effects of a residential, multidisciplinary treatment programme ...
101
EFFECTS OF A RESIDENTIAL, MULTIDISCIPLINARY TREATMENT PROGRAMME OF OBESE CHILDREN AND ADOLESCENTS ON EXERCISE CAPACITY AND BODY COMPOSITION Gertjan Marissens Student number: 01310219 Jonathan Servayge Student number: 01303328 Supervisors: Prof. Dr. Ann De Guchtenaere, Dr. Kristof Vandekerckhove, Bettina Würth A dissertation submitted to Ghent University in partial fulfilment of the requirements for the degree of Master of Medicine in Medicine Academic year: 2016 – 2018
-
Upload
khangminh22 -
Category
Documents
-
view
3 -
download
0
Transcript of effects of a residential, multidisciplinary treatment programme ...

EFFECTS OF A RESIDENTIAL, MULTIDISCIPLINARY TREATMENT PROGRAMME OF OBESE CHILDREN AND ADOLESCENTS ON EXERCISE CAPACITY AND BODY COMPOSITION
Gertjan Marissens Student number: 01310219
Jonathan Servayge Student number: 01303328
Supervisors: Prof. Dr. Ann De Guchtenaere, Dr. Kristof Vandekerckhove, Bettina Würth A dissertation submitted to Ghent University in partial fulfilment of the requirements for the degree of Master of Medicine in Medicine Academic year: 2016 – 2018


Deze pagina is niet beschikbaar omdat ze persoonsgegevens bevat.Universiteitsbibliotheek Gent, 2021.
This page is not available because it contains personal information.Ghent University, Library, 2021.


Preface
We would like to express our gratitude to our promotor, Prof. Dr. Ann De Guchtenaere,
our copromotor, Dr. Kristof Vandekerckhove, and our mentor, Bettina Würth, for entrusting
us with this topic and guiding us in writing our thesis. Your advice, feedback and
suggestions were accurate and most importantly, swift. You gave us the freedom to
compose our thesis as we saw fit, nonetheless, ensured that we did not lose sight of our
objectives.
We would also like to thank Ilse Coomans of the department of Paediatrics, who was
always prepared to answer our statistical related questions. Your guidance provided us
with the most efficient way of handling medical statistics, as such, we were never caught
by the maze of student t and Shapiro-Wilk tests.
Lastly, we would like to thank the staff of the Zeepreventorium. People like Eddy Basslé,
Laura van Roye, Ann Tanghe and Dominique Kind were so kind to assist us in any way
possible and provide us with very unique insight in this health care facility.
All of you were extremely approachable and kindhearted. We really enjoyed working with
you on this thesis and would like to thank you from the bottom of our hearts.

Table of contents
Preface .............................................................................................................................
Lists of abbreviations .....................................................................................................
I. Abstract .................................................................................................................. 1
II. Samenvatting ......................................................................................................... 2
III. Introduction ........................................................................................................... 3
A. Contribution of the students ..................................................................................... 3
B. Objective ................................................................................................................. 3
C. Childhood obesity .................................................................................................... 3
1. Definition ............................................................................................................. 3
2. Epidemiology ....................................................................................................... 4
3. Risk factors of childhood obesity .......................................................................... 5
4. Health consequences .......................................................................................... 7
5. Assessment ....................................................................................................... 12
6. Treatment .......................................................................................................... 16
D. Physical exercise testing ....................................................................................... 20
1. Key variables ..................................................................................................... 20
E. Cardiorespiratory fitness and childhood obesity ..................................................... 26
1. Effects of cardiorespiratory fitness ..................................................................... 26
2. Effects of weight-loss ......................................................................................... 26
IV. Methods ............................................................................................................... 29
A. Medical paediatric centre Zeepreventorium ........................................................... 29
1. Patient population .............................................................................................. 29
2. Treatment programme ....................................................................................... 29
3. Measures ........................................................................................................... 35
B. Study design .......................................................................................................... 38
1. Study objective .................................................................................................. 38
2. Study population ................................................................................................ 38
3. Study Process ................................................................................................... 38
V. Results ................................................................................................................. 41
A. Baseline characteristics ......................................................................................... 41
1. Anthropometric variables ................................................................................... 41
2. Spirometry ......................................................................................................... 41

3. Cardiopulmonary exercise test .......................................................................... 42
B. Effects of the intervention ...................................................................................... 43
1. Overview ........................................................................................................... 43
2. Gender differences ............................................................................................ 46
C. Correlation analysis ............................................................................................... 46
1. Body Composition and exercise capacity .......................................................... 46
2. Predictors of exercise capacity .......................................................................... 47
3. Predictors of body composition .......................................................................... 48
4. Predictors of change in body composition ......................................................... 48
VI. Discussion ........................................................................................................... 49
A. Anthropometric measurements.............................................................................. 49
B. Physical exercise performance .............................................................................. 50
C. Heart rate recovery (HRR) ..................................................................................... 52
D. Strengths and limitations ....................................................................................... 52
E. Suggestions for further research ........................................................................... 53
VII. References ....................................................................................................... 54
VIII. Appendix ..............................................................................................................

Lists of abbreviations
ABPM Ambulatory blood pressure monitoring
AEE Active energy expenditure
ALT Alanine aminotransferase
ATP Adenosine triphosphate
BMC Total bone mineral content
BMD Total bone mineral density
BMI Body mass index
BMR Basal metabolic rate
BOT-2 Bruininks-Oseretsky Test of Motor Proficiency Second Edition
BP Blood pressure
Bpm Beats per minute
BSA Body surface area
CBT Cognitive behavioural therapy
CDC US Central for Disease Control
CDI Children’s Depression Inventory
CPET Cardiopulmonary exercise testing
CRF Cardiorespiratory fitness
CVD Cardiovascular disease
DBP Diastolic blood pressure
En% Percentage of total energy-intake
EqCO2 Equivalent for CO2
EqO2 Equivalent for 02
ERV Expiratory reserve volume
FEV1 Forced expiratory volume in one second
FFM Fat free mass
FM Fat mass
FRC Functional residual capacity
FVC Forced vital capacity
GERD Gastroesophageal reflux disease
HbA1c Glycated haemoglobin
HDL-C High-density lipoprotein cholesterol
HR Heart rate

HRQL Health-related quality of life
HRR Heart rate recovery
HRRX Heart rate recovery after x minutes
IOTF The International Obesity Taskforce
LDL-C Low-density lipoprotein cholesterol
LV Left ventricular
MET Metabolic equivalent of task
MUFA Monounsaturated fatty acids
MVV Maximal voluntary ventilation
NAFLD Non-alcoholic fatty liver disease
NASH Non-alcoholic steatohepatitis
NDIR Nondispersive infrared sensor
NHANES National Health and Nutrition Examination Survey
non-HDL-C Non-high density lipoprotein cholesterol
OGTT Oral glucose tolerance test
OSAS Obstructive sleep apnoea syndrome
OUES Oxygen uptake efficiency slope
PaCO2 Arterial pressure of CO2
PAL Physical activity level
PCOS Polycystic ovary syndrome
PCSC Perceived Competence Scale for Children
PPI Proton pump inhibitors
PSG Polysomnography
PUFA Polyunsaturated fatty acids
PWC150 Physical work capacity at a heart rate of 150 beats per minute
RER Respiratory exchange ratio
Rpm Revolutions per minute
RQ Respiratory quotient
RV Residual volume
Sa02 Oxygen saturation
SBP Systolic blood pressure
SCFE Slipped capital femoral epiphysis
SDS Standard deviation score
SFA Saturated fatty acids

SRBD Sleep related breathing disorders
STAIC State-Trait Anxiety Inventory
T2DM Type 2 diabetes mellitus
TC Total cholesterol
TEE Total energy expenditure
TG Triglyceride levels
TLC Total lung capacity
U/L Units per litre
VC Vital capacity
VCO2 Carbon dioxide production per unit of time
VE Minute ventilation
VIGeZ Vlaams Instituut voor Gezondheidspromotie en Ziektepreventie
VO2 Maximal oxygen uptake per unit of time
VSE Vocational secondary education
VT Ventilatory threshold
W Watt


1
I. Abstract
Objective The purpose of this study was to describe the effects of the residential,
multidisciplinary treatment programme of obese children and adolescents in the Medical
Paediatric Centre Zeepreventorium. Additionally, we wanted to investigate the correlation
between the evolution in body composition and exercise capacity.
Introduction The treatment programme consisted of a dietary programme, physical
exercise, psychological support and education on health topics. In this study we
specifically looked at the changes in body composition (total mass, total fat mass, total
lean mass, total fat free mass, total bone mineral content, total bone mineral density, total
fat percentage, total lean percentage, waist circumference and waist-hip ratio) and
exercise capacity (heart ratemax, predicted heart ratemax, VO2max, weight adjusted VO2max,
predicted VO2max and RQmax).
Methods This study was a clinical observation of 55 severely obese adolescents (37 girls
and 18 boys, mean age 16,47±1,14, mean BMI 40,12±7,96) who started the twelve-month
treatment programme. Anthropometric measurements, body composition, spirometry and
aerobic fitness were measured at baseline and after ten months. Forty-one participants
completed the residential programme and were included in post-treatment analysis.
Results Our participants averagely decreased their body weight by 20,1% (P < 0,001),
accompanied by a significant decrease in BMI of 21,4% (P < 0,001). Waist circumference
decreased by 14,8% (P < 0,001). Mean maximal heart rate increased from 160,64±14,89
bpm to 170,35±13,88 bpm (P < 0,001). Also absolute values of VO2peak (ml/min), VO2peak
relative to body weight (ml/min/kg) and predicted VO2peak (%) significantly improved in our
study population. At maximum intensity, statistical differences between our boys and girls
were found for change of VO2peak (p < 0,05), change of weight adjusted VO2peak (p < 0,05)
and change of predicted VO2peak (p < 0,05). Correlations were found for weight adjusted
VO2peak and total mass (r = -0,410; P < 0,05), total fat mass (r = -0,421; P < 0,05), total fat
percentage (r = -0,329; P < 0,05) and total lean percentage (r = 0,348; P < 0,05). We also
observed correlations between fat free mass and heart ratemax (r = -0,323; P < 0,05).
Conclusion We can conclude that the multidisciplinary treatment programme in the
Medical Paediatric Centre Zeepreventorium is effective in decreasing body weight and
improving physical exercise. Further research must be conducted to elucidate the long-
term effects of such treatment programmes and to compare multidisciplinary treatment
programmes with high intensity intermittent exercise training schedules


2
II. Samenvatting
Doel Het doel van deze studie bestaat erin om het effect van een residentieel,
multidisciplinair behandelingsprogramma bij obese kinderen en jongeren in het Medisch
Pediatrisch Centrum Zeepreventorium, in kaart te brengen. Daarenboven werd er op zoek
gegaan naar correlaties in de evolutie van lichaamssamenstelling en
inspanningscapaciteit.
Inleiding Het behandelingsprogramma bestaat uit voedingsmaatregelen, fysieke
oefeningen en een fysiek trainingsprogramma, psychologische ondersteuning en educatie
rond enkele gezondheidstopics. In deze studie hebben we specifiek gekeken naar de
veranderingen op vlak van lichaamssamenstelling en de veranderingen op vlak van
inspanningscapaciteit.
Methoden In deze studie werden 55 ernstig obese jongeren, waarvan 37 meisjes en 18
jongens met een gemiddelde leeftijd van 16,47±1,14 en gemiddeld BMI van 40,12±7,96,
geobserveerd gedurende een behandelingsprogramma van 12 maanden.
Anthropometrische metingen, lichaamssamenstelling, spirometrie en parameters van
aërobe fitness werden gemeten op het begin van de studie en na 10 maanden.
Eenenveertig deelnemers hebben het behandelingsprogramma volgehouden en werden
geïncludeerd in de analyse.
Resultaten De deelnemers in onze studie verloren gemiddeld 20,1% van hun
lichaamsgewicht, gepaard gaande met een significante daling van hun BMI van 21,4% (P
< 0,001). Taille omtrek daalde met 14,8%. Submaximale performance (PWC150)
verbeterde van 127,81 ± 28,62 Watt naar 148,55 ± 38,68 Watt op het einde van het
programma. Gemiddelde maximale hartritme verbeterde opmerkelijk van 160,64±14,89
bpm naar 170,35±13,88 bpm (P < 0,001). Absolute VO2peak (ml/min), relatieve VO2peak
(ml/min/kg) en voorspelde VO2peak (%) toonden een significante verbetering aan. Bij
maximale intensiteit werden significante verschillen tussen de jongens en de meisjes uit
onze studiepopulatie geobserveerd op vlak van verandering van absolute, relatieve en
voorspelde VO2peak.
Conclusie We kunnen concluderen dat het multidisciplinair programma in het Medisch
Pediatrisch Centrum Zeepreventorium geschikt is in het verminderen van lichaamsgewicht
en in het verbeteren van fysieke inspanning. Verder onderzoek zal moeten uitlichten wat
de lange termijn effecten zijn van dergelijke behandelingsprogramma’s. Ten slotte moet
men vergelijken wat het verschil is tussen huidige behandelingsmodellen en
behandelingsprogramma’s met hoge-intensiteitstraining


3
III. Introduction
A. Contribution of the students
An application to the Ethical Committee of the University Hospital Ghent was submitted.
Literature on childhood obesity, physical exercise and the effects of physical exercise on
an obese paediatric population was collected in Pubmed and Endnote. The students
helped the staff of the Medical Paediatric Centre Zeepreventorium to perform the
cardiopulmonary exercise tests. Furthermore, they collected all the required data from the
patient files at the Zeepreventorium and performed statistical analysis upon this data.
B. Objective
The purpose of this study was to describe the effects of the residential, multidisciplinary
treatment programme of obese children and adolescents in the Medical Paediatric Centre
Zeepreventorium on exercise capacity and body composition. The treatment programme
consisted of dietary changes, physical exercise, psychological support and education on
health topics. Additionally, we wanted to investigate the correlation between the evolution
in body composition (dual-energy X-ray absorptiometry and anthropometry) and the
variables of exercise capacity (VO2 peak, Predicted VO2 peak, RQpeak, HRpeak, Predicted
HRpeak, VEpeak,).
C. Childhood obesity
1. Definition
Obesity is a medical condition in which an individual has an excess of body weight in the
form of fat. In general, obesity is caused by an energy imbalance: where calorie intake
exceeds expenditure, the surplus energy is stored as fat. A multitude of obesogenic factors
can contribute to this energy excess (e.g. high food consumption, decreased physical
activity, increased sedentary behaviour and genetic factors) (1).
When trying to define overweight and obesity, one must discuss the body mass index or
BMI. Body Mass Index (BMI) is an index calculated by dividing weight in kilograms by the
square of height in meters (kg/m2) and is the most commonly used measure for overweight
and obesity. Overweight and obesity are then defined based on percentile cut-off points,
where the 85th-94th BMI percentile is defined as being overweight and ≥95th percentile as
being obese. However, these body mass index percentiles are not frequently used and the
categorization of BMI percentiles does not adequately define the risk of comorbidities, as
this is where waist circumference is more appropriate (2). Consequently, in adults,
overweight is defined as a BMI ≥ 25,0 kg/m2 and obesity as a BMI ≥ 30,0 kg/m2. The latter
is subdivided in classes I-III (3). For children aged zero to five years and for children and

4
adolescents aged five to nineteen years, the World Health Organization (WHO) developed
growth reference data, the latest of which were updated in 2007. As explained by Flegal
et al. (4) for children, BMI Z-scores need to be used to assess overweight and obesity. As
such, the WHO defines child overweight as a BMI higher than one standard deviation (i.e.
equivalent to BMI 25 kg/m2 at 19 years) and childhood obesity as a BMI higher than two
standard deviations (i.e. equivalent to BMI 30 kg/m2 at 19 years).
2. Epidemiology
Multiple studies show an alarming rise in the prevalence of obesity in adults, and more
recently also in children (5). According by data collected by the World Health Organization,
in Europe one out of three 11-year-olds is overweight or obese (6). In Belgium up to 15%
of boys and 14% of girls among 11-year-olds are overweight in the Flemish region, with
slightly higher percentages in the French region (19% and 13% respectively) (7). The
International Obesity Taskforce (IOTF) estimates that around 224 million school-age
children are overweight worldwide, making this generation the first predicted to have
shorter lifespan than their parents (1).
There is consensus that early treatment and prevention offer multiple long-term health
benefits, and that they are the only way towards a sustainable health service. The study
conducted by Haslam et al. (8) in 2005 points out that obesity is a major threat to
bankrupting the healthcare system, costing the UK economy £3.5 billion and results in
30’000 deaths every year. A more recent study estimates that obesity will cost the National
Health Service £10 billion a year by 2050 (9). It is not the act of preventing or treating
obesity, however obesity’s most important economic issue is the cost of its associated
health problems (10). In 2003, the American Academy of Paediatrics issued a policy
statement on prevention of childhood obesity and overweight stating that paediatricians
should recognize children at risk for obesity, calculate and plot BMI to identify weight gain
and monitor obesity related comorbidities (11). Furthermore, obesity does not need a
scientific breakthrough to be treated successfully, in contrast to many other chronic
diseases. There are numerous obesity interventional programmes consisting of diet,
physical exercise, behavioural therapy, drugs, surgery or a combination of therapies. What
is stopping us then? According to Haslam et al. (8) the barriers to successful management
of obesity are political and organisational ones, along with a lack of resources. The benefits
of managing obesity are well described and will be discussed later on.

5
3. Risk factors of childhood obesity
a) Genetic
The reported dramatic increase in childhood obesity is multifactorial, as it cannot be
blamed on genetics or environment alone (11, 12). The gene pool is not able to change in
one or two generations. However, there are some genetic abnormalities that can cause
obesity. These molecular genetic abnormalities, such as Prader-Willi syndrome, can
presently account for 5% of the obese individuals. Prader-Willi syndrome is caused by the
deletion of the q11-q13 fragment of the paternal chromosome 15 and causes severe
childhood obesity resistant to diet (11). Other genetic diseases related with obesity and
obesity-related health consequences include Bardet-Biedl syndrome (13), and Down’s
syndrome (14) among others we will not discuss (15).
b) Parental factors
Lindkvist et al. (16) investigated the associations between toddlers’ and parents’ BMI.
They concluded that the probability of a toddler having a BMI above the WHO 95th
percentile was significantly increased if either the mother or father was overweight (i.e.
BMI ≥ 25 kg/m2). They also found a positive synergistic effect between the mother and
father being overweight and their child having a BMI above the WHO 85th percentile.
Similar results are reported in the study by Vanhala et al. (12), which investigated lifestyle
risk factors for obesity in 7-year-old children, where mother’s obesity and father’s
overweight were also significantly associated with obesity in their children. The IDEFICS
case-control study (17) further confirms that both maternal and paternal BMI are the
strongest risk factors on the risk of obesity at the age two to nine. The IDEFICS study
added that gestational weight gain also is significantly associated with childhood obesity.
c) Ethnicity
The association between ethnicity and obesity in children and adolescents is unclear and
little studied. The review by Higgins V. et al. (18) reports that after controlling for a wide-
range of maternal socio-economic characteristics and parental obesity, there are no ethnic
differences in childhood obesity. However, this review only includes studies in the UK.
These results are contradictory to other findings where, after adjustment for
sociodemographic, cultural and family routine factors and maternal BMI, it was reported
that Black African children were more likely to be overweight and Pakistani children to
have lower odds of obesity (19). Both studies discuss ethnicity and overweight/obesity in
the UK. The latter reports that in the United States, there were no racial or ethnic disparities
in children’s odds of obesity or overweight.

6
d) Food
The study conducted by Vanhala et al. (12) reported that overeating and skipping breakfast
are independent risk factors for childhood obesity after adjustment for other variables.
Surprisingly, desserts being served as part of the meal protected from being obese. The
consumption of sweets, soft drinks, juices or cribs however, did not differ between the
normal weight and obese children according to this study. However, the results concerning
the association between obesity and sugar-sweetened drinks seems controversial and are
the subject of much discussion, as discussed in the study by Slavin (20).
e) Television watching
One of the most prominent risk factors but often forgotten is the fact that during the past
two decades, there was a dramatic change in lifestyle that also affected the young
generation. Children and adolescents now spend an increased amount of time watching
television or playing video games, instead of playing outside. This habit is related with
parents’ perception of an unsafe neighbourhood (21). Parents are thus reluctant to allow
their children to go outside and play. Television watching has also been linked to obesity
due to inactivity but also due to energy dense food advertising (22). Furthermore, the
duration of television watching is associated with increased BMI and with the risk of being
obese. Watching television for more than one hour per day tripled the risk of being
overweight compared to children who watched television for less than half an hour per day
(12).
f) Education
Lastly, it seems that lifestyle and prevalence of overweight and obesity seems to differ
between different types of education. In a cross-sectional school-based survey with 994
adolescents aged 16-18 in Flanders, Belgium, prevalence of overweight, health-related
quality of life (HRQL) and lifestyle were assessed per type of education. The study
concluded that the prevalence of overweight and obesity is significantly higher in
vocational secondary education (VSE) schools, schools that provide practice-oriented
education and aim to learn students a specific occupation, than in the other type of
secondary education schools in Flanders (23).
g) Gender
There is a vast body of evidence that suggest that the prevalence of overweight and
obesity in children and adolescents is higher among male than female participants (24,
25). However, there is more or less consensus that gender is not a risk factor for
developing overweight or obesity.

7
4. Health consequences
Since the prevalence of childhood obesity is rising, many health conditions once thought
reserved for adults are now being seen in children with increased incidence. As a result,
paediatricians now face health problems such as type 2 diabetes (T2DM), metabolic
syndrome, non-alcoholic steatohepatitis (NASH) and sleep apnoea. Even if conditions do
not appear as symptoms until adulthood, these health consequences can appear earlier
than usual in a person’s lifetime if this person has a history of childhood obesity. Childhood
obesity has been shown to be associated with negative psychosocial factors, orthopaedic
complications and chronic diseases, such as hypertension, atherosclerosis, dyslipidaemia,
type 2 diabetes, metabolic syndrome, sleep apnoea and asthma (10, 26). Additionally,
according to Malecka-Tendera et al. (11) childhood obesity is a an important predictor of
adult obesity and as such contributes to a significant increased risk for cardiovascular
disease. Furthermore, children are also more vulnerable to a unique set of obesity-related
health problems because their bodies are growing and developing, such as Blount disease
and slipped capital femoral epiphysis. The following list encompasses the many health
consequences of obesity in childhood.
The list is based on the “Clinical Practical guidelines for medical care of patients with
obesity” developed by the American Association of Clinical Endocrinologists (27) in
combination with Stephen R. Daniels’s article “The consequences of childhood overweight
and obesity” (10). In the appendix we refer to Table I of Stephen R. Daniels’s article. This
table gives an overview of the major health consequences in a paediatric population and
their prevalence. We will tackle the body systems that are the most affected by obesity.
Yet there are a number of other health consequences related to obesity we will not discuss
any further, such as polycystic ovary syndrome (PCOS), pseudotumor cerebri,
polycythaemia, pre-eclampsia, low back pain, male hypogonadism, osteoarthritis, urinary
stress incontinence and an increased risk during anaesthesia (27).
a) Cardiovascular disorders
Obesity affects the cardiovascular system in multiple ways (28). First, obese individuals
have an increased total blood volume, both intracellularly and extracellularly, to meet the
perfusion needs of the increased adipose tissue. The perfusion needs are principally
maintained by an increased stroke volume, as resting heart rate remains largely
unchanged. This increased stroke volume in turn, leads to a higher cardiac output and left
ventricular (LV) work. Second, there is an amplification of this fluid overload by the
increased amounts of adipocytes and hyperinsulinemia. Adipocytes function as hormone
factories, producing atrial natriuretic peptide and angiotensin, both of which play a key role
in regulating fluid volume. Hyperinsulinemia can stimulate the sympathetic nervous
8
system, causing sodium retention by increasing renin secretion in the kidney. Lastly,
obesity leads to a number of haemostatic and fibrinolytic changes, resulting in an
increased blood viscosity and an increased risk for thromboembolic disease. The
continuous fluid and pressure overload results in left ventricular hypertrophy, increasing
the risk for systolic ventricular dysfunction (29). Now, it is possible to understand the role
of obesity in cardiovascular disorders, such as hypertension, left ventricular hypertrophy,
atherosclerosis and to greater extent, stroke (30), heart failure and acute myocardial
infarction.
The association between obesity and hypertension is well documented as the risk for
elevated blood pressure ranges from 2,5 to 3,7 times higher for the overweight children
compared to their normal-weight counterparts (10, 26). Hypertension is three times more
prevalent in obese compared to non-obese adolescents (31). Furthermore, obesity-related
hypertension has been linked to insulin resistance in children and adolescents (32).
Left ventricular hypertrophy is an independent risk factor for cardiovascular disease in
adults and has been associated with obesity and hypertension in adults and with increased
BMI in adults and adolescents (10). These findings are supported by Mangner et al. (33).
In their study every participant underwent a standardized two-dimensional
echocardiography. They found that childhood obesity indeed is associated with significant
changes in the wall of the left ventricle and left ventricular mass, probably caused by
underlying hypertension in obese adolescents.
It is certain that obesity and atherosclerosis are associated with each other. However,
whether obesity is an independent risk factor of atherosclerosis or whether the relationship
between obesity and atherosclerosis has been mediated through the major risk factors of
obesity discussed above, has been a subject of some dispute for many years (34). The
underlying mechanism of how obesity could independently be associated with
atherosclerosis remains uncertain. Multiple theories have been proposed, such as gut
microbiome, oxidative stress and impaired autophagy (35).
b) Metabolic disorders
Many metabolic disorders (among them insulin resistance, dyslipidaemia, metabolic
syndrome and type 2 diabetes mellitus) have been linked with obesity in adults. Sedentary
behaviour, persistent low levels of physical activity and poor cardiorespiratory fitness are
predictors of the progression towards Type 2 diabetes mellitus (T2DM) and metabolic
syndrome (36). However, as the prevalence and severity of overweight in children and
adolescents increased, more and more metabolic disorders were also found in children.

9
Several studies have shown that obesity in children is associated with decreased insulin
sensitivity and thus increased circulating insulin levels. This is explained by the decrease
in adiponectin receptor expression levels, thereby reducing adiponectin sensitivity and
enhancing insulin resistance (37). Increased insulin levels may in turn cause hypertension
and increased cholesterol levels.
Childhood obesity is also frequently associated with a dyslipidaemia pattern that consists
of a combination of elevated triglycerides, decreased high-density lipoprotein cholesterol
(HDL-C) on top of normal to mildly elevated low-density lipoprotein cholesterol (LDL-C)
(31, 38). This brings us to the topic of the metabolic syndrome. In adults, the metabolic
syndrome is defined as 3 or more of the following risk factors: an elevated waist
circumference, triglyceride levels, blood pressure (BP), fasting glucose and reduced HDL-
C. Whether these risk factors can be used for the diagnosis of metabolic syndrome is
unclear. However, physicians report that the cluster of findings mentioned above is now
also being seen in children (36, 38). The study by Steele et al. (36) mentions an
International Diabetes Federation consensus report of 2007 that defines the metabolic
syndrome in adolescents as central obesity plus any two of a raised triglyceride level, a
reduced HDL-C level, hypertension and elevated fasting plasma glucose.
Lastly, the incidence of type 2 diabetes has increased dramatically in obese children
populations (39). The increased prevalence of type 2 diabetes mellitus raises concern
about cardiovascular disease risk. Type 2 diabetes mellitus patients face a similar risk for
a future adverse cardiovascular event as patients who have already had a heart attack or
a stroke. This finding suggest doctors should aggressively manage cardiovascular risk
factors, such as high blood pressure and cholesterol in adults with diabetes, to prevent
future illnesses and deaths from cardiovascular disease. If adolescents with type 2
diabetes mellitus have this same advanced risk, they may be more likely to have heart
attacks, strokes, or heart failure at a very young age, perhaps even in their twenties and
thirties.
c) Pulmonary disorders
How obesity affects the pulmonary system has been studied extensively in adults, in
adolescents the evidence is more scarce. As recent research pointed out, it seems that
dysfunctional respiratory mechanics, ventilatory inefficiency appear to be more related to
more severe cardiopulmonary conditions such as heart failure and not increased BMI itself
(40). In an obese population total respiratory compliance is reduced by as much as two
thirds of the normal value (28). This is due to a combination of a decrease in chest
compliance, dependent mainly on fat distribution, and lung compliance, caused by

10
decreasing lung volumes. These two factors in turn exacerbate airway resistance. The
decrease in lung volumes is most consistently seen as a decrease in expiratory reserve
volume (ERV) and functional residual capacity (FRC). Functional residual capacity being
the sum of expiratory reserve volume and the residual volume (RV), wherein obesity has
a very modest effect on residual volume. Considering the impact of obesity on expiratory
reserve volume and functional residual capacity, we might expect a similar effect on total
lung capacity (TLC). In spite of this, total lung capacity is not affected unless in massively
obese individuals. Although the relationship between BMI and other lung function
assessments is inversely proportional in massively obese individuals, this is not the case
in a general obese population. Generally, as BMI increases, there is no reduction in
expiratory flow, forced expiratory volume in one second (FEV1) nor forced vital capacity
(FVC) (41). In a paediatric population similar findings have been reported in terms of
expiratory reserve volume and functional residual capacity. In obese children, however,
higher BMI is associated with higher forced expiratory volume in one second and forced
vital capacity values (42).
Pulmonary disorders most frequently associated with childhood obesity are asthma and
obstructive sleep apnoea. How obesity may influence the prevalence and incidence of
asthma is unclear. On the one hand, obesity has been associated with increased
inflammation. Since asthma is caused by inflammation of the airways, this is one possible
explanation. The link between asthma and obesity however may be complicated by
socioeconomic status, cigarette smoking, or other variables. On the other hand, children
with asthma often have impaired physical activity and may be treated with corticosteroids,
which may promote obesity development. In conclusion, the association between
childhood obesity and asthma needs to be studied more extensively (42).
Obesity and sleep apnoea however, are clearly related both in adults and in children.
Mallory, G.B. et al. (43) found that one third of young severely overweight patients had
symptoms associated with obstructive sleep apnoea and five percent had severe
obstructive sleep apnoea. Sleep disordered breathing may be one of the most important
but also most under-recognized medical complications in overweight children and
adolescents. Next to hypertension, sleep apnoea can also lead to increased left ventricular
mass and thus is a major condition also affecting the cardiovascular consequences.
d) Gastrointestinal disorders
A first gastrointestinal disorder linked with obesity in adults is non-alcoholic fatty liver
disease (NAFLD) and non-alcoholic steatohepatitis (NASH). The chronic inflammation of
the liver caused by fat deposits can lead to fibrosis, cirrhosis and end-stage liver disease

11
(31). However, studying the prevalence of non-alcoholic fatty liver disease and non-
alcoholic steatohepatitis in children and adolescents is hard, as there are no symptoms
and the diagnosis can only be confirmed by liver biopsy. Some studies estimate that as
many as 50% of the obese children may have fat deposits in their livers while some 3% of
obese children actually have the more advanced non-alcoholic steatohepatitis.
Research has verified that obesity can also contribute to gastroesophageal reflux disease
(GERD) (44), as obese adults were almost three times more likely to develop symptoms
of acid regurgitation and heartburn. Despite the many research conducted in adults, the
association between gastroesophageal reflux disease and obesity has not been
extensively studied in children nor adolescents.
e) Skeletal disorders
The consequences of obesity are not only metabolic or systemic. Obesity can also cause
physical damage to the human skeleton. In adults, osteoarthritis is a common disorder in
obese individuals. Orthopaedic problems also afflict obese children. Blount’s disease and
slipped capital femoral epiphysis (SCFE) are the most severe paediatric orthopaedic
diseases. (45). Tibia vara, or Blount disease, is a mechanical deficiency in the medial tibial
growth plate in adolescents that results in bowing of the tibia, a bowed appearance of the
lower leg, and an abnormal gait. Slipped capital femoral epiphysis, a condition where the
femur is rotated externally from under the growth plate, causes pain and makes it
impossible to walk. The association between Blount’s disease and slipped capital femoral
epiphysis in obese children and adolescents has also been reported, when these
individuals had a concurrent vitamin D deficiency (46).
f) Psychosocial issues
Childhood obesity is also linked with various psychosocial issues. Some studies suggest
a higher rate of depression among obese children than among children of normal weight
(47). It is known that weight issues can cause body dissatisfaction, one of the major risk
factors for depression in adolescents, especially in girls. However, researchers have not
been able to determine whether the severity of the depression may be caused by an
amount of body weight. Also, since depression is often associated with abnormal eating
patterns and lack of physical activity, it is unclear if depression would cause obesity, or
whether obesity could result in psychosocial problems that may cause depression.
However, obese children diagnosed with depression should not partake in a weight-control
programme, unless in concurrence with therapeutic sessions with a mental health
specialist, as the programme may be futile or even harmful (47). In addition to depression,
low self-esteem and anxiety have also been found to relate to obesity in children and

12
adolescents. Other psychosocial consequences of obesity include fewer years of
education, lower family income, higher poverty rates and lower marriage rates (47).
Lastly, health-related quality of life (HRQoL) is also decreased in obese adolescents and
is partially explained by the health consequences of obesity. Overall health-related quality
of life was inversely associated with BMI, hence, health-related quality of life is an
important indicator of the impact of obesity and effect of interventions, complementary to
clinical variables (48).
5. Assessment
Diagnosing overweight and obesity in children and adolescents is the first step in tackling
this prevalent condition. Overweight and obesity itself are assessed mainly by measuring
BMI and waist circumference. Additionally, paediatric overweight and obesity is associated
with many comorbidities and health consequences, as discussed extensively above.
Nonetheless, these comorbidities must be assessed in an obese paediatric population
under certain circumstances. We will provide a concise overview of how these
comorbidities can be assessed in children.
a) Anthropometric variables
(1) Body mass index
Body Mass Index (BMI) is an index calculated by dividing weight in kilograms by the square
of height in meters (kg/m2) and is the most commonly used measure for overweight and
obesity. First, because it is an indirect measure of body fat. Second, because of its
feasibility under clinical settings and in epidemiological studies (49). In adults, BMI
provides a useful measure of overweight and obesity on a population-size level. However,
there are some issues with the use of BMI in the measurement of body fat, as explained
by Rothman (50). First, the body mass index does not necessarily reflect the changes in
body fat and muscle mass that occur with age. As with age, the proportion of body fat
increases whereas muscle mass decreases, however, these changes may not correspond
with appropriate changes in BMI. Second, the relationship between BMI and body fat
percentage is not linear and is different for the sexes. Finally, errors in measurement of
obesity with BMI can introduce misclassification problems that may result in bias, resulting
in confounding estimating the effects related to obesity.
As explained by Flegal et al. (4), for children, BMI z-scores need to be used to assess
overweight and obesity, since for children, the body mass index varies with age, not only
with weight. Therefore, body mass index values are compared with reference values that
are age and sex specific and subsequently translated into z-scores. The z-score or
standard deviation score (SDS) of a variable represents the number of standard deviation

13
units above or below the mean value of the specific variable. As such, the WHO defines
child overweight as a BMI higher than one standard deviation (i.e. equivalent to BMI 25
kg/m2 at 19 years) and childhood obesity as a BMI higher than two standard deviations
(i.e. equivalent to BMI 30 kg/m2 at 19 years).
(2) Waist circumference
Waist circumference is a measure of potential value in children, given its relation to
cardiovascular risk and insulin resistance in adults. Waist circumference is preferably
measured four cm above the umbilicus, based on the ease of measurement (51). Adults
with high waist circumference values are more likely to have hypertension, diabetes,
dyslipidaemia and the metabolic syndrome (52). Therefore, cut-off points for waist
circumference would help to identify individuals at increased health risk within the various
BMI categories. These cut-off values are recommended and are implemented in the
clinical practical guidelines composed by an endocrine society-appointed task force of six
experts (53).
b) Comorbidities
When assessing obese children and adolescents, a thorough medical and family history
is crucial, especially in children with short statue, low intelligent quotient (IQ) or both (47).
It must be noted that associated comorbidities may be asymptomatic or subclinical, but
may have familial tendencies. The family history should include obesity, bariatric surgery,
type 2 diabetes mellitus, gestational diabetes, dyslipidaemia, hypertension, non-alcoholic
fatty liver disease, cirrhosis, sleep apnoea and use of continuous positive airway pressure,
premature cardiovascular disease events/ deaths and (in women) infertility, polycystic
ovary syndrome, hyperandrogenism-associated signs and symptoms (53).
The medical history is more elaborated. Clinicians should assess the patient for signs of
hyperglycaemia, unexplained headaches, habitual snoring, generalized tiredness,
gastrointestinal discomfort, musculoskeletal symptoms and (in pubertal girls) acne,
hirsutism and onset and pattern of menses. Physicians should also inquire a history of
second-generation antipsychotics and psychiatric disorders. Lastly, one should also get
an idea of the individual’s lifestyle, i.e. dietary habits, sedentary behaviour, physical activity
etc. (53).
(1) Blood pressure
As discussed above, one of the major health consequences of obesity is elevated blood
pressure (BP) or hypertension. Since long-term health risks for hypertensive children and
adolescents are substantial, therefore it is important that clinical measures are taken to
reduce these risks and optimize health outcomes.

14
Hypertension in children and adolescents is defined as an average systolic blood pressure
(SBP) and/ or diastolic blood pressure (DBP) that is ≥ 95th percentile for gender, age and
height on more than three occasions. As with adults, adolescents with blood pressure
levels higher than 120/80 mmHg should be considered prehypertensive. This definition is
based on the normative distribution of blood pressure in healthy children.
The National High Blood Pressure Education Program Working Group on High Blood
Pressure in Children and Adolescents states that children older than three years who are
seen in a medical setting should have their blood pressure measured. The preferred
method is auscultation whereby correct measurement requires a cuff that is appropriate to
the size of the child’s upper arm. Hypertension, or an elevated blood pressure, must be
confirmed on repeated visits, however no exact number of visits is mentioned, before
characterizing a child as having hypertension (54). The Basis Diagnostics Directive
Cardiovascular risk in obese children adds that the finding of an elevated blood pressure
on three repeated visits is practically, the most commonly used. Although blood pressure
in children is most frequently measured by oscillometric devices, blood pressure values
are based on auscultatory findings. Thus, abnormal oscillometric values should be
checked using auscultation.
Ambulatory blood pressure monitoring (ABPM), a procedure in which the participant’s
blood pressure is monitored during 24 hours by a portable blood pressure monitoring
device, is useful in the detection of ‘white coat hypertension’ as well as evaluating the risk
for hypertensive organ injury, apparent drug resistance and hypotensive symptoms with
antihypertensive drugs (32). Additionally, ambulatory blood pressure monitoring can be
helpful when more information on blood pressure patterns is needed, such as episodic
hypertension, chronic kidney disease, diabetes and autonomic dysfunction (54). However,
The Basis Diagnostics Directive Cardiovascular risk in obese children notes that
ambulatory blood pressure monitoring is a stressful method in children and adolescents
and that the value of ambulatory blood pressure monitoring in an obese population is
controversial. One must ask himself, whether ambulatory blood pressure monitoring can
add additional value to auscultatory findings concerning blood pressure (55).
(2) Prediabetes and diabetes mellitus
Prediabetes is defined as a HbA1c ranging from 5.7% to <6.5% (39 to 48 mmol/mol).
However there have been reports of poor performance of HbA1c in diagnosing prediabetes
and diabetes in paediatrics, underestimating the prevalence of both. Additionally, it has
been shown that there are racial/ethnic disparities in the correlation between HbA1c and
ambient blood glucose, making Hb1Ac an unpredictable parameter for assessing
15
prediabetes and type 2 diabetes mellitus. In high-risk youths additional testing, by means
of measuring fasting or random glucose or an oral glucose tolerance test (OGTT), may be
required. Prediabetes is then defined as a fasting plasma glucose between 100 mg/dl and
126 mg/dl or a two-hour plasma glucose between 140 and 200 mg/dl in an oral glucose
tolerance test.
Type 2 diabetes mellitus, in turn, is defined as a HbA1c of ≥ 6.5% (≥ 48 mmnol/mol),
although this should be confirmed by repeated testing in absence of unequivocal
hyperglycaemia. Other cut-off values are a fasting plasma glucose of ≥ 126 mg/dl, during
oral glucose tolerance test a two-hour plasma glucose of ≥ 200 mg/dl or in a patient with
classic symptoms of hyperglycaemia, a random plasma glucose of ≥ 200 mg/dl.
It has to be waived to measure insulin values as insulin concentration has no diagnostic
value in diagnosing obesity-associated insulin resistance or hyperinsulinemia.
(3) Dyslipidaemia
The assessment of dyslipidaemia consists of measuring triglyceride levels (TG < 90
mg/dl), low density lipoprotein cholesterol (LDL-C < 110 mg/dl), total cholesterol (TC < 170
mg/dl), high density lipoprotein cholesterol (HDL-C > 45 mg/dl) and non-HDL cholesterol
(non-HDL-C < 120 mg/dl) levels in blood. Values between brackets are considered
acceptable for children and adolescents. Triglyceride levels apply to ten to nineteen year
olds (56).
(4) Non-alcoholic fatty liver disease
Since non-alcoholic fatty liver disease is mainly asymptomatic, it requires screening for
detection. The least expensive and least invasive method of screening for non-alcoholic
fatty liver disease is by assessing alanine aminotransferase (ALT) concentrations. alanine
aminotransferase levels of > 25 U/L in boys and > 22 U/L in girls have been associated
with significant histologic abnormalities. High alanine aminotransferase levels suggest a
more advanced stage of non-alcoholic fatty liver disease, hepatitis or fibrotic changes (57).
(5) Polycystic ovary syndrome
The diagnosis of polycystic ovary syndrome in an adolescent girl is made based on the
presence of clinical and/ or biochemical evidence of hyperandrogenism in the presence of
persistent oligomenorrhea. Clinical manifestations of hyperandrogenism include hirsutism,
acne, androgenic alopecia and virilization of which hirsutism is most commonly used
clinical diagnostic criterion (58). Biochemical evidence of hyperandrogenism include an
elevated total/free testosterone (59). It is important to notice that the Rotterdam ultrasound

16
polycystic ovary syndrome criteria were not validated for adolescents. Therefore polycystic
ovary morphology is not sufficient to make a diagnosis in adolescents (60).
(6) Obstructive sleep apnoea
Napping frequently or excessive sleepiness in the classroom is a major clue to sleep
problems in older children. Clinicians can use a sleep log, sleep diary or sleep
questionnaire to efficiently identify the traits of a patient’s sleep (61). An extensive physical
examination of the upper airway is also recommended. The gold standard for diagnosis of
sleep related breathing disorders (SRBD) in children is not polysomnography (PSG) alone.
Polysomnography must be integrated with clinical and polysomnographic findings and
interpreted by a knowledgeable sleep specialist (62).
(7) Psychiatric
Since there are no studies that compare different methods for psychiatric assessment of
obese children, it is recommended to use well-validated instruments previously used in
normal and psychiatric populations. The Children’s Depression Inventory (CDI) is the most
commonly used screening device for paediatric depression and has also been effectively
used in an obese population. One major disadvantage is that the Children’s Depression
Inventory is a self-report measure, therefore the Children’s Depression Inventory may be
supplemented with a parent-report measure such as the Child Behaviour Checklist (47).
Low self-esteem can be reliably assessed by using the Perceived Competence Scale for
Children (PCSC). For anxiety the State-Trait Anxiety Inventory (STAIC) is a validated and
reliable measure of current anxiety (47).
6. Treatment
There is a general consensus that the effect of multidisciplinary obesity interventional
programmes is greater than the effect of physical activity or diet alone (63). Luckily,
programmes offering a combination of a psychological approach plus diet plus physical
activity are numerous. Some programmes even focus on behavioural modifications.
Zametkin et al. states that for a weight-management programme to succeed, the obese
patient must be ready to change his or her lifestyle. As such, the study proposes to assess
weight-programme readiness in obese children and adolescents by using the Children’s
Eating Behaviour Inventory and the Children’s Eating Attitude Test. This is important as
an unsuccessful weight-management programme may diminish the adolescent’s self-
esteem and impair future weight-loss efforts (47).
In children and adolescents, school-based interventional programmes are also worth
investigating. In a mixed-studies systematic review in which 93 papers were included, it is
17
reported that school-based physical activity interventions have tended to focus on
increasing knowledge via health education and printed/audio-visual materials and
implementing curricula to increase the amount of time students are engaged in physical
activity during the school day. These interventions have not been successful for
adolescent population due to a lack of attention paid to the role of the wider school
environment. Herein, there is more focus on the school’s physical and social environment,
health education and links with families and the wider community. Therefore the review
suggests an approach based on measures for which there is consistent support, such as
the activity settings (the type and location for specific activities, i.e. baseball field, indoor
gym) within school, the creation of a ‘physical activity culture’, teaching behaviours that
support a positive climate for physical activity promotion and availability of intramural
opportunities for all students (64).
a) Prevention
It is paramount that we start working on preventing childhood obesity. Families and
schools represent the most important foci for preventive efforts (65). In the past,
interventional programmes were often focussed on diet or physical exercise alone,
however it has been shown that the effect of interventional programmes based on exercise
plus diet is much greater (66). Additionally, studies report that interventional programmes
should include efforts to reduce television watching (22), parental BMI and gestational
weight gain, as these are major risk factors for developing childhood obesity (17).
An integrated preventive approach, wherein biological risk factors, early feeding practices,
family life and food policies are tackled, is necessary to reduce the prevalence of obesity.
A proposed approach is the ‘cell-to-society’ approach, or the ‘Six-Cs’ model. The Six-Cs
represent the cell, child, clan (family), community, country and culture and involve factors
relevant to overweight and obesity for children at multiple stages of development (67).
Harrison et al. describe the Six-Cs model extensively in their article. In the appendix figure
I from the article by Harrison et al is included. Successful preventive measures can be
tailored to each developmental stage by specifying the most relevant and research-
supported nutrition and activity factors for children at that stage (68).
b) Diet
The main component of any weight-loss intervention, in which a dietary programme is
implemented, should be reducing the total caloric intake. Macronutrient composition of
meals has less impact on weight loss than adherence rates in most patients. Therefore,
it may be considered to modify the macronutrient composition in certain populations to

18
optimize adherence, eating patterns, weight loss, metabolic profiles, risk factor reduction
and/or clinical outcomes (27).
c) Physical exercise
Physical activity is the cornerstone of every modern interventional programme. Evidence
suggests that that physical exercise reduces markers of inflammation and improves
glucose control in obesity, independent of weight loss (69). An integral programme based
on exercise plus diet is the most effective to attain a reduction in obesity among obese
adolescents (66, 70). Training schemes should be composed of structured exercises with
clear prescription variables, such as intensity, duration, frequency and time. The US
Central for Disease Control (CDC), mentioned in the study by Trivedi et al. (31),
recommends 60 minutes of daily, moderate (walking, gardening, dancing) to vigorous
(running, aerobics, football, basketball) physical activity. Furthermore, childhood
cardiorespiratory fitness, and same goes for childhood waist circumference, is strongly
associated with cardiometabolic health later in life. Additionally, higher levels of
cardiorespiratory fitness reduce the risk of adult metabolic syndrome (71). For these
reasons physical exercise is indispensable in any intervention programme.
More recently, the American Association of Clinical Endocrinologists proposed a series of
practical guidelines, based on systematic reviews of peer-reviewed literature in
combination with professional judgement, as to what kind of physical exercise should be
included in interventional programmes. Unfortunately, these guidelines are based on
literature conducted in an American adult population. The article mentions that any
decision based on their guidelines should be made in light of local resources and individual
patient circumstances.
Aerobic physical exercise training should be prescribed to patients with overweight or
obesity as a component of a lifestyle intervention. The initial prescription may require a
progressive increase in the volume and intensity of exercise, and the ultimate goal should
be ≥150 min/week of moderate exercise performed during three to five daily sessions per
week. In obese and overweight patients undergoing weight-loss therapy, resistance
training should be prescribed to help promote fat loss while preserving fat-free mass.
Patients should be training towards the goal of resistance training two to three times per
week consisting of single-set exercises that use the major muscle groups. Patients should
be encouraged to partake in nonexercised and active leisure activity to reduce sedentary
behaviour. Lastly, physical exercise as part of an intervention programme should be
individualized and an exercise physiologist or certified fitness professional should be
involved in treatment. This ensures that activities and exercise regimens lies within the

19
capabilities and preferences of the patient, taking into account any health-related physical
limitations, and improve outcomes (27). Since motivation and drop-out is an important
factor in interventional programmes, another study investigated the effects of aerobic and
resistance training on psychological health. Their findings suggest that resistance training,
either alone or in combination with aerobic exercise training, may provide psychological
benefits, such as better adherence. Therefore, it could be an alternative in the biological
and psychological management for obese adolescents who find aerobic exercise training
uncomfortable or unenjoyable (72).
One recent study compared water- versus land-based exercise programmes as part of a
multidisciplinary intervention. It was concluded that water- and land-based physical
exercises promote similar improvements in body composition, physical fitness and health-
related quality of life. However, land-based exercises increased more abdominal strength
than water-based exercises and significantly increased social, psychosocial and total
score (73).
d) Medication
Initial therapy of childhood obesity consists of a combination of physical activity and diet.
Weight loss, through its effects on hyperinsulinemia, has shown to decrease the rate of
co-morbidities and improve the outcome of obese patients (70). Medication in obese
adolescents is not intended to treat obesity, but to decrease the damage and risks
secondary to obesity-related health consequences. As such dyslipidaemia can be
managed second line by prescribing statins or niacin. Medical treatment of hypertension
usually begins with an ACE-inhibitor (31). However, this should never be the standard way
of care. Treating obesity in adolescents must be focussed on multidisciplinary
interventional programmes.
e) Surgery
In adults, research has shown that there is a reduction in mortality for morbidly obese
individuals who underwent bariatric surgery (26). Present day, bariatric surgery in children
and adolescents is becoming widespread, however a wide range of moral issues are being
identified. Of course there is an imperative to help obese children and adolescents,
unfortunately there is little high quality evidence on safety, outcomes, and cost-
effectiveness for bariatric surgery in this study population. Issues with autonomy, informed
consent, assent, and assessing the best interest of children and adolescents are
reinforced by lack of maturity and family relations. Social aspects of obesity, such as
medicalization, prejudice, and discrimination, raise problems with justice and trust in health

20
professionals. Conceptual issues, such as definition of obesity and treatment end-points,
present moral problems (74).
Nonetheless, the changes in inflammation, oxidative stress and adipokines following
bariatric surgery among severely obese adolescents are significant. Bariatric surgery as
such, suggests a potential reduction in risk for type 2 diabetes mellitus and cardiovascular
disease (75).
D. Physical exercise testing
Cardiopulmonary exercise testing (CPET) is used to assess the physiological response of
the pulmonary, cardiovascular and metabolic systems throughout progressive physical
exercise. This physical exercise goes up to maximal exertion in a controlled environment
following a weight-adjusted exercise protocol specific for a particular indication.
Cardiopulmonary exercise testing evaluates the integrated function of multiple organ
systems and specifically the increased need for oxygen and the removal of metabolically
produced carbon dioxide. Traditionally, CPET was used for the provocation of cardiac
arrhythmias and the assessment of exercise-induced bronchoconstriction, however
nowadays it also plays an important role in evaluating children and adults with endocrine,
metabolic, musculoskeletal, neurologic and pulmonary diseases. Furthermore,
cardiopulmonary exercise testing can be appreciated in diagnostics, assessment of
disease severity, prognosis and response to treatment. Hence the health consequences
of obesity, mentioned above, cardiopulmonary exercise testing is used for the assessment
of disease severity in heart and respiratory disease, for the assessment of other potential
contributing factors to exercise limitation but most importantly to assess the suitability and
establish a baseline before beginning an intervention programme and to assess the
effectiveness of an intervention programme on aerobic capacity (76).
1. Key variables
During cardiopulmonary exercise testing many variables can be measured. Participants
generally breathe through a facemask or mouthpiece to provide a large number of
measured respiratory variables and their derivatives. In addition to this, an
electrocardiogram and blood pressure measurement can provide another large array of
potentially interesting cardiovascular variables. Furthermore, cardiopulmonary exercise
testing evaluates these variables during sub-maximal and maximal exercise.

21
a) Aerobic capacity
(1) Peak oxygen uptake
Measuring the maximal oxygen uptake (VO2 max) during cardiopulmonary exercise testing
is considered the gold standard for assessing aerobic capacity by the WHO. Aerobic
capacity is defined as the maximal capacity of the pulmonary and cardiovascular system
to take up and transport oxygen to the exercising muscles and vice versa, of the exercising
muscles to extract and utilize oxygen from the blood. During a progressive
cardiopulmonary exercise test, VO2 increases linearly with exercise intensity up to a point
at which there is no further increase in VO2 despite increasing exercise intensity. As such
a plateau phase is attained. The appearance of a plateau in VO2 has been considered the
best evidence for reaching VO2 max. However, this plateau is rarely achieved in paediatric
populations and therefore, the highest VO2 measured during a cardiopulmonary exercise
test (VO2 peak) is often considered the best measurable indicator of aerobic capacity.
b) Quality of performed effort
In the section “aerobic capacity” we mentioned the appearance of a plateau phase, where
VO2 is not increasing despite an increase in exercise intensity. For practical purposes, VO2
max is interchangeable with VO2 peak. Nevertheless, the absence of a VO2 plateau must raise
the question whether the participant performed an effort at or near the maximal level. Both
subjective criteria, such as sweating, facial flushing, unsteady biking, etc., as well as
objective criteria, especially in paediatric populations heart rate (HR) and respiratory
exchange ratio (RER) at VO2 peak, are important in assessing the quality of the performed
effort.
(1) Peak heart rate
The role of the cardiovascular system during exercise is to provide oxygen to the
exercising muscles, as well as to remove the metabolically produced carbon dioxide from
those muscles. Cardiac output is an important determinant of VO2 and increases linearly
with VO2. As cardiac output is the product of heart rate and stroke volume, heart rate also
increases linearly with exercise intensity and VO2, and gradually levels off when it
approaches VO2peak. As heart rate is relatively easy to measure, it is widely used in
exercise physiology.
(2) Peak respiratory exchange ratio
Respiratory exchange ratio (RER) is defined as the ratio of measured VCO2 and VO2. A
respiratory exchange ratio value less than 1.00 is indicative of the oxidative metabolism of
carbohydrates, such as glucose and glycogen, whereas an respiratory exchange ratio
value more than 1.00 indicates a mixture of carbohydrates and free fatty acids. During

22
progressive exercise, respiratory exchange ratio increases, and thus reflects a progressive
increase in VCO2 in relation to VO2. This is caused by a shift in metabolism from primarily
free fatty acids to glucose and glycogen, as well as through buffering lactate from
anaerobic glycolysis. A peak respiratory exchange ratio higher than 1.00 indicates a great
metabolic demand and an intense effort delivered by the participant. RER is equal to
respiratory quotient (RQ) at the cellular level. Therefore, RQ and RER can be used
interchangeably. In this thesis we will continue using RQ as measurement for the peak
respiratory exchange ratio. However, it must be noted that present day, ventilatory
threshold is more often used to evaluate the intensity of the effort delivered by the
participant.
c) Ventilatory threshold
The ventilatory threshold (VT) is defined as the highest attained VO2 without a sustained
increase in blood lactate concentration and lactate-pyruvate ratio. It is characterised by a
greater contribution of anaerobic glycolysis as an additional source of energy when the
cardiopulmonary system fails to deliver a sufficient amount of oxygen to sustain oxidative
metabolism of the exercising muscles. As such ventilatory threshold provides the physician
with information concerning the transition from oxidative metabolism to anaerobic
glycolysis during cardiopulmonary exercise testing. Practically, the ventilatory threshold is
used in the measurement and prediction of aerobic endurance performance as well as for
prescribing exercise intensity in endurance sports. In addition to this, the ventilatory
threshold is a useful alternative for participants unwilling or unable to perform a maximal
effort in order to estimate aerobic capacity.
Determining the ventilatory threshold can occur invasively and non-invasively. Invasively
would be by determining lactate levels in the participant’s blood during exercise. This
method is however devious and not recommended in paediatric populations. Present day
there are multiple methods to determine the ventilatory threshold non-invasively. There is
the ventilatory equivalents method, where EqO2 and EqCO2 are plotted in one graph
throughout cardiopulmonary exercise testing. The point that reveals an upward deflection
of the EqO2 without a concomitant increase in EqCO2 is referred to as the ventilatory
threshold. Another commonly used method is the V-slope method. This method involves
plotting VCO2 as a function of VO2 during cardiopulmonary exercise testing. The point at
which the increase in VCO2 is greater than the increase in VO2 is referred to as the V-
slope ventilatory threshold. At this point the regression coefficient obtains values higher
than 1,0.
23
The
is the percentage VO2 attained at the ventilatory threshold, relatively to
VO2peak.
d) Cardiac variables at peak exercise
The performance of the cardiovascular system during cardiopulmonary exercise testing is
typically monitored and followed by the recording of an electrocardiogram, as well as
measuring blood pressure and oxygen pulse.
(1) Heart rate
As mentioned earlier, the function of the cardiovascular system during exercise is to deliver
an adequate amount of oxygen and nutrients to the exercising muscles, while purging
carbon dioxide and lactic acid from those muscles. Cardiac output is the product of heart
rate and left ventricular stroke volume. Prior to exercise and at the onset of exercise, both
heart rate and left ventricular stroke volume will increase to sustain the exercising muscles.
However, the increase in heart rate and the increase in left ventricular stroke volume is
disproportionate. Heart rate can increase two up to three times above its normal value
whereas left ventricular stroke volume can only increase one and a half time its resting
value due to increased preload, increased myocardial contractility and a reduced afterload.
Hence, the increase in cardiac output is mainly due to the increase in heart rate and the
left ventricular stroke volume is considered to be the major physiological factor that limits
oxygen transport to the exercising muscles. These findings are even greater in a paediatric
population as children have a lower left ventricular stroke volume at all exercise intensities,
which they try to compensate for by higher heart rate values.
(2) Blood pressure
Blood pressure is the product of cardiac output and peripheral resistance. Systolic blood
pressure increases proportionally to cardiac output, whereas diastolic blood pressure
remains largely unchanged due to peripheral vasodilatation. Blood pressure is regulated
by arterial baroreceptors: they are stimulated when the arterial wall expands due to an
increase in systolic blood pressure leading to vasodilatation, whereas a decreased firing
rate of the baroreceptors will lead to vasoconstriction and an increase in heart rate. Blood
pressure measurements during cardiopulmonary exercise testing are performed to assess
the myocardial contractility, chronotropic response and dilation of the peripheral vascular
bed.
(3) Oxygen pulse
The oxygen pulse reflects the amount of oxygen that is consumed for the aerobic
resynthesis of ATP and is calculated by dividing VO2 by the simultaneously measured
heart rate. It reflects the amount of oxygen that is expended by the exercising muscles
24
during one cardiac cycle. Oxygen pulse can be used to estimate left ventricular stroke
volume. When it is desirable to reduce the influence of body size on absolute oxygen pulse
values coinciding with the measurement of VO2, oxygen pulse can be expressed by
normalizing the absolute values for body mass. This is the relative oxygen pulse.
(4) Heart rate recovery
Heart rate recovery (HRR) refers to the decrease in absolute beats per minute (bpm) of
the heart rate after a specific time (e.g. one HRR1, two HRR2, four HRR4, six minutes
HRR6) after cessation of peak exercise. Heart rate recovery has been the subject of much
interest, particularly because of its ability to predict all-cause mortality (77). Especially
heart rate recovery after one minute, an indicator of vagal nerve dysfunction, has been
shown to be a strong predictor of cardiovascular morbidity and overall mortality in adults
(78, 79). Therefore, an improvement in heart rate recovery suggest to have an effect on
reducing the risk of cardiovascular disease.
e) Pulmonary variables at peak exercise
During cardiopulmonary exercise testing, the pulmonary system is responsible for
regulating gas exchange and maintaining the acid-base balance when the metabolic
demands of the exercising muscles increase.
(1) Minute ventilation
Minute ventilation (VE) represents the total output of the pulmonary system. It is the
product of breathing frequency and tidal volume. Minute ventilation is regulated to maintain
the arterial pressure of CO2 (PaCO2) closely to its resting value, resulting in a closer linear
relation between minute ventilation and VCO2 up to the respiratory compensation point.
Above this compensation point, metabolic acidosis occurs, causing a decrease in blood
pH, and leads to compensatory hyperventilation.
(2) Relation between minute ventilation and VO2
The VE/VO2-slope represents the regression coefficient which describes the linear relation
between minute ventilation and VO2 during cardiopulmonary exercise testing. It provides
the physician with information concerning the ventilatory response to the aerobic metabolic
requirements of the exercising muscles. Minute ventilation increases almost linearly with
VO2 up to ventilatory threshold, from that point on, the increase in minute ventilation is
disproportional to the increase in VO2 due to the increase in metabolically produced carbon
dioxide and lactic acid. In non-scientific words, the VE/VO2-slope represents the average
number of liters of air that a child has to ventilate in order to take up, transport and utilize
one liter of oxygen.
25
(3) Relation between minute ventilation and VCO2
The VE/VCO2-slope represents the regression coefficient which describes the linear
relation between minute ventilation and VCO2 during cardiopulmonary exercise testing. It
provides the physician with information regarding the ventilatory efficiency. Minute
ventilation increases linearly with VCO2 up until the respiratory compensation point. Above
this point minute ventilation increases rapidly due to the effects of metabolic acidosis. The
VE/VCO2-slope represents the average number of liters of air that a child has to ventilate
in order to exhale one liter of carbon dioxide.
(4) Oxygen uptake efficiency slope
The oxygen uptake efficiency slope (OUES) was introduced in an attempt to develop an
objective and independent submaximal measure of aerobic capacity that might act as an
alternative for VO2peak. Due to the linearity of the oxygen uptake efficiency slope, wherein
the logarithmic transformation of minute ventilation makes the relation between minute
ventilation and VO2 throughout cardiopulmonary exercise testing linear, the oxygen uptake
efficiency slope does not require a maximal effort. This is especially important in paediatric
populations. Additionally, the oxygen uptake efficiency slope has been reported to be
highly correlated with other measures of aerobic capacity, including VO2peak and ventilatory
threshold. Another major advantage of the oxygen uptake efficiency slope is that it
incorporates pulmonary, cardiovascular and musculoskeletal function into a single
measurement as each of the systems involved in the pathway for oxygen from the
atmosphere to the mitochondria might be a physiological limiting factor for the oxygen
uptake efficiency slope, including pulmonary diffusing capacity, cardiac output, oxygen
carrying capacity of the blood and oxygen extraction as well as oxygen utilisation capacity
of the exercising muscles.
Since studies in paediatric populations found that oxygen uptake efficiency slope
correlates highly with body mass, body height, body mass index, body surface area, fat
free mass and age in healthy and in obese children it seems appropriate to normalize
absolute oxygen uptake efficiency slope values for body size. As such we obtain the
relative oxygen uptake efficiency slope values.
f) Additional variables
(1) Physical work capacity
Physical work capacity (PWC) is defined as the workload achieved at a heart rate of 150
beats per minutes (PWC150) (80). In the obese population PWC150 is used to give an
indication of the individual progress during treatment programme.
26
E. Cardiorespiratory fitness and childhood obesity
Different types of exercise lead to different results. Multiple studies have been conducted
on what training programme is the most efficient in reducing parameters of obesity, such
as fat mass, fat free mass, body mass index and waist circumference. However, the
purpose of physical exercise is multifactorial, also cardiorespiratory variables are
influenced by physical exercise. In this section we will provide an overview of the physical
exercise programmes that have been studied in recent research and what their effects are
on different variables.
1. Effects of cardiorespiratory fitness
Cardiorespiratory fitness (CRF) reflects the ability of the lungs and heart to transport
oxygen via the blood and the ability of the tissues and organs to extract and use oxygen
during sustained exercise. Cardiorespiratory fitness is generally improved by 20% after
regular exercise training in sedentary individuals. Additionally, cardiorespiratory fitness is
a strong predictor of cardiovascular disease (CVD) risk and appears to partly ameliorate
the health consequences of obesity. Four mechanisms have been proposed to explain the
health benefits of exercise in obese patients: improvements in lipid profile, insulin
sensitivity, vascular function and reduced inflammation. Increasing cardiorespiratory
fitness through exercise training may have health benefits through improving a number of
metabolic risk factors independent of weight-loss (69).
2. Effects of weight-loss
One of the best ways of studying the effects of obesity is to study the same group of
patients before and after weight loss, each patient acting as their own control (41). Weight
loss and the decrease in body fat are significantly more prominent in boys than in girls
(81).
a) Blood pressure
Weight-loss has been associated with a reduction of clinic blood pressure, which has been
associated with a decrease in risk factors of cardiovascular disease in adults. The study
by Hvidt et al. (32), conducted in 71 obese patients aged 10-18 years who were enrolled
in an lifestyle intervention programme for one year after which there was a follow-up of
one year, states that no significant differences were found between ambulatory blood
pressures in mmHg at baseline and follow-up. However, changes were observed in day-
time systolic and diastolic blood pressure when calculating ambulatory blood pressure z-
scores. Changes in anthropometric obesity measures from baseline to follow-up were
associated with changes in 24-hour, day- and night-time blood pressure, and associations
were significant when adjusted for relevant confounders at baseline. When a reduction of
27
blood pressure is primordial, weight-loss goal should be 5-15%. Additionally to caloric
restriction and regular physical exercise, medication must be considered (27).
b) Metabolic disorders
The weight-loss goal in obese individuals with either prediabetes, type 2 diabetes mellitus
or metabolic syndrome should be 10%. This should be attained by a lifestyle therapy that
includes a moderate calorie intake meal plan, aerobic and resistance exercise training. In
addition to lifestyle therapy, American guidelines suggest that phentermine/topiramate,
liraglutide 3mg or orlistat should be considered to achieve the 10% weight-loss goal. In
prediabetic patients who remain glucose intolerant despite lifestyle intervention therapy
and medication, diabetic medications can be considered (27).
In obese patients with dyslipidaemia, weight-loss goal is also 10%. This is to be achieved
by a lifestyle intervention programme consisting of physical activity, in addition to a diet
that minimizes sugars and refined carbohydrates, avoids trans fats, limits alcohol usage
and emphasizes intake of fiber-rich foods. Additionally, medication can be considered to
reduce lipid levels.
c) Pulmonary function
Most of the changes in respiratory physiology, discussed in “Health Consequences >
Pulmonary disorders”, are resolved after significant weight loss (82). This is because most
of the respiratory abnormalities are caused by the mechanical load of fat tissue on the
chest wall and the resultant deconditioning (28). Aerobic exercise training can partly
improve pulmonary function by strengthening the respiratory muscles. Although in order
to achieve the predicted values of lung function, activity duration should be lengthened
and a further reduction in BMI is necessary (83). Even modest weight loss leads to a
modest, yet significant improvement in expiratory reserve volume and functional residual
capacity. Respiratory muscle endurance improves, however maximal voluntary ventilation
(MVV) does not (41).
d) Physical condition
In a residential treatment programme of 33 weeks, consisting of moderate dietary
restriction, physical activity and psychological support, maximal performance levels
increased without an improvement in VO2peak (84). In an 8-week multidisciplinary inpatient
programme with a moderate calorie restriction, daily physical activity and behaviour
modification, VO2peak, however, did increase significantly (from 52% at initial assessment
to 70% after 8 weeks) (81). For asthma weight-loss goal should be at least 7-8%, for
obstructive sleep apnoea at least 7-11% (27). A 12-week training programme, consisting
of aerobic exercise training (2-3 times a week), a nutritional programme and educational

28
meetings for the management of obesity, resulted in an increase in peak VO2 by 10% (85).
In a 12-week family-based cognitive behavioural lifestyle treatment an increase was seen
in the VO2peak-SDS-kg of 20%. The mean differences between the intervention and control
group, adjusted for baseline differences, were statistically significant for VO2peak-SDS and
VO2peak-SDS-kg (86).
e) Gastroesophageal reflux disease
The data for weight loss as treatment for gastroesophageal reflux disease in obese
individuals is less robust, yet there seems to be an association with weight loss and fewer
gastroesophageal reflux disease symptoms (87). Weight-loss goal of 10% should be
pursued. Additionally, proton pump inhibitors (PPI) can be administered during weight-loss
interventions. Roux-en-Y gastric bypass is the bariatric surgery of choice (27).
f) Body fat composition
After a nutritional intervention of 16 weeks, no changes in fat free mass (FFM) were
observed. This also results in the lowest decrease in fat mass (FM) percentage. The
highest decrease in fat mass percentage, accompanied by a parallel increase in fat free
mass was observed in a multi-component intervention of 20 weeks (63). In the residential
treatment programme in the Zeepreventorium, a mean loss of 8.9% FM was reported (84).
In an 8-week interventional programme, there was a significant decrease in body mass
and fat mass in boys and girls. Additionally, the decrease in fat mass was associated with
the decrease in body mass in boys, but not in girls (88).

29
IV. Methods
A. Medical paediatric centre Zeepreventorium
1. Patient population
For this study, obese children and adolescents were recruited while entering an inpatient
treatment programme at the medical paediatric centre Zeepreventorium in De Haan,
Belgium. Here, children and adolescents with chronic conditions (e.g. obesity, cystic
fibrosis, chronic fatigue syndrome, etc.) are treated by a multidisciplinary team of health
care providers.
Every year in July, a new group of patients with obesity starts a twelve-month weight loss
programme. All children were referred to the Zeepreventorium by medical doctors after
outpatient treatment failed. Referring doctors have to fill in a request for admission
clarifying their reason for referral. The medical history of the patient and previous weight
loss interventions need to be mentioned in this letter. During a first consultation at the
rehabilitation centre, several months before intake, all necessary information about the
treatment programme is given. The medical history of the patient is discussed and their
anthropometry is measured for the first time.
The Zeepreventorium is using admission criteria for their inpatient weight loss programme.
Those criteria are split up in two categories according to age. For adolescents aged 16
years and younger, a BMI equal to or higher than the 97th age and gender specific
percentile is required to enrol (as defined by Flemish Growth Charts 2004) (89). For
adolescents older than 16 years a BMI ≥ 35 kg/m2 or a BMI ≥ 30 kg/m2 in combination with
comorbidities (e.g. elevated blood pressure, diabetes mellitus, etc.) is required.
2. Treatment programme
a) Intake
In the beginning of July, a new cohort enters the twelve-month weight loss treatment.
However, patients can also start their weight loss treatment in January or at the end of
August. During the first month of the treatment programme, every patient goes through a
specific set of tests. Those tests are performed and analysed by the certified staff from the
Zeepreventorium. This set of tests includes a dual energy X-ray absorptiometry,
electrocardiogram, cardiopulmonary exercise testing, spirometry, anthropometry, motor
skill assessment, psychological tests and blood tests. Every patient goes through the same
set of tests and those tests are repeated at fixed moments in the treatment programme.
For instance, the anthropometry (length, weight, BMI) is assessed on a monthly basis. The
more sophisticated tests (e.g. dual energy X-ray absorptiometry, cardiopulmonary

30
exercise testing and spirometry) are assessed a second time after six months of treatment
and a last time after ten months.
b) Treatment programme
The weight loss programme of the Zeepreventorium exists of different elements as will be
explained in the next sections. The cornerstones are physical exercise, dietary changes,
psychological support and education on health topics. As the residential aspect of this
treatment programme has its importance too, it will be discussed in a separate paragraph.
Two different treatment programmes are used at the Zeepreventorium: one treatment
programme for children younger than 14 years, and one programme for children older than
14 years. In the following text, the treatment programme will be discussed for children
older than 14 years.
(1) Residency at the Zeepreventorium
The treatment programme at the rehabilitation centre is an inpatient treatment programme.
Upon entering the programme, patients are assigned to different groups according to their
age and gender. In the beginning of the treatment programme, the children and
adolescents are allowed to return home for the weekend twice a month. After a couple of
months, however, they are allowed to go home more frequently. The children and
adolescents stay in the rehabilitation centre during holidays, except for two longer
reintegration periods of circa one week (after plus minus six months and plus minus ten
months). Following the philosophy of the rehabilitation centre, those visits back home are
called “moments of reintegration.”
The purpose of these “moments of reintegration” is to prepare the patients for their re-
entrance in society (i.e. living in a non-therapeutic setting). During their stay at the
rehabilitation centre, the children are taught to adapt a new and healthy lifestyle. The
Zeepreventorium provide all necessities to support these lifestyle changes (i.e. healthy
food, organised sport activities, a supportive environment). The children will be exposed
to a more challenging environment when they leave this therapeutic setting (i.e. during the
“moments of reintegration” as well as after the treatment programme).
In order to get the maximum effect out of these “moments of reintegration”, individuals are
attended to by a psychologist, the dietitian and the physiotherapist. Afterwards,
expectations and results are again discussed with the psychologist. The role of the
psychologist at the Zeepreventorium will be discussed in more detail later in this paper.
The “moments of reintegration” are also essential for the patient to maintain his or her
social life (e.g. youth organization, old school friends, sports club) and to facilitate the
reintegration in his or her family. Another initiative to ease the reintegration of the patients

31
in their family is the so-called family days. Those family days will be discussed more in
detail in the paragraph Education.
Patients can continue their secondary education at the Zeelyceum, a secondary school
associated with the Zeepreventorium and located at the same site. The Zeelyceum is
organised as a type five secondary school, meaning that it is adapted to the educational
needs of children who are living in a rehabilitation centre or in a hospital.
(2) Physical exercise
The training programme at the Zeepreventorium is tailored to the individual needs and
interests of the children. Children are encouraged to exercise before as well as after
school. The rehabilitation centre organizes group sport sessions 2 hours per day or 10
hours per week. In addition to those group sessions, each child performs three hours per
week of individual exercises organised in smaller groups of three to five students. During
the first two months, the main focus of these individual training sessions is on posture
correction and on the right execution of the exercises and movements. During those first
two months, endurance training is done in a recreational manner.
In a second phase, the individual training program of a week is made up of one hour of
physical exercise in the swimming pool, one hour of endurance training in the fitness room
followed by some strength exercises and one hour of core stability training. The exercises
in the swimming pool consist of endurance training, improvement of the swimming
technique and aqua fitness.
Every form of endurance training is guided by the heart rate of the patient. The results of
the cardiopulmonary exercise test are used to determine which heart rate zone is ideal for
endurance training. During the first months of the training programme, endurance training
starts at a heart rate of 50-60% of maximum heart rate. In the last few months, the heart
rate goes up to 75% of maximum heart rate.
In the rehabilitation centre, the main focus of physical exercise is on education and re-
education. The children are taught to move, to train, and to exercise correctly. All physical
exercise is done under supervision of the physiotherapists. They are responsible for
adapting the intensive training programme to the physical capacity of each child.
(3) Dietary changes
The children get three meals a day at the rehabilitation centre (i.e. breakfast, lunch and
dinner). More specific, they receive two cold meals and one hot meal. Three times a day
the children are offered one piece of fruit (at 10 am, 16 pm and 20 pm) and after every

32
lunch one dairy product as dessert (yoghurt or pudding). Once a week they get a biscuit
instead of fruit.
During the day the children are encouraged to drink water, if possible up to one and a half
litres a day. Each meal they are stimulated to drink one glass of water. The daily energy
and nutrient intake consists of all necessary components as prescribed by the Superior
Health Council of Belgium (2016) and Flemish Institute of Health Promotion and Disease
Prevention (VIGeZ) (89, 90).
Concerning the composition of energy intake, this means 10% of total energy-intake
(10En%) of proteins, 50-55En% of carbohydrates (with less than 10En% of mono and
disaccharides) and 30-35En% of fat. There should be less than 10En% of saturated fatty
acids (SFA) and attention for an adequate intake of mono and poly unsaturated fatty acids
(MUFA’s and PUFA’s). The range of calorie intake differs for gender and age using the
Flemish growth charts (2004) (89, 91).
Dieticians at the Zeepreventorium decided to not base their diet on specific calorie
calculations and restrictions. This decision was made because of the notable
interindividual differences that exist in basal metabolic rate (BMR) and physical activity
level (PAL). Besides that, there are a lot of difficulties associated with predicting those
values for individual children or adolescents with obesity.
Instead of specific calorie prescriptions, the dietician defines minimum and maximum
portions for every meal. Those portions are based on the Flemish Nutrition Pyramid of
2015 and are adjusted to age and gender. In the appendix you can find an overview of
these minimum and maximum portions (addendum I) (89). Each meal, the children are
allowed to decide for themselves whether they want a minimum or a maximum portion.
Although, calorie calculations can be made on an individual level if requested by one of
the doctors. During the treatment programme, the diet can be adjusted on an individual
level, according to the evolution of weight, length and level of activity.
Last year, the dieticians analysed every minimum and maximum portion in every group
during one week. Their goal was to assess the efficacy of their approach and to get an
idea of the real energy and nutrient intake of the patients. The results of this study are
included in the appendix (table II).
At the Zeepreventorium, the children have also two moments where they can choose
something higher in calories (one time during the week and one time during the weekend).
They have three moments where they can drink a can of light soda instead of water (two

33
times during the week and one time during the weekend). Whether they take these
moments and when they take them is their own choice.
(4) Psychological
The treatment programme is an “immersion treatment” which places patients in a
therapeutic and educational environment for an extended period of time. Besides focusing
on healthy eating habits and moderate exercises, the programme also exists of regular
training sessions with a trained psychologist.
Individual sessions with a psychologist are organised on a regular basis, depending on the
age and care dependency of the patient. At the Zeepreventorium, the children are divided
in two groups according to care dependency. The group with the biggest medical needs
has one individual session with a therapist per week. If the therapist is convinced of the
adolescent’s skills and progression on a personal level, he can decide to lower the
frequency of the sessions to one session every two weeks. Normally it takes six up to nine
months to go from one session a week to one session every two weeks. The second group
has one session every two weeks. Additional sessions are possible if necessary.
The duration of these sessions is based on the age of the patient. The older patients have
training sessions of 50 minutes. The younger patients have individual sessions of 25
minutes due to their shorter span of attention. During these individual sessions several
themes are discussed and several psychological techniques are integrated. Cognitive
behavioural therapy (CBT) is one of those techniques. The cognitive behavioural therapy
consists of individual meetings with a therapist but also of regular group sessions.
During these sessions the youngsters are taught several self-regulation skills applied to
an eating- and non-eating-related context. Examples of these skills are self-observation,
self-instruction, self-evaluation and self-reward, motivational interviewing and problem
solving. The purpose of this training is to enhance the self-awareness of the patients
concerning their eating behaviour. Enhancing the self-awareness of the patients will help
them to enlarge their capacity to modify the behavioural response (e.g. emotional eating
in a high-risk situation like feeling alone).
The emphasis on the role of self-regulation is primordial. Self-regulation consists of two
distinct aspects: sensitivity to reward and inhibitory control. The first concept reflects the
sensory pleasure that is associated with receiving a reward and the motivation of the
patient to obtain this reward. The latter refers to the executive function by which impulses
or responses are controlled.

34
Finally, the self-determination theory (Deci and Ryan) is applied to weight control. There
are three innate psychological needs as the basis for autonomous motivation. Those three
basic components of this theory are: competence (i.e. having the feeling of efficacy),
autonomy (i.e. perceiving internal locus of causality; having a feeling of free will) and
relatedness (i.e. having a sense of security and belonging). Those psychological needs
are being emphasised during the group and individual psycho-education sessions which
are organised on a regular base.
All the aforementioned skills are thus discussed and trained at the regular meetings with
the psychologist. The psychologists also make use of the socratic dialogues and they try
to change the external motivation regarding a healthy lifestyle into an internal motivation.
Another advantage of an inpatient treatment programme is that the children are able to
train these skills every day under the supervision of their doctors, physiotherapists,
teachers and coaches. Those different mentors have regular meetings with the
psychologist to share their observations of the children.
(5) Education
The last cornerstone of the inpatient weight loss treatment programme of the
Zeepreventorium is education. Next to secondary education, patients are educated on
health topics (e.g. energy intake, cooking skills) in extra training sessions and lessons.
The family of the patient is involved in this process as well.
Overall psychological education on psychosocial and dietary subjects takes place in the
ten first weeks after admission. The psychological education is included in the individual
sessions with the therapist. The sessions of the first ten weeks are followed by a three
week during problem solving programme. If useful, the therapists have a whole range of
additional protocols on different subjects which can be used in function of a thoroughly
preparation of reintegration in the social context. Additional sessions are possible if
necessary.
Regarding parental involvement in this programme, parents are requested to help their
child to adopt the new lifestyle. Parents are obliged to do so during family days, psycho-
educational moments or individual contacts with therapists in the rehabilitation centre.
During the first six months, there’s one family day per month.
The family days focus on exercising as a family, cooking healthy meals as a family and
supporting the new lifestyle as a family. During psycho-education, parents are instructed
about motivational encouragement, supporting the self-image of the child and parenting
skills (e.g. how to live with a child or adolescent with a chronic disease). The personal

35
contacts tend to individualise the above mentioned subjects. For the youngsters of 12
years and above, a monthly contact is organised. This is also the case for the younger
children but these are supplemented with informal contacts whenever parents come to the
rehabilitation centre.
3. Measures
All the measures mentioned below are assessed by skilled health professionals of the
Zeepreventorium. The tests are performed and analysed at their own laboratory.
a) Anthropometry
Stature and weight are assessed on a monthly basis according to standard techniques
and by using calibrated devices. Weight is measured to the nearest 0,1 kg using a digital-
balanced scale. Stature is measured to the nearest 0,1 cm using a wall mounted
Harpenden stadiometer while the children are barefoot in anatomical position. Stature and
weight are always assessed with the same device. For the data analysis, stature was used
from the anthropometric assessments. Weight however was used from the output of the
Dual-Energy X-ray absorptiometry.
Body Mass Index (BMI) and body surface area (BSA) were calculated afterwards. The
body surface area was calculated with the formula of Mosteller. This formula was chosen
because of its feasibility to calculate.
Body mass index (kg/m2) =
( ) ∗ ( )
Body surface area (m2) = ( ) ∗ ( )
b) Body composition
Body composition is assessed by using a Refurbished Prodigy Full Size dual-energy X-
ray absorptiometer (GE Healthcare, Diegem, Belgium). The following measures are
assessed: total fat %, total fat mass (in kg), total lean mass (in kg), total mass (in kg), total
bone mineral content (in g) (BMC), total bone mineral density (BMD) and z-score of bone
mineral density. The z-score of the bone mineral density is based on the USA (combined
NHANES/ Lunar) whole body reference data in accordance to age and ethnicity (92). The
Refurbished Prodigy Full Size dual-energy X-ray absorptiometer is also responsible for the
assessment of the waist circumference, hip circumference and waist-hip ratio. The data of
the Dual-energy X-ray absorptiometry were used to calculate fat-free mass. For the data
analysis, total mass was used from the dual-energy X-ray absorptiometer
Total fat free mass (in kg) = Total mass – Total fat mass

36
Total fat free mass (in %) = ( ) – ( )
( )
c) Cardiopulmonary exercise testing
(1) General overview
Symptom-limited cardio-pulmonary exercise testing was performed on an Ergoselect 200P
bicycle (Ergoline GmbH, Bitz, Germany). Before assessing the cardio-pulmonary exercise
capacity, an electrocardiogram is taken in order to exclude patients with severe cardiac
disease.
At the rehabilitation centre, two test protocols are used for children with obesity. Originally
one protocol was used for children smaller than 140 cm and a second one for children who
measure more than 140 cm. As this subdivision wasn’t applicable anymore to their
patients, another way of determining the best protocol for each patient was sought. At this
moment, they try to predict which protocol fits the patient best. The purpose is that the
patient reaches his or her maximum exercise capacity after 10-15 minutes of testing.
In order to do so, there are two protocols eligible. In both protocols the children are
encouraged to keep up a pedalling cadence between 55 and 65 rpm. The first protocol
sets off with a workload of 30W. Every two minutes 20W is added to the workload. When
the patient isn’t any longer able to maintain the prescribed cadence, the workload drops
to 30W for another six minutes of recuperation. Patients were instructed and encouraged
to exercise to the limit of their tolerance.
The second protocol starts at a workload of 50W and 25W is added every two minutes.
The workload drops to 50W during the six minutes of recuperation. The patients are always
tested with the same protocol as in their first exercise test.
During the exercise an Ergocard Clinical (Medisoft Belgium, Sorinnes, Belgium) metabolic
cart is responsible for collecting parameters of physical capacity. The Ergocard Clinical
features a nondispersive infrared sensor (NDIR) of CO2 and electrochemical O2 sensor
which is responsible for breath-by-breath measurement of the gas exchange. Before each
exercise test, the gas analysers and flow meter are calibrated. The Medcard, an option of
the Ergocard Clinical, is responsible for registering the heart rate by using the peripheral
leads. The Medcard is able to perform an electrocardiogram but this option is not used at
the Zeepreventorium. The Ergocard Clinical has a Sa02 finger sensor which determines
the oxygen saturation during exercise.
37
(2) Variables
For our statistical analysis the following variables were used from the cardiopulmonary
exercise test: heart rate rest, VO2rest (mL/min), VO2rest (mL/min/kg), VE rest, heart rate VT, VO2
VT (mL/min), VO2 VT (mL/min/kg), VE VT, RQ VT, heart rate peak, predicted heart rate peak,
VO2peak (mL/min), VO2peak (mL/min/kg), VE peak, predicted VO2peak (%), RQmax, physical work
capacity, oxygen uptake efficiency slope,
, heart rate recovery one
minute (bpm), heart rate recovery two minutes (bpm), heart rate recovery one minute (%) and heart
rate recovery two minutes (%).
After retrieving most of these variables immediately from the cardiopulmonary exercise
test, several additional parameters had to be calculated. The first parameter which was
calculated afterwards is the oxygen uptake efficiency slope (OUES). The oxygen uptake
efficiency slope is derived from the relationship between oxygen uptake VO2 (in ml/min)
and minute ventilation (VE) (l/min) during incremental exercise. It has been calculated in
an Excel file by applying the following linear regression V02 = a log (VE) + b. The slope of
this line, the letter a in the equation, is called the OUES. It shows the effectiveness of VO2.
A second group of variables which were calculated afterwards, is the group of heart rate
recovery. Heart rate recovery was calculated at different moments in time (i.e. one minute
after heart rate peak, two minutes after heart rate peak, four minutes after heart rate peak and
six minutes after heart rate peak) and was expressed in beats per minute as well as in % of
the maximum heart rate.
Heart rate recovery at x min (in bpm) = Heart rate peak in bpm – Heart rate at x min in bpm
Heart rate recovery at x min (in %) = ( ) – ( )
Predicted values were used for heart rate max and VO2 max. Those predicted variables
were calculated by using the following formulas (93):
Predicted Heart rate max male = 220 – age (years)
Predicted Heart rate max female = 210 – (age-0,65)
Predicted VO2 max = 0,001 ∗ 𝑤𝑒𝑖𝑔ℎ𝑡 ∗ (50,72 − 0,372 ∗ 𝑎𝑔𝑒)*
* The formula used by medisoft is defined by Karl Wasserman
d) Spirometry
Lung function is assessed using the Medisoft Bodybox 5500 (Medisoft Belgium, Sorinnes,
Belgium). The following parameters of the spirometry are used in the data analysis: forced

38
vital capacity (FVC) (in L), forced expiratory volume in one second (in L), total lung capacity
(in L) and vital capacity (in L).
e) Motor skill assessment
The BOT-2 (Bruininks-Oseretsky Test of Motor Proficiency, Second Edition) is
administered and scored by trained physiotherapists of the rehabilitation centre, following
a standardized protocol. In this study the short form of the BOT-2 was used. By using
gender and age specific normative tables, standard scores (standard BOT-2) can be
calculated along with the corresponding percentile rank. In this study running speed and
agility, strength and the percentile rank are used.
f) Blood Pressure
Blood pressure was measured with the CARESCAPE* V100 Monitor (GE Healthcare,
Diegem, Belgium).
B. Study design
1. Study objective
At the beginning of this study, two main objectives were set. The first objective was to
perform a descriptive analysis of the study population before as well as after the weight
loss intervention. The second goal was to investigate the correlation between the evolution
in body composition (dual-energy x-ray absorptiometry and anthropometry) and the
parameters of exercise capacity (VO2 max, weight adjusted VO2 max, predicted VO2 max, heart
rate max, predicted heart rate max, RQ peak). As such this is an interventional study although
there was no interference in the normal inpatient weight loss treatment program.
2. Study population
55 obese children (37 girls and 18 boys) between 14 and 19 years were recruited from the
“Zeepreventorium” at their admission. The medical staff of the “Zeepreventorium” selected
five different groups to participate in this study (on a total of nine groups). Inclusion criteria
were BMI ≥ 97th age and gender specific percentile for children aged 16 and younger. For
the adolescents older than 16 years a BMI ≥ 35 kg/m2 (or a BMI ≥ 30 kg/m2 in combination
with comorbidities) was set as cut-off. No exclusion criteria have been applied.
3. Study Process
a) Literature
The study set off with a literature review. Articles were collected using the Pubmed search
engine. Endnote was used to refer to previous literature.

39
b) Ethics
The ethics committee of the University of Ghent (Ghent, Belgium) approved this study
(Belgian registration number: B670201630025). All participants and their parents gave
their written informed consent at admission.
c) Data analysis
(1) Data collection
Data was retrieved from the electronic health records of the patients of the
Zeepreventorium. This data was stored in an Excel file.
(2) Statistics
Statistical analysis was performed by using SPSS, version 25 (IBM, US). In a first phase,
the excel file was transformed in a .zsav data file. This data file had to be adapted before
starting any statistical analysis: exclusion of impossible values, adding labels to the
variables, correction of the measures of the variables and calculating new variables.
In a second phase, a descriptive analysis was conducted (i.e. assessing mean values and
standard deviation scores of the variables). The descriptive analysis was performed for
several subgroups of our population (i.e. whole population, male participants and female
participants). The baseline characteristics were assessed by using the whole study
population. For the analysis of the effects of the intervention, only participants who
completed the treatment programme were withheld. These leftovers were analysed as a
whole as well as according to gender.
Normality was tested in a third phase by using the Shapiro-Wilk test. Normality was
determined for all the variables as well as for the difference of each variable pre- and post-
interventional (i.e. variablepre – variablepost). The latter was necessary to make a decision
between the Paired samples T-test and the Wilcoxon signed ranks test for assessing
statistical difference between the variables pre-and post-intervention. The first one was
needed to pick the appropriate correlation test (i.e. Pearson or Spearman).
In a fourth phase, the Paired Samples T-test and the Wilcoxon signed ranks test were
applied to our data to assess statistical differences between the variables before and after
the treatment programme. The Paired Samples T-test was used for the variables with a
normal distribution, the Wilcoxon signed ranks test was used for the variables with a non-
normal distribution. These tests were applied to the data of all participants who completed
the treatment programme as well as to the data of our male and female group separately.
In order to assess statistical differences between our male and female participants, new
variables have been calculated. These variables provide information about the way the

40
variables had changed during the weight loss treatment programme and were calculated
as follows
𝐶ℎ𝑎𝑛𝑔𝑒 𝑜𝑓 𝑣𝑎𝑟𝑖𝑎𝑏𝑙𝑒 𝑥 =𝑉𝑎𝑟𝑖𝑎𝑏𝑙𝑒 𝑥 𝑝𝑜𝑠𝑡 − 𝑉𝑎𝑟𝑖𝑎𝑏𝑙𝑒 𝑥 𝑝𝑟𝑒
𝑉𝑎𝑟𝑖𝑎𝑏𝑙𝑒 𝑥 𝑝𝑟𝑒∗ 100
By doing this, it was possible to compare our male and female participants by using the
Independent Samples T-test or the Mann-Whitney U Test, as needed. Normality of the
variables itself was assessed by using the Shapiro-Wilk test and the Levene test was used
to assess the equality of variances of the different variables. Only if the variables were
normally distributed in the population and if the variances were equal in both groups, the
Independent Samples T-test has been used.
During the last phase of our statistical analysis, correlation was assessed between change
in body composition and change in exercise capacity, between body composition before
the intervention and exercise capacity after the intervention and between exercise capacity
before the intervention and body composition after the intervention. To assess correlation,
the Pearson or Spearman correlation test has been used. The Pearson test was used for
the variables with bivariate normality, the Spearman test for the remaining variables.
Correlation was tested between the change of variables of body composition and the
change of variables of exercise capacity, between the variables of body composition
before the intervention and the variables of exercise capacity after the intervention and
between variables of exercise capacity before the intervention and variables of body
composition after the intervention.
All reported P-values are two-tailed and statistical significance is set at less than 0,05.

41
V. Results
This chapter exists of three different components: baseline characteristics, effects of the
intervention and correlation analysis. For the analysis of the baseline characteristics, data
was used from all the patients enrolled in this treatment programme. However, only the
data of the patients who completed the treatment programme were used for the analysis
of the effects of the intervention and for the correlation analysis.
A. Baseline characteristics
1. Anthropometric variables
This study includes 55 participants (37 girls and 18 boys). At the admission in July 2016,
the median age of the patients was 16,29 years (14,69-19,01). The mean total mass at
admission, was 116,38 kg (±23,37). This mean total mass of the patients is the result of
the sum of mean total fat mass, mean total lean mass and mean total bone mineral
content. The mean total fat mass at baseline was 57,83 kg (±13,73), the mean total lean
mass was 55,43 kg (±11,56) and the median total bone mineral content was 3,02 kg (2,02-
4,20). The mean length was 1,69 m (±0,10), resulting in a median body mass index of
38,11 kg/m2 (30,67-67,17) and a mean body surface area of 2,33 m2 (±0,26). The mean
waist circumference was 124,84 cm (±13,61) and the mean waist-hip ratio 0,98 (±0,07).
The median total fat percentage was 50,17% (33,89-57,58).
2. Spirometry
The results of the spirometry at baseline were: median forced vital capacity (FVC) of 4,11
L (3,05-6,34), mean forced expiratory volume in one second (FEV1) of 3,45 L (±0,59),
median total lung capacity of 5,45 L (±1,07) and median vital capacity (VC) of 4,10 L (3,07-
6,29).
In table IIIa, there’s an overview of the baseline characteristics of body composition and
lung function.

42
Variables At admission
Participants: Girls Boys
55 37 18
Age (years) 16,29 (14,69-19,01) Total mass (kg) 116,38 (±23,37) Length (m) 1,69 (±0,10) Body mass index (kg/m2) 38,11 (30,67-67,17) Body surface area (m2) 2,33 (±0,26)
Waist circumference (cm) 124,84 (±13,61) Waist-Hip ratio 0,98 (±0,07) Total fat (%) 50,17 (33,89-57,58) Total fat mass (kg) 57,83 (±13,73) Total lean mass (kg) 55,43 (±11,56) Total bone mineral content (kg) 3,02 (2,02-4,20)
Forced Vital Capacity (L) 4,11 (3,05-6,34) Forced Expiratory Volume in one second (L) 3,45 (±0,59) Total Lung Capacity (L) 5,45 (4,15-8,31) Vital Capacity (L) 4,10 (3,07-6,29) Table IIIa: Baseline characteristics of measures of body composition and lung function for all obese children and adolescents enrolled in the treatment programme. Normally distributed data are represented as mean value (± Standard deviation) and non-normal data is represented as median (minimum-maximum).
3. Cardiopulmonary exercise test
Variables At admission
Heart raterest (bpm) 96,71 (±12,25) VO2rest (mL/min) 536 (±197,67) VO2rest (mL/min/kg) 4,68 (±1,60)
Heart rate VT (bpm) 142,80 (±14,78) Heart rate VT / Heart rate max (%) 88,52 (±7,78) VO2 VT (mL/min) 1649,94 (±348,17) VO2 VT (mL/min/kg) 14,72 (±3,28) RQ VT 0,87 (±0,06)
Heart rate max (bpm) 161,35 (±14,73) Predicted heart rate max (%) 84,75 (±8,04) VO2peak (mL/min) 2007,58 (±436,75) VO2peak (mL/min/kg) 18,47 (±3,94) Predicted VO2peak (%) 57,40 (35,32-83,26) RQmax 0,98 (±0,07)
Oxygen uptake efficiency slope (mL/min O2) / (L/min VE) 2303,79 (±578,73)
(%) 82,15 (±9,33)
Physical work capacity (Watt) 125 (70-200)
Heart rate recovery one minute (bpm) 7,04 (±6,87) Heart rate recovery two minutes (bpm) 28,90 (±10,68) Heart rate recovery one minute (%) 4,32 (±4,23) Heart rate recovery two minutes (%) 17,75 (±6,08) Table IIIb: Baseline characteristics of measures of cardiopulmonary exercise capacity of all obese children and adolescents enrolled in the treatment programme. Normally distributed data are represented as mean value (± Standard deviation) and non-normal data is represented as median (minimum-maximum).

43
All the results of the cardiopulmonary exercise test are represented in table IIIb.
At rest, the participants had a mean heart rate of 96,71 bpm (±12,25) and a mean VO2 of
536 mL/min (±197,67). At ventilatory threshold the mean heart rate was 142,80 bpm
(±14,78), the mean VO2 1649,94 mL/min (±348,17) and mean RQ 0,87 (±0,06). At
maximum exercise intensity, the mean heart rate of the participants was 161,35 bpm
(±14,73), resulting in a mean predicted heart rate of 84,75% (±8,04). The mean VO2peak
was 2007,58 mL/min (±436,75), the median predicted VO2 57,40% (35,32-83,26). The
mean weight adjusted VO2 was 18,47 mL/min/kg (±3,94) and the average RQ at maximum
intensity 0,98 (±0,07). After one minute of recuperation, the maximum heart rate had
dropped with 7,04 bpm (±6,87) or 4,32% (±4,23). After two minutes the mean heart rate
recovery was 28,90 bpm (±10,68) or 17,75% (±6,08). The oxygen uptake efficiency slope
was 2303,79 (±578,73). The
was 82,15% (±9,33) and the median
physical work capacity was 125 Watt (70-200)
In the appendix, there’s an overview of all the baseline characteristics (Table IIIc).
B. Effects of the intervention
1. Overview
After twelve months of treatment, 41 participants were left (29 girls and 12 boys). Fourteen
students or 25,45% of the patients dropped out of this study because of several reasons.
Those reasons were mainly linked to living in a group away from home (i.e. homesickness
and not being able to live and function in group) and to school related problems (i.e.
educational issues). There is no evidence that the drop-outs of this study are linked to
physical restrictions.
The mean total mass of the participants dropped from 118,94 kg (±24,80) to a median total
mass of 90,06 kg (61,44-163,91) after ten months of treatment. This decrease in total mass
was labelled as significant (p < 0,001) and it was the result of a significant decrease in
mean total fat mass and mean total lean mass. The mean total fat mass of the patients
went from 59,67 kg (±14,38) to 39,04 kg (±15,39) (p < 0,001) and total lean mass from
56,12 kg (±11,98) to 52,69 kg (±10,73) (p < 0,001). The mean total bone mineral content
significantly increased from a median value of 3,00 kg (2,07-4,20) to a mean value of 3,33
kg (±0,51) (p < 0,001).
Over the twelve-month treatment, individuals grew in length from 1,70 m (±0,09) to 1,72
m (±0,09). The BMI of the participants decreased significant from a median value of 39,24
(30,67-67,17) kg/m2 to a median value of 30,56 kg/m2 (21,39-59,63) (p < 0,001). The mean
body surface area decreased from 2,36 m2 (±0,27) to 2,12 m2 (±0,27) (p < 0,001). Waist

44
circumference decreased with 14,83% from a mean value of 125,93 cm (±14,31) to a
median value of 101,20 cm (82,90-144) (p < 0,001) and mean waist-hip ratio dropped from
0,98 (±0,07) to 0,93 (±0,08) (p < 0,001). Total fat percentage changed from a median value
of 50,90% (37,04-57,58) at baseline to a mean value of 41,14% (±8,98) post-treatment (p
< 0,001).
There were no significant differences in the variables of exercise capacity at rest. At
ventilatory threshold, significant changes were found in all variables. Heart rate at
ventilatory threshold increased with 5,15%, going from 143,23 bpm (±14,23) to 150,60
bpm (±16,15) (p < 0,05). VO2 changed from 1676,67 mL/min (±335,62) to 1868,60 mL/min
(±487,33) (p < 0,05). The RQ of the participants increased from 0,87 (±0,06) to 0,96 (±0,06)
(p < 0,001).
At maximal exercise, heart rate max augmented from 160,64 bpm (±14,89) to 170,35 bpm
(±13,88) (p < 0,001) and predicted heart rate max from 84,39% (±7,71) to 89,98% (±7,15)
(p < 0,001). The mean VO2peak was 2044,23 mL/min (±419,00) before the treatment, and
increased with 6,04 percentage to 2167,62 mL/min (±485,47) (p < 0,05). Weight adjusted
VO2peak increased from 18,47 mL/min/kg (±3,97) to 23,61 mL/min/ kg (±6,30) (p < 0,001)
and the predicted VO2peak from 55,93% (±10,06) to 64,50% (±12,80) (p < 0,001). The RQmax
increased significant from 0,97 (±0,07) to 1,10 (±0,07) (p < 0,001).
Concerning heart rate recovery, significant changes were found in all variables. The mean
heart rate recovery after one minute (HRR1) was 7,44 bpm (±6,40) at baseline and 10,40
bpm (±4,68) after ten months of treatment (p < 0,05). In percentages heart rate recovery
after one minute increased from 4,60% (±3,89) to 6,14% (±2,75) (p < 0,05). The heart rate
recovery after two minutes of recuperation increased from 29,15 bpm (±10,17) at the start
to 35,65 bpm (±9,39) (p < 0,001) at the end and from 18,03% (±5,86) to 20,88% (±5,05)
(p < 0,05).
The
increased with 3,45%. Starting at 82,21% (±8,95), the
increased to 86,08% (±10,14), however, p-value was 0,462. The
oxygen uptake efficiency slope changed from a mean value of 2371,98 (±587,34) to a
median value of 2346,80 (1640-4502,10) but it was not labelled as significant (p = 0,386).
Physical work capacity changed from a median value of 127,81 Watt (70-200) to a median
value of 150 Watt (90-250) (p < 0,001). Concerning the results of spirometry, the forced
expiratory volume in one second increased significantly from 3,46 L (±0,59) to 3,50 L
(±0,51) (p < 0,05), forced vital capacity increased from 4,36 L (±0,77) to 4,46 L (±0,75) (p

45
< 0,05), total lung capacity from a median value of 5,58 L (2,04-8,31) to a mean value of
5,88 L (±0,98) (p < 0,05) and vital capacity from 4,27 L (±0,73) to 4,31 L (±0,65) (p < 0,05).
Table IVa: Effects of the multidisciplinary treatment programme: measures of body composition, cardiopulmonary exercise capacity and lung function of all obese children and adolescents enrolled in the treatment programme. Normally distributed data are represented as mean value (± Standard deviation) and non-normal data is represented as median (minimum-maximum).
Variables At admission After ten months % p-value
Participants: Girls Boys
41 28 13
41 28 13
Age (years) 16,24 (14,69-18,48)
Total mass (kg) 118,94 (±24,80) 90,06 (61,44-163,91) -20,08 < 0,001
Length (m) 1,70 (±0,09) 1,72 (±0,09) +1,18 < 0,001
Body mass index (kg/m2) 39,24 (30,67-67,17) 30,56 (21,39-59,63) -21,39 < 0,001
Body surface area (m2) 2,36 (±0,27) 2,12 (±0,27) -10,17 < 0,001
Waist circumference (cm) 125,93 (±14,31) 101,20 (82,90-144,00) -14,83 < 0,001
Waist-hip ratio 0,98 (±0,07) 0,93 (±0,08) -5,10 < 0,001
Total fat (%) 50,90 (37,04-57,58) 41,14 (±8,98) -17,85 < 0,001
Total fat mass (kg) 59,67 (±14,38) 39,04 (±15,39) -34,57 < 0,001
Total lean mass (kg) 56,12 (±11,98) 52,69 (±10,73) -6,11 < 0,001
Total fat free mass (kg) 59,27 (±12,00) 56,02 (±10,97) -5,48 < 0,001
Total bone mineral content (kg) 3,00 (2,07-4,20) 3,33 (±0,51) +5,81 < 0,001
Oxygen uptake efficiency slope (mL/min O2) / (L/min VE)
2371,98 (±587,34) 2346,80 (1640-4502,10) +1,71 = 0,386
(in %) 82,21 (±8,95) 86,08 (±10,14) +3,45 = 0,462
Physical work capacity (Watt) 127,81 (70-200) 150 (90-250) +16,23 < 0,001
Heart rate VT / Heart rate max (%) 88,76 (±6,83) 91,07 (74,29-96,67) -0,34 = 0,678
Heart raterest (bpm) 96,58 (±12,91) 91,18 (±12,84) -5,58 = 0,097
VO2rest (mL/min) 545,78 (±200,49) 535,21 (±176,31) -1,93 = 0,931
VO2rest (mL/min/kg) 4,64 (±1,50) 5,90 (±2,20) +27,16 < 0,05
Heart rate VT (bpm) 143,23 (±14,23) 150,60 (±16,15) +5,15 < 0,05
VO2 VT (mL/min) 1676,67 (±335,62) 1868,60 (±487,33) +11,45 < 0,05
VO2 VT (mL/min/kg) 14,54 (±3,42) 20,40 (±5,34) +40,30 < 0,001
RQ VT 0,87 (±0,06) 0,96 (±0,06) +10,34 < 0,001
Heart rate max (bpm) 160,64 (±14,89) 170,35 (±13,88) +6,04 < 0,001
Predicted heart rate max (%) 84,39 (±7,71) 89,98 (±7,15) +6,66 < 0,001
VO2peak (mL/min) 2044,23 (±419,00) 2167,62 (±485,47) +6,04 < 0,05
VO2peak (mL/min/kg) 18,47 (±3,97) 23,61 (±6,30) +27,83 < 0,001
Predicted VO2peak (%) 55,93 (±10,06) 64,50 (±12,80) +15,32 < 0,001
RQmax 0,97 (±0,07) 1,10 (±0,07) +13,40 < 0,001
Heart rate recovery one minute (bpm) 7,44 (±6,40) 10,40 (±4,68) +39,78 < 0,05
Heart rate recovery two minutes (bpm) 29,15 (±10,17) 35,65 (±9,39) +22,30 < 0,001
Heart rate recovery one minute (%) 4,6 (±3,89) 6,14 (±2,75) +33,48 < 0,05
Heart rate recovery two minutes (%) 18,03 (±5,86) 20,88 (±5,05) +15,81 < 0,05
Forced expiratory volume in one second (L) 3,46 (±0,59) 3,50 (±0,51) +1,16 < 0,05
Forced vital capacity (L) 4,36 (±0,77) 4,46 (±0,75) +2,29 < 0,05
Total lung capacity (L) 5,58 (2,04-8,31) 5,88 (±0,98) +6,14 < 0,05
Vital capacity (L) 4,27 (±0,73) 4,31 (±0,65) +0,94 < 0,05

46
In Table IVa, you can find a summary of the most important effects of the intervention. In
the appendix, you can find all the effects of the intervention (Table IVb).
2. Gender differences
In the appendix, you can find a general overview of the effects of the intervention on
different variables according to gender (Table V and Table VI).
In order to assess the differences between our male and female participants, an
independent t-test or Mann-Whitney U test, as needed, was performed on the variables of
“change.” The results of these tests are added to the appendix (Table VII).
Looking at the differences in change of anthropometry between boys and girls, there are
significant differences in change of body mass index (p < 0,05), total fat percentage (p <
0,05) and total fat mass (p < 0,05). There were no significant differences between boys
and girls in change of waist circumference (p = 0,566), waist-hip ratio (p = 0,889), total
lean mass (p = 0,111) and total bone mineral content (p = 0,074). The difference in change
of total mass was not significant between boys and girls (p = 0,052).
Regarding the results of the cardiopulmonary exercise test, statistical differences between
boys and girls were found for variables at ventilatory threshold as well as for variables at
maximum intensity. At ventilatory threshold, there were statistical differences for the
change of VO2 (p < 0,05) and weight adjusted VO2 (p < 0,05) between boys and girls.
There were no statistical differences in change of heart rate (p = 0,455) and change of RQ
(P = 0,545).
At maximum intensity, statistical differences between our boys and girls were found for
change of VO2peak (p < 0,05), change of weight adjusted VO2peak (p < 0,05) and change of
predicted VO2peak (p < 0,05). No statistical differences have been found for change of heart
ratemax between boys and girls (p = 0,675), change of predicted heart ratemax (p = 0,734)
and change of RQmax (p = 0,569).
C. Correlation analysis
1. Body Composition and exercise capacity
Correlation was assessed between change of variables of body composition and change
of variables of exercise capacity by using the Spearman and Pearson correlation tests, as
appropriate.
Correlations were found between the change of body mass index and the change of weight
adjusted VO2peak (p < 0,05), between the change of total mass and weight adjusted VO2peak
(p < 0,05), between change of total fat mass and change of weight adjusted VO2peak (p <
47
0,05), between change of total fat percentage and change of weight adjusted VO2peak (p <
0,05), between total lean percentage and change of weight adjusted VO2peak (p < 0,05). An
additional correlation was found between the change of total fat free mass and the change
of heart ratemax (p < 0,05).
No further correlations were found between the change in variables of body composition
and the change in variables of exercise capacity. In table VIII, you can find an overview of
all the correlations that have been assessed and their respective correlation coefficients.
2. Predictors of exercise capacity
A second correlation analysis was performed to assess if any of the variables of body
composition could be used as a predictor for exercise capacity at the end of the treatment
programme. In Table IX there is a summary of these correlation tests in which variables of
body composition pre-interventional were compared with the variables of exercise capacity
post-interventional.
Several variables of body composition, assessed before the treatment programme,
showed significant correlation with variables of exercise capacity, assessed post-
interventional. Total mass at baseline was correlated with the predicted heart ratemax
(p<0,05), weight adjusted VO2peak (p < 0,05) and predicted VO2peak (p < 0,05) post-
interventional but not with
(p = 0,483). Total lean body mass was
correlated with predicted heart ratemax and predicted VO2peak but not with weight adjusted
VO2peak (p = 0,060) or
(p = 0,839).
Total fat mass before the intervention showed correlation with predicted heart ratemax after
the intervention (p < 0,05), weight adjusted VO2peak (p < 0,05) and predicted VO2peak
(p<0,05) but not with
(p=0,851). No correlation was found between the
total bone mineral content from before the intervention and variables of exercise capacity
after the intervention as well as between the waist-hip ratio before the weight loss
treatment and our variables of exercise capacity post-interventional.
Other correlations were found between total fat percentage, assessed before the weight
loss treatment programme, and weight adjusted VO2peak (P < 0,05), between lean
percentage pre-interventional and weight adjusted VO2peak post-interventional (p < 0,05),
between total fat free mass measured before the intervention and predicted heart ratemax
(p < 0,05) and predicted VO2peak measured after the intervention (p < 0,05). The last
correlation was found between waist circumference and weight adjusted VO2peak (p < 0,05).
All the other correlations that were tested are visualised in table VIII.

48
3. Predictors of body composition
Correlation analysis between variables of exercise capacity, assessed before the
intervention, and variables of body composition, assessed after the weight loss treatment,
was performed in order to find predictors of body composition and are shown in Table X.
One correlation was found between predicted heart ratemax assessed before the
intervention and variables of body composition measured after the intervention. More in
detail, the predicted heart ratemax was correlated with the total fat mass (p < 0,05). More
correlations were found between predicted VO2peak and variables of body composition.
There was a correlation between predicted VO2peak and total body mass (p < 0,05), total
lean mass (p < 0,05), total fat mass (p < 0,001), waist circumference (p < 0,05) and waist-
hip ratio (p < 0,001).
Correlations were found between weight adjusted VO2peak measured before the
intervention and total body mass from after the weight loss treatment (p < 0,001), total fat
mass post-interventional (p < 0,001), total fat percentage post-interventional (p < 0,001),
total lean percentage post-interventional (p < 0,001) and waist circumference post-
interventional (p < 0,001). There were no correlations between
measured before the intervention and variables of body composition
measured after the weight loss programme.
4. Predictors of change in body composition
In Table XI, there is an overview of correlation analyses between change of body
composition and variables prior to treatment. As such, we found that fat loss (in kg) is not
correlated with total fat mass prior to the programme (r = -0,163, p = 0,316).

49
VI. Discussion
The aim of this study was to describe the effects of the residential, multidisciplinary
treatment programme of obese children and adolescents in the Zeepreventorium. The
treatment programme consisted of physical exercise, a dietary programme, psychological
support and education on health topics. In this study we specifically looked at the changes
in body composition (total mass, total fat mass, total lean mass, total fat free mass, total
bone mineral content, total bone mineral density, total fat percentage, total lean
percentage, waist circumference and waist-hip ratio) and exercise capacity (heart ratemax,
predicted heart ratemax, VO2peak, weight adjusted VO2peak, predicted VO2peak and RQmax).
A. Anthropometric measurements
Our obese population significantly decreased their body weight by 20,08 % (P < 0,001) or
23,88 kg in absolute values (20,63 kg FM and 3,25 kg FFM). It must be mentioned
however, that with increasing age, weight normally increases. Thus, the observed
significant decrease is probably an underestimation of the effect of the treatment
programme. The review by de Miguel-Etayo et al. (63), reported body composition
changes during interventions to treat obesity in a paediatric population. They found that
the highest decrease in fat percentage was parallel to an increase in FFM in
multidisciplinary treatment programmes. On the contrary, our data does not support this
finding and reports an decrease of FFM.
Also, a significant decrease in BMI (21,39 %, P < 0,001) after the ten-month treatment
programme, was observed. These findings are similar to the observations by Deforche et
al. (84) who reported an absolute mean weight loss of 23 kg and a decrease in BMI of 24
% in the same institution. Another study conducted in the Zeepreventorium in 2003, reports
a 24,49 % weight loss after ten months of treatment and a decrease in BMI of 26,71%.
These percentages are higher than our findings. This difference could be explained by the
study sample size, as Braet et al. (94) observed 110 obese individuals. However, mean
age and mean weight at admission could also influence these findings.
Additionally, we assessed if boys or girls have reacted different on the multidisciplinary,
inpatient weight loss treatment programme. Differences were assessed for several
variables of exercise capacity and body composition. The study by Knöpfli et al. (81) was
the first to conclude that loss of body weight (in kilograms) and percentage fat mass was
greater in boys than in girls. We support this finding, as we also found a significant
difference in loss of body weight (11,35 kg, P < 0,001) and percentage body fat (7,61%, P
< 0,001). As explained by Knöpfli et al. these gender differences may have serious
consequences in terms of the content and focus of multidisciplinary treatment programmes

50
for obese boys and girls. These findings, namely, suggest that the optimal treatment
programme differs according to gender. Furthermore, we cannot provide a closing
statement on these gender differences. First, it is possible that the boys in our population
may have been more compliant with basic daily activity than girls. This is supported by the
fact that in the general population, a more active daily activity pattern is observed in boys
than in girls of the same age, especially during adolescence. Second, the lower proportion
of loss of body weight and decrease in percentage body fat may be explained by the fact
that females have a lower basal metabolic rate than males.
An important finding in this study is that the fat loss (in kg) is not correlated with total fat
mass prior to the programme (r = -0,163, p = 0,316), suggesting that individuals with more
fat mass at baseline do not achieve significantly more fat loss. This finding is in contrast
with the findings of Trapp et al. (95). However, Trapp et al. researched this correlation in
45 normal weight, 20-year-old women. Nevertheless, this association is one that needs to
be studied more extensively, as it would indicate which individuals would benefit the most
of multidisciplinary interventional programmes.
Our study is relatively unique because we observe an interventional programme of ten
months. However, studies consisting of a multidisciplinary programme of 13 weeks also
report significant changes in body composition. Pienaar et al. (96) observed a study
population of 20 subjects with a mean age of 11 years (±0,99). Their findings state that
after 13 weeks BMI, body mass, fat percentage and waist circumference significantly
decrease as well. These findings are also supported by other studies observing 13-week
multidisciplinary training programmes. As such, we can conclude that the residential,
multidisciplinary intervention programme of the Zeepreventorium is successful in reducing
body composition variables in obese children and adolescents and in short, in reducing
obesity, the recommended primary outcome measure by Bryant et al. (97).
B. Physical exercise performance
We observed no significant improvements in physical exercise variables at rest. There was
a decrease of 5,58% in the resting heart rate post-treatment compared to resting heart
rate at baseline, which was not statistically significant.. This finding is in contrast with the
finding of Wong et al. (98) who report a significantly lower resting heart rate after a 12-
week training period. This contrast of findings could be explained by the difference in
training programme. We found no literature supporting or contrasting our finding that
VO2rest also shows a non-significant decrease.
VO2peak, whether in absolute values (VO2peak mL/min), relative to body weight (VO2peak
mL/min/kg) or relative to normal values adjusted for age, gender, weight and length

51
(predicted VO2peak %), has significantly increased in our study population. This contrasts
with the findings of Deforche et al. (84) who reported an increase in maximal performance
levels without an improvement in absolute VO2max. VO2max is an age-dependent
measurement of physical exercise, meaning that VO2max increases in children and
adolescents when they age. Also, a significant increase in VO2max relative to body weight
is to be expected, as body weight decreases significantly.
The study by Aguer et al. (99) contrasts the significant increase in absolute VO2max value,
however supports the finding that VO2max relative to body weight significantly increases
after 5 months of a multidisciplinary programme (moderate energy restriction, nutritional
education and regular physical activity). Aguer et al., however, estimated VO2max using the
established heart rate – VO2 relationship. This relationship has been studied and
developed by Uth et al. (100) in 2004. Uth et al., however, concluded that the HRmax-to-
HRrest ratio or Heart Rate Ratio Method may provide an estimation of VO2max in well-trained
men. The applicability of the Heart Rate Ratio Method in relation to an obese paediatric
population has not yet been studied. In our study VO2peak was used instead of VO2max, as
in obese paediatric populations the VO2max plateau is rarely attained. The significant
increase in VO2max when expressed per kilogram of body weight can be mainly the result
of body weight loss. VO2max should therefore be expressed per kilogram of fat-free mass
to suggest a training effect. Also, training effects can be suggested by evaluating HRmax.
The study conducted by Drinkard et al. (101) suggests that OUES impedes its clinical utility
for assessing the fitness level of severely overweight adolescents. This finding is
supported by the fact that we have found no significant difference in OUES after 10 months
treatment. On the one hand this could be explained by the wide interindividual variation,
magnitude bias and exercise intensity dependence mentioned by Drinkard et al. However,
it is also possible that our study sample size is too confined to support or contrast this
hypothesis. The use of the OUES as an ‘effort-independent’ measure of CPET in an obese
paediatric population and as such, as an alternative for VO2peak, has been a topic of
controversy and must be researched more extensively.
Whether the oxygen uptake efficiency slope is a valid and adequate indicator of
cardiorespiratory fitness in an obese paediatric population and whether it reflects exercise-
induced changes in VO2peak in obese children, has been a topic of controversy. Drinkard
et al. (101) investigated the value of the oxygen uptake efficiency slope in 170 severely
overweight (BMI z-score 2,50 ± 0,34) and 43 non-overweight (BMI z-score 0,13 ± 0,84)
adolescents. They concluded that oxygen uptake efficiency slope differs significantly in
overweight and non-overweight adolescents and as such, its use should be precluded in

52
clinical practice. These findings, however, are contrasted by Dias et al. (102), who
investigated the use of the oxygen uptake efficiency slope in 63 obese children (BMI > 95th
percentile for age and sex), and Breithaupt et al. (103). The last study observed a sample
of 56 obese children aged seven – eighteen years.
Findings in the study by Karner-Rezek et al. (88) state that anaerobic fitness of obese
adolescents (mean age for girls 15,1 ± 1,5 and 13,8 ± 1,8 for boys) prior to the intervention
programme is not related to loss of body mass. After correlating
pre
with total mass (in kg) post, fat mass (in kg) post and lean mass (in kg) post, we found no
significant correlations, therefore, supporting this finding.
C. Heart rate recovery (HRR)
The study by Wilks et al. (78) observed the changes in heart rate recovery (HRR) after an
inpatient lifestyle-change programme of four to six weeks. HRR was calculated as the
difference between the highest exercising HR and HR at one, three and five minutes post-
exercise. We used the same method to calculate HRR, but collected data at one, two, four
and six minutes post-exercise. Compared with baseline, at follow-up the decline in HR was
more pronounced in the study by Wilks et al. (+32%, +18% and +11% for HRR1, HRR3
and HRR5; p < 0,001). We found similar data supporting these findings (+40%, +22%, +
28% and + 26% for HRR1, HRR2, HRR4 and HRR6; p < 0,05 for HRR1, p < 0,001 for
HRR2, HRR4 and HRR6). Furthermore, since heart rate recovery considerably improved,
however, was not correlated with improvements in body weight and cardio-metabolic risk
(waist circumference), we support the conclusion of Wilks et al.: HRR would be a valuable
addition to cardiovascular risk assessment in our study population.
D. Strengths and limitations
We would like to elucidate a couple of strengths of this study. First, we have collected a
vast amount of body composition and physical exercise variables, at baseline and after 10
months of treatment. Therefore, we were able to evaluate possible unknown correlations
and associations. Second, our data is coming from a homogenous study population,
collected at the correct time intervals with little individual variation. The programme is
tailored to the obese adolescents, however, the duration of endurance training or core
stability exercises is fixed. Therefore, interindividual differences are negligible and our data
is reliable. The strength of the interventional programme at the Zeepreventorium lies in the
fact that participants are individually accompanied by a multidisciplinary team.
Furthermore, we recognise several limitations in this study. First, this study misses the
additional value of metabolic markers (e.g. lipids, glucose, insulin, leptin, adipocytokines)
53
and more accurate measurement and follow-up of blood pressure. For instance, we could
be able to make a statement about the effect of changes in body composition variables on
blood pressure. Also, comorbidities (e.g. hypertension, NAFLD, OSAS) could have been
assessed at baseline and after treatment. Second, this study represents only the short-
term effects of the multidisciplinary treatment programme. More information could be
gained if patients were to be followed-up after the treatment programme. Third, one of the
main risk factors for developing childhood obesity is parental overweight. However, we do
not have the data to support or contrast this finding. Finally, our study population
encompassed 55 participants (37 girls and 18 boys) at baseline and 41 participants (29
girls and 12 boys) after 10 months of treatment, a drop-out rate of 25,45%. Because of this
relatively small sample size, this clinical observational study should be considered a
preliminary study which hopefully can contribute to provide useful clinical data to
substantiate paediatric obesity guidelines. Also, it is possible that our study sample size is
incompetent to evaluate OUES in the obese paediatric population. Therefore, studies with
larger sample sizes are necessary.
E. Suggestions for further research
In current literature a lot of topics are discussed separately. We think that a review of all
existing literature followed by a study that can investigate all these topics in one study
population could be a turning point in developing paediatric obesity guidelines. As Flegal
et al. (4) pointed out, it might be useful to consider what BMI cut-offs best predict future
health risks and how to efficiently screen for such risks, rather than trying to define obesity
and overweight by statistical measurements.
Further research must be conducted to investigate the value of the use of HRR in obese
populations as an impaired HRR is a strong predictor of overall mortality and
cardiometabolic risk. Also, since the greatest challenge of obesity interventions is to
maintain body composition and physical exercise changes, more studies should be
conducted to elucidate the long-term effects of obesity intervention programmes.
Furthermore, age-dependent measurements, resulting in an over- or underestimation of
findings, can be avoided when including a control group in the treatment programme.

54
VII. References
1. International Obesity Taskforce. About obesity 2015 [updated 10th October 2015; cited 2017 28 Aug]. 2. Daniels SR. The use of BMI in the clinical setting. Pediatrics. 2009;124 Suppl 1:S35-41. 3. Organization WH. What is overweight and obesity? 2017 [cited 2017 5 Nov]. Available from: http://www.who.int/dietphysicalactivity/childhood_what/en/. 4. Flegal KM, Ogden CL. Childhood obesity: are we all speaking the same language? Advances in nutrition. 2011;2(2):159S-66S. 5. Ahrens W, Pigeot I, Pohlabeln H, De Henauw S, Lissner L, Molnar D, et al. Prevalence of overweight and obesity in European children below the age of 10. International journal of obesity. 2014;38 Suppl 2:S99-107. 6. World Health Organization. Obesity - Data and statistics 2017 [cited 2017 28 Aug]. Available from: http://www.euro.who.int/en/health-topics/noncommunicable-diseases/obesity/data-and-statistics. 7. World Health Organization. Monitoring and Surveillance: Overweight and Obesity in three age groups 2013 [cited 2017 28 Aug]. Available from: http://www.euro.who.int/en/nutrition-country-profiles. 8. Haslam D, Sattar N, Lean M. ABC of obesity. Obesity--time to wake up. Bmj. 2006;333(7569):640-2. 9. Beynon C, Fone D. Risk factors for childhood obesity: a data analysis of the Welsh Health Survey. Nursing children and young people. 2017;29(6):38-44. 10. Daniels SR. The consequences of childhood overweight and obesity. The Future of children. 2006;16(1):47-67. 11. Malecka-Tendera E, Mazur A. Childhood obesity: a pandemic of the twenty-first century. International journal of obesity. 2006;30 Suppl 2:S1-3. 12. Vanhala M, Korpelainen R, Tapanainen P, Kaikkonen K, Kaikkonen H, Saukkonen T, et al. Lifestyle risk factors for obesity in 7-year-old children. Obesity research & clinical practice. 2009;3(2):I-II. 13. Khan SA, Muhammad N, Khan MA, Kamal A, Rehman ZU, Khan S. Genetics of human Bardet-Biedl syndrome, an updates. Clinical genetics. 2016;90(1):3-15. 14. Bertapelli F, Pitetti K, Agiovlasitis S, Guerra-Junior G. Overweight and obesity in children and adolescents with Down syndrome-prevalence, determinants, consequences, and interventions: A literature review. Research in developmental disabilities. 2016;57:181-92. 15. Goldstone AP, Beales PL. Genetic obesity syndromes. Frontiers of hormone research. 2008;36:37-60. 16. Lindkvist M, Ivarsson A, Silfverdal SA, Eurenius E. Associations between toddlers' and parents' BMI, in relation to family sociod-emography: a cross-sectional study. BMC public health. 2015;15. 17. Bammann K, Peplies J, De Henauw S, Hunsberger M, Molnar D, Moreno LA, et al. Early life course risk factors for childhood obesity: the IDEFICS case-control study. PloS one. 2014;9(2):e86914. 18. Higgins V, Dale A. Ethnicity and childhood overweight/obesity in England. Pediatric obesity. 2012;7(3):e22-6. 19. Zilanawala A, Davis-Kean P, Nazroo J, Sacker A, Simonton S, Kelly Y. Race/ethnic disparities in early childhood BMI, obesity and overweight in the United Kingdom and United States. International journal of obesity. 2015;39(3):520-9. 20. Slavin J. Beverages and body weight: challenges in the evidence-based review process of the Carbohydrate Subcommittee from the 2010 Dietary Guidelines Advisory Committee. Nutrition reviews. 2012;70 Suppl 2:S111-20.

55
21. Lumeng JC, Appugliese D, Cabral HJ, Bradley RH, Zuckerman B. Neighborhood safety and overweight status in children. Archives of pediatrics & adolescent medicine. 2006;160(1):25-31. 22. Kaur H, Choi WS, Mayo MS, Harris KJ. Duration of television watching is associated with increased body mass index. The Journal of pediatrics. 2003;143(4):506-11. 23. Vissers D, Devoogdt N, Gebruers N, Mertens I, Truijen S, Van Gaal L. Overweight in adolescents: differences per type of education. Does one size fit all? Journal of nutrition education and behavior. 2008;40(2):65-71. 24. Parrino C, Vinciguerra F, La Spina N, Romeo L, Tumminia A, Baratta R, et al. Influence of early-life and parental factors on childhood overweight and obesity. Journal of endocrinological investigation. 2016;39(11):1315-21. 25. Lazzeri G, Giacchi MV, Spinelli A, Pammolli A, Dalmasso P, Nardone P, et al. Overweight among students aged 11-15 years and its relationship with breakfast, area of residence and parents' education: results from the Italian HBSC 2010 cross-sectional study. Nutrition journal. 2014;13:69. 26. Nguyen NT, Magno CP, Lane KT, Hinojosa MW, Lane JS. Association of Hypertension, Diabetes, Dyslipidemia, and Metabolic Syndrome with Obesity: Findings from the National Health and Nutrition Examination Survey, 1999 to 2004. Journal of the American College of Surgeons. 2008;207(6):928-34. 27. Garvey WT, Mechanick JI, Brett EM, Garber AJ, Hurley DL, Jastreboff AM, et al. AMERICAN ASSOCIATION OF CLINICAL ENDOCRINOLOGISTS AND AMERICAN COLLEGE OF ENDOCRINOLOGY COMPREHENSIVE CLINICAL PRACTICE GUIDELINES FOR MEDICAL CARE OF PATIENTS WITH OBESITYEXECUTIVE SUMMARYComplete Guidelines available at https://www.aace.com/publications/guidelines. Endocrine practice : official journal of the American College of Endocrinology and the American Association of Clinical Endocrinologists. 2016;22(7):842-84. 28. Parameswaran K, Todd DC, Soth M. Altered respiratory physiology in obesity. Canadian respiratory journal. 2006;13(4):203-10. 29. Garrett K, Lauer K, Christopher BA. The Effects of Obesity on the Cardiopulmonary System: Implications for Critical Care Nursing 2007 [cited 2017 6 Aug]. Available from: http://www.medscape.com/viewarticle/495041_6. 30. Ohlsson C, Bygdell M, Sonden A, Jern C, Rosengren A, Kindblom JM. BMI increase through puberty and adolescence is associated with risk of adult stroke. Neurology. 2017;89(4):363-9. 31. Trivedi S, Burton A, Oden J. Management of pediatric obesity: a lifestyle modification approach. Indian journal of pediatrics. 2014;81(2):152-7. 32. Hvidt KN. Blood pressure and arterial stiffness in obese children and adolescents. Danish medical journal. 2015;62(3). 33. Mangner N, Scheuermann K, Winzer E, Wagner I, Hoellriegel R, Sandri M, et al. Childhood obesity: impact on cardiac geometry and function. JACC Cardiovascular imaging. 2014;7(12):1198-205. 34. Grundy SM. Obesity, metabolic syndrome, and coronary atherosclerosis. Circulation. 2002;105(23):2696-8. 35. Lovren F, Teoh H, Verma S. Obesity and atherosclerosis: mechanistic insights. The Canadian journal of cardiology. 2015;31(2):177-83. 36. Steele RM, Brage S, Corder K, Wareham NJ, Ekelund U. Physical activity, cardiorespiratory fitness, and the metabolic syndrome in youth. Journal of applied physiology. 2008;105(1):342-51. 37. Singla P, Bardoloi A, Parkash AA. Metabolic effects of obesity: A review. World journal of diabetes. 2010;1(3):76-88. 38. Cook S, Kavey RE. Dyslipidemia and pediatric obesity. Pediatric clinics of North America. 2011;58(6):1363-73, ix.

56
39. Pulgaron ER, Delamater AM. Obesity and type 2 diabetes in children: epidemiology and treatment. Current diabetes reports. 2014;14(8):508. 40. Arena R, Cahalin LP. Evaluation of cardiorespiratory fitness and respiratory muscle function in the obese population. Progress in cardiovascular diseases. 2014;56(4):457-64. 41. Littleton SW. Impact of obesity on respiratory function. Respirology. 2012;17(1):43-9. 42. Robinson PD. Obesity and its impact on the respiratory system. Paediatric respiratory reviews. 2014;15(3):219-26. 43. Mallory GB, Jr., Fiser DH, Jackson R. Sleep-associated breathing disorders in morbidly obese children and adolescents. The Journal of pediatrics. 1989;115(6):892-7. 44. El-Serag H. The association between obesity and GERD: a review of the epidemiological evidence. Digestive diseases and sciences. 2008;53(9):2307-12. 45. Han JC, Lawlor DA, Kimm SYS. Childhood obesity. Lancet. 2010;375(9727):1737-48. 46. Montgomery CO, Young KL, Austen M, Jo CH, Blasier RD, Ilyas M. Increased Risk of Blount Disease in Obese Children and Adolescents With Vitamin D Deficiency. J Pediatr Orthoped. 2010;30(8):879-82. 47. Zametkin AJ, Zoon CK, Klein HW, Munson S. Psychiatric aspects of child and adolescent obesity: a review of the past 10 years. Journal of the American Academy of Child and Adolescent Psychiatry. 2004;43(2):134-50. 48. de Beer M, Hofsteenge GH, Koot HM, Hirasing RA, Delemarre-van de Waal HA, Gemke RJ. Health-related-quality-of-life in obese adolescents is decreased and inversely related to BMI. Acta paediatrica. 2007;96(5):710-4. 49. Bibiloni Mdel M, Pons A, Tur JA. Prevalence of overweight and obesity in adolescents: a systematic review. ISRN obesity. 2013;2013:392747. 50. Rothman KJ. BMI-related errors in the measurement of obesity. International journal of obesity. 2008;32 Suppl 3:S56-9. 51. Rudolf MC, Walker J, Cole TJ. What is the best way to measure waist circumference? International journal of pediatric obesity : IJPO : an official journal of the International Association for the Study of Obesity. 2007;2(1):58-61. 52. Janssen I, Katzmarzyk PT, Ross R. Body mass index, waist circumference, and health risk: evidence in support of current National Institutes of Health guidelines. Archives of internal medicine. 2002;162(18):2074-9. 53. Styne DM, Arslanian SA, Connor EL, Farooqi IS, Murad MH, Silverstein JH, et al. Pediatric Obesity-Assessment, Treatment, and Prevention: An Endocrine Society Clinical Practice Guideline. The Journal of clinical endocrinology and metabolism. 2017;102(3):709-57. 54. National High Blood Pressure Education Program Working Group on High Blood Pressure in C, Adolescents. The fourth report on the diagnosis, evaluation, and treatment of high blood pressure in children and adolescents. Pediatrics. 2004;114(2 Suppl 4th Report):555-76. 55. Kist-van Holthe JE, Van Mil EGAH, Van Den Akker ELT, Dapper T, Groothoff JW, Moret M, et al. Richtlijn Basisdiagnostiek cardiovasculair risico bij kinderen met obesitas en behandeling van hypertensie. Nederlandse Vereniging voor Kindergeneeskunde, 2016. 56. Expert Panel on Integrated Guidelines for Cardiovascular H, Risk Reduction in C, Adolescents, National Heart L, Blood I. Expert panel on integrated guidelines for cardiovascular health and risk reduction in children and adolescents: summary report. Pediatrics. 2011;128 Suppl 5:S213-56. 57. Schwimmer JB, Dunn W, Norman GJ, Pardee PE, Middleton MS, Kerkar N, et al. SAFETY study: alanine aminotransferase cutoff values are set too high for reliable detection of pediatric chronic liver disease. Gastroenterology. 2010;138(4):1357-64, 64 e1-2. 58. Yildiz BO. Diagnosis of hyperandrogenism: clinical criteria. Best practice & research Clinical endocrinology & metabolism. 2006;20(2):167-76. 59. Roe AH, Dokras A. The diagnosis of polycystic ovary syndrome in adolescents. Reviews in obstetrics & gynecology. 2011;4(2):45-51.

57
60. Legro RS, Arslanian SA, Ehrmann DA, Hoeger KM, Murad MH, Pasquali R, et al. Diagnosis and treatment of polycystic ovary syndrome: an Endocrine Society clinical practice guideline. The Journal of clinical endocrinology and metabolism. 2013;98(12):4565-92. 61. Chang SJ, Chae KY. Obstructive sleep apnea syndrome in children: Epidemiology, pathophysiology, diagnosis and sequelae. Korean journal of pediatrics. 2010;53(10):863-71. 62. Wise MS, Nichols CD, Grigg-Damberger MM, Marcus CL, Witmans MB, Kirk VG, et al. Executive summary of respiratory indications for polysomnography in children: an evidence-based review. Sleep. 2011;34(3):389-98AW. 63. de Miguel-Etayo P, Moreno LA, Iglesia I, Bel-Serrat S, Mouratidou T, Garagorri JM. Body composition changes during interventions to treat overweight and obesity in children and adolescents; a descriptive review. Nutricion hospitalaria. 2013;28(1):52-62. 64. Morton KL, Atkin AJ, Corder K, Suhrcke M, van Sluijs EM. The school environment and adolescent physical activity and sedentary behaviour: a mixed-studies systematic review. Obesity reviews : an official journal of the International Association for the Study of Obesity. 2016;17(2):142-58. 65. Dietz WH, Gortmaker SL. Preventing obesity in children and adolescents. Annual review of public health. 2001;22:337-53. 66. Hernandez Alvarez ED, Valero Bernal MV, Mancera Soto EM. Efficacy of the prescription of physical activity in the obese child population. Revista de Salud Pública. 2015;17(1):120-31. 67. Harrison K, Bost KK, McBride BA, Donovan SM, Grigsby-Toussaint DS, Kim J, et al. Toward a Developmental Conceptualization of Contributors to Overweight and Obesity in Childhood: The Six-Cs Model. Child Development Perspectives. 2011;5(1):50-8. 68. Fiese BH, Bost KK, McBride BA, Donovan SM. Childhood obesity prevention from cell to society. Trends in endocrinology and metabolism: TEM. 2013;24(8):375-7. 69. Hamer M, O'Donovan G. Cardiorespiratory fitness and metabolic risk factors in obesity. Current opinion in lipidology. 2010;21(1):1-7. 70. Reinehr T, de Sousa G, Toschke AM, Andler W. Long-term follow-up of cardiovascular disease risk factors in children after an obesity intervention. The American journal of clinical nutrition. 2006;84(3):490-6. 71. Schmidt MD, Magnussen CG, Rees E, Dwyer T, Venn AJ. Childhood fitness reduces the long-term cardiometabolic risks associated with childhood obesity. International journal of obesity. 2016;40(7):1134-40. 72. Goldfield GS, Kenny GP, Alberga AS, Prud'homme D, Hadjiyannakis S, Gougeon R, et al. Effects of aerobic training, resistance training, or both on psychological health in adolescents with obesity: The HEARTY randomized controlled trial. Journal of consulting and clinical psychology. 2015;83(6):1123-35. 73. Lopera CA, da Silva DF, Bianchini JA, Locateli JC, Moreira AC, Dada RP, et al. Effect of water- versus land-based exercise training as a component of a multidisciplinary intervention program for overweight and obese adolescents. Physiology & behavior. 2016;165:365-73. 74. Hofmann B. Bariatric surgery for obese children and adolescents: a review of the moral challenges. BMC medical ethics. 2013;14:18. 75. Kelly AS, Ryder JR, Marlatt KL, Rudser KD, Jenkins T, Inge TH. Changes in inflammation, oxidative stress and adipokines following bariatric surgery among adolescents with severe obesity. International journal of obesity. 2016;40(2):275-80. 76. Bongers BC, Hulzebos EH, Van Brussel M, Takken T. Pediatric Norms for Cardiopulmonary Exercise Testing In Relation to Gender and Age: Uitgeverij BoxPress; 2012. 129 p. 77. Morise AP. Heart rate recovery: predictor of risk today and target of therapy tomorrow? Circulation. 2004;110(18):2778-80.

58
78. Wilks DC, Rank M, Christle J, Langhof H, Siegrist M, Halle M. An inpatient lifestyle-change programme improves heart rate recovery in overweight and obese children and adolescents (LOGIC Trial). European journal of preventive cardiology. 2014;21(7):876-83. 79. Cole CR, Foody JM, Blackstone EH, Lauer MS. Heart rate recovery after submaximal exercise testing as a predictor of mortality in a cardiovascularly healthy cohort. Annals of internal medicine. 2000;132(7):552-5. 80. Preisser AM, Velasco Garrido M, Bittner C, Hampel E, Harth V. Gradual versus continuous increase of load in ergometric tests: are the results comparable? Advances in experimental medicine and biology. 2015;840:51-8. 81. Knopfli BH, Radtke T, Lehmann M, Schatzle B, Eisenblatter J, Gachnang A, et al. Effects of a multidisciplinary inpatient intervention on body composition, aerobic fitness, and quality of life in severely obese girls and boys. The Journal of adolescent health : official publication of the Society for Adolescent Medicine. 2008;42(2):119-27. 82. Vengata Subramanai M, Ganesh Sundaram S, Wan Rosley W. Effect of physical activity on respiratory function in obese: a systematic review. International journal of Physiotherapy and Research. 2014;2(1):342-46. 83. Azad A, Gharakhanlou R, Niknam A, Ghanbari A. Effects of aerobic exercise on lung function in overweight and obese students. Tanaffos. 2011;10(3):24-31. 84. Deforche B, De Bourdeaudhuij I, Debode P, Vinaimont F, Hills AP, Verstraete S, et al. Changes in fat mass, fat-free mass and aerobic fitness in severely obese children and adolescents following a residential treatment programme. European journal of pediatrics. 2003;162(9):616-22. 85. Carvalho HM, Milano GE, Lopes WA, Figueiredo AJ, Radominski RB, Leite N. Peak oxygen uptake responses to training in obese adolescents: a multilevel allometric framework to partition the influence of body size and maturity status. BioMed research international. 2013;2013:618595. 86. Vos RC, Wit JM, Pijl H, Houdijk EC. Long-term effect of lifestyle intervention on adiposity, metabolic parameters, inflammation and physical fitness in obese children: a randomized controlled trial. Nutrition & diabetes. 2011;1:e9. 87. Chang P, Friedenberg F. Obesity and GERD. Gastroenterology clinics of North America. 2014;43(1):161-+. 88. Karner-Rezek K, Knechtle B, Fenzl M, Schlegel C, Konrad M, Rosemann T. The effects of an 8-week multicomponent inpatient treatment program on body composition and anaerobic fitness in overweight and obese children and adolescents. International journal of general medicine. 2013;6:159-66. 89. gezondheidsraad H. Voedingsaanbevelingen voor België - 2016. Advies nr. 9285. Brussel2016. 90. Leven VIG. Aanbevelingen voor voeding: jongeren 2014 [cited 2017 23th July]. Available from: http://www.vigez.be/themas/voeding-en-beweging/aanbevelingen/aanbevelingen-voor-voeding/jongeren 91. Roelants M, Hauspie R, Hoppenbrouwers K. References for growth and pubertal development from birth to 21 years in Flanders, Belgium. Annals of human biology. 2009;36(6):680-94. 92. Fan B, Shepherd JA, Levine MA, Steinberg D, Wacker W, Barden HS, et al. National Health and Nutrition Examination Survey whole-body dual-energy X-ray absorptiometry reference data for GE Lunar systems. Journal of clinical densitometry : the official journal of the International Society for Clinical Densitometry. 2014;17(3):344-77. 93. Wasserman K, Hansen JE, Sue DY, Whipp BJ, Casaburi R. Principles of Exercise Testing and Interpretation. Second ed: Lea & Febiger; 1994. 479 p.
59
94. Braet C, Tanghe A, Decaluwe V, Moens E, Rosseel Y. Inpatient treatment for children with obesity: weight loss, psychological well-being, and eating behavior. Journal of pediatric psychology. 2004;29(7):519-29. 95. Trapp EG, Chisholm DJ, Freund J, Boutcher SH. The effects of high-intensity intermittent exercise training on fat loss and fasting insulin levels of young women. International journal of obesity. 2008;32(4):684-91. 96. Pienaar A, Du Toit D, Truter L. The effect of a multidisciplinary physical activity intervention on the body composition and physical fitness of obese children. The Journal of sports medicine and physical fitness. 2013;53(4):415-27. 97. Bryant M, Ashton L, Nixon J, Jebb S, Wright J, Roberts K, et al. Framework of outcome measures recommended for use in the evaluation of childhood obesity treatment interventions: the CoOR framework. Pediatric obesity. 2014;9(6):e116-31. 98. Wong PC, Chia MY, Tsou IY, Wansaicheong GK, Tan B, Wang JC, et al. Effects of a 12-week exercise training programme on aerobic fitness, body composition, blood lipids and C-reactive protein in adolescents with obesity. Annals of the Academy of Medicine, Singapore. 2008;37(4):286-93. 99. Aguer C, Gavarry O, Gole Y, Boussuges A, Doyard P, Falgairette G. A 5-month weight-reduction programme has a positive effect on body composition, aerobic fitness, and habitual physical activity of severely obese girls: a pilot evaluation study. Journal of sports sciences. 2010;28(3):281-9. 100. Uth N, Sorensen H, Overgaard K, Pedersen PK. Estimation of VO2max from the ratio between HRmax and HRrest--the Heart Rate Ratio Method. European journal of applied physiology. 2004;91(1):111-5. 101. Drinkard B, Roberts MD, Ranzenhofer LM, Han JC, Yanoff LB, Merke DP, et al. Oxygen-uptake efficiency slope as a determinant of fitness in overweight adolescents. Medicine and science in sports and exercise. 2007;39(10):1811-6. 102. Dias KA, Masterson CE, Wallen MP, Ingul CB, Davies P, Leong GM, et al. The Oxygen Uptake Efficiency Slope Reflects Exercise-training Induced Changes In VO2max In Obese Children: 3676 Board# 115 June 4, 8: 00 AM-9: 30 AM. Medicine and science in sports and exercise. 2016;48(5 Suppl 1):1024. 103. Breithaupt PG, Colley RC, Adamo KB. Using the oxygen uptake efficiency slope as an indicator of cardiorespiratory fitness in the obese pediatric population. Pediatric exercise science. 2012;24(3):357.


VIII. Appendix
A. Introduction
Figure I: Harrison K, Bost KK, McBride BA, Donovan SM, Grigsby-Toussaint DS, Kim J, et al.
Toward a Developmental Conceptualization of Contributors to Overweight and Obesity in
Childhood: The Six-Cs Model. Child Development Perspectives. 2011;5(1):50-8.
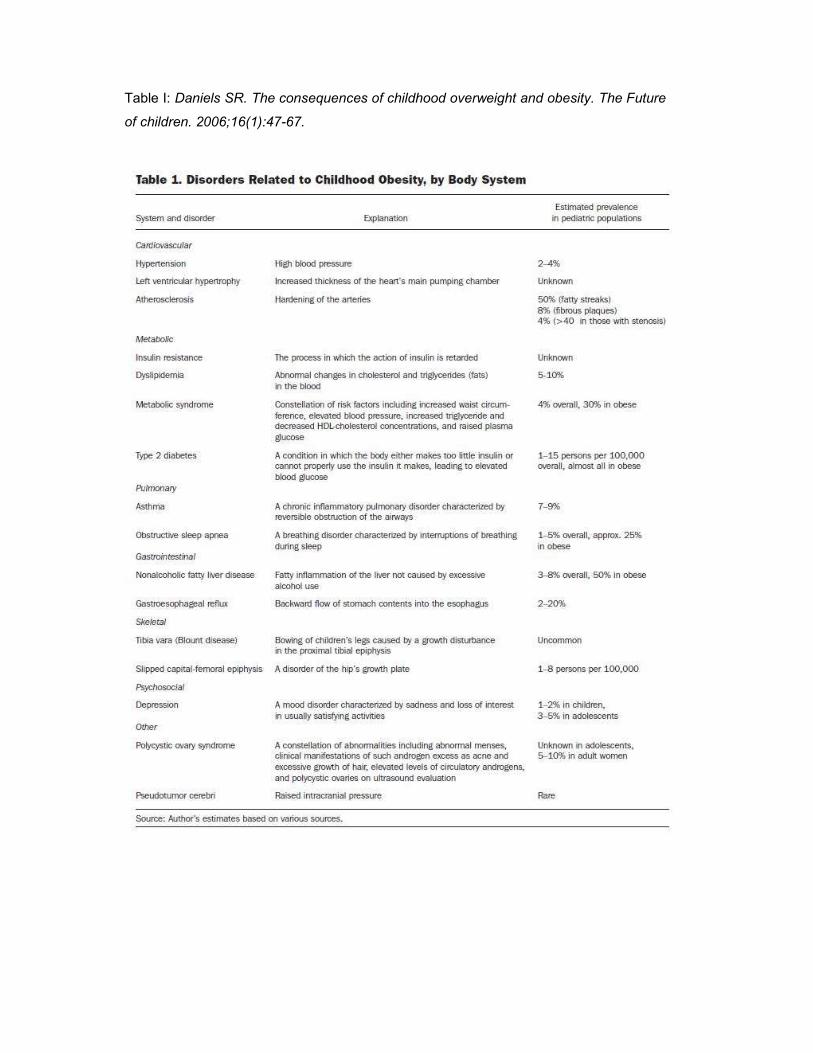
Table I: Daniels SR. The consequences of childhood overweight and obesity. The Future
of children. 2006;16(1):47-67.

B. Methods
Addendum I: Food programme of the Zeepreventorium
Day schedule
Breakfast
Source of carbohydrates: Choice between o Whole grain bread or multigrain bread o Cereals (Wednesday) o Bread rolls
Minarine Spread: Choice between
o Low-fat cheese o Low-fat charcuterie o Sweet spread (Monday and Tuesday) like hazelnut spread
Drink o Skimmed milk o Coffee and/or tea (without sugar)
Snack
Choice between:
Fruit: minimum one piece every day Skimmed milk product: maximum one every day Product of choice: one time every week and one time every weekend
Lunch
Soup: Vegetable soup prepared without butter, oil, pasta, potatoes, rice or meat Vegetables: Choice between
o Boiled or steamed vegetables o Crudités + one ladle light salad dressing
Source of carbohydrates: boiled potatoes, rice, pasta, … Meat/ fish/ eggs /meat analogue: Choice between
o One portion meat, fish or meat analogue plus one ladle low-fat meat sauce o Two eggs
Drink: water
Snack
Choice between:
Fruit: minimum one piece every day Skimmed milk product: maximum one every day Product of choice: one time every week and one time every weekend
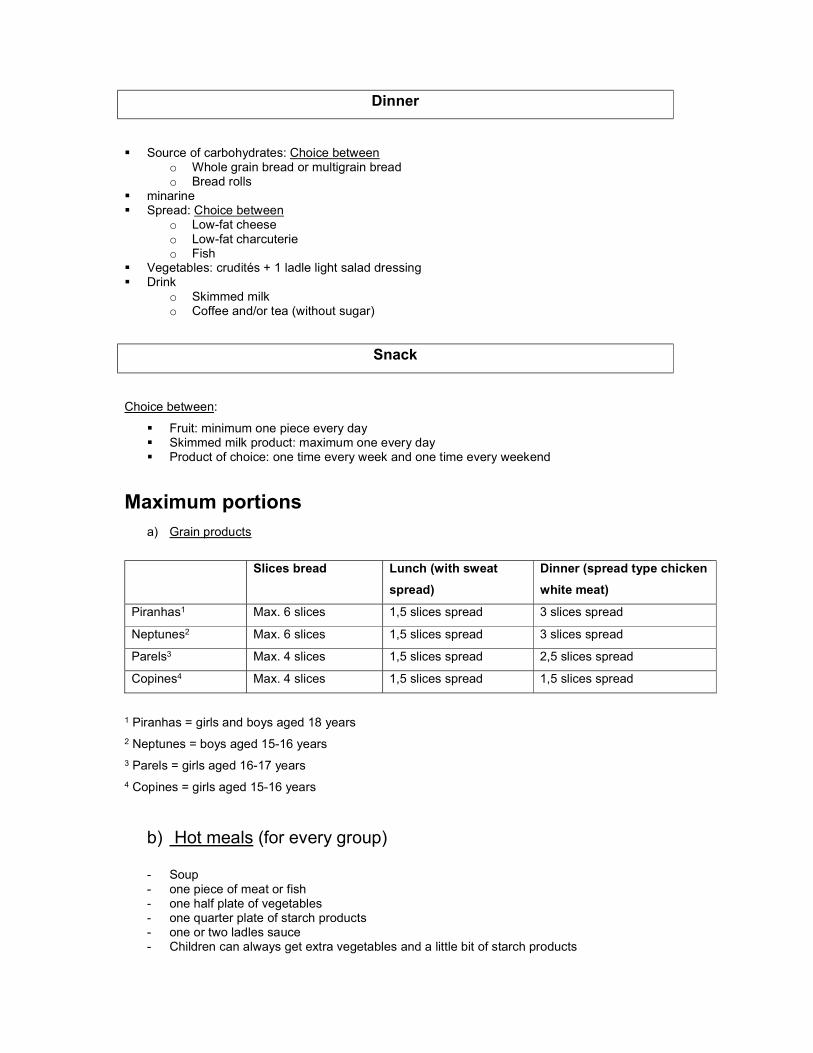
Dinner
Source of carbohydrates: Choice between o Whole grain bread or multigrain bread o Bread rolls
minarine Spread: Choice between
o Low-fat cheese o Low-fat charcuterie o Fish
Vegetables: crudités + 1 ladle light salad dressing Drink
o Skimmed milk o Coffee and/or tea (without sugar)
Snack
Choice between:
Fruit: minimum one piece every day Skimmed milk product: maximum one every day Product of choice: one time every week and one time every weekend
Maximum portions a) Grain products
Slices bread Lunch (with sweat
spread)
Dinner (spread type chicken
white meat)
Piranhas1 Max. 6 slices 1,5 slices spread 3 slices spread
Neptunes2 Max. 6 slices 1,5 slices spread 3 slices spread
Parels3 Max. 4 slices 1,5 slices spread 2,5 slices spread
Copines4 Max. 4 slices 1,5 slices spread 1,5 slices spread
1 Piranhas = girls and boys aged 18 years
2 Neptunes = boys aged 15-16 years
3 Parels = girls aged 16-17 years
4 Copines = girls aged 15-16 years
b) Hot meals (for every group)
- Soup - one piece of meat or fish - one half plate of vegetables - one quarter plate of starch products - one or two ladles sauce - Children can always get extra vegetables and a little bit of starch products
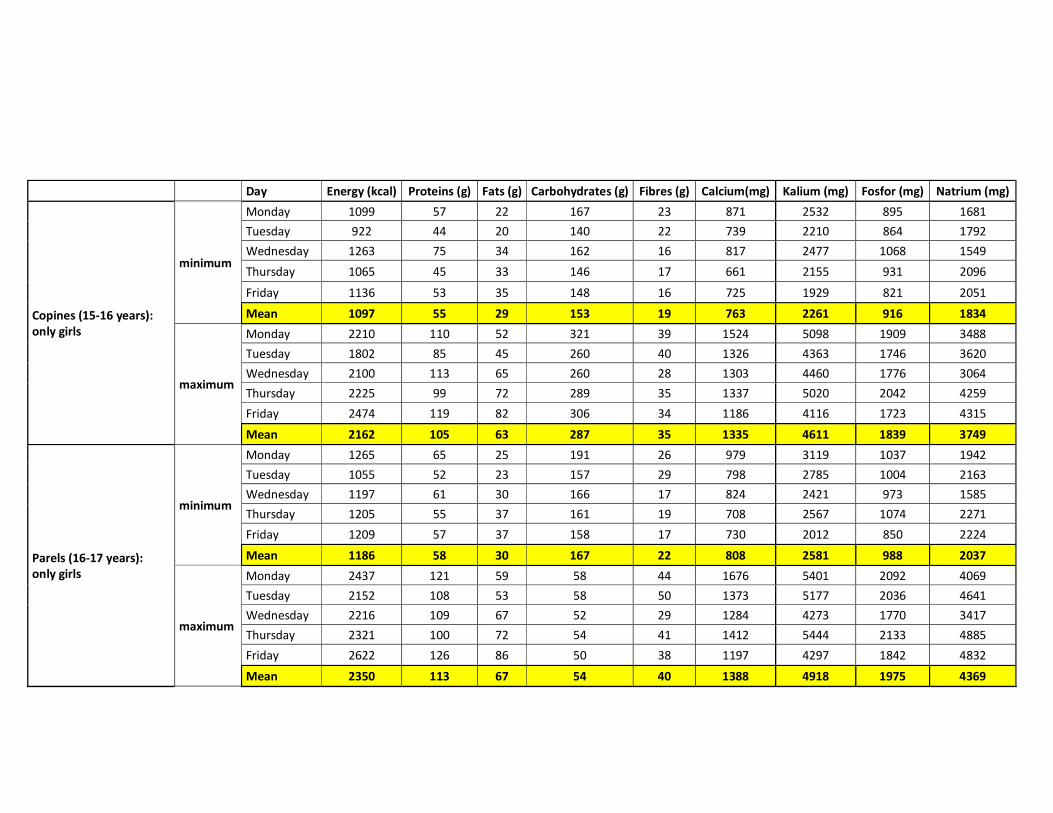
Day Energy (kcal) Proteins (g) Fats (g) Carbohydrates (g) Fibres (g) Calcium(mg) Kalium (mg) Fosfor (mg) Natrium (mg)
Copines (15-16 years): only girls
minimum
Monday 1099 57 22 167 23 871 2532 895 1681 Tuesday 922 44 20 140 22 739 2210 864 1792 Wednesday 1263 75 34 162 16 817 2477 1068 1549
Thursday 1065 45 33 146 17 661 2155 931 2096
Friday 1136 53 35 148 16 725 1929 821 2051
Mean 1097 55 29 153 19 763 2261 916 1834
maximum
Monday 2210 110 52 321 39 1524 5098 1909 3488 Tuesday 1802 85 45 260 40 1326 4363 1746 3620 Wednesday 2100 113 65 260 28 1303 4460 1776 3064 Thursday 2225 99 72 289 35 1337 5020 2042 4259
Friday 2474 119 82 306 34 1186 4116 1723 4315
Mean 2162 105 63 287 35 1335 4611 1839 3749
Parels (16-17 years): only girls
minimum
Monday 1265 65 25 191 26 979 3119 1037 1942 Tuesday 1055 52 23 157 29 798 2785 1004 2163 Wednesday 1197 61 30 166 17 824 2421 973 1585 Thursday 1205 55 37 161 19 708 2567 1074 2271
Friday 1209 57 37 158 17 730 2012 850 2224
Mean 1186 58 30 167 22 808 2581 988 2037
maximum
Monday 2437 121 59 58 44 1676 5401 2092 4069 Tuesday 2152 108 53 58 50 1373 5177 2036 4641 Wednesday 2216 109 67 52 29 1284 4273 1770 3417 Thursday 2321 100 72 54 41 1412 5444 2133 4885
Friday 2622 126 86 50 38 1197 4297 1842 4832
Mean 2350 113 67 54 40 1388 4918 1975 4369

Day Energy (kcal) Proteins (g) Fats (g) Carbohydrates (g) Fibres (g) Calcium(mg) Kalium (mg) Fosfor (mg) Natrium (mg)
Neptunes (15-16 years): only boys
minimum
Monday 1204 61 25 181 23 919 2811 964 1745 Tuesday 1081 52 25 160 27 843 2772 1020 2058
Wednesday 1201 63 32 161 16 830 2423 991 1516
Thursday 1248 58 41 159 18 700 2591 1114 2285
Friday 1273 60 41 161 17 735 2098 876 2265
Mean 1201 59 33 164 20 805 2539 993 1974
maximum
Monday 2818 131 72 407 53 1717 5997 2271 4640 Tuesday 2405 110 66 339 52 1471 5339 2169 4799 Wednesday 2441 114 74 323 37 1413 5037 1922 3770 Thursday 2658 110 88 351 41 1313 4972 2280 5058
Friday 2893 133 97 362 39 1225 4363 2026 5337
Mean 2643 120 79 356 44 1428 5142 2134 4721
Piranhas girls (18 years)
minimum
Monday 1221 63 27 178 22 950 2822 997 1921 Tuesday 969 44 25 141 22 751 2267 873 1996 Wednesday 1137 55 30 159 15 818 2190 913 1552 Thursday 1156 52 40 146 17 676 2394 1036 2129
Friday 1232 57 40 157 16 719 1918 836 2190
Mean 1143 54 32 156 18 783 2318 931 1958
maximum
Monday 2493 121 66 351 44 1688 5418 2099 4083 Tuesday 2224 106 58 317 52 1382 5227 2028 4548 Wednesday 2260 106 69 300 32 1318 4617 1777 3373 Thursday 2417 106 81 310 40 1377 5417 2201 4690
Friday 2802 129 92 353 38 1210 4306 1880 4805
Mean 2439 114 73 326 41 1395 4997 1997 4300

Day Energy (kcal) Proteins (g) Fats (g) Carbohydrates (g) Fibres (g) Calcium(mg) Kalium (mg) Fosfor (mg) Natrium (mg)
Piranhas boys (18 years)
minimum
Monday 1285 70 26 189 24 959 3104 1078 1797 Tuesday 955 44 24 140 22 746 2242 870 1869 Wednesday 1203 61 31 166 17 828 2446 976 1464 Thursday 1255 59 41 160 19 703 2611 1118 2155
Friday 1281 61 42 160 16 725 2022 872 2299
Mean 1196 59 33 163 20 792 2485 983 1917
maximum
Monday 2965 140 74 429 53 1830 6514 2431 4724 Tuesday 2492 114 68 351 55 1417 5487 2174 5158 Wednesday 2476 114 75 328 37 1418 5119 1931 3878 Thursday 2722 113 91 355 49 1549 6469 2431 5476
Friday 2833 126 93 365 40 1211 4193 1939 5051
Mean 2698 121 80 366 47 1485 5556 2181 4857
Table II: Results of measuring all the food and ingredients consumed at the Zeepreventorium during one week.

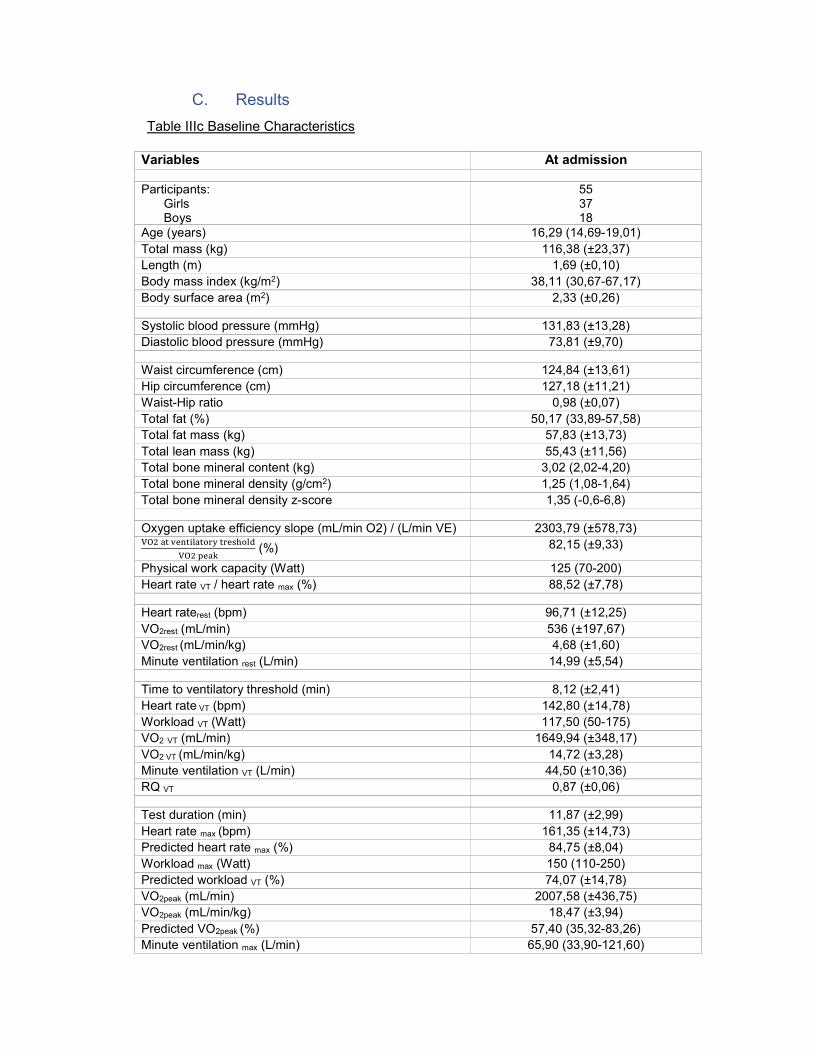
C. Results
Table IIIc Baseline Characteristics
Variables At admission
Participants: Girls Boys
55 37 18
Age (years) 16,29 (14,69-19,01) Total mass (kg) 116,38 (±23,37) Length (m) 1,69 (±0,10) Body mass index (kg/m2) 38,11 (30,67-67,17) Body surface area (m2) 2,33 (±0,26)
Systolic blood pressure (mmHg) 131,83 (±13,28) Diastolic blood pressure (mmHg) 73,81 (±9,70)
Waist circumference (cm) 124,84 (±13,61) Hip circumference (cm) 127,18 (±11,21) Waist-Hip ratio 0,98 (±0,07) Total fat (%) 50,17 (33,89-57,58) Total fat mass (kg) 57,83 (±13,73) Total lean mass (kg) 55,43 (±11,56) Total bone mineral content (kg) 3,02 (2,02-4,20) Total bone mineral density (g/cm2) 1,25 (1,08-1,64) Total bone mineral density z-score 1,35 (-0,6-6,8)
Oxygen uptake efficiency slope (mL/min O2) / (L/min VE) 2303,79 (±578,73)
(%) 82,15 (±9,33)
Physical work capacity (Watt) 125 (70-200) Heart rate VT / heart rate max (%) 88,52 (±7,78)
Heart raterest (bpm) 96,71 (±12,25) VO2rest (mL/min) 536 (±197,67) VO2rest (mL/min/kg) 4,68 (±1,60) Minute ventilation rest (L/min) 14,99 (±5,54)
Time to ventilatory threshold (min) 8,12 (±2,41) Heart rate VT (bpm) 142,80 (±14,78) Workload VT (Watt) 117,50 (50-175) VO2 VT (mL/min) 1649,94 (±348,17) VO2 VT (mL/min/kg) 14,72 (±3,28) Minute ventilation VT (L/min) 44,50 (±10,36) RQ VT 0,87 (±0,06)
Test duration (min) 11,87 (±2,99) Heart rate max (bpm) 161,35 (±14,73) Predicted heart rate max (%) 84,75 (±8,04) Workload max (Watt) 150 (110-250) Predicted workload VT (%) 74,07 (±14,78) VO2peak (mL/min) 2007,58 (±436,75) VO2peak (mL/min/kg) 18,47 (±3,94) Predicted VO2peak (%) 57,40 (35,32-83,26) Minute ventilation max (L/min) 65,90 (33,90-121,60)
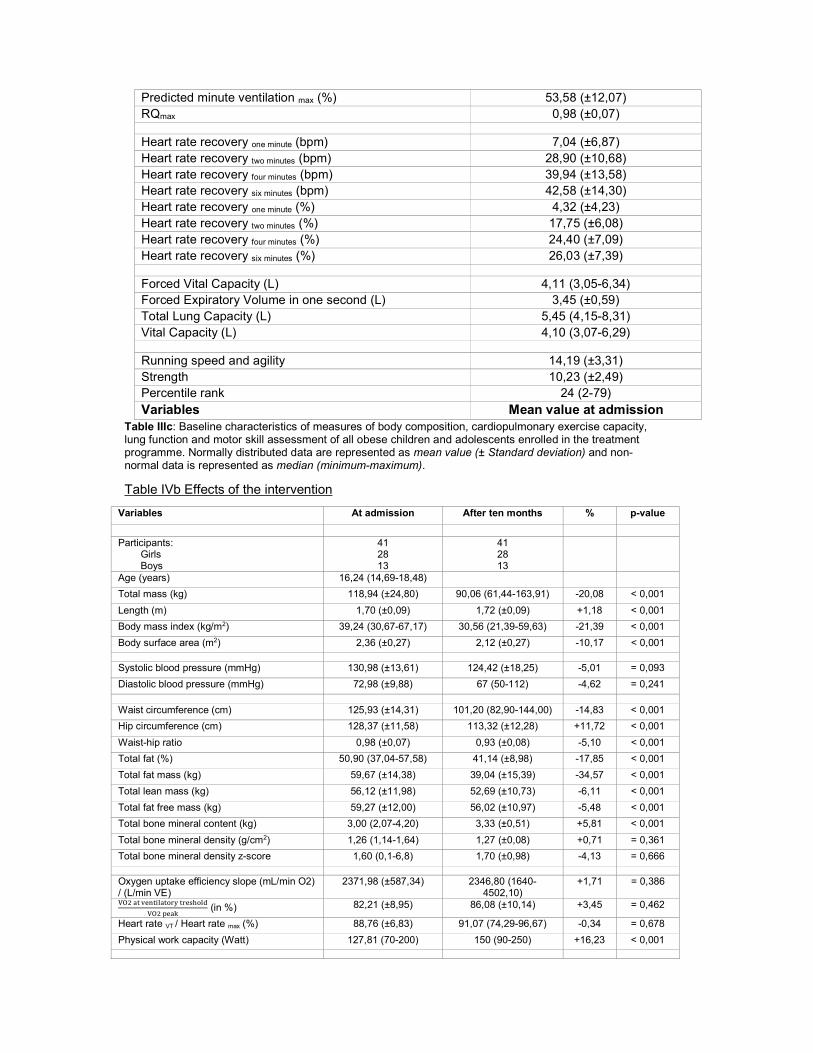
Table IIIc: Baseline characteristics of measures of body composition, cardiopulmonary exercise capacity, lung function and motor skill assessment of all obese children and adolescents enrolled in the treatment programme. Normally distributed data are represented as mean value (± Standard deviation) and non-normal data is represented as median (minimum-maximum).
Table IVb Effects of the intervention
Predicted minute ventilation max (%) 53,58 (±12,07) RQmax 0,98 (±0,07)
Heart rate recovery one minute (bpm) 7,04 (±6,87) Heart rate recovery two minutes (bpm) 28,90 (±10,68) Heart rate recovery four minutes (bpm) 39,94 (±13,58) Heart rate recovery six minutes (bpm) 42,58 (±14,30) Heart rate recovery one minute (%) 4,32 (±4,23) Heart rate recovery two minutes (%) 17,75 (±6,08) Heart rate recovery four minutes (%) 24,40 (±7,09) Heart rate recovery six minutes (%) 26,03 (±7,39)
Forced Vital Capacity (L) 4,11 (3,05-6,34) Forced Expiratory Volume in one second (L) 3,45 (±0,59) Total Lung Capacity (L) 5,45 (4,15-8,31) Vital Capacity (L) 4,10 (3,07-6,29)
Running speed and agility 14,19 (±3,31) Strength 10,23 (±2,49) Percentile rank 24 (2-79) Variables Mean value at admission
Variables At admission After ten months % p-value
Participants:
Girls Boys
41 28 13
41 28 13
Age (years) 16,24 (14,69-18,48)
Total mass (kg) 118,94 (±24,80) 90,06 (61,44-163,91) -20,08 < 0,001
Length (m) 1,70 (±0,09) 1,72 (±0,09) +1,18 < 0,001
Body mass index (kg/m2) 39,24 (30,67-67,17) 30,56 (21,39-59,63) -21,39 < 0,001
Body surface area (m2) 2,36 (±0,27) 2,12 (±0,27) -10,17 < 0,001
Systolic blood pressure (mmHg) 130,98 (±13,61) 124,42 (±18,25) -5,01 = 0,093
Diastolic blood pressure (mmHg) 72,98 (±9,88) 67 (50-112) -4,62 = 0,241
Waist circumference (cm) 125,93 (±14,31) 101,20 (82,90-144,00) -14,83 < 0,001
Hip circumference (cm) 128,37 (±11,58) 113,32 (±12,28) +11,72 < 0,001
Waist-hip ratio 0,98 (±0,07) 0,93 (±0,08) -5,10 < 0,001
Total fat (%) 50,90 (37,04-57,58) 41,14 (±8,98) -17,85 < 0,001
Total fat mass (kg) 59,67 (±14,38) 39,04 (±15,39) -34,57 < 0,001
Total lean mass (kg) 56,12 (±11,98) 52,69 (±10,73) -6,11 < 0,001
Total fat free mass (kg) 59,27 (±12,00) 56,02 (±10,97) -5,48 < 0,001
Total bone mineral content (kg) 3,00 (2,07-4,20) 3,33 (±0,51) +5,81 < 0,001
Total bone mineral density (g/cm2) 1,26 (1,14-1,64) 1,27 (±0,08) +0,71 = 0,361
Total bone mineral density z-score 1,60 (0,1-6,8) 1,70 (±0,98) -4,13 = 0,666
Oxygen uptake efficiency slope (mL/min O2) / (L/min VE)
2371,98 (±587,34) 2346,80 (1640-4502,10)
+1,71 = 0,386
(in %) 82,21 (±8,95) 86,08 (±10,14) +3,45 = 0,462
Heart rate VT / Heart rate max (%) 88,76 (±6,83) 91,07 (74,29-96,67) -0,34 = 0,678
Physical work capacity (Watt) 127,81 (70-200) 150 (90-250) +16,23 < 0,001
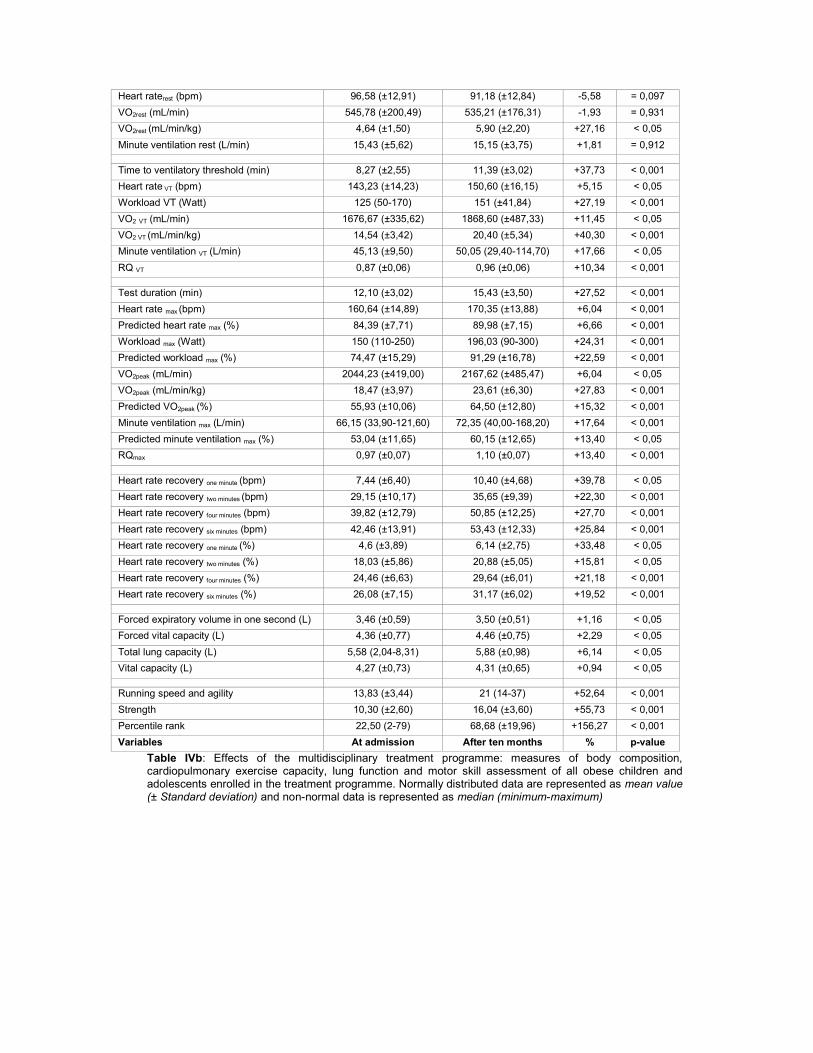
Table IVb: Effects of the multidisciplinary treatment programme: measures of body composition, cardiopulmonary exercise capacity, lung function and motor skill assessment of all obese children and adolescents enrolled in the treatment programme. Normally distributed data are represented as mean value (± Standard deviation) and non-normal data is represented as median (minimum-maximum)
Heart raterest (bpm) 96,58 (±12,91) 91,18 (±12,84) -5,58 = 0,097
VO2rest (mL/min) 545,78 (±200,49) 535,21 (±176,31) -1,93 = 0,931
VO2rest (mL/min/kg) 4,64 (±1,50) 5,90 (±2,20) +27,16 < 0,05
Minute ventilation rest (L/min) 15,43 (±5,62) 15,15 (±3,75) +1,81 = 0,912
Time to ventilatory threshold (min) 8,27 (±2,55) 11,39 (±3,02) +37,73 < 0,001
Heart rate VT (bpm) 143,23 (±14,23) 150,60 (±16,15) +5,15 < 0,05
Workload VT (Watt) 125 (50-170) 151 (±41,84) +27,19 < 0,001
VO2 VT (mL/min) 1676,67 (±335,62) 1868,60 (±487,33) +11,45 < 0,05
VO2 VT (mL/min/kg) 14,54 (±3,42) 20,40 (±5,34) +40,30 < 0,001
Minute ventilation VT (L/min) 45,13 (±9,50) 50,05 (29,40-114,70) +17,66 < 0,05
RQ VT 0,87 (±0,06) 0,96 (±0,06) +10,34 < 0,001
Test duration (min) 12,10 (±3,02) 15,43 (±3,50) +27,52 < 0,001
Heart rate max (bpm) 160,64 (±14,89) 170,35 (±13,88) +6,04 < 0,001
Predicted heart rate max (%) 84,39 (±7,71) 89,98 (±7,15) +6,66 < 0,001
Workload max (Watt) 150 (110-250) 196,03 (90-300) +24,31 < 0,001
Predicted workload max (%) 74,47 (±15,29) 91,29 (±16,78) +22,59 < 0,001
VO2peak (mL/min) 2044,23 (±419,00) 2167,62 (±485,47) +6,04 < 0,05
VO2peak (mL/min/kg) 18,47 (±3,97) 23,61 (±6,30) +27,83 < 0,001
Predicted VO2peak (%) 55,93 (±10,06) 64,50 (±12,80) +15,32 < 0,001
Minute ventilation max (L/min) 66,15 (33,90-121,60) 72,35 (40,00-168,20) +17,64 < 0,001
Predicted minute ventilation max (%) 53,04 (±11,65) 60,15 (±12,65) +13,40 < 0,05
RQmax 0,97 (±0,07) 1,10 (±0,07) +13,40 < 0,001
Heart rate recovery one minute (bpm) 7,44 (±6,40) 10,40 (±4,68) +39,78 < 0,05
Heart rate recovery two minutes (bpm) 29,15 (±10,17) 35,65 (±9,39) +22,30 < 0,001
Heart rate recovery four minutes (bpm) 39,82 (±12,79) 50,85 (±12,25) +27,70 < 0,001
Heart rate recovery six minutes (bpm) 42,46 (±13,91) 53,43 (±12,33) +25,84 < 0,001
Heart rate recovery one minute (%) 4,6 (±3,89) 6,14 (±2,75) +33,48 < 0,05
Heart rate recovery two minutes (%) 18,03 (±5,86) 20,88 (±5,05) +15,81 < 0,05
Heart rate recovery four minutes (%) 24,46 (±6,63) 29,64 (±6,01) +21,18 < 0,001
Heart rate recovery six minutes (%) 26,08 (±7,15) 31,17 (±6,02) +19,52 < 0,001
Forced expiratory volume in one second (L) 3,46 (±0,59) 3,50 (±0,51) +1,16 < 0,05
Forced vital capacity (L) 4,36 (±0,77) 4,46 (±0,75) +2,29 < 0,05
Total lung capacity (L) 5,58 (2,04-8,31) 5,88 (±0,98) +6,14 < 0,05
Vital capacity (L) 4,27 (±0,73) 4,31 (±0,65) +0,94 < 0,05
Running speed and agility 13,83 (±3,44) 21 (14-37) +52,64 < 0,001
Strength 10,30 (±2,60) 16,04 (±3,60) +55,73 < 0,001
Percentile rank 22,50 (2-79) 68,68 (±19,96) +156,27 < 0,001
Variables At admission After ten months % p-value

Table V and Table VI Effects of the intervention according to gender
Variables At admission After ten months P-value
Participants: 13 13
Age (years) 15,42 (14,69-18,27)
Total mass (kg) 131,84 (±22,07) 99,89 (±19,58) < 0,001
Length (m) 1,77 (±0,09) 1,79 (±0,09) < 0,001
Body mass index (kg/m2) 41,94 (±7,52) 30,84 (±6,08) < 0,001
Body surface area (m2) 2,54 (±0,24) 2,21 (±0,25) < 0,001
Waist circumference (cm) 130,13 (±15,92) 109,9 (±19,17) < 0,001
Waist-hip ratio 1,02 (±0,06) 0,97 (±0,09) = 0,059
Total fat (%) 47,97 (±5,07) 33,89 (±9,05) < 0,001
Total fat mass (kg) 63,35 (±14,45) 34,14 (±14,37) < 0,001
Total lean mass (kg) 65,32 (±9,65) 62,20 (±7,89) = 0,105
Total bone mineral content (kg) 3,17 (±0,43) 3,47 (2,94-4,84) < 0,05
(in %) 78,81 (±7,36) 83,84 (±8,50) = 0,305
Physical work capacity (Watt) 150 (±23,57) 175 (150-250) < 0,05
Heart rateVT (bpm) 138,38 (±10,88) 150,08 (±11,76) < 0,05
VO2VT (ml/min) 1870,85 (±301,51) 2361,50 (±515,41) < 0,05
RQVT 0,87 (±0,06) 0,96 (±0,04) < 0,05
VO2VT (ml/min/kg) 14,49 (±2,58) 24,08 (±4,36) < 0,001
Heart ratemax (bpm) 160,92 (±14,68) 172,25 (±10,58) < 0,05
Predicted heart ratemax (%) 84,25 (±7,51) 90,62 (±5,63) < 0,05
VO2peak (ml/min) 2385,85 (±402,61) 2709,92 (±396,88) < 0,05
VO2peak (ml/min/kg) 19,56 (±3,24) 27,84 (±6,34) < 0,05
Predicted VO2peak (%) 53,63 (±7,27) 61,25 (52,97-98,72) < 0,05
RQmax 1,00 (±0,06) 1,13 (±0,07) < 0,001
Heart rate recovery one minute (bpm) 8,08 (±4,25) 11,75 (±3,67) = 0,054
Heart rate recuperation two minutes (bpm) 29,25 (±10,11) 39,33 (±7,74) < 0,05
Heart rate recuperation one minute (%) 5,08 (±2,87) 6,88 (±2,26) = 0,134
Heart rate recuperation two minutes (%) 18,22 (±6,72) 22,90 (±4,61) < 0,05
Table V: Effects of the multidisciplinary treatment programme: measures of body composition, cardiopulmonary exercise capacity, lung function and motor skill assessment of the male obese children and adolescents enrolled in the treatment programme. Normally distributed data are represented as mean value (± Standard deviation) and non-normal data is represented as median (minimum-maximum)
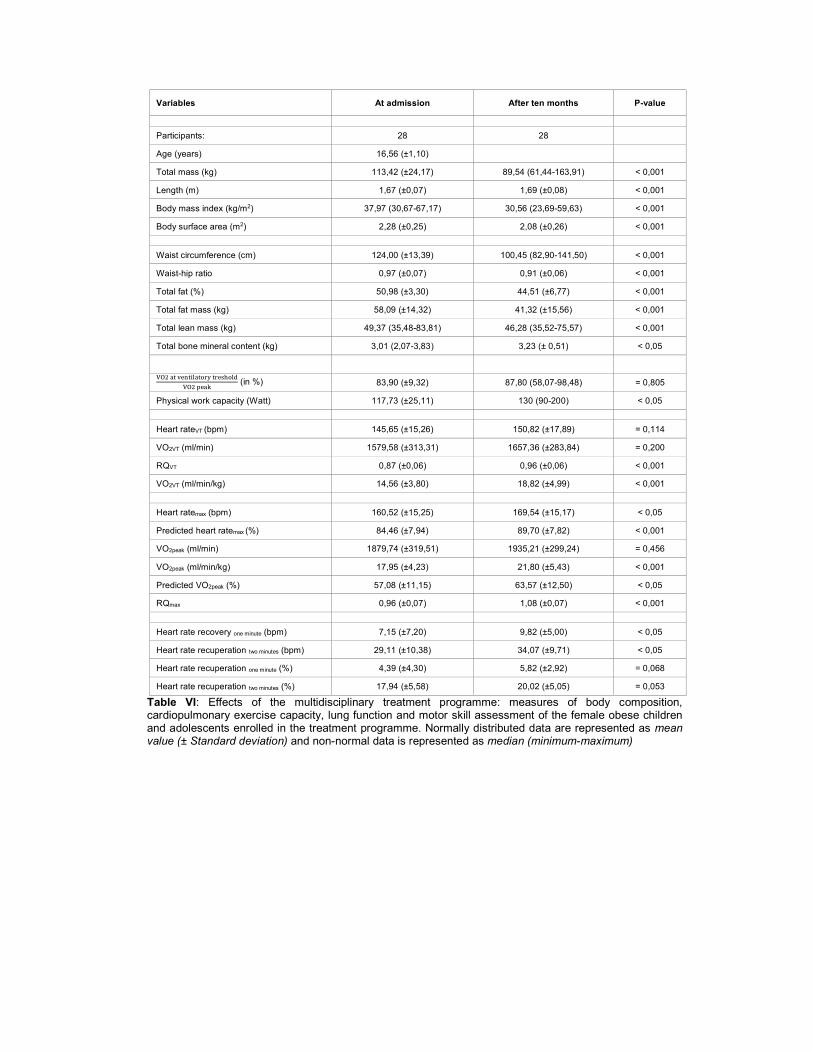
Variables At admission After ten months P-value
Participants: 28 28
Age (years) 16,56 (±1,10)
Total mass (kg) 113,42 (±24,17) 89,54 (61,44-163,91) < 0,001
Length (m) 1,67 (±0,07) 1,69 (±0,08) < 0,001
Body mass index (kg/m2) 37,97 (30,67-67,17) 30,56 (23,69-59,63) < 0,001
Body surface area (m2) 2,28 (±0,25) 2,08 (±0,26) < 0,001
Waist circumference (cm) 124,00 (±13,39) 100,45 (82,90-141,50) < 0,001
Waist-hip ratio 0,97 (±0,07) 0,91 (±0,06) < 0,001
Total fat (%) 50,98 (±3,30) 44,51 (±6,77) < 0,001
Total fat mass (kg) 58,09 (±14,32) 41,32 (±15,56) < 0,001
Total lean mass (kg) 49,37 (35,48-83,81) 46,28 (35,52-75,57) < 0,001
Total bone mineral content (kg) 3,01 (2,07-3,83) 3,23 (± 0,51) < 0,05
(in %) 83,90 (±9,32) 87,80 (58,07-98,48) = 0,805
Physical work capacity (Watt) 117,73 (±25,11) 130 (90-200) < 0,05
Heart rateVT (bpm) 145,65 (±15,26) 150,82 (±17,89) = 0,114
VO2VT (ml/min) 1579,58 (±313,31) 1657,36 (±283,84) = 0,200
RQVT 0,87 (±0,06) 0,96 (±0,06) < 0,001
VO2VT (ml/min/kg) 14,56 (±3,80) 18,82 (±4,99) < 0,001
Heart ratemax (bpm) 160,52 (±15,25) 169,54 (±15,17) < 0,05
Predicted heart ratemax (%) 84,46 (±7,94) 89,70 (±7,82) < 0,001
VO2peak (ml/min) 1879,74 (±319,51) 1935,21 (±299,24) = 0,456
VO2peak (ml/min/kg) 17,95 (±4,23) 21,80 (±5,43) < 0,001
Predicted VO2peak (%) 57,08 (±11,15) 63,57 (±12,50) < 0,05
RQmax 0,96 (±0,07) 1,08 (±0,07) < 0,001
Heart rate recovery one minute (bpm) 7,15 (±7,20) 9,82 (±5,00) < 0,05
Heart rate recuperation two minutes (bpm) 29,11 (±10,38) 34,07 (±9,71) < 0,05
Heart rate recuperation one minute (%) 4,39 (±4,30) 5,82 (±2,92) = 0,068
Heart rate recuperation two minutes (%) 17,94 (±5,58) 20,02 (±5,05) = 0,053
Table VI: Effects of the multidisciplinary treatment programme: measures of body composition, cardiopulmonary exercise capacity, lung function and motor skill assessment of the female obese children and adolescents enrolled in the treatment programme. Normally distributed data are represented as mean value (± Standard deviation) and non-normal data is represented as median (minimum-maximum)

Table VII: Differences in the effects of the intervention according to gender
Variables Boys Girls % p-value Participants: 13 28 Age (years) 16,10 (±1,27) 16,56 (±1,10) = 0,177 Change of total mass (%) -22,45 (±5,96) -18,50 (±5,59) 3,95 = 0,052 Change of length (%) 1,18 (±0,66) ,88 (±0,52) 0,3 = 0,135 Change of body mass index (%) -24,46 (±5,66) -20,05 (±5,34) 4,41 < 0,05 Change of body surface area (%) -11,66 (±3,83) -9,45 (±3,29) 2,21 = 0,082 Change of Waist circumference (%) -16,78 (±10,15) -16,66 (±6,83) 0,12 = 0,566 Change of waist-hip ratio (%) -4,14 (±10,39) -6,01 (±6,71) 1,87 = 0,889 Change of total fat percentage (%) -28,53 (±14,28) -12,94 (±10,07) 15,59 < 0,05 Change of total fat mass (%) -45,48 (±12,29) -30,42 (±11,69) 15,06 < 0,05 Change of total lean mass (%) -2,93 (±6,51) -6,84 (±7,11) 3,91 = 0,111 Change of total bone mineral content (%) 14,10 (±9,44) 6,74 (± 18,50) 7,36 = 0,074 Change of Oxygen uptake efficiency slope (%)
2,36 (±12,16) 6,72 (±22,25) 4,36 = 0,456
Change of
(%) 5,62 (±15,54) 2,06 (±17,87) 3,56 = 0,572
Change of physical work capacity (%) 26,79 (±17,42) 14,76 (±24,34) 44,90 = 0,171 Change of Heart rate VT (%) 7,60 (±8,80) 4,55 (±12,61) 3,05 = 0,455 Change of VO2 VT (%) 24,90 (±17,97) 7,69 (±22,47) 17,21 < 0,05 Change of RQ VT (%) 10,81 (±9,89) 9,27 (±8,36) 1,54 = 0,545 Change of Weight adjusted VO2 VT (%) 61,63 (±24,66) 32,93 (±28,43) 28,70 < 0,05 Change of Heart rate max (%) 6,89 (±5,92) 5,85 (±7,57) 1,04 = 0,675 Change of Predicted heart rate max (%) 7,08 (±6,01) 6,22 (±7,67) 0,86 = 0,734 Change of VO2 max (%) 14,72 (±13,31) 4,51 (±14,56) 10,21 < 0,05 Change of Weight adjusted VO2 max (%) 41,45 (±16,85) 22,14 (±19,00) 19,31 < 0,05 Change of Predicted VO2 max (%) 24,22 (±15,64) 11,54 (±16,84) 12,68 < 0,05 Change of RQ max (%) 13,55 (±7,75) 11,87 (±7,89) 1,68 = 0,569 Variables Boys Girls % P-value
Table VII: Effects of the multidisciplinary treatment programme according to gender: measures of body composition, cardiopulmonary exercise capacity, lung function and motor skill assessment of the female obese children and adolescents enrolled in the treatment programme. Normally distributed data are represented as mean value (± Standard deviation) and non-normal data is represented as median (minimum-maximum)

Table VIII: Correlation between body composition and exercise capacity
Variable 1 Variable 2 Correlation Coefficient
p-value
Change of body mass index (%) Change of heart rate max (%) 0,230 0,172
Change of predicted heart rate max (%) 0,264 0,119
Change of weight adjusted VO2 max (%) -0,386 < 0,05
Change of predicted VO2 max (%) -0,145 0,407
Change of
(%) -0,263 0,133
Change of total mass (%) Change of heart rate max (%) 0,198 0,232
Change of predicted heart rate max (%) 0,238 0,156
Change of weight adjusted VO2 max (%) -0,410 < 0,05
Change of predicted VO2 max (%) -0,220 0,198
Change of
(%) -0,168 0,335
Change of total fat mass (%) Change of heart rate max (%) -0,015 0,928
Change of predicted heart rate max (%) 0,021 0,901
Change of weight adjusted VO2 max (%) -0,421 < 0,05
Change of predicted VO2 max (%) -0,212 0,214
Change of
(%) -0,167 0,339
Change of total lean mass (%) Change of heart rate max (%) 0,319 0,051
Change of predicted heart rate max (%) 0,312 0,060
Change of weight adjusted VO2 max (%) 0,031 0,853
Change of predicted VO2 max (%) -0,053 0,758
Change of
(in %) 0,114 0,513
Change of total bone mineral content (%) Change of heart rate max (%) -0,184 0,268
Change of predicted heart rate max (%) -0,179 0,290
Change of weight adjusted VO2 max (%) 0,241 0,144
Change of predicted VO2 max (%) 0,234 0,169
Change of
(%) -0,069 0,692
Change of total fat percentage (%) Change of heart rate max (%) -0,157 0,348
Change of predicted heart rate max (%) -0,118 0,486
Change of weight adjusted VO2 max (%) -0,329 < 0,05
Change of predicted VO2 max (%) -0,135 0,433
Change of
(%) -0,217 0,210
Change of total lean percentage (%) Change of heart rate max (%) 0,104 0,535
Change of predicted heart rate max (%) 0,077 0,651
Change of weight adjusted VO2 max (%) 0,348 < 0,05
Change of predicted VO2 max (%) 0,185 0,279
Change of
(in %) 0,213 0,220
Change of total fat free mass (%) Change of heart rate max (%) 0,323 < 0,05
Change of predicted heart rate max (%) 0,317 0,056
Change of weight adjusted VO2 max (%) 0,086 0,610
Change of predicted VO2 max (%) -0,002 0,993
(%) 0,114 0,515
Change of waist circumference %) Change of heart rate max (%) -0,118 0,494
Change of predicted heart rate max (%) -0,096 0,585
Change of weight adjusted VO2 max (%) -0,324 0,054
Change of predicted VO2 max (%) -0,252 0,151

Change of
(%) -0,169 0,340
Change of total waist-hip ratio (%) Change of Heart rate max (%) -0,270 0,112
Change of predicted heart rate max (%) -0,226 0,192
Change of weight adjusted VO2 max (%) -0,237 0,164
Change of predicted VO2 max (%) -0,245 0,163
Change of
(%) -0,161 0,362
Variable 1 Variable 2 Correlation Coefficient
p-value
Table VIII: Correlation between change in variables of body composition and variables of exercise capacity.

Table IX: Predictors of exercise capacity
Variable Pre Variable Post Correlation Coefficient
p-value
Total mass (kg) Predicted heart rate max (%) -0,364 < 0,05 Weight adjusted VO2 max (ml/min/kg) -0,456 < 0,05 Predicted VO2 max (%) -0,483 < 0,05
(%) -0,119 0,483
Total lean body mass (kg) Predicted heart rate max (%) -0,434 < 0,05 Weight adjusted VO2 max (ml/min/kg) -0,304 0,060 Predicted VO2 max (%) -0,356 < 0,05
(%) -0,035 0,839
Total fat mass (kg) Predicted heart rate max (%) -0,322 < 0,05 Weight adjusted VO2 max (ml/min/kg) -0,527 < 0,05 Predicted VO2 max (%) -0,461 < 0,05
(%) -0,032 0,851
Total bone mineral content (g) Predicted heart rate max (%) 0,105 0,531 Weight adjusted VO2 max (ml/min/kg) -0,089 0,588 Predicted VO2 max (%) -0,241 0,146
(%) -0,140 0,409
Total fat percentage (%) Predicted heart rate max (%) -0,081 0,627 Weight adjusted VO2 max (ml/min/kg) -0,350 < 0,05 Predicted VO2 max (%) -0,112 0,503
(%) 0,007 0,966
Total lean percentage (%) Predicted heart rate max (%) -0,027 0,873 Weight adjusted VO2 max (ml/min/kg) 0,385 < 0,05 Predicted VO2 max (%) 0,013 0,937
(%) -0,035 0,839
Total fat-free mass (kg) Predicted heart rate max (%) -0,368 < 0,05 Weight adjusted VO2 max (ml/min/kg) -0,309 0,055 Predicted VO2 max (%) -0,445 < 0,05
(%) -0,179 0,289
Waist circumference (cm) Predicted heart rate max (%) -0,279 0,099 Weight adjusted VO2 max (ml/min/kg) -0,356 < 0,05 Predicted VO2 max (%) -0,228 0,181
(%) -0,054 0,760
Waist-hip ratio Predicted heart rate max (%) -0,162 0,345 Weight adjusted VO2 max (ml/min/kg) 0,092 0,590 Predicted VO2 max (%) 0,088 0,608
(%) -0,171 0,327
Table VI: Correlation between variables of body compositon before the intervention and variables of exercise capacity after the intervention.

Table X: Predictors of body composition
Variable Pre Variable Post Correlation Coefficient
p-value
Predicted heart rate max (%) Total body mass (kg) -0,269 0,093 Total lean mass (kg) -0,241 0,134 Total fat mass (kg) -0,337 < 0,05 Total bone mineral content (g) 0,244 0,129 Total fat percentage (%) -0,192 0,235 Total lean percentage (%) 0,178 0,273 Total fat free mass (kg) -0,223 0,167 Waist circumference (cm) -0,242 0,133 Waist-hip ratio -0,112 0,504
Weight adjusted VO2 max (ml/min/kg) Total body mass (kg) -0,595 < 0,001 Total lean mass (kg) -0,276 0,085 Total fat mass (kg) -0,772 <0,001 Total bone mineral content (g) -0,036 0,825 Total fat percentage (%) -0,619 <0,001 Total lean percentage (%) -0,612 <0,001 Total fat free mass (kg) -0,272 0,090 Waist circumference (cm) -0,643 <0,001 Waist-hip ratio -0,190 0,252
Predicted VO2 max (%) Total body mass (kg) -0,527 < 0,05 Total lean mass (kg) -0,470 < 0,05 Total fat mass (kg) -0,533 < 0,001 Total bone mineral content (g) -0,068 0,681 Total fat percentage (%) -0,245 0,133 Total lean percentage (%) 0,237 0,146 Total fat free mass (kg) -0,463 0,003 Waist circumference (cm) -0,522 < 0,05 Waist-hip ratio -0,534 < 0,001
(%) Total body mass (kg) -0,102 0,535
Total lean mass (kg) -0,256 0,116 Total fat mass (kg) 0,083 0,618 Total bone mineral content (g) -0,147 0,372 Total fat percentage (%) 0,197 0,229 Total lean percentage (%) -0,192 0,241 Total fat free mass (kg) -0,256 0,115 Waist circumference (cm) 0,034 0,837 Waist-hip ratio 0,085 0,611 Table X: Correlation between variables of exercise capacity before the intervention and variables of body composition between the weight los treatent programme.

Table XI: Predictors of change in body composition
Variable 1 Variable 2 Correlation Coefficient
p-value
Fat loss (in kg) Total fat mass (in kg) before treatment -0,163 0,316
Change of body mass index (%)
Predicted VO2max before the treatment -0,341 < 0,05
Age at admission Total lean mass at admission 0,056 0,737 Change of total mass (%) Predicted VO2max before the treatment -0,299 0,078 Age at admission 0,018 0,911 Total lean mass at admission 0,051 0,756 Change of fat mass ‘(%) Predicted VO2max before the treatment -0,327 < 0,05 Age at admission 0,069 0,671 Total lean mass at admission 0,120 0,462
Change of lean mass (%) Predicted VO2max before the treatment 0,147 0,377
Age at admission -0,046 0,776 Total lean mass at admission -0,281 0,079 Change of total fat percentage (%)
Predicted VO2max before the treatment -0,315 0,054
Age at admission -0,025 0,880 Total lean mass at admission 0,150 0,354 Change of total lean percentage (%)
Predicted VO2max before the treatment 0,312 0,056
Age at admission -0,030 0,856 Total lean mass at admission -0,237 0,140 Change of Waist-circumference
Predicted VO2max before the treatment -0,245 0,151
Age at admission -0,043 0,797 Total lean mass at admission 0,386 <0,05 Change of Waist-hip ratio Predicted VO2max before the treatment -0,274 0,106 Age at admission 0,119 0,478 Total lean mass at admission 0,324 0,050
Table VII: Correlation between variables prior to the intervention and change in body composition.