Effective Range of FSSW Parameters for High Load-Carrying ...
24
Citation: Ataya, S.; Ahmed, M.M.Z.; El-Sayed Seleman, M.M.; Hajlaoui, K.; Latief, F.H.; Soliman, A.M.; Elshaghoul, Y.G.Y.; Habba, M.I.A. Effective Range of FSSW Parameters for High Load-Carrying Capacity of Dissimilar Steel A283M-C/Brass CuZn40 Joints. Materials 2022, 15, 1394. https://doi.org/10.3390/ ma15041394 Academic Editors: Józef Iwaszko, Jerzy Winczek and Andrey Belyakov Received: 29 January 2022 Accepted: 11 February 2022 Published: 14 February 2022 Publisher’s Note: MDPI stays neutral with regard to jurisdictional claims in published maps and institutional affil- iations. Copyright: © 2022 by the authors. Licensee MDPI, Basel, Switzerland. This article is an open access article distributed under the terms and conditions of the Creative Commons Attribution (CC BY) license (https:// creativecommons.org/licenses/by/ 4.0/). materials Article Effective Range of FSSW Parameters for High Load-Carrying Capacity of Dissimilar Steel A283M-C/Brass CuZn40 Joints Sabbah Ataya 1,2 , Mohamed M. Z. Ahmed 3, * , Mohamed M. El-Sayed Seleman 2 , Khalil Hajlaoui 1 , Fahamsyah H. Latief 1 , Ahmed M. Soliman 4 , Yousef G. Y. Elshaghoul 5 and Mohamed I. A. Habba 6 1 Department of Mechanical Engineering, College of Engineering, Imam Mohammad Ibn Saud Islamic University, Riyadh 11432, Saudi Arabia; [email protected] (S.A.); [email protected] (K.H.); [email protected] (F.H.L.) 2 Department of Metallurgical and Materials Engineering, Faculty of Petroleum and Mining Engineering, Suez University, Suez 43512, Egypt; [email protected] 3 Mechanical Engineering Department, College of Engineering at Al Kharj, Prince Sattam Bin Abdulaziz University, Al Kharj 16273, Saudi Arabia 4 Department of Mechanical Engineering, College of Engineering, Jouf University, Sakaka 72388, Saudi Arabia; [email protected] 5 Mechanical Engineering Department, Faculty of Engineering, Suez University, Suez 43518, Egypt; [email protected] 6 Mechanical Department, Faculty of Technology & Education, Suez University, Suez 43518, Egypt; [email protected] * Correspondence: [email protected] Abstract: In the current study, a 2 mm thick low-carbon steel sheet (A283M—Grade C) was joined with a brass sheet (CuZn40) of 1 mm thickness using friction stir spot welding (FSSW). Different welding parameters including rotational speeds of 1000, 1250, and 1500 rpm, and dwell times of 5, 10, 20, and 30 s were applied to explore the effective range of parameters to have FSSW joints with high load-carrying capacity. The joint quality of the friction stir spot-welded (FSSWed) dissimilar materials was evaluated via visual examination, tensile lap shear test, hardness test, and macro- and microstructural investigation using SEM. Moreover, EDS analysis was applied to examine the mixing at the interfaces of the dissimilar materials. Heat input calculation for the FSSW of steel–brass was found to be linearly proportional with the number of revolutions per spot joint, with maximum heat input obtained of 11 kJ at the number of revolutions of 500. The temperature measurement during FSSW showed agreement with the heat input dependence on the number of revolution. However, at the same revolutions of 500, it was found that the higher rotation speed of 1500 rpm resulted in higher temperature of 583 ◦ C compared to 535 ◦ C at rotation speed of 1000 rpm. This implies the significant effect for the rotation speed in the increase of temperature. The macro investigations of the friction stir spot-welded joints transverse sections showed sound joints at the different investigated parameters with significant joint ligament between the steel and brass. FSSW of steel/brass joints with a number of revolutions ranging between 250 to 500 revolutions per spot at appropriate tool speed range (1000–1500 rpm) produces joints with high load-carrying capacity from 4 kN to 7.5 kN. The hardness showed an increase in the carbon steel (lower sheet) with maximum of 248 HV and an increase of brass hardness at mixed interface between brass and steel with significant reduction in the stir zone hardness. Microstructural investigation of the joint zone showed mechanical mixing between steel and brass with the steel extruded from the lower sheet into the upper brass sheet. Keywords: Friction stir spot welding; low-carbon steel; brass; load-carrying capacity; hardness; microstructure 1. Introduction In 1991, friction stir welding (FSW) was initially introduced by TWI in the United King- dom as a newly developed solid-state welding process, particularly for joining aluminum Materials 2022, 15, 1394. https://doi.org/10.3390/ma15041394 https://www.mdpi.com/journal/materials
-
Upload
khangminh22 -
Category
Documents
-
view
3 -
download
0
Transcript of Effective Range of FSSW Parameters for High Load-Carrying ...

�����������������
Citation: Ataya, S.; Ahmed, M.M.Z.;
El-Sayed Seleman, M.M.; Hajlaoui, K.;
Latief, F.H.; Soliman, A.M.;
Elshaghoul, Y.G.Y.; Habba, M.I.A.
Effective Range of FSSW Parameters
for High Load-Carrying Capacity of
Dissimilar Steel A283M-C/Brass
CuZn40 Joints. Materials 2022, 15,
1394. https://doi.org/10.3390/
ma15041394
Academic Editors: Józef Iwaszko,
Jerzy Winczek and Andrey
Belyakov
Received: 29 January 2022
Accepted: 11 February 2022
Published: 14 February 2022
Publisher’s Note: MDPI stays neutral
with regard to jurisdictional claims in
published maps and institutional affil-
iations.
Copyright: © 2022 by the authors.
Licensee MDPI, Basel, Switzerland.
This article is an open access article
distributed under the terms and
conditions of the Creative Commons
Attribution (CC BY) license (https://
creativecommons.org/licenses/by/
4.0/).
materials
Article
Effective Range of FSSW Parameters for High Load-CarryingCapacity of Dissimilar Steel A283M-C/Brass CuZn40 JointsSabbah Ataya 1,2 , Mohamed M. Z. Ahmed 3,* , Mohamed M. El-Sayed Seleman 2 , Khalil Hajlaoui 1,Fahamsyah H. Latief 1, Ahmed M. Soliman 4 , Yousef G. Y. Elshaghoul 5 and Mohamed I. A. Habba 6
1 Department of Mechanical Engineering, College of Engineering, Imam Mohammad Ibn Saud IslamicUniversity, Riyadh 11432, Saudi Arabia; [email protected] (S.A.); [email protected] (K.H.);[email protected] (F.H.L.)
2 Department of Metallurgical and Materials Engineering, Faculty of Petroleum and Mining Engineering,Suez University, Suez 43512, Egypt; [email protected]
3 Mechanical Engineering Department, College of Engineering at Al Kharj, Prince Sattam Bin AbdulazizUniversity, Al Kharj 16273, Saudi Arabia
4 Department of Mechanical Engineering, College of Engineering, Jouf University, Sakaka 72388, Saudi Arabia;[email protected]
5 Mechanical Engineering Department, Faculty of Engineering, Suez University, Suez 43518, Egypt;[email protected]
6 Mechanical Department, Faculty of Technology & Education, Suez University, Suez 43518, Egypt;[email protected]
* Correspondence: [email protected]
Abstract: In the current study, a 2 mm thick low-carbon steel sheet (A283M—Grade C) was joinedwith a brass sheet (CuZn40) of 1 mm thickness using friction stir spot welding (FSSW). Differentwelding parameters including rotational speeds of 1000, 1250, and 1500 rpm, and dwell times of 5,10, 20, and 30 s were applied to explore the effective range of parameters to have FSSW joints withhigh load-carrying capacity. The joint quality of the friction stir spot-welded (FSSWed) dissimilarmaterials was evaluated via visual examination, tensile lap shear test, hardness test, and macro- andmicrostructural investigation using SEM. Moreover, EDS analysis was applied to examine the mixingat the interfaces of the dissimilar materials. Heat input calculation for the FSSW of steel–brass wasfound to be linearly proportional with the number of revolutions per spot joint, with maximum heatinput obtained of 11 kJ at the number of revolutions of 500. The temperature measurement duringFSSW showed agreement with the heat input dependence on the number of revolution. However,at the same revolutions of 500, it was found that the higher rotation speed of 1500 rpm resulted inhigher temperature of 583 ◦C compared to 535 ◦C at rotation speed of 1000 rpm. This implies thesignificant effect for the rotation speed in the increase of temperature. The macro investigations of thefriction stir spot-welded joints transverse sections showed sound joints at the different investigatedparameters with significant joint ligament between the steel and brass. FSSW of steel/brass jointswith a number of revolutions ranging between 250 to 500 revolutions per spot at appropriate toolspeed range (1000–1500 rpm) produces joints with high load-carrying capacity from 4 kN to 7.5 kN.The hardness showed an increase in the carbon steel (lower sheet) with maximum of 248 HV and anincrease of brass hardness at mixed interface between brass and steel with significant reduction inthe stir zone hardness. Microstructural investigation of the joint zone showed mechanical mixingbetween steel and brass with the steel extruded from the lower sheet into the upper brass sheet.
Keywords: Friction stir spot welding; low-carbon steel; brass; load-carrying capacity; hardness;microstructure
1. Introduction
In 1991, friction stir welding (FSW) was initially introduced by TWI in the United King-dom as a newly developed solid-state welding process, particularly for joining aluminum
Materials 2022, 15, 1394. https://doi.org/10.3390/ma15041394 https://www.mdpi.com/journal/materials

Materials 2022, 15, 1394 2 of 24
alloys with specific requirements that should be fulfilled [1,2]. Then friction stir spot weld-ing (FSSW) was developed as one of its variant for local joining of similar and dissimilarsheets [3–9] as a promising technique with similarities to the basic concepts of linear FSWwith a specific requirement where no lateral movement of the tool is required [10]. Moreinterestingly, the rotating tool pierces the sheets that are being welded and then produces astir zone. The stir zone or nugget in the friction processed materials characterized by fine,dynamic, recrystallized microstructures due the severe plastic deformation experienced athigh temperatures [11–14]. Indeed, the FSSW can be operated under the bulk melting point,which allows this technique to prevent the formation of defects attributed to porosity, solid-ification, thermal distortion, etc. [15,16]. The FSSW technique has been applied for joiningdissimilar materials [17] such as aluminum–magnesium [18], aluminum–copper [19], andaluminum–steel [10,20]. Moreover, previous investigations stated that FSSW had beenemployed for various steels such as high-strength [21], advanced high-strength [22], andultrahigh-strength steels [23]. Moreover, the steels comprising mixture structures of ferriteand martensite are termed dual-phase (DP) steel. These DP steels are actually a kindof low-carbon steel consisting of ferrite and martensite microstructures. DP steels havecaptured particular interest due to their good combination of high strength, ductility, andweldability of these alloys and have been used widely for over the past few years in theautomotive industry [24]. Some methods are used to improve the mechanical propertiesof DP steels: one of them is adding alloying elements into the DP steels to modify theirmicrostructure. However, as a result of the addition of the alloying elements at a highpercentage, it may cause the DP steel to become more prone to cracking during the weldingprocess [25]. Many attempts have been carried out to join steel sheets of interstitial-free (IF)and dual-phase (DP) steel sheets by FSSW with a convex shoulder tool. Two different com-binations were used: one with IF as the top sheet (IF/DP) and another with DP as the topsheet (DP/IF) [26]. Turning to copper [27] and its alloys [28], they have been widely used inmany engineering applications due copper’s excellent electrical and thermal conductivities,superior corrosion resistance, and good strength and ductility. More importantly, conven-tional fusion welding processes cannot be undertaken to manufacture copper joints sincethey demonstrate high thermal diffusivity, which is approximately 10–100 times highercompared with nickel alloys and most steels [29]. Meran [30] reported that copper andcopper alloys have been successfully manufactured via the FSW method. Gao et al. [31]investigated the properties of dissimilar lap joints of commercial brass (CuZn40) to plaincarbon steel (S25C) by considering the welding speed effect using the FSW method. Theresults showed that the grain size, hardness at the stirred zone, and tensile shear fractureload of the joints were significantly changed when the welding speed were varied. Withrespect to brass (Cu–Zn alloy), it demonstrates high strength, plasticity, high hardness, andgood corrosion resistance, which makes brass suitable to be used as structural materials inmany industrial applications [32]. Nevertheless, it is very difficult to clad brass to steel byfusion welding because of the strength loss in the fusion zone due to the evaporation of Zn,as well as the large differences in the thermal physical properties between brass and steel,such as melting point, thermal conductivity, and thermal expansion coefficient [31]. Tohandle this problem, friction welding as a solid-state welding process has been employedin recent years. Luo et al. [33] used the CT-130-type special inertia friction welding machineto finish the H90 brass/high carbon steel dissimilar metals radial friction welding process,and Kimura et al. [34] achieved the brass/low-carbon steel dissimilar metal welding byfriction welding. However, the friction welding has a large limitation in the shape of thejoint, which should be a body of rotation such as a pipe and a rod-type joint. In addition,yellow brass (Cu/Zn 63/37) has an excellent capacity for cold working and tin coating byhot dipping; moreover, brass CuZn37 has excellent cold working properties [35]. Mostbrasses are not normally ranked as heat-treatable; some brasses are cast or hot-workedin the duplex α/β state and then annealed at about 450 ◦C to convert the microstructureinto a single phase of better resistance to corrosion [35]. Due to the relative high tempera-ture associated with FSSW of brass, recrystallization accompanied with microsegregation

Materials 2022, 15, 1394 3 of 24
leading to separation of β-phase takes place [31], which leads to some softening. Thisbehavior could be avoided either by applying proper stirring speed [31] or by postweldheat treatment [34].
There are some research works on the friction stir spot welding of similar and dissimi-lar metals and alloys [36–39]. However, limited reports are found on the friction stir spotwelding of low-carbon steel and brass, which is important for the use of joints. Based onthe above reasons, it is interesting to study the manufacturing of low-carbon steel and brassas a lap joint by FSSW method. The aim of this study is to investigate the effective rangeof FSSW combinations of parameters of rotational speed and dwell time to obtain a highload-carrying capacity of dissimilar steel A283M-C/brass CuZn40 sheet FSSW joints. Theexamined rotational speed are 1000, 1250, and 1500 rpm, and the applied dwell times are 5,10, 20, and 30 s. The resulting load-carrying capacity of the joints are measured and judgedby the resulting heat generated and temperature raise at the joint during the FSSW process.Moreover, the cohesion quality of the joints is examined by the metallographic examinationand EDS analysis. Normalized process parameters will be determined to function in theselection of the effective range of conditions for further FSSW processes.
2. Methodology2.1. Materials
The FSSW was carried out on lap joints of the brass (CuZn40) and low-carbon steel.CuZn40 brass samples were cut from cold-rolled sheet of 1 mm thickness produced byWieland Company, Ulm, Germany. The low-carbon steel (St 44-2) sheet was produced anddelivered by Ezz Dekheila Steel (EZDK) Company, Alexandria, Egypt, in the form of 2 mmthick sheets. The chemical composition of the used low-carbon steel and brass have beenanalyzed using Foundry-Master pro, Oxford Instruments, Abingdon, UK. The steel gradeis equivalent to A283M grade C according to ASTM A283M-18 [40]. Preparing for the FSSWlap joints, the starting copper and steel sheets were cut into plates of the width of 100 mmand length of 200 mm. The chemical composition of both starting materials is listed inTable 1. The mechanical properties that were obtained according to ASTM E8/E8M-21 [41]are also included in Table 2.
Table 1. The chemical composition of low-carbon steel (St 44-2) and brass (CuZn40) sheets (in Wt.%).
Element(Wt. %) C Si Mn P S Cr Ni V Nb Cu Zn Pb
St 44-2 0.052 0.034 0.875 0.01 0.003 0.017 0.05 0.036 0.026 0.03 - 0.005CuZn40 - 0.002 0.005 0.007 - - - - - 61.3 38.6 0.025
Table 2. The mechanical properties of the starting sheet materials: low-carbon steel (steel 44-2) andbrass (CuZn40).
MaterialProperties
Yield Stressσy (MPa)
Tensile Strengthσuts (MPa)
Fracture StrainεFr (%)
HardnessHV
Steel 44-2 461 525 19.4 223 ± 2.4CuZn40 250 434 40 128 ± 2.3
For microstructure investigation, the brass and steel samples were separately mechani-cally ground up to the final stage of SiC grit of 2400. (i) Brass was primarily polished usinga solution of the following mixture: 260 mL oxide (Al2O3) suspension with file aluminaparticle (0.05 µm), 0.5 mL HF, 1 mL HNO3, and 40 mL H2O2. (ii) The samples were finallyetched during the final polishing stage using Klemm III and potassium disulfide. Thespecimens were polished and etched as in steps (i) and (ii) for two or three times, until ascratch-free surface and the microstructure were revealed. Steel was etched after polishing

Materials 2022, 15, 1394 4 of 24
in Nital 2% for 5 s. The microstructure of the starting brass and low-carbon steel is shownin Figure 1a,b, respectively. From the binary Cu–Zn system, brass with copper contentless than about 63 wt.% is composed of a single α-phase [42]. With increasing the zinccontent, more than 37 wt.% β-phase starts to appear. In the current study, brass with littledispersed β-phase can be distinguished due to the cold deformation of the alloy, as shownFigure 2a. Figure 2b shows the microstructure of the low-carbon steel used in this study. Ascan be seen from this micrograph, the microstructures are composed mainly of relativelylarge ferritic grains, while some smaller pearlite grains or dispersed pearlitic islands at theferritic triple points of ferrite grains in small portions are spread across the whole area.
Materials 2022, 15, x FOR PEER REVIEW 4 of 26
alumina particle (0.05 µm), 0.5 mL HF, 1 mL HNO3, and 40 mL H2O2. (ii) The samples were finally etched during the final polishing stage using Klemm III and potassium disul-fide. The specimens were polished and etched as in steps (i) and (ii) for two or three times, until a scratch-free surface and the microstructure were revealed. Steel was etched after polishing in Nital 2% for 5 s. The microstructure of the starting brass and low-carbon steel is shown in Figure 1a,b, respectively. From the binary Cu–Zn system, brass with copper content less than about 63 wt.% is composed of a single α-phase [42]. With increasing the zinc content, more than 37 wt.% β-phase starts to appear. In the current study, brass with little dispersed β-phase can be distinguished due to the cold deformation of the alloy, as shown Figure 2a. Figure 2b shows the microstructure of the low-carbon steel used in this study. As can be seen from this micrograph, the microstructures are composed mainly of relatively large ferritic grains, while some smaller pearlite grains or dispersed pearlitic islands at the ferritic triple points of ferrite grains in small portions are spread across the whole area.
Figure 1. Optical microstructure of base materials used in this study. (a) Microstructure of brass (CuZn40) and (b) microstructure of low-carbon steel (steel 44).
2.2. Friction Stir Spot Welding (FSSW)
The difficulty in fusion welding of the dissimilar metallic alloys, especially those are far different in their physical and mechanical properties, comes from the selection of the filler material that can match both alloys and also the high heat input that can severely deteriorate the properties of the welded area. Thus, the use of the solid state welding pro-cess can the best alternative to overcome these limitations.
In this study, steel and brass sheets were cut into the dimensions of 100 mm × 200 mm. For the FSSW lap joint, the steel sheet was used as the lower sheet, and the brass sheet was used as the top sheet with an overlap of 40 mm. A fixture plate with rectangular slots of 30 mm × 30 mm slots was used to clamp the sheet and to support and stabilize the
Figure 1. Optical microstructure of base materials used in this study. (a) Microstructure of brass(CuZn40) and (b) microstructure of low-carbon steel (steel 44).
2.2. Friction Stir Spot Welding (FSSW)
The difficulty in fusion welding of the dissimilar metallic alloys, especially those arefar different in their physical and mechanical properties, comes from the selection of thefiller material that can match both alloys and also the high heat input that can severelydeteriorate the properties of the welded area. Thus, the use of the solid state weldingprocess can the best alternative to overcome these limitations.
In this study, steel and brass sheets were cut into the dimensions of 100 mm × 200 mm.For the FSSW lap joint, the steel sheet was used as the lower sheet, and the brass sheetwas used as the top sheet with an overlap of 40 mm. A fixture plate with rectangular slots

Materials 2022, 15, 1394 5 of 24
of 30 mm × 30 mm slots was used to clamp the sheet and to support and stabilize thesheets during FSSW. Figure 2a shows the arrangement of the FSSW process, and the fixtureplate is shown in Figure 2b. FSSW joints were conducted using a home-manufacturedFSW machine with main specifications of load of 100 kN, Torque of 140 Nm, and rotationspeed up to 3000 rpm existing in the FSW lab at Suez University, Egypt. FSSW tools madefrom tungsten carbide (WC) with a cylindrical probe (length: 0.9 mm, diameter: 8.2 mm)and shoulder diameter of 20 mm were used. There are many design considerations formanufacturing of FSW and FSSW tools [43–45]. However, the tool material was selectedbased on the tool material required for welding high-melting-point materials, as the workdeals with both steel and copper alloys. Furthermore, a simple cylindrical tapered geometrydesign was used, as the preparation of complex features in the WC is quite difficult, and itwill wear away very quickly.
Materials 2022, 15, x FOR PEER REVIEW 5 of 26
sheets during FSSW. Figure 2a shows the arrangement of the FSSW process, and the fix-ture plate is shown in Figure 2b. FSSW joints were conducted using a home-manufactured FSW machine with main specifications of load of 100 kN, Torque of 140 Nm, and rotation speed up to 3000 rpm existing in the FSW lab at Suez University, Egypt. FSSW tools made from tungsten carbide (WC) with a cylindrical probe (length: 0.9 mm, diameter: 8.2 mm) and shoulder diameter of 20 mm were used. There are many design considerations for manufacturing of FSW and FSSW tools [43–45]. However, the tool material was selected based on the tool material required for welding high-melting-point materials, as the work deals with both steel and copper alloys. Furthermore, a simple cylindrical tapered geom-etry design was used, as the preparation of complex features in the WC is quite difficult, and it will wear away very quickly.
Figure 2.c shows a graphical representation of the applied FSSW tool. The WC tool was fixed in a tool steel holder that made from H13 tool steel. After the welding process, the welded sheets were cut for further characterization.
Figure 2. (a) FSSW process arrangement, (b) fixture plate supporting the sheets of spot joints, (c) graphical representation of the used FSSW tool arrangement, and (d) temperature measurement during FSSW (all dimensions in mm).
Figure 2. (a) FSSW process arrangement, (b) fixture plate supporting the sheets of spot joints,(c) graphical representation of the used FSSW tool arrangement, and (d) temperature measurementduring FSSW (all dimensions in mm).

Materials 2022, 15, 1394 6 of 24
Figure 2.c shows a graphical representation of the applied FSSW tool. The WC toolwas fixed in a tool steel holder that made from H13 tool steel. After the welding process,the welded sheets were cut for further characterization.
The FSSW joints were conducted at different rotation speeds of 1000, 1250, and1500 rpm at a constant plunge rate of 0.1 mm/s, zero tilt angle, and distance controlledmode. The applied vertical load during welding was ranging between 11 to 14 kN. Thetemperature near to the stir zone was measured for FSSW experiments covering the appliednumber of rotations (83, 167, 250, 333, 500 R). A Modern Digital Multimeter (MDM) modelUT61B, Zhejiang, China with thermocouple type “K” was used to measure the temperature.The thermocouple was inserted between the brass and steel sheets (as shown in Figure 2d),and the temperature values were recorded and plotted as a function of the time.
2.3. FSSW lap Joints Evaluation
The starting sheets of copper and steel were cut into 100 mm × 200 mm. Copper wasplaced over steel with an overlap area of 40 mm × 200 mm. After welding, the wholedimensions of welded pair of materials were 160 mm × 200 mm, and it was cut intoindividual samples for investigations perpendicular to the length (200 mm); each is 30 mmin width and containing one spot, as shown in Figure 3.
Materials 2022, 15, x FOR PEER REVIEW 6 of 26
The FSSW joints were conducted at different rotation speeds of 1000, 1250, and 1500 rpm at a constant plunge rate of 0.1 mm/s, zero tilt angle, and distance controlled mode. The applied vertical load during welding was ranging between 11 to 14 kN. The temper-ature near to the stir zone was measured for FSSW experiments covering the applied num-ber of rotations (83, 167, 250, 333, 500 R). A Modern Digital Multimeter (MDM) model UT61B, Zhejiang, China with thermocouple type “K” was used to measure the tempera-ture. The thermocouple was inserted between the brass and steel sheets (as shown in Fig-ure 2d), and the temperature values were recorded and plotted as a function of the time.
2.3. FSSW lap Joints Evaluation
The starting sheets of copper and steel were cut into 100 mm × 200 mm. Copper was placed over steel with an overlap area of 40 mm × 200 mm. After welding, the whole di-mensions of welded pair of materials were 160 mm × 200 mm, and it was cut into individ-ual samples for investigations perpendicular to the length (200 mm); each is 30 mm in width and containing one spot, as shown in Figure 3.
Lap shear tensile test was carried out on the FSSW joints with configuration of the sample, as shown in Figure 3, to measure the load-carrying capacity of the joints. The tensile test samples for the FSSW joints are of the width of 30 mm and a total length of 160 mm, with an overlap length of 40 mm, which are the same dimensions of the original welded plates. To ensure the axial loading of the test specimen, two packing pieces (30 mm × 30 mm) were adhesively joined on the weld specimens, as shown in Figure 3[46]. A universal tensile testing machine, type Instron model 4210, (Norwood, MA, USA was used at crosshead speed of 0.05 mm/s. The load cells of the FSW and the tensile testing machine are calibrated by a specialized company; the same was performed periodically for the dis-placement measuring units.
The transverse cross section of the spot joints was investigated through macrographs and hardness measurements on a diagonal line through the joined materials. Low-load Vickers hardness tester HWDV-75, TTS Unlimited, Osaka, Japan was used with an inden-tation interspacing distance of 2 mm using a test load of 10 N and a dwell time of 15 s.
Figure 3. FSSW tensile shear test specimen with two backing plates to ensure axial loading of the specimens during the tensile shear test.
FEI Quanta FEG 250 Field Emission Gun Scanning Electron Microscope (FEGSEM), FEI company (Hillsboro, OR, USA), equipped with EDAX-OIM7 and controlled by TEAM software was used for microstructure investigation and elemental analysis of the joints. EDS line and point elemental analysis was carried out using a scan step size of 0.5 µm.
3. Results and Discussion
Many FSSW conditions were examined to explore the effect of the different parame-ters on developing high-quality dissimilar lap joints between brass (CuZn40) and low-carbon steel (St 44-2).
3.1. Heat Input in the FSSW Process
Figure 3. FSSW tensile shear test specimen with two backing plates to ensure axial loading of thespecimens during the tensile shear test.
Lap shear tensile test was carried out on the FSSW joints with configuration of thesample, as shown in Figure 3, to measure the load-carrying capacity of the joints. Thetensile test samples for the FSSW joints are of the width of 30 mm and a total lengthof 160 mm, with an overlap length of 40 mm, which are the same dimensions of theoriginal welded plates. To ensure the axial loading of the test specimen, two packing pieces(30 mm × 30 mm) were adhesively joined on the weld specimens, as shown in Figure 3 [46].A universal tensile testing machine, type Instron model 4210, (Norwood, MA, USA wasused at crosshead speed of 0.05 mm/s. The load cells of the FSW and the tensile testingmachine are calibrated by a specialized company; the same was performed periodically forthe displacement measuring units.
The transverse cross section of the spot joints was investigated through macrographsand hardness measurements on a diagonal line through the joined materials. Low-loadVickers hardness tester HWDV-75, TTS Unlimited, Osaka, Japan was used with an in-dentation interspacing distance of 2 mm using a test load of 10 N and a dwell timeof 15 s.
FEI Quanta FEG 250 Field Emission Gun Scanning Electron Microscope (FEGSEM),FEI company (Hillsboro, OR, USA), equipped with EDAX-OIM7 and controlled by TEAMsoftware was used for microstructure investigation and elemental analysis of the joints.EDS line and point elemental analysis was carried out using a scan step size of 0.5 µm.

Materials 2022, 15, 1394 7 of 24
3. Results and Discussion
Many FSSW conditions were examined to explore the effect of the different parameterson developing high-quality dissimilar lap joints between brass (CuZn40) and low-carbonsteel (St 44-2).
3.1. Heat Input in the FSSW Process
To determine the effect of the different welding parameters, the number of parametershas been reduced by combining the rotational speed (rpm) and the dwell time (s) into thenumber revolutions per joint as follows:
Total number of revolutions (R) = Tool rotation speed per second × dwell time (s)
Now, the rotational speed and the dwell time are reduced into one parameter, namely,the number of revolutions per spot (R). Moreover, the vertical load which represents thedownward force (applied pressure) by the tool will be used to calculate the heat input inthe welding process. Considering the friction force between the tool (pin surfaces and thepin shoulder) and considering an average friction coefficient (µ) equal to 0.5 [47–49] andusing the applied vertical force (F), the rotational speed (ω) and the heat input (Q) arecalculated as follows [50]:
Q =1312µ
FKA
ω rp (1)
where rp is the tool pin radius which equal to 4.1 mm and KA is the value of shouldercontact surface area (AC) divided by the total shoulder surface area (A) [50], which can becalculated as follows:
KA =AC
A=π(
r2s − r2
p
)πr2
s=
(102 − 4.12)
102 = 0.8319 (2)
where rs is the tool shoulder radius and rp is the tool pin radius.Basically, the angular speed ω(rad/min) = 2πN (rpm) can be expressed in (rad/s)
as follows:ω(rad/s) =
2π60
N(rps) (3)
We can substitute the values of Equations (2) and (3) into Equation (1) and rewriteEquation (1) as follows:
Q(J/s) =1312
∗ 0.5∗ F0.8319
2π60
∗0.0041(Nm/s) (4)
Simply, heat input in the current case can be calculated as:
Q (kJ/s) = 2.794 ∗ 10−7 ω (rad/s) ∗ F (N) (5)
Equation (5) is valid and used for friction spot welding when multiplied by the lineartravel speed. However, in FSSW, there is no travel speed but rotation in the same positionfor a dwell time, so that multiplying Q with dwell time Dt (in s) gives the total generatedheat (E) per spot weld, as described by Equation (6).
E = Q ∗ Dt (kJ) (6)
Figure 4 shows the effect of the total number of revolutions on the heat generated perspot weld. This figure shows the effect of the number of rotations as the key parameterin the heat generation upon FSSW process. Clearly it can be observed that increasing thenumber of rotations increases the heat input per spot. This will significantly affect the jointsquality and microstructure. The heat input ranges from 11 kJ to 1.5 kJ based on the numberof revolutions per spot.

Materials 2022, 15, 1394 8 of 24
Materials 2022, 15, x FOR PEER REVIEW 9 of 26
Figure 4. Linear fitting of the total heat input per spot weld as a function of the number of rotations on FSSW of low-carbon steel/brass (CuZn40) joints.
Temperature was measured during the FSSW process for different experiments cov-ering the applied number of revolutions range (83 to 500R) using different combinations of revolutions per minutes and dwell times. Figure 5 includes the curves of the measured temperature during the FSSW for some experiments. It is clear that the controlling param-eter for heat input or temperature rise is not only the number of revolutions per spot but also the speed of the revolution. Practicing 500 revolutions within 20 s using a speed 1500 rpm is more effective than practicing the same number of revolutions in a time of 30 s using 1000 rpm. The first condition (1500 rpm, 20 s) raised the temperature to 583 °C, and a long time was needed to cool again, while a temperature of 535 °C was reached at the second condition (1000 rpm, 30 s). Comparing the experiments carried at the same speed of 1000 rpm for different dwell times of 5, 10, 20, and 30 s, it is obvious that the short dwell time is effective to raise the FSSW temperature, whereas the long dwell time is needed to generate heat at a rate higher than the heat dissipation rate through the different metallic units adjacent to the FSSW nuggets: base materials, jig plate, clamping units, FSSW tool, and the machine table. At 1000 rpm, the maximum attained temperature is 535 °C after 30 s; the maximum temperature falls to 323 °C at the shortest dwell time of 5 s (see Figure 5 and Table 4).
0
2
4
6
8
10
12
0 100 200 300 400 500 600
y = 0.0226 R – 0.194
r2=0.981
No. of revolutions [ R ]
Hea
t in
put
[kJ]
Figure 4. Linear fitting of the total heat input per spot weld as a function of the number of rotationson FSSW of low-carbon steel/brass (CuZn40) joints.
Table 3 gives the calculated heat input at the different FSSW conditions, and Figure 4shows the heat input against the number of revolutions. In Figure 4, the average total heatinput has been well linear fitted with the total number of revolutions (R) per spot weldwith a high coefficient of determination (r2 = 0.981). The linear equation describing therelation of the total generated heat per spot and the number of rotations is:
Heat (kJ) = 0.0226 R − 0.194 (7)
Temperature was measured during the FSSW process for different experiments cov-ering the applied number of revolutions range (83 to 500R) using different combinationsof revolutions per minutes and dwell times. Figure 5 includes the curves of the measuredtemperature during the FSSW for some experiments. It is clear that the controlling pa-rameter for heat input or temperature rise is not only the number of revolutions per spotbut also the speed of the revolution. Practicing 500 revolutions within 20 s using a speed1500 rpm is more effective than practicing the same number of revolutions in a time of 30 susing 1000 rpm. The first condition (1500 rpm, 20 s) raised the temperature to 583 ◦C, anda long time was needed to cool again, while a temperature of 535 ◦C was reached at thesecond condition (1000 rpm, 30 s). Comparing the experiments carried at the same speedof 1000 rpm for different dwell times of 5, 10, 20, and 30 s, it is obvious that the short dwelltime is effective to raise the FSSW temperature, whereas the long dwell time is needed togenerate heat at a rate higher than the heat dissipation rate through the different metallicunits adjacent to the FSSW nuggets: base materials, jig plate, clamping units, FSSW tool,and the machine table. At 1000 rpm, the maximum attained temperature is 535 ◦C after30 s; the maximum temperature falls to 323 ◦C at the shortest dwell time of 5 s (see Figure 5and Table 4).
In Table 4, the maximum measured temperatures are listed for some FSSW experiments.Considering the melting of low-carbon steel (St 44-2) as 1539 ◦C and that for brass (CuZn40)as 900 ◦C [42], the relative absolute temperatures (T/Tm) were calculated to show how farapart are the different welding temperatures from the recrystallization temperatures of the

Materials 2022, 15, 1394 9 of 24
welded materials. It is obvious that the attained temperature during FSSW lies within therecrystallization temperature range of brass, while it is only at the boundaries or lowerthan the recrystallization temperature of steel.
Table 3. Welding conditions, the generated heat input, and the tensile lap shear maximum forcecarried by the joint.
Max. TensileEnergy Power
No. of Machine Dwell Rotation Joint
Load Rotations Load Time Speed Numbering
(kN) (kJ) (kJ/s) (R) (kN) (s) (rpm)
2.7 1.7 0.34 83 11.7 5 1000 13 1.6 0.32 83 10.96 5 1000 2
– * 1.6 0.31 83 10.7 5 1000 3– 1.5 0.31 83 10.5 5 1000 4– 2.5 0.51 104 13.8 5 1250 5– 2.1 0.43 104 11.7 5 1250 6
1.3 ** 3 0.6 125 13.6 5 1500 7– 2.9 0.6 125 13 5 1500 8
3.6 3.3 0.33 167 11.4 10 1000 93.3 3.7 0.37 167 12.8 10 1000 10– 3.2 0.32 167 11.1 10 1000 116 2.5 0.25 167 8.6 10 1000 12
4.9 3.2 0.32 167 10.7 10 1000 13– 3.1 0.31 167 10.5 10 1000 144 3.4 0.34 167 11.6 10 1000 15
1.5 3.6 0.36 167 12.4 10 1000 16– 3.7 0.37 167 12.5 10 1000 17
2.4 4.8 0.48 208 13.1 10 1250 18– 5 0.5 208 13.8 10 1250 19
3.2 5.1 0.51 250 11.6 10 1500 205.2 6 0.6 250 13.7 10 1500 212 6 0.6 250 13.8 10 1500 22
3.8 NA NA 250 NA 10 1500 231.6 NA NA 250 NA 10 1500 247.5 NA NA 250 NA 10 1500 257.1 NA NA 250 NA 10 1500 266.3 NA NA 250 NA 10 1500 277.5 7.8 0.39 333 1.3 20 1000 287.5 7.5 0.37 333 12.8 20 1000 29– 7.8 0.4 333 13.3 20 1000 30
6.4 11.2 0.37 500 12.8 30 1000 315.4 10.8 0.36 500 12.3 30 1000 32– 10.5 0.35 500 12 30 1000 33
* The joints that show “–” in the “Max. tensile load” have been consumed in investigations other than tensile testsuch as hardness testing and macro- and microstructure investigation. ** FSSW joints with a maximum load lowerthan 2 kN have been considered as failed joints.
Table 4. Measured temperature during brass/steel FSSW experiments related to the absolute meltingtemperature of the base materials.
Rotation Speed,(rpm)
Time(s)
No. of Rotations,(R)
Maximum Temperature,(◦C) T/Tm (Steel) T/Tm (Brass)
1500 20 500 583 0.47 0.731000 30 500 535 0.45 0.691000 20 333 472 0.41 0.641500 10 250 420 0.38 0.591000 10 167 363 0.35 0.541000 5 83 323 0.33 0.51

Materials 2022, 15, 1394 10 of 24Materials 2022, 15, x FOR PEER REVIEW 10 of 26
Figure 5. Temperature measured during some FSSW of low-carbon steel/brass joints.
In Table 4, the maximum measured temperatures are listed for some FSSW experi-ments. Considering the melting of low-carbon steel (St 44-2) as 1539 °C and that for brass (CuZn40) as 900 °C [42], the relative absolute temperatures (T/Tm) were calculated to show how far apart are the different welding temperatures from the recrystallization tempera-tures of the welded materials. It is obvious that the attained temperature during FSSW lies within the recrystallization temperature range of brass, while it is only at the boundaries or lower than the recrystallization temperature of steel.
Table 4. Measured temperature during brass/steel FSSW experiments related to the absolute melt-ing temperature of the base materials.
Rotation Speed,
(rpm)
Time
(s)
No. of Rota-
tions,
(R)
Maximum Tempera-
ture,
(°C)
T/Tm (Steel) T/Tm (Brass)
1500 20 500 583 0.47 0.73 1000 30 500 535 0.45 0.69 1000 20 333 472 0.41 0.64 1500 10 250 420 0.38 0.59 1000 10 167 363 0.35 0.54 1000 5 83 323 0.33 0.51
3.2. Joint Quality and Macroscopic Investigation
Some samples were macroscopically investigated by a cut through the spot zone. The cut samples were molded to be easily handled during the metallographic preparation pro-cess. Due to the stirring occurred by the welding tool pin, a so-called keyhole is generated. Usually, this keyhole reaches the lower sheet of the joint, and the materials of the upper sheet are softened, pressed, and extruded to flow under the tool shoulder. With the ap-plied force from the machine, the tool shoulder continues pressing the material removed by the pin, causing further extrusion of the softened brass to make it flow around the tool shoulder, producing a flash-like extruded brass, as shown in Figure 6.
0
200
400
600
0 20 40 60 80 100
500 R (1500 / 20 )
500 R (1000 / 30)
333 R (1000 / 20)
250 R (1500 / 10)
167 R (1000 / 10)
83 R (1000 / 5 )
stiring start
No. of revol. (rpm / time, s)
Time [ s ]
Tem
per
atu
re [
°C
]
Figure 5. Temperature measured during some FSSW of low-carbon steel/brass joints.
3.2. Joint Quality and Macroscopic Investigation
Some samples were macroscopically investigated by a cut through the spot zone. Thecut samples were molded to be easily handled during the metallographic preparationprocess. Due to the stirring occurred by the welding tool pin, a so-called keyhole isgenerated. Usually, this keyhole reaches the lower sheet of the joint, and the materialsof the upper sheet are softened, pressed, and extruded to flow under the tool shoulder.With the applied force from the machine, the tool shoulder continues pressing the materialremoved by the pin, causing further extrusion of the softened brass to make it flow aroundthe tool shoulder, producing a flash-like extruded brass, as shown in Figure 6.
Materials 2022, 15, x FOR PEER REVIEW 11 of 26
Depending on the extent of the dwell time and the rotational speed, the tool pin may further press the underlying sheet (steel), causing little extrusion and producing a slight steel ring. Figure 6 also indicates that there is good cohesion between the brass and the undelaying steel sheet at the stirred region beneath the tool shoulder. This cohesion region is generated mainly by the heat generated from the friction process and the pressure prac-ticed by the tool shoulder on the brass.
Figure 6. Macro image of an FSSW steel/brass joint showing the different zones using a total of 167 revolutions (rpm = 1000 and dwell time = 10 s).
Figure 7 includes macroscopic images showing a comparison of the FSSW joint form at different welding conditions. Figure 7a shows the joint form at a low number of rota-tions (83 R) where the keyhole is still not well-formed. With increasing the number of rotations to 167 R, the weld nugget seems uniform around the keyhole (as shown in Figure 7b). Repeating the previous conditions while increasing the nominal downward displace-ment from 1.4 to 1.8 mm makes the keyhole deeper (Figure 7c) with more steel extrusion to the sides of the keyhole, and the cohesion of brass to steel appears with a lower area around the keyhole. Increasing the number of revolutions per spot to 333 and 500 in-creases the quality and the area of cohesion of brass to steel, as shown in Figure 7d,e, respectively. This is mainly due to the increased heat input for these two conditions, as shown in Figure 4 and Table 3.
Figure 7. Macro images of FSSW steel/brass joints at different revolutions (R): (a) 83 R; (b) 167 R (penetration = 1.4 mm); (c) 167 R (1.8 mm); (d) 333 R; and (e) 500 R.
Figure 6. Macro image of an FSSW steel/brass joint showing the different zones using a total of167 revolutions (rpm = 1000 and dwell time = 10 s).
Depending on the extent of the dwell time and the rotational speed, the tool pinmay further press the underlying sheet (steel), causing little extrusion and producing aslight steel ring. Figure 6 also indicates that there is good cohesion between the brass andthe undelaying steel sheet at the stirred region beneath the tool shoulder. This cohesionregion is generated mainly by the heat generated from the friction process and the pressurepracticed by the tool shoulder on the brass.
Figure 7 includes macroscopic images showing a comparison of the FSSW joint format different welding conditions. Figure 7a shows the joint form at a low number of rotations(83 R) where the keyhole is still not well-formed. With increasing the number of rotations

Materials 2022, 15, 1394 11 of 24
to 167 R, the weld nugget seems uniform around the keyhole (as shown in Figure 7b).Repeating the previous conditions while increasing the nominal downward displacementfrom 1.4 to 1.8 mm makes the keyhole deeper (Figure 7c) with more steel extrusion to thesides of the keyhole, and the cohesion of brass to steel appears with a lower area aroundthe keyhole. Increasing the number of revolutions per spot to 333 and 500 increases thequality and the area of cohesion of brass to steel, as shown in Figure 7d,e, respectively. Thisis mainly due to the increased heat input for these two conditions, as shown in Figure 4and Table 3.
Materials 2022, 15, x FOR PEER REVIEW 11 of 26
Depending on the extent of the dwell time and the rotational speed, the tool pin may further press the underlying sheet (steel), causing little extrusion and producing a slight steel ring. Figure 6 also indicates that there is good cohesion between the brass and the undelaying steel sheet at the stirred region beneath the tool shoulder. This cohesion region is generated mainly by the heat generated from the friction process and the pressure prac-ticed by the tool shoulder on the brass.
Figure 6. Macro image of an FSSW steel/brass joint showing the different zones using a total of 167 revolutions (rpm = 1000 and dwell time = 10 s).
Figure 7 includes macroscopic images showing a comparison of the FSSW joint form at different welding conditions. Figure 7a shows the joint form at a low number of rota-tions (83 R) where the keyhole is still not well-formed. With increasing the number of rotations to 167 R, the weld nugget seems uniform around the keyhole (as shown in Figure 7b). Repeating the previous conditions while increasing the nominal downward displace-ment from 1.4 to 1.8 mm makes the keyhole deeper (Figure 7c) with more steel extrusion to the sides of the keyhole, and the cohesion of brass to steel appears with a lower area around the keyhole. Increasing the number of revolutions per spot to 333 and 500 in-creases the quality and the area of cohesion of brass to steel, as shown in Figure 7d,e, respectively. This is mainly due to the increased heat input for these two conditions, as shown in Figure 4 and Table 3.
Figure 7. Macro images of FSSW steel/brass joints at different revolutions (R): (a) 83 R; (b) 167 R (penetration = 1.4 mm); (c) 167 R (1.8 mm); (d) 333 R; and (e) 500 R.
Figure 7. Macro images of FSSW steel/brass joints at different revolutions (R): (a) 83 R; (b) 167 R(penetration = 1.4 mm); (c) 167 R (1.8 mm); (d) 333 R; and (e) 500 R.
3.3. Tensile Lap Shear Test Results
Tensile lap shear tests (TLST) were conducted on the FSSWed samples to evaluate theload-carrying capacity of the joints. The TLST results are presented in the load-displacementcurves as shown in Figure 8. Figure 9 illustrates the fracture surface of lower surface ofupper brass sheet and the upper surface of the lower steel sheet after the tensile test of thespot joints given in Figure 8. The lap shear tensile curves of the joints welded with the samerotation speed (1000 rpm) and different dwell times (5, 10, 20, and 30 s), which produced adifferent number of rotations per spot (from 83 to 500 revolutions), are shown in Figure 8a.This figure shows a variation of the tensile strength of the joint with the variation of thenumber of revolutions per spot. At the lower number of revolutions (83–167 R; Figure 9a–h),the displacement and the maximum force seem lower than that at the higher number ofrevolutions (333 and 500; Figure 9i–l) per spot. This is due to the improved joint quality interms of good cohesion of brass on steel with the effect of increased total heat input perspot. The highest reached maximum tensile force at a rotational speed of 1000 rpm and thetotal number of rotations of 333 was 7.51 kN.

Materials 2022, 15, 1394 12 of 24
Materials 2022, 15, x FOR PEER REVIEW 12 of 26
3.3. Tensile Lap Shear Test Results
Tensile lap shear tests (TLST) were conducted on the FSSWed samples to evaluate the load-carrying capacity of the joints. The TLST results are presented in the load-dis-placement curves as shown in Figure 8. Figure 9 illustrates the fracture surface of lower surface of upper brass sheet and the upper surface of the lower steel sheet after the tensile test of the spot joints given in Figure 8. The lap shear tensile curves of the joints welded with the same rotation speed (1000 rpm) and different dwell times (5, 10, 20, and 30 s), which produced a different number of rotations per spot (from 83 to 500 revolutions), are shown in Figure 8a. This figure shows a variation of the tensile strength of the joint with the variation of the number of revolutions per spot. At the lower number of revolutions (83–167 R; Figure 9a–h), the displacement and the maximum force seem lower than that at the higher number of revolutions (333 and 500; Figure 9i–l) per spot. This is due to the improved joint quality in terms of good cohesion of brass on steel with the effect of in-creased total heat input per spot. The highest reached maximum tensile force at a rota-tional speed of 1000 rpm and the total number of rotations of 333 was 7.51 kN.
The FSSW of brass/steel welded at 250 R (1500 rpm and 10 s) is not reproducible as detected and represented in Figure 8b, where all displayed curves are for the same weld-ing condition, and the resulting tensile data are very different. However, the maximum tensile force of 7.52 kN was attained at a rotation speed of 1500 rpm, or the total number of rotations per spot of 250. It can also be noticed from Figure 8a,b, that, with increased heat input (at the higher number of revolutions; 250, 333, and 500), the extent of displace-ment before fracture is higher than other conditions.
Figure 8. Load-displacement curves of joined samples at rotational speed of (a) at 1000 rpm and number of revolutions per spot (83, 167, 333, and 500 R) and (b) at 1500 rpm and 250 revolutions per spot.
0
2000
4000
6000
8000
0 1 2 3 4
( b )
1500 RPM
250 revol. per spot
Displacement [ mm ]
0
2000
4000
6000
8000
0 1 2 3 4
( a )
167
167
167
83
500
333
1000 RPM
Different revolutions
Displacement [ mm ]
Lo
ad
[
N ]
Figure 8. Load-displacement curves of joined samples at rotational speed of (a) at 1000 rpm andnumber of revolutions per spot (83, 167, 333, and 500 R) and (b) at 1500 rpm and 250 revolutionsper spot.
Materials 2022, 15, x FOR PEER REVIEW 13 of 26
Figure 9. Photo images of the dissimilar fracture surfaces of the lap shear tensile tested FSSW steel/brass joints produced at different numbers of revolutions (R); (a,b) at 83 R, (c–h) at 167 R, (i,j) at 333 R, (k,l) at 500 R, and (m,n) at 250 R.
Table 3 includes the maximum tensile load for the different tested samples. The av-erage of the maximum load carried by the joint is presented against the number of rota-tions per spot weld, as shown in Figure 10. It can be indicated that the maximum tensile increases with increasing the number of stirring rotations, which coincides with the high-est total heat input per spot (Table 3). It can be noticed that there is a considerable error bar, which is calculated by the standard deviation of the obtained results for the same conditions. This means that the quality described by the maximum carried load of the joints produced by this manufacturing process is still not identical for the same condition, but there is a general trend showing increased load-carrying capacity of the joint with increasing the total generated heat during the process, which can be achieved by increas-ing the number of rotations per spot at considerable revolution speed in the range from 1000 to 1500 rpm.
Figure 9. Photo images of the dissimilar fracture surfaces of the lap shear tensile tested FSSWsteel/brass joints produced at different numbers of revolutions (R); (a,b) at 83 R, (c–h) at 167 R, (i,j) at333 R, (k,l) at 500 R, and (m,n) at 250 R.

Materials 2022, 15, 1394 13 of 24
The FSSW of brass/steel welded at 250 R (1500 rpm and 10 s) is not reproducible asdetected and represented in Figure 8b, where all displayed curves are for the same weldingcondition, and the resulting tensile data are very different. However, the maximum tensileforce of 7.52 kN was attained at a rotation speed of 1500 rpm, or the total number ofrotations per spot of 250. It can also be noticed from Figure 8a,b, that, with increased heatinput (at the higher number of revolutions; 250, 333, and 500), the extent of displacementbefore fracture is higher than other conditions.
Table 3 includes the maximum tensile load for the different tested samples. Theaverage of the maximum load carried by the joint is presented against the number ofrotations per spot weld, as shown in Figure 10. It can be indicated that the maximumtensile increases with increasing the number of stirring rotations, which coincides with thehighest total heat input per spot (Table 3). It can be noticed that there is a considerableerror bar, which is calculated by the standard deviation of the obtained results for the sameconditions. This means that the quality described by the maximum carried load of thejoints produced by this manufacturing process is still not identical for the same condition,but there is a general trend showing increased load-carrying capacity of the joint withincreasing the total generated heat during the process, which can be achieved by increasingthe number of rotations per spot at considerable revolution speed in the range from 1000 to1500 rpm.
Materials 2022, 15, x FOR PEER REVIEW 14 of 26
Figure 10. Average maximum tensile load of the tensile lap shear test of FSSW steel/brass joints manufactured by different revolutions per spot weld.
To evaluate the success of such FSSW joints, the tensile shear results are compared with other works. According to the reported results by Abdullah and Hussein [51] for the FSSW of copper with carbon steel at plunge depths of 0.2 and 0.4 mm and different rota-tion speeds of 1120, 1400, and 1800 rpm, the tensile shear force of the welded joints was increased with an increase of the rotation speed and plunge depth, and the tensile shear force ranged between 510 N and 4.56 kN. The higher load-carrying capacities are attained mostly at a higher plunge depth using 1400 and 1800 rpm. The results from Figner et al. [52] show that FSSW of aluminum alloy AA5754 with galvanized steel using rotational speed ranging between 800 and 3200 rpm, dwell time range of 0 to 0.8 s, and plunge depth of 2.2 mm resulted in a maximum tensile lap shear force of 8.30 kN. However, the base materials of the joints of these results, or at least the softer component (aluminum alloy AA5754), have a higher strength than brass of the current work. The same can be men-tioned for the joints [53] of AA5083, which were welded with steel alloy at various FSSW parameters. The shear forces of the joints with a maximum value of 4.02 kN was attained. Moreover, much lower shear force (3.20 kN) has been recorded by Sun et al. [20] for FSSW joints of AA6061-T6 with mild steel, which was achieved at a rotational speed of 700 rpm and a dwell time of 2 s. Mubiayi et al. [54] studied FSSW of pure copper (C11000) with the soft aluminum alloy AA1060; the higher load-carrying capacities of 5.23 kN and 4.84 kN were obtained at rotational speeds of 800 and 1200 rpm, respectively. A plunge depth of 1 mm was used for these successful cases. The base materials used by Mubiayi et al. [54] were softer than the current study materials. Based on the previously mentioned results and conditions, it could be concluded that the current attained results are comparable or even better among the achieved results from FSSW works.
3.4. Hardness Results of FSSW Joints
Hardness measurements were carried out on the FSSW joint to explore the effect of stirring on the development of joint material strength. Figure 11 shows the hardness pro-files measured on the joint sheet at different stirring dwell times, which produced differ-ent numbers of revolutions per joint.
Figure 10. Average maximum tensile load of the tensile lap shear test of FSSW steel/brass jointsmanufactured by different revolutions per spot weld.
To evaluate the success of such FSSW joints, the tensile shear results are compared withother works. According to the reported results by Abdullah and Hussein [51] for the FSSWof copper with carbon steel at plunge depths of 0.2 and 0.4 mm and different rotation speedsof 1120, 1400, and 1800 rpm, the tensile shear force of the welded joints was increased withan increase of the rotation speed and plunge depth, and the tensile shear force ranged

Materials 2022, 15, 1394 14 of 24
between 510 N and 4.56 kN. The higher load-carrying capacities are attained mostly at ahigher plunge depth using 1400 and 1800 rpm. The results from Figner et al. [52] show thatFSSW of aluminum alloy AA5754 with galvanized steel using rotational speed rangingbetween 800 and 3200 rpm, dwell time range of 0 to 0.8 s, and plunge depth of 2.2 mmresulted in a maximum tensile lap shear force of 8.30 kN. However, the base materialsof the joints of these results, or at least the softer component (aluminum alloy AA5754),have a higher strength than brass of the current work. The same can be mentioned for thejoints [53] of AA5083, which were welded with steel alloy at various FSSW parameters.The shear forces of the joints with a maximum value of 4.02 kN was attained. Moreover,much lower shear force (3.20 kN) has been recorded by Sun et al. [20] for FSSW joints ofAA6061-T6 with mild steel, which was achieved at a rotational speed of 700 rpm and adwell time of 2 s. Mubiayi et al. [54] studied FSSW of pure copper (C11000) with the softaluminum alloy AA1060; the higher load-carrying capacities of 5.23 kN and 4.84 kN wereobtained at rotational speeds of 800 and 1200 rpm, respectively. A plunge depth of 1 mmwas used for these successful cases. The base materials used by Mubiayi et al. [54] weresofter than the current study materials. Based on the previously mentioned results andconditions, it could be concluded that the current attained results are comparable or evenbetter among the achieved results from FSSW works.
3.4. Hardness Results of FSSW Joints
Hardness measurements were carried out on the FSSW joint to explore the effect ofstirring on the development of joint material strength. Figure 11 shows the hardness profilesmeasured on the joint sheet at different stirring dwell times, which produced differentnumbers of revolutions per joint.
Materials 2022, 15, x FOR PEER REVIEW 15 of 26
FSW or FSSW of materials with melting points very far apart such as steel/brass does not produce completely mixed dissimilar materials at the joint regions. Even if cohesion takes place, no wide range mixing occurs: materials of the top and bottom sheet stay dis-tinguishable. Thus, hardness measurements were conducted on the welding regions of the two joined sheets individually. It seems that a small area of the steel sheet was affected, which is slightly bigger than the tool pin area. Beyond this area, the steel was not affected, and the hardness values of steel were scattered within a band around the base steel sheet hardness value (223 HV). At longer dwell time and higher number of rotations (500 R), the heat input was at a maximum, which provided a better condition for stirring the steel beneath the tool pin, leading to a clear increase of the hardness values reaching its maxi-mum (262 HV), as shown in Figure 11 for steel in the middle zone. At the lower number of rotations (167 R), there was a little increase in the hardness value under the keyhole, reaching 248 HV, while a slight increase of the hardness above the hardness value of the base steel sheet was recorded a value of 238 HV on stirring for 83 R.
Brass containing 40 Zn has a melting temperature of around 900 °C. This means a temperature above 315 °C can lead to recrystallization of cold-worked brass. However, a much higher temperature (583 °C) was recorded on the FSSW of the brass/steel sheet (see Figure 5 and Table 4). Along with this high temperature, we also must keep in mind the mechanical stirring pressing and extrusion of brass, which is performed by the tool pin and shoulder. This gave us two oppositely working effects. The hardness measurements reflect the dominant effect on the strength of brass. Starting from the base brass sheet, the hardness increased with increasing the number of revolutions per spot. The highest hard-ness value of 163 HV was reached using 500 R at the stirred zone, while brass hardness using a number of rotations 83 R per spot showed a hardness value of about 149 HV. Both are located within the hardness ranges of the highest strength temper conditions (≥140 HV). At the highest temperature zone near the keyhole, brass began to recrystallize and became softer than the base cold-worked bass sheet. The lowest hardness value around 92 HV was recorded for the spot-welded test using 500 R, where the highest temperature was reached at the keyhole.
50
100
150
200
250
300
350
-20 -15 -10 -5 0 5 10 15 20
HAZ HAZ
HAZ HAZ base brass
base steel
stirred / extrusion brass ring
keyhole
srirred steel
R = Revolutions
167 R
83 R
500 R
500 R
167 R
83 R
base brass
base steel
Distance [mm]
Ha
rdn
ess [
HV
]
Figure 11. Vickers hardness profile measured on stirred brass and steel at the rotation speed of1000 rpm for different dwell times, i.e., different revolutions (R) per spot (5 s: 83 R, 10 s: 167 R, and30 s: 500 R).
FSW or FSSW of materials with melting points very far apart such as steel/brass doesnot produce completely mixed dissimilar materials at the joint regions. Even if cohesiontakes place, no wide range mixing occurs: materials of the top and bottom sheet stay

Materials 2022, 15, 1394 15 of 24
distinguishable. Thus, hardness measurements were conducted on the welding regionsof the two joined sheets individually. It seems that a small area of the steel sheet wasaffected, which is slightly bigger than the tool pin area. Beyond this area, the steel was notaffected, and the hardness values of steel were scattered within a band around the basesteel sheet hardness value (223 HV). At longer dwell time and higher number of rotations(500 R), the heat input was at a maximum, which provided a better condition for stirringthe steel beneath the tool pin, leading to a clear increase of the hardness values reachingits maximum (262 HV), as shown in Figure 11 for steel in the middle zone. At the lowernumber of rotations (167 R), there was a little increase in the hardness value under thekeyhole, reaching 248 HV, while a slight increase of the hardness above the hardness valueof the base steel sheet was recorded a value of 238 HV on stirring for 83 R.
Brass containing 40 Zn has a melting temperature of around 900 ◦C. This means atemperature above 315 ◦C can lead to recrystallization of cold-worked brass. However, amuch higher temperature (583 ◦C) was recorded on the FSSW of the brass/steel sheet (seeFigure 5 and Table 4). Along with this high temperature, we also must keep in mind themechanical stirring pressing and extrusion of brass, which is performed by the tool pinand shoulder. This gave us two oppositely working effects. The hardness measurementsreflect the dominant effect on the strength of brass. Starting from the base brass sheet,the hardness increased with increasing the number of revolutions per spot. The highesthardness value of 163 HV was reached using 500 R at the stirred zone, while brass hardnessusing a number of rotations 83 R per spot showed a hardness value of about 149 HV. Bothare located within the hardness ranges of the highest strength temper conditions (≥140 HV).At the highest temperature zone near the keyhole, brass began to recrystallize and becamesofter than the base cold-worked bass sheet. The lowest hardness value around 92 HV wasrecorded for the spot-welded test using 500 R, where the highest temperature was reachedat the keyhole.
3.5. Microstructure, SEM, and EDS Analysis
Figure 12 shows the microstructure of the right side of the cross-section through thekeyhole of the brass/steel joint produced by 333 rotations. Figure 12a shows good cohesionof brass to steel by the pressing force practiced by the tool shoulder at the generated heatand temperature, which could be around 472 ◦C (as indicated in Table 4). Frictional stirringof steel sheet by the bottom surface of the tool pin extruded some of the steel into brass.Penetration of the extruded steel into brass could increase the joint strength. The extrudedsteel appears in the form of a ring, as shown in the macro images shown in Figure 7,appears in the form of double rings, as shown in Figure 12a,b shows higher magnificationof the region around the extruded steel where the brass is highly deformed and highlyheat-affected by stirring and extrusion of both steel and brass.
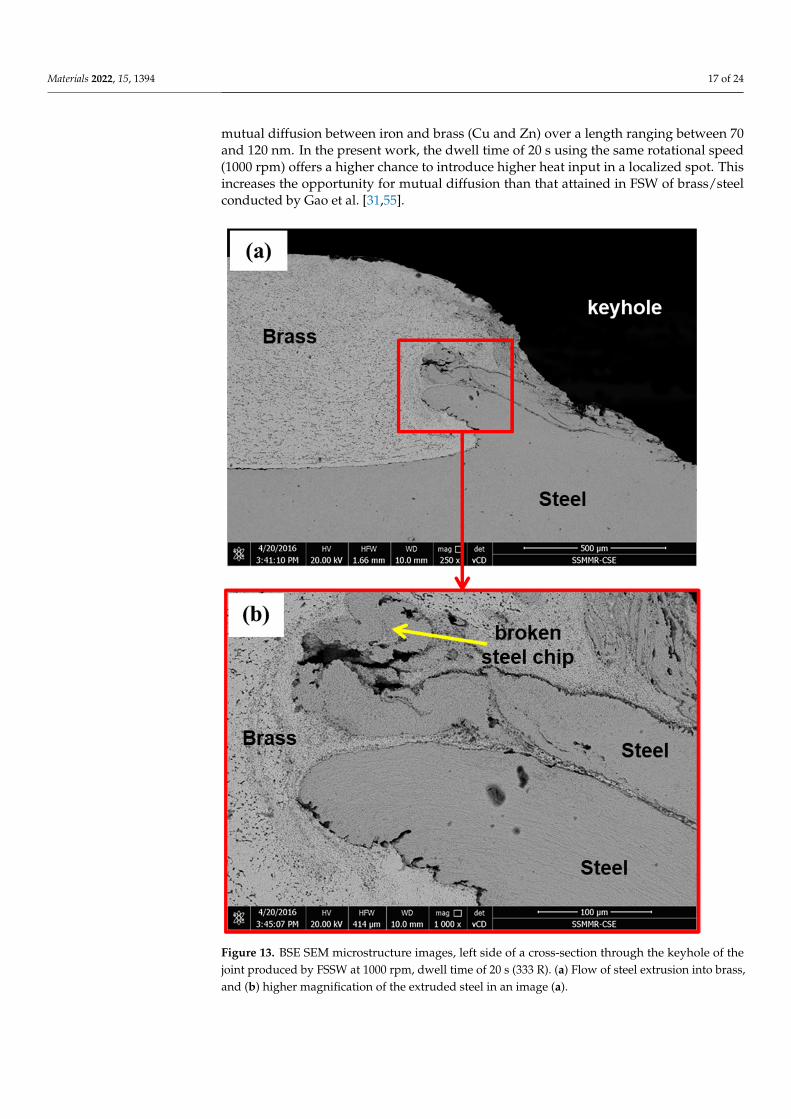
Microstructure investigation of the left side of the cross-section of the joint carriedout at 1000 rpm and dwell time of 20 s (333 R) is shown in Figure 13. The general featuresexplained in the right side of the joint in Figure 12 can also be seen in the microstructure ofthe left side of the joint shown in Figure 13, except the fracture of the steel chip extruded inthe brass sheet. The upper steel extrusion chip seems thinner and especially longer thanthe lower one. This thinner chip faced resistance to flow in brass by the pressure from thetool shoulder; thus, this thin chip is bent and fractured. Near the keyhole, the temperatureis at maximum due to the friction of the tool and the steel sheet. This high temperaturefacilitates the flow of steel extrusion into softened brass. Away from the keyhole, the heatsink increases, and the temperature steeply falls. This can be an additional resistance to theflow of the steel chip into brass. Although the fracture of steel extrusion can be consideredas a discontinuity in the joint, it does not represent a welding defect as long as the area ofcohesion of brass to steel is large enough. From the tensile lap shear test results (Figure 10and Table 3), this welding condition (1000 rpm, 20 s, 333 R) produced a joint with thehighest load-carrying capacity, where the average maximum load was 7505 N.

Materials 2022, 15, 1394 16 of 24Materials 2022, 15, x FOR PEER REVIEW 17 of 26
Figure 12. BSE SEM microstructure, right side of a cross-section through the keyhole of the joint produced by FSSW at 1000 rpm, dwell time of 20 s (333 R) (a) extrusion and flow of stirred steel into brass, and (b) higher magnification of the extruded steel region in an image (a).
Microstructure investigation of the left side of the cross-section of the joint carried out at 1000 rpm and dwell time of 20 s (333 R) is shown in Figure 13. The general features explained in the right side of the joint in Figure 12 can also be seen in the microstructure of the left side of the joint shown in Figure 13, except the fracture of the steel chip extruded in the brass sheet. The upper steel extrusion chip seems thinner and especially longer than the lower one. This thinner chip faced resistance to flow in brass by the pressure from the tool shoulder; thus, this thin chip is bent and fractured. Near the keyhole, the temperature is at maximum due to the friction of the tool and the steel sheet. This high temperature facilitates the flow of steel extrusion into softened brass. Away from the keyhole, the heat sink increases, and the temperature steeply falls. This can be an additional resistance to the flow of the steel chip into brass. Although the fracture of steel extrusion can be con-sidered as a discontinuity in the joint, it does not represent a welding defect as long as the area of cohesion of brass to steel is large enough. From the tensile lap shear test results
Figure 12. BSE SEM microstructure, right side of a cross-section through the keyhole of the jointproduced by FSSW at 1000 rpm, dwell time of 20 s (333 R) (a) extrusion and flow of stirred steel intobrass, and (b) higher magnification of the extruded steel region in an image (a).
EDS line scan was carried out on the sample welded at 1000 rpm for a dwell timeof 20 s at the region containing steel and brass; see Figure 14. This image is a small areafrom the image shown in Figure 12. Normally, the analysis of steel is rich in iron, andthe brass region is rich in copper and zinc. Let us concentrate on the transition lengthbetween steel and brass. There could be mutual atomic diffusion between steel and brass,which can be shown from light concentration gradient on the sound steel/brass interface.In friction stir welding of the brass/steel spot joint using a tool rotation of 1000 rpm andlinear travel speeds of 250, 500, and 600 mm/min, Gao et al. [31,55] found that there is a
Materials 2022, 15, 1394 17 of 24
mutual diffusion between iron and brass (Cu and Zn) over a length ranging between 70and 120 nm. In the present work, the dwell time of 20 s using the same rotational speed(1000 rpm) offers a higher chance to introduce higher heat input in a localized spot. Thisincreases the opportunity for mutual diffusion than that attained in FSW of brass/steelconducted by Gao et al. [31,55].
Materials 2022, 15, x FOR PEER REVIEW 18 of 26
(Figure 10 and Table 3), this welding condition (1000 rpm, 20 s, 333 R) produced a joint with the highest load-carrying capacity, where the average maximum load was 7505 N.
Figure 13. BSE SEM microstructure images, left side of a cross-section through the keyhole of the joint produced by FSSW at 1000 rpm, dwell time of 20 s (333 R). (a) Flow of steel extrusion into brass, and (b) higher magnification of the extruded steel in an image (a).
EDS line scan was carried out on the sample welded at 1000 rpm for a dwell time of 20 s at the region containing steel and brass; see Figure 14. This image is a small area from the image shown in Figure 12. Normally, the analysis of steel is rich in iron, and the brass region is rich in copper and zinc. Let us concentrate on the transition length between steel and brass. There could be mutual atomic diffusion between steel and brass, which can be shown from light concentration gradient on the sound steel/brass interface. In friction stir welding of the brass/steel spot joint using a tool rotation of 1000 rpm and linear travel speeds of 250, 500, and 600 mm/min, Gao et al. [31,55] found that there is a mutual diffu-sion between iron and brass (Cu and Zn) over a length ranging between 70 and 120 nm. In the present work, the dwell time of 20 s using the same rotational speed (1000 rpm) offers a higher chance to introduce higher heat input in a localized spot. This increases the
Figure 13. BSE SEM microstructure images, left side of a cross-section through the keyhole of thejoint produced by FSSW at 1000 rpm, dwell time of 20 s (333 R). (a) Flow of steel extrusion into brass,and (b) higher magnification of the extruded steel in an image (a).

Materials 2022, 15, 1394 18 of 24
Materials 2022, 15, x FOR PEER REVIEW 19 of 26
opportunity for mutual diffusion than that attained in FSW of brass/steel conducted by Gao et al. [31,55].
Figure 14. EDS analysis across the joint containing steel extrusion and brass for a region located on the right side of the cross-section through the FSSW joint by stirring at 1000 rpm, dwell time of 20 s (333 R). (a) EDS line path on SE SEM image, and (b) curves of the EDS elemental analysis.
Figure 15 includes the microstructure of a region from the left side to the keyhole in a cross-section of the brass/steel spot joint produced at 1500 rpm for a dwell time of 10 s, which provides a total of 250 revolutions. Figure 15 a shows the steel extrusion in the form of a hock inside brass. Excellent cohesion at the interface between brass and steel can be seen in Figure 15b. In further magnification, microstructural changes of brass can be seen, depending on the degree of deformation and heat input to the joint materials (Figure 15c,d).
Figure 14. EDS analysis across the joint containing steel extrusion and brass for a region located onthe right side of the cross-section through the FSSW joint by stirring at 1000 rpm, dwell time of 20 s(333 R). (a) EDS line path on SE SEM image, and (b) curves of the EDS elemental analysis.
Figure 15 includes the microstructure of a region from the left side to the keyhole in across-section of the brass/steel spot joint produced at 1500 rpm for a dwell time of 10 s,which provides a total of 250 revolutions. Figure 15a shows the steel extrusion in the formof a hock inside brass. Excellent cohesion at the interface between brass and steel can beseen in Figure 15b. In further magnification, microstructural changes of brass can be seen,depending on the degree of deformation and heat input to the joint materials (Figure 15c,d).
Figure 16 shows the EDS line scan analysis of the brass/steel contacting region fromthe microstructure shown in Figure 15c. It can be noted that at the interface region betweenthe brass and steel parts some traces of elements can be seen in both sides, which indicatethe mutual diffusion of elements. Fe peak can be observed in the brass side as well aspeaks of Cu and Zn in the steel side. This type of diffusion is expected to occur at thishigh temperature and high strain experienced during FSSW. Bonding of dissimilar metalsduring the different joining processes is explained on by many mechanisms [56–58]. Inthe current work, the attained results implied from Figures 12–16 indicate that the maindominant bonding mechanism could be mechanical bonding and diffusion bonding onshort scale at brass/steel interface.

Materials 2022, 15, 1394 19 of 24Materials 2022, 15, x FOR PEER REVIEW 20 of 26
Figure 15. BSE SEM microstructure at different magnifications (a) 200×, (b) 1000×, (c) 4000×, (d) 3000×) for the FSSW joints showing mechanical mixing and cohesion of brass on steel at the stirred of samples joined at a rotational speed of 1500 rpm, dwell time of 10 s (250R).
Figure 16 shows the EDS line scan analysis of the brass/steel contacting region from the microstructure shown in Figure 15c. It can be noted that at the interface region be-tween the brass and steel parts some traces of elements can be seen in both sides, which indicate the mutual diffusion of elements. Fe peak can be observed in the brass side as well as peaks of Cu and Zn in the steel side. This type of diffusion is expected to occur at this high temperature and high strain experienced during FSSW. Bonding of dissimilar metals during the different joining processes is explained on by many mechanisms [56–58]. In the current work, the attained results implied from Figure 12 to Figure 16 indicate that the main dominant bonding mechanism could be mechanical bonding and diffusion bonding on short scale at brass/steel interface.
Figure 15. BSE SEM microstructure at different magnifications (a) 200×, (b) 1000×, (c) 4000×,(d) 3000× for the FSSW joints showing mechanical mixing and cohesion of brass on steel at the stirredof samples joined at a rotational speed of 1500 rpm, dwell time of 10 s (250R).
Materials 2022, 15, x FOR PEER REVIEW 21 of 26
Figure 16. (a) EDS line scan from the lower right side to the upper left side of the SE SEM image of FSSW brass/steel joint by stirring at 1500 rpm and dwell time of 10 s (250 R), and (b) EDS line scan results.
Table 5 includes the results of EDS analysis of different spots in the recrystallized brass, as shown in Figure 17. The elemental analysis shows that spots 1 and 2 are richer in zinc than spot 3 allocated in the matrix, representing α-brass phase, which has a zinc con-tent of 32 wt.%, while the zinc content of spots 1 and 2 are 42.5 and 40.93 wt.%, respec-tively. The values of carbon that appeared in this analysis are mainly from contamination from the molding and sticking materials of the sample.
Figure 17. SE SEM microstructure, appearance of β-phase in the recrystallized structure of brass in the HAZ of samples joined at a rotational speed of 1500 rpm, dwell time of 10 s (250 R).
Figure 16. (a) EDS line scan from the lower right side to the upper left side of the SE SEM imageof FSSW brass/steel joint by stirring at 1500 rpm and dwell time of 10 s (250 R), and (b) EDS linescan results.

Materials 2022, 15, 1394 20 of 24
Table 5 includes the results of EDS analysis of different spots in the recrystallized brass,as shown in Figure 17. The elemental analysis shows that spots 1 and 2 are richer in zincthan spot 3 allocated in the matrix, representing α-brass phase, which has a zinc content of32 wt.%, while the zinc content of spots 1 and 2 are 42.5 and 40.93 wt.%, respectively. Thevalues of carbon that appeared in this analysis are mainly from contamination from themolding and sticking materials of the sample.
Table 5. EDS elemental analysis of spots 1 and 2 (β-phase) and spot 3 (α-phase).
Element (wt.%) Spot 1 (wt.%) Spot 2 (wt.%) Spot 3
Fe 0.6 1.6 0.8Cu 54.1 53.2 63.3Zn 42.5 40.9 32.1
Materials 2022, 15, x FOR PEER REVIEW 21 of 26
Figure 16. (a) EDS line scan from the lower right side to the upper left side of the SE SEM image of FSSW brass/steel joint by stirring at 1500 rpm and dwell time of 10 s (250 R), and (b) EDS line scan results.
Table 5 includes the results of EDS analysis of different spots in the recrystallized brass, as shown in Figure 17. The elemental analysis shows that spots 1 and 2 are richer in zinc than spot 3 allocated in the matrix, representing α-brass phase, which has a zinc con-tent of 32 wt.%, while the zinc content of spots 1 and 2 are 42.5 and 40.93 wt.%, respec-tively. The values of carbon that appeared in this analysis are mainly from contamination from the molding and sticking materials of the sample.
Figure 17. SE SEM microstructure, appearance of β-phase in the recrystallized structure of brass in the HAZ of samples joined at a rotational speed of 1500 rpm, dwell time of 10 s (250 R).
Figure 17. SE SEM microstructure, appearance of β-phase in the recrystallized structure of brass inthe HAZ of samples joined at a rotational speed of 1500 rpm, dwell time of 10 s (250 R).
In the next and final section, further investigation of the effect of FSSW conditionson the microstructure of brass are presented. Because brass represents the softer andweaker component of the joint, it determines the join’s strength; thus, that understandingits microstructural changes is of great importance. Figure 17 shows the microstructure ofbrass of the joint welded at 250 R (Figure 15) near the highest temperature region at thekeyhole. It can be noticed that there are islands of β-phase distributed on discontinuousgrain boundaries, while the matrix is mainly α-phase. This α-phase is dominating in brassescontaining zinc content lower than 37 wt.%, according to the Cu–Zn phase diagram [42].The β-phase appears in the as-received brass (Figure 1a) in the form of mechanical twins. Atthe regions adjacent to the high temperature, as shown in Figure 15, brass is recrystallized,and no more mechanical twins can be noticed, as shown in Figure 17.
3.6. General Discussion
The main contribution of this study is the investigation of the dissimilar spot jointsbetween steel alloy and copper base alloy and the use of new parameters to justify the jointheat input and quality, which is the tool revolutions per spot as one parameter encompassesboth the tool rotation rate and dwell time. In this section, some normalized points fromthe applied process conditions and the results to be applied for other FSSW are presented.In this work, three tool rotation speeds (1000, 1250, and 1500 rpm) and four dwell times(5, 10, 20, and 30 s), which form 12 process conditions, were reduced to seven rotations

Materials 2022, 15, 1394 21 of 24
per spot (83, 104, 125, 167 250, 333, 500 R). The studied materials have melting pointsvery far apart: brass (CuZn40) having a melting point of 900 ◦C and the relatively hardermaterial represented by low-carbon steel with a much higher melting point (1530 ◦C). Thenormalized measured temperature at the applied number of revolutions (Table 4) showthat the welding conditions resulted in generating heat, which raised the temperature up to≈0.4 Tm for such steel and ≈0.6 Tm for such soft brass, which could be suitable conditionsfor such material joining. Furthermore, the generated heat at a number of revolutions of250 or higher (Table 3 and Figure 4) was also a reasonable level to produce a dissimilarjoint with good load-carrying capacity of 4 to 7.5 kN, as shown in Figure 10. Wheneversuch relative temperature is reached, a successful FSSW joint can be achieved for similarcombinations of materials with very different melting points. Even the rotational speed andthe dwell times were normalized into the number of revolutions per spot, keeping in mindthat the rotational speed and the dwell time should be high enough to provide enoughhigher rate of heat generation. If other FSSW tools are used, the generated heat input by thenew tool alone would be estimated using the given equations to see if the heat input valueis enough to place the selected new tool geometry or the new process conditions (rotationalspeed and dwell time) in the heat input range to produce acceptable load-carrying capacity.The new tool geometry (such as pin height) should, of course, be related to thickness ofthe top sheet materials thickness; here, it was 0.1 mm shorter than the top sheet materialsthickness. Heat input calculation for the FSSW of steel–brass was found to be linearlyproportional with the number of revolutions per spot joint. Maximum heat input obtainedwas 11 KJ at the number of revolutions of 500. The temperature measurement during FSSWshowed agreement with the heat input dependence on the number of revolutions. However,at the same number of revolutions of 500, it was found that the higher rotation speed of1500 rpm resulted in higher temperature of 583 ◦C compared to 535 ◦C at a rotation speedof 1000 rpm. This implies the significant effect for the rotation speed in the increase oftemperature. The macro investigations of the friction stir spot-welded joints transversesections showed sound joints at the different investigated parameters with significant jointligament between the steel and brass. The tensile shear load results showed wide scatteringat the same value of number of revolution, with maximum tensile shear load of about7.52 kN attained at a rotation speed of 1500 rpm and 10 s, or the total number of rotationsper spot of 250.
Tensile test results are usually scattered in a narrow range. The scattering of TLSTresults could not be compared with the scattering of the fusion welded or even with theFSW samples. The variation of the TSLT results shown in Figure 10 could be related tovariation in behavior of the stirred at the keyhole and the form of extrusion of steel chips andbrass around the keyhole. Figures 12–16 show the different forms of cohesion at the steel–brass interface, which results in different load-carrying capacity of the samples. However,sticking to the conditions producing a high heat input range (i.e., at 250 revolutions perspot or higher) produces lap joints with relatively high load-carrying capacity.
The hardness measurement across the transverse section of the spot joint showed anincrease in the carbon steel (lower sheet) with a maximum of 248 HV and an increase of brasshardness at the mixed interface between brass and steel and significant reduction in the stirzone. Microstructural investigation of the joint zone showed mechanical mixing betweensteel and brass, with the steel extruded from the lower sheet into the upper brass sheet. TheEDS analysis across the interface showed a concentration gradient for both Fe into brassand Cu into steel, which implies the mutual diffusion at the experienced thermomechanicalconditions. The current study showed the importance of parameters optimization usingthe different optimization software to minimize the number of experiments. Thus, theresults of this study can used in an optimization study using Taguchi method, for example.Furthermore, the refill FSSW technology can be used to improve the joint appearanceand quality.

Materials 2022, 15, 1394 22 of 24
4. Conclusions
Based on the obtained results and analysis, the following conclusions can be outlined:
(1) Whenever a generated FSSW heat over 4 kN is secured by any parameters combina-tion, successful joints can be achieved.
(2) Heat input for the FSSW of steel–brass was found to be linearly proportional with thenumber of revolutions per spot joint, and the maximum heat input obtained is 11 kJat the number of revolutions of 500.
(3) Application of the acceptable range of FSSW revolution per spot heats the joint zoneto a normalized temperature of ≈0.4 Tm for steel and ≈0.6 Tm for brass and producesgood steel/brass adhesion, which is strengthened by the mutual atomic diffusion.
(4) Considering other successful FSSW conditions, an appropriate tool geometrywith a height of 0.1 mm less than the top sheet thickness produces good joint load-carrying capacity.
(5) FSSW of steel/brass joints with a number of revolutions ranging between 250 to500 revolutions per spot at appropriate tool speed range (1000–1500 rpm) producesjoints with high load-carrying capacity from 4 kN to 7.5 kN.
Author Contributions: Conceptualization, S.A., M.M.E.-S.S., M.I.A.H. and M.M.Z.A.; Data curation,M.M.Z.A. and A.M.S.; Formal analysis, M.M.Z.A., M.M.E.-S.S., S.A. and F.H.L.; Funding acquisition,K.H. and S.A.; Investigation, M.M.E.-S.S., Y.G.Y.E. and M.I.A.H.; Methodology, M.M.E.-S.S., Y.G.Y.E.and S.A.; Project administration, K.H. and S.A.; Resources, M.M.E.-S.S., K.H. and F.H.L.; Software,K.H., A.M.S. and F.H.L.; Supervision, S.A.; M.M.E.-S.S. and M.I.A.H.; Validation, M.M.Z.A., K.H. andS.A.; Visualization, K.H., S.A. and F.H.L.; Writing—original draft, S.A. and F.H.L., Writing—reviewand editing, M.M.Z.A., M.I.A.H., A.M.S. and M.M.E.-S.S. All authors have read and agreed to thepublished version of the manuscript.
Funding: Funded by the Deanship of Scientific Research at Imam Mohammad Ibn Saud IslamicUniversity, KSA (Research Group No. RG-21-12-04).
Institutional Review Board Statement: Not applicable.
Informed Consent Statement: Not applicable.
Data Availability Statement: The data presented in this study are available on request from thecorresponding author. The data are not publicly available due to the extremely large size.
Acknowledgments: The authors appreciate the Deanship of Scientific Research at Imam MohammadIbn Saud Islamic University for funding this work through Research Group No. RG-21-12-04.
Conflicts of Interest: The authors declare no conflict of interest.
References1. Venu, B.; BhavyaSwathi, I.; Raju, L.S.; Santhanam, G. A review on Friction Stir Welding of various metals and its variables. Mater.
Today Proc. 2019, 18, 298–302. [CrossRef]2. Padhy, G.K.; Wu, C.S.; Gao, S. Friction stir based welding and processing technologies—processes, parameters, microstructures
and applications: A review. J. Mater. Sci. Technol. 2018, 34, 1–38. [CrossRef]3. De Carvalho, W.S.; Vioreanu, M.C.; Lutz, M.R.A.; Cipriano, G.P.; Amancio-Filho, S.T. The influence of tool wear on the mechanical
performance of AA6061-T6 refill friction stir spot welds. Materials 2021, 14, 7252. [CrossRef] [PubMed]4. Andrade, D.G.; Sabari, S.; Leitão, C.; Rodrigues, D.M. Shoulder related temperature thresholds in fssw of aluminium alloys.
Materials 2021, 14, 4375. [CrossRef]5. Kumamoto, K.; Kosaka, T.; Kobayashi, T.; Shohji, I.; Kamakoshi, Y. Microstructure and fatigue behaviors of dissimilar
a6061/galvannealed steel joints fabricated by friction stir spot welding. Materials 2021, 14, 3877. [CrossRef]6. Kubit, A.; Trzepiecinski, T.; Gadalinska, E.; Slota, J.; Bochnowski, W. Investigation into the effect of rfssw parameters on tensile
shear fracture load of 7075-t6 alclad aluminium alloy joints. Materials 2021, 14, 3397. [CrossRef]7. Zlatanovic, D.L.; Balos, S.; Bergmann, J.P.; Rasche, S.; Pecanac, M.; Goel, S. Influence of tool geometry and process parameters on
the properties of friction stir spot welded multiple (Aa 5754 h111) aluminium sheets. Materials 2021, 14, 1157. [CrossRef]8. Li, M.; Zhang, C.; Wang, D.; Zhou, L.; Wellmann, D.; Tian, Y. Friction stir spot welding of aluminum and copper: A review.
Materials 2020, 13, 156. [CrossRef]9. Steel, A.; Joints, K.F. Effect of Loading Methods on the Fatigue Properties. Materials 2020, 13, 4247.

Materials 2022, 15, 1394 23 of 24
10. Ahmed, M.M.Z.; Abdul-maksoud, M.A.A.; El-sayed Seleman, M.M.; Mohamed, A.M.A. Effect of dwelling time and plunge depthon the joint properties of the dissimilar friction stir spot welded aluminum and steel. J. Eng. Res. Res. 2021, 9, 1–20. [CrossRef]
11. Tonelli, L.; Morri, A.; Toschi, S.; Shaaban, M.; Ammar, H.R.; Ahmed, M.M.Z.; Ramadan, R.M. Effect of FSP parameters and toolgeometry on microstructure, hardness, and wear properties of AA7075 with and without reinforcing B 4 C ceramic particles. Int.J. Adv. Manuf. Technol. 2019, 102, 3945–3961. [CrossRef]
12. Hamada, A.S.; Järvenpää, A.; Ahmed, M.M.Z.; Jaskari, M.; Wynne, B.P.; Porter, D.A.; Karjalainen, L.P. The microstructuralevolution of friction stir welded AA6082-T6 aluminum alloy during cyclic deformation. Mater. Sci. Eng. A 2015, 642, 366–376.[CrossRef]
13. Ahmed, M.M.Z.; El-Sayed Seleman, M.M.; Zidan, Z.A.; Ramadan, R.M.; Ataya, S.; Alsaleh, N.A. Microstructure and mechanicalproperties of dissimilar friction stir welded AA2024-T4/AA7075-T6 T-butt joints. Metals 2021, 11, 128. [CrossRef]
14. Ahmed, M.M.Z.; Ataya, S.; El-Sayed Seleman, M.M.; Mahdy, A.M.A.; Alsaleh, N.A.; Ahmed, E. Heat input and mechanicalproperties investigation of friction stir welded aa5083/aa5754 and aa5083/aa7020. Metals 2021, 11, 68. [CrossRef]
15. Shen, Z.; Ding, Y.; Gerlich, A.P. Advances in friction stir spot welding. Crit. Rev. Solid State Mater. Sci. 2020, 45, 457–534. [CrossRef]16. Ahmed, M.M.Z.; Abdelazem, K.A.; El-Sayed Seleman, M.M.; Alzahrani, B.; Touileb, K.; Jouini, N.; El-Batanony, I.G.; Abd El-Aziz,
H.M. Friction stir welding of 2205 duplex stainless steel: Feasibility of butt joint groove filling in comparison to gas tungsten arcwelding. Materials 2021, 14, 4597. [CrossRef]
17. Bozkurt, Y.; Salman, S.; Çam, G. Effect of welding parameters on lap shear tensile properties of dissimilar friction stir spot weldedaa 5754-h22/2024-t3 joints. Sci. Technol. Weld. Join. 2013, 18, 337–345. [CrossRef]
18. Chowdhury, S.H.; Chen, D.L.; Bhole, S.D.; Cao, X.; Wanjara, P. Lap shear strength and fatigue behavior of friction stir spot weldeddissimilar magnesium-to-aluminum joints with adhesive. Mater. Sci. Eng. A 2013, 562, 53–60. [CrossRef]
19. Zhou, L.; Li, G.H.; Zhang, R.X.; Zhou, W.L.; He, W.X.; Huang, Y.X.; Song, X.G. Microstructure evolution and mechanical propertiesof friction stir spot welded dissimilar aluminum-copper joint. J. Alloys Compd. 2019, 775, 372–382. [CrossRef]
20. Sun, Y.F.; Fujii, H.; Takaki, N.; Okitsu, Y. Microstructure and mechanical properties of dissimilar Al alloy/steel joints prepared bya flat spot friction stir welding technique. Mater. Des. 2013, 47, 350–357. [CrossRef]
21. Ahmed, M.M.Z.; El-Sayed Seleman, M.M.; Shazly, M.; Attallah, M.M.; Ahmed, E. Microstructural Development and MechanicalProperties of Friction Stir Welded Ferritic Stainless Steel AISI 409. J. Mater. Eng. Perform. 2019, 28, 6391–6406. [CrossRef]
22. Chen, K.; Liu, X.; Ni, J. Keyhole refilled friction stir spot welding of aluminum alloy to advanced high strength steel. J. Mater.Process. Technol. 2017, 249, 452–462. [CrossRef]
23. Das, H.; Mondal, M.; Hong, S.T.; Lim, Y.; Lee, K.J. Comparison of microstructural and mechanical properties of friction stir spotwelded ultra-high strength dual phase and complex phase steels. Mater. Charact. 2018, 139, 428–436. [CrossRef]
24. Kuang, S.; Kang, Y.-L.; Yu, H.; Liu, R.D. Effect of continuous annealing parameters on the mechanical properties and microstruc-tures of a cold rolled dual phase steel. Int. J. Miner. Metall. Mater. 2009, 16, 159–164. [CrossRef]
25. Mazar Atabaki, M.; Ma, J.; Liu, W.; Kovacevic, R. Hybrid laser/arc welding of advanced high strength steel to aluminum alloy byusing structural transition insert. Mater. Des. 2015, 75, 120–135. [CrossRef]
26. Sarkar, R.; Sengupta, S.; Pal, T.K.; Shome, M. Microstructure and Mechanical Properties of Friction Stir Spot-Welded IF/DPDissimilar Steel Joints. Metall. Mater. Trans. A Phys. Metall. Mater. Sci. 2015, 46, 5182–5200. [CrossRef]
27. Shen, J.J.; Liu, H.J.; Cui, F. Effect of welding speed on microstructure and mechanical properties of friction stir welded copper.Mater. Des. 2010, 31, 3937–3942. [CrossRef]
28. Emami, S.; Saeid, T. Effects of welding and rotational speeds on the microstructure and hardness of friction stir welded single-phase brass. Acta Metall. Sin. (Eng. Lett.) 2015, 28, 766–771. [CrossRef]
29. Lee, W.B.; Jung, S.B. The joint properties of copper by friction stir welding. Mater. Lett. 2004, 58, 1041–1046. [CrossRef]30. Meran, C. The joint properties of brass plates by friction stir welding. Mater. Des. 2006, 27, 719–726. [CrossRef]31. Gao, Y.; Nakata, K.; Nagatsuka, K.; Shibata, Y.; Amano, M. Optimizing tool diameter for friction stir welded brass/steel lap joint.
J. Mater. Process. Technol. 2016, 229, 313–321. [CrossRef]32. Panagopoulos, C.N.; Georgiou, E.P.; Simeonidis, K. Lubricated wear behavior of leaded αβ brass. Tribol. Int. 2012, 50, 1–5.
[CrossRef]33. Luo, J.; Xiang, J.; Liu, D.; Li, F.; Xue, K. Radial friction welding interface between brass and high carbon steel. J. Mater. Process.
Technol. 2012, 212, 385–392. [CrossRef]34. Kimura, M.; Kusaka, M.; Kaizu, K.; Fuji, A. Effect of post-weld heat treatment on joint properties of friction welded joint between
brass and low carbon steel. Sci. Technol. Weld. Join. 2010, 15, 590–596. [CrossRef]35. Hofmann, U.; El-Magd, E. Behaviour of Cu-Zn alloys in high speed shear tests and in chip formation processes. Mater. Sci. Eng. A
2005, 395, 129–140. [CrossRef]36. Bakhtiari Argesi, F.; Shamsipur, A.; Mirsalehi, S.E. Preparation of bimetallic nano-composite by dissimilar friction stir welding of
copper to aluminum alloy. Trans. Nonferrous Met. Soc. China 2021, 31, 1363–1380. [CrossRef]37. Ilman, M.N. Kusmono Microstructure and mechanical properties of friction stir spot welded AA5052-H112 aluminum alloy.
Heliyon 2021, 7, e06009. [CrossRef]38. Yapici, G.G.; Ibrahim, I.J. On the fatigue and fracture behavior of keyhole-free friction stir spot welded joints in an aluminum
alloy. J. Mater. Res. Technol. 2021, 11, 40–49. [CrossRef]

Materials 2022, 15, 1394 24 of 24
39. Feng, X.S.; Li, S.B.; Tang, L.N.; Wang, H.M. Refill Friction Stir Spot Welding of Similar and Dissimilar Alloys: A Review. ActaMetall. Sin. (Eng. Lett.) 2020, 33, 30–42. [CrossRef]
40. Davis, J.R. (Ed.) Annual Book of ASTM Standards; American Society for Testing and Materials: Materials Park, OH, USA, 2001;ISBN 9780803135079.
41. ASTM E8/E8M-08; Standard Test Method for Tension Testing of Metallic Materials. ASTM International: West Conshohohocken,PA, USA, 2008; 1–25.
42. Davis, J.R. ASM Speciality Hand Book: Copper and Copper Alloys; ASM International: Materials Park, OH, USA, 2001;ISBN 0871707268.
43. Janeczek, A.; Tomków, J.; Fydrych, D. The influence of tool shape and process parameters on the mechanical properties of aw-3004aluminium alloy friction stir welded joints. Materials 2021, 14, 3244. [CrossRef]
44. Chupradit, S.; Bokov, D.O.; Suksatan, W.; Landowski, M.; Fydrych, D.; Abdullah, M.E.; Derazkola, H.A. Pin angle thermaleffects on friction stir welding of AA5058 aluminum alloy: CFD simulation and experimental validation. Materials 2021, 14, 7565.[CrossRef]
45. Saini, N.; Pandey, C.; Thapliyal, S.; Dwivedi, D.K. Mechanical Properties and Wear Behavior of Zn and MoS2 Reinforced SurfaceComposite Al- Si Alloys Using Friction Stir Processing. Silicon 2018, 10, 1979–1990. [CrossRef]
46. Hwang, J.Y.; Monteiro, S.N.; Bai, C.G.; Carpenter, J.; Cai, M.; Firrao, D.; Kim, B.G. Characterization of Minerals, Metals, and Materials;Wiley: Hoboken, NJ, USA, 2012; ISBN 9781118291221.
47. Ahmed, M.M.Z.; Habba, M.I.A.; Jouini, N.; Alzahrani, B.; El-Sayed Seleman, M.M.; El-Nikhaily, A. Bobbin tool friction stirwelding of aluminum using different tool pin geometries: Mathematical models for the heat generation. Metals 2021, 11, 438.[CrossRef]
48. Nandan, R.; Roy, G.G.; Lienert, T.J.; Debroy, T. Three-dimensional heat and material flow during friction stir welding of mild steel.Acta Mater. 2007, 55, 883–895. [CrossRef]
49. Peel, M.J.; Steuwer, A.; Withers, P.J.; Dickerson, T.; Shi, Q.; Shercliff, H. Dissimilar Friction Stir Welds in AA5083-AA6082. Part I :Process Parameter Effects on Thermal History and Weld Properties. Metall. Mater. Trans. A 2006, 37, 2183–2193. [CrossRef]
50. Atak, A.; Sık, A.; Özdemir, V. Thermo-Mechanical Modeling of Friction Stir Spot Welding and Numerical Solution With The FiniteElement Method. Int. J. Eng. Appl. Sci. 2018, 5, 70–75.
51. Abdullah, I.T.; Hussein, S.K. Improving the joint strength of the friction stir spot welding of carbon steel and copper using thedesign of experiments method. Multidiscip. Model. Mater. Struct. 2018, 14, 908–922. [CrossRef]
52. Figner, G.; Vallant, R.; Weinberger, T.; Schröttner, H.; Pasic, H.; Enzinger, N. Friction Stir Spot Welds between aluminium and steelautomotive sheets: Influence of welding parameters on mechanical properties and microstructure. Weld. World 2009, 53, 13–23.[CrossRef]
53. Fereiduni, E.; Movahedi, M.; Kokabi, A.H. Aluminum/steel joints made by an alternative friction stir spot welding process. J.Mater. Process. Technol. 2015, 224, 1–10. [CrossRef]
54. Mubiayi, M.P.; Akinlabi, E.T. Evolving properties of friction stir spot welds between AA1060 and commercially pure copperC11000. Trans. Nonferrous Met. Soc. China 2016, 26, 1852–1862. [CrossRef]
55. Gao, Y.; Nakata, K.; Nagatsuka, K.; Matsuyama, T.; Shibata, Y.; Amano, M. Microstructures and mechanical properties of frictionstir welded brass/steel dissimilar lap joints at various welding speeds. Mater. Des. 2016, 90, 1018–1025. [CrossRef]
56. Bhanu, V.; Fydrych, D.; Gupta, A.; Pandey, C. Study on microstructure and mechanical properties of laser welded dissimilar jointof p91 steel and incoloy 800ht nickel alloy. Materials 2021, 14, 5876. [CrossRef]
57. Batistão, B.F.; Bergmann, L.A.; Gargarella, P.; de Alcântara, N.G.; dos Santos, J.F.; Klusemann, B. Characterization of dissimilarfriction stir welded lap joints of AA5083 and GL D36 steel. J. Mater. Res. Technol. 2020, 9, 15132–15142. [CrossRef]
58. Campo, K.N.; Campanelli, L.C.; Bergmann, L.; dos Santos, J.F.; Bolfarini, C. Microstructure and interface characterization ofdissimilar friction stir welded lap joints between Ti–6Al–4V and AISI 304. Mater. Des. 2014, 56, 139–145. [CrossRef]