
Effective exchange rates in Asia with entrepôt and growing ...
36
Restricted Effective exchange rates in Asia with entrepôt and growing intra-regional trade San Sau Fung, Marc Klau, Guonan Ma and Robert McCauley 1 Current version: 22 March 2005 Contents Introduction ............................................................................................................................................... 2 1. Refinements in the calculation of effective exchange rates ........................................................... 3 1.1 Adjusting for Hong Kong’s re-export trade .......................................................................... 3 1.2 Updating the base year ........................................................................................................ 7 2. Refining the RMB effective exchange rate..................................................................................... 8 2.1 Comparison of basket weights with both refinements ......................................................... 8 2.2 Comparison of effective exchange rates with both refinements .......................................... 9 2.3 Comparison with each refinement considered separately ................................................. 12 2.3.1 Effects of trade data adjustment .............................................................................. 12 2.3.2 Effects of base year updating .................................................................................. 12 3. Refining the effective exchange rates indices of other Asian currencies .................................... 13 3.1 Weights on China and Hong Kong .................................................................................... 13 3.2 The case of Hong Kong ..................................................................................................... 14 3.3 The case of Singapore....................................................................................................... 17 3.4 Comparison of refined scenario with official weights and effective exchange rates ......... 17 4. Applications of the effective exchange rate in policy analysis ..................................................... 19 4.1 Currency stability: bilateral versus effective ...................................................................... 19 4.2 Effective currency blocs in the renminbi basket ................................................................ 21 4.3 Effective exchange rates as a mechanism for cross-border reactions .............................. 24 5. Concluding remarks ..................................................................................................................... 26 References ............................................................................................................................................. 28 Appendix 1 General data requirements ...................................................................................... 30 Appendix 2 Response of selected currencies to the yen/$ and euro/$ rates ............................. 31 Appendix 3 Trade-weight tables ................................................................................................. 33 1 The views expressed in this papers are those of the authors only and do not necessarily reflect those of the BIS. 1
-
Upload
khangminh22 -
Category
Documents
-
view
1 -
download
0
Transcript of Effective exchange rates in Asia with entrepôt and growing ...
Restricted
Effective exchange rates in Asia with entrepôt and growing intra-regional trade
San Sau Fung, Marc Klau, Guonan Ma and Robert McCauley1
Current version: 22 March 2005
Contents
Introduction...............................................................................................................................................2 1. Refinements in the calculation of effective exchange rates...........................................................3
1.1 Adjusting for Hong Kong’s re-export trade ..........................................................................3 1.2 Updating the base year........................................................................................................7
2. Refining the RMB effective exchange rate.....................................................................................8 2.1 Comparison of basket weights with both refinements .........................................................8 2.2 Comparison of effective exchange rates with both refinements..........................................9 2.3 Comparison with each refinement considered separately.................................................12
2.3.1 Effects of trade data adjustment..............................................................................12 2.3.2 Effects of base year updating..................................................................................12
3. Refining the effective exchange rates indices of other Asian currencies ....................................13 3.1 Weights on China and Hong Kong ....................................................................................13 3.2 The case of Hong Kong .....................................................................................................14 3.3 The case of Singapore.......................................................................................................17 3.4 Comparison of refined scenario with official weights and effective exchange rates .........17
4. Applications of the effective exchange rate in policy analysis .....................................................19 4.1 Currency stability: bilateral versus effective ......................................................................19 4.2 Effective currency blocs in the renminbi basket ................................................................21 4.3 Effective exchange rates as a mechanism for cross-border reactions..............................24
5. Concluding remarks .....................................................................................................................26 References .............................................................................................................................................28 Appendix 1 General data requirements......................................................................................30 Appendix 2 Response of selected currencies to the yen/$ and euro/$ rates .............................31 Appendix 3 Trade-weight tables .................................................................................................33
1 The views expressed in this papers are those of the authors only and do not necessarily reflect those of the BIS.
1
Restricted
Introduction
Discussion of exchange rate policy in Asia would benefit from appropriate measures of exchange rates on a multilateral basis. Indeed, measures of effective exchange rates serve policy and market analysis in various ways: as an indicator of external competitiveness; as an ingredient in a monetary or financial condition index; as a reference point for foreign exchange policy; or even as an operating target. Policy-makers’ and market participants’ measures of effective exchange rates also condition the reaction of one currency to movements in trading partners’ currencies. Better measures of effective exchange rates could thus allow them to play their assigned role more appropriately and could even make inappropriate responses to currency movements less likely.2
The measurement of effective exchange rates in Asia faces two challenges. First, trade relationships in Asia and between Asia and the rest of the world are veiled by Hong Kong SAR’s3 entrepôt trade. Hong Kong’s status as trade entrepôt for China is a long-standing challenge that has become more important as China’s trade has bulked larger, even though Hong Kong’s share of China’s trade has been secularly falling (from 36% in 1991 to 10% in 2004). While the effect of Hong Kong’s entrepôt role in obscuring trade relationships within Asia and between Asia and the rest of the world is at some level understood by policy-makers and market analysts, we are not aware of a systematic effort to adjust measures of effective exchange rates for entrepôt trade. Secondly, intra-regional trade is growing very fast in Asia, particularly trade with China. For instance, China has recently become Korea’s major export market, displacing the United States. This development challenges the statistician to use updated data to generate relevant measures of the effective exchange rate.
The purpose of this paper is two-fold: first, to refine the construction of the effective exchange rates of the Chinese renminbi (RMB) and other Asian currencies, to make allowances for the role of Hong Kong as an entrepôt as well as to reflect the growing intra-regional trade; and, second, to draw the implications of the improved measures of effective exchange rate for policy analysis.
The paper is organised as follows. The first section outlines two refinements in the estimation of the Asian effective exchange rates and shows how they affect the calculated weights. For the sake of the concreteness, and considering that the Hong Kong trade adjustment most affects the weights for the effective index for mainland China, this section takes the latter as the example in the analysis. In this spirit, the second section presents the estimated trade weights and compares RMB nominal effective exchange rates (NEERs) and real effective exchange rates (REERs) with and without the two refinements. It also compares the effect of each refinement separately. The third section covers the same ground for other Asian exchange rates, comparing effective exchange rates with and without the adjustments. Where possible it also compares the refined measures to effective exchange rate measures used by policy-makers in the region.
The fourth section uses the refined effective exchange rates to analyse three policy topics. In particular, we show how bilateral exchange rate stability creates effective exchange rate instability and present a counterfactual of effective exchange rate stability in terms of changing bilateral exchange rates. We then provide a summary measure of the difference between our base and refined measures in terms of the relative weights on the major currency blocs, again in reference to the RMB. Finally, we discuss possible reactions among Asian currencies to each other’s movements, and how our base and refined measures might condition such interaction differently. The last section summarises the main findings of the paper.
2 For applications in policy and market analysis, see Leahy (1998); Buldorini et al (2002), Hargreave and Carlton (2003), and
Suttle and Fernandez (2005). 3 Hong Kong SAR hereafter referred to as Hong Kong.
2
Restricted
1. Refinements in the calculation of effective exchange rates
The NEER is a geometrically weighted average of a basket of bilateral exchange rates. The REER is NEER deflated by a similarly weighted average of foreign prices or costs relative to those in the home economy. Key choices in the construction of an effective exchange rate include, the weighting scheme employed, the range of currencies to be included in the basket, and the base period for the trade data from which the weights are to be estimated. For analytical simplicity, we base our calculations on a bilateral-weighting scheme4 and a basket of 34 currencies5, and review two possible improvements for the construction of the effective exchange rates of Asian currencies – an adjustment for trade through and around Hong Kong and an updated base period to take into account of the rising intra-regional trade. Of course, it is in the nature of effective exchange rate estimation that an adjustment of trade flows for one economy simultaneously amounts to an adjustment of trade flows for its trading partners. Nevertheless, for the sake of concreteness, we often take the Chinese renminbi as an example in what follows. Then we turn to a broader discussion of the implications for Asian effective exchange rates in a subsequent section.6
1.1 Adjusting for Hong Kong’s re-export trade
There is a consensus that the official trade data published by both China and its trading partners give a distorted view of their underlying trade relationships, mainly because a substantial amount of China’s two-way trade with the rest of the world takes the form of Hong Kong’s re-exports. In 2003, Hong Kong’s China-related re-exports accounted for 22% of China’s global exports and 21% of its total imports7. This is not as easy a problem to correct as might first appear, because the value of the re-export trade includes a mark-up (or re-export margin) accruing to Hong Kong, and this should be regarded as service trade with Hong Kong rather than manufacturing trade with China.8
If one parts the veil of Hong Kong, then the trade weights for both China and its trading partners look different. In particular, in the RMB basket, a naive weight on Hong Kong overstates the flow of manufactured goods from China destined for final sale in Hong Kong and understates their flow to China’s other trading partners. From these other trading partners point of view, naive trade data overweights Hong Kong and underweights China. Hence there is a need to systematically adjust the reported trade data.
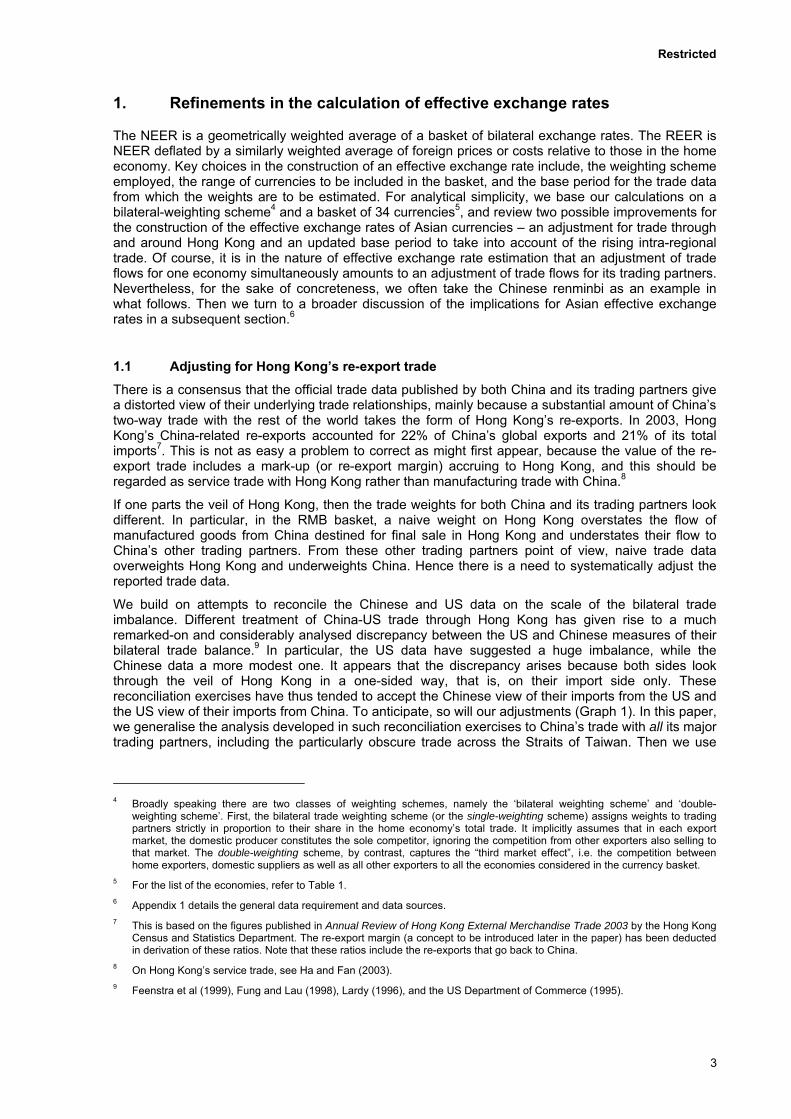
We build on attempts to reconcile the Chinese and US data on the scale of the bilateral trade imbalance. Different treatment of China-US trade through Hong Kong has given rise to a much remarked-on and considerably analysed discrepancy between the US and Chinese measures of their bilateral trade balance.9 In particular, the US data have suggested a huge imbalance, while the Chinese data a more modest one. It appears that the discrepancy arises because both sides look through the veil of Hong Kong in a one-sided way, that is, on their import side only. These reconciliation exercises have thus tended to accept the Chinese view of their imports from the US and the US view of their imports from China. To anticipate, so will our adjustments (Graph 1). In this paper, we generalise the analysis developed in such reconciliation exercises to China’s trade with all its major trading partners, including the particularly obscure trade across the Straits of Taiwan. Then we use
4 Broadly speaking there are two classes of weighting schemes, namely the ‘bilateral weighting scheme’ and ‘double-
weighting scheme’. First, the bilateral trade weighting scheme (or the single-weighting scheme) assigns weights to trading partners strictly in proportion to their share in the home economy’s total trade. It implicitly assumes that in each export market, the domestic producer constitutes the sole competitor, ignoring the competition from other exporters also selling to that market. The double-weighting scheme, by contrast, captures the “third market effect”, i.e. the competition between home exporters, domestic suppliers as well as all other exporters to all the economies considered in the currency basket.
5 For the list of the economies, refer to Table 1. 6 Appendix 1 details the general data requirement and data sources. 7 This is based on the figures published in Annual Review of Hong Kong External Merchandise Trade 2003 by the Hong Kong
Census and Statistics Department. The re-export margin (a concept to be introduced later in the paper) has been deducted in derivation of these ratios. Note that these ratios include the re-exports that go back to China.
8 On Hong Kong’s service trade, see Ha and Fan (2003). 9 Feenstra et al (1999), Fung and Lau (1998), Lardy (1996), and the US Department of Commerce (1995).
3
Restricted
adjusted trade data to derive improved weights for the effective baskets of the currencies of China and its trading partners. We do not generalise the adjustment for non-China related Hong Kong re-export trade or to entrepôt trade in Singapore (Box 1).
0
25
50
75
100
125
150
175
1999 2000 2001 2002 2003
US reported exports to China Adjusted US exports to China China’s reported imports from US
0
25
50
75
100
125
150
175
1999 2000 2001 2002 2003
US reported imports from ChinaAdjusted US imports from ChinaChina’s reported exports to US
Bilateral trade between China and the United States
United State exports to China United State imports from China
In billions of US dollars
Graph 1
Sources: UN Comtrade; national data; BIS calculations.
Box 1
Entrepôt trade in Asia not involving China
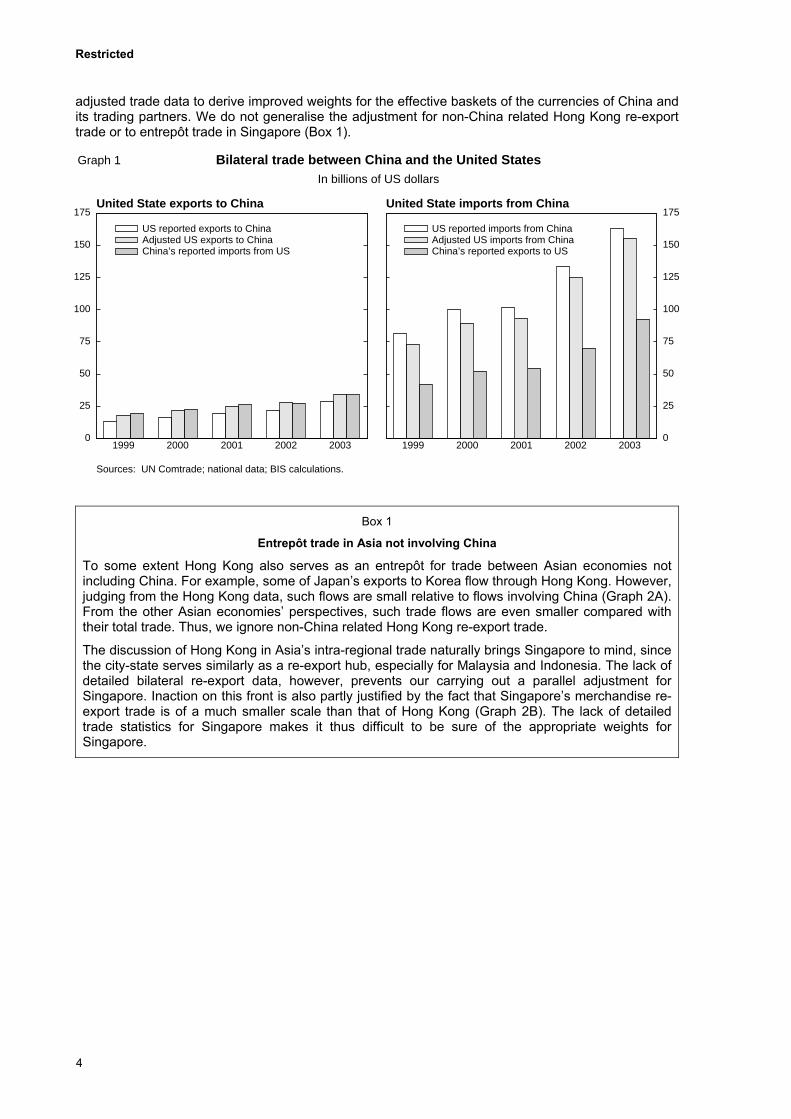
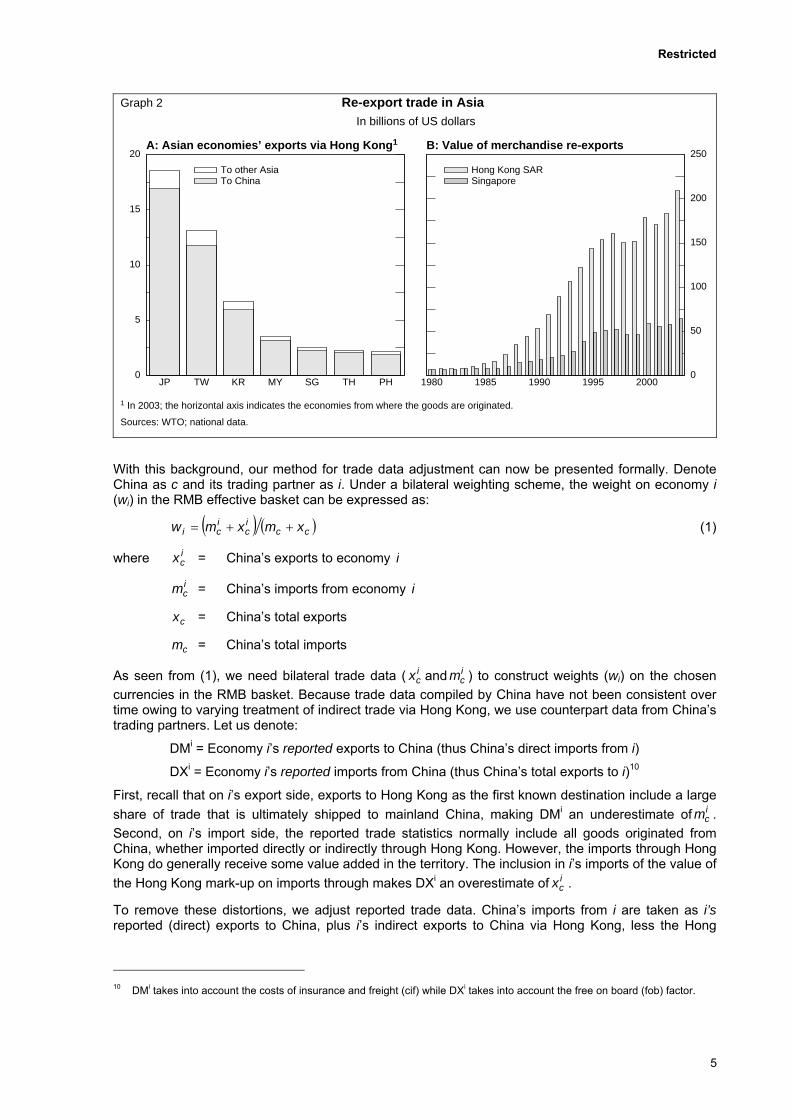
To some extent Hong Kong also serves as an entrepôt for trade between Asian economies not including China. For example, some of Japan’s exports to Korea flow through Hong Kong. However, judging from the Hong Kong data, such flows are small relative to flows involving China (Graph 2A). From the other Asian economies’ perspectives, such trade flows are even smaller compared with their total trade. Thus, we ignore non-China related Hong Kong re-export trade.
The discussion of Hong Kong in Asia’s intra-regional trade naturally brings Singapore to mind, since the city-state serves similarly as a re-export hub, especially for Malaysia and Indonesia. The lack of detailed bilateral re-export data, however, prevents our carrying out a parallel adjustment for Singapore. Inaction on this front is also partly justified by the fact that Singapore’s merchandise re-export trade is of a much smaller scale than that of Hong Kong (Graph 2B). The lack of detailed trade statistics for Singapore makes it thus difficult to be sure of the appropriate weights for Singapore.
4
Restricted
0
5
10
15
20
JP TW KR MY SG TH PH
To other AsiaTo China
0
50
100
150
200
250
1980 1985 1990 1995 2000
Hong Kong SARSingapore
1 In 2003; the horizontal axis indicates the economies from where the goods are originated.
Sources: WTO; national data.
Graph 2
In billions of US dollars
Re-export trade in Asia
A: Asian economies’ exports via Hong Kong1 B: Value of merchandise re-exports
With this background, our method for trade data adjustment can now be presented formally. Denote China as c and its trading partner as i. Under a bilateral weighting scheme, the weight on economy i (wi) in the RMB effective basket can be expressed as:
( ) ( )ccic
ici xmxmw ++= (1)
where = China’s exports to economy icx i
= China’s imports from economy icm i
= China’s total exports cx
= China’s total imports cm
As seen from (1), we need bilateral trade data ( and ) to construct weights (wicx i
cm i) on the chosen currencies in the RMB basket. Because trade data compiled by China have not been consistent over time owing to varying treatment of indirect trade via Hong Kong, we use counterpart data from China’s trading partners. Let us denote:
DMi = Economy i’s reported exports to China (thus China’s direct imports from i)
DXi = Economy i’s reported imports from China (thus China’s total exports to i)10
First, recall that on i’s export side, exports to Hong Kong as the first known destination include a large share of trade that is ultimately shipped to mainland China, making DMi an underestimate of . Second, on i’s import side, the reported trade statistics normally include all goods originated from China, whether imported directly or indirectly through Hong Kong. However, the imports through Hong Kong do generally receive some value added in the territory. The inclusion in i’s imports of the value of the Hong Kong mark-up on imports through makes DX
icm
i an overestimate of . icx
To remove these distortions, we adjust reported trade data. China’s imports from i are taken as i’s reported (direct) exports to China, plus i’s indirect exports to China via Hong Kong, less the Hong
10 DMi takes into account the costs of insurance and freight (cif) while DXi takes into account the free on board (fob) factor.
5
Restricted
Kong margin. At the same time, China’s exports to i should be i’s reported imports from China less the margin associated with the re-exports through Hong Kong. Algebraically,
= DMicm i + RMi (1 – h1) (2)
= DXicx i – RXi (h2) (3)
where RMi = Hong Kong’s re-exports originating from i and destined for China
RXi = Hong Kong’s re-exports originating from China and destined for i
h1 = Re-export margin for goods going from i via Hong Kong to China
h2 = Re-export margin for goods going from China via Hong Kong to i.
We rely on Hong Kong surveys of average margins on re-exports for h1 and h2.11 In 2003, the margin on China-sourced goods (h2) is higher at 24% than that on goods sourced elsewhere bound for China (h1) at 9%. This may reflect that income levels for skilled labour in Hong Kong are closer to that of China’s trading partners than China.
Stepping back, and changing the point of view to the trading partner, the adjustment adds to the China trade of most trading partners save Hong Kong. Basically, exports to China through Hong Kong are being added (with the small 9% margin deducted), while only the Hong Kong mark-up is being deducted from imports from China through Hong Kong.
This adjustment procedure is applied to 31 of China’s trading partners.12 Those receiving exceptional treatment are Taiwan, China (hereafter, Taiwan) and Hong Kong, which are addressed as special cases in Box 2. One point worthy of note is that our trade data revision involves not only the adjustment for China-related re-exports of Hong Kong. For Taiwan, we have to make allowances for the merchandise transshipment between China and Taiwan (not captured by Hong Kong’s re-export data), and for Hong Kong, its own domestic exports bound for China.
Throughout this paper, unadjusted trade data refers to that reported by the relevant authorities (except for China where we solely use counterpart data) and adjusted trade data refers to that derived from the adjustment procedures described above. The importance of these trade data adjustments can be illustrated by the example of the bilateral China-US trade imbalance (Graph 1). According to the US data, the bilateral US trade deficit with China was USD 135 billion in 2003. On the basis of China’s own data, the bilateral Sino-US trade deficit was only USD 59 billion. After the adjustment of the trade data, the bilateral trade imbalance was revised to USD 121 billion.13 We will highlight the important impact of trade data revision on both trade weights in the RMB basket and the RMB effective exchange rates by comparing the estimates using the adjusted trade data with those using unadjusted trade data.
Box 2
Special trade data adjustments for Hong Kong and Taiwan
Hong Kong is one of China’s biggest trading partners, serving uniquely as an entrepôt. However, in the RMB basket and in the baskets of China’s major trading partners, Hong Kong should weigh in as a much less important trading partner than the usually consulted trade data would imply. On the one hand, from Hong Kong’s perspective, its exports to China include it re-exports. But Hong Kong’s weight should be based on just
11 Alternative methods of estimating the markup are discussed in Feenstra et al (1999). To estimate h , they compare the unit-
value of Hong Kong imports from China and the unit-value of Hong Kong re-exports from China to the US (and to the world). However, the same methodology applied to the estimation of h (markup from US via Hong Kong to China) sometimes produces negative numbers. The authors ascribed this impossible result to data measurement errors.
2
1
12 For economies with re-export trade via Hong Kong to China that is not reported by the Hong Kong authority, we estimate them using data of an economy of geographical proximity. For example, we use Mexico (its ratio of of exports/imports via Hong Kong to/from China) as a proxy for Brazil and Chile.
13 The estimate is closer to the US figure than the Chinese figure not because the US measure is in principle better than the Chinese measure. Both countries’ import data are not far from our estimates. It is just that the US imports (as reported by the US) are larger than Chinese imports (as reported by China).
6
Restricted
its domestic exports (goods manufactured locally in Hong Kong), as reported by the Hong Kong government. On the other hand, Hong Kong’s imports include goods that are subsequently re-exported. But Hong Kong’s weight should be based on just retained imports, ie, goods imported and consumed locally in Hong Kong. Such data are unavailable and have to be estimated by eliminating the re-export elements from the total imports, taking into account the re-export margin. After these modifications, Hong Kong’s domestic exports to China represent China’s true (free on board) imports from Hong Kong; likewise, Hong Kong’s retained imports (minus cost of insurance and freight) sourced from China represent China’s true exports to Hong Kong. With such an adjustment, Hong Kong’s own share in China’s total manufacturing imports for 1999-2001 declines from 5% to 4%, while its share of China’s manufacturing exports falls from 24% to 4%. The reduction of weights on Hong Kong is redistributed to other economies: Japan’s share of China’s exports rises from 14% to 18% and US’s share rises from 28% to 35%.
Trade data between Mainland China and Taiwan have not been accurately recorded. The published Taiwanese data fail to report most of its “indirect” trade with China and thus discrepancies between Mainland and Taiwan trade data are large, especially in Taiwan’s exports to China. Indirect trade across the Taiwan Strait takes two different forms: re-exports through Hong Kong and offshore transshipments via Hong Kong. The key difference between these two is that the former are cleared by Hong Kong customs (and thus recorded in Hong Kong’s statistics as re-exports) while the latter are not. Transshipments are the nautical version of the flights across the Straits around lunar new year in 2005, that had to enter Hong Kong airspace en route. As a result of such sail-bys, using Hong Kong’s re-export data alone are not sufficient to correct for the cross-Strait inconsistency in trade data. Two agencies in Taiwan (Mainland Affairs Council and Bureau of Foreign Trade14) produce separate estimates of the cross-Strait trade flows, taking into account both the re-exports and transshipments. We use the simple average of these two estimates in our calculations. Since 2002, the two agencies have unified their statistics. Given the controversy over this trade, it is possible that there are biases in these estimates. We have not, however, been able to form a prior regarding the size, or indeed sign, of any such bias and thus we take them as a usable measure of the cross-Strait trade patterns.
1.2 Updating the base year
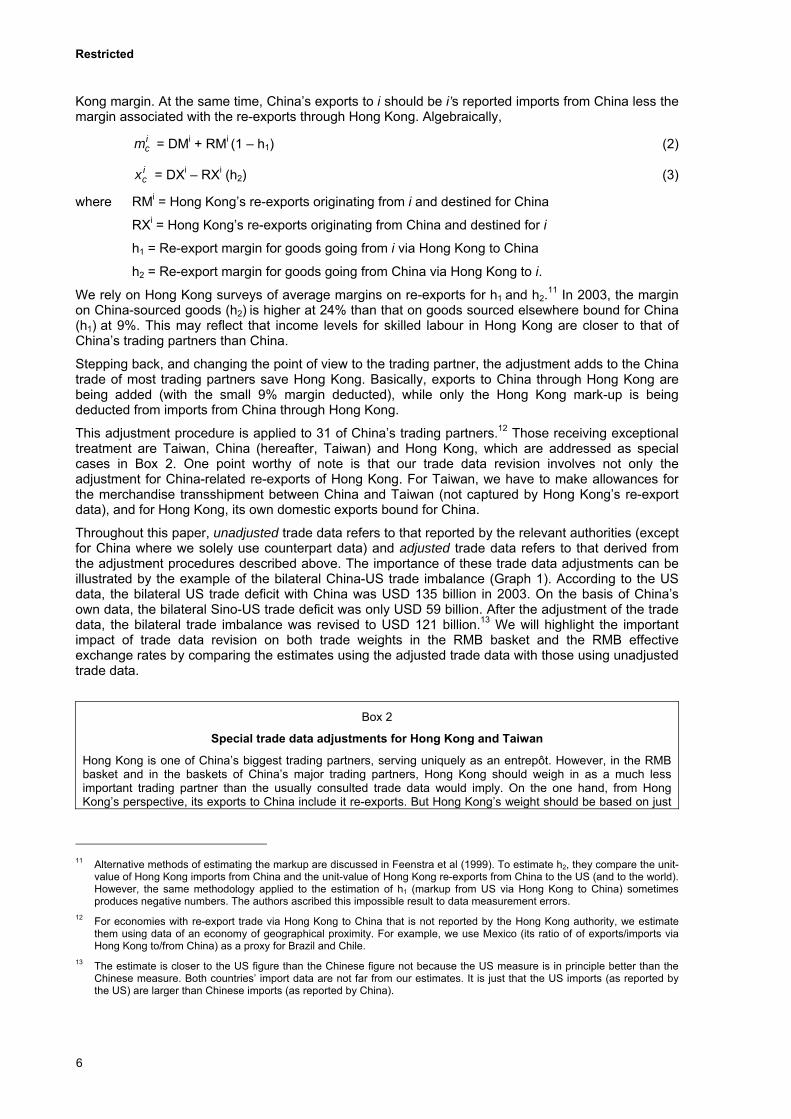
On the presumption that trade patterns tend to be fairly stable over time, a frequent practice in the calculation of effective exchange rates is to base trade-weights on trade data for some base year and not to update the base year for an extended period. However, the rapid economic integration within Asia in the last decade (despite the Asian crisis, regional trade picked up sharply afterwards, see Graph 3A) shows that trade patterns can evolve quickly. Moreover, regional trade agreements under discussion among ASEAN15 and China, Japan and Korea (the “ASEAN +3”), could quicken the change in these patterns. Use of weights based on decade-old trade patterns thus runs the risk of overweighting Europe and North America and underweighting Asia.
Moreover, China’s external trade has grown particularly rapidly and has shifted towards manufacturing (Graph 3B). China’s share in global trade rose from less than 2% in the early 1990s to more than 5% in 2003. Over the same period, China’s exports have shifted away from primary to manufactured goods as its economy industrialised, to over 90% of its total exports in 2003. In the process, China’s imports have increasingly come from the rest of Asia while its exports have increasingly gone to the US market. These facts highlight China’s emergence as a major link in the global manufacturing supply chain, specialising in labour-intensive activities. With China’s accession into the WTO, these trade patterns are likely to evolve further.
To accommodate these rapid changes in Asia’s, particularly China’s, trade patterns, we update our trade weights and effective exchange rate indices based on 1991 trade data to a more recent base period of 1999-2001. Comparison of the results based on earlier and later data can shed light on the implications of the shifting trade patters in Asia.16
14 See Appendix 1. 15 Association of South East Asian Nations, comprising Brunei Darussalam, Cambodia, Indonesia, Laos, Malaysia, Myanmar,
the Philippines, Singapore, Thailand and Vietnam. 16 Admittedly, an ideal approach is to update trade weights regularly and ‘chain-link’ the effective exchange rate indices
calculated with contemporaneous trade weights, as is the practice of the US Federal Reserve and the OECD, where weights are updated yearly.
7
Restricted
40
45
50
55
92 93 94 95 96 97 98 99 00 01 02 0370
75
80
85
90
95
0
1
2
3
4
5
6
92 93 94 95 96 97 98 99 00 01 02 03
Manufacturing exports (lhs)2
Share of world trade (rhs)
1 Total trade among China, Hong Kong SAR, India, Indonesia, Japan, Korea, Malaysia, the Philippines, Singapore, Thailand andTaiwan (China); as a share of their total global trade. 2 Goods classified under SITC (revision 3) sections 5 through 8; as a shareof total exports.
Sources: IMF; UN Comtrade.
Graph 3
In per cent
Asia’s changing trade patterns
A: Intra-regional trade1 B: China’s trade: scale and composition
2. Refining the RMB effective exchange rate
This section and the next bring together the above two refinements in the determination of weights and their construction of measures of effective exchange rates. This section focuses on the Chinese renminbi, and the next section analyses other Asian currencies. To facilitate the discussion, we compare the calculation results under two scenarios:
• Base scenario: unadjusted trade data and 1991 trade weights
• Refined scenario: adjusted trade data and 1999-2001 trade weights
These two scenarios are compared in terms of both the trade weights in the RMB basket and the RMB effective exchange rate indices. It should be recognised at the outset that, while the trade weights are influenced by both refinements, measures of effective exchange rates are also affected by interactions between the new weights and the paths of exchange rates and prices as well. We first analyse the combined effects of the refinements on the trade weights and effective exchange rates, and then discuss the independent impact of each refinement separately.
2.1 Comparison of basket weights with both refinements
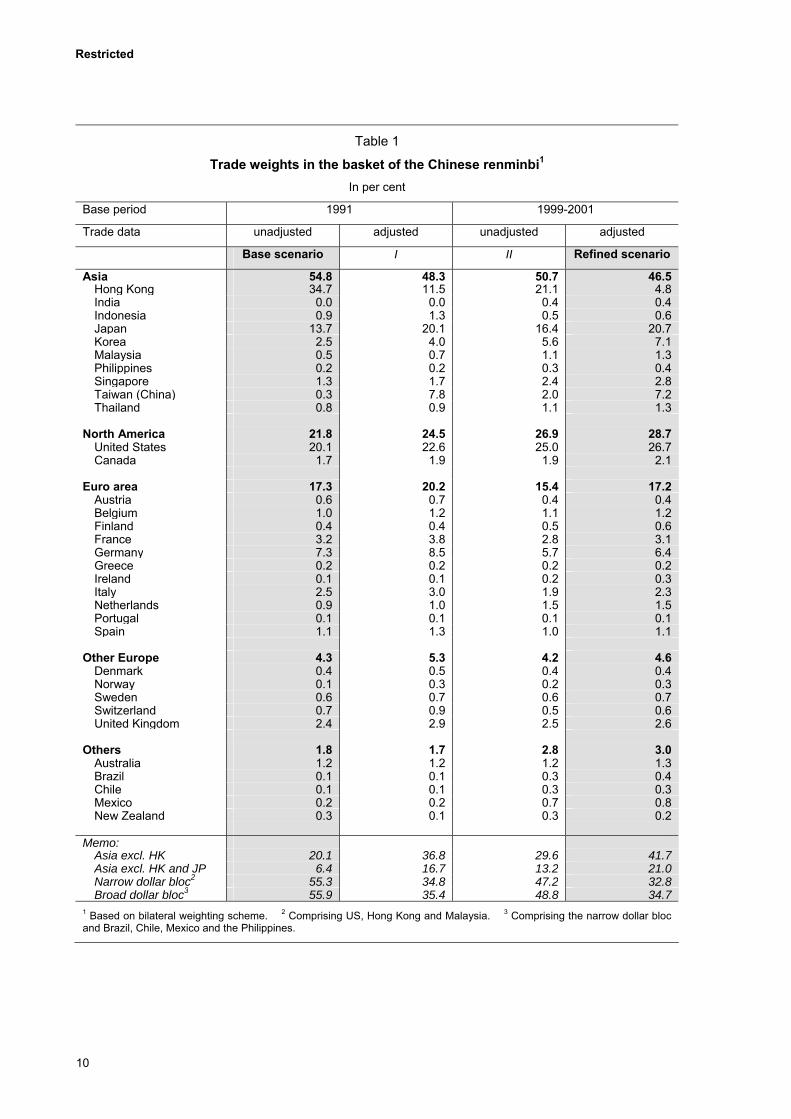
A juxtaposition of the trade weights in the RMB basket under the two scenarios results in two striking contrasts (Table 1). First, the combined trade weight on Asia (including Japan) in the RMB basket decreases substantially with the refinements. In particular, it falls by 8 percentage points, from 55% under the base scenario to 47% under the refined scenario. Within Asia, the decline of the Asian weight is more than entirely due to the sharp reduction in the weight of Hong Kong (from 35% under the base scenario to only 5% under the refined scenario). The refined scenario increases the weights on all the other Asian economies in the basket, most notably Taiwan, Korea and Japan. Similarly, the weight on the US, China’s single largest export market, increases by 7 percentage points. The weight
8
Restricted
of the euro area remains more or less the same under both scenarios. As is demonstrated below, this somewhat surprising result reflects that the higher weight on Europe from looking through the veil of Hong Kong is offset by the declining importance of Europe as a trading partner of China over the 1990s.17
A second, and less obvious, contrast is that the refined scenario puts a lighter weight on the US dollar. This is true in relation to a narrow “dollar bloc” comprising the not only the US but also Hong Kong and Malaysia, with their pegged currencies. In the RMB basket, the weight on this dollar bloc would be almost halved, from 55% under the base scenario to just 33%, owing to the redistribution of Hong Kong’s trade weight to economies other than the US. This is also true in relation to a broader “dollar bloc” including the Philippines, Brazil, Chile and Mexico.18 We return to this issue in section 4.2 below.
2.2 Comparison of effective exchange rates with both refinements
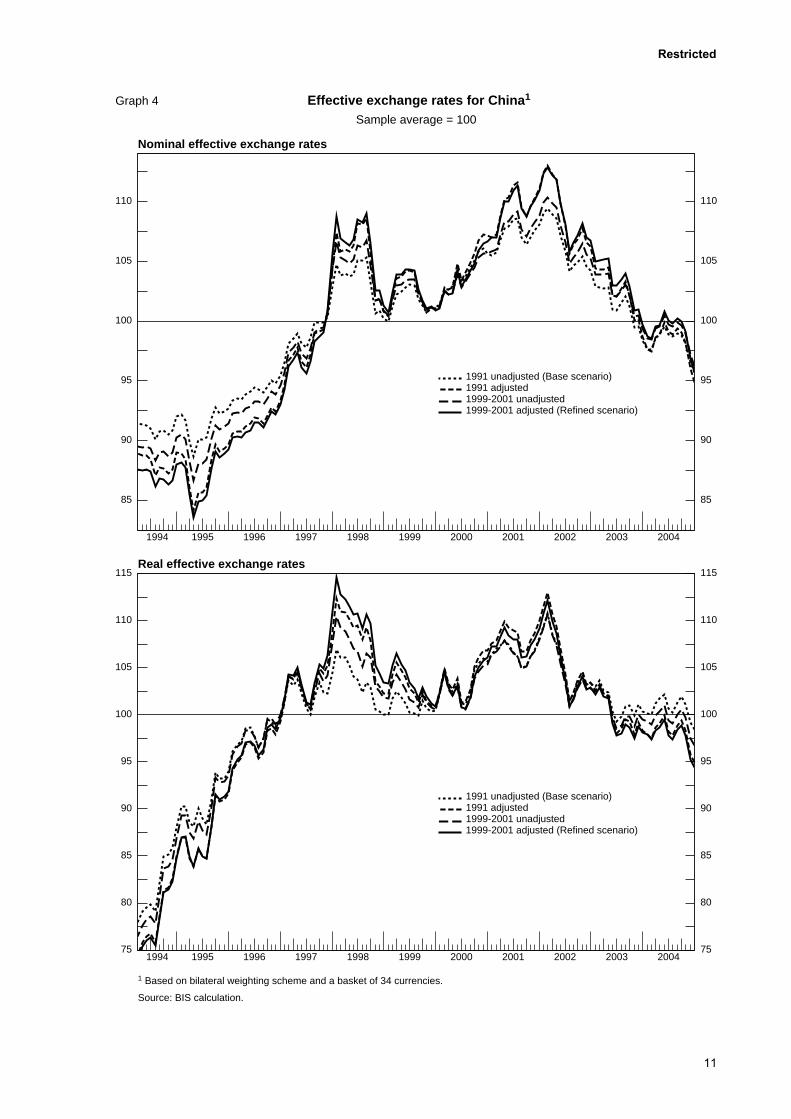
The RMB NEERs and REERs under the base and refined scenarios show similarities and differences (Graph 4). On the one hand, the RMB effective exchange rates broadly follow similar movements under the two scenarios, with a correlation coefficient of 98% for the NEER and 96% for the REER in the sample shown. On the other hand, however, the effective exchange rates under these two scenarios can sometimes diverge by as much as several percentage points. In particular, the refined NEER shows a much sharper appreciation of the RMB both during the Asian crisis around late 1997 and during the final part of the dollar strengthening cycle into the first quarter of 2002. By contrast, the gap between the REER indices under the two scenarios seems to be relatively modest, probably owing to the offsetting price inflation movements. In other words, deflation in the quite open Chinese economy at the latter stages of the US dollar’s appreciation prevented the RMB from appreciating as much in real terms.
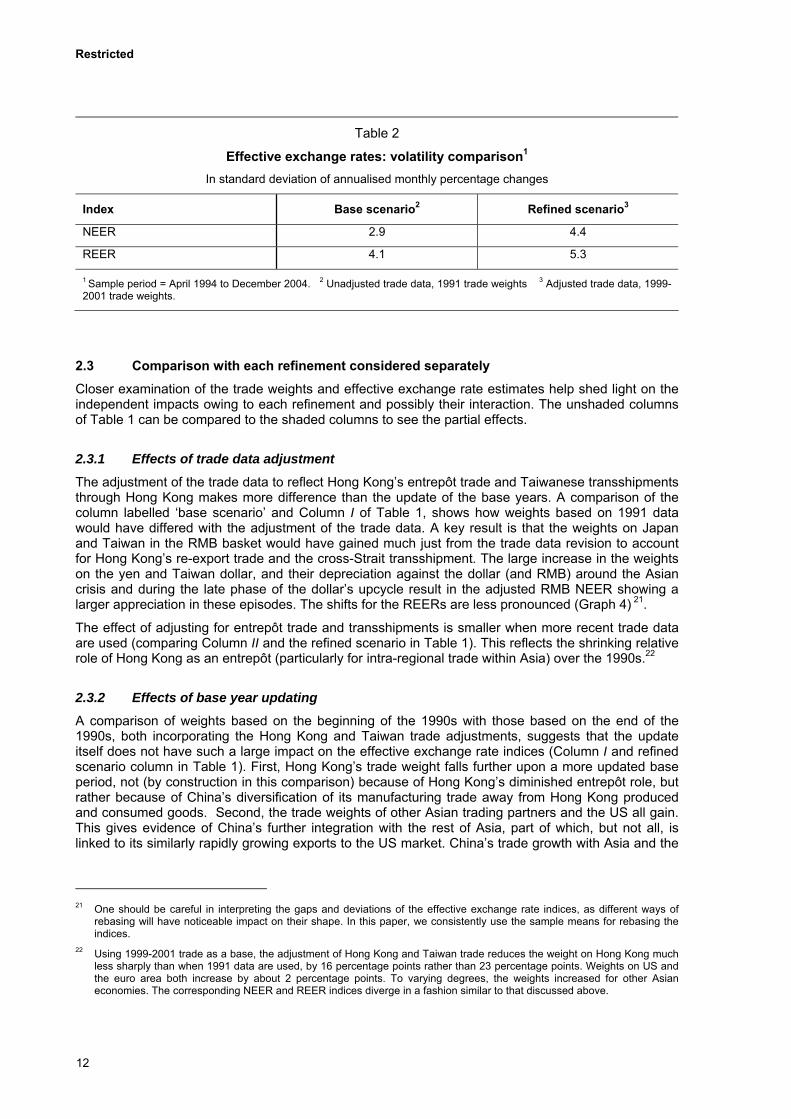
Overall, the RMB effective exchange rates under the refined scenario appear to be more volatile than those under the base scenario. Table 2 confirms this visual impression for both the nominal and real effective exchange rates. The most important reason behind the increased effective exchange rates volatility as measured under the refined scenario is the sharply reduced dollar bloc weight in the RMB basket after the refinements. Given the history of RMB’s tight dollar link, an RMB basket assigning a smaller dollar bloc weight will translate fluctuations in the bilateral dollar rates of other trading partners’ currencies into an increase in the effective volatility of the RMB.19 This finding again underscores the importance of properly measuring the trade weights in the effective exchange rate estimation, since an overweighting of the dollar bloc conveys an exaggerated impression of currency stability under a dollar peg.20
17 This pair of offsetting effects, however, has no counterpart in the weight in the euro area effective exchange rate on China
because China has become a more important trading partner for Europe over the same decade. 18 This somewhat broader “dollar bloc” would show a reduction of the weight from 55.9% to 34.7%. 19 Given the paths of other bilateral dollar exchange rates, the effective volatility as calculated depends on the weights
assigned to different currencies in the basket. At the limit, a 100% weight on the dollar bloc means that the bilateral dollar exchange rate and effective exchange rate are essentially the same. In other words, under a tight dollar link and a (misassigned) 100% weight on the dollar bloc, the RMB volatility would be zero in both effective and bilateral terms.
20 Note also that the RMB REERs are more volatile than their nominal counterparts under both scenarios. This may reflect instability in the inflation process in China, with food bulking large in the consumer price index.
9
Restricted
Table 1
Trade weights in the basket of the Chinese renminbi1
In per cent
Base period 1991 1999-2001
Trade data unadjusted adjusted unadjusted adjusted
Base scenario I II Refined scenario
Asia 54.8 48.3 50.7 46.5Hong Kong 34.7 11.5 21.1 4.8India 0.0 0.0 0.4 0.4Indonesia 0.9 1.3 0.5 0.6Japan 13.7 20.1 16.4 20.7Korea 2.5 4.0 5.6 7.1Malaysia 0.5 0.7 1.1 1.3Philippines 0.2 0.2 0.3 0.4Singapore 1.3 1.7 2.4 2.8Taiwan (China) 0.3 7.8 2.0 7.2Thailand 0.8 0.9 1.1 1.3
North America 21.8 24.5 26.9 28.7
United States 20.1 22.6 25.0 26.7Canada 1.7 1.9 1.9 2.1
Euro area 17.3 20.2 15.4 17.2
Austria 0.6 0.7 0.4 0.4Belgium 1.0 1.2 1.1 1.2Finland 0.4 0.4 0.5 0.6France 3.2 3.8 2.8 3.1Germany 7.3 8.5 5.7 6.4Greece 0.2 0.2 0.2 0.2Ireland 0.1 0.1 0.2 0.3Italy 2.5 3.0 1.9 2.3Netherlands 0.9 1.0 1.5 1.5Portugal 0.1 0.1 0.1 0.1Spain 1.1 1.3 1.0 1.1
Other Europe 4.3 5.3 4.2 4.6
Denmark 0.4 0.5 0.4 0.4Norway 0.1 0.3 0.2 0.3Sweden 0.6 0.7 0.6 0.7Switzerland 0.7 0.9 0.5 0.6United Kingdom 2.4 2.9 2.5 2.6
Others 1.8 1.7 2.8 3.0
Australia 1.2 1.2 1.2 1.3Brazil 0.1 0.1 0.3 0.4Chile 0.1 0.1 0.3 0.3Mexico 0.2 0.2 0.7 0.8New Zealand 0.3 0.1 0.3 0.2
Memo: Asia excl. HK 20.1 36.8 29.6 41.7Asia excl. HK and JP 6.4 16.7 13.2 21.0Narrow dollar bloc2 55.3 34.8 47.2 32.8Broad dollar bloc3 55.9 35.4 48.8 34.7
1 Based on bilateral weighting scheme. 2 Comprising US, Hong Kong and Malaysia. 3 Comprising the narrow dollar bloc and Brazil, Chile, Mexico and the Philippines.
10
Restricted
85
90
95
100
105
110
85
90
95
100
105
110
1994 1995 1996 1997 1998 1999 2000 2001 2002 2003 2004
1991 unadjusted (Base scenario) 1991 adjusted 1999-2001 unadjusted 1999-2001 adjusted (Refined scenario)
75
80
85
90
95
100
105
110
115
75
80
85
90
95
100
105
110
115
1994 1995 1996 1997 1998 1999 2000 2001 2002 2003 2004
1991 unadjusted (Base scenario) 1991 adjusted 1999-2001 unadjusted 1999-2001 adjusted (Refined scenario)
Effective exchange rates for China1
Nominal effective exchange rates
Real effective exchange rates
Graph 4
Sample average = 100
1 Based on bilateral weighting scheme and a basket of 34 currencies.
Source: BIS calculation.
11
Restricted
Table 2
Effective exchange rates: volatility comparison1
In standard deviation of annualised monthly percentage changes
Index Base scenario2 Refined scenario3
NEER 2.9 4.4
REER 4.1 5.3
1 Sample period = April 1994 to December 2004. 2 Unadjusted trade data, 1991 trade weights 3 Adjusted trade data, 1999-2001 trade weights.
2.3 Comparison with each refinement considered separately
Closer examination of the trade weights and effective exchange rate estimates help shed light on the independent impacts owing to each refinement and possibly their interaction. The unshaded columns of Table 1 can be compared to the shaded columns to see the partial effects.
2.3.1 Effects of trade data adjustment
The adjustment of the trade data to reflect Hong Kong’s entrepôt trade and Taiwanese transshipments through Hong Kong makes more difference than the update of the base years. A comparison of the column labelled ‘base scenario’ and Column I of Table 1, shows how weights based on 1991 data would have differed with the adjustment of the trade data. A key result is that the weights on Japan and Taiwan in the RMB basket would have gained much just from the trade data revision to account for Hong Kong’s re-export trade and the cross-Strait transshipment. The large increase in the weights on the yen and Taiwan dollar, and their depreciation against the dollar (and RMB) around the Asian crisis and during the late phase of the dollar’s upcycle result in the adjusted RMB NEER showing a larger appreciation in these episodes. The shifts for the REERs are less pronounced (Graph 4) 21.
The effect of adjusting for entrepôt trade and transshipments is smaller when more recent trade data are used (comparing Column II and the refined scenario in Table 1). This reflects the shrinking relative role of Hong Kong as an entrepôt (particularly for intra-regional trade within Asia) over the 1990s.22
2.3.2 Effects of base year updating
A comparison of weights based on the beginning of the 1990s with those based on the end of the 1990s, both incorporating the Hong Kong and Taiwan trade adjustments, suggests that the update itself does not have such a large impact on the effective exchange rate indices (Column I and refined scenario column in Table 1). First, Hong Kong’s trade weight falls further upon a more updated base period, not (by construction in this comparison) because of Hong Kong’s diminished entrepôt role, but rather because of China’s diversification of its manufacturing trade away from Hong Kong produced and consumed goods. Second, the trade weights of other Asian trading partners and the US all gain. This gives evidence of China’s further integration with the rest of Asia, part of which, but not all, is linked to its similarly rapidly growing exports to the US market. China’s trade growth with Asia and the
21 One should be careful in interpreting the gaps and deviations of the effective exchange rate indices, as different ways of
rebasing will have noticeable impact on their shape. In this paper, we consistently use the sample means for rebasing the indices.
22 Using 1999-2001 trade as a base, the adjustment of Hong Kong and Taiwan trade reduces the weight on Hong Kong much less sharply than when 1991 data are used, by 16 percentage points rather than 23 percentage points. Weights on US and the euro area both increase by about 2 percentage points. To varying degrees, the weights increased for other Asian economies. The corresponding NEER and REER indices diverge in a fashion similar to that discussed above.
12
Restricted
US has outpaced that with Europe, and as a result the trade weights for most European economies decrease. Thus, whereas seeing through the veil of Hong Kong raises the weight on the euro area (by 3% based on 1991 trade), updating the base period lowers it (by 3% based on adjusted trade data). The fact that China’s trade with the US has kept up with that with Asia means that the effect from updating the base year on the effective exchange rates is limited.
To sum up, the overall differences on the RMB effective exchange rates under the base and refined scenarios are largely attributable to the trade data adjustment. Looking forward, the importance of the Hong Kong re-export adjustment may diminish further, since it is unlikely that the Closer Economic Partnership Agreement will materially reverse the trend of market share loss of Hong Kong’s entrepôt trade. Integration across the Taiwan Strait, however, may have a way to go (and the transshipment adjustment may bulk larger over time—or disappear entirely).
3. Refining the effective exchange rates indices of other Asian currencies
Taking account of Asia’s entrepôt and rising intra-regional trade matters not only to the effective exchange rate of the renminbi but also to those of other Asian currencies. In this section we apply the refinements to other Asian effective exchange rates. Where available, effective exchange rate weights of the respective central banks are compared to our calculations. This provides background to the policy-oriented analysis in the next section.
3.1 Weights on China and Hong Kong
In the previous section, we saw how taking account of the entrepôt trade through Hong Kong tends to redistribute the trade weights in the RMB basket away from Hong Kong and toward other trading partners. From the standpoint of the trading partners, this same adjustment tends to redistribute trade weights away from Hong Kong and toward China.
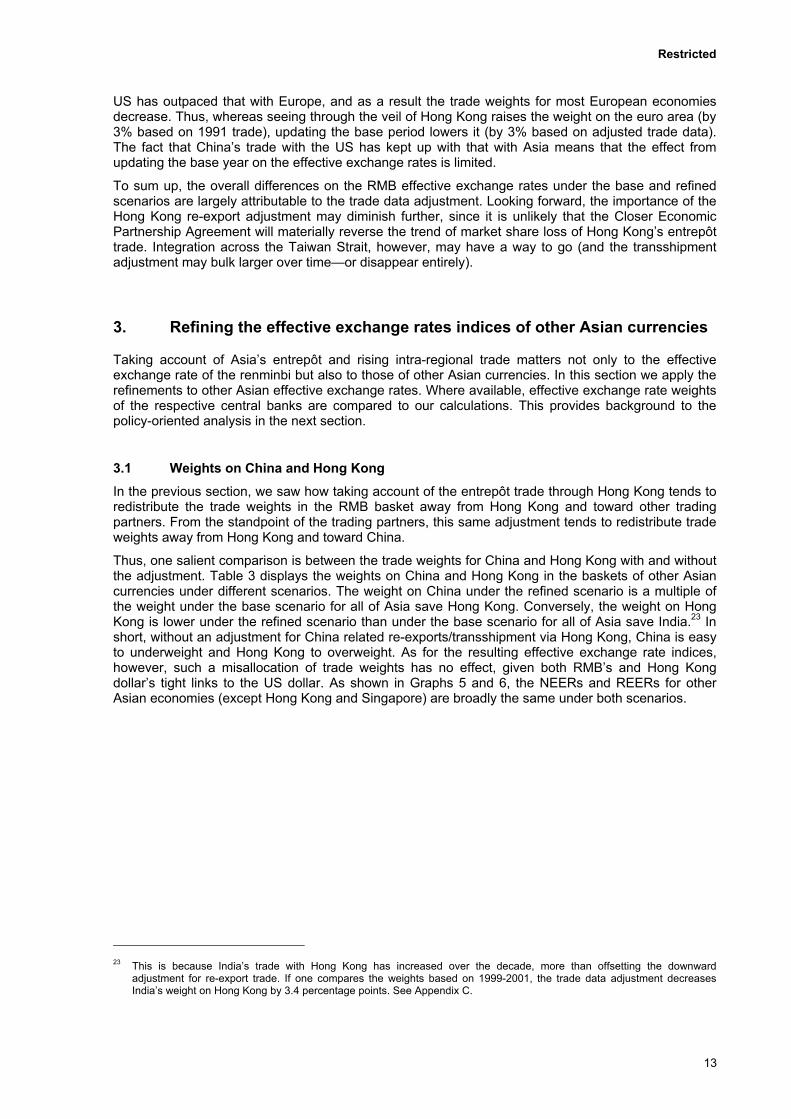
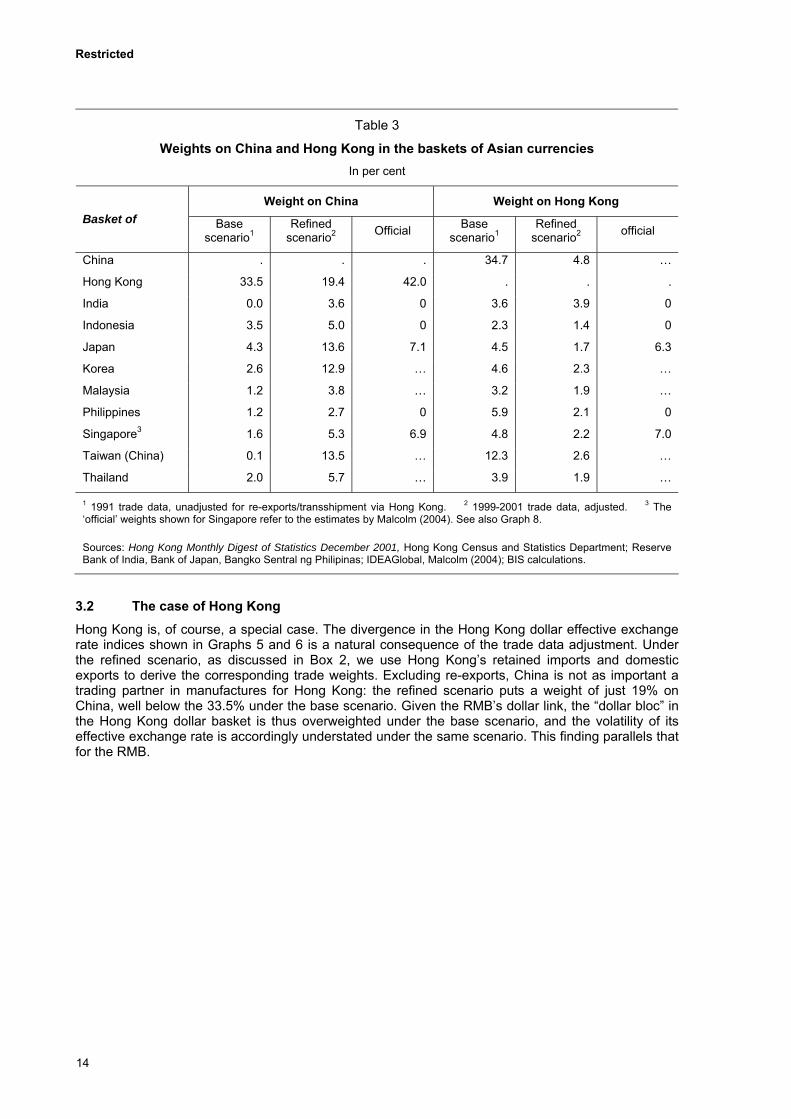
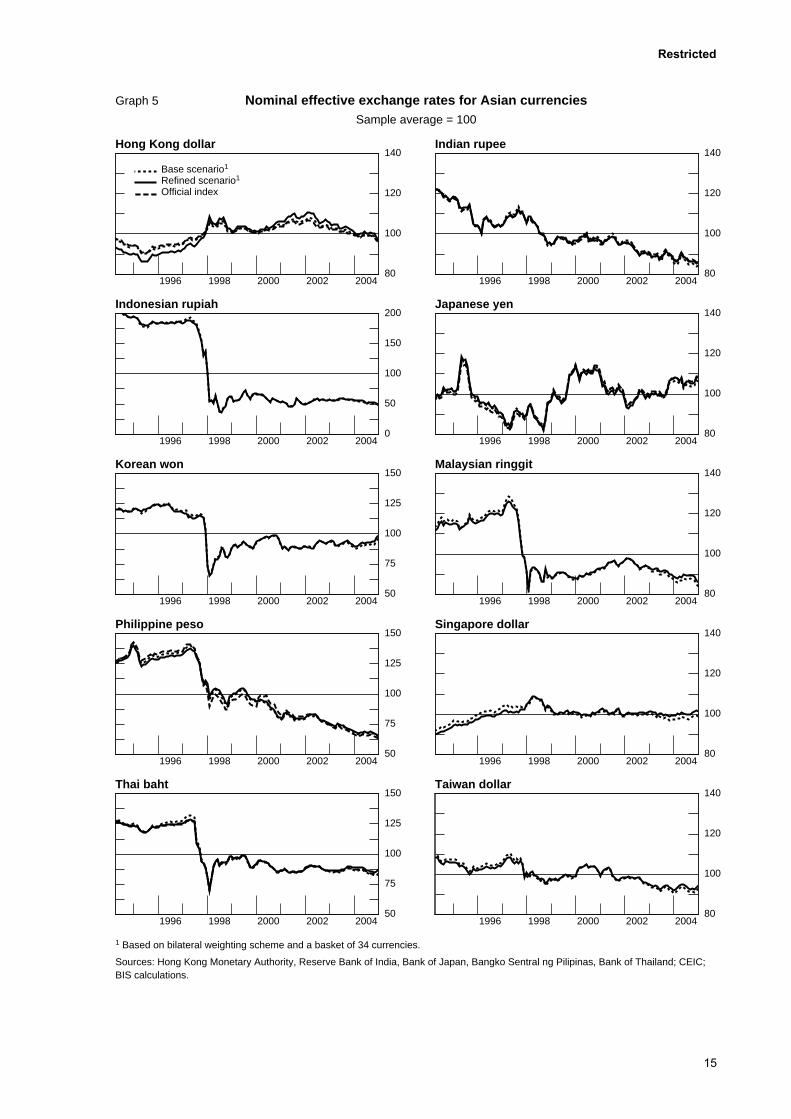
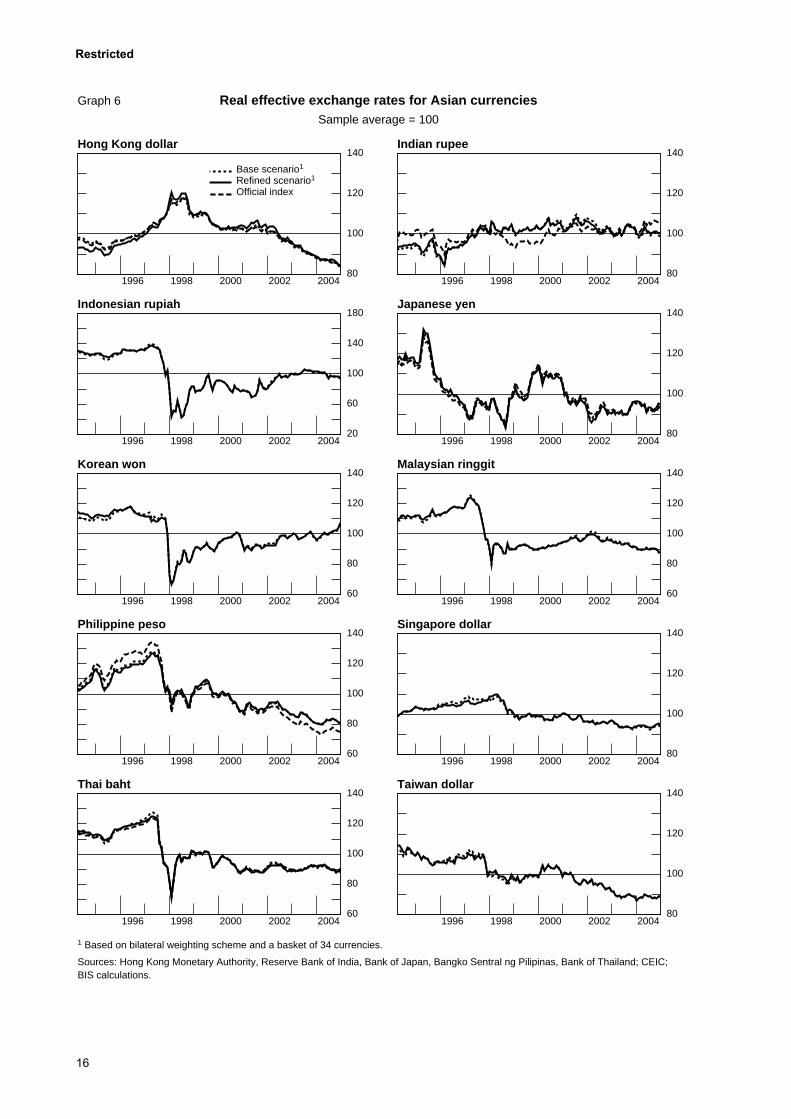
Thus, one salient comparison is between the trade weights for China and Hong Kong with and without the adjustment. Table 3 displays the weights on China and Hong Kong in the baskets of other Asian currencies under different scenarios. The weight on China under the refined scenario is a multiple of the weight under the base scenario for all of Asia save Hong Kong. Conversely, the weight on Hong Kong is lower under the refined scenario than under the base scenario for all of Asia save India.23 In short, without an adjustment for China related re-exports/transshipment via Hong Kong, China is easy to underweight and Hong Kong to overweight. As for the resulting effective exchange rate indices, however, such a misallocation of trade weights has no effect, given both RMB’s and Hong Kong dollar’s tight links to the US dollar. As shown in Graphs 5 and 6, the NEERs and REERs for other Asian economies (except Hong Kong and Singapore) are broadly the same under both scenarios.
23 This is because India’s trade with Hong Kong has increased over the decade, more than offsetting the downward
adjustment for re-export trade. If one compares the weights based on 1999-2001, the trade data adjustment decreases India’s weight on Hong Kong by 3.4 percentage points. See Appendix C.
13
Restricted
Table 3
Weights on China and Hong Kong in the baskets of Asian currencies In per cent
Weight on China Weight on Hong Kong Basket of Base
scenario1Refined
scenario2 Official Base scenario1
Refined scenario2 official
China . . . 34.7 4.8 …
Hong Kong 33.5 19.4 42.0 . . .
India 0.0 3.6 0 3.6 3.9 0
Indonesia 3.5 5.0 0 2.3 1.4 0
Japan 4.3 13.6 7.1 4.5 1.7 6.3
Korea 2.6 12.9 … 4.6 2.3 …
Malaysia 1.2 3.8 … 3.2 1.9 …
Philippines 1.2 2.7 0 5.9 2.1 0
Singapore3 1.6 5.3 6.9 4.8 2.2 7.0
Taiwan (China) 0.1 13.5 … 12.3 2.6 …
Thailand 2.0 5.7 … 3.9 1.9 …
1 1991 trade data, unadjusted for re-exports/transshipment via Hong Kong. 2 1999-2001 trade data, adjusted. 3 The ‘official’ weights shown for Singapore refer to the estimates by Malcolm (2004). See also Graph 8.
Sources: Hong Kong Monthly Digest of Statistics December 2001, Hong Kong Census and Statistics Department; Reserve Bank of India, Bank of Japan, Bangko Sentral ng Philipinas; IDEAGlobal, Malcolm (2004); BIS calculations.
3.2 The case of Hong Kong
Hong Kong is, of course, a special case. The divergence in the Hong Kong dollar effective exchange rate indices shown in Graphs 5 and 6 is a natural consequence of the trade data adjustment. Under the refined scenario, as discussed in Box 2, we use Hong Kong’s retained imports and domestic exports to derive the corresponding trade weights. Excluding re-exports, China is not as important a trading partner in manufactures for Hong Kong: the refined scenario puts a weight of just 19% on China, well below the 33.5% under the base scenario. Given the RMB’s dollar link, the “dollar bloc” in the Hong Kong dollar basket is thus overweighted under the base scenario, and the volatility of its effective exchange rate is accordingly understated under the same scenario. This finding parallels that for the RMB.
14
Restricted
80
100
120
140
1996 1998 2000 2002 200480
100
120
140
1996 1998 2000 2002 2004
80
100
120
140
1996 1998 2000 2002 2004
80
100
120
140
1996 1998 2000 2002 2004
80
100
120
140
1996 1998 2000 2002 2004
80
100
120
140
1996 1998 2000 2002 2004
0
50
100
150
200
1996 1998 2000 2002 2004
50
75
100
125
150
1996 1998 2000 2002 2004
50
75
100
125
150
1996 1998 2000 2002 2004
50
75
100
125
150
1996 1998 2000 2002 2004
Base scenario1 Refined scenario1
Official index
Nominal effective exchange rates for Asian currencies
Hong Kong dollar Indian rupee
Indonesian rupiah Japanese yen
Korean won Malaysian ringgit
Philippine peso Singapore dollar
Thai baht Taiwan dollar
Graph 5
Sample average = 100
1 Based on bilateral weighting scheme and a basket of 34 currencies.
Sources: Hong Kong Monetary Authority, Reserve Bank of India, Bank of Japan, Bangko Sentral ng Pilipinas, Bank of Thailand; CEIC;BIS calculations.
15
Restricted
80
100
120
140
1996 1998 2000 2002 200480
100
120
140
1996 1998 2000 2002 2004
80
100
120
140
1996 1998 2000 2002 2004
80
100
120
140
1996 1998 2000 2002 2004
80
100
120
140
1996 1998 2000 2002 2004
60
80
100
120
140
1996 1998 2000 2002 200460
80
100
120
140
1996 1998 2000 2002 2004
60
80
100
120
140
1996 1998 2000 2002 2004
60
80
100
120
140
1996 1998 2000 2002 2004
20
60
100
140
180
1996 1998 2000 2002 2004
Base scenario1 Refined scenario1
Official index
Real effective exchange rates for Asian currencies
Hong Kong dollar Indian rupee
Indonesian rupiah Japanese yen
Korean won Malaysian ringgit
Philippine peso Singapore dollar
Thai baht Taiwan dollar
Graph 6
Sample average = 100
1 Based on bilateral weighting scheme and a basket of 34 currencies.
Sources: Hong Kong Monetary Authority, Reserve Bank of India, Bank of Japan, Bangko Sentral ng Pilipinas, Bank of Thailand; CEIC;BIS calculations.
16
Restricted
3.3 The case of Singapore
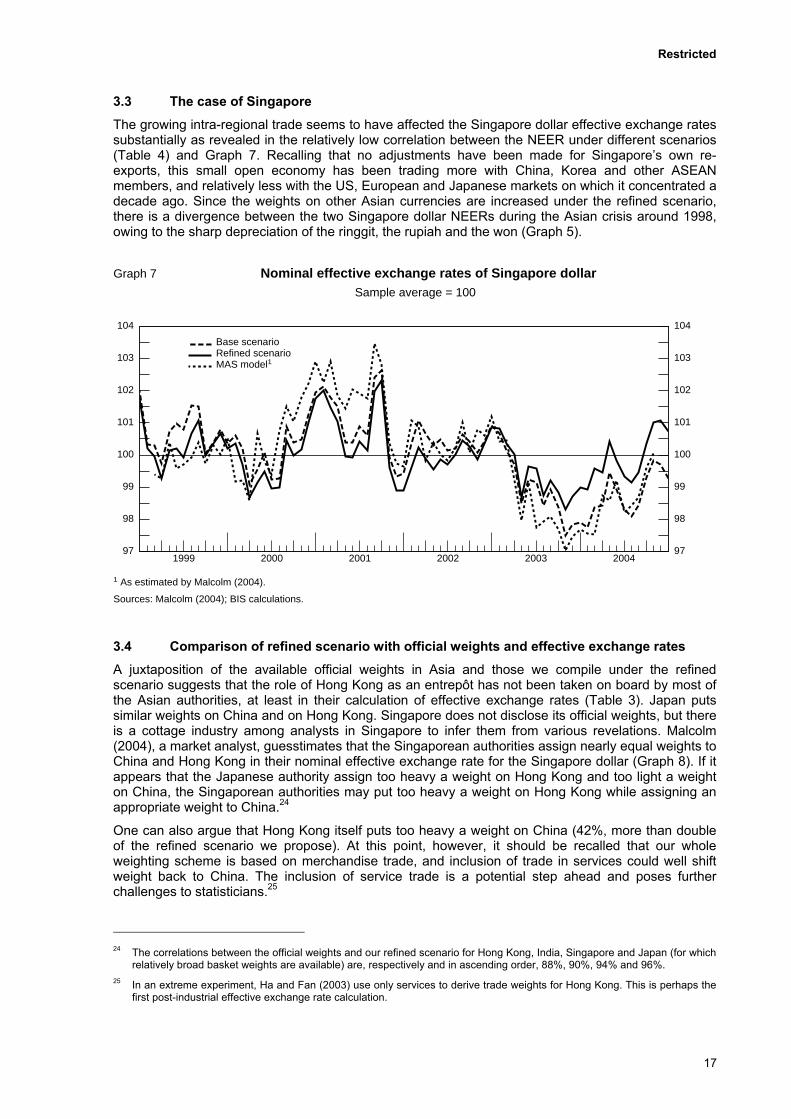
The growing intra-regional trade seems to have affected the Singapore dollar effective exchange rates substantially as revealed in the relatively low correlation between the NEER under different scenarios (Table 4) and Graph 7. Recalling that no adjustments have been made for Singapore’s own re-exports, this small open economy has been trading more with China, Korea and other ASEAN members, and relatively less with the US, European and Japanese markets on which it concentrated a decade ago. Since the weights on other Asian currencies are increased under the refined scenario, there is a divergence between the two Singapore dollar NEERs during the Asian crisis around 1998, owing to the sharp depreciation of the ringgit, the rupiah and the won (Graph 5).
97
98
99
100
101
102
103
104
97
98
99
100
101
102
103
104
1999 2000 2001 2002 2003 2004
Base scenario Refined scenarioMAS model1
1 As estimated by Malcolm (2004).
Sources: Malcolm (2004); BIS calculations.
Graph 7
Sample average = 100
Nominal effective exchange rates of Singapore dollar
3.4 Comparison of refined scenario with official weights and effective exchange rates
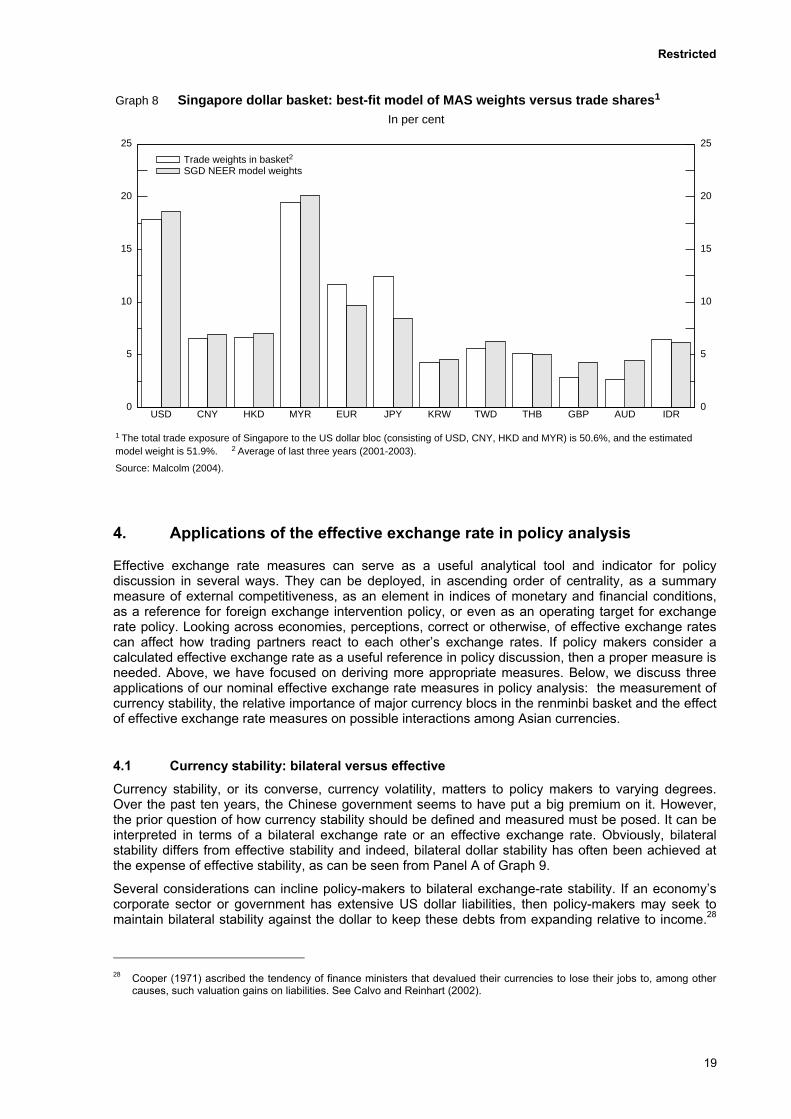
A juxtaposition of the available official weights in Asia and those we compile under the refined scenario suggests that the role of Hong Kong as an entrepôt has not been taken on board by most of the Asian authorities, at least in their calculation of effective exchange rates (Table 3). Japan puts similar weights on China and on Hong Kong. Singapore does not disclose its official weights, but there is a cottage industry among analysts in Singapore to infer them from various revelations. Malcolm (2004), a market analyst, guesstimates that the Singaporean authorities assign nearly equal weights to China and Hong Kong in their nominal effective exchange rate for the Singapore dollar (Graph 8). If it appears that the Japanese authority assign too heavy a weight on Hong Kong and too light a weight on China, the Singaporean authorities may put too heavy a weight on Hong Kong while assigning an appropriate weight to China.24
One can also argue that Hong Kong itself puts too heavy a weight on China (42%, more than double of the refined scenario we propose). At this point, however, it should be recalled that our whole weighting scheme is based on merchandise trade, and inclusion of trade in services could well shift weight back to China. The inclusion of service trade is a potential step ahead and poses further challenges to statisticians.25
24 The correlations between the official weights and our refined scenario for Hong Kong, India, Singapore and Japan (for which
relatively broad basket weights are available) are, respectively and in ascending order, 88%, 90%, 94% and 96%. 25 In an extreme experiment, Ha and Fan (2003) use only services to derive trade weights for Hong Kong. This is perhaps the
first post-industrial effective exchange rate calculation.
17
Restricted
Information available to us suggests that neither Hong Kong nor China is included in the currently employed currency baskets in India, Indonesia or the Philippines.26 If the respective central banks widen their currency baskets, they may be able to take on board the implications of Hong Kong as an entrepôt.
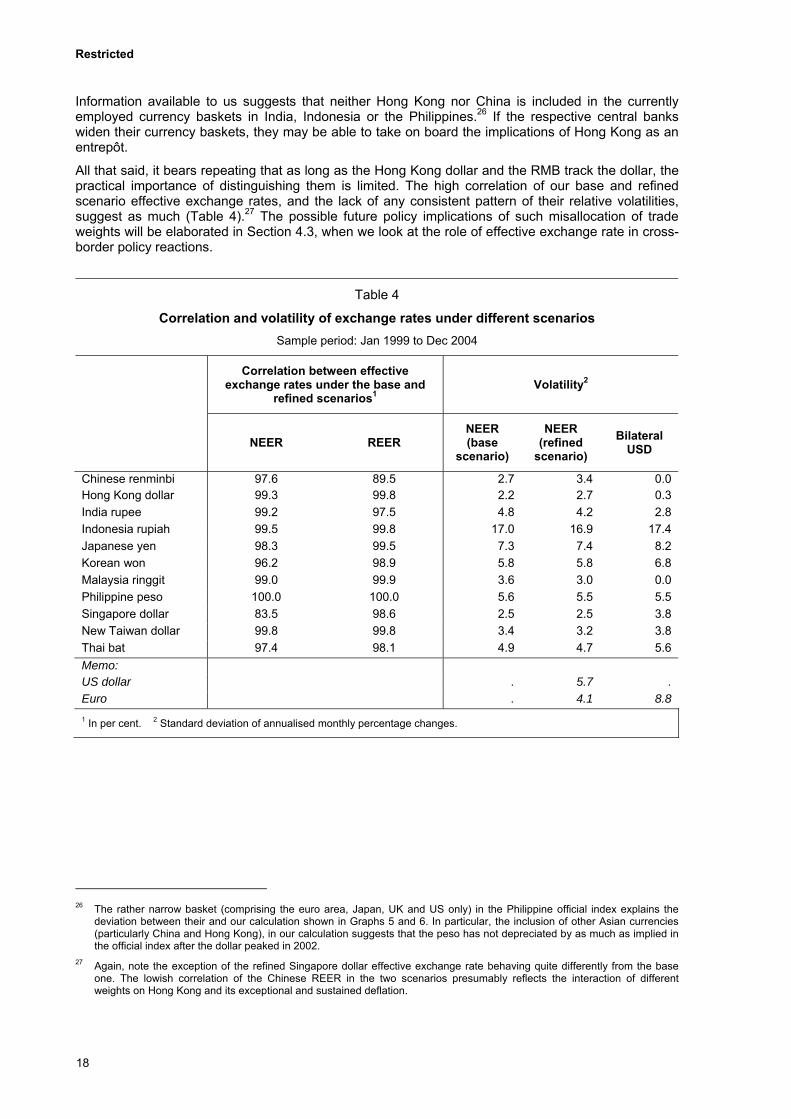
All that said, it bears repeating that as long as the Hong Kong dollar and the RMB track the dollar, the practical importance of distinguishing them is limited. The high correlation of our base and refined scenario effective exchange rates, and the lack of any consistent pattern of their relative volatilities, suggest as much (Table 4).27 The possible future policy implications of such misallocation of trade weights will be elaborated in Section 4.3, when we look at the role of effective exchange rate in cross-border policy reactions.
Table 4
Correlation and volatility of exchange rates under different scenarios Sample period: Jan 1999 to Dec 2004
Correlation between effective exchange rates under the base and
refined scenarios1Volatility2
NEER REER
NEER (base
scenario)
NEER (refined
scenario) Bilateral
USD
Chinese renminbi 97.6 89.5 2.7 3.4 0.0 Hong Kong dollar 99.3 99.8 2.2 2.7 0.3 India rupee 99.2 97.5 4.8 4.2 2.8 Indonesia rupiah 99.5 99.8 17.0 16.9 17.4 Japanese yen 98.3 99.5 7.3 7.4 8.2 Korean won 96.2 98.9 5.8 5.8 6.8 Malaysia ringgit 99.0 99.9 3.6 3.0 0.0 Philippine peso 100.0 100.0 5.6 5.5 5.5 Singapore dollar 83.5 98.6 2.5 2.5 3.8 New Taiwan dollar 99.8 99.8 3.4 3.2 3.8 Thai bat 97.4 98.1 4.9 4.7 5.6 Memo: US dollar . 5.7 . Euro . 4.1 8.8 1 In per cent. 2 Standard deviation of annualised monthly percentage changes.
26 The rather narrow basket (comprising the euro area, Japan, UK and US only) in the Philippine official index explains the
deviation between their and our calculation shown in Graphs 5 and 6. In particular, the inclusion of other Asian currencies (particularly China and Hong Kong), in our calculation suggests that the peso has not depreciated by as much as implied in the official index after the dollar peaked in 2002.
27 Again, note the exception of the refined Singapore dollar effective exchange rate behaving quite differently from the base one. The lowish correlation of the Chinese REER in the two scenarios presumably reflects the interaction of different weights on Hong Kong and its exceptional and sustained deflation.
18
Restricted
0
5
10
15
20
25
0
5
10
15
20
25
USD CNY HKD MYR EUR JPY KRW TWD THB GBP AUD IDR
Trade weights in basket2
SGD NEER model weights
1 The total trade exposure of Singapore to the US dollar bloc (consisting of USD, CNY, HKD and MYR) is 50.6%, and the estimatedmodel weight is 51.9%. 2 Average of last three years (2001-2003).
Source: Malcolm (2004).
Graph 8
In per cent
Singapore dollar basket: best-fit model of MAS weights versus trade shares1
4. Applications of the effective exchange rate in policy analysis
Effective exchange rate measures can serve as a useful analytical tool and indicator for policy discussion in several ways. They can be deployed, in ascending order of centrality, as a summary measure of external competitiveness, as an element in indices of monetary and financial conditions, as a reference for foreign exchange intervention policy, or even as an operating target for exchange rate policy. Looking across economies, perceptions, correct or otherwise, of effective exchange rates can affect how trading partners react to each other’s exchange rates. If policy makers consider a calculated effective exchange rate as a useful reference in policy discussion, then a proper measure is needed. Above, we have focused on deriving more appropriate measures. Below, we discuss three applications of our nominal effective exchange rate measures in policy analysis: the measurement of currency stability, the relative importance of major currency blocs in the renminbi basket and the effect of effective exchange rate measures on possible interactions among Asian currencies.
4.1 Currency stability: bilateral versus effective
Currency stability, or its converse, currency volatility, matters to policy makers to varying degrees. Over the past ten years, the Chinese government seems to have put a big premium on it. However, the prior question of how currency stability should be defined and measured must be posed. It can be interpreted in terms of a bilateral exchange rate or an effective exchange rate. Obviously, bilateral stability differs from effective stability and indeed, bilateral dollar stability has often been achieved at the expense of effective stability, as can be seen from Panel A of Graph 9.
Several considerations can incline policy-makers to bilateral exchange-rate stability. If an economy’s corporate sector or government has extensive US dollar liabilities, then policy-makers may seek to maintain bilateral stability against the dollar to keep these debts from expanding relative to income.28
28 Cooper (1971) ascribed the tendency of finance ministers that devalued their currencies to lose their jobs to, among other
causes, such valuation gains on liabilities. See Calvo and Reinhart (2002).
19
Restricted
As has been pointed out, however, this consideration does not seem to be a large one in China (Prasad et al (2005)). Regarding the other side of the balance sheet, however, there may be concern that the prospect of RMB weakness against the dollar could lead to deposit shifts from RMB to US dollars. This is not a far-fetched concern (Ma and McCauley (2002)), but at current levels of deposit dollarisation in China—well less than 10%—it would not seem a overwhelming concern. (China currently faces the pressure of conversions of dollar deposits to RMB.) Another consideration is to maintain competitiveness in dollar bloc markets, especially the US. This consideration is often seen to gain importance from the fact that a high fraction of China’s trade (perhaps over 90%) is dollar-invoiced. It must be asked whether, for instance, dollar invoicing of imports from Japan really means that prices should not be expected to rise in the wake of substantial yen appreciation against the dollar. In sum, it is easy to overstate the benefit of the stability of the dollar exchange rate.
Several considerations argue for effective exchange rate stability. Despite the dollar invoicing, China’s global competitiveness is better gauged by effective exchange rates, since China trades extensively with virtually all the economies in the world.29 Price stability is another important consideration.30 Experience has shown that domestic price stability is not necessarily well served by bilateral stability. China imported deflation when the dollar was strong and is importing inflation as the dollar weakens.31 Effective stability would damp some of these cross-border price pressures. Thus, an effective exchange rate framework may better balance the considerations of competitiveness and price stability.
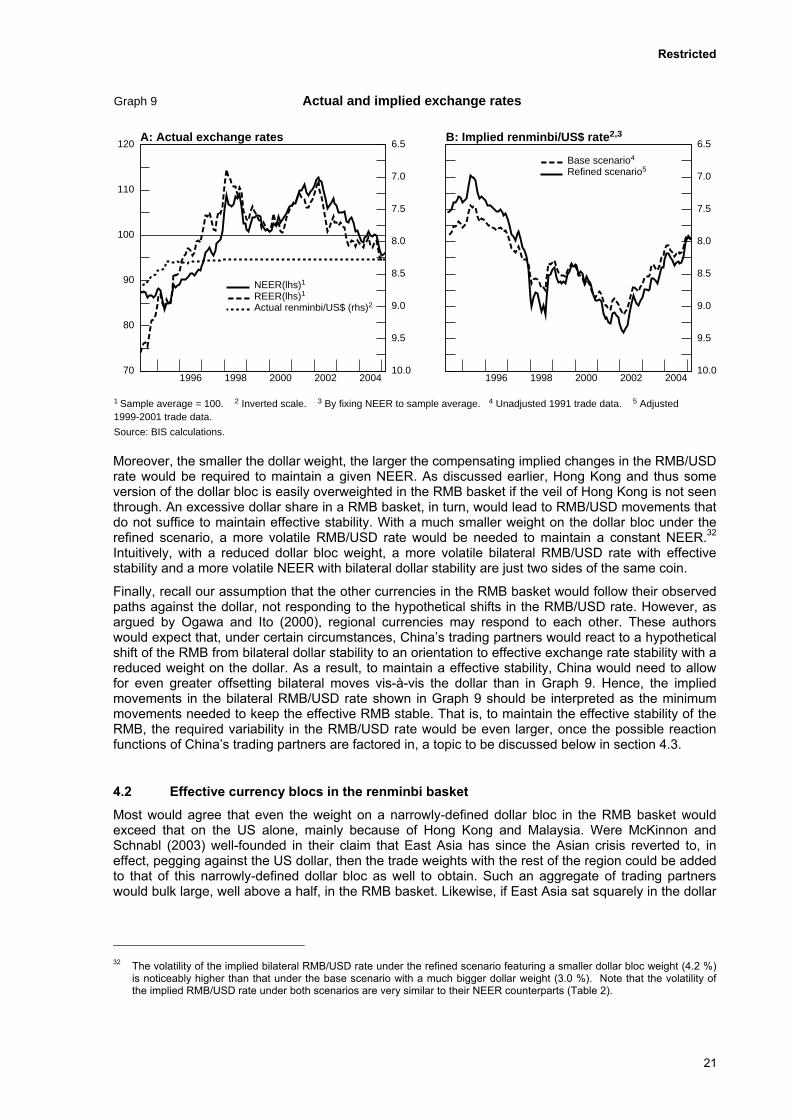
Such considerations make the following experiment relevant. What path would the bilateral RMB/USD exchange rate have followed, if effective stability had been pursued? In other words, how much instability of the bilateral RMB/USD rate would have been necessary to maintain the effective stability of the RMB? We conduct a simulation to address this counterfactual question. To simplify the analysis, we assume that a given RMB NEER level was targeted and that the dollar exchange rates of all the other currencies in the RMB basket followed their observed paths against the dollar, not responding to the hypothetical shifts in the RMB/USD rate. Panel B of Graph 9 presents the implied RMB/USD rates under both the base and refined scenarios, suggesting that the RMB would have depreciated against a strong US dollar in the 1997/98 and 2001/02 episodes but would be appreciating vis-à-vis a weakening dollar since 2002.
This result is intuitive: an appreciation (depreciation) of the dollar vis-à-vis other major currencies would require an implied offsetting depreciation (appreciation) of the RMB against the dollar, if a constant NEER is to be maintained. In fact, a comparison of Panel A and B reveals that the implied RMB/USD rate under a hypothetical NEER target is the inverse of the RMB NEER under a de facto dollar link.
29 Dollar invoicing itself should not be a main concern, since dollar pricing is ultimately influenced by exchange rates of the
home currencies. 30 Ho and McCauley (2003) show that large effective exchange rate changes are associated with missed inflation targets for a
sample of emerging market countries. 31 Ha et al (2003a and 2003b) found that in NEER terms, a much stronger renminbi in the wake of a dollar appreciation during
1998-2001 had in fact been a major factor importing deflation into the Chinese economy from abroad, while Anderson (2004) and Peng et al (2004) discussed the possible roles of a weaker renminbi NEER in loosening China’s monetary conditions since 2002, following the recent dollar weakness.
20
Restricted
70
80
90
100
110
120 6.5
7.0
7.5
8.0
8.5
9.0
9.5
10.01996 1998 2000 2002 2004
NEER(lhs)1
REER(lhs)1
Actual renminbi/US$ (rhs)2
6.5
7.0
7.5
8.0
8.5
9.0
9.5
10.01996 1998 2000 2002 2004
Base scenario4 Refined scenario5
1 Sample average = 100. 2 Inverted scale. 3 By fixing NEER to sample average. 4 Unadjusted 1991 trade data. 5 Adjusted1999-2001 trade data.
Source: BIS calculations.
Graph 9 Actual and implied exchange rates
A: Actual exchange rates B: Implied renminbi/US$ rate2,3
Moreover, the smaller the dollar weight, the larger the compensating implied changes in the RMB/USD rate would be required to maintain a given NEER. As discussed earlier, Hong Kong and thus some version of the dollar bloc is easily overweighted in the RMB basket if the veil of Hong Kong is not seen through. An excessive dollar share in a RMB basket, in turn, would lead to RMB/USD movements that do not suffice to maintain effective stability. With a much smaller weight on the dollar bloc under the refined scenario, a more volatile RMB/USD rate would be needed to maintain a constant NEER.32 Intuitively, with a reduced dollar bloc weight, a more volatile bilateral RMB/USD rate with effective stability and a more volatile NEER with bilateral dollar stability are just two sides of the same coin.
Finally, recall our assumption that the other currencies in the RMB basket would follow their observed paths against the dollar, not responding to the hypothetical shifts in the RMB/USD rate. However, as argued by Ogawa and Ito (2000), regional currencies may respond to each other. These authors would expect that, under certain circumstances, China’s trading partners would react to a hypothetical shift of the RMB from bilateral dollar stability to an orientation to effective exchange rate stability with a reduced weight on the dollar. As a result, to maintain a effective stability, China would need to allow for even greater offsetting bilateral moves vis-à-vis the dollar than in Graph 9. Hence, the implied movements in the bilateral RMB/USD rate shown in Graph 9 should be interpreted as the minimum movements needed to keep the effective RMB stable. That is, to maintain the effective stability of the RMB, the required variability in the RMB/USD rate would be even larger, once the possible reaction functions of China’s trading partners are factored in, a topic to be discussed below in section 4.3.
4.2 Effective currency blocs in the renminbi basket
Most would agree that even the weight on a narrowly-defined dollar bloc in the RMB basket would exceed that on the US alone, mainly because of Hong Kong and Malaysia. Were McKinnon and Schnabl (2003) well-founded in their claim that East Asia has since the Asian crisis reverted to, in effect, pegging against the US dollar, then the trade weights with the rest of the region could be added to that of this narrowly-defined dollar bloc as well to obtain. Such an aggregate of trading partners would bulk large, well above a half, in the RMB basket. Likewise, if East Asia sat squarely in the dollar
32 The volatility of the implied bilateral RMB/USD rate under the refined scenario featuring a smaller dollar bloc weight (4.2 %)
is noticeably higher than that under the base scenario with a much bigger dollar weight (3.0 %). Note that the volatility of the implied RMB/USD rate under both scenarios are very similar to their NEER counterparts (Table 2).
21
Restricted
bloc, then the overall weight on the yen in the RMB’s effective exchange rate would be no higher than the trade weight on Japan.
In fact, however, since the Asian crisis, currencies in the region have moved in greater sympathy with the yen. Before the crisis, it was rare for a regional currency to share more than 20% of the yen’s movement against the dollar (McCauley (1997)). During the crisis, amid much idiosyncratic variation, one could discern a more substantial co-movement between yen and regional currencies (Galati and McCauley (1998)). Despite the claims of American academics, MAS (2000) found greater flexibility for the Indonesian rupiah, Korean won and Thai baht, a result widened by McCauley (2001), Kawai (2002) and more recently, Kim et al (2004).
In 2004, regional currencies moved with the yen as never before (Ho et al (2005)). For much of 2003 and 2004, the Korean won could rise (or fall) a half percent against the dollar on a day when the yen rose (or fell) one percent against the dollar. The Indonesian rupiah, Singapore dollar, the New Taiwan dollar and the Thai baht would generally strengthen by 0.1-0.3% in the face of a one percent appreciation of the yen. Only the Philippine peso came close to conforming to McKinnon’s description for the period under consideration. Appendix 2 shows the estimation of the coefficients of the co-movement (the betas), and a graph of rolling 60-day estimates, and these remind us that these individual elasticity estimates are far from stable.
In passing, note that the influence of the yen on the RMB and Hong Kong dollar forwards can be seen in the period since the Dubai G-7 meeting in September 2003. At the peak in early 2004, the non-deliverable one-year forward exchange rate (NDF) for the RMB showed as much sympathy with the yen as the Singapore dollar, which is explicitly managed against a trade-weighted basket including the yen.33 In effect, the market is already trading the RMB as a potential part of a yen bloc. Granger causality tests suggest that for the period under consideration, the yen/dollar spot rates appear to lead the RMB NDF.34
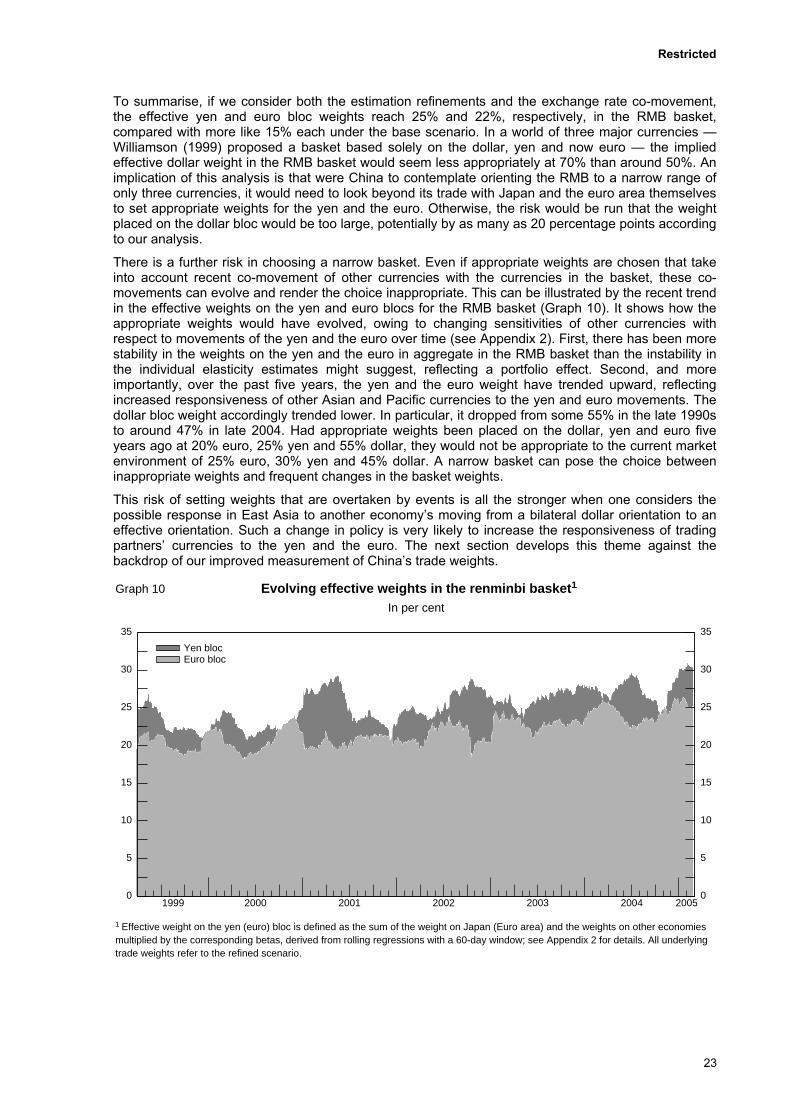
The upshot of East Asian currencies trading in sympathy with the yen is that the effective yen weight in the RMB basket could be much higher than the trade weight on Japan alone. As noted, our estimation refinements have raised the trade weight on Japan by more than six percentage points (Table 1). If we take into account the influence of the yen on the regional currencies, then the effective weight on the yen could rise further. Table 5 presents the estimated average responses (betas) of non-Japan Asian currencies (as well as for the Canadian dollar, British pound and Swiss franc) to the yen-dollar movements, and their contributions to the so-called “effective yen bloc” in the RMB basket as a consequence. This exchange rates co-movement factor raises the effective yen weight by another four percentage points. Overall, our estimation refinements and the recognition of the proto yen bloc in East Asia together raise the weight on the yen by almost 10 percentage points in the RMB basket, to 24.6% from only 13.7% under the base scenario.
On this basis, how much larger than the euro area is the euro bloc or zone? It turns out that the euro area still gains a bit more from the currencies that move with the euro than the yen gains from those that move with it. Recall that, unlike the yen, the euro did not gain any weight in the calculated RMB effective exchange rate under the refined scenario as compared to the base scenario. This was the result of the Hong Kong adjustment adding weight to the euro area, but the updating of the trade data subtracting weight. However, the euro area in effect picks up weight by first of all the tendency of European exchange rates to move with the euro against the dollar: sterling, the Swiss franc, and the Nordic currencies. In addition, the euro gains, at least for the moment, from the strong correlation of the antipodean currencies with the euro. This development dates back only to the months after the inception of the euro; before that, the Australian and New Zealand dollars were long-time members of the dollar bloc. Similarly, the Canadian dollar, once firmly in the dollar bloc, now shows a considerable euro echo in its trading against the US dollar. In East Asia, the euro’s movements, as distinct form the yens’ movements, are most evident in the Singapore dollar, but this relationship adds less weight to the euro than does Switzerland. Taking all of these echoes of the euro into account raises the euro weight from 17.2% on the euro area proper to 21.9% for the euro bloc.
33 For a review of the Asian NDF markets, see Ma, Ho and McCauley (2004). 34 The Granger causality test for the daily percentage changes of yen-dollar spot rate and that of 12-month renminbi NDF, for
the period of 01/10/2003 to 12/01/2004, with the one lag included.
22
Restricted
To summarise, if we consider both the estimation refinements and the exchange rate co-movement, the effective yen and euro bloc weights reach 25% and 22%, respectively, in the RMB basket, compared with more like 15% each under the base scenario. In a world of three major currencies — Williamson (1999) proposed a basket based solely on the dollar, yen and now euro — the implied effective dollar weight in the RMB basket would seem less appropriately at 70% than around 50%. An implication of this analysis is that were China to contemplate orienting the RMB to a narrow range of only three currencies, it would need to look beyond its trade with Japan and the euro area themselves to set appropriate weights for the yen and the euro. Otherwise, the risk would be run that the weight placed on the dollar bloc would be too large, potentially by as many as 20 percentage points according to our analysis.
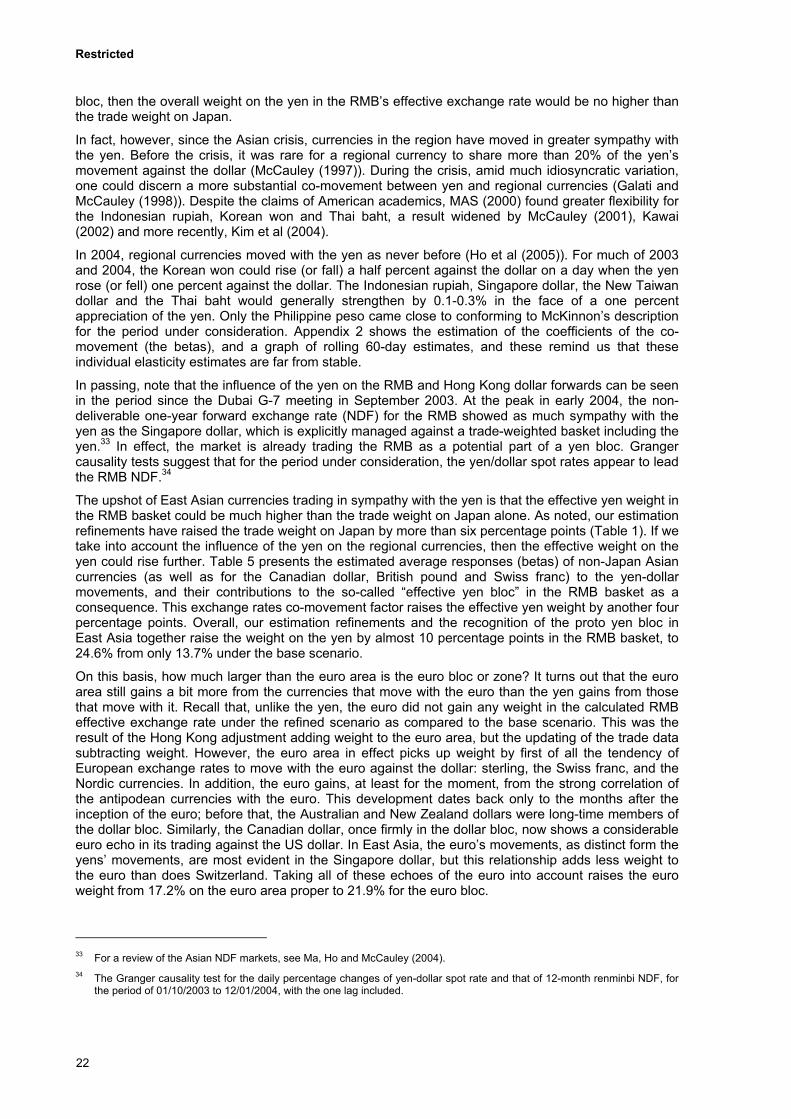
There is a further risk in choosing a narrow basket. Even if appropriate weights are chosen that take into account recent co-movement of other currencies with the currencies in the basket, these co-movements can evolve and render the choice inappropriate. This can be illustrated by the recent trend in the effective weights on the yen and euro blocs for the RMB basket (Graph 10). It shows how the appropriate weights would have evolved, owing to changing sensitivities of other currencies with respect to movements of the yen and the euro over time (see Appendix 2). First, there has been more stability in the weights on the yen and the euro in aggregate in the RMB basket than the instability in the individual elasticity estimates might suggest, reflecting a portfolio effect. Second, and more importantly, over the past five years, the yen and the euro weight have trended upward, reflecting increased responsiveness of other Asian and Pacific currencies to the yen and euro movements. The dollar bloc weight accordingly trended lower. In particular, it dropped from some 55% in the late 1990s to around 47% in late 2004. Had appropriate weights been placed on the dollar, yen and euro five years ago at 20% euro, 25% yen and 55% dollar, they would not be appropriate to the current market environment of 25% euro, 30% yen and 45% dollar. A narrow basket can pose the choice between inappropriate weights and frequent changes in the basket weights.
This risk of setting weights that are overtaken by events is all the stronger when one considers the possible response in East Asia to another economy’s moving from a bilateral dollar orientation to an effective orientation. Such a change in policy is very likely to increase the responsiveness of trading partners’ currencies to the yen and the euro. The next section develops this theme against the backdrop of our improved measurement of China’s trade weights.
0
5
10
15
20
25
30
35
0
5
10
15
20
25
30
35
1999 2000 2001 2002 2003 2004 2005
Yen bloc Euro bloc
1 Effective weight on the yen (euro) bloc is defined as the sum of the weight on Japan (Euro area) and the weights on other economiesmultiplied by the corresponding betas, derived from rolling regressions with a 60-day window; see Appendix 2 for details. All underlying trade weights refer to the refined scenario.
Graph 10
In per cent
Evolving effective weights in the renminbi basket1
23
Restricted
Table 5
Effective weights in the renminbi basket In per cent
Yen bloc Euro bloc
Trade weight1
βjpy Effective yen weights2
βeur Effective euro weight2
Japan 20.7 1 20.7
Asia and Oceania 3.6 1.2
Australia 1.3 0.17 0.2 0.51 0.7
India 0.4 0.03 0.0 0.01 0.0
Indonesia 0.6 0.25 0.2 -0.11 -0.1
Korea 7.1 0.21 1.5 -0.01 -0.1
New Zealand 0.2 0.16 0.0 0.54 0.1
Philippines 0.4 0.05 0.0 0.07 0.0
Singapore 2.8 0.20 0.6 0.09 0.3
Taiwan (China) 7.2 0.12 0.9 0.03 0.2
Thailand 1.3 0.17 0.2 0.04 0.1
Euro area 17.2 1 17.2
Others 0.4 3.5
Canada 2.1 0.08 0.2 0.15 0.3
United Kingdom 2.6 0.06 0.2 0.53 1.4
Switzerland 0.6 0.05 0.0 0.95 0.6
Denmark 0.4 1 0.4
Norway 0.3 0.82 0.2
Sweden 0.7 0.84 0.6
Total effective weights 24.6 21.9
1 The trade weights refer to those under ‘refined scenario’ in Table 1. 2 Effective weight defined as trade weight multiplied by the corresponding betas estimated over the period from 5 Jan 1999 to 28 Feb 2005. The beta estimation is detailed in Appendix 2.
4.3 Effective exchange rates as a mechanism for cross-border reactions
The finding that the conventionally measured RMB effective exchange rate over-weights the dollar has several important implications. The first implication is for Chinese policy. Were the Chinese authorities to shift from a dollar orientation to a basket orientation, there is a risk of their assigning an insufficient weight to non-dollar currencies. The cost of this underweighting would be a very mild version of the cost of the current dollar orientation, as argued above: a tendency to domestic deflation in a market environment of a strong dollar globally, and a tendency toward inflation in a market environment of a weak dollar. This insight is based on the fact that, given China does not only trade with the US, the effective exchange rate would be more comprehensive than the bilateral dollar rate in assessing the ‘exchange rate channel’ for transmission of cross-border price pressure. From the standpoint of avoiding the import of deflation or inflation, however, even a basket with a too-small weight on non-dollar currencies would represent an improvement on the status quo.
The second implication arises from the symmetrical effect that Chinese trading partners’ weight on China is too small, and their weight on Hong Kong is correspondingly too big, as discussed earlier (Table 3). With both the RMB and the Hong Kong dollar closely aligned with the dollar, the relative weighting of the two at present makes little difference. Similarly, were both China and Hong Kong to
24
Restricted
adopt the same basket orientation, it would again matter little that trading partners had the relative weights wrong.35
Were the orientation of the RMB and Hong Kong dollar to diverge, however, it would matter. Without any commitment to the likelihood of such a development, it is possible to assess the effect of China’s adoption of a basket orientation, while Hong Kong’s dollar remained linked to the US dollar.
Consider the case of Singapore. If it gives weight to Hong Kong in its basket that really belongs to China, it would under-react to China’s adoption of a basket orientation. That is, were the RMB to be managed against a basket, the management of the Singapore dollar would tilt away from the dollar. However, the under-weighting of China in Singapore’s basket would mean that Singapore’s incremental weight on the non-dollar currencies would be too small. This result is clearest for Singapore, with its explicit basket orientation, but it would hold more broadly in East Asia to the extent that regional currencies are more implicitly managed against a basket and that the weights on China are too low, as suggested above.
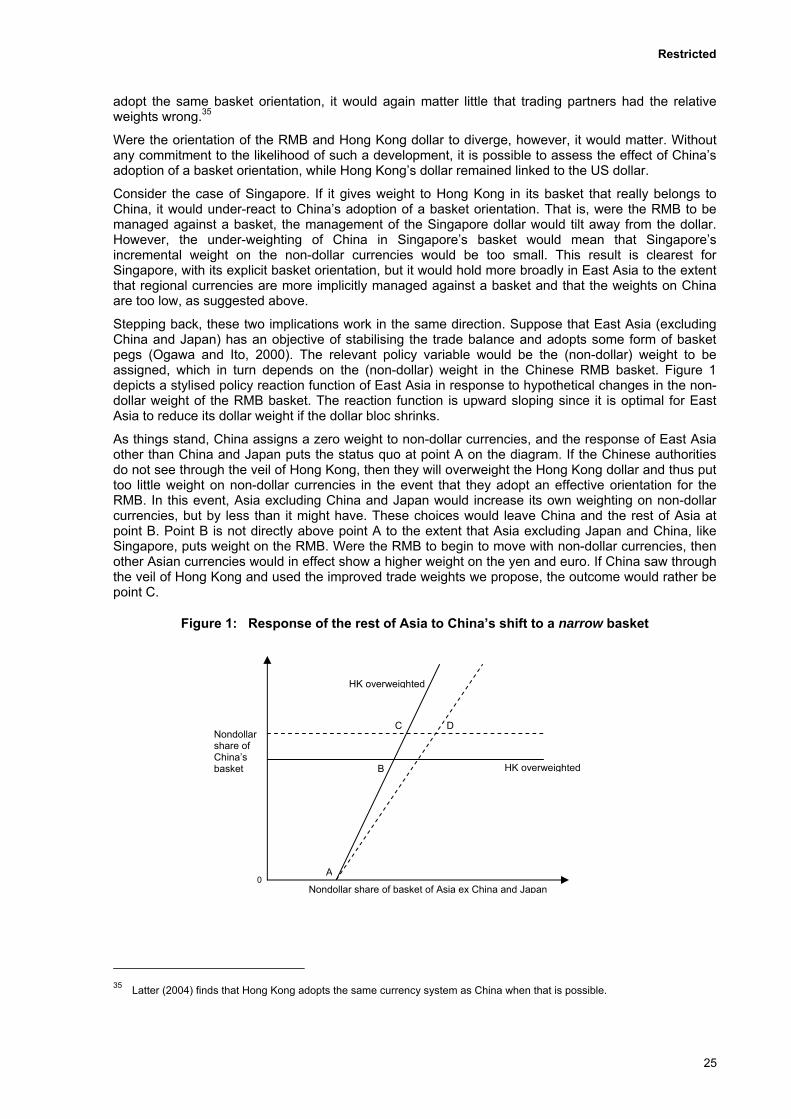
Stepping back, these two implications work in the same direction. Suppose that East Asia (excluding China and Japan) has an objective of stabilising the trade balance and adopts some form of basket pegs (Ogawa and Ito, 2000). The relevant policy variable would be the (non-dollar) weight to be assigned, which in turn depends on the (non-dollar) weight in the Chinese RMB basket. Figure 1 depicts a stylised policy reaction function of East Asia in response to hypothetical changes in the non-dollar weight of the RMB basket. The reaction function is upward sloping since it is optimal for East Asia to reduce its dollar weight if the dollar bloc shrinks.
As things stand, China assigns a zero weight to non-dollar currencies, and the response of East Asia other than China and Japan puts the status quo at point A on the diagram. If the Chinese authorities do not see through the veil of Hong Kong, then they will overweight the Hong Kong dollar and thus put too little weight on non-dollar currencies in the event that they adopt an effective orientation for the RMB. In this event, Asia excluding China and Japan would increase its own weighting on non-dollar currencies, but by less than it might have. These choices would leave China and the rest of Asia at point B. Point B is not directly above point A to the extent that Asia excluding Japan and China, like Singapore, puts weight on the RMB. Were the RMB to begin to move with non-dollar currencies, then other Asian currencies would in effect show a higher weight on the yen and euro. If China saw through the veil of Hong Kong and used the improved trade weights we propose, the outcome would rather be point C.
Figure 1: Response of the rest of Asia to China’s shift to a narrow basket
HK overweighted
C DNondollar share of China’s basket HK overweighted B
A0
Nondollar share of basket of Asia ex China and Japan
35 Latter (2004) finds that Hong Kong adopts the same currency system as China when that is possible.
25
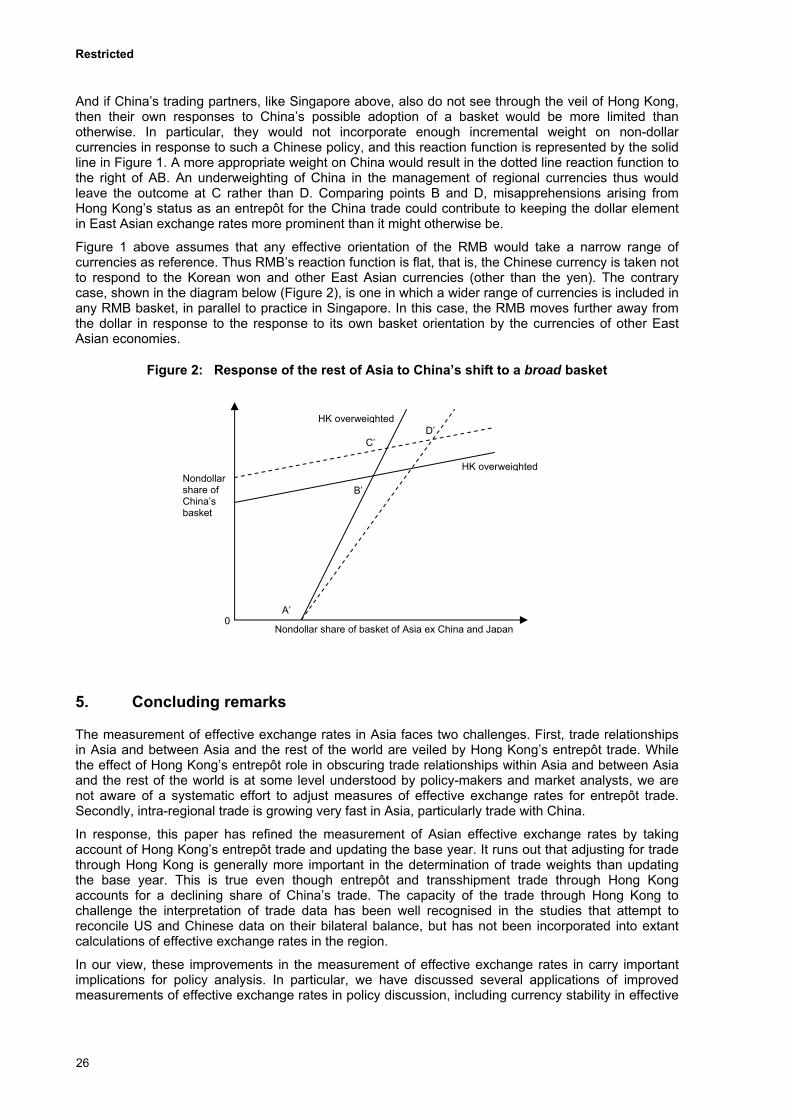
Restricted
And if China’s trading partners, like Singapore above, also do not see through the veil of Hong Kong, then their own responses to China’s possible adoption of a basket would be more limited than otherwise. In particular, they would not incorporate enough incremental weight on non-dollar currencies in response to such a Chinese policy, and this reaction function is represented by the solid line in Figure 1. A more appropriate weight on China would result in the dotted line reaction function to the right of AB. An underweighting of China in the management of regional currencies thus would leave the outcome at C rather than D. Comparing points B and D, misapprehensions arising from Hong Kong’s status as an entrepôt for the China trade could contribute to keeping the dollar element in East Asian exchange rates more prominent than it might otherwise be.
Figure 1 above assumes that any effective orientation of the RMB would take a narrow range of currencies as reference. Thus RMB’s reaction function is flat, that is, the Chinese currency is taken not to respond to the Korean won and other East Asian currencies (other than the yen). The contrary case, shown in the diagram below (Figure 2), is one in which a wider range of currencies is included in any RMB basket, in parallel to practice in Singapore. In this case, the RMB moves further away from the dollar in response to the response to its own basket orientation by the currencies of other East Asian economies.
Figure 2: Response of the rest of Asia to China’s shift to a broad basket
HK overweightedD’
C’
HK overweightedNondollar share of China’s basket
B’
A’ 0
Nondollar share of basket of Asia ex China and Japan
5. Concluding remarks
The measurement of effective exchange rates in Asia faces two challenges. First, trade relationships in Asia and between Asia and the rest of the world are veiled by Hong Kong’s entrepôt trade. While the effect of Hong Kong’s entrepôt role in obscuring trade relationships within Asia and between Asia and the rest of the world is at some level understood by policy-makers and market analysts, we are not aware of a systematic effort to adjust measures of effective exchange rates for entrepôt trade. Secondly, intra-regional trade is growing very fast in Asia, particularly trade with China.
In response, this paper has refined the measurement of Asian effective exchange rates by taking account of Hong Kong’s entrepôt trade and updating the base year. It runs out that adjusting for trade through Hong Kong is generally more important in the determination of trade weights than updating the base year. This is true even though entrepôt and transshipment trade through Hong Kong accounts for a declining share of China’s trade. The capacity of the trade through Hong Kong to challenge the interpretation of trade data has been well recognised in the studies that attempt to reconcile US and Chinese data on their bilateral balance, but has not been incorporated into extant calculations of effective exchange rates in the region.
In our view, these improvements in the measurement of effective exchange rates in carry important implications for policy analysis. In particular, we have discussed several applications of improved measurements of effective exchange rates in policy discussion, including currency stability in effective
26

Restricted
as opposed to bilateral terms, the effective weights on major currency blocs in the RMB basket and interactions among regional currencies in East Asia.
The most important message is that effective exchange rates constructed without our proposed refinements would overweight the dollar bloc, narrowly or broadly, defined in the RMB basket. Therefore, should the Chinese authorities adopt some effective orientation in their exchange rate policy, the relative weights in basket have to be determined more carefully than just looking at simple trade flows. Furthermore, without our refinements, effective exchange rates of other Asian currencies could underweight the RMB relative to the Hong Kong dollar. These relative weights make no difference only so long as the two currencies are both tied to the US dollar, but would matter if the orientation of the RMB and Hong Kong dollar are to diverge.
27
Restricted
References
Anderson, Jonathan (2003), “The complete RMB handbook”, UBS Investment Research, October.
Buldorini, Luca, Stelios Makraydakis and Christian Thimann (2002): “The effective exchange rates of the euro”, European Central Bank Occasional Paper Series no. 2, February.
Calvo, G and C Reinhart (2002): “Fear of floating”, Quarterly Journal of Economics, vol 117 (May), pp 379-408.
Census and Statistics Department, HKSAR (2003), Annual Review of Hong Kong External Merchandise Trade 2003.
Chinn, Menzie D (2002): “The measurement of real effective exchange rates: a survey and application to East Asia”, paper presented at the Australian-Japan Research Centre of the Australian National University, May.
Cooper, Richard N (1971): Currency devaluation in developing countries, Princeton Essays in international finance, no 86 (June).
Durand, M., C Madaschi and F. Terribile (1998): ”Trends in OECD countries’ international competitiveness: The influence of emerging market economies”, OECD Economics Department Working Papers No. 195, May, Paris.
Ee, Khor Hoe, Edward Robinson and Jason Lee (2004): “Managed floating and intermediate exchange rate systems: the Singapore experience”, MAS Staff paper no 37 (December).
Ellis, Luci (2001): “Measuring the effective exchange rate: pitfalls and practicalities”, Reserve Bank of Australia Research Discussion Paper, no. 2001-04, August, Sydney.
Feenstra, R.C., W. Hai, W.T. Woo and S. Yao (1999): “Discrepancies in international data: an application to China-Hong Kong entrepôt trade”, American Economic Review Papers and Proceedings, 89, pp 338-343.
Fung, K.C. and Lawrence J. Lau (1998): “The China-US bilateral trade balances: how big is it really?”, Pacific Economic Review, No 3, pp 33-47.
Galati, G and R N McCauley (1998): “The yen/dollar exchange rate and fluctuations in Asia-Pacific currencies”, BIS Quarterly Review, November, pp 13–15.
Goldstein, Morris and Philip Turner (2004): Controlling currency mismatches in emerging markets, Institute for International Economics, Washington.
Ha, Jiming and Kevin Fan (2002): “The prospect for the US dollar and implications for the Hong Kong economy”, Hong Kong Monetary Authority Research Memoranda, July, Hong Kong.
——— (2003): “Alternative measures of the real exchange rate”, Hong Kong Monetary Authority Quarterly Bulletin, March, pp 16-21, Hong Kong.
Ha, Jiming, Kevin Fan and Chang Shu (2003): “The causes of inflation and deflation in mainland China”, Hong Kong Monetary Authority Quarterly Bulletin, September, pp 23-31, Hong Kong.
Ho, Corrinne, Guonan Ma and Robert N. McCauley (2005): “Trading Asian currencies,” Bank for International Settlements, Quarterly Review, March, pp 49-58.
Ho, Corrinne and Robert N McCauley (2003): “Living with Flexible Exchange Rates,” BIS Working Papers no. 130.
Hargreaves, Derek and Carlton Strong (2003): “JPMorgan effective exchange rates: revised and modernised”, JPMorgan Global Data Watch, May, New York.
Hong Kong SAR Government, Census and Statistics Department (2004): Annual Review of Hong Kong External Merchandise Trade 2003.
——— (2004): Monthly Survey of Re-export Trade, on authors’ communication with the Hong Kong SAR Census and Statistics Department
28
Restricted
Kawai, M (2002): “Exchange rate arrangements in East Asia: Lessons from the 1997-98 currency crisis”, Bank of Japan, Institute for Monetary and Economic Studies, Monetary and Economic Studies, vol 20, no S-1, December.
Kim, Soyoung, Sunghyun H. Kim and Yunjong Wang (2004): “Fear of Floating in East Asia”, Tufts University Department of Economics Working Paper, September.
Lardy, Nicholas (1996): China in the World Economy, Institute for International Economics, Washington, DC.
Latter, Tony (2004): “Hong Kong’s exchange rate regimes in the twentieth century: the stories of three regime changes”, Hong Kong Institute of Monetary Research Working Paper, no 17, September.
Leahy, Michael P (1998): “New summary measures of the foreign exchange rate value of the dollar”, Federal Reserve Bulletin, October, pp 811-818, Washington DC.
Ma, Guonan, Corrinne Ho and Robert McCauley (2004): “The markets for non-deliverable forwards in Asian currencies”, BIS Quarterly Review, June, pp 81- 94.
Malcolm, James (2004): “Replicating the SGD basket dynamically”, Deutsche Bank Global markets research, foreign exchange, 30 August.
McCauley, Robert N (1997): The euro and the dollar, Princeton Essays in international finance, no 205 (November)
McCauley, Robert N (2001): “Setting Monetary Policy in East Asia: Goals, Developments and Institutions,” in Future Directions for Monetary Policies in East Asia (Sydney: Reserve Bank of Australia), pp. 7-55.
McKinnon, R and G Schnabl (2003): “The East Asian dollar standard, fear of floating and original sin”, mimeo, September.
Monetary Authority of Singapore Economics Department (2000): “Kicking the Habit and Turning Over a New Leaf: Monetary Policy in East Asia After the Currency Crisis”, Occasional Paper no. 21, (December).
Monetary Authority of Singapore (2001), Singapore’s Exchange Rate Policy (MAS: February).
Ogawa, E. and T. Ito, (2002): “On the desirability of a regional basket currency arrangement,” Journal of the Japanese and International Economies, vol. 16, No. 3, 317-334.
Peng, Wensheng (2004): “Macroeconomic conditions in the mainland of China”, paper presented at the Hong Kong Institute of Monetary Research seminar on Research on the Mainland Economy, July, Hong Kong.
Prasad, Eswar, Thomas Rumbaugh and Qing Wang (2005): “Putting the cart before the horse? Capital account liberalization and exchange rate flexibility in China”, IMF Policy Discussion Paper, PDP/05/01 (January).
Suttle, P and D Fernandez (2005): “Emerging Asia’s monetary future”, JPMorgan Global issues, January.
Turner, Philip and Jozef Van’t dack (1993): “Measuring International Price and Cost Competitiveness”, BIS Economic Papers No 39, November, Basel.
US Department of Commerce (1995): “Comparison of 1992-93 merchandise trade statistics of the United States and the People’s Republic of China”, Commerce News, Bureau of Census, Washington DC.
Williamson, J (1999): “The Case for a common basket peg for East Asian currencies”, in Stefan Collingnan, J Pisani-Ferry and Yung-Chul Park, eds., Exchange Rate Policies in Emerging Asian Countries (London: Routledge), pp. 327-343.
29
Restricted
Appendix 1 General data requirements
Trade data
In this paper, manufacturing trade data (SITC classification 5 to 8) of China’s trading partners are used to compute the trade weights. Trade data are taken directly from the OECD (International Trade by Commodity Statistics), the United Nation’s Comtrade Database or from national data. For reporter economies without bilateral trade data by SITC breakdowns, the manufacturing part is estimated by taking the manufacturing ratio of its total trade as a reference.
For trade data adjustment, the re-export trade statistics are published by the Hong Kong SAR Government (in Annual Review of Hong Kong External Merchandise Trade), but a breakdown into manufacturing goods is unavailable, which are estimated through a manufacturing trade ratio derived from China’s direct bilateral trade statistics. Due to data limitation, we also assume that the re-export margins are not economy-specific and are constant across all of China’s trading partners.
Taiwan (China) estimates of cross-strait trade flow are publicly available from the Mainland Affairs Council, Cross-Strait Economic Statistics Monthly, (http://www.mac.gov.tw/english/english/csexchan/rpt/index.htm) and Bureau of Foreign Trade (http://cus93.trade.gov.tw/english/FSCE/FSC0011E.ASP).
Deflator
Consumer price indices (CPI) are used as the price deflator for the REER calculation.
30
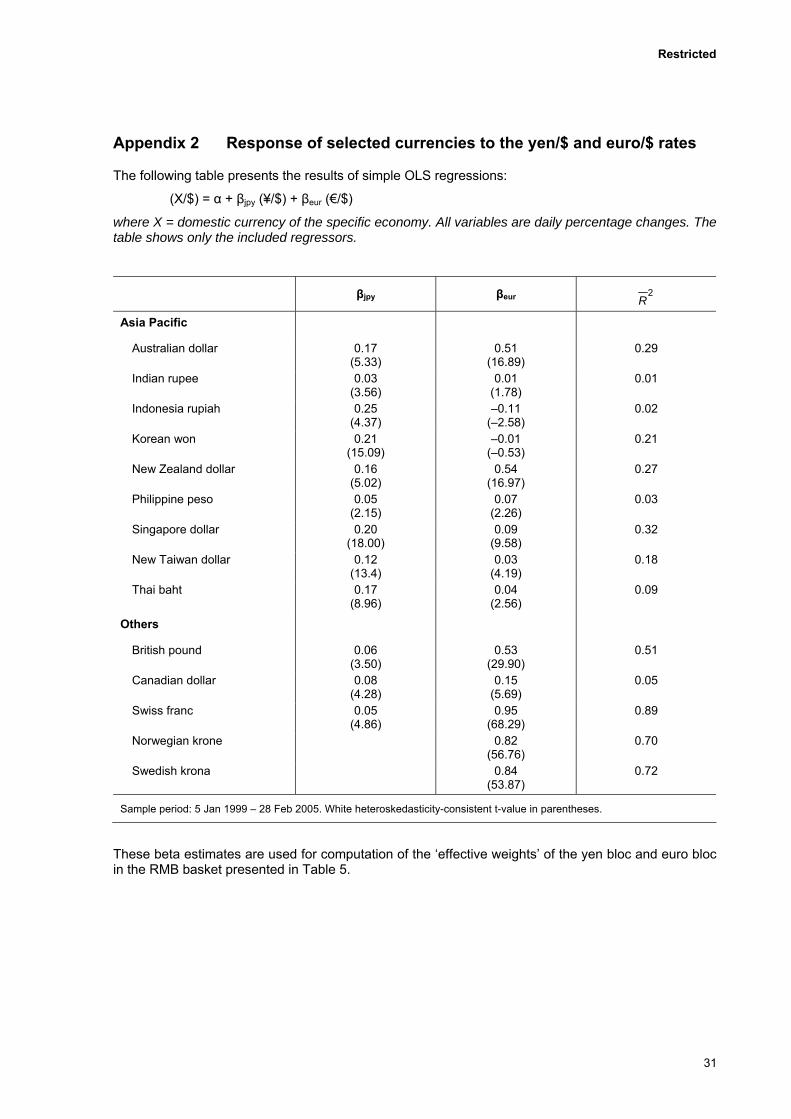
Restricted
Appendix 2 Response of selected currencies to the yen/$ and euro/$ rates
The following table presents the results of simple OLS regressions:
(X/$) = α + βjpy (¥/$) + βeur (€/$)
where X = domestic currency of the specific economy. All variables are daily percentage changes. The table shows only the included regressors.
βjpy βeur 2R
Asia Pacific
Australian dollar 0.17 (5.33)
0.51 (16.89)
0.29
Indian rupee 0.03 (3.56)
0.01 (1.78)
0.01
Indonesia rupiah 0.25 (4.37)
–0.11 (–2.58)
0.02
Korean won 0.21 (15.09)
–0.01 (–0.53)
0.21
New Zealand dollar 0.16 (5.02)
0.54 (16.97)
0.27
Philippine peso 0.05 (2.15)
0.07 (2.26)
0.03
Singapore dollar 0.20 (18.00)
0.09 (9.58)
0.32
New Taiwan dollar 0.12 (13.4)
0.03 (4.19)
0.18
Thai baht 0.17 (8.96)
0.04 (2.56)
0.09
Others
British pound 0.06 (3.50)
0.53 (29.90)
0.51
Canadian dollar 0.08 (4.28)
0.15 (5.69)
0.05
Swiss franc 0.05 (4.86)
0.95 (68.29)
0.89
Norwegian krone 0.82 (56.76)
0.70
Swedish krona 0.84 (53.87)
0.72
Sample period: 5 Jan 1999 – 28 Feb 2005. White heteroskedasticity-consistent t-value in parentheses.
These beta estimates are used for computation of the ‘effective weights’ of the yen bloc and euro bloc in the RMB basket presented in Table 5.
31

Restricted
The graphs show the coefficients (the ‘yen betas’) from regressions of daily percentage changes in the respective domestic currency/USD bilateral rates on that of the JPY/USD rate, estimated over a rolling window of 60 days. EUR/USD is also included as a regressor. The upper and lower band represents the 95% confidence interval.
-1.2
-0.8
-0.4
0.0
0.4
0.8
1.2
1999 2000 2001 2002 2003 2004
AUD
-.8
-.6
-.4
-.2
.0
.2
.4
.6
.8
1999 2000 2001 2002 2003 2004
CNY 12M NDF
-.10
-.05
.00
.05
.10
.15
.20
1999 2000 2001 2002 2003 2004
HKD 12M
-2
-1
0
1
2
3
1999 2000 2001 2002 2003 2004
IDR
-.3
-.2
-.1
.0
.1
.2
.3
1999 2000 2001 2002 2003 2004
INR
-0.4
0.0
0.4
0.8
1.2
1999 2000 2001 2002 2003 2004
KRW
-1.2
-0.8
-0.4
0.0
0.4
0.8
1.2
1999 2000 2001 2002 2003 2004
NZD
-2.0
-1.5
-1.0
-0.5
0.0
0.5
1.0
1.5
1999 2000 2001 2002 2003 2004
PHP
-.2
-.1
.0
.1
.2
.3
.4
.5
.6
.7
1999 2000 2001 2002 2003 2004
SGD
-.8
-.6
-.4
-.2
.0
.2
.4
.6
.8
1999 2000 2001 2002 2003 2004
THB
-.3
-.2
-.1
.0
.1
.2
.3
.4
.5
.6
1999 2000 2001 2002 2003 2004
TWD
32
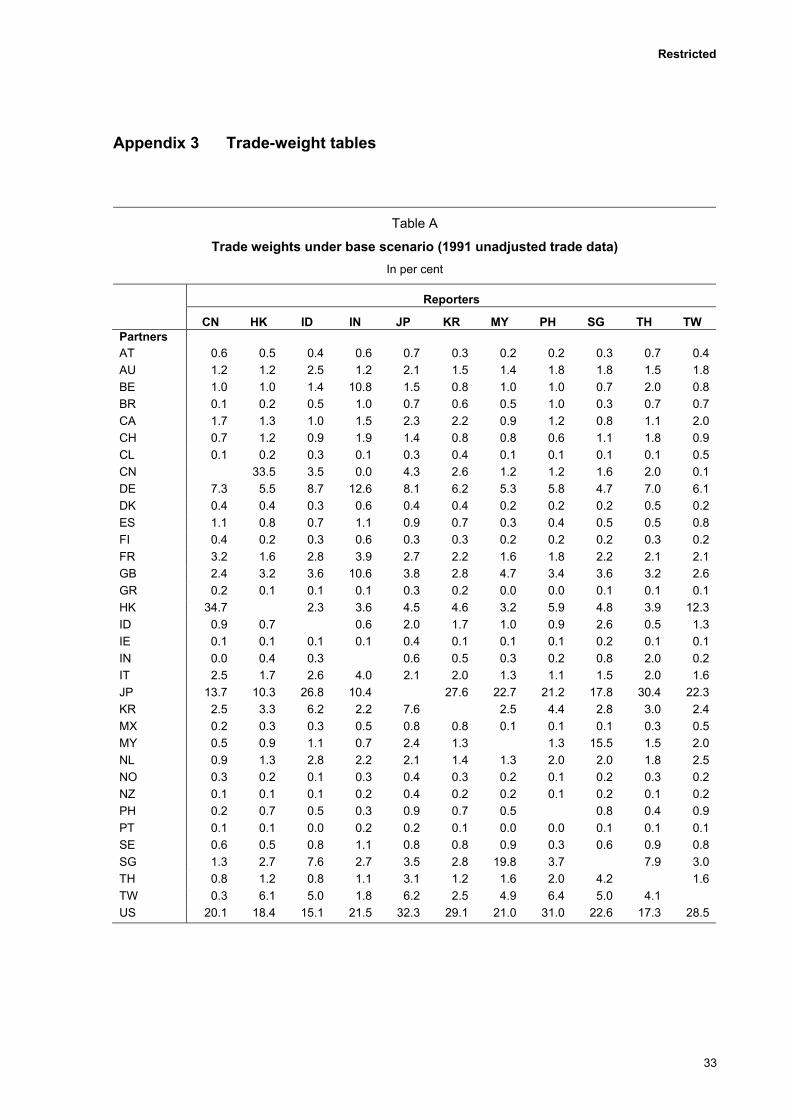
Restricted
Appendix 3 Trade-weight tables
Table A
Trade weights under base scenario (1991 unadjusted trade data)In per cent
Reporters
CN HK ID IN JP KR MY PH SG TH TW Partners AT 0.6 0.5 0.4 0.6 0.7 0.3 0.2 0.2 0.3 0.7 0.4 AU 1.2 1.2 2.5 1.2 2.1 1.5 1.4 1.8 1.8 1.5 1.8 BE 1.0 1.0 1.4 10.8 1.5 0.8 1.0 1.0 0.7 2.0 0.8 BR 0.1 0.2 0.5 1.0 0.7 0.6 0.5 1.0 0.3 0.7 0.7 CA 1.7 1.3 1.0 1.5 2.3 2.2 0.9 1.2 0.8 1.1 2.0 CH 0.7 1.2 0.9 1.9 1.4 0.8 0.8 0.6 1.1 1.8 0.9 CL 0.1 0.2 0.3 0.1 0.3 0.4 0.1 0.1 0.1 0.1 0.5 CN 33.5 3.5 0.0 4.3 2.6 1.2 1.2 1.6 2.0 0.1 DE 7.3 5.5 8.7 12.6 8.1 6.2 5.3 5.8 4.7 7.0 6.1 DK 0.4 0.4 0.3 0.6 0.4 0.4 0.2 0.2 0.2 0.5 0.2 ES 1.1 0.8 0.7 1.1 0.9 0.7 0.3 0.4 0.5 0.5 0.8 FI 0.4 0.2 0.3 0.6 0.3 0.3 0.2 0.2 0.2 0.3 0.2 FR 3.2 1.6 2.8 3.9 2.7 2.2 1.6 1.8 2.2 2.1 2.1 GB 2.4 3.2 3.6 10.6 3.8 2.8 4.7 3.4 3.6 3.2 2.6 GR 0.2 0.1 0.1 0.1 0.3 0.2 0.0 0.0 0.1 0.1 0.1 HK 34.7 2.3 3.6 4.5 4.6 3.2 5.9 4.8 3.9 12.3 ID 0.9 0.7 0.6 2.0 1.7 1.0 0.9 2.6 0.5 1.3 IE 0.1 0.1 0.1 0.1 0.4 0.1 0.1 0.1 0.2 0.1 0.1 IN 0.0 0.4 0.3 0.6 0.5 0.3 0.2 0.8 2.0 0.2 IT 2.5 1.7 2.6 4.0 2.1 2.0 1.3 1.1 1.5 2.0 1.6 JP 13.7 10.3 26.8 10.4 27.6 22.7 21.2 17.8 30.4 22.3 KR 2.5 3.3 6.2 2.2 7.6 2.5 4.4 2.8 3.0 2.4 MX 0.2 0.3 0.3 0.5 0.8 0.8 0.1 0.1 0.1 0.3 0.5 MY 0.5 0.9 1.1 0.7 2.4 1.3 1.3 15.5 1.5 2.0 NL 0.9 1.3 2.8 2.2 2.1 1.4 1.3 2.0 2.0 1.8 2.5 NO 0.3 0.2 0.1 0.3 0.4 0.3 0.2 0.1 0.2 0.3 0.2 NZ 0.1 0.1 0.1 0.2 0.4 0.2 0.2 0.1 0.2 0.1 0.2 PH 0.2 0.7 0.5 0.3 0.9 0.7 0.5 0.8 0.4 0.9 PT 0.1 0.1 0.0 0.2 0.2 0.1 0.0 0.0 0.1 0.1 0.1 SE 0.6 0.5 0.8 1.1 0.8 0.8 0.9 0.3 0.6 0.9 0.8 SG 1.3 2.7 7.6 2.7 3.5 2.8 19.8 3.7 7.9 3.0 TH 0.8 1.2 0.8 1.1 3.1 1.2 1.6 2.0 4.2 1.6 TW 0.3 6.1 5.0 1.8 6.2 2.5 4.9 6.4 5.0 4.1 US 20.1 18.4 15.1 21.5 32.3 29.1 21.0 31.0 22.6 17.3 28.5
33
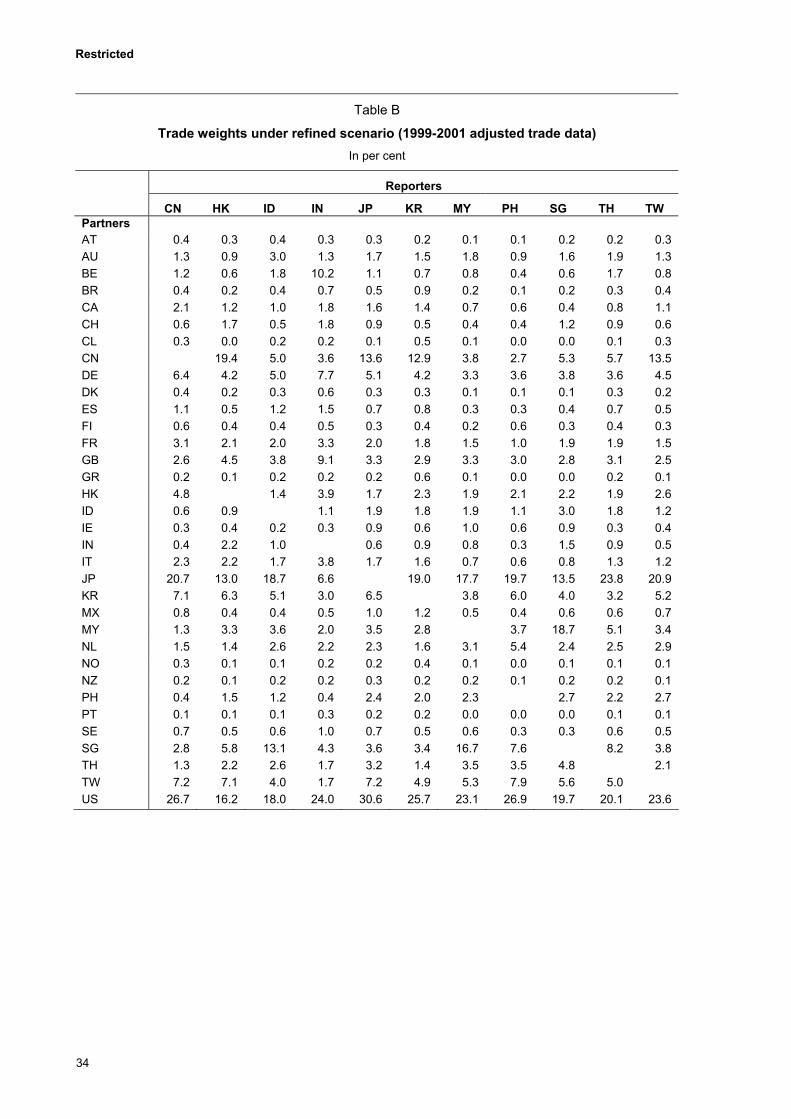
Restricted
Table B
Trade weights under refined scenario (1999-2001 adjusted trade data)In per cent
Reporters
CN HK ID IN JP KR MY PH SG TH TW Partners AT 0.4 0.3 0.4 0.3 0.3 0.2 0.1 0.1 0.2 0.2 0.3 AU 1.3 0.9 3.0 1.3 1.7 1.5 1.8 0.9 1.6 1.9 1.3 BE 1.2 0.6 1.8 10.2 1.1 0.7 0.8 0.4 0.6 1.7 0.8 BR 0.4 0.2 0.4 0.7 0.5 0.9 0.2 0.1 0.2 0.3 0.4 CA 2.1 1.2 1.0 1.8 1.6 1.4 0.7 0.6 0.4 0.8 1.1 CH 0.6 1.7 0.5 1.8 0.9 0.5 0.4 0.4 1.2 0.9 0.6 CL 0.3 0.0 0.2 0.2 0.1 0.5 0.1 0.0 0.0 0.1 0.3 CN 19.4 5.0 3.6 13.6 12.9 3.8 2.7 5.3 5.7 13.5 DE 6.4 4.2 5.0 7.7 5.1 4.2 3.3 3.6 3.8 3.6 4.5 DK 0.4 0.2 0.3 0.6 0.3 0.3 0.1 0.1 0.1 0.3 0.2 ES 1.1 0.5 1.2 1.5 0.7 0.8 0.3 0.3 0.4 0.7 0.5 FI 0.6 0.4 0.4 0.5 0.3 0.4 0.2 0.6 0.3 0.4 0.3 FR 3.1 2.1 2.0 3.3 2.0 1.8 1.5 1.0 1.9 1.9 1.5 GB 2.6 4.5 3.8 9.1 3.3 2.9 3.3 3.0 2.8 3.1 2.5 GR 0.2 0.1 0.2 0.2 0.2 0.6 0.1 0.0 0.0 0.2 0.1 HK 4.8 1.4 3.9 1.7 2.3 1.9 2.1 2.2 1.9 2.6 ID 0.6 0.9 1.1 1.9 1.8 1.9 1.1 3.0 1.8 1.2 IE 0.3 0.4 0.2 0.3 0.9 0.6 1.0 0.6 0.9 0.3 0.4 IN 0.4 2.2 1.0 0.6 0.9 0.8 0.3 1.5 0.9 0.5 IT 2.3 2.2 1.7 3.8 1.7 1.6 0.7 0.6 0.8 1.3 1.2 JP 20.7 13.0 18.7 6.6 19.0 17.7 19.7 13.5 23.8 20.9 KR 7.1 6.3 5.1 3.0 6.5 3.8 6.0 4.0 3.2 5.2 MX 0.8 0.4 0.4 0.5 1.0 1.2 0.5 0.4 0.6 0.6 0.7 MY 1.3 3.3 3.6 2.0 3.5 2.8 3.7 18.7 5.1 3.4 NL 1.5 1.4 2.6 2.2 2.3 1.6 3.1 5.4 2.4 2.5 2.9 NO 0.3 0.1 0.1 0.2 0.2 0.4 0.1 0.0 0.1 0.1 0.1 NZ 0.2 0.1 0.2 0.2 0.3 0.2 0.2 0.1 0.2 0.2 0.1 PH 0.4 1.5 1.2 0.4 2.4 2.0 2.3 2.7 2.2 2.7 PT 0.1 0.1 0.1 0.3 0.2 0.2 0.0 0.0 0.0 0.1 0.1 SE 0.7 0.5 0.6 1.0 0.7 0.5 0.6 0.3 0.3 0.6 0.5 SG 2.8 5.8 13.1 4.3 3.6 3.4 16.7 7.6 8.2 3.8 TH 1.3 2.2 2.6 1.7 3.2 1.4 3.5 3.5 4.8 2.1 TW 7.2 7.1 4.0 1.7 7.2 4.9 5.3 7.9 5.6 5.0 US 26.7 16.2 18.0 24.0 30.6 25.7 23.1 26.9 19.7 20.1 23.6
34
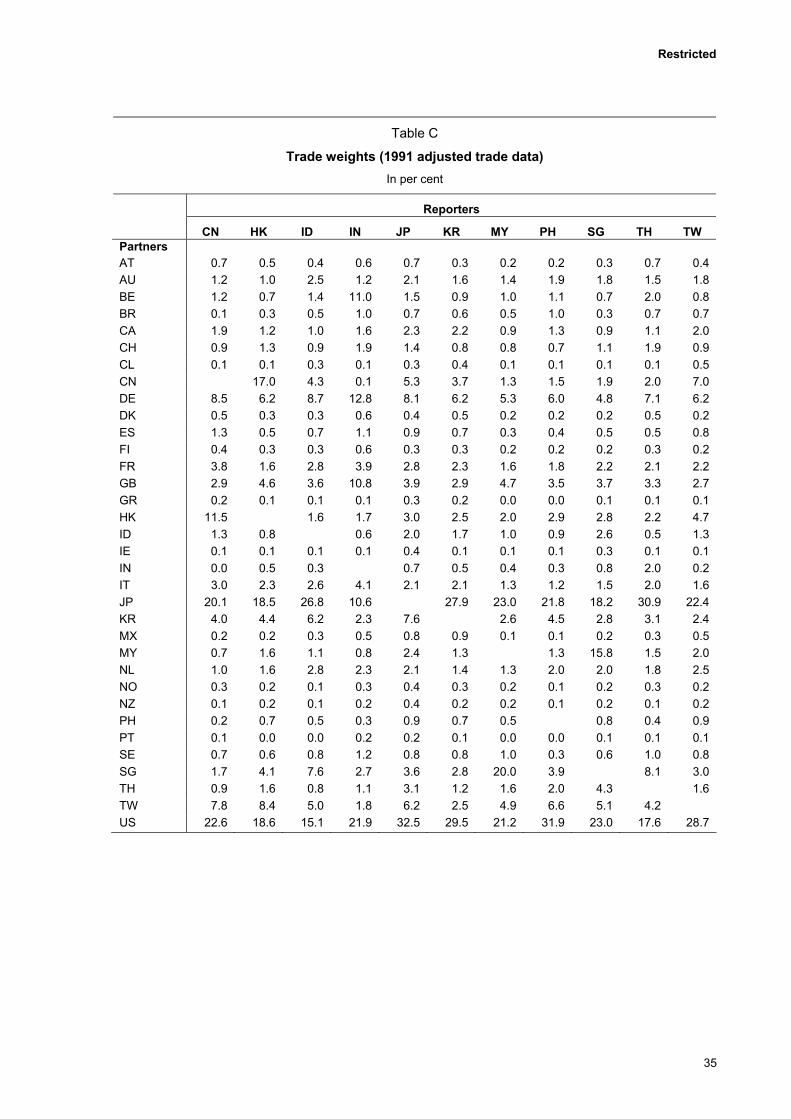
Restricted
Table C
Trade weights (1991 adjusted trade data)In per cent
Reporters
CN HK ID IN JP KR MY PH SG TH TW Partners AT 0.7 0.5 0.4 0.6 0.7 0.3 0.2 0.2 0.3 0.7 0.4 AU 1.2 1.0 2.5 1.2 2.1 1.6 1.4 1.9 1.8 1.5 1.8 BE 1.2 0.7 1.4 11.0 1.5 0.9 1.0 1.1 0.7 2.0 0.8 BR 0.1 0.3 0.5 1.0 0.7 0.6 0.5 1.0 0.3 0.7 0.7 CA 1.9 1.2 1.0 1.6 2.3 2.2 0.9 1.3 0.9 1.1 2.0 CH 0.9 1.3 0.9 1.9 1.4 0.8 0.8 0.7 1.1 1.9 0.9 CL 0.1 0.1 0.3 0.1 0.3 0.4 0.1 0.1 0.1 0.1 0.5 CN 17.0 4.3 0.1 5.3 3.7 1.3 1.5 1.9 2.0 7.0 DE 8.5 6.2 8.7 12.8 8.1 6.2 5.3 6.0 4.8 7.1 6.2 DK 0.5 0.3 0.3 0.6 0.4 0.5 0.2 0.2 0.2 0.5 0.2 ES 1.3 0.5 0.7 1.1 0.9 0.7 0.3 0.4 0.5 0.5 0.8 FI 0.4 0.3 0.3 0.6 0.3 0.3 0.2 0.2 0.2 0.3 0.2 FR 3.8 1.6 2.8 3.9 2.8 2.3 1.6 1.8 2.2 2.1 2.2 GB 2.9 4.6 3.6 10.8 3.9 2.9 4.7 3.5 3.7 3.3 2.7 GR 0.2 0.1 0.1 0.1 0.3 0.2 0.0 0.0 0.1 0.1 0.1 HK 11.5 1.6 1.7 3.0 2.5 2.0 2.9 2.8 2.2 4.7 ID 1.3 0.8 0.6 2.0 1.7 1.0 0.9 2.6 0.5 1.3 IE 0.1 0.1 0.1 0.1 0.4 0.1 0.1 0.1 0.3 0.1 0.1 IN 0.0 0.5 0.3 0.7 0.5 0.4 0.3 0.8 2.0 0.2 IT 3.0 2.3 2.6 4.1 2.1 2.1 1.3 1.2 1.5 2.0 1.6 JP 20.1 18.5 26.8 10.6 27.9 23.0 21.8 18.2 30.9 22.4 KR 4.0 4.4 6.2 2.3 7.6 2.6 4.5 2.8 3.1 2.4 MX 0.2 0.2 0.3 0.5 0.8 0.9 0.1 0.1 0.2 0.3 0.5 MY 0.7 1.6 1.1 0.8 2.4 1.3 1.3 15.8 1.5 2.0 NL 1.0 1.6 2.8 2.3 2.1 1.4 1.3 2.0 2.0 1.8 2.5 NO 0.3 0.2 0.1 0.3 0.4 0.3 0.2 0.1 0.2 0.3 0.2 NZ 0.1 0.2 0.1 0.2 0.4 0.2 0.2 0.1 0.2 0.1 0.2 PH 0.2 0.7 0.5 0.3 0.9 0.7 0.5 0.8 0.4 0.9 PT 0.1 0.0 0.0 0.2 0.2 0.1 0.0 0.0 0.1 0.1 0.1 SE 0.7 0.6 0.8 1.2 0.8 0.8 1.0 0.3 0.6 1.0 0.8 SG 1.7 4.1 7.6 2.7 3.6 2.8 20.0 3.9 8.1 3.0 TH 0.9 1.6 0.8 1.1 3.1 1.2 1.6 2.0 4.3 1.6 TW 7.8 8.4 5.0 1.8 6.2 2.5 4.9 6.6 5.1 4.2 US 22.6 18.6 15.1 21.9 32.5 29.5 21.2 31.9 23.0 17.6 28.7
35
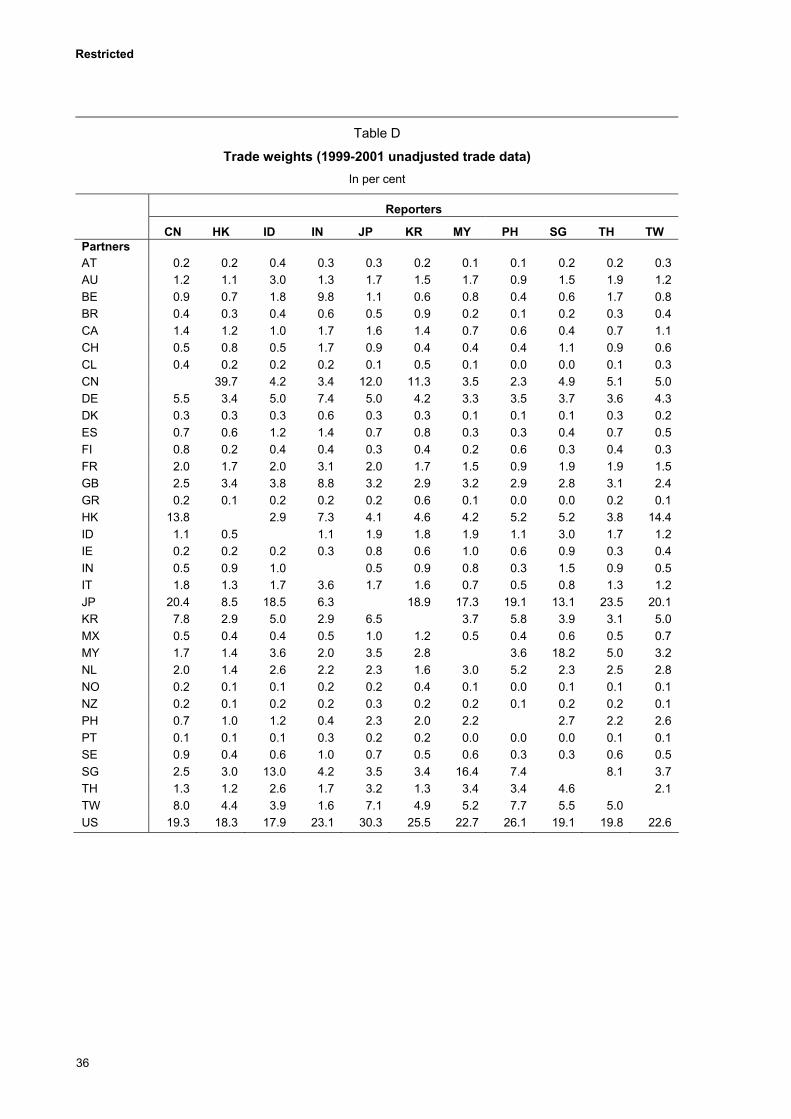
Restricted
Table D
Trade weights (1999-2001 unadjusted trade data)In per cent
Reporters
CN HK ID IN JP KR MY PH SG TH TW Partners AT 0.2 0.2 0.4 0.3 0.3 0.2 0.1 0.1 0.2 0.2 0.3 AU 1.2 1.1 3.0 1.3 1.7 1.5 1.7 0.9 1.5 1.9 1.2 BE 0.9 0.7 1.8 9.8 1.1 0.6 0.8 0.4 0.6 1.7 0.8 BR 0.4 0.3 0.4 0.6 0.5 0.9 0.2 0.1 0.2 0.3 0.4 CA 1.4 1.2 1.0 1.7 1.6 1.4 0.7 0.6 0.4 0.7 1.1 CH 0.5 0.8 0.5 1.7 0.9 0.4 0.4 0.4 1.1 0.9 0.6 CL 0.4 0.2 0.2 0.2 0.1 0.5 0.1 0.0 0.0 0.1 0.3 CN 39.7 4.2 3.4 12.0 11.3 3.5 2.3 4.9 5.1 5.0 DE 5.5 3.4 5.0 7.4 5.0 4.2 3.3 3.5 3.7 3.6 4.3 DK 0.3 0.3 0.3 0.6 0.3 0.3 0.1 0.1 0.1 0.3 0.2 ES 0.7 0.6 1.2 1.4 0.7 0.8 0.3 0.3 0.4 0.7 0.5 FI 0.8 0.2 0.4 0.4 0.3 0.4 0.2 0.6 0.3 0.4 0.3 FR 2.0 1.7 2.0 3.1 2.0 1.7 1.5 0.9 1.9 1.9 1.5 GB 2.5 3.4 3.8 8.8 3.2 2.9 3.2 2.9 2.8 3.1 2.4 GR 0.2 0.1 0.2 0.2 0.2 0.6 0.1 0.0 0.0 0.2 0.1 HK 13.8 2.9 7.3 4.1 4.6 4.2 5.2 5.2 3.8 14.4 ID 1.1 0.5 1.1 1.9 1.8 1.9 1.1 3.0 1.7 1.2 IE 0.2 0.2 0.2 0.3 0.8 0.6 1.0 0.6 0.9 0.3 0.4 IN 0.5 0.9 1.0 0.5 0.9 0.8 0.3 1.5 0.9 0.5 IT 1.8 1.3 1.7 3.6 1.7 1.6 0.7 0.5 0.8 1.3 1.2 JP 20.4 8.5 18.5 6.3 18.9 17.3 19.1 13.1 23.5 20.1 KR 7.8 2.9 5.0 2.9 6.5 3.7 5.8 3.9 3.1 5.0 MX 0.5 0.4 0.4 0.5 1.0 1.2 0.5 0.4 0.6 0.5 0.7 MY 1.7 1.4 3.6 2.0 3.5 2.8 3.6 18.2 5.0 3.2 NL 2.0 1.4 2.6 2.2 2.3 1.6 3.0 5.2 2.3 2.5 2.8 NO 0.2 0.1 0.1 0.2 0.2 0.4 0.1 0.0 0.1 0.1 0.1 NZ 0.2 0.1 0.2 0.2 0.3 0.2 0.2 0.1 0.2 0.2 0.1 PH 0.7 1.0 1.2 0.4 2.3 2.0 2.2 2.7 2.2 2.6 PT 0.1 0.1 0.1 0.3 0.2 0.2 0.0 0.0 0.0 0.1 0.1 SE 0.9 0.4 0.6 1.0 0.7 0.5 0.6 0.3 0.3 0.6 0.5 SG 2.5 3.0 13.0 4.2 3.5 3.4 16.4 7.4 8.1 3.7 TH 1.3 1.2 2.6 1.7 3.2 1.3 3.4 3.4 4.6 2.1 TW 8.0 4.4 3.9 1.6 7.1 4.9 5.2 7.7 5.5 5.0 US 19.3 18.3 17.9 23.1 30.3 25.5 22.7 26.1 19.1 19.8 22.6
36