Average Effective Tax Rates on Capital, Labour and ...
55
OECD Economics Department Working Papers No. 258 Average Effective Tax Rates on Capital, Labour and Consumption David Carey, Harry Tchilinguirian https://dx.doi.org/10.1787/247874530426
-
Upload
khangminh22 -
Category
Documents
-
view
1 -
download
0
Transcript of Average Effective Tax Rates on Capital, Labour and ...
OECD Economics Department Working Papers No. 258
Average Effective Tax Rateson Capital, Labourand Consumption
David Carey,Harry Tchilinguirian
https://dx.doi.org/10.1787/247874530426
Unclassified ECO/WKP(2000)31
Organisation de Coopération et de Développement Economiques OLIS : 02-Oct-2000Organisation for Economic Co-operation and Development Dist. : 10-Oct-2000__________________________________________________________________________________________
English text onlyECONOMICS DEPARTMENT
AVERAGE EFFECTIVE TAX RATES ON CAPITAL, LABOUR ANDCONSUMPTION
ECONOMICS DEPARTMENT WORKING PAPERS NO. 258
byDavid Carey and Harry Tchilinguirian
Unclassified
EC
O/W
KP
(2000)31E
nglish text only
Most Economics Department Working Papers beginning with No. 144 are now availablethrough OECD’s Internet Web site at http://ww.oecd.org/eco/eco.
96040
Document complet disponible sur OLIS dans son format d’origine
Complete document available on OLIS in its original format
ECO/WKP(2000)31
2
ABSTRACT/RÉSUMÉ
Over the past 15 years, tax reforms have profoundly changed the shape of OECD tax systems andrekindled interest in measuring effective tax burdens. Indeed, in order to understand past reforms or to evaluate thetax policies of particular countries, it is necessary to go beyond statutory rates since these sometimes bear littlerelation to rates actually paid. This paper updates and extends the Mendoza et al. estimates of average effective taxrates (AETRs) and presents new estimates based on modifications to the methodology to make some of theunderlying assumptions more realistic. In particular, the assumption that all income from self-employment is capitalincome is dropped in favour of assuming that the self-employed earn both labour and capital income. This changeraises estimates of the AETR on capital and reduces the estimated AETR on labour but does not alter the trendsobserved in the updated Mendoza et al. estimates. Both sets of estimates show that, on average, the relative taxburden has shifted towards labour in OECD countries since the early 1980s. Considerable caution is required wheninterpreting AETRs as the methodology is subject to a number of limitations, not the least of which result from thedifficulty of splitting income tax between capital and labour. Whether for individual countries or for the OECD as awhole, estimates of average effective tax rates should not be used as a basis for policy decisions without more broadlybased analysis and corroborating data, including micro-data. Moreover, it should not be forgotten that the initialimpact of taxes (between capital, labour and consumption) captured by these indicators may not coincide with finalincidence.
JEL code: H22, H87, H89Keywords: Average effective tax rates, tax ratios, implicit tax rates
*****
Au cours des quinze dernières années, diverses réformes ont profondément modifié la structure dessystèmes fiscaux des pays de l'OCDE et ravivé l'intérêt pour une mesure de la charge fiscale effective. De fait, pourcomprendre les réformes antérieures ou pour évaluer les politiques fiscales de certains pays, il est nécessaire d'aller audelà des taux statutaires, ceux-ci ayant parfois bien peu de relation avec ceux effectivement payés. Cet articleactualise et étend les estimations des TIEM (taux d'imposition effectifs moyens) mis au point par Mendoza et al. etprésente de nouvelles estimations fondées sur des modifications de la méthodologie visant à rendre plus réalistescertaines des hypothèses sous-jacentes. En particulier l'hypothèse selon laquelle l'ensemble des revenus destravailleurs indépendants doit être considéré comme revenu du capital est abandonnée en faveur d'une hypothèseselon laquelle les revenus des travailleurs indépendants représentent à la fois des revenus du travail et des revenus ducapital. Ce changement augmente les estimations des TIEM sur le capital et réduit les TIEM estimés sur le travail,mais ne modifie pas les tendances observées dans les estimations révisées de Mendoza et al. Ces deux sériesd'estimations montrent qu'en moyenne la charge fiscale relative s'est déplacée vers le travail dans les pays de l'OCDEdepuis le début des années 80. Les estimations des TIEM doivent être interprétées avec beaucoup de prudence car laméthodologie utilisée comporte un certain nombre de limites, la difficulté de répartir l’impôt sur le revenu entre lecapital et le travail n’étant pas la moindre. Que ce soit pour les pays pris individuellement ou pour l’ensemble del’OCDE, les estimations des taux d’imposition effectifs moyens ne doivent pas servir à orienter la politiqueéconomique sans une analyse plus large et des données qui les corroborent (y compris des donnéesmicroéconomiques). En outre, il faut garder à l’esprit que l’impact initial des impôts (sur le capital, le travail et laconsommation) capté par ces indicateurs peut ne pas coïncider avec leur incidence finale.
Classification JEL: H22, H87, H89Mots-clés : Taux d’imposition effectifs moyens, coefficient de pression fiscale, taux d’imposition implicites
Copyright OECD, 2000Applications for permission to reproduce or translate all, or part of, this material should be made to:Heads of Publications Service, OECD, 2 rue André Pascal, 75775 Paris Cedex 16, France.

ECO/WKP(2000)31
3
TABLE OF CONTENTS
Page
I. Introduction ............................................................................................................................4
II. Updated Mendoza et al. estimates of average effective tax rates...........................................6
III. Estimates based on a modified version of the Mendoza et al. methodology .......................12
IV. Effects of relaxing some assumptions about capital income................................................20
V. Limitations of the methodology ...........................................................................................23
VI. Conclusion............................................................................................................................25
Tables and figures................................................................................................................................27
Annex tables ........................................................................................................................................45
Bibliography ........................................................................................................................................51
ECO/WKP(2000)31
4
AVERAGE EFFECTIVE TAX RATES ON CAPITAL, LABOUR AND CONSUMPTION
David Carey and Harry Tchilinguirian1
I. Introduction
1. Taxation has increased significantly in OECD countries in recent decades, raising the importanceof analyses to determine its effects on major macroeconomic variables such as saving, investment andemployment. An obstacle to undertaking such analyses has been the absence of suitable measures ofaggregate taxation. As noted by Mendoza et al. (1994), various strategies to combine information onstatutory tax schedules, tax returns and tax codes with data on income distribution, household surveys, andprojections of real present values for investment projects in specific industries have been proposed tomeasure marginal effective income tax rates.2 However, in view of the complexity of tax credits,exemptions and deductions in most countries, it is not clear that such tax rates are equivalent to themacroeconomic variables that affect macroeconomic variables as measured in National Accounts.3 Analternative approach, suggested by Lucas (1990) and (1991) and Razin and Sadka (1993) and developed byMendoza et al. (1994), is to relate realised tax revenues directly to the relevant macroeconomic variables inthe National Accounts. The resulting estimates, known as “average effective tax rates” (AETRs), “implicittax rates” or “tax ratios”, take into account the effective overall tax burden from the major taxes and areconsistent with the concept of aggregate tax rates at the national level and with the representative agentassumption.4,5 According to Mendoza et al (1994), empirical work conducted by the earlier authors
1. The authors are indebted to Steven Clark, Kathryn Gordon, Jeffrey Owens, Paul Atkinson, Chiara Bronchi,
Jorgen Elmeskov, Andreas Woergoetter and several other OECD colleagues for drafting suggestions andcomments; to Chantal Nicq and Josette Rabesona for technical support and to Anne Eggimann and NanetteMellage for secretarial support. The authors would also like to thank members of the Working Party onTax Policy Analysis and Tax Statistics of the OECD Committee on Fiscal Affairs who provided commentson an earlier draft. All errors and omissions, of course, are the authors’.
2. Mendoza et al (1994) (p. 2) list the following such studies: for the United States, Auerbach (1987), Barroand Sahasakul (1986), Joines (1981), and Seater (1985); and for international studies, King and Fullerton(1984), McKee, Viser and Saunders (1986), OECD (1991), and Easterly and Rabelo (1993). King andFullerton (1984), which is perhaps the best known such study, uses statutory tax rates to estimate effectivemarginal tax rates for a stylised firm. Although extensively used, this methodology is often criticised for itsunrealistic assumptions (e.g. that firms do not adjust their asset and financial structures in response to taxincentives).
3. Mendoza et al. (1994), p. 2.
4. ibid.
5. OECD (2000b) contains an extensive examination of the conceptual and practical difficulties encounteredin the measurement of implicit tax rates as well as suggestions for refinements of the existing approaches in
ECO/WKP(2000)31
5
suggests that these tax rates are useful approximations to the taxes that distort economic decisions indynamic models. As with the other approaches, this method involves a number of limiting assumptions,most of which are needed to allow the available data to be used to form estimates of the value of revenuestreams and the relevant macroeconomic variables.
2. This paper updates the Mendoza et al. estimates of average effective tax rates on capital, labourand consumption (Table A1), which end in 1988, and extends coverage from G7 countries to most OECDcountries. It also presents new estimates based on modifications to the methodology to make some of theunderlying assumptions more realistic. In particular, the assumption that all income from self-employmentis capital income is dropped in favour of assuming that the self-employed earn both labour and capitalincome. This change markedly raises estimates of the AETR on capital and reduces the estimated AETRon labour but does not alter the trends observed in the updated Mendoza et al. estimates. Sensitivityanalysis is also carried out to see what are the effects of relaxing the assumption that capital income istaxed at the same rate as all other household income. Assessments are made of the impact on the estimatesof allowing for preferential tax treatment for pension fund and life insurance earnings, relief from doubletaxation of dividends, and the possibility that households pay no tax at all on capital income. The lattersimulation can be considered as an upper limit for relaxing the other two assumptions at the same time aswell as the implicit assumption that imputed rentals on owner occupied housing are fully taxed and thathouseholds do not evade taxes on capital income. Relaxing the first two assumptions does not generallyhave a great effect on the estimates, whereas assuming that households pay no tax at all on capital incomedoes.
3. Even after the revisions to the Mendoza et al. methodology presented in this paper, many of theassumptions that underlie the calculations of AETRs are unrealistic. Given the various limitations to AETRmethodologies relying on aggregate tax and national accounts data (see Sections II and V below) theOECD takes the view that further work relying on micro-data is required to assess the magnitude ofpotential biases to average tax rate figures derived from aggregate data.6 Caution is therefore requiredwhen interpreting estimates of AETRs, including those reported in this paper, especially for individualcountries since the estimates may be particularly sensitive to underlying assumptions. Furthermore, policymakers should be aware of the methodological problems should AETR estimates be used to shape publicdebate. Such estimates should not be used on their own to support a given policy stance or to advocate aparticular direction for reform. Rather, estimates of average effective tax rates should be used inconjunction with more broadly based analyses and with other tax indicators and information that cancorroborate the story they tell.
the literature. OECD (2000a) also discusses the strengths and weaknesses of implicit tax ratios in thecontext of an analysis of the different approaches available for measuring tax burdens.
6. The “health warnings” applying to the use of AETR are amplified in OECD (2000a) and OECD (2000b).The authors of OECD (2000b, p. 3) conclude that “…average tax rates measured using aggregate data willin a number of cases generate misleading indicators of the tax burdens on taxpayers, on factors ofproduction, and on consumption. At the same time, it is recognised that an examination of such ratios is auseful exercise, if only to identify the substantial shortcomings of these measures. The message of thisstudy is that policymakers should be aware of the measurement problems underlying average tax rate basedon aggregate data, should they be fielded to shape public policy debates”. In OECD (2000a), it is noted thatwhile average tax rates represent a more informative indicator of the burden and impact of tax systems thana simple reliance on nominal (statutory) tax rates or tax revenue as a share of GDP, their calculation raisesseveral potentially significant methodological problems. The Working Party No. 2 on Tax Policy Analysisand Tax Statistics of the OECD Committee on Fiscal Affairs takes the view that AETR results relying onaggregate tax and national accounts data are potentially highly misleading indicators of relative tax burdensand tax trends. Work is currently under way by Working Party No. 2 delegates using micro-data to assessthe magnitude of potential biases to average tax rate figures derived from aggregate data.

ECO/WKP(2000)31
6
4. The methodology and underlying assumptions used to calculate AETRs are outlined in the nextsection along with some of the data problems that are encountered. In addition, the Mendoza et al.estimates are updated and extended beyond the G7 countries. In the following section, estimates arepresented based on revised equations that correct some shortcomings in the Mendoza et al. equations. Thisis followed by an examination of the effects of relaxing some of the underlying assumptions about thetaxation of capital income. Finally, limitations of the methodology are discussed in Section V.
II. Updated Mendoza et al. estimates of average effective tax rates
Methodology, underlying assumptions and data problems
5. The Mendoza et al. methodology involves relating realised tax revenues to estimates of theassociated tax bases. Tax shifting is not taken into account: the initial impact of taxes is assumed to be thefinal incidence. Hence the tax burdens calculated using this methodology will not correspond to theburdens impacting on economic incentives if, as is likely, there is tax shifting. Tax revenue data come fromOECD Revenue Statistics (OECD, 1999). This contains time series on revenue streams from various typesof tax -- on personal incomes, corporate profits, sales, property, etc. -- as reported by member countries.Estimates of the value of the associated tax bases come from National Accounts. As such data do notreadily fit with the tax revenue data, a number of assumptions -- some of them very restrictive -- arerequired to align the two data sets. One particular problem of fit concerns data on household taxes. Thesedata do not distinguish between taxes paid on labour- and capital income. Mendoza et al. deal with thisproblem by assuming households pay the same effective tax rates on capital and labour incomes (i.e. theyassume that the labour component of the household income tax is proportional to labour’s share inhousehold income). OECD data on statutory tax arrangements show that this assumption is unlikely to be agood one for many OECD countries (OECD 1994). Some have dual income systems that treat capitalincome differently from labour income and/or provide relief from double taxation of dividends. There arealso special arrangements for pensions, owner-occupied housing and individual share ownership.
6. Another problem is that no distinction is made in National Accounts between the labour andcapital components of self employed income. As noted above, Mendoza et al. assign all self-employedincome to capital. An alternative approach, presented in Section III, is to assign part of this income flow tolabour and part to capital. This entails making an estimate of labour income of the self-employed, which isan inherently difficult task that could be approached in a variety of ways. Other problems that arise fromusing National Accounts data are that:
− the definitions of National Accounts data categories (e.g. the definition of the corporate andquasi-corporate sector) may not be fully comparable to analogous tax revenue data categories(e.g. corporate income taxes paid);
− the procedures for estimating the consumption of fixed capital, which is used in calculatingnet operating surplus, are not comparable across countries (and this has an importantinfluence on the estimates);
− National Accounts data may reflect avoidance and evasion incentives created by national taxsystems. For example, if a country’s tax policies favour capital income over labour income,then there would be an incentive to disguise labour income as capital income.7 The potential
7. The ease with which such a switch could be effected would depend on legal and labour market practices in
the country concerned.

ECO/WKP(2000)31
7
for switching reduces the reliability and comparability of estimates of the tax bases associatedwith capital and labour; and
− Revisions to National Accounts data on the basis of SNA 93/ESA 95 are at different stages ofprogress in different countries. In many countries, National Accounts are partly on the oldbasis (SNA 68/ESA 79) and partly on the new basis. The data used in this paper reflect theprogress that had been made by mid-20008. GDP and operating surplus tend to be higher on aSNA 93/ESA 95 basis, reducing tax ratios.9
7. It also should be borne in mind that there are differences between the concepts of acomprehensive tax base in National Accounts and in tax codes, especially for capital income. For instance,capital gains would be included in comprehensive income in a tax code but not in the National Accounts(because there is no value added). Similarly, the payment of dividends increases the tax base in countrieswith a classical system for taxing corporate earnings (i.e. there is double taxation of dividends) but doesnot increase capital income in the National Accounts (again, there is no value added). Another problem isthat Revenue Statistics are on a cash basis10 whereas National Accounts are on an accrual basis. This meansthat the timing of the two data sets does not correspond.
AETR equations
Effective household tax ratio, τh
8. In order to calculate the AETR on labour (τl) or on capital (τk), it is necessary to calculate theAETR on total household income, τh . This is used to allocate personal income tax to capital and labourunder the assumption that the average tax rate paid on each is the same (that is, τh). (The results ofsensitivity analysis exploring the importance of this assumption for the estimated AETR on capital andlabour are reported in section IV). Thus, τh can be calculated as follows:
τh = 1100/(OSPUE+PEI + W) (1)
This equation says that the AETR on household income is personal income tax divided by the householdincome. Note that in some countries11, enterprise taxes are included in personal income tax (1100);symbols and mnemonics are described in Box 1. Household income comprises operating surplus of theunincorporated sector (OSPUE), property income (PEI) and dependent wage income (W). Note thatimputed rentals on owner-occupied housing are included in OSPUE and that pension fund and lifeinsurance earnings, which are imputed to households in the National Accounts, are included in PEI.
8. The EO67 database is used. In this database, there are at least some revised data for all countries except the
following: Japan; Iceland; New Zealand; Poland; Switzerland; and Turkey. For more information, seehttp: //www.oecd.org/eco/data/eoinv.pdf, pp 5-6.
9. The implications of these revisions for reported tax ratios are discussed OECD (1999), Revenue Statistics1965/98, special feature S. 3, pp. 30-33.
10. This can result in tax data in a given year including revenue from a tax that no longer exists, as occurred inAustria following the abolition of the business tax (Gewerbesteuer) at the end of 1993.
11. These countries are Japan, Germany, Italy, Austria and Greece.

ECO/WKP(2000)31
8
Box 1. Variable names and symbols used
The tax revenue data are identified using the OECD system (OECD Revenue Statistics):
- 1100 Taxes on income, profit and capital gains of individuals or households;
- 1200 Taxes on income, profit and capital gains of corporations;
- 1300 Unallocated taxes on income, profit and capital gains;
- 2000 Total social security contributions (2100 is paid by employees; 2200 by employers; 2300 bythe self-employed; 2400 is unallocated);
- 3000 Taxes on payroll and workforce;
- 4000 Taxes on property;
- 4100 Recurrent taxes in immovable property;
- 4400 Taxes on financial and capital transactions;
- 5110 General taxes on goods and services (5111 VAT)
- 5120 Taxes on specific goods and services (5121 excise taxes; 5122 profits of fiscal monopolies;5123 customs and import duties; 5126 taxes on specific services; 5128 other taxes);
- 5200 Taxes on use of goods and performances.
The variables from National Accounts are:
- CP Private final consumption expenditure;
- EE Dependent employment;
- ES Self-employment;
- CG Government final consumption expenditure;
- CGW Government final wage consumption expenditure;
- IG Investment by general government;
- IP Investment by private sector;
- OSPUE Unincorporated business net income (including imputed rentals on owner-occupiedhousing);1
- PEI Interest, dividends and investment receipts;2
- W Wages and salaries of dependent employment;
- WSSS Compensation of employees (including private employers’ contributions to social securityand to pension funds);
- OS Net operating surplus of the overall economy.3
________________________
1. The mnemonics for this variable reflect the definition in SNA68/ESA79, “Operating surplus of private unincorporatedenterprises”.
2. This variable is “households’ property and entrepreneurial income” in SNA68/ESA79.3. This normally includes the statistical discrepancy.
ECO/WKP(2000)31
9
Effective labour tax ratio, τl
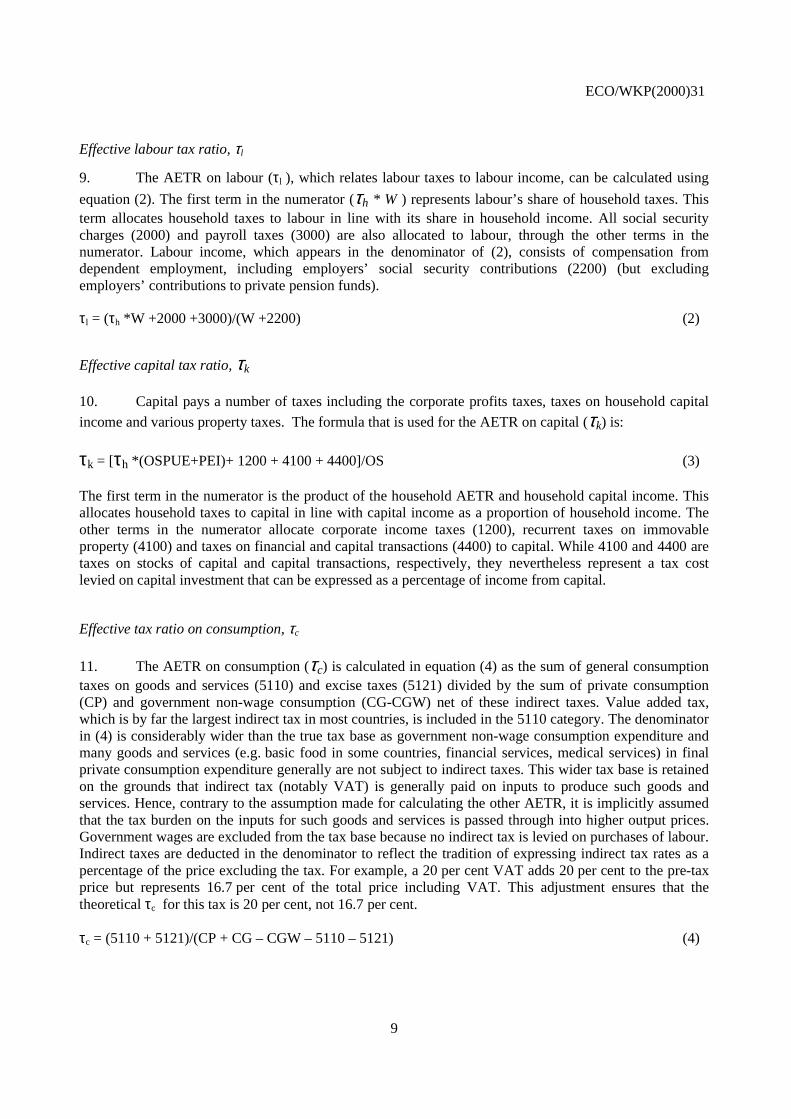
9. The AETR on labour (τl ), which relates labour taxes to labour income, can be calculated using
equation (2). The first term in the numerator (τh * W ) represents labour’s share of household taxes. Thisterm allocates household taxes to labour in line with its share in household income. All social securitycharges (2000) and payroll taxes (3000) are also allocated to labour, through the other terms in thenumerator. Labour income, which appears in the denominator of (2), consists of compensation fromdependent employment, including employers’ social security contributions (2200) (but excludingemployers’ contributions to private pension funds).
τl = (τh *W +2000 +3000)/(W +2200) (2)
Effective capital tax ratio, τk
10. Capital pays a number of taxes including the corporate profits taxes, taxes on household capital
income and various property taxes. The formula that is used for the AETR on capital (τk) is:
τk = [τh *(OSPUE+PEI)+ 1200 + 4100 + 4400]/OS (3)
The first term in the numerator is the product of the household AETR and household capital income. Thisallocates household taxes to capital in line with capital income as a proportion of household income. Theother terms in the numerator allocate corporate income taxes (1200), recurrent taxes on immovableproperty (4100) and taxes on financial and capital transactions (4400) to capital. While 4100 and 4400 aretaxes on stocks of capital and capital transactions, respectively, they nevertheless represent a tax costlevied on capital investment that can be expressed as a percentage of income from capital.
Effective tax ratio on consumption, τc
11. The AETR on consumption (τc) is calculated in equation (4) as the sum of general consumptiontaxes on goods and services (5110) and excise taxes (5121) divided by the sum of private consumption(CP) and government non-wage consumption (CG-CGW) net of these indirect taxes. Value added tax,which is by far the largest indirect tax in most countries, is included in the 5110 category. The denominatorin (4) is considerably wider than the true tax base as government non-wage consumption expenditure andmany goods and services (e.g. basic food in some countries, financial services, medical services) in finalprivate consumption expenditure generally are not subject to indirect taxes. This wider tax base is retainedon the grounds that indirect tax (notably VAT) is generally paid on inputs to produce such goods andservices. Hence, contrary to the assumption made for calculating the other AETR, it is implicitly assumedthat the tax burden on the inputs for such goods and services is passed through into higher output prices.Government wages are excluded from the tax base because no indirect tax is levied on purchases of labour.Indirect taxes are deducted in the denominator to reflect the tradition of expressing indirect tax rates as apercentage of the price excluding the tax. For example, a 20 per cent VAT adds 20 per cent to the pre-taxprice but represents 16.7 per cent of the total price including VAT. This adjustment ensures that thetheoretical τc for this tax is 20 per cent, not 16.7 per cent.
τc = (5110 + 5121)/(CP + CG – CGW – 5110 – 5121) (4)
ECO/WKP(2000)31
10
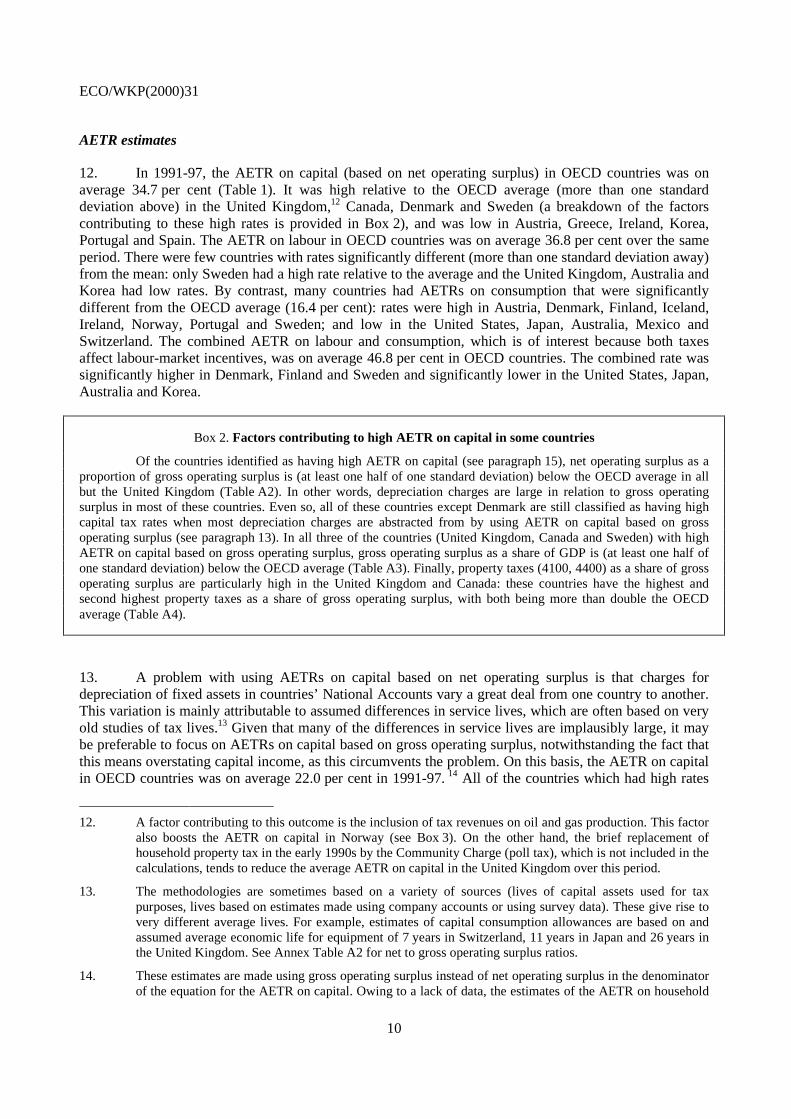
AETR estimates
12. In 1991-97, the AETR on capital (based on net operating surplus) in OECD countries was onaverage 34.7 per cent (Table 1). It was high relative to the OECD average (more than one standarddeviation above) in the United Kingdom,12 Canada, Denmark and Sweden (a breakdown of the factorscontributing to these high rates is provided in Box 2), and was low in Austria, Greece, Ireland, Korea,Portugal and Spain. The AETR on labour in OECD countries was on average 36.8 per cent over the sameperiod. There were few countries with rates significantly different (more than one standard deviation away)from the mean: only Sweden had a high rate relative to the average and the United Kingdom, Australia andKorea had low rates. By contrast, many countries had AETRs on consumption that were significantlydifferent from the OECD average (16.4 per cent): rates were high in Austria, Denmark, Finland, Iceland,Ireland, Norway, Portugal and Sweden; and low in the United States, Japan, Australia, Mexico andSwitzerland. The combined AETR on labour and consumption, which is of interest because both taxesaffect labour-market incentives, was on average 46.8 per cent in OECD countries. The combined rate wassignificantly higher in Denmark, Finland and Sweden and significantly lower in the United States, Japan,Australia and Korea.
Box 2. Factors contributing to high AETR on capital in some countries
Of the countries identified as having high AETR on capital (see paragraph 15), net operating surplus as aproportion of gross operating surplus is (at least one half of one standard deviation) below the OECD average in allbut the United Kingdom (Table A2). In other words, depreciation charges are large in relation to gross operatingsurplus in most of these countries. Even so, all of these countries except Denmark are still classified as having highcapital tax rates when most depreciation charges are abstracted from by using AETR on capital based on grossoperating surplus (see paragraph 13). In all three of the countries (United Kingdom, Canada and Sweden) with highAETR on capital based on gross operating surplus, gross operating surplus as a share of GDP is (at least one half ofone standard deviation) below the OECD average (Table A3). Finally, property taxes (4100, 4400) as a share of grossoperating surplus are particularly high in the United Kingdom and Canada: these countries have the highest andsecond highest property taxes as a share of gross operating surplus, with both being more than double the OECDaverage (Table A4).
13. A problem with using AETRs on capital based on net operating surplus is that charges fordepreciation of fixed assets in countries’ National Accounts vary a great deal from one country to another.This variation is mainly attributable to assumed differences in service lives, which are often based on veryold studies of tax lives.13 Given that many of the differences in service lives are implausibly large, it maybe preferable to focus on AETRs on capital based on gross operating surplus, notwithstanding the fact thatthis means overstating capital income, as this circumvents the problem. On this basis, the AETR on capitalin OECD countries was on average 22.0 per cent in 1991-97. 14 All of the countries which had high rates
12. A factor contributing to this outcome is the inclusion of tax revenues on oil and gas production. This factor
also boosts the AETR on capital in Norway (see Box 3). On the other hand, the brief replacement ofhousehold property tax in the early 1990s by the Community Charge (poll tax), which is not included in thecalculations, tends to reduce the average AETR on capital in the United Kingdom over this period.
13. The methodologies are sometimes based on a variety of sources (lives of capital assets used for taxpurposes, lives based on estimates made using company accounts or using survey data). These give rise tovery different average lives. For example, estimates of capital consumption allowances are based on andassumed average economic life for equipment of 7 years in Switzerland, 11 years in Japan and 26 years inthe United Kingdom. See Annex Table A2 for net to gross operating surplus ratios.
14. These estimates are made using gross operating surplus instead of net operating surplus in the denominatorof the equation for the AETR on capital. Owing to a lack of data, the estimates of the AETR on household

ECO/WKP(2000)31
11
based on net operating surplus except Denmark (depreciation charges are high) continue to have high rateswhile of the countries which had low rates, only Austria, Greece and Portugal continue to do so. NewZealand now joins the group of countries with high rates (depreciation charges are low) and Germany joinsthe group with low rates (depreciation charges are high). In the remainder of this paper, discussion ofAETRs on capital focuses on estimates based on gross operating surplus, although estimates based on netoperating surplus will also be included for information in the tables.
14. There are a number of caveats to bear in mind when comparing AETRs across countries. One isthat estimates of the ATER on labour are influenced by the extent to which countries rely on fundedpension systems as opposed to pay-as-you-go systems for the provision of retirement income. This isbecause contributions to funded systems, even if they are compulsory, are (rightly) not considered to betaxes whereas pay-as-you go contributions are considered to be taxes. Switzerland provides an extremeexample of the potential importance of this factor. If contributions to the second-pillar of the pensionsystem were instead social security contributions to a pay-as-you-go system, the AETR on labour there in1996 would have been 12.4 percentage points higher.15 Another factor to bear in mind is that healthinsurance arrangements affect cross-country comparisons of AETRs on capital. In particular, the fact thatthe United States does not have a compulsory social health system but that most other countries docontributes to a lower AETR on labour in the United States relative to those in other countries than wouldotherwise be the case. As for the retirement income financing arrangements, this does not mean that cross-country comparisons are false. It just means that readers should be aware that differences in AETRs onlabour may reflect to a considerable extent differences in social insurance coverage. By contrast, cross-country comparisons of AETRs on capital will be distorted if public enterprises are subject to corporate taxin some countries but not in others (the government taking its share of earnings in the form of higherdividends).16 It should also be noted that AETRs on both labour and capital are somewhat overstated inDenmark, the Netherlands and Sweden because most social security benefits are taxed (OECD 2000a, p.29); this increases the numerator of the AETR on household income without affecting the denominator.17
15. The updated estimates of AETRs based on Mendoza et al.’s methodology suggests that AETRson labour since 1980 have on average increased at a faster rate than AETRs on capital and on consumption.The OECD average trend increases in these rates and for the AETR on labour and consumption combined,as indicated by the average annual change, are 0.3, 0.2, 0.2 and 0.3 percentage point, respectively(Table 2). These estimates suggest that, on average, OECD countries have focused the increase in theoverall tax burden (Table 3) on the least mobile factor of production, labour. The trend increase in theAETR on labour and consumption was particularly large (i.e., it exceeded the OECD average by more thanone standard deviation) in Italy and Portugal. (This and all other discussion concerning countries withtrends significantly different from the OECD average abstracts from the Czech Republic, Hungary,
income used to allocate household taxes continue to be based on the net operating surplus of the householdand private unincorporated enterprise sector.
15. Contributions to the second pillar of the pension system in Switzerland were SF 25.4 billion, 6.9 per cent ofGDP in 1996 (Federal Statistics Office (1998), 13 Sécurité sociale et Assurances, La Prévoyanceprofessionnelle en Suisse, Table A2.1, columns 3 and 4).
16. Changes in the tax treatment of public enterprises, including through privatisation, will also distort trendsin AETR on capital. For example, when the Austrian central bank was made taxable in 1994, this increasedcorporate tax revenue by more than 10 per cent.
17. Correcting for this factor, the AETR on labour in the Netherlands in 1992 calculated in EuropeanCommission (1997) would decline from 52.6 per cent to 43.1 per cent assuming that the average tax rate onsocial security benefits is the same as on other personal income (OECD, 2000b, p. 29). As the average taxpaid on social security benefits is likely to be lower than on other personal income, this is an overestimateof the effect of this factor. The corrected value lies somewhere between the two estimates.

ECO/WKP(2000)31
12
Iceland, Luxembourg, Mexico, Poland and Turkey, which are excluded from the country averages owingto a lack of data). Of the two countries with large increases in the AETR on capital, only Portugal also hada high trend increase in the AETR on capital. New Zealand was the only country to have a significantlylower trend growth rate in the AETR on capital and on labour and consumption than the OECD average:both rates declined. These trends have also involved a narrowing in the distribution of AETRs on capitalacross OECD countries since 1980-85 but not on labour or on labour and consumption combined (seeTable 1).
III. Estimates based on a modified version of the Mendoza et al. methodology
Correcting the treatment of social security and private employers’ contributions to pension funds
16. There are a number of problems with the treatment of social security in the Mendoza et al.equations. First, employees’ social security contributions (2100) are counted twice in the numerator ofequation (2) for the AETR on labour. They are included in the National Accounts series for wages ofdependent employment (W) and in total social security contributions (2000). Second, social securitycontributions of the self-employed (2300) are also included in total social security contributions (2000) inthe numerator of (2) whereas all self-employed income, including social security contributions of the self-employed, is allocated to capital (3). Third, the fact that households are normally able to deduct socialsecurity contributions from taxable income is not reflected in the denominator of (2), which includes suchcontributions.18 Finally, social security contributions (2400) that cannot be allocated to employees,employers or the self-employed have all been allocated to labour whereas they are paid out of both capitaland labour income. These problems are corrected in equations (5) - (9). Employees’ social securitycontributions are deducted from W in both the denominator of (5), the new equation for the AETR onhousehold income, and the numerator of (8), the new equation for the AETR on labour. This treatmentboth eliminates the double counting of employees’ social security contributions in (2) and corrects theimplicit assumption in (1) concerning the non-deductibility of such contributions. The deductibility ofhouseholds’ social security contributions is further taken into account by deducting the social securitycontributions of the self-employed (2300) in the denominator of (5) and the numerator of (9), the AETR oncapital. As these social security contributions (2300) represent a charge on capital income, which includesall income of the self-employed, they are moved from (8) to (9). Unallocated social security contributions,which are significant in some countries, notably Switzerland, are added to the numerator of (5) as they arepaid by households. They are also deducted from the denominator of (5) as, like other social securitycontributions, they are tax deductible. Consistent with this treatment, unallocated social securitycontributions (2400) are deducted from the numerators of (8) and (9) in line with the shares of labourincome (α) and capital income (β) in household income. This ensures that household income tax (1100)and unallocated social security contributions (2400) are fully allocated to labour (8) and capital (9).
17. A related problem with the Mendoza et al. equation for the AETR on labour (2) is that thedenominator excludes private employers’ contributions to pension funds. Such contributions are a
18. Employees’ social security contributions are not deductible in Australia, Canada, Hungary, Mexico,
Portugal, the United Kingdom and the United States. With the exceptions of Hungary and Portugal, suchcontributions in these countries are considerably lower than the OECD average. In Germany, Ireland,Poland and Turkey deductions are for a flat amount. Treating employees’ social security contribution asdeductible when they are not results in too much household tax being allocated to capital (overstating theAETR on capital) and not enough household tax being allocated to labour (understating the AETR onlabour).

ECO/WKP(2000)31
13
significant part of total labour earnings in a number of countries. Failure to include these contributions inthe denominator of (8) means that the denominators of (8) and (9) do not add up to total GDP, as theyshould. This problem is corrected in (8) by replacing the existing terms in (2) with (the National Accountsseries) total compensation of employees (WSSS), which includes such contributions and the existing terms.The modified equations incorporating this and the other changes are as follows:
τh = (1100 )/(OSPUE+PEI -2300 + W - 2100 -2400) (5)
α = (W -2100)/(OSPUE + PEI -2300 +W -2100) (6)
β = 1 - α (7)
τl = (τh *(W -2100 - α 2400) +2100 +2200 +α2400 +3000)/WSSS (8)
τk = [τh *(OSPUE +PEI -2300 -β 2400) +2300 + β2400 +1200 + 4100 + 4400]/OS (9)
Dividing self-employed income into capital and labour components
18. Mendoza et al. assume unrealistically that all income from self-employment is a return to capital.This assumption is now dropped in favour of an approach that assigns this income flow to both labour andcapital. Making such an assignment is inherently difficult and could be done in a number of ways. Theapproach adopted in this paper is to assume that the self-employed “pay themselves” the same annualsalary net of social security contributions as that earned by the average employee. This is given by wagesand salaries of dependent employment (W) minus employees’ social security contributions (2100), alldivided by dependent employment (EE). The product of this imputed wage rate and the number of self-employed (ES) gives the imputed “wage bill” for the self-employed (WSE), excluding social securitypayments:
WSE = ES * ((W -2100)/EE) (10)
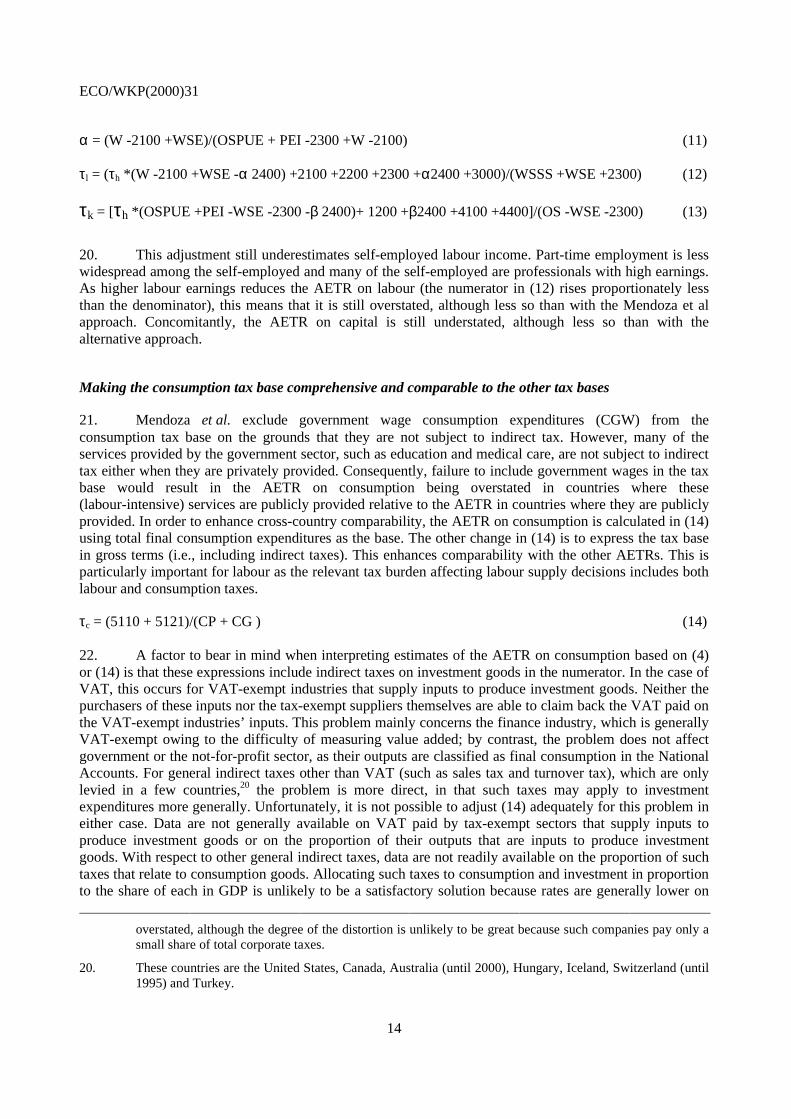
19. This change does not affect (5) as it is not necessary to distinguish between the labour and capitalcomponents of household income to calculate the AETR on households. However, (6) must be modified sothat imputed wages of the self-employed (WSE) are also taken into account when determining the share oflabour in household income net of social security contributions (11). The equation for the AETR on labour(8) must also change to include self-employed labour income (WSE) in the expression for labour income inthe numerator used for allocating labour’s share of household tax (1100) and unallocated social security(2400). Labour income of the self-employed including social security contributions (WSE + 2300) mustalso be added to total labour income in the denominator of (8) and deducted from the capital income in thedenominator of (9). Finally, with self-employed labour income now included in the denominator of (12),the social security contributions of the self-employed (2300) must be moved from the AETR on capital tothe AETR on labour. These changes are reflected in the revised equations (12) and (13) 19 for the AETR onlabour and capital, respectively.
19. The inclusion of 1200 in the numerator of (13) presupposes that this item relates entirely to capital. In fact,
there are many small corporations in some countries that are more comparable to small-unincorporatedenterprises, which are considered to pay taxes on both labour and capital income. It would be consistent totreat these corporations in the same way as unincorporated enterprises. However, this cannot be doneowing to the lack of aggregate data. In the absence of this adjustment, AETR on capital tend to be
ECO/WKP(2000)31
14
α = (W -2100 +WSE)/(OSPUE + PEI -2300 +W -2100) (11)
τl = (τh *(W -2100 +WSE -α 2400) +2100 +2200 +2300 +α2400 +3000)/(WSSS +WSE +2300) (12)
τk = [τh *(OSPUE +PEI -WSE -2300 -β 2400)+ 1200 +β2400 +4100 +4400]/(OS -WSE -2300) (13)
20. This adjustment still underestimates self-employed labour income. Part-time employment is lesswidespread among the self-employed and many of the self-employed are professionals with high earnings.As higher labour earnings reduces the AETR on labour (the numerator in (12) rises proportionately lessthan the denominator), this means that it is still overstated, although less so than with the Mendoza et alapproach. Concomitantly, the AETR on capital is still understated, although less so than with thealternative approach.
Making the consumption tax base comprehensive and comparable to the other tax bases
21. Mendoza et al. exclude government wage consumption expenditures (CGW) from theconsumption tax base on the grounds that they are not subject to indirect tax. However, many of theservices provided by the government sector, such as education and medical care, are not subject to indirecttax either when they are privately provided. Consequently, failure to include government wages in the taxbase would result in the AETR on consumption being overstated in countries where these(labour-intensive) services are publicly provided relative to the AETR in countries where they are publiclyprovided. In order to enhance cross-country comparability, the AETR on consumption is calculated in (14)using total final consumption expenditures as the base. The other change in (14) is to express the tax basein gross terms (i.e., including indirect taxes). This enhances comparability with the other AETRs. This isparticularly important for labour as the relevant tax burden affecting labour supply decisions includes bothlabour and consumption taxes.
τc = (5110 + 5121)/(CP + CG ) (14)
22. A factor to bear in mind when interpreting estimates of the AETR on consumption based on (4)or (14) is that these expressions include indirect taxes on investment goods in the numerator. In the case ofVAT, this occurs for VAT-exempt industries that supply inputs to produce investment goods. Neither thepurchasers of these inputs nor the tax-exempt suppliers themselves are able to claim back the VAT paid onthe VAT-exempt industries’ inputs. This problem mainly concerns the finance industry, which is generallyVAT-exempt owing to the difficulty of measuring value added; by contrast, the problem does not affectgovernment or the not-for-profit sector, as their outputs are classified as final consumption in the NationalAccounts. For general indirect taxes other than VAT (such as sales tax and turnover tax), which are onlylevied in a few countries,20 the problem is more direct, in that such taxes may apply to investmentexpenditures more generally. Unfortunately, it is not possible to adjust (14) adequately for this problem ineither case. Data are not generally available on VAT paid by tax-exempt sectors that supply inputs toproduce investment goods or on the proportion of their outputs that are inputs to produce investmentgoods. With respect to other general indirect taxes, data are not readily available on the proportion of suchtaxes that relate to consumption goods. Allocating such taxes to consumption and investment in proportionto the share of each in GDP is unlikely to be a satisfactory solution because rates are generally lower on
overstated, although the degree of the distortion is unlikely to be great because such companies pay only asmall share of total corporate taxes.
20. These countries are the United States, Canada, Australia (until 2000), Hungary, Iceland, Switzerland (until1995) and Turkey.
ECO/WKP(2000)31
15
investment goods.21 Thus, (14) overstates the AETR on consumption by including indirect taxes oninvestment in the numerator. However, the degree of overstatement is unlikely to be great, especially ascountries tend to have either a VAT or other general indirect taxes, but not both.22
Reallocating tax data
23. There are two aspects of classifications of data in Revenue Statistics that significantly undermineinternational comparability. One is that the household tax (1100) series includes business taxes in a numberof countries (Table A5). These taxes are akin to corporate taxes and similarly should be allocated directlyto capital.23 The other is that the taxe d’habitation in France and Council Tax in the United Kingdom,which are broadly similar taxes,24 are classified differently: taxe d’habitation is included in 1100 whileCouncil Tax appears in 4110. As the base for these taxes is property, the preferred classification is propertytax, as in the data for the United Kingdom. In the remainder of this paper, business taxes (Table A5) arededucted from 1100 and added to 1200 (in Japan, Germany, Italy, Austria and the Czech Republic) andtaxe d’habitation is re-classified as a property tax.
24. A problem of comparability also arises in respect of unallocated social security contributions(2400) in Switzerland. This category includes all medical insurance premiums in Switzerland, whereas inother countries either all medical insurance premiums or voluntary premiums are not included in socialsecurity contributions. Owing to a lack of historical data, the Swiss data for 2400 have not been adjusted.However, a breakdown between the compulsory and voluntary components of medical insurance isavailable since 1996, when basic cover became compulsory. These suggest that the overstatement of socialsecurity contributions in Switzerland is modest; voluntary health insurance premiums amounted to 8 percent of social security contributions (2000) in 1996. (Another point to bear in mind in respect ofunallocated social security contributions (2400) is that the data appearing for Austria are not unallocated atall, but merely an alternative classification of total social security contributions.)
25. Mendoza et al. ignored taxes on income, profits and capital gains that had not been allocated tohouseholds or companies. These taxes (1300) are added to household tax (1100) and/or company tax in theremainder of this paper on the basis of what seems most appropriate. The countries concerned and thetreatment adopted in each case are as follows:
21. Nevertheless, this approach does enable an assessment to be made of the importance of adjusting for
general indirect taxes on investment goods. At the same time, it needs to be borne in mind that the resultingestimates underestimate the AETR on consumption because such taxes are normally higher onconsumption goods than on investment goods. For the countries that had such taxes in 1991-97, the revisedAETR on consumption for 1980-85, 1986-90 and 1991-97 respectively are as follows: United States 4.8,4.3, 4.6; Canada 10.6, 11.2, 11.2; Australia 9.8, 8.8, 7.2; Iceland 13, 15.7, 21.4; Ireland 24.1, 24.8, 24.1;Switzerland 6.2, 6.6, 7.2; and Turkey 3.2, 6, 8.2. Most of these revised rates are less than one percentagepoint lower than the unadjusted estimates. In countries that have reduced or abolished such taxes andintroduced VAT (Canada and Switzerland), the adjusted AETR on consumption have increased by morethan the unadjusted estimates since 1980-85.
22. The exceptions are Canada, Hungary, Iceland and Turkey.
23. As data on unincorporated business income including imputed rentals on owner-occupied housing are notavailable in all of these countries, such income was not deducted from household income for the purposesof allocating the remaining household taxes to labour and capital. This tends to overstate the AETR orcapital (too much of household taxation is allocated to capital) and understate the AETR on labour.
24. Both taxes have a property base and are paid by occupants, regardless of whether they are tenants orowner-occupiers.
ECO/WKP(2000)31
16
− Canada, non-resident withholding tax is added to 1200;
− Austria, tax on interest is added to 1100;25
− Denmark, almost all of this category represents a tax on pension fund earnings and, as a taxon capital income, is added to 1200;
− Greece, this category (impôts extraordinaires) is allocated to households (1100) andcompanies (1200) according to the relative weights of each in taxes on income, profits andcapital gains (1000);
− Hungary, withholding taxes on dividends and interest are added to 1100;
− New Zealand, this category, which mainly consists of taxes on the earnings of pension fundsand life insurance, is added to 1200; and
− Portugal, professional tax (impôt professionnel), supplementary personal tax (impôtcomplémentaire personnes singulières et collectives), and capital gains tax (impôt surplus-values) are allocated to 1100, and industrial tax (impôt industriel), land tax (impôtfoncier rural et urbain), agriculture tax (impôt industrie agricole), local direct taxes (impôtsdirects perçus par les administrations locales) and interest on late payments (intérêts payésen retard) are added to 1200.
26. There are also a number of property taxes that Mendoza et al. did not take into account, notablywealth taxes and estate, inheritance and gift taxes. Such treatment seems inappropriate as these taxes canbe considered as surcharges on capital income. In the remainder of this paper, all taxes on property (4000)are taken into account26. Accordingly, the revised AETR on capital is given by (15).
τk = [τh *(OSPUE +PEI -WSE -2300 -β 2400)+ 1200 +4000]/(OS -WSE -2300) (15)
27. Mendoza et al. also abstracted from a number of indirect taxes that should be taken into accountin the AETR on consumption. These taxes include excise taxes (5121), which are mainly levied on tobaccoand motor vehicle fuels,27 profits of fiscal monopolies (5122), customs and import duties28 (5123), taxes onspecific services (5126), other taxes on specific goods and services (5128)29 and taxes on the use of goods
25. Insofar as this tax is paid by households, such a treatment would be consistent with that in countries such
as Germany that have resident withholding taxes.
26. It is implicitly assumed that all such taxes relate to the income flows appearing in the denominator of (15).While this is true for most property taxes (4000), it is not true for taxes on wealth in the form of art,racehorses or foreign property. Accordingly, the revised estimates tend to overstate the AETR on capital.
27. Ideally, only that part of excises or motor vehicle fuels that relates to final consumption should be takeninto account. Unfortunately, such disaggregation is not possible. Consequently, the revised estimates willtend to overstate the AETR on consumption as they include excises on motor vehicle fuels used inproduction.
28. Mendoza et al. excluded customs and import duties on the grounds that they were not significant inG7 countries but noted that these duties should be taken into account in extending the study to othercountries.
29. In other words, we include all taxes on specific goods and services except taxes on exports (5124), taxes oninvestment goods (5125) and other taxes on international trade and transactions (5127).

ECO/WKP(2000)31
17
and performance activities (5200). Equation (16) for the AETR on consumption includes theseamendments.
τc = (5110 +5121 +5122 +5123 +5126 +5128 +5200)/(CP + CG)(16)
28. Many countries have taxes (6000) that cannot be allocated to any of the categories in RevenueStatistics. In most cases, these taxes are small in relation to GDP.30 As in Mendoza et al., we abstract fromthese taxes throughout this paper.
Revised AETR estimates
29. With the Mendoza et al. methodology revised as described, AETRs on capital and onconsumption are somewhat higher and AETRs on labour are lower. The average AETR on capital inOECD countries was 26.6 per cent in 1991-97 (Table 4); as noted above, this rate is understated insofar asself-employed labour income is underestimated, albeit less so than in the Mendoza et al. estimatesthemselves. The group of countries that has high rates relative to the average is now limited to the UnitedKingdom31 and Canada: New Zealand and Sweden have dropped out of this group. Germany, Austria andPortugal continue to have low rates but not Greece. Finland and Ireland now join the group of countrieswith low rates. A considerably larger group of countries is now classified as having AETRs on laboursignificantly different from the OECD average (33.4 per cent). Denmark, Finland, and Poland now joinSweden in the group with high rates. And the United States, Japan, Greece, New Zealand and Portugal nowjoin the United Kingdom, Australia, and Korea in the group with low rates. By contrast, there are nowfewer countries with AETRs on consumption that differ significantly from the OECD average (17.1 percent). Only the United States, Japan and Switzerland continue to be classified as having low rates;Australia and Mexico have dropped out of this group. The Czech Republic joins Denmark, Finland,Iceland, Ireland, and Norway in the group with high rates but Austria and Sweden leave the group. Thereare few changes in the classification of countries with AETRs on labour and consumption that differsignificantly from the OECD average (42.7 per cent): the United States, Japan and Korea continue to havelow rates, but not Australia; Denmark, Finland and Sweden are joined by Hungary in the group with highrates.
30. These results are not greatly affected by cyclical factors. In about half of the countries for whichfull data sets are available, none of the AETRs is significantly affected by the output gap (Table 5). Thecountries in which cyclical factors appear to be most important are the United States (the output gap issignificant for all AETRs except on consumption), Australia (the output gap is significant for all AETRsexcept on labour) and Belgium (the output gap is significant for the AETRs on labour and on labour andconsumption combined). The AETRs that most depend on cyclical factors are on capital and on labour andconsumption, with the output gap being significant in five countries in each case.
30. Countries where such taxes amount to 0.5 per cent of GDP or more are (percentages in brackets):
Turkey (3.7); France (1.7); Hungary (0.8); Korea (0.7); Austria (0.5); Italy (0.5); and the UnitedKingdom (0.5).
31. As previously noted, a factor contributing to this outcome is the inclusion of tax revenues on oil and gasproduction. This factor also boosts the AETR on capital in Norway (see Box 3). On the other hand, thebrief replacement of household property tax in the early 1990s by the Community Charge (poll tax) tendsto reduce the average AETR on capital in the United Kingdom over this period.

ECO/WKP(2000)31
18
31. Average trends in the revised AETR estimates for OECD countries are the same as those foundusing the updated Mendoza et al. equations except for consumption, where the average annual increase(0.1 per cent) is slightly lower (Table 6). (AETR estimates are plotted in Figures 1.a-d). Thus, the revisedestimates, consistent with the Mendoza et al. conclusions, suggest that, on average, OECD countries havefocused the increase in the tax burden on labour. There are few changes in the classification of countrieswith average growth rates in AETR significantly different from the OECD average. Greece and Korea nowjoin Portugal in the group of countries with a high average increase in the AETR on capital. No countryhas a large decline in its AETR on capital now that New Zealand has dropped out of this category. Withrespect to the AETR on labour and consumption combined, Finland joins Italy in the group with a largeincrease while Portugal drops out of this group. The United Kingdom is no longer in the group with a largereduction in the AETR on labour and consumption combined, leaving New Zealand alone in this category.
32. The trend shift in the OECD average relative tax burden (as indicated by the average annualpercentage changes in AETRs) from capital to labour reflects a decline in labour’s share of nationalincome that has not been matched by a decline in labour’s share of the total taxation (Table 7). Indeed,both labour and capital taxes have increased as a share of GDP over the last two decades.
33. A point to bear in mind with both the Mendoza et al. estimates and the revised estimates is thatAETRs may not be representative in the context of substantial revenues from resource taxes. For example,the AETR for capital in Norway is estimated to have significantly declined since the early 1980s32.However, this reflects the fall in taxes on oil and gas. The AETR for capital in mainland Norway(i.e., excluding North Sea oil) was actually broadly unchanged in the most recent period from the level inthe early 1980s (see Box 3).
32. As noted above, tax revenues on oil and gas production also affect the estimates for the United Kingdom,
although to a lesser extent.

ECO/WKP(2000)31
19
Box 3. Case study: effective tax rates in Norway
The average effective tax rates (AETR) in this study are aggregate indicators that may not always be suitedto an individual country’s characteristics. This is particularly true in the case of Norway where the offshore sector (oilindustry) accounts for a significant share of overall profits in the economy1 and is also subject to significant sectorspecific taxes.
Two estimates of the AETR on consumption are provided (Figure 1). The first estimate (which includes theoffshore sector) uses the methodology adopted in this paper -- all indirect (offshore and on-shore) taxes have beenattributed to consumption with a weight of unity. The second estimate removes the “oil and gas products” and “CO2”taxes from total indirect taxes. The AETR on mainland consumption follows a broadly similar path to the AETR onconsumption including the offshore sector, but is about 4 percentage points lower over 1980-97. However thisaverage difference hides trends within the period. Before the 1986 oil-price crisis, the difference between theestimates rose from 2 percentage points in 1980 to a maximum of 5 percentage points in 1985. Firmer oil prices ormore favourable exchange rate conditions underpinned increases in this gap. After 1986, this difference narrowed to2 percentage points.
Figure 1. Effective tax rates on consumption (Tc) Figure 2. Effective tax rates on capital (Tk)(based on gross operating surplus)
Note: The reference price of crude is a continuous series based on Forties(1980-84) and Brent(1985-87)
0%
10%
20%
30%
40%
50%
1980 81 82 83 84 85 86 87 88 89 1990 91 92 93 94 95 96 97
0
10
20
30
40
50
Forties/Brent - $/barrel (right scale)Tc - including offshore sectorTc - mainland
0%
10%
20%
30%
40%
50%
1980 81 82 83 84 85 86 87 88 89 1990 91 92 93 94 95 96 97
0
10
20
30
40
50
Forties/Brent - $/barrel (right scale)Tk - including offshore sectorTk - mainland
In order to calculate the AETR on capital (based on gross operating surplus) for the mainland, it isnecessary to estimate the operating surplus of the offshore sector. This was calculated as a residual of offshore GDPless compensation of employees in the offshore sector, less indirect taxes related to the oil industry, less operatingsurplus of the State Direct Financial Interest (SDFI). The operating surplus of state companies such as Statoil, NorskHydro, or Saga Petroleum, is included in the offshore estimate. Once again, two estimates are provided (Figure 2).The mainland estimate removes direct taxes on oil-related activities from realised tax revenue flows (this includesordinary taxes on income and wealth from the extraction of oil as well as a the special income tax) and the estimatedoffshore gross operating surplus from the capital base.
The new estimate underscores the importance of direct taxes raised on oil-related activities as a share ofcapital taxes. These taxes peaked in 1985 and subsequently declined sharply, reflecting the combined effects of a fallin oil prices, a weaker dollar, and tax reforms favouring a more generous treatment of the offshore sector. Direct taxesbottomed out in 1988 before they began to trend upwards again. Whereas the AETR on capital for the wholeeconomy has declined since the early 1980s, the AETR for the mainland economy has risen. While there weresignificant differences in the AETR on capital for whole economy and the mainland economy in the 1980s, this hasnot been so in recent years. The peaks of 1986 and 1987 on the other hand illustrate the sensitivity of the estimateswith respect to the level of profits (the capital tax base) in the economy.
________________________
1. The estimated operating surplus in the offshore sector (which excludes “State Direct Financial Interest” - SDFI) has been closeto 30 per cent of gross operating surplus in recent years
ECO/WKP(2000)31
20
IV. Effects of relaxing some assumptions about capital income
34. The implicit assumption underlying the preceding analysis that all household income is taxed atthe same rate is not realistic. Some forms of household capital income receive favourable tax treatment. Inparticular, pension fund and life insurance earnings, which are imputed to households in the NationalAccounts (such earnings are included in PEI), are not taxed in most countries or are taxed at low rates. Inaddition, imputed rentals on owner-occupied housing (included in OSPUE) are not taxed at all in mostcountries or are taxed at very favourable rates in some other countries. Another problem is that householddividend receipts (included in PEI) are mainly taxed at the corporate level rather than the household levelin many countries. In other words, there is relief from double taxation in many countries, reducing oreliminating household taxation of dividends. Yet another problem is that interest on government bonds isincluded in household capital income (through PEI), yet for the most part such interest is not a distributionof (government) operating surplus (i.e., capital income). Accordingly, most such interest should not betaken into account for allocating household taxes to capital and labour.33 Another problem still is thathouseholds often evade tax on some capital income, notably interest receipts. In the remainder of thissection, an assessment is made of the impact on the AETR estimates of preferential tax treatment for theearnings of pension funds and life insurance and of relief from double taxation of dividends. Unfortunately,it is not possible to gauge the effects of preferential tax treatment for imputed rentals on owner-occupiedhousing or of the inappropriate treatment of interest on government bonds owing to a lack of data.However, an upper limit of allowing for these factors together with preferential tax treatment for pensionfund- and life insurance earnings, relief from double taxation of dividends and some tax evasion is toassume that households do not pay tax on capital income. The results of making this assumption arediscussed in the last part of this section.
Preferential tax treatment for pension fund and life insurance earnings
35. As noted above, households’ savings with pension funds and life insurance companies receivepreferential tax treatment in most countries, contrary to the implicit assumption in the preceding analysisthat all household income is taxed at the same rate. In most countries, contributions to pension funds aretax deductible, fund earnings accumulate tax-free but distributions are taxed (Table 8); this treatment isgenerally referred to as exempt-exempt-taxed (EET). Such treatment is represented in equation (17), whereall variables are understood to be expected values:
33. Apart from over-allocating household taxes to capital, interest on government bonds does not pose much of
a problem for AETR estimates. Such interest is not included in the denominator of the AETR on capitalequation; rather, this includes government operating surplus. While some tax on interest on governmentbonds may be included in 1200 (in the numerator of the AETR on capital equation), this is unlikely to be aserious distortion for two reasons. First, most government bonds not held directly by households are heldon their behalf by pension funds and life insurance companies and these entities do not pay tax on earningsin most countries. Second, most of the remaining government bonds are likely to be held by banks. As theyare highly geared, these bond holdings are largely debt financed. This means that the tax liability on thisinterest falls not on banks but on lenders to banks. Ultimately, this interest income mainly accrues tohouseholds.
ECO/WKP(2000)31
21
FV =[C/(1-t)] *(1+r) n * (1-t) (17)
= C *(1+r) n
where
FV = final value;
C = after-tax contribution;
t = tax rate;
r = rate of return;
n = the number of periods during which the investment is held.
Provided that the tax rate against which contributions are deducted is the same as that on distributions andthat earnings accumulate tax-free, it does not make any difference to the expected final value of the fundwhether contributions are tax-deductible and distributions are taxed (EET) or contributions are notdeductible and distributions are not taxed (TEE).34 In these circumstances, the only tax concession is thatfund earnings accumulate tax-free. Even so, this represents a substantial tax advantage compared with thestandard income tax treatment, as shown in equation (18), which would apply to savings placed in a bankaccount or used to purchase a bond. For example, assuming a 5 per cent rate of return (before tax) and a35 per cent tax rate, the return over 40 years from placing funds in a pension fund is 604 per cent comparedwith 259 per cent for a bank account or bond holding. If the tax rate in retirement is lower than that againstwhich contributions are deducted, as is generally the case owing to declining income after age 50-55, taxdeferral on these contributions provides an additional benefit under EET.
FV =C *[1+r *(1-t)] n (18)
36. Savings with life insurance companies in most countries benefit from the same principal taxconcession as pension fund saving, namely that earnings are not taxed as they accumulate. In general,contributions are made out of tax-paid earnings (i.e., contributions are not deductible) and distributions aretax-free (usually after a minimum holding period) or contributions are tax-deductible and distributions aretaxed. Thus, the typical tax-treatment is either TEE or EET (as for pension funds). As noted above, theseare equivalent provided that the tax rate applying at the time that contributions are made is the same as thatapplying when distributions occur.
37. Preferential tax treatment of the earnings of pension funds and life insurance investments resultsin the AETR on household income being understated in the above estimates because these earnings areimputed to households in the National Accounts.35 This tax preference is then allocated to both labour andcapital, whereas it should be entirely allocated to capital. Thus, the AETR on labour is underestimated andthe AETR on capital is overestimated. To avoid these distortions, such earnings should be deducted fromthe household income tax base in the denominator of the AETR on household income (equation 5) and inthe numerator of the AETR on capital (equation 15). Unfortunately, such earnings data are not readilyavailable for most countries. However, data on the financial assets of pension funds and life insurance
34. However, TEE and EET will not be equivalent in ex post terms unless the outcome equals the expected
value. If returns are higher (lower) than expected, taxes will be greater (lower) under EET than TEE.Effectively, taxation reduces rate of return risk under EET but not under TEE.
35. As noted above, such earnings are included in property and entrepreneurial income (PEI).
ECO/WKP(2000)31
22
companies are generally available (Tables 9 and 10). By assuming a rate of return on such assets, weobtain an estimate of such earnings to be deducted from household income in equations (5) and (15). Theassumed rate of return for this exercise is 5 per cent. (This happens to be the rate of return, excludingcapital gains (which are not recorded as income in the National Accounts), on Swiss pension fund assetsover 1990-96). This adjustment is also necessary for countries that tax such earnings because these taxesare not included with household taxes in (5), but rather are included directly in the numerator of the AETRon capital (15). The countries (for which data are available) that tax such earnings are Australia andSweden, which apply a low rate (15 per cent), and Denmark and New Zealand, where the tax rates arerespectively 35.8 per cent and 33 per cent. As data on the taxes paid on the earnings of pension funds andlife insurance are available for Denmark and New Zealand, it was possible to obtain a more accurateestimate of such earnings for these countries. These more accurate estimates were used for these countriesrather than those based on a 5 per cent rate of return.36
38. With these adjustments, the average AETR on capital (based on gross operating surplus) over1991-96 for OECD countries was about 2 percentage points lower than the unadjusted estimate, and theAETR on labour was about 1 percentage point higher than the unadjusted estimate (Table 11). At the sametime, there is considerable variation in the effects of the adjustment on the estimates for individualcountries. Adjustments to the AETR on capital range from around 1 percentage point in Europeancountries with large pay-as-you-go pension systems to almost 5 percentage points in the Netherlands,where most of the retirement income system is funded.37 While these estimates undoubtedly underestimatethe effects of savings preferences, notably by abstracting from the benefit of lower marginal tax rates inretirement (owing to a lack of data), the differences from the unadjusted estimates are not so great for mostcountries as to make the unadjusted estimates misleading.
Relief from double taxation of dividends
39. Most countries provide some form of relief from double taxation of dividends. This conflicts withthe implicit assumption in both the updated and revised Mendoza et al. equations that households pay thesame tax rate on dividends as on any other income. Relief is provided through dividend imputation systems(Table 12) and/or low-flat rate systems (Table 13); Italy, Finland and Norway provide relief through bothsystems.38 Failure to adjust for such relief means that AETRs on household income and on labour are 36. As it turns out, the rate of return on Danish pension fund and life insurance assets is not much different
from the assumed rate of 5 per cent, the rate of return achieved by Swiss pension funds over 1991-96. Therate of return on New Zealand pension fund and life insurance assets cannot be calculated owing to a lackof data on their assets.
37. The magnitude of these adjustments is much smaller than estimated by Ruggeri et al. (1997) for Canada.This is because they counted as tax preferences to be assigned to capital not only the exemption of pensionfund and life insurance earnings from taxation, but also tax expenditures on deductions for contributions topension funds net of taxes paid on pension benefits. However, as noted above, to the extent the tax rateapplicable when contributions are made is the same as that when benefits are received, there is no taxpreference from the deferral of tax on labour income over and above that resulting from the tax-exempttreatment of fund earnings. Most of the difference between tax expenditures on deductible contributionsand taxes on pension benefits reflects growth in labour incomes rather than a tax preference to capital.
38. In Finland and Norway, the combination of dividend imputation credits and a flat tax rate on dividends thatis the same as the company tax rate means that, typically, no personal income tax is due on dividendreceipts. This was also true in New Zealand, where the top personal tax rate (33 per cent) was the same asthe company tax rate. Since 1998, personal taxpayers in Italy have been able to choose between a dividendimputation credit, as formerly, or paying a low flat tax rate (12.5 per cent). The dividend imputation creditis more valuable up to a marginal income tax rate of 44 per cent, beyond which point it would be moreattractive to opt for the flat tax rate. Dividends are exempt from personal income tax in Greece.
ECO/WKP(2000)31
23
understated and AETRs on capital are overstated. In principle, such relief could be adjusted for byremoving dividend receipts from household income in the denominator of the AETR on household incomeand from the numerator of the AETR on capital and transferring taxes paid by households on dividendsdirectly to the numerator of the AETR on capital. Unfortunately, this cannot be done for most countriesowing to a lack of data on taxes paid by households on dividend receipts; by contrast, data on householddividend receipts (including those imputed from pension funds and life insurance) are available in mostcountries’ National Accounts. However, this problem does not arise in Finland, Norway and New Zealandbecause households pay no extra taxes on dividend receipts; the flat-rate tax (28 per cent) on dividends inFinland and Norway and the top marginal tax rate in New Zealand are the same as the imputation creditrates. Removing household dividend receipts in Finland and New Zealand from the denominator of (5) andthe numerator of (15) reduces the AETR on capital in 1991-96 by 1.6 and 1.1 percentage pointsrespectively and raises the AETR on labour by 0.3 percentage point in both countries.39
Assuming that households do not pay tax on capital income
40. As noted above, it is not possible to adjust the estimates directly for the fact that households paylittle or no tax on imputed rentals on owner-occupied dwellings in most countries. Yet this is clearly animportant violation of the implicit assumption underlying AETR estimates that all household income istaxed at the same rate. Similarly, data are not available to remove interest receipts on government bondsfrom household income. An upper limit for these two adjustments, together with those concerning thepreferential tax treatment of pension fund and life insurance earnings, relief from double taxation ofdividends and tax evasion is to assume that households pay no tax at all on capital income. This clearlyoverstates the position but does provide an upper limit for the potential distortions to the estimates causedby violation of the implicit assumption that capital income is taxed at the same rate as other householdincome. On this basis, the AETR on capital based on gross operating surplus is about 11 percentage pointslower on average in the OECD area than in the revised estimates and the AETR on labour is about onepercentage point higher.40
V. Limitations of the methodology
41. As noted above, AETRs have been developed to analyse the influence of taxes on keymacroeconomic variables such as saving, investment and employment. The rates that have been calculatedare backward looking average rates whereas marginal expected rates, for which aggregate data areunavailable, would be preferable for this kind of analysis. Accordingly, an assessment needs to be madeabout how well backward-looking AETR proxy expected marginal rates. Clearly, backward-looking AETRwill not be a very good proxy for expected marginal rates when tax policy has recently changed or isexpected to do so. The tax treatment of losses may also cause AETR in particular years to be a poor proxyof marginal expected rates. In most tax systems, businesses are able to carry forward non-capital (business)losses to offset tax payable in future years. AETRs on capital will tend to be overstated when losses areincurred but understated when they are subsequently used to reduce tax liabilities. This problem can beattenuated by averaging over the business cycle or by focusing on trends, as has been done in this paper.Differences between expected and past inflation rates also need to be taken into account when assessing
39. This calculation cannot be done for Norway because National Accounts data on dividend receipts are not
available.
40. The OECD averages for AETRs on capital (based on gross operating surplus) assuming that households donot pay tax on capital are for 1980-85, 1986-90, 1991-97 respectively (in per cent): 16.6, 17.4, and 17.6.The corresponding AETRs on labour are: 31.0, 32.9, 34.4.
ECO/WKP(2000)31
24
how well backward-looking AETR proxy expected rates, as inflation tends to increase the AETR oncapital41.
42. Another point to bear in mind is that in the presence of cross-border capital flows the appropriatecoverage of domestic and international sectors in the AETR on capital differs depending on whether savingor investment behaviour is to be analysed. For the analysis of (national) saving behaviour, the numeratorshould include all taxes paid by residents while the denominator should include residents’ world-wideincome. The standard definition differs from this “customised” definition in that foreign taxes paid byresidents are not included in the numerator and residents’ foreign-source income is not included in thedenominator. (The fact that the numerator and denominator include, respectively, host country taxes paidby foreigners and host country income accruing to foreigners can be abstracted from as it is assumed thatall domestic-source capital income is taxed at the same rate). Compared with the “customised” measure,the standard measure understates (overstates) the tax burden on capital insofar as foreign taxes paid byresidents represent a greater (smaller) proportion of the numerator than does foreign-source capital incomeof the denominator. In the case of tax evasion on foreign-source income, the direction of this bias isunambiguous - the tax burden on capital is overstated because the “standard” measure includes all the taxespaid by residents on their capital income but not all of their income. For the analysis of (domestic)investment behaviour, the numerator of the AETR on capital should include all taxes paid on domesticallygenerated capital income while the denominator should comprise domestic capital income. The standarddefinition differs from this “customised” definition in that the numerator includes domestic taxes paid byresidents on foreign source income but does not include foreign taxes paid by foreign investors on theircapital income from the host country. The standard measure overstates (understates) the tax burden oncapital insofar domestic taxes paid by residents on their foreign-source income exceed (are less than)foreign taxes paid by foreign investors on their capital income from the host country.
43. Even the “customised” AETR on capital may not be a very good guide to the influence oftaxation on investment in the presence of tax planning. This is because tax planning in a context of cross-border economic activities enables companies to separate investment location from earnings location. Agiven AETR on capital could attract investment but repel earnings if depreciation allowances are generousbut nominal tax rates are high, or have the opposite effects if depreciation allowances and nominal tax ratesare low. Information about the structure of taxation is also needed in order to assess the influence oftaxation on investment behaviour.
44. Another limitation of AETR analysis is that household tax data do not distinguish between capitaland labour income. In order to allocate household tax to capital and labour, it is assumed that all householdincome is taxed at the same rate. However, as noted above, there are a number of instances where personalcapital income is taxed at lower rates than labour income. In addition to the cases discussed above,countries frequently have a low flat rate of tax on interest receipts (see Table 13) In view of theseconsiderations, the AETR on capital presented in this paper tend to be overstated and the AETR on labourunderstated. The calculation in the previous section assuming that households pay no tax at all on capitalincome indicates the upper limit of this distortion. On this basis, AETRs on capital could be a great deallower than in the standard calculations and the AETR on labour considerably higher. Trends in AETRs arealso distorted by preferential treatment for household capital income insofar as the extent of such treatmenthas changed. Many countries introduced lower personal tax rates on capital income over the periodcovered by this study. At the same time, investments in pension funds, life insurance and owner-occupied
41. The interaction of inflation and nominal tax systems based on historic costs raises AETR on capital
because the real value of depreciation allowances is reduced and the real value of inventory gains isoverestimated. While corporations benefit from being able to deduct the inflation premium component ofinterest payments, this benefit is largely at the expense of households, which pay tax on this premium.
ECO/WKP(2000)31
25
housing have grown substantially. Accordingly, there is likely to have been a greater shift in the relativetax burden from capital to labour than indicated in the standard estimates.
45. The other assumption made in this paper to allocate self-employed income to labour and capitalis that the self-employed “pay” themselves the same wage as dependent employees. As noted above, thisapproach underestimates labour income because part-time employment is less widespread among the self-employed and many of the self-employed are professionals with high earnings. Consequently, the AETRon labour tends to be overstated and the AETR on capital understated. If self-employment has grown morerapidly (slowly) than dependent employment, the extent of this distortion will have grown (diminished)over time, overstating (understating) the trend shift in the relative tax burden from capital to labour.
46. It should also be borne in mind that the analysis presented in this paper generally abstracts fromtax shifting -- only primary tax burdens are analysed. There is, however, an exception for the AETR onconsumption, where tax shifting is implicitly assumed for tax-exempt goods and services; they are includedin the denominator on the grounds that suppliers pass on the VAT on their inputs into higher output prices.
47. Finally, trends in AETRs on capital only capture part of the effects of international taxcompetition. When companies shift their tax base abroad through thin capitalisation, this is reflected in adecline in the AETR on capital because company tax receipts fall but there is no change in domesticoperating surplus (which includes interest). By contrast, when companies use transfer pricing or a physicaltransfer of operations to shift their tax base abroad, this is not generally captured in the AETR on capitalbecause both the numerator and the denominator decline. Hence, the effects of international taxcompetition on AETRs on capital are likely to be understated in this paper.
VI. Conclusion
48. Average effective tax rates (AETRs), also known as “implicit tax rates” and “tax ratios”, havebeen widely used in empirical economic analyses to approximate the taxes that distort key economicdecisions, notably in the areas of employment, saving and investment. This paper proposes somemodifications to the well-known methodology developed by Mendoza et al. for calculating AETRs. Whilethese modifications do not deal with many of the criticisms that have been addressed to this methodology,they do make the underlying assumptions more realistic. The main change is that the assumption that allself-employed income is capital income is dropped in favour of assuming that the self-employed earn bothcapital and labour income. This is done by assuming that they “pay themselves” a wage equal to theaverage wage for employees. While this adjustment goes in the right direction, it does not go far enough, asmicro-data suggest that self-employed labour earnings are higher on average than for employees. Inaddition, the treatment of social security contributions and employers’ contribution to pension funds iscorrected in the revised equations and a wider range of indirect taxes is included in the AETR onconsumption. With these changes, AETRs on capital (based on gross operating surplus) and onconsumption are somewhat higher and AETRs on labour are lower than in the estimates based on theupdated Mendoza et al. equations. Nevertheless, AETRs on capital (based on gross operating surplus)remain lower than AETRs on labour in the revised estimates. Estimates based on both the updated andrevised Mendoza et al. equations indicate that there has been a shift in the relative tax burden from capitalto labour in OECD countries over the period 1980-97. This reflects a decline in labour’s share of nationalincome that has not been matched by a decline in labour’s share of total taxation. In common with capitaltaxes, labour taxes have increased as a share of GDP over the period. In most cases the revised estimatesare not greatly affected by cyclical factors.
49. Sensitivity analyses were also carried out to examine the effects of relaxing the assumption thatcapital income is taxed at the same rate as all other household income. The revised estimates are not

ECO/WKP(2000)31
26
greatly affected in most cases by respectively allowing for preferential tax treatment of pension fund andlife insurance earnings and for relief from double taxation of dividends. However, assuming thathouseholds pay no tax at all on their capital income has a significant effect on the estimates.
50. Considerable caution is required in interpreting AETRs, for both individual countries and inassessing general trends for OECD countries as a whole. The fundamental problems in splitting income taxbetween capital and labour are hard to solve. And both sets of estimates presented in this paper rest on theassumption that all capital income is taxed at the same rate. A brief inspection of most OECD countries’tax systems shows that this assumption is unrealistic, particularly for countries with preferential treatmentfor pension funds and largely funded retirement income systems. Cross-border flows and tax planning alsoare not taken into account, reducing the usefulness of the estimates for analysing the effects of tax onsaving and investment behaviour. In addition, they are not very useful for assessing the effects ofinternational tax competition because this can reduce both the numerator and the denominator of the AETRon capital. For such reasons, AETR estimates need to be corroborated by a significant volume of otherinformation before conclusions can reasonably be drawn. This applies both to conclusions about acountry’s tax system and to the relative shift in the tax burden towards labour suggested by the estimates inthis paper.
ECO/WKP(2000)31
27
Tables and Figures
List of Tables
1. Average effective tax rates - using Mendoza et al. methodology2. Annual changes in average effective tax rates - using Mendoza et al. methodology3. Total tax revenue4. Average effective tax rates - revised methodology5. Influence of the business cycle on AETRs6. Annual changes in average effective tax rates - revised methodology7. Decomposition of average annualchanges in AETRs - revised methodology8. Tax treatment of private pensions9. Financial assets of pension funds10. Financial assets of insurance companies11. Estimated effects of preferential tax treatment for pension and insurance fund earnings - revised
methodology12. Dividend imputation credit rates, 199713. Overview of tax structures in OECD countries, 1998
List of Figures
1.a. Average effective tax rates on consumption (1980-1997) - Revised methodology1.b. Average effective tax rates on labour (1980-1997) - Revised methodology1.c. Average effective tax rates on capital (1980-1997) - Revised methodology1.d. Average effective tax rates on capital (1980-1997) - Revised methodology

ECO/WKP(2000)31
28
Table 1. Average effective tax rates - using Mendoza et al. methodologyPer cent
Capital based on net operating surplus Capital based on gross operating surplus1 Labour Consumption Combined Labour and consumption2
1980-85 1986-90 1991-97 1980-85 1986-90 1991-97 1980-85 1986-90 1991-97 1980-85 1986-90 1991-97 1980-85 1986-90 1991-97
United States 39.5 39.1 40.9 24.9 25.8 27.3 25.3 25.9 26.7 5.5 5.0 5.2 29.4 29.6 30.6Japan 38.1 46.2 41.8 24.9 29.6 24.1 24.6 28.0 28.3 4.8 5.3 6.0 28.2 31.8 32.6Germany 29.6 26.5 25.1 17.1 16.2 15.5 38.6 40.6 41.4 15.1 14.7 15.8 47.9 49.3 50.7France 28.7 26.3 26.8 17.1 16.8 17.0 42.6 45.9 47.2 20.5 20.2 19.1 54.3 56.8 57.2Italy 24.3 27.8 33.1 17.9 20.8 24.4 37.7 42.2 47.3 12.0 14.2 15.4 45.2 50.4 55.4United Kingdom 67.8 61.2 48.2 39.4 38.4 31.9 27.5 25.2 23.7 16.5 16.7 16.7 39.5 37.7 36.5Canada 38.3 43.3 51.3 25.2 28.1 30.6 24.3 28.5 31.9 12.6 12.9 12.3 33.9 37.7 40.3
Australia 41.9 43.7 41.4 24.0 26.2 25.7 21.9 24.3 23.2 10.9 10.2 8.3 30.4 32.0 29.6Austria 21.4 21.9 23.4 13.7 14.0 14.7 44.1 44.7 47.3 22.2 22.1 20.9 56.6 56.9 58.3Belgium 37.8 35.0 35.7 27.5 26.1 26.3 45.2 48.3 48.2 16.5 16.2 17.0 54.3 56.6 57.0Czech Republic .. .. 38.03 .. .. 18.33 .. .. 41.64 .. .. 19.24 .. .. 52.9
Denmark .. 54.0 48.35 .. 26.5 25.85 .. 40.56 43.2 .. 35.86 33.3 .. 61.86 62.1Finland 30.3 37.6 39.9 17.4 20.4 20.6 36.4 40.6 47.7 26.1 29.9 27.5 52.9 58.3 62.1Greece .. 15.0 16.17 .. 12.2 13.3 .. 35.2 37.9 11.9 18.1 19.3 .. 46.9 49.9Hungary .. .. .. .. .. .. .. .. 42.9 .. .. 20.2 .. .. 54.4
Iceland .. .. .. .. .. .. .. .. .. 16.5 19.3 21.5 .. .. ..Ireland 26.6 23.1 22.6 18.7 17.5 17.5 23.3 27.2 27.3 24.1 24.8 24.1 41.8 45.2 44.8Korea 11.0 14.4 21.7 8.9 11.2 16.3 3.8 5.5 8.6 10.4 11.5 13.8 13.8 16.4 21.3Luxembourg .. .. .. .. .. .. .. .. .. .. .. .. .. .. ..
Mexico .. .. .. .. .. .. .. .. .. 6.2 7.2 6.2 .. .. ..Netherlands 27.7 27.9 29.2 18.9 19.4 20.3 48.5 49.3 50.5 16.4 18.3 18.3 56.9 58.6 59.6New Zealand .. 42.28 37.2 .. 32.58 31.55 .. 27.98 26.0 11.1 18.6 19.8 .. 41.3 40.6Norway 39.5 38.5 29.57 24.5 19.8 17.37 37.1 38.1 37.8 33.4 32.8 32.6 58.1 58.4 58.0Poland .. .. .. .. .. .. .. .. 40.67 .. .. 16.87 .. .. 50.67
Portugal .. 11.29 16.73 .. 10.09 11.43 .. 26.29 29.5 12.9 18.7 20.9 .. 40.0 44.2Spain 13.5 19.9 21.5 9.8 14.9 16.0 32.4 35.4 37.8 7.3 12.0 13.1 37.3 43.1 46.0Sweden 46.6 62.4 52.7 25.4 32.7 29.2 50.9 54.4 52.3 21.3 24.1 22.8 61.3 65.4 63.2Switzerland 27.8 36.4 35.0 15.5 17.8 16.4 31.8 32.6 35.5 7.6 8.2 8.0 37.0 38.2 40.6Turkey .. .. .. .. .. .. .. .. .. 3.2 6.3 10.4 .. .. ..
OECD average 32.4 34.9 34.7 20.4 22.1 22.0 33.1 35.4 36.8 14.4 16.1 16.5 43.3 45.7 46.9G7 average 38.0 38.6 38.2 23.8 25.1 24.4 31.5 33.8 35.2 12.4 12.7 12.9 39.8 41.9 43.3EU average 32.2 33.6 32.6 20.3 21.6 21.2 38.8 41.2 42.8 17.1 19.2 19.3 49.8 52.6 53.7OECDStandard deviation 13.4 13.8 10.8 7.4 7.5 6.0 11.7 12.0 12.1 7.9 8.0 7.6 13.1 13.2 12.9EUStandard deviation 14.5 14.9 10.6 8.0 7.8 5.9 8.6 9.0 9.4 5.4 5.0 3.9 7.9 8.2 8.3
1. These estimates are made using gross operating surplus in the denominator of TK. However, TH, which is in the numerator of TK, continues to be based on the net operating surplus of the household and private unincorporatedenterprise sector.
2. The combined labour and consumption figures are the sum of the average labour rate plus average consumption rate net of labour tax (as households can only consume out of net income).3. 1993-96 4. 1993-97 5 . 1991-96 6 . 1988-90 7 . 1991-95 8 . 1987-90 9 . 1989-90. Source: Authors’ calculations based on OECD Revenue Statistics and OECD National Accounts.
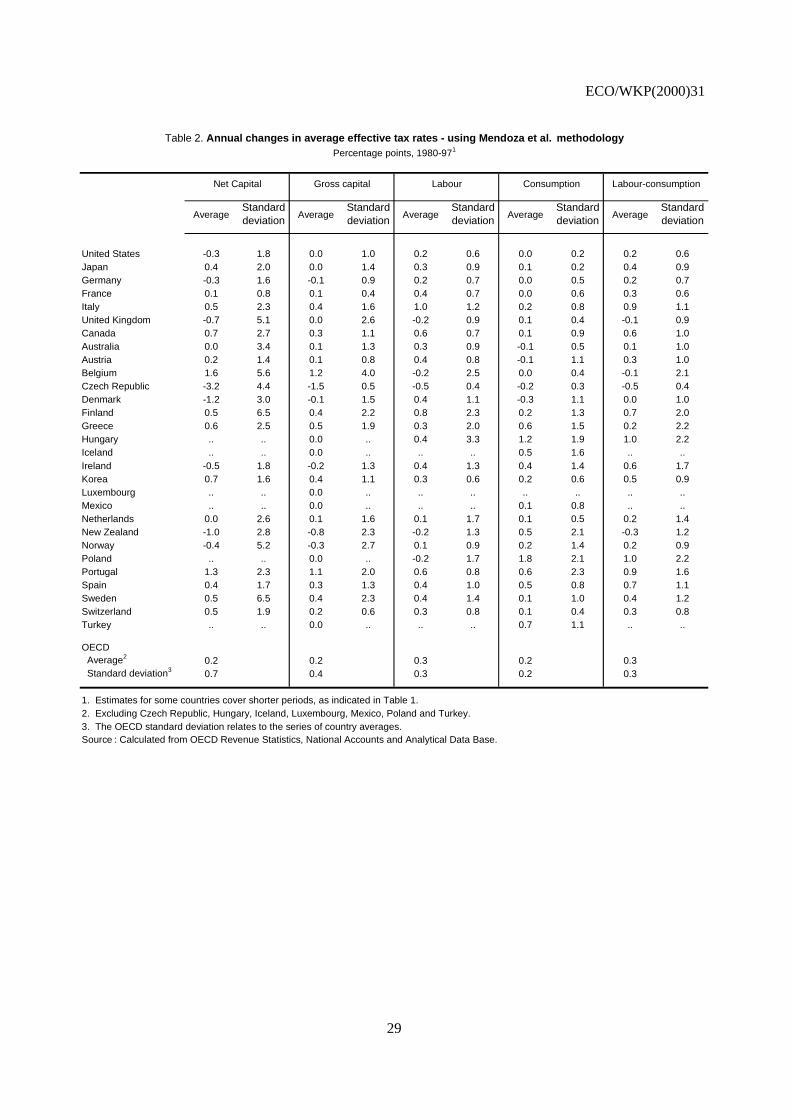
ECO/WKP(2000)31
29
Table 2. Annual changes in average effective tax rates - using Mendoza et al. methodology
Net Capital Gross capital Labour Consumption Labour-consumption
AverageStandard deviation
AverageStandard deviation
AverageStandard deviation
AverageStandard deviation
AverageStandard deviation
United States -0.3 1.8 0.0 1.0 0.2 0.6 0.0 0.2 0.2 0.6Japan 0.4 2.0 0.0 1.4 0.3 0.9 0.1 0.2 0.4 0.9Germany -0.3 1.6 -0.1 0.9 0.2 0.7 0.0 0.5 0.2 0.7France 0.1 0.8 0.1 0.4 0.4 0.7 0.0 0.6 0.3 0.6Italy 0.5 2.3 0.4 1.6 1.0 1.2 0.2 0.8 0.9 1.1United Kingdom -0.7 5.1 0.0 2.6 -0.2 0.9 0.1 0.4 -0.1 0.9Canada 0.7 2.7 0.3 1.1 0.6 0.7 0.1 0.9 0.6 1.0Australia 0.0 3.4 0.1 1.3 0.3 0.9 -0.1 0.5 0.1 1.0Austria 0.2 1.4 0.1 0.8 0.4 0.8 -0.1 1.1 0.3 1.0Belgium 1.6 5.6 1.2 4.0 -0.2 2.5 0.0 0.4 -0.1 2.1Czech Republic -3.2 4.4 -1.5 0.5 -0.5 0.4 -0.2 0.3 -0.5 0.4Denmark -1.2 3.0 -0.1 1.5 0.4 1.1 -0.3 1.1 0.0 1.0Finland 0.5 6.5 0.4 2.2 0.8 2.3 0.2 1.3 0.7 2.0Greece 0.6 2.5 0.5 1.9 0.3 2.0 0.6 1.5 0.2 2.2Hungary .. .. 0.0 .. 0.4 3.3 1.2 1.9 1.0 2.2Iceland .. .. 0.0 .. .. .. 0.5 1.6 .. ..Ireland -0.5 1.8 -0.2 1.3 0.4 1.3 0.4 1.4 0.6 1.7Korea 0.7 1.6 0.4 1.1 0.3 0.6 0.2 0.6 0.5 0.9Luxembourg .. .. 0.0 .. .. .. .. .. .. ..Mexico .. .. 0.0 .. .. .. 0.1 0.8 .. ..Netherlands 0.0 2.6 0.1 1.6 0.1 1.7 0.1 0.5 0.2 1.4New Zealand -1.0 2.8 -0.8 2.3 -0.2 1.3 0.5 2.1 -0.3 1.2Norway -0.4 5.2 -0.3 2.7 0.1 0.9 0.2 1.4 0.2 0.9Poland .. .. 0.0 .. -0.2 1.7 1.8 2.1 1.0 2.2Portugal 1.3 2.3 1.1 2.0 0.6 0.8 0.6 2.3 0.9 1.6Spain 0.4 1.7 0.3 1.3 0.4 1.0 0.5 0.8 0.7 1.1Sweden 0.5 6.5 0.4 2.3 0.4 1.4 0.1 1.0 0.4 1.2Switzerland 0.5 1.9 0.2 0.6 0.3 0.8 0.1 0.4 0.3 0.8Turkey .. .. 0.0 .. .. .. 0.7 1.1 .. ..
OECD Average2 0.2 0.2 0.3 0.2 0.3 Standard deviation3 0.7 0.4 0.3 0.2 0.3
1. Estimates for some countries cover shorter periods, as indicated in Table 1.2. Excluding Czech Republic, Hungary, Iceland, Luxembourg, Mexico, Poland and Turkey.3. The OECD standard deviation relates to the series of country averages.Source : Calculated from OECD Revenue Statistics, National Accounts and Analytical Data Base.
Percentage points, 1980-971
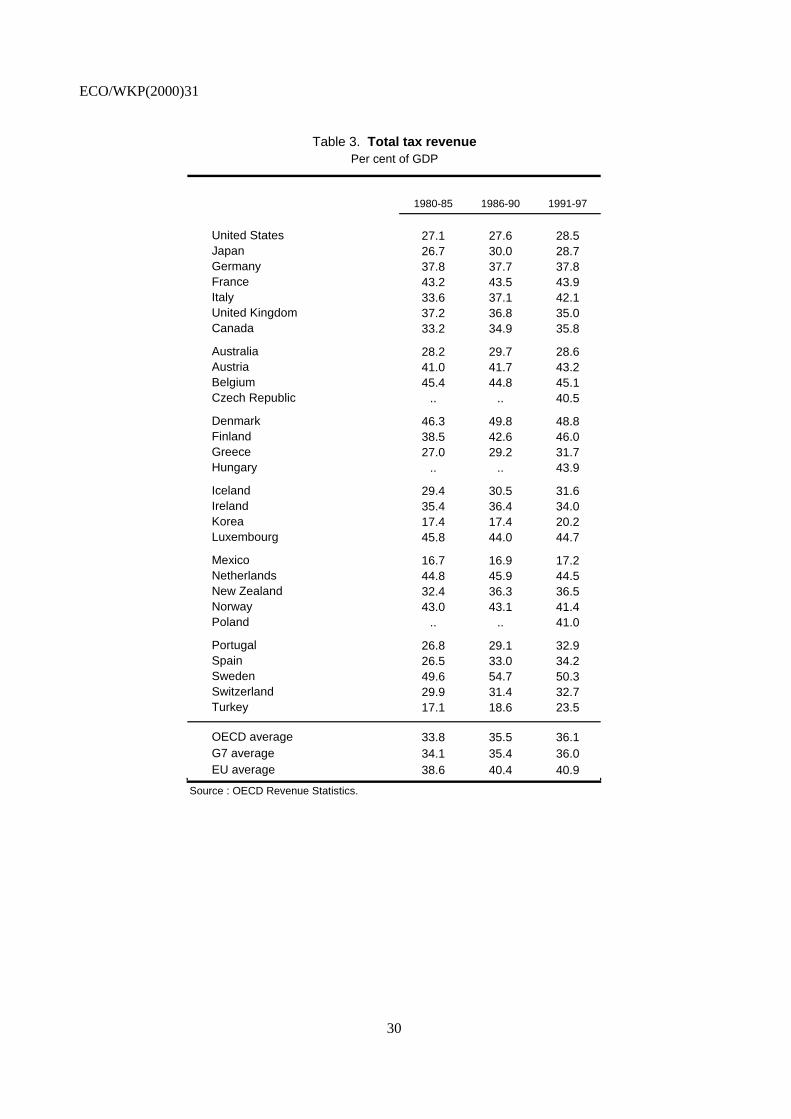
ECO/WKP(2000)31
30
Table 3. Total tax revenue Per cent of GDP
1980-85 1986-90 1991-97
United States 27.1 27.6 28.5Japan 26.7 30.0 28.7Germany 37.8 37.7 37.8France 43.2 43.5 43.9Italy 33.6 37.1 42.1United Kingdom 37.2 36.8 35.0Canada 33.2 34.9 35.8
Australia 28.2 29.7 28.6Austria 41.0 41.7 43.2Belgium 45.4 44.8 45.1Czech Republic .. .. 40.5
Denmark 46.3 49.8 48.8Finland 38.5 42.6 46.0Greece 27.0 29.2 31.7Hungary .. .. 43.9
Iceland 29.4 30.5 31.6Ireland 35.4 36.4 34.0Korea 17.4 17.4 20.2Luxembourg 45.8 44.0 44.7
Mexico 16.7 16.9 17.2Netherlands 44.8 45.9 44.5New Zealand 32.4 36.3 36.5Norway 43.0 43.1 41.4Poland .. .. 41.0
Portugal 26.8 29.1 32.9Spain 26.5 33.0 34.2Sweden 49.6 54.7 50.3Switzerland 29.9 31.4 32.7Turkey 17.1 18.6 23.5
OECD average 33.8 35.5 36.1G7 average 34.1 35.4 36.0EU average 38.6 40.4 40.9
Source : OECD Revenue Statistics.
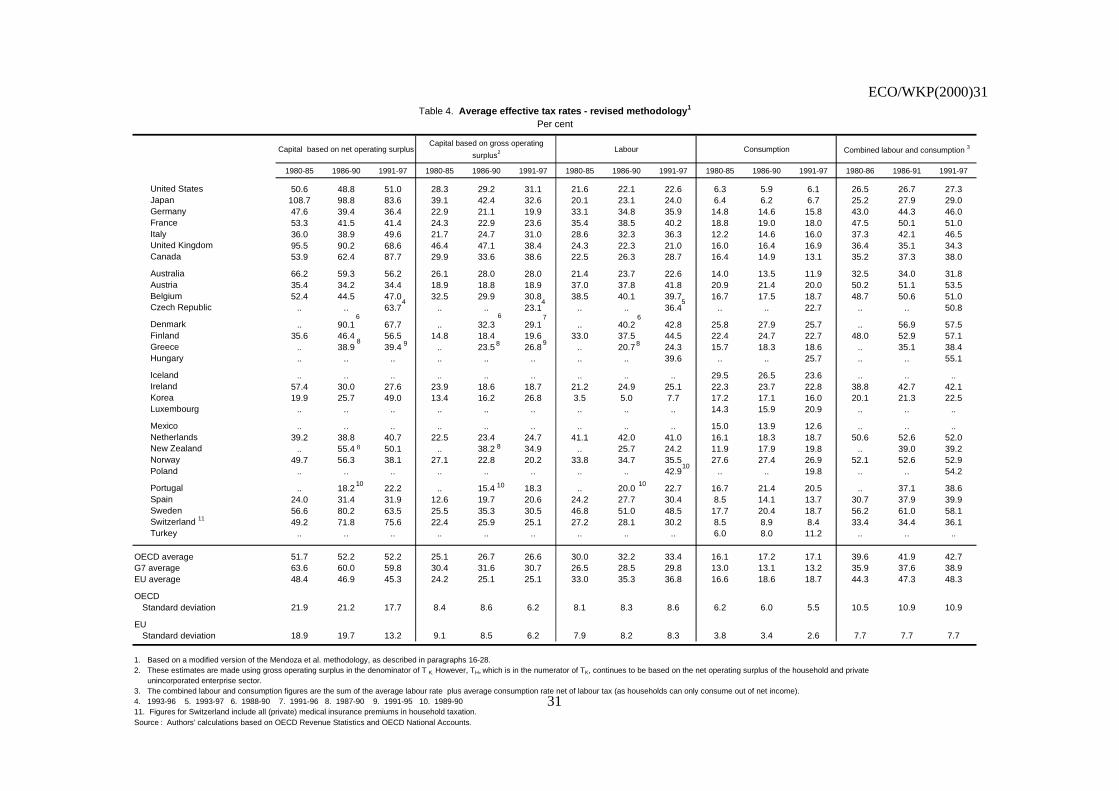
ECO/WKP(2000)31
31
Table 4. Average effective tax rates - revised methodology1
Per cent
Capital based on net operating surplusCapital based on gross operating
surplus2 Labour Consumption Combined labour and consumption 3
1980-85 1986-90 1991-97 1980-85 1986-90 1991-97 1980-85 1986-90 1991-97 1980-85 1986-90 1991-97 1980-86 1986-91 1991-97
United States 50.6 48.8 51.0 28.3 29.2 31.1 21.6 22.1 22.6 6.3 5.9 6.1 26.5 26.7 27.3Japan 108.7 98.8 83.6 39.1 42.4 32.6 20.1 23.1 24.0 6.4 6.2 6.7 25.2 27.9 29.0Germany 47.6 39.4 36.4 22.9 21.1 19.9 33.1 34.8 35.9 14.8 14.6 15.8 43.0 44.3 46.0France 53.3 41.5 41.4 24.3 22.9 23.6 35.4 38.5 40.2 18.8 19.0 18.0 47.5 50.1 51.0Italy 36.0 38.9 49.6 21.7 24.7 31.0 28.6 32.3 36.3 12.2 14.6 16.0 37.3 42.1 46.5United Kingdom 95.5 90.2 68.6 46.4 47.1 38.4 24.3 22.3 21.0 16.0 16.4 16.9 36.4 35.1 34.3Canada 53.9 62.4 87.7 29.9 33.6 38.6 22.5 26.3 28.7 16.4 14.9 13.1 35.2 37.3 38.0
Australia 66.2 59.3 56.2 26.1 28.0 28.0 21.4 23.7 22.6 14.0 13.5 11.9 32.5 34.0 31.8Austria 35.4 34.2 34.4 18.9 18.8 18.9 37.0 37.8 41.8 20.9 21.4 20.0 50.2 51.1 53.5Belgium 52.4 44.5 47.0 32.5 29.9 30.8 38.5 40.1 39.7 16.7 17.5 18.7 48.7 50.6 51.0Czech Republic .. .. 63.7 .. .. 23.1 .. .. 36.4 .. .. 22.7 .. .. 50.8
Denmark .. 90.1 67.7 .. 32.3 29.1 .. 40.2 42.8 25.8 27.9 25.7 .. 56.9 57.5Finland 35.6 46.4 56.5 14.8 18.4 19.6 33.0 37.5 44.5 22.4 24.7 22.7 48.0 52.9 57.1Greece .. 38.9 39.4 .. 23.5 26.8 .. 20.7 24.3 15.7 18.3 18.6 .. 35.1 38.4Hungary .. .. .. .. .. .. .. .. 39.6 .. .. 25.7 .. .. 55.1
Iceland .. .. .. .. .. .. .. .. .. 29.5 26.5 23.6 .. .. ..Ireland 57.4 30.0 27.6 23.9 18.6 18.7 21.2 24.9 25.1 22.3 23.7 22.8 38.8 42.7 42.1Korea 19.9 25.7 49.0 13.4 16.2 26.8 3.5 5.0 7.7 17.2 17.1 16.0 20.1 21.3 22.5Luxembourg .. .. .. .. .. .. .. .. .. 14.3 15.9 20.9 .. .. ..
Mexico .. .. .. .. .. .. .. .. .. 15.0 13.9 12.6 .. .. ..Netherlands 39.2 38.8 40.7 22.5 23.4 24.7 41.1 42.0 41.0 16.1 18.3 18.7 50.6 52.6 52.0New Zealand .. 55.4 50.1 .. 38.2 34.9 .. 25.7 24.2 11.9 17.9 19.8 .. 39.0 39.2Norway 49.7 56.3 38.1 27.1 22.8 20.2 33.8 34.7 35.5 27.6 27.4 26.9 52.1 52.6 52.9Poland .. .. .. .. .. .. .. .. 42.9 .. .. 19.8 .. .. 54.2
Portugal .. 18.2 22.2 .. 15.4 18.3 .. 20.0 22.7 16.7 21.4 20.5 .. 37.1 38.6Spain 24.0 31.4 31.9 12.6 19.7 20.6 24.2 27.7 30.4 8.5 14.1 13.7 30.7 37.9 39.9Sweden 56.6 80.2 63.5 25.5 35.3 30.5 46.8 51.0 48.5 17.7 20.4 18.7 56.2 61.0 58.1Switzerland 11 49.2 71.8 75.6 22.4 25.9 25.1 27.2 28.1 30.2 8.5 8.9 8.4 33.4 34.4 36.1Turkey .. .. .. .. .. .. .. .. .. 6.0 8.0 11.2 .. .. ..
OECD average 51.7 52.2 52.2 25.1 26.7 26.6 30.0 32.2 33.4 16.1 17.2 17.1 39.6 41.9 42.7G7 average 63.6 60.0 59.8 30.4 31.6 30.7 26.5 28.5 29.8 13.0 13.1 13.2 35.9 37.6 38.9EU average 48.4 46.9 45.3 24.2 25.1 25.1 33.0 35.3 36.8 16.6 18.6 18.7 44.3 47.3 48.3
OECDStandard deviation 21.9 21.2 17.7 8.4 8.6 6.2 8.1 8.3 8.6 6.2 6.0 5.5 10.5 10.9 10.9
EUStandard deviation 18.9 19.7 13.2 9.1 8.5 6.2 7.9 8.2 8.3 3.8 3.4 2.6 7.7 7.7 7.7
1. Based on a modified version of the Mendoza et al. methodology, as described in paragraphs 16-28.2. These estimates are made using gross operating surplus in the denominator of T K. However, TH, which is in the numerator of TK, continues to be based on the net operating surplus of the household and private unincorporated enterprise sector.3. The combined labour and consumption figures are the sum of the average labour rate plus average consumption rate net of labour tax (as households can only consume out of net income).4. 1993-96 5. 1993-97 6. 1988-90 7. 1991-96 8. 1987-90 9. 1991-95 10. 1989-9011. Figures for Switzerland include all (private) medical insurance premiums in household taxation.Source : Authors’ calculations based on OECD Revenue Statistics and OECD National Accounts.
4 4 5
9
6 6 67
8 8 89
10
8 8
10 10 10

ECO/WKP(2000)31
32
Table 5. Influence of the business cycle on AETRs
1980-97
Ouptut gap is significant1
AETR on capital(based on gross
operating surplus)AETR on labour
AETR onconsumption
AETR on labour andconsumption
combined
United States X X XJapan XGemrnayFrance XItalyUnited Kingdom XCanada X
Australia X X XAustria XBelgium X XFinlandIrelandNetherlands XNorwaySpainSwitzerland
1. The influence of cyclical factors on AETRs was tested using the following regression equation:
stxststxstx uG ,,,1,1,,, +++= −− γτβατwhere:τ = average effective tax rate;x = {capital (based on gross operating surplus), labour, consumption, labour and consumption combined};s = country;
G = output gap from OECD Economic Outlook 67.The country sample was limited to countries for which full data sets are available.
Source : Authors’ estimates.
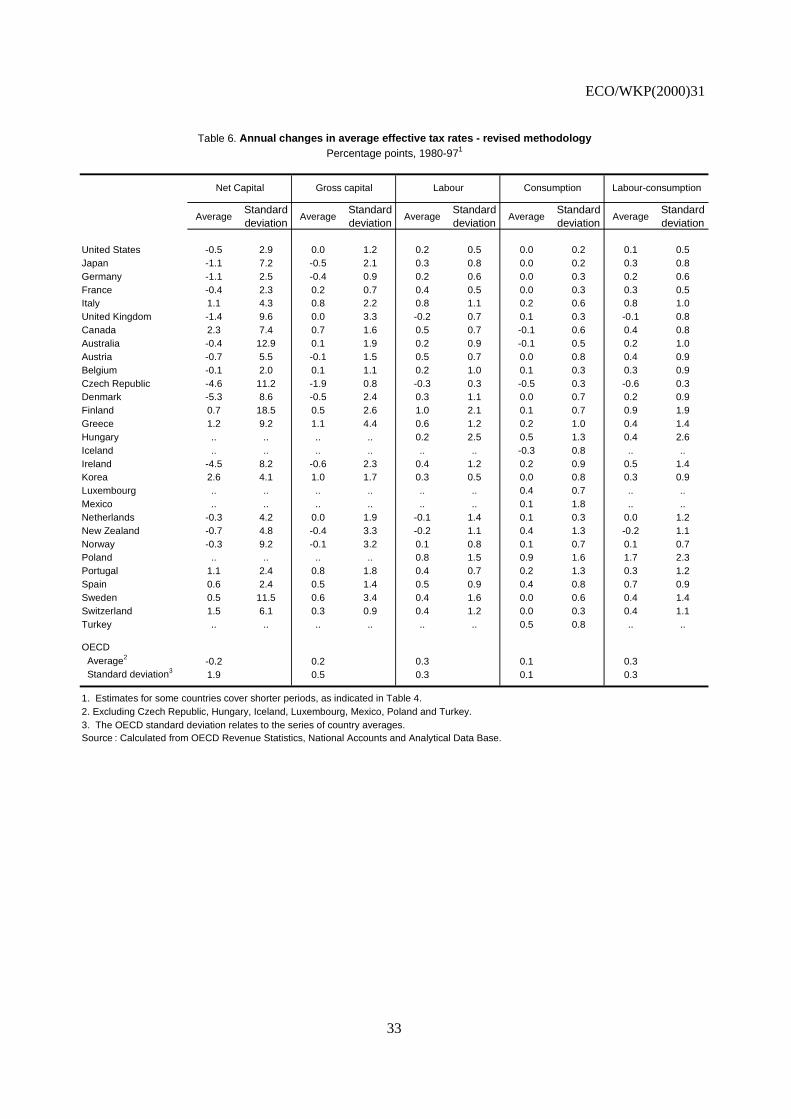
ECO/WKP(2000)31
33
Table 6. Annual changes in average effective tax rates - revised methodology Percentage points, 1980-971
Net Capital Gross capital Labour Consumption Labour-consumption
AverageStandard deviation
AverageStandard deviation
AverageStandard deviation
AverageStandard deviation
AverageStandard deviation
United States -0.5 2.9 0.0 1.2 0.2 0.5 0.0 0.2 0.1 0.5Japan -1.1 7.2 -0.5 2.1 0.3 0.8 0.0 0.2 0.3 0.8Germany -1.1 2.5 -0.4 0.9 0.2 0.6 0.0 0.3 0.2 0.6France -0.4 2.3 0.2 0.7 0.4 0.5 0.0 0.3 0.3 0.5Italy 1.1 4.3 0.8 2.2 0.8 1.1 0.2 0.6 0.8 1.0United Kingdom -1.4 9.6 0.0 3.3 -0.2 0.7 0.1 0.3 -0.1 0.8Canada 2.3 7.4 0.7 1.6 0.5 0.7 -0.1 0.6 0.4 0.8Australia -0.4 12.9 0.1 1.9 0.2 0.9 -0.1 0.5 0.2 1.0Austria -0.7 5.5 -0.1 1.5 0.5 0.7 0.0 0.8 0.4 0.9Belgium -0.1 2.0 0.1 1.1 0.2 1.0 0.1 0.3 0.3 0.9Czech Republic -4.6 11.2 -1.9 0.8 -0.3 0.3 -0.5 0.3 -0.6 0.3Denmark -5.3 8.6 -0.5 2.4 0.3 1.1 0.0 0.7 0.2 0.9Finland 0.7 18.5 0.5 2.6 1.0 2.1 0.1 0.7 0.9 1.9Greece 1.2 9.2 1.1 4.4 0.6 1.2 0.2 1.0 0.4 1.4Hungary .. .. .. .. 0.2 2.5 0.5 1.3 0.4 2.6Iceland .. .. .. .. .. .. -0.3 0.8 .. ..Ireland -4.5 8.2 -0.6 2.3 0.4 1.2 0.2 0.9 0.5 1.4Korea 2.6 4.1 1.0 1.7 0.3 0.5 0.0 0.8 0.3 0.9Luxembourg .. .. .. .. .. .. 0.4 0.7 .. ..Mexico .. .. .. .. .. .. 0.1 1.8 .. ..Netherlands -0.3 4.2 0.0 1.9 -0.1 1.4 0.1 0.3 0.0 1.2New Zealand -0.7 4.8 -0.4 3.3 -0.2 1.1 0.4 1.3 -0.2 1.1Norway -0.3 9.2 -0.1 3.2 0.1 0.8 0.1 0.7 0.1 0.7Poland .. .. .. .. 0.8 1.5 0.9 1.6 1.7 2.3Portugal 1.1 2.4 0.8 1.8 0.4 0.7 0.2 1.3 0.3 1.2Spain 0.6 2.4 0.5 1.4 0.5 0.9 0.4 0.8 0.7 0.9Sweden 0.5 11.5 0.6 3.4 0.4 1.6 0.0 0.6 0.4 1.4Switzerland 1.5 6.1 0.3 0.9 0.4 1.2 0.0 0.3 0.4 1.1Turkey .. .. .. .. .. .. 0.5 0.8 .. ..
OECD Average2 -0.2 0.2 0.3 0.1 0.3 Standard deviation3 1.9 0.5 0.3 0.1 0.3
1. Estimates for some countries cover shorter periods, as indicated in Table 4.2. Excluding Czech Republic, Hungary, Iceland, Luxembourg, Mexico, Poland and Turkey. 3. The OECD standard deviation relates to the series of country averages.Source : Calculated from OECD Revenue Statistics, National Accounts and Analytical Data Base.
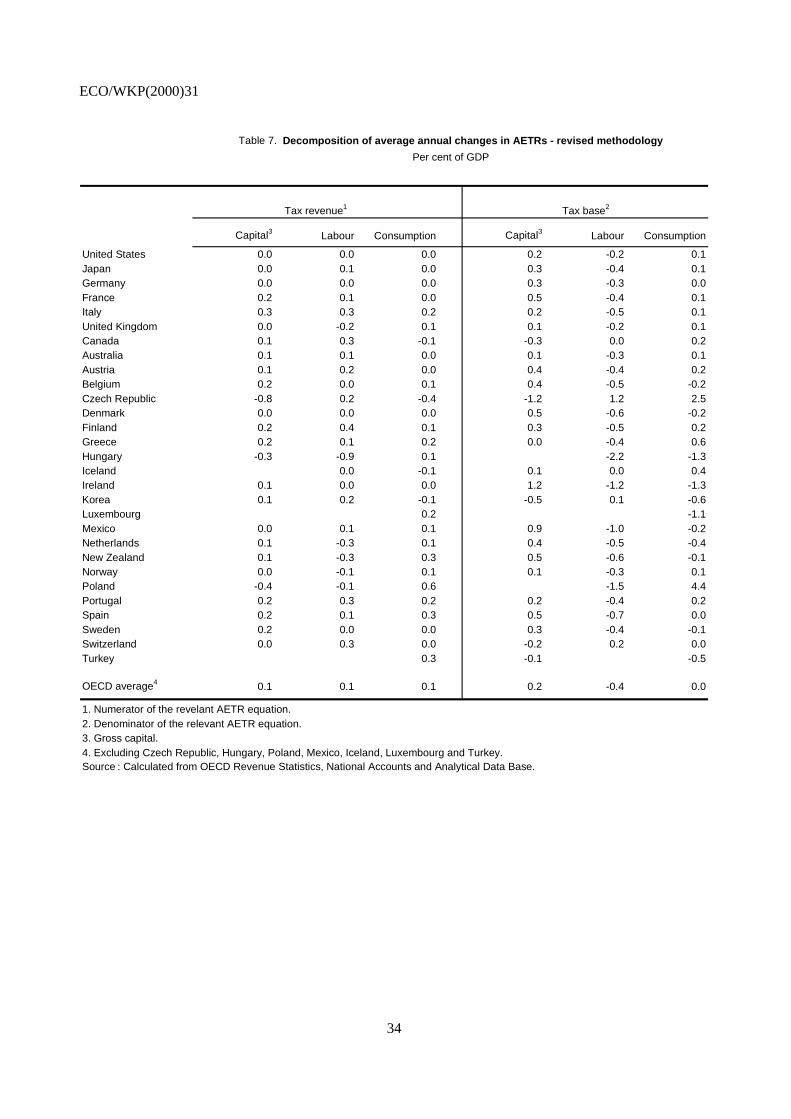
ECO/WKP(2000)31
34
Table 7. Decomposition of average annual changes in AETRs - revised methodology
Per cent of GDP
Tax revenue1 Tax base2
Capital3 Labour Consumption Capital3 Labour Consumption
United States 0.0 0.0 0.0 0.2 -0.2 0.1Japan 0.0 0.1 0.0 0.3 -0.4 0.1Germany 0.0 0.0 0.0 0.3 -0.3 0.0France 0.2 0.1 0.0 0.5 -0.4 0.1Italy 0.3 0.3 0.2 0.2 -0.5 0.1United Kingdom 0.0 -0.2 0.1 0.1 -0.2 0.1Canada 0.1 0.3 -0.1 -0.3 0.0 0.2Australia 0.1 0.1 0.0 0.1 -0.3 0.1Austria 0.1 0.2 0.0 0.4 -0.4 0.2Belgium 0.2 0.0 0.1 0.4 -0.5 -0.2Czech Republic -0.8 0.2 -0.4 -1.2 1.2 2.5Denmark 0.0 0.0 0.0 0.5 -0.6 -0.2Finland 0.2 0.4 0.1 0.3 -0.5 0.2Greece 0.2 0.1 0.2 0.0 -0.4 0.6Hungary -0.3 -0.9 0.1 -2.2 -1.3Iceland 0.0 -0.1 0.1 0.0 0.4Ireland 0.1 0.0 0.0 1.2 -1.2 -1.3Korea 0.1 0.2 -0.1 -0.5 0.1 -0.6Luxembourg 0.2 -1.1Mexico 0.0 0.1 0.1 0.9 -1.0 -0.2Netherlands 0.1 -0.3 0.1 0.4 -0.5 -0.4New Zealand 0.1 -0.3 0.3 0.5 -0.6 -0.1Norway 0.0 -0.1 0.1 0.1 -0.3 0.1Poland -0.4 -0.1 0.6 -1.5 4.4Portugal 0.2 0.3 0.2 0.2 -0.4 0.2Spain 0.2 0.1 0.3 0.5 -0.7 0.0Sweden 0.2 0.0 0.0 0.3 -0.4 -0.1Switzerland 0.0 0.3 0.0 -0.2 0.2 0.0Turkey 0.3 -0.1 -0.5
OECD average4 0.1 0.1 0.1 0.2 -0.4 0.0
1. Numerator of the revelant AETR equation.2. Denominator of the relevant AETR equation.3. Gross capital.4. Excluding Czech Republic, Hungary, Poland, Mexico, Iceland, Luxembourg and Turkey.Source : Calculated from OECD Revenue Statistics, National Accounts and Analytical Data Base.
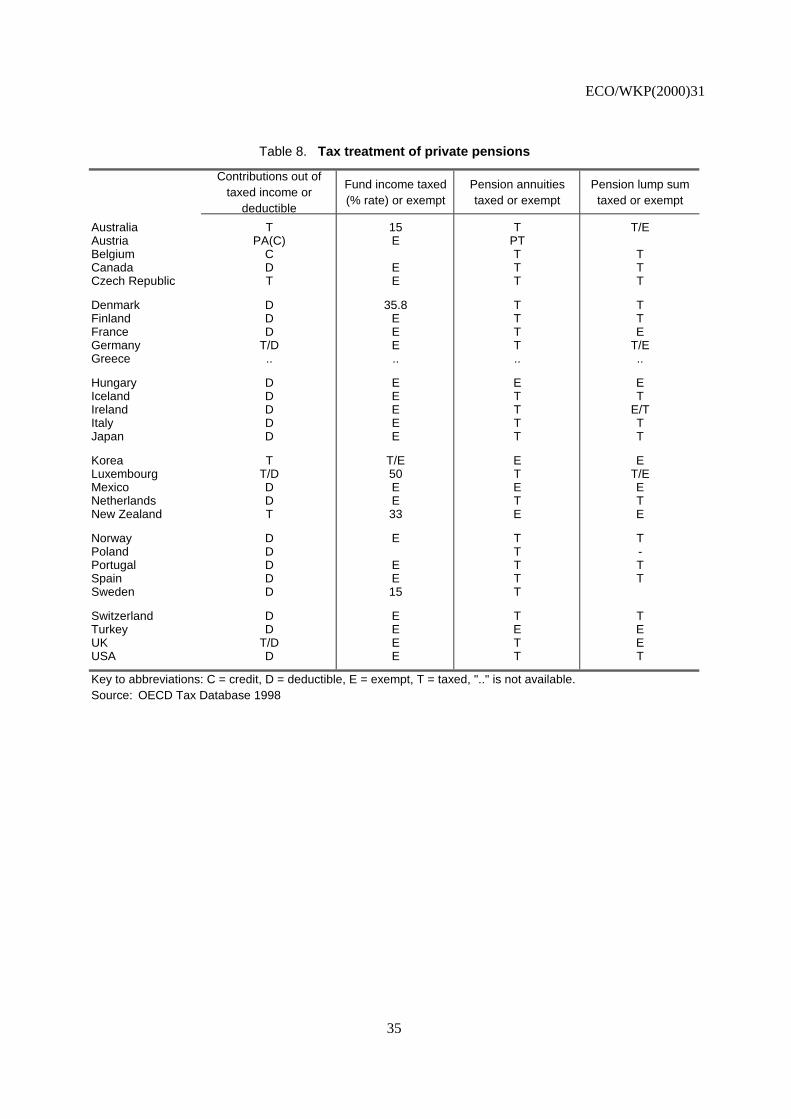
ECO/WKP(2000)31
35
Table 8. Tax treatment of private pensions
Contributions out of taxed income or
deductible
Fund income taxed (% rate) or exempt
Pension annuities taxed or exempt
Pension lump sum taxed or exempt
Australia T 15 T T/EAustria PA(C) E PTBelgium C T TCanada D E T TCzech Republic T E T T
Denmark D 35.8 T TFinland D E T TFrance D E T EGermany T/D E T T/EGreece .. .. .. ..
Hungary D E E EIceland D E T TIreland D E T E/TItaly D E T TJapan D E T T
Korea T T/E E ELuxembourg T/D 50 T T/EMexico D E E ENetherlands D E T TNew Zealand T 33 E E
Norway D E T TPoland D T -Portugal D E T TSpain D E T TSweden D 15 T
Switzerland D E T TTurkey D E E EUK T/D E T EUSA D E T T
Key to abbreviations: C = credit, D = deductible, E = exempt, T = taxed, ".." is not available.Source: OECD Tax Database 1998

ECO/WKP(2000)31
36
Table 9. Financial assets of pension fundsAs a percentage of GDP.
1990 1991 1992 1993 1994 1995 1996 1997
Australia 17.0 21.6 21.3 27.3 27.0 29.1 30.4 30.7Austria .. 0.5 0.5 0.6 0.7 1.0 1.2 ..Belgium 2.0 2.8 2.5 2.9 2.9 3.7 4.1 ..Canada 28.8 30.7 31.3 34.0 35.9 38.6 40.7 43.3Czech republic .. .. .. .. 0.1 .. .. ..
Denmark 14.6 15.5 14.4 16.8 17.2 16.8 16.9 ..Finland .. .. .. .. .. .. .. ..France .. .. .. .. .. .. .. ..Germany 3.1 3.3 2.9 2.5 2.7 2.7 2.8 2.9Greece 6.5 7.1 6.9 8.0 10.2 10.8 11.9 ..
Hungary .. .. .. .. .. .. .. ..Iceland 37.3 42.1 40.8 46.8 55.0 57.6 62.5 66.5Italy 3.5 4.3 3.1 3.4 3.5 3.6 3.2 2.9Japan .. .. .. .. .. .. .. ..Korea 3.1 2.9 3.2 3.4 3.3 3.1 2.8 1.8
Luxembourg 17.7 18.5 17.2 17.2 18.7 18.2 18.2 ..Netherlands 81.0 83.5 76.0 83.0 87.0 88.3 93.3 102.0Norway 4.4 4.9 4.5 5.5 6.4 6.4 6.5 ..Portugal 1.6 2.6 2.9 5.0 6.6 8.3 9.1 10.1Spain 2.9 3.2 2.5 2.6 2.4 2.2 2.0 2.0
Sweden 1.7 1.7 1.6 2.0 2.2 2.4 2.4 ..Switzerland 60.3 .. 60.6 .. 72.5 .. 75.1 ..Turkey .. .. .. .. .. .. .. ..United Kingdom 55.0 59.4 52.7 72.7 64.7 68.7 77.5 ..United States 44.9 50.6 51.9 54.4 53.3 59.4 64.4 72.5
Source: OECD, DAF/FIN -- Institutional Investors, Statistical Yearbook 1998.
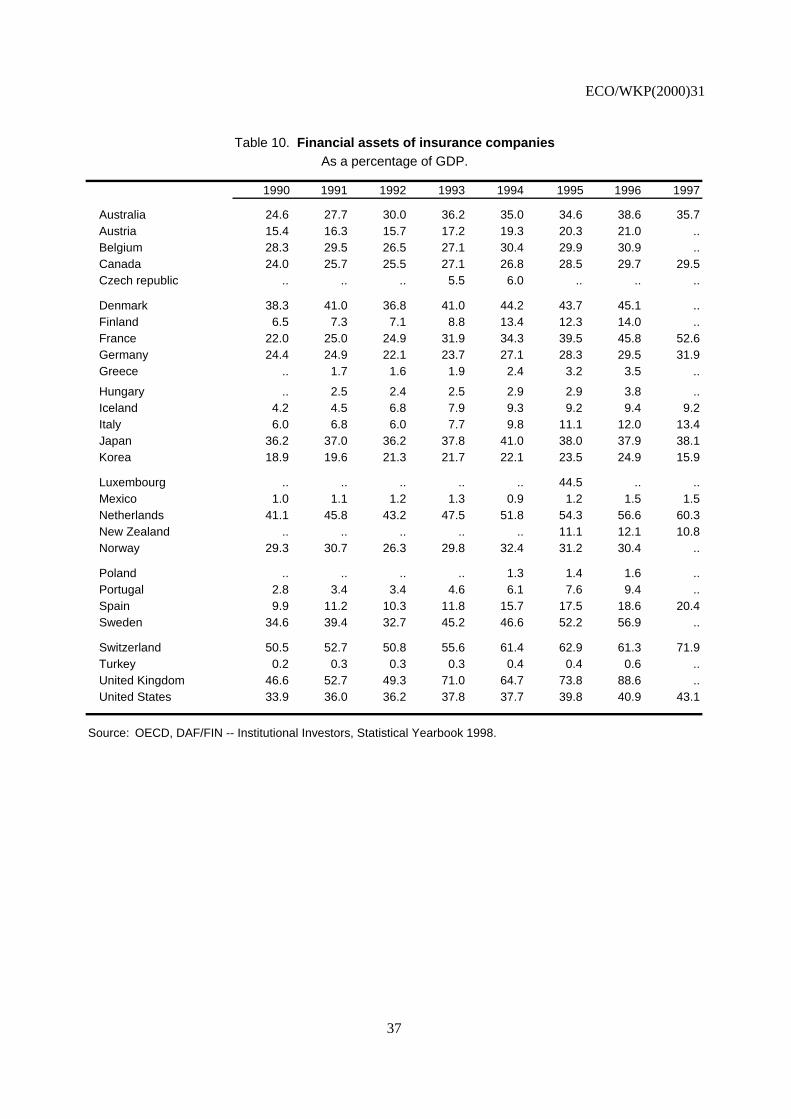
ECO/WKP(2000)31
37
Table 10. Financial assets of insurance companiesAs a percentage of GDP.
1990 1991 1992 1993 1994 1995 1996 1997
Australia 24.6 27.7 30.0 36.2 35.0 34.6 38.6 35.7Austria 15.4 16.3 15.7 17.2 19.3 20.3 21.0 ..Belgium 28.3 29.5 26.5 27.1 30.4 29.9 30.9 ..Canada 24.0 25.7 25.5 27.1 26.8 28.5 29.7 29.5Czech republic .. .. .. 5.5 6.0 .. .. ..
Denmark 38.3 41.0 36.8 41.0 44.2 43.7 45.1 ..Finland 6.5 7.3 7.1 8.8 13.4 12.3 14.0 ..France 22.0 25.0 24.9 31.9 34.3 39.5 45.8 52.6Germany 24.4 24.9 22.1 23.7 27.1 28.3 29.5 31.9Greece .. 1.7 1.6 1.9 2.4 3.2 3.5 ..
Hungary .. 2.5 2.4 2.5 2.9 2.9 3.8 ..Iceland 4.2 4.5 6.8 7.9 9.3 9.2 9.4 9.2Italy 6.0 6.8 6.0 7.7 9.8 11.1 12.0 13.4Japan 36.2 37.0 36.2 37.8 41.0 38.0 37.9 38.1Korea 18.9 19.6 21.3 21.7 22.1 23.5 24.9 15.9
Luxembourg .. .. .. .. .. 44.5 .. ..Mexico 1.0 1.1 1.2 1.3 0.9 1.2 1.5 1.5Netherlands 41.1 45.8 43.2 47.5 51.8 54.3 56.6 60.3New Zealand .. .. .. .. .. 11.1 12.1 10.8Norway 29.3 30.7 26.3 29.8 32.4 31.2 30.4 ..
Poland .. .. .. .. 1.3 1.4 1.6 ..Portugal 2.8 3.4 3.4 4.6 6.1 7.6 9.4 ..Spain 9.9 11.2 10.3 11.8 15.7 17.5 18.6 20.4Sweden 34.6 39.4 32.7 45.2 46.6 52.2 56.9 ..
Switzerland 50.5 52.7 50.8 55.6 61.4 62.9 61.3 71.9Turkey 0.2 0.3 0.3 0.3 0.4 0.4 0.6 ..United Kingdom 46.6 52.7 49.3 71.0 64.7 73.8 88.6 ..United States 33.9 36.0 36.2 37.8 37.7 39.8 40.9 43.1
Source: OECD, DAF/FIN -- Institutional Investors, Statistical Yearbook 1998.

ECO/WKP(2000)31
38
Table 11. Estimated effects of preferential tax treatment for pension and insurance fund earnings, per cent1 - revised methodology
Assuming an average of 5 per cent return on assets over the period
Average effective tax rates on labour Average effective tax rates on capital (using net operating surplus)
1990 1991 1992 1993 1994 1995 1996 1997Average 1991/96
Average 1991/96
unadjusted AETR
1990 1991 1992 1993 1994 1995 1996 1997Average 1991/96
Average 1991/96
unadjusted AETR
United States 23.0 23.0 22.7 23.0 23.3 23.8 24.5 25.2 23.4 22.4 46.4 48.5 48.6 48.1 47.1 45.7 44.7 44.6 47.1 51.2 Japan 25.6 25.2 24.1 24.7 23.2 23.9 23.7 24.1 24.1 24.0 88.4 81.8 79.2 76.4 82.4 89.7 79.7 79.7 81.5 83.9 Germany 34.5 35.6 36.2 36.1 37.0 37.5 36.1 36.4 36.4 35.9 32.3 33.9 35.9 36.0 31.7 31.9 32.2 29.1 33.6 37.1 France 39.4 40.0 39.9 40.3 40.8 40.7 41.3 41.1 40.5 40.2 38.2 37.4 38.4 38.4 36.7 37.9 39.4 41.4 38.0 40.9 Italy 33.2 33.4 34.3 36.4 35.1 36.3 39.4 40.6 35.8 35.7 41.4 44.1 52.9 56.1 46.0 44.1 45.4 47.3 48.1 49.7 United Kingdom 21.8 22.0 21.6 21.7 22.5 22.9 22.8 .. 22.2 21.0 84.4 82.8 64.1 55.6 53.6 59.4 58.8 .. 62.4 68.3 Canada 28.6 29.3 29.2 28.8 29.6 29.9 30.6 31.1 29.6 28.5 70.9 84.4 89.4 84.4 73.7 69.9 77.9 85.3 80.0 86.7
Australia 22.8 22.0 21.8 22.8 23.5 24.2 25.0 25.6 23.2 22.3 62.9 57.6 53.1 48.3 49.8 49.9 54.8 52.2 52.3 56.1 Austria .. 38.4 39.8 41.3 42.4 43.2 44.4 .. 41.6 41.3 .. 31.5 34.3 34.1 28.8 30.0 33.7 .. 32.1 34.4 Belgium 40.3 39.6 39.9 39.6 40.6 40.9 40.7 .. 40.2 39.6 39.1 40.1 40.7 43.3 46.0 44.8 44.6 .. 43.2 46.6 Czech Republic .. .. .. 37.8 36.3 .. .. .. .. 36.6 .. .. .. 63.0 63.9 .. .. .. .. 63.7
Denmark 42.1 42.3 43.5 45.2 47.8 46.3 46.5 45.5 45.3 42.8 57.9 56.0 53.6 55.3 52.6 53.9 54.5 .. 54.3 67.7 Finland 39.7 39.7 40.6 43.6 49.0 46.7 47.6 .. 44.5 44.4 57.6 113.9 86.8 38.5 31.0 32.9 38.3 .. 56.9 59.0 Greece .. 22.1 22.0 24.4 25.3 25.2 25.6 .. 24.1 23.8 .. 36.6 38.3 32.9 39.7 44.6 .. .. 38.4 39.4 Hungary .. .. .. .. .. .. .. .. .. 40.1 .. .. .. .. .. .. .. .. .. ..
Iceland .. .. .. .. .. .. .. .. .. .. .. .. .. .. .. .. .. .. .. ..Ireland .. .. .. .. .. .. .. .. .. 25.1 .. .. .. .. .. .. .. .. .. 28.0 Korea 6.6 6.1 6.8 8.1 8.3 8.2 8.6 8.3 7.7 7.6 36.2 36.9 44.2 42.0 43.5 49.8 .. .. 43.3 46.7 Luxembourg .. .. .. .. .. .. .. .. .. .. .. .. .. .. .. .. .. .. .. ..
Mexico .. .. .. .. .. .. .. .. .. .. .. .. .. .. .. .. .. .. .. ..Netherlands 42.3 45.2 44.3 44.9 42.4 41.4 38.9 39.4 42.8 41.5 29.5 31.2 31.8 34.4 30.9 29.9 34.5 35.6 32.1 40.5 New Zealand 27.1 25.3 25.9 26.3 26.5 26.2 24.0 23.8 25.7 24.5 50.8 47.5 47.1 44.6 45.9 49.0 47.8 48.5 47.0 49.9 Norway 36.1 36.5 35.5 34.7 36.1 36.0 36.7 .. 35.9 35.4 41.6 40.3 35.3 33.3 33.8 35.2 33.5 .. 35.2 37.6 Poland .. .. .. .. .. .. .. .. .. 42.9 .. .. .. .. .. .. .. .. .. ..
Portugal 20.4 20.9 23.0 22.4 22.9 23.9 23.3 .. 22.8 22.6 18.7 23.5 23.3 19.9 18.6 19.6 22.0 .. 21.1 21.7 Spain 28.9 29.6 30.8 30.7 31.2 30.6 30.1 30.5 30.5 30.4 34.4 33.6 34.0 32.6 29.0 27.8 28.3 31.3 30.9 31.9 Sweden 52.0 49.8 48.1 46.1 47.9 49.5 51.7 .. 48.8 47.9 87.8 80.2 60.3 56.5 51.2 40.9 55.1 .. 57.4 63.2 Switzerland 29.4 29.4 30.1 31.8 33.3 33.0 34.0 .. 32.0 30.1 62.4 69.5 71.5 63.5 54.3 53.5 52.4 .. 60.8 77.0 Turkey .. .. .. .. .. .. .. .. .. .. .. .. .. .. .. .. .. .. .. ..
Average 31.3 31.3 31.5 32.0 32.7 32.7 32.9 31.0 32.2 31.4 51.6 54.9 52.1 47.7 45.2 45.6 46.9 49.5 48.7 53.5
1. These calculations are made by deducting estimated pension and insurance fund earnings from the household income tax base in the denominator of th and the numerator of tk. Fund earnings were estimated assuming an average rate of return on assets of 5% over the period, except for Denmark and New Zealand, where fund earnings were estimated from taxes paid on them. Value of assets was obtained using data from Tables 5 and 6. See paragraph 38 for more details.Source : Authors’ calculations based on OECD Revenue Statistics and OECD National Accounts.
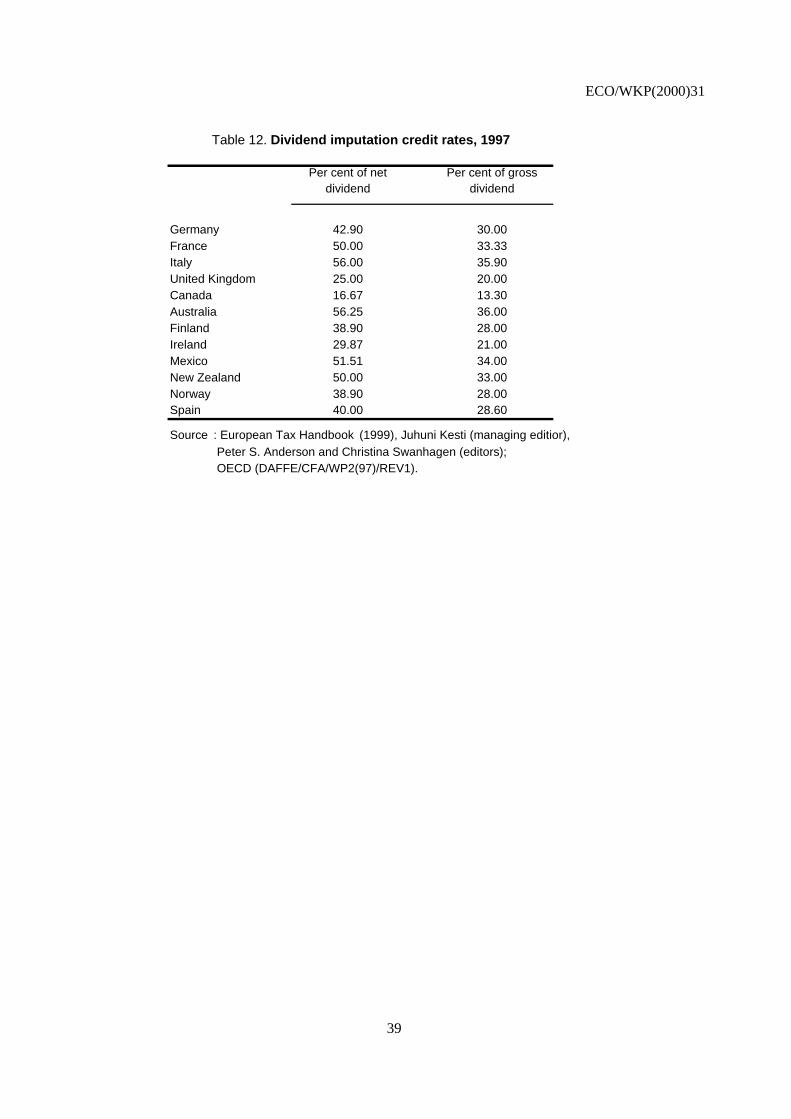
ECO/WKP(2000)31
39
Table 12. Dividend imputation credit rates, 1997
Per cent of net dividend
Per cent of gross dividend
Germany 42.90 30.00France 50.00 33.33Italy 56.00 35.90United Kingdom 25.00 20.00Canada 16.67 13.30Australia 56.25 36.00Finland 38.90 28.00Ireland 29.87 21.00Mexico 51.51 34.00New Zealand 50.00 33.00Norway 38.90 28.00Spain 40.00 28.60
Source : European Tax Handbook (1999), Juhuni Kesti (managing editior), Peter S. Anderson and Christina Swanhagen (editors); OECD (DAFFE/CFA/WP2(97)/REV1).
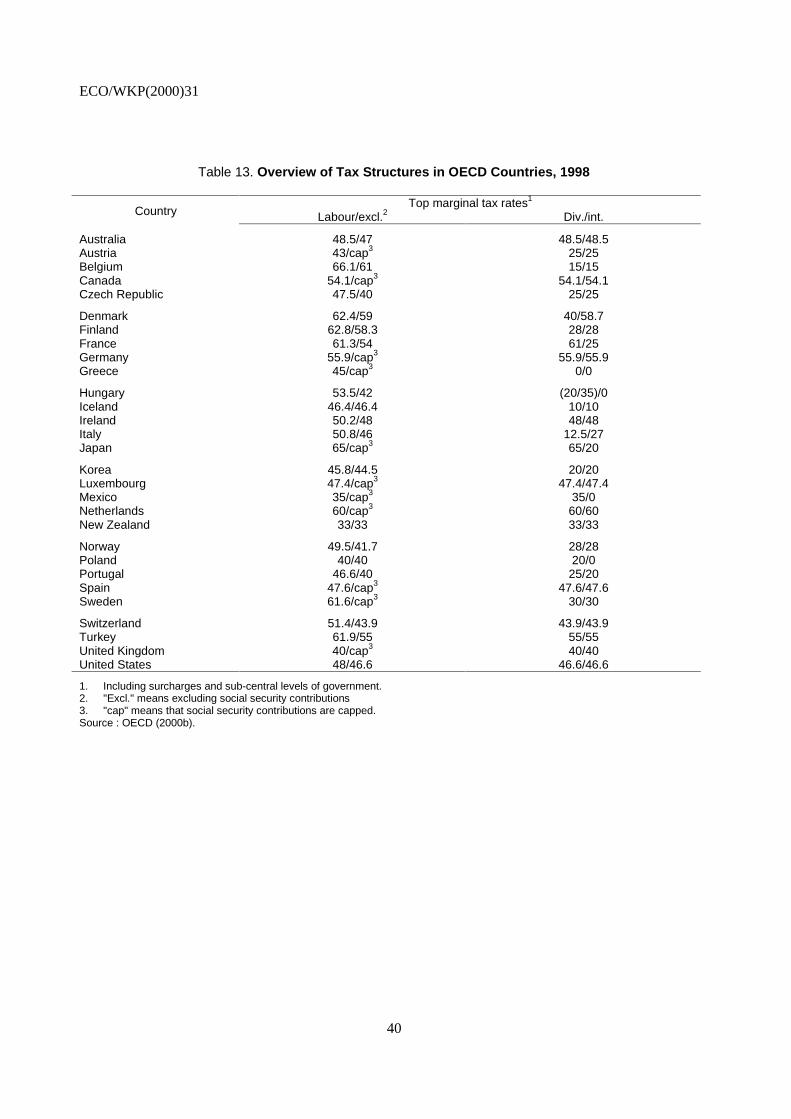
ECO/WKP(2000)31
40
Table 13. Overview of Tax Structures in OECD Countries, 1998
Top marginal tax rates1
Country Labour/excl.2 Div./int.
Australia 48.5/47 48.5/48.5Austria 43/cap3 25/25Belgium 66.1/61 15/15Canada 54.1/cap3 54.1/54.1Czech Republic 47.5/40 25/25
Denmark 62.4/59 40/58.7Finland 62.8/58.3 28/28France 61.3/54 61/25Germany 55.9/cap3 55.9/55.9Greece 45/cap3 0/0
Hungary 53.5/42 (20/35)/0Iceland 46.4/46.4 10/10Ireland 50.2/48 48/48Italy 50.8/46 12.5/27Japan 65/cap3 65/20
Korea 45.8/44.5 20/20Luxembourg 47.4/cap3 47.4/47.4Mexico 35/cap3 35/0Netherlands 60/cap3 60/60New Zealand 33/33 33/33
Norway 49.5/41.7 28/28Poland 40/40 20/0Portugal 46.6/40 25/20Spain 47.6/cap3 47.6/47.6Sweden 61.6/cap3 30/30
Switzerland 51.4/43.9 43.9/43.9Turkey 61.9/55 55/55United Kingdom 40/cap3 40/40United States 48/46.6 46.6/46.6
1. Including surcharges and sub-central levels of government.2. "Excl." means excluding social security contributions3. "cap" means that social security contributions are capped.Source : OECD (2000b).
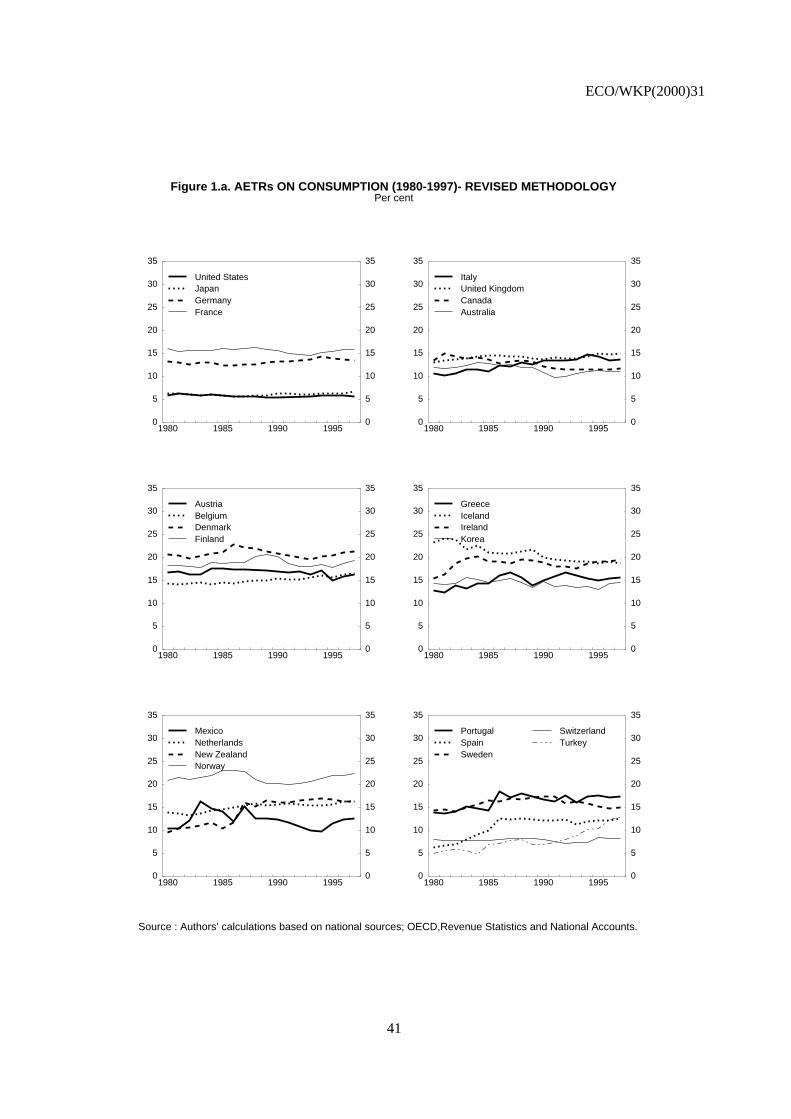
ECO/WKP(2000)31
41
Figure 1.a. AETRs ON CONSUMPTION (1980-1997)- REVISED METHODOLOGYPer cent
Source : Authors’ calculations based on national sources; OECD,Revenue Statistics and National Accounts.
1980 1985 1990 19950
5
10
15
20
25
30
35
0
5
10
15
20
25
30
35
United StatesJapanGermanyFrance
1980 1985 1990 19950
5
10
15
20
25
30
35
0
5
10
15
20
25
30
35
ItalyUnited KingdomCanadaAustralia
1980 1985 1990 19950
5
10
15
20
25
30
35
0
5
10
15
20
25
30
35
AustriaBelgiumDenmarkFinland
1980 1985 1990 19950
5
10
15
20
25
30
35
0
5
10
15
20
25
30
35
GreeceIcelandIrelandKorea
1980 1985 1990 19950
5
10
15
20
25
30
35
0
5
10
15
20
25
30
35
MexicoNetherlandsNew ZealandNorway
1980 1985 1990 19950
5
10
15
20
25
30
35
0
5
10
15
20
25
30
35
PortugalSpainSweden
SwitzerlandTurkey

ECO/WKP(2000)31
42
Figure 1.b. AETRs ON LABOUR (1980-1997) - REVISED METHODOLOGYPer cent
Source : Authors’ calculations based on national sources; OECD,Revenue Statistics and National Accounts.
1980 1985 1990 199510
20
30
40
50
10
20
30
40
50United StatesJapanGermanyFrance
1980 1985 1990 199510
20
30
40
50
10
20
30
40
50ItalyUnited KingdomCanadaAustralia
1980 1985 1990 199510
20
30
40
50
10
20
30
40
50AustriaBelgiumCzech Rep.Denmark
1980 1985 1990 199510
20
30
40
50
10
20
30
40
50FinlandGreeceHungaryIreland
1980 1985 1990 199510
20
30
40
50
10
20
30
40
50MexicoNetherlandsNew ZealandNorway
1980 1985 1990 199510
20
30
40
50
10
20
30
40
50PolandPortugalSpain
SwedenSwitzerland

ECO/WKP(2000)31
43
Figure 1.c. AETRs ON CAPITAL (1) (1980-1997)- REVISED METHODOLOGYPer cent
1. Using all property taxes and net operating surplus.Source : Authors’ calculations based on national sources; OECD,Revenue Statistics and National Accounts.
1980 1985 1990 1995
20
40
60
80
100
120
20
40
60
80
100
120United StatesJapan
GermanyFrance
1980 1985 1990 1995
20
40
60
80
100
120
20
40
60
80
100
120ItalyUnited Kingdom
CanadaAustralia
1980 1985 1990 1995
20
40
60
80
100
120
20
40
60
80
100
120AustriaBelgiumDenmarkFinland
1980 1985 1990 1995
20
40
60
80
100
120
20
40
60
80
100
120GreeceIrelandNetherlands
1980 1985 1990 1995
20
40
60
80
100
120
20
40
60
80
100
120New ZealandNorwayPortugal
1980 1985 1990 1995
20
40
60
80
100
120
20
40
60
80
100
120SpainSwedenSwitzerland
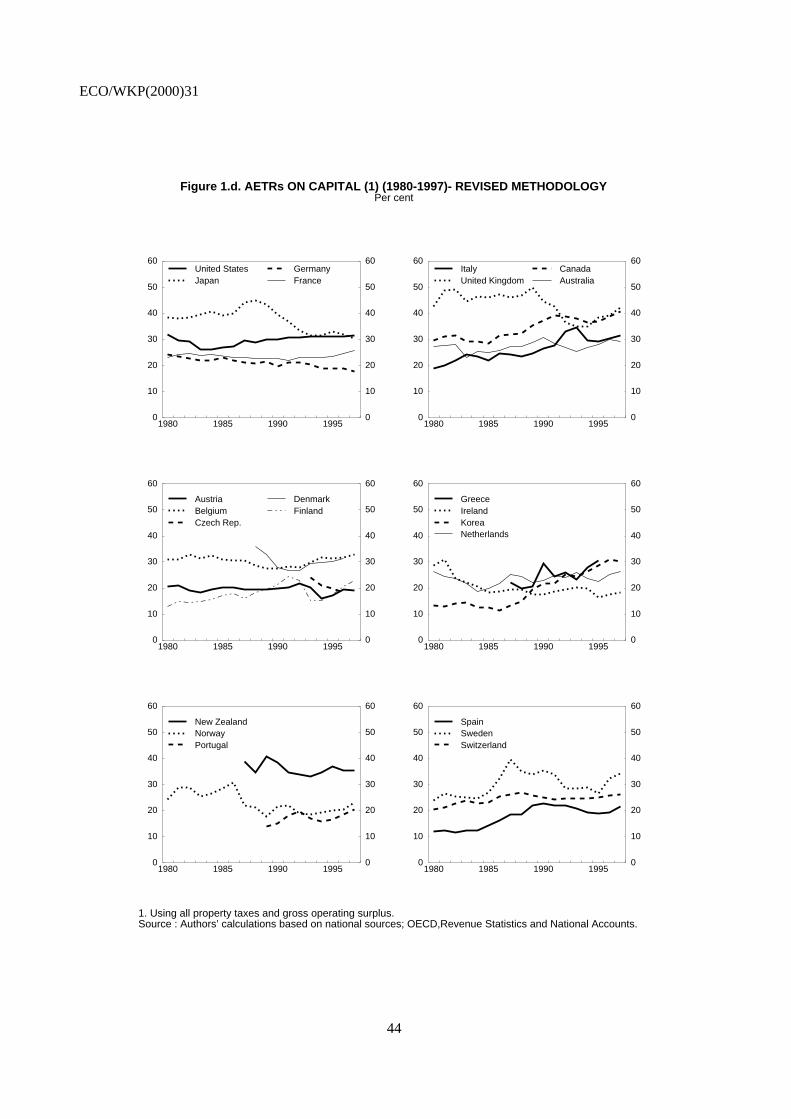
ECO/WKP(2000)31
44
Figure 1.d. AETRs ON CAPITAL (1) (1980-1997)- REVISED METHODOLOGYPer cent
1. Using all property taxes and gross operating surplus.Source : Authors’ calculations based on national sources; OECD,Revenue Statistics and National Accounts.
1980 1985 1990 19950
10
20
30
40
50
60
0
10
20
30
40
50
60United StatesJapan
GermanyFrance
1980 1985 1990 19950
10
20
30
40
50
60
0
10
20
30
40
50
60ItalyUnited Kingdom
CanadaAustralia
1980 1985 1990 19950
10
20
30
40
50
60
0
10
20
30
40
50
60
AustriaBelgiumCzech Rep.
DenmarkFinland
1980 1985 1990 19950
10
20
30
40
50
60
0
10
20
30
40
50
60
GreeceIrelandKoreaNetherlands
1980 1985 1990 19950
10
20
30
40
50
60
0
10
20
30
40
50
60
New ZealandNorwayPortugal
1980 1985 1990 19950
10
20
30
40
50
60
0
10
20
30
40
50
60
SpainSwedenSwitzerland

ECO/WKP(2000)31
45
Annex Tables
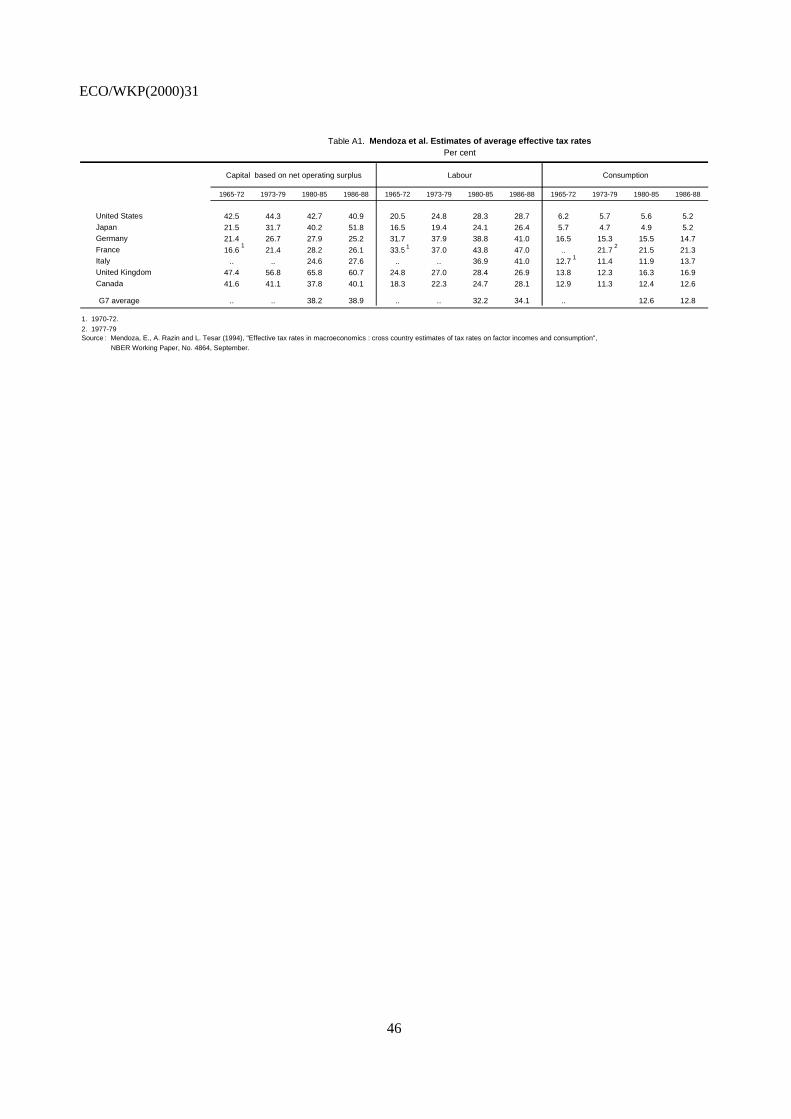
ECO/WKP(2000)31
46
Table A1. Mendoza et al. Estimates of average effective tax rates Per cent
Capital based on net operating surplus Labour Consumption
1965-72 1973-79 1980-85 1986-88 1965-72 1973-79 1980-85 1986-88 1965-72 1973-79 1980-85 1986-88
United States 42.5 44.3 42.7 40.9 20.5 24.8 28.3 28.7 6.2 5.7 5.6 5.2Japan 21.5 31.7 40.2 51.8 16.5 19.4 24.1 26.4 5.7 4.7 4.9 5.2Germany 21.4 26.7 27.9 25.2 31.7 37.9 38.8 41.0 16.5 15.3 15.5 14.7France 16.6 21.4 28.2 26.1 33.5 37.0 43.8 47.0 .. 21.7 21.5 21.3Italy .. .. 24.6 27.6 .. .. 36.9 41.0 12.7 11.4 11.9 13.7United Kingdom 47.4 56.8 65.8 60.7 24.8 27.0 28.4 26.9 13.8 12.3 16.3 16.9Canada 41.6 41.1 37.8 40.1 18.3 22.3 24.7 28.1 12.9 11.3 12.4 12.6
G7 average .. .. 38.2 38.9 .. .. 32.2 34.1 .. 12.6 12.8
1. 1970-72.
2. 1977-79Source : Mendoza, E., A. Razin and L. Tesar (1994), "Effective tax rates in macroeconomics : cross country estimates of tax rates on factor incomes and consumption", NBER Working Paper, No. 4864, September.
2
1
1 1

ECO/WKP(2000)31
47
Table A2. Net over gross operating surplusPer cent
1980 1981 1982 1983 1984 1985 1986 1987 1988 1989 1990 1991 1992 1993 1994 1995 1996 1997 1980-85 1986-90 1991-97
United States 62.4 62.8 60.6 61.9 65.8 66.1 65.0 65.6 66.5 66.2 66.0 65.0 64.6 65.9 66.5 67.6 68.4 68.7 63.3 65.9 66.7 Japan 67.8 66.1 65.3 64.3 64.6 65.1 65.1 64.6 64.9 63.6 62.7 61.8 59.6 58.3 56.7 55.6 56.6 55.5 65.5 64.2 57.7 Germany 58.6 56.5 55.7 57.6 58.4 59.0 60.5 60.1 61.3 61.7 62.4 62.1 61.0 59.5 61.5 61.8 62.8 64.3 57.6 61.2 61.8 France 60.5 59.6 58.9 59.0 60.1 61.2 63.5 63.6 63.9 64.7 63.8 63.2 63.3 62.6 63.7 63.6 63.6 64.0 59.9 63.9 63.4 Italy 75.1 73.3 73.0 73.3 74.1 74.0 75.2 75.3 75.4 75.1 74.3 73.9 73.4 72.8 73.8 74.4 74.4 74.3 73.8 75.1 73.9 United Kingdom 55.2 53.7 57.3 60.5 60.5 62.3 61.1 63.0 63.6 63.8 62.4 61.4 64.3 66.7 68.2 67.8 68.1 68.4 58.2 62.8 66.4 Canada 66.9 65.1 62.8 65.3 67.1 66.8 64.7 65.5 66.6 65.4 62.6 59.3 57.6 58.5 60.5 61.5 60.4 60.7 65.7 65.0 59.8
Australia 58.8 56.6 52.1 58.8 59.5 58.2 57.2 59.7 61.9 61.3 60.0 60.3 61.0 61.7 62.6 63.5 62.8 63.2 57.3 60.0 62.2 Austria 65.2 62.9 63.9 65.4 64.0 63.8 63.8 63.3 63.5 64.2 65.2 64.9 63.7 61.8 61.5 61.7 61.8 62.4 64.2 64.0 62.5 Belgium 72.1 71.6 72.6 72.5 73.5 74.1 74.5 74.3 74.3 75.4 74.2 73.8 73.1 73.3 73.6 73.9 74.3 74.2 72.7 74.6 73.7 Czech Republic .. .. .. .. .. .. .. .. .. .. .. .. 53.7 48.8 44.1 51.5 49.1 .. .. .. 49.4 Denmark 47.2 46.5 50.1 51.1 53.1 53.3 52.6 47.7 47.8 49.5 50.3 50.2 50.9 51.5 53.4 54.3 55.7 .. 50.2 49.6 52.7
Finland 58.3 56.4 57.8 57.7 58.2 56.3 55.5 55.1 55.5 55.3 51.3 42.8 44.9 50.4 54.7 58.5 59.0 61.8 57.4 54.6 53.2 Greece 83.8 83.4 83.1 81.6 82.0 81.9 81.3 81.0 81.8 81.3 80.5 81.9 82.0 82.6 82.4 82.3 .. .. 82.6 81.2 82.2 Hungary .. .. .. .. .. .. .. .. .. .. .. .. .. .. .. .. .. .. .. .. ..Iceland 50.1 49.5 45.6 53.1 58.8 54.2 56.3 55.8 53.2 54.8 57.8 54.6 54.8 54.3 56.8 54.7 53.9 55.8 51.9 55.6 55.0 Ireland 66.9 68.8 69.8 69.7 73.1 74.6 74.1 74.2 76.9 77.0 77.6 76.2 76.2 76.9 76.5 77.7 78.2 78.2 70.5 75.9 77.1
Korea 83.0 82.9 81.0 79.7 79.3 79.4 79.9 78.6 77.6 76.5 75.9 76.2 75.9 75.8 76.5 75.3 73.1 72.7 80.9 77.7 75.1 Luxembourg 50.0 47.7 54.2 54.7 56.0 53.6 56.7 55.4 59.9 62.4 60.3 59.4 56.5 59.1 61.7 60.6 60.6 61.8 52.7 58.9 60.0 Mexico 84.7 84.3 82.5 80.7 81.9 81.8 78.3 79.3 81.4 83.7 85.0 85.1 84.6 84.0 83.7 80.8 82.5 82.5 82.7 81.6 83.3 Netherlands 66.9 67.0 66.8 68.3 70.2 71.0 70.2 68.5 68.5 69.8 70.3 69.9 68.9 68.1 70.0 69.9 70.0 70.7 68.4 69.5 69.7 New Zealand 78.9 80.4 80.4 80.8 80.0 78.9 78.8 76.6 77.3 77.3 76.7 76.0 75.5 77.7 78.0 77.9 77.1 76.7 79.9 77.3 77.0
Norway 61.8 62.1 60.9 61.3 63.7 62.7 53.2 48.8 47.0 52.8 56.7 58.4 57.4 58.7 58.9 59.4 62.1 61.6 62.1 51.7 59.5 Poland .. .. .. .. .. .. .. .. .. .. .. .. .. .. .. .. .. .. .. .. ..Portugal 89.7 89.7 89.0 89.0 89.6 90.0 89.8 89.8 89.9 89.8 89.3 88.4 87.6 87.8 88.0 88.0 88.0 88.0 89.5 89.7 88.0 Spain 74.5 72.6 73.1 72.3 73.4 72.6 73.8 74.6 74.9 75.3 74.9 74.6 74.2 73.6 74.4 75.2 75.0 75.0 73.1 74.7 74.6 Sweden 52.7 51.1 54.6 55.6 57.5 56.0 55.7 54.4 54.1 51.7 47.2 48.0 51.9 53.5 57.7 63.0 58.4 58.9 54.6 52.6 55.9 Switzerland 58.6 57.6 55.6 53.4 56.2 54.4 53.1 50.2 48.6 47.0 46.6 43.5 43.3 45.0 47.9 48.9 50.0 51.5 56.0 49.1 47.2 Turkey 92.1 92.3 92.6 92.5 92.7 92.7 92.6 90.2 89.5 90.4 90.9 89.5 89.8 90.5 89.5 90.5 90.4 90.4 92.5 90.7 90.1
OECD average1 66.3 65.5 65.5 66.3 67.7 67.3 66.8 66.2 66.6 67.0 66.6 65.5 65.4 65.9 67.1 67.4 67.5 68.4 66.4 66.6 66.7 G7 average 63.8 62.4 62.0 63.1 64.4 64.9 65.0 65.4 66.0 65.8 64.9 63.8 63.4 63.5 64.4 64.6 64.9 65.1 63.4 65.4 64.2 EU average2 63.8 62.7 64.1 64.8 65.8 65.8 66.2 65.7 66.4 66.8 66.0 64.9 65.0 65.5 67.0 67.9 67.9 69.4 64.5 66.2 66.6
OECD1
Standard deviation 12.4 12.9 12.4 11.4 10.8 11.3 11.4 11.8 12.0 11.9 12.2 12.8 12.4 11.9 11.0 10.7 10.6 10.1 11.8 11.8 11.3
EU2
Standard deviation 11.6 12.0 10.6 10.2 10.1 10.6 10.4 11.2 11.0 11.0 11.7 12.4 11.6 10.7 9.6 9.1 9.2 8.3 10.8 11.0 10.1
1. Excluding Czech Republic and Greece.2. Excluding Greece.Source : Authors’ calculations based on OECD National Accounts.
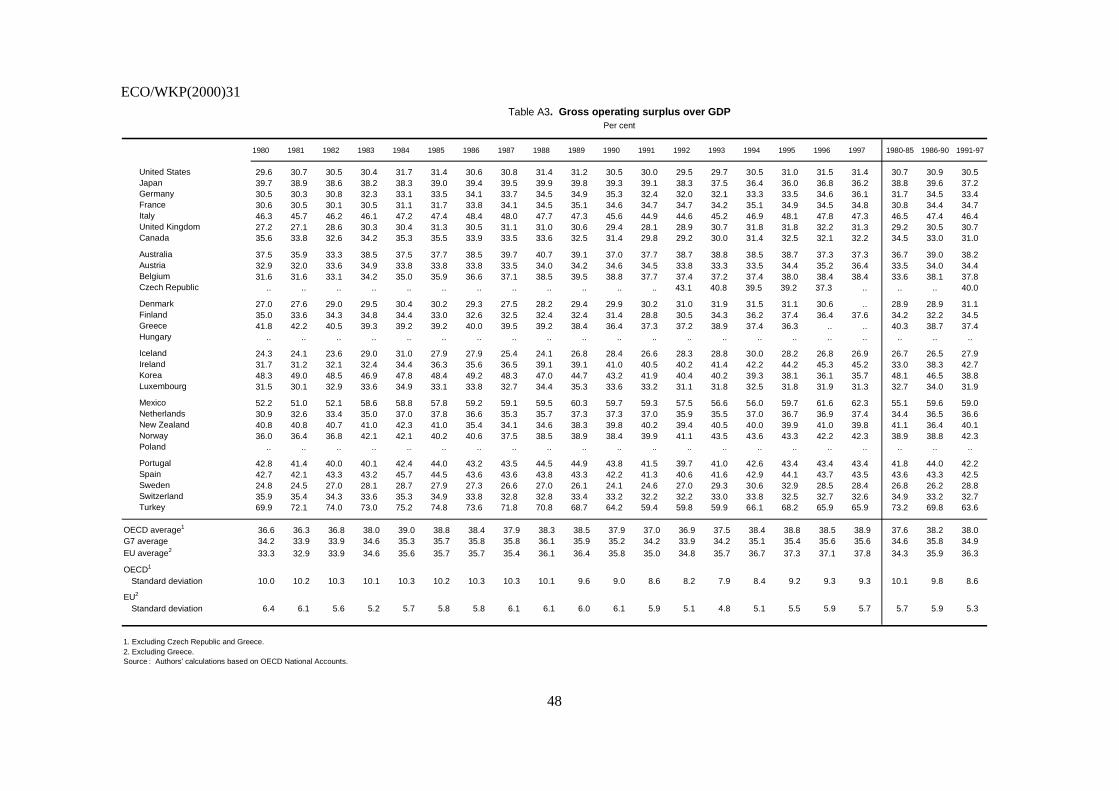
ECO/WKP(2000)31
48
Table A3. Gross operating surplus over GDPPer cent
1980 1981 1982 1983 1984 1985 1986 1987 1988 1989 1990 1991 1992 1993 1994 1995 1996 1997 1980-85 1986-90 1991-97
United States 29.6 30.7 30.5 30.4 31.7 31.4 30.6 30.8 31.4 31.2 30.5 30.0 29.5 29.7 30.5 31.0 31.5 31.4 30.7 30.9 30.5 Japan 39.7 38.9 38.6 38.2 38.3 39.0 39.4 39.5 39.9 39.8 39.3 39.1 38.3 37.5 36.4 36.0 36.8 36.2 38.8 39.6 37.2 Germany 30.5 30.3 30.8 32.3 33.1 33.5 34.1 33.7 34.5 34.9 35.3 32.4 32.0 32.1 33.3 33.5 34.6 36.1 31.7 34.5 33.4 France 30.6 30.5 30.1 30.5 31.1 31.7 33.8 34.1 34.5 35.1 34.6 34.7 34.7 34.2 35.1 34.9 34.5 34.8 30.8 34.4 34.7 Italy 46.3 45.7 46.2 46.1 47.2 47.4 48.4 48.0 47.7 47.3 45.6 44.9 44.6 45.2 46.9 48.1 47.8 47.3 46.5 47.4 46.4 United Kingdom 27.2 27.1 28.6 30.3 30.4 31.3 30.5 31.1 31.0 30.6 29.4 28.1 28.9 30.7 31.8 31.8 32.2 31.3 29.2 30.5 30.7 Canada 35.6 33.8 32.6 34.2 35.3 35.5 33.9 33.5 33.6 32.5 31.4 29.8 29.2 30.0 31.4 32.5 32.1 32.2 34.5 33.0 31.0
Australia 37.5 35.9 33.3 38.5 37.5 37.7 38.5 39.7 40.7 39.1 37.0 37.7 38.7 38.8 38.5 38.7 37.3 37.3 36.7 39.0 38.2 Austria 32.9 32.0 33.6 34.9 33.8 33.8 33.8 33.5 34.0 34.2 34.6 34.5 33.8 33.3 33.5 34.4 35.2 36.4 33.5 34.0 34.4 Belgium 31.6 31.6 33.1 34.2 35.0 35.9 36.6 37.1 38.5 39.5 38.8 37.7 37.4 37.2 37.4 38.0 38.4 38.4 33.6 38.1 37.8 Czech Republic .. .. .. .. .. .. .. .. .. .. .. .. 43.1 40.8 39.5 39.2 37.3 .. .. .. 40.0
Denmark 27.0 27.6 29.0 29.5 30.4 30.2 29.3 27.5 28.2 29.4 29.9 30.2 31.0 31.9 31.5 31.1 30.6 .. 28.9 28.9 31.1 Finland 35.0 33.6 34.3 34.8 34.4 33.0 32.6 32.5 32.4 32.4 31.4 28.8 30.5 34.3 36.2 37.4 36.4 37.6 34.2 32.2 34.5 Greece 41.8 42.2 40.5 39.3 39.2 39.2 40.0 39.5 39.2 38.4 36.4 37.3 37.2 38.9 37.4 36.3 .. .. 40.3 38.7 37.4 Hungary .. .. .. .. .. .. .. .. .. .. .. .. .. .. .. .. .. .. .. .. ..
Iceland 24.3 24.1 23.6 29.0 31.0 27.9 27.9 25.4 24.1 26.8 28.4 26.6 28.3 28.8 30.0 28.2 26.8 26.9 26.7 26.5 27.9 Ireland 31.7 31.2 32.1 32.4 34.4 36.3 35.6 36.5 39.1 39.1 41.0 40.5 40.2 41.4 42.2 44.2 45.3 45.2 33.0 38.3 42.7 Korea 48.3 49.0 48.5 46.9 47.8 48.4 49.2 48.3 47.0 44.7 43.2 41.9 40.4 40.2 39.3 38.1 36.1 35.7 48.1 46.5 38.8 Luxembourg 31.5 30.1 32.9 33.6 34.9 33.1 33.8 32.7 34.4 35.3 33.6 33.2 31.1 31.8 32.5 31.8 31.9 31.3 32.7 34.0 31.9
Mexico 52.2 51.0 52.1 58.6 58.8 57.8 59.2 59.1 59.5 60.3 59.7 59.3 57.5 56.6 56.0 59.7 61.6 62.3 55.1 59.6 59.0 Netherlands 30.9 32.6 33.4 35.0 37.0 37.8 36.6 35.3 35.7 37.3 37.3 37.0 35.9 35.5 37.0 36.7 36.9 37.4 34.4 36.5 36.6 New Zealand 40.8 40.8 40.7 41.0 42.3 41.0 35.4 34.1 34.6 38.3 39.8 40.2 39.4 40.5 40.0 39.9 41.0 39.8 41.1 36.4 40.1 Norway 36.0 36.4 36.8 42.1 42.1 40.2 40.6 37.5 38.5 38.9 38.4 39.9 41.1 43.5 43.6 43.3 42.2 42.3 38.9 38.8 42.3 Poland .. .. .. .. .. .. .. .. .. .. .. .. .. .. .. .. .. .. .. .. ..
Portugal 42.8 41.4 40.0 40.1 42.4 44.0 43.2 43.5 44.5 44.9 43.8 41.5 39.7 41.0 42.6 43.4 43.4 43.4 41.8 44.0 42.2 Spain 42.7 42.1 43.3 43.2 45.7 44.5 43.6 43.6 43.8 43.3 42.2 41.3 40.6 41.6 42.9 44.1 43.7 43.5 43.6 43.3 42.5 Sweden 24.8 24.5 27.0 28.1 28.7 27.9 27.3 26.6 27.0 26.1 24.1 24.6 27.0 29.3 30.6 32.9 28.5 28.4 26.8 26.2 28.8 Switzerland 35.9 35.4 34.3 33.6 35.3 34.9 33.8 32.8 32.8 33.4 33.2 32.2 32.2 33.0 33.8 32.5 32.7 32.6 34.9 33.2 32.7 Turkey 69.9 72.1 74.0 73.0 75.2 74.8 73.6 71.8 70.8 68.7 64.2 59.4 59.8 59.9 66.1 68.2 65.9 65.9 73.2 69.8 63.6
OECD average1 36.6 36.3 36.8 38.0 39.0 38.8 38.4 37.9 38.3 38.5 37.9 37.0 36.9 37.5 38.4 38.8 38.5 38.9 37.6 38.2 38.0 G7 average 34.2 33.9 33.9 34.6 35.3 35.7 35.8 35.8 36.1 35.9 35.2 34.2 33.9 34.2 35.1 35.4 35.6 35.6 34.6 35.8 34.9 EU average2 33.3 32.9 33.9 34.6 35.6 35.7 35.7 35.4 36.1 36.4 35.8 35.0 34.8 35.7 36.7 37.3 37.1 37.8 34.3 35.9 36.3
OECD1
Standard deviation 10.0 10.2 10.3 10.1 10.3 10.2 10.3 10.3 10.1 9.6 9.0 8.6 8.2 7.9 8.4 9.2 9.3 9.3 10.1 9.8 8.6
EU2
Standard deviation 6.4 6.1 5.6 5.2 5.7 5.8 5.8 6.1 6.1 6.0 6.1 5.9 5.1 4.8 5.1 5.5 5.9 5.7 5.7 5.9 5.3
1. Excluding Czech Republic and Greece.2. Excluding Greece.Source : Authors’ calculations based on OECD National Accounts.
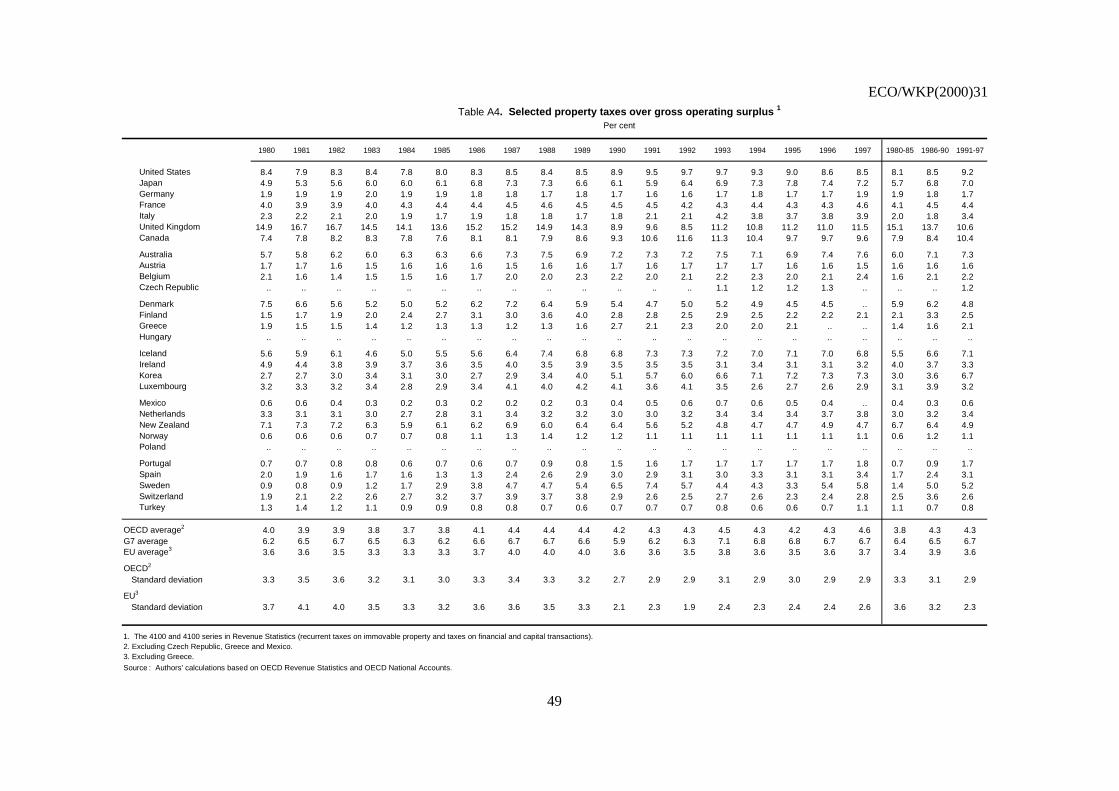
ECO/WKP(2000)31
49
Table A4. Selected property taxes over gross operating surplus 1
Per cent
1980 1981 1982 1983 1984 1985 1986 1987 1988 1989 1990 1991 1992 1993 1994 1995 1996 1997 1980-85 1986-90 1991-97
United States 8.4 7.9 8.3 8.4 7.8 8.0 8.3 8.5 8.4 8.5 8.9 9.5 9.7 9.7 9.3 9.0 8.6 8.5 8.1 8.5 9.2 Japan 4.9 5.3 5.6 6.0 6.0 6.1 6.8 7.3 7.3 6.6 6.1 5.9 6.4 6.9 7.3 7.8 7.4 7.2 5.7 6.8 7.0 Germany 1.9 1.9 1.9 2.0 1.9 1.9 1.8 1.8 1.7 1.8 1.7 1.6 1.6 1.7 1.8 1.7 1.7 1.9 1.9 1.8 1.7 France 4.0 3.9 3.9 4.0 4.3 4.4 4.4 4.5 4.6 4.5 4.5 4.5 4.2 4.3 4.4 4.3 4.3 4.6 4.1 4.5 4.4 Italy 2.3 2.2 2.1 2.0 1.9 1.7 1.9 1.8 1.8 1.7 1.8 2.1 2.1 4.2 3.8 3.7 3.8 3.9 2.0 1.8 3.4 United Kingdom 14.9 16.7 16.7 14.5 14.1 13.6 15.2 15.2 14.9 14.3 8.9 9.6 8.5 11.2 10.8 11.2 11.0 11.5 15.1 13.7 10.6 Canada 7.4 7.8 8.2 8.3 7.8 7.6 8.1 8.1 7.9 8.6 9.3 10.6 11.6 11.3 10.4 9.7 9.7 9.6 7.9 8.4 10.4
Australia 5.7 5.8 6.2 6.0 6.3 6.3 6.6 7.3 7.5 6.9 7.2 7.3 7.2 7.5 7.1 6.9 7.4 7.6 6.0 7.1 7.3 Austria 1.7 1.7 1.6 1.5 1.6 1.6 1.6 1.5 1.6 1.6 1.7 1.6 1.7 1.7 1.7 1.6 1.6 1.5 1.6 1.6 1.6 Belgium 2.1 1.6 1.4 1.5 1.5 1.6 1.7 2.0 2.0 2.3 2.2 2.0 2.1 2.2 2.3 2.0 2.1 2.4 1.6 2.1 2.2 Czech Republic .. .. .. .. .. .. .. .. .. .. .. .. .. 1.1 1.2 1.2 1.3 .. .. .. 1.2
Denmark 7.5 6.6 5.6 5.2 5.0 5.2 6.2 7.2 6.4 5.9 5.4 4.7 5.0 5.2 4.9 4.5 4.5 .. 5.9 6.2 4.8 Finland 1.5 1.7 1.9 2.0 2.4 2.7 3.1 3.0 3.6 4.0 2.8 2.8 2.5 2.9 2.5 2.2 2.2 2.1 2.1 3.3 2.5 Greece 1.9 1.5 1.5 1.4 1.2 1.3 1.3 1.2 1.3 1.6 2.7 2.1 2.3 2.0 2.0 2.1 .. .. 1.4 1.6 2.1 Hungary .. .. .. .. .. .. .. .. .. .. .. .. .. .. .. .. .. .. .. .. ..
Iceland 5.6 5.9 6.1 4.6 5.0 5.5 5.6 6.4 7.4 6.8 6.8 7.3 7.3 7.2 7.0 7.1 7.0 6.8 5.5 6.6 7.1 Ireland 4.9 4.4 3.8 3.9 3.7 3.6 3.5 4.0 3.5 3.9 3.5 3.5 3.5 3.1 3.4 3.1 3.1 3.2 4.0 3.7 3.3 Korea 2.7 2.7 3.0 3.4 3.1 3.0 2.7 2.9 3.4 4.0 5.1 5.7 6.0 6.6 7.1 7.2 7.3 7.3 3.0 3.6 6.7 Luxembourg 3.2 3.3 3.2 3.4 2.8 2.9 3.4 4.1 4.0 4.2 4.1 3.6 4.1 3.5 2.6 2.7 2.6 2.9 3.1 3.9 3.2
Mexico 0.6 0.6 0.4 0.3 0.2 0.3 0.2 0.2 0.2 0.3 0.4 0.5 0.6 0.7 0.6 0.5 0.4 .. 0.4 0.3 0.6 Netherlands 3.3 3.1 3.1 3.0 2.7 2.8 3.1 3.4 3.2 3.2 3.0 3.0 3.2 3.4 3.4 3.4 3.7 3.8 3.0 3.2 3.4 New Zealand 7.1 7.3 7.2 6.3 5.9 6.1 6.2 6.9 6.0 6.4 6.4 5.6 5.2 4.8 4.7 4.7 4.9 4.7 6.7 6.4 4.9 Norway 0.6 0.6 0.6 0.7 0.7 0.8 1.1 1.3 1.4 1.2 1.2 1.1 1.1 1.1 1.1 1.1 1.1 1.1 0.6 1.2 1.1 Poland .. .. .. .. .. .. .. .. .. .. .. .. .. .. .. .. .. .. .. .. ..
Portugal 0.7 0.7 0.8 0.8 0.6 0.7 0.6 0.7 0.9 0.8 1.5 1.6 1.7 1.7 1.7 1.7 1.7 1.8 0.7 0.9 1.7 Spain 2.0 1.9 1.6 1.7 1.6 1.3 1.3 2.4 2.6 2.9 3.0 2.9 3.1 3.0 3.3 3.1 3.1 3.4 1.7 2.4 3.1 Sweden 0.9 0.8 0.9 1.2 1.7 2.9 3.8 4.7 4.7 5.4 6.5 7.4 5.7 4.4 4.3 3.3 5.4 5.8 1.4 5.0 5.2 Switzerland 1.9 2.1 2.2 2.6 2.7 3.2 3.7 3.9 3.7 3.8 2.9 2.6 2.5 2.7 2.6 2.3 2.4 2.8 2.5 3.6 2.6 Turkey 1.3 1.4 1.2 1.1 0.9 0.9 0.8 0.8 0.7 0.6 0.7 0.7 0.7 0.8 0.6 0.6 0.7 1.1 1.1 0.7 0.8
OECD average2 4.0 3.9 3.9 3.8 3.7 3.8 4.1 4.4 4.4 4.4 4.2 4.3 4.3 4.5 4.3 4.2 4.3 4.6 3.8 4.3 4.3 G7 average 6.2 6.5 6.7 6.5 6.3 6.2 6.6 6.7 6.7 6.6 5.9 6.2 6.3 7.1 6.8 6.8 6.7 6.7 6.4 6.5 6.7 EU average3 3.6 3.6 3.5 3.3 3.3 3.3 3.7 4.0 4.0 4.0 3.6 3.6 3.5 3.8 3.6 3.5 3.6 3.7 3.4 3.9 3.6
OECD2
Standard deviation 3.3 3.5 3.6 3.2 3.1 3.0 3.3 3.4 3.3 3.2 2.7 2.9 2.9 3.1 2.9 3.0 2.9 2.9 3.3 3.1 2.9
EU3
Standard deviation 3.7 4.1 4.0 3.5 3.3 3.2 3.6 3.6 3.5 3.3 2.1 2.3 1.9 2.4 2.3 2.4 2.4 2.6 3.6 3.2 2.3
1. The 4100 and 4100 series in Revenue Statistics (recurrent taxes on immovable property and taxes on financial and capital transactions). 2. Excluding Czech Republic, Greece and Mexico.3. Excluding Greece.
Source : Authors’ calculations based on OECD Revenue Statistics and OECD National Accounts.

ECO/WKP(2000)31
50
Table A5. Business and corporate taxes in selected countries1
Per cent of GDP
Business taxes in 1100 Corporate taxes (1200)2
1980-85 1986-90 1991-97 1980-85 1986-90 1991-97Japan 0.04 0.05 0.05 5.49 6.86 4.68Germany 0.89 0.88 0.69 2.03 2.01 1.37Italy 0.03 0.07 0.05 2.97 3.75 3.93Austria 0.87 0.78 0.55 1.33 1.46 1.68
1. These countries have business taxes that are included in the 1100 series (taxes on income, profits and capital gains of individuals) of Revenue Statistics.2. The 1200 series in Revenue Statistics (taxes on income, profit and capital gains of corporations).Source : Authors’ calculations based on national sources, OECD Revenue Statistics and OECD National Accounts.
ECO/WKP(2000)31
51
BIBLIOGRAPHY
AUERBACH, A. J. (1987), “Corporate taxation in the United States”, in Economic Policy in Theory andPractice, ed. by A. Razin and E. Sadka, Machmillan, London.
BARRO, R. J. and C. SAHASAKUL (1983), “Measuring the average marginal tax rate from individualincome tax”, Journal of Business 56, pp. 419-452, October.
EASTERLY, W. and S. RABELO (1993), “Fiscal policy and economic growth: an empiricalinvestigation”, Journal of Monetary Economics 32, pp. 417-58.
EUROPEAN COMMISSION (1997), “Effective taxation and tax convergence in the EU and the OECD”,Background paper - Note for the Economic and Policy Committee, Brussels, 2 December 1997,Reference: II/603/97, EN/REV.2.
JOINES, D. H. (1981), “Estimates of effective amrginal tax rates on factor incomes”, Journal ofBusiness 54, No.2.
KESTI, J. (managing editor), P. S. ANDERSON and C. SWANHAGEN (editors) (1999), European taxHandbook, International Bureau of Fiscal Documentation.
KING, M. and D. FULLERTON (1984), The Taxation of Income from Capital, M. King and D. Fullerton(eds.) University of Chicago Press.
LUCAS Jr, R. E. (1990), “Supply-side economics: an analytical review”, Oxford Economic Papers 42,pp. 293-316.
LUCAS Jr, R. E. (1991), “Topic in public finance”, unpublished lecture notes (Spring), University ofChicago.
McKEE, M.J., J. J. C. VISSER and P. G. SAUNDERS (1986), “Marginal tax rates on the use of labour andcapital in OECD countries”, OECD Economic Studies, No. 7, Autumn, pp. 45-152.
MENDOZA, E. G., A. RAZIN and L. L. TESAR (1994), “Effective tax rates in macroeconomics:cross-country estimates of tax rates on factor incomes and consumption”, NBER Working Paper,No. 4864, September.
OECD (1991), Taxing Profits in a Global Economy: Domestic and International Issues, Paris.
OECD (1992), Methods used by OECD countries to measure stock of capital, December.
OECD (1994), The Taxation of Household Savings, Paris.
OECD (1999a), Revenue Statistics, Paris.

ECO/WKP(2000)31
52
OECD (1999b), National Accounts, Paris.
OECD (2000a), Tax Burdens: Alternative Measures, OECD Tax Policy Studies, No. 2.
OECD (2000b), Effective Tax Rates: A Critical Survey, OECD Tax Policy Studies, No. 5.
RAZIN, A. and E. SADKA (1993), The Ecoomy of Modern Israel: Malaise and Promise, University ofChicago Press, Chicago, IL.
RUGGERI, G. C., M. LAROCHE and C. VINCENT (1997), “Effective Income Tax Rates inMacroeconomics: An Update for Canada”, Canadian Department of Finance, Economic Studies andPolicy Analysis Diviison Working Paper, No. 97-05, May.
SEATER, J. J. (1982), “Marginal federal personal and corporate income tax rates in the United States:1909-75”, Journal of Monetary Economics” 10, pp. 361-81.
VALENDUC, C. (1996), “Taxation du travail, du capital et de la consommation dans les pays de l’Unioneuropéenne”, Rapport de synthèse, Commission européenne Task Force Prélèvements obligatoires,DG XX1, July.

ECO/WKP(2000)31
53
ECONOMICS DEPARTMENT
WORKING PAPERS
257. The Health Care System in Poland(September 2000) Nathalie Girouard and Yutaka Imai
256. Public Expenditure Reform: The Health Care Sector in the United Kingdom(August 2000) Vincent Koen
255. Regulatory Reform in Road Freight and Retail Distribution(August 2000) Olivier Boylaud
254. Regulation, Market Structure and Performance in Air Passenger Transportation(August 2000) Rauf Gonenc and Giuseppe Nicoletti
253. Policy Interdependence during Economic Transition: the Case of Slovakia 1999-2000(June 2000) Joaquim Oliveira Martins and Tristan Price
252. E-Commerce: Impacts and Policy Challenges(June 2000) Jonathan Coppel
251. The Implementation and the Effects of Regulatory Reform: Past Experience and Current Issues(June 2000) Rauf Gonenc, Maria Maher and Giuseppe Nicoletti
250. The Concept, Policy Use and Measurement of Structural Unemployment: Estimating a Time Varying NAIRUacross 21 OECD Countries(June 2000) Pete Richardson, Laurence Boone, Claude Giorno, Mara Meacci, David Rae and David Turner
249. Options for Reforming the Spanish Tax System(June 2000) Isabelle Joumard and Aristomène Varoudakis
248. Economic Growth in the OECD Area: Recent Trends at the Aggregate and Sectoral Level(June 2000) Stefano Scarpetta, Andrea Bassanini, Dirk Pilat and Paul Schreyer
247. Economic Effects on the 1999 Turkish Earthquakes: an Interim Report(June 2000) Alexandra Bibbee, Rauf Gonenc, Scott Jacobs, Josef Konvitz and Robert Price
246. Policy Influences on Economic Growth in OECD Countries: an Evaluation of the Evidence(June 2000) Sanghoon Ahn and Philip Hemmings
245. The Tax System in the Czech Republic(May 2000) Chiara Bronchi and Andrew Burns
244. The Tax System in Norway: Past Reforms and Future Challenges(May 2000) Paul van den Noord
243. A Changing Financial Environment and the Implications for Monetary Policy(May 2000) Paul Mylonas, Sebastian Schich, Gert Wehinger
ECO/WKP(2000)31
54
242. Carbon Emission Leakages: a General Equilibrium View(May 2000) Jean-Marc Burniaux and Joaquim Oliveira Martins
241. The Healthcare System in Hungary(April 2000) Eva Orosz and Andrew Burns
240. Comparing Semi-Structural Methods to Estimate Unobserved Variables: the HPMV and Kalman FiltersApproaches(April 2000) Laurence Boone
239. New Issues in Public Debt Management: Government Surpluses in Several OECD Countries, the CommonCurrency in Europe and Rapidly Rising Debt in Japan(April 2000) Paul Mylonas, Sebastian Schich, Thorsteinn Thorgeirsson and Gert Wehinger
238. Regulation, Industry Structure and Performance in the Electricity Supply Industry(April 2000) Faye Steiner
237. Regulation, Market Structure and Performance in Telecommunications(April 2000) Olivier Boylaud and Giuseppe Nicoletti
236. Predicting the Evolution and Effects of the Asia Crisis from the OECD Perspective(April 2000) Pete Richardson, Ignazio Visco and Claude Giorno
235. Modelling Manufacturing Export Volumes EquationsA System Estimation Approach(April 2000) Keiko Murata, David Turner, David Rae and Laurence Le Fouler
234. The Polish Tax Reform(March 2000) Patrick Lenain and Leszek Bartoszuk
233. The Tax System in Mexico: a Need for Strengthening the Revenue Raising Capacity(March 2000) Thomas Dalsgaard
232. EMU, the Euro and the European Policy Mix(February 2000) Jonathan Coppel, Martine Durand and Ignazio Visco
231. The Tax System in Japan: a Need for Comprehensive Reform(February 2000) Thomas Dalsgaard and Masaaki Kawagoe
230. The Size and Role of Automatic Fiscal Stabilisers in the 1990s and Beyond(January 2000) Paul van den Noord
229. Enhancing Environmentally Sustainable Growth in Finland(January 2000) Ann Vourc’h and Miguel Jimenez
228. Finance and Growth: Some Theoretical Considerations, and a Review of the Empirical Literature(January 2000) Kotaro Tsuru
227. What the Yield Curves Say about Inflation: Does It Change over Time?(December 1999) Sebastian Schich
226. Summary Indicators of Product Market Regulation with an Extension to Employment Protection Legislation(December 1999) Giuseppe Nicoletti, Stefano Scarpetta and Olivier Boylaud