Effect of Timely Treatment on Malaria Gametocytemia in ...
153
University of South Florida Scholar Commons Graduate eses and Dissertations Graduate School September 2015 Effect of Timely Treatment on Malaria Gametocytemia in Esmeraldas, Ecuador Miguel Reina-Ortiz University of South Florida, [email protected] Follow this and additional works at: hp://scholarcommons.usf.edu/etd Part of the Epidemiology Commons is Dissertation is brought to you for free and open access by the Graduate School at Scholar Commons. It has been accepted for inclusion in Graduate eses and Dissertations by an authorized administrator of Scholar Commons. For more information, please contact [email protected]. Scholar Commons Citation Reina-Ortiz, Miguel, "Effect of Timely Treatment on Malaria Gametocytemia in Esmeraldas, Ecuador" (2015). Graduate eses and Dissertations. hp://scholarcommons.usf.edu/etd/5765
-
Upload
khangminh22 -
Category
Documents
-
view
0 -
download
0
Transcript of Effect of Timely Treatment on Malaria Gametocytemia in ...

University of South FloridaScholar Commons
Graduate Theses and Dissertations Graduate School
September 2015
Effect of Timely Treatment on MalariaGametocytemia in Esmeraldas, EcuadorMiguel Reina-OrtizUniversity of South Florida, [email protected]
Follow this and additional works at: http://scholarcommons.usf.edu/etd
Part of the Epidemiology Commons
This Dissertation is brought to you for free and open access by the Graduate School at Scholar Commons. It has been accepted for inclusion inGraduate Theses and Dissertations by an authorized administrator of Scholar Commons. For more information, please [email protected].
Scholar Commons CitationReina-Ortiz, Miguel, "Effect of Timely Treatment on Malaria Gametocytemia in Esmeraldas, Ecuador" (2015). Graduate Theses andDissertations.http://scholarcommons.usf.edu/etd/5765

Effect of Timely Treatment on Malaria Gametocytemia in Esmeraldas, Ecuador
by
Miguel E. Reina-Ortiz
A dissertation submitted in partial fulfillment
of the requirements for the degree of
Doctor of Philosophy Department of Global Health
College of Public Health
University of South Florida
Major Professor: Ricardo Izurieta, M.D., Dr.P.H.
Jaime Corvin, Ph.D.
Mauricio Espinel, Ph.D.
Boo Kwa, Ph.D. Wilbur Milhous, Ph.D.
Date of Approval:
July 8, 2015
Keywords: early malaria treatment, malaria transmission, malaria control, malaria elimination
Copyright © 2015, Miguel E. Reina-Ortiz

Dedication
This work is dedicated to my beloved wife, Vinita, who has been thrilled with me at every
moment of this exciting journey. It is indeed a blessing to share with you my every path, my every
minute. You are my perfect companion. I have also received true inspiration and constant support from
my mother, Gloria, to whom this work is also dedicated. You showed me the value of hard work and
perseverance and the importance of love and dedication. I am truly thankful to my siblings Italo, Anita,
Andres and Liena, who have been with me at every step of the way; this work would not have been
possible without your support. Ama, Bua, you have been a blessing in my life as well and I am truly
thankful for all that you have done for us. Father, where would I go without you? You are my strength
and my support, my Alpha and my Omega. It is your love which consistently moves me forward and
spark every day that desire to serve, for which I am thankful. I will never be able to completely express all
my gratitude to you all. Thank you very much indeed.

Acknowledgments
It would not have been possible to complete this work without the continuous guidance and
support of all the doctoral dissertation committee members, a heartfelt thank you to all of you. Dr.
Ricardo Izurieta has been much more than an advisor and professor, he has demonstrated at all times his
unparalleled sincerity, kindness, skillfulness, wisdom and passion for public health, for teaching and for
helping others selflessly. It has been a tremendous blessing to count you as my advisor and guide
throughout this process. I have no words to thank you. Dr. Boo Kwa has always been supportive,
welcoming and willing to provide insightful guidance not only in the scientific and technical aspects
required to complete this dissertation but also in broad aspects of life. For this, I thank you. A profound
gratitude to Dr. Jaime Corvin for being a constant source of positive criticism encouraging self-
improvement and high standards in addition to the invaluable support along these years of preparation.
Dr. Mauricio Espinel provided with crucial insights that helped understand the context in which these
results ought to be read and was also available for multiple consultations. Thank you Mauricio for
demonstrating what passion for public health research can accomplish for our Ecuador when well-
intentioned hearts embark in this enterprise. Dr. Wilbur Milhous’ ability to guide and impart knowledge
in the most subtle and effective ways has been a source of inspiration during this journey. Dr. Richard
Nisbett, whom served in my academic committee, showed me the importance of understanding the
complexities arousing from myriad of factors and the necessity for applying methods based on
community participation and real collaboration. These are lessons that will have a great impact on many
different aspects of my life. Thanks Dr. Thomas Mason, for graciously accepting to be part of the
examining committee. In this very short time I learned how much I wish I had spent more time under your
guidance. Although Dr. Benjamin Jacob, Dr. Rajaram Lakshminarayan and Dr. Alfred Mbah were not

part of my committee, they provided insightful comments on statistics and were always willing to provide
help; for that I thank them all immensely. I would also like to acknowledge the valuable support and
guidance of other faculty members that did not participate as committee members but who were
instrumental in my completion of this dissertation; thank you Dr. Julie Baldwin, Dr. Ismael Hoare, Dr.
Kay Perrin and Dr. Thomas Unnasch.
This document reflects partially a piece of history that is written on a daily basis by
anonymous heroes who relentlessly battle every day to bring the grasp of malaria to an end. I want to
salute those heroes. Firstly, I would like to recognize the tremendous effort of an army of community
health volunteers and workers whose names I may not know but whose work made possible that malaria
diagnosis and treatment reaches further and further every year. You are indeed true heroes. I would also
like to thank Richard Castillo for his support in the field in Esmeraldas. Also, I would like to thank
Mauricio Quiñónez and Dr. Cesar Díaz for their hard work in aggregating the data and for their kind
collaboration throughout this research. The pivotal support provided by Dr. Julio Valencia, director of the
local SNEM office, needs to be recognized and thanked. In the national headquarters, I would like to
thank Dr. Wilfrido Torres and Dr. Shirley Yépez for their important collaboration in this research. To all
of you thank you very much.
I would like to thank all the friends whom I met during these years in the university and who
unknowingly were a source of strength to accomplish this work. A great thank you goes to all my friends
who are miles away from Florida but not even an inch away from my heart. Your constant friendship has
made this journey even more pleasant. I would like to thank to all my large and extended family, so
numerous that I cannot possibly write all of your names here. Each one of your calls, messages, thoughts
and prayers lifted me beyond my capabilities. Thank you all.
Finally, I want to warmly remember all those who suffer from malaria even as I write this letters.
My prayer is that this small contribution may serve to help alleviate the suffering and that we, as a
scientific and global community, will be able to offer you the tools needed to extinguish this malady that

afflicts you. May one day we declare a world free of malaria. May the Lord helps us reach there and, in
the meantime, gives us the strength we need.

i
Table of Contents
List of Tables ......................................................................................................................................... iv List of Figures ........................................................................................................................................ vi
List of Abbreviations .............................................................................................................................. ix
Glossary ................................................................................................................................................. xi
Abstract ................................................................................................................................................ xiii
Chapter One: Background ....................................................................................................................... 1 1.1 Malaria definition .................................................................................................................. 1 1.2 Epidemiology ........................................................................................................................ 1
1.2.1 Global and Regional Epidemiology ........................................................................ 1 1.2.2 Malaria in Ecuador ................................................................................................ 3
1.2.2.1 Progress on malaria control in Ecuador: a review of epidemiological indicators ........................................................................... 5
1.2.2.2 Ecuador's National Malaria Control Program: a brief description ............ 7
1.2.3 Malaria in Esmeraldas Province ........................................................................... 10 1.3 Life cycle ............................................................................................................................ 15
1.3.1 Plasmodium falciparum life cycle ........................................................................ 19 1.3.2 Plasmodium vivax life cycle ................................................................................. 20 1.3.3 Comparing P. falciparum and P. vivax life cycles................................................. 21
1.4 Biologic factors affecting malaria transmission .................................................................... 24 1.4.1 Gametocytic dynamics ......................................................................................... 24 1.4.2 Dynamics of the sexual and asexual parasite populations...................................... 26 1.4.3 Gametocytes and their role in primary and recrudescent infections ....................... 26
1.5 Timely malaria treatment..................................................................................................... 28 1.6 Environmental factors associated with malaria transmission ................................................ 31
1.6.1 Rainfall… .. .......................................................................................................... 31 1.6.2 Humidity. ….. ...................................................................................................... 32 1.6.3 Temperature ........................................................................................................ 32 1.6.4 Vegetation ........................................................................................................... 33 1.6.5 Aquatic Habitats .................................................................................................. 33 1.6.6 Hydrographic modifications ................................................................................. 33 1.6.7 Deforestation and road construction ..................................................................... 36
1.7 Socioeconomic factors associated with malaria transmission ............................................... 36 1.7.1 Agriculture .......................................................................................................... 37 1.7.2 Aquaculture and Shrimp farming ......................................................................... 40 1.7.3 Population Density and Human Migration ............................................................ 41 1.7.4 Globalization and modern transportation .............................................................. 42 1.7.5 Urbanization ........................................................................................................ 42

ii
Chapter Two: Justification, Hypotheses and Objectives ......................................................................... 44 2.1 Justification ......................................................................................................................... 44 2.2 Hypotheses ......................................................................................................................... 45
2.2.1 Primary hypothesis .............................................................................................. 45 2.2.2 Secondary hypothesis........................................................................................... 45
2.3 Objectives ........................................................................................................................... 45 2.3.1 General… ............................................................................................................ 45 2.3.2 Specific… ............................................................................................................ 45
Chapter Three: Materials and Methods .................................................................................................. 46
3.1 Study design ....................................................................................................................... 46 3.1.1 Retrospective Cohort ........................................................................................... 46 3.1.2 Ecologic Study..................................................................................................... 48
3.2 Study population ................................................................................................................. 49 3.3 Operational definition of the study variables ........................................................................ 50
3.3.1 Retrospective Cohort ........................................................................................... 50 3.3.2 Ecologic Study..................................................................................................... 51
3.4 Sample size ......................................................................................................................... 52 3.5 Data collection .................................................................................................................... 52 3.6 Data analysis ....................................................................................................................... 53
3.6.1 Retrospective Cohort ........................................................................................... 53 3.6.2 Ecologic Study..................................................................................................... 54
3.7 Confidentiality and ethical considerations............................................................................ 54 3.8 Dissemination of results ...................................................................................................... 55 3.9 Risks and benefits ............................................................................................................... 55
Chapter Four: Retrospective Cohort ....................................................................................................... 56
4.1 Baseline characteristics of study population ......................................................................... 56 4.2 General characteristics ........................................................................................................ 59
4.2.1 Malaria Diagnosis ................................................................................................ 59 4.2.2 Malaria Treatment ............................................................................................... 62 4.2.3 Malaria follow-up visits ....................................................................................... 63
4.3 Effect of timely treatment on asexual malaria parasitemia during follow-up visits. ............... 63 4.4 Effect of timely treatment on malaria gametocytemia during follow-up visits ...................... 65
4.4.1 Binary probability distribution-based analysis ...................................................... 65 4.4.2 Effect of timely treatment on total number of follow-up visits with
gametocytemia ....................................................................................................... 66 4.4.3 Effect of timely treatment on gametocyte density at follow-up visits 1, 2,
and 5…….. ............................................................................................................ 69 4.4.4 Survival analysis for gametocyte clearance by treatment arm classification
group………. ......................................................................................................... 71 4.4.5 Evaluating a potential effect of timely malaria treatment on transmissibility ......... 73
Chapter Five: Parish-level Ecologic Study ............................................................................................. 76
5.1 Preliminary data .................................................................................................................. 76 5.2 Baseline characteristics ....................................................................................................... 77 5.3 General characteristics of malaria transmission in Esmeraldas ............................................. 79
5.3.1 Gametocytemia .................................................................................................... 79 5.3.2 Number of cases .................................................................................................. 81 5.3.3 Incidence Rates .................................................................................................... 82
5.4 Effect of timely malaria treatment on malaria transmission in Esmeraldas ........................... 85

iii
Chapter Six: Nationwide Ecologic Study ............................................................................................... 91 6.1 Preliminary data .................................................................................................................. 91 6.2 Baseline characteristics ....................................................................................................... 92 6.3 General characteristics of malaria transmission in Ecuador .................................................. 94
6.3.1 Number of cases .................................................................................................. 94 6.3.2 Incidence rates ..................................................................................................... 95
6.4 Effect of timely malaria treatment on malaria transmission in Ecuador ................................ 97
Chapter Seven: Discussion .................................................................................................................... 99 7.1 General discussion .............................................................................................................. 99 7.2 Conclusion ........................................................................................................................ 112 7.3 Public Health relevance and recommendations .................................................................. 113
References........................................................................................................................................... 115
Appendix A: IRB Approval Letter ....................................................................................................... 128
Appendix B: IRB Amendment 1 Approval Letter ................................................................................ 130 Appendix C: IRB Amendment 2 Approval Letter ................................................................................ 131
Appendix D: SNEM Esmeraldas Approval Letter ................................................................................ 132

iv
List of Tables
Table 1. Number of cases of malaria by parasite species and year in Ecuador (2001-2014) ................. 5
Table 2. Reported malaria cases by parasite species in Esmeraldas and Ecuador (2010) .................... 10 Table 3. Number of cases of malaria by parasite species and year in Esmeraldas (2001-2015) .......... 11
Table 4. Plasmodium falciparum and Plasmodium vivax life cycle characteristics............................. 21
Table 5. Gametocytemia at diagnosis in percentage by days from onset of symptoms ....................... 25 Table 6. Gametocytemia at diagnosis by parasite species and by time from onset of symptoms ......... 25
Table 7. Study activities ................................................................................................................... 47 Table 8. List of urban and rural parishes in the province of Esmeraldas by district ............................ 50
Table 9. Operational definition of main variables for the retrospective cohort study .......................... 51
Table 10. Operational definition of main variables for the ecologic study ........................................... 52 Table 11. Baseline characteristics of study population by treatment arm ............................................. 58
Table 12. Parasitological characteristics at diagnosis .......................................................................... 59 Table 13. Malaria species diagnosed by treatment arm ....................................................................... 59
Table 14. Parasite density at diagnosis by treatment arm ..................................................................... 60
Table 15. Parasite density at diagnosis, defined as two categories, by treatment arm ........................... 61
Table 16. Gametocytemia at diagnosis by treatment arm .................................................................... 61
Table 17. Graphic prescription by treatment arm ................................................................................ 62 Table 18. Treatment appropriateness by treatment arm ....................................................................... 62
Table 19. Stepwise backward logistic regression model for the presence of trophozoites at any point during follow-up ........................................................................................................ 64
Table 20. Presence of gametocytemia during follow-up by treatment arm ........................................... 65 Table 21. Logistic regression model for detectable gametocytemia at any point during follow-
up ....................................................................................................................................... 66

v
Table 22. Total number of follow-up visits with detectable gametocytemia by treatment arm ............. 66
Table 23. Comparison of the mean number of follow-up visits with detectable gametocytemia
by treatment arm ................................................................................................................. 67 Table 24. Linear regression model for total number of follow-up visits with detectable
gametocytemia ................................................................................................................... 67 Table 25. Poisson log linear regression model for total number of follow-up visits with
detectable gametocytemia ................................................................................................... 68 Table 26. Negative binomial regression model for total number of follow-up visits with
detectable gametocytemia ................................................................................................... 68
Table 27. Gametocyte density by follow-up visit and treatment arm ................................................... 70
Table 28. Linear regression model for period of transmissibility ......................................................... 75 Table 29. Percentage of patients developing gametocytemia during follow-up by parish and
period ................................................................................................................................. 80 Table 30. Malaria cases by parish of origin ......................................................................................... 81
Table 31. Malaria incidence rate by parish and period ........................................................................ 84 Table 32. Repeated measures negative binomial regression for number of malaria cases in
subsequent periods .............................................................................................................. 90 Table 33. Baseline characteristics of nationwide study population ...................................................... 92
Table 34. Malaria cases by province ................................................................................................... 94

vi
List of Figures
Figure 1. Reported malaria-related deaths in Africa and the Americas (1990-2010) .............................. 2
Figure 2. Malaria incidence rates by parasite species and province in mainland Ecuador (2010) ........... 4 Figure 3. Malariometric indices in Ecuador (1998-2010)...................................................................... 6
Figure 4. Malaria diagnosis indices in Ecuador (1998-2010) ................................................................ 7
Figure 5. Algorithm of malaria diagnosis, epidemiological control and data management
activities by SNEM in Ecuador ............................................................................................. 9
Figure 6. Malaria cases by parasite species and parish in Esmeraldas, Ecuador (2011) ....................... 13
Figure 7. Land Use Land Cover classification (LULC) of malaria transmission areas in Esmeraldas Province ........................................................................................................... 14
Figure 8. Hot Spot analysis of malaria cases in Esmeraldas Province ................................................. 15
Figure 9. Malaria life cycle ................................................................................................................ 17 Figure 10. Timeline of main events in the course of P. falciparum infections ....................................... 21
Figure 11. Timeline of main events in the course of P. vivax infections ................................................ 23 Figure 12. Treatment failure probabilities for ACT regime vs. sulfadoxine-pyrimethamine .................. 30
Figure 13. Study timeline for the retrospective cohort study ................................................................. 46
Figure 14. Variable matrix for the retrospective cohort study ............................................................... 48
Figure 15. Variable matrix for the ecologic study................................................................................. 49
Figure 16. Study population by treatment arm...................................................................................... 57 Figure 17. Time to treatment by gametocyte status at diagnosis (Day 0). .............................................. 61
Figure 18. Number of follow-up visits completed per treatment arm .................................................... 63
Figure 19. Percentage of patients with trophozoites by follow-up visit and treatment arm .................... 64
Figure 20. Temporal trends for presence of gametocytemia by treatment arm ...................................... 69
Figure 21. Gametocytemia at follow-up visits 1, 2 and 3 by treatment arm ........................................... 71

vii
Figure 22. Kaplan-Meier survival analysis for gametocytemia ............................................................. 72 Figure 23. Cumulative hazard function by treatment arm group ........................................................... 72
Figure 24. Period of transmissibility by time to treatment and treatment arm ........................................ 73 Figure 25. Period of transmissibility by treatment arm ......................................................................... 74
Figure 26. Temporal trends of number of malaria cases in Esmeraldas, Ecuador (2001-2014) .............. 76
Figure 27. Malaria cases by treatment arm and period of diagnosis in Esmeraldas, Ecuador
(2012-2015) ........................................................................................................................ 77
Figure 28. Geospatial distribution of malaria cases by season, parish and year in Esmeraldas
(2012-2015) ........................................................................................................................ 78 Figure 29. Percentage of patients with gametocytes by period and treatment arm ................................. 79
Figure 30. Percentage of patients developing gametocytemia by parish and period ............................... 80
Figure 31. Number of cases reported by parish and period ................................................................... 82 Figure 32. Parishes by malaria incidence rate and treatment arm in Esmeraldas (Jul 2012 - Dec
2013) .................................................................................................................................. 83
Figure 33. Parishes by malaria incidence rate and treatment arm in Esmeraldas (Jan 2014 - Mar 2015) .................................................................................................................................. 83
Figure 34. Malaria transmission on periods subsequent to period 2013-A by treatment arm.................. 86
Figure 35. Number of malaria cases by treatment arm at period 2013-A (Period 2013-A – Period
2015-A) .............................................................................................................................. 87 Figure 36. Malaria incidence rate by treatment arm at period 2013-A (Period 2013-A – Period
2015-A) .............................................................................................................................. 88 Figure 37. Number of malaria cases by parish and gametocyte during follow-up at period 2013-
A (Period 2013-A – Period 2015-A).................................................................................... 89 Figure 38. Number of malaria cases by gametocyte during follow-up at period 2013-A (Period
2013-A – Period 2015-A) ................................................................................................... 89
Figure 39. Temporal trends of number of malaria cases in Ecuador (2001-2014) .................................. 91
Figure 40. Malaria cases by period of diagnosis and treatment arm in Ecuador (Feb 2012 – Dec
2014) .................................................................................................................................. 93
Figure 41. Number of cases reported by province and period ............................................................... 95 Figure 42. Provinces by malaria incidence rate and treatment arm (Feb 2012 – Jun 2013) .................... 96

viii
Figure 43. Provinces by malaria incidence rate and treatment arm (Jul 2013 – Dec 2014) .................... 96 Figure 44. Number of malaria cases among provinces by treatment arm at period 2013-A
(Period 2013-A – 2014-B) .................................................................................................. 97
Figure 45. Malaria incidence rate among provinces by treatment arm at period 2013-A (Period 2013-B – 2014-B) ............................................................................................................... 98
Figure 46. Proposed model of a timeline from early treatment to malaria control ............................... 111
ix
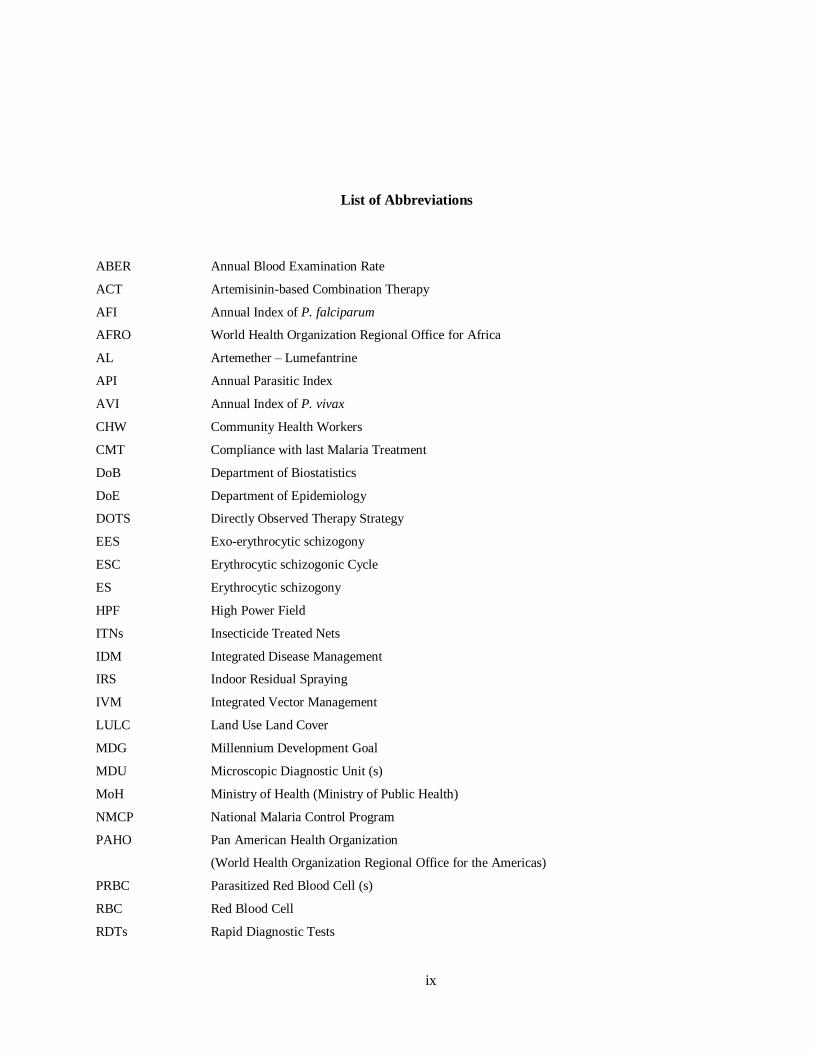
List of Abbreviations
ABER Annual Blood Examination Rate
ACT Artemisinin-based Combination Therapy
AFI Annual Index of P. falciparum
AFRO World Health Organization Regional Office for Africa
AL Artemether – Lumefantrine
API Annual Parasitic Index
AVI Annual Index of P. vivax
CHW Community Health Workers
CMT Compliance with last Malaria Treatment
DoB Department of Biostatistics
DoE Department of Epidemiology
DOTS Directly Observed Therapy Strategy
EES Exo-erythrocytic schizogony
ESC Erythrocytic schizogonic Cycle
ES Erythrocytic schizogony
HPF High Power Field
ITNs Insecticide Treated Nets
IDM Integrated Disease Management
IRS Indoor Residual Spraying
IVM Integrated Vector Management
LULC Land Use Land Cover
MDG Millennium Development Goal
MDU Microscopic Diagnostic Unit (s)
MoH Ministry of Health (Ministry of Public Health)
NMCP National Malaria Control Program
PAHO Pan American Health Organization
(World Health Organization Regional Office for the Americas)
PRBC Parasitized Red Blood Cell (s)
RBC Red Blood Cell
RDTs Rapid Diagnostic Tests

x
SAS Statistical Analysis System
SNEM Servicio Nacional de Erradicación de la Malaria (National Malaria Eradication Service, the
official name of Ecuador’s National Malaria Control Program)
SPR Slide Positivity Rate
SPSS Statistical Package for the Social Sciences (IBM SPSS Statistics Software)
WHO World Health Organization

xi
Glossary
Annual Blood Examination Rate. A measure of diagnostic efforts; it is calculated as a rate of
the number of all patients who receive parasitological testing per 100 people at risk per year. In
order to be able to discern decreases in malaria trends, the ABER should be sustained or
increased.
Annual Parasitic Index. A measured of the intensity of malaria; it is calculated as the number of
confirmed cases in a year divided per 1,000 people under surveillance.
Annual Index for P. falciparum. Similar to the API, only that it measures only cases of P.
falciparum.
Annual Index for P. vivax. Similar to the API, only that it measures only cases of P. vivax
Malariometric indices. Series of epidemiological indicators used to monitor progress on malaria
elimination and control.
Monotonic. In a trend, refers to the quality of being constantly and entirely either increasing or
decreasing without any data point reversing the trend, even temporally.
Non-monotonic. In a trend, lack of monotonic quality.

xii
Slide Positivity Rate. Measured as the number of slides that are positive divided by the total
number of slides examined. This indicator is less susceptible to variations in the ABER than the
number of malaria cases.

xiii
Abstract
Malaria is a disease that causes great burden in public health worldwide. It was estimated that in
2011 there were 3.3 billion people at risk of acquiring malaria. According to data from the Ministry of
Public Health of Ecuador, malaria incidence has shown a 99.9% steady decrease since year 2000. This
study evaluated the effect of timely treatment on circulating gametocyte and malaria incidence rates. All
cases reported in the province of Esmeraldas, Ecuador from July 2012 to March 2015 and to the national
headquarters between February 2012 and December 2014 were studied. The effect of early treatment on:
1) follow-up gametocytemia at an individual level (cases reported in Esmeraldas); and, 2) incidence rates
at a population level (within Esmeraldas and within Ecuador) was evaluated using a retrospective cohort
and an ecologic study design, respectively.
A total of 193 cases from the province of Esmeraldas were included in the retrospective cohort
study. Patients were classified into three groups depending on time to treatment (i.e. how many days
elapsed from symptoms onset to treatment) as follows: 1) early treatment for those treated within 2 days;
2) late treatment for those treated between 3 to 7 days; and, 3) extremely late for those receiving treatment
after 7 days. A consistent association between time to treatment and follow-up gametocytemia was found
in different regression models including logistic (adjusted OR = 0.20 and 0.28 for early and late
treatment, respectively, p < 0.05), linear (parameter estimate = 0.018, p < 0.05) Poisson log linear
(parameter estimate 0.103, p < 0.05), and negative binomial (parameter estimate = 0.111, p < 0.05).
Extremely late patients had higher follow-up gametocytemia levels during follow-up visits 1 and 2. A
survival analysis showed that extremely late treated patients tend to clear gametocytes later than the other
two treatment arms (p > 0.05). Finally, there was a positive association between time to treatment and a
period of transmisibiltiy, which was estimated based on the potential number of days that a patient has
gametocytemia (p < 0.05).

xiv
Population-level associations between time to treatment and malaria incidence rates were
assessed through a two-tiered ecologic study: nationwide for Ecuador and provincewide for Esmeraldas..
A parish-level anlaysis of malaria among all parishes in the province of Esmeraldas revealed that malaria
transmission differs widely within each population-level treatment arm classification group. A repeated
measures negative binomial regression showed that there is a positive association between malaria
incidence rate in subsequent periods and mean time to treatment, follow-up gametocytemia and a negative
association with malaria incidence rate in the previous period (p < 0.05 for all associations). The
nationwide analysis confirmed that there is wide variation in malaria incidence rate within each
population-level treatment arm classification group.
Although the World Health Organization (WHO) recommends timely malaria treatment there
seems to be lack of peer-reviewed published evidence evaluating the association of time to malaria
treatment with follow-up gametocytemia and incidence rates, especially in Latin America. This study has
important public health implications. Firstly, there seems to be no clear definition for early malaria
treatment. In this study, consistent evidence of the association between time to treatment and, specifically,
early malaria treatment (i.e. malaria within 2 days of symptoms onset) with follow-up gametocytemia and
period of transmissibliity is provided. Evidence provided here can serve as a basis for future research in
other countreis facing similar conditions. Additionally, this information can serve to better inform public
health policy, especially regarding the definition of early treatment and, thus, setting goals to accomplish
early treatment among malaria infected patients. Noteworthy, Esmeraldas and Ecuador face significant
challenges not only to achieve but to maintain malaria elimination, if achieved. These challenges arise
from favorable local environmental conditions and to certain vulnerabilities like proximity to neibhoring
areas with high malaria incidence, susceptibility to receive migration, specially refugees fleeing armed
conflict, socio-economic disadvantages and remoteness of some parishes were malaria remains active.
Moreover, the integration of the current national malaria control program into the organizational strucutre
of the Ministry of Health may impose additional challenges like: 1) differential prioritization of other
diseases, 2) lack of clear guidance about the role of the current malaria-dedicated personnel in the MoH

xv
strucutre; and, 3) lack of specification about on whom would accountability for malaria control rely. All
these vulnerabilities should be properly addressed if malaria elimination is to be achieved in Ecuador.
Finally, further research is required to confirm whether these trends and association are replicable across
different populations, countries and continents. If these associations are similar or even stronger in other
populations, then better malaria control programs informed in evidence-based definition of early malaria
treatment could certainly be planned and implemented to achieve malaria elimination and control in other
regions of the world.

1
Chapter One: Background
1.1 Malaria definition
Malaria is a preventable and potentially lethal vector-borne disease that is prevalent in the tropical
and subtropical regions of the world. With a complex life cycle and an important contribution to the
world’s burden of disease, malaria is one of the main infectious diseases of global public health
importance. Malaria relevance is, however, not only epidemiological but also historical. Indeed, it is a
disease that has been with humankind for millennia and which resists eradication.
Malaria can also be defined as a parasitic disease caused in humans by five species of protozoans
belonging to the genus Plasmodium including P. falciparum, P. vivax, P. ovale, P. malariae and P.
knowlesi. (1) Among these, Plasmodium falciparum is associated with greater morbidity and mortality
whereas Plasmodium vivax is known for its ability to cause long-lasting infections due to the persistence
of liver-dwelling hypnozoites, an intermediate parasitic stage formed during its life cycle. (1) The
following paragraphs and sections offer a brief description of all aspects of malaria as they relate to
efforts and possibility of malaria elimination in Ecuador.
1.2 Epidemiology
1.2.1 Global and Regional Epidemiology
Malaria is a disease that causes great burden in public health worldwide. Globally, malaria is
distributed throughout the tropics and it was estimated that 3.3 billion people live in areas of increased
risk for transmission in 2011. (2) Nonetheless, important progress has been made in malaria control in
recent years, bringing the world closer to achieving the malaria target (i.e. have halted and begun to
reverse the incidence of malaria) of Millennium Development Goal 6 (MDG 6)”. (2) In fact, it was
estimated that 198 million cases and 584,000 deaths due to malaria occurred worldwide in 2013 (2) down

2
from 216 million cases and 655,000 deaths in 2010. (3) Children under the age of 5 and pregnant women
are the most severely affected by this disease and Sub-Saharan Africa is the most affected world region
reporting 80% of global cases and 90% of global deaths. (3, 4)
Although the impact of malaria on Africa is much greater than in the Americas (see Figure 1), the
Americas continue to battle this disease. According to the Pan-American Health Organization (PAHO),
21 out of 35 countries are endemic to malaria which translates into an estimated 264 million people at risk
of infection. (5, 6) Only in 2004, the number of reported cases of malaria added to 882,361 in the
Americas with Brazil, Colombia, Peru and Venezuela accounting for 81.8%. (7) On the other hand, there
are some countries that are very close to achieving malaria elimination including El Salvador and
Ecuador. In fact, Ecuador received the Pan American Health Organization’s “Champion against Malaria
in the Americas” award in 2009. (8)
Figure 1. Reported malaria-related deaths in Africa and the Americas (1990-2010)
Source: Data derived from the World Malaria Report 2011 (3)
NOTE: Please notice that the Y axis scale has been formatted as a Log10, therefore differences between both continents are
large (i.e. maximum value is below one thousand for the Americas and over one hundred thousand for Africa).
1
10
100
1,000
10,000
100,000
1,000,000
1990
1991
1992
1993
1994
1995
1996
1997
1998
1999
2000
2001
2002
2003
2004
2005
2006
2007
2008
2009
2010
Mal
aria
-re
alte
d d
eath
s
Year
Africa
Americas

3
1.2.2 Malaria in Ecuador
Malaria has a seasonal transmission pattern in Ecuador with increased number of cases reported
usually during local rainy season, which varies according to the geographical location in the country.
There are two species of Plasmodium that cause human malaria in Ecuador: P. falciparum and P. vivax.
(2) Ecuador has suffered from malaria for a long time (9) and even though one of the main antimalarial
drugs, quinine, was developed from Andean traditional medicine, (10) malaria has always been far from
controlled in Ecuador. However, in recent years important progress in controlling malaria has been made.
In fact, the proportion of population living in areas of high/moderate risk for malaria was reduced from
8.2% in year 2008 (11) to only 2% in 2013. (2)
The geo-distribution of malaria-related indices in Ecuador seems to follow a spatial trend
whereby there is a concentration of cases in provinces in the coastal and Amazon basin regions, with the
Andean range seemingly functioning as a barrier between these two regions. (12) Thus, in Ecuador,
malaria is found in tropical areas as confirmed by Geographic Information Systems (GIS)-based analysis.
(12) The distribution of cases of malaria during year 2010 was concentrated in provinces of the Coastal
and Amazon regions with only 57 cases (out of a total of 1,886 cases) being reported in the Andean
subtropics. As shown in the Figure 2, the provinces with the highest incidence rates per 100,000 people
were located in the Amazon basin (Orellana, 391.5; Pastaza, 141.8; and, Morona Santiago 87.2) and in the
Coast (Esmeraldas, 41.2; and, Los Rios, 31.2) in Ecuador during 2010. Further analyses revealed
important Plasmodium falciparum and Plasmodium vivax activity in the province of Esmeraldas (12)
where malaria is also seasonally transmitted with increased number of cases reported usually coinciding
with the local rainy season. A more detailed epidemiological description of malaria in Esmeraldas is
offered in section 1.2.3.
According to data from the Ministry of Public Health of Ecuador (MoH), malaria incidence has
shown a 99.9% non-monotonic decrease between 2000 and 2014, with only one slight peak in year 2013.
In fact, only 100 confirmed malaria cases were reported in Ecuador in 2014. (Table 1).

4
Figure 2. Malaria incidence rates by parasite species and province in mainland Ecuador (2010)
Source: Reina Ortiz M, et. al. (12)
These historically low levels provide a unique opportunity to achieve the long-sought goal of
malaria elimination from the country. However, important challenges remain and intelligent, evidence-
based decision-making is in order if we are to achieve such goal. Notably, malaria continues to be
transmitted in few pockets of residual activity including Esmeraldas, in the coast, and some provinces in
the Amazon basin. More interestingly, only in Esmeraldas both species are actively and importantly being
transmitted in every season. Additionally, malaria incidence rates show a constant but irregular decline
since year 2000 with sudden increases in the number of cases. Thus, both temporal and geographical
seemingly unpredictable variability appear to limit the efficacy of malaria control efforts implemented by
the Servicio Nacional de Erradicación de la Malaria (SNEM), which is Ecuador’s National Malaria
Control Program (NMCP). Such pattern should encourage both research and intervention to achieve

5
elimination of indigenous malaria transmission. Research should be conducted: 1) to identify risk factors,
vulnerable populations and hot spot areas where control measures are more likely to produce maximum
impact; 2) to determine evidence-based efficient and effective malaria control strategies; and, 3) to inform
authorities in order to support the decision-making process to implement evidence-based/guided
interventions.
Table 1. Number of cases of malaria by parasite species and year in Ecuador (2001-2014)
Year
Number of cases of malaria
P. falciparum P. vivax Total
n % N %
2001 35,256 33% 71,385 67% 106,641
2002 20,867 24% 66,682 76% 87,543
2003 10,724 21% 41,341 79% 52,065
2004 6,005 21% 22,693 79% 28,698
2005 2,220 13% 14,842 87% 17,062
2006 1,596 16% 8,261 84% 9,857
2007 1,159 14% 7,306 86% 8,465
2008 491 10% 4,495 90% 4,986
2009 551 13% 3,574 87% 4,125
2010 256 14% 1,630 86% 1,886
2011 296 24% 937 76% 1,233
2012 28 15% 153 85% 181
2013 115 46% 133 54% 248
2014 14 14% 86 86% 100
Source: Data provided by the Ministry of Public Health of Ecuador and Pan-American Health Organization (13)
1.2.2.1 Progress on malaria control in Ecuador: a review of epidemiological indicators
An evaluation of Ecuador’s progress on malaria control was prepared by PAHO. (14) A summary
of this work showing several malariometric indices is presented here. As shown in Figure 3, the annual
parasitic index (API), which is the number of confirmed cases during one year divided by the number of
people under surveillance, has shown a steady decrease since 2001 onwards after a previous period of
monotonic increase from 1998 to 2001. A similar trend but with the pinnacle moved one year later is
observed for the annual index for P. vivax (AVI) whereas the index for P. falciparum (AFI) has been
declining since 2000 onwards. (14)

6
Figure 3. Malariometric indices in Ecuador (1998-2010)
Source: Modified from Malaria in Ecuador. (14) API = Annual Parasitic Index; AFI = Annual Index of P.
falciparum; AVI = Annual Index of P. vivax. NOTE: Notice there is no data for years 2005-2007.
According to PAHO, the Annual Blood Examination Rate (ABER), which is the number of slides
examined divided by population and expressed as percentage, has been decreasing in Ecuador since year
2002. Similarly, the Slide Positivity Rate (SPR) has been steadily decreasing since 2001. (14)
Importantly, SPR is believed to offer a more accurate appraisal than malaria incidence rates, and malaria
transmission, since it is less affected by the diagnostic efforts; that is to say, by variations in the ABER.
(3, 15) Since Ecuador has shown a decrease in both ABER and SPR, as well as in malaria incidence rate,
it is reasonable to think that a lower transmission of malaria has been accompanied by a lesser “effort” in
diagnosis, probably to avoid wasting of resources, especially in provinces where there were no reports of
new malaria cases. Figure 4 shows the temporal trends on these two important malaria diagnosis indices
in Ecuador for the period between years 1998 and 2010. Please note that there is no information available
for years 2005 to 2007 and therefore these years have not been included in the figure.
1998 1999 2000 2001 2002 2003 2004 2008 2009 2010
API 15.16 23.27 23.55 26.45 24.51 18.68 11.96 0.6 0.5 0.2
AFI 7.79 13.49 13.4 9.03 5.25 3.82 2.79 0.55 0.43 0.17
AVI 7.37 9.78 10.15 17.43 19.26 14.87 9.17 0.05 0.07 0.03
0
5
10
15
20
25
30

7
Figure 4. Malaria diagnosis indices in Ecuador (1998-2010)
Source: Modified from Malaria in Ecuador. (14) ABER = Annual Blood Examination Rate; SPR = Slide positivity Rate
1.2.2.2 Ecuador’s National Malaria Control Program: a brief description
Ecuador’s national malaria control program (SNEM) has been entrusted with the control and
prevention of malaria in Ecuador since the 1950’s and has developed a malaria control plan that consists
of indoor residual spraying (IRS), public health education, distribution of bed nets and control of water
reservoirs, as part of an integrated vector and disease management approach.
Integrated Vector Management (IVM) encompasses several activities, many of which overlap
with other aspects of the vector control program. Active case surveillance is one of the activities of the
SNEM’s IVM component. After a person has been diagnosed with malaria, SNEM officers in Esmeraldas
Province keep a 28-day follow-up to make sure that the parasite has been eradicated from the person
(SNEM Esmeraldas, personal communication). Another important aspect of IVM in SNEM is the
entomological evaluation. Additional activities include indoor and space spraying, community-based
vector control including destruction of larval breeding sites, delivery of Insecticide Treated Nets (ITN) or
bed-net treatment with insecticide. (16)
1998 1999 2000 2001 2002 2003 2004 2008 2009 2010
ABER 4.4 6.4 7.3 7.0 5.8 5.4 4.7
SPR 14.5 20.2 18.1 19.9 19.0 12.1 8.3 1.3 0.9 0.4
0.0
5.0
10.0
15.0
20.0
25.0

8
As part of its malaria control program, the National Service of Eradication of Malaria (SNEM)
has also developed a plan to reach remote areas of the country where they provide with decentralized
diagnosis and treatment. In general terms, this plan consists on providing specific technical training to
high school or college graduates on microscopic malaria diagnoses as well as on how to treat positive
patients in accordance with the national malaria treatment plan which recommends ACT + primaquine for
P. falciparum and chloroquine + primaquine for P. vivax. These “microscopists”, as they are referred to,
are effectively in charge of community-level detection, diagnosis, treatment, case-investigation, and
follow-up of malaria cases. (16)
Active surveillance, outbreak investigation and control are important aspects of Ecuador’s
malaria control program. The importance of these activities in Ecuador is even greater given the level of
malaria control that has been achieved. If the progress is to be maintained or improve it is crucial to deter
and fight-off any outbreak as small as it may seem. From 2008 to 2011, three outbreaks were investigated,
one in Cascales District, the other in Lago Agrio District and finally one in Putumayo District, all of them
in the Province of Sucumbíos. (16)
A summary of the activities performed by the SNEM during the processes of patient care,
epidemiological control and data management is shown in Figure 5. Briefly, a patient with symptoms of
malaria reaches a health unit (a health post, health clinic or hospital) where he/she receives care by trained
technicians. If the patient is confirmed to be infected with malaria, after a blood smear is analyzed in the
microscope, the patient receives immediate treatment and his/her contact info is recorded to allow for
follow-up. The case is then reported to both the Department of Epidemiology (DoE) and the Department
of Biostatistics (DoB). Upon the receipt of notice, the DoE coordinates field operations to visit the likely
place of transmission and an IVM plan is locally implemented. On the other end, the DoB receives the
notification and sends the sample for quality control. In this quality control, a group of trained
technicians, independent of those who originally made the diagnosis, review all blood smears again to
confirm diagnosis and parasite species as well as to corroborate the presence or absence of gametocytes.

9
Upon confirmation, data are sent to the National Headquarters where they are integrated in a national
database to allow for national-scale surveillance and monitoring. (16)
Figure 5. Algorithm of malaria diagnosis, epidemiological control and data management activities by SNEM in Ecuador
Source: Modified from Prevention and Control of Malaria among People in Special Circumstances in the Americas. (16)
In addition to the activities described earlier, the SNEM also works with community health
workers (CHWs) who are trained on recognition of symptoms, on the use of Rapid Diagnostic Tests
(RDTs) where microscopy is not available and on referring guidelines. (16) These CHWs work in
coordination with officers from the MoH and with local schools to promote health/malaria awareness
through education campaigns and vector control at local level by the community. (16)
Finally, the Ecuadorian MoH and SNEM, in accordance with international guidelines and
conscious of its importance, have developed strategic partnerships with other actors to ensure an
(Malaria) Patient
Health Unit (Post, Clinic,
Hospital)
Epidemiology
Field Operations
IVM
Statistics
Quality Control
National Headquarters
10
appropriate deliverance and coordination of efforts in malaria control. A short list of such partners is
provided below.
The Global Fund
The Office of the United Nations High Commissioner for Refugees (UNHCR)
Red Cross
Community Health Workers (CHW)
Local Schools
Association of Volunteers of Sucumbíos (ACOPSAS, Spanish acronym)
Association of Indigenous Nations of Sucumbíos (APTISE, Spanish acronym)
National Secretary of Migrants, an office of the Ecuadorian government (SENAMI,
Spanish acronym)
Women’s Federation of Sucumbíos
Association of Colombo-Ecuadorian Women (OMCEA, Spanish acronym)
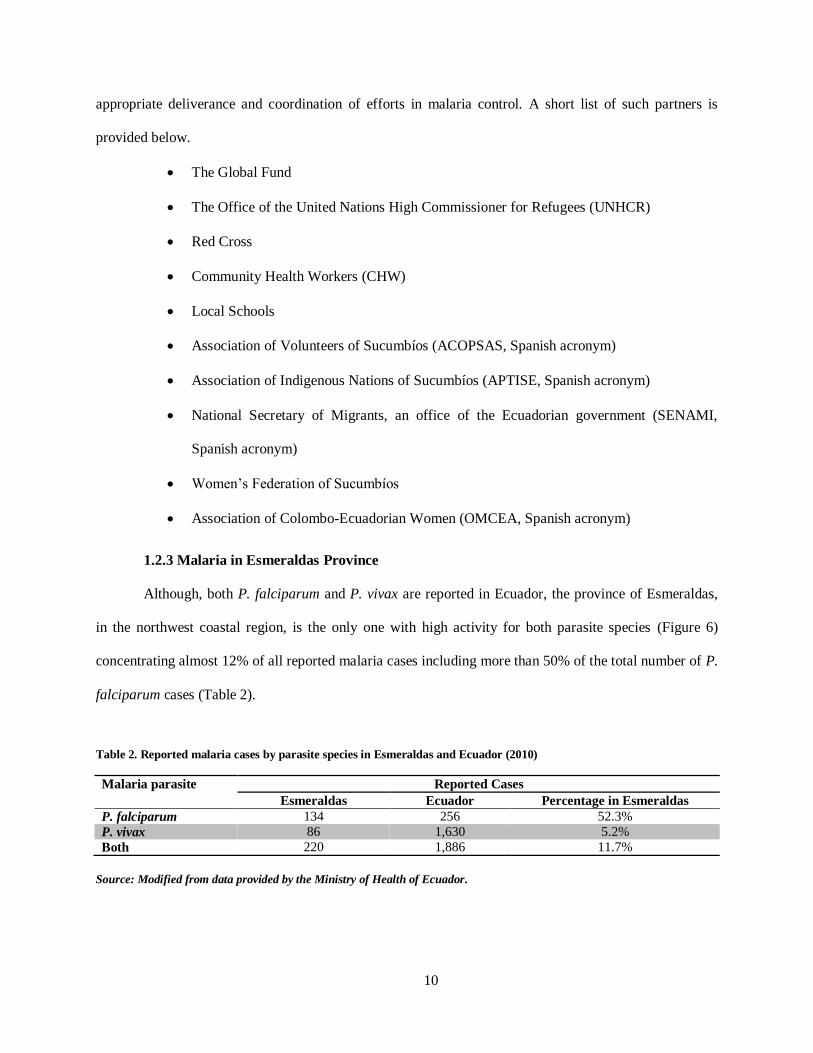
1.2.3 Malaria in Esmeraldas Province
Although, both P. falciparum and P. vivax are reported in Ecuador, the province of Esmeraldas,
in the northwest coastal region, is the only one with high activity for both parasite species (Figure 6)
concentrating almost 12% of all reported malaria cases including more than 50% of the total number of P.
falciparum cases (Table 2).
Table 2. Reported malaria cases by parasite species in Esmeraldas and Ecuador (2010)
Malaria parasite Reported Cases
Esmeraldas Ecuador Percentage in Esmeraldas
P. falciparum 134 256 52.3%
P. vivax 86 1,630 5.2%
Both 220 1,886 11.7%
Source: Modified from data provided by the Ministry of Health of Ecuador.

11
The number of cases diagnosed with malaria has also been declining in the province of
Esmeraldas in the last decade. As shown in Table 3, the number of cases of malaria in the province of
Esmeraldas has non-monotonically been reduced from 24,862 to 25 between years 2000 and 2014. This
reduction represents a 99.9% reduction and is observed for both parasite species with a non-monotonic
decrease observed for P. falciparum whereas a monotonic reduction was observed for P. vivax. In fact,
recent figures show an increase in the number of cases during 2013 with a total of 141 cases being
reported in the province of Esmeraldas, most of them in and around the city of Esmeraldas (Table 3).
Moreover, the geographical distribution of the disease has also been altered and the main centers of
activity had moved from the northern parishes to the suburban areas around Esmeraldas City.
Table 3. Number of cases of malaria by parasite species and year in Esmeraldas (2001-2015)
Year
Number of cases of malaria
P. falciparum P. vivax Total
n % n %
2001 9,745 39.20 15,117 60.80 24,862
2002 6,903 28.89 16,992 71.11 23,895
2003 4,041 28.58 10,098 71.42 14,139
2004 1,949 23.30 6,415 76.70 8,364
2005 780 16.94 3,824 83.06 4,604
2006 561 23.49 1,827 76.51 2,388
2007 264 22.47 911 77.53 1,175
2008 106 28.04 272 71.96 378
2009 161 52.10 148 47.90 309
2010 131 61.21 83 38.79 214
2011 85 84.16 16 15.84 101
2012 16 84.21 3 15.79 19 *
2013 141 99.30 1 0.70 142
2014 24 96.00 1 4.00 25
2015 7 100.00 0 0.00 7**
Source: Modified from data provided by SNEM Esmeraldas.
* Data includes only cases reported from July to December 2012;
** Data includes only cases reported until March 2015
Before further describing malaria trends in Esmeraldas it is important to quickly review the
relevance of Geographic Information Systems (GIS) in infectious diseases epidemiology and public
health practice. Geographic Information Systems (GIS) are designed to integrate and analyze spatial data.
(17) Spatial data is understood as any type of data which has an associated geo-referenced point

12
corresponding to a specific geographical location on earth’s surface. (17) In a broad sense, geographic
information systems are part of a larger group of related technologies that allow for capturing and
processing of geographical data. (17) Such technologies include Remote Sensing (RS), Global
Positioning Systems (GPS) and vector files. (17) A geographic information system not only integrates
data captured through related technologies as just explained but, more importantly, it will allow for
statistical and spatial analyses. (17) This can be achieved thanks to the fact that these systems link
attributes or characteristics to the features observed in a map. (17) Both the features and attributes are
stored in a database known as a geodatabase. (17) As a result, GIS technologies are characterized by their
ability to store, compute and display spatial relationships between objects; store many attributes of
objects; analyze spatial and attribute data; and, integrate spatial data from different sources. (17) Because
of these characteristics, public health practitioners and other professionals may harness the potentialities
of GIS-related technologies to achieve: 1) spatial database management; 2) visualization and mapping;
and, 3) spatial analysis. All these aspects are critical in the planning, implementation, research and
evaluation of public health interventions as they relate to the basic questions of public health research. In
fact, it has been proposed that Geospatial analysis performed within a Geographical Information Systems
environment could provide with the right tools to help make informed and intelligent decisions by
identifying places of prolific activity where resources and effort should be focused for a more efficient
eradication and control program. (17, 18)
Geographical, environmental and other spatial-temporal variables are associated with the
transmission and disease dynamics of tropical infectious diseases. In fact, remotely sensed data has been
used in the study and understanding of vector-borne (i.e. malaria) and infectious disease dynamics. For
instance, it has been shown that LULC patterns are associated with tropical infectious disease dynamics
(19-22) and that Vegetation indexes and other remotely-sensed, vegetation-derived attributes are
associated with vector-borne disease dynamics.(23) Furthermore, GIS-based statistical analyses and other
geospatial analyses in the study of tropical disease dynamics have successfully been used before. For
instance, it has been shown that distance from anopheline habitats to homestead is associated with

13
anopheline abundance, (23) and malaria cases. (24). Additionally, regression models can be used to
analyze geospatial data in conjunction with field-obtained vector-related data.(20).
Further GIS-based analysis of malaria-related data in Esmeraldas for year 2011 showed that the
parishes located in the northern part of the province endured high activity for both plasmodium species
whereas the City of Esmeraldas and its surrounding parishes were also affected, but to a lesser extent
(Figure 6). It is important to mention that the northern parishes are close to the border with Colombia and
are more likely to be affected by the guerrilla conflict in that country.
Figure 6. Malaria cases by parasite species and parish in Esmeraldas, Ecuador (2011)
Source: Reina-Ortiz M, et. al. (12)

14
As shown in the Figure 7, a Land Use/Land Cover (LULC) analysis revealed that the areas of
malaria activity were characterized by dense vegetation identified as rainforest. Both supervised and
unsupervised algorithms were used showing similar results.
Figure 7. Land Use Land Cover classification (LULC) of malaria transmission areas in Esmeraldas Province
Source: Reina Ortiz M, et. al.
A Geo-spatial autoregressive analysis of the sampled data also suggests that malaria cases in
Esmeraldas are significantly clustered (p < 0.05) in the northern region, near the border with Colombia,
that is, a hot spot analysis confirmed that the northern parishes were active sites of malaria cases for both
P. vivax and P. falciparum (Figure 8). (12)
Finally, according to data from the local office of the SNEM in Esmeraldas, the vectors more
frequently found in the province include An. albimanus, An. punctimacula and An. pseudopunctipennis.
These would be the main vectors of malaria in Esmeraldas.

15
Figure 8. Hot Spot analysis of malaria cases in Esmeraldas Province
Source: Reina Ortiz M, et. al. (12)
1.3 Life cycle
Malaria is transmitted between humans through the bites of infected female anophelines
mosquitoes. (1) In order to complete their reproductive cycle, female anophelines need a blood meal
which, depending on species and other environmental factors, they can take from humans or animals. If in
doing so the mosquito is fed upon blood from an infected individual, it is likely that the anophelines will
take a meal loaded with some malaria gametocytes, both male and female. Within the mosquito, malaria
develops into infective sporozoites, which dwell in the salivary glands until the next blood meal through
which they will be delivered into the new victim’s bloodstream. During the next meal, mosquitoes will
probe for blood; thus, when an infected anopheline female mosquito feeds on human host sporozoites are

16
transferred from the vector’s salivary gland into the host’s skin rather than directly into the bloodstream.
(25-27) From there, malaria parasites will first reach the liver and later on the peripheral blood where a
subset of them will finally develop into infective gametocytes completing the cycle. A more detailed
explanation of the life cycle from this point onwards is offered in the paragraphs below.
Once in the dermis, sporozoites seek to enter the bloodstream to finally move into the liver. (28)
In murine models with P. berghei, sporozoites seem to glide randomly in the dermis until they find either
a blood (in 70% of the cases) or a lymphatic (in 20-30% of the cases) vessel, which they invade – a
process that takes up to an hour for half of the sporozoites. (28, 29) Parasites traveling through lymphatic
vessels are stopped in the nearest proximal lymph node where they associate with local Dendritic Cells
whereas those sporozoites entering the bloodstream will reach the hepatocytes after a relatively short
journey in the bloodstream, although longer than originally thought. (28) Additionally, other researchers
have shown that by 15 minutes, the first wave of sporozoites inoculated in mice had already reached
general circulation, with sporozoites remaining in the dermis for a minimum of 5 minutes. (26, 30) In
fact, murine models using P. yoelii have shown that the majority of sporozoites spend 1-3 hours in the
skin before reaching their target cells in the liver. (29) This contrasts early findings by Sir NH Fairley
who showed that blood from malaria infected patients remained infectious for 30 minutes after
inoculation with P. vivax before becoming sterile for 7 days. (31, 32) These findings led to early
assumptions that sporozoites quickly gain access to the bloodstream and take up to 30 minutes before
reaching the liver.
Once in the liver, sporozoites penetrate hepatocytes, undergo morphological changes, nuclear
division and cytoplasmic growth which lead to the release of single-nucleated merozoites. (33) These
merozoites which are released after the primary exo-erythrocytic schizogony (EES) are called cryptozoic
merozoites. (33) In mammalian plasmodia, cryptozoic merozoites can only invade erythrocytes, as
opposed to invading new hepatocytes (i.e., there is only one round of EES). (33) After penetrating
erythrocytes the cryptozoic merozoites can undergo either blood schizogony or, in some cases,

17
gametocytogony. (33) In fact, murine models of malaria have shown that some cryptozoic merozoites can
directly enter the gametocytogonic cycle. (34)
Thus, the Plasmodium’s life cycle can be divided into two major sub-cycles: 1) the sporogonic or
extrinsic cycle, which takes place in the mosquito; and, 2) the schizogonic or intrinsic cycle, which refers
to the phases developed in the human host. Furthermore, the intrinsic cycle can be further subdivided into
exo-erythrocytic and erythrocytic cycles. (1, 33) A schematic representation of the malaria life cycle
taken from the Centers for Disease Control and Prevention’s website is shown in Figure 9.
Figure 9. Malaria life cycle
Source: Modified by Miguel REINA ORTIZ from CDC, Malaria, About Malaria, Biology. (35)

18
There are some important aspects of the life cycle that relate directly to malaria diagnosis and
transmission and that should be further clarified. Namely, symptoms are usually manifest only after two
erythrocytic schizogonic cycles (ESC) are completed. Considering that the prepatent period (i.e. time
from mosquito bite until release of cryptozoic merozoites) lasts 5.5 days for P. falciparum and 8 days for
P. vivax (36) and considering also that the duration of each ESC is 48 hours for both falciparum and vivax
(33) malaria, then the incubation period would be of 10 and 12 days for falciparum and vivax malaria,
respectively (See figure above). In fact, the reported incubation period for falciparum malaria is 8-15 days
whereas for vivax malaria it is 12-20 days. (36) Finally, assuming that a proportion of cryptozoic
merozoites would directly enter the process of gamecytogony and considering that this cycle lasts 8 days
for P. falciparum and 4 days for P. vivax, then we have that the earliest theoretical gametocytemia would
appear at day14 and 12 for falciparum and vivax malaria, respectively. This means that the time window
between symptom onset and gametocytemia would be 4 days and 0 days for falciparum and vivax
malaria, respectively (see figure above). In fact, reported prevalence of gametocytemia at diagnosis is
much lower for P. falciparum (5-9%) than it is for P. vivax (57%), and the time between onset of
symptoms and detectable gametocytemia is 2 and 3 days for vivax and falciparum malaria, respectively.
(37-39) Since gametocytes are required for continuing transmission, the proper use of this information to
inform treatment policies would have tremendous advantages in the interruption of malaria transmission.
During the ESC the cryptozoic merozoites are transformed into trophozoites first and then into
mature schizonts which release even more infecting merozoites into the bloodstream which within the red
blood cell (RBC), in turn, can develop into another blood schizont or into female and male gametocytes.
(1, 33) The minimum period of time elapsed from sporozoite inoculation to merozoite appearance in
erythrocytes (i.e. until parasitaemia) is called the prepatent period and it is specific for each parasite
species, although it is very difficult to measure in natural infections. (36) The incubation period, on the
other hand, is the time elapsed from infection until clinical manifestations and it usually lasts longer than
the pre-patent period since it requires that the number of circulating parasites reaches a “pyrogenic”

19
threshold. (36) It is important to note that parasites will not reach a detectable circulating blood level until
at least 2-3 schizogonic cycles have occurred (i.e. until 2-3 batches of merozoite have been released by
mature schizonts). (36) This means that the incubation period would more likely be larger than the
prepatent period by 2, 4 or 6 days in tertian malaria parasites like P. falciparum and P. vivax. (36) It is
also important to mention that the clinical symptoms of malaria are related to the release of merozoites in
the bloodstream during the erythrocytic cycle. (29) In contrast, the sporozoites and the hepatic forms of
the parasite are asymptomatic. (27)
As explained earlier, some parasitic forms will develop into macro and microgametocytes,
responsible for the sexual replication of plasmodium parasites. (1) The gametocytes are taken by the
anopheline female mosquito during her next blood meal and parasites further develop within the vector
into zygotes, ookinetes and finally into infective stage sporozoites, which migrate to the salivary glands,
completing the life cycle. (1, 35) This sporogonic cycle is estimated to last 9 days for P. falciparum and 8
days for P. vivax. (33)
As mentioned earlier, there are two Plasmodium species circulating in Ecuador. In the following
paragraphs a, detailed explanation of the life cycles of both P. falciparum and P. vivax is offered.
1.3.1 Plasmodium falciparum life cycle
Plasmodium falciparum infections are associated with higher morbidity and mortality. Several
characteristics of this malaria species’ life cycle account for such increased pathology.
The description of the life cycle of P. falciparum will begin with the exo-erythrocytic cycle.
When an infected Anopheles spp. female bites a human being, thousands of sporozoites are injected into
the host’s skin, and eventually, bloodstream wherefrom they reach the liver. This prepatent period lasts
5.5 days in P. falciparum infections. (33, 36) After completion of the EES, merozoites are released in the
bloodstream where they invade RBCs and mainly enter the ESC. (1) Completion of the erythrocytic
schizogony (ES) and schizont maturation requires that the parasite migrates to capillaries and sinuses of
internal organs during a process known as schizont sequestration that is responsible for the increased

20
morbidity and mortality observed in P. falciparum infections and which leads to a multitude of
manifestations for which this protozoan is also known as the “arch simulator” or the “great mimic”. (33)
The gravest manifestation among these is cerebral malaria which develops after an extensive blockage of
capillaries in the cerebrum and cerebellum. (33) During P. falciparum infections in which there is only
one brood of parasites merozoite release occurs every third day (i.e. the duration of the ESC is 48 hours).
(33) For this reason P. falciparum is also known as the malignant tertian malaria (i.e. it is associated with
increased morbidity and mortality and symptoms appear every third day). (33)
Although relapses do not occur in P. falciparum infections, recrudescence may appear after
inadequate treatment compliance, and sometimes even after full course treatments with chloroquine or
other schizonticides. (33) Many different factors have been implicated in recrudescence appearance
including a variety of stresses, excessive exercise, pregnancy or exposure to cold temperatures like
swimming in temperate seas. (33) It has been estimated that the natural life span of P. falciparum
infections is 9-12 months on average with reported maximum lengths of up to 3-4 years. (33)
1.3.2 Plasmodium vivax life cycle
As explained earlier, P. vivax has been shown to be cleared from the circulating blood in as short
as 30 minutes after mosquito bites. (33) The prepatent period in P. vivax infections is longer than that for
falciparum malaria with at least 8 days, although longer periods have been reported for specific strains.
(36) Vivax malaria is also known as benign tertian malaria with ES cycles during 48 hours. (33) After
transmission by an infected mosquito, the host will initially develop irregular and almost daily fevers for
the first week followed by the typical vivax periodicity (i.e. very third day). (33) However, two different
broods of schizonts may exist, effectively leading to daily fever peaks. (33) P. vivax is known for forming
hypnozoites which dwell in the liver and cause relapses occurring more or less every 2 months. (33) All
other aspects of the life cycle are similar to P. falciparum with the exception of schizont sequestration
which is not present in P. vivax infections.

21
1.3.3 Comparing P. falciparum and P. vivax life cycles
The table below summarizes the main differences between P. falciparum and P. vivax.
Table 4. Plasmodium falciparum and Plasmodium vivax life cycle characteristics
Characteristic P. falciparum P. vivax
Common name Malignant tertian malaria Benign tertian malaria
Pre-liver period Up to 3 hours* Up to 3 hours*
Prepatent period (a) 5.5 days 8 days
Extra-erythrocytic schizont size (diameter) 60 μm 45 μm
Merozoites produced per schizont 10,000 30,000
Duration of gametocytogony (b) 8 days 4 days
Duration of ES cycle (c) 48 hours 48 hours
Theoretical Incubation period in days from infection [b+
d [2]]
10 days 12 days
Reported incubation period range 8-15 days 12-20 days
Earliest theoretical Gametocyte production (a+b) in days
from infection
14 days 12 days
Duration of sporogony 9 days 8 days
Type of renewed clinical manifestation Recrudescence Relapse
Average longevity (i.e. maximum time to renewed clinical
manifestations)
9-12 months 2 years
Maximum reported longevity 4 years 4 years
Data derived from multiple sources as cited in the text. * Data derived from murine models. ES = Erythrocytic Schizogony
The figure below shows the timeline of events in the course of P. falciparum infections. Let the
day of mosquito bite be day zero.
Figure 10. Timeline of main events in the course of P. falciparum infections
End of 4th Erythrocytyc
schizogony
• Release of merozoites
End of 1st Gametocytogony
Day 14
End of 2nd Erythrocytic
schizogony
• Release of merozoites
Onset of symptoms
Day 10
End of 1st Erythrocytic
schizogony
• Release of merozoites
Day 8
End of Extra-erythrocytic
schizogony
Merozoites released
Red Blood Cell invasion:
• Start of Erythrocytic schizogony
• Start of Gametocytogony
Day 6
Mosquito bite
Blood circulation
Liver Migration
Start of Extra-erythrocytic
schizogony
Day 0

22
In summary, after sporozoites are injected during mosquito bite the parasites reach the liver in the
same day where they will develop into extra-erythrocytic schizonts. By day 6, the schizonts have matured
and released the first batch of merozoites, the cryptozoic merozoites. Cryptozoic merozoites then invade
RBCs wherein they either develop into trophozoites (i.e. they follow the erythrocytic schizogonic cycle)
or undergo the first gametocytogonic cycle. It is important to mention that only a small proportion of
cryptozoic merozoites directly enter the gametocytogonic cycle. Those merozoites which entered the
erythrocytic schizogony will take around 48 hours to mature, a process during which they need to migrate
to deep blood vessels. After at least two erythrocytic schizogonies are completed (i.e. by day 10) the first
clinical manifestations of the infection are evident. Incubation periods for falciparum malaria are
estimated to range between 8-15 days. Since the gametocytogony takes up 8 days among P. falciparum
parasites, the earliest possible time when gametocytes can be present in the circulating blood would be
day 14, four days after the first symptoms appeared (6 days if we consider the shortest reported incubation
period) and the same day when the fourth erythrocytic schizogony is completed. However, it is important
to remember that only a fraction, if any, of the cryptozoic merozoites will enter the gametocytogony
immediately and therefore gametocytemia, if present, is likely to be at low levels. For the same reasons,
gametocytemia is more likely to occur during the second week (8-14 days) after the onset of parasitemia,
a period also known as patent period. Merozoites are released at the end of each completed schizogony.
(33, 36)
A similar timeline for P. vivax infections is shown below. Again, day of mosquito bite is
designated as day 0. Briefly, following sporozoite deposit during mosquito bite the parasites reach the
liver in the same day where they will develop into extra-erythrocytic schizonts. By day 8, the schizonts
have matured and released the first batch of merozoites, the cryptozoic merozoites. Cryptozoic merozoites
then invade RBCs wherein they either develop into trophozoites (i.e. they follow the erythrocytic
schizogonic cycle) or undergo the first gametocytogonic cycle. It is important to mention that only a small
proportion of cryptozoic merozoites directly enter the gametocytogonic cycle. Those merozoites which
entered the erythrocytic schizogony will take around 48 hours to mature. After at least two erythrocytic

23
schizogonic cycles are completed (i.e. by day 12) the first clinical manifestations of the infection are
evident. In fact, incubation periods for vivax malaria are estimated to range between 12 to 20 days. Since
the gametocytogony takes up 4 days among P. falciparum, the earliest possible time when gametocytes
can be present in the circulating blood would be very same day of onset of clinical manifestations.
However, it is likely that gametocyte levels are relatively low. Merozoites are released at the end of each
completed schizogony. (33, 36)
Figure 11. Timeline of main events in the course of P. vivax infections
From this analysis we can see that for P. vivax infections it is more likely that gametocytes are
circulating in the blood at the day of symptoms onset whereas for P. falciparum at least 4 days may elapse
from symptoms onset until gametocytes can be produced. In fact, data derived from classic malaria
research among non-immune subjects show that those infected with P. vivax are likely to be infectious
(i.e. able to be transmitted to the biting mosquito) as early as two days after fever becomes a constant
symptom coinciding with active clinical symptoms whereas the same period extend to more than a week
for P. falciparum infected subjects. (36) Among immune subjects, it is believed that gametocytogenesis is
End of 2nd Erythrocytic schizogony
•Release of mereozoites
Onset of symptoms
End of 1st Gametocytogony
Day 12
End of 1st Erythrocytic schizogony
•Release of merozoites
Day 10
End of Extra-erythrocytic schizogony
Merozoites released
Red Blood Cell invasion:
• Start of Erythrocytic schizogony
• Start of Gametocytogony
Day 8
Mosquito bite
Blood circulation
Liver Migration
Start of Extra-erythrocytic schizogony
Day 0

24
lower. (36)This difference could have important implications in the control of malaria as proposed in this
study and as explained later.
1.4 Biologic factors affecting malaria transmission
1.4.1 Gametocytic dynamics
As explained earlier, gametocytes are the sexual stage during the life cycle of plasmodia parasites
which is taken up by the transmitting mosquitoes during blood meals. Thus, gametocytes are the
parasite’s transmission stage. (40) In fact, gametocytes are critical phases of the parasite’s life cycle for
the ongoing transmission of the disease and levels of gametocytemia has been associated with the risk of
malaria transmission. (37)
Gametocytes develop as follow. Albeit some cryptozoic merozoite could enter the
gametocytogonic cycle immediately, most of the merozoites usually take up to 48 hours to develop into a
schizont within an infected RBC, which releases 16 merozoites into the circulation after this period. (40)
Each of these merozoites will, in turn, infect a new RBC which circulates for one day. Within the RBC,
the merozoite can take one of two paths: develop into another full set of merozoites or develop into a
single gametocyte. If merozoites will develop, the infected RBC (parasitized RBC or PRBC) is
sequestered in blood vessels of deep tissues for one day. If a gametocyte is to be formed, however, the
RBC will be sequestered for the period it takes the gametocyte to mature, which can be 4-12 days in vivo.
(40) The gametocyte development within these infected RBC includes 4 early stages (during
sequestration) and a final stage of mature gametocytes which circulate in the blood and are arrested in the
cell cycle phase G0 until they become gametes in the vector’s gut. (37, 41, 42) P. falciparum gametocytes
are reported to have a geometric mean circulation time of up to 7.4 days. (40, 43) Although there are
many factors influencing the development of gametocytes (including asexual parasitaemia level, host
physiological state, host immunity and pharmacological agents), it has been reported that factors slowing
parasite asexual proliferation may favor the development of gametocytes (chemotherapy, for instance).
(36, 41)

25
Although the presence of asymptomatic gametocytemia has been reported, at least during
recrudescence, (43) a recent study in Colombia showed that during primary infection with P. falciparum
gametocytemia was not detectable until three days of disease evolution (i.e. patients with evolution times
between 1-2 days had not detectable gametocytemia). (37) Although there was no correlation between
gametocytemia levels and days of disease evolution, it is known that the probability of detecting
gametocytes increases with disease duration. (37)
Table 5. Gametocytemia at diagnosis in percentage by days from onset of symptoms
Days from onset of symptoms Gametocytemia at diagnosis*
Percentage Cumulative Percentage
Day 1 0% 0%
Day 2 0% 0%
Day 3 16% 16%
Day 4 7% 23%
Day 5 0% 23%
Source: Data from Arango et al. * Average from two different populations
In fact, it has been estimated that blood-circulating mature gametocytes appear 7-12 days after
blood-circulating asexual parasites in malaria infections. (36, 44) Nonetheless, it has been reported that
symptomatic malaria cases usually have measurable and transmissible levels of mature gametocytes at
diagnosis/recruitment. (44) The table above shows the relationship between time from symptom onset and
percentage of patients with gametocytemia at time of P. falciparum diagnosis, based on the data presented
by Arango et. al. (37)
Table 6. Gametocytemia at diagnosis by parasite species and by time from onset of symptoms
Malaria parasite Gametocytemia
at diagnosis
Time from onset of clinical manifestations
(median in days)
Without gametocytemia With Gametocytemia p-value
P. falciparum 9% 3 5 < 0.0001
P. vivax 57% 2 3 0.005
Source: Data obtained from McKenzie et al.
26
Another study compared the presence of gametocytemia in P. falciparum and P. vivax infections
in Thailand and Peru. (38) This study showed that at the moment of diagnosis, gametocytemia was more
frequent in P. vivax infections (57%) compared to P. falciparum (9%). (38) Moreover, there were
significant differences in the time elapsed from symptoms onset between patients presenting with and
without gametocytemia (p < 0.05 for both parasite species) as shown below. (38) Other studies have
reported lower P. falciparum gametocytemia at diagnosis (5.4-6.2%). (39)
1.4.2 Dynamics of the sexual and asexual parasite populations
A study conducted in Nigerian children receiving chloroquine as treatment for P. falciparum
infections reported no correlation between sexual and asexual P. falciparum blood circulating forms
either during the primary or recrudescent infections, the latter both in symptomatic and asymptomatic
patients; probably due in part to parasite sequestration. (43) Similarly, a study conducted in malaria
endemic zones in Colombia found no association between gametocytemia and sexual parasitemia. (37)
Nonetheless, previous studies have shown that a decrease in asexual parasitemia is associated with a rise
in the number of blood circulating gametocytes. (43) As explained below, it is likely the asymptomatic
gametocytemia with high gametocytemia:parasitemia ratio occurs during recrudescent infections, (43) as
opposed to primary infections.
1.4.3 Gametocytes and their role in primary and recrudescent infections
Recrudescence of malaria occurs in P. falciparum infections following treatment failure. It is
important to recognize the role played by gametocytes in malaria recrudescence. A study conducted in
Nigeria showed that the gametocytemia:parasitemia ratio was significantly higher during recrudescence
when compared to the primary infections. (43) Moreover, the same study revealed important and
statistically significant differences in gametocytemia dynamics between children with treatment and
without treatment failures. Namely, during their primary infections, those who suffered recrudescence
showed higher levels of maximum gametocytemia, gametocytemia half-life and time to reach maximum
gametocytemia and slower gametocytemia clearance than those children without recrudescence. (43)

27
Although these observations were made in patients receiving chloroquine as treatment for P. falciparum,
they suggest that gametocytes play an important role in recrudescence and that the fast-acting and
gametocytocidal activity observed with ACT may explain, at least in part, the success of this regime.
Recrudescent infections may appear at different time post-treatment. In the same study by
Sowunmi et. al., (43) a total of forty-eight recrudescent P. falciparum infections appeared at days 6, 7, 10
and 14; however, infections appearing up to 21 says of treatment are considered to be recrudescent. (43)
Interestingly, twenty-two (46%) of these were asymptomatic at recrudescence with negative correlation
being observed between recrudescent parasitemia and the time elapsing from recrudescence detection
until first appearance of symptoms. (43) Additionally, the gametocytemia:parasitemia ratio in
recrudescence was higher among those who remained asymptomatic for at least 5 days after detection of
recrudescence as compared to those who were symptomatic at the moment of recrudescence detection.
(43) Overall, when compared to primary infections, recrudescent infections displayed significantly less
symptoms, lower parasitemia levels and higher gametocytemia:parasitemia ratios. (43) All these results
suggest that gametocytemia may be related to initially asymptomatic recrudescence, if not in primary
infection as well. Moreover, it clearly shows that gametocytemia may be present even during
asymptomatic disease, especially among recrudescent infections, and therefore it may be an indication of
the need to evaluate the effects of early treatment on gametocytemia and, potentially, disease
transmission.
There could be many explanations for treatment failure, which could lead to recrudescent
infections, either symptomatic or not. Mainly, parasite drug resistance may lead to treatment failure.
Therefore, as discussed earlier, it is important to assess drug susceptibility among local circulating
parasite strains. (45) Another option is the use of sub-optimal quality drugs (i.e. counterfeit drugs).
Finally, non-compliance with the therapeutic regime is essential. Overall, in malaria management, it is
important to follow the three-fold approach (T3) suggested by the World Health Organization (WHO) and
which refers to the implementation of the following pivotal activities in malaria management: Test, Treat,
and Track. (46) As we will see further below, the NMCP in Ecuador (SNEM) has established mechanisms

28
of diagnosis and treatment decentralization making these two important steps more available.
Additionally, at least in the province of Esmeraldas, treatment is initiated under direct observation by the
local healthcare worker and a log of drug administration at home is kept to verify that the patient has
complied with the treatment regime in a process that at least partly resembles the directly observed
therapy strategy (DOTS) used in the management of tuberculosis, which has been shown to be effective
in reducing tuberculosis-associated morbidity and mortality. (47, 48)
1.5 Timely malaria treatment
The World Health Organization recommends Artemisinin-based Combination Therapy (ACT)
plus primaquine to treat P. falciparum infections and chloroquine plus primaquine to treat P. vivax cases
wherever parasites are still sensitive to these drugs. (2) One of the advantages of ACT is that it produces
faster clinical relief in addition to fast and effective parasite clearance attained by the fast-acting
artemisinin-derivative coupled with longer acting partners which ensure elimination of any potential
residual plasmodia. (45, 49) Additionally, ACT has been proven to display gametocytocidal activity
against P. falciparum parasites in several studies in Africa, a trait that has been suggested to potentially
limit parasite transmission (45) since gametocytocides or sporontocides have been considered useful in
limiting the transmission of malaria parasites in endemic areas. (33)
Nonetheless, despite these likely benefits it is highly recommended that the efficacy and safety of
the therapeutic regimes being administered are continuously monitored locally in order to facilitate
evidence-based decision making by the corresponding authorities. (45) In fact, a recent paper by Abuaku
et al suggests that a newly introduced ACT (Artemether – lumefantrine [AL]) was efficacious in inducing
parasitological and clinical clearance among children under 5 years of age in Ghana. (45). On the other
hand, the observed uneven clearance rate achieved in different ecological zones raised concerns about the
possibility of resistant parasite emergence. (45) This study highlights the importance of conducting
research to clarify the local patterns of clinical and parasitological effectiveness of the drugs being used.
Similarly, another study conducted in Ethiopia showed that the PCR-corrected recrudescence rate per-

29
protocol among children younger than 5 years at day 42 was close to 10%, demonstrating the need for
drug efficacy monitoring as recommended by the WHO. (49)
Another important aspect of treatment that must be considered is compliance. High levels of
compliance or adherence have been associated with positive outcomes in other infections like tuberculosis
and HIV. (47, 48, 50-54) Such outcomes include treatment success, clinical improvement and the
prevention of resistance, disease progression and death. (47, 48, 50-54) In fact, the Directly Observed
Therapy Strategy (DOTS), a strategic treatment approach for tuberculosis, has been shown to reduce the
transmission of resistant tuberculosis and to improve health outcomes among infected patients. (47, 48) In
malaria, treatment compliance has also been evaluated. A study conducted in the Brazilian Amazon
region showed that poor compliance with last malaria treatment (CMT) was associated with the
occurrence of subsequent malaria episodes among individuals assumed to be less immune (i.e. those with
a recently diagnosed first episode of malaria ever or those who had an “increased number of malaria
episodes” in the previous 2 years). (55) However, the same association was not observed among “more
immune” individuals (i.e. first episode of malaria happened more than 4.5 years previous to interview or
with few or no malaria episodes in the previous 2 years). (55)
Finally, it is important to consider the post-treatment gametocyte dynamics since, as mentioned
before, gametocytemia levels correspond with risk of malaria transmission. A study conducted in Ghana
showed that P. falciparum gametocyte levels are usually very low/undetectable after 3 days post-
treatment leading to a very low proportion of children with gametocytes. (45) Moreover, the proportion of
children with gametocytes decreased even further, to almost zero, after day 7 post treatment. (45) On the
other hand, reports suggest that P. falciparum gametocytemia levels are higher among patients with
treatment failure or patients who require longer time to clear asexual parasites. (37)
Although to the best of our knowledge no study has evaluated the impact of early malaria
treatment on circulating gametocyte levels, some studies have looked at the impact on other malaria-
related indexes. For instance, a study conducted in rural areas of Burkina Faso has shown that the
implementation of community-based schemes to provide prompt malaria treatment was associated with a
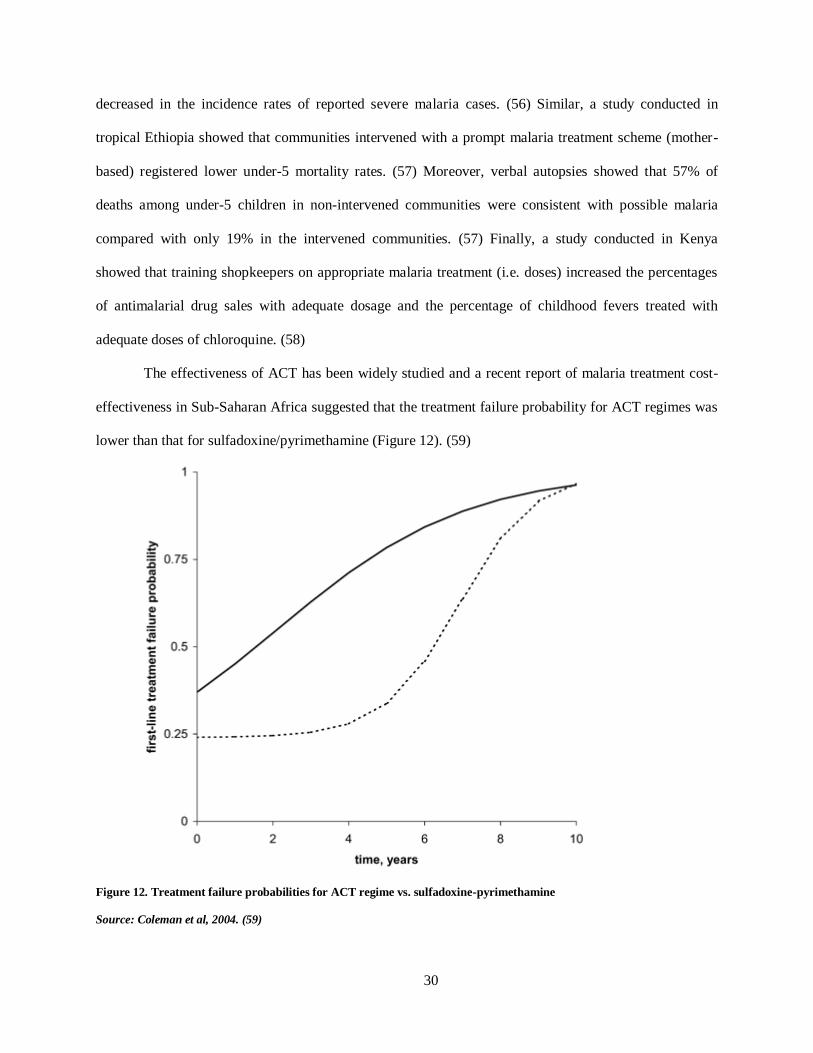
30
decreased in the incidence rates of reported severe malaria cases. (56) Similar, a study conducted in
tropical Ethiopia showed that communities intervened with a prompt malaria treatment scheme (mother-
based) registered lower under-5 mortality rates. (57) Moreover, verbal autopsies showed that 57% of
deaths among under-5 children in non-intervened communities were consistent with possible malaria
compared with only 19% in the intervened communities. (57) Finally, a study conducted in Kenya
showed that training shopkeepers on appropriate malaria treatment (i.e. doses) increased the percentages
of antimalarial drug sales with adequate dosage and the percentage of childhood fevers treated with
adequate doses of chloroquine. (58)
The effectiveness of ACT has been widely studied and a recent report of malaria treatment cost-
effectiveness in Sub-Saharan Africa suggested that the treatment failure probability for ACT regimes was
lower than that for sulfadoxine/pyrimethamine (Figure 12). (59)
Figure 12. Treatment failure probabilities for ACT regime vs. sulfadoxine-pyrimethamine
Source: Coleman et al, 2004. (59)

31
According to the World WHO, there are four main strategies to fight against malaria, among
these four we find: 1) confirmation of malaria diagnosis through microscopy or RDTs for every suspected
case, and 2) timely treatment with appropriate antimalarial drugs. (60) It is our contention that timely
treatment can only be achieved if timely diagnosis is in place and that timely treatment of malaria cases
would lead to lower circulating gametocyte loads and therefore lower probability for disease transmission
finally translating into lower malaria incidence rates.
As explained earlier, the release of the first batch of gametocytes (and this may not necessarily
mean very large numbers of gametocytes) coincides with the onset of symptoms for P. vivax infections,
however, in P. falciparum infections it occurs at least 2 days, and most probably 7 days, after onset of
symptoms. This is corroborated by certain studies showing that gametocytemia rate at diagnosis is as low
as 9% for P. falciparum and 52% for P. vivax.
1.6 Environmental factors associated with malaria transmission
Malaria is a vector-borne disease and therefore factors that alter vector abundance are likely to
influence malaria transmission and prevalence rates. Environmental factors (including vegetation
coverage and other vegetation-related attributes) are associated with tropical vector-borne disease
dynamics. (23) For instance, it has previously been shown that the water quality and features of the
aquatic habitats are associated with anopheline larval abundance (22, 23) and that seasonal variation in
anopheline larval and adult mosquito abundance is related to type of aquatic habitat.(23, 61) Variables
affecting mosquito populations may include rainfall, temperature and humidity, among others, which are
briefly discussed below.
1.6.1 Rainfall
Malaria-transmitting mosquitoes require aquatic habitats in order to complete their life cycle and
ensure reproduction/population growth. Rainfall is an important factor affecting the availability and
distribution of these aquatic habitats and it is widely known that malaria transmission shows usually a

32
seasonal pattern. (36) For instance, in Ecuador and elsewhere, most of the cases occur during the rainy
season.
1.6.2 Humidity
Humidity is a measure of the amount of water vapor in the air and it may interact with other
climate variables like rainfall and wind. Relative humidity, which might be related to other environmental
variables, may also affect mosquito growth and it has been reported that, over 60%, increasing levels of
relative humidity are associated with increased adult mosquito longevity. (36) Furthermore, Li et al
(2013) demonstrated that per each percent increase in relative humidity a corresponding 3.99% increase
in malaria cases could be observed in Guangzhou, China. (62)
1.6.3 Temperature
Temperature is a key variable for the appropriate development of mosquitoes throughout their
different life cycle stages. Mosquitoes usually require both a warm and humid environment to reproduce
and proliferate; therefore, temperature is likely to affect the number of malaria cases in any given region
or city. In the same study by Li et al (2013) mentioned above, it was shown that per each degree Celsius
increase in temperature there was a 0.90% increase in the number of malaria cases. (62)
Temperature affects generation time of anophelines (e.g. time between oviposition, from
oviposition to adults and from emergence to oviposition) and it is believed that a range between 20-30°C
is favorable for their growth, with increasing temperatures being associated with shorter generation time.
For instance, the generation time for An. gambiae sensu lato is shortened to 12-13 days at high
temperatures within that range whereas at low temperatures it may be increased to 2-3 weeks. (36)
Similarly, at favorable temperatures An. gambiae and An. arabiensis can achieve high rates of aquatic
development which permits their development in temporary water pools before vegetation, pollution,
competitors or predators can take away that opportunity. (36) Higher temperatures are also associated
with increased adult vector mortality; however, this effect is swamped by the reduced generation times
observed. (36)

33
Temperature also has an effect on the duration of the sporogony as shown by the fact that, when
temperature is held constant at any point, the duration of the extrinsic cycle ranges from shorter to longer
as follows: P. vivax, P. falciparum, P. ovale and P. malariae. (36) This relationship may be modulated by
vector species; for instance, at 25°C the sporogonic cycle is shortest in An. freeborni for all Plasmodium
species including P. vivax (11 days as opposed to 12 days on other vectors) and P. falciparum (12 days as
opposed to 14 days on other vectors). (36) Additionally, there is a minimum temperature at which the
sporogonic cycle can be completed within the vector, although there is no consensus on the exact
temperature, the estimated minimum temperature is 14.5 – 15°C and 16°C-19°C for P. vivax and P.
falciparum, respectively. (36) Interestingly, throughout the year, the environment temperature in the city
of Esmeraldas is, on average, above 25°C with minimum variation (1°C) over the seasons. (63)
1.6.4 Vegetation
Vegetation-related attributes have previously been shown to be associated with anopheline larval
abundance. (23) Vegetation offers both nutrients and coverage for mosquito habitats and is therefore
essential in their development. It is likely that, by affecting mosquito populations, vegetation-related
variables may affect malaria transmission.
1.6.5 Aquatic Habitats
Abundance of anopheline larvae and mosquitoes is seasonal, and this variation may be dependent
on type of aquatic habitat. (23, 61) Aquatic habitats are essential in mosquitoes’ life cycle since
mosquitoes oviposit their offspring on water and will spend their next two stages (i.e. larvae and pupae)
of their life cycle under water. The availability of aquatic habitats depends on other variables like rainfall
and man-made environmental changes.
1.6.6 Hydrographic modifications
Water resource management projects (e.g. construction of a dam and irrigation development
projects) might be associated with an increase in both mosquito populations and malaria incidence as a
result of the environmental and socioeconomic modifications introduced by them. (64-67) These

34
modifications might include one or more of the following: 1) the creation of permanently flooded habitats
which may lead to an aggravation or to a modification of diseases patterns (i.e. from seasonal to
permanent or the appearance of a new agent) (65, 68, 69); 2) human migration which might also influence
disease pattern and help to explain the observed increase in disease transmission (65, 70); and, 3) other
disease-favorable environmental modifications like construction of buildings, roads and deforestation.
(67) Therefore, it is important to include mitigation strategies and plan for vector control when
developing such projects. (67)
Furthermore, the environmental modifications related to water resource management projects
might be classified into two general types: 1) modifications in the ecosystem and 2) hydro-biologic
modifications. Ecosystem modifications include the creation of aquatic habitats and the creation of
supporting vegetation whereas hydro-biologic transformations are related to the persistence of such
favorable conditions throughout the year. (65) Flooded habitats are problematic since in such habitats
mosquitoes may breed. An increase in mosquito population would in turn translate into an increased risk
of disease transmission in areas previously free of disease or else into a change in the pattern of
transmission from seasonal to perennial. (64, 68, 69) There are many possible explanations to that
increase in flooded habitats. In many occasions, budget constrictions, especially in developing countries
like in Sub-Saharan Africa, lead to sub-standard engineering practices which may in turn lead to the
creation of such flooded habitats. For instance, the construction of the Lagdo dam on the Benue River was
accompanied by a waste water management scheme whereby the natural floodplain depressions were
used for drainage. (70) These depressions became permanent marshy areas where disease transmitting
agents, including anopheline mosquitoes, flourished. (66, 68) Examples like this abound; for instance, an
irrigation scheme in Zanzibar failed to plan for vector control leading to an increase of anophelines in the
affected areas which was already endemic for malaria. (67) Other examples where increased malaria
transmission has been suggested to be associated with the development of irrigation projects (e.g. dams)
include those in Cameroon, (71) Kenya, (72) Sri Lanka, (73) and Ethiopia. (74)

35
Albeit increasing malaria transmission have been described thus far, opposite experiences have
also occurred. The widely known Tennessee Valley water management project is a paragon of effective
malaria control through appropriate water resource management projects. (75) Additionally, a recent
report suggested that the construction of small dams have decreased malaria incidence in Orissa, India
mainly due to alterations of vector’s breeding sites. (76) Similarly, the construction of dams in northern
Cameroon was followed by a decrease in vector populations of both An. gambiae and An. funestus. (71)
In this case, however, dams in southern Cameroon had been associated with increase malaria
transmission. (71) This apparent dichotomy may be due to the fact that An. gambiae proliferates in
temporal pools during rainy season as opposed to permanent water bodies created by dams. (71) As far as
An. funestus is concerned, lack of vegetation in the irrigation projects of Northern Cameroon prevented
breeding of this vector; however, the shallow waters of the dams in the south favored its development.
(71)
Overall, the impact of irrigation and water management projects on malaria transmission will
depend both on dam construction specifications (i.e. size, drainage system, irrigation surface, local terrain
considerations like vegetation, temperature and humidity, etc.) and on local characteristics of disease
transmission, including which vector prevails and its life cycle habits like preferred oviposition and
breeding sites (i.e. permanent vs. temporary water bodies, temperature, turbidity, slow flows vs. rapid
flows, etc.). Consequently, it is important to include provisions for the management of the impact on
malaria and other diseases when planning new irrigation projects. (67)
It is important to mention that an “epidemiological paradox” may occur whereby an increase in
anopheline populations does not translate into increased transmission and disease rates as has been
observed in at least two different regions of Burkina Faso and Ivory Coast, probably due to a natural
regulation of mosquito populations with reduced lifespan as a measure to offset the increased population
density which in turn may reduce the possibility of disease transmission. (65) In fact, despite an observed
increase in anophelines, the overall number of malaria cases and the prevalence of malaria in children

36
under five years of age were lower in irrigated rice cultivation areas when compared to irrigated
sugarcane fields and traditionally cultivated maize in Tanzania. (77)
1.6.7 Deforestation and road construction
The construction of new roads has been associated with changes in the disease pattern and
transmission dynamics in tropical areas of the world. (78, 79) Among other factors associated with this
activity, deforestation may have an important impact on health. It is believed that deforestation favors the
creation of new habitats for malaria vectors including An. gambiae in Africa. (80) Similarly, road
construction-associated deforestation has been associated with increased malaria transmission in the
Brazilian Amazon rainforest. (81) A recent study conducted in the Brazilian Amazon identified paved and
unpaved roads, forest fires and deforestation through means of selective logging as risk factors for
increased malaria transmission. (82) Similar, malaria transmission around the Iquitos-Nauta road corridor
seems to have been favored by the creation of new breeding sites for An. darlingi after the construction of
this highway. (83) Finally, road construction is usually followed by migration of both laborers and
newcomers to the areas recently open to traffic which, in turn, pose the double risk we previously
described; namely, the advent of non-immune people to an area of malaria transmission and the
possibility of introducing new strains, including resistant strains, into an area with dense mosquito
populations, both cases leading to increased malaria-related morbidity and mortality. (84) On the other
hand, new roads may facilitate access to healthcare for people living in otherwise remote locations; such
increased access may improve malaria diagnosis and treatment, such is one of the contentions of the study
proposed in this document.
1.7 Socioeconomic factors associated with malaria transmission
In addition to the environmental factors described earlier, there are several socioeconomic factors
that may be associated with malaria transmission. It is widely accepted that impoverished communities,
especially in Sub-Saharan Africa, are the greater sufferers from malaria morbidity and mortality.
Although most of these communities are characterized by having the appropriate climatic and

37
environmental conditions for vector development it is also likely that poor socioeconomic development
made possible these conditions to accrue in detriment of the health status in these communities through
malaria infection.
Important factors to be considered are agricultural and other economic activities which might be
associated with changes in landscape and environment that may in turn lead to changes in disease
transmission and vector abundance dynamics in tropical settings (i.e. rice farms, shrimp farms, irrigation
development projects, etc.) (19, 23, 61, 64, 68, 85-87). Due to the complex interactions between these
factors and human health it is expected that they will also affect malaria transmission. These changes may
be gauged by means of Land Use/Land Cover and Vegetation Indexes analyses. In the following
paragraphs, a brief description of such factors is made.
1.7.1 Agriculture
Several authors have shown how agricultural and other economic activities may be associated
with changes in disease transmission and vector abundance in tropical settings.(19, 23, 61, 85-87) For
instance, rice cultivation has been followed by an increase in An. gambiae populations across Africa and
in Central Asia.(64, 77, 88) Other types of crops, including cotton, sugarcane and wheat, have also been
implicated in increasing malaria transmission in African countries. (77, 85) In addition to an increase in
vector population as a result of irrigation and flooding, other modifications induced by these practices are
also likely to affect malaria transmission. For example, it has been reported an increase in insecticide
resistance among anophelines in Northern Cameroon due to the use of pesticide in cotton plantations. (70,
89) Similarly, increased resistance due to agricultural use of insecticides has been observed in West
African nations. (90, 91) However, the risk of malaria transmission associated with agricultural activities
is hard to gauge and it is probable that a combination of factors are responsible for the observed
differences; thus, a multivariable, comprehensive mitigation approach should be implemented in
conjunction with expanding agriculture in at-risk areas.
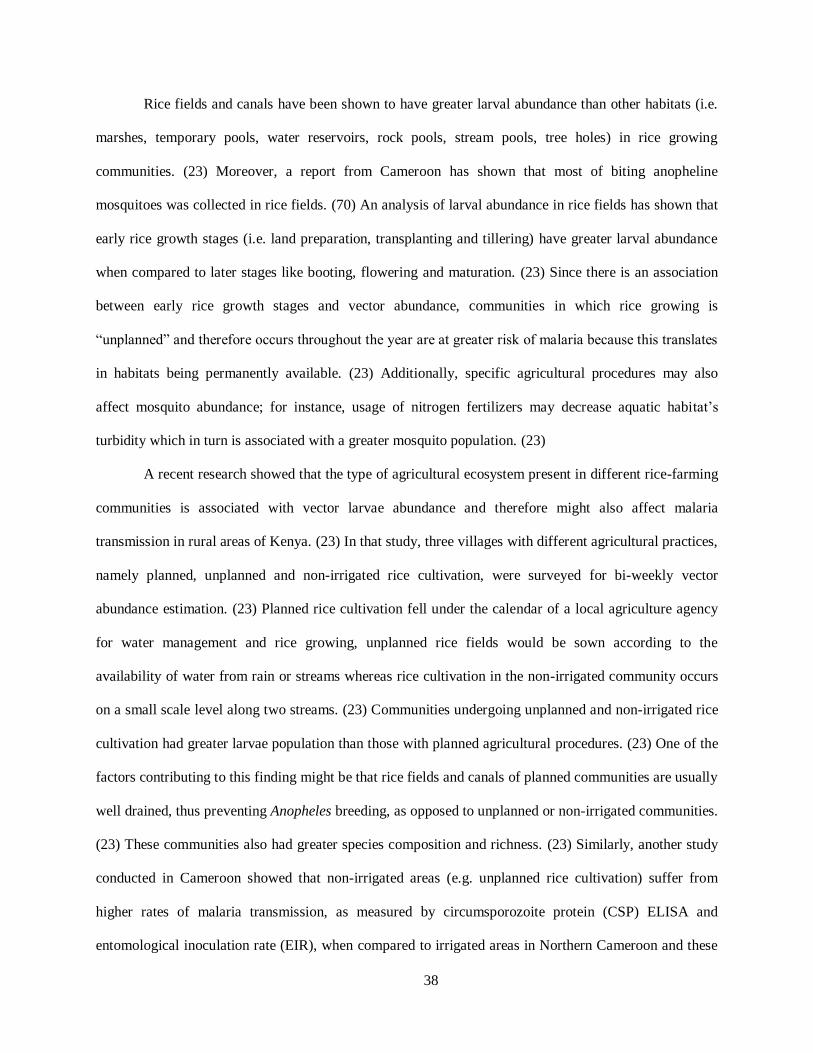
38
Rice fields and canals have been shown to have greater larval abundance than other habitats (i.e.
marshes, temporary pools, water reservoirs, rock pools, stream pools, tree holes) in rice growing
communities. (23) Moreover, a report from Cameroon has shown that most of biting anopheline
mosquitoes was collected in rice fields. (70) An analysis of larval abundance in rice fields has shown that
early rice growth stages (i.e. land preparation, transplanting and tillering) have greater larval abundance
when compared to later stages like booting, flowering and maturation. (23) Since there is an association
between early rice growth stages and vector abundance, communities in which rice growing is
“unplanned” and therefore occurs throughout the year are at greater risk of malaria because this translates
in habitats being permanently available. (23) Additionally, specific agricultural procedures may also
affect mosquito abundance; for instance, usage of nitrogen fertilizers may decrease aquatic habitat’s
turbidity which in turn is associated with a greater mosquito population. (23)
A recent research showed that the type of agricultural ecosystem present in different rice-farming
communities is associated with vector larvae abundance and therefore might also affect malaria
transmission in rural areas of Kenya. (23) In that study, three villages with different agricultural practices,
namely planned, unplanned and non-irrigated rice cultivation, were surveyed for bi-weekly vector
abundance estimation. (23) Planned rice cultivation fell under the calendar of a local agriculture agency
for water management and rice growing, unplanned rice fields would be sown according to the
availability of water from rain or streams whereas rice cultivation in the non-irrigated community occurs
on a small scale level along two streams. (23) Communities undergoing unplanned and non-irrigated rice
cultivation had greater larvae population than those with planned agricultural procedures. (23) One of the
factors contributing to this finding might be that rice fields and canals of planned communities are usually
well drained, thus preventing Anopheles breeding, as opposed to unplanned or non-irrigated communities.
(23) These communities also had greater species composition and richness. (23) Similarly, another study
conducted in Cameroon showed that non-irrigated areas (e.g. unplanned rice cultivation) suffer from
higher rates of malaria transmission, as measured by circumsporozoite protein (CSP) ELISA and
entomological inoculation rate (EIR), when compared to irrigated areas in Northern Cameroon and these

39
areas, in turn, endured higher transmission when compared to urban areas. (70) Another study comparing
irrigated rice, sugarcane and non-irrigated maize cultivation showed that despite increases in vector
populations rice and sugarcane cultivated areas had lower prevalence of malaria among children under
five years of age. (77) An analysis of the factors affecting these patterns showed that presence of other
invertebrates, distance to nearest homestead, (70) depth and water turbidity were the best predictors for
larvae abundance. (23) However, the risk of increase in malaria transmission seems to depend on the base
line status of the affected communities. Thus, in areas of stable transmission rice fields/planned
agriculture do not seem to increase risk of malaria however in areas of unstable transmission, where anti-
malaria immunity is limited, rice field agriculture may be associated with epidemic outbreaks of malaria.
(65, 85) Examples of the first case can be found in some areas of Burkina Faso, Ivory Coast and
Cameroon whereas the highlands and desert borders in Africa, like some areas of Burundi and
Madagascar, have experienced increase malaria as a result of rice cultivation. (65, 85) Replacement of
highly anthropophilic and endophilic An. funestus by An. arabiensis, which is a less competent vector,
might be one of the reasons explaining why irrigation schemes do not increase, or even decrease, malaria
cases in areas of stable transmission. (85) Furthermore, areas of irrigated agriculture are more used to
mosquito nuisance and therefore more habituated to use of protective measures. (80, 85) Additionally, as
opposed to more “rural”, less privileged, unplanned agriculture communities, these projects usually result
in wealth generation and improved sanitation infrastructure and coverage which turn into greater use of
bed nets and access to treatment and care with the consequent reduction in malaria burden. (80, 85)
As mentioned earlier, not only rice cultivation has been incriminated in increased malaria
transmission. In fact, rice-free areas of large-scale agricultural programs like the Gezira-Managil area in
Sudan, where cotton, wheat and sorghum had been planted, have seen outbreaks of malaria. (85) In this
irrigation/agricultural intervention a change in malaria transmission pattern from seasonal to perennial
was observed. (69) Additionally, the surface area of arable land more than doubled since its establishment
with the consequent increase in malaria mosquito breeding habitats. (85) Insecticide resistance developed
in mosquito, probably as a result of selection pressures imposed by local agricultural practices. (69) Other

40
areas of cotton cultivation, like the Hola cotton and vegetable scheme in Kenya, have reported increase in
malaria transmission. (85) Finally, sugarcane cultivation has also been associated with an increased in
malaria incidence. (85) A report from Swaziland suggests that defective drainage systems in sugarcane
cultivation fields might have been responsible for an increase in the population of An. gambiae sensu lato,
the local malaria vector. (85) Other areas where sugarcane cultivation has been suggested to be associated
with high number of malaria cases or transmission include Tanzania and (77) Kenya. (92)
1.7.2 Aquaculture and Shrimp farming
Shrimp farming is an important income-generating activity in coastal areas of the tropics. There
are several anophelines that have adapted to living in salt-water and coastal conditions like An. merus in
Africa or An. sundaicus in East Asia. (36, 93) It has been reported that shrimp farming may facilitate
vector breeding in Vietnam, especially of those vectors adapted to breed in the ponds and ditches filled
with brackish waters in shrimp farms. (94) In these habitats, anopheline larvae are associated with
floating algae right below surface where they are both protected from predator fish and nurtured in an
comfortable environment with right temperature. (94) Anophelines, specifically An. albimanus, have also
been reported to thrive around shrimp farms in the coast of Ecuador. (95) In summary, both intensive or
extensive shrimp farming, as is the case of Ecuador or Vietnam, respectively, are believed to increase
malaria transmission through environmental modifications affecting primordially mangrove-associated
swamps. (96) However, similar to irrigation and agriculture, a generalized assumption of the association
between shrimp farming and malaria cannot be made since several local variables might affect the way
shrimp rearing impact malaria; for instance, if the local vector breeds in freshwater, shrimp farms may
reduce malaria transmission especially if after various cycles the salt-water vector loses competency like
it seemed to have happened in Mekong, Vietnam. (93, 97) In places where shrimp farms increase malaria,
like in the Mekong Delta, conservation of mangroves has been recommended to reduce vector breeding
sites at shrimp farms. (98)
41
Similarly, pisciculture has been incriminated in malaria transmission in the Amazonian rainforest
of Peru. Fish ponds, especially those abandoned, may create breeding habitats for anophelines. (99)
Similarly, increased detection of An. gambiae and An. funestus has been reported in abandoned fishponds
of Kenya. (99) It would seem that the presence of fish on active fishponds prevent the reproduction of
anopheline mosquitoes. (99) In fact, when abandoned fishponds were repopulated with Oreochromis
(Tilapia) niloticus, which is a larvivorous fish, mosquito densities dropped as compared to untreated
ponds. (100)
1.7.3 Population Density and Human Migration
The association between host population density and malaria infection has been suggested at least
for avian malaria. (101) It is likely that overcrowding may help facilitate disease transmission by
increasing the number of available subjects for mosquito biting and therefore of available susceptible
individuals for malaria infection although this hypothesis needs further investigation. In fact, the
construction of a dam and the creation of irrigated land cultivation fields in an area of northern Cameroon
resulted in major migration of people followed by increased number of human malaria cases. (64, 70,
102) This correlates well with the higher CSP rate among mosquitoes captured during the rainy season in
urban areas when compared to those captured in rural areas. (70)
Another important aspect to consider is the temporal migration of people due to work. It has been
suggested that the migration of naïve populations into malaria endemic areas, for instance when a new
irrigation or oil project is being developed, may result in an alteration of disease transmission patterns due
to a sudden increase in susceptible reservoirs or hosts. (65) Moreover, in many times these workers are
moved in with their families, including women and children, the most vulnerable populations. Additional
factors that may favor malaria transmission in such situations include poor housing conditions of
newcomers, overburden of already weakened local health systems and the potential for some immigrants
to be actually parasite carriers, including chloroquine-resistant strains, and ergo serve as reservoirs of the
disease. (85) However, the risk measurement is not straightforward and it includes the susceptibility and

42
immunity of the incoming population and the endemicity of the disease on one hand and the development
and improvement in infrastructure, including health infrastructure serving the local populations, in the
other hand. (65) This section focused on rural population density, the effects of population density on
malaria transmission in urban centers are discussed below.
1.7.4 Globalization and modern transportation
Modern transportation may facilitate disease transmission. Several diseases and outbreaks are
believed to be related to movement of pathogens and/or vectors through modern transportation vehicles
including ships and planes. International and intercontinental travel is indeed nowadays easy in a matter
of few hours a completely new favorable niche may be reached by pathogens and vectors establishing
new epicenters of disease activity thousands of miles away from their point of origin. For instance, the
relatively recent and new outbreak of West Nile Virus (WNV was probably introduced into New York
through frequent international air travel between Israel and the city. (103) Similarly, it would seem that
the construction of airports in French Polynesian Islands facilitated the importation not only of goods but
also of A. aegypti and consequent outbreaks of Dengue Fever. (80) Regarding anophelines, it is believed
that small planes introduced An. gambiae into oasis of Algeria from Niger and Mali, although the species
never established there. (80) Similarly, it has been reported that An. gambiae sensu lato was introduced
into Brazil from Dakar by postal ships in the early XX century. (80)
1.7.5 Urbanization
Until now, all anthropogenic changes analyzed have had a negative impact on health as it relates
to malaria. In other words, all human-made activities we have analyzed so far are usually associated with
an increase on vector population, malaria transmission, incidence rates, or all. However, there are some
anthropogenic changes or activities that might be associated with a decrease on malaria. It is generally
accepted that malaria transmission is lower in urban centers than in rural villages. Urbanization might
reduce malaria transmission, especially in Africa, by means of both reduced habitat and increased water
pollution. (80) Another factor that may play a role is an increased access to healthcare in urban settings

43
which may lead to increased malaria diagnosis and treatment. For instance, the number of infective bites
per person per year in Burkina Faso ranges from 150 in Bobo-Dioulasso (rural) to 4 in the suburbs and to
0.5 in downtown. (80) One important exception would be the urban transmission of malaria by An.
stephensi in south India. (80)

44
Chapter Two: Justification, Hypotheses and Objectives
2.1 Justification
Malaria is a disease that causes a heavy burden in public health globally and it is estimated that
around half of the world’s population live in areas of increased risk for transmission. In Ecuador, malaria
is caused by two species of malaria parasites: Plasmodium falciparum and Plasmodium vivax. Although
the number of cases of malaria has been significantly reduced during the last 12 years in Ecuador, malaria
continues to be transmitted every year in a few localized geographical foci. Among those foci,
Esmeraldas Province represents the only place where both P. falciparum and P. vivax remain active,
although in reduced rates as compared to year 2,000. It is important to understand what may help continue
this pattern of reduced transmission if we are ever to control this disease. It has been postulated in the past
that gametocytes play an important role in continuing transmission and therefore reduced gametocytemia
would lead to reduced number of incident cases. Therefore, understanding the dynamics of gametocyte
production and factors affecting it might prove instrumental. As explained earlier, the release of the first
batch of gametocytes (and this may not necessarily mean very large numbers of gametocytes) coincides
with the onset of symptoms for P. vivax infections, however, it occurs at least 2 days after, and most
probably 7 days after, onset of symptoms in P. falciparum infections. This is corroborated by certain
studies showing that gametocytemia rate at diagnosis is as low as 9% for P. falciparum and 57% for P.
vivax. (38) Considering this gametocyte dynamics and considering the fact that current malaria regimes in
Ecuador (i.e. ACT + primaquine for P. falciparum and Chloroquine + primaquine for P. vivax) have
important gametocytocidal effects, this research proposes to study the effect of timely malaria treatment
(i.e. treatment initiated within 2 days of onset of symptoms) in the incidence rates of malaria in Ecuador,
both at the national level and within the province of Esmeraldas. It is this study’s contention that earlier
diagnosis and treatment for malaria infections in Esmeraldas, as a result of decentralization efforts made

45
by the SNEM in Ecuador, may be associated with lower gametocyte counts and therefore decreased
transmission (i.e. lower incidence rates).
2.2 Hypotheses
2.2.1 Primary hypothesis
Timely malaria treatment (defined as time elapsed from symptom onset to time of start of
antimalarial treatment no greater than 2 days) is associated with the levels of gametocytemia
at days 5,7,14, 21 and 28
2.2.2 Secondary hypothesis
Timely malaria treatment is associated with lower malaria incidence rates during the
subsequent malaria season.
2.3 Objectives
2.3.1 General
To determine whether there is an association between timely malaria treatment, levels of
gametocytemia and malaria transmission
2.3.2 Specific
To calculate the levels/presence of gametocytemia at days 5, 7, 14, 21 and 28 among patients
diagnosed with malaria and who received treatment within 2 days of symptom’s onset, and
compare it with the levels of gametocytemia at the same days among patients who received
treatment either between 3-7 days or after 7 days from onset of symptoms.
To determine whether there is an association between timely malaria treatment (i.e. treatment
within 2 days of onset of symptoms) and malaria incidence rates during the subsequent
malaria season both at a national level and within the Province of Esmeraldas.

46
Chapter Three: Materials and Methods
3.1 Study design
In order to test the primary and secondary hypotheses, this research was conducted using two
different study designs: a retrospective cohort and an ecologic study.
3.1.1 Retrospective Cohort
Retrospective cohort studies are designed to elucidate whether there is a causal association
between an exposure and an observed outcome based on historical records. (104) A retrospective cohort
study was conducted on all malaria cases reported by SNEM in the Province of Esmeraldas from July
2012 to March 2015. As per standard procedures, cases of malaria are reported and recorded, including
blood smears, by the local SNEM office and for all cases from July 2012 onwards all patients were
schedule for a total of five follow-up visits within a 28 days period. This study was designed according to
this standard SNEM protocol. A timeline including the main study activities is shown in Figure 13.
Figure 13. Study timeline for the retrospective cohort study
* Group 1 = Early treatment; Group 2 = Late treatment; Group 3 = Extremely late treatment

47
Patients were classified into three treatment groups according to the time elapsed from onset of
symptoms to treatment, as follows: 1) early treatment if treatment was received in the first 2 days; 2) late
treatment if received between 3 to 7 days; and, 3) extremely late treatment if treatment was administered
after 7 days. The day of diagnosis/treatment by SNEM was considered day 0, days before this event was
considered t minus and days after this event was considered day 1, 2, 3, etc. (Table 7 and Figure 13). As
explained earlier, a total of five post-treatment follow-up visits were schedule and during each visit a
blood sample was taken to diagnose the presence of trophozoites or gametocytes. The outcome variable
was gametocytemia during follow-up visits. A comparison of gametocytemia levels during follow-up
visits between and within treatment groups was performed. A summary of the activities conducted and the
time on which they were conducted is offered in Table 7.
Table 7. Study activities
Days Onset of
symptoms
Medical
interview
Diagnosis and
Treatment
Data Collection
Form
Blood smear
sample taken
T minus X
Day 0 X X X X
Day 5 (Follow-up 1) X X
Day 7 (Follow-up 2) X X
Day 14 (Follow-up 3) X X
Day 21 (Follow-up 4) X X
Day 28 (Follow-up 5) X X
NOTE: These activities are part of the standard care given by MoH through SNEM in Esmeraldas. Study subjects are
not required to undergo any extra activity and were not further contacted at all. This is a retrospective study done on
information already collected by the local office of SNEM in Esmeraldas.
In order to conduct the retrospective cohort study to evaluate the impact of early treatment in the
post-treatment gametocyte count in peripheral blood we accessed all historic records of malaria patients.
The records analyzed included information for the following variables: Health Post, Date of Blood
Sampling, Date of Symptoms onset, Age, Gender, Pregnancy status (if applicable), Gestational week (if
applicable), Ethnicity, Place of residence (province, district, parish, neighborhood/community/location),
Probable place of infection (province, district, parish, neighborhood/community/location), Malaria
species diagnosed, Parasite (i.e. trophozoite) density at diagnosis, Gametocytemia at diagnosis (i.e.
presence or absence of gametocytes at diagnosis and density, if applicable), Date of treatment onset,

48
Presence of other symptomatic patients in and around residence, Temporal residence in past month (i.e.
has the patient slept outside usual residence in the past month), Place of temporal residence, if applicable
(country, province, district, parish, community/neighborhood/location), Type of infection (i.e. indigenous
or imported), Prescribed treatment, Treatment graphic prescription (i.e. whether the patient received
SNEM’s recommended standard graphic explanation of the prescription), Treatment adherence to national
guidelines, Date of follow-up visit, Trophozoite count during follow-up visit, and Gametocyte count
during follow-up visit. For the last two variables, parasites (i.e. trophozoites and gametocytes) are counted
in number per 100 high-power fields as per standard SNEM procedures. A detailed description of the
operational definition of all study variables included in the retrospective cohort study is offered in Table
9.
The retrospective cohort study was designed considering the following variable matrix.
Figure 14. Variable matrix for the retrospective cohort study
3.1.2 Ecologic Study
An ecologic study is designed to evaluate associations between variables and populations (i.e.
group characteristics) rather than evaluating them at the individual level. (104) An ecologic study to
evaluate the hypothesis that timely malaria treatment is associated with low population gametocytemia
and lower incidences in the following season was conducted. The ecologic study was divided into two

49
levels of analysis: 1) Parish-level to study the differences among the parishes of the province of
Esmeraldas; and, 2) Province-level to study the differences among the provinces of Ecuador. The same
database used for the retrospective cohort was used in the parish-level analysis whereas a national
database including all cases of malaria reported to the SNEM headquarters between January 2012 and
December 2014 was utilized in the province-level analysis. A detailed description of the operational
definition of all study variables included in the ecologic study is offered in Table 10.
Parishes in Esmeraldas as well as provinces in Ecuador were characterized as early, late or
extremely late treatment based on the mean time to treatment for any given period. The association of
treatment with gametocytemia as well as with incidence rates occurring in the next season was then
evaluated using a negative binomial regression. The ecologic study was designed to evaluate the
following variable matrix.
Figure 15. Variable matrix for the ecologic study
3.2 Study population
This study was conducted on data corresponding to all patients recorded and reported by the local
SNEM Office in the Province of Esmeraldas. Esmeraldas is a province located in the northwest of
Ecuador, having borders with Colombia to the north, the Provinces of Carchi, Imbabura and Pichincha to
the east, the Province of Manabí to the south, and the Pacific Ocean bathes to the west. Esmeraldas has a
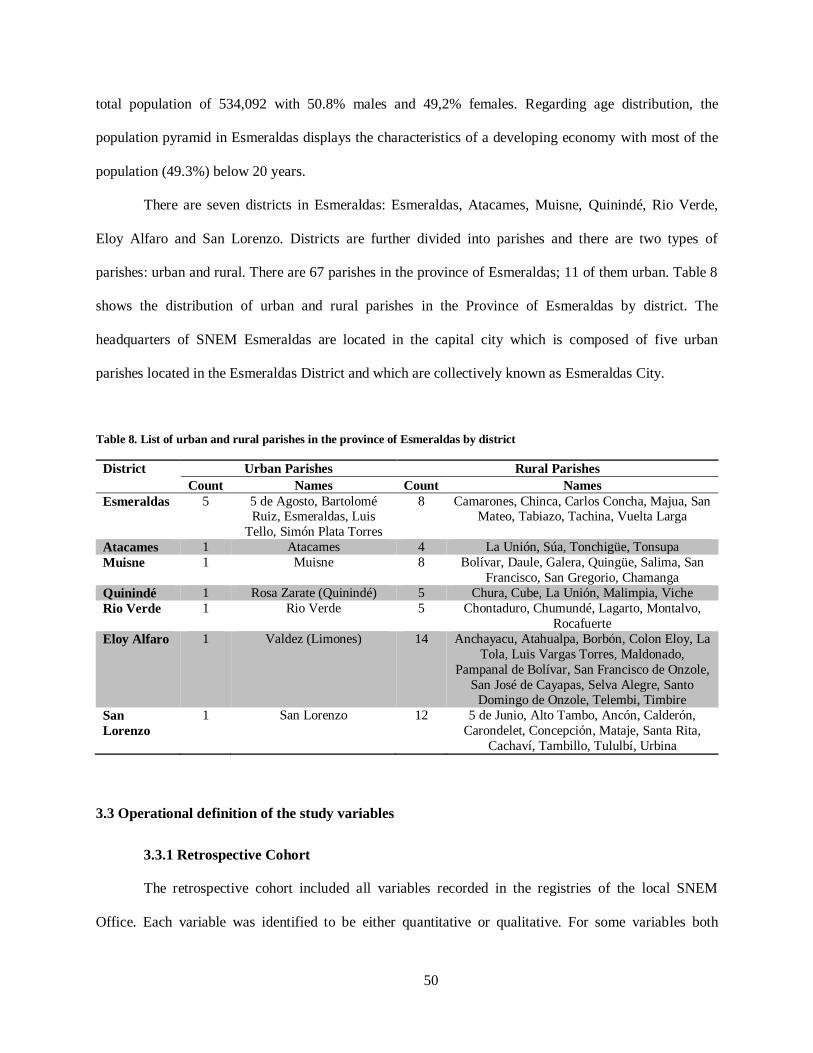
50
total population of 534,092 with 50.8% males and 49,2% females. Regarding age distribution, the
population pyramid in Esmeraldas displays the characteristics of a developing economy with most of the
population (49.3%) below 20 years.
There are seven districts in Esmeraldas: Esmeraldas, Atacames, Muisne, Quinindé, Rio Verde,
Eloy Alfaro and San Lorenzo. Districts are further divided into parishes and there are two types of
parishes: urban and rural. There are 67 parishes in the province of Esmeraldas; 11 of them urban. Table 8
shows the distribution of urban and rural parishes in the Province of Esmeraldas by district. The
headquarters of SNEM Esmeraldas are located in the capital city which is composed of five urban
parishes located in the Esmeraldas District and which are collectively known as Esmeraldas City.
Table 8. List of urban and rural parishes in the province of Esmeraldas by district
District Urban Parishes Rural Parishes
Count Names Count Names
Esmeraldas 5 5 de Agosto, Bartolomé Ruiz, Esmeraldas, Luis
Tello, Simón Plata Torres
8 Camarones, Chinca, Carlos Concha, Majua, San Mateo, Tabiazo, Tachina, Vuelta Larga
Atacames 1 Atacames 4 La Unión, Súa, Tonchigüe, Tonsupa
Muisne 1 Muisne 8 Bolívar, Daule, Galera, Quingüe, Salima, San
Francisco, San Gregorio, Chamanga
Quinindé 1 Rosa Zarate (Quinindé) 5 Chura, Cube, La Unión, Malimpia, Viche
Rio Verde 1 Rio Verde 5 Chontaduro, Chumundé, Lagarto, Montalvo,
Rocafuerte
Eloy Alfaro 1 Valdez (Limones) 14 Anchayacu, Atahualpa, Borbón, Colon Eloy, La
Tola, Luis Vargas Torres, Maldonado,
Pampanal de Bolívar, San Francisco de Onzole,
San José de Cayapas, Selva Alegre, Santo Domingo de Onzole, Telembi, Timbire
San
Lorenzo
1 San Lorenzo 12 5 de Junio, Alto Tambo, Ancón, Calderón,
Carondelet, Concepción, Mataje, Santa Rita,
Cachaví, Tambillo, Tululbí, Urbina
3.3 Operational definition of the study variables
3.3.1 Retrospective Cohort
The retrospective cohort included all variables recorded in the registries of the local SNEM
Office. Each variable was identified to be either quantitative or qualitative. For some variables both

51
quantitative and qualitative classifications were possible. For parasite and gametocyte density a semi-
quantitative categorization was possible based on the trophozoite /gametocyte count per 100 HPFs. Table
9 summarizes the operational definition of the main study variables.
Table 9. Operational definition of main variables for the retrospective cohort study
Variable Definition Information Source Scale
Timely to
treatment
Time elapsed between
symptoms’ onset and
treatment
Number of days
elapsed between
these two events
Patient or
guardian
when asked
Ratio AND
Ordinal: early, late,
extremely late
Age Time in years elapsed
since birth until interview
Number of years
elapsed since birth
until interview
Patient or
guardian
when asked
Ratio
Gender An individual’s sexual
identification
Gender
identification
Patient or
guardian when asked
Nominal:
Male, Female
Ethnicity An individual’s ethnical
identification
Ethnical
identification
Patient or
guardian
when asked
Nominal: Afro-
Ecuadorian, Mestizo,
Other
Residence Place where a person
lives
Physical address of
residence
Patient or
guardian
when asked
Nominal:
Urban-rural
Place of infection Probable place where a
person was infected
Physical address of
such place
SNEM
database
Nominal
Transmission
status
Case classification into
imported or indigenous transmission
Transmission status
classification
SNEM
database
Nominal:
Indigenous, imported
Parasite density Burden of parasites in the
blood sample
Number of parasites
per 100 HPF*
Technician,
SNEM data
base
Interval AND
Ordinal:
Very low, low, medium,
high and very high
Gametocytemia Presence of gametocytes
in blood
Number of
gametocytes per 100
HPF*
Technician,
SNEM data
base
Interval AND
Ordinal
Treatment Treatment Prescribed Idem SNEM data
base
Nominal
*HPF = High Power Field
3.3.2 Ecologic Study
The ecologic study was conducted by aggregating the number of cases per parish in Esmeraldas
or per province in Ecuador. Additionally, malaria incidence rate was calculated using the total estimated
population for the province or the parish based on data from Ecuador’s VI National Census in 2010. Data
was collected from the same provincial or national registries. Variables were identified as quantitative and
qualitative. Table 10 summarizes the operational definition of the main study variables.

52
Table 10. Operational definition of main variables for the ecologic study
Variable Definition Information Source Scale
Health Post Healthcare facility staffed by
SNEM or MoH personnel
Code of the Health Post SNEM data
base
Nominal
Health Post
location
Physical address that
determines the location of
the health post
Address of the Health Unit SNEM data
base
Nominal
Population
Gametocytemia
Rate
Percentage or proportion of
individuals in any given
population who contain
malaria gametocytes in their
blood
Proportion of
gametocytemia per parish
SNEM data
base
Ratio
Malaria
incidence rate
Number of new malaria
cases per 100,000 in any given period
Number of new malaria
cases per 100,000 pop per parish per period
SNEM data
base
Ratio
Time to
treatment
Time elapsed from
symptom’s onset to start of
treatment
Mean time to treatment per
parish
SNEM data
base
Ratio
3.4 Sample size
This study was conducted on all cases reported by the SNEM; therefore the study included the
whole universe of study subjects. As explained earlier, all cases of malaria are registered and recorded in
the Regional SNEM Offices in accordance to standard procedures in place. As per SNEM standard
procedures, data relating date of symptom onset and continuous follow-up until day 28 were collected
only from year 2012 onwards, including all variables listed in the study design section. All cases
registered in the Esmeraldas SNEM Office from July 2012 to March 2015 were considered eligible. In
total, the provincial database recorded 220 cases whereas the national database had 529 cases registered.
3.5 Data collection
Data was collected from the provincial SNEM office located in the city of Esmeraldas and from
the national SNEM headquarters. Historic records including date of onset of symptoms and date of
diagnosis and treatment, as well as all variables described in the study design section were reviewed. This
information was captured and recorded using data collection forms. Information regarding parasite
species and gametocyte count on days 0, 5, 7, 14, 21 and 28 was also recorded. Study subjects were not
required to undergo any extra activity and were not contacted at all. This was a retrospective cohort study

53
done on information and samples already collected by the local office of SNEM in Esmeraldas. In
addition, we analyzed a national database reporting all cases of malaria diagnosed and reported to the
SNEM headquarters between January 2012 and December 2014.
3.6 Data analysis
3.6.1 Retrospective Cohort
Data was entered into an excel spreadsheet and exported into Statistical Analysis System (SAS)
and Statistical Package for the Social Sciences (SPSS) for statistical analysis. The dependent variable
(gametocytemia during follow-up visits) and the independent variable (time elapsed from onset to
treatment) were treated first as continuous variables. Thereafter, as explained earlier, the independent
variable was coded into three different groups: 1) early treatment (less than 2 days); late treatment (3 to 7
days); and, 3) extremely late treatment (more than 7 days). Similarly, gametocytemia during follow-up
was coded into a binary variable (i.e. presence and absence). Other variables (e.g. age, gender, ethnicity,
etc.) were classified as appropriate into qualitative or quantitative variables. A repeated measures
ANOVA was used to analyze the relationship between follow-up gametocytemia (as a quantitative
variable) and time to treatment whereas a Chi-square test was performed to analyze the association
between treatment arm and follow-up gametocytemia (as a qualitative variable). To control for possible
confounders a series of regression models including binary logistic, linear, Poisson log linear and negative
binomial were fitted. Poisson log linear regression models were used to account for non-Gaussian
distribution of study variables and negative binomial models were fit to account for data over-dispersion.
A survival analysis was conducted to determine the association between malaria treatment arm and days
to gametocyte clearance from peripheral blood. Finally, a period of transmissibility was determined for
each treatment arm group based on the number of days during which gametocytes can be found in
peripheral blood. In order to do that, four days were subtracted from the mean time to gametocyte
clearance for each treatment arm group to account for the gametocyte-free period that occurs in the first

54
four days after symptom onset, as explained in Figure 10. Thereafter, a linear regression model was fit to
evaluate the association between treatment arm group and period of transmissibility.
3.6.2 Ecologic Study
Data was entered into an excel spreadsheet and exported into SAS and SPSS for statistical
analysis. Initially, an exploratory analysis was conducted by plotting GIS-based models displaying the
spatial distribution of malaria cases, malaria incidence rates and treatment arm groups for both the
province- and parish-level analysis. Descriptive statistics included total number of cases, malaria
incidence rates, mean time to treatment, treatment arm classification, and proportion of subjects with
follow-up gametocytemia. The dependent variable (incidence rate) and two of the independent variables
(mean time treatment and malaria incidence rate in previous period) were treated as continuous variables
whereas the last independent variable (population gametocytemia) was treated as a categorical variable. A
repeated measures negative binomial regression model was fitted to account for data over-dispersion.
3.7 Confidentiality and ethical considerations
This study was conducted in adherence to international bioethical norms, including the Helsinki
Declaration and Good Clinical Practices, in all applicable articles. Data was collected from records on the
provincial office of SNEM in Esmeraldas. The researchers had no direct contact with patients. Data
collected was strictly confidential and was used only for the purposes stated in this study. Data was not
shared with third parties and was not further distributed.
All study activities related to human subjects, including data and sample collection, are part of the
standard care given by MoH through SNEM in Ecuador and have already been completed by them. Study
subjects were not required to undergo any extra activity and they were not be contacted at all. This is a
retrospective cohort study done on information already collected by the local office of SNEM in
Esmeraldas and by the national SNEM headquarters.
Participants in this study were not exposed to any risk other than what they would usually incur
into their normal life, as a matter of fact they were not being contacted at all and the data related to their

55
condition was de-identified (with the exception of residence) and confidential. Additionally, they were
not subjected to any kind of experimentation (biological, medical, sociological or behavioral).Subjects
were not denied any right or title to which they would otherwise be entitled nor they were threatened or
coerced to participate in this study, once again, all data and samples had already been collected as per
current standard care given by the local SNEM office in Esmeraldas.
No identifier was recorded (with the exception of residence) in any study material. Additionally,
data analysis was conducted in a password-protected information system with back-up procedures.
3.8 Dissemination of results
The key contacts, who are members of the local SNEM office, as well as local MoH
representatives, will be offered a copy of the scientific reports produced which will be submitted
afterwards for publication in peer-reviewed journals.
3.9 Risks and benefits
There are no additional risks associated with taking part in this study and the potential benefits
include the improvement of the planning and evaluation stage of future research and public health
interventions for malaria in Esmeraldas and elsewhere in Ecuador and other malaria endemic areas. This,
in turn, would also eventually and theoretically directly benefit participants of this research.

56
Chapter Four: Retrospective Cohort
4.1 Baseline characteristics of study population
A retrospective cohort study was conducted including all cases diagnosed with malaria and
reported by the local SNEM office in the province of Esmeraldas between July 2012 and March 2015.
Five follow-up visits were schedule to occur at day 5 (follow-up visit 1 or FU1), day 7 (follow-up visit 2
or FU2), day 14 (follow-up visit 3 or FU3), day 21 (follow-up visit 4 or FU4) and day 28 (follow-up visit
5 or FU5) post-treatment.
A total of 220 cases were reported to the local SNEM Office in Esmeraldas between July 2012
and March 2015. Of them, 27 (12.3%) did not complete any follow-up visits and/or had incomplete files
and were not included in the analysis. Excluded patients did not differ significantly in any baseline
variable, except for province of origin and transmission status (i.e. imported vs. indigenous).
The remaining 193 patients attended a total of 1,000 visits (193 at diagnosis + 807 follow-up
visits). The mean number of follow-up visits in the study population was 4.18 + 1.31. During each visit, a
blood sample (i.e. thick smear) was taken to diagnose the presence of blood-stage malaria parasites,
including gametocytes. As explained in chapter three, patients were classified into early, late, or
extremely late treatment (i.e. treatment arm groups) if the time elapsed from onset of symptoms to
treatment was either within 2 days, between 3 to 7 days or more than 7 days, respectively. As shown in
Figure 16, thirty-nine patients (20.2%) received early treatment whereas 112 (58.03%) and 42 (21.76%)
were in the late and the extremely late treatment arms, respectively.
Several basic socio-demographic and malaria-related characteristics were recorded. Overall,
patients had a mean age of 25.8 + 15.28 years old. Most of the patients were males (54.4%) with a female
to male ratio of 1:1.2. Out of 88 females, only 9 were pregnant and, among them, the mean gestational
age was 21.1 + 7.8 weeks.

57
Figure 16. Study population by treatment arm
The majority of patients self-identified as Mestizos (61.1%), followed by Afro-Ecuadorians
(30.6%), white (7.3%) and indigenous (1%). Only 6 patients did not have permanent residence in the
province of Esmeraldas: 1 lived in Carchi and the other 5 in Colombia. Within the province of
Esmeraldas, the majority of cases (76.2%) originated among people residing in the District of Esmeraldas
whereas 19.2% of the cases were reported from San Lorenzo, 1% from Quinindé and 0.5% from Eloy
Alfaro. Interestingly, 20 cases (10.4%) were considered to be imported (i.e. the patient most probably
acquired the infection outside Esmeraldas, mostly in Colombia, either because of temporal or permanent
residence in those areas).
Table 11 shows that baseline characteristics were similar across all treatment arms, except for the
percentage of pregnant women which was highest among early treatment patients (26.3%) as compared to
1.9% among those in late treatment and 17.6% for the extremely late treatment group (p < 0.01, Monte
Carlo Exact Test).

58
Table 11. Baseline characteristics of study population by treatment arm
Characteristic Treatment arm p-value Statistical
test Early
n = 39
Late
n = 112
Extremely late
n = 42
Age
mean + SD
23.8 + 14.3
26.6 + 16.5
25.3 + 12.8
0.59
ANOVA Test
Ethnicity (3 categories)
Afro-Ecuadorian, n (%)
Mestizo, n (%)
Other, n (%)
11 (28.2)
26 (66.7)
2 (5.1)
34 (30.4)
68 (60.7)
10 (8.9)
14 (33.3)
24 (57.1)
4 (9.5)
0.91
Monte Carlo
Exact Test
Gender
Male, n (%)
Female, n (%)
20 (51.3)
19 (48.7)
60 (53.6)
52 (46.4)
25 (59.5)
17 (40.5)
0.73
Chi-Square
Test
Pregnant * Yes, n (%)
No, n (%)
5 (26.3)
14 (73.7)
1 (1.9)
51 (98.1)
3 (17.6)
14 (82.4)
<0.01
Monte Carlo Exact Test
Gestational age**
mean + SD
17.4 + 4.2
16 + undefined
29 + 8.2
0.14
Kruskal-
Wallis Test
Province of origin
Esmeraldas, n (%)
Other, n (%)
38 (97.4)
1 (2.6)
108 (96.4)
4 (3.6)
41 (97.6)
1 (2.4)
1
Monte Carlo
Exact Test
Province of infection
Esmeraldas, n (%)
Other, n (%)
36 (92.3)
3 (7.7)
104 (92.9)
8 (7.1)
39 (92.9)
3 (7.1)
1
Monte Carlo
Exact Test
Other symptomatic person Yes, n (%)
No, n (%)
18 (46.2)
21 (53.8)
44 (39.3)
68 (60.7)
19 (45.2)
23 (54.8)
0.68
Chi-Square Test
Where is that person?***
Neighbors, n (%)
Household, n (%)
3 (16.7)
15 (83.3)
7 (16.3)
36 (83.7)+
2 (10.5)
17 (89.5)
0.84
Monte Carlo
Exact Test
Slept outside community
Yes, n (%)
No, n (%)
8 (20.5)
31 (79.5)
17 (15.2)
95 (84.8)
5 (11.9)
37 (88.1)
0.58
Chi-Square
Test
Province where slept
Esmeraldas, n (%)
Other, n (%)
4 (57.1)
3 (42.9)+
10 (58.8)
7 (41.2)
3 (60)
2 (40)
1
Monte Carlo
Exact Test
Province of work Esmeraldas, n (%)
Other, n (%)
38 (97.4)
1 (2.6)
107 (95.5)
5 (4.5)
40 (95.2)
2 (4.8)
0.90
Monte Carlo Exact Test
Type of infection
Indigenous, n (%)
Imported, n (%)
34 (87.2)
5 (12.8)
101 (90.2)
11 (9.8)
38 (90.5)
4 (9.5)
0.89
Monte Carlo
Exact Test
* Only for females (i.e. n= 19, 52 and 17 for early, late and extremely late groups, respectively)
**Only for pregnant females (i.e. n= 5, 1 and 3 for early, late and extremely late groups, respectively)
***Only for those who answered yes to the question: “is there any other symptomatic person”? (i.e. n= 18, 44 and 19 for
early, late and extremely late groups, respectively.
+ One missing value
SD = Standard Deviation

59
4.2 General characteristics
4.2.1 Malaria Diagnosis
Overall, Plasmodium falciparum was diagnosed in 188 patients (97.41%) whereas vivax malaria
was diagnosed in the remaining 5 patients (Table 12). Noteworthy, most of the patients had a high
parasitological density (35.8%) followed by a 31.5% with medium density (Table 12). At the moment of
diagnosis, gametocytes could be found in 14.5% of patients (Table 12).
Table 12. Parasitological characteristics at diagnosis
Characteristic n (%)
Species
Plasmodium falciparum Plasmodium vivax
188 (97.4) 5 (2.6)
Parasitological density
Very Low (1-39 parasites in 100 HPFs*)
Low (40-60 parasites in 100 HPFs*)
Medium (60-100 parasites in 100 HPFs*)
High (2 a 20 parasites per field in 100 HPFs*)
Very high (21 a 200 parasites per field in HPFs)
25 (13%)
25 (13%)
61 (31.5%)
69 (35.8%)
13 (6.7%)
Gametocytes
Negative (absent)
Positive (present)
165 (85.5%)
28 (14.5%)
* HPFs = High power fields
The proportion of patients being diagnosed with P. falciparum was slightly different across
treatment arms. As shown in Table 13, falciparum malaria was diagnosed in about 95% of early and
extremely late treated patients (95.1% and 95.3%, respectively) whereas it represented 99.1% of all cases
among those belonging to the late treatment arm (p > 0.05, Monte Carlo exact test).
Table 13. Malaria species diagnosed by treatment arm
Species diagnosed Treatment arm
Early
n = 39
Late
n = 112
Extremely late
n = 42
Plasmodium falciparum, n (%) 37 (94.9) 111 (99.1) 40 (95.2)
Plasmodium vivax, n (%) 2 (5.1) 1 (0.9) 2 (4.8)
p = 0.223, Monte Carlo Exact Test
Parasite density was initially categorized into five groups according to the standard national
procedures as follows: 1) “Very low” if 1-39 parasites were found per 100 HPF; 2) “Low” = between 40-

60
100 parasites per 100 HPF; 3) “Medium” = 1 parasite per field in 100 HPFs; 4) “High” = 2-20 parasites
per field in 100 HPFs; and, 5) “Very high” = 21-200 parasites per field in 100 HPFs. Parasite density also
showed interesting but statistically non-significant trends across treatment arms (p > 0.05, Monte Carlo
Exact Test). For instance, most of the patients in early and extremely late treatment had medium-level
parasite density (38.5% and 35.7%, respectively) whereas 40.2% of patients in the late treatment group
had a high parasite density (p > 0.05, Monte Carlo Exact Test; Table 14). Interestingly, the proportion of
patients with very high parasite density was greatest among extremely late treatment patients followed by
late and early treatment whereas the proportion of patients having the lowest three parasite density groups
(i.e. very low, low and medium) was highest among early treatment patients as compared to the other two
groups (Table 14).
Table 14. Parasite density at diagnosis by treatment arm
Parasite density at diagnosis
Treatment arm
Early
n = 39
Late
n = 112
Extremely late
n = 42
Very low, n (%) 6 (15.4) 14 (12.5) 5 (11.9)
Low, n (%) 5 (12.8) 14 (12.5) 6 (14.3)
Medium, n (%) 15 (38.5) 31 (27.7) 15 (35.7)
High, n (%) 12 (30.7) 45 (40.2) 12 (28.6)
Very high, n (%) 1 (2.6) 8 (7.1) 4 (9.5)
p = 0.802, Monte Carlo Exact Test
Therefore, in order to increase power and improve model fit, parasite density was reclassified
accordingly into two categories, low and high, for further analysis. Low density was defined as at least
medium-level parasite density (i.e. 1-100 parasites in 100 HPFs) whereas high density corresponded to
parasite densities of “high” and “very high” (i.e. 2-200 parasites per field in 100 HPF).
As shown in Table 15, the proportion of patients with low level parasitemia was highest (66.7%)
among early treatment patients as compared to those belonging to the late (52.7%) and extremely late
(61.9%) treatment arms (p >0.05, Chi-Square Test).

61
Table 15. Parasite density at diagnosis, defined as two categories, by treatment arm
Parasitological density at
diagnosis
Treatment arm
Early
n = 39
Late
n = 112
Extremely late
n = 42
Low level parasitemia, n (%) 26 (66.7) 59 (52.7) 26 (61.9)
High level parasitemia, n (%) 13 (33.3) 53 (47.3) 16 (38.1)
p = 0.254, Chi-Square Test
At diagnosis, gametocytes were detected in 12.8% of early treatment patients as compared to
11.6% and 23.8% among late and extremely lately treated patients, respectively (p > 0.05, Chi-Square
Test; Table 16).
Table 16. Gametocytemia at diagnosis by treatment arm
Gametocytemia at
diagnosis
Treatment arm
Early
n = 39
Late
n = 112
Extremely Late
n = 42
Negative, n (%) 34 (87.2) 99 (88.4) 32 (76.2)
Positive, n (%) 5 (12.8) 13 (11.6) 10(23.8)
p = 0.151, Chi-Square Test
However, further analysis using time to treatment as a quantitative variable revealed that there is
a trend of association between this variable and gametocytemia at diagnosis (Figure 17).
Figure 17. Time to treatment by gametocyte status at diagnosis (Day 0).
* Mann-Whitney Test

62
4.2.2 Malaria Treatment
Malaria treatment in the study population largely followed the national recommendations. In fact,
99.5% of patients received the recommended graphic description of treatment prescription. The graphic
prescription consisted of a pictorial representation of the pills being prescribed and the times and doses
that the patient needed to take. As shown in Table 17, no statistically significant differences could be
observed when comparing the proportion of patients who received graphic prescription across the
different treatment arms (p > 0.05, Monte Carlo Exact Test).
Table 17. Graphic prescription by treatment arm
Did the patient receive
graphic prescription?
Treatment arm
Early
n = 39
Late
n = 112
Extremely late
n = 42
Yes, n (%) 38 (97.4) 112 (100) 42 (100)
No, n (%) 1 (2.6) 0 (0) 0 (0)
p = 0.208, Monte Carlo Exact Test
Similarly, no statistically significant differences could be observed when comparing the
proportion of individuals receiving treatment in adherence to the national guidelines (p > 0.05, Monte
Carlo Exact Test). In fact, we observed that the percentage of patients receiving appropriate treatment, as
defined in the national guidelines, was only slightly different for patients in the early and extremely late
treatment arms (82.8% and 86.1%) when compared to 93.5% among late treatment patients (Table 18).
Table 18. Treatment appropriateness by treatment arm
Treatment appropriate as per
national guidelines
Treatment arm*
Early
n = 29
Late
n = 77
Extremely Late
n = 36
Yes, n (%) 24 (82.8) 72 (93.5) 31 (86.1)
No, n (%) 5 (17.2) 5 (6.5) 5 (13.9)
p = 0.200, Monte Carlo Exact Test
* Sample size for this analysis is reduced to 142 with distribution per group as shown in table.

63
4.2.3 Malaria follow-up visits
Overall, most patients (61.6%) completed at least five follow-up visits (mean = 4.19 + 1.30). As
shown in Figure 18, the distribution of the number of follow-up visits by treatment group was similar
with a median of five for all groups. A Kruskal-Wallis test revealed that the differences between groups
are statistically non-significant (p > 0.05).
Figure 18. Number of follow-up visits completed per treatment arm
4.3 Effect of timely treatment on asexual malaria parasitemia during follow-up visits.
Overall, 3 patients (1.5%) presented parasitemia (detectable trophozoites in blood) at any point
during follow-up visits; two of them during follow-up visit one and the other one during follow-up visit
five. Due to the very limited number of cases with trophozoites during follow-up, no clear differences
were observed across treatment arms. Nonetheless, it is worth describing the trends whereby 2.5% of

64
patients in the early treatment group and 2.3% of extremely late treated patients presented trophozoites
during follow-up visit one (i.e. FU1) whereas 0.9% of late treatment patients developed detectable
trophozoites in follow-up visit five (i.e. FU5) (Figure 19).
Figure 19. Percentage of patients with trophozoites by follow-up visit and treatment arm
A stepwise backward logistic regression analysis could not identify any predictor associated with
the presence of trophozoites during follow-up visits (Table 19).
Table 19. Stepwise backward logistic regression model for the presence of trophozoites at any point during follow-up
Covariate Initial Model* Final Model**
OR 95% CI p-value OR 95% CI p-value
Lower Upper Lower Upper
Treatment
Extremely late
Late Early
Ref.
0.36 0.83
0.02 0.05
6.14 14.91
0.483 0.896
---- ---- ---- ----
Age 0.945 0. 85 1.06 0.319 0.953 0.86 1.06 0.367
Parasite density at dg
High
Low
Ref.
1.82
0.14
23.57
0.647
---- ---- ---- ----
Urban-rural classification
Rural
Urban
Ref.
0.20
0.02
2.85
0.237
---- ---- ---- ----
* Nagelkerke R Square = 0.104, Hosmer and Lemeshow test p = 0.679, correct predicted classification = 98.4%
** Nagelkerke R Square = 0.036, Hosmer and Lemeshow test p = 0.45, correct predicted classification 98.4%
OR = Odds Ratio; CI = Confidence Interval
0.1
1
10
100
FU0 FU1 FU2 FU3 FU4 FU5
Per
cen
tage
wit
h t
rop
ho
zoit
es
Type of visit
Early treatment
Late treatment
Extremely late treatment

65
4.4 Effect of timely treatment on malaria gametocytemia during follow-up visits
4.4.1 Binary probability distribution-based analysis
Overall, 19 patients (9.8%) presented gametocytemia at some point during follow-up. Among
them, 14 (74%) had only one control with detectable gametocytemia. Treatment arm classification, based
on the time elapsed from symptom onset to malaria treatment, had a statistically significant association
with the presence of gametocyte at any point during follow-up (Table 20). In fact, detectable
gametocytemia at some point during follow up occurred only in 5.1% of early treatment patients
compared to 7.1% and 21.4% among those in the late and extremely late treatment arms, respectively (p <
0.05, Monte Carlo Exact Test; Table 20).
Table 20. Presence of gametocytemia during follow-up by treatment arm
Gametocytemia at any point during
follow-up
Treatment arm
Early
n = 39
Late
n = 112
Extremely late
n = 42
Yes, n (%) 2 (5.1) 8 (7.1) 9 (21.4)
No, n (%) 37 (94.9) 104 (92.9) 33 (78.6)
p = 0.017, Monte Carlo Exact Test
The presence of gametocytemia at any point during follow-up was modeled using a stepwise
backward logistic regression analysis. All models adequately fit the data (p > 0.05 for each model,
Hosmer and Lemeshow test). Covariates included in the analysis were age, ethnicity, gender, type of
infection at diagnosis, parasite (trophozoite) density at diagnosis, and urban-rural classification (Table
21). In summary, after controlling for possible confounders, patients receiving both early and late
treatment had reduced odds of developing detectable gametocytes when compared to patients receiving
extremely late treatment (p < 0.05 for both cases). Specifically, the odds for gametocytemia at any point
during follow-up were 80% and 72% lower for early and late treatment patients, respectively, as
compared to that of extremely late treatment patients (p = 0.048 and 0.016, respectively; Table 21).

66
Table 21. Logistic regression model for detectable gametocytemia at any point during follow-up
Covariate Initial Model* Final Model**
OR 95% CI p-value OR 95% CI p-value
Lower Upper Lower Upper
Treatment
Extremely late
Late
Early
Ref.
0.28
0.17
0.09
0.03
0.81
0.90
0.019
0.037
0.28
0.20
0.10
0.04
0.79
0.98
0.016
0.048
Age 1.015 0.98 1.05 0.362 ---- ---- ---- ----
Gender
Female
Male
Ref.
0.71
0.26
1. 97
0.513
---- ---- ---- ----
Ethnicity
Other
Afro-Ecuadorian
Mestizo
Ref.
3.05
1.58
0.32
0.18
28.69
14.29
0.330
0.683
---- ---- ---- ----
Type of infection
Imported
Indigenous
Ref.
1.18
0.11
12.35
0.890
---- ---- ---- ----
Parasite density at dg
High
Low
Ref.
1.92
0.63
5.89
0.255
---- ---- ---- ----
Residence
Rural
Urban
Ref.
3.81
0.36
40.14
0.265
---- ---- ---- ----
* Nagelkerke R square = 0147, Hosmer and Lemeshow Test p = 0.529, correct predicted classification = 90.2%
** Nagelkerke R square = 0.076, Hosmer and Lemeshow Test p = 1, correct predicted classification = 90.2%
OR = Odds Ratio; CI = Confidence Interval
4.4.2 Effect of timely treatment on total number of follow-up visits with gametocytemia
Firstly, a categorical analysis was conducted and revealed a trend of association between
treatment arms and total number of follow-up visits with gametocytemia. The proportion of people having
at least one or two visits with detectable gametocytemia was higher among extremely late patients as
compared to the other groups (p > 0.05, Monte Carlo Exact Test, Table 22).
Table 22. Total number of follow-up visits with detectable gametocytemia by treatment arm
Number of follow-up
visits with detectable
gametocytemia
Treatment arm
Early
n = 39
Late
n = 112
Extremely late
n = 42
0, n (%) 37 (94.8) 104 (92.9) 33 (78.5)
1, n (%) 1 (2.6) 7 (6.2) 7 (16.7)
2, n (%) 1 (2.6) 1 (0.9) 2 (4.8)
p = 0.058, Monte Carlo Exact Test

67
Afterwards, a quantitative approach to the analysis of the effect of timely malaria treatment on
gametocytemia was used. Extremely late treated patients had statistically significant higher mean number
of follow-up visits with detectable gametocytes than people in the other two treatment arms (p < 0.05,
ANOVA test; Table 23). A Bonferroni post-hoc correction analysis showed that the difference between
early and late treatment was statistically non-significant whereas the difference between early and
extremely late was marginally significant with a p-value of 0.087 (Table 23). The same post-hoc test
showed that the difference between early and extremely late groups is statistically significant (Table 23).
Table 23. Comparison of the mean number of follow-up visits with detectable gametocytemia by treatment arm
Treatment arm* Number of follow-up visits with detectable gametocytemia
Mean SD 95% CI
Lower Upper
Early 0.0769 0.3543 -0.0379 0.1918
Late 0.0864 0.3043 0.0234 0.1373
Extremely late 0.2619 0.5437 0.0925 0.4313
* ANOVA Test: Overall (p = 0.023); early vs. late (p = 1); early vs. extremely late (p = 0.087); late vs. extremely late (p =
0.026). SD = Standard Deviation; CI = Confidence Interval.
A stepwise backward linear regression analysis to model the total number of follow-up visits with
detectable gametocytemia revealed that the time elapsed from symptoms onset to treatment had a
statistically significant positive association with the total number of follow-up visits after controlling for
the following covariates: age, gender, ethnicity, type of infection (i.e. whether the infection is considered
to be imported or indigenous), malaria species, parasite density at diagnosis, and urban-rural classification
(p < 0.05; Table 24).
Table 24. Linear regression model for total number of follow-up visits with detectable gametocytemia
Covariate Initial Model* Final Model**
Estimate 95% CI p-
value Estimate
95% CI p-
value Lower Upper Lower Upper
Time to treatment 0.019 0.006 0.032 0.005 0.018 0.005 0.032 0.006
Age 0.001 -0.002 0.005 0.546 ---- ---- ---- ----
Gender 0.019 -0.090 0.128 0.731 ---- ---- ----
Ethnicity -0.079 -0.177 0. 018 0.111 ---- ---- ---- ---- Type of infection -0.014 -0.240 0.211 0.900 ---- ---- ---- ----
Malaria species -0.047 -0.415 0.323 0.800 ---- ---- ---- ----
Parasite density at dg -0.090 -0.200 0.021 0.112 -0.106 -0.213 0.002 0.054
Residence -0.117 -0.313 0.080 0.243 ---- ---- ---- ----
* R-square = 0.078; ANOVA p-value = 0.054
** R-square = 0.055; ANOVA p-value = 0.005; CI = Confidence Interval.

68
Further analysis of the mean number of follow-up visits with detectable gametocytemia (by
treatment arm group classification) suggested that there may exist heteroskedasticity between treatment
arm groups (p < 0.05, Levene homoskedasticity test; p = 0.125, Welch homoskedasticity test; and p =
0.057, Brown-Forsythe homoskedasticity test). Therefore, in order to improve the model fit for total
number of follow-ups with gametocytemia, two other models were fit.
Table 25. Poisson log linear regression model for total number of follow-up visits with detectable gametocytemia
Covariate Initial Model* Final Model**
Estimate 95% CI p-
value Estimate 95% CI p-
value Lower Upper Lower Upper
Time to treatment 0.128 0.047 0.209 0.002 0.103 0.033 0.173 0.004
Age 0.010 -0.017 0.036 0.475 ---- ---- ---- ----
Gender 0.138 -0.701 0.977 0.747 ---- ---- ---- ----
Ethnicity
Other
Afro-Ecuadorian
Mestizo
Ref.
1.480
0.907
-0.616
-1.192
3.575
3.006
0.166
0.397
---- ---- ---- ----
Type of infection -0.281 -2.421 1.859 0.797 ---- ---- ---- ----
Parasite density at dg -0.865 -1890 0.160 0.098 ---- ---- ---- ----
Residence -1.547 -3.674 0.580 0.154 ---- ---- ---- ----
* Goodness of fit Test p = 0.022
** Goodness of fit Test p = 0.010
CI = Confidence Interval
A stepwise backward Poisson log linear model showed that time to treatment is positively
associated with the total number of follow-up visits reporting gametocytemia (p < 0.05; Table 25).
Importantly, both initial and final models fit the data appropriately (p < 0.05, model fit test; Table 25).
Table 26. Negative binomial regression model for total number of follow-up visits with detectable gametocytemia
Covariate Initial Model* Final Model**
Estimate 95% CI p-
value
Estimate 95% CI p-
value Lower Upper Lower Upper
Dispersion 0.7038 0.046 10.763 ---- 1.7131 0.296 9.931 ----
Time to treatment 0.134 0.040 0.228 0.005 0.111 0.025 0.196 0.011
Age 0.008 -0.022 0.037 0.604 ---- ---- ---- ----
Gender 0.164 -0.770 1.098 0.730 ---- ---- ---- ----
Ethnicity Other
Afro-Ecuadorian
Mestizo
Ref.
1.700
1.071
-0.650
-1.256
4.051
3.397
0.156
0.367
----
----
----
----
Type of infection -0.184 -2.513 2.145 0.877 ---- ---- ---- ----
Parasite density at dg -0.840 -1.928 0.249 0.130 ---- ---- ---- ----
Residence -1.478 -3.779 0.823 0.208 ---- ---- ---- ----
* Goodness of fit Test p = 0.050
** Goodness of fit Test p = 0.015

69
Finally, a stepwise backward negative binomial model, accounting for data over-dispersion,
confirmed that the time elapsed between onset of symptoms and treatment had a positive association with
the total number of follow-ups having detectable gametocytes (p < 0.05). Noteworthy, the initial model
marginally fits the data (p = 0.05, model fit test) whereas the final model adequately fits data (p < 0.05,
model fit test; Table 26).
4.4.3 Effect of timely treatment on gametocyte density at follow-up visits 1, 2, and 5.
The distribution of the cases with detectable gametocytemia during follow-up visits by treatment
arm group was also analyzed. With the exception of only one patient, gametocytemia was developed
either in the first or second follow-up visit (Figure 20). Noteworthy, the percentage of patients developing
gametocytemia during the first and second follow-up visit is higher for extremely late treated patients (p <
0.01, Chi-Square test).
Figure 20. Temporal trends for presence of gametocytemia by treatment arm
* FU = Follow-up visit

70
A multivariate analysis of variance (MANOVA) test evaluating the independent effect of
treatment arm comparison on gametocytemia density at follow-ups 1, 2 and 5, which were the only ones
with reported gametocytemia, revealed a statistically significant association (p < 0.05, MANOVA test;
Table 27).
Table 27. Gametocyte density by follow-up visit and treatment arm
Follow-up visit Treatment
arm
Gametocyte density
Mean SD 95% CI
Lower Upper
Follow-up 1* Early 0.0571 0.2355 -0.0238 0.1380
Late 0.0636 0.2452 0.0173 0.1100
Extremely late 0.1951 0.4012 0.0685 0.3218
Follow-up 2** Early 0.0286 0.1690 -0.0295 0.0866
Late 0.0103 0.1015 -0.0102 0.0308
Extremely late 0.0857 0.2840 -0.0119 0.1833
Follow-up 5*** Early <0.0001 <0.0001 <0.0001 <0.0001 Late 0.0141 0.1187 -0.0140 0.0422
Extremely late <0.0001 0.0887 <0.0001 <0.0001
* ANOVA Test: Overall (p = 0.03); early vs. late (p = 1); early vs. extremely late (p = 0.19); late vs. extremely late (p = 0 .16).
Homoskedasticity Welch Test p = 0.138
** ANOVA Test: Overall (p = 0.08); early vs. late (p = 0.91); early vs. extremely late (p = 0.67); late vs. extremely late (p =
0.35). Homoskedasticity Welch Test p = 0.285
*** ANOVA Test: Overall (p = 0.68); early vs. late (p = 0.69); early vs. extremely late (n.d.); late vs. extremely late (p = 0.69).
Homoskedasticity Welch Test p = undefined; SD = Standard Deviation; CI = Confidence Interval.
A Jonckheere-Terpstra test, to account for non-Gaussian data distribution and for the order in
treatment arm classification, confirmed that there was a statistically significant asosciation between
treatment arm and gametocyte density at day 5 whereas the association at days 7 and 28 was not
significant (Figure 21).
In order to understand this relationship further, the outcome (i.e. gametocytemia during follow-up
visits at days 5, 7 and 28) was analyzed as a categorical variable. A Chi-Sqaure analysis comparing the
distribution of gametocytemia during follow-up visits at days 5, 7 and 28 (i.e. follow-up visits 1, 2 and 5)
by treatment arm confirmed a statistically significant association between these two variables (p < 0.05,
Chi-Square test). As explained earlier, no patient developed gametocytemia during follow-up visits at
days 14 and 21 (i.e. follow-up visits 3 and 4). Therefore, Table 27 and Figure 21 omit information
regarding gametocytemia during follow-up visits 3 and 4.

71
Figure 21. Gametocytemia at follow-up visits 1, 2 and 3 by treatment arm
4.4.4 Survival analysis for gametocyte clearance by treatment arm classification group
A Kaplan-Meier Survival analysis showed that patients receiving extremely late treatment cleared
gametocytes 5.3 days post treatment, a period slightly longer than that of those being early or lately
treated who cleared gametocytes after 5.1 and 4.8 days of treatment onset, respectively (p > 0.05).
A graphic representation of time to gametocyte clearance clearly shows that late treatment group
patients tend to reach non-detectable gametocytemia faster than early treatment and that these patients, in
turn, reach gametocyte clearance faster than extremely late treated patients (Figure 22).
Although these differences are not statistically significant they reveal an important trend that
deserves further analyses. Therefore, a Cox proportional hazards model was fit to compare the hazard
ratios for gametocyte clearance (i.e. absence of gametocytemia) per treatment arm. The cumulative hazard
analysis revealed that, although statistically non-significant, the hazard of gametocyte clearance is higher
for late treatment patients as compared to early or extremely late treatment patients (Figure 23).

72
Figure 22. Kaplan-Meier survival analysis for gametocytemia
Note: Vertical lines represent data censoring.
Figure 23. Cumulative hazard function by treatment arm group
Note: Vertical lines represent data censoring.

73
4.4.5 Evaluating a potential effect of timely malaria treatment on transmissibility
A “period of potential transmissibility” per treatment group, defined as the average length of time
measured in days during which gametocytes can be detected, was estimated and is shown in Figure 24.
For this analysis, the period of transmissibility was estimated by adding the pre-treatment gametocytemia
to the post-treatment gametocytemia periods, assuming gametocytemia is present at some level from day
4 onwards, based on the estimated time gametocytes would first be detectable according to the parasite’s
life cycle as described in Figure 9.
Time to
Treatment /
treatment
arm
Days from symptom onset
0-3 4 5 6 7 8 9 10 11 12 13 14
…
25
26
27
28
29
30
31
Early
(Day 0)
Early
(at 1 day)
Early
(at 2 days)
Late
(at 3 days)
Late
(at 4 days)
Late
(at 5 days)
Late
(at 6 days)
Late
(at 7 days)
Extremely
Late
(at 8 days)
Extremely
Late
(at 25 days)
Legend
Pre-treatment gametocytemia
Post-treatment gametocytemia
Gametocyte free
Figure 24. Period of transmissibility by time to treatment and treatment arm
This analysis highlights the potential importance of providing early treatment. In this study
population, the period of transmissibility for early treatment patients would range from 0 to 4 days
whereas the same period would fluctuate between approximately 5 and 9 days and for extremely late
patients the shortest period of potential transmissibility would be 9 days with a maximum of 17 days.
These differences were not only large but also statistically significant (Figure 25). A Jonckheere-Terpstra

74
test showed that the period of potential transmissibility was significantly shorter among early treatment
(mean 2.05), longer among late treatment (mean 5.26) and longest among extremely late treatment
patients (mean 12.79) (p < 0.05). Further pair-wise analysis revealed that the differences between each
treatment arm group pair possible were statistically significant (p < 0.05 in all comparisons, Mann-
Whitney Test).
Figure 25. Period of transmissibility by treatment arm
* Mann-Whitney Test; **Mann-Whitney Test for early vs. extremely late comparison and Jonckheere-Terpstra Test for across
groups comparison
Time to treatment was significantly associated with period of transmissibility after controlling for
the following covariates: age, gender, ethnicity, type of infection, malaria species, parasite density at
diagnosis, and urban-rural classification (Table 28). Interestingly, ethnicity also remained associated to
period of transmissibility after controlling for confounders. In summary, African descendants had lower
period of transmissibility than mestizos whereas mestizos had lower periods than people belonging to
other ethnicities (i.e. indigenous and white).

75
Table 28. Linear regression model for period of transmissibility
Covariate Initial Model* Final Model**
Estimate 95% CI p-value Estimate 95% CI p-
value Lower Upper Lower Upper
Time to treatment 1.056 0.988 1.124 <0.001 1.056 0.987 1.126 <0.001
Age 0.001 -0.017 0.020 0.875 ---- ---- ---- ----
Gender 0.393 -0.164 0.950 0.130 ---- ---- ---- ----
Ethnicity
Other
Afro-Ecuadorian
Mestizo
Ref.
1.149
0.420
0.050
-0.593
2.248
1.433
0.041
0.416
---- ---- ---- ----
Type of infection -0.687 -1.833 0.460 0.241 ---- ---- ---- ----
Malaria species 1.403 -0.480 3.286 0.144 ---- ---- ---- ----
Parasite density at
diagnosis
-0.407 -0.970 0.156 0.156 ---- ---- ---- ----
Residence -0.157 -1.164 0.851 0.761 ---- ---- ---- ----
* p < 0.001, R-square = 0.824; ** p < 0.001, R-Square = 0.815
CI = Confidence Interval

76
Chapter Five: Parish-level Ecologic Study
5.1 Preliminary data
A temporal trend plot of the number of cases of malaria in Esmeraldas province for the period
2001-2010 was created based on information provided by the local SNEM office. As shown in Figure 26,
there was a sharp monotonic decrease in the number of malaria cases between 2001 and 2010 in the
province of Esmeraldas, Ecuador.
Figure 26. Temporal trends of number of malaria cases in Esmeraldas, Ecuador (2001-2014)
In fact, the total number of malaria cases steadily decreased from 24,862 in 2001 to 25 in 2014.
This represents a 99.9% decrease in the number of cases reported in this province.
0
5,000
10,000
15,000
20,000
25,000
30,000
Nu
mb
er o
f m
alar
ia C
ases
P. falciparum
P. vivax
Total

77
5.2 Baseline characteristics
As explained earlier, a total of 193 valid cases were used for data analysis. For the ecologic study,
we classified the cases in periods according to the time of the year they were diagnosed, as follows: 1)
Period 2012-B spans from July to December 2012; 2) Period 2013-A from January to June 2013; 3)
Period 2013-B from July to December 2013; 4) Period 2014-A from January to June 2014; 5) Period
2014-B from July to December 2014; and, 6) Period 2015-A from January to March 2015. Periods 2012-
B, 2013-B and 2014-B correspond to the dry season whereas periods 2013-A, 2014-A and 2015-A to the
rainy season, when malaria is most actively transmitted.
Figure 27. Malaria cases by treatment arm and period of diagnosis in Esmeraldas, Ecuador (2012-2015)
As shown in Figures 28 and 29, the number of malaria cases increased from period 2012-B to
period 2013-A across all different treatment arms. This observation is expected considering that period
2012-B corresponds to a dry season and is natural that it would have lower number of reported cases. In
fact, although 19 cases (9.8%) were reported during period 2012-B, most of the cases (110; 57%) were

78
reported during the first rainy period of the time series (period 2013-A). From there onwards, there is a
monotonic decrease in the total number of cases (Figure 29). Moreover, the number of cases during rainy
seasons across the years of study was drastically reduced from 110 in 2013 to 17 in 2014 and to 7 during
the first part of the ongoing 2015 rainy season (Figure 28). This represents a 94% decrease.
Figure 28. Geospatial distribution of malaria cases by season, parish and year in Esmeraldas (2012-2015)
Afterwards, an analysis of the distribution of percentage of persons with gametocyte and
treatment arm per period was conducted. Overall, the percentage of patients with gametocytemia at
diagnosis was higher among extremely late treatment patients than among late or early treatment patients
with the sole exception of period 3 where it was higher among early treatment patients.

79
Figure 29. Percentage of patients with gametocytes by period and treatment arm
5.3 General characteristics of malaria transmission in Esmeraldas
5.3.1 Gametocytemia
Parishes were classified in each period according to the presence of gametocytemia at any time
during follow up to evaluate the impact of gametocyte clearance, which would be indicative of time to
treatment, on malaria transmission.
As shown in Table 29, gametocytemia was present in only four parishes during the study period.
Tululbí, a rural parish of San Lorenzo, had 25% of patients developing gametocytemia at some follow-up
visit during period 2012-B whereas San Lorenzo had 20% in period 2013-B. Similarly, Esmeraldas had

80
25% in period 2014-A whereas Vuelta Larga had 14% and 15% in periods 2013-A and 2013-B,
respectively.
Table 29. Percentage of patients developing gametocytemia during follow-up by parish and period
Parish Percentage with follow-up gametocytemia per period*
2012-B 2013-A 2013-B 2014-A 2014-B 2015-A
Esmeraldas -- 0 0 25 -- --
San Lorenzo 0 0 20 0 0 0
Tululbí 25 -- -- -- -- --
Vuelta Larga 0 14 15 -- -- --
* All other parishes had 0% of patients with follow-up gametocytemia at any given period for which the parish reported
malaria cases
Similarly, the percentage of patients developing gametocytemia at any point during follow-up in
Vuelta Larga was 14% during period 2013-A and 15% during period 2013-B whereas it was 20% for San
Lorenzo parish during period 2013-B and 25% for Esmeraldas during period 2014-A (Figure 30).
Figure 30. Percentage of patients developing gametocytemia by parish and period

81
5.3.2 Number of cases
Most of the cases reported in this series (187, 97%) were diagnosed in either of 16 different
parishes in the province of Esmeraldas. Additionally, one patient (0.5%) was from one parish in the
province of Carchi and five patients (2.5%) came from the neighboring country of Colombia (Table 30).
Table 30. Malaria cases by parish of origin
Parish
Number of cases per period Total
2012-B 2013-A 2013-B 2014-A 2014-B 2015-A %
Alto Tambo 0 0 0 0 1 2 1.55
Ancon 1 0 0 2 0 0 1.55
Calderon 0 0 0 1 0 0 0.52
Carondelet 0 1 0 0 0 0 0.52
Colombia 1 0 0 3 1 0 2.59
Cnel. Concha Torres 0 1 0 0 0 0 0.52
Cube 0 0 0 1 0 0 0.52
Esmeraldas 0 9 1 4 0 0 7.26
La Tola 0 0 0 0 1 0 0.52
Mataje 0 0 1 0 0 1 1.04
Rosa Zarate 0 0 0 1 0 0 0.52
San Lorenzo 2 6 5 5 1 1 10.36
Tabiazo 0 1 0 0 0 0 0.52
Tachina 0 2 5 0 1 2 5.18
Tobar Donoso 0 0 0 0 0 1 0.52
Tululbí 4 0 0 0 0 0 2.07
Urbina 0 0 0 0 3 0 1.55
Vuelta Larga 11 90 20 0 0 0 62.69
Legend
0 cases
1 to 3 cases
4 to 7 cases
8 to 19 cases
20 to 50 cases
> 50 cases
Vuelta Larga, a suburban parish encompassing the south of Esmeraldas city, was the origin of the
majority of cases (63%) followed by San Lorenzo, a northern parish near the border with Colombia,
which reported 10% of cases (Figure 31).

82
Figure 31. Number of cases reported by parish and period
5.3.3 Incidence Rates
Based on the mean time to treatment (i.e. mean time elapsed from symptom onset to treatment),
each parish was classified into early, late or extremely late treatment (using the same cut-offs as in the
retrospective cohort design) for any given period. Figure 32 shows a geospatial model representing
malaria incidence rates and treatment arms by parish during periods 2012-B (i.e. period 1 or Jul-Dec
2012) to 2013-B (i.e. period 3 or Jul-Dec 2013) whereas Figure 33 shows the same distributions for
periods 2014-A (i.e. period 4 or Jan-Jun Dec 2014) to 2015-A (i.e. period 6 or Jan-Mar 2015).

83
Figure 32. Parishes by malaria incidence rate and treatment arm in Esmeraldas (Jul 2012 - Dec 2013)
Figure 33. Parishes by malaria incidence rate and treatment arm in Esmeraldas (Jan 2014 - Mar 2015)

84
Noteworthy, only three parishes were classified as early treatment and four as extremely late
treatment during all periods, the remaining parishes were all considered late treatment parishes. Patterns
of association between treatment arm and number of cases reported in subsequent period were not
completely consistent. For instance, all early treatment parishes but one, Tachina, did not report any case
of malaria in the subsequent period. Similarly, out of 5 extremely late treatment parishes, 3 three did not
report any cases in the following period whereas the pattern for late treatment period was mixed.
However, as shown below, linear regression analysis showed significant associations between time to
treatment and malaria incidence rates in the subsequent period.
Table 31. Malaria incidence rate by parish and period
Parish
Malaria incidence rate (per 100,000 pop) per period
2012-B 2013-A 2013-B 2014-A 2014-B 2015-A
Alto Tambo 0 0 0 0 53.45 106.89
Ancon 55.13 0 0 110.25 0 0
Calderon 0 0 0 159.24 0 0
Carondelet 0 57.80 0 0 0 0
Colombia n.d. 0 0 n.d. n.d. 0
Cnel. Concha Torres 0 42.48 0 0 0 0
Cube 0 0 0 13.18 0 0
Esmeraldas 0 5.56 0.62 2.47 0 0
La Tola 0 0 0 0 22.90 0
Mataje 0 0 67.80 0 0 67.80
Rosa Zarate 0 0 0 1.49 0 0
San Lorenzo 7.97 23.91 19.92 19.92 3.98 3.98
Tabiazo 0 37.59 0 0 0 0
Tachina 0 50.21 125.53 0 25.11 50.21
Tobar Donoso 0 0 0 0 0 110.50
Tululbí 174.29 0 0 0 0 0
Urbina 0 0 0 0 394.22 0
Vuelta Larga 367.03 3003.00 667.33 0 0 0
Legend
0 cases per 100,000 pop
0.01 to 10 cases per 100,000 pop
10.01 to 50 cases per 100,000 pop
50.01 to 100 cases per 100,000 pop
100.01 to 500 cases per 100,000 pop
> 500 cases per 100,000 pop

85
As shown in Figures 31-33, malaria incidence was extremely high during period 2013-A (i.e.
period 2). In fact, period 2013-A had the highest incidence rates for all parishes reporting cases in that
period (Table 30). For parishes with no cases reported during period 2, malaria incidence rates where
highest either in period 2014-A or period 2015-A, except for Mataje which shows same rate in the only
two periods when cases were reported (Table 31).
As noted earlier, periods 2013-A, 2014-A, and 2015-A correspond to the rainy season when
malaria transmission is expected to be at its maximum. For nine parishes, cases were reported only during
one period and therefore it is not possible to compare.
5.4 Effect of timely malaria treatment on malaria transmission in Esmeraldas
Since the highest number of cases and the highest incidence rates was reported during Period
2013-A (Tables 30 and 31; Figures 31-33), this period was chosen as the baseline measurement for the
evaluation of the effect that timely malaria treatment (i.e. time to malaria treatment) has on the number of
cases and the incidence rate of the subsequent periods.
A post-period 2013-A temporal analysis of the number of cases of malaria among these parishes
showed that the transmission of malaria in Vuelta Larga (suburban Esmeraldas City) was stopped during
period 2013-B, since from period 2014-A onwards there is no case reported in this parish (Table 30 and
Figure 34). Similarly, no cases were reported from period 2014-A onwards in the following parishes:
Coronel Carlos Concha Torres (Rural Parish in the Esmeraldas District City), Tabiazo (Rural Parish in the
Esmeraldas District) and Carondelet (Rural parish in San Lorenzo District). Two cases of malaria were
reported in Esmeraldas City during period 2014-A with no further transmission afterwards (Figure 9). On
the contrary, transmission continued up to period 2015-A in two of the parishes which did not report any
patient developing gametocytes during period 2013-A: Tachina (Esmeraldas District) and San Lorenzo
parish, which is an urban center in the District of San Lorenzo (Figure 34). Interestingly, period 2013-A
early treatment parishes achieved 100% reduction during period 2013-B compared to 25% (1 in 4) late
treatment parishes and 67% (2 in 3) extremely late parishes (Table 30).

86
Figure 34. Malaria transmission on periods subsequent to period 2013-A by treatment arm.
As seen in Figure 34, post-period 2013-A malaria transmission, measured as number of cases,
was reduced to zero for the only parish classified as early treatment in period 2013-A (i.e. Carlos Concha
Torres). Vuelta Larga and the other late treatment parishes also reduced transmission although, overall,
they needed more time to reach zero transmission. Finally, transmission patterns in extremely late
treatment parishes were characterized by low levels but noticeable inter-parish differences.
Figure 35 summarizes the malaria transmission patterns, as number of cases, for the three
treatment arm groups. It can be observed that early treatment parishes quickly reach zero transmission
(i.e. within one period) whereas that process takes almost four periods for extremely late parishes and for
late treatment parishes the pattern reverses, with an upturn during the last period.

87
Figure 35. Number of malaria cases by treatment arm at period 2013-A (Period 2013-A – Period 2015-A)
Similarly, a temporal analysis of malaria transmission patterns measured as incidence rates
confirms the same trends observed previously when comparing number of cases (Figure 36). Briefly,
early treatment parishes reached zero incidence rate within one period, extremely late parishes reduced
incidence rates at a slower pace and finally late treatment parishes had an upward trend at the end of the
study period (Figure 36).
Since gametocytemia during follow-up is considered an intermediate variable in this study,
further analyses of the effect that gametocytemia has on post-period 2013-A transmission were
conducted. As mentioned earlier, Vuelta Larga was the only parish that had patients developing
gametocytes during follow-up in period 2013-A (Figure 30 and Table 29). All other parishes were
negative for gametocytes during follow-up in period 2013-A.

88
Figure 36. Malaria incidence rate by treatment arm at period 2013-A (Period 2013-A – Period 2015-A)
Vuelta Larga reached zero transmission within two periods whereas the transmission pattern for
the parishes with no gametocytemia during follow-up in period 2013-A had an overall downward trend
with exceptional cases, like Tachina, which increased the number of cases in period 5 (Figure 37).
A summary of the trends by gametocytemia during follow-up at period 2013-A confirmed the
previous findings that, overall, those parishes with no gametocytemia during-follow-up decrease malaria
transmission at slower rates than Vuelta Larga (Figure 37).
Finally, a repeated measures negative binomial regression showed that there was a positive and
statistically significant association between time to treatment during period 2013-A and malaria
transmission, measured as number of malaria cases, in subsequent periods (p < 0.05; Table 32). Similarly,
gametocytemia during follow-up and malaria incidence rates measured in period 2013-A were both
statistically significantly associated with the number of malaria cases in the periods that followed (p <
0.001 for both associations; Table 32).

89
Figure 37. Number of malaria cases by parish and gametocyte during follow-up at period 2013-A (Period 2013-A – Period
2015-A)
Figure 38. Number of malaria cases by gametocyte during follow-up at period 2013-A (Period 2013-A – Period 2015-A)

90
Similar results were obtained with a Poisson log linear and a linear regression model (data not
shown). No statistically significant associations were found when modeling malaria incidence rate using a
negative binomial regression (data not shown).
Table 32. Repeated measures negative binomial regression for number of malaria cases in subsequent periods
Covariate
(as measured at period 2013-A)
Number of malaria cases
Estimate 95% CI p-value
Lower Upper
Gametocytes during follow-up 140.052 68.328 211.777 < 0.001
Time to Treatment 0.123 0.013 0.232 0.029
Malaria incidence rate -0.046 -0.070 -0.022 < 0.001
Quasi Likelihood (QIC) = 55.702; Corrected (QICC) = 59.463
CI = Confidence Interval.
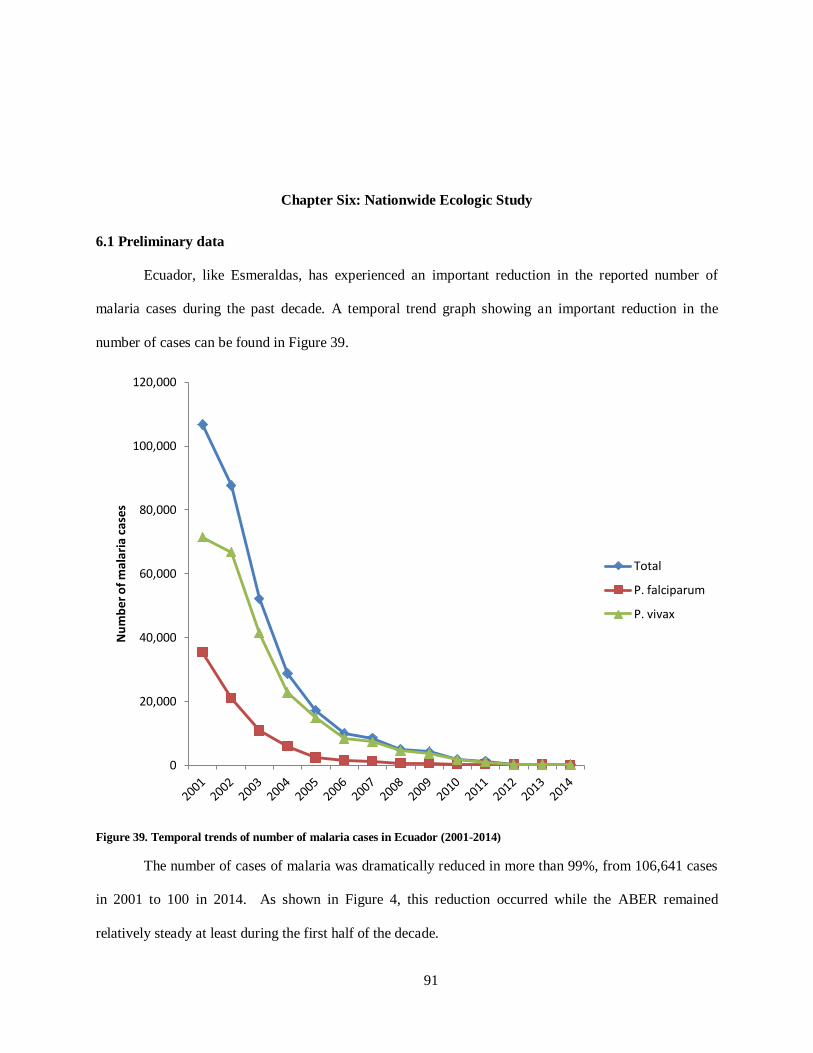
91
Chapter Six: Nationwide Ecologic Study
6.1 Preliminary data
Ecuador, like Esmeraldas, has experienced an important reduction in the reported number of
malaria cases during the past decade. A temporal trend graph showing an important reduction in the
number of cases can be found in Figure 39.
Figure 39. Temporal trends of number of malaria cases in Ecuador (2001-2014)
The number of cases of malaria was dramatically reduced in more than 99%, from 106,641 cases
in 2001 to 100 in 2014. As shown in Figure 4, this reduction occurred while the ABER remained
relatively steady at least during the first half of the decade.
0
20,000
40,000
60,000
80,000
100,000
120,000
Nu
mb
er o
f m
alar
ia c
ases
Total
P. falciparum
P. vivax

92
6.2 Baseline characteristics
A total of 529 cases of malaria with at least one follow-up visit completed were reported to the
national headquarters of SNEM between February 2012 and December 2014. This time was divided into
periods, as follows: 1) Period 2012-A spans from February to June 2012; 2) Period 2012-B spans from
July to December 2012; 3) Period 2013-A from January to June 2013; 4) Period 2013-B from July to
December 2013; 5) Period 2014-A from January to June 2014; and, 6) Period 2014-B from July to
December 2014. It is important to mention that since rainy season patterns vary according to geographical
region in Ecuador (i.e. months of rain are different for provinces in the coast and in the Amazon basin
region), it is not possible to classify periods as rainy or dry season for the whole country. Nonetheless, in
order to maintain consistency with the parish-level analysis, periods are keeping as A and B for each year
with periods A spanning from January to June and periods B from July to December.
Table 33. Baseline characteristics of nationwide study population
Characteristic n (%)
Species
Plasmodium falciparum
Plasmodium vivax
157 (29.7)
347 (70.3)
Treatment arm
Early treatment
Late treatment Extremely late treatment
139 (26.3%)
241 (45.6%) 149 (28.2%)
Gender
Male, n (%)
Female, n (%)
296 (56%)
233 (44%)
Age,
mean + SD
25.6 + 18.0
Number of follow-up visits completed,
mean + SD
3.78 + 1.05
Some baseline characteristics are summarized in Table 33. Vivax malaria was the most common
species diagnosed nationwide with 372 cases (70%) followed by P. falciparum with 157 cases (30%)
(Table 33). Gender distribution was slightly equal with a 1:1.27 female to male ratio (Table 33). Most
patients completed 4 visits (mean 3.78 + 1.05) (Table 33). The mean time elapsed from symptoms onset
to diagnosis was 6.1 + 5.3 (Table 33). Based on this variable, patients were classified into three treatment

93
arms as before. Most of the patients (45.6%) received late treatment whereas 26.3% were early treated
and 28.2% were treated extremely late (Table 33).
Figure 40. Malaria cases by period of diagnosis and treatment arm in Ecuador (Feb 2012 – Dec 2014)
The pattern of distribution of the number of cases, across different treatment arms, can be
summarized as an upward trend from period 2012-A to period 2012-B and then a decreasing trend from
that period onwards. In fact, most of the cases (31.8%) were diagnosed in period 2013-A followed by
24.8% in period 2012-B and 9.5% in period 2012-A (i.e. increasing trend from period 2012-A to period
2013-A) whereas 10.4% of cases were diagnosed during period 2014-A and 8.5% in period 2014-B,
representing the decreasing trend in these late periods (Figure 40). Moreover, a 73% reduction was
observed between periods 2013-A and 2014-B.

94
6.3 General characteristics of malaria transmission in Ecuador
6.3.1 Number of cases
Most of the cases (28.4%) were diagnosed in the province of Guayas, followed by Esmeraldas
(26.9%), Orellana (13.4%) and Los Rios (10.8%) (Table 34). Noteworthy, the total number of cases
reported by the local SNEM office in Esmeraldas and the National Headquarters do not coincide since
certain patients are dropped from the national database due to lack of clarity in the digitalized images
scanned from the local to the central offices.
Table 34. Malaria cases by province
Province
Number of cases per period Total
2012-A 2012-B 2013-A 2013-B 2014-A 2014-B %
Bolivar 0 0 0 3 2 0 0.9
Cañar 1 1 0 0 0 0 0.4
Cotopaxi 0 2 0 0 0 0 0.4
El Oro 0 3 1 0 0 0 0.8
Esmeraldas 3 19 81 29 6 4 26.8
Guayas 25 52 40 23 6 4 28.4
Los Rios 7 21 13 8 4 4 10.8
Manabí 9 1 1 1 1 0 2.5
Morona Santiago 0 0 0 1 13 2 3
Orellana 1 21 16 5 8 20 13.4
Pastaza 3 10 3 0 14 10 7.6
Sucumbíos 1 1 13 10 1 1 5.1
Legend
0 cases
1 to 3 cases
4 to 7 cases
8 to 19 cases
20 to 50 cases
> 50 cases
The remaining 20.7% were patients from the provinces of Pastaza (7.6%), Sucumbíos (5.1%),
Morona Santiago (3%), Manabí (2.5%), Bolívar (0.9%), El Oro (0.8%), Cañar (0.4%), and Cotopaxi
(0.4%) (Table 34 and Figure 41).

95
Figure 41. Number of cases reported by province and period
6.3.2 Incidence rates
Each province was classified into early, late or extremely late treatment based on the mean time
to treatment (i.e. mean time elapsed from symptom onset to treatment) for any given period. Figure 42
shows a geospatial model representing the number of cases and treatment arms by province during
periods 2012-A to 2013-A whereas Figure 31 shows the same distributions for periods 2013-B to 2014-B.
There were only five provinces classified as early treatment in the study period. There was no
clear pattern of association between treatment arm classification and number of malaria cases in the
subsequent period.

96
Figure 42. Provinces by malaria incidence rate and treatment arm (Feb 2012 – Jun 2013)
Figure 43. Provinces by malaria incidence rate and treatment arm (Jul 2013 – Dec 2014)

97
6.4 Effect of timely malaria treatment on malaria transmission in Ecuador
Just like in the previous analysis, period 2013-A was chosen as the baseline measurement since
the highest number of cases was reported during that period (Tables 34 and Figures 40-43). Only eight
provinces reported malaria cases during period 2013-A which were classified as follows: 1) Manabí,
Orellana, Pastaza, and Sucumbíos were classified as “early treatment”; 2) Esmeraldas, El Oro and Guayas
were classified as “late treatment”; and 3) Los Rios was classified as “extremely late treatment”.
Figure 44. Number of malaria cases among provinces by treatment arm at period 2013-A (Period 2013-A – 2014-B)
Post period 2013-A rates show an overall decreasing trend for late and extremely late treatment
arms whereas for early treatment there seems to be a tendency to increase number of cases during the last
two periods.

98
Figure 45. Malaria incidence rate among provinces by treatment arm at period 2013-A (Period 2013-B – 2014-B)
A post-period 2013-A temporal analysis showed that early treatment provinces tend to have
higher incidence rates in the subsequent periods as compared to late and extremely late provinces (Figure
45). Particularly, Pastaza and Orellana provinces reported the highest incidence rates, especially during
periods 2014-A and 2014-B.
99
Chapter Seven: Discussion
7.1 General discussion
Malaria is an ancient, preventable parasitic infection that continues to represent a public health
issue of global concern. In fact, it is estimated that around half of the world’s population live in areas of
risk of malaria transmission and the disease caused more than half a million malaria-related deaths
worldwide in 2013, mostly in sub-Saharan Africa. (2) Nonetheless, in Ecuador, malaria transmission has
declined sharply and consistently since year 2000. (2, 105, 106) The country has received the “Champion
for the Eradication of Malaria” award by PAHO and is currently deemed to be in pre-elimination phase.
(2, 8) Understanding the factors that have contributed to the observed decrease of malaria cases in
Ecuador is fundamental since Ecuador could represent a case study for other countries facing similar
conditions; especially after considering the fact that tropical regions of Ecuador represent ideal
environmental niches for malaria transmission and that until very recently malaria was in fact widely
transmitted in those areas. Ecuador’s effort for malaria control had been channeled through the National
Service for the Eradication of Malaria (SNEM). This national malaria service has implemented since year
2000 onwards a comprehensive control packages which main characteristic was the progressive
community outreach facilitating diagnosis and treatment through the deployment of skilled community-
based health worker. (107) This in turn, not only increased accessibility of malaria diagnosis and
treatment but rather may actually have lowered the time from infection/symptom’s onset to healthcare
service provision. (107) Noteworthy, malaria microscopic diagnosis is performed in almost every patient
with symptoms and treatment is only started after confirmation. The first-line treatment for P. falciparum
is the combination artemether-lumefantrine (AL) + primaquine whereas vivax malaria is treated with
chloroquine + primaquine. (2) The addition of primaquine to the first-line treatment of falciparum malaria
is essential and aims to achieve gametocyte clearance which has important implications for malaria
100
prevention and control. (2, 105) Specifically, although it has been previously reported that artemisinin
derivatives may exert certain gametocytocidal effects, these are limited to immature gametocytes. (108)
The addition of primaquine, which targets mature gametocytes, increases the probability of radical
treatment and gametocyte clearance and therefore could further reduce the likelihood of malaria
transmission and is recommended by the WHO especially in countries in pre-elimination (like Ecuador)
or elimination phase. (109) Furthermore, it has been suggested that the combination AL reduces patient
infectiousness. (108) Therefore, it is this study’s contention that early malaria treatment, as a result of
this increased availability, leads to decrease post-treatment gametocytemia (i.e. detectable gametocytes at
any point during follow-up).
A retrospective cohort design was used to evaluate the impact of early treatment on
gametocytemia among all patients diagnosed with malaria in the province of Esmeraldas, Ecuador
between July 2012 and March 2015. Most of our study population received late treatment (58.03%)
followed by extremely late (21.76%) and early (20.21%) treatment. Although no other study classifying
patients this way were found, a prospective study conducted in two different municipalities of Colombia
found that the time elapsed from symptoms onset to treatment, among patients diagnosed with P.
falciparum, ranged from 1 to 30 days (75% between 1 and 5 days) in Turbo and 1 to 15 days in Zaragoza
(85% between 1 and 5 days), in the Department (i.e. Province) of Antioquia. (37) Interestingly, although
our study found that 12.8% of patients in early treatment presented gametocytemia at diagnosis, the
previous study in Colombia by Arango et al. (2004) showed that no patient had gametocytemia when
diagnosis was made on days 1 or 2 post-symptom. (37) However, another study conducted in Ghana
showed that 10.5% of children from coastal areas presented with gametocytemia at diagnosis. (45) These
differences might be related to characteristics that are unique to the subject, the parasite or the
transmission dynamics. For instance, whereas in Colombia there are high levels of transmission,
Esmeraldas shows very low transmission levels. This difference in transmission might be associated with
differential immune response and demographic characteristic of affected population which may, at least in
part, explain the different rates of gametocytemia at diagnosis (i.e. higher transmission may lead to

101
stronger immune response and limited development of gametocytes as demonstrated in cases of
premonition where a strong, non-sterile immune response leads to extremely slow parasite development
(110) ). Additionally, the study by Arango et. al. (2004) was conducted in the Atlantic and Northern
regions of Colombia where the predominant parasite species and transmission patterns may be different.
(37)
Regarding parasite species, the majority of patients diagnosed in Esmeraldas suffered from P.
falciparum infections (97.4% overall, 94.9% among early, 99.1% among late, and 95.2% among
extremely late patients). This pattern is opposite to the national malaria epidemic pattern in which P.
vivax predominates with 70.3%; however, this is not completely unexpected since a large proportion of
the population in Esmeraldas province are African descendants and, as explained below, could be less
likely to get infected with vivax malaria. In fact, the ethnical composition of the population in Esmeraldas
largely diverts from the one observed for Ecuador as a whole. Namely, due to historical reasons
Esmeraldas is home to the majority of Afro-Ecuadorians and, accordingly, the proportion of people who
self-identify as Afro-Ecuadorian in Esmeraldas is significantly higher than in other regions of Ecuador.
This is a very interesting fact, as recent research suggests that P. falciparum was introduced to South
America through slave trade (111) and Esmeraldas is the only region of Ecuador where African
descendants are as numerous. Similarly, a recent report of the malaria epidemic in Colombia highlights
that whereas P. vivax is more common nationwide, the pacific regions report higher incidence of P.
falciparum. (112) Such patterns may be at least partially explained by the high African descendant
population who are more likely to be phenotypically categorized as Duffy-negative subjects. (112) In fact,
a recent study reported that the Duffy-negative genotype had a prevalence of 56% in the cities of
Buenaventura and Tumaco, both located in the southern Pacific coast of Colombia and the latter lying in
the border with Esmeraldas, Ecuador. (113)
An analysis of the impact of treatment on asexual parasite survival showed that only three
patients out of 193 (1.5%) developed detectable parasitemia at some point during follow-up. High level of
parasitemia clearance is a landmark characteristic of artemisinin-based combination therapy (ACT) and is
102
one of the reasons why it is recommended as first-line malaria treatment. In fact, ACT proved to be
effective in this study population and these results corroborate previously published data. For instance, a
clinical trial conducted in Ghana showed that only one patient, out of 163, developed PCR-corrected late
parasitic failure at day 14. (45)
A series of possible confounders were investigated; however, none had statistically significant
association with treatment arm except for the proportion of pregnant females. This may be related to the
fact that pregnant women are more likely to receive medical care because of the required ante natal care
visits. Additionally, it is likely that pregnant women may receive a preferential treatment for medical or
health care provision within her own family (i.e. the family would prefer to prioritize the healthcare needs
of the pregnant woman over other members of the family). Nevertheless, since pregnancy is a variable
that applies only to females it was not included in further analysis (i.e. it would have cause that more than
50% of subjects be dropped from the analysis due to missing data). Of special interest, the number of
follow-up visits, treatment appropriateness (i.e. whether the patient received treatment according to
national guidelines) and graphic treatment provision (i.e. whether the patient received graphic instructions
for the anti-malarial prescription, which is a standard local practice) were all found to be similar across
treatment groups. Thus, bias and confounding effects stemming from these variables are likely to have
been avoided. Similarly, other important covariates like age, gender, province of origin, province of
infection, the presence of another symptomatic person in the vicinity and if so the place where that person
lives (i.e. in the same household or not), whether the patient slept temporarily outside his/her community,
location of that temporal residence, province of work and whether the infection is considered indigenous
or imported where all similar across the different treatment arms. Given the closeness of Esmeraldas to
Colombia, the latter variable may have a special importance. As mentioned earlier, an infection was
considered imported if the patient is thought to have acquired the infection in Colombia based on the
information provided in the epidemiological survey form, specifically regarding place of permanent and

103
temporal residence (i.e. if the patient lives or had slept in Colombia in the month previous to
diagnosis/treatment).
Asexual parasite density and gametocytemia have previously been reported to be correlated with
the time elapsed from symptom onset to diagnosis/treatment. (37, 38) Such correlation was also observed
in this study with early treatment patients having lower asexual parasitemia levels (i.e. parasite density)
than those belonging to late and extremely late groups. In fact, the proportion of patients belonging to the
lowest three parasite density classification groups (i.e. Very Los, Low and Medium) was highest among
early treatment patients whereas the proportion of patients belonging to the next category (i.e. High) was
highest among late treatment patients and, finally, the proportion of patients having the greatest parasite
density (i.e. Very high) was greatest among extremely late group patients. Similarly, gametocytemia at
diagnosis was highest among extremely late treated patients (i.e. 23.8% of patients had detectable
gametocytemia at diagnosis as compared to 11.6% in late and 12.8% in early treatment groups). This can
be explained by the fact that the process of gametocytogony takes up to 8 days for P. falciparum and it is
estimated that gametocytes would be detected from day four after onset of symptoms (see Figure 9).
Time elapsed from symptoms onset to treatment and detectable gametocytemia at some point
during follow-up were found to have a statistically significant association in this study. After controlling
for potential confounders, people receiving extremely late treatment were almost 3.5 and 5 times more
likely to present gametocytemia than those receiving late and early treatment respectively. Very
interestingly, this association was consistently found to be statistically significant across different
regression model algorithms applied including binary logistic (p < 0.05), linear (estimate 0.018, p < 0.01),
Poisson log linear (estimate 0.103, p = 0.01) and negative binomial (estimate 0.111, p = 0.01) which
underscores the nature of this association. Although there may be other explanations for this observation,
based on the results of this study we can conclude that the longer the time to treatment the higher the
probability of developing gametocytemia at some point during follow-up. Although, no other studies were
found which specifically evaluate the effect of time to treatment and gametocytemia during follow-up, a
104
study conducted in Ghana reported that gametocytemia at day 2 post treatment among children from
coastal zone was 10.5% whereas at day 3 it was reduced to 5.3%. (45)
More importantly, a Kaplan-Meier survival analysis showed that, although statistically non-
significant, there was a difference in the mean time to reach clearance of gametocytemia across the
different treatment groups. Briefly, mean time to gametocyte clearance was 5.1, 4.8 and 5.3 days for
people receiving early, late and extremely late treatment. This apparent paradox (i.e. longer time to
gametocyte clearance among early treatment as compared to late treatment patients) could be explained
by idiosyncrasies of some patients or even the existence of pharmacological resistance, since the standard
error among early treatment patients was wider.
It was shown that extremely late treated patients represent a much higher transmission potential
since they had been at least 7 days without treatment and potentially carrying gametocytes which would
further be transmitted and continue malaria transmission. As shown in Figure 24, an average early
treatment patient in this study population would be carrying gametocytes for a maximum of 4 days,
assuming gametocytemia was present at day 4 of symptoms onset, whereas the maximum period of
transmissibility would be 9 days for late treatment patients and many times much longer for those being
extremely late treated. These results would suggest a pivotal role that early treatment may have in malaria
control by reducing the period of time when gametocytes are available in peripheral blood for further
malaria transmission. In fact, the period of transmissibility would be range from 0-3 days, 5-9 and 10-27
for early, late and extremely late treatment patients, respectively. These results were confirmed by a
Jonckheere-Terpstra test to take into account the orderly effect of treatment arm on period of
transmissibility which revealed that the period of transmissibility is significantly longer for extremely
treated patients. Thus, early malaria treatment could have an extremely important role in malaria control
through the reduction of gametocyte carriage and onwards malaria transmission.
Interestingly, parish-level and province-level ecologic studies did not yield consistent results
showing association between time to treatment and malaria transmission in the subsequent cycle.

105
Probably, the main exception is the statistically significant association found in a repeated measures,
parish-level analysis between time to treatment, gametocyte carriage during follow-up, and malaria cases
in subsequent periods (i.e. post-period 2013-A). On the other hand, many of the observed trends even
seem to be paradoxical showing that the areas or regions where mean time to treatment was higher had
reduced malaria transmission in the subsequent periods. For instance, let us look at the parish of Vuelta
Larga in the province of Esmeraldas, which is a suburban area in the city of Esmeraldas. A total of 90
cases were reported in this parish during period 2013-A when most of the patients received late treatment.
During period 2013-B, only 20 cases were reported and no case was reported from period 2014-A
onwards. Similar peri-urban outbreaks have been reported in other areas of Latin America, like Colombia
where, despite malaria being predominantly rurally transmitted, occasional suburban outbreaks occur.
(112) Interestingly, in the pacific region of Colombia, with which Esmeraldas borders, urban and peri-
urban malaria may represent up to 39% of cases for P. vivax and 24% for P. falciparum. (112)
This epidemic outbreak in the periphery of Esmeraldas city during period 2013-A is thought to
have been associated to the migration of one infected person from Colombia followed by further local
spread, as explained by local authorities. (107) According to a report by Narvaez (2014), local authorities
believed that the outbreak started in the jail, which is surrounded by less privileged neighborhoods where
conditions are ideal for the malaria vector to thrive. (107) This explanation seems plausible since human
migration has been postulated to facilitate the dissemination of malaria, including drug-resistant strains
(37, 112). Specifically, human migration related to mining, timber, armed internal conflict or illicit
agricultural activities have been suggested to affect malaria transmission. (112) There are many
mechanisms through which human migration could affect malaria transmission. For instance, the
immigration of malaria-immunologically naïve subjects into endemic areas may facilitate disease
transmission. (112) Additionally, reintroduction of malaria can occur when infected subjects, either
symptomatic or not, migrate to areas where malaria had previously been eliminated or eradicated. This
might be a partial explanation for the seemingly continuous malaria transmission that occurs in provinces
of the Ecuadorian Amazon Basin as shown in this study. For instance, we observed that the provinces of

106
Pastaza, Orellana, and Sucumbíos (all of them in the Amazon Basin) reported malaria cases during
periods all periods in the study. It is important to mention that the Amazon Basin provinces receive high
seasonal and non-seasonal migration of people who stay for work or tourism. Another important
consideration is that the ecologic conditions in the Amazon basin differ significantly from those in the
coastal region, especially in terms of the periodicity of the rainy season.
Human migration, however, cannot be the only explanation for these apparent contradictory
population-level associations between longer time to treatment and decreased malaria transmission in
subsequent periods. Another important factor to consider is the implementation of malaria control
policies. In fact, a recent report based on in-depth interviews among malaria control key stake holders in
Ecuador showed that malaria control activities are deployed intensively whenever a new outbreak or foci
of malaria is recognized. (107) Under such scenario the following explanation is plausible. An infected
asymptomatic carrier immigrates to an ecologically favorable community where the vector abounds. A
rapidly spreading outbreak ensues, however, since malaria cases reported in previous seasons had been
relatively low, patients delay seeking healthcare assistance and usually receive treatment after 2 days of
symptoms onset. Thus, overall, the majority of individuals would effectively receive late or extremely late
treatment. Confronted with a new outbreak, authorities deploy intense vector and malaria control
strategies to prevent further transmission amplification leading to reduced transmission rates in the
subsequent periods and seasons. Such can be the explanation for the outbreak in Vuelta Larga during
period 2013-A and the subsequent low reported rates. In fact, the SNEM stated that the 2013 outbreak
was controlled through selective and sequential indoor residual spraying (IRS) campaigns supported by
community-based communication and education campaigns. (106) Similarly, that could at least partially
explain the trends observe in the nationwide population-level analysis.
The importance of malaria control policy and infrastructure in Ecuador has recently been
reviewed by Narvaez. (107) According to that report, one of the pillars for the success of malaria control
in Ecuador has been the application of consistent diagnosis, treatment and surveillance methodologies
across the country. One primordial aspect of SNEM’s control efforts was the expansion of microscopic

107
diagnostic units (MDU) from only 40 in year 2000 (107) to 245 by 2014. (106) Importantly, these
activities have been decentralized and both diagnosis and treatment were made available to even
relatively remote communities which in turn have helped improve the implementation of malaria control
strategies and might be partly responsible for the observed decreasing trends in the number of cases. In
fact, these MDU relied at least partially on the contribution from CHWs who were trained on drawing,
storing and transporting blood samples for further review by trained SNEM technicians. (105)
Additionally, with the support of the international community-based epidemiology project named
PAMAFRO, the SNEM introduced a mew intervention model based on intensive malaria control with
community-based focalized P. falciparum foci and outbreak control interventions favoring the
distribution of insecticide treated nets (ITNs) and deemphasizing indoor residual spraying (IRS) activities
which were relegated to be used only on outbreak control. (107) Similarly, surveillance collection forms
and informatics systems were updated and redesigned to be better adapted to local realities. (107) Such
activities had traditionally being implemented by the SNEM as a vertical and independent program which
had been established even before the Ministry of Public Health (MoH) of Ecuador. However, currently,
the SNEM is being absorbed into the structure of the MoH and many officers are afraid that the advances
in malaria control may not be sustained in the long term, especially because the guidelines for the merger
and for the roles previous SNEM officers and technicians will have in the MoH have not been published.
Many fear that SNEM officers and technicians will be overburden with other healthcare responsibilities
and that malaria control will be neglected, buried under other priorities each local MoH district may have.
There are other factors that are importantly associated with malaria transmission and that could
help explain the observed results. For instance, deforestation associated with timber production, illicit
agriculture, fish/shrimp farming and mining may provide with ideal habitats for vectors to breed. (112)
Similarly, ideal environmental conditions like humidity, temperature and rainfall can increase vector
population and therefore the risk or the potential risk for malaria transmission. In the same vein, the
effects of El Niño Southern Oscillation (ENSO) on malaria transmission have been widely documented.
(112) The greatest recent ENSO event occurred in 1997-1998 and is believed to have caused the increase

108
in malaria cases observed in year 2000 in Ecuador. (107) No significant ENSO events have been reported
in the study period. (114)
Finally, Esmeraldas constitutes a province vulnerable to malaria not only due to the local
environmental conditions, which favor vector reproduction and therefore malaria transmission, but also
because of its closeness to Colombia. This is important because although Ecuador has made significant
progress in malaria control, Colombia still report greater number of cases, especially in the areas near the
border with Ecuador. Additionally, poor socioeconomic development in the area of the border of
Esmeraldas and Colombia adds to the high formal and informal trans-border migration which, for all
reasons previously exposed, may increase the risk of malaria transmission in Esmeraldas, especially in the
northern parishes close to the border with Colombia. Furthermore, political, civil and military instability
in the border with Colombia, as a result of violent actions between local guerrillas and regular forces, may
further weaken the healthcare network in the northern of the province, force human migration, illegal
activities and further increase the risk of malaria.
In fact, all these challenges are relevant for most of the active malaria transmission foci in
Ecuador. Furthermore, additional challenges for malaria control remain for the country as a whole. For
instance, a recent report shows the existence of up to 20% asymptomatic malaria carriers in the Pacific
coast of Colombia, including areas near to the border with Ecuador, (113) which highlights the risk for
further transmission, especially if malaria control measures were to be stopped or neglected. Finally, the
recent and ongoing incorporation of SNEM and MoH can be a unique opportunity to strengthen malaria
control but could also turn into a setback to achieve this objective. One of the main concerns is that
malaria control might be neglected, drowned under a myriad of other priorities the MoH may have or will
have. For instance, an increase in the number of dengue cases occurred almost concomitantly to the
decrease in the number of malaria cases, especially in recent years, leading to a shift in the etiology of
fever cases, at least in the province of Esmeraldas, as reported by Cifuentes et. al. (38) Furthermore, an
important outbreak of the recently introduced Chikungunya fever occurred in Ecuador during the first
months of year 2015. (115) In fact, according to the MoH, more than 27,000 cases were reported by July,

109
including more than 3,000 in Esmeraldas, (115) compared to less than 10 cases of malaria reported
between January and March 2015 in Esmeraldas as shown in this report. This has important implications
since it may divert patient’s, clinician’s and public health officer’s attention away from malaria when it
comes to evaluating the cause of fever and therefore result in the delayed malaria diagnosis and treatment.
Given the local favorable ecological conditions and the important reduction on the number of malaria
cases, neglecting malaria control at this moment would be a terrible mistake that could potentially have
disastrous consequences. Malaria can easily be reintroduced in tropical areas as demonstrated even in
Ecuador since malaria was considered eliminated from the lower Napo region during the 1970’s only to
reemerge in subsequent years. (116) Another extremely important aspect relates to vulnerable
populations. As demonstrated in the 2013 outbreak, vulnerable populations like inmates, women, children
and those living in lower socioeconomic status housing and neighborhoods may be at increased risk not
only of acquiring the infection but also of not accessing healthcare services in a timely fashion which
would worsen the personal and community conditions favoring increased malaria transmission and
burden.
Despite this challenges it is noteworthy to mention some of the perceived strengths of Ecuador’s
national malaria control program (SNEM), Probably one of the greatest strengths of SNEM is the degree
of community involvement that it has developed. Community volunteers have been incorporated into
SNEM activities as outreach technicians able to identify suspicious cases, take blood samples and make
sure that these samples reach trained technicians to diagnose and treat malaria. This is extremely
important, especially considering the remoteness of many of the parishes and communities were malaria
transmission is active, especially in the northern border of Esmeraldas. Additionally, although debatable,
it is likely that the vertical, independent autonomy that SNEM enjoyed for more than four decades may
have favored the development of a strong, dedicated and highly trained workforce specialized exclusively
in malaria diagnosis and treatment. It would be interesting to try to replicate similar approaches in areas
where malaria transmission remains high and that have similar conditions, emphasizing the importance of
timely malaria diagnosis and treatment and how to best achieve this through community involvement.

110
However, as explained earlier, the success of the program was also dependent on the support from
international partners and continuous commitment from the central government. Thus, long-term
sustainability of such a program would be difficult to ensure and therefore appropriate corrective and
preventive measures should be put in place to increase the likelihood of sustainability (although certainly
community involvement and empowerment would be instrumental in achieving this goal).
This study has some minor limitations. Firstly, although we consistently found statistically
significant associations, most of them were of low magnitude. Future research is required to further
elucidate the nature of the observed associations. Such research should include larger sample size,
gametocytemia per microliter of blood and recording of other potential explanatory variables like axillar
temperature, asexual parasitemia per microliter of blood, pharmacokinetic parameters. On the same
subject, the sample size for this study was relatively small. Replicating this study in larger populations
would increase power and help to describe in more detail the association between time to treatment,
follow-up gametocytemia and malaria transmission. Finally, the ecologic studies are subject to ecological
fallacy which states that the associations observed (or not observed) at the population level may not
necessarily reflect the true associations that occur at the individual level. (104)
There are several strengths that characterize the present study, among them the appropriate use of
study designs tailored to answer the proposed hypotheses and objectives which were also innovative in
various aspects but fundamentally in the way patients were classified into early, late and extremely late
treatment which would certainly help better define what timely malaria treatment means in terms of
operational planning and public health practice. Additionally, all patients were scheduled to complete a
28-day follow-up (5 visits in total). Epidemiological and parasitological information was programmed to
be collected at every single patient visit; such information included completing the corresponding sections
of the data collection form, blood smear diagnosis and supervised treatment administration logs. Another
important strength of this study is that it was done with data collected in the field, under real-life
conditions. Thus, even though the associations were not strong there is certainty that they exist and they
occur in field conditions where program operation needs to face inherent challenges associated to

111
community work. Similarly, a very important advantage is that the study was conducted among all
patients reported to by the SNEM thus minimizing selection bias and since the information was originally
recorded prospectively, and only the analysis was retrospective, the possibility of recall bias is also
minimal. Finally, results were consistent using different statistical approaches and methodologies which
confirm the robustness of the associations.
Based on the information collected from this study and from the different written and oral reports
obtained from officials working in the field in Ecuador, the following model for a proposed timeline from
early treatment to malaria control is presented (Figure 46).
Figure 46. Proposed model of a timeline from early treatment to malaria control
In the proposed model, early treatment would lead to lower follow-up gametocytemia which in
turn leads to reduced possibility of transmission resulting, eventually, in malaria control. The likelihood
for accomplishment of this timeline is highly dependent and affected by external factors like: 1)
environmental factors; 2) other malaria prevention and control strategies like IVM and IDM; 3) political
stability (or instability); 4) availability of appropriate financing and non-financial resources; 5)
commitment and support, both domestic and international (as demonstrated by the expansion of the
MDUs and the coordinated research and projects funded by The Global Fund in Ecuador); 6)
socioeconomic conditions; and, 7) community involvement and empowerment.

112
7.2 Conclusion
Ecuador has achieved significant reduction in the number of cases of malaria from year 2000
onwards. The reasons for this trend may be multiple and complex and it will be very difficult to identify
an isolated cause for such commendable achievement. Nonetheless, timely malaria diagnosis and
treatment has been pivotal for malaria control. To the best of our knowledge there have been no studies to
corroborate the importance that time to treatment has on circulating and detectable gametocytemia which
carry importance since gametocytes are the transmission stage of the parasite. In this study, it has been
consistently shown that early treatment is associated with: 1) decrease likelihood of having detectable
gametocytemia during any follow-up visit, 2) lower total number of follow-up visits in which
gametocytes can be detected; and, 3) decreased gametocyte counts at follow-up visits in days 5 and 7.
These factors, in turn, may be associated with lower malaria transmission. Our population-level analysis
showed that regions where majority of patients received late or extremely late treatment, were usually
associated with lower transmission rates in subsequent periods. This may be explained by the fact that
these regions usually are also the regions where active outbreaks are occurring and therefore where
malaria control strategies are been maximally implemented. Thus, indirectly, the importance of malaria
control strategies has been highlighted. Currently, the malaria control program in Ecuador is undergoing
significant changes and it is uncertain whether these accomplishments will be maintained. Moreover,
Esmeraldas remain a vulnerable province because of its proximity with Colombia where transmission
rates are much higher than in Ecuador, because of the relatively high trans-border human migration,
because of the presence of both legal and illegal agricultural, mining, fish/shrimp farming and timber
activities, because of the armed conflict and its spinoff socioeconomic effects, and because it enjoys
tropical weather conducive to mosquito reproduction. If malaria is to continue to be controlled or even
eliminated the current timely diagnosis and treatment efforts should be maintained and deepened at the
same time that surveillance and monitoring is enhanced allowing for quick intervention in outbreak
scenarios. If these strategies are sustained it is possible that Esmeraldas and Ecuador will control and
possible eliminate indigenous malaria transmission.

113
7.3 Public Health relevance and recommendations
The present study has an important international public health value stemming from both the fact
that it addresses an outstanding global health issue and because it provides evidence to tailor control
strategies that may help curb that very same issue. Although current WHO guidelines recommend early
malaria diagnosis and treatment, there is lack of peer-reviewed published evidence evaluating the impact
of timely malaria treatment on malaria transmission. Moreover, to the best of our knowledge, there is no
definition of how early treatment should be; thus, by establishing a clear association of early treatment
defined as treatment within 2 days, this study is contributing a significant piece of evidence to further
strengthen current malaria control policies. Additionally, the results in this study demonstrate that timely
malaria treatment (i.e. early treatment) can reduce the probability that gametocytes will be detectable at
any point during follow-up and thus provides evidence that could suggest its implementation in other
areas where malaria transmission occurs and has similar characteristics than in Ecuador. This would be
instrumental not only in achieving malaria elimination and control goals but would also represent an
innovative approach in which malaria treatment can be thought of as a primary prevention strategy aimed
at preventing further transmission of the disease. This approach is also highly relevant for Public Health
as it would imply using malaria treatment as a primary prevention strategy with benefits to the larger
community population and not only to the individual. Further studies should be conducted to evaluate the
impact of early malaria treatment in the transmission of malaria in other geographical locations like
Africa, where the malaria burden is maximum.
Regarding malaria control in Ecuador, it is recommended that timely malaria treatment is adopted
as a national priority encouraging every patient to be treated within 2 days of symptoms onset, or in less
than 7 days as last resource. Implementing such program would be challenging however, as explained
earlier, it is recommended that it includes significant community involvement and empowerment to
ensure sustainability. It is also critical to consider the relative burden of malaria to other causes of fever to
ensure that both the population and the healthcare workers do not neglect timely malaria diagnosis and
treatment. This, in addition to strengthening other aspects of malaria control, will help achieve the goal of

114
malaria elimination. Special attention should be given to all borders in Ecuador since both Peru and
Colombia still report higher number of cases and their progress in malaria control is significantly lower
than Ecuador’s. Finally, according to new government policies the SNEM office has now been integrated
into the MoH structure; therefore, it will be necessary to closely monitor this process to evaluate its
possible impact on malaria control (i.e. to determine whether it would enhance or weaken the current
SNEM malaria control program and its achievements). That being said, malaria control should be
incorporated into a broader Integrated Disease Management (IDM) Program whereby each community
will be analyzed and a comprehensive intervention addressing all important locally transmitted diseases
will be implemented, including IVM techniques.

115
References
1. Guerrant RL, Walker DH, Weller PF. Tropical infectious diseases principles, pathogens and
practice. Edinburgh: Saunders/Elsevier; 2011.
2. World Health Organization. World malaria report 2014. Geneva: World Health Organization;
2014. xiii, 227 p. p.
3. World Health Organization. World malaria report 2011. Geneva: World Health Organization;
2011. xii, 246 p. p.
4. Pasquale H, Jarvese M, Julla A, Doggale C, Sebit B, Lual MY, et al. Malaria control in South
Sudan, 2006-2013: strategies, progress and challenges. Malaria journal. 2013;12:374. Epub 2013/10/29.
5. Pan American Health Organization. Health in the Americas. 2007 ed. Washington, D.C.: Pan
American Health Organization; 2007. 2v. p.
6. Organización Panamericana de la Salud. Salud en las Americas. 2012 ed. Washington, D.C.:
Organizacion Panamericana de la Salud; 2012. 2v. p.
7. Pan American Health Organization. Report on the Situation of Malaria in the Americas, 2011.
Washington, D.C.: Pan American Health Organization; 2011.
8. Pan American Health Organization. Ecuador gana premio al "Campeon de le malaria en las
Americas". Quito: Pan American Health Organization; 2009.
9. Pinault LL, Hunter FF. Malaria in highlands of Ecuador since 1900. Emerging infectious
diseases. 2012;18(4):615-22. Epub 2012/04/04.
10. Carter R, Mendis KN. Evolutionary and historical aspects of the burden of malaria. Clinical
microbiology reviews. 2002;15(4):564-94. Epub 2002/10/05.

116
11. Pan American Health Organization. Health Situation in the Americas 2009. Basic Indicators.
Washington, D.C.: Pan American Health Organization; 2009.
12. Reina-Ortiz M, Caliskan S, Jacob B et al. Using Parish-level Prevalence Data within a GIS
Environment to Understand and Predict Malaria Activity Foci in the Province of Esmeraldas, Ecuador.
Presented at: The 6th International Congress of the Society for Vector Ecology; 2013 Sep 22-27; La
Quinta, CA.
13. Pan American Health Organization. Malaria Statistics, Ecuador [internet]. Washington, D.C.: Pan
American Health Organization; 2014. [cited 2015 Jul 7]. Available from
http://phip.paho.org/vizql/w/MalariaSurveillanceIndicators/v/Web/viewData/sessions/9CC66FAD82DB
4B499C89ED09B0C447A4-0:1/views/Diagnosis_-208373899?maxrows=200.
14. Pan American Health Organization. Malaria in Ecuador. Time Series Epidemiological Data from
1998 to 2004. Washington, D.C.: Pan American Health Organization; 2004.
15. Bi Y, Hu W, Liu H, Xiao Y, Guo Y, Chen S, et al. Can slide positivity rates predict malaria
transmission? Malaria journal. 2012;11:117. Epub 2012/04/20.
16. Gobierno de la Republica del Ecuador. Prevención y control de la malaria entre poblaciones en
circunstancias especiales en las Américas. Quito: Ministerio de Salud Pública del Ecuador; 2011 May. .
17. Cromley EK, McLafferty SL. GIS and public health. Second Edition. New York: The Guilford
Press; 2012. 340 p. p.
18. Jacob BG, Arheart KL, Griffith DA, Mbogo CM, Githeko AK, Regens JL, et al. Evaluation of
environmental data for identification of Anopheles (Diptera: Culicidae) aquatic larval habitats in Kisumu
and Malindi, Kenya. Journal of medical entomology. 2005;42(5):751-5. Epub 2005/12/22.
19. Diuk-Wasser MA, Bagayoko M, Sogoba N, Dolo G, Toure MB, Traore SF, et al. Mapping rice
field anopheline breeding habitats in Mali, West Africa, using Landsat ETM+ sensor data. International
journal of remote sensing. 2004;25(2):359-76. Epub 2007/12/18.

117
20. Jacob BG, Burkett-Cadena ND, Luvall JC, Parcak SH, McClure CJ, Estep LK, et al. Developing
GIS-based eastern equine encephalitis vector-host models in Tuskegee, Alabama. International journal of
health geographics. 2010;9:12. Epub 2010/02/26.
21. Jacob BG, Morris JA, Caamano EX, Griffith DA, Novak RJ. Geomapping generalized eigenvalue
frequency distributions for predicting prolific Aedes albopictus and Culex quinquefasciatus habitats based
on spatiotemporal field-sampled count data. Acta tropica. 2011;117(2):61-8. Epub 2010/10/26.
22. Pinault LL, Hunter FF. Larval Habitat Associations with Human Land Uses, Roads, Rivers, and
Land Cover for Anopheles albimanus, A. pseudopunctipennis, and A. punctimacula (Diptera: Culicidae)
in Coastal and Highland Ecuador. Frontiers in physiology. 2012;3:59. Epub 2012/03/29.
23. Mwangangi JM, Shililu J, Muturi EJ, Muriu S, Jacob B, Kabiru EW, et al. Anopheles larval
abundance and diversity in three rice agro-village complexes Mwea irrigation scheme, central Kenya.
Malaria journal. 2010;9:228. Epub 2010/08/10.
24. Van Der Hoek W, Konradsen F, Amerasinghe PH, Perera D, Piyaratne MK, Amerasinghe FP.
Towards a risk map of malaria for Sri Lanka: the importance of house location relative to vector breeding
sites. International journal of epidemiology. 2003;32(2):280-5. Epub 2003/04/26.
25. Medica DL, Sinnis P. Quantitative dynamics of Plasmodium yoelii sporozoite transmission by
infected anopheline mosquitoes. Infection and immunity. 2005;73(7):4363-9. Epub 2005/06/24.
26. Matsuoka H, Yoshida S, Hirai M, Ishii A. A rodent malaria, Plasmodium berghei, is
experimentally transmitted to mice by merely probing of infective mosquito, Anopheles stephensi.
Parasitology international. 2002;51(1):17-23. Epub 2002/03/07.
27. Sinnis P, Zavala F. The skin stage of malaria infection: biology and relevance to the malaria
vaccine effort. Future microbiology. 2008;3(3):275-8. Epub 2008/05/29.
28. Amino R, Thiberge S, Martin B, Celli S, Shorte S, Frischknecht F, et al. Quantitative imaging of
Plasmodium transmission from mosquito to mammal. Nature medicine. 2006;12(2):220-4. Epub
2006/01/24.

118
29. Yamauchi LM, Coppi A, Snounou G, Sinnis P. Plasmodium sporozoites trickle out of the
injection site. Cellular microbiology. 2007;9(5):1215-22. Epub 2007/01/17.
30. Sidjanski S, Vanderberg JP. Delayed migration of Plasmodium sporozoites from the mosquito
bite site to the blood. The American journal of tropical medicine and hygiene. 1997;57(4):426-9. Epub
1997/11/05.
31. Fairley NH. Sidelights on malaria in man obtained by subinoculation experiments. Transactions
of the Royal Society of Tropical Medicine and Hygiene. 1947;40(5):621-76. Epub 1947/05/01.
32. Desowitz RS. The fate of sporozoites. Bulletin of the World Health Organization.
2000;78(12):1445-6. Epub 2001/02/24.
33. Kreier JP, Rockefeller Foundation., United States. Agency for International Development.
Malaria. New York: Academic Press; 1980. v. p.
34. Killick-Kendrick R, Warren M. Primary exoerythrocytic schizonts of a mammalian Plasmodium
as a source of gametocytes. Nature. 1968;220(5163):191-2. Epub 1968/10/12.
35. Centers for Disease Prevention and Control. Malaria, About Malaria, Biology [internet]. Atlanta:
Centers for Disease Control and Prevention; 2010 [updated 2012 Nov 9; cited 2015 Jul 7]. Available
from: http://www.cdc.gov/malaria/about/biology/.
36. Wernsdorfer WH, McGregor I. Malaria : principles and practice of malariology. Edinburgh ; New
York: Churchill Livingstone; 1988.
37. Arango E, Alvarez T, Carmona J, Blair S. Gametocitemia de Plasmodium falciparum según la
respuesta terpéutica a sulfadoxina-pirimetamina y cloroquina en dos municipios de Antioquia, Colombia.
Biomédica 2004;24:79-88.
38. McKenzie FE, Wongsrichanalai C, Magill AJ, Forney JR, Permpanich B, Lucas C, et al.
Gametocytemia in Plasmodium vivax and Plasmodium falciparum infections. The Journal of
parasitology. 2006;92(6):1281-5. Epub 2007/02/20.

119
39. Kakuru A, Jagannathan P, Arinaitwe E, Wanzira H, Muhindo M, Bigira V, et al. The effects of
ACT treatment and TS prophylaxis on Plasmodium falciparum gametocytemia in a cohort of young
Ugandan children. The American journal of tropical medicine and hygiene. 2013;88(4):736-43. Epub
2013/02/06.
40. Eichner M, Diebner HH, Molineaux L, Collins WE, Jeffery GM, Dietz K. Genesis, sequestration
and survival of Plasmodium falciparum gametocytes: parameter estimates from fitting a model to
malariatherapy data. Transactions of the Royal Society of Tropical Medicine and Hygiene.
2001;95(5):497-501. Epub 2001/11/15.
41. Paul RE, Brey PT, Robert V. Plasmodium sex determination and transmission to mosquitoes.
Trends in parasitology. 2002;18(1):32-8. Epub 2002/02/19.
42. Sinden RE, Butcher GA, Billker O, Fleck SL. Regulation of infectivity of Plasmodium to the
mosquito vector. Advances in parasitology. 1996;38:53-117. Epub 1996/01/01.
43. Sowunmi A, Fateye BA. Asymptomatic, recrudescent, chloroquine-resistant Plasmodium
falciparum infections in Nigerian children: clinical and parasitological characteristics and implications for
the transmission of drug-resistant parasites. Ann Trop Med Parasitol. 2003;97(5):469-79. Epub
2003/08/22.
44. Eziefula AC, Staedke SG, Yeung S, Webb E, Kamya M, White NJ, et al. Study protocol for a
randomised controlled double-blinded trial of the dose-dependent efficacy and safety of primaquine for
clearance of gametocytes in children with uncomplicated falciparum malaria in Uganda. BMJ open.
2013;3(3). Epub 2013/03/29.
45. Abuaku B, Duah N, Quaye L, Quashie N, Koram K. Therapeutic efficacy of artemether-
lumefantrine combination in the treatment of uncomplicated malaria among children under five years of
age in three ecological zones in Ghana. Malar J. 2012;11:388. Epub 2012/11/24.
46. World Health Organization. T3 | Test. Treat. Track. Scaling up diagnositc testing, treatment and
surveillance for malaria. Geneva: World Health Organization; 2012. 10 p.

120
47. Moonan PK, Quitugua TN, Pogoda JM, Woo G, Drewyer G, Sahbazian B, et al. Does directly
observed therapy (DOT) reduce drug resistant tuberculosis? BMC public health. 2011;11:19. Epub
2011/01/11.
48. Yen YF, Rodwell TC, Yen MY, Shih HC, Hu BS, Li LH, et al. DOT associated with reduced all-
cause mortality among tuberculosis patients in Taipei, Taiwan, 2006-2008. The international journal of
tuberculosis and lung disease : the official journal of the International Union against Tuberculosis and
Lung Disease. 2012;16(2):178-84. Epub 2012/01/13.
49. Eshetu T, Abdo N, Bedru KH, Fekadu S, Wieser A, Pritsch M, et al. Open-label trial with
artemether-lumefantrine against uncomplicated Plasmodium falciparum malaria three years after its broad
introduction in Jimma Zone, Ethiopia. Malar J. 2012;11:240. Epub 2012/07/25.
50. Mills EJ, Nachega JB, Bangsberg DR, Singh S, Rachlis B, Wu P, et al. Adherence to HAART: a
systematic review of developed and developing nation patient-reported barriers and facilitators. PLoS
medicine. 2006;3(11):e438. Epub 2006/11/24.
51. Bangsberg DR, Hecht FM, Charlebois ED, Zolopa AR, Holodniy M, Sheiner L, et al. Adherence
to protease inhibitors, HIV-1 viral load, and development of drug resistance in an indigent population.
AIDS. 2000;14(4):357-66. Epub 2000/04/19.
52. Bangsberg DR, Perry S, Charlebois ED, Clark RA, Roberston M, Zolopa AR, et al. Non-
adherence to highly active antiretroviral therapy predicts progression to AIDS. AIDS. 2001;15(9):1181-3.
Epub 2001/06/21.
53. Paterson DL, Swindells S, Mohr J, Brester M, Vergis EN, Squier C, et al. Adherence to protease
inhibitor therapy and outcomes in patients with HIV infection. Annals of internal medicine.
2000;133(1):21-30. Epub 2000/07/06.
54. Wood E, Hogg RS, Yip B, Harrigan PR, O'Shaughnessy MV, Montaner JS. Is there a baseline
CD4 cell count that precludes a survival response to modern antiretroviral therapy? AIDS.
2003;17(5):711-20. Epub 2003/03/21.
121
55. Duarte EC, Gyorkos TW. Self-reported compliance with last malaria treatment and occurrence of
malaria during follow-up in a Brazilian Amazon population. Tropical medicine & international health :
TM & IH. 2003;8(6):518-24. Epub 2003/06/07.
56. Pagnoni F, Convelbo N, Tiendrebeogo J, Cousens S, Esposito F. A community-based programme
to provide prompt and adequate treatment of presumptive malaria in children. Transactions of the Royal
Society of Tropical Medicine and Hygiene. 1997;91(5):512-7. Epub 1998/02/17.
57. Kidane G, Morrow RH. Teaching mothers to provide home treatment of malaria in Tigray,
Ethiopia: a randomised trial. Lancet. 2000;356(9229):550-5. Epub 2000/08/19.
58. Marsh VM, Mutemi WM, Muturi J, Haaland A, Watkins WM, Otieno G, et al. Changing home
treatment of childhood fevers by training shop keepers in rural Kenya. Tropical medicine & international
health : TM & IH. 1999;4(5):383-9. Epub 1999/07/14.
59. Coleman PG, Morel C, Shillcutt S, Goodman C, Mills AJ. A threshold analysis of the cost-
effectiveness of artemisinin-based combination therapies in sub-saharan Africa. The American journal of
tropical medicine and hygiene. 2004;71(2 Suppl):196-204. Epub 2004/08/28.
60. World Health Organization. World malaria report 2012. Geneva: World Health Organization;
2012. xxxiv, 249 p. p.
61. Dolo G, Briet OJ, Dao A, Traore SF, Bouare M, Sogoba N, et al. Malaria transmission in relation
to rice cultivation in the irrigated Sahel of Mali. Acta tropica. 2004;89(2):147-59. Epub 2004/01/21.
62. Li T, Yang Z, Wang M. Temperature, relative humidity and sunshine may be the effective
predictors for occurrence of malaria in Guangzhou, southern China, 2006-2012. Parasites & vectors.
2013;6:155. Epub 2013/06/01.
63. Fernandez F. (2005). Análisis de la variabilidad climática de la costa ecuatoriana. Acta
Oceanográfica del Pacífico 13(1)1:1-6.
64. Robert V, van den Broek A, Stevens P, Slootweg R, Petrarca V, Coluzzi M, et al. Mosquitoes and
malaria transmission in irrigated rice-fields in the Benoue valley of northern Cameroon. Acta tropica.
1992;52(2-3):201-4. Epub 1992/12/01.

122
65. Same-Ekobo A, Fondjo E, Eouzan J-P. Grands travaux et maladies à vecteurs au Cameroun :
impact des aménagements ruraux et urbains sur le paludisme et autres maladies à vecteurs. Paris: IRD,
Institut de recherche pour le développement; 2001. 221, 10 p. p.
66. Slootweg, R. & M.L.F. van Schooten (1995). Partial restoration of floodplain functions at local
level: the experience of Gounougou, Benue valley, Cameroon. In: H. Roggeri. Tropical Freshwater
Wetlands: A Guide to Current Knowledge and Sustainable Management. Development in Hydrobiology
12, Kluwer Academic Publishers (in English and French).
67. El Gaddal AA. The experience of the Blue Nile Health Project in the control of malaria and other
water-associated diseases. Washington, D.C., American Association for the Advancement of
Science,1991. p. 51-8. p.
68. Slootweg R, Keyzer R. Reducing schistosomiasis infection risks through improved drainage.
Irrigation and Drainage Systems, 1993; 7: 99-112.
69. el Gaddal AA, Haridi AA, Hassan FT, Hussein H. Malaria control in the Gezira-Managil Irrigated
Scheme of the Sudan. The Journal of tropical medicine and hygiene. 1985;88(2):153-9. Epub 1985/04/01.
70. Antonio-Nkondjio C, Atangana J, Ndo C, Awono-Ambene P, Fondjo E, Fontenille D, et al.
Malaria transmission and rice cultivation in Lagdo, northern Cameroon. Transactions of the Royal
Society of Tropical Medicine and Hygiene. 2008;102(4):352-9. Epub 2008/02/26.
71. Ripert CL, Raccurt CP. The impact of small dams on parasitic diseases in Cameroon. Parasitol
Today. 1987;3(9):287-9. Epub 1987/09/01.
72. Khaemba BM, Mutani A, Bett MK. Studies of anopheline mosquitoes transmitting malaria in a
newly developed highland urban area: a case study of Moi University and its environs. East African
medical journal. 1994;71(3):159-64. Epub 1994/03/01.
73. Ramasamy R, De Alwis R, Wijesundere A, Ramasamy MS. Malaria transmission at a new
irrigation project in Sri Lanka: the emergence of Anopheles annularis as a major vector. The American
journal of tropical medicine and hygiene. 1992;47(5):547-53. Epub 1992/11/01.

123
74. Ghebreyesus TA, Haile M, Witten KH, Getachew A, Yohannes AM, Yohannes M, et al.
Incidence of malaria among children living near dams in northern Ethiopia: community based incidence
survey. BMJ. 1999;319(7211):663-6. Epub 1999/09/10.
75. United States Public Health Service and Tennessee Valley Authority, 1947. Malaria Control on
ImpoundedWaters. Government Printing Office,Washington, DC.
76. Sharma SK, Tyagi PK, Upadhyay AK, Haque MA, Adak T, Dash AP. Building small dams can
decrease malaria: a comparative study from Sundargarh District, Orissa, India. Acta tropica.
2008;107(2):174-8. Epub 2008/07/01.
77. Ijumba JN, Shenton FC, Clarke SE, Mosha FW, Lindsay SW. Irrigated crop production is
associated with less malaria than traditional agricultural practices in Tanzania. Transactions of the Royal
Society of Tropical Medicine and Hygiene. 2002;96(5):476-80. Epub 2002/12/12.
78. Eisenberg JN, Trostle J, Sorensen RJ, Shields KF. Toward a systems approach to enteric
pathogen transmission: from individual independence to community interdependence. Annual review of
public health. 2012;33:239-57. Epub 2012/01/10.
79. Eisenberg JN, Goldstick J, Cevallos W, Trueba G, Levy K, Scott J, et al. In-roads to the spread of
antibiotic resistance: regional patterns of microbial transmission in northern coastal Ecuador. Journal of
the Royal Society, Interface / the Royal Society. 2012;9(70):1029-39. Epub 2011/10/01.
80. Mouchet J, Carnevale P. Impact des transformations de l'environment sur les maladies a
transmission vectorielle. [Impact of changes in the environment on vector-transmitted diseases]. Sante.
1997;7(4):263-9. Epub 1997/07/01. Impact des transformations de l'environnement sur les maladies a
transmission vectorielle.
81. Olson SH, Gangnon R, Silveira GA, Patz JA. Deforestation and malaria in Mancio Lima County,
Brazil. Emerging infectious diseases. 2010;16(7):1108-15. Epub 2010/07/01.
82. Hahn MB, Gangnon RE, Barcellos C, Asner GP, Patz JA. Influence of deforestation, logging, and
fire on malaria in the Brazilian Amazon. PloS one. 2014;9(1):e85725. Epub 2014/01/10.

124
83. Vittor AY, Gilman RH, Tielsch J, Glass G, Shields T, Lozano WS, et al. The effect of
deforestation on the human-biting rate of Anopheles darlingi, the primary vector of Falciparum malaria in
the Peruvian Amazon. The American journal of tropical medicine and hygiene. 2006;74(1):3-11. Epub
2006/01/13.
84. Institute of Medicine (U.S.). Committee for the Study on Malaria Prevention and Control: Status
Review and Alternative Strategies. Malaria: Obstacles and Opportunities: a report of the Committee for
the Study on Malaria Prevention and Control: Status Review and Alternative Strategies, Division of
International Health, Institute of Medicine. Stanley Oaks et al. editors. Washington D.C., 1991.
85. Ijumba JN, Lindsay SW. Impact of irrigation on malaria in Africa: paddies paradox. Medical and
veterinary entomology. 2001;15(1):1-11. Epub 2001/04/12.
86. Klinkenberg E, Takken W, Huibers F, Toure YT. The phenology of malaria mosquitoes in
irrigated rice fields in Mali. Acta tropica. 2003;85(1):71-82. Epub 2002/12/31.
87. Muturi EJ, Kamau L, Jacob BG, Muriu S, Mbogo CM, Shililu J, et al. Spatial distribution, blood
feeding pattern, and role of Anopheles funestus complex in malaria transmission in central Kenya.
Parasitology research. 2009;105(4):1041-6. Epub 2009/06/27.
88. Bismil'din FB, Shapieva Z, Anpilova EN. [Current malaria situation in the Republic of
Kazakhstan]. Meditsinskaia parazitologiia i parazitarnye bolezni. 2001(1):24-33. Epub 2001/09/11.
Sovremennaia situatsiia po maliarii v Respublike Kazakhstan.
89. Chouaibou M, Etang J, Brevault T, Nwane P, Hinzoumbe CK, Mimpfoundi R, et al. Dynamics of
insecticide resistance in the malaria vector Anopheles gambiae s.l. from an area of extensive cotton
cultivation in Northern Cameroon. Tropical medicine & international health : TM & IH. 2008;13(4):476-
86. Epub 2008/02/06.
90. Diabate A, Baldet T, Chandre F, Akoobeto M, Guiguemde TR, Darriet F, et al. The role of
agricultural use of insecticides in resistance to pyrethroids in Anopheles gambiae s.l. in Burkina Faso. The
American journal of tropical medicine and hygiene. 2002;67(6):617-22. Epub 2003/01/10.

125
91. Diabate A, Brengues C, Baldet T, Dabire KR, Hougard JM, Akogbeto M, et al. The spread of the
Leu-Phe kdr mutation through Anopheles gambiae complex in Burkina Faso: genetic introgression and de
novo phenomena. Tropical medicine & international health : TM & IH. 2004;9(12):1267-73. Epub
2004/12/16.
92. Githeko AK, Service MW, Mbogo CM, Atieli FK, Juma FO. Plasmodium falciparum sporozoite
and entomological inoculation rates at the Ahero rice irrigation scheme and the Miwani sugar-belt in
western Kenya. Annals of tropical medicine and parasitology. 1993;87(4):379-91. Epub 1993/08/01.
93. Trung HD, Van Bortel W, Sochantha T, Keokenchanh K, Quang NT, Cong LD, et al. Malaria
transmission and major malaria vectors in different geographical areas of Southeast Asia. Tropical
medicine & international health : TM & IH. 2004;9(2):230-7. Epub 2004/03/26.
94. Lindsay SW, Kirby M, Baris E, Bos R. Environmental management for malaria control in the
East Asia and Pacific (EAP) region. Washington, D.C.: World Bank; 2004. 46 p. p.
95. Manguin S. Biodiversity of malaria in the world. Montrouge: John Libbey Eurotext; 2008. xxxii,
427 p. p.
96. Babin D, Unesco., CIRAD (Organization). Beyond tropical deforestation : from tropical
deforestation to forest cover dynamics and forest development. Paris: United Nations Educational Centre
de cooperation internationale en recherche agronomique pour le developpement; 2004. xxxvii, 488 p. p.
97. Erhart A, Thang ND, Bien TH, Tung NM, Hung NQ, Hung LX, et al. Malaria epidemiology in a
rural area of the Mekong Delta: a prospective community-based study. Tropical medicine & international
health : TM & IH. 2004;9(10):1081-90. Epub 2004/10/16.
98. Wielgosz B, Mangheni M, Tsegai D, Ringler C (2012). Malaria and Agriculture. A Global
Review of the Literature with a Focus on the Application of Integrated Pest and Vector Management in
East Africa and Uganda. IFPRI Discussion Paper 01232. International Food Policy Research Institute.
Washington DC, USA.
99. Howard AF, Omlin FX. Abandoning small-scale fish farming in western Kenya leads to higher
malaria vector abundance. Acta tropica. 2008;105(1):67-73. Epub 2007/12/11.
126
100. Howard AF, Zhou G, Omlin FX. Malaria mosquito control using edible fish in western Kenya:
preliminary findings of a controlled study. BMC public health. 2007;7:199. Epub 2007/08/11.
101. Isaksson C, Sepil I, Baramidze V, Sheldon BC. Explaining variance of avian malaria infection in
the wild: the importance of host density, habitat, individual life-history and oxidative stress. BMC
ecology. 2013;13:15. Epub 2013/04/10.
102. Slootweg, R., Van Schooten, M.L.F., 1990. Paludisme et irrigation: augmentation du paludisme
`a cause de l’introduction des cultures irrigu´ees `a Gounougou et estimation de la perte au niveau des
m´enages. Mission d’Etude et d’Am´enagement de la Vall´ee Sup´erieure de la Benou´e, Garoua, rapport
du projet pisciculture no. 36.
103. Reisen WK. Ecology of West Nile virus in North America. Viruses. 2013;5(9):2079-105. Epub
2013/09/07.
104. Gordis L. Epidemiology. 4th ed. Philadelphia: Elsevier/Saunders; 2009. xv, 375 p. p.
105. Díaz C, Veloz R, Valencia J, et. al. Manual Operativo Estándar para la Gestión del Diagnóstico
Microscópico de Plasmodium. Ecuador. Edición revisada 2010. Esmeraldas: SNEM - RAVREDA; 2010.
87 p.
106. Servicio Nacional de Control de Enfermedades Transmitidas por Vectors Artrópodos "SNEM".
Boletin de Prensa. Día Mundial del Paludismo: Logros alcanzados por el Ecuador en la lucha contra esta
enfermedad. Guayaquil: Ministerio de Salud Pública del Ecuador; 2014 Abr 23.
107. Narváez, A. Sistematización del Proyecto Prevención y Control de Malaria, Ecuador 2010-2015.
Evaluación de procesos, productos y resultados del Proyecto Fondo Global Malaria experiencia en los
años 2010-2015. Quito: Centro de Desarrollo y Autogestión (DYA); 2014. 83 p.
108. Okell LC, Cairns M, Griffin JT, Ferguson NM, Tarning J, Jagoe G, et al. Contrasting benefits of
different artemisinin combination therapies as first-line malaria treatments using model-based cost-
effectiveness analysis. Nature communications. 2014;5:5606. Epub 2014/11/27.
109. World Health Organization. Global report on antimalarial drug efficacy and drug resistance:
2000-2010. Geneva: World Health Organization; 2010. 115 p. p.

127
110. Soe S, Khin Saw A, Htay A, Nay W, Tin A, Than S, et al. Premunition against Plasmodium
falciparum in a malaria hyperendemic village in Myanmar. Transactions of the Royal Society of Tropical
Medicine and Hygiene. 2001;95(1):81-4. Epub 2001/03/31.
111. Yalcindag E, Elguero E, Arnathau C, Durand P, Akiana J, Anderson TJ, et al. Multiple
independent introductions of Plasmodium falciparum in South America. Proceedings of the National
Academy of Sciences of the United States of America. 2012;109(2):511-6. Epub 2011/12/29.
112. Padilla J, Alvarez G, Montoya R, Chaparro P, Herrera S. Epidemiology and control of malaria in
Colombia. Mem Inst Oswaldo Cruz, Rio de Janeiro 2011;106(Suppl. I):114-122.
113. Vallejo AF, Chaparro PE, Benavides Y, Alvarez A, Quintero JP, Padilla J, et al. High prevalence
of sub-microscopic infections in Colombia. Malaria journal. 2015;14:201. Epub 2015/05/15.
114. International Reseearch Institute for Climate and Society. ENSO Resources [Internet]. New York:
The Earth Institute, Columbia University [cited 2015 Jul 7]. Available from http://iri.columbia.edu/our-
expertise/climate/enso/
115. República del Ecuador. Ecuador en alerta para prevenir el contagio de la fiebre del virus
chikungunya [internet]. Quito: Ministerio de Salud Pública; 2015 [cited 2015 Jul 7]. Available from
http://www.salud.gob.ec/ecuador-en-alerta-para-prevenir-el-contagio-de-la-fiebre-del-virus-
chikungunya-3/
116. San Sebastian M, Jativa R, Goicolea I. Epidemiology of malaria in the Amazon basin of Ecuador.
Revista panamericana de salud publica = Pan American journal of public health. 2000;7(1):24-8. Epub
2000/03/15.

128
Appendix A: IRB Approval Letter
129
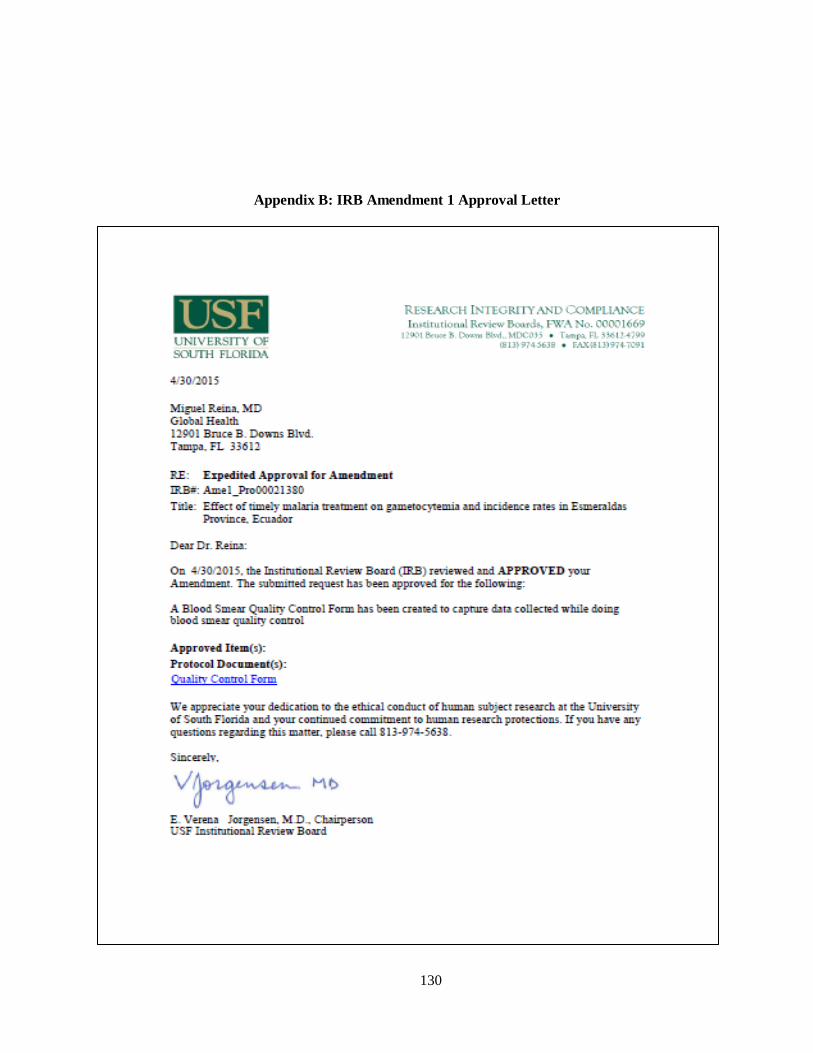
130
Appendix B: IRB Amendment 1 Approval Letter

131
Appendix C: IRB Amendment 2 Approval Letter

132
Appendix D: SNEM Esmeraldas Approval Letter