Effect of surface treatment and knit structure on comfort properties of wool fabrics
12
Effect of surface treatment and knit structure on comfort properties of wool fabrics Maryam Naebe a , Volker Lutz b , Bruce A McGregor a , Xungai Wang a,c and David Tester d a Institute for Frontier Materials, Deakin University, Victoria 3216, Australia b Institut für Textiltechnik der RWTH Aachen, Germany c School of Textile Science and Engineering, Wuhan Textile University, Wuhan, China d CRC for Sheep Industry Innovation Ltd., CJ Hawkins Homestead, University of New England, Armidale NSW 2351, Australia. Corresponding author email: [email protected] ABSTRACT The comfort properties of the pique and single jersey knitted wool fabrics were investigated using the Wool ComfortMeter. The fabrics were knitted in three cover factors and treated with either plasma or a silicone softening agent and were compared with untreated fabrics. Plasma treatment did not show significant effects on the comfort value. However, silicone polymer significantly reduced Wool ComfortMeter values suggesting that the silicone coating reduced the number of protruding fibres on the fabric surface. Regardless of treatment used, pique fabrics showed a lower Wool ComfortMeter value, and therefore were perceived to be more comfortable than the single jersey structure. While the effect of cover factor was not significant, in fitted model to predict the Wool ComfortMeter value of fabrics, mass/unit area and fabric thickness were significant predictors along with fabric structure and finishing treatment. Keywords: Surface modification; plasma treatment; silicone polymer; next-to-skin comfort; pique and single jersey Introduction
Transcript of Effect of surface treatment and knit structure on comfort properties of wool fabrics
Effect of surface treatment and knit structure on comfort properties of wool fabrics
Maryam Naebea, Volker Lutzb, Bruce A McGregora, Xungai Wanga,c and David Testerd
a Institute for Frontier Materials, Deakin University, Victoria 3216, Australia bInstitut für Textiltechnik der RWTH Aachen, Germany c School of Textile Science and Engineering, Wuhan Textile University, Wuhan, China d CRC for Sheep Industry Innovation Ltd., CJ Hawkins Homestead, University of New England, Armidale NSW 2351, Australia.
Corresponding author email: [email protected]
ABSTRACT
The comfort properties of the pique and single jersey knitted wool fabrics were investigated
using the Wool ComfortMeter. The fabrics were knitted in three cover factors and treated
with either plasma or a silicone softening agent and were compared with untreated fabrics.
Plasma treatment did not show significant effects on the comfort value. However, silicone
polymer significantly reduced Wool ComfortMeter values suggesting that the silicone coating
reduced the number of protruding fibres on the fabric surface. Regardless of treatment used,
pique fabrics showed a lower Wool ComfortMeter value, and therefore were perceived to be
more comfortable than the single jersey structure. While the effect of cover factor was not
significant, in fitted model to predict the Wool ComfortMeter value of fabrics, mass/unit area
and fabric thickness were significant predictors along with fabric structure and finishing
treatment.
Keywords: Surface modification; plasma treatment; silicone polymer; next-to-skin comfort;
pique and single jersey
Introduction
The surface of the wool fibre is complex and its morphology and chemistry play important
roles in the functional properties of wool fabrics. Many chemical and/or physical treatments
are used to modify the fibre surface and improve the performance properties of wool fabrics
(Alexander and Hudson, 1963).
Plasma treatment is one of special interest as it can replace less environmentally friendly
finishing processes and create new surface characteristics. It has been considered as an
effective surface modification technique which induces chemical and morphological changes
on the surface of wool fibre (Naebe et al., 2010a; Naebe et al., 2010b; Naebe et al., 2011a;
Ratnapandian et al., 2011). The plasma treatment parameters (pressure, treatment time,
discharge power and the nature of the gas) control the effectiveness of plasma treatment.
Previous studies (Kim and Kang, 2002; Naebe et al., 2011b) have shown that plasma
treatment increased the stiffness of the fabric with increasing treatment time and plasma
power. Handle evaluation of treated fabrics has shown that plasma treatment made the fabric
harsher and longer plasma treatment times resulted in a serious impairment of fabric handle.
It has been shown that plasma treatment modifies the surface lipid layer of wool fibres,
particularly by the removal the fatty acid layer from the surface and then increases the
coefficient of friction of wool fabric, hence resulting in the harsher handle (Naebe, 2009).
Silicone based softening agents are normally associated with enhancements in fabric softness.
Their surface energies are lower than the wool fibre. Since they have a high tendency to
spread on the fibre during drying, there is a strong tendency for softener to form a continuous
layer between adjacent fibres (Rippon, 2008). When silicone polymer is applied to the fabric,
the formation of an elastic network on the surface of the fibre makes the fabric easier to bend
and twist (Naebe, 2009). Therefore, the net effect of softening agent on wool fibres is an
initial decrease in fabric stiffness and improvement in the handle of the treated fabrics. The

results of a subjective evaluation of the effects of fabric softness and harshness were
consistent with the bending stiffness evaluation (Naebe et al., 2011b). The mechanism for the
reduction in prickliness of silicon treated fabrics appears to be reduced fibre/fibre friction
rather than a modification in fibre modulus (Naylor et al., 1992).
The Wool ComfortMeter device has been developed to objectively assess the comfort
properties of knitted fabric. There is a good correlation with the results of a subjective
assessment in wearer trials of fabric prickle responses and this objective technique (Tester,
2010; McGregor & Naebe, 2012). Since the instrument has been designed to detect changes
in wool fibre bending stiffness (Ramsay et al., 2012), it is expected to be able to detect the
changes in comfort on both softener and plasma treated fabrics. The aim of this study is to
compare the effect of plasma treatment and softener on the comfort properties of wool fabrics
assessed by the Wool ComfortMeter.
Experimental
Design and material
The fabric design was: two knitting structures, three cover factors (CF) and three finishing
treatments. The fabric structures were single jersey and pique. The fabrics were knitted with
pure wool yarn of mean fibre diameter 19.4 μm and yarn count of 1/40 Nm. All fabrics were
knitted on a circular knitting machine with positive feed in 24 machine gauge in CF: loose
(L), medium (M) and tight (T) with corresponding values of 1.37, 1.45, 1.54 for single jersey
and 1.45, 1.54, 1.62 for pique fabrics, respectively. The finishing treatments were: control
fabrics, untreated (UT), plasma treated (PT), and treated with softening agent (ST).
Plasma treatment
An atmospheric pressure, ambient air plasma machine, manufactured by CSIRO Materials
Science and Engineering (Finn et al., 2006) was used. This device is a form of dielectric
barrier discharge plasma with one flat stainless steel mesh electrode and a series of glass
covered metal rods as the dielectric-barrier electrode. The fabric was placed in the 3 mm gap
between the glass electrode array and the mesh. Ambient air was passed through the rods, the
fabric and then the mesh with a face velocity of approximately 1 m/s. The operating
frequency and voltage were 2.6 kHz and 19 kV, respectively. The power input was ~10
kW/m2. Fabrics were treated by passing them through the device very slowly providing an
exposure time of approximately 10 seconds and a very high level of treatment.
Softening treatment
A silicone based softener, Megasoft Jet (Ciba), was applied to fabrics by a pad dry method.
Fabric samples were dipped in a freshly made aqueous solution containing 500 g/l water and
500 g/l softener emulsion for 30 sec prior to padding. The samples were padded to a wet
pick-up of 50 % and dried on a pin frame in a Benz laboratory stenter for a 3 min dwell at
150 °C.
Comfort evaluation
The testing procedure using the Wool ComfortMeter (WCM) followed the established test
method (Naylor et al., 2010). Briefly, five (30 cm × 30 cm) samples were prepared for each
fabric. As 18 fabrics were used (2 structures × 3 cover factors × 3 treatments), a total of 90
samples were prepared. The back of the samples was lightly steamed and fabrics were
conditioned at the standard conditions for over 20 hours prior to testing on the WCM. Fabric
comfort evaluation was carried out on the back of the sample in a random order each time.
Previous research on the influence of temperature and humidity on the WCM results (Naebe
et al. 2012) has confirmed that the WCM operates best at standard conditions. Then the

average of five values along their standard deviation (s.d) were determined for each fabric
(Table 1).
Mass per unit area and fabric thickness Measurements
Mass per unit area and fabric thickness were determined at standard conditions. Fabrics were
cut into 100 mm2 round samples using a ZWEIGLE circle cutter. Three samples were
prepared. Care was taken that the samples were cut from the middle part of the fabric roll to
avoid uneven edges which might have influenced the results. A precision scale (± 0.1 mg),
Metler Toledo Ltd., was used to determine the mass of each sample. The average of the mass
per unit area (g/m2) was calculated.
Fabric thickness was measured using Mesdan Lab thickness gauge with an applied pressure
of 0.5 kPa. The average of five measurements (± 0.01 mm) in different area of each sample
was reported as the average thickness.
Scanning electron microscopy
Surface morphology of the fabric samples was evaluated using a Field Emission Scanning
Electron Microscope (Hitachi S4300 SE/N). The images were taken at a working distance of
15 mm and an accelerating voltage of 1.2 kV.
Statistical analysis
To study the influence of knitting structure, CF and finishing treatment on the WCM value,
a randomized block ANOVA was applied to the data using SPSS Statistics 17 (SPSS
Manuals, Harvard University) . There were no outliers. Differences between treatments were
determined using a P-value = 0.05. Further analysis using the Post Hoc Multiple
Comparison using Least significant difference (LSD) was carried out to compare all
possible pairs of factor levels. Linear regression modelling was used to determine the effects
of significant physical attributes, including fabric thickness and fabric mass/unit area, upon
the WCM value.
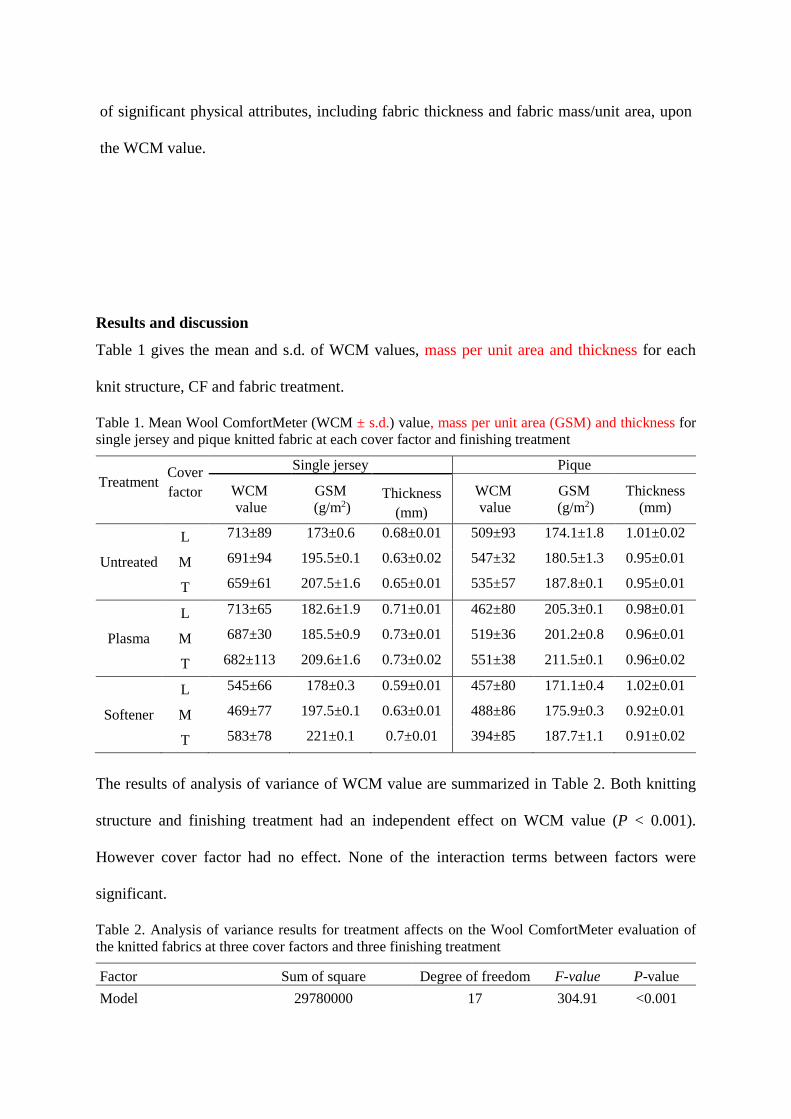
Results and discussion
Table 1 gives the mean and s.d. of WCM values, mass per unit area and thickness for each
knit structure, CF and fabric treatment.
Table 1. Mean Wool ComfortMeter (WCM ± s.d.) value, mass per unit area (GSM) and thickness for single jersey and pique knitted fabric at each cover factor and finishing treatment
Treatment Cover factor
Single jersey Pique
WCM value
GSM (g/m2)
Thickness (mm)
WCM value
GSM (g/m2)
Thickness (mm)
L 713±89 173±0.6 0.68±0.01 509±93 174.1±1.8 1.01±0.02
Untreated M 691±94 195.5±0.1 0.63±0.02 547±32 180.5±1.3 0.95±0.01
T 659±61 207.5±1.6 0.65±0.01 535±57 187.8±0.1 0.95±0.01
L 713±65 182.6±1.9 0.71±0.01 462±80 205.3±0.1 0.98±0.01
Plasma M 687±30 185.5±0.9 0.73±0.01 519±36 201.2±0.8 0.96±0.01
T 682±113 209.6±1.6 0.73±0.02 551±38 211.5±0.1 0.96±0.02
L 545±66 178±0.3 0.59±0.01 457±80 171.1±0.4 1.02±0.01
Softener M 469±77 197.5±0.1 0.63±0.01 488±86 175.9±0.3 0.92±0.01
T 583±78 221±0.1 0.7±0.01 394±85 187.7±1.1 0.91±0.02
The results of analysis of variance of WCM value are summarized in Table 2. Both knitting
structure and finishing treatment had an independent effect on WCM value (P < 0.001).
However cover factor had no effect. None of the interaction terms between factors were
significant.
Table 2. Analysis of variance results for treatment affects on the Wool ComfortMeter evaluation of the knitted fabrics at three cover factors and three finishing treatment
Factor Sum of square Degree of freedom F-value P-value Model 29780000 17 304.91 <0.001

Knitting structure 455609.03 1 83.97 <0.001 Cover factor 12.81 2 0.001 0.999 Finishing treatment 270716.89 2 24.95 <0.001 LSD results for treatments are summarised in Table 3. As there was no difference in WCM
value between the untreated and plasma treated fabrics (P = 0.73) they have similar next-to-
skin comfort. There were significant differences in WCM value between softener treated
fabrics and both the untreated and plasma treated fabrics (P < 0.001).
Table 3. Least significant difference `s post hoc comparisons for the main effects of finishing treatments on Wool ComfortMeter value
Treatment (I) Treatment (J) Mean Difference (I-J) P-value Plasma Treatment Silicone Treatment112.93* <0.001
Untreated -6.56 0.73 Silicone Treatment Plasma Treatment -112.93* <0.001
Untreated -119.48* <0.001
Testing the statistical significance of parameters shows no difference in WCM value with
increasing CF, though our previous study, which had a larger number of fabrics and a wider
range in CF, (McGregor and Naebe, 2012) showed that CF may affect the WCM value.
The CF describes the density of a knitted fabric which in this study is defined as √Tl
in which
T is the yarn count in tex and l is loop length. It has been pointed out (Baird and Foulds,
1968) that some relaxation shrinkage nearly always occurs in the yarn and causes a reduction
in the loop length and a corresponding increase in cover factor when fabrics are relaxed in
water. The need to measure CF after wet relaxation and conditioning has also been
mentioned. In addition, in recent study (Saha, 2012) the effect of plasma treatment on CF was
investigated and changes in the CF as a result of treatment was reported.
These findings might indicate that the silicone treatment and plasma treatments may have
changed the nominal calculated CF and so may explain why the statistical analysis did not
detect any significant change in WCM value with increasing CF. Manipulating CF changes
fabric mass/unit area and fabric thickness, and WCM values may be more sensitive to these
direct measurements of fabric properties than CF. Therefore, further analysis using fabric
mass/unit area was carried out.
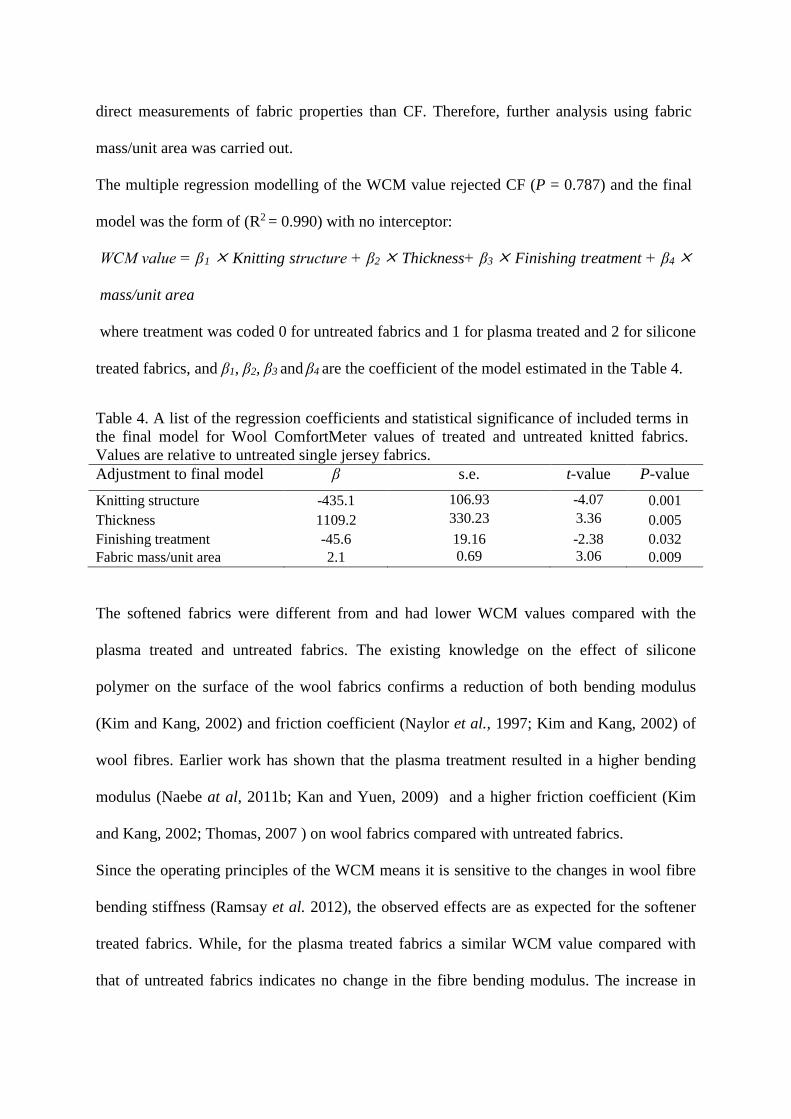
The multiple regression modelling of the WCM value rejected CF (P = 0.787) and the final
model was the form of (R2 = 0.990) with no interceptor:
WCM value = β1 Knitting structure + β2 Thickness+ β3 Finishing treatment + β4
mass/unit area
where treatment was coded 0 for untreated fabrics and 1 for plasma treated and 2 for silicone
treated fabrics, and β1, β2, β3 and β4 are the coefficient of the model estimated in the Table 4.
Table 4. A list of the regression coefficients and statistical significance of included terms in the final model for Wool ComfortMeter values of treated and untreated knitted fabrics. Values are relative to untreated single jersey fabrics. Adjustment to final model β s.e. t-value P-value Knitting structure -435.1 106.93 -4.07 0.001 Thickness 1109.2 330.23 3.36 0.005 Finishing treatment -45.6 19.16 -2.38 0.032 Fabric mass/unit area 2.1 0.69 3.06 0.009
The softened fabrics were different from and had lower WCM values compared with the
plasma treated and untreated fabrics. The existing knowledge on the effect of silicone
polymer on the surface of the wool fabrics confirms a reduction of both bending modulus
(Kim and Kang, 2002) and friction coefficient (Naylor et al., 1997; Kim and Kang, 2002) of
wool fibres. Earlier work has shown that the plasma treatment resulted in a higher bending
modulus (Naebe at al, 2011b; Kan and Yuen, 2009) and a higher friction coefficient (Kim
and Kang, 2002; Thomas, 2007 ) on wool fabrics compared with untreated fabrics.
Since the operating principles of the WCM means it is sensitive to the changes in wool fibre
bending stiffness (Ramsay et al. 2012), the observed effects are as expected for the softener
treated fabrics. While, for the plasma treated fabrics a similar WCM value compared with
that of untreated fabrics indicates no change in the fibre bending modulus. The increase in

fabric bending modulus is due to fibre friction increases and not increases in the component
fibre bending modulus. .
Therefore, the changes in fibre bending modulus could explain the observed differences in
WCM values. However the WCM device is also sensitive to the density and number of the
protruding fibres from the surface of the fabrics ( Ramsay et al., 2012). It is also possible that
the lower WCM values occurring after silicone treatment are a result of less fibre on the
fabric surface interacting with the recording head of the WCM. It has been known for many
years that the application of silicone polymers can glue protruding fibres together or cause
them to adhere to the surface of the yarn and therefore not protrude (Figure 1, Makinson,
1975; Naebe et al., 2011b).
Figure 1. SEM image of wool fabric treated with Silicon
Regardless of treatment, the pique fabrics showed lower WCM values compared to the
corresponding single jersey fabrics. This appears to confirm the report of pique fabrics
producing lower prickle responses during fabric wearer trials where other aspects of fabric
design and construction and WCM assessment were also accounted for in prediction models
(McGregor et al., 2012). While the same yarn is used for both pique and single jersey fabrics,
the pique fabric is thicker, more stable to treatments and changes in CF and has a more open
surface structure (Kane et al., 2007) (Figure 2). Accordingly, more protruding fibres sit deep
in the surface of the pique fabric compared with single jersey fabrics. Thus the lower WCM
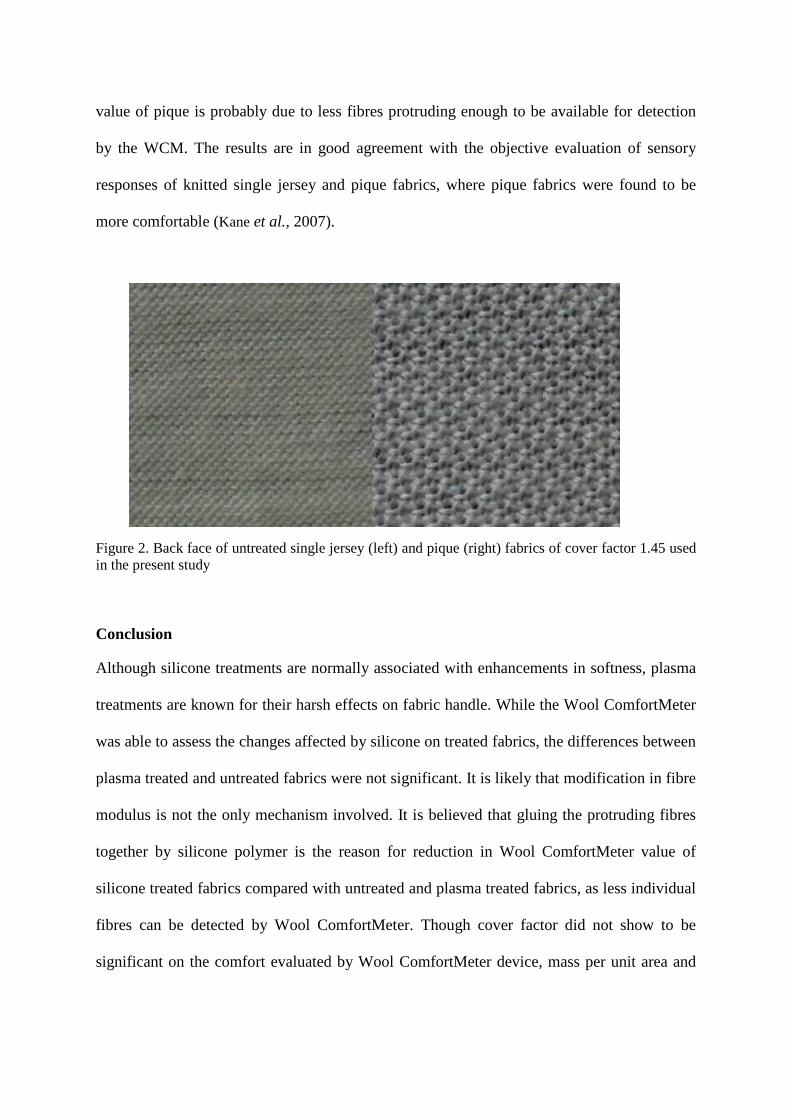
value of pique is probably due to less fibres protruding enough to be available for detection
by the WCM. The results are in good agreement with the objective evaluation of sensory
responses of knitted single jersey and pique fabrics, where pique fabrics were found to be
more comfortable (Kane et al., 2007).
Figure 2. Back face of untreated single jersey (left) and pique (right) fabrics of cover factor 1.45 used in the present study
Conclusion
Although silicone treatments are normally associated with enhancements in softness, plasma
treatments are known for their harsh effects on fabric handle. While the Wool ComfortMeter
was able to assess the changes affected by silicone on treated fabrics, the differences between
plasma treated and untreated fabrics were not significant. It is likely that modification in fibre
modulus is not the only mechanism involved. It is believed that gluing the protruding fibres
together by silicone polymer is the reason for reduction in Wool ComfortMeter value of
silicone treated fabrics compared with untreated and plasma treated fabrics, as less individual
fibres can be detected by Wool ComfortMeter. Though cover factor did not show to be
significant on the comfort evaluated by Wool ComfortMeter device, mass per unit area and

thickness of fabrics were significant in the predicted model. Pique fabrics showed a lower
Wool ComfortMeter value than single jersey fabrics.
ACKNOWLEDGMENT The authors would like to express their appreciation to L. Staynes, F. Dean and Dr. N. Finn
from CSIRO, Materials Science and Engineering, Belmont, Australia. This work was funded
by The Cooperative Research Centre for Sheep Industry Innovation Ltd.
References
Alexander, P. and Hudson, R. F. (1963). Wool, its chemistry and physics. London Chapman & Hall. Anonymous, SPSS Manuals, Harvard University, "http://www.hks.harvard.edu/fs/pnorris/Classes/A SPSS Manuals/SPSS Statistics Brief Guide17.0.pdf." Baird, K. & Foulds, R. A. (1968). Felting Shrinkage of Plain-Knitted Wool Fabrics : Its Dependence Upon Fabric Structure and Shrinkproofing Level. Textile Research Journal 38, 743-753. Finn, N., Avkviz, L., Schultz, J. & Farmer, A. Plasma Treatment Apparatus & Method, E. patent, EP 1623064 A1. Kan, C. W. & Yuen, C. W. M. (2009) Influence of Plasma Gas on the Quality-Related Properties of Wool Fabric. IEEE Transactions on Plasma Science 37 (5), 653-658. Kane, C. D., Patil, U. J. & Sudhakar, P. (2007). Studies on the Influence of Knit Structure and Stitch Length on Ring and Compact Yarn Single Jersey Fabric Properties. Textile Research Journal 77(8), 572-582. Kim, M. S.& Kang, T. J. (2002). Dimentional and surface properties of plasma and silicone treated wool fabric. Textile Research Journal, 72(2), 113-120. Makinson, K. R. (1975). Mechanism of Shrink-Proofing with Silicone Resins. Textile Research Journal, 45, 217-219. McGregor, B.A. & Naebe, M. (in press). Effect of fibre, yarn and knitted fabric attributes associated with wool comfort properties. Journal of the Textile Institute. McGregor, B.A., Naebe, M., Stanton, J., Speijers, J., Bielby, J., Pieruzzini, S. & Tester, D. (in press). Relationship between wearer prickle response with fibre and garmnet properties and Wool ComfortMeter assessment. Journal of the Textile Institute. Naebe, M. (2009). Effect of plasma on the properties of protein fibres. lnstitute for Technology Research and Innovation, Centre for Material and Fibre Innovation, Deakin University. Thesis (PhD).

Naebe, M., Cookson, P. G., Rippon, J. A. & Wang, X. G. (2010a). Effects of Levelling Agent on the Uptake of Reactive Dyes by Untreated and Plasma-Treated Wool. Textile Research Journal, 80(7), 611-622. Naebe, M., Rippon, J., Brady, R., Wang, X., Brack, N., van Riessen, G. & Cookson, P. (2010b). Effects of Plasma Treatment of Wool on the Uptake of Dyes with Different Hydrophobic Properties. Textile Research Journal, 80(4), 312-324. Naebe, M., Cookson, P. G., Denning, R. & Wang, X. (2011a). Ageing Effect of Plasma Treated Wool. Journal of the Textile Instite, 102(12), 1086-1093. Naebe, M., Cookson, P. G., Denning, R. & Wang, X. (2011b). Use of low-level plasma for enhancing the shrink resistance of wool fabric treated with a silicone polymer. Journal of the Textile Institute, 102(11), 948-956. Naebe, M., Yu, Y., McGregor, B. A., Tester, D. & Wang, X. (2012). The effect of humidity and temperature on Wool ComfortMeter assessment of single jersey wool fabrics. Textile Research Journal, Advance online publication. doi: 10.1177/0040517512441988 Naylor, G. R. S., Veitch, C. J., Mayfield, R. J. & Kettlewell, R. (1992). Fabric-evoked prickle. Textile Research Journal, 62(8), 487-493. Naylor, G. R. S., Phillips, D. G., Veitch, C. J., Dolling, M. & Marland, D. J. (1997). Fabric-evoked prickle in worsted spun single jersey fabrics .Part I. The role of fiber end diameter characteristics. Textile Research Journal, 67(4), 288-295. Naylor, G. R. S., Ramsay, D. J. & Tester, D. H. (2010). Measurement of the potential skin comfort characteristics of finished wool fabrics and garments using the CRC wool Comfortmeter. Draft Test Procedure. CRC for Sheep Industry Innovation, Armidale, NSW Ramsay, D. J., Fox, D. B. & Naylor, G. R. S. (2012). An Instrument for Assessing Fabric Prickle Propensity. Textile Research Journal, 82(5), 513-520. Ratnapandian, S., Wang, L., Fergusson, S. M. & Naebe, M. (2011). Effect of Atmospheric Plasma Treatment on Pad-dyeing of Natural Dyes on Wool. Journal of Fiber Bioengineering & Informatics 4(3), 1-10. Rippon, J. A. (2008). Friction, felting and shrink- proofing of wool. Friction in textile materials, woolhead publishing Limited: 253-291. Cambridge: Woodhead Publishing. Saha, R. (2012) Cover Factor Analysis of Pet Fabric. http://www.textiletoday.com.bd/magazine/printable.php?id=340 Tester, D. H. (2010). Relationship between Comfort Meter values and the prickle rating of garments in wearer trails. Animal Production Science, 50, 1077-1081. Thomas, H. (2007). Plasma Modification of Wool, in “Plasma Technologies for Textiles,” Shishoo, R., (Ed.), Woodhead Publishing Limited, Cambridge, England, 228–246.