
Interpreting Quantifier Combinations - ILLC Preprints and ...
Upload
khangminh22Category
view
1download
0
Tropical Agricultural Research Vol. 30 (2): 1 – 12 (2018)
Effect of pH, Temperature and Time Combinations on Yield and Degree
of Esterification of Mango Peel Pectin: A Box-Behnken Design Based
Statistical Modelling
S. Sangheetha*, D. C. K. Illeperuma1, A. N. Navaratne2 and C. Jayasinghe3
Department of Food Technology
University College of Jaffna
Jaffna
Sri Lanka
ABSTRACT: A 3-factor-3-level Box-Behnken design was employed to determine the effect of
conditions: pH, temperature and time on yield and degree of esterification (DE) of mango
peel pectin obtained using acid extraction method. Fifteen experimental runs with different
combinations of pH (1.3, 2.5 and 3.7), temperature (60, 75 and 90 oC) and time (45, 90 and
135 min) were performed on mango peel collected from fruit processing industry. Acid
extraction method was used to extract pectin. Yield and the DE of mango peel pectin varied
from 6.1 to 16.3% (dry weight basis) and 45.5 to 87.5%, respectively. Interactive effects of
pH, temperature and time on the DE were significant at P<0.050. The empirical quadratic
second degree polynomial model developed for DE in the study was significant (P=0.000)
and well fitted to all experimental data with R2 of 99.48. The study highlighted that mango
peel from fruit processing industry can be used to produce high methoxyl (DE > 50 %) or
low methoxyl pectin (DE < 50 %) by controlling conditions during extraction and the model
could be used to predict the DE of mango peel pectin for given conditions.
Keywords: Box-Behnken design, Degree of esterification, Fruit industry waste, High and low
methoxyl pectins, Mango peel
INTRODUCTION
Pectin is a polysaccharide of galacturonic acids with branches of neutral sugars such as L-
rhamnose, L-arabinose and D-galactose (Wai et al., 2010). Galacturonic acids in pectin are
methyl esterified to various extents (Wang et al., 2017). The ratio of esterified galacturonic
acid units to total galacturonic acids determines the degree of esterification (DE) (Flutto,
2003). Based on the DE, pectin is classified as “High methoxyl (HM) pectin” (DE > 50 %)
and “Low methoxyl (LM) pectin” (DE < 50 %) (Ranganna, 1986; Thakur et al., 1997). The
DE determines gelling properties, solubility, emulsion activities, emulsion stability and
release effects of pectin in complex food matrices, thus plays a unique role in food
manufacturing (Srivastava and Malviya, 2011; Müller-Maatsch et al., 2016). However, as
pectin is a constituent in plant cell wall, its yield and the DE depend on the chemical
composition of plant cells and structure of pectin. Furthermore, nature of raw material,
1Department of Food Science and Technology, Faculty of Agriculture, University of Peradeniya, Sri Lanka. 2Department of Chemistry, Faculty of Science, University of Peradeniya, Sri Lanka. 3Department of Food Science and Technology, Faculty of Livestock, Fisheries and Nutrition, Wayamba University
of Sri Lanka, Sri Lanka. *Corresponding author: [email protected]
Sangheetha et al.
2
method and conditions such as pH, temperature, time, ionic strength of solution, solid:
solution ratio of extraction affect yield and the DE of pectin (Yeoh et al., 2008; Begum et al.,
2017; Sandarani, 2017).
Mango fruit is composed of approximately 11 – 18% peel, 14 – 22% seed and the rest being
flesh (Mitra et al., 2013). In Sri Lankan context, mango peel and seed account for 51% of
total fruit waste discarded by the fruit processing industry (Wathsala et al., 2017). As mango
peel contains nearly 12 - 18.5% pectin (Koubala et al., 2008; Girma and Worku, 2016),
investigation of mango peel for pectin extraction is useful. Different extraction conditions are
used to obtain pectin from fruit peels (Begum et al., 2017; Sandarani, 2017). Therefore, it is
important to identify appropriate extraction conditions to obtain maximum possible yield of
pectin. Hence, this study was conducted to investigate the effect of extraction conditions
namely pH, temperature and time on yield and the DE of mango peel pectin and to optimize
these conditions to extract maximum possible pectin by employing Response Surface
Methodology (RSM).
METHODOLOGY
Collection and preparation of materials
Fresh mango peel was obtained from fruit processing plants at CBL Natural Foods (Pvt)
Limited, Minuwangoda, Sri Lanka and Kist Processing Plant, Kilinochchi, Sri Lanka. Peels
were transported to the laboratories within 2 - 3 h, cleaned, sorted, washed twice in potable
running water and left for 10 min for moisture draining. The peels were disintegrated into
pieces of approximately 1 cm2 and dehydrated at 55 – 60 oC for 7 – 8 h in a dehydrator
(TSM Products, D10 – 32609, United States). The dehydrated pieces were ground in a
tabletop laboratory grinder (Jaipan, India) and sieved through a laboratory sieve set (Ailmill,
India) to make powder with particle size of 0.425 - 0.850 mm. Mango peel powder was
packaged in metalized polyester bags and stored in air tight polypropylene containers at
ambient conditions until further use.
All chemicals used in the study were analytical grade purchased from Merck Chemicals,
India, VWR chemicals, USA and Sigma Aldrich, Germany. Ethanol (96%, v/v) was procured
from Lanka Sugar Company (Pvt) Limited for extraction of pectin.
Experimental design
A 3-factor-3-level Box-Behnken design of response surface methodology (RSM) was
employed to design the experimental runs and investigate the effect of extraction conditions
(pH, temperature and time) on yield and the DE of pectin. Fifteen experimental runs were
carried out in triplicate represented by center points (Table 1). The conditions used were; pH
of 1.3, 2.5 and 3.7, temperature of 60, 75 and 90 oC and time of 45, 90 and 135 min which
were selected based on previous studies on various fruit peels (Kratchanova et al., 2004;
Kanmani et al., 2014; Müller-Maatsch et al., 2016). The experimental runs were conducted
in a randomized order.
Mango peel pectin extraction
3
Table 1. Box- Behnken Design of RSM employed for investigation on the effect of
extraction conditions on yield and degree of esterification of pectin extracted
from mango peel
Run No Extraction conditions and levels
pH Temperature (oC) Time (min)
1 1.3 60 90
2 3.7 60 90
3 1.3 90 90
4 3.7 90 90
5 1.3 75 45
6 3.7 75 45
7 1.3 75 135
8 3.7 75 135
9 2.5 60 45
10 2.5 90 45
11 2.5 60 135
12 2.5 90 135
13 2.5 75 90
14 2.5 75 90
15 2.5 75 90 Run number was generated by Minitab 17 statistical software
Extraction of pectin
Pectin from mango peel powder was extracted according to the method described by
Kratchanova et al. (2004). Approximately 10 g of mango peel powder was mixed with 300
ml of distilled water and pH was adjusted to required levels indicated in Table 1 using 1 M
hydrochloric acid. The suspension was left for 20 - 30 min with occasional stirring for
equilibrium. The pH was re-adjusted as required. Sample containers were partially covered
with watch glasses and heated at predetermined temperatures for respective times (Table 1)
in a water bath (Labtech, LWB-306DS). Subsequently, the hot suspension was filtered
through a muslin cloth and cooled to 4 oC in an ice bath. An equal volume of 96% (v/v)
ethanol was gradually added to the sample and slowly stirred for nearly 5 min. The solution
was then allowed to rest for 1 h and the coagulated pectin was separated by filtering through
a muslin cloth. Another equal volume of ethanol was added to the filtrate and coagulated
pectin was separated as above. The isolated pectin was washed 5 times with 96% (v/v)
ethanol, dried at 35 oC in an air convection incubator (Pol- Eko Aparatura – CLW 15,
Poland) for overnight and weighed after cooled to ambient temperature. The dried sample
was ground into fine powder and stored in airtight amber glass containers under ambient
conditions until determination of the DE.
Determination of yield
The yield of pectin from mango peel was calculated by using the Equation 1.
Sangheetha et al.
4
………………………………………………………..(2)
…(3)
Yield (%) = 𝑊𝑜 𝑋 100
𝑊1
where, W0 is the weight of dried pectin before grinding and packaging (g) and W1 is the
weight of dried mango peel powder used for extraction (g).
Determination of the DE
According to Pasandide et al. (2015), the powdered sample (0.2 g) was added into a conical
flask containing 20 ml of distilled water and 3 ml of 96% ethanol and thoroughly dissolved
using a vortex mixer at 3000 rpm (Velp Scientifica – ZX3, USA). The solution containing
few drops of phenolphthalein indicator was titrated against 0.1 M standardized sodium
hydroxide (V1). Then, 10 ml of standardized 0.1 M sodium hydroxide was added slowly to
the solution while occasional swirling of the flask. After leaving the flask aside for 15 min,
10 ml of standardized 0.1 M hydrochloric acid was added and mixed well. The solution was
titrated against 0.1 M standardized sodium hydroxide (V2) using phenolphthalein as the
indicator. The DE was calculated using the Equation 2.
DE = V2 ×100
V1 + V2
Statistical analysis of experimental data
DE was estimated in duplicate and the average was used for modelling. Design of
experiment and all statistical analysis were executed in Minitab 17 (Minitab Inc., State
College, PA, USA). Multiple regression analysis was performed to develop an empirical
quadratic second degree polynomial model. Experimental data were analyzed to fit the
second degree polynomial equation (Equation 3) generated by Minitab 17.
Y = β0+β1X1+ β2X2+ β3X3+β12X1X2+ β13X1X3+ β23X2X3+ β11X12+ β22X2
2+ β33X32
where,
Y - DE
X1, X2 and X3 – pH, temperature and time
β0 – Intercept coefficient
β1, β2, β3 – Linear coefficient
β12, β13, β23 – Quadratic coefficient
β11, β22, β33 - Interaction coefficient
Analysis of variance (ANOVA) was used to determine the significance and accuracy of
developed empirical quadratic second degree polynomial model and to analyze the effect of
extraction conditions on DE of mango peel pectin.
………………………………………………………..(1)
Mango peel pectin extraction
5
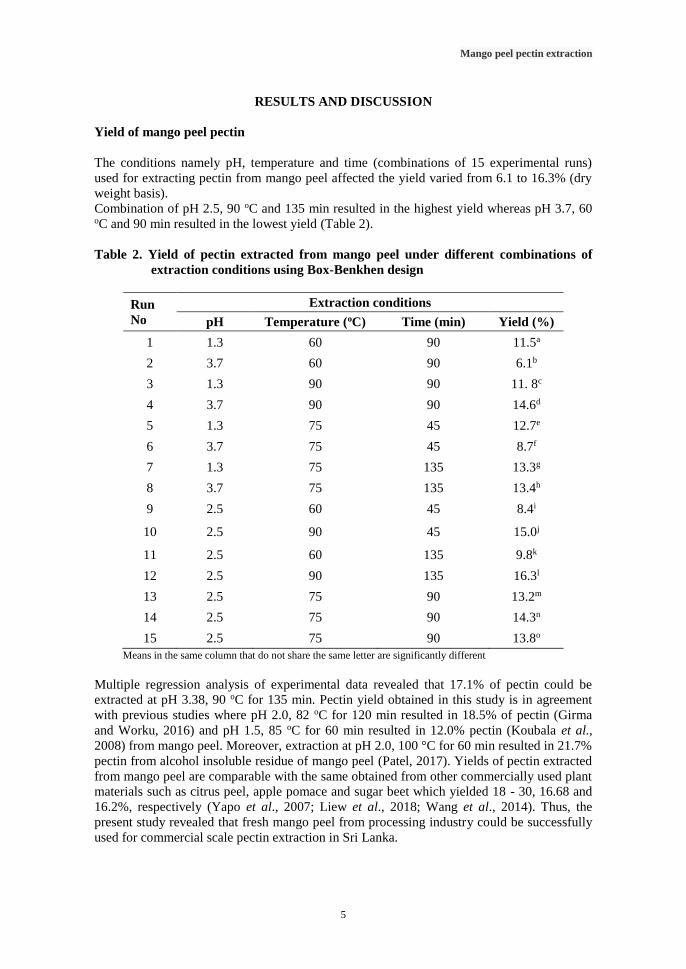
RESULTS AND DISCUSSION
Yield of mango peel pectin
The conditions namely pH, temperature and time (combinations of 15 experimental runs)
used for extracting pectin from mango peel affected the yield varied from 6.1 to 16.3% (dry
weight basis).
Combination of pH 2.5, 90 oC and 135 min resulted in the highest yield whereas pH 3.7, 60 oC and 90 min resulted in the lowest yield (Table 2).
Table 2. Yield of pectin extracted from mango peel under different combinations of
extraction conditions using Box-Benkhen design
Run
No
Extraction conditions
pH Temperature (oC) Time (min) Yield (%)
1 1.3 60 90 11.5a
2 3.7 60 90 6.1b
3 1.3 90 90 11. 8c
4 3.7 90 90 14.6d
5 1.3 75 45 12.7e
6 3.7 75 45 8.7f
7 1.3 75 135 13.3g
8 3.7 75 135 13.4h
9 2.5 60 45 8.4i
10 2.5 90 45 15.0j
11 2.5 60 135 9.8k
12 2.5 90 135 16.3l
13 2.5 75 90 13.2m
14 2.5 75 90 14.3n
15 2.5 75 90 13.8o
Means in the same column that do not share the same letter are significantly different
Multiple regression analysis of experimental data revealed that 17.1% of pectin could be
extracted at pH 3.38, 90 oC for 135 min. Pectin yield obtained in this study is in agreement
with previous studies where pH 2.0, 82 oC for 120 min resulted in 18.5% of pectin (Girma
and Worku, 2016) and pH 1.5, 85 oC for 60 min resulted in 12.0% pectin (Koubala et al.,
2008) from mango peel. Moreover, extraction at pH 2.0, 100 °C for 60 min resulted in 21.7%
pectin from alcohol insoluble residue of mango peel (Patel, 2017). Yields of pectin extracted
from mango peel are comparable with the same obtained from other commercially used plant
materials such as citrus peel, apple pomace and sugar beet which yielded 18 - 30, 16.68 and
16.2%, respectively (Yapo et al., 2007; Liew et al., 2018; Wang et al., 2014). Thus, the
present study revealed that fresh mango peel from processing industry could be successfully
used for commercial scale pectin extraction in Sri Lanka.
Sangheetha et al.
6
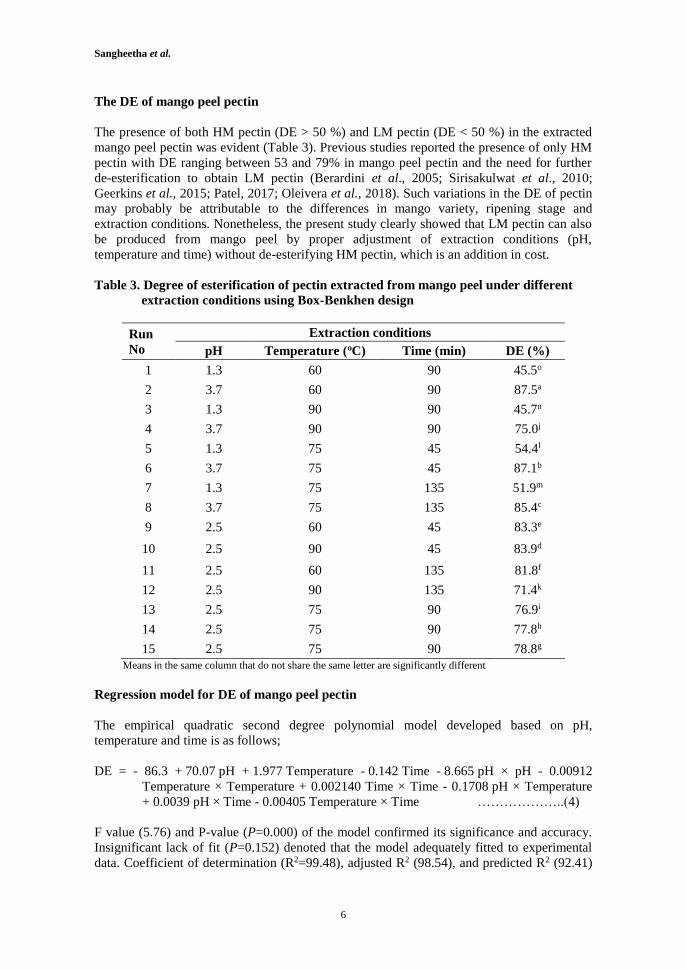
The DE of mango peel pectin
The presence of both HM pectin (DE > 50 %) and LM pectin (DE < 50 %) in the extracted
mango peel pectin was evident (Table 3). Previous studies reported the presence of only HM
pectin with DE ranging between 53 and 79% in mango peel pectin and the need for further
de-esterification to obtain LM pectin (Berardini et al., 2005; Sirisakulwat et al., 2010;
Geerkins et al., 2015; Patel, 2017; Oleivera et al., 2018). Such variations in the DE of pectin
may probably be attributable to the differences in mango variety, ripening stage and
extraction conditions. Nonetheless, the present study clearly showed that LM pectin can also
be produced from mango peel by proper adjustment of extraction conditions (pH,
temperature and time) without de-esterifying HM pectin, which is an addition in cost.
Table 3. Degree of esterification of pectin extracted from mango peel under different
extraction conditions using Box-Benkhen design
Run
No
Extraction conditions
pH Temperature (oC) Time (min) DE (%)
1 1.3 60 90 45.5o
2 3.7 60 90 87.5a
3 1.3 90 90 45.7n
4 3.7 90 90 75.0j
5 1.3 75 45 54.4l
6 3.7 75 45 87.1b
7 1.3 75 135 51.9m
8 3.7 75 135 85.4c
9 2.5 60 45 83.3e
10 2.5 90 45 83.9d
11 2.5 60 135 81.8f
12 2.5 90 135 71.4k
13 2.5 75 90 76.9i
14 2.5 75 90 77.8h
15 2.5 75 90 78.8g
Means in the same column that do not share the same letter are significantly different
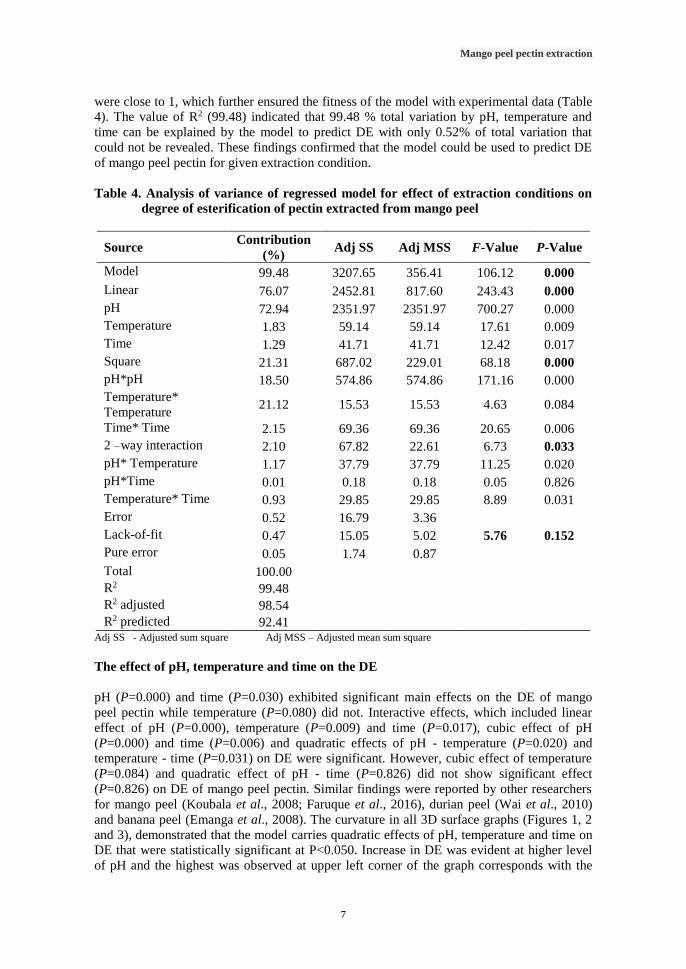
Regression model for DE of mango peel pectin
The empirical quadratic second degree polynomial model developed based on pH,
temperature and time is as follows;
DE = - 86.3 + 70.07 pH + 1.977 Temperature - 0.142 Time - 8.665 pH × pH - 0.00912
Temperature × Temperature + 0.002140 Time × Time - 0.1708 pH × Temperature
+ 0.0039 pH × Time - 0.00405 Temperature × Time ………………..(4)
F value (5.76) and P-value (P=0.000) of the model confirmed its significance and accuracy.
Insignificant lack of fit (P=0.152) denoted that the model adequately fitted to experimental
data. Coefficient of determination (R2=99.48), adjusted R2 (98.54), and predicted R2 (92.41)
Mango peel pectin extraction
7
were close to 1, which further ensured the fitness of the model with experimental data (Table
4). The value of R2 (99.48) indicated that 99.48 % total variation by pH, temperature and
time can be explained by the model to predict DE with only 0.52% of total variation that
could not be revealed. These findings confirmed that the model could be used to predict DE
of mango peel pectin for given extraction condition.
Table 4. Analysis of variance of regressed model for effect of extraction conditions on
degree of esterification of pectin extracted from mango peel
Source Contribution
(%) Adj SS Adj MSS F-Value P-Value
Model 99.48 3207.65 356.41 106.12 0.000
Linear 76.07 2452.81 817.60 243.43 0.000
pH 72.94 2351.97 2351.97 700.27 0.000
Temperature 1.83 59.14 59.14 17.61 0.009
Time 1.29 41.71 41.71 12.42 0.017
Square 21.31 687.02 229.01 68.18 0.000
pH*pH 18.50 574.86 574.86 171.16 0.000
Temperature*
Temperature 21.12 15.53 15.53 4.63 0.084
Time* Time 2.15 69.36 69.36 20.65 0.006
2 –way interaction 2.10 67.82 22.61 6.73 0.033
pH* Temperature 1.17 37.79 37.79 11.25 0.020
pH*Time 0.01 0.18 0.18 0.05 0.826
Temperature* Time 0.93 29.85 29.85 8.89 0.031
Error 0.52 16.79 3.36
Lack-of-fit 0.47 15.05 5.02 5.76 0.152
Pure error 0.05 1.74 0.87
Total 100.00
R2 99.48
R2 adjusted 98.54
R2 predicted 92.41 Adj SS - Adjusted sum square Adj MSS – Adjusted mean sum square
The effect of pH, temperature and time on the DE
pH (P=0.000) and time (P=0.030) exhibited significant main effects on the DE of mango
peel pectin while temperature (P=0.080) did not. Interactive effects, which included linear
effect of pH (P=0.000), temperature (P=0.009) and time (P=0.017), cubic effect of pH
(P=0.000) and time (P=0.006) and quadratic effects of pH - temperature (P=0.020) and
temperature - time (P=0.031) on DE were significant. However, cubic effect of temperature
(P=0.084) and quadratic effect of pH - time (P=0.826) did not show significant effect
(P=0.826) on DE of mango peel pectin. Similar findings were reported by other researchers
for mango peel (Koubala et al., 2008; Faruque et al., 2016), durian peel (Wai et al., 2010)
and banana peel (Emanga et al., 2008). The curvature in all 3D surface graphs (Figures 1, 2
and 3), demonstrated that the model carries quadratic effects of pH, temperature and time on
DE that were statistically significant at P<0.050. Increase in DE was evident at higher level
of pH and the highest was observed at upper left corner of the graph corresponds with the
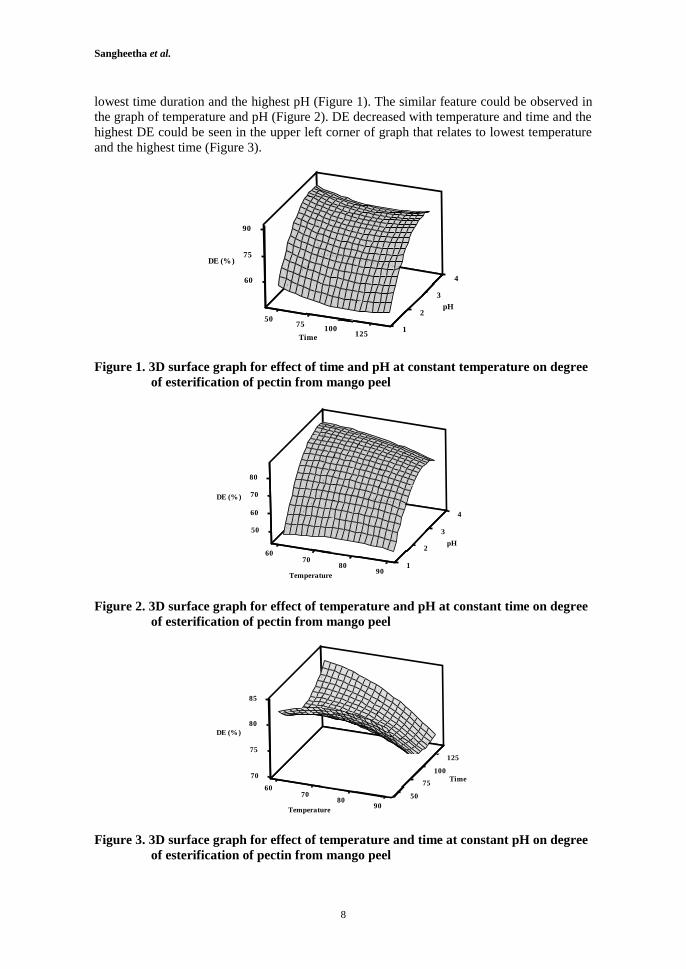
Sangheetha et al.
8
lowest time duration and the highest pH (Figure 1). The similar feature could be observed in
the graph of temperature and pH (Figure 2). DE decreased with temperature and time and the
highest DE could be seen in the upper left corner of graph that relates to lowest temperature
and the highest time (Figure 3).
Figure 1. 3D surface graph for effect of time and pH at constant temperature on degree
of esterification of pectin from mango peel
Figure 2. 3D surface graph for effect of temperature and pH at constant time on degree
of esterification of pectin from mango peel
Figure 3. 3D surface graph for effect of temperature and time at constant pH on degree
of esterification of pectin from mango peel
Temperature 75
Hold Values
0557
001
60
57
0557
1521
3
2
4
57
09
)%( ED
Hp
emiT
urface Plot of D % (S ) vs pH, TimeE
Time 90
Hold Values
0670
80
05
06
07
06
190
3
2
4
80
)%( ED
Hp
erutarepmeT
urface Plot of DE S %) vs pH, Temperature(
pH 2.5
Hold Values
07
75
08
0670
0850
09
1
100
57
121 5
08
58
)%( ED
emiT
erutarepmeT
urface Plot of DES (%) vs Time, Temperature
Mango peel pectin extraction
9
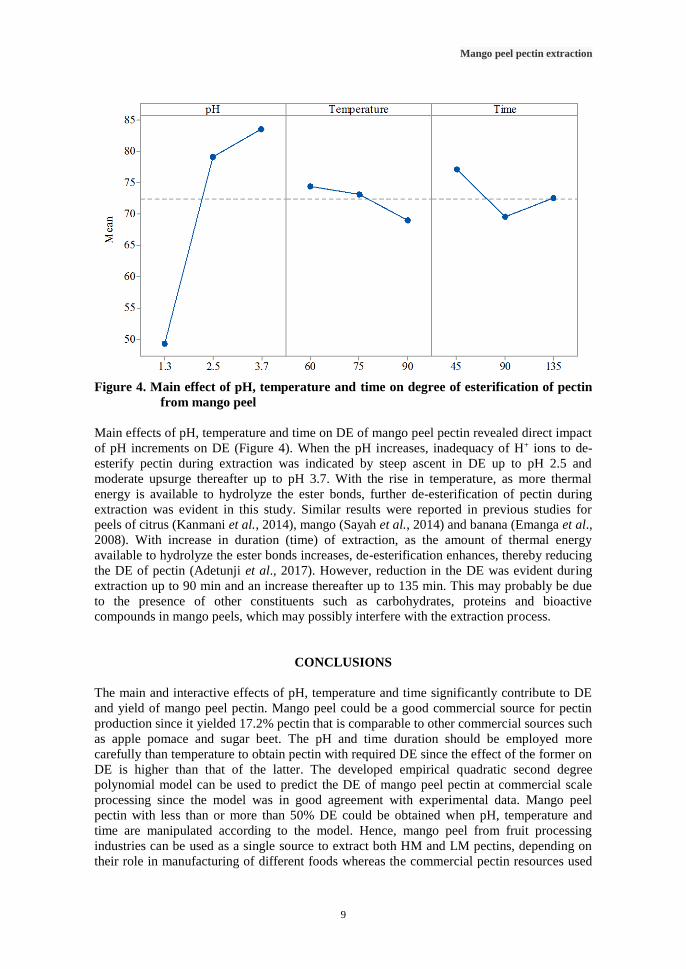
Figure 4. Main effect of pH, temperature and time on degree of esterification of pectin
from mango peel
Main effects of pH, temperature and time on DE of mango peel pectin revealed direct impact
of pH increments on DE (Figure 4). When the pH increases, inadequacy of H+ ions to de-
esterify pectin during extraction was indicated by steep ascent in DE up to pH 2.5 and
moderate upsurge thereafter up to pH 3.7. With the rise in temperature, as more thermal
energy is available to hydrolyze the ester bonds, further de-esterification of pectin during
extraction was evident in this study. Similar results were reported in previous studies for
peels of citrus (Kanmani et al., 2014), mango (Sayah et al., 2014) and banana (Emanga et al.,
2008). With increase in duration (time) of extraction, as the amount of thermal energy
available to hydrolyze the ester bonds increases, de-esterification enhances, thereby reducing
the DE of pectin (Adetunji et al., 2017). However, reduction in the DE was evident during
extraction up to 90 min and an increase thereafter up to 135 min. This may probably be due
to the presence of other constituents such as carbohydrates, proteins and bioactive
compounds in mango peels, which may possibly interfere with the extraction process.
CONCLUSIONS
The main and interactive effects of pH, temperature and time significantly contribute to DE
and yield of mango peel pectin. Mango peel could be a good commercial source for pectin
production since it yielded 17.2% pectin that is comparable to other commercial sources such
as apple pomace and sugar beet. The pH and time duration should be employed more
carefully than temperature to obtain pectin with required DE since the effect of the former on
DE is higher than that of the latter. The developed empirical quadratic second degree
polynomial model can be used to predict the DE of mango peel pectin at commercial scale
processing since the model was in good agreement with experimental data. Mango peel
pectin with less than or more than 50% DE could be obtained when pH, temperature and
time are manipulated according to the model. Hence, mango peel from fruit processing
industries can be used as a single source to extract both HM and LM pectins, depending on
their role in manufacturing of different foods whereas the commercial pectin resources used
Sangheetha et al.
10
at the present give only high methoxyl pectin and require an additional de-esterification
process step to produce low methoxyl pectin.
ACKNOWLEDGEMENT
The research grant of RG/2017/AG/2 by National Science Foundation, Sri Lanka is hereby
gratefully acknowledged.
REFERENCES
Begum, R., Yusof, Y. A., Aziz, M. G. and Uddin, M. B. (2017). Screening of fruit wastes as
pectin source: Journal of Environmental Science and Natural Resources. 10(1), 65-70.
Berardini, N., Fezer, R., Conrad, J., Beifuss, U., Carle, R., and Schieber, A. (2005).
Screening of mango (Mangifera indica L.) cultivars for their contents of flavonol O- and
xanthone C-glycosides, anthocyanins, and pectin: Journal of Agricultural and Food
Chemistry. 53, 1563-1570.
Emanga, T. H., Ronkart, S. N., Robert, B. C. and Paquot, M. (2008). Characterization of
pectins extracted from banana peels (Musa AAA) under different conditions using an
experimental design: Food Chemistry. 108, 463–471.
Faruque, M. O., Kamrul, N., Begum, A. A., Mazumder, M. A. R., and Uddin, M. B. (2016).
Effect of extraction methods on the characteristics of pectin from mango peel wastes:
International Journal of Agricultural and Food Science. 6(2), 70-75.
Flutto, L. (2003). Pectin: properties and determination. pp. 4440–4449. In: B. Caballero, B.,
Trugo, L.C. and Finglas, P. M. (Ed.) Encyclopedia of Food Sciences and Nutrition. CA
Academic Press, San Diego, California, United Sates.
Geerkens, C. H., Nagel, A., Just, K. M., Miller-Rostek, P., Kammerer, D. R., Schweiggert, R.
M. and Carle, R. (2015). Mango pectin quality as influenced by cultivar, ripeness, peel
particle size, blanching, drying, and irradiation: Food Hydrocolloids. 51, 241-251.
Girma, E. and Worku, T. (2016). Extraction and characterization of pectin from selected fruit
peel waste: International Journal of Scientific and Research Publications. 6(2), 447-454.
Kanmani, P., Dhivya, E., Aravind, J. and Kumaresan, K. (2014). Extraction and analysis of
pectin from citrus peels: augmenting the yield from Citrus limon using statistical
experimental design: Iran Journal of Energy Environment. 5, 303–312.
Koubala, B. B., Kanscia, G., Mbomeb, L. I., Cre´peauc, M. J., Thibaultc, J. F. and Raletc, M.
C. (2008). Effect of extraction conditions on some physicochemical characteristics of pectins
from ‘‘Ame´liore´e’’ and ‘‘Mango’’ mango peels: Food Hydrocolloids. 22, 1345–1351.
Kratchanova, M., Nikolova, M., Pavlova, E., Yanakieva, I. and Kussovski, V. (2010).
Composition and properties of biologically active pectic polysaccharides from leek (Allium
porrum L.): Journal of Science and Food Agriculture. 90(12), 2046-2050.
Mango peel pectin extraction
11
Levigne S., Ralet M. C. and Thibault J. F. (2002). Characterization of pectins extracted from
fresh sugar beet under different conditions using an experimental design: Carbohydrate
Polymers. 49, 145-153.
Liew, S. Q., Ngoh, G. C., Yusoff, R. and Teoh, W. H. (2018). Acid and deep eutectic solvent
(DES) extraction of pectin from pomelo (Citrus grandis (L.) Osbeck) peels: Biocatalysis and
Agricultural Biotechnology. 13, 1–11.
Methacanon, P., Krongsin, J. and Gamonpilas, C. (2013). Pomelo (Citrus maxima) pectin:
Effects of extraction parameters and its properties: Journal of Food Hydrocolloid. 35, 383-
391.
Mitra, S. K., Pathak, P. K., Devi, H. L. and Chakraborty, I. (2013). Utilization of seed and
peel of mango: Acta Horticulture. 992, 593–596.
Müller-Maatsch, J., Bencivenni, M., Caligiani, A., Tedeschi, T., Bruggeman, G., Bosch, M.,
Petrusan, J., Van, D. B., Elst, K. and Sforza, S. (2016). Pectin content and composition from
different food waste streams: Food chemistry. 201, 37-45.
Oliveira, A. do N., Paula, D. de A., De Oliveira, E. B., Saraiva, S., Paulo, S. and Ramos, A.
(2018). Optimization of pectin extraction from Ubá mango peel through surface response
methodology: International Journal of Biological Macromolecules. 113,395-402.
Pasandide, B., Khodaiyan, F., Zeinab, E. and Hosseini, M. S. S. (2017). Optimization of
aqueous pectin extraction from Citrus medica peel: Carbohydrate Polymers. 178, 27-33.
Ranganna, S. (1986). Handbook of analysis and quality control for fruits and vegetables
products. 2nd Ed. Mc Graw Hill publishing Ltd, New Delhi, pp.33-43.
Sandarani, M. D. J. C. (2017). A Review: Different Extraction Techniques of Pectin: Journal
of Pharmacognosy and Natural Products. 3(3), doi: 10.4172/2472-0992.1000143
Sayah, M. Y., Chabir, R., El Kandri, Y. R., Chahdi, F. O., Touzani, H. and Errachidi, F.
(2014). Optimization of pectin extraction from steam distillated orange peels through an
experimental factorial design: International Journal of Innovation and Applied Studies. 11,
1642-1649.
Sirisakulwat, S., Sruamsiri, P., Carle, R. and Neidhart, S. (2010). Resistance of industrial
mango peel waste to pectin degradation prior to by-product drying: International Journal of
Food Science and Technology. 45, 1647-1658.
Srivastava, P. and Malviya, R. (2011). Sources of pectin, extraction and its applications in
pharmaceutical industry - An overview: Indian Journal of Natural Products and Resources.
2(1), 10-18.
Thakur, B. R. (1997). Chemistry and uses of pectin – A review: Critical Reviews in Food
Science and Nutrition. 37, 47-73.
Wai, W. W., Alkari, A. F. M. and Easa, A. M. (2010). Effect of extraction conditions on
yield and degree of esterification of durian rind pectin: An experimental design: Food and
bio product processing. 88, 209-214.
Sangheetha et al.
12
Wang, W., Wu, X., Chantapakul, T., Wang, D., Zhang, S., Maa, X., Ding, T., Ye, X. and
Liu, D. (2017). Acoustic cavitation assisted extraction of pectin from waste grapefruit peels:
A green two-stage approach and its general mechanism: Food Research International. 102,
101–110.
Wathsala, L. H. A. G., Maheshika, M. D. I., Illeperuma, C., Nawarathna, A., Sukirtha, S. and
Jayasinghe, C. V. L. (2017). Possibility of incorporation the pineapple pulp waste in food
industry as a solution to Sri Lankan fruit processing by products: Proceedings of 73rd Annual
Conference of Sri Lankan Association for Advancement of Science. 118.
Yapo, B. M., Robert, C., Etienne, I., Wathelet, B. and Paquot, M. (2007). Effect of extraction
conditions on the yield, purity and surface properties of sugar beet pulp pectin: Food
Chemistry. 100(4), 1356–1364.
Yeoh, S., Shi, J., Langrish, T. A. G. (2008). Comparisons between different techniques for
water-based extraction of pectin from orange peels: Journal of Desalination. 218(3), 229–
237.
Wang, X., Chen, Q. and Lü, X. (2014). Pectin extracted from apple pomace and citrus peel
by subcritical water: Food Hydrocolloids. 38, 129-137.
Copyright © 2022 FDOKUMEN