EFFECT OF OIL AND AGRICULTURE ON ECONOMIC GROWTH IN NIGERIA
38
EFFECT OF OIL AND AGRICULTURE ON ECONOMIC GROWTH IN NIGERIA International Journal of Development and Economic Sustainability (IJDES) Moses C. Ekperiware and Michael O. Olomu [email protected] NATIONAL CENTRE FOR TECHNOLOGY MANAGEMENT (NACETEM), OAU, ILE- IFE, OSUN STATE, NIGERIA ABSTRACT The Nigerian oil and agricultural sectors are two crucial sectors as regards the history of economic development in Nigeria. The agricultural sector was the highest contributor of income and still the highest employer of labour but since the late 1960s, the oil sector overtook the agricultural sector been the federal government main source of revenue and foreign earnings. Since these variables are key determinants of economic progress in the history of Nigeria, this study attempt to examine the interaction and feedback mechanism among these sectors with economic output in Nigeria from 1981 to 2012 using vector auto regression (VAR) methodology. 1
Transcript of EFFECT OF OIL AND AGRICULTURE ON ECONOMIC GROWTH IN NIGERIA
EFFECT OF OIL AND AGRICULTURE ON ECONOMIC GROWTH IN NIGERIA
International Journal of Development and Economic Sustainability
(IJDES)
Moses C. Ekperiware and Michael O. Olomu
NATIONAL CENTRE FOR TECHNOLOGY MANAGEMENT (NACETEM), OAU, ILE-
IFE, OSUN STATE, NIGERIA
ABSTRACT
The Nigerian oil and agricultural sectors are two crucial
sectors as regards the history of economic development in
Nigeria. The agricultural sector was the highest contributor of
income and still the highest employer of labour but since the
late 1960s, the oil sector overtook the agricultural sector been
the federal government main source of revenue and foreign
earnings. Since these variables are key determinants of economic
progress in the history of Nigeria, this study attempt to examine
the interaction and feedback mechanism among these sectors with
economic output in Nigeria from 1981 to 2012 using vector auto
regression (VAR) methodology.
1

The results showed that all the three variables are
positively correlated and the unit root test shows that the
variables are stationary at levels. Output was more decomposed
into agriculture sector (AGRICP) than oil revenue (OILRP) both in
the short run and long run while AGRICP was more decomposed to
output in the short run, but OILRP in the long run. OILRP on the
other hand was more decomposed to output followed by AGRICP in
both short and long run but with a larger standard error.
Response of output to innovation on oil revenue was only
additive in the shortest while and negatively affected output
before positively trickled down in the long run. Gains from oil
sector are not properly used but short lived and the gains from
the oil sector have reduced the motivation of regions and indeed
Nigerians to maximise her resources endowed other than oil.
Output response to AGRICP innovation exhibits positive shock and
shows tendency of positively contributing to output both in the
short run and long run and any effort put into investing more in
the agricultural sector even from gains from the oil sector would
lead to sustainable development of the economy.
Innovation to OILRP showed a positive shock to AGRICP which
means that oil revenues can be a veritable source of fund to
boost agricultural development in the country where majority of
2

the Nigerian population is employed. There is a positive feedback
from the AGRICP on the oil sector, which means a developing
agricultural sector does not exclude development of the oil
sector. Innovation to output has positive shock on oil revenue.
This means that increased output can attract foreign investors in
the economy.
Conclusively, the three economic variables are vital economic
mix for economic development in Nigeria and government should do
more in place of policy and planning to optimise the gains for
economic progress.
Keywords: Oil, agriculture, output, Nigeria, economic
development
1. Introduction
To most developing economies of the world, agriculture is a key
potential for economic growth and development. Nigeria’s economy
can be described as a rapidly growing economy with an average
growth rate of 7% in the last decade (World Bank 2013). Nigeria
has been blessed with both agricultural and oil endowment.
Agriculture has been Nigerian major economic activity before the
emergence of crude oil in the late 1960s. But since then, the
3

country has relied more on oil for revenue and development than
agriculture as the oil sector still welcome most expatriates to
do major activities in the oil sector in the country. If the
nation relies on a product, majority of her labour should be
leading in working and contributing to their economic growth
compared to what is obtainable in the Nigerian case let alone the
nation exporting crude and importing the refined product for
consumption at an exorbitant price compared to what is been
exported. Still the people employed and infrastructure and system
in place to process these crude products had it been done in
Nigeria would have significantly contribute in developing the
nation.
The nation budget is usually been earmark based on crude oil
price while the agricultural sector is not much on the scene but
which actually contributes to development in the country.
Ekperiware (2011) opined that the oil sector has not been
contributing much compared to the real sector as far as the
Nigerian case is concern so a further empiric on the impact of
oil revenue the government makes out of the oil sector and the
percentage contribution of the agricultural sector to development
in the country is germane.
Here the definition of agriculture is germane, agriculture
is the growing of crops and rearing of animals as wells as4

raising fishes for human use. This sounds like basic need of man.
Food security is as important as human existence. The cumulative
agricultural activities in the country can be said as basic and a
vital component of the real sector of the economy. It is obvious
that the Nigerian economy is not planned with this all important
sector besides the huge natural endowment in the agricultural
sector, rather the economy is planned based on expectations from
the oil market (Ogbonna and Appah, 2012).
Also, if the agricultural sector is left at the mercy of the
oil sector which its major stakeholders and players are just a
handful of Nigerian and which its economic activities takes place
outside the shores of the country with most of its active workers
not citizens of the country, as an economist, it’s hard to
convince even non economist how such sector is expected to drive
development. So one can easily see my hesitations about the oil
sector and economic development in the country.
However, the revenue stream the oil sector brings to the
Nigeria economy is commendable, contributing the highest revenue
to the economy and the major foreign earner etc. but as the
engine of economic survival is not in the fabric of the real
economy raises doubts if the oil sector can drive the structural,
political, social, infrastructural priorities of the economy
5
compared to if agriculture is the main stay of the economy and
labour, infrastructures and the entire system works to sustain
the economy.
Foreign workers come work earn wages and go back in the top
oil jobs, the nation exports crude which go into other economies
and processed by companies which employ labour, must have built
infrastructure, service, pay tax etc. and export such product at
selling price for Nigeria to use. As far as the oil sector is
concern, Nigeria is mostly a consumer economy from the chain of
event of the system.
Hence this study wants to investigate how much the oil
sector, as promising as it seems and the agricultural sector are
contributing to Nigerian development of Nigeria.
Chiefly, this study would look at the trend of agriculture
and oil sectors’ indices in the country, and comparatively
examine the impact of both sectors to economic development in the
country
2. LITERATURE REVIEW
6

This review would take two forms; theoretical and empirical on
government revenue from oil and contributions of agriculture
sector on development in Nigeria.
2.1 Theoretical Review
2.1.1 Oil Revenue
Dominant theories have suggested that there is a significant
relationship between economic growth vis-à-vis oil revenue income
and agriculture but international evidences also suggested that
resource-rich nations are characterized by slow or stagnating
growth, de-industrialization, low savings, deteriorating capital
accumulation and stagnating or declining productivity (Budina and
Van Wijnbergen, 2008).
National Planning Commission (2011) revealed from their
survey that the Nigeria’s primary activity constitutes
agriculture, mining and quarrying which accounts for more than
65% of real gross outputs and about 80% of foreign exchange
revenues in 2011 and within the non-oil sector, manufacturing,
building and construction account for 4.14% of foreign exchange
and government revenue during this period.
Oil as a natural resource in Nigeria was discovered in 1956
and its exportation began proper in 1958 and since the oil boom
7

era in the early 1970s, it seems to have become the leading
factor for economic growth and development in Nigeria’s economy.
Notably, Nigeria is Africa’s highest oil exporter and the world’s
tenth highest oil producer and Nigeria’s economy is structurally
dependent on oil and gas which constitutes about 96% of total
exports, 80% of government revenues and around 40% of GDP (CBN,
2011). In addition, Libya and Nigeria are the two countries with
huge reserves in Africa accounting for almost 65% of total oil
reserve from Africa.
Previous studies have shown that revenue generated from oil
has played a principal role and contributes to economic
development in Nigeria (Azaiki and Shagari, 2007). Statistically,
the total oil revenue generated between 2000 and 2009 into the
Federation Account totalled to N34.2 trillion while non-oil
revenue was N7.3 trillion which amounted to 82.36% and 17.64%
respectively (CBN, 2009). During this period, the mean value of
oil revenue stood at N3.42 trillion compared to non-oil revenue
which was N732.2 billion (CBN, 2009).
According to Yakub (2008), revenue from a nation’s natural
resources (e.g. petroleum) has a positive influence on economic
growth and development. This was demonstrated as Nigeria’s oil
revenue accounted for a larger share of the total revenue which
rose from 77.5% in 1975 to 88.6% in 2011 (Nwosa and Ogunlowore,8

2013). This was further evident as Nigeria generated an extra
$390 billion in oil-related fiscal revenue between 1971 and 2005
using 1970 as a benchmark and oil accounted for about 90% of the
total exports and approximately four-fifths of total government
revenues (Budina and Van Wijnbergen, 2008).
Ogbonna and Appah (2012) also carried out an empirical
investigation on the effects of petroleum income on the Nigerian
economy for the period 2000 to 2009 where they discovered that
oil revenue has a positive and significant relationship with
Nigeria’s gross domestic product (GDP) and per capita income,
which is the revenue generated from exploration contributes to
the national growth.
Contrarily, Bawa and Mohammed (2007) asserted that “Nigeria
with all its oil wealth has performed poorly, with GDP, per
capita today not higher than at independence in 1960” where they
acknowledged poor performance of Nigeria’s economy but they
refused to provide any empirical evidence to support their
findings.
Baghebo and Atima (2013) examined the impact of petroleum on
economic growth in Nigeria for the period of 1980-2011. The
stationary status of the time series data was examined using
Augmented Dickey Fuller test. The real gross domestic product is9

the dependent variable while the independent variables are
foreign direct investment, oil revenue, corruption index,
external debt. The Johansen co-integration test was conducted to
ascertain the long run equilibrium condition of the variables in
the model. It was revealed that the oil revenue and corruption
index negatively impact the real GDP while other independent
variables have positive impacts on the growth of the economy.
They concluded that the resource curse theory is in operation in
Nigeria as revenue from oil goes into the hands of few
influential Nigerians in midst of plenty.
Nigeria’s heavy dependence on the oil sector coupled with
the uncertainty in the international oil market has brought mixed
economic performances and macroeconomic imbalances which
accumulated to weakening international oil price and a subsequent
revenue shortfall culminated in relatively low real GDP growth in
2002. This led to deterioration in the fiscal account and
pressure on external payments amounted to a debt crisis but the
upturn in the oil market in 2003 brought about the anticipated
upswing in real GDP growth, which rose to 5% (AfDB/OECD, 2004).
More importantly in the recent times, the Nigerian oil and
gas sub-sector has become inefficient in recent years due to the
absence of a coherent national energy policy, rendering it unable
10

to satisfy the growing demand for energy as government owned oil
refineries have failed to supply refined petroleum products.
The contributions of the oil industry to growth and
development of the Nigerian economy can be measured in terms of
the industry’s impacts on the macroeconomic variables. These
contributions can also be examined in terms of its share of
revenue generation and has immensely improved both the foreign
exchange reserves and government revenues (Onyemaechi, 2012). It
was furthered observed that the government share of crude oil
revenue coupled with various joint venture agreements with the
international oil producing companies is roughly 70% of revenues
accumulated from crude oil transactions. He also opined that the
oil industry can contribute significantly to growth and
development of the Nigerian economy through foreign direct
investment (FDI).
With more than 65% of Nigeria’s federal generated revenue
coming from oil in the last decade, Nigeria’s fiscal policy
remains heavily influenced by the oil industry and its volatile
movement and based on the IMF report in 2003 that starting from
1970, Nigeria’s revenue and expenditures followed a similar
pattern to oil prices. Revenue and expenditure also experienced
sharp increase during the periods of high oil prices such as
1979-82, 1991-92, 2000-02 and 2005-09 and more so, when oil11

prices subsided after the booms, Nigeria’s revenue declined as
well. On average, from 2003 to 2011, oil revenue accounted for
80% of all Federal-collected revenue annually.
Odularu (2007) asserted that oil and gas exports accounted
for more than 98% of export earnings and about 83% of federal
government revenue in Nigeria in the year 2002. More so in the
same year, Nigeria's per capita income had improved to about one-
quarter of its mid-1970s high and far below the level at
independence while the economy also continue to witness massive
growth of "informal sector" estimated by some to be as high as
75% of the total economy.
In the year 2000, rise in world’s oil prices resulted into
more improved government revenue of over $16 billion which nearly
equals the double amount realized in the year 1999. Nigeria has
the second largest oil reserves and the biggest oil exporter in
Africa with 2.5 million bpd as at year 2011 followed by Angola
exporting an estimated 1.84 million bpd in that year. More so,
Nigeria’s 37.2 billion barrels of oil reserves places it among
the top 10 countries in terms of reserves.
To Englama et al (2010), crude oil became major export
commodity in Nigeria in 1958 and its contribution to the federal
government revenue became pronounced which was 82.1% in 1970,
26.3% in 1974 and constituted 83% in the year 2008 largely due to12

upsurge in oil prices in the international market and this
gradually made Nigeria became dependent on crude oil as
productivity declined in other sectors. During the global
financial crisis in 2009, Nigeria economy was threatened with
unfavourable terms of trade which resulted into a drop in the oil
revenue and slow economic growth.
According to OPEC survey in 2010/2011, it was declared that
oil export revenue dropped from US$74,033 million in 2008 to
US$43,623 million in 2009 and the naira depreciated to N148.902
in 2009 from N118.546 in 2008 and the Nigeria’s total export
revenue in 2010 amounted to US$70,579 million and the revenue of
petroleum exports from the total export revenue was US$61,804
million which is 87.6% of total export revenue and this means
that Nigeria’s economy is vulnerable to the fluctuation of oil
prices at the international market.
Furthermore, recent evidences have shown that some of the
countries in Africa with the highest income inequality are oil
producing nations such as Nigeria, where 70% of the population
lives below the poverty line as many locals regard fuel subsidies
as the only benefit of living in an oil-rich nation. Fuel
subsidies as it is also come with it its own inadequacies and
losses to the economy. Several resurgent efforts aimed at
diversification of these economies have yielded mixed results –13

although the Nigeria is a bit encouraging as the non-oil sector
has been expanding at a much faster pace than the oil sector in
recent years.
Based on various empirical evidences from Nigeria, it is
crystal clear that oil discovery has had certain effects on the
Nigerian people and the economy both positively and negatively.
Considering the environment challenges faced by the various
communities within which the oil wells are exploited where they
suffer environmental degradation which results to deprivation of
means of livelihood and other socioeconomic factors could be
refer to as negative impacts. Though national financial records
have shown that large proceeds are obtained from the domestic
sales and export of petroleum products, its impact on the growth
of the Nigerian economy still raise some questions which this
study aimed to answer.
2.1.2 Agriculture Resources
Nigeria was a predominantly agrarian economy with agriculture
accounting for significant shares of the GDP and total exports,
as well as employing the bulk of the labour force. Since
inception and in the 1960’s, the Nigeria’s main domestic product
was agriculture which provided the country with employment and
14

foreign exchange earnings but the sector was just over taken by
the oil boom that began in the 1970’s and this hampered its
contribution to the Nigerian economy (National Bureau of
Statistics, 2012). Historically, from the moment the oil boom
began, there has been a steady decline in the market share of the
agricultural productivity in Nigeria and it has been largely
ignored in favour of the oil and gas industry.
Agriculture is the backbone of the rural economy such as
Nigeria which is characterized as an engine that contributes to
the growth of the economy but the sector is still identified with
low agricultural outputs despite the country’s fertile landmass
partly due to the over dependence of government on oil which
characterized Nigeria as a mono-cultural economy. Currently,
Nigeria has 75% of its land suitable for agriculture, but only
40% remained cultivated (Omorogiuwa et al, 2014). Agricultural
sector is an important stimulus market for industrial products –
both in terms of backward and forward linkages to industry.
A strong empirical correlation has been established between
Nigerian’s total GDP and the agriculture which suggests that the
prospects of the non-oil sub-sector and the overall economy are
closely tied to the performance of the agricultural sector. The
growth and development of the agricultural sector in any economy
is pertinent for national output growth through its influence15
from indigenous incomes, provision of resources for industrial
needs and foreign exchange earnings leading to transformation of
such an economy.
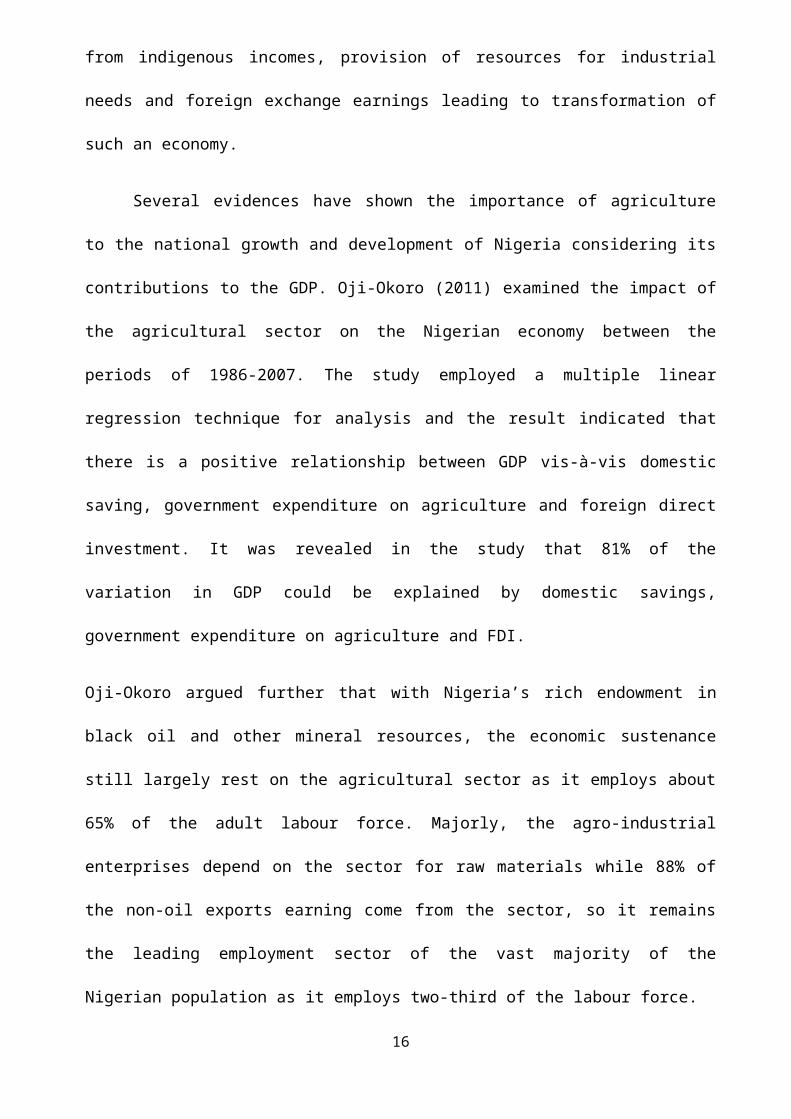
Several evidences have shown the importance of agriculture
to the national growth and development of Nigeria considering its
contributions to the GDP. Oji-Okoro (2011) examined the impact of
the agricultural sector on the Nigerian economy between the
periods of 1986-2007. The study employed a multiple linear
regression technique for analysis and the result indicated that
there is a positive relationship between GDP vis-à-vis domestic
saving, government expenditure on agriculture and foreign direct
investment. It was revealed in the study that 81% of the
variation in GDP could be explained by domestic savings,
government expenditure on agriculture and FDI.
Oji-Okoro argued further that with Nigeria’s rich endowment in
black oil and other mineral resources, the economic sustenance
still largely rest on the agricultural sector as it employs about
65% of the adult labour force. Majorly, the agro-industrial
enterprises depend on the sector for raw materials while 88% of
the non-oil exports earning come from the sector, so it remains
the leading employment sector of the vast majority of the
Nigerian population as it employs two-third of the labour force.
16

More importantly, the fact that agricultural sector
contributes up to 90% of non-oil foreign exchange earnings
position it at the heart of strategy for economic transformation
and diversification from oil revenue (Eboh, 2011). He pointed
that between the periods of 1983-2002, the adverse effects of the
oil sector volatility have been moderated by agricultural value
added in the country but since GDP per capita reached its minimal
in 1984, agricultural GDP per capita increased by over 30% to
2002. Appalling indicators have shown that agriculture sector
spending has been erratic as it contributes an annual average of
more than 32% of GDP from 2002-2007.
Tombofa (2004) affirmed that the active existence and
performance of agriculture is of great significance to the growth
and development process. He noted that the basis for the world’s
great civilization and the increase in productivity around the
world is agriculture which also sustained the first industrial
revolution. The agricultural sector is known to employ over 75%
of the labour force in developing countries and Nigeria is not an
exemption to this assertion.
Ukeji (2003) further acknowledged that in the 1960’s,
agriculture contributed up to 64% to the total GDP but
retrogressively decline in the 1970’s to 48% and falls to 20% in
17

1980 and 19% in 1985 as a result of oil discoveries in large
quantity coupled with economic mismanagement pronounced in these
periods. Similar research was also conducted by Olajide et al.
(2012) to measure the relationship between agricultural resource
and economic growth in Nigeria. The Ordinary Least Square
regression method was used for data analysis and the result
ascertained a positive cause and effect relationship between GDP
and agricultural outputs. Agricultural sector was estimated to
contribute more than 30% to the GDP between 1970 and 2010 which
implied that agricultural sector for the period of analysis has
significant influence on macroeconomic output level.
In fact, due to oil prices collapse and the financial crisis
in the 1980’s, it led to decreased government revenue which
affected the growth of the agricultural sector but Structural
Adjustment Policy (SAP) was implemented by the Nigerian
government chiefly aimed to stabilize the economy including the
agricultural sector did not prove successful (IFPRI 2010).
Although the agricultural policies established over the years by
the Nigerian government have not been successful but agriculture
sector continues to heavily influence GDP and economic growth. In
the recent time, agribusiness appears to be the new frontier to
18

improve economy as it has become the country’s new strategy
towards economic growth and development.
From the above, it is crystal clear that previous indigenous
studies have paid little or no attention to the relationship
between GDP vis-à-vis oil revenue and agriculture, thereby
providing further justification for this study.
3. Method
The methods used in this study are descriptive statistics and
econometric techniques. The descriptive technique presents trend
of oil, agriculture and GDP variables to illustrate their
movement over time in the Nigerian economy. For the econometric
technique, the vector auto regression (VAR) model will be used.
This would show feedback and shocks to innovations in oil,
agriculture and output through variance decomposition and impulse
response from Vector Auto-Regression (VAR) in the Nigerian
economy overtime.
3.1 Measurement of variable
Here, the description of the variables is done and their
characteristics are examined in a tabular form.
19

TABLE 1: MEASUREMENT OF VARIABLES
VARIABLE MEANING MEASUREMENT
RGDPR Growth Rate of output (OUTPUTt−OUTPUTt−1
OUTPUTt )X100OILRP Percentage revenue from oil
out of federal government
revenue
(OILREVENUEFGREVENUE )X100
AGRICP Percentage of agriculture
output contribution to
output
( AGRICOUTPUTECONOMICOUTPUT )X100
Source: Author (2014)
There seems to be no better index to measure the oil sector
than its revenue to the government and the contribution of the
agricultural sector than its contribution to the nation’s output.
From the table above, an increase of RGDPR means that present
economic output is better than past economic output, hence the
economy is growing and that sectorial outputs like the
agricultural, manufacturing and service etc. sectors in the
economic are improving. In the oil sector, its evidence from
Central Bank of Nigerian (CBN) database that the oil sector
provides the economy with the highest revenue (OILRP), we attempt
to examine how this revenue relates with the agricultural and
economic growth in Nigeria. 20

Concerning the agricultural sector, it has been the mainstay
of the economy before the exploration of oil in Nigerian and
remains one of the leading real sectors of the economy. If indeed
government is working (policies and implementations) both locally
and internationally, there should be a huge linkage between the
oil and the agricultural sector in impacting the economic growth
of Nigeria. So examining and getting feedback of how these
variables relate (shocks and innovations) in the Nigerian economy
would be a useful exercise.
3.2 Model Specification
This study is carried out using the vector auto regression
(VAR) model, for the purpose of analysing the effects and tracing
out innovation (shocks) on the choice variables in the Nigerian
economy (oil, agriculture and output). The VAR approach, made
popular by Sims (1980), has become an important tool in empirical
macroeconomics. In VAR model, a system of simultaneous equation
is represented in vector form like as in equation (1) below.
AYt=B(L)Yt−1+Cet ……………………………………………………………………. (1)
21

is a general representative vector of endogenous variables,
Yt−1 is a vector of their lagged values and et is a white noise
vector of the disturbance terms for each variable. This
disturbance term captures any exogenous factors in the model. The
square n x n matrix A, where n is the number of variables,
contains the parameters of the contemporaneous response of the
variables to the disturbances or innovations. B(L) is a pth
degree matrix polynomial in the lag operator L, where p is the
number of lagged periods used in the model. However, we transform
equation (1) into a reduced form model to derive the standard VAR
representation, as shown in equation (2) below, which facilitates
estimation of the model parameters.
Yt=D(L)Yt−1+et ……………………………………………………………………………….. (2)
The transformation of (1) into (2) implies that D(L)≡A−1Cet . The
error term ( et ) are linear combinations of the uncorrelated shocks
( et ) such that each individual error term is serially uncorrelated
with zero mean and a constant variance.
The matrix is the variance /covariance of the estimated
residuals et , of the standard VAR. The 2 are the variance and ij
are the covariance terms where each ij = (1/T)∑T=1
Te¿ejt and
22

=[ σ12 σ12 σ13
σ21 σ22 σ23
σ31 σ32 σ32 ]………………………………………………………………………(3)
The matrix is symmetric, since 12 = 21, and so it contains only
(n2 + n)/2 distinct estimated parameters to use in recovering the
parameters in (1).
The VAR model involves applying the long-run restrictions
which tend to be more consistent with many economic theories. One
of the advantages of this approach is that the restrictions are
only applied to the long-run parameter, while the short-run
dynamics are allowed to be determined freely.
The research study considers a vector of three variables:
∆Xt,=[∆agricpt,∆gdprt,∆oilrpt ]
(5)
where Xt is a 3×1 vector of variables, where rgdpt denotes the GDP
growth rate; agricpt represents percentage contribution of
agriculture sector to economic output and oilrpt stands for
percentage contribution of oil sector to government revenue.
4. PRESENTATION AND ANALYSIS OF RESULTS
The study’s estimates are presented below for analysis
TABLE 2: UNIT ROOT TEST
23

S/N I(0) I(0)t I(I)
RGDPR -8.136809
OILRP -3.552645
AGRICP -1.942465 -2.852931
Source: computed using eview 7.0 and arranged by author
The unit root test shows that all the variables are
stationary at levels. However, agriculture was found to be
stationary at levels with trend. This shows that the agricultural
sector has been trending overtime hence its autoregressive may be
useful in determining agricultural development.
TABLE 3: CORRELATION TEST
RGDPR OILRP AGRICP
RGDPR 1.0000
OILRP 0.3720 1.0000
AGRICP 0.5598 0.3679 1.0000
Source: computed using eview 7.0 and arranged by author
Table 3 presents the correlation matrix for the variables in
the model. A possible incidence of strong correlation among the
independent variables may violate the working assumptions of our
24

estimation technique and hereby produce unrealistic results.
Here, we test for the likely occurrence of multi-collinearity
among the independent variables using the pairwise correlation
matrix. The table indicates a positive weak multi-collinearity
among the independent variables. The correlation test showed that
all the three variables are positively correlated. The highest
correlation is between the agricultural sector and the output,
followed by oil and output before agriculture and oil.
FIGURE 1: PERCENTAGE GROWTH TREND OF VARABLES
-40
-20
0
20
40
60
80
100
85 90 95 00 05 10
RGDPR OILRP AGRICP
Source: computed using eview 7.0 and arranged by author
Trend analysis is made to find out what direction a variable
is going, at what rate and how rapid. Where comparisons were to
be made among sectors percentage would have to be applied to all
of the data. The percentage rate of contribution of the oil25

sector to government revenue is greater than the contribution of
the agricultural sector contribution to economic output in
Nigeria. The economic output has been progressive since after the
Structural Adjustment Program (SAP) saga but its rate is lower
than that of oil sector and the agricultural sector. The economic
variables consistently indicate progressive and positive trend
which shows that the economy is improving.
TABLE 4: PRESENTATION OF VAR ESTIMATES
Date: 09/04/14 Time: 17:45 Sample(adjusted): 1983 2012 Included observations: 30 after adjusting endpoints t-statistics in parentheses
RGDPR OILRP AGRICPRGDPR(-1) 0.109827
(0.56674)-0.043429(-0.12153)
0.008807(0.07192)
RGDPR(-2) 0.139763(1.29200)
0.284689(1.42719)
-0.094980(-1.38945)
OILRP(-1) 0.018116(0.16086)
0.359112(1.72921)
-0.028595(-0.40180)
OILRP(-2) -0.094162 (-0.89486)
-0.079520(-0.40982)
0.123182(1.85254)
AGRICP(-1) 0.124208(0.40455)
0.474458(0.83803)
0.625387(3.22339)
AGRICP(-2) 0.258951(0.81055)
-0.272630(-0.46278)
0.241897(1.19821)
C -4.437939(-0.46122)
47.05813(2.65217)
-1.670062(-0.27466)
R-squared 0.410719 0.311297 0.801322 Adj. R-squared 0.256994 0.131636 0.749493 Sum sq. resids 234.7035 798.0686 93.72165 S.E. equation 3.194448 5.890555 2.018627 F-statistic 2.671771 1.732689 15.46086 Log likelihood -73.42504 -91.78311 -59.65513 Akaike AIC 5.361669 6.585541 4.443676 Schwarz SC 5.688615 6.912487 4.770622 Mean dependent 4.520000 76.59383 36.61259 S.D. dependent 3.705950 6.321284 4.033165 Determinant Residual Covariance 601.7669 Log Likelihood -223.7025 Akaike Information Criteria 16.31350
26

Schwarz Criteria 17.29434 Source: computed using eview 7.0 and arranged by author
Though the estimates or coefficients of VAR are not too
relevant compared to their impulse and variance decomposition
results but they show the individual relation of the endogenous
and exogenous variable. The VAR estimates showed that passed
values of output and agriculture positively relates to economic
growth and agricp but oilrp second lag negatively affects output
and agricp. This means that gains from the oil sector are not put
in futuristic projects that promote output through the real
sector.
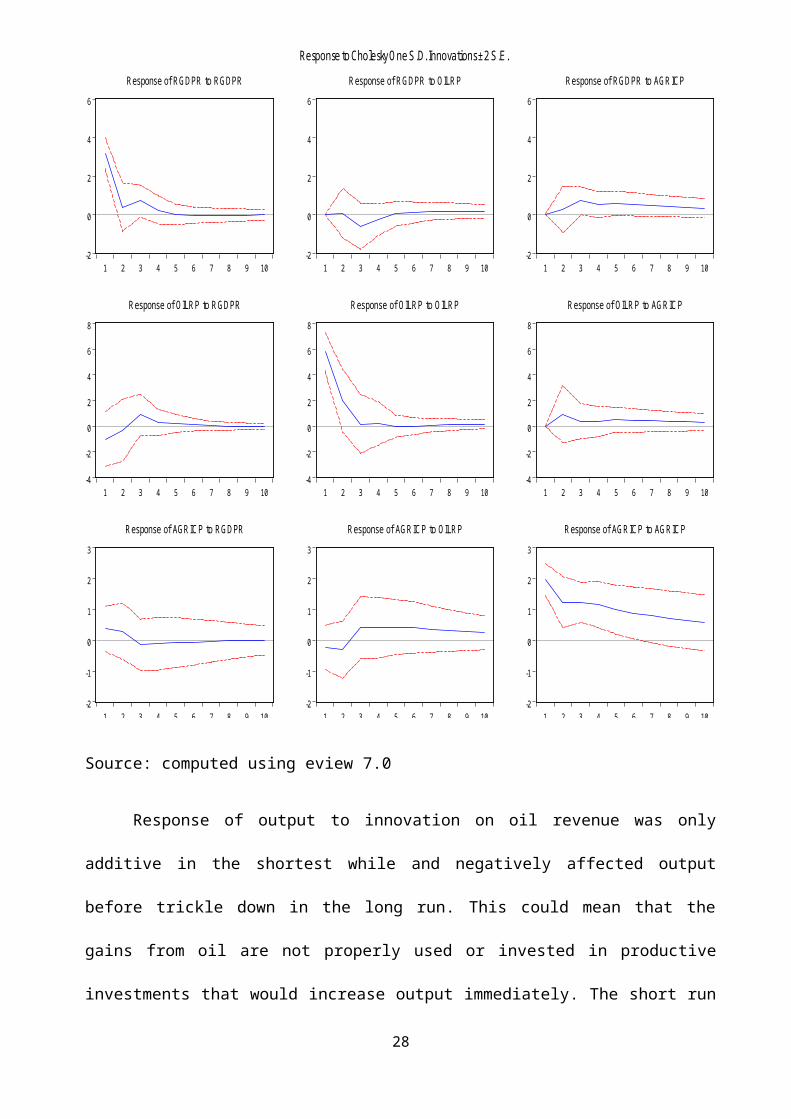
FIGURE 2: GRAPH OF IMPULSE RESPONSE OF VARIABLES
27
-2
0
2
4
6
1 2 3 4 5 6 7 8 9 10
Response of RG DPR to RG DPR
-2
0
2
4
6
1 2 3 4 5 6 7 8 9 10
R esponse of R G DPR to O ILR P
-2
0
2
4
6
1 2 3 4 5 6 7 8 9 10
Response of RGD PR to AGR ICP
-4
-2
0
2
4
6
8
1 2 3 4 5 6 7 8 9 10
Response of OILR P to R G D PR
-4
-2
0
2
4
6
8
1 2 3 4 5 6 7 8 9 10
R esponse of O ILR P to O ILR P
-4
-2
0
2
4
6
8
1 2 3 4 5 6 7 8 9 10
R esponse of O ILR P to AG R IC P
-2
-1
0
1
2
3
1 2 3 4 5 6 7 8 9 10
Response of AGR IC P to RG D PR
-2
-1
0
1
2
3
1 2 3 4 5 6 7 8 9 10
Response of AG R IC P to O ILR P
-2
-1
0
1
2
3
1 2 3 4 5 6 7 8 9 10
R esponse of AG R ICP to AG RIC P
Response to Cholesky O ne S.D. Innovations ± 2 S.E.
Source: computed using eview 7.0
Response of output to innovation on oil revenue was only
additive in the shortest while and negatively affected output
before trickle down in the long run. This could mean that the
gains from oil are not properly used or invested in productive
investments that would increase output immediately. The short run
28

negative shock on output may also be as a result that oil revenue
has reduced the motivation of regions and indeed Nigerians to
work hard and maximise her resources endowed other than oil. But
the response of output to AGRICP innovation exhibits positive
shock.
Besides what Ajayi (2009) said about agriculture employing
70 per cent of Nigerian population and generates 88 per cent of
nonoil earning, from the impulse response AGRICP has the tendency
of positively contributing to output both in the short run and
long run and any effort put into investing more in the
agricultural sector even from gains from the oil sector would
lead to sustainable development of the economy. Analysis of shock
to AGRICP as a result of innovation to OILRP showed a positive
shock which means that oil revenues can be a veritable source of
fund to boost agricultural development in the country where
majority of the population is employed. Also, it was interesting
to note that feedback of from the AGRICP positively impact on the
oil sector, which means a developing agricultural sector does not
exclude development of the oil sector. Further analysis from
figure 2 and table 5 showed that innovation to output has
positive shock on oil revenue. This may be as a result of how
29
increased output may attract foreign investors and assure their
investments.
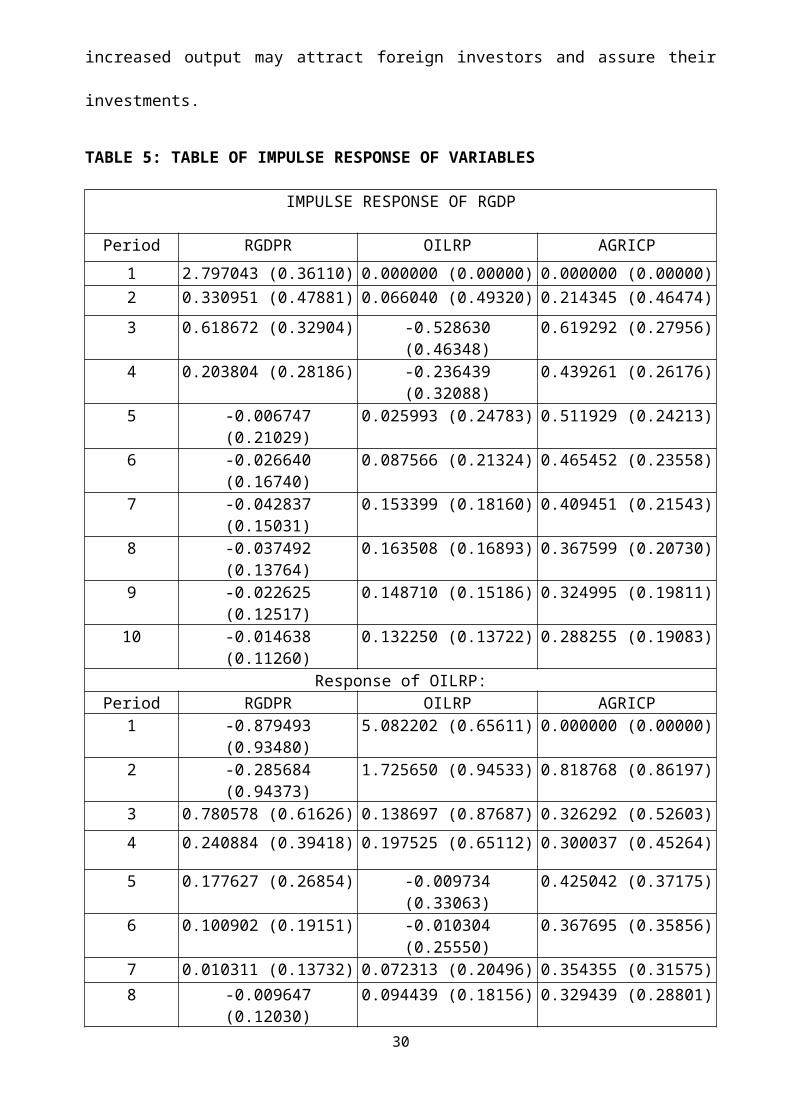
TABLE 5: TABLE OF IMPULSE RESPONSE OF VARIABLES
IMPULSE RESPONSE OF RGDP
Period RGDPR OILRP AGRICP1 2.797043 (0.36110) 0.000000 (0.00000) 0.000000 (0.00000)2 0.330951 (0.47881) 0.066040 (0.49320) 0.214345 (0.46474)3 0.618672 (0.32904) -0.528630
(0.46348)0.619292 (0.27956)
4 0.203804 (0.28186) -0.236439(0.32088)
0.439261 (0.26176)
5 -0.006747(0.21029)
0.025993 (0.24783) 0.511929 (0.24213)
6 -0.026640(0.16740)
0.087566 (0.21324) 0.465452 (0.23558)
7 -0.042837(0.15031)
0.153399 (0.18160) 0.409451 (0.21543)
8 -0.037492(0.13764)
0.163508 (0.16893) 0.367599 (0.20730)
9 -0.022625(0.12517)
0.148710 (0.15186) 0.324995 (0.19811)
10 -0.014638(0.11260)
0.132250 (0.13722) 0.288255 (0.19083)
Response of OILRP:Period RGDPR OILRP AGRICP
1 -0.879493(0.93480)
5.082202 (0.65611) 0.000000 (0.00000)
2 -0.285684(0.94373)
1.725650 (0.94533) 0.818768 (0.86197)
3 0.780578 (0.61626) 0.138697 (0.87687) 0.326292 (0.52603)4 0.240884 (0.39418) 0.197525 (0.65112) 0.300037 (0.45264)
5 0.177627 (0.26854) -0.009734(0.33063)
0.425042 (0.37175)
6 0.100902 (0.19151) -0.010304(0.25550)
0.367695 (0.35856)
7 0.010311 (0.13732) 0.072313 (0.20496) 0.354355 (0.31575)8 -0.009647
(0.12030)0.094439 (0.18156) 0.329439 (0.28801)
30

9 -0.015782(0.10507)
0.108769 (0.15400) 0.293447 (0.27181)
10 -0.016466(0.09478)
0.110650 (0.13638) 0.262996 (0.25707)
Response of AGRICP:Period RGDPR OILRP AGRICP
1 0.319575 (0.32005) -0.209563(0.31623)
1.725691 (0.22279)
2 0.249641 (0.36409) -0.276385(0.36958)
1.079224 (0.32458)
3 -0.129491(0.33303)
0.353731 (0.39517) 1.070847 (0.25713)
4 -0.104092(0.34034)
0.352037 (0.38872) 1.007377 (0.29356)
5 -0.064123(0.32095)
0.365290 (0.34915) 0.865697 (0.30877)
6 -0.060105(0.29447)
0.360900 (0.32826) 0.772670 (0.32656)
7 -0.033699(0.26724)
0.311462 (0.29421) 0.689946 (0.33862)
8 -0.021326(0.23865)
0.271782 (0.26505) 0.612947 (0.34667)
9 -0.016204(0.21111)
0.238388 (0.23885) 0.548803 (0.34996)
10 -0.012668(0.18730)
0.209131 (0.21627) 0.491621 (0.34926)
Ordering: RGDPR OILRP AGRICPSource: Generated from eview 7.o
From the variance decomposition result in table 6 showed
that output is more decomposed into AGRICP than OILRP both in the
short run and long run while AGRICP was more decomposed to output
in the short run, but OILRP in the long run. However, OILRP was
more decomposed to output followed by AGRICP in both short and
long run, only with a larger standard error. AGRICP was found to
be more decomposed to output in the short run but OILRP in the
31

long run. In summary, from figure 1 and 3 it showed that after
the Structural Adjustment Period (SAP), the Nigerian economy has
been on a positive trend
TABLE 6: TABLE OF VARIANCE DECOMPOSITION OF VARIABLES
Variance Decomposition of RGDPR:
Period S.E. RGDPR OILRP AGRICP 1 3.194448 100.0000 0.000000 0.000000 2 3.226915 99.36987 0.054631 0.575500 3 3.431759 92.10016 3.143327 4.756510 4 3.486508 89.67605 3.645243 6.678712 5 3.535323 87.21714 3.552323 9.230534
Variance Decomposition of OILRP: Period S.E. RGDPR OILRP AGRICP
1 5.890555 2.907674 97.09233 0.000000 2 6.289966 2.819198 94.97067 2.210134 3 6.365719 4.713743 92.78571 2.500543 4 6.384855 4.871186 92.35521 2.773608 5 6.406504 4.938589 91.73238 3.329032
Variance Decomposition of AGRICP: Period S.E. RGDPR OILRP AGRICP
1 2.018627 3.269094 1.405759 95.32515 2 2.403120 3.714270 2.717236 93.56849 3 2.730527 3.170292 4.293684 92.53602 4 2.992528 2.797280 5.379822 91.82290 5 3.179961 2.530281 6.485489 90.98423
Cholesky Ordering: RGDPR OILRP AGRICP
FIGURE 3: TREND OF NIGERIAN ECONOMIC GROWTH
1971197319751977197919811983198519871989199119931995199719992001200320052007200920112013
-30.0
-20.0
-10.0
0.0
10.0
20.0
30.0Growth Rate RGDP
32

Source: CBN Statistical Bulletin Various Issued
5. CONCLUSIONS AND RECOMMENDATIONS
The correlation test showed that all the three variables are
positively correlated and the unit root test shows that all the
variables are stationary at levels. However, agriculture was
found to be stationary at levels with trend.
Output is more decomposed into AGRICP than OILRP both in the
short run and long run while AGRICP was more decomposed to output
in the short run, but OILRP in the long run. OILRP on the other
hand was more decomposed to output followed by AGRICP in both
short and long run, only with a larger standard error.
Response of output to innovation on oil revenue was only
additive in the shortest while and negatively affected output
before trickled down in the long run. Gains from oil sector are
not properly used are short lived. Concentration on the illusive
gain from the oil sector has reduced the motivation of regions
and indeed Nigerians to work hard and maximise her resources
endowed other than oil.
Output response to AGRICP innovation exhibits positive shock
and shows tendency of positively contributing to output both in
the short run and long run and any effort put into investing more
33

in the agricultural sector even from gains from the oil sector
would lead to sustainable development of the economy.
Innovation to OILRP showed a positive shock to AGRICP which
means that oil revenues can be a veritable source of fund to
boost agricultural development in the country where majority of
the population is employed.
There is a positive feedback from the AGRICP on the oil sector,
which means a developing agricultural sector does not exclude
development of the oil sector.
Innovation to output has positive shock on oil revenue. This
means that increased output can attract foreign investors in the
economy.
REFERENCES
African Economic Outlook (2004): Nigeria-Africa Economic Outlook
by African Development Bank and Organisation for Economic
Co-operation and Development, 2004.
http://www.oecd.org/countries/nigeria/32430302.pdf (Accessed
on 01/07/2014).
Ajayi S. (2009): Impact of Climate Change and Food Security in
Nigeria, department of crop production and protection,
34

Obafemi Awolowo University, Ile-Ife, in Agric show seminar,
Tundun Wada, Karu LGA, Nasarawa State, Nigeria.
Azaiki and Shagari (2007): Oil, Gas and Life in Nigeria, Ibadan,
Y – Books, a Division of Associated Book–Makers Nigeria
Limited.
Baghebo, M. and Atima, T. O. (2013): The impact of petroleum on
economic growth in Nigeria. Global Business and Economics
Research Journal, 2(5): 102-115.
Bawa, S. and Mohammed, J. A. (2007): “Natural Resource Abundance
and Economic Growth in Nigeria”, Central Bank of Nigeria
Economic Review, 45, N0 3, September 2007, Nigeria, CBN
ISSN1957-2968.
Budina, N. and S. Van Wijnbergen (2008): Managing Oil Revenue
Volatility in Nigeria: The Role of Fiscal Policy. Africa at
a turning point: Growth, Aid and External Shocks: World
Bank.
Central Bank of Nigeria (2009): “Economic Report for the Fourth
Quarter of 2009” Volume 4, Issue 4, December 2009”: Abuja,
CBN Collier, P & A.
Central Bank of Nigeria, Annual Report and Statement of Accounts
(2011): GDP at current basic prices.
35

Eboh E.C. (2011): Agricultural Economy of Nigeria: Paradoxes and
Cross Roads of Multimodal Nature. 56th inaugural lecture of
the University of Nigeria, delivered on January 27, 2011.
Englama, A., Duke, O. O., Ogunleye, S., and Isma, F. U. (2010):
Oil Price and Exchange rate Volatility in Nigeria: An
Empirical observation.
International Food Policy Research Institute (2010): Policy
Benchmarking and Tracking the Agricultural Policy
Environment in Nigeria. Abuja: IFPRI.
National Bureau of Statistics (2012): Retrieved July 1, 2014,
from
http://www.nigerianstat.gov.ng/sectorstat/sectors/Agricultur
e.
National Planning Commission (2011): Annual Performance of the
Nigerian Economy 2010. Abuja: National Planning Commission.
Nwosa, P.I and Ogunlowore, A.J (2013): Has Oil Revenue Enhanced
Non-Oil Export in Nigeria? A Co-Integration Approach:
Journal of Economics and Development Studies, Vol. 1 No. 3,
December 2013.
Odularu, G.O (2007): Crude Oil and the Nigerian Economic
Performance. Oil and Gas Business: 2007. Available at
http://www.ogbus.ru/eng/
36
Ogbonna, G.N. and Appah, E. (2012): Petroleum income and Nigerian
economy: Empirical Evidence. Arabian Journal of Business and
Management Review (OMAN Chapter) Vol. 1, No.9; April 2012.
Oji-Okoro, I (2011): Analysis of the Contribution of Agricultural
Sector on the Nigerian Economic Development. World Review of
Business Research, Vol. 1, No. 1, March 2011. Pp. 191 - 200.
Olajide, O.T, Akinlabi, B. H and Tijani, A.A. (2012): Resource
and Economic Growth in Nigeria. European Scientific Journal
October edition vol. 8, No.26 ISSN: 1857 – 7881 (Print) e -
ISSN 1857- 7431.
Omorogiuwa O, Zivkovi J and Ademoh F (2014): The Role of
Agriculture in the Economic Development of Nigeria. European
Scientific Journal February 2014 edition vol.10, No.4 ISSN:
1857 – 7881 (Print) e - ISSN 1857- 7431.
Onyemaechi J. O. (2012): Economic Implications of Petroleum
Policies in Nigeria: An Overview.
Tombofa, S. S. (2004): Development economics: An introduction.
Port Harcourt: Pearl Publishers.
Ukeje, R.O. (2003). Macroeconomics: An Introduction. Port
Harcourt: Davidson Publication.
World Bank (2013): Nigeria Economic Report (No. 1): Washington,
DC, World Bank.
37

Yakub, M.U (2008): The Impact of Oil on Nigerian’s Economy: The
Boom and Burst Cycle. Central Bank of Nigeria, Abuja,
Nigeria.
38