Nexus between Oil Revenue, Non-oil Export and Industrial Output in Nigeria: An Application of the...
13
© 2013 Research Academy of Social Sciences http://www.rassweb.com 48 International Journal of Financial Economics Vol. 1, No. 2, 2013, 48-60 Nexus between Oil Revenue, Non-oil Export and Industrial Output in Nigeria: An Application of the VAR Model Hodo B. Riman 1 , Emmanuel S. Akpan 2 , Amenawo I. Offiong 3 , Cornelius M. Ojong 4 Abstract The study had set forth to explore the intertwining relationship that exist between oil revenue shock, non-oil export and industrial output in Nigeria. In achieving this objective the study utilized data spanning the period 1970-2010. This period captured the major era of regime shift (changes in governance) and policy administration in Nigeria. Vector Autoregressive (VAR) model and cointegration technique were used to examine the long run relationship, while the Vector Error Correction Model (VECM) was used to analyze the short-run behavior of the variables. The Johansen cointegration analysis suggests that a long run behavior exist between oil revenue shock, non-oil export, policy/regime shift and industrial output in Nigeria. The short-run result showed that the speed at which industrial output will converge towards long-run equilibrium after experiencing shock from oil revenue is very slow. It therefore would take a very slow process for industrial output to recover from shock arising from variation in oil revenue. The long run result shows that oil revenue shock and policy/regime shift had negative impact on industrial output and non-oil export. The impulse response function and variance decomposition analysis suggest that the major drivers of industrial development in Nigeria are non-oil export, regime shift and oil revenue. Thus innovations from these variables impact severely on industrial growth in Nigeria. The study therefore suggest among other things that the panacea to industrial growth in Nigeria rest on diversifying the economy away from crude oil export and ensuring a stable government in Nigeria that will endure long enough to sustain industrial and other economic policies. Key words: Structural Adjustment Programme, Industrial Production, Non-oil export, Economic growth, Co- integration, Oil revenue shock. 1. Introduction Nigeria has been adjudged the 6 th largest exporter of crude oil in the world with the USA as her biggest trading partner. Crude oil export accounts for the greatest revenue earner for the country. The dependency of the country on crude oil revenue is amplified by the usual budgetary estimate based on forecast from the expected crude oil prices. The Nigerian economy, like other oil exporting countries, is constantly exposed to oil price shocks since oil contributes over 90% of the total revenue. The dependency of the country on crude oil revenue is amplified by the usual budgetary estimate based on forecast from the expected crude oil prices. Shortfall on oil revenue occasioned by fluctuations in international oil prices had often led to deficit in the country‟s budget. Fluctuations in inter national crude oil prices have often exerted concurrent level of fluctuations in the revenue receipt from crude oil export. In such instances where there is a fluctuation in oil revenue, the country‟s Economic and Finance advisers have to resort to either external borrowings, domestic borrowings or adjustment in budgetary allocation to sectors in other to continue to steer the economic to the path of growth. Quite recently, the Coordinating Minister for the Economy and Minister of Finance, Prof Ngozi Okonjo-Iweala raise a critical concern on Nigeria‟s overdependence on crude oil and the dwindling fortune from oil revenue. She further painted a gloomy picture of the economy and hinted that there was an urgent need for “stringent budgetary measures” to arrest the downward slide; otherwise, the country might be heading for an economic crisis if the situation is quickly addressed. Her assertive comments prompted the country‟s National Assembly to caution her over her utterances which they claim was unguided. The truth of the matter is that the country is suddenly awakening to the reality that continued dependence on crude oil as the major revenue earner is hurting the economy. 1 Department of Banking and Finance University of Calabar, Nigeria 2 Department of Banking and Finance University of Calabar, Nigeria 3 Department of Banking and Finance University of Calabar, Nigeria 4 Department of Banking and Finance University of Calabar, Nigeria
-
Upload
independent -
Category
Documents
-
view
2 -
download
0
Transcript of Nexus between Oil Revenue, Non-oil Export and Industrial Output in Nigeria: An Application of the...
© 2013 Research Academy of Social Sciences
http://www.rassweb.com 48
International Journal of Financial Economics
Vol. 1, No. 2, 2013, 48-60
Nexus between Oil Revenue, Non-oil Export and Industrial Output in
Nigeria: An Application of the VAR Model
Hodo B. Riman1, Emmanuel S. Akpan
2, Amenawo I. Offiong
3, Cornelius M. Ojong
4
Abstract
The study had set forth to explore the intertwining relationship that exist between oil revenue shock, non-oil export
and industrial output in Nigeria. In achieving this objective the study utilized data spanning the period 1970-2010. This
period captured the major era of regime shift (changes in governance) and policy administration in Nigeria. Vector
Autoregressive (VAR) model and cointegration technique were used to examine the long run relationship, while the
Vector Error Correction Model (VECM) was used to analyze the short-run behavior of the variables. The Johansen
cointegration analysis suggests that a long run behavior exist between oil revenue shock, non-oil export, policy/regime
shift and industrial output in Nigeria. The short-run result showed that the speed at which industrial output will
converge towards long-run equilibrium after experiencing shock from oil revenue is very slow. It therefore would take a
very slow process for industrial output to recover from shock arising from variation in oil revenue. The long run result
shows that oil revenue shock and policy/regime shift had negative impact on industrial output and non-oil export. The
impulse response function and variance decomposition analysis suggest that the major drivers of industrial development
in Nigeria are non-oil export, regime shift and oil revenue. Thus innovations from these variables impact severely on
industrial growth in Nigeria. The study therefore suggest among other things that the panacea to industrial growth in
Nigeria rest on diversifying the economy away from crude oil export and ensuring a stable government in Nigeria that
will endure long enough to sustain industrial and other economic policies.
Key words: Structural Adjustment Programme, Industrial Production, Non-oil export, Economic growth, Co-
integration, Oil revenue shock.
1. Introduction
Nigeria has been adjudged the 6th
largest exporter of crude oil in the world with the USA as her biggest trading
partner. Crude oil export accounts for the greatest revenue earner for the country. The dependency of the country on
crude oil revenue is amplified by the usual budgetary estimate based on forecast from the expected crude oil prices. The
Nigerian economy, like other oil exporting countries, is constantly exposed to oil price shocks since oil contributes over
90% of the total revenue. The dependency of the country on crude oil revenue is amplified by the usual budgetary
estimate based on forecast from the expected crude oil prices. Shortfall on oil revenue occasioned by fluctuations in
international oil prices had often led to deficit in the country‟s budget. Fluctuations in international crude oil prices have
often exerted concurrent level of fluctuations in the revenue receipt from crude oil export. In such instances where there
is a fluctuation in oil revenue, the country‟s Economic and Finance advisers have to resort to either external borrowings,
domestic borrowings or adjustment in budgetary allocation to sectors in other to continue to steer the economic to the
path of growth.
Quite recently, the Coordinating Minister for the Economy and Minister of Finance, Prof Ngozi Okonjo-Iweala
raise a critical concern on Nigeria‟s overdependence on crude oil and the dwindling fortune from oil revenue. She
further painted a gloomy picture of the economy and hinted that there was an urgent need for “stringent budgetary
measures” to arrest the downward slide; otherwise, the country might be heading for an economic crisis if the situation
is quickly addressed. Her assertive comments prompted the country‟s National Assembly to caution her over her
utterances which they claim was unguided. The truth of the matter is that the country is suddenly awakening to the
reality that continued dependence on crude oil as the major revenue earner is hurting the economy.
1 Department of Banking and Finance University of Calabar, Nigeria
2 Department of Banking and Finance University of Calabar, Nigeria
3 Department of Banking and Finance University of Calabar, Nigeria
4 Department of Banking and Finance University of Calabar, Nigeria
International Journal of Financial Economics
49
But what was the situation before now? As at 1970, non-oil export was the dominant revenue earner for the
country. Non-oil export accounted for over 74 percent of total revenue earned by the country while oil revenue
accounted for a paltry 26 percent, (see table 1 at the appendix). Within the same year the total output of major
agricultural commodities was at 6,461,000 tons while index of industrial production was 41.3. By 1985, the contribution
of oil revenue to total revenue earned by the country increased to 73 percent while the contribution of non-oil export
revenue to total revenue dropped to 23 percent. This situation which then called for urgent attention ushered in the
adoption of the Structural Adjustment Programme (SAP), which was seen as a remedy to the poor performance of the
agricultural and industrial sector. SAP was aimed at promoting and re-engineering the growth of non-oil exports.
Policies were formulated that will revive the ailing industries and increased agricultural out in the country.
Given the need to revamp the economy and evade the impending doom for the industrial sector, various
governments at different times introduced industrial policies that would correct the imbalances in the sectorial allocation
of funds to industrial and agricultural sectors (otherwise, termed as priority sectors). The first national development plan
that was launched in 1962 (post-independence) had the motive to diversify the economy and give more credence to the
agricultural sector. This was to be achieved through increasing investment rate to 15 per cent, promote rapid
development in education and health sector. However, this lofty policy was truncated by the civil war. The second
development plan that was launched soon after the war was geared towards restoring the productive capacity,
achievement of self-reliance and generation of employment. The fulcrum that was to drive this policy was the
indigenization policy of 1972. While implementing this policy, the quantum leap in export revenue gained from rising
crude oil export relegated the indigenization policy to the background. The poor implementation of the third
development plan resulted to the initiation of import substitution industrialization (ISI) strategy packaged in the SAP
policy of the fourth development plan which began in 1986.
However, despite all the policies so far introduced to improve industrial performance in Nigeria, the country‟s
GDP was still observed to be on the downward trend. It is however sad to observe that the contribution of industrial
production to GDP rather than improve fell from 45.83 percent in 1995 to 41.53 percent in 2005. The contribution of
manufacturing sub-sector and non-oil export also reduced from 7.44 and 1.14 percent in 1995 to 2.89 and 0.7 percent in
2005 respectively. Oil revenue still continued to account for the sum of total revenue. for instance, as at oil revenue
accounted for a record high of 89 percent while non-oil export revenue accounted for 11 percent of the country‟s total
revenue. Adejugbe (1980) in a reaction to the poor performance of the industrial sector stated that Nigeria industrial
policies, objectives, and strategies were often subject to modifications, neglect or even total abandonment. He further
attributed the Nigeria‟s poor industrial programs to frequent muddling of policies by incumbent government and abrupt
modifications and interruptions of existing and ongoing industrial programs and strategies established by previous
government. Each government that comes into office will recklessly abandon existing programs and begin a new
program, thus truncating the growth process. . Thus, such situation can never promote an unequivocal growth in the
country‟s GDP
Furthermore, some researchers have blamed the dwindling performance of the industrial sector viz-a-viz non-oil
exports to the huge attention accorded to the crude oil export which thus serves as the major revenue earner to the
nation. How does the crude oil pricing affect industrial production? According to Schneider (2005) in the wake of oil
price increase supply suffers as production costs rise. Given substitution between production factors, relative price
changes result in a reallocation of the means of production. However, these intersectoral reallocations also generate
costs (training expenses, irreversible investments, etc.) Thus, the actual impact on investment essentially depends on the
expectations about the stability of oil price changes, which tend to vary over time. On the demand side, oil price shocks
drive up the general level of prices, which translates into lower real disposable incomes and thus reduces demand. Aliyu
(2009) had opined that consumption and investment is said to be affected due changes in the demand side. Consumption
is affected indirectly through its positive relationship with disposable income while investment is adversely affected
indirectly because such increase in oil price also affects firms‟ input prices and thereby increasing their costs
Questions are rift as to why the industrial sector in Nigeria has not responded correspondingly to the numerous
policies and funding so far expended on the sector. Does the industrial sector in Nigeria drive the country‟s GDP? Does
policy shift and governance affect the level of industrial production in Nigeria (particularly, since different
administration pursue different industrial policy regimes in Nigeria)? And finally, what would be the future effect of
the current trend in industrial production hold for the country if the dismal trend is unabated? These are the questions
this research work seeks to address.
This study is an extension of a previous paper on Industrial Production and Non-oil Export; Assessing the Long-
run Implication on Economic Growth in Nigeria (Riman, Akpan, Duke and Mboto; 2012) wherein the paper introduces
a new insight and understanding into the problem of industrial production in Nigeria by first, studying the impact of the
H. B. Riman et al
50
variable using an extended time period to 2012, secondly, by introducing governance variable into the model to capture
the effect of regime shift on industrial production, and thirdly, by using the VAR methodology to study the long-run
effect of oil revenue shock on non-oil export and industrial output in Nigeria
2. Literature Review
Industrialization is the period of social and economic change that transforms a human group from an agrarian
society into an industrial one. It is a part of a wider modernisation process, where social change and economic
development are closely related with technological innovation, particularly with the development of large-scale energy
and metallurgy production. It is the extensive organisation of an economy for the purpose of manufacturing.
Industrialization has come to be seen as the necessary route to the economic and social development of any nation.
A country‟s wealth, development and advancement is normally judged by its level of industrialization. The industrial
sector in Nigeria had continued to witness retarded growth since after the introduction of the Structural Adjustment
Programme (SAP) introduced in 1986.
Unimpressively, the highest contribution of industrial sector to the nations GDP was noticed in 1995. Within that
year the sectors contribution to GDP stood at 45.83 percent, while manufacturing sub-sector and non-oil export
contribution to GDP was 7.44 and 1.14 percent respectively. Ikeze, Soludo and Elekwa (2001) observed that
industrialization in Nigeria ascended during the oil boom era (1973-81, with manufacturing share of GDP reaching 11
percent) this performance was not however sustained as the sector experienced abrupt decline to five percent in 2000.
The industrial sector had failed to record appreciable improvement after then.
What could have been responsible for this dismal performance noticed in the industrial sector in Nigeria? In an
attempt to answer this question, Adejugbe (1980) responded that Nigeria industrial policies, objectives, and strategies
are often subject to modifications, neglect or even total abandonment. He further opined that industrial policies and
practice in Nigeria are pursued on ad-hoc basis and in a most uncoordinated manner. This according to Adejugbe partly
explains the reason for the concentration of Nigeria‟s few industries in major cities like Lagos, Kano, Ibadan, and Port
Harcourt.
The poor performance of the sector had also been attributed by other researchers to poor electricity supply
situation in the country. Adeniran ( 2005 ) and Onyeonoru (2003) in their research observed a unidirectional causality
that runs from GDP to Electricity consumption in Nigeria. In their separate work, they both observed that electricity
production in Nigeria was sub-optimal and below the installed capacity utilization. They concluded their research by
adding that sufficient electricity production was necessary for increasing industrial production in Nigeria.
Enang (2010) investigated the joint interaction between industrialization, electricity supply and economic growth
in Nigeria within the framework of auto-regressive distributed lag (ARDL) bounds proposed by Presaran et al (2001).
The paper found a feedback causality between GDP and Electricity supply. However, only a unidirectional relationship
was observed between capital employed and GDP. The research finally confirmed that electricity supply, technology
and capital employed were necessary for industrial and GDP growth in Nigeria.
Ajayi (2007) in describing the industrial trend in Nigeria observed that there is no significant relationship between
the volume of production subcontracting and the size and structural characteristics of contracting firms. He observed
that industrial production subcontractors were concentrated in Lagos, Ikorodu, Sagamu and Ibadan in the Southwest;
Jos, Kaduna, Zaria, Kano, and Sokoto in the north; and a few other locations such as Benin, Owerri, Port-Harcourt (in
the south) and Ilorin (middle belt). According to Ajayi, this spatial disparity in the distribution of manufacturing
activities has often explained the reason for the dismal performance of the sector. He thus emphasize the need for the
valorization of raw agricultural products or the treatment of raw materials for export, or through the principle of import
substitution adopted by the Nigerian governments as their industrial planning strategy.
Alao (2010), using an error correction model observed that manufacturing sub-sector has been hindered by high
interest rates, particularly the interest rate spread (IRS) which is the difference between lending and borrowing rates. It
is also alleged that this rate is partly responsible for high cost of production in the Nigerian manufacturing sub-sector
Adebiyi (2001), Adebiyi and Babatope-Obasa, 2004), and Babawale et al (1996)
Chimobi (2010) while estimating the relationship between Economic growth, Investment and Export in Nigeria
observed that industrial production has the ability to increase investment which ultimately will lead to the production of
more good, which eventually will yield growth in the domestic economy. Investment will lead to enhanced development
in projects such as electricity supply, good road network, good medical care and host of other projects.
International Journal of Financial Economics
51
Despite the problems burdening the industrial sector in Nigeria, its contribution to GDP cannot be over
emphasized. The industrial sector has been described as the engine that drives the economy of any nation. Diaz-Bautista
(2003) empirical results indicate that industrial sector and overall economy are co-integrated and have a long run
relationship in Mexico. The Granger causality test shows evidence that there exists a two way causal relationship
between industrial growth and GNP thus supporting the findings that industrial output causes the overall economic
growth for Mexico during the period under consideration.
Some researchers have also opined that the quality and level of governance also determine the extent a country
achieves industrialization. Governance is generally understood as a broad process affecting the collective decision-
making roles and procedures, management and authority relationships of social and economic agents involving multiple
jurisdictions and domains. Governance is about governing and therefore cannot be isolated from political responsibility
in all areas in which delegated authority makes decisions.
What actually would be the effect of governance on industrial production viz-a-viz economic growth? Kilvits and
Purju (2008) observed that governance is a very important factor in determining the value of human and social capital.
As a matter of fact, the level and systems of governance in place strongly determines the achievement of economic
growth of any nation. Two systems of governance had been identified in literature, democratic governance and the
military system of governance. Each of these systems of governance impact on the economy in different ways,
particularly, as they relate to policies formulation. For instance, Jensen (2009) attempted to explore the effect of
democratic governance on the inflow of Foreign Direct Investment. His result suggest that democratic political
institutions are associated with higher levels of FDI inflows since it attracts as much as 70 percent more FDI as a
percentage of GDP than their authoritarian counterpart. This result also collaborates the result obtained by Kilvits and
Purju (2010) who both observed that democratic governance has been associated with improved and effective industrial
policies, innovation policy, FDI, labour relations and support to local companies to improve in their value chain. As
noted by Kilvits and Purju, Multinational corporations create spillover effects between private enterprises located within
or outside the national borders. Alongside the transfer of technology inside large trans-national enterprises (TNE),
Coeurderoy and Murray (2005) have demonstrated that countries whose system of governance encourage internalization
and globalization of entrepreneurship would benefit from increasing trade, capital mobility and wide spread diffusion of
technology transfer.
While exploring the effect of Military expenditure on domestic economies, Looney (20010 noted that rent seeking
behavior of communities adversely affect industrial growth. Comparing the nature of growth in the midst of rent
seeking attitude, the author observed that military regimes create an environment where military expenditure tend to
have positive overall impact on economic growth, while civilian regimes having less control over rent seeking groups
do not appear to be able to combine rent seeking activities and military expenditures in a manner conducive to overall
economic growth.
On the causal effect of oil revenue on industrial production Ojapinwa and Ejumedia (2010) using the VAR
impulse response function analysis concluded that reacted significantly to oil price, inflation and exchange rate.
However, industrial output did not react significantly to changes in money supply. Furthermore, Aworawo (2011) also
opined that the problem of irregular power supply has been compounded by the acute shortage of refined product which
has become major feature in Nigeria‟s energy sector since 1993. The consequence is that it has become increasingly
difficult to secure petroleum products to run generating set when there is power outage from government power source.
Even when the petroleum product is available, the cost has been so high that owners of industry. All these has left the
industrialist more confused.
KomainJiranyakul (2006) further asserted that a rise in oil price affected supply of the petroleum product,
(especially for oil import dependent countries) and hence makes it more costly for firms to produce goods since energy
and capital are complemented, which implies that firms that uses more of refined petroleum product experience higher
cost of running their machines except they purchase new energy-efficient machines. The profit of firms stuck with less
fuel-efficient machines suffers, and they may alternatively invest in labour intensive method of production, which of
course has a backwards production effect on the firms.
Rodriguez (2007) analysed the response of manufacturing industries to oil price shock in four EMU countries
namely, France, Germany, Italy and Spain, the US and the UK the latter being oil importing countries. The result
indicated that oil price lowers the level of aggregate manufacturing output in all countries under study, although the
responses differ between and amongst countries.
What could possibly be the long run effect of export earnings on industrial growth? Uddin and Norman (2002)
using the Granger causality tests to find the direction of causality between exports and industrial production index in
H. B. Riman et al
52
Bangladesh observed that there exists bi-directional causality between exports and industrial activities in Bangladesh.
Thus, the authors summarized that a viable industrial sector was necessary to drive Bangladesh external trade. Mamun
and Nath (2005) had showed that though industrial production and export were co-integrated at the long run, there exists
a uni-directional causality running from export to economic growth in Bangladesh. Kemal et al (2002) also found a
positive association between export growth, industrial production and economic growth for India as well as other South
Asian economies.
Ferda (2007) estimated a multivariate causality analysis of export and growth in turkey. Empirical evidence from
the bounds co-integration test indicated that there existed only one long-run relationship between the variables in which
real industrial production index is the dependent variable. Augmented Granger causality tests suggested that changes in
real exports and terms of trade through the error correction term precede changes in real industrial index in the long-run.
In the short-run, there is a uni-lateral causation running from changes in real exports to real industrial production index.
3. Methodology
The study uses annual data for 1970-2010 obtained from the Central Bank of Nigeria Statistical bulletin. The study
applied the Vector Autoregresion (VAR) model developed by Klien (2010) although with some modifications to include
some endogenous variables such as industrial output, policy or regime shift and national income. According to Klien
(2010) the advantage of the VAR approach is that it does not require any a priori assumtions on the direction of the
feedback between variables in the model. This study therefore adopts the VAR specification adopted by Klien (2010).
OILP
N NOEXP
YIt = Γ0 + ∑Γt Yt-1 +εit where YIt = INDP
GDP
DUM
Where Yit is a vector of the four endogenous variables (NOEXP, INDP, OILP, GDP, DUM). The variable INDP is
the index of industrial production, OILP represent revenue receipt from oil export, GDP represent National income,
NOEXP represent Non-oil exports, and DUM represent the variable for regime shift which takes the value of 0 for the
era of military regime and 1 for the era of democratic regime. The variables of OILP and NOEXP appear as a ration of
percentages of GDP. The framework of this study will allows for the application of the impulse response function and
variance decomposition. Impulse response function traces the direct effects from oil to non-oil sectors and also
identifies the indirect effects that work through industrial production.
Impulse response further describes the reaction of one variable in the system to innovations in another variable in
the system while holding all other shocks at zero. The shocks in the VAR were orthogonized using the Cholesky
decomposition, which implies that variables appearing earlier in the ordering are considered more exogenous, while the
variables appearing later in the ordering are considered more endogenous. The specification holds that oil revenue is the
most exogenous variable since oil prices are determined in the global market following the forces of demand and
supply. Industrial production, non-oil export and regime shift are endogenously determined. The assumption in this
study is that the industrial sector reacts spontaneously to changes in revenue receipt from the government, and the
reaction of the industrial sector has a positive or negative effect on non-oil exports depending on the variability of oil
revenue receipt.
The analysis in this study will begin from testing of the stationarity of variables in order to avoid spurious
regression estimates. This will be conducted using the Augmented Dickey Fuller and Kwaiatkowski-Phillips tests. Next,
the resulting order of integration necessitated applying the Johansen cointegration technique to ascertain the existence of
a long-run relationship among the variables.
To check whether the assumptions of our VAR model are met, it is necessary to carefully choose the lag length in
the model. The lag length is selected based on the AIC (Akaike‟s Information Criterion). According to Enders (2003),
the model will be misspecified when lag length is too small. The more lags, the more parameters we need to estimate
and the less biased our results would be. The model will be over-parameterized if the number of lags is too large.
Selecting the lag order is simply to understand that we find p such that Ai =0 for all i > p in the VAR model.
International Journal of Financial Economics
53
To test the long-run cointegration of four time series, the study will implement the Johansen cointegration test.
Consider the following equation.
The number of cointegration vectors (r) is determined by the maximum eigenvalue test (Enders,
2003) and the trace test (Enders, 2003). Both tests are based on the likelihood ratio test. When λ trace and λmax
conflict, we should choose the number of the cointegration vector based on λmax , because “the λmax test has the
sharper alternative hypothesis.
4. Empirical Result
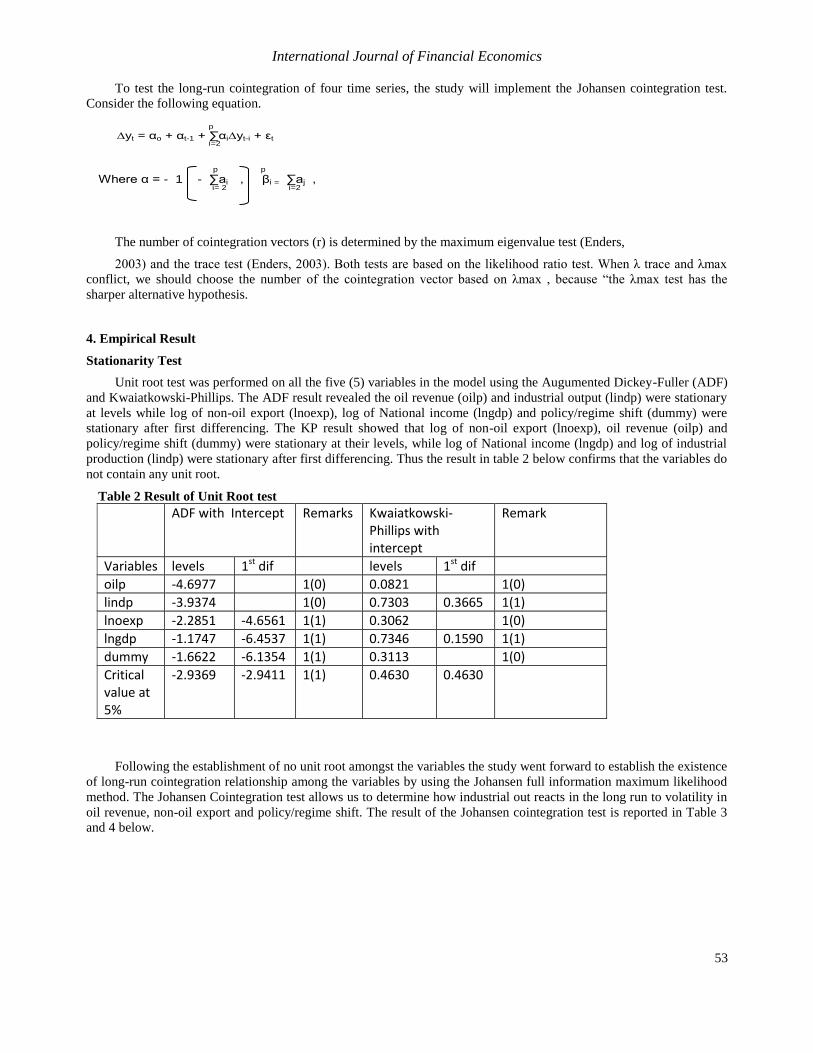
Stationarity Test
Unit root test was performed on all the five (5) variables in the model using the Augumented Dickey-Fuller (ADF)
and Kwaiatkowski-Phillips. The ADF result revealed the oil revenue (oilp) and industrial output (lindp) were stationary
at levels while log of non-oil export (lnoexp), log of National income (lngdp) and policy/regime shift (dummy) were
stationary after first differencing. The KP result showed that log of non-oil export (lnoexp), oil revenue (oilp) and
policy/regime shift (dummy) were stationary at their levels, while log of National income (lngdp) and log of industrial
production (lindp) were stationary after first differencing. Thus the result in table 2 below confirms that the variables do
not contain any unit root.
Table 2 Result of Unit Root test
Following the establishment of no unit root amongst the variables the study went forward to establish the existence
of long-run cointegration relationship among the variables by using the Johansen full information maximum likelihood
method. The Johansen Cointegration test allows us to determine how industrial out reacts in the long run to volatility in
oil revenue, non-oil export and policy/regime shift. The result of the Johansen cointegration test is reported in Table 3
and 4 below.
p
∆yt = αo + αt-1 + ∑αi∆yt-i + εt
i=2
p p
Where α = - 1 - ∑ai , βi = ∑aj ,
i= 2
i=2
ADF with Intercept Remarks Kwaiatkowski-Phillips with intercept
Remark
Variables levels 1st dif levels 1st dif
oilp -4.6977 1(0) 0.0821 1(0)
lindp -3.9374 1(0) 0.7303 0.3665 1(1)
lnoexp -2.2851 -4.6561 1(1) 0.3062 1(0)
lngdp -1.1747 -6.4537 1(1) 0.7346 0.1590 1(1)
dummy -1.6622 -6.1354 1(1) 0.3113 1(0)
Critical value at 5%
-2.9369 -2.9411 1(1) 0.4630 0.4630
H. B. Riman et al
54
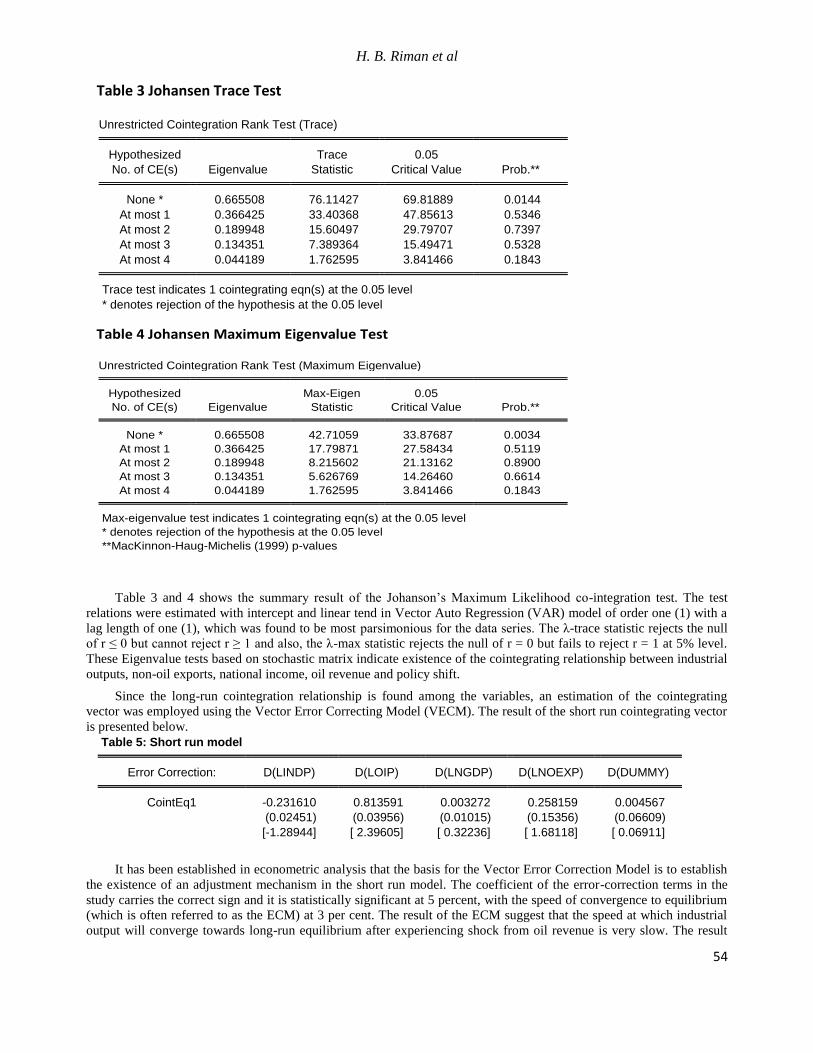
Table 3 and 4 shows the summary result of the Johanson‟s Maximum Likelihood co-integration test. The test
relations were estimated with intercept and linear tend in Vector Auto Regression (VAR) model of order one (1) with a
lag length of one (1), which was found to be most parsimonious for the data series. The λ-trace statistic rejects the null
of r ≤ 0 but cannot reject r ≥ 1 and also, the λ-max statistic rejects the null of r = 0 but fails to reject r = 1 at 5% level.
These Eigenvalue tests based on stochastic matrix indicate existence of the cointegrating relationship between industrial
outputs, non-oil exports, national income, oil revenue and policy shift.
Since the long-run cointegration relationship is found among the variables, an estimation of the cointegrating
vector was employed using the Vector Error Correcting Model (VECM). The result of the short run cointegrating vector
is presented below.
It has been established in econometric analysis that the basis for the Vector Error Correction Model is to establish
the existence of an adjustment mechanism in the short run model. The coefficient of the error-correction terms in the
study carries the correct sign and it is statistically significant at 5 percent, with the speed of convergence to equilibrium
(which is often referred to as the ECM) at 3 per cent. The result of the ECM suggest that the speed at which industrial
output will converge towards long-run equilibrium after experiencing shock from oil revenue is very slow. The result
Table 3 Johansen Trace Test
Unrestricted Cointegration Rank Test (Trace) Hypothesized Trace 0.05
No. of CE(s) Eigenvalue Statistic Critical Value Prob.** None * 0.665508 76.11427 69.81889 0.0144
At most 1 0.366425 33.40368 47.85613 0.5346
At most 2 0.189948 15.60497 29.79707 0.7397
At most 3 0.134351 7.389364 15.49471 0.5328
At most 4 0.044189 1.762595 3.841466 0.1843 Trace test indicates 1 cointegrating eqn(s) at the 0.05 level
* denotes rejection of the hypothesis at the 0.05 level
Table 4 Johansen Maximum Eigenvalue Test
Unrestricted Cointegration Rank Test (Maximum Eigenvalue) Hypothesized Max-Eigen 0.05
No. of CE(s) Eigenvalue Statistic Critical Value Prob.** None * 0.665508 42.71059 33.87687 0.0034
At most 1 0.366425 17.79871 27.58434 0.5119
At most 2 0.189948 8.215602 21.13162 0.8900
At most 3 0.134351 5.626769 14.26460 0.6614
At most 4 0.044189 1.762595 3.841466 0.1843 Max-eigenvalue test indicates 1 cointegrating eqn(s) at the 0.05 level
* denotes rejection of the hypothesis at the 0.05 level
**MacKinnon-Haug-Michelis (1999) p-values
Table 5: Short run model Error Correction: D(LINDP) D(LOIP) D(LNGDP) D(LNOEXP) D(DUMMY) CointEq1 -0.231610 0.813591 0.003272 0.258159 0.004567
(0.02451) (0.03956) (0.01015) (0.15356) (0.06609)
[-1.28944] [ 2.39605] [ 0.32236] [ 1.68118] [ 0.06911]
International Journal of Financial Economics
55
put a very strong point on the impact of oil revenue shock on industrial production, especially in the short run. The
result signifies that it takes a very slow process for industrial output to recover from shock arising from variation in oil
revenue. The result further showed that oil revenue, national income, non-oil export and policy/regime shift reacted
positively to industrial output at the short run.
The long run model presented below in table 6 reveal that industrial output reacted negatively to shock from oil
revenue, non-oil export and policy/regime shift.
Table 6 Long-run model
: D(LINDP) D(LOIP) D(LNGDP) D(LNOEXP) D(DUMMY)
1.000000 -0.606755 1.687984 -1.332090 -0.517254
(0.16718) (1.29009) (0.37347) (0.29405)
[-3.62944] [ 1.30842] [-3.56683] [-1.75906]
In the long run shows that the coefficient of oil revenue has negative relationship with industrial output and is
statistically significant at 5 percent. The result shows that a 10 percent variation in oil revenue will reduce industrial
output by 61 percent. The coefficient of policy/regime shift is also observed to be negative and also significant at 5
percent. A change in governance though has a positive impact on industrial output in the short run; however, this
positive impact is always short lived as in the long run while industrialist are grappling with adjusting to policy changes,
further changes in governance results to a negative effect on industrial output. It therefore becomes necessary to have a
stable government that will have sufficient time horizon to pursue and see to the completion/accomplishment of policies
relating to industrial development in Nigeria. Most worrisome in the result above is the long run negative impact of
non-oil exports on industrial output. The possible explanation for this could be that the negative effect of shock to oil
revenue and policy/regime shift on industrial output has a collaborating effect on non-oil output.
Figure 1: CUSUM Test
Figure 2: CUSUMSQ Test
-20
-15
-10
-5
0
5
10
15
20
80 82 84 86 88 90 92 94 96 98 00 02 04 06 08 10
CUSUM 5% Significance
-0.4
-0.2
0.0
0.2
0.4
0.6
0.8
1.0
1.2
1.4
80 82 84 86 88 90 92 94 96 98 00 02 04 06 08 10
CUSUM of Squares 5% Significance
H. B. Riman et al
56
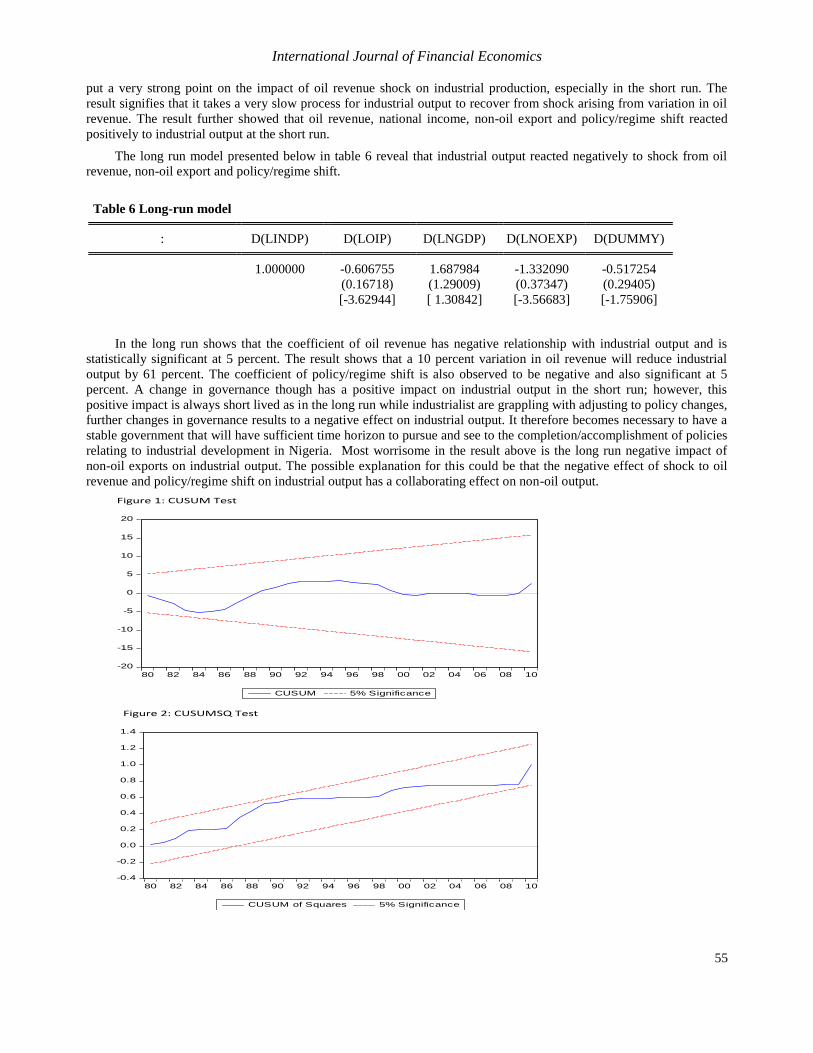
Parameter Stability Test
We can observe in the long run result presented in table 6 that the log of GDP and log of Non-oil export were in
excess of 1, it is therefore becomes necessary to conduct parameter stability test to ensure that the estimated parameter
are not varying over time. As noted by Fowowe (2010) and Hansen (1992) an unstable parameter can result in a
misspecification of the model and could lead to biased results. The study utilizes the cumulative sum (CUSUM) and the
cumulative sum of squares (CUSUMSQ) test to confirm the parameter stability test. Figure 1 and 2 below present the
result of the CUSUM and CUSUMSQ the model specification and parameter consistency test. The pair of the straight
line in each figure indicates the 5 percent significance level. The null hypothesis of correct specification and parameter
consistency can be accepted if the plotted CUSUM and CUSUMSQ lie inside the straight lines. However, if the CUSUS
and CUSUMSQ lies outside the plotted lines, then the null hypothesis will be rejected and it will be concluded that the
parameters in the model are not correctly specified.
It can be observed from figure 1 and figure 2 that the CUSUM and CUSUMSQ plotted both lie within the straight
lines at 5 percent level of significance. It can therefore be concluded that our equations are correctly specified and the
parameters are stable in the model.
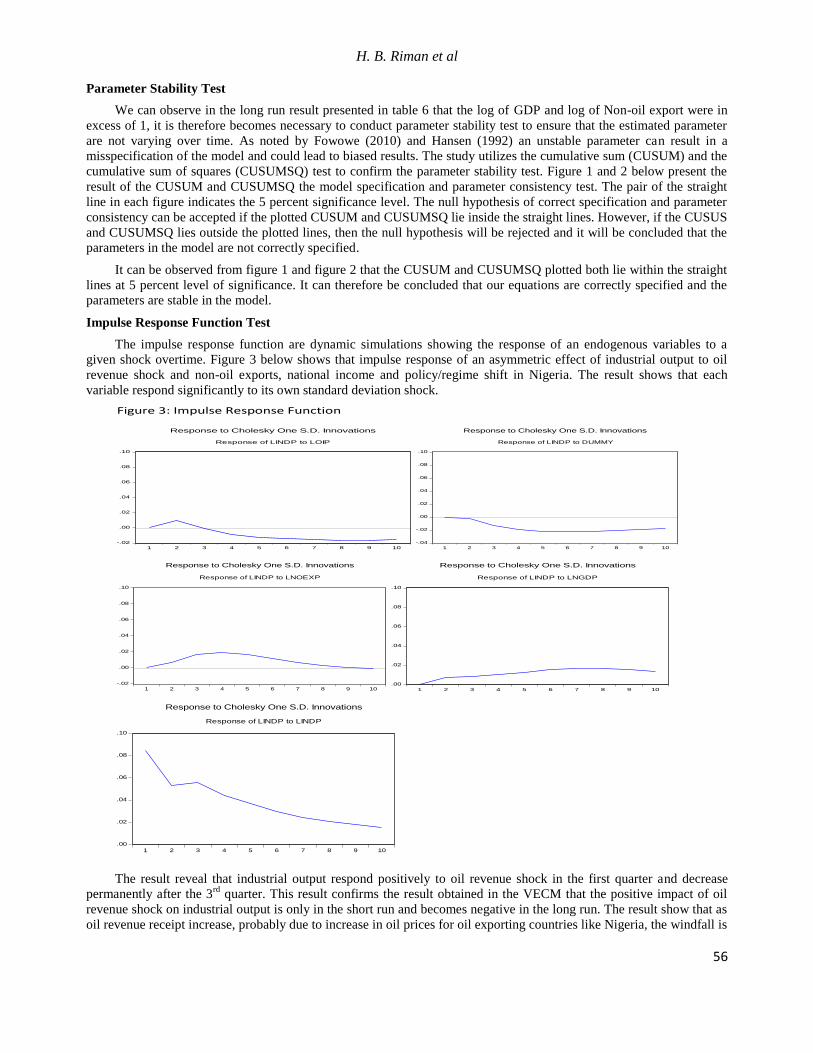
Impulse Response Function Test
The impulse response function are dynamic simulations showing the response of an endogenous variables to a
given shock overtime. Figure 3 below shows that impulse response of an asymmetric effect of industrial output to oil
revenue shock and non-oil exports, national income and policy/regime shift in Nigeria. The result shows that each
variable respond significantly to its own standard deviation shock.
The result reveal that industrial output respond positively to oil revenue shock in the first quarter and decrease
permanently after the 3rd
quarter. This result confirms the result obtained in the VECM that the positive impact of oil
revenue shock on industrial output is only in the short run and becomes negative in the long run. The result show that as
oil revenue receipt increase, probably due to increase in oil prices for oil exporting countries like Nigeria, the windfall is
Figure 3: Impulse Response Function
-.02
.00
.02
.04
.06
.08
.10
1 2 3 4 5 6 7 8 9 10
Response of LINDP to LOIP
Response to Cholesky One S.D. Innovations
-.04
-.02
.00
.02
.04
.06
.08
.10
1 2 3 4 5 6 7 8 9 10
Response of LINDP to DUMMY
Response to Cholesky One S.D. Innovations
-.02
.00
.02
.04
.06
.08
.10
1 2 3 4 5 6 7 8 9 10
Response of LINDP to LNOEXP
Response to Cholesky One S.D. Innovations
.00
.02
.04
.06
.08
.10
1 2 3 4 5 6 7 8 9 10
Response of LINDP to LNGDP
Response to Cholesky One S.D. Innovations
.00
.02
.04
.06
.08
.10
1 2 3 4 5 6 7 8 9 10
Response of LINDP to LINDP
Response to Cholesky One S.D. Innovations
International Journal of Financial Economics
57
used to the benefit of industries. However, when such windfalls are short lived, government attention is driven away
from the industrial sector to other sectors of the economy, thus leading to the crisis experienced in the industrial sectors.
The response of industrial output to policy shift is uncertain in the 1st quarter. However, the response becomes negative
permanently after the 2nd
quarter. The result above reveals that Industrial output response positively to non-oil export
after the 1st quarter. This positive response peaked at the 4
th quarter and then decreases and further flattened out after the
8th
quarter. The result confirms economic theory that industrial out should, under normal circumstances, increase as
non-oil exports increases.
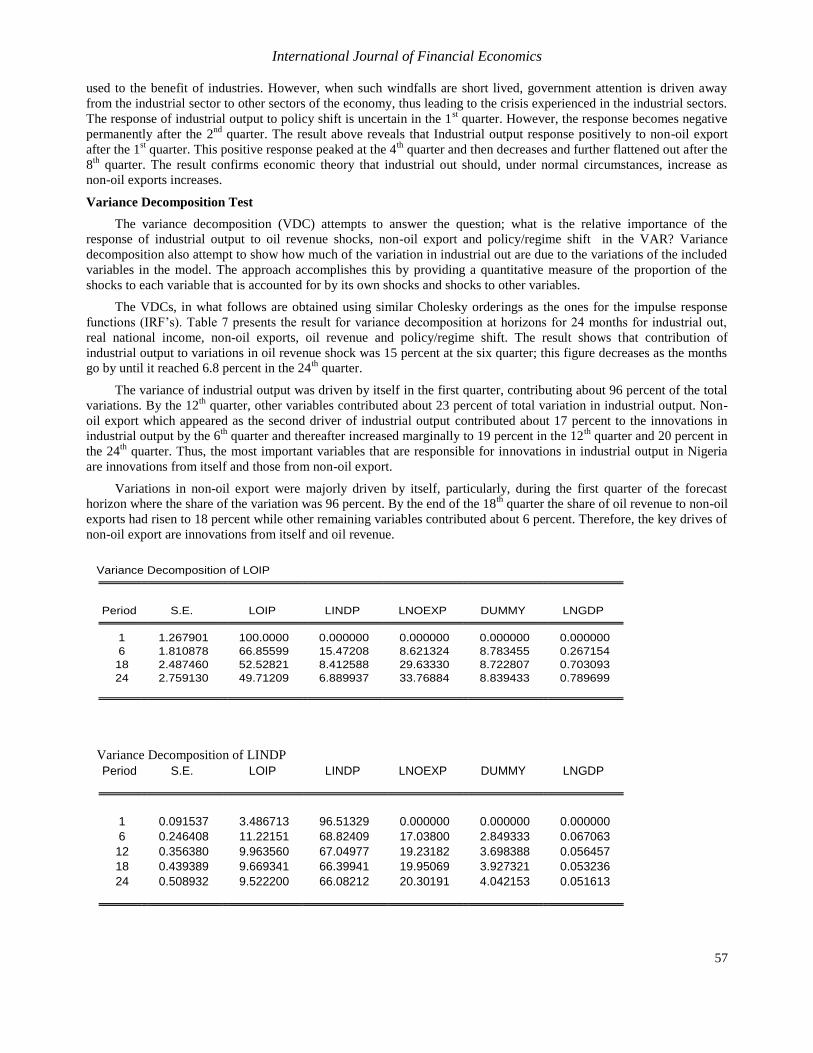
Variance Decomposition Test
The variance decomposition (VDC) attempts to answer the question; what is the relative importance of the
response of industrial output to oil revenue shocks, non-oil export and policy/regime shift in the VAR? Variance
decomposition also attempt to show how much of the variation in industrial out are due to the variations of the included
variables in the model. The approach accomplishes this by providing a quantitative measure of the proportion of the
shocks to each variable that is accounted for by its own shocks and shocks to other variables.
The VDCs, in what follows are obtained using similar Cholesky orderings as the ones for the impulse response
functions (IRF‟s). Table 7 presents the result for variance decomposition at horizons for 24 months for industrial out,
real national income, non-oil exports, oil revenue and policy/regime shift. The result shows that contribution of
industrial output to variations in oil revenue shock was 15 percent at the six quarter; this figure decreases as the months
go by until it reached 6.8 percent in the 24th
quarter.
The variance of industrial output was driven by itself in the first quarter, contributing about 96 percent of the total
variations. By the 12th
quarter, other variables contributed about 23 percent of total variation in industrial output. Non-
oil export which appeared as the second driver of industrial output contributed about 17 percent to the innovations in
industrial output by the 6th
quarter and thereafter increased marginally to 19 percent in the 12th
quarter and 20 percent in
the 24th
quarter. Thus, the most important variables that are responsible for innovations in industrial output in Nigeria
are innovations from itself and those from non-oil export.
Variations in non-oil export were majorly driven by itself, particularly, during the first quarter of the forecast
horizon where the share of the variation was 96 percent. By the end of the 18th
quarter the share of oil revenue to non-oil
exports had risen to 18 percent while other remaining variables contributed about 6 percent. Therefore, the key drives of
non-oil export are innovations from itself and oil revenue.
Variance Decomposition of LOIP
Period S.E. LOIP LINDP LNOEXP DUMMY LNGDP 1 1.267901 100.0000 0.000000 0.000000 0.000000 0.000000
6 1.810878 66.85599 15.47208 8.621324 8.783455 0.267154
18 2.487460 52.52821 8.412588 29.63330 8.722807 0.703093
24 2.759130 49.71209 6.889937 33.76884 8.839433 0.789699
Variance Decomposition of LINDP
Period S.E. LOIP LINDP LNOEXP DUMMY LNGDP
1 0.091537 3.486713 96.51329 0.000000 0.000000 0.000000
6 0.246408 11.22151 68.82409 17.03800 2.849333 0.067063
12 0.356380 9.963560 67.04977 19.23182 3.698388 0.056457
18 0.439389 9.669341 66.39941 19.95069 3.927321 0.053236
24 0.508932 9.522200 66.08212 20.30191 4.042153 0.051613
H. B. Riman et al
58
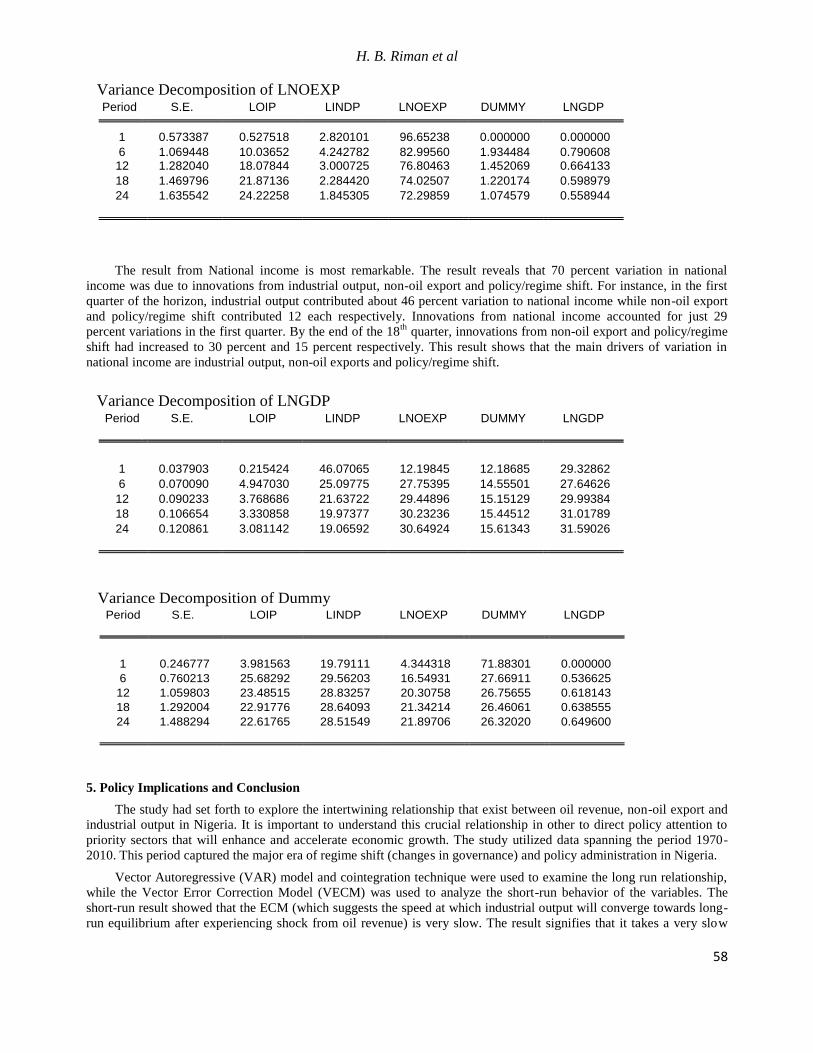
The result from National income is most remarkable. The result reveals that 70 percent variation in national
income was due to innovations from industrial output, non-oil export and policy/regime shift. For instance, in the first
quarter of the horizon, industrial output contributed about 46 percent variation to national income while non-oil export
and policy/regime shift contributed 12 each respectively. Innovations from national income accounted for just 29
percent variations in the first quarter. By the end of the 18th
quarter, innovations from non-oil export and policy/regime
shift had increased to 30 percent and 15 percent respectively. This result shows that the main drivers of variation in
national income are industrial output, non-oil exports and policy/regime shift.
5. Policy Implications and Conclusion
The study had set forth to explore the intertwining relationship that exist between oil revenue, non-oil export and
industrial output in Nigeria. It is important to understand this crucial relationship in other to direct policy attention to
priority sectors that will enhance and accelerate economic growth. The study utilized data spanning the period 1970-
2010. This period captured the major era of regime shift (changes in governance) and policy administration in Nigeria.
Vector Autoregressive (VAR) model and cointegration technique were used to examine the long run relationship,
while the Vector Error Correction Model (VECM) was used to analyze the short-run behavior of the variables. The
short-run result showed that the ECM (which suggests the speed at which industrial output will converge towards long-
run equilibrium after experiencing shock from oil revenue) is very slow. The result signifies that it takes a very slow
Variance Decomposition of LNOEXP Period S.E. LOIP LINDP LNOEXP DUMMY LNGDP
1 0.573387 0.527518 2.820101 96.65238 0.000000 0.000000
6 1.069448 10.03652 4.242782 82.99560 1.934484 0.790608 12 1.282040 18.07844 3.000725 76.80463 1.452069 0.664133
18 1.469796 21.87136 2.284420 74.02507 1.220174 0.598979
24 1.635542 24.22258 1.845305 72.29859 1.074579 0.558944
Variance Decomposition of LNGDP Period S.E. LOIP LINDP LNOEXP DUMMY LNGDP
1 0.037903 0.215424 46.07065 12.19845 12.18685 29.32862
6 0.070090 4.947030 25.09775 27.75395 14.55501 27.64626
12 0.090233 3.768686 21.63722 29.44896 15.15129 29.99384
18 0.106654 3.330858 19.97377 30.23236 15.44512 31.01789
24 0.120861 3.081142 19.06592 30.64924 15.61343 31.59026
Variance Decomposition of Dummy Period S.E. LOIP LINDP LNOEXP DUMMY LNGDP
1 0.246777 3.981563 19.79111 4.344318 71.88301 0.000000
6 0.760213 25.68292 29.56203 16.54931 27.66911 0.536625
12 1.059803 23.48515 28.83257 20.30758 26.75655 0.618143
18 1.292004 22.91776 28.64093 21.34214 26.46061 0.638555
24 1.488294 22.61765 28.51549 21.89706 26.32020 0.649600
International Journal of Financial Economics
59
process for industrial output to recover from shock arising from variation in oil revenue. Furthermore, all the variables
responded positively to industrial output in the short run.
The long run result shows that the coefficient of oil revenue had negative relationship with industrial output and
was statistically significant at 5 percent. The coefficient of policy/regime shift was also observed to be negative and also
significant at 5 percent. It can be understood from the long run result that a change in governance though has a positive
impact on industrial output in the short run; however, in the long run changes in governance results to a negative effect
on industrial output. The impulse response function and variance decomposition analysis suggest that the major drivers
of industrial development in Nigeria are non-oil export, regime shift and oil revenue. Thus innovations from these
variables impact severely on industrial growth in Nigeria. The study suggest that the panacea to the dwindling industrial
sector in Nigeria is to
Diversify the economy away from crude oil and encourage the growth of Small and Medium Scale Entrepreneurs
who are the major drivers of the production of products non-oil export. The paper however appreciates the current effort
of the government in providing small funds to the entrepreneur through the Microenterprise Development Agencies
(MEDA). However, the study underscores the need to not only monitor the use of these funds but also nurture these
medium scale entrepreneurs until full scale growth is achieved.
The implication of the above result is that government policies in tackling the impact of fluctuations in real oil
revenues are important source of stabilizing the growth of industrialization. Thus, the Nigerian government should
consider this all important relationship between real oil revenue and industrial output in planning and implementation of
economic policies.
Continuous change in governance appear as a major distortion to industrialization and non-oil exports in Nigeria.
It therefore becomes necessary to have a stable government that will have sufficient time horizon to pursue and see to
the completion/accomplishment of policies relating to industrial development in Nigeria.
The issue of corruption and lack of accountability in government and particularly, at the Nigerian National
Petroleum Corporation, (NNPC) should be addressed strongly.
References
Adebiyi, A, (2001) Trade Liberalisation Policy and Industrial Growth Performance In Nigeria: An Error Correction
Mechanism (ECM) Technique. (Online) Available www.bayoadebiyi.com/Adebiyi Michael Adebayo/trade
liberalization policy and industrial growth performance in Nigeria
Adejugbe, M.O.A, (1980) Nigeria‟s industrial Policies and performance in the Military Era, 1966-1979 Proceedings of
the annual Conference of the Nigeria Economic Society
Adejugbe, M.O.A, (1997) Stimulating Non-oil Sector through Marketing and Trading Strategies” Central Bank of
Nigeria Economic and Financial Review. Vol 35.(4)22-26
Adeniran, O, (2008) Does Energy Consumption cause Economic Growth? An Empirical Evidence from Nigeria.
(Online) Available www.dundee.ac.uk/cepmlp/gateway/files.php?
Ahmed, J., and Harnhinen, S, (1995) Unit roots and co-integration in Estimating Causality between Exports and
Economic growth: Empirical Evidence from The ASEAN countries, Economic Letters, 49
Ajayi, Dare Dickson, (2007) Recent Trends and Patterns in Nigeria‟s Industrial Development. Africa Development,
Vol. (32); 2.
Alao, R.O, (2010) Productivity in the Nigerian Manufacturing Sub-Sector: An Error Correction Model (ECM).
European Journal of Economics, Finance and Administrative Sciences. Issue 20, 25-33
Aworawo, D,(2011) Costly Neglect: Technology, Industrialization and the Crisis of Development in Nigeria. The
Journal of International Social Research. 4(17)
Awoseyila, A.P, (1997) Appraisal of past and Present Policy Measures for Reviewing Nigeria‟s Non-oil Sector and
Policy Implications for the future. Central Bank of Nigeria Economic and Financial Review. 35. (4)
Babawale, T. A. et al., (1996) „Nigeria Beyond Structural Adjustment: Towards a National Popular Alternative
Development Strategy‟, Africa Development, 21 (3)
Balogun, E.D, (1997) Towards Efficient Institutional Arrangements for Non-oil Sector Development in Nigeria. Central
Bank of Nigeria Economic and Financial Review. 35 (4)
H. B. Riman et al
60
Chimobi, O.P, (2010) The Estimation of Long-run Relationship between Economic Growth, Investment and Export in
Nigeria. International Journal of Business and Management. 5,( 4) 215-219
Díaz-Bautista, A, (2004) Mexico‟s Industrial Engine of Growth: Cointegration and Causality. (Online) Available www.
ideas.repec.org/p/wpa/wuwpem/0402010.html
Dickey, D.A and Fuller, W.A, (1979) Distributions of the Estimators for Autoregressive Time Series with a Unit root,
Journal of the American Statistical Association, 74,
Enang,B.U, (2010) Industrial Development, Electricity Crisis and Economic Performance in Nigeria. European Journal
of Economics, Finance and Administrative Sciences, Issue 18
Engel, R.F and Granger, C. W, (1987) Co-integration and Error Correction Representation, Estimation and Testing.
Econometrica 55 (2) 251-76
Feder, H,. (2007) A Multivariate Causality Analysis of Export and Growth for Turkey” MPRA Paper No. 3565
Fowowe, B, (2010) Financial Liberalisation and Financial Fragility in Nigeria. Central Bank of Nigeria Economic and
Financial Review 48(1): 71-92
Hansen, B.E, (1992) Test for Parameter Stability in Regression with 1(1) Processes. Journal of Business and Economic
Statistics. 10(3): 321-335
Ikpeze, N, Soludo, C.C and Elekwa, N.N, (2001) Nigeria: The Political Economy of the Policy Process, policy Choice
and Implementation” Industrial policy in Africa-Forced Consensus. Chapter 13
Johanson, Soren, (1989) Statistical Analysis of Co-integration Vectors” Journal of Economic Dynamics and Control: 12
Johansen, S. and Juselius, K, (1990) Maximum Likelihood Estimation and Inference on Co-integration- with
Applications to the Demand for Money”, Oxford Bulletin of Economics and Statistics, 52,
Kemal, A. R., Din, M., Qadir, U., Fernando, L. and Colombage , S, (2002) Exports and Economic Growth in South
Asia” A Study prepared for the South Asia Network of Economic Research Institutes.
Klien, N, (2010) The linkage between the Oil and Non-oil Sector: A panel VAR Approach. IMF Working Paper,
International Monetary Fund WP/10/118 Available at http/relooney.info/0_NS4053_720.pdf
Mamun, K., Al, A. and Nath, H.K, (2005) Export–led growth in Bangladesh: a time series analysis”, Applied
Economics Letters,12(6)
Nelson, C.F and Plosser, C.I, (1982) Trends and Random walks in Macroeconomic Time-series-some Evidence and
implications,” Journal of Monetary Economics, 10
Onyeonoru, I, (2003) Globalization and Industrial Performance in Nigeria‟, Africa Development, 28(3 & 4)
Ojapinwa, T. V and Ejumedia, P.E, (2010) The industrial impact of oil price shock in Nigeria: (1970-2010) European
Scientific Journal. 8(12) 113-126.
Pesaran, M.H., Shin, Y and Smith, R.J, (2001) Bounds testing approaches to the analysis of level relationships” Journal
of Applied Econometrics, 16.
Phillips, P.C. and Perron, P, (1988) Testing for a unit root in a time series regression, Biometrica, 75.
Akpan, E S, Riman, H B, Duke, J and Mboto, H W. (2012) Industrial Production and Non-oil Export: Assessing the
long run implication on economic growth in Nigeria. International Journal of Finance and Economics, Vol. 4
(2)
Soludo, C.C, (1998) Africa: Industrialisation Strategy in the context of Globalization” In Iqbal and M. khan (Eds) Trade
Reforms and Regional Integration in Africa. Washington, DC. IMF
Uddin, M.G.S and Norman, A.M, (2009) Causality between Industrial Production and Exports in Bangladesh. (Online)
Available www.gbmf.info/2009/Causality_Gazi_salah_uddin.pdf
Ukpong, G.E, (1997) Production Trend of Selected Non-oil Products in Nigeria. Central Bank of Nigeria Economic and
Financial Review. 35(4)