effect of mice tourism on hotel performance in three and
95
EFFECT OF MICE TOURISM ON HOTEL PERFORMANCE IN THREE AND FOUR STAR RATED HOTELS IN MOMBASA COUNTY; KENYA BY ERINA NOTAILA GITAU A THESIS SUBMITTED IN PARTIAL FULFILLMENT OF THE REQUIREMENTS FOR THE DEGREE OF MASTER OF TOURISM MANAGEMENT IN THE SCHOOL OF BUSINESS AND MANAGEMENT SCIENCES, UNIVERSITY OF ELDORET, KENYA NOVEMBER, 2017
-
Upload
khangminh22 -
Category
Documents
-
view
2 -
download
0
Transcript of effect of mice tourism on hotel performance in three and

EFFECT OF MICE TOURISM ON HOTEL PERFORMANCE IN THREE AND
FOUR STAR RATED HOTELS IN MOMBASA COUNTY; KENYA
BY
ERINA NOTAILA GITAU
A THESIS SUBMITTED IN PARTIAL FULFILLMENT OF THE
REQUIREMENTS FOR THE DEGREE OF MASTER OF TOURISM
MANAGEMENT IN THE SCHOOL OF BUSINESS AND MANAGEMENT
SCIENCES, UNIVERSITY OF ELDORET, KENYA
NOVEMBER, 2017

ii
DECLARATION
Declaration by the candidate
This thesis is my original work and has not been submitted for any academic award in
any institution; and shall not be reproduced in part or full, or in any format prior written
permission from the author and/or University of Eldoret
ERINA NOTAILA GITAU Signature …………………..Date………………
BMSPG/MTM/2003/14
Declaration by Supervisors
This thesis has been submitted with our approval as University supervisors.
DR. JOEL SUMUKWO Signature………………. Date……………
University of Eldoret
DR. JULIE MAKOMERE Signature………………. Date……………
University of Eldoret

iii
DEDICATION
This thesis is dedicated to my loving parents and siblings for their love and undying
support, encouragement, financial support and inspiration.
iv
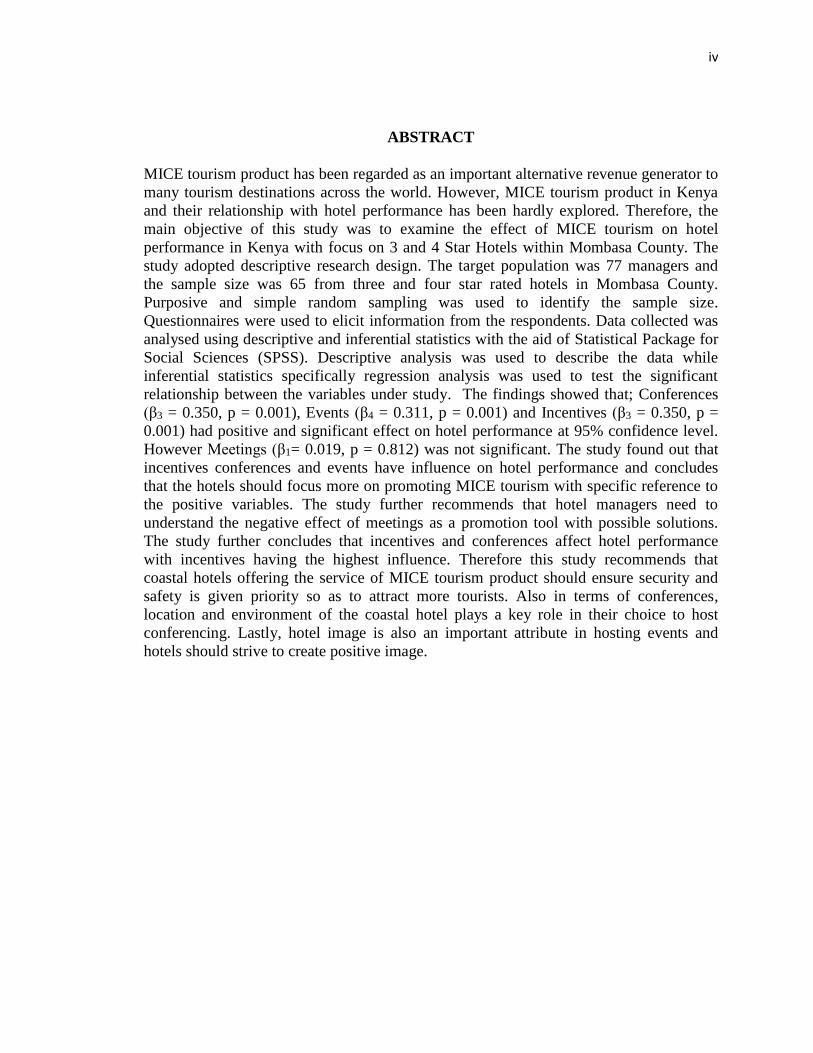
ABSTRACT
MICE tourism product has been regarded as an important alternative revenue generator to
many tourism destinations across the world. However, MICE tourism product in Kenya
and their relationship with hotel performance has been hardly explored. Therefore, the
main objective of this study was to examine the effect of MICE tourism on hotel
performance in Kenya with focus on 3 and 4 Star Hotels within Mombasa County. The
study adopted descriptive research design. The target population was 77 managers and
the sample size was 65 from three and four star rated hotels in Mombasa County.
Purposive and simple random sampling was used to identify the sample size.
Questionnaires were used to elicit information from the respondents. Data collected was
analysed using descriptive and inferential statistics with the aid of Statistical Package for
Social Sciences (SPSS). Descriptive analysis was used to describe the data while
inferential statistics specifically regression analysis was used to test the significant
relationship between the variables under study. The findings showed that; Conferences
(β3 = 0.350, p = 0.001), Events (β4 = 0.311, p = 0.001) and Incentives (β3 = 0.350, p =
0.001) had positive and significant effect on hotel performance at 95% confidence level.
However Meetings (β1= 0.019, p = 0.812) was not significant. The study found out that
incentives conferences and events have influence on hotel performance and concludes
that the hotels should focus more on promoting MICE tourism with specific reference to
the positive variables. The study further recommends that hotel managers need to
understand the negative effect of meetings as a promotion tool with possible solutions.
The study further concludes that incentives and conferences affect hotel performance
with incentives having the highest influence. Therefore this study recommends that
coastal hotels offering the service of MICE tourism product should ensure security and
safety is given priority so as to attract more tourists. Also in terms of conferences,
location and environment of the coastal hotel plays a key role in their choice to host
conferencing. Lastly, hotel image is also an important attribute in hosting events and
hotels should strive to create positive image.
v
TABLE OF CONTENTS
DECLARATION ................................................................................................................ ii
DEDICATION ................................................................................................................... iii
ABSTRACT ....................................................................................................................... iv
TABLE OF CONTENTS .....................................................................................................v
LIST OF TABLES ........................................................................................................... viii
LIST OF FIGURES ........................................................................................................... ix
LIST OF ABBREVIATIONS ACRONYMS AND SYMBOLS ........................................x
OPERATIONAL DEFINITION OF TERMS ................................................................... xi
ACKNOWLEDGEMENT ................................................................................................ xii
CHAPTER ONE ..................................................................................................................1
INTRODUCTION ...............................................................................................................1
1.1 Background of the Study ...............................................................................................1
1.2 Statement of the Problem ...............................................................................................4
1.3. Main Objective..............................................................................................................5
1.4 Hypothesis of the Study .................................................................................................6
1.5 Significance of the Study ...............................................................................................6
1.6 Scope of the Study .........................................................................................................7
1.7 Limitations of the Study.................................................................................................7
CHAPTER TWO .................................................................................................................9
LITERATURE REVIEW ....................................................................................................9
2.1 Introduction ....................................................................................................................9
2.2 Hotel Performance .........................................................................................................9
2.3 MICE Tourism .............................................................................................................12
2.3 Theoretical Framework ................................................................................................25
2.4. Conceptual Framework ...............................................................................................26
CHAPTER THREE ...........................................................................................................27
RESEARCH DESIGN AND METHODOLOGY .............................................................27
3.1 Introduction ..................................................................................................................27
3.2 Research Design...........................................................................................................27
3.2 Study Area and Methodology ......................................................................................28
vi
3.3 Target Population .........................................................................................................28
3.4 Sample Size ..................................................................................................................29
3.5 Sampling Procedure .....................................................................................................30
3.6 Research Instruments ...................................................................................................31
3.7 Pilot Study ....................................................................................................................32
3.8 Validity and Reliability ................................................................................................32
3.8.1 Validity of the research instrument ...........................................................................32
3.8.2 Reliability of the research instrument .......................................................................33
3.9 Data Collection Procedure ...........................................................................................33
3.10 Data Analysis and Presentation .................................................................................34
3.10.1 Multiple Regression Analysis .................................................................................34
3.11 Ethical Consideration .................................................................................................35
CHAPTER FOUR ..............................................................................................................36
DATA ANALYSIS, RESULTS AND INTERPRETATION ............................................36
4.0 Introduction ..................................................................................................................36
4.1 Demographic information of the respondents ..............................................................37
4.2 MICE Tourism .............................................................................................................39
4.3 Effect of Meetings on Hotel Performance ...................................................................40
4.4 Effects of Incentives on Hotel Performance ................................................................42
4.5 Effects of Conferences on Hotel Performance .............................................................43
4.6 Effects of Events on Hotel Performance ......................................................................44
4.7 Hotel Performance .......................................................................................................45
4.7.1 Customer Value ........................................................................................................46
4.7.1 Customer Interaction .................................................................................................48
4.7.2 Customer Interaction .................................................................................................49
4.8 Regression analysis of effect of MICE Tourism on Hotel Performance .....................50
CHAPTER FIVE ...............................................................................................................53
SUMMARY AND DISCUSSIONS ..................................................................................53
5.1 Summary ......................................................................................................................53

vii
5.2 Discussion ....................................................................................................................54
5.2.1 General Information ..................................................................................................54
5.2.2 Effects of choice in holding meetings .......................................................................54
CONCLUSIONS AND RECOMMENDATIONS ............................................................57
6.1 Recommendations ........................................................................................................61
6.2 Suggestions for Further Research ................................................................................62
REFERENCES ..................................................................................................................63
APPENDIX I:QUESTIONNAIRE FOR HOTEL EMPLOYEES .....................................77
APPENDIX II: STUDY AREA .........................................................................................83

viii
LIST OF TABLES
Table 4.1: Events offered at the hotels ...............................................................................39
Table 4.2: Frequency of the event held at the hotel ...........................................................40
Table 4.3: Effects of meetings on hotel performance ........................................................41
Table 4.4: Level of agreement in relation to incentives .....................................................43
Table 4.5: Level of agreement in relation to Conferences .................................................44
Table 4.6: Level of agreement in relation to Events ..........................................................45
Table 4.7: Customer Knowledge .......................................................................................46
Table 4.8: Customer Value ................................................................................................47
Table 4.9: Customer Interaction ........................................................................................49
Table 4.10: Customer Interaction ......................................................................................50
Table 4.11: Standard multiple regression analysis output for coefficients results ............51
Table 4.12: Standard multiple regression analysis output for model summary .................52
Table 4.13: Standard multiple regression analysis output for Analysis of variance ..........52

ix
LIST OF FIGURES
Figure 1.1: Conceptual Framework for the study ..............................................................26
Figure 4.1: Gender of the Respondents..............................................................................37
Figure 4.2 Education level of the respondents ...................................................................38
Figure 4.3: The relationship between respondents’ work duration and the position with
the hotels ............................................................................................................................39
x
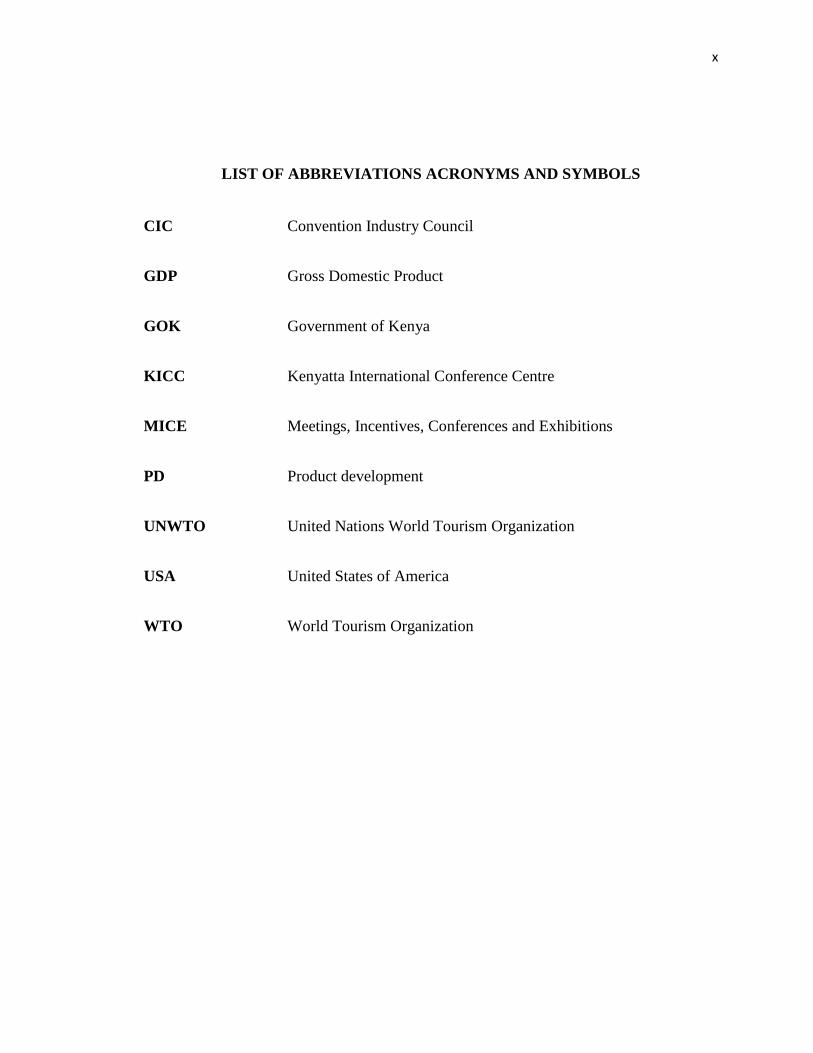
LIST OF ABBREVIATIONS ACRONYMS AND SYMBOLS
CIC Convention Industry Council
GDP Gross Domestic Product
GOK Government of Kenya
KICC Kenyatta International Conference Centre
MICE Meetings, Incentives, Conferences and Exhibitions
PD Product development
UNWTO United Nations World Tourism Organization
USA United States of America
WTO World Tourism Organization
xi
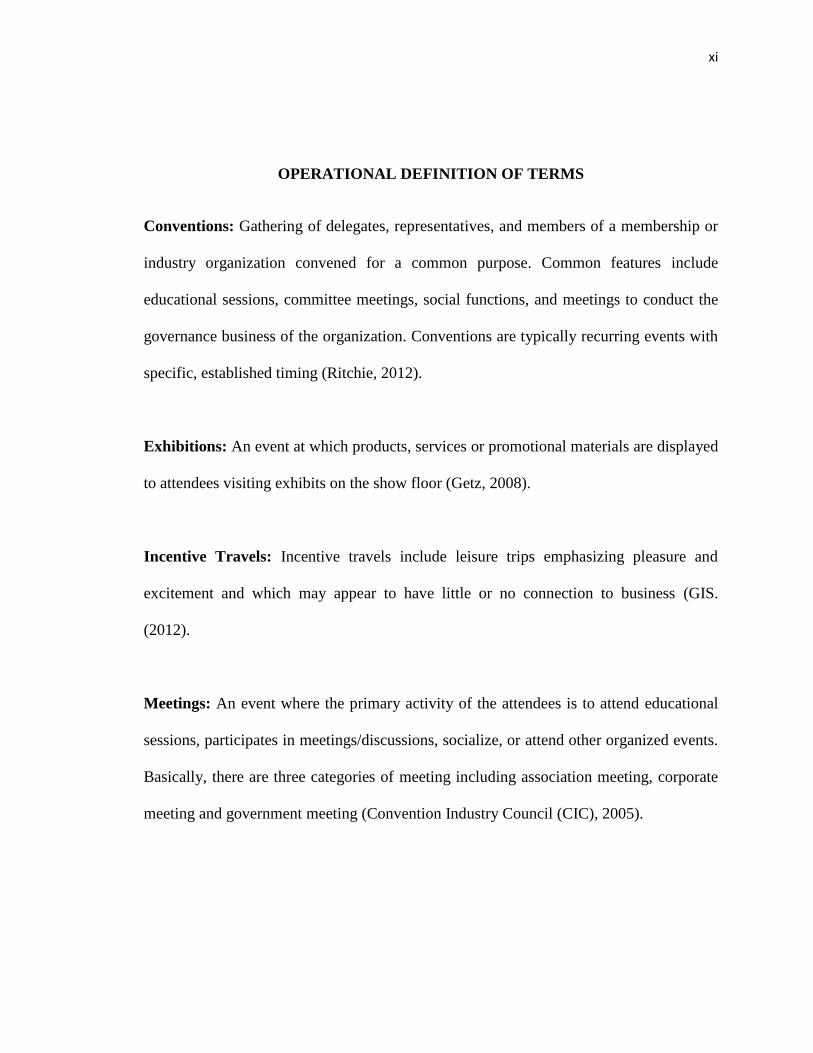
OPERATIONAL DEFINITION OF TERMS
Conventions: Gathering of delegates, representatives, and members of a membership or
industry organization convened for a common purpose. Common features include
educational sessions, committee meetings, social functions, and meetings to conduct the
governance business of the organization. Conventions are typically recurring events with
specific, established timing (Ritchie, 2012).
Exhibitions: An event at which products, services or promotional materials are displayed
to attendees visiting exhibits on the show floor (Getz, 2008).
Incentive Travels: Incentive travels include leisure trips emphasizing pleasure and
excitement and which may appear to have little or no connection to business (GIS.
(2012).
Meetings: An event where the primary activity of the attendees is to attend educational
sessions, participates in meetings/discussions, socialize, or attend other organized events.
Basically, there are three categories of meeting including association meeting, corporate
meeting and government meeting (Convention Industry Council (CIC), 2005).

xii
ACKNOWLEDGEMENT
I would like to take this opportunity to extend my profound appreciation to the school of
Business and Management Sciences and the Department of Tourism and Tour
Operations, University of Eldoret for their immense academic support. Further, I am
grateful for the selected hospitality facilities within Mombasa County for allowing me to
collect data to make this a success. Last but not least ultimate gratitude goes to the
Almighty God who has brought me this far.
1
CHAPTER ONE
INTRODUCTION
1.1 Background of the Study
The meetings, incentives, conventions, and exhibitions (MICE) industry represents one of
the fastest growing segments of the tourism industry (Casanova, Kim & Morrison, 2005;
Weber, 2001; Weber & Roehl, 2001). Globally MICE tourism has grown in recent
decades (UNWTO, 2014) and has become a significant operating sector of the tourism
industry (Goeldner & Ritchie, 2012). Today, countries all over the world are putting their
best foot forward to develop the MICE industry as a means to enliven national economic
development (Yang & Gu, 2011). The industry has also been recognized as a significant
market segment over the past decades (Astroff & Abbey, 2006; Kim, Chon, & Chung,
2003; World Tourism Organization, 2006) and has matured to become a crucial segment
of the global tourism and hospitality sector and important contributor to regional
economics (Crouch & Louviere, 2004; Dwyer, 2002; Spiller, 2002; UNWTO, 2006).
The industry consists of multi sectors of hospitality services, including lodging, food and
beverage, catering, convention service, convention facility supply, transportation,
tourism, retail, and entertainment and thus bears great importance for the local economy
of a destination (Astroff & Abbey, 2006; Fenich, 2008; Yang & Gu, 2011). On the other
hand, the MICE industry shares several common characteristics with hospitality service
sectors, such as inseparability of production and consumption, perishability, and
seasonality. Moreover, the MICE industry of a destination always faces uncertain
2
markets due to fluctuations in the economy and competitions from rivaling destinations
(Astroff & Abbey, 2006; Fenich, 2008; Isler, 2008). Therefore, the demand for a MICE
destination is typically probabilistic rather than deterministic.
The MICE industry’s importance to an economy is also well recognized, as researchers
and practitioners both acknowledge the many contributions that conventions and other
events have on local, state and national economies (Crouch & Ritchie, 1998; Lee, 2006).
The industry is considered to be of great economic impact due to four main reasons. First,
its target market is “high-quality, high-cost-and therefore-high-yield end of the market”
(Casanova, Kim & Morrison, 2005, p. 22). Second, unlike most segments of the
hospitality and tourism industry, events are a year-round activity. Third, if an event is
successful, it is likely that it will be held again in the same destination (future business
and revenue). Last, event tourism is greener than mass tourism (Casanova, Kim &
Morrison, 2005). The industry has contributed to income, employment, and investment to
cities, towns and regions (UNWTO, 2014) and generating foreign exchange (Page &
Connell, 2006).
In terms of demand, in 2009 alone, a total of 11,929 international meetings were held
worldwide (Yang & Gu, 2011). However, according to Braley (2008) this demand for
MICE capacity is uncertain and highly seasonal and convention and exhibition facilities,
like hotel rooms, are perishable. Fenich (2008) further argues that the demand of the
MICE industry is usually affected by seasons, holidays, and weather conditions. Further,
3
fluctuations in the economy and competition from rivaling destinations always cause
uncertain markets to a MICE destination (Astroff & Abbey, 2006).
In Kenya, MICE tourism, also known as business and conference travel is Kenya‘s third
major tourism product line after Safari tourism and Coastal tourism (Odunga et al.,
2011). Kenya’s MICE tourism started in 1973 with the opening of the Kenyatta
International Conference Centre (KICC) in Nairobi (Odunga et. al., 2011). It has been the
host destination for high profile international and national conferences and events
(Meetings Kenya, 2014). More recently, as part of Kenya’s priority for tourism
development, the country recognizes MICE as being a growth sector which is needed in
order to make Kenya a top ten long haul destination (Ministry of East Africa, Commerce
and Tourism, 2013). Kenya considers the MICE sector to have ‘untapped tourism
potential,’ which makes it a key opportunity for Kenya’s tourism development (Ministry
of East Africa, Commerce and Tourism, 2013). This has been entrenched further, by the
lack of targeted efforts by the Kenya Tourist Board on the sub-sector to co-ordinate the
marketing and promotion of MICE tourism in Kenya (Isler, 2008).
Moreover, another area where hospitality practitioners in Kenya lag behind is the
determinant factors of MICE site selection. Literature indicates that venue selection is
primordial to ensure the success of any aspect of MICE (Crouch & Ritchie, 1997). In
fact, companies try to associate their communication strategy to an adequate destination,
which will convey a certain favourable image for the organisation (Bowdin, Mcdonnell,
Allen & O’Toole, 2006). Some authors state that selecting the most convenient

4
destination to an event is one of the most important decisions that event planners have to
take (Vogt, Roehl & Fesenmaier, 1994; DiPietro et al., 2008). In addition, successful
meetings in a given destination will contribute not only for the success of the meeting
industry, but also for the success of leisure tourism in that destination as it will encourage
return visits (Crouch & Ritchie, 1997).
Although some studies address MICE site-selection (Crouch & Ritchie, 1998; Choi &
Boger, 2002; Crouch & Louviere, 2004; Comas & Moscardo, 2005; Hayat, Severt,
Breiter, Nusair & Okumus, 2014; Para & Kachnievska, 2014), further research needs to
be done, especially in Kenya, in order to understand the effect of MICE tourism product
on hotel performance. In fact, critical issues on this subject “is how associations decide
where to hold their conferences and meetings” (Comas & Moscardo, 2005: 117) and how
this affects hotel performance. This study attempted to determine the effect of MICE
tourism product on the performance of three and four star rated hotels within the hotel
industry in Mombasa County, Kenya.
1.2 Statement of the Problem
Understanding effect of MICE tourism product on hospitality performance is important
for destinations that want to capitalize on the MICE industry. With the growing
competition, destinations must become experts in all facets of the MICE industry.
Destinations have to understand that while there are main attributes that are important to
all MICE planners and all MICE types, there are still many differences that still exist, or
the different segments MICE planners plan for. According to Government of Kenya
(2012) for example, MICE as a product line of the Tourism industry continues to face a
5
number of challenges which need to be addressed for the sector to attain its full potential.
These challenges have rendered stand-alone MICE facility providers with a difficult task
in packaging their products to meet the needs and the demands of the organizers and
remain relevant in the competitive market.
Previous literature on MICE site selection process has focused on association site
selection, although lately some researchers have investigated how event type influences
destination attributes importance (Comas & Moscardo 2005; Rompf, Breiter & Severt,
2008). Research is somewhat extensive; however it is mainly theoretical and lacks
empirical support (Crouch & Ritchie, 1998). Crawford and McCleary (1992) anticipated
that more quantitative research will be published as the hospitality field grows; however,
there is no increase in this aspect of research (Lee & Back, 2005) especially from
suppliers’ perspective and with a focal point in customer service. This calls for a need for
comprehensive empirical research from the industry perspective to generate an overall
understanding of attributes that influence MICE organisers’ venue selection in hotel
industry as perceived by the hotel managers.
1.3. Main Objective
The main objective of this study was to examine the effect of MICE tourism on Hotel
performance in 3 and 4 star rated hotels within Mombasa County, Kenya.
1.3.2 Specific Objectives
1. To determine the effect of meetings on Hotel performance.
2. To assess the effect of incentives on Hotel performance.

6
3. To evaluate the effect of conference on Hotel performance.
4. To examine the effect of events on Hotel performance.
1.4 Hypothesis of the Study
Ho1. There is no significant effect of meetings on performance of three and four star rated
Hotels in Mombasa County.
Ho2 There is no significant effect of incentives on Hotel performance of three and four
star rated Hotels in Mombasa County.
Ho3 There is no significant effect of conferences on Hotel performance of three and four
star rated Hotels in Mombasa County.
Ho4There is no significant effect of events on Hotel performance of three and four star
rated Hotels in Mombasa County.
1.5 Significance of the Study
Competition and dwindling profitability has been a major hindrance to many hotels at the
coastal region of Kenya. This study therefore, could help hoteliers diversify their clientele
base rather than the traditional dwindling beach tourists market. It could also help
understand variables that most influence MICE tourism performance thus helping hotels
put measures to supply such variables.
In terms of new investment in MICE tourism industry, the study could help other hotels
within coastal region in packaging competitive MICE tourism product for sustainable
growth and development.
7
This study could also help the national and county governments in formulation of
informed MICE tourism policies that address the obstacles facing the tourism sector and
make decisions that are geared towards the development of alternative tourism products
geared towards achievement of Kenya’s vision 2030.
1.6 Scope of the Study
The study was on the effect of MICE tourism on performance of three and four star rated
hotels. Therefore, the study only covered three and four rated star hotels within Mombasa
County, Kenya. The study also focused on meetings, incentives, conferences and events
and dependent variables while the dependent variable of hotel performance was measured
using non-financial measures of customer satisfaction, interaction, value and knowledge
even though there are other financial measures of hotel performance.
1.7 Limitations of the Study
The study was likely to be influenced by limited geographical location of the hotels,
security concerns, timing of data collection and limited budget since the study was self-
financed. To overcome vastness of geographical location of the three and four star rated
hotel, the researcher hired a private car to reach all the hotels during data collection. In
terms of security concerns, the researcher introduced herself at the security desks and also
used introduction letter for research from the University and research permit to be
allowed access into the hotels.
8
Even though the study was done during high season at the Coast, the researcher
introduced herself to the respondents in terms of the purpose of the study, dropped the
questionnaires for filling and later picked them. Even though the research was self-
finance, the researcher appropriately used limited budget available to effectively
complete data collection process.

9
CHAPTER TWO
LITERATURE REVIEW
2.1 Introduction
This chapter puts into perspective the various studies on MICE tourism with to hotel
performance. It also discusses effect MICE tourism as a way of improving hotel
performance of a particular destination. Specifically the chapter discusses MICE tourism
in Kenya and MICE tourism activities and opportunities.
2.2 Hotel Performance
Olsen (2008) refers performance as a concept considered both complex and dynamic and
practically conceptualized in two major ways which are considered both drivers and
results of performance whereas organizational performance is viewed as an
organization’s overall’s productivity majorly concerned with inventory turnover, number
of customers, general profitability as well as the total market share. Performance can be
measured through quantitative and qualitative methods. This study refers it to financial
measures such as profits and non-financial measures such as company image, market
share, service quality as well as customer and employee turnover. According to Richard
Devinney and Johnson (2009), comparatively, in the service industry, other measures
which are regarded as non-financial usually happen to be the best performance indicators
than financial measures.
Non-financial measures are regarded as better measures of both value and motivation
because it complements short-run financial figures to show long-term objectives.
10
Therefore performance can be termed as an output which shows profitability and is better
explained by expected behavioral output. According to Wadongo, Odhuno and Kambona
(2010), an organization’s performance is not to be measured by way of financial
performance but rather by use operational as well as market indicators, which are mainly
non-financial measures.
Enz (2008) refers hotel industry as the service sector containing products which can’t be
separated and which require varied measurement methods. A hotel is ideally meant to
offer both services and products besides also increasing customer satisfaction by way of
provision of quality services and products (Ramsaran-Powdar, 2007). Kerin et al. (2009)
further states that hotel industry has shown that customer satisfaction has an effect on
hotels competitive advantage and performance.
According to Litterallet et al. (2002), the hotel industry is a service-based industry with
varied characteristics including relatively low barriers to entry as well as numerous
operators who pursue a family or even lifestyle form of business model as part of their
intrigue will and desire to change their lives. The Uniqueness of hotels lies not only in
their sizes but also in the dimension of the kind of business the family is involved in as
well as the commercialization of the home. Most of these hotels are not interested in
pursuing financial growth and profitability but instead are motivated by other non-
financial factors which include independence, self-satisfaction as well as community
recognition unlike entrepreneurial style hotels (Peacock, 2009; Thomas, 2000). Hotel
Performance differs like any other business performance. Hotel performance is regarded

11
complex in nature and varies depending on the management’s motivation and focus
(Morrison & Teixeira 2004).
2.2.1 Hotel Industry in Kenya
The hotel industry in Kenya is closely linked to the tourism sector which has shown
impressive growth over the years. Tourism is one of the six key areas that have been
given priority in acting as the key growth drivers in Kenya (Owiti, 2011). The sector is
making Kenya one of the top best tourist destinations globally offering unique visitor
experiences (GoK, 2006). The hospitality and travel industry are the two major and main
industries that make up the activities of tourism in Kenya (Kotler, 2010). The hospitality
industry in Kenya was developed at the Kenyan Coast because of the Arab traders and
the construction of the Railway Line. The Kenya’s Hotel and Restaurants Act cap 494
defines a hotel as a premise which provides accommodation and food in exchange for
money (Kenya Economic Report, 2013). The first hotel constructed was the Grand Hotel
which later changed into the Manor Hotel though it has since been closed down. Utalii
College was later build to take care of the training needs of hotel staff in the 1960’s.
In Kenya, in as far as contribution of foreign exchange to the country is concerned,
Tourism is ranked number three just after tea and horticulture. In terms of contribution to
total wage employment, Tourism is said to contribute and good proportion, like 12%,
besides also contributing like 13% of GPD, this is according to National Tourism
Strategy, (2013). Kenya’s Gross Domestic Product (GDP) has grown by 4.7 percent in
comparison to 4.6% growth rate in 2012 (KNBS). Kenyan economy was weak in 2012
because of high interest rates which resulted from high inflation in 2011. This paused a

12
big challenge to the tourism sector which relies on the global currency. The net effect was
that tourism earnings decreased in 2013 because the number of international visitors
decreased from 1,710.8 thousand in 2012 to 1,519.6 thousand in 2013 representing 11.2
decrease. At the same time, tourism earnings decreased from Kshs. 96 billion in 2012 to
94 billion in 2013 representing a decrease of 2%.
In Kenya, many hotels are currently struggling to gain the International Organization for
Standardization (ISO) certification and Company of the Year Awards. The managements
of hotels in Kenya have further perfected this pursuit by focusing their attention on
achieving the coveted five–star classification. This classification provides hotels with a
window of opportunity to join membership of international organizations and schemes.
These endeavors have therefore compelled many hotels to turn to performance
measurement systems as a means of achieving superior financial and non-financial
objectives. Hotel industry practitioners and scholars in Kenya struggle to gain firm
performance to identify good practice. Given that hotels are an integral part of the
Kenyan tourism industry which is an important pillar of the Kenyan economy, a review
into the dimensions that affect the industry is justified.
2.3 MICE Tourism
MICE according to the context of travel abbreviate Meetings, Incentives, Conferences
and Events. It is referred as group tourism committed to planning, booking and
facilitation of conferences, seminars and a variety of other events. Sometimes referred to
as the meetings or events industry, MICE travel is composed of a number of components

13
which are meeting planners; meetings and convention departments of hotels (World
Tourism Organization, 2005).
Meeting is a general term that refers to people coming together in an identified one place
to undertake a particular activity. The frequency can vary as per a set of pattern, for
example annual general meetings, committee meetings and other (Rogers, 2003; WTO,
2006). Wood et al. (2008) refers incentives as an event that brings people together and
constitutes a section of a programme that purely allows past performance to be rewarded
by participants.
A conference is defined as meeting that involves participation meant for general
discussion, fact-finding, problem solving as well as consultation. Conference has a
special connotation similar to frequency; they have limitation in terms of duration and
carry with them specified objectives and goals (Rogers et al., 2003). Events refer to
general showcasing of both products and services in large scale. Occasions can be
exchange just, where participants need to work in whatever industry is being displayed or
can be customer or even public, where anybody can go to (WTO, 2006).
In the recent past decades, MICE tourism has extensively grown globally (UNWTO,
2014) and has greatly risen to become a very important sector of operation in particularly
in the industry of tourism (Goeldner & Ritchie, 2012). It has contributed to income,
employment, and investment (UNWTO, 2014). According to Yang and Gu (2011), in
2009 a total of 11,929 global gatherings were held around the world. This industry

14
comprise of numerous areas in hospitality administrations which incorporates hotel or
rather lodging, food and drink, cooking, tradition benefit, tradition office supply,
transportation, tourism, retail, and diversion which conveys awesome essentialness for
the local economy of a countries’ destination (Yang & Gu, 2011).
Many countries in the world are struggling to develop and maintain the MICE tourism
with an aim of improving national economic development (Yang & Gu, 2011).
Unsurprisingly, most of these tourism destinations are looking for mechanisms to develop
their own tourism industries with an aim of helping them appear different from their
competitors by targeting MICE tourism (UNWTO, 2014). According to (UNWTO,
2014), MICE tourism reduces season in season out, averagely increases the total amount
of receipts, and also leads to increased awareness on a brand.
The United States of America (USA)is the leading country in MICE tourism followed by
Germany and Spain respectively (ICCA report, 2013). To the U.S. economy the industry
contributes $263 billion in annual spending, provides $25.6 billion in tax revenue at the
federal, state, and local levels, and creates 1.7million jobs for the American workforce in
local communities. For Singapore, which relies on MICE heavily for its tourism industry,
MICE tourism contributes even more to the nation’s economy. Within Africa, South
Africa has been the most popular in MICE tourism followed by Egypt, Tunisia and
Morocco.
15
MICE tourism in Kenya started in the year 1973 with the opening of the Kenyatta
International Conference Centre (KICC) in Nairobi (Odunga et al., 2011). It has been the
host destination for high profile international and national conferences and events
(Meetings Kenya, 2014). Kenya has greatly recognized MICE tourism as an important
sector of growth which is apparently needed in order to rank it among the top ten long
haul destination. Kenya greatly recognizes MICE as sector to possess a great potential not
already tapped, which makes MICE become a prime opportunity for development of
tourism in Kenya (GoK, 2012). In recognition of the contribution of the MICE tourism
sector, the National MICE Committee and Secretariat was established in July 2010 and
was tasked with the responsibility of charting the way forward for the MICE subsector. It
comprises of public and private sector actors, the national MICE committee and
secretariat and this is a clear indicator of the commitment of the government’s to develop
this sector (Odunga et al., 2011).
According to UNWTO (2014), destinations should establish strategies for positioning
which creates an image or identity in the minds of their target market and also
repositioning which changes the identity of the destination as a product, relative to the
identity of competing cities/countries always retaining front of mind the reshaping of
opinion and constant evolution of the sector.

16
2.3.1 Effect of Meetings on Hotel Performance
Meeting is where a certain number of people participating in a discussion or information
exchange and conference is where workshops and training sessions occur. For the
important meetings and conferences with special purposes, most organizers look for the
unique program such as team-building and leisure travel. These activities are a
component of MICE tourism similarly, incentive travels are regarded as a reward for the
companies’ employees or customers to enjoy a short trip together but profoundly, to
tighten the relationships and increase the profit (Odunga et al., 2011).
Meetings refer to coming together of two or more people with a unified purpose of
meeting common and shared goals and objectives through verbal interaction, for instance
the sharing of some information or conclusive agreements. Meetings at times happen
face-to-face or even virtually, or even through a telephone conference call or better still,
video conference. Meeting can be separately identified from other forms of gatherings
such as a chance encounter (not convened), a sports game or a concert (verbal interaction
is incidental), a party or the company of friends (no common goal is to be achieved) and a
demonstration (whose common goal is achieved mainly through the number of
demonstrators present, not through verbal interaction). Study carried out by Olsen (2008)
found out that a number of cities found in the United States recorded a decline majorly in
the convention business, and he further notes that hotels have been experiencing
employees’ redundancy and closures together with airline changes, which eventually led
cancellation and postponement of scheduled conferences as well as conventions.
17
Meeting planners and other professionals use the term "meeting" to show an event
booked at a hotel (Goeldneret et al., 2012).In this manner "meeting" covers an address
(one introduction), class (normally a few introductions, little gathering of people, one
day), meeting (average size, at least one days), congress (expansive, a few days),
presentation or public exhibition (with kept an eye on stands being gone by passers-by),
workshop (littler, with dynamic members), instructional class, group building session and
commence occasion.
The convention industry attracts high-spending visitors and those who make repeat visits
to a destination. An research study on MICE tourism did by Robert (2011) discovered
that gatherings are the indispensable parts of the accommodation business since
gatherings speak to a major business when that is done separated from common
workplace. They require resting spaces for the individuals who travel long separations
and nourishment and refreshment administrations for those going to them. Likewise, the
noteworthy time and costs brought about by participants require that the meeting be
professionally arranged and figured out how to amplify their viability. Business travel is
bifurcated into two general classes, one being the individual business travel and alternate
business tourism.
According to Odunga et al. (2011), there are over 2000 meetings, incentive travel,
conference and events. Events (M.I.C.E) offices in type of hotels or rather lodgings,
lodges, learning establishments, Conference/Convention focuses and Stadia everywhere
throughout the nation moved in the significant towns, along the drift and national stops,
18
all with gathering offices of differing limits. In addition to the above public learning
institutions have by virtue of their core business constructed to provide venues of
information and knowledge exchanges in form of lecture theatres and seminar rooms.
These offices have been utilized as auxiliary wellspring of pay for these foundations
through procuring to the neighborhood advertise for gatherings, gatherings and classes.
On the other hand stadia have been able to cater for demands of huge crowds especially
for political and religious functions (Rotich et al., 2012).
2.3.2 Effect of Incentives on Hotel Performance
Incentive travel is like a reward to the employees. It doesn't have a business or
informative portion yet rather it is much more a non-business escape with the purpose of
continued with motivation for execution. It might incorporate the gathering of the laborer
or it could be a reward for a workgroup.
Dissimilar to different sorts of the MICE tourism, the impetus travel concentrates on fun,
nourishment and different exercises instead of training and work (UNWTO, 2014).
Impetus travel contrasts relying upon the way of life and social variables, in its
application and comprehension in specific nations. In some creating markets for instance
the Indian market, motivating force make a trip alludes to a straightforward course of
action or a plane ticket and paid settlement. USA for instance, there is an extensive
number of individual impetuses utilizing index offer as motivation program. Despite the
fact that lion's share of conventional motivator trips alludes a gathering of individuals for
whom a movement and stimulation program is custom-made.
19
Likewise with respect to different national markets for instance French, Italian and
German organizations, they generally compose motivation trips in their nearby markets,
though the neighborhood market of Great Britain is obviously moderately little, since the
greater part of their organizations don't think of it as appropriate for the motivator travel.
A study carried out by on Yang & Gu, (2011) on popular incentives travels and
established that Orlando, Las Vegas, and Hawaii were the most popular incentive travel
destinations in the last five years. The purposes behind choosing those goals included
great climate, simple air associations, ubiquity, wellbeing and security, picture/style,
vicinity to home, estimation for the cash, assortment of exercises, and compelling
showcasing methodologies created by both goal associations and accommodation offices.
WTO (2005) gives the most imperative influencing elements or factors while putting
MICE motivating forces in the Gulf/Middle East. They incorporate Cost , Quality of
convenience, Quality of meeting offices, Quality of administration, Overall interest of the
goal ,Travel time to goal, Time of year, Security/wellbeing, Availability of inn
rooms/settings, Visa obtainment, International air courses and Weather.
The rousing power travel publicize is one that can have a noteworthy monetary impact.
The custom business tends to pull in high-spending visitors and the people who make go
over visits to an objective. Masters in Hong Kong (1997) prescribed that MICE voyagers
have a tendency to stay longer at an objective and spend more than the typical traveler, an
example that began to develop a long time back is that business adventurers are mixing
20
business with delight. Colleagues and children are running with the business voyager
locally and all inclusive, and with the availability of resort practices this customarily
suggests the visitor will stay for possibly two or three days longer, in the desire of
working up a "mini-vacation."
2.3.3 Effect of Conferences on Hotel Performance
Tourism industry finds conferences as one of the lead revenue generators for many
destinations worldwide. According to Continental ranking of conference tourism Europe
and Asia are the leaders while North America and Africa follow suit. According to
Wekesa, (2006), this has enhanced change and economic growth and more importantly
the product development which embraces emerging needs which makes (tourism) sector
the 29thlargest contributor to the gross national product globally.
Within Africa, South Africa has been the most popular in hosting meetings in Africa,
followed by Egypt, Tunisia and Morocco. Kenya takes the 4thposition. City wise, Nairobi
ranks 5thafter Cape Town, Durban, Cairo and Johannesburg. In Kenya, the Kenyatta
International Conference Center, United Nations office in Nairobi, Gigiri, Safari park
Hotel in Nairobi and the White sands hotel and Sun-n-sand hotel in Mombasa have been
and still are the strong forces behind development of conference tourism, coming out as
the main host venues for most of the international events / conferences coming to Kenya.
In the recent past, a host of other hotels and high learning institutions in the country have
been also instrumental in hosting meetings and events (Victoria Safaris, 2007).

21
A convention refers to meeting of individuals who meet at an arranged place and time
with a reason of discussing or engaging in some basic intrigue. The most widely
recognized traditions depend on industry, calling, and being a fan. For this situation
exchange traditions concentrate on specific industry, include keynote speakers, merchant
shows, and other data and exercises important to the coordinators and participants.
Proficient traditions concentrate on issues of worry to the calling and headways in the
calling. Fan traditions for the most part highlight presentations, shows, and deals in view
of popular culture and visitor famous people. Sci-fi traditions generally share of the idea
of both expert traditions and fan traditions, with balance fluctuating, starting with one
then onto the next. Traditions likewise exist for different pastimes, for example, gaming
or model railways (Robert, 2011).
Traditions or rather conventions are for the most part arranged and composed by
proficient organizers, either by staff of the facilitating organization or by outside experts.
Most extensive urban areas have a tradition focus committed to facilitating such
occasions. The term MICE is generally utilized in Asia as a depiction of the business. It is
a standout amongst the most components in the MICE tourism.
The United States of America Constitution has an arrangement for the calling of an
established tradition, whereby representatives of the states are assembled upon to an
uncommon conference to change or draft the constitution. The Constitution additionally
has arrangements for established revisions to be endorsed by state traditions of the
22
general population. These methods struck approve the first constitution and to embrace
the twenty-first alteration, which finished disallowance.
A research study done by Zutt (2010) discovered that gathering tourism includes different
areas of the economy-stationery suppliers, interpreters, sustenance and cooking specialist
co-ops, drivers and some more. Additionally profiting by meetings are providers of
hardware, for example, overhead projectors, scanners and different ICT administrations.
Likewise one of the basic contributions for holding a meeting of global stature is to
guarantee consistent air travel. This is then trailed by guaranteeing that the large numbers
of representatives have an agreeable, considerably more essential remain amid the
gathering time frame. This works to help cities compete to attract this business not only
with each other but with other types of places such as resorts and rural areas in the case of
small conferences. So, as he further pointed out, the economic prize is great but so is the
competition. This should make cities think deeply before investing in the construction of
facilities.
Mauser (2005) directed an examination on the elements affecting gathering participation,
he distinguished primary factors as: availability, emissiveness which alludes to the
inclination of individuals from the gathering to go to yearly meeting this incorporates
qualities, for example, pay and populace and allure, with appeal fusing the atmosphere,
relaxation civilities and social exercises. Cost, et al (2003), additionally clarifies that
while including these appealing relaxation luxuries and social exercises, it is useful for
meeting organizer to ponder the socioeconomics/social qualities of its participants in
23
order to incorporate exercises that will hold any importance with those going to the
meeting.
MPI Foundation, (2000) researched the reasons why individuals go to yearly affiliation
gatherings; they discovered that meeting participants can be assembled into five classes
which are information searchers, esteem based participants, social organizers,
accommodation driven participants, and animals of propensity. They discovered that
information searchers and the social organizers are the most happy with yearly affiliation
gatherings. The learning searchers for this situation were the individuals who are there to
add as far as anyone is concerned of the calling. The social organizers were the
individuals who are most worried about meeting associates in the business and need to
convey family to blend business with joy. Their fulfillment was because of the
thoughts/instruments gave, speaker quality and systems administration openings gave
(Trombino et al., 2000).
Oppermann (1996) additionally remarks that business viewpoints are just a single of the
reasons identified with going to traditions and gatherings. Affiliations tend to put
extraordinary significance on different components (Readman, 2003). There are exercises
intended to energize social collaboration these are those exercises booked inside any
tradition or meeting. These exercises may incorporate nourishment and refreshment
social occasions, expos and recreational or sports exercises, for example, golf or tennis
(Yang & Gu, 2011).

24
2.3.4 Effect of Events on Hotel Performance
Events are expressed through the presentations about products and services towards a
specific group of audiences with the aim of selling products. Thus, an exhibition along
with a sightseeing tour will make a greater impression on the customers and help increase
products’ sales (Tyrel, 2013). According to Getz, (2008) trade fairs involve marketing
investment by the participating organizations. Expenses are caused at the show for
administrations, for example, electrical, corner cleaning, web administrations, and
drayage which are otherwise called material taking care of. Many organizations promote
trade shows to enhance economic development.
Attendees attending the event in many cases are asked to utilize an exhibitor manual or
online exhibitor manual to arrange their required administrations and finish any vital
printed material, for example, wellbeing and security assertions. There is an increasing
number of virtual tradeshows which are trade fairs happening online. They are expanding
in ubiquity because of their moderately ease and in light of the fact that there is no
compelling reason to travel whether you are going to or displaying.
An investigation did by Braley (2008) discovered that the interest for MICE limit is
dubious and exceedingly regular and tradition and presentation offices, similar to lodging
rooms, are perishable .CEIR(2009) additionally contends that the request of the MICE
business is normally influenced via seasons, occasions, and climate conditions. Further,
changes in the economy and rivalry from matching goals dependably aim dubious
markets to a MICE goal or destination.

25
International Congress and Convention Association (ICCA) measurements appear, that a
total of 400,000 gatherings and Events are held worldwide consistently at the aggregate
cost of US$280 billion. The Global Association of the Exhibition Industry (UFI) calls
attention to that as yearly MICE tourism industry yield esteem has just achieved
US$1.16trillion (counting US$400 billion for gatherings and US$760 billion for
exhibitions),MICE could be relied on to convey gigantic monetary advantage to the
nations and urban areas that host them (GIS, 2012).
2.3 Theoretical Framework
The study is guided by theory of the competitive advantage of nations by Michael
Porter’s (1991). The theory provides a tool for analyzing competitiveness. Porter’s theory
contributes to better understanding of the competitive advantage of nations in
international trade and production. It focuses on individual industries, clusters of
industries, where the principles of competitive advantage are applied. Michael Porter’s
theory begins from individual industries and builds up to the economy as a whole. Since
firms, compete in international markets, it is important to understand the way firms create
and sustain competitive advantage which is the key to explaining role the nation plays in
the process.
Porter’s theory of competitive advantage looks at MICE tourism as a strategy that
improves tourism in a destination. To remain competitive enough the destination has to
create a differentiating factor from other destinations which in this case is the hotels in
26
Mombasa Town. Therefore the study is looking at MICE as a product used to gain
competitive advantage and hence gain cost leadership.
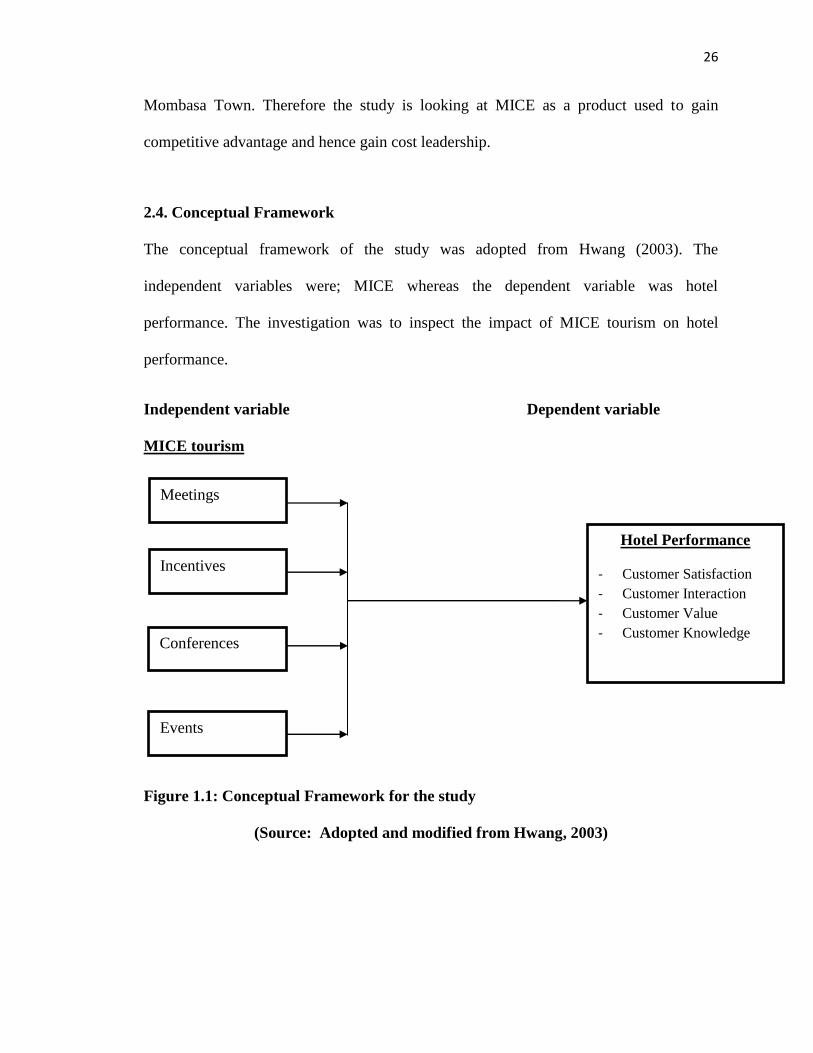
2.4. Conceptual Framework
The conceptual framework of the study was adopted from Hwang (2003). The
independent variables were; MICE whereas the dependent variable was hotel
performance. The investigation was to inspect the impact of MICE tourism on hotel
performance.
Independent variable Dependent variable
MICE tourism
Figure 1.1: Conceptual Framework for the study
(Source: Adopted and modified from Hwang, 2003)
Meetings
Incentives
Conferences
Events
Hotel Performance
- Customer Satisfaction
- Customer Interaction
- Customer Value
- Customer Knowledge
27
CHAPTER THREE
RESEARCH DESIGN AND METHODOLOGY
3.1 Introduction
This chapter describes the research design and methodology that was employed to collect
the data and information from the field. The chapter also outlines study area, study
population and target population, sampling procedure and instrument of data collection,
validity and reliability of the research instruments. Finally a description of how the data
collected was analyzed and presented.
3.2 Research Design
A research design is the arrangement of conditions for collection and analysis of data
(Cooper & Schindler 2008; Kothari, 2004). The study adopted a descriptive research
design to establish the associations among the key study variables with the intent of
generalizing from a sample to a population (Creswell, 2014). This involves gathering of
data at a particular point in time with the intention of describing the nature of existing
conditions (Creswell, 2014). Moreover, descriptive research design has been widely used
in tourism industry by different authors within the hospitality and tourism industry
research (Fwaya et al., 2012; Wadongo et al., 2010).

28
3.2 Study Area and Methodology
The research was conducted in Mombasa County. The County is located within the
coastal region of Kenya (Ngumbao, 2012). Mombasa County, as part of the larger coastal
tourism circuit, has been the epicenter of coastal and marine tourism in Kenya over the
years. The county possesses different attractions including Mombasa Old Town and Fort
Jesus, beaches like Nyali, Bamburi, Pirates and Shanzu beaches, marine parks like
Mombasa Marine National Park and Reserve. Mombasa County was chosen as the study
area because of its strategic location and suitability for MICE tourism in terms of
location, weather, infrastructure and rich tourist sites which could complement MICE
tourism product development. A survey and managerial opinion in 2010 also revealed
that both Nairobi and Mombasa are regarded as the most suitable destinations in Kenya
for MICE tourism promotion (Sarova Hotels, 2012).
3.3 Target Population
A population is defined as the entire group of individuals who possess some common
observable characteristics that can be studied in a research study while the target
population is a more narrowly defined and manageable population identified for use in a
research study (Mugenda & Mugenda, 2003). The target population for this study
included hotels head of departments in Marketing, Reservations, accounts, human
resources, food and beverage, and security and maintenance within three and four star
rated hotels in Mombasa as per the Tourism Regulatory Authority rating of hotels under
Kenyan Gazette Notice on 5th August 2016. They are 11 in Mombasa County. This was
29
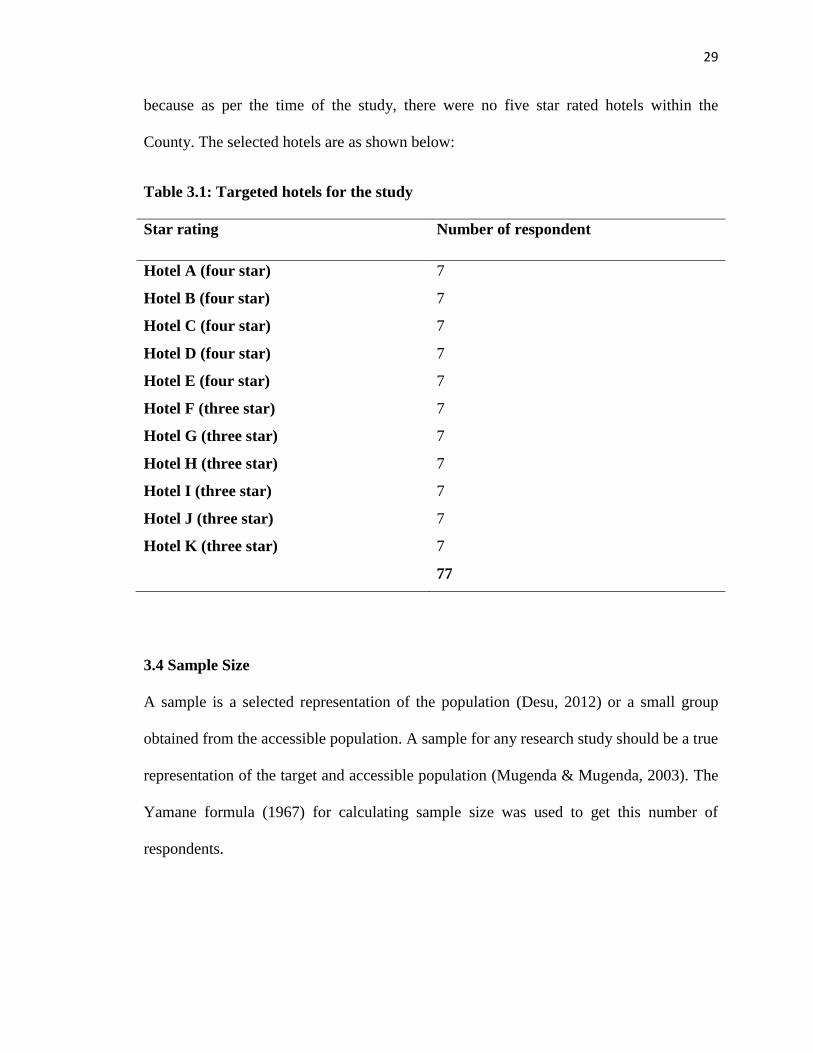
because as per the time of the study, there were no five star rated hotels within the
County. The selected hotels are as shown below:
Table 3.1: Targeted hotels for the study
Star rating Number of respondent
Hotel A (four star)
Hotel B (four star)
Hotel C (four star)
Hotel D (four star)
Hotel E (four star)
Hotel F (three star)
Hotel G (three star)
Hotel H (three star)
Hotel I (three star)
Hotel J (three star)
Hotel K (three star)
7
7
7
7
7
7
7
7
7
7
7
77
3.4 Sample Size
A sample is a selected representation of the population (Desu, 2012) or a small group
obtained from the accessible population. A sample for any research study should be a true
representation of the target and accessible population (Mugenda & Mugenda, 2003). The
Yamane formula (1967) for calculating sample size was used to get this number of
respondents.
30
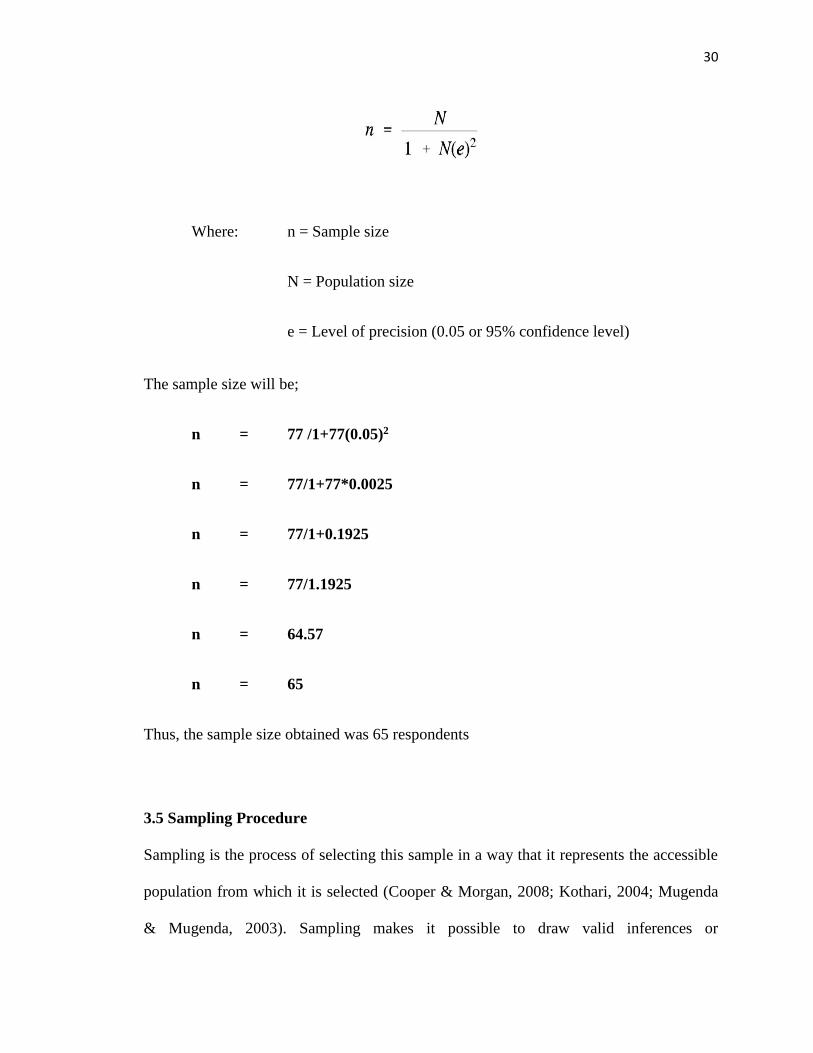
Where: n = Sample size
N = Population size
e = Level of precision (0.05 or 95% confidence level)
The sample size will be;
n = 77 /1+77(0.05)2
n = 77/1+77*0.0025
n = 77/1+0.1925
n = 77/1.1925
n = 64.57
n = 65
Thus, the sample size obtained was 65 respondents
3.5 Sampling Procedure
Sampling is the process of selecting this sample in a way that it represents the accessible
population from which it is selected (Cooper & Morgan, 2008; Kothari, 2004; Mugenda
& Mugenda, 2003). Sampling makes it possible to draw valid inferences or

31
generalizations on the basis of careful observation of variables with a relatively small
proportion of the population (Kothari, 2004). The study used purposive sampling to select
the three and four star rated hotels and simple random sampling to select managers in
every hotel who form part of the respondents.
3.6 Research Instruments
The study used questionnaires in primary data collection. The researcher chose self-
administration of questionnaires because it is quicker and cheaper to administer over a
geographically widely dispersed region besides facilitating easy derivation of information
from respondent (Kothari, 2004). The choice of questionnaires was guided by the nature
of the data to be collected and the objectives of the study and covered variables that could
not be directly observed. Further, questionnaires enable collection of a lot of information
that can provide opinion judgement regarding study variables (Kothari, 2004).
The questionnaires were structured in a way that they had both open and closed ended
questions. Closed ended questions enhance consistency of responses given across
respondents besides being popular with the respondents (Fraenkel & Wallen, 2003).
According to Cohen et al. (2007), closed ended questions limit the breadth of responses
given by participants, hence the researcher also considered some open ended questions
with the aim of capturing richness, in-depth and freedom of expression from the
respondents

32
3.7 Pilot Study
Pre-testing of the research instruments was done in two hotels (one three star rated and
one four star rated) selected by random sampling. The two hotels were located in Kwale
County, Kenya. This sample was convenient in terms of time and resources. The
instruments were tested for their validity and reliability on eliciting relevant information
on the research objectives. According to Mugenda and Mugenda (2003), a sample of
between 10% is adequate for a pilot study in a research study.
3.8 Validity and Reliability
3.8.1 Validity of the research instrument
The validity of an instrument is defined as the degree to which it measures accurately
what it is purported to measure, mainly the data anticipated for collection based on the
objectives of that study (Mugenda & Mugenda, 2003). According to Cohen et al. (2007),
there are two types of validity; internal and external validity. Internal validity comprises
face, content, construct and criterion validity while external validity focuses on the extent
to which study findings can be generalized.
Face validity refers to the extent to which an instrument seems to cover concepts it
purports to measure. This was established through the review of literature on the
variables being studied to determine their appropriateness. Content validity refers to the
degree to which the research instrument appropriately represents the content domain it is
intended to measure thus adequately covers the topic under study. When an instrument is

33
judged to have high content validity, its content is considered to be congruent with the
testing purpose and with prevailing notions of the subject matter being tested (Borg &
Gall, 1989). Through literature review, this study was able to verify that variables under
study were adequately covered. The researcher constructed the questionnaires with
guidance from research supervisors to address both content and face validity.
3.8.2 Reliability of the research instrument
Reliability is the degree of consistency of a research instrument and the accuracy of the
target attributes (Kombo & Tromp, 2008). According to Cohen et al. (2007), a reliability
level is acceptable at 0.7. To determine the reliability of instruments that were used in the
current study, the research instrument was piloted in two hotels that were not finally
included in the study sample. Responses given were checked to ascertain the extent to
which they yielded relevant data.
Further, the researcher computed the Cronbach alpha internal consistency coefficient.
This coefficient allows for the assessment of consistency of research items in measuring
the research variables. The questionnaire yielded Cronbach alpha internal consistency
coefficients of 0.824, which was considered reliable.
3.9 Data Collection Procedure
Before proceeding for data collection, the researcher sought clearance from the Dean,
School of Business and Management Sciences then authorization to conduct research
34
from the National Commission for Science, Technology and Innovation (NACOSTI).
Thereafter, the researcher visited the various selected hotels for study.
3.10 Data Analysis and Presentation
According to Mugenda and Mugenda (2003), data analysis is the process of bringing
order and meaning to raw data collected. It is also a way towards bringing structure and
significance to the mass of data gathered (Orodho & Kombo 2002). Research data was
analyzed using descriptive statistics both descriptive statistics such as frequency and
mean and inferential statistics using regression analysis to establish relationships.
3.10.1 Multiple Regression Analysis
Multiple regression analysis is a technique used to explore the relationship between one
continuous dependent variable and a number of continuous independent variables
(Kothari, 2004). The study chose this technique because it is able to tell how well a set of
variables (several independent variables) are able to predict a particular outcome (the
dependent variable). This study intended to establish the effect of MICE tourism products
(independent variables) on Hotel Performance (dependent variable) as guided by the
following model:
Y= β0+ β1X1 + β2X2 + β3X3 + β4X4+e
X1 = Meeting
X2 =Incentive
35
X3 =Conference
X4 =Exhibition
e = Error term
Y= Hotel Performance
3.11 Ethical Consideration
Researchers have the obligation to treat both the participants and the information they
provide with honesty and respect (Catherine, 2002). Research ethics defines what
researchers should and should not do when conducting research. Hence researchers have
a professional and moral obligation to act ethically. The researcher obtained permission
to carry out the study from all relevant bodies including the hotels before data collection
process began. The researcher took time to explain the purpose of the study and the
benefits of its findings hence requested participants to voluntarily participate in the study.
The researcher also stressed that participants were free to decline participation or even
withdraw from the study without any consequences if they felt uncomfortable. Further,
the researcher assured participants of anonymity and confidentiality on the information
provided.

36
CHAPTER FOUR
DATA ANALYSIS, RESULTS AND INTERPRETATION
4.0 Introduction
The chapter presents results on the effect of MICE tourism on the performance of three
and four star rated hotels in Mombasa County. The dependent variable was hotel
performance and the independent variables were meetings; incentives; conference and
events. Ten hotels were sampled with sixty dully filled questionnaires from the
respondents representing 92% response rate.
Table 4.1 Response rate by the respondents
Sampled Hotel Number
1. Hotel A (four star)
2. Hotel B(four star)
3. Hotel C (four star)
4. Hotel D (four star)
5. Hotel E (four star)
6. Hotel F (three star)
7. Hotel G (three star)
8. Hotel H (three star)
9. Hotel I (three star)
10. Hotel J (three star)
Total
6
7
7
7
6
5
6
5
5
6
60
37
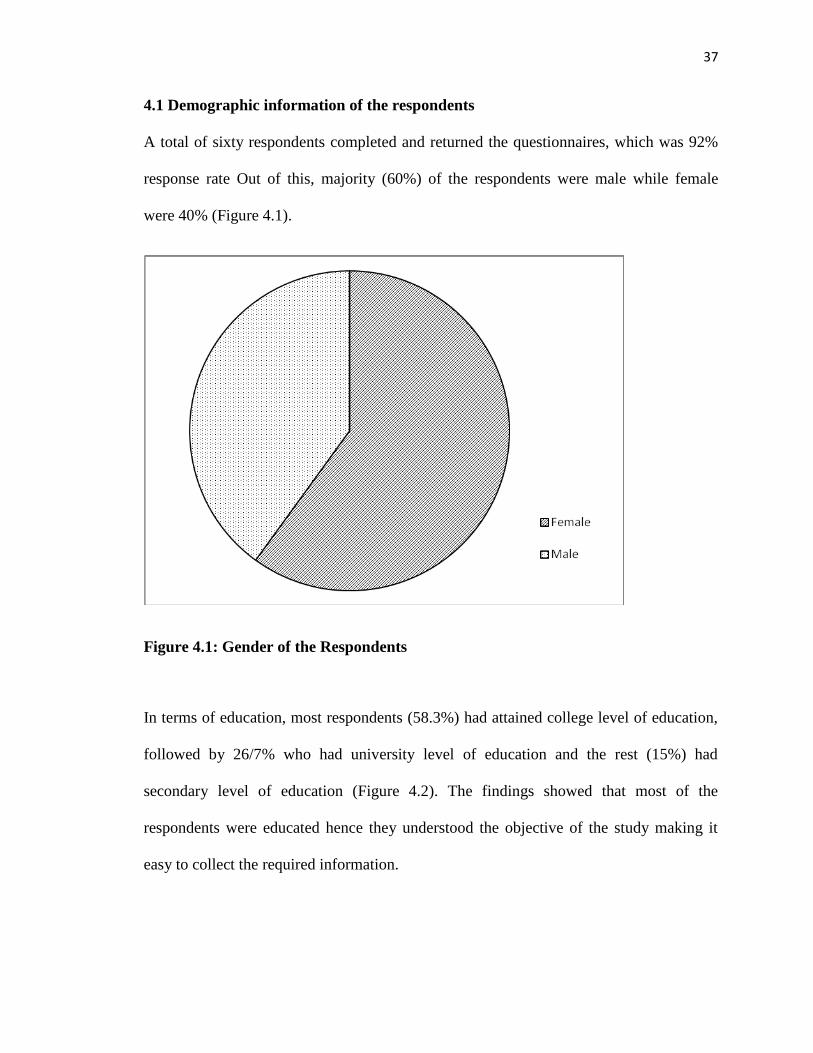
4.1 Demographic information of the respondents
A total of sixty respondents completed and returned the questionnaires, which was 92%
response rate Out of this, majority (60%) of the respondents were male while female
were 40% (Figure 4.1).
Figure 4.1: Gender of the Respondents
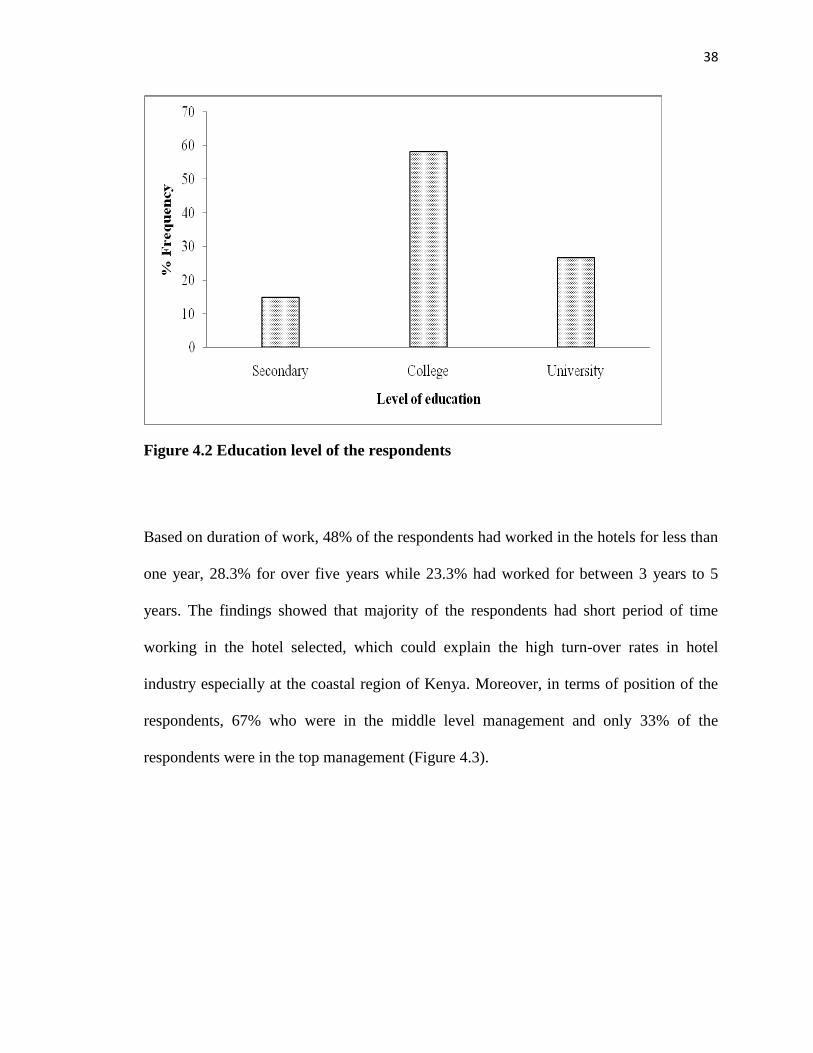
In terms of education, most respondents (58.3%) had attained college level of education,
followed by 26/7% who had university level of education and the rest (15%) had
secondary level of education (Figure 4.2). The findings showed that most of the
respondents were educated hence they understood the objective of the study making it
easy to collect the required information.
38
Figure 4.2 Education level of the respondents
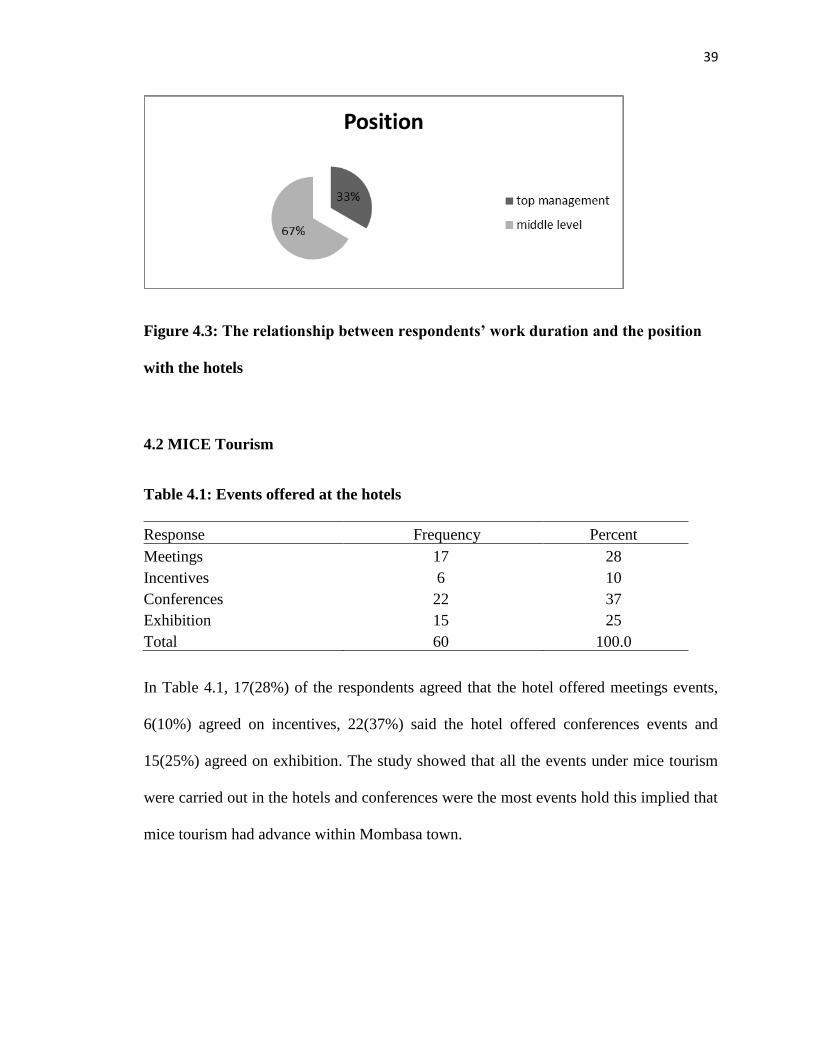
Based on duration of work, 48% of the respondents had worked in the hotels for less than
one year, 28.3% for over five years while 23.3% had worked for between 3 years to 5
years. The findings showed that majority of the respondents had short period of time
working in the hotel selected, which could explain the high turn-over rates in hotel
industry especially at the coastal region of Kenya. Moreover, in terms of position of the
respondents, 67% who were in the middle level management and only 33% of the
respondents were in the top management (Figure 4.3).
39
Figure 4.3: The relationship between respondents’ work duration and the position
with the hotels
4.2 MICE Tourism
Table 4.1: Events offered at the hotels
Response Frequency Percent
Meetings 17 28
Incentives 6 10
Conferences 22 37
Exhibition 15 25
Total 60 100.0
In Table 4.1, 17(28%) of the respondents agreed that the hotel offered meetings events,
6(10%) agreed on incentives, 22(37%) said the hotel offered conferences events and
15(25%) agreed on exhibition. The study showed that all the events under mice tourism
were carried out in the hotels and conferences were the most events hold this implied that
mice tourism had advance within Mombasa town.
40
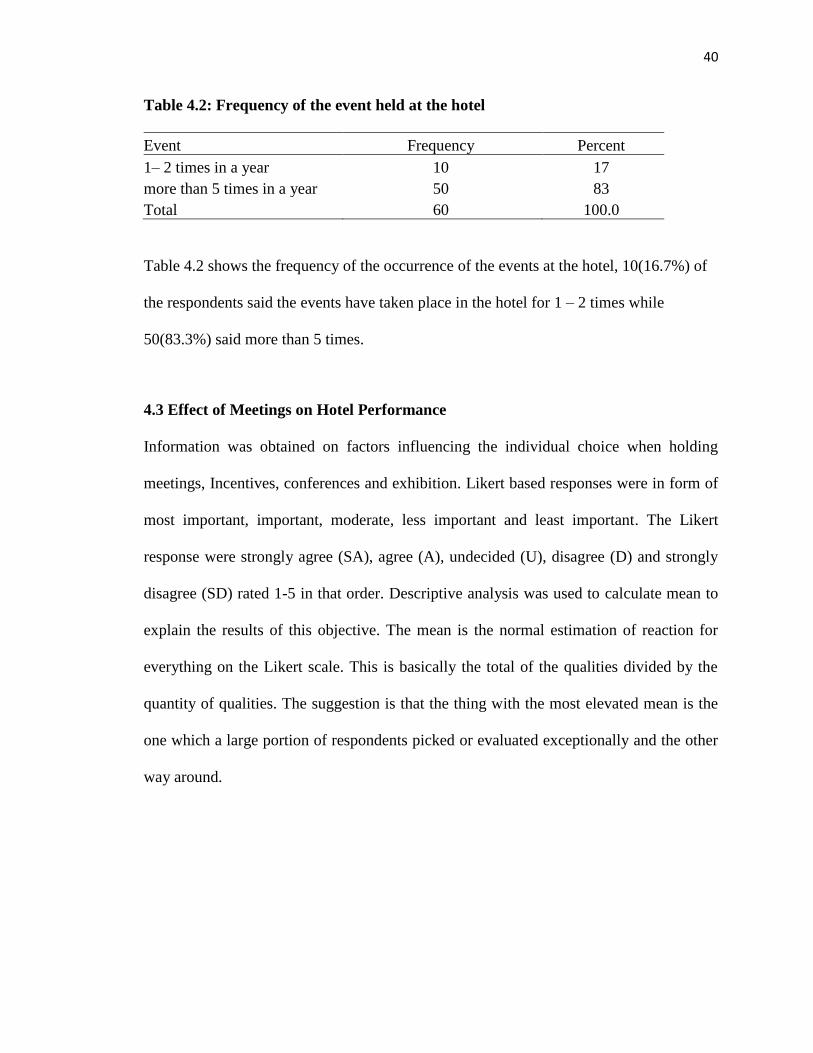
Table 4.2: Frequency of the event held at the hotel
Event Frequency Percent
1– 2 times in a year 10 17
more than 5 times in a year 50 83
Total 60 100.0
Table 4.2 shows the frequency of the occurrence of the events at the hotel, 10(16.7%) of
the respondents said the events have taken place in the hotel for 1 – 2 times while
50(83.3%) said more than 5 times.
4.3 Effect of Meetings on Hotel Performance
Information was obtained on factors influencing the individual choice when holding
meetings, Incentives, conferences and exhibition. Likert based responses were in form of
most important, important, moderate, less important and least important. The Likert
response were strongly agree (SA), agree (A), undecided (U), disagree (D) and strongly
disagree (SD) rated 1-5 in that order. Descriptive analysis was used to calculate mean to
explain the results of this objective. The mean is the normal estimation of reaction for
everything on the Likert scale. This is basically the total of the qualities divided by the
quantity of qualities. The suggestion is that the thing with the most elevated mean is the
one which a large portion of respondents picked or evaluated exceptionally and the other
way around.

41
Table 4.3: Effects of meetings on hotel performance
Factors
influencing
the choice of
holding
meetings
Strongly
disagree
Disagree Undecided Agree Strongly agree
Mean F % F % F % F % F %
Location 2 3.3 9 15 - - 24 40 25 42 4.02
Sufficient
infrastructure
9 15 4 7 - - 6 10 41 68 4.10
Price 9 15 - - 4 7 8 13 39 65 4.13
Customer
service
satisfaction
9 15 - - - - 25 42 26 43 3.98
Security and
safety
9 15 - - - - 17 28 34 57 4.12
Key: F=Frequency
Table 4.3 shows that 21(3%) strongly disagreed, 9(15%) disagreed that location affected
the choice of holding meetings in the institution, 24(40%) agreed and 25(42%) strongly
agreed with the statement but none of them was undecided. 9(15%) strongly disagreed
that sufficient infrastructure was a factor making them choose the location of their
meetings, 4(7%) disagreed, 6(10%) agreed and 41(68%) strongly agreed with it been the
factor but none was undecided. 9(15%) of the respondents strongly disagreed on price as
the factor, 4(6.7%) were undecided, 8(13.3%) agreed and majority of them 39(65.0%)
strongly agreed with the factor but none of them disagreed. 9(15%) strongly disagreed
that customer service satisfaction was a factor influencing the choice of where to hold the
meetings, 25(41.7%) agreed and 26(43.3%) strongly agreed but none of them either
disagreed or was undecided. 9(15%) of the respondents strongly disagreed that security
and safety influenced their choice, but 17(28.3%) agreed and 34(56.7%) strongly agreed
but none of them either disagreed or was undecided.
42
According to the means observed in the findings, there are factors influencing the choice
of holding meetings in an institution as shown by the high means of the variables above.
Security and safety was mostly agreed on as been the factor to be chosen while deciding
where to hold the meetings. This implied that clients majorly look at the safety and
security of the venue before choosing where to hold their meetings, in that without
security no attendance can take place.
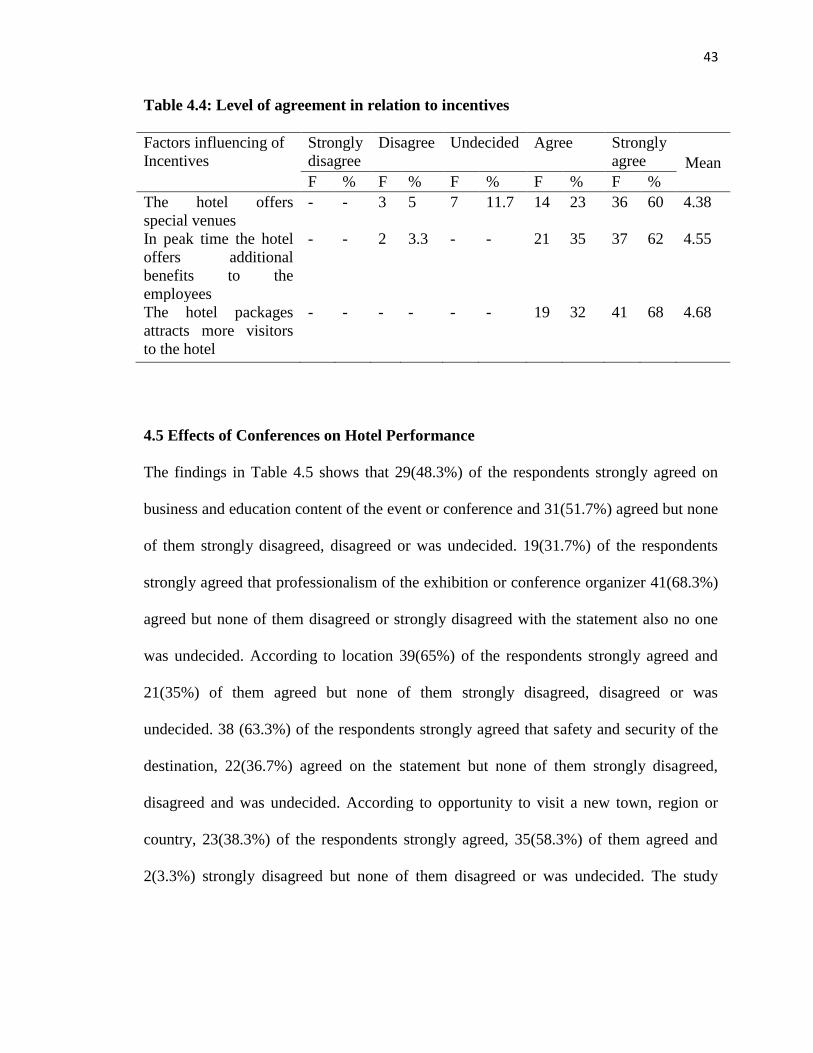
4.4 Effects of Incentives on Hotel Performance
The findings above in table 4.4 shows that respondents strongly agreed that the hotel
offers special venues as they were 36(60%), 14(23.3%) agreed, 7(11.7%) were
undecided, 3(5%) disagreed but none of the strongly disagreed. 37(61.7%) of the
respondents strongly agreed that in peak time the hotel offers additional benefits to the
employees, 21(35%) of them agreed and 2(3.3%) disagreed but none of them either
strongly disagreed or was undecided.41(68.3%) of the respondents strongly agreed that
hotel packages attracts more visitors to the hotel, and 19(31.7%) agreed but none of them
strongly disagreed, disagreed and was undecided. Mostly agreed component was that the
hotel packages attract more visitors to the hotel. Therefore for every hotel to increase its
performance through incentives its packages must be attractive to the customers and also
to its employees.
43
Table 4.4: Level of agreement in relation to incentives
Factors influencing of
Incentives
Strongly
disagree
Disagree Undecided Agree Strongly
agree Mean
F % F % F % F % F %
The hotel offers
special venues
- - 3 5 7 11.7 14 23 36 60 4.38
In peak time the hotel
offers additional
benefits to the
employees
- - 2 3.3 - - 21 35 37 62 4.55
The hotel packages
attracts more visitors
to the hotel
- - - - - - 19 32 41 68 4.68
4.5 Effects of Conferences on Hotel Performance
The findings in Table 4.5 shows that 29(48.3%) of the respondents strongly agreed on
business and education content of the event or conference and 31(51.7%) agreed but none
of them strongly disagreed, disagreed or was undecided. 19(31.7%) of the respondents
strongly agreed that professionalism of the exhibition or conference organizer 41(68.3%)
agreed but none of them disagreed or strongly disagreed with the statement also no one
was undecided. According to location 39(65%) of the respondents strongly agreed and
21(35%) of them agreed but none of them strongly disagreed, disagreed or was
undecided. 38 (63.3%) of the respondents strongly agreed that safety and security of the
destination, 22(36.7%) agreed on the statement but none of them strongly disagreed,
disagreed and was undecided. According to opportunity to visit a new town, region or
country, 23(38.3%) of the respondents strongly agreed, 35(58.3%) of them agreed and
2(3.3%) strongly disagreed but none of them disagreed or was undecided. The study

44
observed among all the factors that location affects the choice of location when carrying
out conferences
Table 4.5: Level of agreement in relation to Conferences
Questionnaire item
Strongly
disagree
Disagree Undecided Agree Strongly
agree Mean
F % F % F % F % F %
Business and education
content of the or
conference
- - - - - - 31 52 29 48 4.48
Professionalism of the
exhibition or conference
organizer
- - - - - - 41 68 19 32 4.32
Location - - - - - - 21 35 39 65 4.65
Safety and security of the
destination
- - - - - - 22 37 38 63 4.63
Opportunity to visit a
new town, region or
country
2 3.3 - - - - 35 58 23 38 4.28
4.6 Effects of Events on Hotel Performance
Table 4.6 below shows that in choosing where to carry out Events here are factors
considered by the clients as agreed by the respondents, 36(60%) agreed that cost
affordability was most important in choosing the venue for exhibition, 24 (40%) of them
said important but none of them said least important, less important and moderate. 37
(61.7%) of the respondents said service quality professionalism was most important
23(38.3%) said it was important but none of them said it was least important, less
important. 39(65%) of the respondents said leisure and entertainment facilities was most
important, 8(13.3%) said it was important, 8(13.3%) was moderate and 5(8.3%) said least
important but none of them said less important. 40(66.7%) of the respondents said
infrastructure accessibility said it was most important, 20(33.3%) of the respondents said

45
it was important but none of them said least important, less important and moderate.
45(75%) of the respondents said business-Friendliness image was most important,
15(25%) said important but none of them said least important, less important and
moderate. Hence business friendliness image was considered important by the
respondents when choosing the factors influencing events in the hotel.
Table 4.6: Level of agreement in relation to Events
Factors
influencing events
Least
important
Less
important
Moderate Important Most
important Mean
F % F % F % F % F %
Cost affordability - - - - - - 24 40 36 60 4.60
Service quality
professionalism
- - - - - - 23 38 37 62 4.62
Leisure and
entertainment
facilities
5 8.3 - - 8 13.
3
8 13 39 65 4.27
Infrastructure
accessibility
- - - - - - 20 33 40 67 4.67
Business-
Friendliness image
- - - - - - 15 25 45 75 4.75
4.7 Hotel Performance
The findings in table 4.7 shows that 54(90%) of the respondents strongly agreed that the
hotel ensures it understands the customer’s needs 6(10%) agreed but none of them
disagreed, strongly disagreed and none disagreed. All the respondents strongly agreed
that the hotel management ensures the customer’s data is safe and kept well as no one of
the strongly disagreed, disagreed and undecided. 32(53.3%) of the respondents strongly
agreed that with the improved technology the hotel ensures it acquires new customers,
26(43.3%) of them agreed 2(3.3%) were undecided but none of them strongly disagreed
or disagreed. 35(58.3%) strongly agreed that the hotel ensures there is safety of

46
transactions and seller empathy, 25(41.7%) agreed but none of them strongly disagreed,
disagreed, and undecided.
Table 4.7: Customer Knowledge
Customer knowledge
attributes
Strongly
disagree
Disagree Undecided Agree Strongly
agree Mean
F % F % F % F % F %
The hotel ensures it
Understands the
customer’s needs
- - - - - - 6 10 54 90 4.9
The hotel management
ensures the customers
data is safe and kept well
- - - - - - - - 60 100 5.00
With the improved
technology the hotel
ensures it acquires new
customers
- - - - 2 3.3 26 43 32 53 4.50
The hotel ensures there
is safety of transactions
and seller empathy
- - - - - - 25 42 35 58 4.58
The hotel ensures it
improves its employee
skills so as to ensure
their customers’ needs
are understood better
2 3.3 - - - - 21 35 39 65 4.65
39(65%) of the respondents strongly agreed that the hotel ensures it improves its
employee skills so as to ensure their customers’ needs are understood better, 21(35%) of
the respondents agreed and 2(3.3%) strongly disagreed but none of them disagreed or was
undecided. Therefore it is important for the hotel to ensure the data of each and every
client is well kept, which boost the trust given to the hotel by the customer.
4.7.1 Customer Value
The findings in table 4.8 shows that 49(87.7%) of the respondents strongly agreed that
the hotel ensures it does follow ups so as to retain its customers 11(18.3%) agreed but

47
none of them disagreed, strongly disagreed and none disagreed. 32 (53.3%) of the
respondents strongly agreed that the hotel has improved its services to cater for each and
every customers demands. 28(43.7%) of the respondents, none of the respondents were
undecided, disagreed or strongly disagreed. 41(68.3%) of the respondents strongly agreed
that the hotel manages its profit increase with the increase of customers attained,
14(23.3%) agreed, 2 (3.3%) of the respondents were undecided, 3(5%) disagreed. On
whether the hotel ensures there is consistency of maintaining its brand majority of the
respondents 50(83.3%) strongly agreed while 10(16.7%) agreed, none of the respondents
who were undecided, disagreed or strongly disagreed. Hence therefore keeping and
maintaining the brand of the hotel will help in reducing any sudden changes among the
clients.
Table 4.8: Customer Value
Customer value
attributes
Strongly
disagree
Disagree Undecided Agree Strongly
agree Mean
F % F % F % F % F %
The hotel ensures it
does follow ups so as to
retain its customers
- - - - - - 11 18 49 82 4.82
The hotel has improved
its services to cater for
each and every
customers demands
- - - - - - 28 47 32 53 4.53
The hotel manages its
profit increase with the
increase of customers
attained
- - 3 5 2 3.3 14 23 41 68 4.55
The hotel ensures there
is consistency of
maintaining its brand
- - - - - - 10 17 50 83 4.83

48
4.7.1 Customer Interaction
Table 4.9 shows that 35 (58.3%) and 25(41.7%) of the respondents strongly agreed and
agreed respectively on if the hotel offers diversified products and services none of the
respondents who were undecided, disagreed or strongly disagreed. 35 (58.3%) and
25(41.7%) of the respondents strongly agreed and agreed respectively on whether the
hotel has invested a lot in ensuring there is brand promotion to attract customers, none of
the respondents who were undecided, disagreed or strongly disagreed. On whether hotel
ensures it improves channel management by responding to customers feedback 33(55%)
of the respondents strongly agreed, 27(45%) of the respondents agreed again none of the
respondents none of the respondents who were undecided, disagreed or strongly
disagreed. Majority of the respondents representing 33(55%) strongly agreed on if the
hotel participates in community building programs so as to improve on customer
interactions, 20(33.3%) of the respondents agreed and 7(11.7%) of the respondents were
undecided, none of the respondents who disagreed or strongly disagreed. Therefore it is
important to keep the brand promotion and also offering diversified products and services
will help in attracting customers.
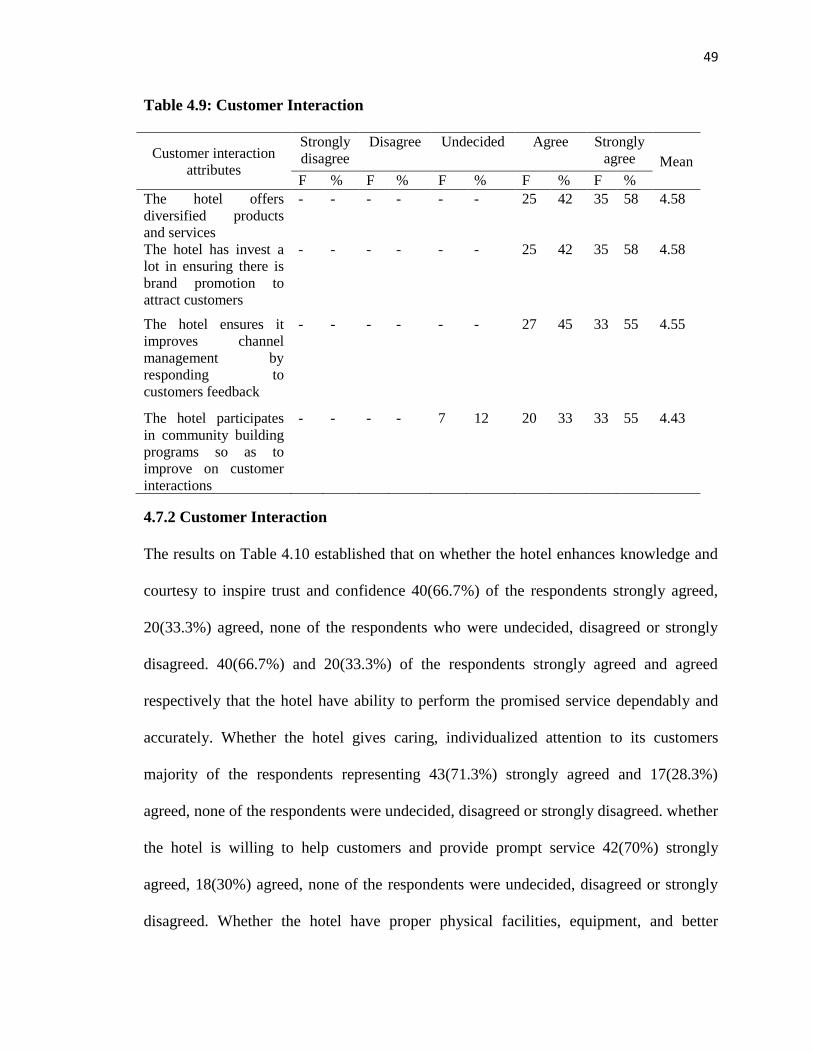
49
Table 4.9: Customer Interaction
Customer interaction
attributes
Strongly
disagree
Disagree Undecided Agree Strongly
agree Mean
F % F % F % F % F %
The hotel offers
diversified products
and services
- - - - - - 25 42 35 58 4.58
The hotel has invest a
lot in ensuring there is
brand promotion to
attract customers
- - - - - - 25 42 35 58 4.58
The hotel ensures it
improves channel
management by
responding to
customers feedback
- - - - - - 27 45 33 55 4.55
The hotel participates
in community building
programs so as to
improve on customer
interactions
- - - - 7 12 20 33 33 55 4.43
4.7.2 Customer Interaction
The results on Table 4.10 established that on whether the hotel enhances knowledge and
courtesy to inspire trust and confidence 40(66.7%) of the respondents strongly agreed,
20(33.3%) agreed, none of the respondents who were undecided, disagreed or strongly
disagreed. 40(66.7%) and 20(33.3%) of the respondents strongly agreed and agreed
respectively that the hotel have ability to perform the promised service dependably and
accurately. Whether the hotel gives caring, individualized attention to its customers
majority of the respondents representing 43(71.3%) strongly agreed and 17(28.3%)
agreed, none of the respondents were undecided, disagreed or strongly disagreed. whether
the hotel is willing to help customers and provide prompt service 42(70%) strongly
agreed, 18(30%) agreed, none of the respondents were undecided, disagreed or strongly
disagreed. Whether the hotel have proper physical facilities, equipment, and better
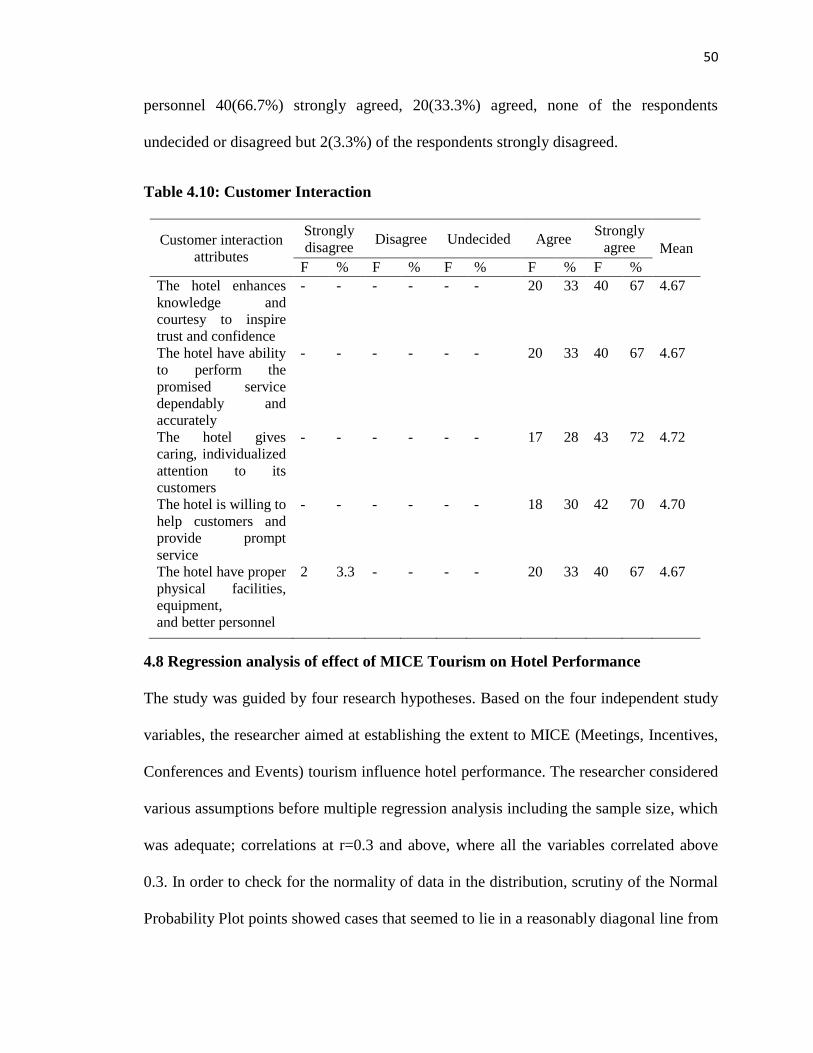
50
personnel 40(66.7%) strongly agreed, 20(33.3%) agreed, none of the respondents
undecided or disagreed but 2(3.3%) of the respondents strongly disagreed.
Table 4.10: Customer Interaction
Customer interaction
attributes
Strongly
disagree Disagree Undecided Agree
Strongly
agree Mean
F % F % F % F % F %
The hotel enhances
knowledge and
courtesy to inspire
trust and confidence
- - - - - - 20 33 40 67 4.67
The hotel have ability
to perform the
promised service
dependably and
accurately
- - - - - - 20 33 40 67 4.67
The hotel gives
caring, individualized
attention to its
customers
- - - - - - 17 28 43 72 4.72
The hotel is willing to
help customers and
provide prompt
service
- - - - - - 18 30 42 70 4.70
The hotel have proper
physical facilities,
equipment,
and better personnel
2 3.3 - - - - 20 33 40 67 4.67
4.8 Regression analysis of effect of MICE Tourism on Hotel Performance
The study was guided by four research hypotheses. Based on the four independent study
variables, the researcher aimed at establishing the extent to MICE (Meetings, Incentives,
Conferences and Events) tourism influence hotel performance. The researcher considered
various assumptions before multiple regression analysis including the sample size, which
was adequate; correlations at r=0.3 and above, where all the variables correlated above
0.3. In order to check for the normality of data in the distribution, scrutiny of the Normal
Probability Plot points showed cases that seemed to lie in a reasonably diagonal line from

51
bottom left to top right indicating no major deviations from normal distribution. Further,
the straight line relationship with the predicted dependent variable was an indication of
linearity. Scatter plot of standardized residuals showed that residuals were roughly
rectangular distributed with most of them concentrated at the centre as required. The
multiple regression analysis results showed there exist significant positive relationship
between independent variables and dependent variable (above 0.3 preferably); Meetings,
Incentives, Conferences and Events correlate substantially with Hotel performance
(r=0.421, p<0.001; r=0.427, p<0.001; r=0.538, p<0.001; r=0.401, p<0.001 respectively).
There was also significant positive correlation between each of the independent variables
all at 0.001 alpha level. Regarding the relative importance of the four MICE products,
incentives (β2 = 0.791, p < 0.001) carried the heaviest weight for hotel performance,
followed by Conferences (β3 = 0.350, p < 0.001), Events (β4 = 0.311, p = 0.001), and
Meetings (β1= 0.019, p = 0.812) all at 95% confidence level ,therefore the study rejected
hypothesis 2,3,4 and failed to reject hypothesis 1.(Table 4.11).
Table 4.11: Standard multiple regression analysis output for coefficients results
Coefficientsa
Model
Unstandardized
Coefficients
Standardized
Coefficients
t Sig. B Std. Error Beta
1 (Constant) 3.088 .284 10.878 .000
a .004 .015 .019 .239 .812
b .361 .045 .791 7.936 .000
c .245 .061 .350 4.010 .000
d .258 .070 .311 3.662 .001
1 Dependent Variable: i
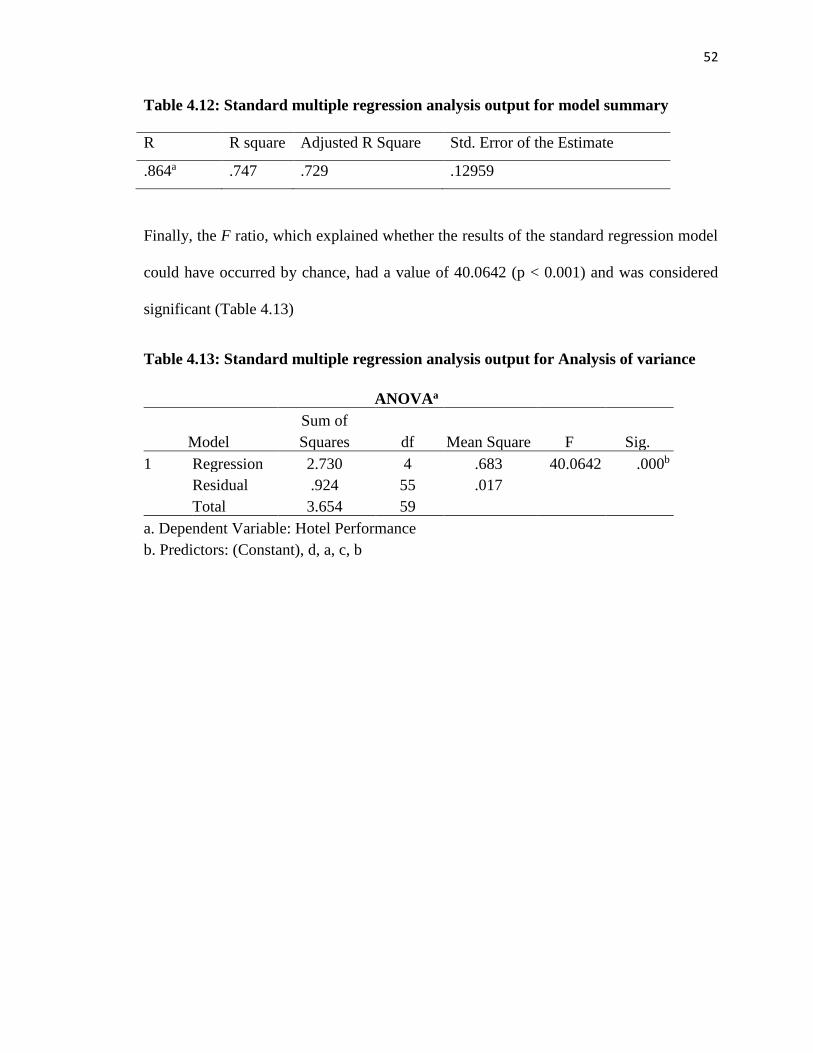
52
Table 4.12: Standard multiple regression analysis output for model summary
R R square Adjusted R Square Std. Error of the Estimate
.864a .747 .729 .12959
Finally, the F ratio, which explained whether the results of the standard regression model
could have occurred by chance, had a value of 40.0642 (p < 0.001) and was considered
significant (Table 4.13)
Table 4.13: Standard multiple regression analysis output for Analysis of variance
ANOVAa
Model
Sum of
Squares df Mean Square F Sig.
1 Regression 2.730 4 .683 40.0642 .000b
Residual .924 55 .017
Total 3.654 59
a. Dependent Variable: Hotel Performance
b. Predictors: (Constant), d, a, c, b
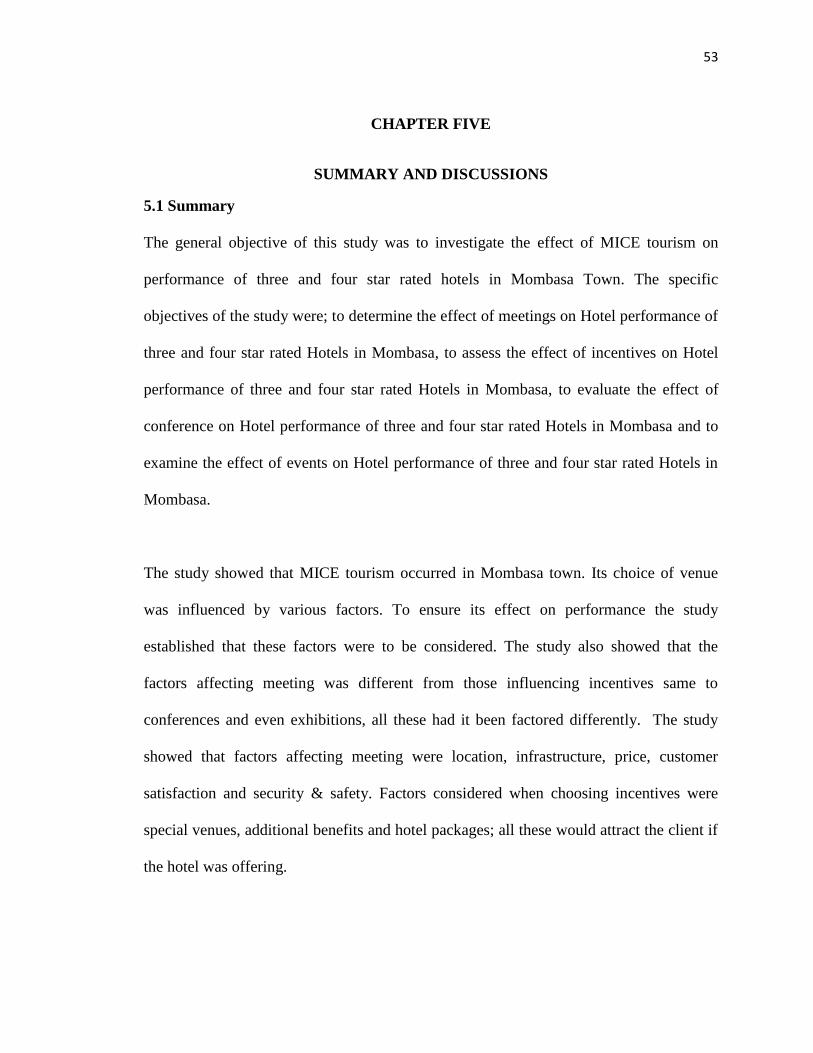
53
CHAPTER FIVE
SUMMARY AND DISCUSSIONS
5.1 Summary
The general objective of this study was to investigate the effect of MICE tourism on
performance of three and four star rated hotels in Mombasa Town. The specific
objectives of the study were; to determine the effect of meetings on Hotel performance of
three and four star rated Hotels in Mombasa, to assess the effect of incentives on Hotel
performance of three and four star rated Hotels in Mombasa, to evaluate the effect of
conference on Hotel performance of three and four star rated Hotels in Mombasa and to
examine the effect of events on Hotel performance of three and four star rated Hotels in
Mombasa.
The study showed that MICE tourism occurred in Mombasa town. Its choice of venue
was influenced by various factors. To ensure its effect on performance the study
established that these factors were to be considered. The study also showed that the
factors affecting meeting was different from those influencing incentives same to
conferences and even exhibitions, all these had it been factored differently. The study
showed that factors affecting meeting were location, infrastructure, price, customer
satisfaction and security & safety. Factors considered when choosing incentives were
special venues, additional benefits and hotel packages; all these would attract the client if
the hotel was offering.
54
The study further showed that for an individual to choose where to attend a conference
he/she will look at this factors; content of the event, professionalism, location, safety &
security and also opportunities coming with the visit. According to the exhibitions, the
study showed that one has to look at the cost, service quality, entertainment facilities,
infrastructure and its image. MICE tourism is instrumental in promoting the overall
performance of the hotel as shown by the study.
5.2 Discussion
5.2.1 General Information
The study found out that meetings and conferences was the mostly consumed MICE
products among hotels in Mombasa town. Incentives and event show there were not
popular as they were seldom held and when held were usually organized by the
respective organizations.
5.2.2 Effects of choice in holding meetings
The study found out that the major factor showing effect of the venue of meetings was
security and safety. Security in a hotel determines the safety of the client; the client will
be comfortable in a place where their security and safety is given weight. Meetings will
take place in a secured environment. This findings are in accordance with contemplate
completed by Odunga et al. (2011) found out that many cities in the United States and
abroad reported a sharp decline in MICE tourism business. He further states that many
hotels experienced layoffs and closures as well as route changes in the airlines due to
security.
55
According to incentives, the study established that majority of the respondents showed
that during peak times the hotels offered additional benefits. In peak times, the clients are
many due to good weather in Mombasa town, variety of activities which act as an added
advantage The findings are in line with Yang & Gu, (2011) who found out that the
reasons for selecting an incentive travel includes good weather, easy air connections,
popularity, safety and security, image/style, proximity to home, value for the money,
variety of activities, and effective marketing strategies developed by both destination
organizations and hospitality facilities.
The study established that location played a significant role in choosing conference
product in MICE tourism. The major aim of the attendees in conferences is to attend
educational sessions, participate in meetings/discussions, socialize, or attend other
organized events therefore its accessibility is a major factor for its attendance. Var,
Cesario, and Mauser (2005) found out that the factors that influenced conference
attendance were accessibility, emissiveness and attractiveness.
Majority of the respondents were in support that exhibition tourism should be business-
friendliness image. For a venue to be attractive its image matters this is because hosting
an exhibition is one medium that can channel products and services to potential buyers on
a regional and global scale. This findings corresponds with the report of Thailand
Convention and Exhibition bureau 2015, which indicates that an exhibition along with a
sightseeing tour will make a greater impression on the customers and help increase
products’ sales.

56
The study further summarized findings on hotel performance which based on the
customer knowledge, value, interaction and satisfaction. The study found out that
according to customer knowledge, the respondents were in support that the hotel ensures
it understands the customer’s needs and the hotel management ensures the customer’s
data is safe and kept well. The study found out that according to customer value, majority
of the respondents agreed that the hotel ensures it does follow ups so as to retain its
customers and that the hotel ensures there is consistency of maintaining its brand. The
investigation set up that on client cooperation, a number of the respondents concurred
that the hotel offers enhanced items and administrations and that the hotel has invest a lot
in ensuring there is brand promotion to attract customers. According to customer
satisfaction the investigation set up that greater part of the respondents concurred that the
hotel gives caring, individualized attention to its customers and that the hotel is willing to
help customers and provide prompt service.

57
Conclusions And Recommendations
According to the study, MICE tourism has effect on how the hotel performs, meetings,
conferences, incentives and exhibition tourism takes place in Mombasa town. Meetings
and conferences were the most encountered. For MICE tourism to be successful and to
take place in an institution there are factors to be considered which attracts more clients.
For a client to consider carrying out meetings in an institution, it should be secured and
safe, also there should be sufficient infrastructure and situated in a good location. Clark,
(2004) indicates that business tourists don’t mind spending more on inns or hotels and
eateries however even on recreation exercises, for example, visits to retail and
neighborhood attractions, for example, galleries or museums and theaters‘so long as the
hosting institution is safe and secured. When all these factors are considered by the
institution then the client will be much comfortable and hence carry out the event in the
venue.
The study draws conclusions that the hotel should offer incentives especially when there
are special venues and in peak time the hotel should offer additional benefits to the
employees and further ensures its package attracts more visitors to the hotel. When the
hotel offers good packages and benefits then it should expect more tourists to attend as
they will feel more satisfied and welcomed which in turn will have an effect on
performance. These conclusions agrees with McCartney, (2008), who investigated MICE
tourism in Mauritius and found out that the most attractive MICE segment is incentive
travels as they can bring significant economic revenues given that they are high spenders
who require up-market products and services. Further Campiranon and Arcodia, (2008)

58
concurs that the goal needs to propose selective bundles which nobody has encountered
earlier and continually outperform itself to make an alluring element or novel experience,
blending business and delight.
According to conferences, the study concluded that the major factor considered for its
choice of the venue was the content, professionalism of the conference organizer,
location, safety and security of the destination and also opportunity given to the client to
visit a new town, region or country. All conferences organized are influenced by the
infrastructure and accessibility of the venue, hence for any institution to achieve mice
benefits, should invested heavily in infrastructure development. As per Davidson, (2003),
in many meetings, participants have two principle destinations, particularly on the off
chance that they are going to gatherings abroad. To begin with that of going to the
meeting in itself and second that of benefitting as much as possible from the goal or scene
in which the gathering is being held, therefore its accessibility and location should be
considered when ensuring a proper MICE destination especially for conferences.
Regarding exhibitions, the factors influencing the choice of venue includes cost
affordability, service quality professionalism, leisure and entertainment facilities offered
by the institution, infrastructure accessibility and also business-Friendliness image should
be factored while choosing the institution. Due to the fact that exhibition is a complex
industry with multiple key players, institution need to respond and react according to the
need of their customers. Global Statistics Report, (2011) recommends that the arranging
and usage of foundations, for example, transport, Information Technology (IT) and

59
reason constructed meeting and displays settings ought to be sufficient to help the interest
for MICE. It discovered that, a sum of 1197 display lobbies worldwide have facilitated no
under 30,700 presentations in 2010 alone drawing in about 2.8 million show
organizations and more than 260 million guests. The report additionally expresses that
the accessible space for holding presentations has been on the expansion since 2006 with
a gauge of an option of 198 activities for scene building around the world. Getz, (2008),
likewise accentuated that the MICE division is encountering an ascent sought after and
keeping in mind the end goal to supply satisfactorily the business, foundation
improvement is fundamental.
The study further concluded on the measurements of hotel performance which included
customer knowledge, value, interaction and value. The study concluded on how the hotel
ensured customer knowledge as a result of MICE tourism, to ensure customer knowledge
the hotel ensures it understands the customer’s needs, also ensures the customers data is
safe and kept well and with the improved technology the hotel ensures it acquires new
customers, it ensures there is safety of transactions and seller empathy and finally the
hotel ensures it improves its employee skills so as to ensure their customers’ needs are
understood better.
The study concluded that the hotel valued its customers by carrying out follow ups,
ensures improved services to cater for each and every customer demands and also ensures
there is consistency of maintaining its brand. The study further concluded that to ensure
there is proper customer interaction, the hotel offered diversified products and services,

60
also it invest a lot on brand promotion to attract customers, improves channel
management by responding to customers feedback and participating in community
building programs. Finally the study concluded that in ensuring customer satisfaction, the
hotel enhanced knowledge and courtesy to inspire trust and confidence, the hotel
performed the promised service dependably and accurately, it gives caring, individualized
attention to its customers and also the hotel had proper physical facilities, equipment and
better personnel.
MICE tourism brings people from different countries to the destination and this can
create strong positive word of mouth. From the study Mombasa is in constant contact
with the press. For example, it organizes familiarization trips and press trips to maintain
contact with press and for publicity purposes. The destination also holds in-house training
with hosted buyers to market the MICE tourism. Moreover, to obtain greater visibility for
MICE tourism, sometimes co-branding efforts are organized with hosted buyers as well
as product launching in the destination which reinforces the marketing efforts. Apart
from enhancing the image of the destination, MICE tourism can also have other social
benefits such as events can be a trigger to revive their culture and show solidarity. In
essence, events can become an opportunity to improve social relationships, for
strengthening abilities to understand one another and for community well-being
(Kurtzman and Zauhar, 1997)

61
Recommendations
This study examined effect of MICE tourism on hotel performance on three and four star
rated hotels within Mombasa County. From the training point of view, this examination
prescribes the creation and upgrade of mindfulness among firms of the significance of
MICE tourism for tourism development as this is will greatly improve the performance of
hotels in Mombasa County and all over the country.
Service providers in the MICE tourism industry should also endeavor to understand to
detail their target markets before presenting the ‘products’ to the market or even before
planning for further investments in the same industry. Consumer tastes and preferences
are dynamic and informed by both internal and external factors.
Keeping at pace with the ever changing technology is critical. To attract the international
clientele and to gain a competitive edge in the market, being technology savvy is
inevitable. Therefore, proprietors in the MICE industry must incorporate new technology
in their services.
MICE tourism industry should strongly highlight ‘past experiences’ particularly from
renowned organizations or personalities. This can be done through endorsements from
these organizations or personalities. Brand influence the consumers’ choice of venue.
Brand/image building therefore is vital and aggressive brand building campaign is
necessary. These efforts should be anchored on advertising elements of quality and tailor-
made services designed to specifically meet the unique needs, tastes and preferences of

62
individual customers. Academics and practitioners can use the findings of this study to
fully understand how management accounting practices can help to improve business
performance in companies.
Suggestions for Further Research
Research ought to be done that additionally incorporates those cordiality foundations in
different areas to build up on the off chance that they likewise consider the MICE tourism
as imperative and to set up the more created items in tourism industry.
63
REFERENCES
Adhiambo, K. (2006).The Impact of Promotion Strategies on Consumption of Domestic
Tourism Products: A Case Study of Residents of Kisii Town, Kenya.
Ailawadi, K., & Keller, K. (2004).Understanding retail branding: Conceptual insights and
research priorities. Journal of Retailing, 80(4), 331-342.
Alba,J., Mela, C., Shimp, T., &Urbany, J. (2009). The Effect of Discount Frequency and
Depth on Consumer Price Judgments. Journal of Consumer Behavior, 26, 99 –
114
Andersson, G. (2016) Sustainability Process and Certification in the Swedish Event
Tourism Industry. J. Environ.Tour. Anal. 4, 5–29.
Astroff, M. & Abbey, J. (2006).Convention Management and Service, 7th ed.
Educational Institute American Hotel and Lodging Association, Lansing, MI.
Baloglu, S., & Love, C.(2005). Association Meeting Planners’ perceptions and intentions
for five major US convention cities: the structured unstructured images.
Tourism Management, 26, (5), 743-752.
Baum, T., Deery, M., Hanlon, C., Lockstone, L., &Smith, K.(2009). People and Work in
Events and Conventions: A Research Perspective.UK: CAB International.
BCVB (2005), General Framework of Convention Tourism.
64
Benchmark Hospitality International .(2013). Meetings and Events. Retrieved June 29,
2014, from Benchmark Hospitality International: Retrieved on 27thJune 2014
from:http://www.benchmarkresortsandhotels.com/meetings_events
Bernard, H., (2002). Research Methods in Anthropology: Qualitative and Quantitative
Methods. 3rd edition. Walnut Creek, California: AltaMira Press.
Blumberg, B., Cooper, D., & Schindler, P. (2014).Business research methods.London :
McGraw-Hill Education.
Boniface, B. & Cooper, C.(2005). Worldwide Destinations: The Geography of Travel and
Tourism. 4th ed. Burlington: Butterworth Heinemann.
Boo, S.; Park, E. (2013)An examination of green intention: the effect of environmental
knowledge and educational experiences on meeting planners’ implementation
of green meeting practices. J. Sustain. Tour. 21,1129–1147.
Braley, F. (2008).Meetings Market Report. Meetings and Conventions, Vol. 41, pp. 1-22.
Brassington, F. (2011).Principles of Marketing. New York, NY: Pearson Publishers
Brignall, S and Ballantine, J (1996) "Performance Measurement in Service Businessess
Revisited," International Journal of Service Industry Management, vol. 7, no.
1, 1996,pp. 6-31.
Business Tourism Partnership (U.K), (2003) Business Tourism Briefing An Overview of
The UK‘s Business Visits And Events Industry.

65
Campiranon, K., and Arcodia, C. (2008) Market Segmentation in Time of Crisis, Journal
of Travel & Tourism Marketing, 23:2-4, pp. 151-161
Clark, J. D. (2004) Considering a convention center: Ten questions communities will
confront. Journal of Convention and Event Tourism, 6(1/2), pp. 5–21.
Colliers international UAE (2008), Dubai Real Estate Overview, Vol 2 p5. Department of
information technology (N/A) Think ChandigarhA comprehensive Guide
retrieved from chdit.gov.in/think_chd.pdf
Conlon, C.,& Mortimer, J.(2010).Effects of Product Availability: Experimental Evidence
Retrieved November 25, 2012 from http://www.bc.edu/
Cooper, C., Fletcher, J., Fyall, A., Gilbert, D. &Wanhill, S. (2008). Tourism Principles
and Practice. 4th ed. Harlow: Financial Times Prentice Hall.
Cooper, D. & Schindler, P. (2003).Business research methods (8th ed). New Delhi: Tata
McGraw-Hill Publishing Company.
Cooper, D. &Schinder, P. (2008).Business Research Methods 10thEd.New York:
McGraw Hill.
Crick A. and Spencer A. (2011), Hospitality Quality: New Direction and New
Challenges, International Journal of Contemporary Hospitality Management,
Vol.23, No. 4, 2011, pp.463-478.
Cronbach, L.&Shavelson, R. (2004).My Current Thoughts on Coefficient Alpha and
Successor procedures. Educational and psychological Measurement64, no. 3 9
June 1): 391-418.
66
Crouch, G. & Louviere, J. (2004).The Determinants of Convention Site Selection: A
Logistic Choice Model from Experimental Data. Journal of Travel Research,
43, (2), 118-130
Crouch, G.I. and Weber, K. (2012). Marketing of Convention Tourism. In: Chon, K. and
Weber, K., eds. Convention Tourism: International Research and Industry
Perspectives. Binghamton, N.Y.: Haworth, 57-77.
Davidson, R. (2003) Adding pleasure to business: Conventions and tourism. Journal of
Convention and Exhibition Management, 5(1), pp. 29–39.
Davidson, R. (2003). Business Tourism. 10th Tourism Congress: University and
Company Conventions, Congresses and Incentive travel.Valencia: Tirant lo
Blanch
Davidson, R. (2007). Business Tourism. 10th Tourism Congress: University and
Company Conventions, Congresses and Incentive travel.Valencia: Tirant lo
Blanch.
Dibley, A., & Baker, S. (2001). Uncovering the links between brand choice and personal
values among young British and Spanish girls. Journal of Consumer Behavior,
1(1), 77-93.
DIS. (2012).Meeting, Incentive, Convention, and Exhibition (MICE) Industry: Analysis
and Investment Opportunities. Taiwan, Ministry of Economic Affairs.
Retrieved April 19,

67
Dwyer, L. &Forsyth, P.(2008). Economic Measures of Tourism Yield: What Markets to
Target? International Journal of Tourism Research, 10 (2), 155-168.
Easingwood, C. J. (2006). New product development for service companies. Journal of
Product Innovation Management, 3(3), 296–312.
Enz, C. A., & Canina, L. (2008). The impact of strategic orientation on intellectual
capital investments in customer service firms
Fenich, G. (2008).Meetings, Expositions, Events, and Conventions: An Introduction to
the Industry. Pearson Prentice Hall, Upper Saddle River, NJ.
Fenich, G. (2008).Meetings, Expositions, Events, and Conventions: An Introduction to
the Industry. Pearson Prentice Hall, Upper Saddle River, NJ.
Festinger, L. (I 954). A theory of social comparison processes. Human Relations, 7, 117-
140.
Fwaya G (2006), “Impacts and Benefits of MICE Tourism: A Framework for Analysis,”
Tourism Economics. Vol. 3, No. 1, 1997, pp. 21-38.
Fwaya, O., Odhuno, E., Kambona, O. & Odhuon, O. (2012). Relationships between
drivers and results of performance in the Kenyan Hotel Industry. Journal of
Hospitality Management and Tourism. 3(3), 46-54.
Garbarino, E., & Lee, O. (2003).Dynamic Pricing in Internet retail: Effects on consumer
trust. Psychology & Marketing, 20(6), 495–513.

68
Getz, D. (2008). Progress in Tourism Management: Event tourism: Definition, evolution,
and Research, Tourism Management, 29, pp. 403–428.
Getz, D.(2008). Event tourism: Definition, evolution, and research. Tourism
Management, 29, (3), 403-428
GIBTM(2009), 3rd Middle East Meetings Industry Research Report 2009
GIS. (2012). Meeting, Incentive, Convention, and Exhibition (MICE) Industry: Analysis
and Investment Opportunities. Taiwan, Ministry of Economic Affairs.
Retrieved April 19, 2013
Global Statistics, Report (2011). The Meeting and Conference Market: Do you really
know your market? Retrieved April 10, 2013
fromhttp://www.businesstourismpartnership.com/pubs/mtg%20mkt.pdf
Goeldner, C. R., & Ritchie, B. J. R. (2012). Tourism: Principles, practices, philosophies
(12th ed.). Hoboken, New Jersey: John Wiley & Sons, Inc
Government of Kenya, (2012). Strategic Plan, 2008-2012. Kenya: Ministry of Tourism
Government of Kenya. (2006). Kenya Vision 2030. Nairobi: Government Printer
ICCA, (2007).The international Association Meetings Market, 1997-2006.Statistics
Report.
ICCA. International Congress and conventions Associations statistics Report.
(2013).Ministry of East Africa, Commerce and Tourism

69
IIMB & ICPB, (2001).India as a Global Conventions destination, Prospects and
Strategies, Ministry of tourism, Govt. of India. www.tourism-gov.in/surveys
IMEX Global Data Exchange (2006, Aug) How international decision-makers view
Germany as a destination for meetings and incentive travel, IMEX research
Jones Lang LaSalle Hotels.(2007). Hong Kong, Macao hotel sectors to set new
benchmarks.Retrieved November 9, 2007
Jong hyeok KimEuiho SuhHyu n seok Hwang, (2003) a model for evaluating the
effectiveness of crm usingthe balanced scorecard, journal of interactive
marketing volume 17 / number 2 / spring
KaishengZeng, XiaohuiLuo (2008) China‘s Inbound Tourist Revenue and Beijing
Olympic Games 2008 China & World
Kang, M. H., Suh, S. J., & Jo, D. (2005).The competitiveness of international meeting
destinations in Asia: Meeting planners’ versus buying centers’ perceptions.
Journal of Convention & Event Tourism, 7(2), 57-85.
Keller, K. (2003). Strategic brand management: Building, measuring, and managing
brand equity. NJ:Pearson Prentice Hall.
Kerin, R.A. and Sethuraman, R. (1998) Exploring the brand value–shareholder value
nexus for consumer goods companies. Journal of the Academy of Marketing
Science, Vol.26, No.4, pp.260–273.
Kim, W. G., and Kim, H. C. (2003).The analysis of Seoul as an international convention
destination. Journal of Convention & Exhibition Management, 5(2), 69-87.
70
Kombo &Tromp (2006.) Proposal and Thesis writing, an Introduction. Africa:Pauline
Publication.
Kombo &Tromp (2006.)Proposal and Thesis writing, an Introduction. Africa:Pauline
Publication.
Kothari, C.(2008). Research Methodology: Methods & Techniques, (2nd Rev. Ed.)New
Delhi. NewAge International Limited Publishers.
Kothari, C.(2008). Research Methodology: Methods & Techniques, (2nd Rev. Ed.)New
Delhi. NewAge International Limited Publishers.
Kotler, P.(2010). Marketing Management: Analysis, Planning, Implementation and
Control.(8th ed.).Pearson Prentice Hall; Upper Paddle River,NJ.
Kurtzman, J. &Zauhar, J. (2005) Sport tourism consumer motivation. Journal of Sport
Tourism, 10 (1), pp. 21-31.
Lau, W.; Barber, T.; Tyrrell, T. (2004) Green attendees’ evaluation of green attributes at
the convention centre: using importance–performance analysis.
Lee, W.; Barber, T.; Tyrrell, T. (2013)Green attendees’ evaluation of green attributes at
the convention centre: usingimportance–performance analysis.
Lewis-Beck, M. (1995).Data Analysis: An Introduction. Thousand Oaks: Sage
Publications.
Lynch, J. E. (2005) Only connect: the role of marketing and strategic management in the
modern organisation. Journal of Marketing Management 10 (6) pp 527-542
71
McCartney, G. (2008) Key considerations in adopting tourism as a destination
development strategy. Euro Asia Journal of Management, 18(1), pp. 51–61.
Morrison, AJ &Teixeira, R (2004), 'Small business performance: a UK tourism sector
focus' Journal of Small Business and Enterprise Development, vol 11, no.
Mugenda, A.G., (2008). Social Science Research. Acts Press. Nairobi. Kenya.
Mugenda, O. & Mugenda, G. (2003).Research Methods: Quantitative and Qualitative
Approaches. Acts Press. Nairobi. Kenya.
Mugenda, O.M. (2002).Research methods: quantitative and qualitative approaches,
Nairobi:Act Press.
National Action Plan for Tourism (2012).Ministry of Civil Aviation and Tourism Govt. of
India.
National Tourism Policy (2002).Dept. of Tourism, Ministry of Tourism and Culture,
Govt. of India.
Neuman, W. (2006).Social Research Methods: Qualitative and quantitative approaches.
Needham Heights: Allyn & Bacon.
Newell G. and Seabrook R., (2005), Factors Influencing Hotel Investment Decision
Making, Journal of Property Investment and Finance, Vol.24, No. 4, 2005, pp.
279-294.

72
Odunga, P.,Besloy, S.,Nthinga, R., &Maingi, S. (2011). Conference Tourism in Kenya:
Towards Tourism Product Development and Extension. Retrieved April, 19,
2013
Olsen, B. (2008). Teaching what they learn, learning what they live: How Teachers'
Personal Histories Shape Their Professional Development.
Opperman,M., (2006). Convention Destination Images: Analysis of Association Meeting
Planners’ Perceptions. Tourism Management, 17, (3), 175-182.
Owen, C, (2014), “Changing Trends in Business Tourism”, Tourism Management.
Pakdeekul, C. (2016) Political Instability and MICE Industry. Available online:
http://www.micenews.co.th/news7898/vision7899
Porter, Michael E. (1985). Competitive Advantage. Free Press. ISBN 0-684-84146-0.
Ramsaran-Fowdar, R (2007), 'Developing a service quality questionnaire for the hotel
industry in Mauritius', Journal of Vacation Marketing, Vol.
Ramsaran-Fowdar, R. (2007), A Study of Service Quality of Stockbrokers in Mauritius
Using a Multi-expectations Approach, Available from
http://ibacnet.org/bai2007/ proceedings/Papers/2007bai7002.doc, last retrieved
April 6th 2009.
Richard, PJ, Devinney, T, Yip, G & Johnson, G (2009), 'Measuring organizational
performance: towards methodological best practice' Journal of Management,
vol 5
73
Roberts, T.(2011). Conferences and Conventions –a Global Industry. Oxford:
Butterworth
Robinson, L.; Callan, R. (2013)UK Conference Delegates’ Cognizance of the Importance
of Venue Selection Attributes. In Proceedings of the Convention and Expo
Summit 2003, The Hong Kong Polytechnic University,Hong Kong, 29–31
August 2013; pp. 248–261.
Rodgers, D (2003) Dying for it: gangs, violence, and social change in urban Nicaragua.
Crisis States Research Centre working papers
Sarova Hotels(2011).Hotels see benefits in Africa. Available on www.sarovahotels.com
Singapore Tourism Board (2009), Gaining Momentum.
Sox, C.B.; Benjamin, S.; Carpenter, J.; Strick, S (2013).An Exploratory Study of Meeting
Planners and Conference Attendees’ Perceptions of Sustainable Issues in
Convention Centers.J. Conv. Event Tour.2013, 14, 144–161.
Sushil (2001), SAP- LAP Frame work, Global Journal of Flexible Systems Management
vol. 2, No. 1, pp 51-55
T. Yamane, Statistic, an Introductory Analysis,2nd ed. New York: Harper and Row,
1967.
The Economic Times (2008, Aug 6). India aggressively tapping MICE tourism market.
Tyrrell, T (2013) Importance-performance analysis: Some recommendations from an
economicplanning perspective. Tour. Anal. 2004, 9, 63–76.

74
UFI, (2011) The Global Association of the Exhibition Industry: ‘world Map of Exhibition
Venue’; Global industry statistics report: available at
www.ufi.org/Public/Search.aspx accessed on 24.03.13
UNWTO, (2012).MICE Industry: An Asia-Pacific Perspective. Available:
http://pub.unwto.org/WebRoot/Store/Shops/Infoshop/5074/2890/C02C/66D1/5
CC5/C0A8/0164/7541/MICE_Industry_Asia_4-4_excerpt.pdf
UNWTO, (2014). Tourist Arrivals by Purpose of Visit 2008.Retrieved April 4, 2013 from
http://www.unwto.org/facts/menu.html
VanWyk, B. (2012). Research design and methods Part I. University of Western Cape.
Victoria Safaris, (2007).Conference Tourism in Africa. Retrieved 19, April, 2013 from
http://www.victoriasafaris.com/conferencetours.htm
Wadongo, B., Odhuno, E. & Kambona, O. (2010). Managerial roles and choice of
performance measures in the Kenyan Five- Star hotels using a cross-sectional
correlation design. Managing Leisure.15(11), 17-31.
Weber,K., Chon, S. (2002). Convention tourism: International research and industry
perspectives. Binghamton,NY: Hawaorth Hospitality Press Inc.
Wood, C., Brotherton,B. (2008). The SAGE Handbook of Hospitality Management
London: Sage Publications Ltd .
World Luxury Tourism.(2015). MICE- Trends and Its Immediate Future. Retrieved June
24, 2015, from: http://www.worldluxurytourism.com/mice/mice-trends-and-its-
future.html

75
World Tourism Organization (2014) Tourism highlights 2002. http://www.wto.org.
Retrieved December 21, 2003
World Tourism Organization (2014), AM Reports, Volume seven –Global Report on the
Meetings Industry, UNWTO, Madrid.
World Tourism Organization, (2005). Measuring the economic importance of the meeting
industry.World Tourism Organization, Madrid, Spain
World Tourism Organization, (2006).Measuring the economic importance of the meeting
industry.World Tourism Organization, Madrid, Spain
Wu Jianhua & Xiao Xuan (2010). Analysis on the situations &policies of China’s MICE
industry, (Unpublished Dphil Thesis). Guang Dong university of Business
studies, Guangzhou: China.
XinliXie&Qunchao Lu (2006), the Economic and Social Effects Analysis of MICE
Tourism, International Journal of Business and Management
Yang, L., &Gu, Z. (2012). Capacity optimization analysis for the MICE industry in Las
Vegas. International Journal of Contemporary Hospitality Management. Vol.
24 Iss: 2 pp. 335 -349
Yang, L., &Gu, Z. (2012). Capacity optimization analysis for the MICE industry in Las
Vegas.International Journal of Contemporary Hospitality Management. Vol.
24 Iss: 2 pp. 335 -349
Zhang, L, & Ying, L. (2008).MICE Industry Clusters Using Location Quotient
Estimation.A Case from GuangZhouCithy of China.Retrieved April4, 2013
76
from
http://siteresources.worldbank.org/KENYAEXTN/Resources/Tourism_Report-
ESW_Kenya_Final_May_2010.pdf
Zutt, M. (2010), It's Our Turn to Eat: The Story of a Kenyan Whistle-Blower. New York:
Harper.
77
APPENCIDES
APPENDIX I:QUESTIONNAIRE FOR HOTEL EMPLOYEES
Dear respondent,
I am a student from university of Eldoret undertaking a Master Degree in Tourism
Management. I am carrying out a research study on the Effect of MICE Tourism on
Hotel Performance in 3 & 4 Star rated Hotels in Mombasa County; Kenya. Any
information you give is purely intended for academic purposes and will be handled with
utmost confidentiality your participation and cooperation will be highly appreciated,
thank you in advance.
Yours sincerely,
Erina Notaila Gitau.
YOURS SINCERELY
ERINA NOTAILA GITAU
Section A: Demographics
Please tick () where appropriate
1. What is your Gender?
Female ( ) Male ( )
2. What is your Educational level?
Primary ( ) Secondary ( ) College ( ) University( ) Others ( )
3. How many years have you worked in this hotel?
Below 1 year ( ) Between 1- 2 years ( ) Between 3 - 5 years ( ) Over 5years
( )

78
4. What is your position in these hotels?
Top Management ( ) Middle Level ( ) Junior Staff ( )
Section B: Mice tourism
5. Which of the following events do you hold?(Please tick)
Meetings ( )
Incentives ( )
Conferences ( )
Exhibition ( )
6. How many times in a year do you hold the event(s) No. 5 above? (Please tick)
1-2 ( )
3-4 ( )
More than 5 ( )
Meetings
7. Kindly rate the factors influencing choice of holding meetings in the hotel
Strongly agree =5, Agree=4, Undecided=3, Disagree=2, strongly disagree=1
Statements Strongly
agree
Agree
Undecided
disagree
Strongly
disagree
Meetings
Location
Sufficient infrastructure
(facilities, venues,
transportation)
Price
Customer service satisfaction
Security and safety
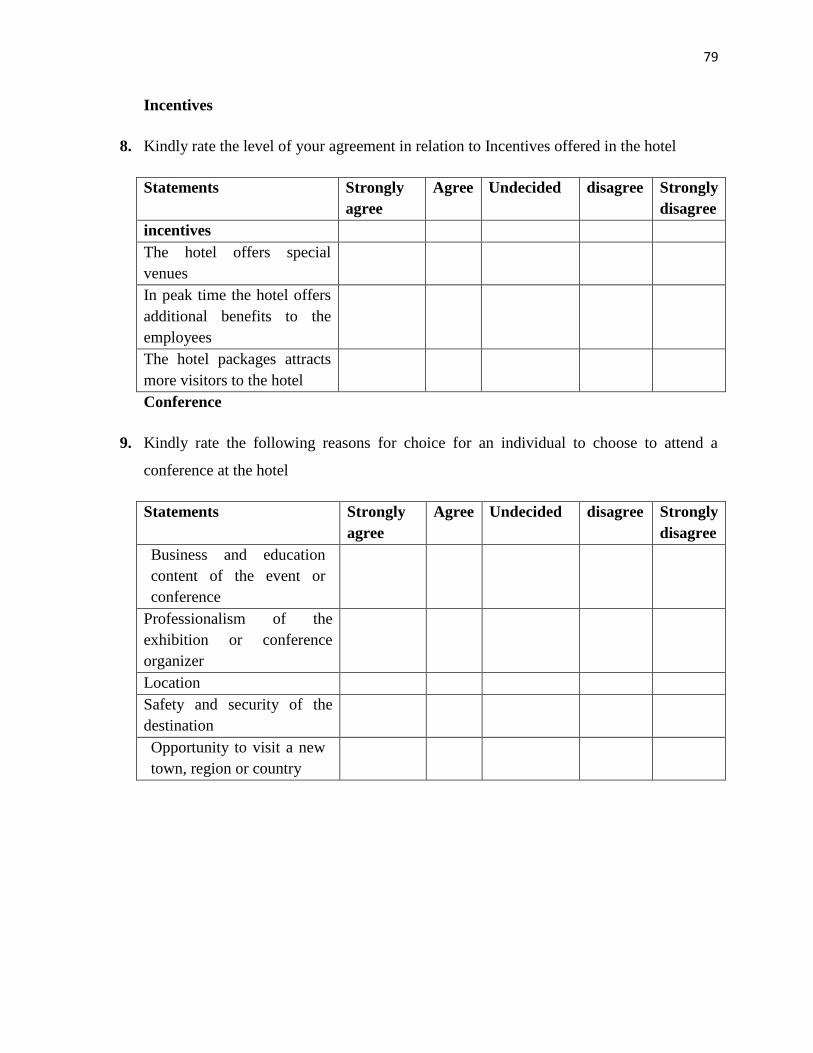
79
Incentives
8. Kindly rate the level of your agreement in relation to Incentives offered in the hotel
Statements Strongly
agree
Agree
Undecided
disagree
Strongly
disagree
incentives
The hotel offers special
venues
In peak time the hotel offers
additional benefits to the
employees
The hotel packages attracts
more visitors to the hotel
Conference
9. Kindly rate the following reasons for choice for an individual to choose to attend a
conference at the hotel
Statements Strongly
agree
Agree
Undecided
disagree
Strongly
disagree
Business and education
content of the event or
conference
Professionalism of the
exhibition or conference
organizer
Location
Safety and security of the
destination
Opportunity to visit a new
town, region or country
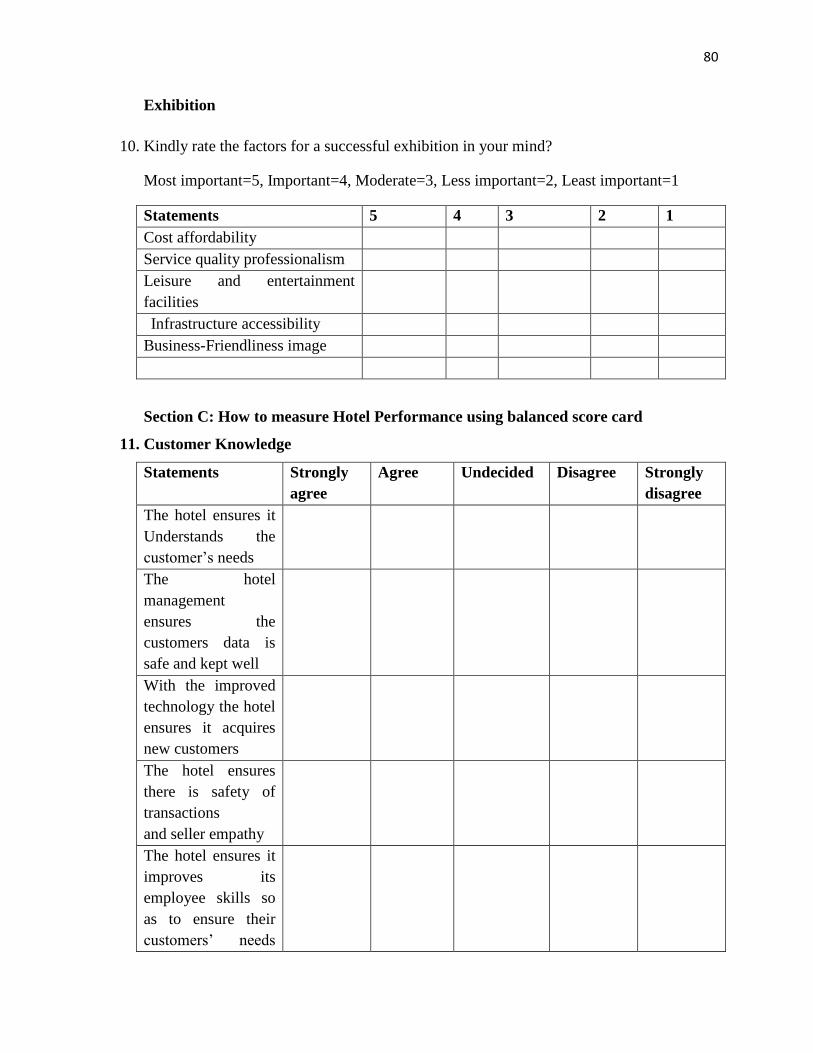
80
Exhibition
10. Kindly rate the factors for a successful exhibition in your mind?
Most important=5, Important=4, Moderate=3, Less important=2, Least important=1
Statements 5 4 3 2 1
Cost affordability
Service quality professionalism
Leisure and entertainment
facilities
Infrastructure accessibility
Business-Friendliness image
Section C: How to measure Hotel Performance using balanced score card
11. Customer Knowledge
Statements Strongly
agree
Agree
Undecided
Disagree
Strongly
disagree
The hotel ensures it
Understands the
customer’s needs
The hotel
management
ensures the
customers data is
safe and kept well
With the improved
technology the hotel
ensures it acquires
new customers
The hotel ensures
there is safety of
transactions
and seller empathy
The hotel ensures it
improves its
employee skills so
as to ensure their
customers’ needs

81
are understood
better
12. Customer Value
Statements Strongly
agree
Agree
Undecided
Disagree
Strongly
disagree
The hotel ensures it
does follow ups so
as to retain its
customers
The hotel has
improved its
services to cater for
each and every
customers demands
The hotel manages
its profit increase
with the increase of
customers attained
The hotel ensures
there is consistency
of maintaining its
brand
13. Customer interaction
Statements Strongly
agree
Agree
Undecided
Disagree
Strongly
disagree
The hotel offers
diversified products
and services
The hotel has invest
a lot in ensuring
there is brand
promotion to attract
customers
The hotel ensures it
improves channel
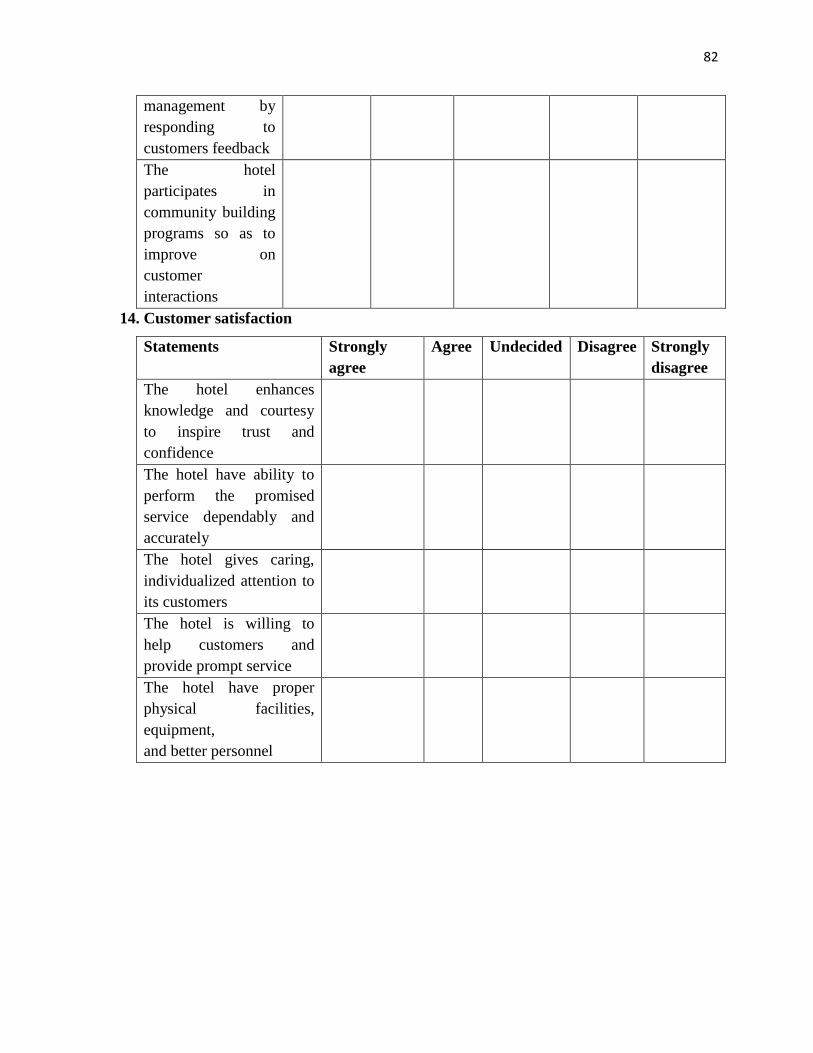
82
management by
responding to
customers feedback
The hotel
participates in
community building
programs so as to
improve on
customer
interactions
14. Customer satisfaction
Statements Strongly
agree
Agree
Undecided
Disagree
Strongly
disagree
The hotel enhances
knowledge and courtesy
to inspire trust and
confidence
The hotel have ability to
perform the promised
service dependably and
accurately
The hotel gives caring,
individualized attention to
its customers
The hotel is willing to
help customers and
provide prompt service
The hotel have proper
physical facilities,
equipment,
and better personnel

83
APPENDIX II: STUDY AREA

![Prosiding[Halal Hotel]](https://static.fdokumen.com/doc/165x107/6345e46cdf19c083b10845eb/prosidinghalal-hotel.jpg)