YOUR HOTEL EXPERIENCE - Accor
332
ENHANCING YOUR HOTEL EXPERIENCE 2014 Registration Document and Annual Financial Report
-
Upload
khangminh22 -
Category
Documents
-
view
1 -
download
0
Transcript of YOUR HOTEL EXPERIENCE - Accor

ENHANCINGYOUR HOTEL EXPERIENCE
2014 Registration Document and Annual Financial Report

Sommaire
Les éléments du Rapport financier annuel sont identifiés dans le sommaire à l’aide du pictogramme
RFA
CONTENT
2014 REVIEW OF THE YEAR 1514.1. Financial review 152
4.2. Report on the parent company financial statements for the year ended December 31, 2014 160
4.3. Material contracts 163
4.4. Subsequent events 163
FINANCIAL STATEMEMENTS AFR 1655.1. Statutory Auditor’s report
on the consolidated financial statements 166
5.2. Consolidated Financial Statements and Notes 167
5.3. Statutory Auditors’ report on the financial statements 266
5.4. Parent Company Financial Statements and Notes 267
CAPITAL AND OWNERSHIP STRUCTURE 3036.1. Information about the Company 304
6.2. Share capital AFR 306
6.3. Ownership structure AFR 310
6.4. The market for Accor securities 313
OTHER INFORMATION 3157.1. Investor relations and documents on display 316
7.2. Persons responsible for the registration document and the audit of the accounts 318
7.3. Fees paid to the Auditors AFR 319
7.4. Information incorporated by reference 319
7.5. Cross-reference table for the Registration Document 320
7.6. Cross-reference table for the Annual Financial Report 322
7.7. Cross-reference table – corporate social responsibility 323
Information disclosed in the Annual Financial Report is indicated in the contents by the pictogram.
AFR
1 4
2 5
36
7
CORPORATE PRESENTATION 31.1. Corporate profile 4
1.2. Core businesses 4
1.3. Financial highlights 11
1.4. Milestones 12
1.5. Strategic vision and outlook 15
CORPORATE RESPONSIBILITY 212.1. Vision and commitments 22
2.2. Managing the stakeholder dialogue process 28
2.3. Commitments to employees AFR 35
2.4. Social responsibility commitments AFR 48
2.5. Environmental commitments AFR 61
2.6. Measuring and assessing performance 72
2.7. Independent verifier’s report on consolidated social, environmental and societal information presented in the management report 86
CORPORATE GOVERNANCE 893.1. Administrative and management bodies 90
3.2. Report of the Chairman of the Board of Directors AFR 104
3.3. Statutory Auditors’ report on the report prepared by the Chairman of the Board of Directors AFR 122
3.4. Risk management AFR 123
3.5. Interests and compensation AFR 130
3.6. Statutory Auditors’ special report on related party agreements and commitments 147

The original French version of this translated Registration Document was filed with the Autorité des Marchés Financiers on March 27, 2015 in accordance with article 212-13 of the General Regulations of the Autorité des Marchés Financiers.
It may be used in connection with a financial transaction in conjunction with an Information Memorandum approved by the Autorité des Marchés Financiers.
This document was prepared by the issuer and is binding on its signatories.
Registration Documentand Annual Financial Report
2014


11.1. CORPORATE PROFILE 4
1.2. CORE BUSINESSES 41.2.1. Hotels 4
1.2.2. Other businesses 10
1.3. FINANCIAL HIGHLIGHTS 11
1.4. MILESTONES 12
1.5. STRATEGIC VISION AND OUTLOOK 151.5.1. 2014: A year of transformation and records 16
1.5.2. Trends and outlook 19
1.5.3. A new digital strategy 19
Corporate PRESENTATION
3Registration Document 2014

CORPORATE PRESENTATIONCorporate profile1
1.1. CORPORATE PROFILE
Accor is the world’s leading hotel operator, with 480,000 rooms in 3,700 hotels across 14 brands of international renown in 92 countries. The Group is organized around two distinct businesses and offers its guests and partners the dual expertise of a hotel operator and brand franchisor (HotelServices) and a hotel owner and investor (HotelInvest).
From the luxury/upscale segment (Sofitel, Pullman, MGallery, Grand Mercure and The Sebel) to midscale (Novotel, Suite Novotel, Mercure and adagio) and economy (ibis, ibis Styles, ibis budget, adagio access and hotelF1), Accor is constantly reinventing its concepts to more effectively satisfy the needs and expectations of business and leisure travelers around the globe. The Group boasts a powerful digital ecosystem that includes its accorhotels.com booking portal, its brand websites and its Le Club Accorhotels loyalty program.
The 180,000 Accor-brand employees work and grow in an environment that is committed to training and encouraging talent through Académie Accor. Since its creation 45 years ago, the Group has always placed innovation at the heart of its strategy, to meet the needs of its customers and build a sustainable, responsible hospitality industry.
1.2. CORE BUSINESSES
1.2.1. HOTELS
Present in every segment, from luxury to economy, Accor is uniquely positioned in the global hospitality market.
A portfolio structured to meet demand, from luxury to economy
Luxury and upscale
Sofitel and its Ambassadors bring French elegance to the world through a collection of prestigious hotels, offering their guests and partners personalized service that combines an emotional experience, outstanding performance and excellence. The Sofitel Luxury Hotels brand has now been enhanced with two new labels that share its DNA:
�� Sofitel Legend offers a collection of legendary hotels, often in centuries- old heritage buildings, beautifully set off by stunning renovations;
�� Sofitel So is the new boutique hotel label epitomized by ultra-contem-porary styling in trendy destinations. Sofitel So’s chic, modern design skillfully blends Sofitel’s famous «art de vivre» and the signature of an internationally renowned designer from the world of art or fashion.
Network: 113 hotels, 28,573 rooms in 41 countries.
Guests: 48% business – 52% leisure.
Pullman hotels and resorts cater to an international clientele from around the world, traveling for business or pleasure. Pullman is the upscale hotel brand for today’s executives: a new generation of four- and five-star hotels for a new generation of cosmopolitan guests who travel more and are more connected than ever. Located in the heart of the world’s leading cities and most sought-after tourist destinations, they promise an innovative, efficient and elegant guest experience, combining warm, skillful hospitality with outstanding offers and services.
Network: 93 hotels, 25,953 rooms in 26 countries.
Guests: 55% business – 45% leisure.
MGallery is a Collection of high-end hotels and resorts located around the world, each of which stylishly expresses a unique personality and history that guests can experience during their stay. Each hotel conveys one of the Collection’s three atmospheres: «Heritage», inspired by the hotel’s history; «Signature», unashamedly design-oriented; and «Serenity», for a relaxing, carefree stay.
Network: 71 hotels, 7,082 rooms in 22 countries.
Guests: 40% business – 60% leisure.
Grand Mercure is an upscale brand that targets demanding customers looking for a hotel that embodies local culture and identity. The hotels’ profiles reflect the regional customs and traditions of their different markets, in China, India, Saudi Arabia or Brazil.
With Mei Jue in China and Maha Cipta* in Indonesia, Grand Mercure enables travelers to experience local culture to the fullest. Their staff are dedicated to providing every guest with the care and attention that make for an unforgettable stay.
Network: 43 hotels, 8,164 rooms in 4 countries.
Guests: 55% business – 45% leisure.
* The local version of Grand Mercure, unveiled in March 2013 and custom designed for the Indonesian market.
4 Registration Document 2014

1
CORPORATE PRESENTATIONCore businesses
The Sebel is a brand of premium apartments in the Asia-Pacific region. For guests seeking independence, it offers an inspiring accommodation experience in stylish, spacious surroundings, supported by a warm welcome and outstanding, personalized service.
Network: 21 apartments, 1,309 rooms in 2 countries.
Guests: 25% business – 75% leisure.
Midscale
Novotel, our international midscale brand, features hotels located in the heart of major international cities, as well as in business districts and tourist destinations. With its comprehensive range of solutions, Novotel enables business and leisure travelers alike to feel right at home.
Network: 414 hotels, 79,220 rooms in 61 countries.
Guests: 59% business – 41% leisure.
Suite Novotel offers midscale, mainly city-center hotels where guest needs are met around the clock with modular 30 sq.m. suites and a range of innovative services.
Network: 31 hotels, 3,854 rooms in 10 countries.
Guests: 70% business – 30% leisure.
Mercure is the only midscale hospitality brand to combine the power of an international network of hotels – all of which meet the same uncompromising quality standards – and the warm, welcoming experience of unique establishments each of which is rooted in its local community and managed by enthusiastic hoteliers. In city centers, by the sea or in the mountains, the Mercure network welcomes business and leisure travelers around the world.
Network: 711 hotels, 89,203 rooms in 52 countries.
Guests: 56% business – 44% leisure.
Adagio Aparthotels offer spacious apartments with a kitchen and hotel services in city-center locations for medium-length and extended stays, based on tiered pricing from the fourth night onwards. The brand offers three product ranges:
�� Adagio, the aparthotel benchmark, with modern apartments located in the heart of leading cities;
�� Adagio access, affordable functional apartments located near city centers;
�� Adagio premium, luxury, upscale aparthotels.
Network: 96 aparthotels, 10,441 apartments in 11 countries.
Guests: 54% business – 46% leisure.
Economy
ibis, the European leader in economy hotels, guarantees absolute relaxation with the innovative Sweet Bed by ibisTM, comfortable and perfectly equipped room, and modern, designer reception areas. Thoughtful and efficient, ibis offers the highest quality services in its category, including 24-hour reception, breakfast from 4:00 am to noon, light meals, a non-stop bar and a modern restaurant concept, the ibis Kitchen.
Network: 1,031 hotels, 129,009 rooms in 59 countries.
Guests: 58% business – 42% leisure.
A non-standardized economy brand with a multitude of styles and a Happy Mood personality, ibis Styles is being developed mainly through franchising. With its focus on business and leisure customers traveling alone or with the family, the brand features customer-friendly solutions at an all-inclusive price covering the room, breakfast, Wi-Fi and a host of extra amenities.
Network: 277 hotels, 25,100 rooms in 24 countries.
Guests: 58% business – 42% leisure.
ibis budget is the Accor group’s benchmark brand in the budget segment. Clever and casual, it embodies simplicity and enables guests to focus on the important things in life. Perfect for customers in search of independence, ibis budget hotels are available around the clock and offer rooms for one, two or three people equipped with cozy duvets and soft pillows, an XL shower, free Wi-Fi* and an all-you-can-eat breakfast buffet.
Network: 537 hotels, 51,022 rooms in 17 countries.
Guests: 56% business – 44% leisure.
hotelF1 offers fully renovated Duo and Trio rooms featuring a contemporary design as well as new reception and breakfast areas. More dynamic than ever, hotelF1 has established itself as an unconventional brand that meets the expectations of cost-conscious consumers.
Network: 246 hotels, 18,836 rooms in 4 countries.
Guests: 65% business – 35% leisure.
For various contractual reasons, 7 hotels representing 949 rooms are still operated under the Formule 1 brand.
5Registration Document 2014

CORPORATE PRESENTATIONCore businesses1
A global presence in every market segment
Accor operates worldwide, with a unique portfolio of 3,717 hotels (482,296 rooms) as of December 31, 2014 and a presence in every market segment.
Hotel portfolio by region and brand at December 31, 2014
Brand
France
Europe (excl. France and
Mediterranean) Asia-Pacific
Latin America and the
Caribbean
Mediterranean Middle East
AfricaNorth
America Total
Hotels Rooms Hotels Rooms Hotels Rooms Hotels Rooms Hotels Rooms Hotels Rooms Hotels Rooms
Sofitel 11 1,509 17 4,292 41 12,051 9 1,666 27 6,444 8 2,611 113* 28,573
Pullman 13 3,692 14 3,485 51 14,462 4 1,086 11 3,228 - - 93 25,953
MGallery 20 1,434 9 1,240 24 2,573 3 291 15 1,544 - - 71 7,082
Novotel 113 15,412 109 21,561 111 26,550 19 3,267 54 10,325 8 2,105 414 79,220
Suite Novotel 19 2,199 8 1,158 - - - - 4 497 - - 31 3,854
Mercure 226 22,080 264 33,974 144 22,744 71 10,361 70 9,517 - - 775 98,676
Adagio 29 3,568 9 1,029 - - 8 654 4 537 - - 50 5,788
Other 1 51 6 957 22 2,761 1 385 3 376 - - 33 4,530
Luxury, upscale and midscale 432 49,945 436 67,696 393 81,141 115 17,710 188 32,468 16 4,716 1,580 253,676
ibis 383 33,690 258 34,947 139 25,151 124 18,170 127 17,051 - - 1,031 129,009
ibis Styles 141 9,920 62 5,735 54 7,437 6 748 14 1,260 - - 277 25,100
ibis budget 324 25,074 141 15,578 30 3,540 19 4,627 23 2,203 - - 537 51,022
Adagio access 44 4,383 2 270 - - - - - - - - 46 4,653
hotelF1 238 17,906 - - - - - - - - - - 238 17,906
Formule 1 - - 3 191 5 739 - - - - - - 8 930
Economy 1,130 90,973 466 56,721 228 36,867 149 23,545 164 20,514 - - 2,137 228,620
TOTAL 1,562 140,918 902 124,417 621 118,008 264 41,255 352 52,982 16 4,716 3,717 482,296
* 121 hotels are marketed through the TARS reservation system.
Accor is the largest hotel group in Europe, with a network of 2,464 hotels and 265,335 rooms, representing 55% of its room base at December 31, 2014. In other regions, its expertise is deployed through 621 hotels (24% of the room base) in the Asia-Pacific region, 264 hotels (9% of the room base) in Latin America and the Caribbean, 352 hotels (11% of the room base) in Africa and the Middle East and 16 hotels (1% of the room base) in North America.
Hotel portfolio by region at December 31, 2014
(% based on number of rooms)
26%Europe (excluding France
and Mediterranean)
29%France
24%Asia-Pacific
9%Latin America and Caribbean
11%Mediterranean,
Middle East, Africa
1%North America
6 Registration Document 2014
1
CORPORATE PRESENTATIONCore businesses
Hotel portfolio by segment at December 31, 2014
(% based on number of rooms)
• Luxury and Upscale
• Midscale
• Economy
38%
47%
15%
Differentiated operating structures
Accor hotels are affiliated with the Group via four main operating structures – franchise agreements, management contracts, leases and ownership. As part of the Group’s organization into the HotelInvest and HotelServices businesses, all of the owned and leased hotels are integrated into the HotelInvest portfolio and are operated by HotelServices under management contracts.
Franchise agreements: Franchised hotels are operated by their owners. Accor provides various services to its franchisees, such as the use of its brands, first and foremost, and access to the Group’s centralized booking system. The other services offered to hotel owners include access to the centralized purchasing system and to Académie Accor for employee training. Accor is remunerated for these services via fees, including trademark fees and sales and marketing fees, as well as through the invoicing of additional services, where applicable.
Management contracts: Hotels under management contracts are similar to franchised hotels in that Accor only records the fees paid by the owner and not the hotel’s revenue. However, these hotels are managed by Accor. The fees received include the trademark and sales and marketing fees paid by franchisees, as well as a management fee corresponding to a percentage of EBITDAR and, in some cases, an incentive fee subject to performance criteria.
Leases: Leased hotels are fully consolidated by Accor, which pays rent to the owner. The rent can either be fixed or variable. Fixed rent corresponds to a percentage of asset value, while variable rent is usually indexed to the hotel’s revenue. For some hotels, particularly in South America, the rent paid by Accor corresponds to a percentage of the hotel’s EBITDAR.
Ownership: Owned hotels are fully consolidated. While Accor only receives fees from franchised and managed hotels, it records all of the operating income and expenses in its accounts for owned and leased hotels.
In developing new hotels, Accor’s strategy is to align their operating structure with:
�� their positioning (luxury and upscale, midscale or economy);
�� the size of the country and type of economy (developed or emerging);
�� their location (large, mid-size or small city);
�� their return on capital employed;
�� their earnings volatility;
�� their EBIT margin.
In mature markets, the Group prefers asset-light operating structures based on:
�� management contracts in the luxury segment;
�� management contracts or franchise agreements in the upscale segment;
�� management contracts and/or franchise agreements in the midscale segment;
�� franchise agreements in the economy segment in Europe.
In emerging markets, the Group focuses on:
�� management contracts in the luxury and upscale segments;
�� joint ventures with local partners in some countries, like India, and management contracts in the midscale segment;
�� all types of operating structures in the economy segments, depending on the brand and the location in key cities.
As of year-end 2014, 61% of the room base was operated under arrangements that limited earnings volatility, such as management contracts and franchise agreements.
7Registration Document 2014

CORPORATE PRESENTATIONCore businesses1
Hotel portfolio by operating structure and brand at December 31, 2014
Brand
Owned Fixed lease Variable lease Managed Franchised Total
Hotels Rooms Hotels Rooms Hotels Rooms Hotels Rooms Hotels Rooms Hotels Rooms
Sofitel 14 2,398 4 1,199 6 777 86 23,003 3 1,196 113* 28,573
Pullman 7 1,592 8 2,073 7 2,249 56 16,063 15 3,976 93 25,953
MGallery 4 429 6 664 3 431 26 2,977 32 2,581 71 7,082
Novotel 50 9,862 42 8,446 106 17,772 142 33,330 74 9,810 414 79,220
Suite Novotel 1 118 6 971 11 1,396 5 662 8 707 31 3,854
Mercure 51 7,583 56 9,151 66 9,679 217 36,164 385 36,099 775 98,676
Adagio 2 207 7 817 4 480 35 4,100 2 184 50 5,788
Other 4 859 1 51 - - 27 3,542 1 78 33 4,530
Luxury, upscale and midscale 133 23,048 130 23,372 203 32,784 594 119,841 520 54,631 1,580 253,676
ibis 150 21,051 103 14,226 198 29,001 144 26,306 436 38,425 1,031 129,009
ibis Styles 5 540 12 1,025 5 911 37 6,095 218 16,529 277 25,100
ibis budget 66 6,817 81 8,829 82 10,163 35 4,960 273 20,253 537 51,022
Adagio access - - 3 263 1 160 42 4,230 - - 46 4,653
hotelF1 21 1,514 - - 158 12,573 - - 59 3,819 238 17,906
Formule 1 3 191 - - - - 5 739 - - 8 930
Economy 245 30,113 199 24,343 444 52,808 263 42,330 986 79,026 2,137 228,620
TOTAL 378 53,161 329 47,715 647 85,592 857 162,171 1,506 133,657 3,717 482,296
* 121 hotels are marketed through the TARS reservation system.
Hotel portfolio by operating structure at December 31, 2014
(% based on number of rooms)
• Owned
• Fixed lease
• Variable lease
• Management
• Franchise
28%10%
18%
11%
33%
Hotel portfolio by segment and operating structure at December 31, 2014
(% based on number of rooms)
• Owned
• Fixed lease
• Variable lease
• Management
• Franchise
13%
70%
6%6%5%
37%
25%
16%
11%
10%
19%
35%
13%
11%
23%
Luxuryand Upscale
Midscale Economy
8 Registration Document 2014

1
CORPORATE PRESENTATIONCore businesses
Hotel portfolio by operating structure and region at December 31, 2014
Owned Fixed lease Variable lease Managed Franchised Total
Hotels Rooms Hotels Rooms Hotels Rooms Hotels Rooms Hotels Rooms Hotels Rooms
France 63 6,666 41 4,678 406 46,489 104 12,923 948 70,162 1,562 140,918
Europe (excl. France and Mediterranean) 212 30,684 199 30,748 122 18,983 104 14,685 265 29,317 902 124,417
North America 3 705 - - - - 12 3,862 1 149 16 4,716
Latin America and the Caribbean 30 5,105 5 684 58 11,073 114 17,575 57 6,818 264 41,255
Mediterranean, Middle East, Africa 51 7,014 41 5308 55 7,775 120 23,921 85 8,964 352 52,982
Asia-Pacific 19 2,987 43 6,297 6 1,272 403 89,205 150 18,247 621 118,008
TOTAL 378 53,161 329 47,715 647 85,592 857 162,171 1,506 133,657 3,717 482,296
Hotel portfolio by region and operating structure at December 31, 2014
(% based on number of rooms)
• Owned & Leased
• Management & Franchise
15%
85%
41%
59%
41%
59%
65%
35%
38%
62%
9%
91%
NorthAmerica
Latin America
and Caribbean
France Europe (excluding France and
Mediter-ranean)
Mediter-ranean Middle
EastAfrica
AsiaPacific
Property
Property, plant and equipment recognized in the consolidated balance sheet primarily corresponds to hotel assets that are either owned outright or held under finance leases. The cost value of consolidated property, plant and equipment stood at €5,853 million at December 31, 2014, while their carrying amount was €3,157 million, representing 36.0% of total consolidated assets at that date (see note 21 to the consolidated financial statements, page 214).
The above breakdown of the hotel portfolio shows the number of rooms, the type of operating structure and the location of the hotels at December 31, 2014. The cost value of the assets is presented on page 159.
Occupancy rates, average room rates and Revenue Per Available Room (RevPAR) are described in the analysis of consolidated results on page 152.
Hotel projects currently underway are presented in note 3 to the consolidated financial statements on page 190.
Environmental issues are described in «Environmental Commitments» on page 61.
Markets and Competition
Accor ranks sixth in the global hotel industry, based on number of rooms.
Hotel companies ranked by number of rooms worldwide at December 31, 2014
Rank GroupNumber
of roomsNumber of hotels
1 Intercontinental Hotels Group 710,295 4,840
2 Hilton Hotels 708,268 4,278
3 Marriott International 701,899 4,117
4 Wyndham Hotel Group 660,826 7,645
5 Choice Hotels International 504,808 6,374
6 Accor 482,296 3,717
Source: Accor, MKG – March 2015.
The above competitors share two characteristics: they are all well established in the United States and they mainly operate through franchise agreements.
9Registration Document 2014

CORPORATE PRESENTATIONCore businesses1
European hospitality companies by number of rooms at December 31, 2014 (28-country European Union)
Rank GroupNumber
of roomsNumber of hotels
1 Accor 267,338 2,486
2 Intercontinental Hotels Group 90,160 589
3 Best Western 88,852 1,281
4 Groupe du Louvre 67,587 969
5 Whitbread 57,615 701
Source: MKG Hospitality database – January 2015.
According to the MKG Hospitality report, three Accor chains rank among the top ten, in number of rooms, in the 28-country European Union.
European integrated hotel chains by number of rooms at December 31, 2014 (28-country European Union)
Rank ChainNumber
of roomsNumber of hotels
1ibis megabrand (ibis, ibis Style, ibis budget) 129,576 1,363
2 Best Western 88,852 1,281
3 Holiday Inn 67,244 484
4 Mercure 58,493 514
5 Premier Inn 57,615 701
6 NH Hoteles 43,529 288
7 Novotel 41,972 261
8 Travelodge 38,275 518
9 Hilton International 35,369 134
10 Radisson Blu 30,865 135
Sources: MKG Hospitality database – January 2015.
1.2.2. OTHER BUSINESSES
Other businesses, which are not material compared with the Hotels business, include the corporate departments and the marginal Casinos business. They are presented as part of the «Other» segment.
10 Registration Document 2014

1
CORPORATE PRESENTATIONFinancial highlights
1.3. FINANCIAL HIGHLIGHTS
In compliance with European Commission Regulation 1606/2002 of the European Parliament and of the Council dated July 19, 2002 and European Commission Regulation 1725/2003 dated September 29, 2003, Accor has prepared its consolidated financial statements since 2005 in accordance with the International Financial Reporting Standards (IFRSs), as published by the International Accounting Standards Board (IASB) and adopted by the European Union.
The following financial highlights have been taken directly from the consolidated financial statements at December 31, 2014.
Consolidated financial highlights
(in millions of euros) 2013* 2014
Consolidated revenue 5,425 5,454
EBITDAR 1,731 1,772
EBIT 521 602
Operating profit before tax and non-recurring items 442 578
Net profit/(loss) 137 240
Net profit/(loss), Group share 126 223
Per-share data
(in euros) 2013* 2014
Earnings per share 0.55 0.97
Diluted earnings per share 0.55 0.96
Ordinary dividend per share 0.80 0.95(1)
(1) Submitted for approval at the Annual Shareholders’ Meeting of April 28, 2015.
Total assets
(in millions of euros) 2013* 2014
Total non-current assets 4,065 4,795
Total current assets 2,877 3,613
Assets held for sale 61 347
Total assets 7,003 8,755
Equity and net debt
(in millions of euros) 2013* 2014
Shareholders’ equity, Group share 2,538 3,654
Minority interests 214 213
Total equity 2,752 3,867
Net debt 226 159
* The financial statements have been restated to exclude the impact of the January 1, 2014 adoption of IFRS 11 – Joint Arrangements, which has been applied retrospectively to all periods presented (see Note 2, page 177 for explanations and impacts).
11Registration Document 2014

CORPORATE PRESENTATIONMilestones1
1.4. MILESTONES
1967
�� Paul Dubrule and Gérard Pélisson create SIEH.
�� First Novotel hotel opens in Lille.
1974
�� First ibis hotel opens in Bordeaux.
�� Acquisition of Courtepaille.
1975
�� Acquisition of Mercure.
1976
�� Hotel operations are launched in Brazil.
�� Ticket Restaurant® meal vouchers are introduced in Brazil, Italy, Germany, Belgium and Spain.
1980
�� Acquisition of Sofitel (43 hotels and two seawater spas).
1981
�� Initial public offering of SIEH shares on the Paris Bourse.
�� Start-up of Services operations in Mexico.
1982
�� Acquisition of Jacques Borel International, European leader in managed food services (Générale de Restauration) and concession restaurants (Café Route, L’Arche), and world leader in the issuance of meal vouchers (Ticket Restaurant®), with 165 million vouchers a year distributed in eight countries.
1983
�� Creation of Accor following the merger of Novotel SIEH Group and Jacques Borel International.
1985
�� Creation of Formule 1, a new hotel concept based on particularly innovative construction and management techniques.
�� Creation of Académie Accor, France’s first corporate university for service activities.
�� Acquisition of Lenôtre, which owns and manages caterer boutiques, gourmet restaurants and a cooking school.
1988
�� 100 new hotels and 250 restaurants are opened during the year, for an average of one opening a day.
�� Start-up of Services operations in Argentina.
1989
�� Formule 1 expands outside France, with two properties in Belgium.
�� Alliance formed with Groupe Lucien Barrière SAS to develop hotel-casino complexes.
1990
�� Acquisition of the Motel 6 chain in the United States, comprising 550 properties. With its global brands, Accor becomes the world’s leading hotel group, in terms of hotels directly owned or managed (excluding franchises).
�� Ticket Restaurant® business launched in Venezuela.
1991
�� Successful public offer for Compagnie Internationale des Wagons-Lits et du Tourisme, which is active in hotels (Pullman, PLM, Altea, Arcade), car rental (Europcar), onboard train services (Wagons-Lits), travel agencies (Wagonlit Travel), managed food services (Eurest) and highway restaurants (Relais Autoroute).
�� Creation of Etap Hotel.
1993
�� Accor Asia Pacific Corp. is created by the merger of Accor’s Asia-Pacific businesses with Quality Pacific Corp.
�� Interest acquired in the Pannonia chain (24 hotels), as part of Hungary’s privatization program.
�� Services business starts up operations in Czech Republic, Austria and Luxembourg.
1994
�� Partnership between Carlson and Wagonlit Travel in business travel services.
�� Ticket Restaurant® introduced in Slovakia, Uruguay and Hungary.
1995
�� Eurest is sold to Compass, making Accor the largest shareholder in the world’s leading food services company.
�� Disposal of 80% of the concession restaurants business.
�� Introduction of an extensive training and communication program to improve environmental protection.
1996
�� Accor becomes the market leader in the Asia-Pacific region, with 144 hotels in 16 countries and 56 projects under construction.
�� Management of the ibis, Etap Hotel and Formule 1 chains is consolidated within Sphere International.
�� Launch of the Compliment Card in partnership with American Express.
12 Registration Document 2014

1
CORPORATE PRESENTATIONMilestones
1997
�� Accor changes its corporate governance system. Paul Dubrule and Gérard Pélisson become Co-Chairmen of the Supervisory Board, while Jean-Marc Espalioux is appointed Chairman of the Management Board.
�� Carlson and Wagonlit Travel merge to form Carlson Wagonlit Travel, owned equally by Accor and Carlson Companies.
�� Public offer made for all outstanding shares of Accor Asia Pacific Corp.
�� Acquisition of a majority interest in SPIC, renamed Accor Casinos.
1998
�� Introduction of the Corporate Card in partnership with Air France, American Express and Crédit Lyonnais.
�� Development of new partnerships, with Air France, French National Railways SNCF, American Express, Crédit Lyonnais, Danone, France Telecom and others.
1999
�� The hotel portfolio grows by 22% with 639 new properties, led by the acquisition of Red Roof Inn in the United States.
�� Deployment of the Internet strategy.
�� The 50% interest in Europcar International is sold.
2000
�� Launch of accorhotels.com.
�� Brand logos are redesigned to highlight the Accor name, raising international visibility and public awareness.
�� 38.5% interest in Go Voyages acquired.
�� 80% interest in Courtepaille sold.
2001
�� Broader presence in the Chinese hotel market in partnership with Zenith Hotel International and Beijing Tourism Group.
�� Suitehotel launched in Europe.
2002
�� Acquisition of a 30% interest in German hotel group Dorint AG (87 hotels, 15,257 rooms).
�� Accor Casinos is now equally-owned with the Colony Capital investment fund, with Accor continuing to manage the company.
�� Stake in Go Voyages is raised to 60%.
2003
�� Stake in Orbis is raised to 35.58% by purchasing an 8.41% interest held by minority shareholders.
�� Stake in Go Voyages raised to 70% following the acquisition of an additional 10% interest.
�� All the Dorint hotels are cobranded as Dorint Sofitel, Dorint Novotel and Dorint Mercure.
2004
�� Accor, the Barrière Desseigne family and Colony Capital set up Groupe Lucien Barrière SAS to hold the casino and hotel assets of Société Hôtelière de la Chaîne Lucien Barrière, Société des Hôtels et Casino de Deauville, Accor Casinos and their respective subsidiaries. Accor owns 34% of the new combination.
�� Acquisition of a 28.9% interest in Club Méditerranée.
�� Stake in Go Voyages is raised from 70% to 100%.
2005
�� Colony Capital invests €1 billion in Accor in exchange for €500 million in ORA equity notes and €500 million in convertible bonds, enabling Accor to strengthen its equity base and step up the pace of expansion.
�� Accor implements a new property management strategy and signs an initial agreement with French real estate company Foncière des Murs to transform fixed-rent leases on 128 hotels in France into variable leases.
2006
�� Accor changes its corporate governance system from a Supervisory Board and Management Board to a Board of Directors, with Serge Weinberg as Chairman and Gilles Pélisson as Chief Executive Officer.
�� As part of the non-strategic asset disposal process, Accor sells its 1.42% stake in Compass Group PLC and its 50% interest in Carlson Wagonlit Travel, as well as most of its investment in Club Méditerranée (22.9% out of a total 28.9% stake).
�� As part of the on-going shift in the Hotels business model, Accor carries out a second transaction with Foncière des Murs, involving 59 hotels and five seawater spas in France, as well 12 hotels in Belgium. Accor will continue to operate the hotels under 12-year leases with variable rents and no guaranteed minimum, renewable four times per hotel at Accor’s option.
�� Accor sells six US Sofitel hotels to a joint venture comprised of GEM Realty Capital, Whitehall Street Global Real Estate Limited Partnership 2005 and Accor. Accor remains a 25% shareholder in the joint venture and continues to manage the hotels under the Sofitel brand through a 25-year contract.
�� Compagnie des Wagons-Lits wins a tender from French National Railways SNCF for onboard food services on the TGV Est Européen high-speed train line.
13Registration Document 2014
CORPORATE PRESENTATIONMilestones1
2007
�� Accor sells two other US Sofitel units in New York and Philadelphia to a joint venture comprised of GEM Realty Capital, Whitehall Street Global Real Estate Limited Partnership and Accor. Accor remains a 25% shareholder in the venture and continues to manage the hotels under the Sofitel brand through a 25-year management contract.
�� As part of the on-going shift in the Hotels business model, Accor sells 47 hotel properties in France and 10 in Switzerland to a real estate consortium comprising two investment funds managed by AXA Real Estate Investment Managers and Caisse des Dépôts et Consignations. Accor continues to operate the hotels under 12-year leases with variable rents and no guaranteed minimum, renewable six times per hotel at Accor’s option.
�� Also as part of the sustained implementation of the Hotels strategy, Accor sells 30 hotels in the United Kingdom to Land Securities and leases them back under 12-year leases with variable rents and no guaranteed minimum, renewable six times.
�� In addition, a memorandum of understanding is signed with Moor Park Real Estate for the sale of 72 hotels in Germany and 19 in the Netherlands. Accor will continue to operate the units under similar leaseback conditions.
�� Accor Services acquires Kadeos, Prepay Technologies and Surf Gold.
�� Red Roof Inn is sold to Citigroup Inc.’s Global Special Situations Group and Westbridge Hospitality Fund II, LP.
�� The Italian food services business is sold to Barclays Private Equity.
�� 28,400 new rooms opened during the year.
2008
�� As part of its strategy of refocusing on its two core businesses, Services and Hotels, Accor sells its remaining 50% stake in the Brazilian food services business to Compass Group.
�� Pursuing its asset-right strategy, Accor sells the Sofitel The Grand hotel in Amsterdam under a sale and management-back arrangement for an enterprise value of €92 million.
�� In line with its commitment to expanding the Hotels business in Central Europe, Accor raises its interest in the Poland-based Orbis hotel group to 50% by acquiring an additional 4.53% stake in the company.
�� Accor launches AIClub, a free cross-brand loyalty program that earns points in more than 2,000 hotels and 90 countries worldwide.
�� Accor continues to expand worldwide with the opening of 28,000 new rooms.
2009
�� Gilles Pélisson, Chief Executive Officer, is appointed Chairman of the Board of Directors.
�� Accor raises its stake in Groupe Lucien Barrière to 49%.
�� In late August, the Board of Directors approves Gilles Pélisson’s recommendation to conduct a review of the potential benefits of demerging the Hotels and Prepaid Services businesses into two self-managing companies, each with its own strategy and resources for growth. The findings demonstrate the sustainable, profitable nature of each business, as well as their ability to meet the challenges of future growth and development. At year-end, the Board of Directors therefore approves the potential benefits of demerging the two businesses.
�� In line with its on-going asset-right strategy, Accor announces a major real estate transaction in the budget segment in France, with the sale of 158 hotelF1 properties, representing a total of 12,300 rooms.
�� 27,300 new rooms are opened during the year.
2010
�� Initiated in 2009, the project to demerge the Hotels and Prepaid Services businesses is approved by shareholders at the Combined Ordinary and Extraordinary Meeting on June 29, 2010 and becomes effective on July 2 following the initial stock market listing of Edenred, the new company formed from the Services business.
�� In line with its asset management strategy, Accor continues to dispose of non-strategic operations and hotel properties during the year, including (i) the sale of Compagnie des Wagons-Lits’ onboard rail catering businesses in July, (ii) the sale of two portfolios of European hotels, one of five hotels to Invesco Real Estate in February and the other of 49 hotels to Predica and Foncière des Murs in August, and (iii) the sale and franchise back of 18 hotels in Sweden in December.
�� Denis Hennequin is appointed Chief Executive Officer in December, then Chairman and Chief Executive Officer in January 2011.
�� Following the opening of 25,000 new rooms during the year, the Accor portfolio comprises more than 500,000 rooms at year-end.
2011
�� Now a pure player in hotels, Accor launches its new corporate signature: «Open New Frontiers in Hospitality» and revitalizes its economy brands around the ibis megabrand, with ibis, all seasons and Etap Hotel being transformed into the new ibis, ibis Styles and ibis budget brands.
�� In March, Accor sells its 49% stake in Groupe Lucien Barrière and in September, completes the disposal of Lenôtre to Sodexo.
�� As part of its asset-light strategy, Accor confirms its ability to continue actively managing its assets in order to focus on its core hotel operator business, with the sale and franchise-back of its 52.6% stake in Hotel Formula 1 (South Africa), the sale and variable leaseback of seven Suite Novotel hotels (France) and the sales and management-back of the Novotel New York Times Square, Pullman Paris Bercy and Sofitel Arc de Triomphe.
�� In December, Accor strengthens its presence in Australia and New Zealand with the acquisition of Mirvac, involving 48 hotels (6,100 rooms) and a 21.9% equity interest in Mirvac Wholesale Hotel Fund (MWHF). Accor’s offering in the two countries now totals 241 hotels across every hospitality segment.
�� In September, a franchise contract is signed with Jupiter Hotels Ltd., whose 24 hotels (2,664 rooms) increases to 68 the number of Mercure hotels in the United Kingdom.
�� Annual room openings reach a new historic high, with 38,700 units coming on line during the year.
14 Registration Document 2014

1
CORPORATE PRESENTATIONStrategic vision and outlook
2012
�� As part of its asset management strategy, Accor restructures its hotel base in North America by selling the Motel 6/Studio 6 chain for €1.5 billion. Accor announces the sale of the Pullman Paris Rive Gauche and the sale and management-back refinancing of such properties as the Pullman Paris Tour Eiffel, the Novotel Times Square in New York and the Sofitel Paris La Défense.
�� Accor continues to expand with the opening of 38,000 new rooms in every segment, mostly under management and franchise contracts and more than 70% located in emerging markets. Accor strengthens its market leadership in Brazil by acquiring the Posadas hotel chain.
�� Throughout the year, Accor works on revitalizing its brand portfolio. In the Economy segment, it implements the ibis mega-brand project that enables more than 1,500 hotels to embrace the new ibis, ibis Styles and ibis budget standards, while in the Upscale segment, it initiates MGallery’s repositioning, led by its boutique hotels, and launches Mei Jue in China. The Group also consolidates Sofitel’s image with high-profile openings in Mumbai, Bangkok and Agadir and enhances Pullman’s image with a vast renovation program.
2013
�� Several major projects were completed in 2013, including some that were initiated in prior years, such as the renovation of a large number of Pullman hotels, the project to move MGallery further upmarket and enhance its visibility, and the final stages of deployment of the ibis megabrand.
�� Progress was also made on the development strategy, particularly via several high-profile openings in the Middle East, which included the first Pullman hotel in Dubai and an ibis/Novotel complex in Abu Dhabi.
�� At the same time, the strategy of optimizing the property portfolio was pursued, with the two most significant transactions concerning the sale and management-back of the Sofitel Paris Le Faubourg early in the year for €113 million and the sale of the interest in Australian hotel owner TAHL for a total of €100 million.
2014
�� In 2014, Accor began an in-depth transformation of its organization around two separate but strategically related businesses – hotel operator and brand franchisor HotelServices and hotel owner and investor HotelInvest.
�� It also pursued its development in fast-growing regions, particularly in the Asia-Pacific region, and acquired hotel portfolios in Switzerland, the United Kingdom, Germany and the Netherlands, representing a total of 110 hotels.
�� In addition, Accor forged alliance with Huazhu and reinforced the existing partnership with Orbis to guarantee new development capabilities in China and Central Europe respectively and acquired a 35% stake in Mama Shelter, a source of inspiration for new, innovative «lifestyle» concepts.
�� Lastly, the Group launched its five-year, €225 million digital plan to streamline and personalize its communications with customers, employees and partners.
1.5. STRATEGIC VISION AND OUTLOOK
Accor had a highly eventful year in 2014, due in particular to the deployment of the new strategy defined by its Chairman and Chief Executive Officer, Sébastien Bazin, and unveiled in November 2013.
Following on from the announcement, operations were quickly reorganized around HotelServices and HotelInvest, which were up and running by the end of first-quarter 2014. The new organization has reaffirmed the strategic nature of our two traditional areas of expertise – asset management and owner services – by separating the related functions, responsibilities and objectives to build a more efficient business model. The 1,354 HotelInvest hotels are being operated by HotelServices under management contracts. The two businesses have their own reporting process, based on separate income statements, cash flow statements and balance sheets, but are managed by a single Executive Committee. Strategic support functions, such as Finance, Human Resources, Legal Affairs and Communications, are still centralized at corporate level.
A large number of major transactions were carried out in 2014, including:
�� the purchase of three property portfolios comprising a total of 110 hotels previously operated under variable lease contracts, for nearly €1 billion;
�� the acquisition of a 36.6% stake in the Mama Shelter boutique hotel chain;
�� the deepening of the partnership with our majority-owned Orbis subsidiary, Poland’s leading hospitality group, by awarding it the exclusive use of Accor brands in Central Europe;
�� the signature of a long-term partnership with Huazhu (China Lodging) to step up the expansion of our brands in China and develop extensive synergies in distribution and loyalty programs;
�� the completion of several refinancing transactions to support corporate strategy during the year, for a total of €3.7 billion.
In addition, on October 30, Accor presented the main aspects of an ambitious digital plan designed to position the Group and its brands among the hospitality industry’s most innovative companies. It is backed by a capital budget totaling €225 million between now and end-2018.
15Registration Document 2014

CORPORATE PRESENTATIONStrategic vision and outlook1
1.5.1. 2014: A YEAR OF TRANSFORMATION AND RECORDS
After very quickly getting its two business lines, HotelServices and HotelInvest, up and running, Accor initiated an in-depth transformation of its business model, which began to deliver benefits in 2014. In a mixed economic environment, we consolidated our leadership in key markets and generated excellent results, with record performances in many operational and financial areas.
1. HotelInvest’s transformation
HotelInvest’s main challenges are to:
1/ Strengthen its position as the leading hotel investor in the economy and midscale segments in Europe, with strategic positions in emerging markets.
2/ Optimize cash flow generation and reduce earnings volatility, particularly by reducing the number of lease contracts. As part of this process, certain hotels have been earmarked for restructuring and lease contracts will not be systematically renewed when they expire. In addition, hotel development will no longer take place via lease contracts, except for contracts on which Accor has already made a commitment.
3/ Manage and rationalize the asset portfolio, with a focus on creating value through the strategic allocation of capital expenditure.
4/ Support the Group’s growth strategy, by holding a selective portfolio of profitable hotel property assets.
HotelInvest will retain the vast majority of owned hotels, limiting property sales to hotels that are performing well below average. HotelInvest is also responsible for allocating maintenance and development expenditure and may decide to acquire other hotel properties to drive the creation of greater value.
To address these challenges, and particularly to reduce the number of lease contracts, Accor carried out a large number of restructuring transactions on behalf of HotelInvest in 2014, concerning both hotel asset portfolios and individual properties.
In May, two portfolios of hotels previously operated under variable leases were purchased, one comprising 86 units in Germany and the Netherlands from Moor Park and the other comprising 11 properties in Switzerland from Axa Real Estate. In August, these transactions were followed by the acquisition of 13 hotels in the United Kingdom from Tritax. In all, an aggregate €980 million was invested in these acquisitions. At the same time, 30 leased and 18 owned hotels were restructured during the year.
2. Two strategic partnerships with regional leaders
Stronger partnership with Orbis
As part of the reorganization of our business in Central and Eastern Europe, operations in Poland, Hungary, the Czech Republic, Slovakia, Romania, Bulgaria and Macedonia were transferred to our majority-owned subsidiary Orbis, the leader in the Polish hospitality market. It will now develop Accor hotel banners in the region by exploiting a master license for all of our brands. Orbis also purchased our operating subsidiaries in these countries, covering 38 hotels and eight new properties in the pipeline, of which 11 are owned, 17 leased, 11 managed under contract and seven franchised. Total proceeds from the transaction amounted to €142 million.
Strategic alliance with Huazhu (China Lodging)
On December 14, a long-term, strategic alliance was announced with Huazhu Hotels Group (China Lodging Group) to create the most prominent and diversified hotel company in China, with more than 2,000 hotels, a diversified brand portfolio and the industry’s strongest pipeline in the country.
This major alliance, which is expected to close in 2015, will accelerate both partners’ expansion in what is today one of the largest and fastest-growing domestic travel markets and the world’s largest outbound travel market. The objective of the alliance is to bring together the best of both partners, combining Accor’s internationally recognized brands and powerful global distribution network with the extensive coverage, local reputation and strong development capability of Huazhu Hotels Group in China. Together the partners have a pipeline of more than 500 hotels in the country. The alliance is expected to accelerate development to new levels and drive very fast growth for Accor’s brands in China.
16 Registration Document 2014

1
CORPORATE PRESENTATIONStrategic vision and outlook
Huazhu is a leading, fast-growing Chinese hospitality group that ranks 13th worldwide with a portfolio of more than 1,900 hotels. Its hotel brands cover the full spectrum of the market from Upscale (Joya, Manxin) to midscale (JI Hotels, Starway) and Economy (Hanting, Elan and Hi Inn), making the group a perfect match with Accor. Huazhu has the strongest pipeline of any hotel group in China to fuel future growth. Accor currently has 144 hotels in China across eight brands in the Luxury/Upscale (Sofitel, Pullman, MGallery, Grand Mercure), Midscale (Novotel, Mercure) and Economy (ibis, ibis Styles) segments. It has been present in China for more than three decades and is the leading hotel group in Australasia.
Pursuant to the transaction, Accor’s Economy and Midscale operations in China will become part of Huazhu under an exclusive Master Franchise arrangement. It will then be in charge of operating and developing the Economy (ibis and ibis Styles) and Midscale (Novotel and Mercure) segments in China, Mongolia and Taiwan, as well as the Upscale Grand Mercure brand.
Accor will continue to operate and develop all of its other Luxury and Upscale brands in China – Sofitel, Pullman, MGallery and The Sebel. Huazhu will take a 10% minority stake in Accor’s Luxury and Upscale business in China and will help to accelerate future development in the country, thanks to its close ties with key Chinese business partners and investors. All of Accor’s existing hotels in China will continue to be operated under their current international brand standards, benefiting from the global distribution and loyalty platforms already in place, together with the added support of
Huazhu’s networks and domestic reputation. They will maintain their identities and unique features, while benefiting from Huazhu’s extensive on-the-ground support capabilities and local expertise.
This strategic alliance aims to accelerate expansion by leveraging Huazhu’s strength in development, real estate investor relations and experience in operating a sizable hotel network in China. Huazhu plans to open 350 to 400 new hotels under the Accor brands in the next five years. The agreement will offer the 47 million cardholders in the partners’ guest loyalty programs the opportunity to stay in a combined network of more than 5,600 hotels around the world.
Under the arrangement, Accor will take a 10% stake in Huazhu and have a seat on the company’s board of directors.
3. Return to fast development of the hotel base, focused on markets in the new economies
A total of 208 hotels, comprising 29,556 new rooms, were opened worldwide in 2014, the equivalent of more than one hotel every two days and one ibis every three days. Franchise agreements and management contracts accounted for 91% of this development, while leased hotels represented 6% and owned hotels 3%. Of the openings, 71% were outside Europe, including 41% in the Asia-Pacific region, 15% in Latin America and 15% in the Mediterranean/Africa/Middle East region.
Accor’s development in 2014
Americas
Europe (excluding France and Mediterranean)France
Asia Pacific
Mediterranean, Middle East, Africa
41%
7%
15%
15%
22%
17Registration Document 2014

CORPORATE PRESENTATIONStrategic vision and outlook1
Pipeline at end-2014
• Owned
• Leased • Managed
• Franchise
6%
30%
61%
91%asset-lightFranchised
3%
At the same time, the development pipeline increased sharply during the year, to 156,000 rooms at December 31 from 136,000 at end-2013. Of the total, 52% are in the Asia-Pacific region, 18% in the Americas, 16% in Europe and 14% in the Mediterranean/Africa/Middle East region. An analysis by segment shows faster growth in the Upscale and Luxury segment, which accounts for 22% of the pipeline, compared with 14% of the current room base.
• France
• Europe (excluding France and Mediterranean)
• Mediterranean, Middle East, Africa
• Asia-Pacific
• Americas
18%
52%
13%
14%
3%
Regions
• Managed
• Franchised
• Owned
• Leased
71 %
8%1%
Operating structures
20%
• Luxury & Upscale
• Midscale
• Economy
22%
Segments
46%
32%
4. Record financial results in 2014
In 2014, Accor delivered a record financial performance at many levels:
�� €602 million in EBIT, representing a record 11.0% margin ratio, led by HotelInvest’s restructuring transactions;
�� record operating free cash flow of €304 million before disposals and acquisitions;
�� a historically high 14.6% return on capital employed (ROCE).
In addition, all of the 2014 objectives assigned to HotelServices and HotelInvest were met during the year:
For HotelServices:
�� a 49.0% EBITDA margin, excluding the Sales & Marketing fund and the loyalty programs;
�� very strong cash flow, amounting to 80.5% of EBITDA.
For HotelInvest:
�� a 6.1% EBIT margin, up sharply from a pro forma 4.1% in 2013;
�� very strong cash flow, amounting to 28.4% of EBITDA after maintenance and development expenditure.
18 Registration Document 2014
1
CORPORATE PRESENTATIONStrategic vision and outlook
1.5.2. TRENDS AND OUTLOOK
Fourth-quarter 2014 trends continued into January and February 2015, with situations varying by geography. In Europe, performances were very strong in the United Kingdom and robust in Germany, but more mixed in France. After eight straight years of contraction, operations in Southern Europe (Spain, Italy, Portugal and Greece) enjoyed a clear rebound in demand, which gained momentum during the year and continued into early 2015. Despite a slight decline in China, business remained very firm in the Africa-Middle East and Asia-Pacific regions. On the other hand, the Americas saw the beginnings of a slowdown in the second half, led by Brazil, which had sharply outperformed through to July 2014 due to preparations for the FIFA World Cup.
In an economic environment that remains uncertain in France, business is still robust, in line with what was observed in late 2014. As a result, Accor has entered 2015 relatively confident in its business outlook.
During the year, the Group intends to accelerate its transformation on the basis of the broad outlines set in 2014, with several large-scale projects:
�� accelerating implementation of the HotelInvest asset restructuring program;
�� deploying the eight Digital Plan programs;
�� optimizing development and building the brands;
�� deploying a new vision for food services and procurement;
�� modernizing our culture, primarily by upgrading our operating procedures.
1.5.3. A NEW DIGITAL STRATEGY
In October 2014, Accor announced the roll-out of a €225-million investment plan that will engage the Group in a wide-ranging digital transformation aimed at consolidating its leadership across the guest experience value chain.
The “Leading Digital Hospitality” plan is based on a holistic response to the challenges of an increasingly digital world, in a market environment shaped by the accelerating pace of change both in technologies and in guest behavior.
Built around three targets – customers, employees and partners – the plan is designed to rethink the role of digital technology and incorporate it into every aspect of the customer journey, while also improving our offering for investor partners and consolidating our distribution market share. It is being supported by two pillars, IT infrastructure and data management, and deployed through eight programs, which will begin to deliver their first benefits in 2015.
1. An integrated plan based on eight programs
Four of the programs are focused on guest benefits, in a commitment to understanding guests better and improving their experience in our hotels. At the same time, they will step up the acquisition of new guests in the databases and help to retain their business.
�� “Mobile First” is aligned with the growing migration to mobile devices, such as smartphones and tablets, by offering a single app incorporating all of our guest services before, during and after the stay.
�� “Customer Centric” will develop and use databases to ensure personalized follow-up and services, while centralizing guest feedback on the corporate Voice of the Guest platform.
�� “Seamless Journey” will deliver a smooth guest experience at every stage of their journey, with electronic payment solutions, one-click booking, online check-in and the virtual Le Club Accorhotels card.
�� “Mice & BtoB” will develop innovative digital solutions for businesses, such as online booking of meeting rooms, and will increasingly incorporate BtoB services in the global booking website, accorhotels.com.
In addition to guests, the plan also includes programs dedicated to employees and partners:
�� “Employee Friendly” aims to simplify check-in processes using tablets and smartphones, develop online training solutions and encourage experience sharing via “AccorLive”, our corporate social network.
�� “Owner & Franchise Centric” will make Accor the industry’s most efficient and transparent partner, in particular by offering comprehensive dynamic pricing and revenue management solutions, a dedicated portal to access personalized information and services and an optimized billing process, starting in 2015.
Lastly, our digital transformation also involves consolidating our IT applications and systems to make them even more robust and agile. In this regard, the following programs will be implemented in 2015:
�� “Infrastructure Transformation” will focus on optimizing systems to bring new services to market more quickly and keep pace with rising transaction volumes.
�� “Business Intelligence & Analytics” will ensure that operational decisions are increasingly based on analyses of the large volumes of data collected, particularly from the hotels.
19Registration Document 2014

CORPORATE PRESENTATIONStrategic vision and outlook1
The digital plan is supported by the extremely robust resources already in place, some of which have been extensively improved since the beginning of 2014 and will continue to be upgraded:
�� TARS (The Accor Reservation System) is a powerful distribution application that today handles 59% of our bookings and more than five million queries a day.
�� accorhotels.com, our multi-brand booking portal, manages an average 45,000 reservations a day. Already available in 32 local versions and 16 languages (18 in 2015), it now offers My Trip Planner, a new trip planning service that lets customers prepare their stays in 70 destinations around the world.
�� Le Club Accorhotels, our multi-brand loyalty program, added more than four million new members in 2014 (for a total of 18 million members at end-2014) and increased the generosity of its benefits. It is the only hotel loyalty program in the world that allows customers to redeem points with no date or availability restrictions.
Based on these resources, several important initiatives were already launched in 2014 at each stage in the customer journey, including:
�� increased personalization of e-mail campaigns through SMART, an exclusive self-learning recommendation tool that generated more than 14,000 e-mail campaigns in 16 languages in 2014;
�� the worldwide roll-out of “Welcome by Le Club Accorhotels”, a digital solution that revisits hospitality and aims to make guest stays easier through smartphone messaging. It was up and running in 1,000 hotels by the end of 2014;
�� a complete makeover of the photo and video images available online, with more than 2,500 new shoots currently in progress.
2. Driving digital transformation with a culture of innovation
Additional resources will be dedicated to innovation, through open innovation platforms and tactical acquisitions to strengthen our expertise or technology. One example is our acquisition of French start-up Wipolo, a leading-edge travel software company that offers mobile and web-based itinerary management services.
3. An ambitious five-year investment plan
Implementation of the plan will be managed by a dedicated governance structure, comprising in particular a Digital Steering Committee and eight Digital Program Committees. Major financial resources, totaling €225 million between 2014 and 2018, will be committed to successfully lead these initiatives, including the €5 million already spent in 2014. Of the total budget, capital expenditure will account for 55% and operating expenditure 45%. In all, 60% of outlays will be designed to consolidate current performance by improving middle and back office solutions and 40% will be dedicated to gaining market share and optimizing unit distribution costs.
20 Registration Document 2014

22.1. VISION AND COMMITMENTS 222.1.1. A strategic vision built around CSR 222.1.2. A constant concern for stakeholders 232.1.3. Commitments supported by the Ethics
and Corporate Social Responsibility Charter 27
2.2. MANAGING THE STAKEHOLDER DIALOGUE PROCESS 28
2.2.1. CSR governance 282.2.2. CSR policies and programs 302.2.3. PLANET 21 objectives and results 32
2.3. COMMITMENTS TO EMPLOYEES 352.3.1. Accor’s employment model and human capital 352.3.2. An ambitious goal for human resources management 382.3.3. Motivating employees and deepening their engagement 382.3.4. Working conditions that enhance
employee well-being and team performance 392.3.5. Supporting employees throughout their career 412.3.6. Compensation and benefits 442.3.7. Diversity and equal opportunity policies 452.3.8. Social dialogue 47
2.4. SOCIAL RESPONSIBILITY COMMITMENTS 482.4.1. Responsibility to guests 482.4.2. Responsibilities to suppliers and contractors 542.4.3. Protecting children from abuse 572.4.4. Demonstrating Accor corporate citizenship with Solidarity Accor 58
2.5. ENVIRONMENTAL COMMITMENTS 612.5.1. Environmental management 612.5.2. Energy and climate change 622.5.3. Water 662.5.4. Local environmental impacts 682.5.5. Waste 70
2.6. MEASURING AND ASSESSING PERFORMANCE 722.6.1. CSR indices and standards 722.6.2. Awards and recognition 722.6.3. Methodological review 732.6.4. Indicator Tables 79
2.7. INDEPENDENT VERIFIER’S REPORT ON CONSOLIDATED SOCIAL, ENVIRONMENTAL AND SOCIETAL INFORMATION PRESENTED IN THE MANAGEMENT REPORT 86
Corporate RESPONSIBILITY
Registration Document 2014 21

CORPORATE RESPONSIBILITYVision and commitments2
A pioneering company, Accor has built its history on a deep dedication to forging ties.
“As a leader, we have always cared about upholding a high level of commitment to our employees, our guests, our partners and our host communities in more than 90 countries. This is our duty as a good corporate citizen. Today, our corporate social responsibility process is irrigating every aspect of our business, creating not only economic value for the Company and its partners, but also social, environmental and societal value for every stakeholder in the Accor ecosystem. However, it’s not enough to create this value, you also have to share it.
Inspired by our commitments, which were reaffirmed in 2014 in our Ethics and Corporate Social Responsibility Charter, Accor will continue to reinvent itself and enhance its appeal, while driving sustainable growth for the benefit of all our stakeholders.”
Sébastien Bazin, Chairman and Chief Executive Officer
2.1. VISION AND COMMITMENTS
2.1.1. A STRATEGIC VISION BUILT AROUND CSR
As an international hospitality group, Accor has a simple mission: to welcome guests and make them feel at home with lodging and meals everywhere around the world. In fulfilling this mission, all of our strategic decisions are shaped by two imperatives. The first, inherent to any company, is to make a profit. The second is an expression of the growing awareness of global challenges, which demands that companies assume new responsibilities, such as sharing the value they create, nurturing fair and equitable stakeholder relations and integrating social responsibility and environmental considerations into their business practices.
Accor’s business model holistically addresses both of these imperatives through a Corporate Social Responsibility (CSR) process that meets the expectations of our two main customers: the guests we welcome in our hotels and the investors and franchisees who help to expand our network. The model comes to life in our hotels, our core business unit and the embodiment of our deep local roots in both our host communities and society as a whole. It is nurtured by the close relationships forged between a hotel’s employees and its service providers and suppliers, the primary source of guest satisfaction and an enriching guest experience.
In addition to quality of service, guests express a multiplicity of expectations concerning Accor including: the best room rates; an ideal location in the chosen destination and the possibility of enjoying the same experience in a variety of destinations around the world; an easy guest journey (in particular booking, which is now largely done online); the desire for a moving, personal experience; and the emerging and increasingly earnest “search for meaning”.
Through its two businesses, HotelServices and HotelInvest, Accor is working every day to meet these needs, often with the beneficial support of the CSR process. Examples include:
�� managing expenses by (i) leveraging its expertise as a hotel operator (as seen, for example, in the employee retention programs that hold down turn-over costs); (ii) optimizing procurement and securing supply with local solutions; and (iii) reducing energy and other costs;
�� developing attractive, innovative new products and services, particularly in the area of social responsibility, which address our guests’ search for meaning.
Registration Document 201422

2
CORPORATE RESPONSIBILITYVision and commitments
2.1.2. A CONSTANT CONCERN FOR STAKEHOLDERS
Accor hotels are like a city where half a million people live every day. As such, they form living communities deeply anchored in their cultural, historical or natural heritage, interacting both with people in the local economy to procure goods and services and with the host population as a whole. Like a city, they use natural resources, produce waste and release effluent, as well as manage their relationships with local authorities.
Because Accor is the sum of its 3,700 hotels, each of which is primarily focused on the economic actors and communities living nearby, our operations are seamlessly interwoven with our stakeholders’ activities and expectations, especially at the local level. As a result, managing stakeholder relationships is an intrinsic part of our business, and a strategic driver for a hospitality company.
Stakeholders, the associated challenges and how value is shared
In 2013, a mapping exercise, carried out with the support of the corporate departments, helped to identify our stakeholders, determine the type of dialogue fostered with each one, and compare stakeholder and corporate views on the criticality of various CSR issues.
In 2014, this process was taken to the next level with a study that gave rise to the following diagram, which offers an overview of our leading stakeholders and each one’s key issues. It also illustrates, for the first time, how these stakeholders share in the financial value that Accor creates.
Registration Document 2014 23

CORPORATE RESPONSIBILITYVision and commitments2
Stakeholders, the associated challenges and the distribution of revenue
90%
35%
10%
16%
NA
0,1%*
4%
3%
32%
9%
Hotel and head office employees, employee representative organizations
Engagement, retention, professiona-lization, workplace health and safety, employer brand
Wages, social security contributions, profit-shares, employee stock ownership
Appeal, differentiating factors, loyalty, profitability, deployment of Accor brand standards, business ethics
Franchise fees, management fees, marketing fees
Rent
Development partnersShareholders
Professional associations and networks of associations, research and training institutes
Promoting/showcasing the tourism/hospitality industry and its professions, collaboration
Membership fees, subsidies
Professional and industry stakeholders
Investors, banks, statutory auditors and rating agencies, analysts
Public authorities and international organizations
Income tax
Compliance, consultation, reputation and visibility
Public authorities & institutions
Dividends
Return on investment, share price performance
1%
Financial partners
Interest
Access to finance
Expenditure and earnings
Suppliers, service providers, distributors (OTAs, referral websites)
and business partners
Quality management, sustainable relations, social
and environmental performance, cost
Purchases (recurring transactions and investments), commissions
Suppliers & distributors
Property investors (owners of hotel properties)
Franchisees, owners of managed hotels
Food and energy resources, raw materials, landscapes, reduction in the environmental footprint (water, waste, biodiversity, etc.)
Silent stakeholder
Social license to operate, local integration, local social and economic development, solidarity
Companies, travel agencies, individual guests and groups
Satisfaction, attentiveness, loyalty, appeal, innovation, responsible tourism
Sales
Customers
Takeholder category
* Excluding local initiatives (areas, countries, hotels).
Main challenges Cash flows from Accor to stakeholders(as a % of revenue)
Cash flows from customers and develop-ment partners to Accor(as a % of revenue)
Local communities, associations, partners and NGOs
Environment Local communities
Corporate philanthropy, donations, partnership
Employees
Registration Document 201424

2
CORPORATE RESPONSIBILITYVision and commitments
Assessing the materiality of issues
The Sustainable Development Department continuously tracks the Group’s CSR issues and challenges. In 2014, its assessment of the materiality of these issues was updated, with a focus on:
�� identifying stakeholder concerns and expectations and determining their degree of importance;
�� benchmarking Accor’s performance against industry practices;
�� measuring the impact of stakeholder expectations on Accor business, either financially or in terms of reputation.
The findings of the update, which are presented in the diagram below, show that respect for guests and responsible employment practices were the two highest-ranking issues, confirming the importance of people in the hospitality industry. The analysis also demonstrated that Accor must address many challenges in the three core aspects of CSR, with a greater emphasis placed on employment issues, followed by social and environmental concerns.
Stakeholder dialogue
LEV
EL
OF
STA
KE
HO
LDE
R C
ON
CE
RN
MO
DE
RA
TE
HIG
HC
RIT
ICA
L
CUSTOMERS
EMPLOYEES
ENVIRONMENT
PUBLIC AUTHORITIES AND INSTITUTIONS
LOCAL COMMUNITIES
SUPPLIERS
Solidarity
Responsible eating
Business ethics
Workplace health and safety
Waste
Biodiversity
Corporate governance
Water
Safety and security
Guest health
Diversity
Working conditions
Service quality
Training
Compensation
Local employment
Combating child sex tourism
Social dialogue and employee representation
Regulatory compliance
Responsible product and services offering
Energy and CO2
Accessibility
Disamenities and pollution
Disease prevention
Personal data protection
Combating prostitution
Human rights
Local purchases
Relations with suppliers/SMEs
MODERATE
IMPACT ON ACCOR
HIGH CRITICAL
Stakeholder dialogue
Dialogue policy
Implementation of our CSR commitment is supported by continuous stakeholder dialogue, a critical process that plays an ongoing, inherent role at every level of the organization and in every aspect of the business. A corporate stakeholder dialogue procedure defines the process’ scope of application and implementation, the responsibilities at every level (global, regional, local) and the resources used to enhance dialogue and keep stakeholders informed.
The importance of stakeholders to the Group is illustrated by the Ethics and Corporate Social Responsibility Charter, the most compelling expression of our dedication to social responsibility. As such, it is organized around our flagship commitments to each major stakeholder category (see page 27).
Registration Document 2014 25

CORPORATE RESPONSIBILITYVision and commitments2
Outside partnerships to extend the process
To capitalize on the capabilities and recommendations of organizations with recognized expertise in key issues, partnerships have been forged to help drive continuous improvement.
ECPAT (End Child Prostitution, Child Pornography & Trafficking of Children for Sexual Purposes): since 2001, Accor has been engaged in the fight against child sex exploitation in its hotels in partnership with ECPAT International, an NGO comprising 77 organizations in more than 70 countries. Between 2008 and 2013, Accor was a
member of the Executive Committee of the “Code of Conduct for the Protection of Children from Sexual Exploitation in Travel and Tourism”, developed by ECPAT and the World Tourism Organization (see page 57).
Pur Projet: this organization is dedicated to combating climate change through reforestation and forest conservation projects, with a focus on the involvement of local communities. Since 2012, a partnership with Pur Projet has supported the development of Accor Plant for the Planet program (see page 69).
Highlights of the year
Stakeholder 2014 highlights
Employees Accorlive global Intranet revamped and Accorlounge enterprise social network launched.Online hiring strengthened by the creation of the ibisjobs.com website and the launch of the accorjobs.com mobile app.Accor “Carte Bienvenue” (offering special benefits for employees) revamped and partnerships extended.Support measures for the head office voluntary separation plan finalized.
Guests New Welcome process (page 50).Voice of the Guest program introduced to drive continuous improvement in the guest experience (page 49).Spirit of Service guidelines revamped for the Mercure and Novotel brands and prepared for ibis Styles.PLANET 21 signage updated (page 30).
Franchisees, owners and property investors
Nearly 20 conferences and investor fairs sponsored around the world, including IHIF Berlin, HICSA Mumbai, AHIC Dubai, AHIF Addis Ababa and EQUIP HOTEL Paris.Annual franchisee conference held in Rio de Janeiro.Creation of a new worldwide database with the contact details of existing and potential investors and partners, which Accor teams can use to track current projects and exchange information among the country organizations.
Suppliers, contractors and financial and business partners
Collaborative CSR venture formed with our largest baked goods supplier and a uniforms vendor.Collaborative venture formed with a mid-sized French company to equip Novotel units with a bundle of interactive, multi-user solutions, intended especially for children.Position of Vice-President, Entrepreneur Promotion and Support created to bring entrepreneurs and mid-sized businesses into the Group and to support them in their collaboration with Accor to help encourage initiative and agility across the organization.
Communities and local development stakeholders
Comprehensive sensitivity training and information kit prepared to combat child sex tourism, in partnership with ECPAT France and two French Interior Ministry organizations – the International Cooperation Directorate (DCI) and the Central Office for the Repression of Violence Against Individuals (OCRVP) (page 58).“One CSR Initiative per Month” program introduced in Mexico, to encourage hotels to focus every month on a CSR issue resonant with their guests, employees and host communities.
Institutional and industry stakeholders
Participation in international consortia or international trade organizations, like WTTC, ITP and HOTREC, and in national trade organizations, like UMIH and GNC, in a spirit of sharing and collaboration.Serving on the steering committee for the ILO Global Business and Disability Network, at the International Labour Organization’s request.Organization of the Take-Off student challenge, whose subject in 2014 was “How will mobile use transform the hospitality industry and the guest experience?”.
Financial community Meetings with 611 investors, via conferences, roadshows and reverse roadshows.Presentation by Tristan Lecomte at the April 29 2014 Annual General Assembly concerning the partnership with Pur Projet and the objectives and results of the Plant for the Planet program.
Registration Document 201426

2
CORPORATE RESPONSIBILITYVision and commitments
2.1.3. COMMITMENTS SUPPORTED BY THE ETHICS AND CORPORATE SOCIAL RESPONSIBILITY CHARTER
Deeply inspired by a dedication to acting responsibly and sharing value, Accor upholds the highest ethical standards, strengthened over time by assertive commitments to all of its stakeholders. This dedication was reaffirmed in 2014 with the publication of the revamped Ethics and Corporate Social Responsibility Charter, which is inspiring all of Accor socially responsible policies and guiding the Group’s responsibility process, in the areas of management ethics, integrity, compliance and corporate social responsibility.
Ethics and CSR Charter
Accor’s valuesand management
principles
Frame of reference- Being familiar with the applicable laws and regulations- Meeting and exceeding regulatory standards
The way we do business- Respect for people- Compliance with good business practices- Protection of property and data
Implementation methods
- Distribution of the Charter- Data reportingOur relations
with stakeholders
Areas of application
Championed by the Chairman and Chief Executive Officer, the Charter presents in detail the foundations of our culture and commitments, which are built on:
�� Accor’s five values and three management principles;
The values of Spirit of Conquest, Imagination, Trust, Respect and Performance underpin and impel the sense of hospitality and service that nurtures our reputation around the world. They form the foundation of Accor ethical commitment and express the Group’s unique personality. In 2013, they were enriched with a mindset shaped by three management principles:
�y Agility: “We are striving to enhance our agility and our ability to call ourselves into question”,
�y Clarity: “We are committed to demonstrating clarity, by emphasizing simplicity in our practices, processes and employee relations, and by precisely defining everyone’s roles and responsibilities”,
�y Accountability: “We encourage employee accountability at every level of the business.”,
These principles are strengthening the management practices based on attention to others, respect for all our differences, transparency, decision-making, openness to new ideas and a sense of initiative;
�� the frame of reference, which expresses our commitment to complying systematically with applicable laws and regulations and fundamental international principles, such as the ILO conventions or the UN Global Compact, which Accor has been actively supporting since 2003 (1);
�� Accor ethical commitments in the way the Group conduct its business, in such areas as fairness and respect for people, compliance with good business practices and the protection of property and data. See example below:
Particular attention is paid to bribery, an issue that is addressed via two additional measures:
�� combating bribery of public officials: Accor pledges that no commission will be paid directly or indirectly to any elected or appointed public official with regard to the Company’s contracts or its relations with government agencies;
�� combating bribery in the private sector: Accor pledges to take all reasonable measures to avoid the use of bribes with regard to both its purchasing and sales procedures.
To help employees put these fundamental principles into practice, the Ethics and Corporate Social Responsibility Charter gives real-world examples of situations they could encounter and describes the right way to handle them.
Given the large number of countries in which Accor operates, constant attention is paid to the risk of bribery. In addition to being addressed in the Charter, it has also been included in the risk map prepared by the Risk Management Department and is tracked with a detailed process. Internal audit grids also cover this issue through the verification of certain processes, such as hotel development and procurement. If employees have a question about a specific situation, they can speak to their manager or contact the Human Resources or Legal Affairs Department in their country.
No incidents of bribery were reported to judicial authorities by Accor in 2014 and no provisions were recognized for bribery-related risks.
Combating bribery
(1) Reference texts include the principles of the 1948 Universal Declaration of Human Rights; the OECD Guidelines for Multinational Enterprises issued by the Organization for Economic Cooperation and Development; the ten principles of the United Nations Global Compact; the International Labour Organization’s fundamental conventions [1966 International Convention on the Elimination of All Forms of Racial Discrimination; the 1990 Convention on the Protection of the Rights of All Migrant Workers and Members of Their Families; the 1989 Convention on the Rights of the Child; The Worst Forms of Child Labour Convention; 1957 Abolition of Forced Labour Convention]; the United Nations Conventions [The 1949 Convention for the Suppression of the Traffic in Persons and of the Exploitation of the Prostitution of Others; the 1966 International Covenant on Economic, Social and Cultural Rights; the Convention against Transnational Organized Crime]; and the Financial Action Task Force (FATF).
Registration Document 2014 27

CORPORATE RESPONSIBILITYManaging the stakeholder dialogue process2
�� specific commitments made to the main stakeholder categories: employees, guests, financial and business partners, suppliers and host communities – as well as in relation to the environment. All of the most frequently expressed expectations are covered, including diversity, work-life balance, hotel security, transparency, child protection and the preservation of natural resources;
�� the Charter distribution process, covering in detail the distribution to employees and outside stakeholders, such as the Group’s owner and franchisee partners, and the role of senior management, Human Resources Departments or Legal Departments in reporting concerns and red flags.
Officially launched in July 2014 at the Summer Academy by Chairman and Chief Executive Officer Sébastien Bazin, the Charter is now being gradually deployed across the organization. Directors are responsible for promoting its values and commitments to their teams and carefully tracking its application. The document is available for download by employees on the various Group Intranets and by outside stakeholders from Accor’s website (www.accor.com) under “Sustainable Development”. It was also presented, in a total of 28 meetings, to the Group Executive Committee and all of the Executive Committees of the regions and the corporate support functions. Distribution to hotel General Managers began in late 2014 and will continue throughout 2015, with the support of a quiz enabling managers to test their knowledge and understanding of the issues. A hotel deployment kit is also available online. In addition, the Charter is being gradually presented to Accor partners.
2.2. MANAGING THE STAKEHOLDER DIALOGUE PROCESS
2.2.1. CSR GOVERNANCE
Creation of an Ethics and CSR Committee
The newly created Ethics and CSR Committee, which met for the first time on December 22, 2014, has been tasked with:
�� inform the Executive Committee about questions pertaining to Ethics and CSR in order to better anticipate the opportunities, challenges and risks associated with them;
�� make recommendations regarding the development of our commitments in the areas of human resources, risk management and sustainable development;
�� monitor the implementation and performance of the actions we implement, for example the current deployment of the Group’s new Ethics & CSR Charter;
�� debate any issues concerning managerial ethics, our business conduct or possible conflicts of interest;
�� analyse any dysfunctions and implement specific additional monitoring if required.
Chaired by Sven Boinet, Deputy Chief Executive Officer, the Committee comprises three Executive Committee members, three representatives from operations (Southeast Asia, Africa and Latin America) and six representatives from the directly concerned corporate support functions (Human Resources, Security and Safety, Legal Affairs and CSR).
In the future, it will meet three times a year and supervise the progress made on the ethics and CSR roadmaps.
A global, Groupwide network of Ethics and CSR correspondents has been put into place, led at the corporate level by two people who coordinate deployment of the Charter and lead and track the related projects. HotelInvest and HotelServices ethics correspondents have been embedded across our operations and regions. The Ethics and CSR correspondents serve as advisors for Charter deployment in their region, leading the related working groups, reporting any issues requiring attention, red flags or best practices and keeping the Executive Committee informed.
Overseeing the CSR process
The corporate social responsibility policy is primarily led by the Sustainable Development Department, the Human Resources Department and the Solidarity Accor endowment fund.
The Sustainable Development Department is in constant contact with the country operations, the brands and the support functions (Human Resources, Purchasing, Technical Affairs, etc.). It is backed by a network of 130 country-correspondents and dedicated committees in certain countries. It interacts with the brands and the support functions via a network of dedicated correspondents and, for certain brands, dedicated committees, as well as during ISO management reviews for ibis and Novotel.
The Sustainable Development Department is primarily responsible for:
�� promoting the PLANET 21 program in the organization and externally;
�� leading the process structured by performance objectives and indicators, and coordinating sustainable development programs and the related partners;
�� moderating the PLANET 21 community around the world by providing support in the form of expertise and social and environmental intelligence. In particular, in September 2014 a three-day PLANET 21 seminar in Paris brought together 60 sustainable development correspondents from around the world;
�� designing and deploying tools capable of improving the management of Accor sustainable development performance;
�� initiating new projects, innovating in the area of sustainable development and tracking emerging issues.
Registration Document 201428

2
CORPORATE RESPONSIBILITYManaging the stakeholder dialogue process
The Corporate Human Resources Department has numerous contacts in the regions, countries and hotels.
Country Human Resources Directors report to their country’s Operating Department. They align Group policies with local conditions and practices, address staffing issues in line with business needs and develop dedicated resources, if necessary. They can leverage all of the expertise and tools developed at Group level, thereby generating synergies that ensure consistency in practices and increase their impact.
Organized into centers of expertise, the Corporate Human Resources Department interacts directly with the regional and country human resources departments and jointly with all of the operating departments and support functions, such as Legal Affairs, Communication, Marketing, IT and Sustainable Development.
Its main expertise units are as follows:
�� Learning & Development and Académie Accor;
�� Corporate Compensation and Employee Benefits;
�� Talent Management and International Mobility;
�� HR Marketing and Employer Brand;
�� Social Responsibility and Employee Relations;
�� Head Office and Corporate Human Resources;
�� Brand/Segment Human Resources (Economy, Midscale, Luxury and Upscale).
The Solidarity Accor corporate endowment fund helps disadvantaged and socially isolated people by supporting outreach projects championed by employees. It is guided in this mission by a number of decision making and advisory bodies, including a Board of Directors, a Selection Committee and a standing team working with local correspondents. These correspondents, who come from the region concerned by the project or have worked there for several years, act as relays between Solidarity Accor and local employees. They also provide useful information and advice concerning the projects.
Addressing CSR issues at other management levels
CSR issues and challenges are addressed across the Group’s decision-making organization. For example, the regional Executive Committees led by the members of the Group Executive Committee regularly discuss sustainable development and human resources issues at their meetings, which may be attended from time to time by representatives from the corporate Human Resources or Sustainable Development Departments. These issues are also addressed at the annual conventions organized by the corporate functions, such as the Legal Affairs Convention, the Development Convention and the Franchisees Convention in France.
Conversely, Executive Committee members are directly involved in the bodies tasked with leading the CSR process:
�� Executive Committee members are invited to address seminars organized for the Human Resources and Sustainable Development networks. In 2014, for example, the Chairman and Chief Executive Officer and the Chief Operating Officer of HotelInvest spoke at the PLANET 21 seminar;
�� the Deputy Chief Executive Officer in charge of Transformation, Human Resources and Legal takes part in meetings for the corporate Human Resources community;
�� the Chairman and Chief Executive Officer, the Chief Financial Officer and the Chief Executive Officer of HotelServices, Germany, Poland and Central Europe all sit on Solidarity Accor’s Board of Directors.
Registration Document 2014 29

CORPORATE RESPONSIBILITYManaging the stakeholder dialogue process2
2.2.2. CSR POLICIES AND PROGRAMS
The Ethics and Corporate Social Responsibility Charter provides a framework for Accor’s CSR policy, which covers three key areas: the PLANET 21 sustainable development program, human resources policies and the Solidarity Accor endowment fund.
Charter 21
Cross-cutting programs Topic-specific programs Tools
ISO 14001
OPEN
Plant for the Planet
WATCH
Water and Energy Waste
Responsibleeating
Sustainableproducts & services
Employee opinion surveys
HR Data
Group human resources policies> brands > countries > hotels
Group commitments and agreements
Local programs
BernachesAwards
ProfessionsChallenge
“Carte Bienvenue” IHMP
Trainingand insertion
Local know-how
Humanitarianand emergency aid
Fundingplatform
Support for peoplewho have been marginalized
or are living in poverty.
Employee participationalongside local NGOsin three focus areas:
HUMANRESOURCES
SOLIDARITYSUSTAINABLEDEVELOPMENT
Académie Accor Accor JOBS
Ethics and CSR Charter
The priorities pursued in these areas in 2014 are described below.
PLANET 21
Launched in 2012, the PLANET 21 program underpins Accor’s sustainable development strategy. After the positive results observed mid-way through the program in late 2013 – when 86% of results were trending upwards – the Group focused in 2014 on strengthening its sustainable development process by:
�� continuing to deploy PLANET 21, with a special emphasis on encouraging hotels to earn the Charter 21 Bronze rating, reduce their water and energy use, participate in the Plant for the Planet program and increase the number of women hotel General Managers;
�� consolidating the process’ fundamentals by reinforcing three programs – Plant for the Planet, child protection (renamed WATCH in 2014) and eco-design (especially the Meeting 21 green meeting solution) – and by revamping the waste management policy;
�� building guest awareness of sustainable development issues with PLANET 21, both in the hotels (posters, screens, etc.) and in digital media (accorhotels.com, but also Trip Advisor’s GreenLeaders rating and the Accor-designed Carbon Optimizer app, which enables users to measure the carbon footprint of a seminar or a one-night stay in a hotel).
In 2015, this roadmap will be extended and expanded with new initiatives, particularly the revamping of the OPEN management application and the development of the next generation PLANET 21 strategic plan covering the 2016-2020 period.
Human resources policies
When Accor reorganized its operations in 2014, Human Resources both supported the transformation and very quickly initiated and delivered a number of projects to help implement the related changes.
These included:
�� revamping the Accor “Carte Bienvenue”, with a new website and partnerships for employees;
�� publishing the Ethics and Corporate Social Responsibility Charter;
�� preparing a new employee survey system;
�� creating a Learning & Development unit;
�� setting up a web and mobile HR unit in the Employer Brand Department;
�� innovating in the approach to the brands’ service attitude policies, launching the ibis Styles Spirit of Service and revamping the Mercure and Novotel Spirits of Service.
Also in 2014, all of the Corporate Human Resources Department’s main expertise units worked closely together to formalize the Group’s human resources vision and defined five major strategic objectives as part of their new 2015 roadmap (see page 38).
Registration Document 201430

2
CORPORATE RESPONSIBILITYManaging the stakeholder dialogue process
Solidarity Accor
The Solidarity Accor corporate endowment fund spent 2014 consolidating its activities following its change in legal status, particularly via:
�� its first year of operation under the new legal status as an endowment fund, as opposed to previous corporate foundation status;
�� the election of a new Board of Directors;
�� the introduction of new fund-raising systems, in particular via the Le Club Accorhotels loyalty program;
�� the sustained deployment of programs to support communities and associations (see page 59).
Just like the hotel data reporting system, the method used for deploying our CSR commitments, policies and programs depends on whether the hotels are owned, leased, managed or franchised.
�� CSR commitments apply to every Accor hotel regardless of operating structure.
�� The PLANET 21 program covers the owned, leased and managed hotels. In the case of franchised hotels, if the program is included in the franchise agreement, it must be deployed. Otherwise, implementation is recommended to the owner, who makes the final decision.
�� Human resources policies and tools are deployed differently depending on the type of operating structure (see page 36). Most of them apply directly to owned, leased or managed hotels, with the exception of social dialogue, which is led at Group level only for owned and leased units. The Group offers franchised hotel recommendations and a variety of tools, but they remain responsible for their own human resource policies.
As a listed company headquartered in France, Accor has a legal obligation to disclose employee, social and environmental information for all of the entities in its scope of consolidation, which corresponds to owned and leased hotels. Accor has chosen to extend this disclosure, whenever possible, to all of the hotels operating under its brands. Depending on the issue, the reported data therefore include a more or less large percentage of the managed and franchised hotels.
A deployment process aligned with each hotel’s operating structure
Registration Document 2014 31

CORPORATE RESPONSIBILITYManaging the stakeholder dialogue process2
2.2.3. PLANET 21 OBJECTIVES AND RESULTS
Launched in April 2012, our PLANET 21 sustainable development program was designed in 2011 based on an assessment of the Group’s environmental footprint and the findings of a survey of guest expectations and concerns in this area. One of the program’s key components is the active participation of both guests and the nearly 180,000 people working under Accor brands worldwide.
PLANET 21 organizes the Group’s sustainable development process, with 21 measurable objectives for 2015 in seven key areas:
Summary table as of end-2014
Pillar 21 commitments 2011-2015 objective2014
results2015 trend
Change vs. 2013
1. Ensure healthy interiors 85% of hotels use eco-labeled products97%
2. Promote responsible eating 80% of hotels with restaurants promote balanced dishes
97%
3. Prevent diseases 95% of hotels organize disease prevention training for employees
74%
4. Reduce our water use 15% reduction in water use between 2011 and 2015 (owned, leased and managed hotels)*
-5.6%*
5. Expand waste recycling 85% of hotels recycle their waste (in countries with recycling channels)
88%
6. Protect biodiversity 60% of hotels participate in the Plant for the Planet reforestation program (excluding hotelF1)
46%
7. Reduce our energy use 10% reduction in energy use between 2011 and 2015 (owned, leased and managed hotels)*
-4.5%*
8. Reduce our CO2 emissions 10% reduction in CO2 emissions between 2011 and 2015 (owned, leased and managed hotels)*
-3.8%*
9. Increase the use of renewable energies
10% of hotels use renewable energies9%
10. Encourage eco-design 40% of hotels have at least three eco-designed room components
40%
11. Promote sustainable building
21 new or renovated hotels are certified as sustainable buildings
13 hotels
12. Introduce responsible hotel offers and technologies
20% of owned and leased hotels offer green meeting solutions
ND
13. Protect children from abuse 70% of hotels have pledged to protect children
48%
14. Develop responsible procurement practices
70% of hotels purchase and promote locally sourced products (hotels with a restaurant)
87%
15. Protect ecosystems 100% of hotels have banned endangered seafood from restaurant menus (hotels with a restaurant)
93%
16. Support employee growth and skills
75% of hotel General Managers are promoted from within
69%
17. Make diversity an asset 35% of hotel General Managers are women (owned, leased and managed hotels)
27%
18. Improve quality of worklife 100% of country organizations conduct an employee opinion survey every two years
55 countries
19. Conduct our business openly and transparently
Accor is included in six internationally-recognized socially responsible investment indices or standards
3 indices
20. Engage our franchised and managed hotels
40% of all non-budget hotels, across all operating structures, are ISO 14001-certified
41%
21. Share our approach with suppliers
100% of purchasing contracts are in compliance with our Procurement Charter 21
80%
* Change at comparable scope of reporting, 2011-2014.
Objective on track to being met by 2015
Better WorseUnchanged
Objective already met Additional action needed to meet the objective by 2015
Registration Document 201432

2
CORPORATE RESPONSIBILITYManaging the stakeholder dialogue process
With 17 of the PLANET 21 commitments showing an improvement, results were generally up for the year and the degree of progress on all the commitments was encouraging with regard to the 2015 targets.
The trend line is positive for half of the commitments. Six targets have already been met, including two in 2014 – “encourage eco-design” and “ISO 14001 certification”. Three others are on track to being met – “increase the use of renewable energies”, “certification as sustainable buildings” (which should be met in 2015 given the current construction pipeline), and “ban endangered seafood”. Compliance with the “Procurement Charter 21” objective rose sharply during the year, to 80% of contracts from 68% in 2013, but the 100% objective will probably never be met given that certain suppliers have refused to sign the Charter because of their own CSR policies.
Progress towards the targets set for the other 11 commitments will be given new momentum in 2015.
�� Our long-standing commitment to disease prevention programs for employees drove a clear improvement in this area, to 75% of hotels organizing programs from 65% in 2013 to 74% in 2014.
�� Initiatives to reduce water and energy use underway since 2011 helped to maintain the downward trend observed from 2006 to 2010, with declines of 5.6% in water use and of 4.5% in energy use between 2011 and 2014. These efforts will be pursued in 2015, but the targets of reducing water use by 15% and energy use by 10% seem difficult to reach in just a year. CO2 emissions correlate more or less directly with energy performance and will follow the same trend line.
�� As of end-2014, 46% of the hotels were participating in the Plant for the Planet project, versus a targeted 60%, and 48% had pledged to protect children, versus a targeted 70%. To close the gap, these programs were given new impetus during the year, and the results should be observed in 2015. Projections show that with strong support across the Group, the targets remain reachable by 2015.
�� Deployment of the “green meeting solutions” commitment may get underway in 2015, following validation in the first quarter of specifications for a “Meeting 21” solution.
�� The number of employees promoted from within seems to have declined in 2014, possibly due to changes in the data collection method during the year. In addition, the scope of reporting was smaller than in previous years.
�� The number of women hotel General Managers apparently declined by one point in 2014, but this was due only to rounding. Accor remains committed to improve parity in this key job category.
�� Lastly, the number of country organizations that conducted an employee survey fell sharply in 2014, primarily because the reporting format and process were being thoroughly revamped during the year. The figure is expected to increase as from 2015-2016.
�� Concerning Accor’s inclusion in “international SRI indices or standards”, an action plan is already being deployed to be relisted in certain indices and to align performance with such internationally recognized standards as the Global Reporting Initiative (GRI-G4) (see page 77).
Charter 21: the hotel sustainable development management system
Progress towards meeting the PLANET 21 program’s objectives is being driven by Charter 21, Accor proprietary system for managing the sustainable development performance of the hotels. It recommends 65 actions that they can deploy to reduce their environmental footprint and includes, since 2011, social responsibility initiatives like the organization of staff training on health and well-being or the purchase of fair trade products. Common to all hotels, Charter 21 is above all a management tool for the hotel operator, the country organization, the brand and the Group as a whole. It is divided into five sections:
�� management, with 12 actions including “Train employees in environmentally friendly practices” and “Be active in protecting children from abuse”;
�� energy, with 18 actions including “Have a central light switch in guest rooms” and “Use energy-efficient boilers”;
�� water, with 12 actions including “Install flow regulators in showers and faucets” and “Use a water-efficient laundry service”;
�� waste, with 13 actions including “Recycle hotel batteries” and “Recycle electrical and electronic equipment”;
�� products, with 10 actions including “Offer balanced dishes in the hotel restaurant” and “Use eco-designed materials in guest rooms”.
Charter 21 also provides a framework for gradual deployment of the actions, with a four-level performance rating system: Bronze (corresponding to the basic prerequisites), Silver, Gold and Platinum, for the most advanced hotels. The system is cumulative, in that a hotel must be validated at each level before it can move on to the next.
Today, this supportive, continuous improvement process is effectively instilling best practices across the hotel base, with 85% of units rated Bronze or above. What’s more, all of the other levels have increased sharply, with more than 58% of units rated at least Silver in 2014 versus 11% in 2011 and 22% with at least a Gold rating in 2014 versus 2% at launch. Since 2013, effective implementation of the first ten Charter 21 actions required to earn the Bronze rating has been included in the quality audits performed by outside auditors.
Registration Document 2014 33

CORPORATE RESPONSIBILITYManaging the stakeholder dialogue process2
A steady improvement in Charter 21 implementation
• Percentage of hotels rated Platinum
• Percentage of hotels rated Gold
• Percentage of hotels rated Silver
• Percentage of hotels rated Bronze
• Percentage of hotels not yet rated Bronze
34%
32%
27%
6%
17%
37%
31%
14%
12%
37%
28%
21%
201320123%1% 1%
2014
2012 2013 2014
Number of applicable hotels 3,331 3,401 3,538
Response rate 92% 93% 94%
Detailed information concerning Charter 21 is available at Accor’s website (www.accor.com) under “Sustainable Development” then “Management and performance”.
Registration Document 201434

2
CORPORATE RESPONSIBILITYCommitments to employees
2.3. COMMITMENTS TO EMPLOYEES
2.3.1. ACCOR’S EMPLOYMENT MODEL AND HUMAN CAPITAL
Accor, a unique employment model
Accor’s business creates and maintains many jobs in 92 countries. As of the end of December 2014, there were around 180,000 Accor brand employees worldwide.
However, a significant percentage of these people do not directly work for Accor but for the business partners, i.e. the owners of managed or franchised hotels and a variety of service providers.
Indirect sphere: Tier one suppliers and sub-contractors (temporary employees, laundry services, housekeepingand grounds maintenance staff, etc.), as well as the rest of the supply chain (tiers 2, 3, 4, etc.). The number of jobs indirectly supported by these purchases is estimated at around 260,000.
Direct sphere: Accor-brand employees, which included at December 31, 2014- 48,000 Accor employees working in owned and leased hotels - 93,000 Accor-brand employees working in managed hotels- an estimated 36,000 Accor-brand employees working in franchised hotels
Franchised hotels
Service providers
Managed hotels
Ownedand leased hotels
Deployment of human resources policies and tools is tailored to each of the three operating structures – owned and leased hotels, managed hotels and franchised hotels.
Accor exercises its responsibilities as an employer only as concerns its direct employees in its various head offices and in the owned and leased hotels. For these employees, our values, management principles and human resources policies are directly applied, along with all of the employee-relations responsibilities inherent to our position as a direct employer.
For employees of managed hotels (i.e. employees paid by the hotel owner), Group recommendations and policies may be applied by the hotel manager, as long as the owner is willing to accept the associated impact on costs and operations.
Because Accor has little influence over HR practices in franchised hotels (franchised hotel employees are paid by the franchisee), the Group strives to share its values and commitments in its communications and day-to-day interactions with franchisees. Accor brand employees deal with guests and are ambassadors for the hotel brand and its values.
This is done through three main channels:
�� Franchise Committees in France, which meet three or four times a year, depending on the brand, to review and make note of developments in such areas as brand identity, marketing and Group processes. In other geographies, Franchisee Conventions are regularly organized for the same purpose;
�� Directors of Franchise Operations, who are in close and constant contact with the franchise operators in the regions and brands for which they act as ambassadors;
�� access to dedicated content on the corporate Intranet and to the training courses provided by Académie Accor.
Employment and employee-relations issues are managed directly by the owners of franchised and managed hotels. Even though Accor is responsible for managing the day-to-day operations and human resources of managed hotels, it cannot negotiate collective agreements on behalf of franchise owners or directly influence the preparation of employment contracts and compensation packages.
Registration Document 2014 35
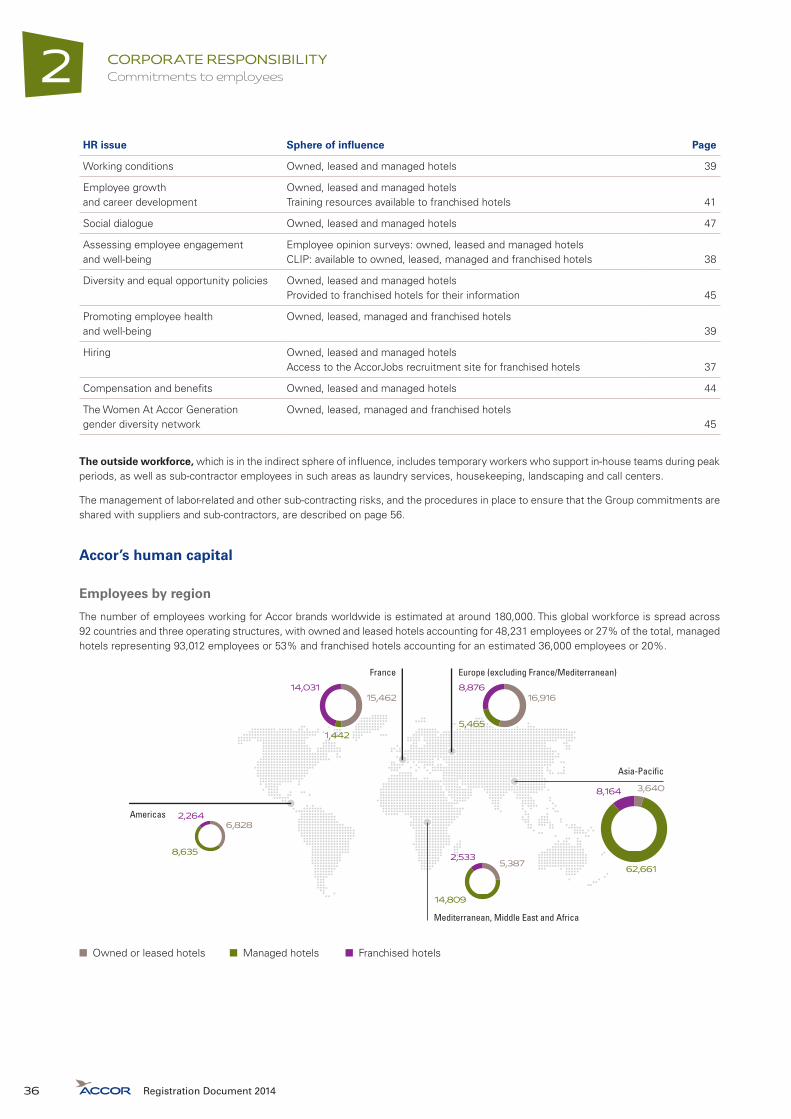
CORPORATE RESPONSIBILITYCommitments to employees2
HR issue Sphere of influence Page
Working conditions Owned, leased and managed hotels 39
Employee growth and career development
Owned, leased and managed hotelsTraining resources available to franchised hotels 41
Social dialogue Owned, leased and managed hotels 47
Assessing employee engagement and well-being
Employee opinion surveys: owned, leased and managed hotelsCLIP: available to owned, leased, managed and franchised hotels 38
Diversity and equal opportunity policies Owned, leased and managed hotelsProvided to franchised hotels for their information 45
Promoting employee health and well-being
Owned, leased, managed and franchised hotels39
Hiring Owned, leased and managed hotelsAccess to the AccorJobs recruitment site for franchised hotels 37
Compensation and benefits Owned, leased and managed hotels 44
The Women At Accor Generation gender diversity network
Owned, leased, managed and franchised hotels45
The outside workforce, which is in the indirect sphere of influence, includes temporary workers who support in-house teams during peak periods, as well as sub-contractor employees in such areas as laundry services, housekeeping, landscaping and call centers.
The management of labor-related and other sub-contracting risks, and the procedures in place to ensure that the Group commitments are shared with suppliers and sub-contractors, are described on page 56.
Accor’s human capital
Employees by region
The number of employees working for Accor brands worldwide is estimated at around 180,000. This global workforce is spread across 92 countries and three operating structures, with owned and leased hotels accounting for 48,231 employees or 27% of the total, managed hotels representing 93,012 employees or 53% and franchised hotels accounting for an estimated 36,000 employees or 20%.
Americas
Europe (excluding France/Mediterranean)France
Asia-Pacific
Mediterranean, Middle East and Africa
2,533
14,809
5,387
14,031
1,442
15,4628,876
5,465
16,916
8,164
62,661
3,640
2,264
8,635
6,828
■ Owned or leased hotels ■ Managed hotels ■ Franchised hotels
Registration Document 201436

2
CORPORATE RESPONSIBILITYCommitments to employees
Local managers
To sustainably anchor its presence in each geography, Accor is committed to hiring local managers from the host community. As of December 31, 2014, 73% of the General Managers of owned, leased and managed hotels were nationals, compared with 74% a year earlier.
Age pyramid
Accor has a young workforce, with 57% of employees under 34 at year-end 2014.
Employees by age
19% 18%
38% 39%
24% 24%
14% 14%
5% 5%
Under 25 25-34 35-44 45-54 Over 55
• 2013
• 2014
Gender diversity
Women accounted for 46% of employees in 2014 and 27% of hotel General Managers, compared with the 2015 target of 35% by 2015 and the ultimate goal of 50%. Initiatives underway to promote gender parity are described on page 45.
Hirings and separations
In 2014, 76,279 people were hired over the year and 61,742 left the Group. The number of new hires rose over the year, reflecting the increased business in the Americas, ASPAC and MMEA regions. The number of separations was stable year-on-year (61,812 in 2013).
Separations by reason
61%64%
13% 12% 1% 1%
23%25%
Resignations Dismissals Layoffs Other
• 2013
• 2014
The “Other” category includes separations due to the termination of a non-permanent contract, retirement, visa expiration, etc.
Voluntary separations
The Group has a high resignation rate, which can be attributed to various factors, including the local economic environment, with operations in fast-growing economies reporting higher turnover. The location and age of the hotel also play a significant role. With a total of 39,354 employees resigning in 2014, resignations accounted for 64% of all separations, versus 61% in 2013.
Absenteeism
Average days of leave declined in 2014 in certain regions, such as the Americas and France, where the figure fell by around 20% in each. The number of days of leave for workplace and commuting accidents was reported for the first time in 2014.
Average number of days absent per employee by cause 2013 2014
Medical leave 6.5 5.9
of which workplace and commuting accidents N/A 0.6
Unauthorized leave 1.1 0.7
Registration Document 2014 37

CORPORATE RESPONSIBILITYCommitments to employees2
2.3.2. AN AMBITIOUS GOAL FOR HUMAN RESOURCES MANAGEMENT
The men and women who make up the Accor corporate community – our human capital – play an essential role in securing our success and driving our performance. The Group is deeply committed to increasing their skills, engagement and motivation, which are vital sources of value, through a clear vision and ambitious strategic objectives for its human resources policies.
In this spirit and to address the Group’s new challenges, the human resources vision was revamped in 2014: empowering Accor men and women, driving innovation and promoting excellence as a source of differentiation, in order to be the world’s most attractive and appealing hospitality group. “The new world of Hospitality is yours!”
To fulfill this vision, the Human Resources Department is being supported by:
�� a new organization for human resources;
�� a new managerial mindset, shaped by three principles – agility, clarity and accountability (see page 27). In 2014, an initiative was undertaken to significantly change our management culture;
�� five strategic objectives:
�y instill and nurture bonds of trust,
�y set the standard as a school for the hospitality industry of the future,
�y develop our skills base and collective intelligence,
�y prepare the next generation of enterprising international managers,
�y assert an identity as an employer of choice;
�� the commitment of each brand, country organization and hotel to embracing and demonstrating the entire human resources eco-system (vision, values, management principles, strategic objectives, etc.).
The strategic objectives have been embodied in a 2015-2017 roadmap involving all of the related Human Resources Departments and in 2015, five major projects will be launched:
�� a Learning & Development program dedicated to tomorrow’s leaders;
�� the deployment of a Groupwide digital Learning & Development platform;
�� the formalization of the Group’s new management culture;
�� a new performance review process reflecting the characteristics of the new management culture;
�� a Business Intelligence project to measure and analyze the actual impacts of our HR policies.
2.3.3. MOTIVATING EMPLOYEES AND DEEPENING THEIR ENGAGEMENT
Accor’s business is built around quality of service and guest satisfaction. Employee quality, enthusiasm and engagement represent a key link in the value creation chain. Employee engagement is measured to optimize this dynamic, define remedial action plans as needed, enhance Accor’s identity as an employer and attract and retain the finest talents.
Assessing employee engagement and well-being
Managers have access to two tools for assessing employee engagement, well-being and morale – employee opinion surveys and the Local Climate and Personal Initiative (CLIP) survey. Both of them support the Group’s management process and enable it to prepare appropriate action plans.
Employee surveys
In 2014, the employee opinion survey system was revised to bring it in line with the new strategic vision, as well as with the new organization by region and business segment. It also needed to reflect the new management culture and offer systematic global coverage. The entire system – objectives, processes, indicators, questionnaires, data processing, even the format of the action plans – was zero-based and rethought, while retaining the core principles of completeness and confidentiality.
Future surveys in the new format will be conducted every year and on a worldwide basis, beginning in September 2015.
Local Climate and Personal Initiative (CLIP) surveys
All managers, regardless of their hotel’s operating structure, can use the CLIP survey to assess the quality of the local working environment and the engagement of their teams. Each team member fills in a confidential questionnaire that covers eight topics, including job fulfillment, the circulation of information, individual initiative, and respect and recognition, etc.
Designed for use by managers across all operating structures, CLIP is available in 11 languages, in hard copy or as a file downloadable from the Group intranet.
Enhancing Accor’s identity as an employer of choice
Celebrating the remarkable accomplishments of the Group’s employees
Every year, Accor honors employees from owned, leased and managed hotels and the head offices for accomplishments deemed to be exceptional and to exemplify the Group’s corporate culture. In 2014, the celebration was revamped and reorganized around three awards, two for individual initiatives – the Gold Bernache and the Silver Bernache – and one for team initiatives – the Team Bernache. The accomplishments are anonymously assessed by a panel of ten judges from across the organization, based on criteria reflecting Accor values and management principles.
In 2015, 10 Gold Bernaches, 30 Silver Bernaches and five Team Bernaches will be awarded to the year’s successful initiatives.
Registration Document 201438

2
CORPORATE RESPONSIBILITYCommitments to employees
Increasing interaction through digital technology
In addition to the 360° Digital plan to digitally transform the guest experience, Accor has undertaken a large number of projects to drive innovation and improve employee well-being.
Examples of flagship projects launched or completed in 2014 include the following.
�� The mobile version of the Accorjobs recruitment website went live in November, making it possible to submit an application via a mobile phone or tablet. It also offers a variety of quizzes to help applicants prepare for their job interview.
�� A “What’s up” page was added to the new AccorLive Intranet site to showcase initiatives, people, projects and ideas.
�� The Open Ideas by Accor collaborative platform was launched during the year to enable users in various communities, like IT, to post, follow, vote, comment on and share their ideas with colleagues in five areas: guest satisfaction, sustainable buildings, energy performance, construction and maintenance costs, and equipment. Based on the contributions shared by employees, the Innovation Challenge celebrates Accor finest innovators, whose ideas were voted the best by their colleagues and selected by the panel of judges.
Beginning in 2015, the platform will be open to every Accor-brand hotel to enable them to participate in the various contests.
2.3.4. WORKING CONDITIONS THAT ENHANCE EMPLOYEE WELL-BEING AND TEAM PERFORMANCE
As an employer, Accor is responsible for ensuring that working conditions are conducive to the health, safety and well-being of its employees and to the performance of its teams. The working environment must be aligned with the tasks being performed, the people involved and the Group’s productivity objectives.
The measures taken to improve working conditions focus mainly on:
�� preventing accidents, repetitive strain injuries and other workplace health and safety issues, by identifying risks and deploying dedicated training modules;
�� limiting the impact on employees’ personal lives of the hospitality business and its unusual working hours, so as to enhance Accor employer appeal and increase employee engagement.
Like most human resources management fundamentals, measures relating to working conditions are handled at the local level, in line with the local culture, the applicable collective agreements and the country’s labor legislation.
Workweek organization and work-life balance
Working hours
In every host country, working hours are set in accordance with local legislation and collective agreements. Overtime may be paid at a higher rate or taken in the form of additional time off, depending on the legislation and agreements applicable in each hotel and on the conditions defined in each employee’s contract.
Workweek organization
With hotels open around the clock, hospitality employees often have to work variable schedules, at night, on weekends and on holidays. In response, Accor has formally pledged in its Ethics and Corporate Social Responsibility Charter to undertake a variety of measures to support better work-life balance, including respecting important events in employees’ lives; minimizing uncertainty in short-term work schedules; and providing practical solutions for employees having trouble commuting.
Part-time work
At end-2014, 9% of employees in head offices and owned, leased and managed hotels were working part-time, compared with 11.4% a year earlier.
Telecommuting
In January 2013, under the gender equality in the workplace agreement and in a commitment to addressing emerging workplace organization practices, an experimental telecommuting arrangement was trialed at the headquarters of the French hotels business with 43 overtime-exempt managers and supervisors. In light of the positive outcomes, a telecommuting agreement is in the process of being validated by the employee representatives.
Night work
Following the signature of a health and working conditions agreement in September 2013 (see box below), night work guidelines were distributed to all of the hotels in France in 2014. They offer recommendations to help regular or occasional night workers to attenuate the impact of working at night, with best practices for maintaining a healthy quality of life.
Preventing workplace accidents and occupational illnesses
Although the claim frequency rate is fairly low, the hospitality industry does involve a certain amount of health risk. Management pays close attention to the day-to-day risk of incidents and the long-term risk of musculoskeletal disorders caused by repetitive movements.
Registration Document 2014 39
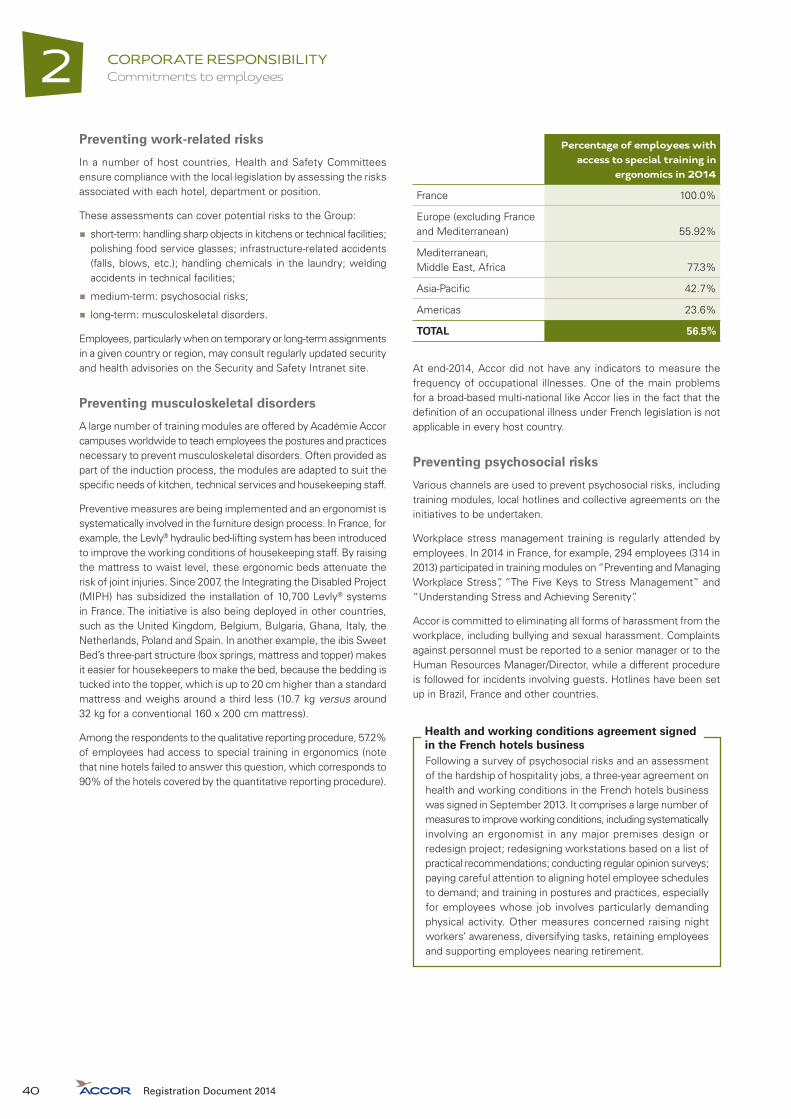
CORPORATE RESPONSIBILITYCommitments to employees2
Preventing work-related risks
In a number of host countries, Health and Safety Committees ensure compliance with the local legislation by assessing the risks associated with each hotel, department or position.
These assessments can cover potential risks to the Group:
�� short-term: handling sharp objects in kitchens or technical facilities; polishing food service glasses; infrastructure-related accidents (falls, blows, etc.); handling chemicals in the laundry; welding accidents in technical facilities;
�� medium-term: psychosocial risks;
�� long-term: musculoskeletal disorders.
Employees, particularly when on temporary or long-term assignments in a given country or region, may consult regularly updated security and health advisories on the Security and Safety Intranet site.
Preventing musculoskeletal disorders
A large number of training modules are offered by Académie Accor campuses worldwide to teach employees the postures and practices necessary to prevent musculoskeletal disorders. Often provided as part of the induction process, the modules are adapted to suit the specific needs of kitchen, technical services and housekeeping staff.
Preventive measures are being implemented and an ergonomist is systematically involved in the furniture design process. In France, for example, the Levly® hydraulic bed-lifting system has been introduced to improve the working conditions of housekeeping staff. By raising the mattress to waist level, these ergonomic beds attenuate the risk of joint injuries. Since 2007, the Integrating the Disabled Project (MIPH) has subsidized the installation of 10,700 Levly® systems in France. The initiative is also being deployed in other countries, such as the United Kingdom, Belgium, Bulgaria, Ghana, Italy, the Netherlands, Poland and Spain. In another example, the ibis Sweet Bed’s three-part structure (box springs, mattress and topper) makes it easier for housekeepers to make the bed, because the bedding is tucked into the topper, which is up to 20 cm higher than a standard mattress and weighs around a third less (10.7 kg versus around 32 kg for a conventional 160 x 200 cm mattress).
Among the respondents to the qualitative reporting procedure, 57.2% of employees had access to special training in ergonomics (note that nine hotels failed to answer this question, which corresponds to 90% of the hotels covered by the quantitative reporting procedure).
Percentage of employees with access to special training in
ergonomics in 2014
France 100.0%
Europe (excluding France and Mediterranean) 55.92%
Mediterranean, Middle East, Africa 77.3%
Asia-Pacific 42.7%
Americas 23.6%
TOTAL 56.5%
At end-2014, Accor did not have any indicators to measure the frequency of occupational illnesses. One of the main problems for a broad-based multi-national like Accor lies in the fact that the definition of an occupational illness under French legislation is not applicable in every host country.
Preventing psychosocial risks
Various channels are used to prevent psychosocial risks, including training modules, local hotlines and collective agreements on the initiatives to be undertaken.
Workplace stress management training is regularly attended by employees. In 2014 in France, for example, 294 employees (314 in 2013) participated in training modules on “Preventing and Managing Workplace Stress”, “The Five Keys to Stress Management” and “Understanding Stress and Achieving Serenity”.
Accor is committed to eliminating all forms of harassment from the workplace, including bullying and sexual harassment. Complaints against personnel must be reported to a senior manager or to the Human Resources Manager/Director, while a different procedure is followed for incidents involving guests. Hotlines have been set up in Brazil, France and other countries.
Following a survey of psychosocial risks and an assessment of the hardship of hospitality jobs, a three-year agreement on health and working conditions in the French hotels business was signed in September 2013. It comprises a large number of measures to improve working conditions, including systematically involving an ergonomist in any major premises design or redesign project; redesigning workstations based on a list of practical recommendations; conducting regular opinion surveys; paying careful attention to aligning hotel employee schedules to demand; and training in postures and practices, especially for employees whose job involves particularly demanding physical activity. Other measures concerned raising night workers’ awareness, diversifying tasks, retaining employees and supporting employees nearing retirement.
Health and working conditions agreement signed in the French hotels business
Registration Document 201440

2
CORPORATE RESPONSIBILITYCommitments to employees
2012 2013 2014
Workplace and commuting accident frequency rate 13.5 13.5 N/A
Lost-time injury rate N/A N/A 12.7
Following the revamp of the human resources indicators in 2014, a distinction is now made between workplace and commuting accidents. As a result, great care should be taken in analyzing the change in the lost-time injury rate, which in 2014 only reflects the impact of workplace accidents.
As of end-2014, the incident severity rate was 0.3. The number of days lost to accidents was broken out from the number of days of medical leave for the first time in 2014, with the result that there are no prior-year figures for this indicator. The reliability of this indicator will be gradually improved beginning in 2015.
In 2014, the Accor community was saddened by the death of nine employees, of which one from a heart attack in a hotel in Indonesia and eight from road accidents while commuting in Egypt (one), Indonesia (two), Nigeria (one) and Thailand (four).
Promoting health and well-being among employees
In every host country, Accor strives to raise employee and guest awareness on the importance of preventing diseases and epidemics.
As part of the PLANET 21 program, for example, the owned, leased, managed and franchised hotels are encouraged to offer employees awareness-building sessions on the prevention of HIV/AIDS and of chronic diseases like diabetes, cancer and cardiovascular ailments, the importance of nutrition and a balanced diet, the prevention of psychosocial risks, e.g. stress, and first aid training.
Since 2002, Accor has been demonstrating a commitment to fighting against epidemics, particularly of HIV/AIDS and malaria. Employee-focused initiatives are structured by the ACT-HIV program, which gives hotel General Managers a six-step action plan built on the three core principles of Accor’s commitment – confidentiality, non-discrimination and equal access to treatment. In 2014, 74% of hotels organized health and well-being training for their employees, with in particular 26,474 employees attending HIV/AIDS sensitivity training. A total of 973 hotels were equipped with condom vending machines.
2.3.5. SUPPORTING EMPLOYEES THROUGHOUT THEIR CAREER
Accor gives employees a genuine opportunity to climb the social ladder. In 2014, 69% of General Managers of owned, leased and managed hotels had been promoted from within. Managers across the organization are united in the belief that quality of service and guest satisfaction depend primarily on employee skills. As a result, Accor’s human resources policies focus on developing skills, training and promoting from within.
Employee growth
Onboarding employees and sharing our culture
Since all employees serve as our frontline ambassadors to guests, in addition to working effectively in a team and having the information they need to do their jobs, they must also be familiar with the Group, its values and its history. A total of 76,279 employees were hired in 2014, of which 55% in the Asia-Pacific region. To facilitate the onboarding process, the “Welcome to Accor” e-learning program is deployed alongside the modules specific to each brand to inform new hires about the Group and its values.
Supporting employee career development
Once the induction phase is over, employees are supported throughout their careers. In 2014, 10,382 employees were promoted in their hotels, of which 2,146 from non-management to management positions. At year-end, 69% of hotel General Managers had come up through the ranks. This vertical and horizontal mobility is encouraged by today’s human resources processes.
Group policy recommends that every year employees should have a performance review with their manager, during which they discuss the past year’s results and set bonus-related objectives for the coming year. The review also gives employees an opportunity to express their career goals so that an appropriate development plan can be prepared. In France, following the reform of employee training legislation, new review resources were developed in compliance with the new rules.
Several job tracks have been defined to clarify the positions involved and professionalize the skill-sets, as well as to enhance employees’ capabilities and inform them about potential career paths.
Registration Document 2014 41
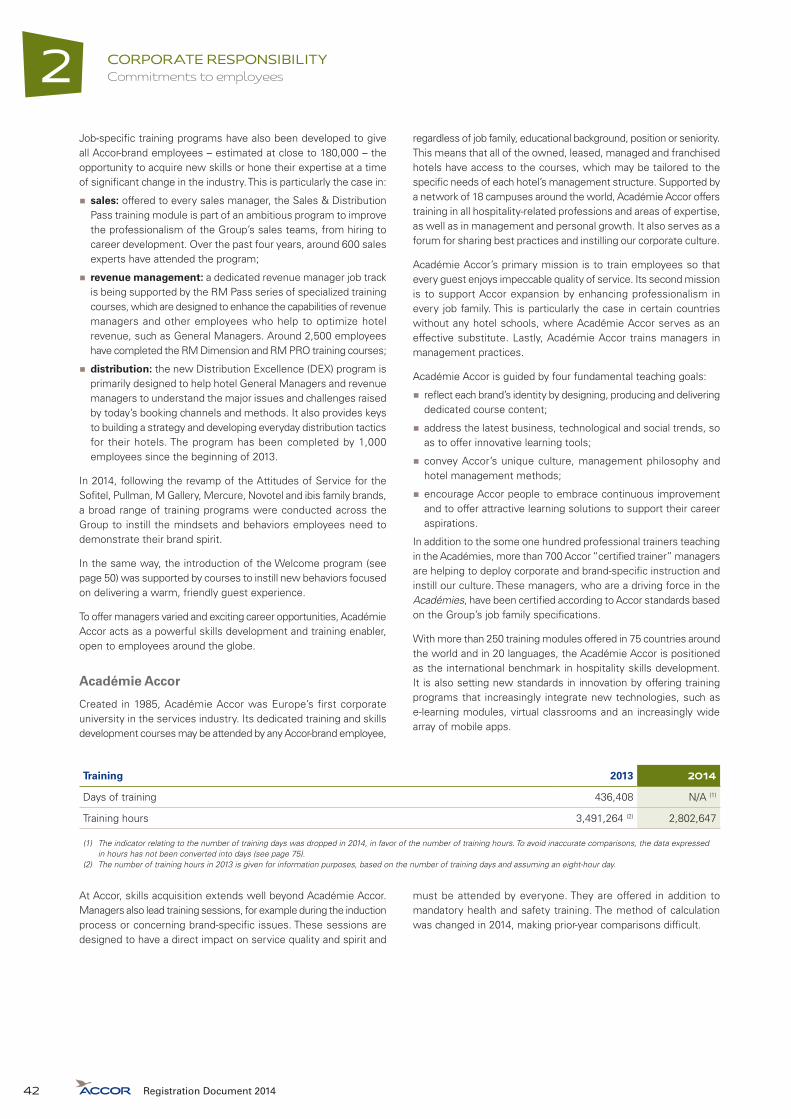
CORPORATE RESPONSIBILITYCommitments to employees2
Job-specific training programs have also been developed to give all Accor-brand employees – estimated at close to 180,000 – the opportunity to acquire new skills or hone their expertise at a time of significant change in the industry. This is particularly the case in:
�� sales: offered to every sales manager, the Sales & Distribution Pass training module is part of an ambitious program to improve the professionalism of the Group’s sales teams, from hiring to career development. Over the past four years, around 600 sales experts have attended the program;
�� revenue management: a dedicated revenue manager job track is being supported by the RM Pass series of specialized training courses, which are designed to enhance the capabilities of revenue managers and other employees who help to optimize hotel revenue, such as General Managers. Around 2,500 employees have completed the RM Dimension and RM PRO training courses;
�� distribution: the new Distribution Excellence (DEX) program is primarily designed to help hotel General Managers and revenue managers to understand the major issues and challenges raised by today’s booking channels and methods. It also provides keys to building a strategy and developing everyday distribution tactics for their hotels. The program has been completed by 1,000 employees since the beginning of 2013.
In 2014, following the revamp of the Attitudes of Service for the Sofitel, Pullman, M Gallery, Mercure, Novotel and ibis family brands, a broad range of training programs were conducted across the Group to instill the mindsets and behaviors employees need to demonstrate their brand spirit.
In the same way, the introduction of the Welcome program (see page 50) was supported by courses to instill new behaviors focused on delivering a warm, friendly guest experience.
To offer managers varied and exciting career opportunities, Académie Accor acts as a powerful skills development and training enabler, open to employees around the globe.
Académie Accor
Created in 1985, Académie Accor was Europe’s first corporate university in the services industry. Its dedicated training and skills development courses may be attended by any Accor-brand employee,
regardless of job family, educational background, position or seniority. This means that all of the owned, leased, managed and franchised hotels have access to the courses, which may be tailored to the specific needs of each hotel’s management structure. Supported by a network of 18 campuses around the world, Académie Accor offers training in all hospitality-related professions and areas of expertise, as well as in management and personal growth. It also serves as a forum for sharing best practices and instilling our corporate culture.
Académie Accor’s primary mission is to train employees so that every guest enjoys impeccable quality of service. Its second mission is to support Accor expansion by enhancing professionalism in every job family. This is particularly the case in certain countries without any hotel schools, where Académie Accor serves as an effective substitute. Lastly, Académie Accor trains managers in management practices.
Académie Accor is guided by four fundamental teaching goals:
�� reflect each brand’s identity by designing, producing and delivering dedicated course content;
�� address the latest business, technological and social trends, so as to offer innovative learning tools;
�� convey Accor’s unique culture, management philosophy and hotel management methods;
�� encourage Accor people to embrace continuous improvement and to offer attractive learning solutions to support their career aspirations.
In addition to the some one hundred professional trainers teaching in the Académies, more than 700 Accor “certified trainer” managers are helping to deploy corporate and brand-specific instruction and instill our culture. These managers, who are a driving force in the Académies, have been certified according to Accor standards based on the Group’s job family specifications.
With more than 250 training modules offered in 75 countries around the world and in 20 languages, the Académie Accor is positioned as the international benchmark in hospitality skills development. It is also setting new standards in innovation by offering training programs that increasingly integrate new technologies, such as e-learning modules, virtual classrooms and an increasingly wide array of mobile apps.
Training 2013 2014
Days of training 436,408 N/A (1)
Training hours 3,491,264 (2) 2,802,647
(1) The indicator relating to the number of training days was dropped in 2014, in favor of the number of training hours. To avoid inaccurate comparisons, the data expressed in hours has not been converted into days (see page 75).
(2) The number of training hours in 2013 is given for information purposes, based on the number of training days and assuming an eight-hour day.
At Accor, skills acquisition extends well beyond Académie Accor. Managers also lead training sessions, for example during the induction process or concerning brand-specific issues. These sessions are designed to have a direct impact on service quality and spirit and
must be attended by everyone. They are offered in addition to mandatory health and safety training. The method of calculation was changed in 2014, making prior-year comparisons difficult.
Registration Document 201442

2
CORPORATE RESPONSIBILITYCommitments to employees
Partnering with educational institutions
To promote the hospitality industry and its professions, Accor forges and maintains close ties and partnerships with a wide range of business schools, hotel management schools and universities in its host countries, as can be seen in the following examples.
The vocational and adult training agreement signed in 1999 with France’s National Education Ministry aims to guide young graduates’ career choices by providing them with more information and to raise awareness of hospitality and food services professions among secondary school teachers. To enhance revenue management education, Accor offers its RM Partner School program at certain schools and has also been partnering the Revenue Management
Masters degree offered by Institut Paul Bocuse and IAE Savoie Mont-Blanc in France since late 2011.
Management development and mobility
Programs to become a manager
Programs have been especially introduced to enable employees, either newly hired or with several years of experience, to move into management positions over the medium to long term. Internal promotion is a reality at Accor, where employees are encouraged to rise rapidly through the ranks. This is reflected in the age pyramid for hotel managers.
Age pyramid at Accor hotels in 2014 Under 25 25-34 35-44 45-54 Over 55
Total managers 2% 37% 36% 19% 6%
Since 1997, Accor International Hospitality Management Program (IHMP) has been helping to create a pool of international managers. The result of a collaborative venture with the ESSEC business school’s MBA in Hospitality Management program (IMHI), IHMP’s classes are taught in English as part of a curriculum structured around six main issues: Business Strategy and Value Creation; Human Resources Management; Finance; Revenue Management; Marketing, Sales and Distribution; and Communication. IHMP certification gives participants 20% of the credits required for the ESSEC MBA in Hospitality Management. Since 1997, the MBA program has been attended by 449 people. The class of 2014-2015 is being sponsored by Chairman and Chief Executive Officer Sébastien Bazin, while the next class, half of whom will be women, will be sponsored by Chief Financial Officer Sophie Stabile.
In the Asia-Pacific region, General Managers may attend a 12-month management skills development program comprising two days of onsite courses and six e-learning modules developed with Cornell University as part of a broader program. Participants may also work together on projects in their offices or via social media.
This system is being extended by a certification process that validates skills learned on the job and enhances employability within the organization. Thanks to a partnership agreement signed with the Glion Institute of Higher Education, any Accor hotel manager can validate his or her years of experience with an MBA in International Hospitality and Service Industries Management and move up to higher positions in the Group. The MBA Glion Online program saw its first students graduate in 2014 and is continuing in 2015 with ten managers enrolled. Most are hotel General Managers or Operations Directors, based in host countries around the world, from Australia and Indonesia to Germany and Dubai.
Preparing the next generation of enterprising international managers
In 2014, as part of its reorganization, Accor began to devise a career management strategy to instill a Groupwide vision in addition to the policies deployed by the brands or in the host countries.
The new strategy is designed to give Accor:
�� a greater agility in foreseeing and embracing the new capabilities and skills that managers need to acquire to meet emerging challenges;
�� a freer-flowing career paths, with horizontal as well as vertical mobility;
�� the ability to make commitments to managers and offer them clear prospects for the future.
As part of this project, the mindsets and behaviors expected of Group Talents were defined and the process of identifying these individuals began with an initial Talent Review organized in October.
Special programs dedicated to promising young people (School of Excellence, Globe Trotters, MDP, etc.) have been deployed or revised. Another program intended for senior executives (Leadership Journey) will be rolled out in 2015.
In 2014, priorities were also defined for deployment in 2015:
�� build the strategic principles and deploy a career management strategy;
�� continue to identify talents and develop the Talent Management process;
�� design and implement a new international mobility policy.
International mobility
With operations in 92 countries, Accor offers employees a wide range of international career opportunities. The International Mobility and Expatriation teams are dedicated to supporting cross-border mobility by identifying the appropriate profiles, managing paperwork and practical issues, and ensuring compliance with Group mobility guidelines.
A dedicated International Mobility Intranet site provides employees with such useful information as travel and visa formalities, checklists, country guides, etc.
Registration Document 2014 43
CORPORATE RESPONSIBILITYCommitments to employees2
2.3.6. COMPENSATION AND BENEFITS
Compensation policies
Accor has defined a global compensation strategy that can be adapted to local practices in each country. It is based on four principles:
�� offer compensation that is competitive in each market and country;
�� ensure that employee compensation is determined fairly;
�� encourage employee savings and stock ownership;
�� strengthen employee healthcare coverage and other benefits.
Accor ensures that compensation policies do not discriminate in any way with regard to age, gender, nationality or any other personal criteria. The Group is also committed to compensating every employee in line with market practices, based on global and local job maps prepared for each job track.
Managers receive a base salary and variable incentive pay that includes an annual bonus and, in certain cases, deferred compensation in the form of performance shares. The annual bonus reflects their performance in meeting personal and team objectives.
All base salaries are reviewed each year, on an individual basis for managers and collectively for non-managers. Across-the-board raises are defined locally, in accordance with inflation, market practices and annual results. Each local unit is tasked with properly managing its own payroll and with collecting the related data and analyses. These data are not yet consolidated at Group level, so the average salary raise cannot be reported.
Payroll costs for the head offices and owned and leased hotels are presented in note 5 on page 198.
Information available to employees
Every year, human resources managers and directors are informed about the bonus policy and the principles for reviewing compensation, in line with the each country’s economic environment.
The base salary and any other benefits that make up the final compensation package are set out in the employment contract when the employee is hired or transferred. In addition, the individual and team performance objectives for the coming year are defined during the annual performance review and given to the employee in writing.
Specific information is also provided throughout the year to employees covered by other benefits, such as performance shares, supplementary pension plans and healthcare and insurance coverage.
In recent years, human resources managers have been able to attend in-house training courses in such issues as compensation policies, the job classification and evaluation method, deferred compensation systems (performance shares) and employee benefits. In 2014, fifteen people were trained in this way and are now able to support the application of compensation policies to the teams in their scope of responsibility. A simplified version of the same module has also been designed to enable trained individuals to regularly update their knowledge and skills.
Discretionary profit-sharing
To better reflect each unit’s actual business performance, discretionary profit-sharing agreements based on overall performance and financial results are generally signed in each subsidiary or hotel.
In 2014, nearly €11.7 million in discretionary profit-shares earned in 2013 was paid to 15,347 employees, representing an average net amount of €762 per person.
On several occasions since 1999, employees around the world have been offered the opportunity to purchase new Accor shares on preferential terms and conditions, as part of employee share issues. As a result, 8,249 employees owned shares in the Company at December 31, 2014, representing 0.552% of total capital (see page 145 for details).
In 2014, non-discretionary profit-sharing agreements were signed in Argentina, Brazil, Ivory Coast, Egypt, the United Arab Emirates, France, Ghana, Mexico, Nigeria, Russia and Turkey.
Employee savings in France
Every year since 1985, Accor employees in France have been able to participate in a Corporate Savings Plan (PEEG) that allows them to invest in various mutual funds with matching funds provided by Accor. In addition, in 2014, 7,001 employees invested in the PERCO group Retirement Savings Plan, which was set up to provide employees with additional income during retirement. Employees in France also receive non-discretionary profit-shares under a corporate agreement covering 75 companies in respect to 2013. Non-discretionary profit-shares earned in 2013 and paid in 2014 amounted to an aggregate net €6.1 million for 19,914 employees, or an average net amount of €306 per person.
A project is underway to enhance the French employee savings benefits with a new plan, scheduled for introduction in 2015. It will offer employees a more advantageous matching funds system in a commitment to raising their stake in their company’s growth.
International insurance and healthcare coverage
Offering international insurance and healthcare coverage enables Accor to meet two key challenges: (i) provide a higher level of protection for employees in countries where public authorities cover little or none of the expense associated with healthcare and (ii) create an element of differentiation to attract and retain talent.
Registration Document 201444

2
CORPORATE RESPONSIBILITYCommitments to employees
Plans have therefore been set up in certain host countries for employees in owned and leased hotels, providing insurance and/or health coverage for routine care, hospitalization, maternity benefits, eye care and other expenses. In some countries, Accor has been able to extend healthcare benefits to employees in its managed hotels, with the investor owner’s agreement.
Issues related to post-retirement benefits, insurance coverage and other employment benefits are discussed and addressed on a consensual basis by representatives from the corporate Human Resources, Consolidation, Treasury and Financing, and Administrative Services Departments, as well as the Group’s consulting actuary. When necessary, the Group Retirement Benefits Committee set up in 2007 validates the decisions resulting from these consensual discussions. The Committee continued its activities in 2014, in line with prior years, and is scheduled to meet again in 2015.
2.3.7. DIVERSITY AND EQUAL OPPORTUNITY POLICIES
For Accor, diversity is a key component in driving performance and innovation, while fostering non-discrimination and equal opportunity across the organization. A structured framework created for our diversity commitments in 2008 is driving a variety of programs to support and demonstrate these commitments.
Initiatives designed to address four challenges
Initiatives undertaken to encourage diversity, ensure equal opportunity and fight against discrimination are underpinned by four challenges:
�� corporate social responsibility: as a fair and sustainable employer, Accor has the duty to reflect the diversity of its host communities;
�� attractiveness as an employer: Accor is a Company that respects its employees and projects a positive image to the public;
�� business performance: making diversity a priority helps Accor to deliver customized solutions to meet guest expectations;
�� operating performance: inclusiveness and social cohesion are important factors for well-being in the workplace, because a fulfilled employee is an efficient employee.
Accor’s diversity policy is expressed in its International Diversity Charter
Accor recognizes that every employee is different and that overall performance depends on the skills of each individual. This commitment to diversity is structured around formalized undertakings and priorities for 2015 in the following areas:
�� diversity of origins;
�� gender diversity and gender equality in the workplace;
�� integration of people with disabilities;
�� age diversity.
This commitment to supporting diversity and fighting discrimination is clearly defined in our International Diversity Charter, which was deployed in 2011 and translated into 13 languages.
The Charter serves as the foundation of our diversity policy, based on seven key commitments:
�� give every employee the opportunity to succeed by taking their capabilities into account at each stage in their careers;
�� fight against all forms of discrimination on the basis of ethnic, social or cultural origin, gender, age, physical characteristics, disabilities, religion, language, marital status, union membership, sexual orientation or other characteristics;
�� conduct diversity surveys in every host country;
�� offer every manager diversity training or a sensitivity course, based on the local situation and available training resources;
�� act as diversity ambassadors to customers, suppliers, hotel owners, investors and other partners, with the goal of fostering a shared ethical commitment;
�� report to the Group Executive Committee once a year on diversity programs underway across the Group, to obtain the Committee’s guidance and recommendations for pathways to improvement.
In 2014, Accor continued to roll out the Charter to Executive Committees worldwide.
Equal opportunity resources
Two main channels are being used to guarantee equal opportunity and eradicate stereotyping – training employees and demonstrating the best practices already being applied in the Group. As part of this process, a wide range of general or issue-specific resources have been developed to review our commitments, provide access to reference documents to improve understanding of the issues, and offer guidelines or examples for putting the commitments into practice. These include the corporate diversity Intranet, the Diversity Glossary, the “Managing Diversity” e-learning program, the guide for recruiters and managers, the Recruitment Charter, the Parenthood Guide, the Disability Guide and guidelines for organizing a disability awareness day.
Lastly, discrimination alert plans have also been defined locally so that anyone experiencing discrimination knows who to contact and how.
Promoting gender diversity and equality
A target of having women account for 35% of hotel General Managers has been set for 2015. However, compared with 2013, the percentage of women General Managers decreased by one point in 2014, to 27%. The ultimate goal is to achieve gender parity in this key position by implementing the corrective actions underway since 2014.
Registration Document 2014 45

CORPORATE RESPONSIBILITYCommitments to employees2
The commitment to increasing the percentage of women across the organization led to the creation, in December 2012, of Women at Accor Generation, an international gender equality network. Sponsored by the Group’s Chief Financial Officer and open to both men and women employees of any Accor brand, the network comprised nearly 1,850 women and 413 men at year-end 2014. Through its eight regional networks, Women at Accor Generation is committed to fighting against stereotypes and the self-censorship of women, primarily by mentoring women employees, encouraging experience sharing and facilitating networking.
So far, pilot mentoring programs conducted in France, Brazil and Asia have supported 90 women, who have reported an increase in self-confidence, a sense of feeling encouraged and motivated and a better understanding of the codes needed to interactive effectively with their professional environment. 71% of them have already recommended the program to one or more of their colleagues.
In 2013, the Gender Marketing working group recommended a line of “Inspired by Her” hospitality services specifically designed for women. In 2014, for example, a number of Golden Rules were defined to help hotel reception teams ensure the safety of women guests. These include not giving women rooms with a connecting door, being discreet when telling them their room number and accompanying them through the hotel late at night. These guidelines will gradually be deployed across the hotel network.
In 2015, a pilot project will be launched in the Benelux region to earn certification under the Gender Equality–European Standard. Earning the label, which is designed to encourage understanding and progress, will enable Accor to continue to improve its performance in gender diversity and equality.
Percentage of women by job category 2013 2014
Total women 46% 46%
Managers 41% 41%
of which hotel General Managers 28% 27%
Hiring and retaining the disabled
Accor is a pioneering member of the ILO Global Business and Disability Network, a United Nations initiative that since June 2011 has brought together multinational companies committed to including people with disabilities in the workplace. It allows members to share their knowledge more effectively, develop products and services that facilitate the hiring and retention of disabled employees and improve their technical expertise in addressing disability issues. As a member, Accor contributed to the publication of Business as unusual: Making workplaces inclusive of people with disabilities, a guidebook for the successful implementation of initiatives designed to include the disabled. Participating in the Network gives us the opportunity to organize a certain number of events around the world and to embrace the best practices of the initiative’s partner companies.
A wide array of resources has been deployed to assist managers in integrating disabled employees into their teams (see below, “Equal opportunity resources”). For the 2014 International Day of People with Disability on December 3, every host country organization held a photo contest in which employees were asked to post a photo illustrating the idea of disability. The country organizations took advantage of the Day to raise disability awareness through messages from senior management. In all, more than 100 photos were posted on the Intranet. In addition, special activities were organized in at least nine countries, with, for example, hiring techniques workshops at the Odyssey headquarters in Paris and a team case study in Brazil.
In 2014, 1,240 disabled people were employed in owned, leased or managed hotels worldwide, representing 1% of the total workforce. However, given the difficulty in obtaining accurate figures in some countries, the real number of disabled employees is probably higher.
In France, the Integrating the Disabled Project (MIPH) is part of the diversity action plan. It is governed by a Groupwide agreement concerning the hiring and retention of disabled employees. In late 2014, a new agreement was renegotiated for the 2015-2017 period. Signed by all of the employee representatives, it came into effect in January 2015.
Among its sustainable flagship measures are dedicated, aligned training programs provided in France by such organizations as the GRETA adult education schools run by the National Education system, the National Association for Adult Vocational Training (AFPA) and the CFA apprentice training centers. They take in and train people with a hearing or vision impairment or a psychological disability for jobs in kitchen, dining room and housekeeping skills. The launch of an advertising campaign expressing the same strong message – “Every day, we welcome very different people and we have always hired them” – illustrated the reality of the diversity and disability experience at Accor with messages resonant with the target audience.
Registration Document 201446

2
CORPORATE RESPONSIBILITYCommitments to employees
2.3.8. SOCIAL DIALOGUE
Accor is committed to maintaining ongoing, constructive dialogue about employee rights and benefits with employee representative organizations. In 2014, the Group initiated negotiations to renew a worldwide agreement signed in 1995 with the International Union of Food Workers (IUF) concerning application of International Labour Organization conventions on employees’ freedom of association and right to unionize.
Dialogue forums and resources
The European Works Council is co-chaired by the Chairman and Chief Executive Officer and a representative of the International Union of Foodworkers (IUF). It meets at least once a year to examine the Group’s organization, strategy and results, as well as cross-border issues. It may also be especially convened to discuss any measures being considered by the Group. In 2015, Accor intends to revitalize discussions in the European Works Council, with in particular a presentation of the Ethics and Corporate Social Responsibility Charter to Council members.
In France, the Group Works Council supports dialogue and the sharing of business information with local employee representatives. Created by the October 12, 1984 framework agreement, it comprises 24 employee representatives chosen from among the 76 subsidiary works councils in France. It is chaired by the Chairman and Chief Executive Officer or his representative and meets twice a year. In addition, a Health, Safety and Working Conditions Committee is active in each of the relevant units.
In 2014, 68% of employees in units reporting qualitative data for the year (corresponding to 91% of the hotels reporting quantitative data) work in a country with an employee representative organization. Across the Group, when a unit lacks an employee representative organization, a wide variety of social dialogue practices have been introduced, depending on the local environment and culture. These include systematic informal round-table discussions with second-line executives, meetings with employee representatives in the hotel, and information meetings concerning major projects and organizational changes.
Supporting reorganization through social dialogue
Accor’s thorough reorganization decided in 2013 by Chairman and Chief Executive Officer Sébastien Bazin required the overhaul of several departments at corporate headquarters. As part of this process, negotiations with employee representatives were initiated in 2014. In a commitment to retaining employees and in a spirit of constructive social dialogue with the unions, the discussions led to the signature of an early placement agreement. Among the 173 people concerned, fewer than 30% opted for outplacement, with the others being successfully inplaced thanks to the extensive efforts of management, the French units and the human resources departments. Lastly, to define the separation terms and conditions, a new agreement was negotiated, which enabled the deployment of outplacement support measures such as job-search counseling, business start-up support, and training.
In total, 7,751 employees left Accor in 2014 following an individual dismissal, including 3,214 employees from owned or leased hotels. Another 462 employees were laid off because of restructuring or for financial reasons, including 179 employees from owned or leased hotels.
Collective agreements
The table below lists the collective agreements signed in 2014 at country level, covering owned and leased hotels. It does not include agreements signed prior to 2014 and it cannot be considered exhaustive, since collective agreements can also be signed by legal entities such as hotel groupings or by individual hotels.
Registration Document 2014 47

CORPORATE RESPONSIBILITYSocial responsibility commitments2
Country Collective agreements signed in 2014 (purpose, term and priority commitments)
Number of employees
covered by an agreement
in 2014
Germany Training and impact on working conditions relating to the brand Service Attitudes, training and implementation of the LCAH program, procedures for transferring calls to the call centers 5,829
Benin Hotel agreement, non-discretionary profit-sharing agreement 123
Brazil Annual pay raise, non-discretionary profit-sharing agreement, healthcare coverage 9,945
Cameroon New employee benefits, healthcare coverage 65
Ivory Coast 2015 pay raise, discretionary profit-shares, non-discretionary profit-sharing agreement, other benefits, healthcare coverage
4 hotels,350 employees
France 2015 pay raise, across-the-board discretionary profit-shares, agreement on on-call hours, non-discretionary profit-sharing agreement 15,921
Hungary General work organization guidelines, health and safety rules, occupational physicians, health and safety training, emergency procedures (unlimited), health coverage 862
Italy Bonus allocation procedures 4 hotels,235 employees
Mexico Annual pay raise, employee benefits, non-discretionary profit-sharing agreement, healthcare coverage, renewal of a mandatory collective bargaining agreement setting up a health and safety commission 468
Monaco Annual bonus replacing the VAT bonus agreement 95
New Zealand Hotel agreement 1,729
Poland Amendment to the collective bargaining agreement defining bonus allocation procedures/wage indexing 2,610
Senegal Discretionary profit-sharing 305
2.4. SOCIAL RESPONSIBILITY COMMITMENTS
By guaranteeing the finest quality products and services, promoting health and nutrition, ensuring safety and security, purchasing responsibly and protecting children from abuse, Accor is setting an example in its relationships with both guests and society as a whole. Solidarity Accor, our community outreach endowment fund, is the natural extension of our approach to corporate social responsibility in our host communities, in full resonance with our founding values.
2.4.1. RESPONSIBILITY TO GUESTS
Accor’s first priority is to make its guests happy. That’s why we try our best to understand their expectations and to interact with them transparently and responsively, so as to define and apply the brand standards that ensure a safe, fully satisfying guest experience. We are also developing a portfolio of sustainable products and services that are better for guest health and the environment.
A guest-focused culture
Identifying and understanding guest expectations
To enhance its guest experience skills and effectiveness, a Guest Experience and Satisfaction Department was created at Group level in 2014. It is tasked with improving guest experience strategies, brand standards and systems for measuring satisfaction and compliance with brand standards. It ensures that innovations are sources of guest value and recommends ways to improve guest perceptions. It also leverages its positioning at Group level to develop synergies among the brands.
Registration Document 201448

2
CORPORATE RESPONSIBILITYSocial responsibility commitments
In this spirit, a number of projects were initiated in 2014. In particular, the Voice Of the Guest (VOG) program is enabling hotels to manage their e-reputations and interact more directly, quickly and seamlessly with guests so as to meet their expectations more effectively.
In practical terms, by zero-basing our guest satisfaction yardsticks, VOG is making it possible to:
�� capture all of the solicited or unsolicited guest feedback (see GSS below). For example, unsolicited reviews posted online or in the social media are continuously captured and analyzed by the hotels;
�� diversifying guest feedback channels, notably mobile phones and tablets;
�� broadening the issues where guests can express their perceptions, such as bar and food services and conference rooms.
By the end of 2014, 30% of our hotels managed their e-reputation online, versus a targeted 100% by the end of 2015.
Defining and applying brand standards
Each brand defines its own standards in such areas as marketing, quality, hygiene and sustainable development, which its member hotels are expected to apply. Guest experience standards were revised for Pullman in 2014 and are scheduled for review at Mercure and Novotel in 2015.
To verify compliance with these brand standards, each hotel must deploy three Groupwide quality control and management tools:
Products & Services Audits conducted every year by an independent consulting firm via “mystery guest” visits to every part of a hotel, based on a very wide range of criteria (between 300 and 2,500 items audited depending on the brand). After the audit, the hotel must prepare and implement an action plan to improve its performance each year.
Hygiene Audits managed by the country organization and conducted every year across the hotel base by an independent consulting firm. Auditors verify the hygiene of food and drink preparation areas, and usually guest rooms as well, by checking compliance with the appropriate procedures and taking samples for analysis. In 2014, more than 5,000 hygiene audits were performed Groupwide.
Guest Satisfaction Surveys (GSS) give guests the opportunity to fill in an online questionnaire about their entire experience, from booking to checkout. Responses are directly viewable by the hotel, which is expected to analyze the feedback and respond to any dissatisfaction within two days.
These tools help to gauge guest satisfaction by determining two leading indicators: the percentage of satisfied guests and the Net Promoter Score, as represented below.
Net Promoter Score by brand in 2014
• Satisfied customers
• Very satisfied customers
• Net Promoter Score
27%
67%
27%
67%
31%
63%
30%
64%
37%
55%
36%
56%
41%
50%
40%
51%
39%
51%
39%
51%
40%
49%
39%
50%
41%
47%
41%
48%
42%
47%
43%
47%
45%
39%
46%
39%
44%
26%
45%
26%
2013 2014Sofitel
2013 2014MGallery
2013 2014Pullman
2013 2014Novotel
2013 2014Suite Novotel
2013 2014Mercure
2013 2014ibis Styles
2013 2014ibis
2013 2014ibis budget
2013 2014hotelF1
57 56 54 54
43 45
32 34 32 33 32 3325
30 33 33
20 21
- 11 - 10
Accor’s benchmark guest experience indicator is the Net Promoter Score, which is equal to the percentage of guests who are “promoters” (who would recommend the hotel) less the percentage of “detractors” (who would not). It is based on a direct question: “How likely is it that you would recommend this hotel to a friend or colleague?”
These three tools are connected to the central Quality Hub database and their data are fed into the indicator scorecard sent to every operations manager, from hotel General Managers to country Operations Directors, and to the various support functions, such as marketing, quality and safety. Based on the data provided, each
country organization is responsible for conducting a quality review to monitor hotel performance and for preparing a corrective action plan if needed. All General Managers are encouraged to use these tools to ensure that service quality and guest satisfaction remain a priority.
Registration Document 2014 49
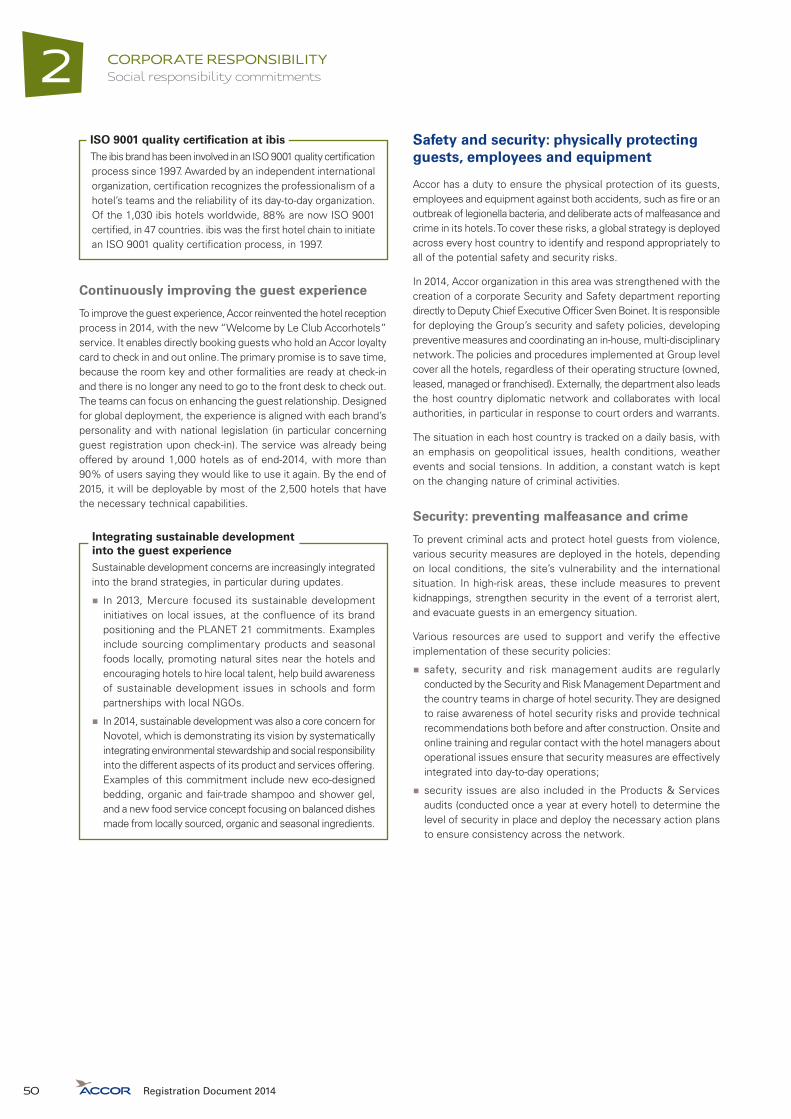
CORPORATE RESPONSIBILITYSocial responsibility commitments2
The ibis brand has been involved in an ISO 9001 quality certification process since 1997. Awarded by an independent international organization, certification recognizes the professionalism of a hotel’s teams and the reliability of its day-to-day organization. Of the 1,030 ibis hotels worldwide, 88% are now ISO 9001 certified, in 47 countries. ibis was the first hotel chain to initiate an ISO 9001 quality certification process, in 1997.
ISO 9001 quality certification at ibis
Continuously improving the guest experience
To improve the guest experience, Accor reinvented the hotel reception process in 2014, with the new “Welcome by Le Club Accorhotels” service. It enables directly booking guests who hold an Accor loyalty card to check in and out online. The primary promise is to save time, because the room key and other formalities are ready at check-in and there is no longer any need to go to the front desk to check out. The teams can focus on enhancing the guest relationship. Designed for global deployment, the experience is aligned with each brand’s personality and with national legislation (in particular concerning guest registration upon check-in). The service was already being offered by around 1,000 hotels as of end-2014, with more than 90% of users saying they would like to use it again. By the end of 2015, it will be deployable by most of the 2,500 hotels that have the necessary technical capabilities.
Sustainable development concerns are increasingly integrated into the brand strategies, in particular during updates.
�� In 2013, Mercure focused its sustainable development initiatives on local issues, at the confluence of its brand positioning and the PLANET 21 commitments. Examples include sourcing complimentary products and seasonal foods locally, promoting natural sites near the hotels and encouraging hotels to hire local talent, help build awareness of sustainable development issues in schools and form partnerships with local NGOs.
�� In 2014, sustainable development was also a core concern for Novotel, which is demonstrating its vision by systematically integrating environmental stewardship and social responsibility into the different aspects of its product and services offering. Examples of this commitment include new eco-designed bedding, organic and fair-trade shampoo and shower gel, and a new food service concept focusing on balanced dishes made from locally sourced, organic and seasonal ingredients.
Integrating sustainable development into the guest experience
Safety and security: physically protecting guests, employees and equipment
Accor has a duty to ensure the physical protection of its guests, employees and equipment against both accidents, such as fire or an outbreak of legionella bacteria, and deliberate acts of malfeasance and crime in its hotels. To cover these risks, a global strategy is deployed across every host country to identify and respond appropriately to all of the potential safety and security risks.
In 2014, Accor organization in this area was strengthened with the creation of a corporate Security and Safety department reporting directly to Deputy Chief Executive Officer Sven Boinet. It is responsible for deploying the Group’s security and safety policies, developing preventive measures and coordinating an in-house, multi-disciplinary network. The policies and procedures implemented at Group level cover all the hotels, regardless of their operating structure (owned, leased, managed or franchised). Externally, the department also leads the host country diplomatic network and collaborates with local authorities, in particular in response to court orders and warrants.
The situation in each host country is tracked on a daily basis, with an emphasis on geopolitical issues, health conditions, weather events and social tensions. In addition, a constant watch is kept on the changing nature of criminal activities.
Security: preventing malfeasance and crime
To prevent criminal acts and protect hotel guests from violence, various security measures are deployed in the hotels, depending on local conditions, the site’s vulnerability and the international situation. In high-risk areas, these include measures to prevent kidnappings, strengthen security in the event of a terrorist alert, and evacuate guests in an emergency situation.
Various resources are used to support and verify the effective implementation of these security policies:
�� safety, security and risk management audits are regularly conducted by the Security and Risk Management Department and the country teams in charge of hotel security. They are designed to raise awareness of hotel security risks and provide technical recommendations both before and after construction. Onsite and online training and regular contact with the hotel managers about operational issues ensure that security measures are effectively integrated into day-to-day operations;
�� security issues are also included in the Products & Services audits (conducted once a year at every hotel) to determine the level of security in place and deploy the necessary action plans to ensure consistency across the network.
Registration Document 201450

2
CORPORATE RESPONSIBILITYSocial responsibility commitments
Accor is also extremely vigilant about prostitution and human trafficking, which may occur in its hotels without its knowledge. It has therefore implemented various procedures for preventing, detecting and combating the use of its hotels for these activities.
In 2014, to address the growing risk of a terrorist attack and to assume his responsibility as corporate leader for the safety of his employees, the Chairman and Chief Executive Officer transferred oversight of the crisis management system to the Senior Vice-President, Safety and Security and deployed the appropriate resources, including a network of country-based crisis managers, toll-free phone numbers, a crisis room, satellite phones and an incident tracking application.
At year-end, a business travel tracker was brought on line, which enables employees to check situation updates about their destination before and during their stay and alerts them by text or email should repatriation become necessary.
Other applications are regularly developed to strengthen the risk prevention system. In 2014:
�� a handbook on the use of surveillance cameras as a tool for preventing and understanding hotel-related safety and security risks was distributed to the hotels;
�� the “Golden Rules” for front desk personnel were sent to the hotels. These primarily concern recommendations for ensuring the safety of women guests traveling alone (see page 46);
�� a memo on wire fraud was issued late in the year as awareness grew of this new form of criminal activity.
In 2014, assertive steps were taken to closely track the Ebola epidemic, deploy preventive measures and ensure proper operational response, notably in West Africa. Weekly information and awareness-building meetings are held with the country organizations and, in the event of a suspected case, an employee and guest protection kit has been prepared with the support of the corporate physician and the Purchasing Department.
Safety: preventing accidents
Given the emergence of new risks and Accor’s global footprint, addressing guest expectations in the area of safety management is a key priority.
To help prevent or abate the primary risks faced by a hotel, such as fires and food or health-related incidents, Groupwide safety procedures are in place:
�� hotels must comply with local building and fire protection legislation, in such areas as regular inspections of utilities and equipment, employee training and evacuation drills. They are also subject to the additional criteria defined in our fire safety policy, which are based on the Management Building System (MBS) methodology developed by HOTREC, the umbrella association for hotels, restaurants and cafés in Europe, and widely recognized throughout the European Union;
�� for more than ten years, a maintenance and inspection program has helped to combat the development and spread of legionella bacteria, with samples taken annually from hotel installations and analyzed by outside laboratories. In addition, hotels track the risk of Legionnaire’s disease via the SET regulatory monitoring application (see page 61). Country organizations take action to ensure compliance with consumer safety and other legislation, in accordance with local standards;
�� in addition, kitchen health inspections are performed by using the Hazard Analysis & Critical Control Points (HACCP) system and applying a similar process to the one used for legionella bacteria inspections.
A line of responsible products and services
Offering dishes that are healthy for people and the planet
Nutrition has become a major issue in today’s society, as seen both in the public health campaigns to reduce the risks of cancer, cardiovascular disease, diabetes, obesity and other health problems and in such environmental concerns as the dangers of agricultural chemicals for the soil and for humans, the growing scarcity of water resources, and the adverse impact on biodiversity. Accor is committed to offering healthy, nutritionally balanced and environmentally sensitive meals that include organic ingredients.
Aware of the importance of food and nutrition, Accor consulted expert chefs and nutritionists to develop recommendations for its hotel restaurants on how to create nutritionally balanced dishes, based on three key aspects: the choice of ingredients, to avoid foods that are too fatty or too sweet; the choice of cooking method, to avoid those that use too much fat; and providing a healthy balance of carbohydrates, lipids and proteins.
The recommendations were set out in a practical guide for restaurant managers worldwide.
To encourage eating that is healthy for people and the environment, the brands are gradually expanding their menus to include products from organic farms, fair trade organizations and local producers.
Registration Document 2014 51
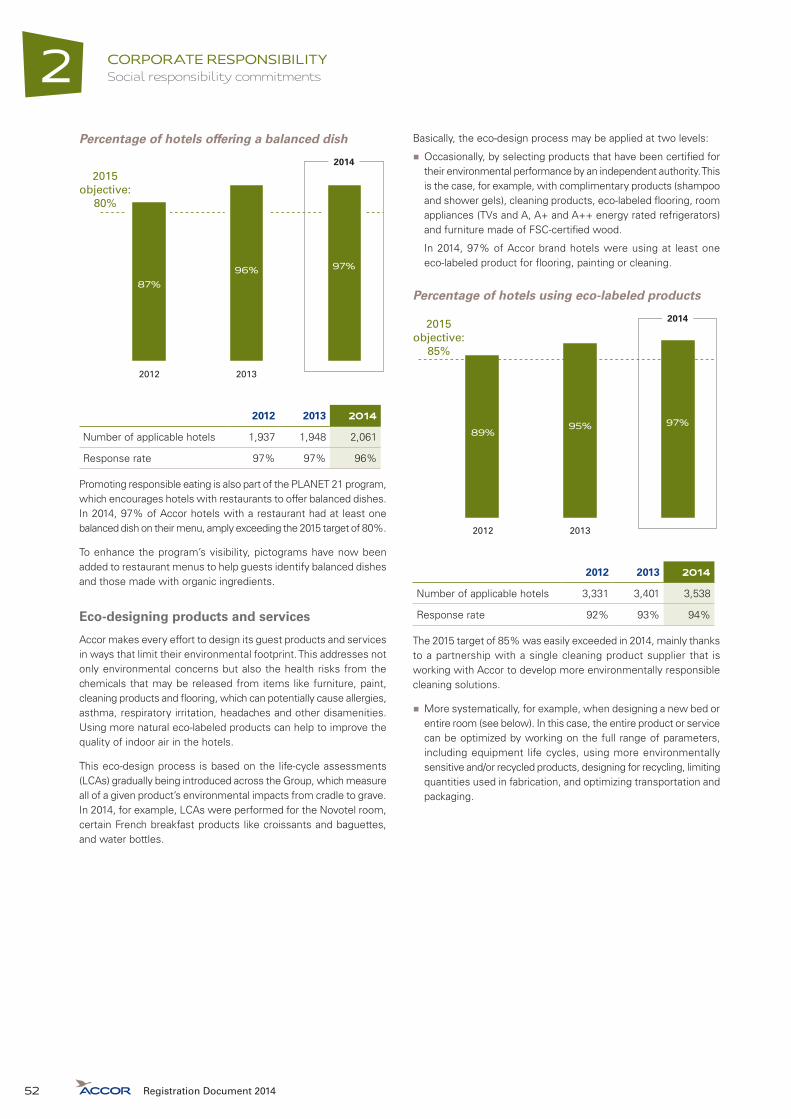
CORPORATE RESPONSIBILITYSocial responsibility commitments2
Percentage of hotels offering a balanced dish
2015objective:
80%
87%96% 97%
20132012
2014
2012 2013 2014
Number of applicable hotels 1,937 1,948 2,061
Response rate 97% 97% 96%
Promoting responsible eating is also part of the PLANET 21 program, which encourages hotels with restaurants to offer balanced dishes. In 2014, 97% of Accor hotels with a restaurant had at least one balanced dish on their menu, amply exceeding the 2015 target of 80%.
To enhance the program’s visibility, pictograms have now been added to restaurant menus to help guests identify balanced dishes and those made with organic ingredients.
Eco-designing products and services
Accor makes every effort to design its guest products and services in ways that limit their environmental footprint. This addresses not only environmental concerns but also the health risks from the chemicals that may be released from items like furniture, paint, cleaning products and flooring, which can potentially cause allergies, asthma, respiratory irritation, headaches and other disamenities. Using more natural eco-labeled products can help to improve the quality of indoor air in the hotels.
This eco-design process is based on the life-cycle assessments (LCAs) gradually being introduced across the Group, which measure all of a given product’s environmental impacts from cradle to grave. In 2014, for example, LCAs were performed for the Novotel room, certain French breakfast products like croissants and baguettes, and water bottles.
Basically, the eco-design process may be applied at two levels:
�� Occasionally, by selecting products that have been certified for their environmental performance by an independent authority. This is the case, for example, with complimentary products (shampoo and shower gels), cleaning products, eco-labeled flooring, room appliances (TVs and A, A+ and A++ energy rated refrigerators) and furniture made of FSC-certified wood.
In 2014, 97% of Accor brand hotels were using at least one eco-labeled product for flooring, painting or cleaning.
Percentage of hotels using eco-labeled products
2015objective:
85%
89%95% 97%
20132012
2014
2012 2013 2014
Number of applicable hotels 3,331 3,401 3,538
Response rate 92% 93% 94%
The 2015 target of 85% was easily exceeded in 2014, mainly thanks to a partnership with a single cleaning product supplier that is working with Accor to develop more environmentally responsible cleaning solutions.
�� More systematically, for example, when designing a new bed or entire room (see below). In this case, the entire product or service can be optimized by working on the full range of parameters, including equipment life cycles, using more environmentally sensitive and/or recycled products, designing for recycling, limiting quantities used in fabrication, and optimizing transportation and packaging.
Registration Document 201452

2
CORPORATE RESPONSIBILITYSocial responsibility commitments
Novotel introduces the totally responsible “Live N Dream” bed
In 2014, Novotel introduced “Live N Dream”, a new bed and bedding concept whose eco-design process was extended to address other corporate social responsibility issues:
�� employee-related aspects, with input from ergonomists tasked with attenuating the risk of musculoskeletal disorders for housekeepers, the production of training videos to instill correct posture and practices, and the use of the Levly® hydraulic bed-lifting system;
�� social aspects, with the selection of certified suppliers;
�� environmental aspects with innovative pillows and bedding made entirely from recycled PET, the use of low environmental impact materials (such as wood from sustainably managed forests for the bed frames), a reduction in the amount of packaging, and the identification of recycling service providers to manage end-of-life disposal.
The eco-design process in action
In 2014, eco-design principles were applied to define the criteria for a new solution for responsible meetings and seminars, Meeting 21, whose standards will be finalized in early 2015.
The criteria are designed to offer an alternative with the smallest possible environmental footprint for every aspect of a successful meeting, including the room (e.g., choice of amenities and materials), consumables (e.g., choice of paper, waste sorting, no plastic cups), food services (e.g., waste-saving measures, organic menu options, fair-trade products), auxiliary services (e.g., hotel shuttles), and participant information and awareness-building.
Beginning in 2015, the green Meeting 21 solution may be offered in any hotel with at least one conference room fulfilling these criteria.
Measuring the carbon footprint of Accor products and services
To meet the expectations of B2B and other guests, in 2014, Accor developed the hospitality industry’s first carbon footprint calculator for a stay or meeting, which also includes the possibility of contributing to the Plant for the Planet program (see page 69). The calculator has been available to sales teams and executive meeting managers during the first quarter of 2015.
Commitments for responsible communication
A set of documents to guide responsible communication practices
Since 2009, Accor has applied the Charter on Responsible Communication prepared by the French advertisers’ association (UDA), which governs the processes in place upstream from communication initiatives. It covers all types of communication – corporate and commercial, above and below the line – and all of the Company’s responsibilities to employees, society and the environment.
Accor has also introduced a Global Hotel Guest Privacy Policy, which is posted on the accorhotels.com, accor.com and brand websites. It explains the reasons for collecting personal information during the booking process and clarifies guests’ rights to access their personal data at their request.
To ensure the responsible use of social media, a Social Media Charter was published in 2010 to offer guidelines for employees posting comments or answering questions concerning an issue directly or indirectly related to the Group on Facebook, Twitter, YouTube, LinkedIn and other social media. The guidelines were updated in 2012.
As part of the AccorLive project launched in 2014, an enterprise social network is also being developed. To join, employees must first agree to abide by the Enterprise Social Network Charter, which defines, among other things, members’ rights and obligations.
A partnership has been formed with TripAdvisor so that comments submitted by guests on a TripAdvisor questionnaire after their stay are posted on both the TripAdvisor and Accor websites.
To ensure price transparency, room rates are clearly indicated at every stage of the online booking process and the terms and conditions of sale are available at all times, in 15 different languages.
Registration Document 2014 53

CORPORATE RESPONSIBILITYSocial responsibility commitments2
Building guest awareness and buy-in
Aligned with the second commitment of the UDA Charter on Responsible Communication (encourage target audiences to behave responsibly), PLANET 21 includes an awareness-building program to encourage guests to reduce their environmental impact and participate in the hotel’s initiatives. It uses instructive signage posted along the entire guest journey – on the booking site, in the hotel entrance and lobby, in the rooms and restaurants, etc.
The signage suggests little things that guests can do to make a real contribution to sustainability, for example by participating in the Plant for the Planet program (see page 69), whose success intrinsically depends on a guest’s willingness to reuse room towels.
In all, more than 90% of Accor hotels are taking practical measures to build guest awareness and buy-in to support their commitment to sustainability.
Percentage of hotels building guest awareness and buy-in
91%93% 94%
20132012
2014
2012 2013 2014
Number of applicable hotels 3,331 3,401 3,538
Response rate 92% 93% 94%
2.4.2. RESPONSIBILITIES TO SUPPLIERS AND CONTRACTORS
With purchases representing around €3.5 billion (1) in 2013, of which around €1.9 billion from certified suppliers, procurement plays a decisive role in Accor’s sustainable development process. The sustainable procurement program aims to unite all of our suppliers, contractors and service providers in a shared commitment to offering products and services that respect personal well-being and help to reduce our environmental footprint.
The Accor procurement process
Based in France, the Corporate Procurement Department manages international contracts and coordinates the network of 19 national Procurement Offices, which employ 145 people worldwide.
Contracts are signed at the international or national level, depending on the features of each category. “Standardizable” products and services that meet several countries’ needs are managed globally, while those specific to a particular country are managed by the national Procurement Office.
Procurement teams make a real contribution to the financial results of the owned, leased, managed and franchised hotels by ensuring that everyone benefits from the Group’s purchasing clout.
Purchases are classified as “certified” if they are sourced by the hotels from suppliers that have signed a contract with an Accor Procurement Department. They are overseen directly by Accor teams, who manage and optimize the contracts and the sourced products or services and control the supply chain by taking care to offer solutions that best fit the needs expressed.
Purchases are classified as “non-certified” if they are sourced directly by the hotels from suppliers that have not signed a contract with an Accor Procurement Department.
(1) €3.5 billion is the estimated volume of total purchases made by all owned, leased, managed and franchised hotels, as extrapolated from the purchases from certified suppliers.
Registration Document 201454
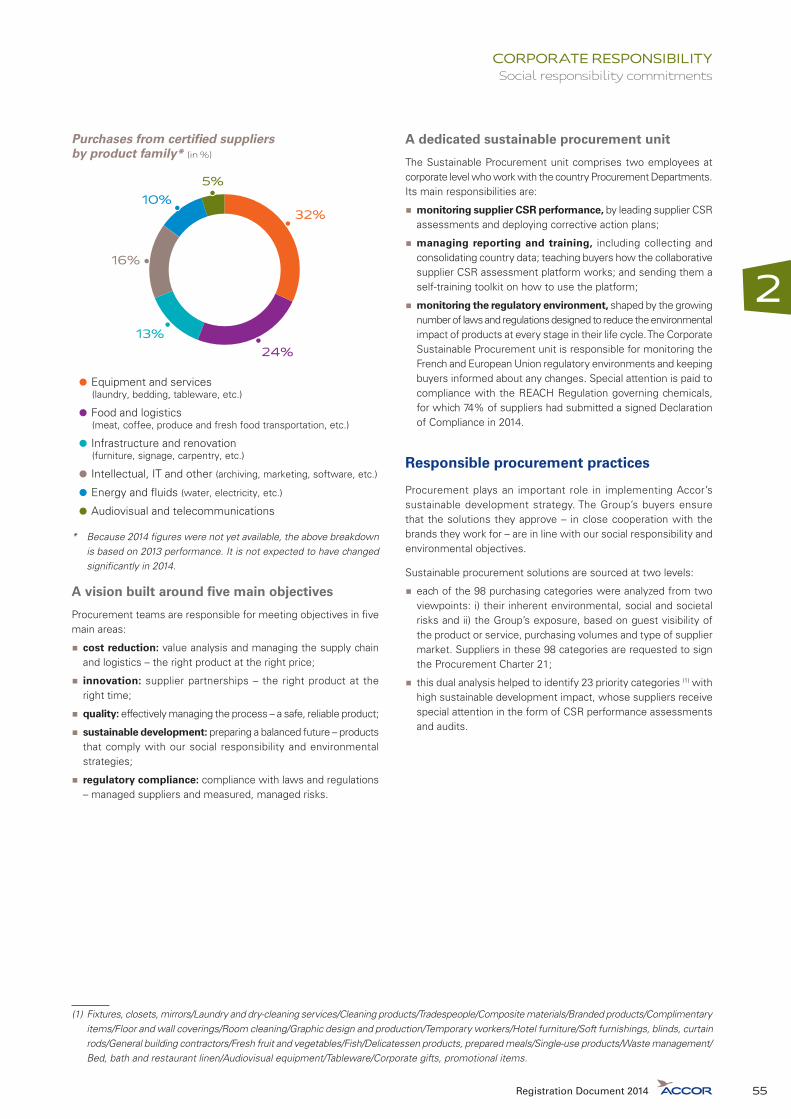
2
CORPORATE RESPONSIBILITYSocial responsibility commitments
Purchases from certified suppliers by product family* (in %)
• Equipment and services (laundry, bedding, tableware, etc.)
• Food and logistics (meat, coffee, produce and fresh food transportation, etc.)
• Infrastructure and renovation (furniture, signage, carpentry, etc.)
• Intellectual, IT and other (archiving, marketing, software, etc.)
• Energy and fluids (water, electricity, etc.)
• Audiovisual and telecommunications
24%13%
16%
10%32%
5%
* Because 2014 figures were not yet available, the above breakdown is based on 2013 performance. It is not expected to have changed significantly in 2014.
A vision built around five main objectives
Procurement teams are responsible for meeting objectives in five main areas:
�� cost reduction: value analysis and managing the supply chain and logistics – the right product at the right price;
�� innovation: supplier partnerships – the right product at the right time;
�� quality: effectively managing the process – a safe, reliable product;
�� sustainable development: preparing a balanced future – products that comply with our social responsibility and environmental strategies;
�� regulatory compliance: compliance with laws and regulations – managed suppliers and measured, managed risks.
A dedicated sustainable procurement unit
The Sustainable Procurement unit comprises two employees at corporate level who work with the country Procurement Departments. Its main responsibilities are:
�� monitoring supplier CSR performance, by leading supplier CSR assessments and deploying corrective action plans;
�� managing reporting and training, including collecting and consolidating country data; teaching buyers how the collaborative supplier CSR assessment platform works; and sending them a self-training toolkit on how to use the platform;
�� monitoring the regulatory environment, shaped by the growing number of laws and regulations designed to reduce the environmental impact of products at every stage in their life cycle. The Corporate Sustainable Procurement unit is responsible for monitoring the French and European Union regulatory environments and keeping buyers informed about any changes. Special attention is paid to compliance with the REACH Regulation governing chemicals, for which 74% of suppliers had submitted a signed Declaration of Compliance in 2014.
Responsible procurement practices
Procurement plays an important role in implementing Accor’s sustainable development strategy. The Group’s buyers ensure that the solutions they approve – in close cooperation with the brands they work for – are in line with our social responsibility and environmental objectives.
Sustainable procurement solutions are sourced at two levels:
�� each of the 98 purchasing categories were analyzed from two viewpoints: i) their inherent environmental, social and societal risks and ii) the Group’s exposure, based on guest visibility of the product or service, purchasing volumes and type of supplier market. Suppliers in these 98 categories are requested to sign the Procurement Charter 21;
�� this dual analysis helped to identify 23 priority categories (1) with high sustainable development impact, whose suppliers receive special attention in the form of CSR performance assessments and audits.
(1) Fixtures, closets, mirrors/Laundry and dry-cleaning services/Cleaning products/Tradespeople/Composite materials/Branded products/Complimentary items/Floor and wall coverings/Room cleaning/Graphic design and production/Temporary workers/Hotel furniture/Soft furnishings, blinds, curtain rods/General building contractors/Fresh fruit and vegetables/Fish/Delicatessen products, prepared meals/Single-use products/Waste management/Bed, bath and restaurant linen/Audiovisual equipment/Tableware/Corporate gifts, promotional items.
Registration Document 2014 55

CORPORATE RESPONSIBILITYSocial responsibility commitments2
For example, as part of the ibis carpeting tender, a grid to assess the bidders’ CSR commitments and performance was designed and integrated into the bid process. Accor selected a GUT-certified product that guaranteed higher environmental value, in particular through the choice of raw materials and the absence of any harmful substances.
In the same way, during the goodies tender, bidders were assessed on the basis of seven CSR criteria, with the resulting score counting for 25% of the final grade.
Hotel purchasing practices
• Percentage of hotels purchasing certified paper (scope of reporting 1)
• Percentage of hotels purchasing fair-trade products (scope of reporting 1)
• Percentage of hotels purchasing local products (scope of reporting 2)
201420132012
82%
62% 68%
88%
66%81%
92%
67%
87%
Scope of reporting 1 2012 2013 2014
Number of applicable hotels 3,331 3,401 3,538
Response rate 92% 93% 94%
Scope of reporting 2
Number of applicable hotels* 1,937 1,948 2,061
Response rate 97% 97% 96%
* Hotels with a restaurant.
Sustainable procurement as a part of supplier relations
Many laws exist to protect people in contact with the Company, including guests, employees, suppliers and others who have only indirect contact. Accor makes every effort to comply with these laws and ensure that they are respected by others, in particular by closely monitoring suppliers and service providers, whose practices may fall short of our commitments to respecting people.
Sharing sustainable development commitments with suppliers
Our corporate social responsibility commitments vis-a-vis suppliers and contractors have been defined in the Procurement Charter 21, which is designed to be included in supplier certification contracts. It enjoins suppliers to:
�� comply with all of the criteria set out in the Charter, which explicitly states the corporate social responsibility commitments Accor wants them to respect;
�� ensure that their own suppliers and subcontractors meet the same standards;
�� participate in Accor’s supplier assessments and implement the necessary action plans;
�� authorize Accor and/or consultants commissioned by Accor to conduct sustainable development audits and implement the necessary action plans.
Any supplier that is unable to meet these requirements must inform Accor so that an agreement can be reached on the corrective and preventive measures to be taken and the timetable for implementing them. Failure to comply with any of the criteria may result in the termination of business dealings with the supplier in question.
In 2014, the Procurement Charter 21 was signed by around 80% of suppliers, based on data from the 18 reporting Procurement Departments, versus 68% in 2013. During the year, the Purchasing teams worked hard to increase this percentage. Despite its ambitious nature, the 2015 target of including the Charter in every contract has been maintained.
Monitoring supplier CSR performance
To track their CSR performance, suppliers are regularly audited, with a focus on the 23 high-priority purchasing categories. The audits presented below primarily concern suppliers in these categories.
Online CSR assessments by EcoVadis: EcoVadis operates a collaborative platform that can be used to assess the CSR performance of suppliers worldwide via a custom-designed questionnaire. Suppliers are scored on their social responsibility, environmental and ethical performance and on how much control they have over their own supply chain. A total of 382 certified Accor suppliers have been assessed since 2010, including 134 in 2014, or around 90% more than in 2013. During the year, 116 corrective action plan requests were issued to suppliers with an EcoVadis score of less than 30, either overall or on one of the criteria.
Onsite audits conducted by Accor: quality audits are performed by country buyers at certified local suppliers and contractors that are important to Accor because of the volume of purchases involved and the related employee and health risks. Particular attention is paid to such categories as laundry services, security services and cleaning services, which are considered sensitive in light of the CSR issues and/or purchasing volumes involved.
Registration Document 201456
2
CORPORATE RESPONSIBILITYSocial responsibility commitments
Onsite audits conducted by consultants: in 2014, Accor commissioned Bureau Veritas to conduct onsite audits at suppliers and/or their sub-contractors whose production facilities are based in a high-risk country. For example, Accor requested that a supplier change sub-contractors after one of them refused to participate in the outside audit.
Nurturing sustainable supplier relationships
As part of its business relationship with certain suppliers, Accor takes a partnership approach to improving the environmental or social responsibility impact of selected products. In one example, life-cycle assessments performed on baked goods in 2014 enabled the supplier to reduce its environmental footprint. This type of partnering relationship may be nurtured at every level of the
organization. In 2014, for example, Pullman collaborated with its uniform manufacturer to plant orchards as part of a circular economy project, which also allowed employees to make a direct contribution by helping to plant the trees.
Lastly, Accor is committed to building sustainable relationships with suppliers, whether they are multinational corporations or small local businesses. To improve management of the supplier panel, the supplier base in every country with an Accor purchasing department was mapped in 2014. The exercise revealed how long certain suppliers had worked with Accor and the high proportion of small and medium-sized companies in the panel. For example, more than 65% of suppliers certified by the French Purchasing Department were small or medium-sized companies and more than half had worked with Accor for more than five years.
2.4.3. PROTECTING CHILDREN FROM ABUSE
Combating sexual exploitation involving children
The sexual exploitation of children crosses geographic, social and cultural borders. According to UNICEF, it concerns around two million girls and boys under 18 worldwide. As the world’s leading hotel operator, present in 92 countries, Accor has a legal and moral obligation to protect children from abuse and to ensure that these practices do not take place in its hotels.
According to the ECPAT (1) NGO, “child sex tourism (CST) is the commercial sexual exploitation of children by individuals who travel from one place to another, where they engage in sexual acts with minors”.
Accor began working to combat CST in 2001, when it became the first hotel group to forge a partnership with ECPAT. The first employee CST sensitivity training programs were introduced in 2002, strengthening our child protection policies.
Accor’s commitment to combating CST is structured by the Code of Conduct for the Protection of Children from Sexual Exploitation in Travel and Tourism issued by ECPAT and the World Tourism Organization, the United Nations agency responsible for the promotion of responsible, sustainable and universally accessible tourism. It has been signed by 1,200 tourism industry professionals for their operations in 46 host countries, where it is being applied with six key objectives:
�� establish a policy and procedures against the sexual exploitation of children;
�� train employees;
�� introduce clauses about the issue in contracts with suppliers;
�� inform travelers;
�� support and collaborate with local stakeholders in the prevention of child sexual exploitation;
�� report annually on the implementation of Code-related activities.
In 2014, the Code of Conduct was signed by Accor in Luxembourg and Belgium, bringing to 37 the number of country organizations that have pledged their support and making Accor the Code’s “Top Member 2014”. Two other country organizations are on their way to becoming members.
In addition, the country organizations demonstrated an increasingly assertive commitment to this issue in 2014, with a wide range of initiatives:
�� several Accor countries, such as Poland and Brazil, and the Group websites actively relayed ECPAT’s “Don’t Look Away” campaign during the FIFA World Cup;
�� Accor UK prepared its own child protection policy;
�� awareness-building campaigns were conducted in Switzerland, under the aegis of Accor and ECPAT Switzerland, and in Africa, led by Accor Africa and ECPAT France.
After preparing a dedicated procedures manual in 2012 in partnership with ECPAT France and two French Interior Ministry organizations – the International Cooperation Directorate (DCI) and the Central Office for the Repression of Violence Against Individuals (OCRVP) – and testing it in Brazil, Thailand, Poland and Senegal, Accor stepped up its child protection commitment by creating the WATCH – We Act Together for Children program (see box page 58).
(1) ECPAT is the leading international organization in the fight to end child prostitution, child pornography and trafficking of children for sexual purposes. Its network comprises 80 organizations working in 75 countries.
Registration Document 2014 57
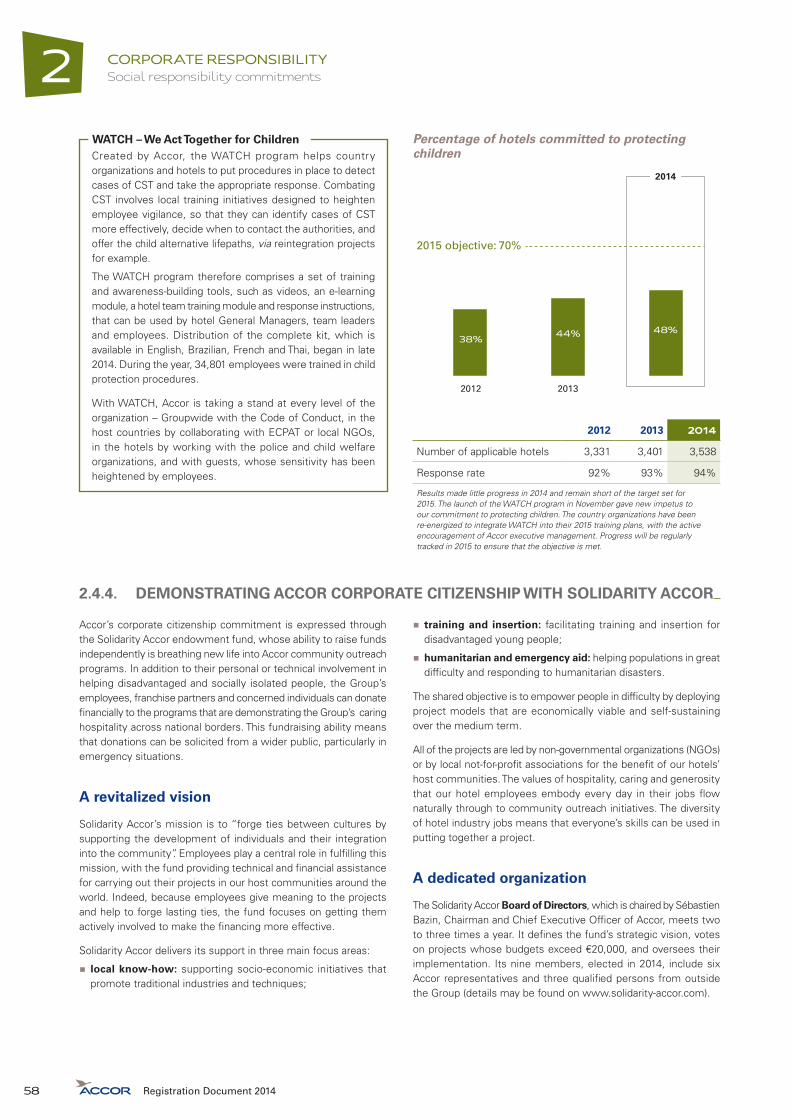
CORPORATE RESPONSIBILITYSocial responsibility commitments2
Created by Accor, the WATCH program helps country organizations and hotels to put procedures in place to detect cases of CST and take the appropriate response. Combating CST involves local training initiatives designed to heighten employee vigilance, so that they can identify cases of CST more effectively, decide when to contact the authorities, and offer the child alternative lifepaths, via reintegration projects for example.
The WATCH program therefore comprises a set of training and awareness-building tools, such as videos, an e-learning module, a hotel team training module and response instructions, that can be used by hotel General Managers, team leaders and employees. Distribution of the complete kit, which is available in English, Brazilian, French and Thai, began in late 2014. During the year, 34,801 employees were trained in child protection procedures.
With WATCH, Accor is taking a stand at every level of the organization – Groupwide with the Code of Conduct, in the host countries by collaborating with ECPAT or local NGOs, in the hotels by working with the police and child welfare organizations, and with guests, whose sensitivity has been heightened by employees.
WATCH – We Act Together for Children Percentage of hotels committed to protecting children
2015 objective: 70%
38% 44% 48%
20132012
2014
2012 2013 2014
Number of applicable hotels 3,331 3,401 3,538
Response rate 92% 93% 94%
Results made little progress in 2014 and remain short of the target set for 2015. The launch of the WATCH program in November gave new impetus to our commitment to protecting children. The country organizations have been re-energized to integrate WATCH into their 2015 training plans, with the active encouragement of Accor executive management. Progress will be regularly tracked in 2015 to ensure that the objective is met.
2.4.4. DEMONSTRATING ACCOR CORPORATE CITIZENSHIP WITH SOLIDARITY ACCOR
Accor’s corporate citizenship commitment is expressed through the Solidarity Accor endowment fund, whose ability to raise funds independently is breathing new life into Accor community outreach programs. In addition to their personal or technical involvement in helping disadvantaged and socially isolated people, the Group’s employees, franchise partners and concerned individuals can donate financially to the programs that are demonstrating the Group’s caring hospitality across national borders. This fundraising ability means that donations can be solicited from a wider public, particularly in emergency situations.
A revitalized vision
Solidarity Accor’s mission is to “forge ties between cultures by supporting the development of individuals and their integration into the community”. Employees play a central role in fulfilling this mission, with the fund providing technical and financial assistance for carrying out their projects in our host communities around the world. Indeed, because employees give meaning to the projects and help to forge lasting ties, the fund focuses on getting them actively involved to make the financing more effective.
Solidarity Accor delivers its support in three main focus areas:
�� local know-how: supporting socio-economic initiatives that promote traditional industries and techniques;
�� training and insertion: facilitating training and insertion for disadvantaged young people;
�� humanitarian and emergency aid: helping populations in great difficulty and responding to humanitarian disasters.
The shared objective is to empower people in difficulty by deploying project models that are economically viable and self-sustaining over the medium term.
All of the projects are led by non-governmental organizations (NGOs) or by local not-for-profit associations for the benefit of our hotels’ host communities. The values of hospitality, caring and generosity that our hotel employees embody every day in their jobs flow naturally through to community outreach initiatives. The diversity of hotel industry jobs means that everyone’s skills can be used in putting together a project.
A dedicated organization
The Solidarity Accor Board of Directors, which is chaired by Sébastien Bazin, Chairman and Chief Executive Officer of Accor, meets two to three times a year. It defines the fund’s strategic vision, votes on projects whose budgets exceed €20,000, and oversees their implementation. Its nine members, elected in 2014, include six Accor representatives and three qualified persons from outside the Group (details may be found on www.solidarity-accor.com).
Registration Document 201458

2
CORPORATE RESPONSIBILITYSocial responsibility commitments
The Selection Committee votes on projects funded at less than €20,000 and oversees their implementation.
The Board is supported by a standing team dedicated entirely to assisting employees in their community outreach projects. It works closely with local correspondents, who are Accor employees from the project’s host region or who have worked there for several years.
Employees add real value to Solidarity Accor’s programs by contributing their professional skills in such areas as marketing, human resources and consulting. In particular, they regularly participate in training programs to present various hospitality industry jobs and share their professional skills with trainees. These programs can include on-site hotel tours, conferences on hospitality industry jobs, presentations of the Accor Group and internships at Accor hotels. In addition, thanks to the fund’s Solidarity Sabbatical program, employees in the French head offices and hotels can leave on two-week outreach assignments in Asia or other developing regions. During these assignments, they share their capabilities with local people through organizations such as women’s groups, village cooperatives and schools.
Fundraising
Solidarity Accor has been funded by Accor with an expendable endowment of €500,000 that, under the terms of its charter, may be increased by raising additional funds. In 2014, this new governance system was set up and tested through a variety of pilot projects that will be gradually expanded and diversified beginning in 2015.
For example, during the Ninth Solidarity Week (see box), Solidarity Accor organized its first in-house fundraising drive to enable employees to support the people covered by the fund’s projects. Another major initiative was launched in November, to enable guest members of Le Club Accorhotels to donate to the fund (see box). In all, a total of €49,700 was raised during the year.
Since November 2014, Accor Le Club Accorhotels loyalty program offers members the possibility of converting their points into donations to Solidarity Accor. The funds raised are routed to an emergency fund used to rebuild communities. Le Club Accorhotels is encouraging members to support this partnership by keeping them informed of the projects that their donations are helping to fund. In the event of a disaster, Le Club Accorhotels members could be Solidarity Accor’s first port of call for emergency aid donations.
Le Club Accorhotels partners Solidarity Accor
Projects supported in 2014
In 2014, 29 projects were supported with total funding of €582,100.
Projects supported in 2014 by region
• Europe • Asia • Americas • Africa
6
1
7
15
Projects supported by Solidarity Accor in 2014, by focus area
• Training and insertion
• Local know-how
• Humanitarian and emergency aid
4%10%
86%
�� 29 projects supported.
�� In 18 countries.
�� Involving more than 750 employees.
�� Supporting more than 2,000 people directly and more than 9,000 indirectly.
Solidarity Accor in figures, 2014
Registration Document 2014 59
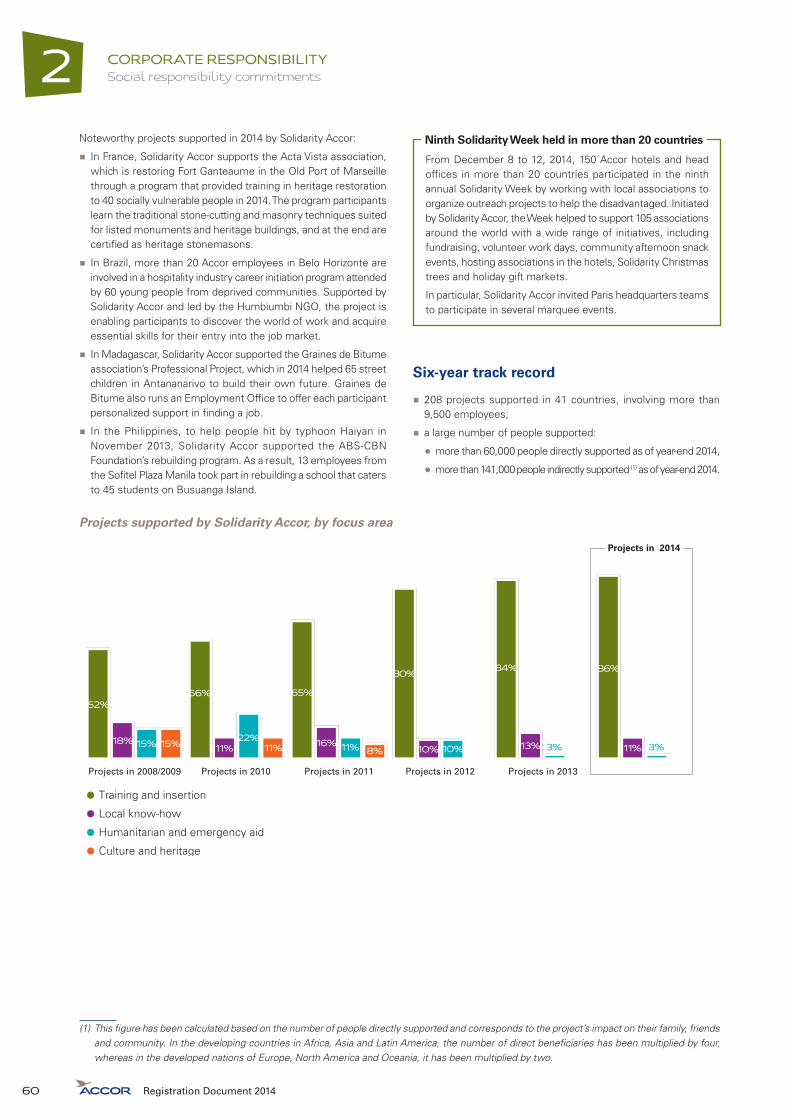
CORPORATE RESPONSIBILITYSocial responsibility commitments2
Noteworthy projects supported in 2014 by Solidarity Accor:
�� In France, Solidarity Accor supports the Acta Vista association, which is restoring Fort Ganteaume in the Old Port of Marseille through a program that provided training in heritage restoration to 40 socially vulnerable people in 2014. The program participants learn the traditional stone-cutting and masonry techniques suited for listed monuments and heritage buildings, and at the end are certified as heritage stonemasons.
�� In Brazil, more than 20 Accor employees in Belo Horizonte are involved in a hospitality industry career initiation program attended by 60 young people from deprived communities. Supported by Solidarity Accor and led by the Humbiumbi NGO, the project is enabling participants to discover the world of work and acquire essential skills for their entry into the job market.
�� In Madagascar, Solidarity Accor supported the Graines de Bitume association’s Professional Project, which in 2014 helped 65 street children in Antananarivo to build their own future. Graines de Bitume also runs an Employment Office to offer each participant personalized support in finding a job.
�� In the Philippines, to help people hit by typhoon Haiyan in November 2013, Solidarity Accor supported the ABS-CBN Foundation’s rebuilding program. As a result, 13 employees from the Sofitel Plaza Manila took part in rebuilding a school that caters to 45 students on Busuanga Island.
From December 8 to 12, 2014, 150 Accor hotels and head offices in more than 20 countries participated in the ninth annual Solidarity Week by working with local associations to organize outreach projects to help the disadvantaged. Initiated by Solidarity Accor, the Week helped to support 105 associations around the world with a wide range of initiatives, including fundraising, volunteer work days, community afternoon snack events, hosting associations in the hotels, Solidarity Christmas trees and holiday gift markets.
In particular, Solidarity Accor invited Paris headquarters teams to participate in several marquee events.
Ninth Solidarity Week held in more than 20 countries
Six-year track record
�� 208 projects supported in 41 countries, involving more than 9,500 employees;
�� a large number of people supported:
�y more than 60,000 people directly supported as of year-end 2014,
�y more than 141,000 people indirectly supported (1) as of year-end 2014.
Projects supported by Solidarity Accor, by focus area
• Training and insertion
• Local know-how
• Humanitarian and emergency aid
• Culture and heritage
52%
18% 15% 15%
56%
11%22%
11%
65%
16% 11% 8%
80%
10% 10%
84%
13% 3%
86%
11% 3%
Projects in 2011 Projects in 2012 Projects in 2013Projects in 2010Projects in 2008/2009
Projects in 2014
(1) This figure has been calculated based on the number of people directly supported and corresponds to the project’s impact on their family, friends and community. In the developing countries in Africa, Asia and Latin America, the number of direct beneficiaries has been multiplied by four, whereas in the developed nations of Europe, North America and Oceania, it has been multiplied by two.
Registration Document 201460

2
CORPORATE RESPONSIBILITYEnvironmental commitments
2.5. ENVIRONMENTAL COMMITMENTS
Accor’s environmental policy is supported by cross-functional management systems covering the environmental performance of its hotels, products and services, along with training and awareness building for Accor employees. It is designed to effectively address our environmental challenges in four primary areas: water, energy, attenuation of local impacts and waste management.
2.5.1. ENVIRONMENTAL MANAGEMENT
Improvement levers in the management of environmental performance
Accor implements its Charter 21 tool, backed by ISO 14001 certification for some brands and hotels, to reduce the environmental impact of the activity of its hotels. Through an approach emphasizing eco-design and innovation, it also seeks to reduce the environmental footprint of its products and services.
Charter 21 and the OPEN and SET systems
Charter 21 is the name of Accor’s internal environmental management system. It lists a series of measures to be phased in by hotels: management measures for setting up an efficient framework for action (organization, training, information, performance monitoring, etc.) plus specific measures on improving environmental performance or the management of risks (regulatory, pollution-related, etc.). All environmental factors (water, energy, waste, etc.) are covered, along with some social factors (responsible eating, health & well-being, etc.) (see also description on page 33). Charter 21 also comes with a toolkit, providing practical tools (checklists, guides, procedures, training kits, etc.) to help hotels implement each of the measures listed.
The Charter 21 management system is rolled out across all Accor Group hotels regardless of operating structure. Hotels use two proprietary applications that tie in with Charter 21:
�� the OPEN application helps hotels manage their sustainable development performance. It comprises a general Charter 21 module plus three thematic modules: Water & energy; Waste; and “Plant for the Planet”. Hotels set their annual targets, enter their data and track their performance indicators. They also use the application for annual reporting purposes. OPEN is rolled out across all Accor hotels, except for the Water & Energy module, which is reserved primarily for owned, leased and managed hotels. The application is regularly upgraded and available in eight languages (Chinese, English, French, German, Italian, Portuguese/Brazilian, Russian and Spanish). It has more than 5,000 users today;
�� SET (for “Safety and Environment Tool”) is used for monitoring safety, environmental and technical aspects of regulatory compliance. It lists regulations applicable to hotels, plus Accor standards, and helps hotels identify compliance shortfalls and manage action plans to remedy non-compliance. Rollout of this application has been completed in sixteen countries and is under way in seven more. In other countries, compliance is ensured by dedicated, locally managed systems.
See page 124 for details on the management of environmental risks, on the means employed for preventing environmental risks and pollution, and on the amounts of provisions and guarantees in relation to environmental risks.
ISO 14001 environmental management certification
In the last ten years, the ibis, Novotel and Thalassa brands, and many other Accor Group hotels, have opted to formalize their environmental commitment by obtaining ISO 14001 certification, thereby benefiting from the international recognition that this certification affords.
With this in mind, an environmental management system (EMS) was set up alongside Charter 21 with the specific capability of meeting the requirements of the ISO 14001 standard. The most recent version of this EMS, named “ISO 14001 in ACTion” was finalized in 2013. It comprises a set of procedures, methods and documents enabling hotels to obtain certification. Deployment will be facilitated by an e-learning module that provides step-by-step support for hotels in implementing the ISO 14001 EMS. Implementation is monitored by annual internal audits for each of the certified hotels. In addition, to verify compliance with ISO 14001 requirements, external audits are carried out each year on a sample of hotels by an accredited independent organization.
Under its PLANET 21 program, Accor has already exceeded its target of ISO 14001 certification for 40% of the hotel base by 2015, regardless of operating structure. By the end of 2014, 1,000 hotels in the Accor network had obtained certification, in 57 countries, if we include owned, managed and franchised hotels. This breaks down as 799 ibis hotels (78% of the ibis network), 329 Novotel and Suite Novotel hotels (75% of these networks) and 21 hotels or other establishments under other banners (Sofitel, Pullman, etc.). Because of financial and staffing issues, certification objectives do not apply to hotels in the budget segment, operated under the hotelF1, Formule 1 and ibis budget brands; certification is a highly demanding process for hotel employees, which makes it difficult to implement in lightly staffed budget hotels.
Registration Document 2014 61

CORPORATE RESPONSIBILITYEnvironmental commitments2
Percentage of hotels with environmental management certification
2015 objective: 40%
31%36% 41%
20132012
2014
2012 2013 2014
Number of applicable hotels* 2,671 2,653 2,770
* Excluding Formule1, hotelF1 and ibis budget hotels.
Eco-design approach
As well as managing the environmental impacts of its hotels, Accor is also firmly committed to reducing the environmental footprint of the products and services that the Group and its brands design. Details on this eco-design approach are given on page 52.
Training, awareness-building and buy-in
The driving forces behind our sustainable development strategy are nearly 180,000 Accor employees around the world. They act as our sustainability ambassadors, both by demonstrating environmental sensitivity in their everyday work and by embracing our approach, so as to explain it to guests and encourage buy-in for the PLANET 21 actions.
Because employee awareness-building and training play a critical role in this process, Accor has developed an ambitious e-learning program, available in ten languages and addressing all Accor Group brands. It comprises two modules:
�� awareness on sustainable development (understanding the issues at stake, how the hotel fits in with its environment, and what the PLANET 21 program involves);
�� everyday working practices (explaining PLANET 21 to guests, measures taken by the hotel, importance of seemingly minor everyday working practices).
Sustainability training resources also include fact sheets (“Sustainable Development in My Job”) for individual departments (corporate, hospitality/housekeeping, etc.) and jobs (head station waiter, cook, housekeeping floor supervisor, Sales Director, General Manager, etc.). The sheets cover all of the hospitality industry’s skill-sets, and can be adapted to each hotel’s local situation and priorities. They are divided into two parts, “In the Hotel” and “In my Job”, each with key takeaways and actionable practices. They also come with a sustainable development glossary.
Each year, around April 22 (Earth Day and PLANET 21 launch date), employees at all Accor establishments worldwide take part in initiatives addressing the 21 commitments in the Accor sustainable development program: tree planting, healthcare training, issue of mosquito nets, lunches with organic food, clean-up of natural sites, etc. In 2014, employee mobilization on the “Plant for the Planet” theme was very impressive.
PLANET 21 Day, a global event for demonstrating Accor personnel’s sustainability commitment
2.5.2. ENERGY AND CLIMATE CHANGE
Energy and carbon challenges
Energy
In addition to representing a major source of rising costs for Accor, hotel energy use ranks among our leading environmental impacts, where there are many pathways to improvement. The Group is working hard to extensively and systematically deploy energy efficiency programs and install renewable energy facilities. According to the 2014 environmental impact study, on a life-cycle basis, 82% (1) of Accor’s total energy consumption comes from the hotels.
In the last ten years, considerable progress has been made in shrinking this footprint. However, further action is necessary in this area to plan for forthcoming legislation, the levying of new taxes and the increasing burden of higher costs in the hotel business.
From 2011 to 2015, Accor is committed to a 10% reduction both in the energy used and in the carbon emitted by our owned, leased and managed hotels. In the case of franchised hotels, where the Group has no control over operations, franchisees are offered resources and recommendations to support actions to address these challenges.
(1) The remaining energy use was primarily attributable to laundry operations (5%), upstream agricultural activities (5%) and construction/renovation (5%).
Registration Document 201462

2
CORPORATE RESPONSIBILITYEnvironmental commitments
Carbon
Climate change represents an important challenge for the entire tourism and travel industry:
�� tourist regions may be seriously impacted by global warming;
�� climate policies are going to deeply reshape our future business and growth environment, in particular by shifting the growth model’s energy paradigm, with far-reaching implications for the transportation and building industries.
Accor Group environmental footprint data for 2014 shows life-cycle annual carbon emissions of around 4.7 million tonnes of CO2 equivalent. Around three quarters (76%) of this comes from hotel energy consumption (electricity in the main). Food services represent the next biggest slice of carbon emissions: upstream farming operations account for 11%, with half of this coming from purchase of meat and dairy products.
Breakdown of Accor’s carbon footprint by source (i.e. 4.7Mt eqCO2)
• Onsite energy consumption
• Food and beverage
• Construction and renovation
• Laundry (external)
• Other (room equipment, cooling systems, onsite water use,waste management, office equipment, hotel maintenance,employee commutes)
11%
4% 4%
5%
76%
Actions currently under way at Accor on energy consumption and greenhouse gas emissions take account of the climate change risks identified by the working group formed with the French Institute of Sustainable Development and International Relations (IDDRI ) from 2007 to 2009. This working group issued recommendations on five main issues: hotel construction and renovation, travel, employee and guest health, hotel development and new businesses and services.
Energy performance in hotel operations
Managing energy performance in hotel operations
After reducing energy consumption by 5.5% during the previous five-year plan (2006-2010), the Group now seeks to stabilize this achievement at the highest-performing hotels and push ahead with consumption control endeavors at those establishments where further reductions are possible. This calls for performance management, focused investments and more efficient practices in both plant maintenance and behaviors.
Performance management is based on:
�� monthly monitoring (or daily monitoring for some hotels) of energy consumption using the OPEN application;
�� a clear understanding of hotel operations (with cross-analysis by brand, number of rooms, number of food and beverage outlets, utility installations, etc.) and their energy use, which has been tracked since 2005;
�� an in-depth analysis of ratios measuring the impact of weather and occupancy rates, so as to ensure comparability among years;
�� benchmarking by brand, hotel family and region;
�� targeted actions that are both easy to implement and sustainable.
To identify the least efficient systems and equipment so that capital expenditure can be optimally allocated, a process is in place based on two proprietary applications: OPEN, for managing water and energy use (see page 61) and MACH, for managing hotel equipment (inventory, installation date and current condition) in order to assess, prioritize and budget renovation needs, and then track the related capital projects.
These applications are used in conjunction with:
�� a network of Technical Departments around the world that help to locally manage and support in-hotel deployment of our methods and applications;
�� the BOOST method for optimizing the management of utility installations (see page 64);
�� a self-assessment program that enables each hotel to identify the best practices aligned with their particular situation;
�� Charter 21, some of whose 65 actions relate to energy savings.
To maintain impetus to work on reducing hotels’ energy (and water) consumption, Accor set detailed targets hotel by hotel in 2014. The aim is to stimulate improvement at the lower-performing hotels by introducing best practices from higher-performing ones, and by requiring catch-up improvement rates from the hotels the farthest behind. Using the OPEN application, each individual hotel can track performance month-by-month with respect to the targets set for it by the local Technical Department.
Registration Document 2014 63

CORPORATE RESPONSIBILITYEnvironmental commitments2
�� Accor’s proprietary BOOST system involves a comprehensive analysis of a hotel’s technical operations and energy performance. It takes the form of an in-depth audit, over three days on average, with tests in rooms, on heating, ventilation and air conditioning systems, and on water and electricity distribution. Data and machine operations are analyzed and then shared with the hotel technical team to identify areas for savings and define action plans. Audits are carried out by specially trained BOOST experts (Accor personnel) or, in regions where there are few technical teams, by specially instructed teams of an outside service provider with expertise in energy efficiency. The audits also stimulate the transfer of skills and know-how, facilitating long-term improvements in hotel management.
�� The improvement measures proposed following the 16 BOOST audits carried out in 2014 should bring cost savings estimated at €830,000, as well as reducing energy consumption by around 11 GWh and CO2 emissions by around 4.5 tonnes. Accor plans to roll out this method across Latin America and Europe from 2015 onward.
BOOST, to improve energy performance
Hotel energy performance in 2014
To track its hotels’ intrinsic energy performance, Accor uses the industry-standard indicator of kWh per available room.
All of Accor’s owned, leased and managed hotels track monthly energy consumption using the OPEN application.
Total energy use
In GWh
• Total energy use
• Total energy use (like-for-like, 2012-2014)
In kWh per available room
• Average energy ratio
• Average energy ratio (like-for-like, 2012-2014)
• Energy ratio adjusted for the impact of weather conditions and occupancy rates (like-for-like, 2012-2014)
3,209
1,767
3,890
1,758
3,957
31.030.6
31.6
32.7
32.5
32.7
39.2
39.7
38.2
1,644
20132012
2014
Scope of reporting 2012 2013 2014
Number of applicable hotels 1,855 1,912 1,940
Response rate 79% 87% 88%
Number of audited hotels 1,465 1,663 1,708
Number of hotels (like-for-like, 2012-2014) 959 959 959
On a like-for-like basis, energy use in kWh per available room across the Accor Group fell by 4.5% from 2011 to 2014.
Adjusted for the impact of weather conditions and occupancy rates, kWh per available room declined by around 3.7% from 2011 to 2014 (1). This is the most accurate figure for expressing Accor’s intrinsic energy performance.
Though Accor’s energy use is trending downwards, it is not on track to meet the 10% reduction targeted for 2015. We are therefore going to continue deploying dedicated programs to improve and optimize energy management in the hotels, such as the BOOST method for optimizing the management of utility installations.
Energy performance in hotel construction
Managing energy performance in hotel construction
Because a building’s architecture, design and construction play a vital role in reducing its environmental footprint, more and more countries are defining construction standards that improve a building’s energy performance and minimize its impact on surrounding ecosystems. As a professional hotel builder, Accor has acquired extensive environmental engineering expertise. It regularly tightens its standards and conducts pilot projects to design hotels that are ever more efficient in using energy, water and potentially harmful chemicals and materials.
An internal standard listing all of Accor’s international guidelines for hotel construction and refurbishment was published in 2013. The document covers many of the issues to be examined during a hotel construction or renovation project, including energy, water, biodiversity, pollution, disamenities and compliance with environmental standards. This document is issued to Accor project managers in different countries for guidance during construction and renovation operations. It is also issued to the managers of managed and franchised hotels.
(1) On the basis of data available for 711 hotels in the like-for-like reporting scope of 959.
Registration Document 201464
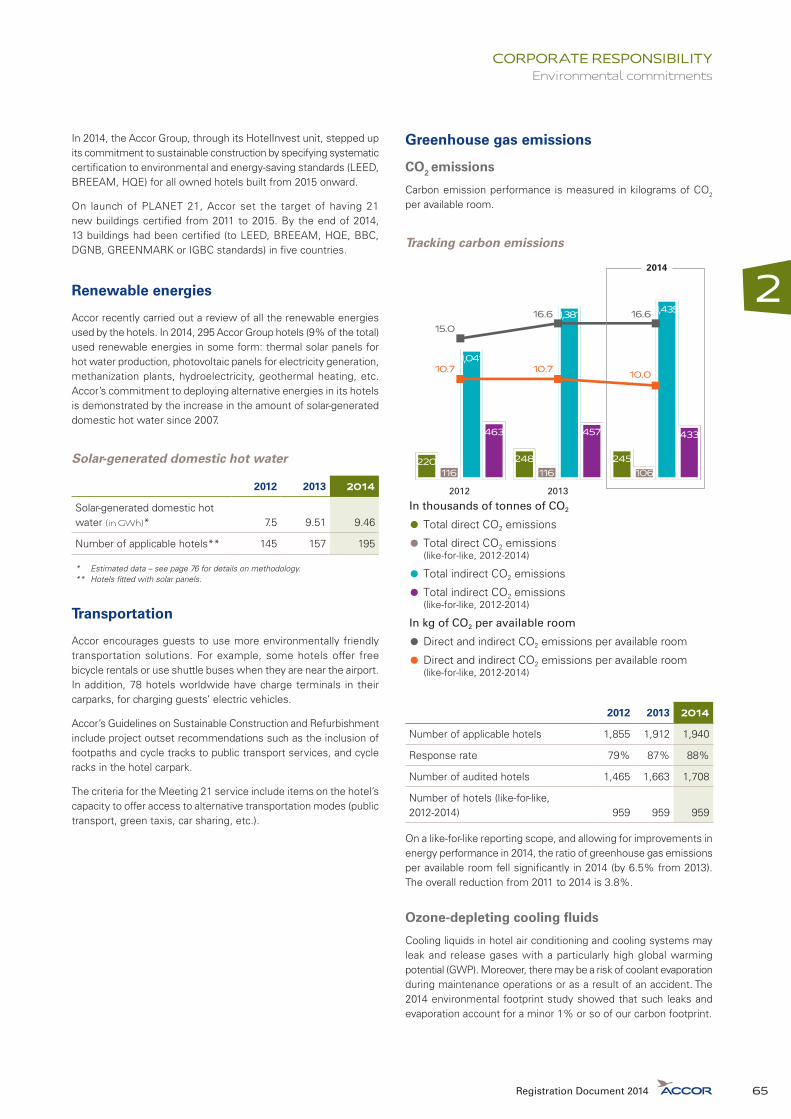
2
CORPORATE RESPONSIBILITYEnvironmental commitments
In 2014, the Accor Group, through its HotelInvest unit, stepped up its commitment to sustainable construction by specifying systematic certification to environmental and energy-saving standards (LEED, BREEAM, HQE) for all owned hotels built from 2015 onward.
On launch of PLANET 21, Accor set the target of having 21 new buildings certified from 2011 to 2015. By the end of 2014, 13 buildings had been certified (to LEED, BREEAM, HQE, BBC, DGNB, GREENMARK or IGBC standards) in five countries.
Renewable energies
Accor recently carried out a review of all the renewable energies used by the hotels. In 2014, 295 Accor Group hotels (9% of the total) used renewable energies in some form: thermal solar panels for hot water production, photovoltaic panels for electricity generation, methanization plants, hydroelectricity, geothermal heating, etc. Accor’s commitment to deploying alternative energies in its hotels is demonstrated by the increase in the amount of solar-generated domestic hot water since 2007.
Solar-generated domestic hot water
2012 2013 2014
Solar-generated domestic hot water (in GWh)* 7.5 9.51 9.46
Number of applicable hotels** 145 157 195
* Estimated data – see page 76 for details on methodology.** Hotels fitted with solar panels.
Transportation
Accor encourages guests to use more environmentally friendly transportation solutions. For example, some hotels offer free bicycle rentals or use shuttle buses when they are near the airport. In addition, 78 hotels worldwide have charge terminals in their carparks, for charging guests’ electric vehicles.
Accor’s Guidelines on Sustainable Construction and Refurbishment include project outset recommendations such as the inclusion of footpaths and cycle tracks to public transport services, and cycle racks in the hotel carpark.
The criteria for the Meeting 21 service include items on the hotel’s capacity to offer access to alternative transportation modes (public transport, green taxis, car sharing, etc.).
Greenhouse gas emissions
CO2 emissions
Carbon emission performance is measured in kilograms of CO2 per available room.
Tracking carbon emissions
In thousands of tonnes of CO2
• Total direct CO2 emissions
• Total direct CO2 emissions (like-for-like, 2012-2014)
• Total indirect CO2 emissions
• Total indirect CO2 emissions (like-for-like, 2012-2014)
In kg of CO2 per available room
• Direct and indirect CO2 emissions per available room
• Direct and indirect CO2 emissions per available room (like-for-like, 2012-2014)
220116
1,041
463
248116
1,381
457
245106
1,435
433
10.7 10.7 10.0
15.016.6 16.6
20132012
2014
2012 2013 2014
Number of applicable hotels 1,855 1,912 1,940
Response rate 79% 87% 88%
Number of audited hotels 1,465 1,663 1,708
Number of hotels (like-for-like, 2012-2014) 959 959 959
On a like-for-like reporting scope, and allowing for improvements in energy performance in 2014, the ratio of greenhouse gas emissions per available room fell significantly in 2014 (by 6.5% from 2013). The overall reduction from 2011 to 2014 is 3.8%.
Ozone-depleting cooling fluids
Cooling liquids in hotel air conditioning and cooling systems may leak and release gases with a particularly high global warming potential (GWP). Moreover, there may be a risk of coolant evaporation during maintenance operations or as a result of an accident. The 2014 environmental footprint study showed that such leaks and evaporation account for a minor 1% or so of our carbon footprint.
Registration Document 2014 65

CORPORATE RESPONSIBILITYEnvironmental commitments2
2.5.3. WATER
Water-related challenges
Because water is very unevenly distributed across the planet, the ability to access it varies widely from one region to another, making it a source of political and social tension, and therefore a major challenge for humanity. Accor uses a great deal of water in its hotels, which are sometimes located in water-stressed regions. We are therefore assertively managing our water consumption around the world. Close attention is also being paid to effluent discharge, so as to preserve downstream aquatic systems and maintain water quality for future use.
Water footprint
Accor’s environmental footprint data, updated in 2014, includes a life-cycle water footprint figure measuring net water consumption, i.e. water drawn less water returned to the environment. Total water use is 31 million cubic meters. It breaks down into three main items: water used in the farming activities behind the provision of food services (39%); water used for generating the energy used in hotels (cooling in fuel-fired and nuclear power plants, etc.) (36%); and water used in hotels (showers, toilets, kitchens, swimming pools, gardening, etc.) (14%) (1).
The figures highlight two main ways of reducing the Group’s water footprint: directly, by managing hotels’ water and energy consumption, and indirectly, by sourcing in favor of more water-efficient farming practices.
Breakdown of Accor’s water footprint by source(i.e. 31M m3)
• Food and beverage
• Onsite energy consumption
• Onsite water consumption
• Other (room equipment, cooling units, waste management, office equipment, hotel maintenance, employee commutes, external laundry services, construction and renovation)
36%
11%
14%39%
Management of water-stressed regions
UN-Habitat defines water stress as the inadequate supply of water of satisfactory quality to meet the needs of people and the environment. More precisely, it is expressed as the ratio of annual water withdrawals to total available annual renewable supply. So the lower the figure, the lower the stress on resources. Although water-stressed regions are already home to many people, the percentage of the global population living in one is expected to rise by 35%, to around 2.8 billion people, by 2025.
Since 2013, Accor carries out a yearly review of its exposure to water stress risk, measuring the risk level of each hotel on the basis of geographical location using the database in the WRI (World Resource Institute) Aqueduct system, one of today’s two leading water risk analysis systems. The results of the review are entered in the OPEN application to inform hotels of their exposure to water stress risks and thereby encourage moderate- and high-risk hotels to step up their action plans on water consumption management.
Breakdown of owned, leased and managed hotels located in water-stressed levels
• Drylands
• Very high water stress (>80%)
• High water stress (40%-80%)
• Moderate to high water stress (20%-40%)
• Low to moderate water stress (10%-20%)
• Low water stress (<10%)
• No data
33%
26%
15%
17%1%
14%
20%
7%
The results show that only 1% of Accor Group hotels are located in drylands. However, 33% of Accor hotels (948 in all) are located in areas of “high” water stress risk or above, with 17% in areas of “very high” risk. The locations most concerned are in France (160 hotels), Australia (111), the UK (106), China (70), Spain (66), Belgium (46), Germany (39), Indonesia (35) and Morocco (29).
(1) Net water consumption in hotels represents 4.5 million cubic meters of the 34 million cubic meters gross consumption (see page 67). Wastewater from the hotels accounts for the difference.
Registration Document 201466

2
CORPORATE RESPONSIBILITYEnvironmental commitments
When this geographic water risk analysis is compared with hotel water use data, it appears that the most critical regions are located in Europe and Asia-Pacific:
�� though hotels in Europe are generally water-efficient, the region is home to nearly 500 hotels deemed to be in a high or extremely high water-stressed situation. The European region therefore deserves special attention;
�� in Asia-Pacific, there are fewer hotels in critical regions (around 270, of which nearly 70 in China), but more attention is being paid to improving water use ratios, which still offer potential for optimization;
�� Accor is especially attentive to hotels in Australia, which appear liable to face heightening water stress in the year to come.
This new approach to examining water consumption profile will help Accor focus its action plans on areas at risk. Particular attention will be paid to water use trends at the hotels concerned. Water stress analysis data is factored in when setting water consumption reduction targets hotel by hotel, along similar lines to the process for setting energy consumption reduction targets (see page 63).
Water use
Water use management program
Over the period 2006 to 2010, Accor achieved a 12% reduction in water consumption, through major efforts at its hotels worldwide. Further improvements are sought under the PLANET 21 program, targeting a 15% reduction in water use per guest in Accor’s owned, leased and managed hotels over the period 2011-2015. Efforts here include attentive management of hotel performance, through monthly tracking, regular reviews, internal benchmarking, etc. Implementation of Charter 21 also helps improve performance, by developing best practices such as fitting flow regulators and sub-meters (for accurate monitoring), abolishing equipment that wastes water and installing dual-flush toilets.
Other programs that contribute to conserving water resources in upstream farming operations include the issue of procurement guidelines (on compliance with organic farming specifications, for example) and the Plant for the Planet initiative (see page 69).
Water performance in 2014
Accor tracks its hotels’ intrinsic performance by measuring water consumption in liters per guest, i.e. liters per room night.
Tracking water use
In million cubic meters
• Total water use
• Total water use (like-for-like, 2012-2014)
Liters per night
• Average liters
• Average liters (like-for-like, 2012-2014)
25
12.9
32
12.8
34
215221
230
305296294
12.7
20132012
2014
2012 2013 2014
Number of applicable hotels 1,855 1,912 1,940
Response rate 79% 87% 88%
Number of audited hotels 1,465 1,663 1,708
Number of hotels (like-for-like, 2012-2014) 959 959 959
On a like-for-like reporting basis, water consumption in liters per guest fell by 5.6% from 2011 to 2014, continuing the downward trend observed from 2006 to 2010. Per-guest consumption at hotels in “very high” and “dryland” water stress risk regions showed a similar fall, of 5.3% from 2011 to 2014.
Registration Document 2014 67

CORPORATE RESPONSIBILITYEnvironmental commitments2
Discharges and treatment
Wastewater
The Group’s environmental impact study (updated in 2014) looked at the impact its hotel operations may have on groundwater quality. This impact is assessed in terms of the eutrophication phenomenon that characterizes deterioration in an aquatic environment. In the sea, eutrophication is measured as nitrogen saturation, expressed in kilograms of nitrogen equivalent (kg N-eq). In rivers and lakes, it is measured as phosphorous saturation, expressed in kilograms of phosphorus equivalent (kg P-eq). On a life-cycle basis, marine eutrophication as a result of Accor’s hotel activities represents 4,569 kg N-eq and freshwater eutrophication 10,345 kg P-eq.
Breakdown of Accor’s eutrophication impact by source MARINE EUTROPHICATION (i.e. 4,569 kgN-eq)
• Food and beverage
• Onsite energy consumption
• Construction and renovation
• Room equipment
• Other (room equipment, cooling units, waste management, office equipment, hotel maintenance, employee commutes, external laundry services, onsite water use)
11%
4% 3%4%
78%
FRESHWATER EUTROPHICATION (i.e. 10,345 kgP-eq)
• Onsite energy consumption
• Other (food services, room equipment, cooling units, waste management, office equipment, hotel maintenance, employee commutes, external laundry services, construction and refurbishment, onsite water use)
4%
96%
The environmental impact study shows that nitrogen saturation arises chiefly (78%) from the farming activities behind the provision of Accor food services, and from livestock farming activities in particular, with meat, milk and eggs accounting for 66%. Phosphorous saturation arises chiefly (96%) from generation of the energy used by Accor hotel activities, the bulk of this (95.6%) being from nuclear power plants.
Accor can reduce the negative impact on groundwater quality by ensuring that all hotel wastewater effluent is systematically treated, either by connection to a collective treatment plant (such as a municipal treatment plant), or onsite in an independent treatment plant.
More environmentally sensitive products
The extensive Groupwide use of eco-labeled cleaning products sourced from a single certified supplier (see page 52) has significantly reduced our impact on the environment.
In addition, the Mercure, Novotel, ibis Styles and ibis brands, for example, now offer complimentary items certified with the EU Ecolabel, Ecocert or Nordic Ecolabel.
2.5.4. LOCAL ENVIRONMENTAL IMPACTS
Biodiversity
Accor assessed its biodiversity footprint for the first time in 2014, evaluating the impact of its activities on ecosystems (i.e. species and their habitats). It was estimated at 4 billion pdf.m2.y. The indicator used to measure biodiversity footprint is expressed in «pdf.m2.y» – i.e. the «potentially disappeared fraction of species» over a unit of surface area (a square meter) over a unit of time (a year). For example, one pdf.m2.y corresponds to the elimination of all biodiversity over a square meter of primary forest and 0.89 pdf.m2.y corresponds to the destruction of one square meter of secondary forest.
The Group’s biodiversity footprint stems, to a very large extent (77%), from the farming activities behind the provision of Accor’s food services. This is primarily because most of the impacts on biodiversity are a direct consequence of land use (and therefore deforestation) and, for farming operations, the use of pesticides. The Group’s impact on biodiversity from construction and renovation is moderate (13%), because the great majority (75%) of Accor Group hotels are located in urban and suburban areas. Pressure on biodiversity arising from hotels’ energy use is estimated at 8%.
Registration Document 201468

2
CORPORATE RESPONSIBILITYEnvironmental commitments
Breakdown of Accor’s biodiversity impact by source (i.e. €4bn PDF.m2.y)
• Food and beverage
• Construction and renovation
• Onsite energy consumption
• Other (room equipment, cooling units, waste management, office equipment, hotel maintenance, employee commutes, external laundry services, onsite water use)
13%
2%8%
77%
Accor is a strong proponent of the preservation of biodiversity, an important factor in the tourist appeal of many geographies. The Group’s commitment on biodiversity is primarily expressed through its Plant for the Planet program (see details below). In addition, Accor is developing its organic foodstuff sourcing and by the end of 2015 all endangered sea species will have completely disappeared from its hotel menus.
Plant for the Planet
Under its Plant for the Planet program, Accor encourages guests to reuse their towels when they stay more than one night in a hotel by promising that savings will be used to finance tree planting. (Half of the savings are invested in planting projects). Unique to Accor, the initiative goes beyond the usual towel reuse programs deployed by other hospitality groups by requiring participating hotels to donate money to agroforestry projects.
In addition, the program also enables us to address another key environmental concern raised by the use of towels and the resulting laundry operations, namely water use and the treatment of detergent wastewater. In this regard, trees play a widely acknowledged role, both in fixing groundwater reserves and absorbing part of the pollution.
Accor’s role as a food services provider means that upstream farming operations are one of the main sources of the Group’s indirect water use, an observation revealed by the environmental footprint study carried out in 2011.
Because the 2011 environmental footprint study revealed that upstream farming operations were one of the major sources of our indirect water use, it was natural to focus the reforestation program on agroforestry projects.
Projects supported under the Plant for the Planet program address the three key sustainable development issues, which makes it a particularly symbolic program: environmental benefits (preservation of ecosystems and endangered endemic species, preservation of water resources, regeneration of non-productive soils, anti-erosion
measures, carbon entrapment, etc.); societal benefits (increase and diversification of revenues in populations involved in the projects, new local social cohesion dynamics); social benefits (including active participation of Accor Group employees, a decisive factor in the program’s success).
Plant for the Planet gained ground in 2014. A total of 1,532 hotels (46% of Group hotels, excluding the hotelF1 banner) now take part in the program, which financed the planting of close to 452,000 trees in 2014 for a budget of around €1.5 million. More than 4 million trees have been planted since the operation began in 2009. The Accor Group and its hotels finance more than 150 reforestation and agroforestry projects in 21 countries, including a new project started in Germany in 2014. In 2015, Accor will be extending program coverage across hotels throughout the Accor Group, with the objective of 60% participation.
Selection and startup of new initiatives is handled by Accor’s partner Pur Projet, as are program management, communications, and high-precision monitoring of the results obtained. All hotels involved in the Plant for the Planet program receive full information on the projects financed through their aid: location of plots concerned, species planted, farmers helped, number of trees planted, etc. Since 2014, guests belonging to the Le Club Accorhotels loyalty program can also participate directly in Plant for the Planet by donating their loyalty points to tree planting operations.
A 2014 evaluation carried out by Accor to determine the impact of its Plant for the Planet program found that the projects already under way would have a positive impact of 450,000 tonnes of CO2 equivalent on climate change and of 560 million pdf.m2.y on biodiversity over a 100 year period.
Accor aims to support a reforestation project in the majority of our host countries by 2015. In addition, the hotels can finance local projects in association with small farmers looking for agroforestry opportunities.
Percentage of hotels participating in the Plant for the Planet program
2015 objective: 60%
39% 41% 46%
20132012
2014
2012 2013 2014
Number of applicable hotels* 3,331 3,401 3,300
* Excluding hotelF1.
Registration Document 2014 69
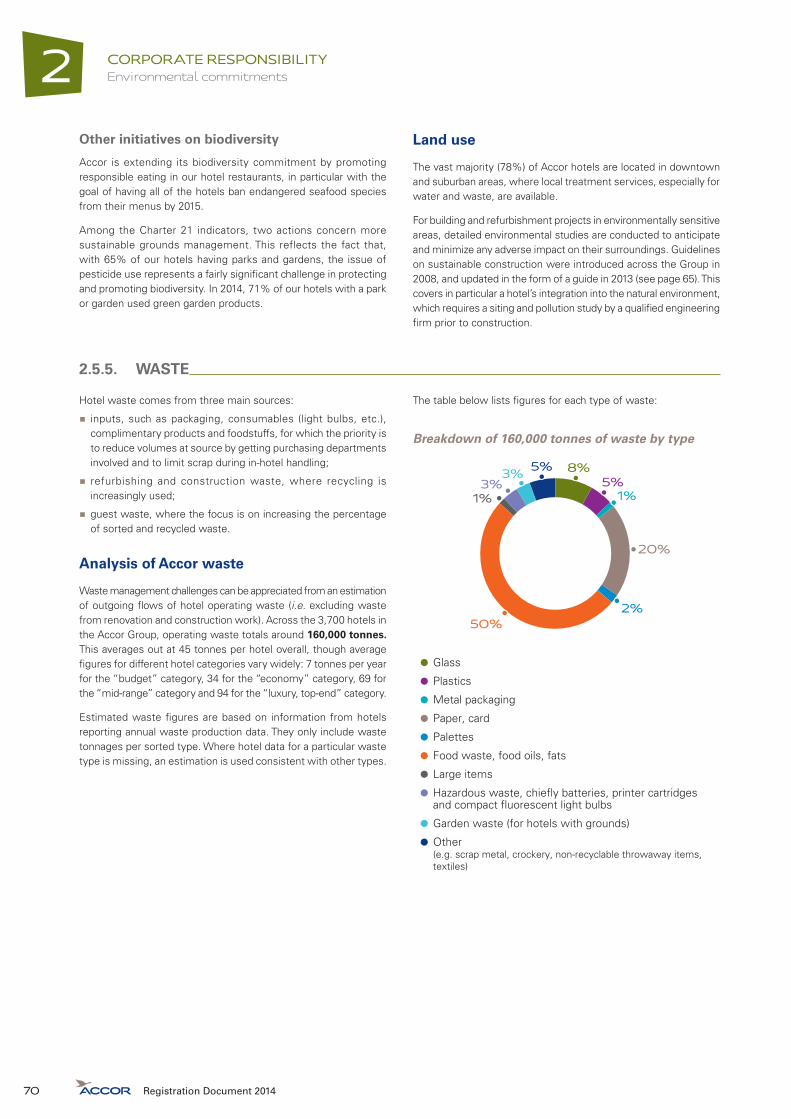
CORPORATE RESPONSIBILITYEnvironmental commitments2
Other initiatives on biodiversity
Accor is extending its biodiversity commitment by promoting responsible eating in our hotel restaurants, in particular with the goal of having all of the hotels ban endangered seafood species from their menus by 2015.
Among the Charter 21 indicators, two actions concern more sustainable grounds management. This reflects the fact that, with 65% of our hotels having parks and gardens, the issue of pesticide use represents a fairly significant challenge in protecting and promoting biodiversity. In 2014, 71% of our hotels with a park or garden used green garden products.
Land use
The vast majority (78%) of Accor hotels are located in downtown and suburban areas, where local treatment services, especially for water and waste, are available.
For building and refurbishment projects in environmentally sensitive areas, detailed environmental studies are conducted to anticipate and minimize any adverse impact on their surroundings. Guidelines on sustainable construction were introduced across the Group in 2008, and updated in the form of a guide in 2013 (see page 65). This covers in particular a hotel’s integration into the natural environment, which requires a siting and pollution study by a qualified engineering firm prior to construction.
2.5.5. WASTE
Hotel waste comes from three main sources:
�� inputs, such as packaging, consumables (light bulbs, etc.), complimentary products and foodstuffs, for which the priority is to reduce volumes at source by getting purchasing departments involved and to limit scrap during in-hotel handling;
�� refurbishing and construction waste, where recycling is increasingly used;
�� guest waste, where the focus is on increasing the percentage of sorted and recycled waste.
Analysis of Accor waste
Waste management challenges can be appreciated from an estimation of outgoing flows of hotel operating waste (i.e. excluding waste from renovation and construction work). Across the 3,700 hotels in the Accor Group, operating waste totals around 160,000 tonnes. This averages out at 45 tonnes per hotel overall, though average figures for different hotel categories vary widely: 7 tonnes per year for the “budget” category, 34 for the “economy” category, 69 for the “mid-range” category and 94 for the “luxury, top-end” category.
Estimated waste figures are based on information from hotels reporting annual waste production data. They only include waste tonnages per sorted type. Where hotel data for a particular waste type is missing, an estimation is used consistent with other types.
The table below lists figures for each type of waste:
Breakdown of 160,000 tonnes of waste by type
• Glass
• Plastics
• Metal packaging
• Paper, card
• Palettes
• Food waste, food oils, fats
• Large items
• Hazardous waste, chiefly batteries, printer cartridges and compact fluorescent light bulbs
• Garden waste (for hotels with grounds)
• Other (e.g. scrap metal, crockery, non-recyclable throwaway items, textiles)
2%
1%3%
3%
50%
8%5%
1%
20%
5%
Registration Document 201470

2
CORPORATE RESPONSIBILITYEnvironmental commitments
Food services account for more than 50% of the waste produced, in the form of oils and fats. Though some hotels do not have restaurants, they do nevertheless serve a breakfast, which also produces waste. The second biggest source of waste is packaging: card, paper, plastics (relatively limited). Hotels produce small amounts of hazardous waste.
Waste management and performance
Accor’s waste management efforts are today focused on the use of appropriate treatment processes for hazardous waste and on the optimization of sorting to increase the proportion of waste recycled. Charter 21 recommends sorting and recycling 12 categories of waste. The chart below shows the proportion of hotels that have set up this kind of sorting process.
Proportion of hotels practicing waste recycling
• 2013
• 2014
Batteries
Printer cartridges
Fluorescent tubes and compact fluorescent bulbs
Paper/card
Glass
Ionic fire detectors
Food oils
Fats (via wastewater grease trap)
Plastics
Metal packaging
Food waste
Garden waste (for hotels with grounds)
98%
98%
94%
98%
94%
96%
90%
91%
87%
89%
86%
88%
92%
91%
85%
83%
74%
75%
63%
66%
47%
48%
66%
66%
Data on the amounts of waste produced and the percentage of hotels practicing waste sorting yield a figure of around 60% for the proportion of waste sorted by hotels for recycling or for appropriate treatment (for special waste such as batteries and printer cartridges).
In 2014, Accor launched a project for redefining its waste management policy and optimizing its methods for tracking waste management performance. These new arrangements, for rollout in 2015, will contribute to Accor’s quest for continuous performance improvement, and bring more reliable tracking of the quantities of waste produced and sorted.
Registration Document 2014 71

CORPORATE RESPONSIBILITYMeasuring and assessing performance2
2.6. MEASURING AND ASSESSING PERFORMANCE
2.6.1. CSR INDICES AND STANDARDS
Accor is included in several internationally recognized indices and standards and its actions in the areas of sustainable development and human resources have been honored by numerous awards.
In recognition of its commitment to sustainable development, Accor is included in four major SRI indices and standards:
�� Euronext Vigeo Eurozone 120 (formerly ASPI): developed by European rating agency Vigeo, the Euronext Vigeo 120 index comprises the world’s top 120 listed companies evaluated in terms of their performance in corporate responsibility;
�� FTSE4Good: developed by the UK company that created the FTSE index, the FTSE4Good series measures the performance of companies that meet globally recognized corporate social responsibility standards. It uses rating profiles established by the London-based agency EIRIS, one of the main providers of environmental, social, governance (ESG) research for responsible investors in Europe;
�� Ethibel Sustainability Indexes (ESI): these indices provide an overview of the financial performance of the world’s leading companies in terms of corporate social responsibility. Their criteria were defined by Belgium-based consultancy Ethibel in partnership with the financial rating agency Standard & Poor’s.
Since 2006, Accor has participated in a survey conducted by the Carbon Disclosure Project on behalf of 475 institutional investors managing more than 55 trillion dollars in assets. This international organization asks leading corporations to report on their climate change strategies, their approach to carbon cost imposition and their greenhouse gas emissions performance. Accor Group results show a continuous rise since 2010. In 2014, Accor obtained a rating of 88C, up from 85B in 2013.
For its 2014 Registration Document, Accor applies the principles of the Global Reporting Initiative, and declares its report “in accordance” with the G4 Guidelines, Core Option. A table matching GRI-G4 alongside Accor indicators is available on the Accor website (www.accor.com/sustainable development/management and performance).
2.6.2. AWARDS AND RECOGNITION
In 2014, Accor was awarded a number of international prizes.
Sustainable development – PLANET 21
In January 2015, Accor was named Industry Mover / Silver Class in the Sustainability Yearbook 2015 published by the RobecoSAM asset management firm.
In the UK, the Plant for the Planet program was included in Sustainability Case Studies, a widely circulated (27,000 companies) e-book listing the best sustainable development initiatives.
In Romania, the Mihai Eminsecu Trust, local partner of the Plant for the Planet program, won two prizes – “Environmental Protection” and “Project Impact” – at the 12th Civil Society Gala, for its project “A Forest for Every School”, developed with the Accor Group.
In the Asia-Pacific region, Accor’s environmental program won the gold medal awarded by the Pacific Asia Travel Association (PATA), for the second year running.
For the third year running, Accor Brazil won the Caio Awards in 2014 for the ECPAT “Don’t Look Away” campaign on child protection run during the World Cup as part of the WATCH program.
The four Mercure hotels in South Africa received recognition for their five years of Fair Trade Tourism certification, covering: fair pay, good working conditions, fair trading practices, fair distribution of profits, and proper observance of human cultural and environmental rights.
Human Resources
For the 17th time, the Great Place To Work Institute named Accor “Best Place to Work” in Brazil, and awarded it second place in its ranking of “Best Multinational Companies in Latin America”.
In Carta Capital magazine’s listing of “The Most Admirable Companies in Brazil”, Accor finished first in the Hospitality category. It has led this category for five years, and figured in the ranking for fourteen.
Accor won first prize for Leadership Development at the Human Resources Excellence Awards 2014 ceremony in Singapore.
The HR Idea survey rates Accor as the French company with the best digital HR strategy: Accor topped the ranking of CAC 40 companies in the HR Idea 2014 survey analyzing digital performance in human resources.
PATA awarded Accor its gold medal in the “Education and Training for Building Futures” category, for the program developed by Accor New Zealand to improve access to training and employment for young people in difficulty.
Registration Document 201472

2
CORPORATE RESPONSIBILITYMeasuring and assessing performance
2.6.3. METHODOLOGICAL REVIEW
This section explains the methodology applied in our corporate social responsibility reporting process. This process is based on a reporting protocol that provides full, detailed specifications on responsibilities, Accor definitions, methods for measuring data and indicators, and areas at risk requiring particular attention. It also describes country-specific features, which are frequently updated. The protocol in French and English has been sent by headquarters to everyone responsible for the reporting process and is available for translation into other host country languages.
Performance is measured through four types of indicator:
�� employee relations indicators;
�� Charter 21 indicators, which cover the environmental and social responsibility actions deployed in the hotels;
�� indicators used to manage water use, energy use and greenhouse gas emissions;
�� additional employee-relations indicators and sustainable procurement indicators.
The reporting period is January 1 to December 31, 2014.
Human Resources
Quantitative data is reported Groupwide, on five broad issues: workforce structure, employee movements, compensation, training and working conditions.
Qualitative data is reported at the end of each yearly period.
In 2014, employee data reporting was updated for harmonization with internal and external indicator requirements. Some calculation methods were adjusted to bring figures into line with the definitions in French legislation as regards degrees of gravity of accidents at work, and number of hours of training.
Quantitative reporting
Reporting scope and frequency
Employee data are reported for:
�� people who work in head offices, owned hotels and leased hotels, who are direct employees of the Accor Group, including apprentices;
�� people who work in the managed hotels, who are under Accor management but are not direct employees of the Accor Group. The only exception concerns a certain number of hotels where direct Accor employees are on assignment.
Employee data do not include:
�� employees of owned, leased and managed hotels closed as of December 31, 2014;
�� employees of owned, leased and managed hotels opened after November 30, 2014;
�� contingent workers, interns and temporary workers;
�� employees of franchised hotels or units in which Accor owns an equity interest but does not exercise any management responsibility (commission-based management contracts and Adagio Aparthotels).
In 2014, indicator data could not be reported from five managed hotels in Germany and 25 managed hotels in France.
Because of inconsistencies on closure of the employee data reporting period, data from the Cuba head office was not included in the 2014 data consolidation. In 2013, there were five employees at this head office.
Reporting application
Employee data are reported and the related indicators managed via the proprietary HR DATA application that was revamped in 2009 and redeployed in 2010. The application has been steadily upgraded with new features to enhance user-friendliness and improve the reliability of the reported data.
In 2014, Accor began work on a project for updating the processes and methods it uses for collecting and analyzing human resources data. The project seeks to automate data collection from payroll systems, for guaranteed consistency. Initial benefits from the project will appear from 2016.
Reporting and control process
The corporate reporting process is defined in the human resources reporting protocol, which applies to everyone involved in the reporting chain, from headquarters to hotels. It provides a detailed, comprehensive description of Group procedures and definitions, the methods used to measure data and indicators, and the areas at risk that require particular attention. It also describes country-specific features, which are frequently updated.
The protocol in French and English has been sent by the corporate Human Resources Department to everyone responsible for the reporting process.
Reporting officers have been designated at three levels to collect, enter, verify and validate employee data, in compliance with the human resources reporting protocol:
�� hotel:
�y collect and validate hotel data,
�y confirm the completeness of the data;
�� country organization:
�y confirm the completeness of the data,
�y verify and validate the data reported from all of the hotels in its scope of operations;
�� corporate:
�y coordinate the consolidation of data from across the Group,
�y confirm the completeness of the data,
�y ensure the consistency of reported data and correct any errors after verification with the regional manager.
Registration Document 2014 73
CORPORATE RESPONSIBILITYMeasuring and assessing performance2
Indicators
WorkforceWorkforce indicators are measured and disclosed on the basis of the monthly average number of employees.
In many host countries, the definition of a permanent or non-permanent employee is not the same as under French law, which means that certain special cases can impact the consolidated figures. Because of the many inconsistencies found across globally consolidated data, it was decided to discontinue Groupwide consolidation of this item from 2014.
Disabled employees are only included as such if officially recognized as such in the countries where they work. Accor therefore considers that this indicator might slightly underestimate the number of disabled employees working for the Group.
To estimate the number of employees in franchised hotels, the number of rooms in the franchised hotel base has been multiplied by the average number of actual employees per room in our owned, leased and managed hotels. These estimated figures have been adjusted to reflect the characteristics of each brand and of the country or region where the owned, leased, managed and franchised hotels are located. For example, an ibis hotel requires many fewer employees than a Sofitel.
For 2014, the job category categorization was reviewed to accommodate the function of “senior executive”. The Group standard was reviewed to clarify the responsibility levels for this personnel category:
�� a “middle manager” is an employee who manages a team or a process like hiring or annual performance reviews, and/or who holds a high level of expertise. This definition does not correspond to the legal status of a manager (cadre) in France. Each country’s human resources department sets its own definition based on local labor legislation, the characteristics of each job and the hotel brand;
�� the term “senior executive” refers to a hotel General Manager or a member of the head office personnel holding substantial responsibilities (e.g. an Executive Committee member). The definition is close to that of “cadre dirigeant” in France.
Employee movementsEvery employee movement during the period is reported, regardless of the type of job contract. A departure is not recorded as a movement in the following cases:
�� when an employee changes from a non-permanent to a permanent contract;
�� when a non-permanent contract is renewed without interruption;
�� when an employee transfers to another position in the Group.
Separations due to job abandonment are recorded as dismissals, in as much as such abandonment is at the employee’s initiative whereas termination is at the employer’s initiative.
PromotionsAn indicator on promotions was added to the quantitative reporting for 2014 and an improvement program on this indicator will be phased in from 2015.
For the Accor Group, promotion is defined as necessarily involving changes in at least two of the following points in the employee’s profile: compensation (on top of annual rise), job function (title), and job category (in hierarchy).
The number of promotions thus expresses the number of changes in job function, pay or job category within a unit over a given period. When an employee leaves one hotel to take up a higher position in another of the Group’s hotels, this is not counted as a promotion.
Health and working conditionsA part-time employee is one who works fewer than a country’s legal working hours, without including any overtime. Variable-time contracts may be counted in different ways in different countries.
AbsenteeismDays absent are reported in number of business days, as defined by local labor legislation.
Three categories are considered:
�� medical leave (including leave for illness of the employee, illness of the employee’s child, and work-related illness). This category does not include maternity or paternity leave;
�� workplace or commuting accidents;
�� unauthorized leave. This does not give rise to any direct costs for the Group because it covers unauthorized absences without pay, depending on local labor laws. This means that their number may be underestimated, because unpaid leave is not always tracked by local human resources departments.
The method for calculating medical leave changed from 2013 to 2014. There is now a separate category for time off related to workplace or commuting accidents. However, to compare figures with the 2013 indicator value, we can add the figures for the “medical leave” and “workplace or commuting accidents” categories in 2014.
The employee absences indicator is gradually being improved through the overhaul of the HR data collection process. As communicated to the relevant authorities, legislation on how to determine the cause of employee absences differs among Accor’s host countries, resulting in a lack of consistency in the consolidated data.
The lost-time injury rate corresponds to the number of lost-time incidents (as defined by local legislation) per million hours worked, with lost-time considered to be at least one day.
In 2014, this figure is calculated on the sole basis of injuries arising at the place of work. In 2013, it was calculated on the basis of injuries arising at the place of work or during travel, which means that the two figures are not properly comparable.
Registration Document 201474
2
CORPORATE RESPONSIBILITYMeasuring and assessing performance
In Switzerland, local legislation requires that the figure for accidents at work include all accidents during the year, regardless of whether or not they are work-related. The lost-time injury rate indicator is biased by this local factor.
Hours worked are counted differently in different countries, and by different systems: payroll scheduling, manual data consolidated subsequently, or annual reporting system. These differences mean this item is not totally reliable.
The incident severity rate is calculated as the number of injury-related absences divided by the number of hours worked multiplied by a thousand.
The incident severity rate is calculated according to the number of absences related to workplace or commuting accidents. This item is reported separately for the first time in 2014; in coming years, work will be done on improving data consistency here.
Fatal workplace accidents are included in the number of lost-time incidents. An accident is considered fatal if the employee dies within 365 days following the incident.
TrainingFrom 2014, training is measured in number of hours. Accor believes that this is the most appropriate calculation method in light of the new training methods used by the Group. The number of training hours reported includes courses conducted by Académie Accor, Accor managers and contract service providers for hotels and head offices.
The number of hours’ training is counted differently by different local systems.
In addition, some training provided in hotels is omitted from group reporting in countries where centralized systems are used; training-specific information systems do not track job take-up training or non-brand-program training provided by management using specialist equipment provided by Académie Accor.
For the number of employees having attended at least one training course, each trainee is counted once, even if he or she attended several courses during the reporting period. However, because people are often counted every time they attend a course, this tends to over-estimate the total number.
The breakdown of training hours by job category was discontinued in 2014. The complexity entailed by this breakdown tended to impair data reliability.
Qualitative reporting
Qualitative reporting is requested of the members of the international HR network involved in quantitative reporting. In 2014, qualitative reporting covered 1,764 hotels, which corresponds to 93% of the quantitative reporting scope (in number of hotels).
Quantitative reporting is carried out using an online survey system, and covers five subjects: labor relations dialogue, compensation, health and safety, local communities, and human and labor rights.
Hotel General Managers from internal promotion
The figure for the number of hotel General Managers in this position as a result of internal promotion is an instantaneous figure on December 31, 2014. It comes from declarations made by members of the international HR network involved in quantitative reporting. Data collection covered 69% of owned, leased and managed hotels in the Accor Group on December 31, 2014.
Charter 21
Reporting scope and frequency
The Charter 21 indicators cover all of the owned, leased, managed and franchised hotels, except for:
�� hotels that joined the Accor network after September 15 of the reporting year;
�� hotels that were no longer part of the Accor network as of December 31 of the reporting year;
�� Thalassa sea and spa facilities, whose data are often reported with their host hotel’s;
�� hotels that were closed for renovation or other reasons during the reporting period or that suffered an exceptional event, such as a flood or an earthquake, that disrupted their operations during the reporting period;
�� the Adagio Aparthotels, which do not apply the Accor Charter 21 and are consolidated by Pierre et Vacances SA.
Charter 21 indicators are reported annually.
Indicators
Charter 21 data are reported by the hotels concerned. Results are expressed as a percentage comparing the number of hotels implementing a given action to the total number of hotels applying Charter 21. Some actions apply only to hotels equipped with special facilities, such as a restaurant or laundry. In this case, the percentage of hotels is calculated based solely on the total number of hotels concerned.
Data collection and control
Hotels enter Charter 21 data annually and validate them in the OPEN application. The data then go through four checks:
�� the person in charge of reporting at the hotel uses the Charter 21 Guide to check that the actions in question have effectively been carried through;
�� the Charter 21 reporting office for the country tracks the progress of reporting and checks compliance with deadlines, fit with definitions, and data consistency;
�� the corporate Charter 21 reporting officer consolidates and checks the data;
�� quality audits are performed every year in the hotels, covering the ten actions corresponding to the Charter’s Bronze level.
Registration Document 2014 75
CORPORATE RESPONSIBILITYMeasuring and assessing performance2
Water and energy
Scope of reporting
The scope of reporting covers all of the owned, leased or managed Accor-brand hotels open at December 31 of the reporting year, except for:
�� hotels that are being gradually integrated into the Accor network or are incapable of measuring use:
�y hotels that joined the network after September 15 of the reporting year,
�y new acquisitions during the reporting year that are not under an Accor banner,
�y hotels closed for renovation during the reporting period,
�y Thalassa sea and spa facilities, whose data are often reported with their host hotel’s;
�� independently operated units or structures and franchised hotels:
�y ibis budget, hotelF1 and Formule1 hotels operated under commission-based management contracts,
�y Mercure Appartement in Brazil,
�y ancillary in-hotel activities, such as retail outlets and residential units, that are not managed by Accor (assuming their data can be clearly segregated).
Indicators
�� Energy use:
�y reported energy use is the final amount of energy used by the hotel;
�y reported energy is the total amount of energy used over the year by the hotels, regardless of source (electricity, gas, etc.) or purpose (lodging, food services, etc.);
�y total energy use is expressed in MWh;
�y fuel energy is calculated on the basis of each unit’s heating value (HV);
�y use data reported by the hotels are expressed by type of energy.
�� Water use:
�y reported water use is the total amount of water used over the year by the hotels, regardless of purpose (food services, grounds watering, etc.);
�y water from hotel pumping facilities is also measured, if they are metered;
�y recycled rain or wastewater is measured, if the facilities are metered;
�y total water use is expressed in cubic meters.
�� Greenhouse gas emissions:
�y direct emissions correspond to fuels burned at the hotels and indirect emissions correspond to the electricity used by the hotels, and the heat and air conditioning supplied by urban heating and cooling networks;
�y energy use is converted using the latest emission factors of the GHG Protocol (available online at www.ghgprotocol.org);
�y total greenhouse gas emissions are expressed in tonnes of CO2 equivalent.
Data collection and control
Each hotel enters its monthly water and energy consumption data and validates them in the OPEN reporting application. The data are then checked by the country or regional organization and again at Group level over the first 11 months of the reporting year. They are re-checked over the entire twelve months at each level (country/region and Group).
Hotel carbon emissions are calculated from previously reported energy use data, as follows:
�� direct emissions correspond to the gas and fuel oil burned in hotel boilers;
�� indirect emissions correspond to the electricity used by the hotels, as well as the heat and air conditioning supplied by urban heating and cooling networks.
Greenhouse gas emissions for both power generation and fuel use are calculated on the basis of Greenhouse Gas Protocol initiative coefficients (www.ghgprotocol.org).
Renewable energies
Solar production of hot water (expressed in GWh) is calculated under the following assumptions:
�� if 2013 figures on solar panel surface area and production are available, along with 2014 figures on solar panel surface area, then 2014 production = 2014 panel surface area x 2013 production / 2013 panel surface area;
�� if figures are only available for the 2014 panel surface area, then 2014 production = 2014 panel surface area x 500 kWh/m2;
�� if figures are only available for the 2013 panel surface area and 2013 production, then 2014 production = 2013 production;
�� if no data is available for 2014 or 2013 (panel surface area, production), then 2014 production = 0.
Registration Document 201476

2
CORPORATE RESPONSIBILITYMeasuring and assessing performance
Purchasing
Scope of reporting
The indicator tracking the Group’s consolidated volume of purchases (€3.5 billion in 2013) covers all of the hotel operating structures and includes purchases from certified suppliers, as well as estimated purchases from non-certified suppliers by the 19 country Procurement Departments.
The other indicators cover purchases from certified suppliers.
Data are reported from the 19 Procurement Departments representing the largest purchasing volumes, including the Corporate Procurement Department.
The 17 country procurement departments that reported data were: Australia, New Zealand, Poland, Portugal, Belgium & Luxembourg, the Netherlands, Hungary, Italy, Brazil, Morocco, Spain, France, Germany, the United Kingdom and Switzerland. Data was also reported by the Corporate Purchasing Department.
The contracts reported in 2014 ran for various times depending on each country organization’s local purchasing procedures. Reporting standards are now being harmonized to deliver consolidated data for contracts in effect over a full-year period.
Indicators
�� REACH: percentage and number of suppliers concerned by REACH having signed a REACH statement.
�� Procurement Charter 21: percentage and number of suppliers for which the current or 2010 Procurement Charter 21 has been signed.
�� Assessing supplier corporate social responsibility performance:
�y number of audits performed with EcoVadis or other third-party during the year;
�y number of remedial action plans requested from suppliers during the year.
Data collection and control
Depending on the indicator, data may be reported by suppliers, buyers (via online reporting applications) and/or third parties.
They are initially checked by the country Procurement Manager, who ensures that they are accurate and consistent with the rest of the information.
They are then re-checked by the corporate sustainable procurement reporting manager.
Purchasing audits review compliance with the three sustainable procurement issues described in the Indicators chapter.
Plant for the Planet
Reporting scope and frequency
Plant for the Planet indicators cover all of the owned, leased, managed and franchised hotels participating in the program (excluding the budget segment, hotelF1).
Data are collected based on the payment campaigns conducted in June and December of each year.
Indicators
�� Number of hotels participating: This figure is based on the number of payments received by Pur Projet and its partners during the year.
�� Number of trees financed: This figure is calculated by dividing the sum of donations received by Pur Projet and our traditional NGO partners in the Plant for the Planet program by the unit cost of the trees, as reported by these same partners.
Data control
Since 2013, the indicators have been controlled directly by Pur Projet, Accor partner in charge of supervising and managing the Plant for the Planet program.
Correspondence with Global Reporting Initiative
For its 2014 Registration Document, Accor applies the principles of the Global Reporting Initiative, and declares its report “in accordance” with the G4 Guidelines, Core Option. A table matching GRI-G4 alongside Accor indicators is available on the Accor website (accor.com/sustainable development/management and performance).
Registration Document 2014 77

CORPORATE RESPONSIBILITYMeasuring and assessing performance2
The Accor Group evaluates (on in own behalf and on that of its internal and external stakeholders) the materiality of GRI-G4 aspects as follows:
Stakeholder
Employees
Partners &
investors Guests SuppliersIndustry players
Government adminis-trations
and institutions
Local commu-
nitiesEnviron-
ment
GRI4 aspect Accor internal external external external external external external external
Economic performance ● ● ● ● ● ● ● ● ●
Presence on market ● ● ● ● ● ● ● ● ●
Energy ● ● ● ● ● ● ● ● ●
Emissions ● ● ● ● ● ● ● ● ●
Products and services ● ● ● ● ● ● ● ● ●
Compliance ● ● ● ● ● ● ● ● ●
Employment ● ● ● ● ● ● ● ● ●
Employer/employee relations ● ● ● ● ● ● ● ● ●
Training and education ● ● ● ● ● ● ● ● ●
Diversity and equal opportunity ● ● ● ● ● ● ● ● ●
Local communities ● ● ● ● ● ● ● ● ●
Guest health and safety ● ● ● ● ● ● ● ● ●
Product and service labeling ● ● ● ● ● ● ● ● ●
● Material aspect.● Non-material aspect.
Registration Document 201478

2
CORPORATE RESPONSIBILITYMeasuring and assessing performance
2.6.4. INDICATOR TABLES
Employee-relations indicators
Employee-relations indicators are presented by region when their change is highly dependent on local conditions. The other indicators are presented by operating structure.
France
Europe (excluding
France/Mediterranean)
Mediterranean, Middle East and Africa Asia-Pacific Americas Total
2013 2014 2013 2014 2013 2014 2013 2014 2013 2014 2013 2014
Owned and leased hotels employees 15,961 15,462 17,529 16,915 5,827 5,387 3,679 3,640 5,765 6,827 48,761 48,231
Upscale luxury hotels 2,126 2,362 2,004 1,922 1,492 1,408 518 486 988 1,551 7,127 7,729
Midscale hotels 6,317 5,849 9,498 9,013 2,127 1,857 1,257 1,331 2,005 1,850 21,205 19,900
Economy hotels 5,480 5,346 4,731 4,701 1,798 1,763 1,229 1,113 2,226 2,820 15,464 15,743
International head offices 960 887 1,296 1,279 411 359 675 710 546 606 3,888 3,841
Holding company – payroll employees 1,078 1,018 - - - - - - - - 1,078 1,018
Managed hotels – non-payroll employees 1,526 1,442 5,620 5,465 13,738 14,809 58,344 62,661 8,803 8,636 88,030 93,012
Upscale luxury hotels 819 859 1,295 1,399 7,538 8,071 24,524 33,018 2,944 3,092 37,118 46,439
Midscale hotels 662 547 3,343 3,042 4,490 4,891 29,771 24,618 5,044 4,308 43,310 37,406
Economy hotels 45 36 982 1,024 1,710 1,846 4,049 5,025 815 1,236 7,602 9,167
TOTAL EMPLOYEES 17,487 16,904 23,149 22,380 19,565 20,196 62,023 66,302 14,568 15,462 136,791 141,243
% under permanent contracts 86% N/A (1) 82% N/A (1) 73% N/A (1) 60% N/A (1) 96% N/A (1) 73% N/A (1)
% women 55% N/A (1) 55% N/A (1) 31% N/A (1) 44% N/A (1) 52% N/A (1) 47% N/A (1)
% men 45% N/A (1) 45% N/A (1) 69% N/A (1) 56% N/A (1) 48% N/A (1) 53% N/A (1)
Training
Total days of training 26,542 N/A (1) 43,505 (3) N/A (1) 50,833 N/A (1) 259,272 N/A (1) 56,256 N/A (1) 436,408 N/A (1)
Total training hours 212,336 (2) 134,357 342,088 (2)(3) 247,031 406,664(2) 291,518 2,074,176(2) 1,781,920 450,048(2) 347,821 3,491,264(2) 2,802,647
Number of employees having attended at least one training course 8,676 7,062 19,864 17,239 17,289 15,748 80,844 66,354 15,182 15,336 140,282 121,739
Employee movements
New hires 11,585 10,470 8,042 8,467 5,915 6,030 29,328 41,703 7,620 9,609 62,490 76,279
Separations 11,943 10,597 8,233 8,597 5,408 5,602 29,184 29,947 7,044 6,999 61,812 61,742
Resignations 1,687 1,636 4,607 5,629 3,025 3,202 24,808 25,616 3,364 3,271 37,491 39,354
Terminations 886 805 1,447 1,214 770 774 2,394 2,016 2,732 2,942 8,229 7,751
Redundancy 137 8 233 118 7 135 47 155 17 46 441 462
Promotions
Total number of promotions N/A 241 N/A 1,196 N/A 992 N/A 5,687 N/A 2,266 N/A 10,382
of which promotions of non-managers to middle managers N/A 164 N/A 235 N/A 235 N/A 1,278 N/A 234 N/A 2,146
(1) The indicator relating to the number of training days was dropped in 2014, in favor of the number of training hours. To avoid inaccurate comparisons, the data expressed in hours has not been converted into days (see page 75).
(2) The number of training hours in 2013 is given for information purposes and is derived from data on the number of training days based on an eight-hour day.(3) The number of training days in 2013 in Europe does not include data from the midscale Novotel chain due to inconsistent data gathered at the year-end.
Registration Document 2014 79
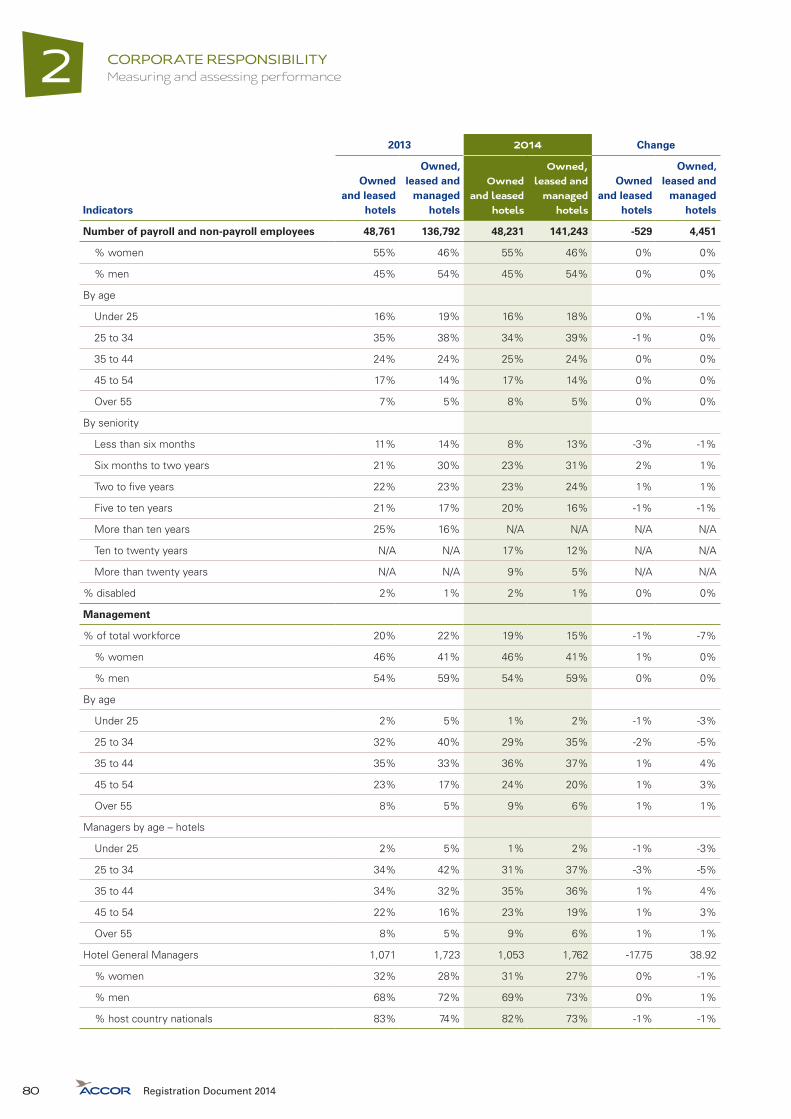
CORPORATE RESPONSIBILITYMeasuring and assessing performance2
Indicators
2013 2014 Change
Owned and leased
hotels
Owned, leased and
managed hotels
Owned and leased
hotels
Owned, leased and
managed hotels
Owned and leased
hotels
Owned, leased and
managed hotels
Number of payroll and non-payroll employees 48,761 136,792 48,231 141,243 -529 4,451
% women 55% 46% 55% 46% 0% 0%
% men 45% 54% 45% 54% 0% 0%
By age
Under 25 16% 19% 16% 18% 0% -1%
25 to 34 35% 38% 34% 39% -1% 0%
35 to 44 24% 24% 25% 24% 0% 0%
45 to 54 17% 14% 17% 14% 0% 0%
Over 55 7% 5% 8% 5% 0% 0%
By seniority
Less than six months 11% 14% 8% 13% -3% -1%
Six months to two years 21% 30% 23% 31% 2% 1%
Two to five years 22% 23% 23% 24% 1% 1%
Five to ten years 21% 17% 20% 16% -1% -1%
More than ten years 25% 16% N/A N/A N/A N/A
Ten to twenty years N/A N/A 17% 12% N/A N/A
More than twenty years N/A N/A 9% 5% N/A N/A
% disabled 2% 1% 2% 1% 0% 0%
Management
% of total workforce 20% 22% 19% 15% -1% -7%
% women 46% 41% 46% 41% 1% 0%
% men 54% 59% 54% 59% 0% 0%
By age
Under 25 2% 5% 1% 2% -1% -3%
25 to 34 32% 40% 29% 35% -2% -5%
35 to 44 35% 33% 36% 37% 1% 4%
45 to 54 23% 17% 24% 20% 1% 3%
Over 55 8% 5% 9% 6% 1% 1%
Managers by age – hotels
Under 25 2% 5% 1% 2% -1% -3%
25 to 34 34% 42% 31% 37% -3% -5%
35 to 44 34% 32% 35% 36% 1% 4%
45 to 54 22% 16% 23% 19% 1% 3%
Over 55 8% 5% 9% 6% 1% 1%
Hotel General Managers 1,071 1,723 1,053 1,762 -17.75 38.92
% women 32% 28% 31% 27% 0% -1%
% men 68% 72% 69% 73% 0% 1%
% host country nationals 83% 74% 82% 73% -1% -1%
Registration Document 201480

2
CORPORATE RESPONSIBILITYMeasuring and assessing performance
Indicators
2013 2014 Change
Owned and leased
hotels
Owned, leased and
managed hotels
Owned and leased
hotels
Owned, leased and
managed hotels
Owned and leased
hotels
Owned, leased and
managed hotels
Working conditions
% full-time employees 82% 89% 84% 91% 2% 2%
% part-time employees 18% 11% 16% 9% -2% -2%
Average number of days of medical leave per employee over the year 11.1 6.5 9.8 5.9 -1.37 -0.66
Of which due to workplace accidents N/A N/A 1.1 0.6 N/A N/A
Average number of days of unauthorized leave per employee over the year 1.3 1.1 0.7 0.7 - -
Lost-time injury rate resulting from workplace and commuting accidents 21.4 13.5 N/A N/A N/A N/A
Lost-time injury rate resulting from workplace accidents N/A N/A 23.6 12.7 N/A N/A
Incident severity rate for workplace and commuting accidents N/A N/A 0.6 0.3 N/A N/A
Number of fatal workplace and commuting accidents 0 8 0 9 0 1
Environmental and social responsibility indicators
Scopes of reporting
Scope of reporting
2013 2014
Owned, leased and managed
hotels
Owned, leased, managed and
franchised hotels
Owned, leased and managed
hotels
Owned, leased, managed and
franchised hotels
Total number of Accor hotels 2,027 3,401 2,068 3,538
Number of hotels applying Charter 21➜ Response rate
2,027➜ 100%
3,173➜ 93%
2,068➜ 100%
3,325➜ 94%
�� With restaurants 1,344 1,880 1,378 1,988
�� With grounds 1,333 2,049 1,371 2,153
�� Air conditioned 1,700 2,598 1,770 2,776
Number of hotels reporting water and energy data➜ Response rate
1,667➜ 87%
N/A1,708
➜ 88%N/A
Registration Document 2014 81

CORPORATE RESPONSIBILITYMeasuring and assessing performance2
Indicators
IndicatorsScope of reporting
2013 2014
% change at comparable scope
of reporting
Owned, leased and
managed hotels
Owned, leased,
managed and franchised
hotels
Owned, leased and
managed hotels
Owned, leased,
managed and franchised
hotels
Owned, leased
and managed
hotels
Owned, leased,
managed and franchised
hotels
SOCIAL RESPONSIBILITY COMMITMENTS
Support for and engagement in local communities
Hotels active in protecting children from abuse
54% 44% 58% 48% +1% +3%
Number of employees trained in preventing child sex tourism
29,499 employees
31,689 employees
31,842 employees
34,709 employees
+6% +9%
Hotels displaying customer awareness campaigns
24% 18% 26% 19% +2% +2%
Guest responsibility
Hotels offering balanced meals 97% 96% 98% 97% +1% +4%
Hotels using eco-friendly cleaning products
97% 95% 99% 96% +2% +4%
Hotels using eco-friendly gardening products
76% 72% 72% 71% -2% 0%
Sustainable procurement
% of purchasing contracts in compliance with Procurement Charter 21
ND 68% ND 80% N/A N/A
Number of third-party supplier audits performed over the past three years
ND 248 ND 382 N/A +54%
Hotels purchasing and promoting local food products
84% 81% 91% 87% +7% +8%
Hotels serving fair trade products or products from sustainable farms
63% 66% 64% 67% +4% +5%
ENVIRONMENTAL COMMITMENTS
Environmental management
ISO 14001-certified hotels (1) 678 900 826 1,149 +29% +29%
Hotels using dispensers or eco-responsible packaging for bathroom products (e.g. flooring, wall paint, bedding, complimentary products)
40% 38% 47% 46% +15% +22%
Hotels using dispensers or eco-responsible packaging for bathroom products
60% 61% 66% 71% +10% +18%
(1) Excluding the economy and budget segment.
Registration Document 201482

2
CORPORATE RESPONSIBILITYMeasuring and assessing performance
IndicatorsScope of reporting
2013 2014
% change at comparable scope
of reporting
Owned, leased and
managed hotels
Owned, leased,
managed and franchised
hotels
Owned, leased and
managed hotels
Owned, leased,
managed and franchised
hotels
Owned, leased
and managed
hotels
Owned, leased,
managed and franchised
hotels
Awareness-building and buy-in
Hotels training employees in environmentally-friendly practices
99% 98% 99% 98% +1% +3%
Hotels raising guest awareness of sustainable development issues
96% 93% 97% 93% +2% 3%
Energy and carbon footprint
Total energy used 3,890 GWh ND 3,957 GWh ND -4.3%* N/A
Total CO2 emissions1,822 thousand
teq CO2
ND1,679 thousand
teq CO2
ND -3.1%** N/A
�� Direct emissions249 thousand
teq CO2
ND245 thousand
teq CO2
ND -7%**
N/A
�� Indirect emissions1,573 thousand
teq CO2
ND1,435 thousand
teq CO2
ND -2.3%**
Hotels using energy-efficient bulbs for 24/24/7 lighting
98% 97% 99% 98% +1% +3%
Hotels using energy-efficient boilers 73% 70% 69% 70% -2% +1%
Hotels using energy-efficient air conditioning units
69% 69% 68% 70% -1% 3%
Hotels using renewable energies 7% 7% 9% 9% +2% +1%
Hotels using energy-efficient bulbs for frontage lighting
71% 71% 73% 74% +1% +4%
Hotels using building management software to manage their energy use
36% 31% 36% 33% 0% +1%
Hotels recovering energy from the ventilation system
37% 32% 39% 34% +2% +2%
Hotels insulating pipes carrying hot/cold fluids
96% 94% 96% 94% +0% +3%
Hotels using a timer for frontage lighting
92% 92% 94% 94% +3% +5%
Hotels using energy-efficient bulbs in guest rooms
89% 89% 90% 90% +1% +3%
Hotels with a central light switch in guest rooms
55% 53% 56% 55% -1% +1%
Hotels with green or cool roofs 4% 4% 8% 6% +3% +2%
Hotels equipped with a timer for common area air conditioning
48% 43% 51% 46% +3% +3%
* Change calculated using the ratio of kWh per available room at a comparable scope of reporting for 2013-2014.** Change calculated using the ratio of kg CO2 equivalent per available room at a comparable scope of reporting for 2013-2014
Registration Document 2014 83

CORPORATE RESPONSIBILITYMeasuring and assessing performance2
IndicatorsScope of reporting
2013 2014
% change at comparable scope
of reporting
Owned, leased and
managed hotels
Owned, leased,
managed and franchised
hotels
Owned, leased and
managed hotels
Owned, leased,
managed and franchised
hotels
Owned, leased
and managed
hotels
Owned, leased,
managed and franchised
hotels
Hotels using speed controllers for pumps and fans
39% 34% 44% 38% +3% +3%
New or renovated hotels certified as sustainable buildings
N/A 6 hotels N/A 13 hotels N/A N/A
Water
Total water us32.2 million
cu.mND
33.6 million cu.m
ND -1.4%* ND
Hotels equipped with flow regulators on faucets/showerheads
97% 96% 98% 97% +1% +3%
Hotels equipped with rainwater recovery installations
7% 7% 7% 7% 0% 0%
Hotels prohibiting the use of cooling towers without water recovery systems
77% 73% 84% 79% +7% +8%
Hotels using motion sensors for bathroom faucets
33% 29% 35% 31% +2% +2%
Hotels using dual flush toilets 58% 59% 62% 63% +2% +4%
Hotels using a water-efficient laundry service
60% 59% 66% 65% +5% +8%
Hotels using selective grounds watering methods
78% 80% 73% 77% -5% -1%
Hotels recycling gray water 8% 7% 8% 7% 0% 0%
Local environmental impacts
Hotels participating in the Plant for the Planet program
1,229 1,404 1289 1529 19% +21%
Hotels banning endangered seafood from restaurant menus
89% 89% 94% 93% +6% +7%
Waste
Sort and recycle toner cartridges 99% 98% 99% 98% 0% +2%
Hotels sorting and recycling batteries
93% 94% 99% 98% 0% +2%
Hotels sorting and recycling fluorescent tubes and light bulbs
94% 94% 97% 96% +1% +3%
Hotels sorting and recycling paper and cardboard
89% 90% 90% 91% +2% +4%
Hotels sorting and recycling glass bottles and packaging
86% 87% 88% 89% +3% +4%
* Change calculated using the ratio of liters per available room at a comparable scope of reporting for 2013-2014.
Registration Document 201484

2
CORPORATE RESPONSIBILITYMeasuring and assessing performance
IndicatorsScope of reporting
2013 2014
% change at comparable scope
of reporting
Owned, leased and
managed hotels
Owned, leased,
managed and franchised
hotels
Owned, leased and
managed hotels
Owned, leased,
managed and franchised
hotels
Owned, leased
and managed
hotels
Owned, leased,
managed and franchised
hotels
Hotels sorting and recycling electrical and electronic equipment
85% 86% 88% 88% +5% +5%
Hotels collecting and recycling cooking oil
92% 92% 91% 91% -1% +2%
Hotels collecting and recycling fats 84% 85% 84% 83% 0% +1%
Hotels sorting and recycling plastic packaging
73% 74% 74% 75% +1% +3%
Hotels sorting and recycling metal packaging
64% 63% 66% 66% +3% +4%
Hotels sorting and recycling organic waste from restaurants
48% 47% 50% 48% +2% +3%
Hotels sorting and recycling green waste from lawns and gardens
62% 66% 61% 66% +1% +3%
Hotels offering guests waste sorting opportunities
26% 24% 23% 21% -3% -2%
Registration Document 2014 85

CORPORATE RESPONSIBILITYIndependent Verifier’s Report on consolidated social, environmental and societal information presented in the Management Report
22.7. INDEPENDENT VERIFIER’S REPORT
ON CONSOLIDATED SOCIAL, ENVIRONMENTAL AND SOCIETAL INFORMATION PRESENTED IN THE MANAGEMENT REPORT
Year ended the 31 12 2014
This is a free translation into English of the original report issued in the French language and it is provided solely for the convenience of English speaking users. This report should be read in conjunction with, and construed in accordance with, French law and professional standards applicable in France.
To the shareholders,
In our quality as an independent verifier accredited by the COFRAC(1), under the number n° 3-1050, and as a member of the network of one of the statutory auditors of the company Accor, we present our report on the consolidated social, environmental and societal information established for the year ended on the 31 12 2014, presented in chapter 2 of the management report, hereafter referred to as the “CSR Information,” pursuant to the provisions of the article L.225-102-1 of the French Commercial code (Code de commerce).
RESPONSIBILITY OF THE COMPANY
It is the responsibility of the Board of Directors to establish a management report including CSR Information referred to in the article R. 225-105 of the French Commercial code (Code de commerce), in accordance with the protocols used by the company composed of social reporting protocols, sustainable procurement reporting explanation sheets, Guidelines for the Charter 21 actions and sustainable development reporting protocol in their updated versions of 2014 (hereafter referred to as the “Criteria”), and of which a summary is included in in the paragraph “Methodological review” of the chapter 2.6.3 of the management report.
INDEPENDENCE AND QUALITY CONTROL
Our independence is defined by regulatory requirements, the Code of Ethics of our profession as well as the provisions in the article L. 822-11 of the French Commercial code (Code de commerce). In addition, we have implemented a quality control system, including documented policies and procedures to ensure compliance with ethical standards, professional standards and applicable laws and regulations.
RESPONSIBILITY OF THE INDEPENDENT VERIFIER
It is our role, based on our work:
�� to attest whether the required CSR Information is present in the management report or, in the case of its omission, that an appropriate explanation has been provided, in accordance with the third paragraph of R. 225-105 of the French Commercial code (Code de commerce) (Attestation of presence of CSR Information);
�� to express a limited assurance conclusion, that the CSR Information, overall, is fairly presented, in all material aspects, in according with the Criteria.
Our verification work was undertaken by a team of five people between October 2014 and March 2015 for an estimated duration of fourteen weeks.
We conducted the work described below in accordance with the professional standards applicable in France and the Order of 13 May 2013 determining the conditions under which an independent third-party verifier conducts its mission, and in relation to the opinion of fairness and the reasonable assurance report, in accordance with the international standard ISAE 3000(2).
(1) Scope available at www.cofrac.fr(2) ISAE 3000 – Assurance engagements other than audits or reviews of historical information.
Registration Document 201486

2
CORPORATE RESPONSIBILITYIndependent Verifier’s Report on consolidated social, environmental and societal
information presented in the Management Report
1. Attestation of presence of CSR Information
We obtained an understanding of the company’s CSR issues, based on interviews with the management of relevant departments, a presentation of the company’s strategy on sustainable development based on the social and environmental consequences linked to the activities of the company and its societal commitments, as well as, where appropriate, resulting actions or programmes.
We have compared the information presented in the management report with the list as provided for in the Article R. 225-105-1 of the French Commercial code (Code de commerce).
In the absence of certain consolidated information, we have verified that the explanations were provided in accordance with the provisions in Article R. 225-105-1, paragraph 3, of the French Commercial code (Code de commerce).
We verified that the information covers the consolidated perimeter, namely the entity and its subsidiaries, as aligned with the meaning of the Article L.233-1 and the entities which it controls, as aligned with the meaning of the Article L.233-3 of the French Commercial code (Code de commerce).
Based on this work, we confirm the presence in the management report of the required CSR information.
2. Limited assurance on CSR Information
Nature and scope of the work
We undertook thirteen interviews with sixteen people responsible for the preparation of the CSR Information in the different departments(3), in charge of the data collection process and, if applicable, the people responsible for internal control processes and risk management, in order to:
�� Assess the suitability of the Criteria for reporting, in relation to their relevance, completeness, reliability, neutrality, and understandability, taking into consideration, if relevant, industry standards;
�� Verify the implementation of the process for the collection, compilation, processing and control for completeness and consistency of the CSR Information and identify the procedures for internal control and risk management related to the preparation of the CSR Information.
We determined the nature and extent of our tests and inspections based on the nature and importance of the CSR Information, in relation to the characteristics of the Company, its social and environmental issues, its strategy in relation to sustainable development and industry best practices.
For the CSR Information which we considered the most important(4):
�� At the level of the consolidated entity, we consulted documentary sources and conducted interviews to corroborate the qualitative information (organisation, policies, actions, etc.), we implemented analytical procedures on the quantitative information and verified, on a test basis, the calculations and the compilation of the information, and also verified their coherence and consistency with the other information presented in the management report;
(3) Sustainable Development Department, Human Resources Department, Group Procurement Department, “Property Solutions” Department, Solidarity Accor, Marketing Department and Group Safety Department.
(4) Environmental and societal information: approaches to environmental evaluation and certification; water consumption and water supply considering local constraints; raw material consumption and measures undertaken to enhance resource efficiency; energy consumption; measures undertaken to improve energy efficiency; greenhouse gas discharges; territorial impact, economic and social (employment, regional development, impact on regional and local populations); importance of subcontracting and the consideration of environmental and social issues in purchasing policies and relations with suppliers and subcontractors; measures undertaken in favour of consumers’ health and safety.
Social information: employment (total headcount and breakdown per gender, age, geographical area); hiring and terminations; organisation of working time; absenteeism; work accidents, notably their frequency and their severity, as well as occupational diseases; training policies; number of days of training; measures undertaken for gender equality; anti-discrimination policies and actions.
Registration Document 2014 87

CORPORATE RESPONSIBILITYIndependent Verifier’s Report on consolidated social, environmental and societal information presented in the Management Report
2�� At the level of the representative selection of entity that we selected(5), based on their activity, their contribution to the consolidated indicators, their location and a risk analysis, we undertook interviews to verify the correct application of the procedures and undertook detailed tests on the basis of samples, consisting in verifying the calculations made and linking them with supporting documentation. The sample selected therefore represented on average 23% of the total workforce, between 25% and 30% for indicators concerning water and energy consumptions, 23% of the hostels for the “Charter 21” indicators, and 27% of the listed suppliers for the sustainable procurement.
For the other consolidated CSR information, we assessed their consistency in relation to our knowledge of the company.
Finally, we assessed the relevance of the explanations provided, if appropriate, in the partial or total absence of certain information.
We consider that the sample methods and sizes of the samples that we considered by exercising our professional judgment allow us to express a limited assurance conclusion; an assurance of a higher level would have required more extensive verification work. Due to the necessary use of sampling techniques and other limitations inherent in the functioning of any information and internal control system, the risk of non-detection of a significant anomaly in the CSR Information cannot be entirely eliminated.
Qualification expressed
Heterogeneous understandings of the Criteria induce different calculation methods between countries for the information related to the “number of days of absence”.
Conclusion
Based on our work, and under this qualification, we have not identified any significant misstatement that causes us to believe that the CSR Information, taken together, has not been fairly presented, in compliance with the Criteria.
Observations
Without qualifying our conclusion above, we draw your attention to the following points:
�� Except for water and energy consumptions indicators, the Criteria application for the calculation of some HR, sustainable procurement and Charter 21 indicators is not homogeneous, as well as associated internal controls not regular enough.
Paris-La Défense, the 12 March 2015French original signed by:
Independent Verifier
ERNST & YOUNG et Associés
Éric Duvaud
Associé Développement Durable
Bruno Perrin
Associé
(5) Social: Italia, Russia, Vietnam, Malaysia, Indonesia, Singapore, Australia, Fiji, New-Zeeland. Environment: for water and energy consumptions: Germany, Austria, Bulgaria, Hungary, Roumania, Czech Republic, Slovakia, Spain, Portugal,
Russia, Ukraine, Saudi Arabia, Bahrain, Egypt, United Arab Emirates, Jordan, Kuwait, Oman, Qatar, Yemen, Australia. And for other environmental indicators: Germany, Austria, Bulgaria, Hungary, Romania, Czech Republic, Slovakia, Sweden, Russia, Ukraine, Malaysia, Indonesia, Singapore, Saudi Arabia, Bahrain, Egypt, United Arab Emirates, Jordan, Kuwait, Lebanon, Oman, Qatar, Yemen, Australia.
Societal: for sustainable procurement: Spain, Italy, Germany, Australia.
Registration Document 201488

33.1. ADMINISTRATIVE AND MANAGEMENT BODIES 903.1.1. Board of Directors 90
3.1.2. Deputy Chief Executive Officer 102
3.1.3. Founding co-chairmen 103
3.1.4. Executive Committee 103
3.2. REPORT OF THE CHAIRMAN OF THE BOARD OF DIRECTORS 104
3.2.1. Corporate governance and the Board of Directors’ operating procedures 104
3.2.2. Internal control and risk management procedures 115
3.3. STATUTORY AUDITORS’ REPORT, PREPARED IN ACCORDANCE WITH ARTICLE L.225-235 OF THE FRENCH COMMERCIAL CODE (CODE DE COMMERCE) ON THE REPORT PREPARED BY THE CHAIRMAN OF THE BOARD OF DIRECTORS 122
3.4. RISK MANAGEMENT 1233.4.1. Security and Risk Management Strategy 123
3.4.2. Risk factors 124
3.4.3 Sensitivity analysis 128
3.4.4 Risk financing – Insurance 129
3.5 INTERESTS AND COMPENSATION 1303.5.1 Directors’ and officers’ compensation 130
3.5.2 Directors’ and employees’ interests 136
3.6. STATUTORY AUDITORS’ SPECIAL REPORT ON RELATED PARTY AGREEMENTS AND COMMITMENTS 147
Corporate GOVERNANCE
Registration Document 2014 89

CORPORATE GOVERNANCEAdministrative and management bodies3
3.1. ADMINISTRATIVE AND MANAGEMENT BODIES
3.1.1. BOARD OF DIRECTORS
Jean-Paul Bailly – Independent director (1)
�� First appointed as a director on May 13, 2009.
�� Current term due to expire at the close of the Annual Shareholders’ Meeting to be called to approve the financial statements for the year ended December 31, 2014.
�� Number of Accor shares held: 1,000.
�� Born November 29, 1946 – French national.
�� Honorary Chairman of the La Poste Group.
�� After graduating from École Polytechnique and the Massachusetts Institute of Technology, Jean-Paul Bailly began his career with the Paris Transit Authority (RATP). In 1978, he took over the running of French technical cooperation programs in Mexico before moving back to RATP in 1982 where he held a number of positions, including Departmental Director, Bus Rolling Stock, director of the Paris Metro and RER suburban rail system, and Human Resources Director. He became Deputy Chief Executive Officer of RATP in 1990 and then served as RATP’s Chairman and Chief Executive Officer between 1994 and 2002. He was Chairman and Chief Executive Officer of La Poste from 2002 to 2013.
Other positions held at December 31, 2014
Position Company
France
Director Edenred
Former positions held in the past five years
Position Company
France
Chairman and Chief Executive Officer La Poste
Chairman of the Supervisory Board La Banque Postale
Member of the Supervisory Board La Banque Postale Asset Management
Director GDF Suez
Permanent representative of La Poste on the Board of Directors GeoPost
Permanent representative of La Poste on the Board of Directors Sofipost
Permanent representative of La Poste on the Board of Directors Poste Immo
Director Sopassure
Director CNP Assurance
(1) In accordance with the criteria defined in the AFEP/MEDEF Corporate Governance Code, as approuved by the Board of Directors on February 17, 2015.
Registration Document 201490

3
CORPORATE GOVERNANCEAdministrative and management bodies
Sébastien Bazin – Chairman and Chief Executive Officer
�� First appointed as a director on January 9, 2006. Previously a member of the Supervisory Board from May 3, 2005.
�� Current term due to expire at the close of the Annual Shareholders’ Meeting to be called to approve the financial statements for the year ending December 31, 2016.
�� Number of Accor shares held: 1,012.
�� Born November 9, 1961 – French national.
�� Having earned a Masters in Business Management from Paris-Sorbonne University, Sébastien Bazin began his career in the
US finance industry in 1985. In 1997, he joined Colony Capital, a private-equity firm, to set up and develop its European operations. During his 15 years with the firm, he managed and participated in a large number of investments in the hospitality industry, including the acquisition of luxury hotel chains Fairmont and Raffles, the acquisition and management of hotel assets from Compagnie Générale des Eaux and Club Méditerranée, the acquisition of an equity stake in Lucien Barrière Group, and the investment in Accor. He is also Vice-Chairman of the Supervisory Board of the Gustave Roussy Foundation.
Other positions held at December 31, 2014 with companies controlled (1) by Accor
Position Company
France
Chairman Adagio SAS
Other positions held at December 31, 2014 with companies not controlled (1) by Accor
Position Company
France
Director Théâtre du Châtelet
Chairman Bazeo Europe SAS
Legal Manager CC Europe Invest
Legal Manager Société du Savoy à Méribel
Managing Partner SCI Nina
Managing Partner SCI Haute Roche
Managing Partner SCI Madeleine Michelis
Managing Partner SCI Ranelagh
Luxembourg
Director Sisters Soparfi
(1) Within the meaning of Article L.233-16 of the French Commercial Code.
Registration Document 2014 91

CORPORATE GOVERNANCEAdministrative and management bodies3
Former positions held in the past five years
Position Company
France
Chief Executive Officer Colony Capital Europe
Chairman and Chief Executive Officer Société d’Exploitation Sports & Événements SA
Chairman and Chief Executive Officer Holding Sports & Événements SA
Chairman Colony Capital SAS
Chief Executive Officer Toulouse Cancéropole SAS
Chief Executive Officer ColSpa SAS.
Legal representative of Colony Capital SAS as Chairman ColSpa SAS
Chairman Colfilm SAS
Chairman Collllkirch France SAS
Chairman Data 4 SAS
Chairman ColWine SAS
Chairman Lucia Investissement SAS
Chairman of the Supervisory Board Paris Saint-Germain Football
Legal representative of Colony Capital SAS as Legal Manager SC Georges V 302
Legal Manager Colmed
Legal Manager Colmassy SARL
Vice-Chairman and member of the Supervisory Board Groupe Lucien Barrière
Director Moonscoop IP
Director Carrefour
Director Edenred
Member of the Supervisory Board ANF Immobilier (Les Ateliers du Nord de la France)
Belgium
Chairman RSI
Luxembourg
Managing Director Sisters Soparfi
United Kingdom
Chairman and director Colyzeo Investment Management Ltd
Switzerland
Legal Manager La Tour S.à.r.l.
Legal Manager La Tour Réseau de Soins SA
Legal Manager Permanence de la Clinique Carouge
Registration Document 201492

3
CORPORATE GOVERNANCEAdministrative and management bodies
Philippe Citerne – Independent director (1), senior independent director and Vice-Chairman of the Board of Directors
�� First appointed as a director on January 9, 2006. Previously, the permanent representative of Société Générale on Accor’s Supervisory Board from December 22, 2003.
�� Current term due to expire at the close of the Annual Shareholders’ Meeting to be called to approve the financial statements for the year ended December 31, 2014.
�� Number of Accor shares held: 2,000.
�� Born April 14, 1949 – French national.
�� Non-Executive Chairman of the Telecom École de Management business school.
�� After graduating from École Centrale Paris and holding a number of positions in the French Finance Ministry, Philippe Citerne joined Société Générale in 1979, where he served as Vice-President of Economic Research, Vice-President Finance and Vice-President Human Relations, prior to becoming a director, Co Chief Executive Officer from 1997 to April 2009. During the transition governance period, from April 23 to August 27, 2013, he served as Chairman of the Accor Board of Directors.
Other positions held at December 31, 2014
Position Company
France
Chairman C2.O
Chairman Filcico
Director Edenred
Director MK2
Member of the Supervisory Board Lendix
Ireland
Chairman Inverewe Capital
Former positions held in the past five years
Position Company
France
Co Chief Executive Officer Societé Générale
Chairman Systèmes Technologiques d’Echanges et de Traitement – STET
Director Sopra Group
Director Rexecode
Representative of Société Générale on the Supervisory Board Fonds de Garantie des Dépôts
Russia
Director Rosbank
Iliane Dumas – Director representing employees
�� First appointed as a director on May 2, 2014.
�� Current term due to expire on May 2, 2017.
�� Born March 5, 1971 – French national.
�� Business project manager within the Group’s Human Resources Department.
�� A graduate of École de Paris des Métiers de la Table, Iliane Dumas joined Accor in 1991 where she was initially part of the sales team in the Distribution Department. She has held several employee representative positions, notably Representative of the Central Works Council on Accor’s Board of Directors. She is currently business project manager within the Group’s Human Resources Department and is a judge at the Paris Employment Tribunal.
(1) In accordance with the criteria defined in the AFEP/MEDEF Corporate Governance Code, as approuved by the Board of Directors on February 17, 2015.
Registration Document 2014 93

CORPORATE GOVERNANCEAdministrative and management bodies3
Mercedes Erra – Independent director (1)
�� First appointed as a director on February 22, 2011.
�� Current term due to expire at the close of the Annual Shareholders’ Meeting to be called to approve the financial statements for the year ended December 31, 2014.
�� Number of Accor shares held: 1,000.
�� Born September 23, 1954 – French national.
�� Executive President of Havas Worldwide.
�� A graduate of HEC business school and Paris-Sorbonne University, Mercedes Erra began her career with Saatchi & Saatchi where she spent fourteen years and reached the position of Chief Executive
Officer. In 1995, she co-founded BETC, which over the past 20 years has become France’s leading advertising agency and consistently ranks among the world’s best creative agencies. Ms. Erra is also Chairman of the Board of Directors of Musée de l’Histoire de l’Immigration. She is involved in a variety of women’s advocacy groups and with UNICEF, as well as being an active member of the French Committee of Human Rights Watch, and a member of the Osons la France Forum, the Innovation 2030 and Childhood and Adolescence Commissions put in place by the French government, and the Medici Committee set up by Amundi. She also sits on the Boards of Directors of the France Télévisions Foundation, the Elle Foundation and IMS.
Other positions held at December 31, 2014 with companies controlled (2) by Havas Worldwide
Position Company
France
Founder, Managing Director and member of the Management Board BETC
President BETC Digital (formerly EURO RSCG 4D)
President Havas 04
Member of the Supervisory Board Rosapark
Director Havas
Director Havas Worldwide Paris
Other positions held at December 31, 2014 with companies not controlled (2) by Havas Worldwide
Position Company
France
Vice-President Commission Nationale Française pour l’Unesco
Member of the Board of Directors Fondation du Collège de France
Director Théâtre du Châtelet
Former positions held in the past five years
Position Company
France
Managing Director Havas
Chairman of the Board of Directors Euro RSCG
President Euro RSCG France
Director Absolut Reality
Director Société de la Tour Eiffel
Sophie Gasperment – Independent director (1)
�� First appointed as a director on June 29, 2010.
�� Current term due to expire at the close of the Annual Shareholders’ Meeting to be called to approve the financial statements for the year ending December 31, 2015.
�� Number of Accor shares held: 1,500.
�� Born August 1, 1964 – French national.
�� Group General Manager, Financial Communication and Strategic Foresight of L’Oréal.
�� A graduate of ESSEC business school and INSEAD, Sophie Gasperment began her career in marketing at L’Oréal, where she held both operational and brand development positions before being appointed Managing Director of L’Oréal UK, where she served for 14 years, in particular as Chairman and Chief Executive Officer of The Body Shop International until 2013. Ms. Gasperment was appointed as a French Foreign Trade Advisor in 2005 and is a member of L’Oréal’s executive office in the UK. She is also a member of the Business Advisory Council of Saïd Business School at the University of Oxford.
(1) In accordance with the criteria defined in the AFEP/MEDEF Corporate Governance Code, as approuved by the Board of Directors on February 17, 2015.(2) Within the meaning of Article L.233-16 of the French Commercial Code.
Registration Document 201494

3
CORPORATE GOVERNANCEAdministrative and management bodies
Former positions held in the past five years
Position Company
Germany
Director Body Shop Beteiligungs GmbH
Director The Body Shop Germany GmbH
United States
Chairman and Chief Executive Officer BSI USA Inc.
Chairman and Chief Executive Officer Buth-NA-Bodhaige Inc.
Chairman Skin & Hair Care Preparations
United Kingdom
Chairman and Chief Executive Officer The Body Shop International plc
Director Anderbarn Ltd
Director Browndray Ltd
Director Cranvine Ltd
Director Creektime Ltd
Director Crestsold Ltd
Director Dishmax Ltd
Director Enfranchise Ninety One Ltd
Director Fillcare Ltd
Director Groundmesh Ltd
Director Islemend Ltd
Director Leasetime Ltd
Director Lordmark Ltd
Director Masonride Ltd
Director Modesite Ltd
Director Solitaire Fashion Shops Ltd
Director TBSI (Holdings 1) Ltd
Director TBSI (Holdings 2) Ltd
Director The Body Shop (Isle of Man)
Director The Body Shop Card Services
Director The Body Shop Midlands Ltd
Director The Body Shop On-Line (I) Ltd
Director The Body Shop On-Line (II) Ltd
Director The Body Shop Queenslie Ltd
Director The Millennium Administration
Director The Body Shop Retail Properties
Director The Body Shop South-West Ltd
Director Toteview Ltd
Registration Document 2014 95
CORPORATE GOVERNANCEAdministrative and management bodies3
Jonathan Grunzweig – Director
�� First appointed as a director on April 29, 2014.
�� Current term due to expire at the close of the Annual Shareholders’ Meeting to be called to approve the financial statements for the year ending December 31, 2016.
�� Number of Accor shares held: 1,000.
�� Born May 22, 1963 – US national.
�� Principal and Chief Investment Officer of Colony Capital, LLC.
�� Jonathan Grunzweig holds a B.A. from Cornell University as well as a Juris Doctor from Harvard Law School. In his role as Principal and Chief Investment Officer of Colony Capital, Mr. Grunzweig oversees the sourcing, structuring, execution and management of global investments. Prior to joining Colony Capital in 1999, Mr. Grunzweig was a Partner with the law firm Skadden, Arps, Slate, Mergher & Flom, LLP.
Other positions held at December 31, 2014 with companies controlled (1) by Colony Capital
Position Company
Hong Kong
Director Colony Yangtze II Advisory Limited
Italy
Director Smeralda Holding S.r.l.
United Kingdom
Director Colyzeo Investment Advisors Limited
Switzerland
Director Clinique de Carouge SMCC SA
Director La Tour S.à r.l.
Other positions held at December 31, 2014 with companies not controlled (1) by Colony Capital
Position Company
Australia
Director Challenger Life Company
Director Challenger Financial Services Group Limited
China
Director Beijing Peng Li Hua Yuan Real Estate Development Co., Ltd
United Kingdom
Director Cdsr Burlington House Developments Limited
Former positions held in the past five years
Position Company
France
Director Colwine SAS
United States
Director Station Casinos, Inc
(1) Within the meaning of Article L.233-16 of the French Commercial Code.
Registration Document 201496

3
CORPORATE GOVERNANCEAdministrative and management bodies
Iris Knobloch – Independent director (1)
�� First appointed as a director on April 25, 2013.
�� Current term due to expire at the close of the Annual Shareholders’ Meeting to be called to approve the financial statements for the year ending December 31, 2016.
�� Number of Accor shares held: 1,000.
�� Born February 13, 1963 – German national.
�� President of Warner Bros. Entertainment France.
�� Iris Knobloch has a J.D. degree from Ludwig-Maximilians Universität Munich and an L.L.M. degree from New York University. She has spent more than eighteen years with Warner Bros. and the Time Warner Group, holding various different positions, and is currently President of Warner Bros. Entertainment France. Before beginning her career with Warner Bros., Ms. Knobloch was an attorney with Norr, Stiefenhofer & Lutz and O’Melveny & Myers in Munich, New York and Los Angeles.
Other positions held at December 31, 2014 with companies outside the Warner Bros. group
Position Company
Bermuda
Member of the Board of Directors Central European Media Enterprises
Bertrand Meheut – Independent director (1)
�� First appointed as a director on May 13, 2009.
�� Current term due to expire at the close of the Annual Shareholders’ Meeting to be called to approve the financial statements for the year ended December 31, 2014.
�� Number of Accor shares held: 1,000.
�� Born September 22, 1951 – French national.
�� Chairman of the Groupe Canal+ Management Board.
�� A graduate of École des Mines de Paris with a degree in civil engineering, Bertrand Meheut has served as Chairman of the Groupe Canal+ Management Board since September 2002. Prior to that he worked in industry, particularly in the life sciences sector, spending the majority of his career with Rhône-Poulenc (and subsequently Aventis CropScience). He joined Rhône-Poulenc in 1984 as Deputy Chief Operating Officer, Europe, in charge of corporate services for the Agro Division. He then went on to become Chief Executive Officer of the German subsidiary, Deputy Chief Executive Officer of Rhône-Poulenc Agro and Executive Vice-President and Chief Operating Officer Europe. Following the creation of Aventis through the merger of Rhône-Poulenc and the German chemicals company Hoechst in late 1999, he was named Chairman and Chief Executive Officer of Aventis CropScience. Mr. Meheut is also a director of La Cinémathèque Française.
Other positions held at December 31, 2014 with companies controlled (2) by Groupe Canal+
Position Company
France
Chairman of the Board of Directors Société d’Édition de Canal+
Chairman of the Supervisory Board StudioCanal
Chairman Canal+ Régie
Permanent representative of Groupe Canal+ on the Board of Directors Sport+
Poland
Member of the Supervisory Board TVN
Other positions held at December 31, 2014 with companies not controlled (2) by Groupe Canal+
Position Company
France
Director Edenred
Director Aquarelle.Com Group
(1) In accordance with the criteria defined in the AFEP/MEDEF Corporate Governance Code, as approuved by the Board of Directors on February 17, 2015.(2) Within the meaning of Article L.233-16 of the French Commercial Code.
Registration Document 2014 97

CORPORATE GOVERNANCEAdministrative and management bodies3
Former positions held in the past five years
Position Company
France
Chairman of the Management Board Canal+ France
Member of the Management Board Vivendi
Director SFR
Permanent representative of Groupe Canal+ as Joint Legal Manager Canal+ Éditions
Representative of Canal+ France as Managing Partner Kiosque
Member of the Executive Committee Canal+ Overseas
Virginie Morgon – Director
�� First appointed as a director on May 13, 2009.
�� Current term due to expire at the close of the Annual Shareholders’ Meeting to be called to approve the financial statements for the year ending December 31, 2016.
�� Number of Accor shares held: 1,000.
�� Born November 26, 1969 – French national.
�� Member of the Executive Board and Chief Executive Officer of Eurazeo.
�� Virginie Morgon graduated from Institut d’Études Politiques de Paris, majoring in Economics and Finance, and holds a Master’s
Degree in Economics and Management (MIEM) from the University of Bocconi (Milan, Italy). After working as an investment banker in New York and London, she joined Lazard in 1994, where she became a senior partner in 2001, specializing in the European Food, Retail and Consumer Goods sector. Ms. Morgan has been a member of Eurazeo’s Executive Board since January 2008 and was appointed as the firm’s Chief Investment Officer in December 2012 and Chief Executive Officer in March 2014. She is a member of the Executive Committee of the Women’s Forum (WEFCOS) and of the Comité de Paris, a Human Rights Watch support Committee.
Other positions held at December 31, 2014 with companies controlled (1) by Eurazeo
Position Company
France
Chief Executive Officer LH APCOA
Chairman of the Supervisory Board Eurazeo PME
Chairman of the Supervisory Board Elis
Chairman of the Supervisory Board Legendre Holding 33 SAS
Germany
Managing Director APCOA Group GmbH
Italy
Chairman of the Board of Directors Broletto 1 Srl
Legal Manager Euraleo Srl
Other positions held at December 31, 2014 with companies not controlled (1) by Eurazeo
Position Company
France
Director L’Oréal
Member of the Supervisory Board Vivendi
Italy
Vice-Chairman of the Board of Directors Moncler SpA
(1) Within the meaning of Article L.233-16 of the French Commercial Code.
Registration Document 201498
3
CORPORATE GOVERNANCEAdministrative and management bodies
Former positions held in the past five years
Position Company
France
Chairman of the Supervisory Board OFI Private Equity Capital (renamed Eurazeo PME Capital)
Director Edenred
Permanent representative of Eurazeo on the Board of Directors LT Participations
President Legendre Holding 33
Chairman of the Board of Directors Holdelis
Member of the Board of Directors Women’s Forum (WEFCOS)
Germany
Chairman of the Supervisory Board APCOA Parking AG
Chairman of the Advisory Board APCOA Parking Holdings GmbH
Italy
Director Sportswear Industries Srl
Legal Manager Intercos SpA
Nadra Moussalem – Director
�� First appointed as a director on April 25, 2013.
�� Current term due to expire at the close of the Annual Shareholders’ Meeting to be called to approve the financial statements for the year ending December 31, 2015.
�� Number of Accor shares held: 2,500.
�� Born July 4, 1976 – French national.
�� Principal and Co-Head of Colony Capital SAS.
�� A graduate of École Centrale de Lyon with a master’s degree in information technology, Nadra Moussalem is Principal and Co-Head of Colony Capital Europe and oversees the sourcing, structuring, execution and management of the fund’s investments in Europe. Before joining Colony Capital in 2000, he worked in the financial engineering department of AXA Conseil in Paris.
Other positions held at December 31, 2014 with companies controlled (1) by Colony Capital
Position Company
France
Chairman Colony Capital SAS
Chairman Data IV Services
Chairman Data IV France
Chairman DC 115 SAS
Chairman Holding Sports & Événements
Chairman Colfilm SAS
Chairman ColIllkirch France
Chief Executive Officer ColSpa
Italy
Chairman Data 4 Italy
Chairman Data 4 Services Italy
Luxembourg
Legal Manager Data Genpar Sarl
United Kingdom
Director Colyzeo Investment Management
Director Data 4 UK Limited
Director Data 4 UK Services Limited
(1) Within the meaning of Article L.233-16 of the French Commercial Code.
Registration Document 2014 99

CORPORATE GOVERNANCEAdministrative and management bodies3
Other positions held at December 31, 2014 with companies not controlled (1) by Colony Capital
Position Company
France
Director Edenred
Director Carmila
Spain
Director Distribuidora Internacional de Alimentación (D.I.A.)
Former positions held in the past five years
Position Company
France
Legal Manager SC George V 301
Legal Manager SC George V 302
Luxembourg
Director Sisters Soparfi SA
Legal Manager Cedar Trust
Legal Manager CT Real Estate
Patrick Sayer – Director
�� First appointed as a director on August 27, 2008.
�� Current term due to expire at the close of the Annual Shareholders’ Meeting to be called to approve the financial statements for the year ending December 31, 2015.
�� Number of Accor shares held: 1,000.
�� Born November 20, 1957 – French national.
�� Chairman of the Executive Board of Eurazeo.
�� A graduate of École Polytechnique and École des Mines de Paris, Patrick Sayer has been Chairman of Eurazeo’s Executive Board since May 2002. He previously held the positions of Managing Partner at Lazard Frères et Cie in Paris and Managing Director of Lazard Frères & Co. in New York. He was formerly the President of the Association Française des Investisseurs pour la Croissance (AFIC) and is currently a director of the Musée des Arts Décoratifs in Paris and a lecturer in finance (Master 225) at Paris-Dauphine University. He is also a member of the Club des Juristes and a judge at the Paris Commercial Court.
Other positions held at December 31, 2014 with companies controlled (1) by Eurazeo
Position Company
France
Vice-Chairman of the Supervisory Board ANF Immobilier
Director Europcar Group
Chief Executive Officer Legendre Holding 19
Chairman Eurazeo Capital Investissement
Chairman Legendre Holding 25
Chairman Legendre Holding 26
Chairman CarryCo Capital 1
Chairman CarryCo Croissance
Legal Manager Investco 3d Bingen (non-trading company)
(1) Within the meaning of Article L.233-16 of the French Commercial Code.
Registration Document 2014100

3
CORPORATE GOVERNANCEAdministrative and management bodies
Other positions held at December 31, 2014 with companies not controlled (1) by Eurazeo
Position Company
France
Member of the Board of Directors Rexel(2)
Dubai
Member of the Advisory Board Kitara Capital International Limited
United States
Member of the Board of Directors Tech Data Corporation
Member of the Board of Directors I-Pulse
Italy
Director Gruppo Banca Leonardo
United Kingdom
Director Colyzeo Investment Advisors
Former positions held in the past five years
Position Company
France
Chairman of the Supervisory Board ANF Immobilier
Chief Executive Officer Immobilière Bingen
Chief Executive Officer Legendre Holding 8
Chairman of the Board of Directors Europcar Group
Chairman of the Board of Directors Holdelis
Director Holdelis
Director Edenred
Member of the Supervisory Board SASP Paris Saint-Germain Football
Vice-Chairman of the Supervisory Board Rexel
Germany
Member of the Advisory Board APCOA Parking Holdings GmbH
Italy
Legal Manager Euraleo Srl
Director Moncler Srl
Director Sportswear Industries Srl
(1) Within the meaning of Article L.233-16 of the French Commercial Code.(2) Until the Shareholders’ Meeting of May 27, 2015.
Registration Document 2014 101

CORPORATE GOVERNANCEAdministrative and management bodies3
3.1.2. DEPUTY CHIEF EXECUTIVE OFFICER
Sven Boinet
�� Deputy Chief Executive Officer
�� First appointed: December 2, 2013
�� Born April 11, 1953 – French national.
�� A graduate of École Centrale de Paris and Stanford University, Sven Boinet started his career in the oil industry at Schlumberger and Coflexip before becoming a consultant for SRI International and then working with Accor between 1988 and 2003. He subsequently became Chairman of the Management Board of Groupe Lucien Barrière, a position he held from 2004 to 2009, and went on to serve as Chief Executive Officer for Groupe Pierre & Vacances from 2009 to 2012. He is also a member of the Board of Directors of Association Institut Paul Bocuse.
Other positions held at December 31, 2014 with companies controlled (1) by Accor
Position Company
Germany
Member of the Supervisory Board Accor Hospitality Germany GmbH
Morocco
Chairman of the Supervisory Board Risma
Other positions held at December 31, 2014 with companies not controlled (1) by Accor
Position Company
France
Chairman SB Conseil
Director Société du Dinard Golf SAS
Former positions held in the past five years
Position Company
France
Chief Executive Officer Groupe Pierre & Vacances Center Parcs
Chairman and Chief Executive Officer Pierre & Vacances Tourisme Europe
Deputy Chief Executive Officer and director Société d’Investissement Touristique et Immobilier (SITI)
Director and then Chief Executive Officer Pierre et Vacances
Director Tourism Real Estate Property Holding SE
Director Adagio SAS
Director Citea
Director Société Française des Papiers Peints
Permanent representative of Pierre et Vacances GIE PV – CP Services
Netherlands
Member of the Supervisory Board Center Parcs Europe N.V.
(1) Within the meaning of Article L.233-16 of the French Commercial Code.
Registration Document 2014102
3
CORPORATE GOVERNANCEAdministrative and management bodies
3.1.3. FOUNDING CO-CHAIRMEN
Paul Dubrule
Born on July 6, 1934 in Tourcoing, France, Paul Dubrule graduated from Institut des Hautes Etudes Commerciales at the University of Geneva. In 1963, he and Gérard Pélisson co-founded the Novotel hotel chain. After serving as Co-Chairman of the Novotel SIEH Group between 1971 and 1983, he co-founded Accor, serving as its Co-Chairman from 1983 to 1997. Mr. Dubrule has also held the positions of Chairman of Entreprise et Progrès, Vice-Chairman of the World Travel and Tourism Council (WTTC) and Chairman of Maison de la France. He served as Mayor of Fontainebleau between 1992 and 2001, and Senator for the Seine-et-Marne département between 1999 and 2004. He was co-Chairman of the Institut Français du Tourisme until 2013 and the Founding Chairman of the Conseil Supérieur de l’Oenotourisme (CSO). A Paul Dubrule Chair for Sustainable Development was created by INSEAD in 2002 and a Paul Dubrule Chair for Innovation has been set up at the Haute École d’Hôtellerie in Lausanne. Mr. Dubrule has also personally opened a hotel and tourism school in Siem Reap, Cambodia.
Gérard Pélisson
Born on February 9, 1932 in Lyon, France, Gérard Pélisson holds an engineering degree from École Centrale des Arts et Manufactures de Paris and a Master of Science in industrial management from the Massachusetts Institute of Technology. In 1963, he and Paul Dubrule co-founded the Novotel hotel chain. After serving as co-Chairman of the Novotel SIEH Group between 1971 and 1983, he co-founded Accor, acting as its co-Chairman from 1983 to 1997. Mr. Pélisson also co-founded the World Travel and Tourism Council (WTTC), for which he served as Vice-Chairman, and was President of the Ecole Superieure de Commerce de Lyon from 1990 to 1996. He is currently Chairman of the Overseas French Association (UFE) and President of Institut Paul Bocuse.
3.1.4. EXECUTIVE COMMITTEE
Members of the Executive Committee at December 31, 2014
�� Sébastien Bazin
Chairman and Chief Executive Officer
�� Sven Boinet
Deputy Chief Executive Officer in charge of Transformation, Human Resources and Legal Affairs
�� Vivek Badrinath
Deputy Chief Executive Officer – Marketing, Digital Media, Distribution and Information Systems
�� Sophie Stabile
Chief Financial Officer
�� John Ozinga
COO HotelInvest
�� Christophe Alaux
CEO HotelServices, France
�� Roland de Bonadona
CEO HotelServices, the Americas
�� Steven Daines
CEO HotelServices, United Kingdom, Ireland, Benelux, Switzerland, Russia and CIS
�� Jean-Jacques Dessors
CEO HotelServices, Mediterranean, Africa and the Middle-East
�� Michael Issenberg
CEO HotelServices, Asia-Pacific
�� Laurent Picheral
CEO HotelServices, Germany, Poland and Central Europe
To the best of the Company’s knowledge, in the last five years no director or officer has (i) been convicted of any fraudulent offence; (ii) been a member of the administrative, management or supervisory body of a company that has been declared bankrupt, or placed in liquidation or receivership; (iii) been the subject of any official public incrimination and/or sanctions by statutory or regulatory authorities; or (iv) been disqualified by a court from acting as a member of the administrative, management or supervisory bodies of an issuer or from acting in the management or conduct of the affairs of any issuer.
Registration Document 2014 103

CORPORATE GOVERNANCEReport of the Chairman of the Board of Directors3
3.2. REPORT OF THE CHAIRMAN OF THE BOARD OF DIRECTORSTO THE SHAREHOLDERS’ MEETING ON THE PREPARATION AND ORGANIZATION OF THE BOARD OF DIRECTORS’ WORK AND ON INTERNAL CONTROL AND RISK MANAGEMENT PROCEDURES (REPORT PREPARED IN APPLICATION OF ARTICLE L. 225-37 OF THE FRENCH COMMERCIAL CODE)
This report was approved by the Board of Directors at its meeting on February 17, 2015. It was prepared in accordance with the Reference Framework for Risk Management and Internal Control Systems issued by the Working Group set up by the French securities
regulator, Autorité des Marchés Financiers (AMF). The following description of the Company’s internal control and risk management procedures is based on the structure of said Reference Framework.
3.2.1. CORPORATE GOVERNANCE AND THE BOARD OF DIRECTORS’ OPERATING PROCEDURES
Corporate Governance Code
In 2014 Accor complied with all of the recommendations contained in the Corporate Governance Code for listed companies published by the AFEP and MEDEF (the «AFEP/MEDEF Code»), which is available from the AFEP, the MEDEF or the Company’s head office.
The Board of Directors’ operating procedures are described in its Bylaws, presented in Appendix A to this report on page 110. In addition, each director is required to comply with the Board of Directors Code of Conduct, set out in Appendix B on page 114.
Chairman and Chief Executive Officer and Deputy Chief Executive Officer
The roles of Chairman of the Board of Directors and Chief Executive Officer have been combined since 2009.
During 2013, following the departure of the previous Chairman and Chief Executive Officer, the Board set up a transitional governance structure under which it temporarily separated the role of Chairman of the Board of Directors from that of Chief Executive Officer. On August 27, 2013, the Board ended the transition period by appointing Sébastien Bazin as Chairman and Chief Executive Officer and Philippe Citerne as Vice-Chairman of the Board and senior independent director. Also, on the recommendation of the Chairman and Chief Executive Officer, on December 2, 2013 the Board appointed Sven Boinet as Deputy Chief Executive Officer in charge of Transformation. On the same date, it authorized an employment contract to be entered into between Mr. Boinet and the Company, for him to serve as director in charge of Human Resources and Legal Affairs.
The Board considered that by combining the roles of Chairman of the Board and Chief Executive Officer the Group would be able to have greater agility in its governance and management, particularly during a period of transformation or an economic downturn, while creating a direct relationship between management and shareholders. This type of governance structure also encourages extensive dialogue between the executive team and the Board of Directors. Since 2009, the Board has noted with satisfaction the
effectiveness of the balance of power existing between its executive and non-executive directors, notably thanks to the presence of a senior independent director.
During the formal assessment of the Board of Directors’ operating procedures carried out in 2014, the directors stated that this governance structure, with the combined role of Chairman and Chief Executive Officer, is effectively adapted to the Group’s current situation and that the allocation of powers and responsibilities between the Chairman and Chief Executive Officer, the senior independent director and the Board of Directors as a whole is effective and balanced.
In accordance with the law and the Company’s Bylaws, the Chairman and Chief Executive Officer chairs Board meetings, organizes and leads the work of the Board and its meetings, ensures that the Company’s corporate governance structures function effectively, and, in particular, obtains assurance that directors are in a position to fulfill their responsibilities.
The Chairman and Chief Executive Officer and the Deputy Chief Executive Officer represent the Company in its dealings with third parties and have the broadest powers to act on behalf of the Company in all circumstances. The situations where the exercise of the powers of the Chairman and Chief Executive Officer and the Deputy Chief Executive Officer is subject to the prior approval of the Board of Directors are described in the section below entitled «Powers of the Board of Directors».
Senior independent director
As mentioned above, the Board has appointed an independent director as Vice-Chairman of the Board of Directors, who serves as the Company’s senior independent director with support from the Corporate Secretary’s Office. In accordance with the Board of Directors Bylaws, the roles and responsibilities of the senior independent director include the following:
�� he may call Board meetings in the event that the Chairman and Chief Executive Officer is unable to do so, and he may chair Board meetings in the absence of the Chairman and Chief Executive Officer;
Registration Document 2014104

3
CORPORATE GOVERNANCEReport of the Chairman of the Board of Directors
�� he is the preferred contact for shareholders not represented on the Board. In this regard, a specific email address has been created ([email protected]) to enable any shareholder to contact him directly with comments or queries;
�� he coordinates the independent directors and, at his initiative, organizes independent directors’ meetings at least once a year, for which the Company manages the logistics and bears the costs. He sets the agenda for these meetings and chairs them, ensuring that each independent director has the opportunity to raise any issue not included on the agenda. Following the meetings, the senior independent director may, at his initiative, meet with the Chairman and Chief Executive Officer to discuss all or some of the comments and requests expressed by the independent directors. If necessary, he may also decide to comment on the work of the independent directors during the full meetings of the Board;
�� he oversees the formal assessments of the Board’s operating procedures and validates the corresponding report;
�� he may request that the Chairman and Chief Executive Officer add items to Board meeting agendas. In any event, he approves the annual plan of the strategic issues that will be included in the Board meeting agendas, as submitted by the Chairman and Chief Executive Officer;
�� he is in charge of dealing with any cases of conflict of interest that may arise among members of the Board of Directors.
In 2014 Mr. Citerne oversaw the assessment of the Board’s procedures and organized and chaired two meetings solely for independent directors.
Mr. Citerne’s term of office as a director is due to expire at the close of the Annual Shareholders’ Meeting to be held to approve the financial statements for the year ended December 31, 2014 and shareholders will be invited to re-elect him. If he is re-elected, the Board plans to re-appoint him as its Vice-Chairman and as senior independent director.
Secretary to the Board of Directors
François Pinon, Group General Counsel, has been appointed by the Board of Directors to serve as Board Secretary.
Powers of the Board of Directors
The Company is governed by a Board of Directors, which determines the Company’s strategy, oversees its implementation, examines any and all issues concerning the efficient running of the business, and makes decisions on all matters concerning the Company.
The Board of Directors deals with all matters falling within the powers vested in it under the applicable laws and regulations. In particular, the Board of Directors is responsible for:
a) approving the annual budget and business plan presented by the Chairman and Chief Executive Officer;
b) reviewing and approving all of the Group’s strategic objectives, at least once a year, in accordance with the Board’s Bylaws;
c) authorizing the following decisions of the Chairman and Chief Executive Officer prior to the decisions being implemented:
�y any and all immediate or deferred financial commitments representing more than €100 million per transaction. «Financial commitments» are defined as:
�- any and all acquisitions or disposals of assets and majority or minority interests in other companies, with the amount of the commitments determined by reference to the entity’s enterprise value,
�- any and all direct investments, for example for the creation of a business, the construction, refurbishment or extension of a hotel property, or expenditure on technological developments,
�- rental investments, measured on the basis of the market value of the leased asset,
�- hotel management contracts with a guaranteed minimum fee,
�- any and all loans to entities in which the Company or one of its subsidiaries does not hold the majority of the shares and voting rights, and any and all commitments to participate in share issues by such entities,
�y any and all financing operations representing more than €1 billion (carried out through one or more transactions). The Chairman and Chief Executive Officer is authorized to carry out any and all financing operations of up to €1 billion without obtaining prior approval from the Board of Directors, provided that such operations are undertaken in accordance with the annual Group financing policy as approved in advance by the Board of Directors. In this case, the Chairman and Chief Executive Officer is required to inform the Board of Directors of the operations after they have been completed. In addition, the Board’s prior approval is not required for borrowings due in less than one year,
�y any and all transactions that may impact the Group’s strategy or lead to a material change in the Group’s business base (mainly entry into a new business or withdrawal from an existing business), whatever the amount of the transaction,
�y any and all transactions involving the Company’s shares carried out in application of Article L. 225-209 of the French Commercial Code that exceed one million shares per transaction or two million shares per year;
d) authorizing the Chairman and Chief Executive Officer to issue guarantees, bonds and endorsements in the Company’s name, up to a cumulative amount of €1 billion per year. In accordance with the Company’s Bylaws, any such authorizations may be given for a period of one year. The Chairman and Chief Executive Officer is required to report to the Board of Directors each year on the amount and nature of guarantees, bonds and endorsements issued under the authorization;
e) discussing and deciding on any proposed changes to the Group’s management structure and reviewing information about the main organizational changes.
The Board shall be kept regularly informed of the Group’s financial position, cash position and commitments as well as the Group’s strategy and main policies in the areas of human resources, organization and information systems, and shall discuss them periodically.
Assessing the Board of Directors’ operating procedures
In addition to regularly discussing its procedures during scheduled meetings, the Board of Directors also periodically performs a formal assessment of its operations. The latest such formal assessment was carried out in 2014 by an external consultant under the supervision of the senior independent director. After interviewing the Chairman
Registration Document 2014 105

CORPORATE GOVERNANCEReport of the Chairman of the Board of Directors3
and Chief Executive Officer, the Vice-Chairman Senior independent director, the other members of the Board and the Board Secretary, based on a questionnaire approved in advance by the Senior Independent Director, the consultant presented the results of the assessment at the Board meeting held on December 12, 2014.
Overall, the assessment showed that the directors are satisfied with the allocation of powers between the Chairman and Chief Executive Officer and the Board of Directors, as well as with the quality of the discussions held during meetings of the Board and Board Committees. However, the directors did feel that the information provided to them could be improved, notably by including agenda items at Board and Committee meetings related to issues such as the Group’s human resources and its competitive positioning.
The Company has used the assessment report to draw up an action plan aimed at enhancing the Board’s operating procedures, which was approved at the Board of Directors February 17, 2015 meeting based on the recommendation of the Compensation, Appointments and Corporate Governance Committee. The measures included in the plan notably involve setting up an induction program to make it easier for new directors to learn about the Group and its governance, strategy and organization. The induction program entails (i) providing Directors with certain documents concerning the Group, (ii) meeting with the Chairman and Chief Executive Officer, the Vice-Chairman of the Board, the Board Secretary, other directors and members of Accor’s Executive Committee, and (iii) onsite visits to one or more Group hotels. Lastly, with a view to enhancing the information given to directors, an annual schedule of Board and Board Committee meetings will be sent to the directors at the beginning of each calendar year, with agenda items on the issues identified in the assessment report.
Membership of the Board of Directors and the independence of directors
The Board of Directors currently has 12 members, including one employee representative director appointed on May 2, 2014 by the trade union that obtained the largest number of votes in the most recent trade union elections within the Group, in accordance with Article 12 of the Company’s Bylaws. Five of the directors are women and six are deemed to be independent based on the criteria listed in the AFEP/MEDEF Code. Consequently, the Company complies with the Board representation recommendations in the AFEP/MEDEF Code as, excluding the employee representative director, the proportion of women on the Board is 36% and the proportion of independent directors is 54%.
The Board assesses the independence of its members each year based on the criteria listed in the AFEP/MEDEF Code, which states that in order for a director to be considered independent he or she must not:
�� be – nor have been at any time in the last five years – an employee or an executive director of the corporation, or an employee or director of its parent or a company that it consolidates;
�� be an executive director of a company in which the corporation directly or indirectly holds a directorship, or in which an employee appointed as such or an executive director of the corporation (current or in the past five years) holds a directorship;
�� be a customer, supplier, investment banker or commercial banker:
�y that is material for the corporation or its group, or
�y for which the corporation or its group represents a significant part of the entity’s activity;
�� have close family ties with an executive director;
�� have been an auditor of the corporation in the last five years;
�� have been a director of the corporation for more than twelve years.
Directors who represent major shareholders of the Company may be considered as independent provided that they do not take part in the control of the Company. If the shareholder owns 10% or more of the Company’s capital or voting rights, the Board of Directors must systematically review whether that shareholder’s representative may be qualified as independent, based on a report issued by the Compensation, Appointments and Corporate Governance Committee and taking into account the Company’s capital structure and any potential conflicts of interest.
On February 11, 2015, the Compensation, Appointments and Corporate Governance Committee reviewed the independent status of the members of the Board of Directors, focusing in particular on whether or not the business relations that may exist between the Company and certain directors are material. For that purpose, it examined the amounts of the transactions carried out during the year with the companies in which the directors hold executive positions, and compared those amounts with Accor’s consolidated revenue and equity for 2014.
Following the Committee’s review, the Board of Directors noted that Accor did not have any material business relations with the companies in which Sophie Gasperment, Iris Knobloch, Philippe Citerne and Jean-Paul Bailly hold executive positions.
The Board examined the business relations between Accor and Groupe Canal Plus, where Bertrand Meheut is Chairman of the Management Board, and noted that these relations represented 0.22% of the Group’s revenue and 0.31% of its equity.
The fees paid by Accor in 2014 to Havas, of which Mercedes Erra is Executive President, represented 0.09% of the Group’s revenue and 0.13% of its equity.
In view of the results of this analysis, and based on the criteria above, on February 17, 2015, the Board affirmed that Mercedes Erra, Sophie Gasperment, Iris Knobloch, Jean-Paul Bailly, Philippe Citerne and Bertrand Meheut qualify as independent directors.
Lastly, Philippe Citerne’s term of office as a director is due to expire at the close of the Annual Shareholders’ Meeting to be called to approve the financial statements for the year ended December 31, 2014. If he is re-elected for a three-year term, he will no longer qualify as an independent director under the criteria in the AFEP/MEDEF Code only on the expiration of the three-year term, as during this three-year period he will cross the threshold of having been a director of Accor for more than twelve years.
Registration Document 2014106

3
CORPORATE GOVERNANCEReport of the Chairman of the Board of Directors
Independence criteria applied (as at February 17, 2015)
Not to be an employee
or executive director
of the Company
No cross-directorships
No material business relations with the
Company
No family ties with an
executive director
Not to have been an
auditor or a former
auditor
Not to have been a
director of the Company for more than
12 years (1)
Not to own more than 10% of the Company’s
share capital
Jean-Paul Bailly √ √ √ √ √ √ √
Sébastien Bazin √ √ √ √ √ √
Philippe Citerne √ √ √ √ √ √ √
Iliane Dumas(2) √ √ √ √ √ √
Mercedes Erra √ √ √ √ √ √ √
Sophie Gasperment √ √ √ √ √ √ √
Jonathan Grunzweig √ √ √ √ √ √
Iris Knobloch √ √ √ √ √ √ √
Bertrand Meheut √ √ √ √ √ √ √
Virginie Morgon √ √ √ √ √ √
Nadra Moussalem √ √ √ √ √ √
Patrick Sayer √ √ √ √ √ √
(1) Determined based on the scheduled expiration date of the director’s term of office.(2) Director representing employees
In accordance with the Company Bylaws and the Board of Directors Bylaws, Paul Dubrule and Gérard Pélisson, Accor’s Founding Co-Chairmen, may attend Board meetings in a consultative capacity, and may be invited to attend meetings of the Board Committees.
Minimum shareholding requirement and preventing conflicts of interest
At the Annual Shareholders’ Meeting held on April 29, 2014, the Company’s Bylaws were amended to increase the minimum number of Accor shares that directors are required to hold in registered form from 500 to 1,000. In addition, to emphasize the importance of directors’ attendance at Board and Committee meetings and to comply with the related recommendation in the AFEP/MEDEF Code, the Board of Directors Bylaws provide that two-thirds of the fees allocated to directors must be based on their attendance record.
Lastly, with a view to preventing any potential conflicts of interest, members of the Board are required to complete a statement every year disclosing any and all direct or indirect ties they have with the Company. To date, none of these statements have disclosed any actual or potential conflicts of interest between a director and the Company. If a new direct or indirect business relationship is envisaged between the Company or the Group and a director or a Founding Co-Chairman, the procedure for related-party agreements provided for in Article L. 225-38 et seq. of the French Commercial Code is applied whenever the business relationship concerned does not constitute a routine agreement entered into on an arm’s length basis.
Other than routine agreements entered into on an arm’s length basis, no new agreements have been signed between any of the Company’s subsidiaries and a director, executive officer or shareholder that owns more than 10% of the Company’s capital.
In addition, directors adhere to the Board of Directors Code of Conduct (presented in Appendix B), which defines the scope of their duty of diligence, discretion and confidentiality, and specifies the rules applicable to trading in the Company’s securities.
Board of Directors’ work
The preparation and organization of the Board of Directors’ work are governed by the laws and regulations applicable to French public limited companies (sociétés anonymes), the Company’s Bylaws, and the Board of Directors Bylaws, which describe the operating procedures of the Board Committees.
The Board met ten times in 2014. The notices of meeting together with the agenda were e-mailed to all the members several days before each meeting date. In the period between two meetings, members were kept regularly informed of significant events and transactions involving the Company and were sent copies of the related press releases issued by the Company.
Registration Document 2014 107

CORPORATE GOVERNANCEReport of the Chairman of the Board of Directors3
Each ordinary Board meeting lasted four hours on average and the attendance rate was 92%.
At its meetings, the Board performed the duties required of it by law and the Company’s Bylaws. It was also informed by the Chairman and Chief Executive Officer and the Deputy Chief Executive Officer – as well as in some cases by other senior executives – of numerous significant achievements and projects relating to Accor’s business. During the year, it authorized several bond issues and the acquisition of significant real-estate assets. In addition, it approved the Digital Plan presented by Management as well as a strategic alliance in Asia with the Huazhu group (China Lodging Group).
In 2014, the Board also carried out a formal assessment of its operating procedures, reviewed the membership structure of its Committees and put forward a new director for election.
In compliance with the French decree dated August 2, 2014 and in line with its established practice, the Board reviewed the related-party agreements approved in prior years and justified its reasons for approving new related-party agreements.
Lastly, the Board called the Annual Shareholders’ Meeting and approved the Report of the Chairman of the Board of Directors.
Directors’ attendance at Board meetings in 2014
Number of meetings taken into account
Attendance rate
Jean-Paul Bailly 10 70%
Sébastien Bazin 10 100%
Philippe Citerne 10 100%
Iliane Dumas (from May 2, 2014) 5 100%
Mercedes Erra 10 100%
Sophie Gasperment 10 90%
Jonathan Grunzweig (from April 29, 2014) 5 80%
Iris Knobloch 10 90%
Bertrand Meheut 10 80%
Virginie Morgon 10 100%
Nadra Moussalem 10 100%
Patrick Sayer 10 90%
Board Committees
Board discussions and decisions on certain topics are prepared by specialist Board Committees made up of directors appointed by the Board for the duration of their term as director. These Committees examine matters falling within their terms of reference, as well as any matters referred to them for consideration by the Chairman and Chief Executive Officer. They report regularly to the Board on their work, and provide the Board with their observations, opinions, proposals and recommendations.
There are currently three standing Board Committees:
�� the Audit and Risks Committee;
�� the Compensation, Appointments and Corporate Governance Committee;
�� the Commitments Committee.
The organizational and procedural framework applicable to the Board Committees is described in the Company’s Bylaws and in the Board of Directors Bylaws, which are presented below.
The Board may also set up one or several special Committees.
Each Committee is chaired by one of its members, who is appointed by the Board on the recommendation of the Compensation, Appointments and Corporate Governance Committee. The Committee Chairman appoints a person who may or may not be a Committee member to act as secretary.
The Chairman of each Committee may ask for the Committee to be consulted on any matters falling within its terms of reference that have not been referred to it.
Each Committee is required to periodically review its rules of procedure and propose to the Board any changes that are considered necessary.
The Board Committees do not have any decision-making authority.
To assist them in their work, the Board Committees may commission technical reports from Company management or external consultants. In both cases, the Chairman and Chief Executive Officer is notified in advance. The Committees may also arrange meetings with members of management responsible for the areas under review, without any executive directors necessarily being present. In this case also, the Chairman and Chief Executive Officer is informed in advance.
Registration Document 2014108

3
CORPORATE GOVERNANCEReport of the Chairman of the Board of Directors
The Audit and Risks Committee has six members – Mercedes Erra, Virginie Morgon, Iris Knobloch, Philippe Citerne, Nadra Moussalem and Jean-Paul Bailly – all of whom have the necessary technical knowledge to fulfill the Committee’s duties. Four of these members are qualified by the Board as independent, including Philippe Citerne, who chairs the Committee and is senior independent director.
At its meeting on February 17, 2015 the Board of Directors decided to appoint Iliane Dumas as a member of the Audit and Risks Committee.
The Audit and Risks Committee met six times in 2014, with an average attendance rate of 80.5%.
Statutory Auditors, the Chairman and Chief Executive Officer, the Chief Financial Officer and the Board Secretary attend the meetings, joined when appropriate by the Senior Vice-President, Internal Audit. The meetings in which the annual and interim financial statements are reviewed begin with a discussion with the Statutory Auditors, which takes place without Company management being present.
During its meetings held in 2014, the Committee (i) prepared the Board’s review and discussion of the annual and interim financial statements, (ii) examined the implementation of the new presentation of the Group’s financial results, broken down between HotelInvest and HotelServices, (iii) examined the accounting treatment and impacts of the bond issues and of the significant real-estate acquisitions, (iv) tracked developments in the Group’s tax disputes, (v) was given presentations on upcoming changes in accounting standards and regulations, and (vi) reviewed Internal Audit findings and the yearly update of the risk map and the acquisitions of significant real-estate assets.
The Compensation, Appointments and Corporate Governance Committee comprises five members, three of whom are qualified by the Board as independent. It is chaired by Bertrand Meheut (who is an independent director), and its other members are Sophie Gasperment, Jean-Paul Bailly, Jonathan Grunzweig and Patrick Sayer.
The Compensation, Appointments and Corporate Governance Committee met three times in 2014, with an average attendance rate of 60%.
During its meetings, the Committee (i) examined the membership structure of the Board Committees, (ii) monitored the implementation of the recommendations in the report on the assessment of the Board’s operating procedures, and (iii) reviewed the terms and conditions of the performance share plans launched in 2014 and the achievement levels of the performance criteria for previously-launched stock option and performance share plans.
Also during the year the Committee reviewed the related-party agreements approved in prior years which remained in force in 2014, assessed the independence of the Company’s directors based on the criteria in the AFEP/MEDEF Code, and put forward recommendations concerning the allocation of directors’ fees among the Board members.
The Commitments Committee has five members, the majority of whom are qualified by the Board as independent. It is chaired by Patrick Sayer and its other members are Mercedes Erra, Sophie Gasperment, Philippe Citerne and Nadra Moussalem. Due to the nature of the responsibilities assigned to this Committee – which sometimes has to give its opinion on acquisitions or disposal projects within a short timeframe – Committee meetings may be called at any time, either in writing or verbally, by the Committee Chairman or by the Chairman and Chief Executive Officer.
The Commitments Committee met five times in 2014, with an average attendance rate of 92%.
During the year, the Committee’s work notably involved reviewing acquisition projects for significant real-estate assets in Europe (the MoorPark and AXA portfolios), the terms and conditions of the bond issues, and the strategic alliance project in Asia with the Huazhu group (China Lodging Group).
Conditions and procedures for attending Shareholders’ Meetings
Accor’s next Annual Shareholders’ Meeting will be held on April 28, 2015 at 10:00 a.m. at the Pullman Paris Bercy hotel, 1, rue de Libourne – 75012 Paris, France. The notice of meeting containing the agenda and draft resolutions was published in the French legal gazette (Bulletin des Annonces Légales Obligatoires) on March 23, 2015 and is available on the Company’s website at www.accor.com.
In accordance with the law, the applicable conditions and procedures for attending Shareholders’ Meetings are set out in the Company’s Bylaws, which are available on the Accor website. They notably concern admittance conditions (Article 24 of the Bylaws), organization of the meetings (Article 25), and disclosure thresholds relating to shareholders’ interests in the Company’s capital and voting rights (Article 9).
Registration Document 2014 109

CORPORATE GOVERNANCEReport of the Chairman of the Board of Directors3
Board of Directors Bylaws (as amended on April 29 and August 25, 2014)
The members of the Board of Directors of Accor (hereinafter the Company) abide by the following rules of procedure, which constitute the Bylaws of the Board of Directors.
These Bylaws are based on recommendations by French market authorities aimed at ensuring compliance with the fundamental principles of corporate governance, notably the AFEP/MEDEF Corporate Governance Code for Listed Companies as revised in June 2013.
Intended for internal use only, these Bylaws are designed to supplement the Company Bylaws by specifying the Board of Directors’ organizational and operating procedures. They may not be used by shareholders or third parties as a basis for any claims against the directors, the Company or any company of the Accor Group (hereinafter the Group). They apply, where appropriate, to the non-voting directors appointed by the Board of Directors as well as to the Founding Co-Chairmen designated in Article 21 of the Company’s Bylaws.
The existence and main provisions of these Bylaws shall be disclosed to the shareholders and to the public.
1. Composition
At least half of the directors on the Board of Directors must be independent within the meaning of the criteria set forth in the AFEP/ MEDEF Corporate Governance Code for listed companies.
Every year, the Board of Directors shall determine which of the directors are independent according to the above-mentioned criteria. The conclusions of said assessment shall be disclosed to the shareholders and to the public in the Annual Report.
2. Meetings
The Board of Directors shall hold at least six meetings per year, of which one dedicated to reviewing the budget and one dedicated to a strategic review of the Group’s operations. The proposed dates of each year’s meetings shall be sent to the directors no later than November 30 of the previous year. Notices of Meeting shall be sent by mail, e-mail or fax or given verbally, by the Board Secretary.
The draft minutes of each meeting shall be sent to the directors within 15 days after said meeting and submitted to the Board for approval during the second meeting following that to which they relate.
Part of at least one meeting a year shall be devoted to assessing the Board’s efficiency and effectiveness, in order to identify possible areas for improvement. In addition, the Board of Directors shall conduct a formal self-assessment at least every two years.
Non-executive directors shall meet once a year, without the executive directors or corporate officers being present, to assess the latter’s performance and consider the future management structure.
For the purpose of calculating the quorum and majority, directors who take part in meetings by any means making it possible to identify them and enabling their actual participation pursuant to current statutes and regulations shall be deemed to be in attendance.
3. Information for the Board of Directors
The directors shall be provided with all the information necessary for them to carry out their duties.
Except when compliance with confidentiality or physical obstacles make it impossible, an information package pertaining to the items on the agenda that require prior study shall be sent to the directors in a timely manner prior to the meetings.
In addition, the directors shall be kept periodically informed between meetings of all significant events and transactions in the life of the Group. To this end, they shall be provided with all the press releases issued by the Company and a periodic summary of financial analysts’ research reports on the Group and, when necessary, the actual reports.
The Board shall be kept regularly informed of the Group’s financial position, cash position and commitments as well as the Group’s strategy and main policies in the areas of human resources, organization and information systems, and shall discuss them periodically.
The directors shall be entitled to require the provision of any document necessary for the proceedings of the Board that has not been submitted to them. Any such requests shall be sent to the Chairman and Chief Executive Officer who may submit it to the Board for a decision.
The directors shall have the right to meet with the Group’s main executives, including without the presence of the executive directors. To do so, they must first file a request with the Chairman and Chief Executive Officer.
4. Powers of the Board of Directors
The Board of Directors deals with all matters falling within the powers vested in it under the applicable laws and regulations.
In addition, the Board of Directors shall:
a) approve the annual budget, including the annual financing plan, as well as the business plan presented by the Chairman and Chief Executive Officer;
b) review and approve the Group’s overall strategy, at least once a year, in accordance with Article 2 of these Bylaws;
c) based on the Commitments Committee’s recommendation, authorize the following decisions of the Chairman and Chief Executive Officer prior to their implementation:
(i) any and all immediate or deferred financial commitments representing more than €100 million per transaction. “Financial commitments” are defined as:
�- any and all acquisitions or disposals of assets and majority or minority interests in other companies; in the latter case, the amount of the commitment is considered as being equal to the entity’s enterprise value,
�- any and all direct investments, for example for the creation of a business, the construction, refurbishment or extension of a hotel property, or expenditure on technological developments,
�- rental investments, measured on the basis of the market value of the leased asset,
�- hotel management contracts with a guaranteed minimum fee,
�- any and all loans to entities in which the Company or one of its subsidiaries does not hold the majority of the shares and voting rights, and any and all commitments to participate in share issues by such entities. In the case of financing transactions, however, the Chairman and Chief Executive Officer is authorized to make any and all financial commitments of up to €1 billion
ANNEXE A
Registration Document 2014110

3
CORPORATE GOVERNANCEReport of the Chairman of the Board of Directors
without obtaining prior approval from the Board of Directors, provided that such commitment is undertaken in accordance with the annual Group financing policy as approved in advance by the Board of Directors. In this case, the Chairman and Chief Executive Officer shall inform the Board of Directors of the transactions after they have been completed. It is noted as well that the Board’s prior approval is not required for borrowings due in less than one year, whatever the amount borrowed,
(ii) any and all transactions that have a material impact on the Group’s strategy or lead to a material change in the Group’s business base (mainly entry in a new business or withdrawal from an existing business), whatever the amount of the transaction,
(iii) any and all transactions involving the Company’s shares carried out in application of Article L. 225-209 of the French Commercial Code, which exceed one million shares per transaction or two million shares per year;
d) authorize the Chairman and Chief Executive Officer to issue guarantees, bonds and endorsements in the Company’s name, up to a cumulative amount of €1 billion per year. In accordance with the Company’s Bylaws, any such authorizations may be given for a period of one year. The Chairman and Chief Executive Officer is required to report to the Board of Directors each year on the amount and nature of guarantees, bonds and endorsements issued under the authorization;
e) discuss and decide on any proposed changes to the Group’s management structure and review information about the main organizational changes.
5. Vice-Chairman of the Board of Directors – Senior Independent Director
In accordance with Article 14 of the Company’s Bylaws, the Board of Directors may appoint one of its independent members to act as Vice-Chairman for the duration of his or her term as director. The appointment may be terminated at any time by decision of the Board of Directors.
As specified in the Company’s Bylaws, the Vice-Chairman may call meetings of the Board of Directors if the Chairman and Chief Executive Officer is unable to do so, and shall chair Board meetings in the Chairman and Chief Executive Officer’s absence.
The Vice-Chairman shall act as the preferred contact for the other independent directors. Whenever necessary and at least once a year, he or she shall organize and lead a meeting reserved exclusively for independent directors to allow them to discuss certain issues outside full Board meetings.
The Vice-Chairman shall ensure that requests from shareholders not represented on the Board are answered, and shall make him or herself available to hear their comments and suggestions and, where necessary, answer their questions. A specific e-mail address shall be created for this purpose. The Vice-Chairman shall inform the Board of Directors about such contact with the shareholders.
In addition, the Vice-Chairman shall oversee formal assessments of the Board of Directors’ practices, approve the list of strategic issues to be discussed at Board meetings, as prepared each year by the Chairman and Chief Executive Officer, and deal with any conflicts of interest affecting Board members.
He or she shall be assisted by the Corporate Secretary services for any related administrative tasks.
6. Board Committees
Board discussions and decisions in certain areas shall be prepared by specialist Board Committees made up of directors appointed by the Board for the duration of their term. These Committees shall examine matters falling within their terms of reference, as well as any matters referred to them for consideration by the Chairman and Chief Executive Officer. They shall report regularly to the Board on their work, and provide the Board with their observations, opinions, proposals or recommendations.
To assist them in their work, the Board Committees may commission technical reports from management or from external consultants, at the Company’s expense. In both cases, the Chairman and Chief Executive Officer shall be notified in advance. The Committees may also arrange meetings with members of Company management responsible for the areas under review, without any executive directors being present. In this case also, the Chairman and Chief Executive Officer shall be informed in advance.
There are three standing Board Committees:
�� the Audit and Risks Committee;
�� the Commitments Committee;
�� the Compensation, Appointments and Corporate Governance Committee.
The Board may also set up one or several special Committees.
Each Committee shall be chaired by one of its members, appointed by the Board on the recommendation of the Compensation, Appointments and Corporate Governance Committee. The Chairman and Chief Executive Officer may be invited to attend any and all Board Committee meetings by the Chairman of the Committee concerned. However, he shall not attend the part of Compensation, Appointments and Corporate Governance Committee meetings during which agenda items concerning him personally are discussed, nor the part of Audit and Risks Committee meetings during which the Committee members discuss matters with the Statutory Auditors.
The Committee Chairman shall appoint a person who need not be a Committee member to act as secretary.
The Chairman of each Committee may ask for the Committee to be consulted on any matters falling within its terms of reference that have not been referred to it.
Each Committee shall periodically review its rules of procedure and propose to the Board any changes that are considered necessary.
The Board Committees shall not have any decision-making authority.
6.1. The Audit and Risks CommitteeThe Audit and Risks Committee shall be responsible for ensuring that the accounting policies applied for the preparation of the financial statements of the Company and the Group are appropriate and applied consistently from one period to the next. Its terms of reference also include checking that internal reporting and control procedures provide adequate assurance concerning the reliability and completeness of financial information and the control of Group risk exposure.
To this end, it carries out the following tasks:
�� it reviews the interim and annual consolidated financial statements and the financial statements of the Company, prior to their examination by the Board of Directors. This includes reviewing draft results press releases and announcements to be issued by the Company;
Registration Document 2014 111

CORPORATE GOVERNANCEReport of the Chairman of the Board of Directors3
�� it reviews the scope of consolidation and the reasons for excluding any entities;
�� it reviews the Risk Management policy and ensures that adequate systems are in place;
�� it assesses the material risk exposure and off-balance sheet commitments, and receives a copy of the Chief Financial Officer’s detailed report on these matters;
�� it obtains assurance concerning the effectiveness of the Group’s system of internal control, by reviewing the methods used to identify risks and the organizational principles and procedures of the Internal Audit Department. It is also informed of the Internal Audit program and of the results of the Internal Audits carried out;
�� it reviews the Statutory Auditors’ audit plan and the results of their audits. It receives a copy of the Statutory Auditors’ post-audit letter setting out the main issues identified during their audit and describing the main accounting options selected;
�� when the Statutory Auditors’ term is due to expire, it oversees the Auditor selection procedure and reviews the proposals submitted by the various candidates, expresses an opinion on the proposed fee budgets for statutory audit work and makes recommendations to the Board of Directors on the choice of candidate;
�� it validates the categories of additional audit-related work that the Statutory Auditors and the members of their networks may be asked to perform in accordance with the applicable laws and regulations;
�� at the end of each year, it is informed of the fees paid by Group companies to the Statutory Auditors and the members of their networks during the year, including a detailed breakdown by type of engagement, and reports to the Board of Directors on these fees, as well as on its assessment of the Statutory Auditors’ level of independence.
The Audit and Risks Committee comprises three to five members possessing the necessary technical knowledge to fulfill the Committee’s duties. A majority of these members, including the Committee Chairman, must be independent directors.
The Audit and Risks Committee holds at least three meetings per year. One meeting – attended by the Senior Vice-President, Internal Audit – is devoted to reviewing the effectiveness of the system of internal control.
The Audit and Risks Committee may make enquiries of the Statutory Auditors without the executive directors and/or the Chief Financial Officer being present, after first notifying the Chairman and Chief Executive Officer.
Calls to meeting shall be issued by the Committee Chairman and include the meeting agenda. Meetings to review the interim and annual financial statements shall be held at least three days prior to the Board meeting called to approve the financial statements. The members of the Audit and Risks Committee must receive all necessary documents on a timely basis. When members are first appointed to the Committee, they are given detailed information about accounting, financial and operational issues that are specific to the Group. The Chairman and Chief Executive Officer, the Chief Financial Officer and the Statutory Auditors shall attend Audit and Risks Committee meetings as needed.
6.2. The Commitments CommitteeThe Commitments Committee is comprised of no more than five members. Meetings of the Committee may be called at any time, in writing or verbally, by the Committee Chairman or the Chairman and Chief Executive Officer.
The Commitments Committee’s recommendations are adopted by a simple majority and must then be discussed by the Board of Directors before the commitments can be implemented by the Group. The Commitments Committee is therefore responsible for preparing Board meetings and making recommendations to the Board on the following matters:
�� any mergers, demergers or asset transfers;
�� any amendments to the Company’s corporate purpose;
�� any and all commitments or transactions for which the Chairman and Chief Executive Officer is required to obtain the Board of Directors’ prior approval in accordance with Article 4. c) of these Bylaws.
6.3. The Compensation, Appointments and Corporate Governance Committee
The Compensation, Appointments and Corporate Governance Committee’s role is to prepare the Board of Directors’ decisions pertaining to the compensation of executive directors and the policy for granting options to purchase new or existing shares of Company stock and making stock grants, to prepare changes in the composition of the Company’s management bodies, and to ensure that the principles of good corporate governance are properly applied.
To this end, it carries out the following tasks:
Appointments:
�� it prepares recommendations, in liaison with the Chairman and Chief Executive Officer, regarding the succession of the executive directors and the selection of new directors. In selecting possible directors, the Committee shall take into consideration the desirable balance in the Board’s composition, take special care that each candidate has the required capabilities and availability and ensure that the directors have the array of experience and skills necessary to enable the Board of Directors to carry out its duties effectively with the required objectivity and independence vis-à-vis both senior management and a given shareholder or group of shareholders;
�� it shall be informed of the succession plan concerning members of the Group’s Executive Committee.
Compensation:
�� it studies and prepares recommendations regarding both the salary and bonus portions of the executive directors’ short-term compensation, the granting of medium- and long-term incentives such as performance shares and stock options, all the provisions regarding their retirement plans and all other in-kind benefits;
�� it defines and implements the rules for setting the bonus portion of the executive directors’ compensation while ensuring that said rules are consistent with the annual appraisal of executive directors’ performance and with the Group’s medium-term strategy;
�� it gives the Board an opinion regarding the general policy for granting stock options and performance shares, and the plans proposed by the Chairman and Chief Executive Officer;
�� it is kept informed of and gives an opinion on the compensation policy for members of the Group Executive Committee and reviews the consistency of such policy;
Registration Document 2014112

3
CORPORATE GOVERNANCEReport of the Chairman of the Board of Directors
�� it issues a recommendation to the Board on the overall amount of directors’ fees, which is submitted to shareholders for approval. It proposes to the Board rules for allocating said directors’ fees and the individual amounts of the payments to be made as fees to the directors based on their attendance at Board and Committee meetings pursuant to Article 8 of these Bylaws;
�� it reviews the policy and the projects proposed by the Chairman and Chief Executive Officer regarding employee share issues;
�� it reviews the insurance coverage taken out by the Company regarding the civil liability of executive directors;
�� it approves the information provided to shareholders in the Annual Report regarding (i) executive director compensation; (ii) the principles and procedures used to set such compensation; and (iii) the grant and exercise of stock options and the grant of performance shares.
Corporate Governance:
�� it is tasked, in liaison with the Chairman and Chief Executive Officer, with issuing recommendations on implementing best corporate governance practices and preparing the assessment of the Board’s work;
�� it periodically reviews whether the directors meet the independence criteria defined by the Board and makes recommendations if it appears necessary to review the independent status of directors;
�� it continuously monitors changes in the Company’s ownership structure and determines how the Company’s awareness of such changes could be improved, particularly through legal procedures;
�� it reviews all cases where there is a conflict of interest concerning one or more shareholders and (i) the interests of the Company or (ii) the interests of the shareholders as a whole;
�� it reviews the measures implemented within the Group concerning business ethics as well as any cases of conflict of interest concerning directors or members of the Executive Committee;
�� it reviews and issues recommendations on best corporate governance practices, particularly concerning the membership structure of the Board of Directors;
�� it prepares all matters for discussion between the Company and its shareholders relating to (i) changes in their equity interests; (ii) their representation in the Company’s corporate governance structures; and (iii) any contractual commitments between them and the Company.
The Compensation, Appointments and Corporate Governance Committee comprises three to five members. A majority of these members, including the Committee Chairman, must be independent directors.
The Compensation, Appointments and Corporate Governance Committee shall hold at least three meetings per year. Calls to meetings are issued by the Committee Chairman and include the meeting agenda.
7. Secretary to the Board of Directors
Pursuant to the Company’s Bylaws, the Board of Directors shall name a Secretary who need not be a director.
The Board Secretary’s role is to call members to meetings of the Board of Directors when requested to do so by the Chairman and Chief Executive Officer and to prepare the draft minutes of the meetings of the Board of Directors, which are then submitted to the Board for approval. He or she is tasked with sending the working documents to the directors according to the procedure set forth in Article 3 of these Bylaws and in general responds to any request from directors for information pertaining to their rights and obligations, the Board’s operation or the life of the Company.
His or her duties also include maintaining and updating the statements designed to prevent conflicts of interest, as provided for in Article 3 of the Board of Directors Code of Conduct.
Lastly, the Board Secretary shall attend the meetings of the Board Committees as needed at the request of the Chairman and Chief Executive Officer or the Committee Chairmen. He or she may also be tasked with sending the working documents to the Committee members.
8. Directors’ fees
The annual amount of directors’ fees approved by shareholders shall be allocated by the Board based on a recommendation by the Compensation, Appointments and Corporate Governance Committee.
Board members shall be entitled to a fixed portion of fees for their duties as directors and, as the case may be, their role as a member or Chairman of one or more Board Committees, as well as a variable portion of fees determined according to their actual attendance at Board or Committee meetings.
Distribution is based on the following principles:
�� the annual amount of directors’ fees shall be divided into an amount set aside for the Board and an amount set aside for the Board Committees, as determined by the Board of Directors. The amount for the Board Committees shall subsequently be divided equally among the three Committees;
�� one-third of the amount set aside for the Board and for each Committee shall be used to pay the fixed portion of directors’ fees, based on a lump sum determined by the Board and in line with the number of directors or Committee members concerned;
�� two-thirds of the amount set aside for the Board and each Committee shall be used to pay the variable portion of directors’ fees based on a per-meeting amount set by the Board depending on the total number of meetings held during the year;
�� the Vice-Chairman of the Board of Directors shall receive the fixed portion of directors’ fees payable to all directors as well as a fixed portion of a flat amount determined by the Board of Directors;
�� Committee Chairmen shall receive a fixed portion of directors’ fees equal to double the fixed portion payable to Committee members;
�� directors who also hold the position of Chairman and Chief Executive Officer, Chief Executive Officer or Deputy Chief Executive Officer shall not receive any directors’ fees;
�� directors representing employees shall not receive any directors’ fees. The directors’ fees that they would have received shall not be distributed and instead the Group has pledged to allocate the equivalent amount to supporting Group employees in difficulty;
�� directors’ fees shall be paid no later than three months following the end of the previous fiscal year.
Registration Document 2014 113

CORPORATE GOVERNANCEReport of the Chairman of the Board of Directors3
Board of Directors Code of Conduct (as amended on April 29, 2014)
The Board of Directors collectively represents all the shareholders and acts in the Company’s interest. Each director, regardless of the reasons for his appointment and his qualification by the Board of Directors as regards the independence criteria set forth in the AFEP/MEDEF Corporate Governance Code for listed companies, represents all the shareholders and as such adheres to the principles of conduct defined in this Code of Conduct.
The non-voting directors appointed by the Board of Directors and the Founding Co-Chairmen referred to in Article 21 of the Company’s Bylaws shall be governed by all of the provisions of this Code of Conduct that are applicable to them.
Duty of due care
Directors shall carry out their duties as they see fit in the best interest of the Company. They shall strive at all times to improve their knowledge of the Group and its business lines and agree to be bound by a duty of vigilance and warning. They shall devote the necessary time and attention to their directorship in particular by attending the meetings of the Committees to which they belong, the meetings of the Board of Directors and the Shareholders’ Meetings.
In addition to complying with the applicable statutes and regulations on the holding of several directorships, it is the responsibility of each director to ascertain whether his/her duties as a director of the Company are compatible with the directorships or positions that he/she holds in other companies in particular as regards the workload. Each director shall disclose periodically to the Company the directorships that he/she holds in any other company in order to enable the Company to comply with its statutory disclosure obligations in this regard.
Information
Directors have the duty to request the information that they deem necessary to carry out their duties from the Company’s management via the Chairman and Chief Executive Officer or, where applicable, the Board Secretary. They shall have the right to meet with the Company’s principal executives, whether or not in the presence of the Chairman and Chief Executive Officer, after having requested such a meeting from the Chairman and Chief Executive Officer.
When a new director takes up office, the Board Secretary shall provide him/her with an information package containing the Company’s Bylaws, the Board of Directors Bylaws, the Board of Directors Code of Conduct as well as the principal statutes and regulations regarding directors’ liability.
Directors may consult the Board Secretary at any time regarding the scope of said statutes and regulations and the rights and obligations incumbent on him/her.
Transparency and preventing conflicts of interests
Directors strive to remain independent in all circumstances as regards their analysis, judgment, decisions and actions.
Directors agree not to seek out or accept any benefit likely to call into question their independence.
Any director that is directly or indirectly in a position of a conflict of interests – even potentially – with respect to the interest of the Company because of the positions that he/she holds, and/or any interests that he/she has elsewhere, shall inform the Chairman and Chief Executive Officer or any individual designated by the Chairman and Chief Executive Officer. He/she shall abstain from the debates and decision-making on the matters concerned and may have to leave a Board meeting during the debate, and, where applicable, the vote.
When he/she takes up office, and subsequently every year no later than January 31, each director shall fill in a statement according to the template attached to this Code of Conduct in which he/she discloses any relationships of any kind with Group companies, their managers, suppliers, customers, partners or competitors.
He/she shall send this statement to the Chairman and Chief Executive Officer and a copy thereof to the Board Secretary.
Directors shall refrain from participating, directly or indirectly, in any transaction of any amount with a Group company invol-ving the sale by said company of one or several hotel assets.
The Board of Directors shall deliberate on the rates granted to directors when staying in a non-official capacity in Group hotels.
Trading in Company securities by the directors
Directors have access to insider information. Such information, if made public, could impact the price of the Company’s sharesor any other securities issued by the Company.
Pursuant to the applicable statutes and regulations, they shall be required:
�� to refrain from using insider information to trade such securities either directly or via an intermediary;
�� not to knowingly allow a third party to carry out such trading;
�� not to disclose such information to third parties even through carelessness.
In addition, without prejudice to the statutes and regulations on insider trading, periods known as “negative windows” shall be determined each year. During such periods, directors shall refrain from trading the Company’s shares or any other securities issued by the Company (including exercising stock options), either directly or via an intermediary, even via the trading of derivatives. Such periods shall consist of (i) 30 calendar days prior to the date of publication of the annual and interim consolidated financial statements, as well as the day of these publications and the following day, and (ii) 15 calendar days prior to the date of publication of quarterly revenue figures, as well as the day of these publications and the following day.
The exact dates of the ”negative windows“ shall be disclosed each year to the directors by the Board Secretary. If specific ”negative windows“ are set up in connection with financial or strategic transactions, the directors shall be informed immediately thereof by the Board Secretary.
Directors may not hedge the risks of losses on the Company shares or stock options they own.
Each director shall be responsible for reporting to the French securities regulator (Autorité des Marchés Financiers) and to the Company (to the attention of the Board Secretary) any trading involving the
ANNEXE B
Registration Document 2014114

3
CORPORATE GOVERNANCEReport of the Chairman of the Board of Directors
Company’s shares or any other securities issued by the Company and carried out by him/her or individuals that are closely related to him/her, pursuant to applicable statutes and regulations.
Directors may consult the Board Secretary at any time regarding the scope of the ”negative windows“ system and on the conditions of its application to any specific case.
Duty of discretion and confidentiality
Pursuant to Article 15 of the Company’s Bylaws, directors shall be bound by a duty of discretion and confidentiality in the interest of the Company. To that end, they undertake that they shall be responsible for maintaining the professional secrecy of all the confidential information to which they have access, the resolutions and the operation of the Board of Directors and of any Committees to which they may belong, as well as the content of the opinions issued or votes cast during Board or Committee meetings.
When requested by the Chairman and Chief Executive Officer, each director agrees to return or destroy immediately any document in his/her possession containing confidential information.
In addition, directors shall be required to consult with the Chairman and Chief Executive Officer prior to any personal disclosure that they may make in the media on matters involving or likely to affect the Group, the Company and/or its governing bodies. This provision shall not apply to directors who concurrently hold the position of Chief Executive Officer or Deputy Executive and who may have to make disclosures in that capacity in the name of the Company.
Shares owned privately
Pursuant to the Company’s Bylaws, directors other than those representing employees must own 1,000 shares in the Company. Such shares and any shares acquired in excess of that number must be registered shares.
The permanent representatives of legal entities that are directors shall be subject to the same obligation.
The number of Company shares owned by each director (and each permanent representative of any legal entity that is a director), excluding that of Company shares owned by directors representing employees, shall be publicly disclosed by the Company.
3.2.2. INTERNAL CONTROL AND RISK MANAGEMENT PROCEDURES
3.2.2.1. Internal control objectives of the parent company
The Group applies the internationally recognized definition of internal control formulated by the Committee of Sponsoring Organizations of the Treadway Commission (COSO). According to this definition, internal control is a process, effected by an entity’s Board of Directors, management and other personnel, designed to provide reasonable assurance regarding the achievement of objectives in the following categories:
�� effectiveness and efficiency of operations;
�� reliability of financial reporting;
�� compliance with applicable laws and regulations.
This definition complies with that set out in the Reference Framework for Risk Management and Internal Control Systems issued by the AMF, which states:
”Internal control is a Company’s system, defined and implemented under its responsibility, which aims to ensure that:
�� laws and regulations are complied with;
�� the instructions and directional guidelines fixed by Executive Management or the Management Board are applied;
�� the Company’s internal processes are functioning correctly, particularly those implicating the security of its assets;
�� financial reporting is reliable; and
generally, contributes to the control over its activities, to the efficiency of its operations and to the efficient utilization of its resources.“
By helping to anticipate and control the risks involved in not meeting the objectives the Company has set for itself, the internal control system plays a key role in conducting and monitoring its various activities.
One of the objectives of the internal control system is therefore to anticipate and control the risks arising in the course of the Company’s business, as well as the risk of errors or fraud, particularly in the areas of accounting and finance. However, as stated in the AMF’s Reference Framework, internal control procedures cannot provide an absolute guarantee that the Company’s objectives will be achieved, no matter how well the system is designed or how well the procedures are applied.
The following description of the Company’s internal control and risk management systems was prepared based on the aforementioned Reference Framework and its application guide.
3.2.2.2. Summary description of internal control and risk management procedures
The internal control and risk management procedures described below cover the parent company and all of its consolidated subsidiaries. Whenever a new entity is consolidated, it implements a systematic plan to deploy the internal control procedures and it is included in the audit plan on a priority basis. The Audit and Risks Committee pays particular attention to ensuring that these plans are properly implemented.
Registration Document 2014 115

CORPORATE GOVERNANCEReport of the Chairman of the Board of Directors3
Overall organization of the internal control and risk management systems
Main participants
Internal control and risk management procedures are part of the policies defined by the Board of Directors and are implemented under the direct responsibility of the operating divisions and corporate functions. Internal control and risk management are everyone’s responsibility, from executive officers to front-line employees.
In this regard, the main structures responsible for overseeing the internal control and risk management systems are as follows:
Executive ManagementIn accordance with the law and the Company’s Bylaws, the Chairman and Chief Executive Officer represents the Company in its dealings with third parties and has the broadest powers to act on behalf of the Company in all circumstances. The situations where exercise of the Chairman and Chief Executive Officer’s powers is subject to the prior approval of the Board of Directors are detailed in paragraph 3.2.1 of this report.
The Chairman and Chief Executive Officer has structured the Group around two core competencies:
�� HotelServices: a hotel operator and brand franchisor;
�� HotelInvest: a hotel owner and investor.
For the purpose of carrying out his duties, the Chairman and Chief Executive Officer is assisted by an Executive Committee which includes representatives from all of the operating divisions and corporate functions. This Committee comprises the following members:
�� the Deputy Chief Executive Officer in charge of Transformation, Human Resources and Legal Affairs, whose responsibilities also include Safety & Security and Internal Audit;
�� the Chief Financial Officer;
�� the COO of HotelInvest;
�� the Deputy Chief Executive Officer in charge of Marketing, Digital Media, Distribution and Information Systems;
�� the CEO of HotelServices, the Americas;
�� the CEO of HotelServices, Asia-Pacific;
�� the CEO of HotelServices, United Kingdom, Ireland, Benelux, Switzerland, Russia and CIS;
�� the CEO of HotelServices, Germany, Poland and Central Europe;
�� the CEO of HotelServices, France;
�� the CEO of HotelServices, Mediterranean, Africa and the Middle East.
In addition, several corporate departments that provide services to both HotelServices and HotelInvest report directly to the Chairman and Chief Executive Officer, namely:
�� the Group Business Development Department;
�� the Strategy Department;
�� the Institutional Relations Department;
�� the Group Media Relations Department;
�� the Corporate Brand, CSR and Internal Communications Department.
Group FinanceThe Chief Financial Officer ensures that the Group’s financial policies are properly implemented, in particular by circulating to the Divisions the accounting principles and standards used to prepare the consolidated financial statements.
The Group Finance function is organized around the following departments:
�� the Finance Senior Executive Office, which is in charge of Group financial control and Group financial information systems;
�� the Group Corporate Treasury, Financing and Credit Management Department;
�� the Group and France Tax Department, which is tasked with implementing and coordinating Group tax planning measures, particularly relating to cross-border transactions;
�� the Financial Communication and Investor Relations Department, which is in charge of releasing information on the Group’s strategy and results to the financial markets;
�� the Group Consolidation Department, which is also in charge of the Group’s accounting standards (IFRS);
�� the parent company’s Accounting Department;
�� the Finance Department of the company in charge of the Group’s loyalty program and Distribution and Marketing management control;
�� the Information Systems’ Finance Department;
�� the Project Finance Department, which coordinates the Finance Department’s cross-business projects;
�� the Group Procurement Department.
Group Finance maintains regular contact with the Statutory Auditors, who audit the financial statements of the Company and the Group in accordance with the applicable laws and regulations.
Risk Management and InsuranceThe Risk Management and Insurance Department coordinates the Group’s structured process for identifying, analyzing and assessing risks and implementing risk prevention action plans adapted to the identified risks. It is also responsible for rolling out risk identification processes (e.g. risk mapping) and provides support to the Group’s operational and corporate departments in this area. In particular, as part of the overall process for managing hotel risks, it defines, promotes and coordinates personal safety procedures in the Group’s hotels and conducts inspections to ensure that these procedures are properly implemented by the people concerned. In addition, it is responsible for arranging appropriate coverage for the Group’s risks, notably by setting up insurance policies.
Group Safety & SecurityThe Group Safety & Security Department advises and assists Executive Management in defining Group-wide safety and security policies. It is responsible for deploying, coordinating and monitoring measures aimed at preventing malicious damage in Group hotels and protecting our customers, employees and infrastructures. Its duties include consulting, performing audits, providing operational support and helping to find secure locations for new hotels in high-risk countries.
Registration Document 2014116

3
CORPORATE GOVERNANCEReport of the Chairman of the Board of Directors
The Safety & Security Department tracks the safety and security situation in each of the Group’s host countries on a daily basis, reviewing the geopolitical context and public health and hygiene conditions, as well as risks relating to extreme weather events and social unrest. It is backed by (i) a network of locally-based internal and/or external health and safety officers, (ii) correspondents within certain French and foreign government departments such as the Ministry of Health, the Ministry of Foreign Affairs, the Ministry of the Interior and the Ministry of Defense, and (iii) private-sector contacts (such as consultants and networks of French and non-French safety officers).
The Group has set up a structured, aligned crisis management organization with specifically-designated teams for the head office and the operating units, in order to quickly ensure the safety of customers, local employees, expatriates and onsite service providers in the event of a crisis. The effectiveness of the crisis management procedures and systems put in place has been clearly demonstrated when dealing with local/and or regional crises.
At end-2014, the Safety & Security Department had an international network of 44 crisis management officers.
Corporate Internal AuditCorporate Internal Audit, which has a dotted-line reporting relationship with the Group Internal Control Committee (cf. 3.2.2.5) and the Audit and Risks Committee, is the cornerstone of the internal control system. It is responsible for helping to develop internal control tools and standards, and for performing internal audits based on the annual audit program approved by the Group Internal Control Committee.
Corporate Internal Audit coordinates its audit plans with the Statutory Auditors’ work plans. It is also responsible for coordinating the activities of the local Internal Audit Departments within the Divisions.
At December 31, 2014, Corporate Internal Audit had a staff of eight auditors. In addition, Group Information Systems Internal Audit, which reports to Corporate Internal Audit, had a team of two auditors at that date.
Local Internal Audit Departments in the DivisionsThe local Internal Audit Departments set up in the main Divisions report to their Division’s Finance Director and have a dotted-line reporting relationship with Corporate Internal Audit. The sole exception to this rule is the local Internal Audit Department for the Europe, Middle East and Africa region, which reports directly to the Senior Vice-President, Internal Audit.
These local departments have direct ties with Corporate Internal Audit, thereby ensuring that they comply with the fundamental principles of conduct and independence and follow the standards required of the Internal Audit profession, as well as the methods recommended by the Group. These ties also guarantee that the local Internal Audit Departments are given adequate resources to fulfill their objectives.
At end-2014, the local Internal Audit Departments in the Divisions had a total of 21 auditors.
The accounting and financial information system
The Group’s accounting and financial information system is designed to ensure the security, reliability, availability and traceability of information. It is based on an interfaced reporting and consolidation system that covers substantially all of the Group’s operations with the aim of providing consistent accounting data at company and Group level.
A specifically-designed user manual has been prepared and issued to the employees concerned, in order to guarantee that the systems are correctly used and that the information obtained is appropriate and relevant.
The Group has also set up processes to ensure the security of the accounting and financial information system, as well as the integrity of the data involved. These include regular back-ups and programmed controls that trigger warnings in the event of incorrect data entries.
The accounting and financial information system is regularly updated in line with the Group’s specific needs.
Internal reporting
The Group ensures that relevant information is communicated in a timely manner to the appropriate persons so that they can exercise their duties in accordance with the Group’s standards. To this end, a set of procedures defining best practices and reporting processes has been circulated internally.
Corporate values and principles
The Group’s internal control system supports the corporate values expressed by the Board of Directors and Executive Management and communicated to all employees. Accor has drawn up rules of conduct and integrity relating to employee behavior and relations with customers, shareholders, business partners and competitors, and in 2014 it replaced its Management Ethics Guide by a more comprehensive Ethics and Corporate Social Responsibility Charter. This new Charter provides a clear framework for the responsible conduct that the Group expects in terms of ethics, integrity, legal compliance and overall corporate social responsibility.
The Internal Audit Charter aims to provide a Group-level cross-functional view of Internal Audit resources and methodologies, as well as the methods used to communicate the results of internal audits. To this end, it defines the framework for Internal Audit activities within the Group, based on the professional standards issued by IFACI and other bodies, which set down strict Codes of conduct for internal auditors. The Charter also formally describes the role, membership and procedural rules of the Group Internal Control Committee as well as the procedure to be followed by Corporate Internal Audit to coordinate the activities of the local Internal Audit Departments.
The Internal Audit Charter has been signed by the Group’s Chairman and Chief Executive Officer, the Deputy Chief Executive Officer, the Chief Financial Officer, the Senior Vice-President, Internal Audit, and the members of the Internal Control Committee, whose structure and roles are described in section 3.2.2.5 below.
Registration Document 2014 117
CORPORATE GOVERNANCEReport of the Chairman of the Board of Directors3
Procedure manuals and accounting principles
The Finance Manual issued to all Finance Departments within the Group describes the closing process for the monthly management accounts and sets out the Group’s charts of accounts, consolidation principles, accounting standards and policies. It also addresses specific issues related to the investment approval procedure and includes the Treasury Charter, which describes cash management procedures, the principles to be followed concerning the holding of payment instruments and the approval of expenditures, as well as the role and organization of cash pooling systems. Employees can download the manual from the Group’s Intranet.
In addition, a presentation of International Accounting Standards/International Financial Reporting Standards, providing details on how to apply the standards to the Group’s specific circumstances, has been prepared by Group Finance and provided to the Group employees concerned.
Lastly, consolidation instructions detailing the financial reporting schedule and specific points concerning consolidation adjustments to individual financial statements are issued once every six months to the various Finance Directors and consolidation teams, and are archived on the Finance Intranet.
Internal procedure manuals
Internal procedure manuals have been produced for the main businesses. The purpose of these manuals is to structure and firmly establish Group procedural guidelines, based on an assessment of the specific internal control risks of each business.
Internal control procedures are implemented under the direct responsibility of the operating divisions and corporate functions and form part of an ongoing process of identifying, assessing and managing risks.
Internal control self-assessments
The Group places considerable emphasis on preparing, issuing and monitoring internal control self-assessment procedures, which have now been rolled out to the majority of hotel operating units and head offices. These procedures interconnect with the Group’s existing internal control standards and processes and are based on analyzing the internal control risks inherent in each business and identifying key control issues.
Data obtained from the internal control self-assessment process are periodically centralized at Division level, with the assistance of the internal auditors when required.
Internal Audit programs for units where the self-assessment system has been deployed include a quantitative measurement, via a rating system, of the gap between the self-assessment and the internal auditors’ assessment of the level of internal control. By analyzing these gaps, it is possible to evaluate the quality of the self-assessment procedures implemented by the unit manager.
Internal Audit reports
A draft report is prepared after each Internal Audit, setting out observations, identified risks and recommendations. This report is sent to the management of the audited unit, which prepares an action plan when required. A summarized version of this draft report is also sent on request to the members of the Executive Committee.
The final report, which includes any corrective action plans prepared by the audited unit, is then sent to the managers in charge of overseeing operational and financial matters for the unit concerned.
The reports prepared by the local Internal Audit Departments are centralized by the Corporate Internal Audit Department and a summary of the work performed by these departments is presented to the Group Internal Control Committee.
The Audit and Risks Committee receives a quarterly summary of the internal audits carried out during the period, including a status report on the annual audit plan, an assessment of the quality of internal control in the audited units and the gap between the internal auditors’ assessments and any self-assessments performed by the units, as well as the internal auditors’ main observations, and action plans decided on by the parties concerned.
Reporting procedure
Group Financial Control is responsible for overseeing the reporting procedure specified in the Finance Manual. The procedure requires the Divisions to submit monthly reporting packages comprising an analysis of key business indicators and the main components of income, in the format prescribed by the Group. All reporting data submitted by the Divisions must be analyzable both by nature and by function.
The reporting procedure is designed to provide a detailed analysis of changes in financial and operating results, which helps the Group to provide support with resource allocation decisions and measure the efficiency of the various organizational structures in place.
Registration Document 2014118

3
CORPORATE GOVERNANCEReport of the Chairman of the Board of Directors
3.2.2.3. Identifying and analyzing risks
The Group identifies and analyzes the key risks that, if they occurred, would affect its ability to fulfill its objectives. It takes the appropriate measures to limit the probability of these risks occurring and the consequences if they do.
As part of these measures, the Group has set up a Central Risk Management and Coordination Committee tasked with:
�� monitoring the rollout of the yearly risk map;
�� helping priority risk owners in their risk management processes;
�� tracking the implementation of risk prevention plans put in place by these risk owners;
�� ensuring that the risk management measures taken by business units and corporate functions are aligned.
The Committee’s members are:
�� the Deputy Chief Executive Officer;
�� the CEO of HotelServices, France;
�� the CEO of HotelServices, United-Kingdom,Irland, Benelux, Switzerland, Russia and CSI;
�� the Chief Human Resources Officer;
�� the Chief Safety and Security Officer;
�� the Senior Vice-President, Internal Audit;
�� the Senior Vice-President, Risk Management and Insurance.
This Committee – which is an expanded version of the former Risk Coordination Committee – meet once every three months.
Identifying risks
The Group is exposed to a number of risks in the normal course of business.
These risks, together with the related control procedures, are described in the «Risk Factors» section of this Registration Document. They mainly correspond to operational risks, environmental risks, legal risks (including litigation and arbitration risks), and financial risks. The «Risk Factors» section also includes a description of the Group’s insurance strategy.
Risk mapping
Internal control risk maps are prepared based on the Internal Audit assignments and above-mentioned self-assessments. These maps, which highlight issues that require priority action, are included in the relevant Internal Audit reports and are periodically presented in summary form to the Internal Control Committee and the Audit and Risks Committee.
A global risk map covering all internal and external risk factors has also been developed in order to obtain data in a standard form concerning the Group’s levels of risk exposure as perceived by Executive Management and by each unit, and to prepare the appropriate action plans when required. Each risk is assessed based on the level of the potential loss it could cause, the probability of it occurring and how efficiently it is managed.
The risk management and insurance Department helps the operating divisions to put in place corrective measures in order to mitigate the main identified risks.
As is the case every year, the results of the risk management and insurance Department’s work were presented to the Audit and Risks Committee in December.
3.2.2.4. Control activities
To improve control of identified risks, the Group has set up control procedures that comply with its standards and cover both operating and financial information processes.
Authorization process for expansion capital expenditure and disposals
A procedure has been set up for the prior authorization of capital expenditure projects, to ensure that they comply with Group strategy and return-on-investment-criteria. The procedure requires formal authorizations to be obtained from the appropriate line and staff managers, in a standard format. A similar authorization procedure has been established for disposals.
As part of this process, the Group has a Business Development Committee, which is tasked with analyzing all projects representing over €150 000 concerning either directly owned hotels or hotels operated under franchise or management agreements. All projects for directly-owned hotels and hotels operated under management and franchise agreements that represent over €5 million are subsequently presented for final approval to the Group’s Executive Committee. Likewise, the Executive Committee’s approval is required for all projects in the luxury and high-end segments.
The Business Development Committee comprises the Chief Financial Officer; the COO of HotelInvest (for directly-owned projects); the HotelServices CEO of the region concerned (for management and franchise projects); the Senior Vice-President, Business Development and the Senior Vice-President, Strategy.
The Business Development Committee meets approximately once a month.
Preparing and controlling the consolidated financial statements
The consolidated financial statements are prepared by Group Finance based on information reported by the subsidiaries’ Chief Executive Officers and Finance Directors. The format of the consolidation packages is determined by the Group.
The subsidiaries are responsible for the information contained in their consolidation packages and are required to make formal representations to Group Finance about the fairness of reporting data and its conformity with Group accounting standards and policies.
The Consolidation Department carries out systematic controls of the consolidation packages submitted by the subsidiaries. A detailed schedule for reviewing the packages has been prepared and sent to the employees concerned.
Registration Document 2014 119

CORPORATE GOVERNANCEReport of the Chairman of the Board of Directors3
In connection with their audit of the consolidated financial statements, the Statutory Auditors audit the consolidation packages transmitted by the subsidiaries included in the scope of their audit. Corporate Internal Audit also reviews from time to time the proper application of Group accounting standards and policies by the subsidiaries, and reports to Group Finance any issues identified during the review.
As the final stage of the process, the consolidated financial statements are examined by the Chief Financial Officer prior to their review by the Audit and Risks Committee. The Board of Directors then approves the consolidated financial statements based on the recommendations of the Audit and Risks Committee.
Corporate Internal Audit assignments
Corporate Internal Audit carries out its audit assignments based on an audit program validated by the Internal Control and Audit and Risks Committees. The main types of assignments, as described in the Internal Audit Charter, are as follows:
�� operational audits, which are aimed at evaluating the reliability and effectiveness of the operating units’ internal control systems as well as ensuring that they comply with Group standards. These audits notably include checking on a regular basis that the internal control self-assessments have been properly performed by the operating units;
�� head office audits (corporate functions), which are designed to optimize internal control procedures applied at the head office and ensure that the head office is able to fulfill its role of overseeing and supporting operating units as effectively as possible. When carrying out their assignments within the Group’s units, Corporate Internal Audit teams also verify that the main risks identified in the risk map are being monitored appropriately;
�� organizational and procedural audits, which are aimed at helping the Divisions to optimize and adapt their procedures and operating processes, notably when rolling out cross-functional projects that lead to a change in organizational structures;
�� specific audits. Review assignments are referred to as specific audits when they comply with the professional standards applicable to internal auditors and fall within their remit. They can concern issues applicable to one or more operating units or to a particular country, function or process.
As part of their assignments, Internal Audit teams perform due diligence reviews to verify compliance with the anti-corruption principles and procedures specified in the Group’s Ethics and Corporate Social Responsibility Charter.
Assignments performed by the local Internal Audit Departments
These departments perform internal audits, either on a stand-alone basis or jointly with Corporate Internal Audit, in line with the program approved by their Division’s Internal Control Committee. They also provide ongoing assistance to finance and operating departments in managing and monitoring internal control issues within their Division’s operating units.
They use methods, tools (including internal control assessment processes) and work programs that have been approved by Corporate Internal Audit due to their direct ties with this department.
In accordance with ethical principles, the local internal auditors do not audit head office or cross-functional departments, due to possible conflicts of interest arising from the fact that the auditors work in the Divisions.
Assignments performed by Group Information Systems Internal Audit
Reporting to Corporate Internal Audit, the Information Systems Internal Audit Department carries out assignments throughout the Group. The main types of audit are as follows:
�� information systems audits, which are performed to ensure that best practices are applied in relation to the organization and monitoring of the audited units’ information systems;
�� audits of applications and processes, which are aimed at ensuring that manual or automated checks in place provide an appropriate level of internal control in view of the operations covered by the applications concerned;
�� project management audits, which are designed to validate the implementation of best project management practices;
�� IT security audits, which help to ensure the security of the Group’s technological platforms. They are primarily performed by the Information Systems Security Department, which reports to Group Information Systems, and in some cases in response to queries raised by Information Systems Internal Audit.
Control assignments performed by the Safety & Security Department and the Risk Management and Insurance Department
The Safety & Security Department and the Risk Management and Insurance Department also carry out control assignments throughout the Group on issues that fall within their respective remits.
Registration Document 2014120

3
CORPORATE GOVERNANCEReport of the Chairman of the Board of Directors
3.2.2.5. Monitoring internal control and risk management
Internal control and risk management procedures are regularly reviewed to ensure that they are appropriate and aligned with the Group’s objectives, particularly in view of the risks specific to each business and the costs of performing the controls.
The main structures responsible for overseeing the internal control and risk management systems are as follows:
The Audit and Risks Committee
As described in the Board of Directors’ Bylaws (Appendix A to this report set out in section 3.2.1 above), the Audit and Risks Committee carries out the following three main tasks in relation to internal control and risk management:
�� it reviews the Risk Management policy and ensures that adequate systems are in place;
�� it is informed every year of the updates to the risk map and the results of the monitoring processes carried out for the Group’s main risks;
�� it obtains assurance concerning the effectiveness of the Group’s system of internal control, by reviewing the methods used to identify risks and the organizational principles and procedures of the Internal Audit Department. It is also informed of the Internal Audit program and of the results of the Internal Audits carried out.
Group Internal Control Committee
The Group Internal Control Committee comprises the Chairman and Chief Executive Officer, the Deputy Chief Executive Officer and the other members of the Executive Committee (see list in the «Directors and Corporate Officers» section of this Registration Document). It also includes the Senior Vice-President, Internal Audit and the Finance Directors of the Group’s main subsidiaries. The heads of the local Internal Audit Departments may also be invited to attend meetings of the Committee at the invitation of their Division’s Internal Control Committee members.
The Group Internal Control Committee guarantees the independence of the Internal Audit function. Its responsibilities are to:
�� validate the annual Internal Audit program;
�� review significant internal audit issues for the current year, in each of the audited areas, and approve the action plans for each audited unit;
�� track changes in internal control levels within the Group;
�� oversee the activities of the Internal Audit function, in terms of audit efficiency/optimization and the adequacy of the function’s resources.
The Group Internal Control Committee meets once a year.
Division Internal Control Committees
Local Internal Control Committees have been set up in the Group’s main operating divisions. Each Committee is chaired by the Division’s Chief Executive Officer and comprises members of the operating units and finance departments, as well as a representative from Corporate Internal Audit. The Committees meet at least once a year to prepare the work program for the local Internal Audit Departments (where appropriate, based on the instructions issued by the Group Internal Control Committee), review the reports on the internal audits performed during the period and assess the progress of previously defined action plans.
Registration Document 2014 121

CORPORATE GOVERNANCE3 Statutory Auditors’ report, prepared in accordance with Article L.225-235 of the French Commercial Code (Code de Commerce) on the report prepared by the Chairman of the Board of Directors
3.3. STATUTORY AUDITORS’ REPORT, PREPARED IN ACCORDANCE WITH ARTICLE L.225-235 OF THE FRENCH COMMERCIAL CODE (CODE DE COMMERCE) ON THE REPORT PREPARED BY THE CHAIRMAN OF THE BOARD OF DIRECTORS
This is a free translation into English of the statutory auditors’ report issued in French prepared in accordance with Article L.225-235 of the French Commercial Code on the report prepared by the Chairman of the Board of Directors on the internal control and risk management procedures relating to the preparation and processing of accounting and financial information issued in French and is provided solely for the convenience of English speaking users.This report should be read in conjunction and construed in accordance with French law and the relevant professional standards applicable in France.
Year ended December 31, 2014
To the Shareholders,
In our capacity as Statutory Auditors of Accor and in accordance with Article L.225-235 of the French Commercial Code (Code de commerce), we hereby report on the report prepared by the Chairman of your Company in accordance with Article L.225-37 of the French Commercial Code (Code de commerce) for the year ended December 31, 2014.
It is the Chairman’s responsibility to prepare, and submit to the Board of Directors for approval, a report on the internal control and risk management procedures implemented by the company and containing the other disclosures required by Article L.225-37 of the French Commercial Code, particularly in terms of corporate governance.
It is our responsibility:
�� to report to you on the information contained in the Chairman’s report in respect of the internal control and risk management procedures relating to the preparation and processing of the accounting and financial information; and
�� to attest that this report contains the other disclosures required by Article L.225-37 of the French Commercial Code , it being specified that we are not responsible for verifying the fairness of these disclosures.
We conducted our work in accordance with professional standards applicable in France.
Information on the internal control and risk management procedures relating to the preparation and processing of accounting and financial information
The professional standards require that we perform the necessary procedures to assess the fairness of the information provided in the Chairman’s report in respect of the internal control and risk management procedures relating to the preparation and processing of the accounting and financial information. These procedures consisted mainly in:
�� obtaining an understanding of the internal control and risk management procedures relating to the preparation and processing of the accounting and financial information on which the information presented in the Chairman’s report is based and the existing documentation;
�� obtaining an understanding of the work involved in the preparation of this information and the existing documentation;
�� determining if any significant weaknesses in the internal control procedures relating to the preparation and processing of the accounting and financial information that we would have noted in the course of our engagement are properly disclosed in the Chairman’s report.
On the basis of our work, we have nothing to report on the information in respect of the company’s internal control and risk management procedures relating to the preparation and processing of accounting and financial information contained in the report prepared by the Chairman of the Board in accordance with Article L.225-37 of the French Commercial Code.
Other disclosures
We hereby attest that the Chairman’s report includes the other disclosures required by Article L.225-37 of the French Commercial Code.
Paris-La Défense and Neuilly-sur-Seine, March 13, 2015
The Statutory AuditorsFrench original signed by
ERNST & YOUNG et Autres
Jacques Pierres
DELOITTE & ASSOCIÉS
Pascale Chastaing-Doblin
Registration Document 2014122

3
CORPORATE GOVERNANCERisk management
3.4. RISK MANAGEMENT
3.4.1. SECURITY AND RISK MANAGEMENT STRATEGY
The Group is exposed to various risks which could impact its customers, employees, assets and brands and could have an adverse effect on its ability to achieve its objectives.
Accor’s security and risk management strategy is underpinned by a structured process for identifying, analyzing and assessing risks and implementing risk prevention action plans adapted to the identified risks.
The strategy deployed by the Safety & Security and risk management and insurance Departments is backed by a global network of correspondents, close working relationships with local authorities and the expertise of specialists.
Identifying, analyzing and assessing risks
The Risk Management and Insurance Department has put in place a risk identification process covering every host country and the corporate head office, with the overall aim of ensuring that identified risks are properly taken into account and effectively addressed.
In addition, the Group has set up a new Central Risk Management and Coordination Committee which has an extended remit compared with the previous Committee and is now tasked with monitoring the risk mapping process and verifying that prevention plans drawn up for priority risks are effectively implemented.
Risk prevention and protection
As part of their audit assignments within the Group’s units, the internal auditors verify that the risk management plans are being properly implemented and that the main identified risks are being specifically addressed.
In addition, as described in section 3.4.4 below, the Group works on an ongoing basis with its insurers and their loss prevention engineers on reducing its fire risk, by performing audits and carefully assessing the audit findings.
The Safety & Security Department tracks the safety and security situation in each of the Group’s host countries on a daily basis, reviewing the geopolitical context and public health and hygiene conditions, as well as risks relating to extreme weather events and social unrest. It is assisted in this work by a network of locally-based correspondents.
Lastly, when large-scale events are held – such as the Winter Olympics and the FIFA World Cup in 2014 – the Group puts in place specific preparation and risk monitoring processes, working in conjunction with the event’s organizers and the local authorities in the countries concerned.
Crisis management
The Group has a crisis management process that is specifically adapted to its organizational structure and enables its teams to effectively handle crisis situations. This process includes ensuring proper communication between the hotels, local head offices and senior management, and dedicated crisis units can be mobilized where required. In 2014, the Group was particularly vigilant in relation to terrorist threats and the spread of the Ebola virus.
Business Continuity and Recovery Plans
Business Continuity and Recovery Plans are drawn up for risks that, if they were to occur, could make it difficult or impossible to carry out the Group’s day-to-day business.
Risk coverage
After the risk identification and analysis process, the Group selects a coverage method that is most suited to the identified risks based on their level and severity, notably taking advantage of opportunities offered in the insurance and reinsurance markets both in France and abroad, as described in section 3.4.4 below.
Registration Document 2014 123
CORPORATE GOVERNANCERisk management3
3.4.2. RISK FACTORS
Operational risks
The Group is exposed to various operational risks although the scale of any financial consequences arising from such risks is reduced by the fact that its business activities are dispersed around the globe.
�� Risks related to malicious damage and terrorist threats: to effectively protect itself against the main threats identified against its establishments, the Group draws on a strategy that is adapted to the severity of the estimated risks related to each structure concerned. It has also put in place a monitoring system as well as specific security measures that evolve in line with the developments of each situation.
�� Public health risks: Accor tracks on an ongoing basis any public health risks that could adversely affect its business. In response to the risk of pandemics, annually-updated business continuity plans are in place to ensure the continuity of its hotel operations and the health and safety of guests and employees. A program has long been in place to prevent the development and spread of legionella bacteria in the Group’s hotels. Technical standards have been defined and preventive maintenance is regularly carried out, with analyses of samples performed by independent laboratories.
�� Risks related to the economic environment: in the event of a sharp slowdown in a regional economy or the global economy, Accor could experience a significant falloff in business due to people travelling less frequently. In this event, austerity plans are in place to freeze budgets, identify cost-reduction opportunities and deploy other responsive measures.
�� Natural disaster risks: some of the Group’s hotels are located in countries that are exposed to the risk of natural disasters, such as hurricanes, earthquakes, tidal waves or floods. When these risks are foreseeable, temporary protection measures are put in place. Exercises are also carried out by our teams in countries subject to seismic risks so they can respond effectively in the event of an earthquake. One of the natural disaster risks identified by the Group is that of the river Seine breaking its banks, which could have major implications for Accor due to the large number of its hotels that could be affected in the Paris region. Specific Business Continuity and Recovery Plans have been drawn up to deal with this eventuality.
�� Competition risks: maintaining the customer appeal of our brands is a key priority for our teams, who constantly work towards making Accor an innovation leader and raising its standards to avoid losing business to competitors. Careful attention is also paid to current changes in customer behavior due to alternative accommodation solutions offered by new market entrants (furnished rentals, house and apartment swaps, etc.).
Lastly, the risk of losing control over the distribution of its products to online travel agencies (OTAs) is a major focal point for the Group. Controlling this dependency risk involves increasing the direct bookings made through Accor websites and stepping up the loyalty program, both of which require the development of state-of-the-art technological systems.
�� Risks of damage to our brand image: Accor could be faced with a major media event capable of damaging its brand image. For example, a health and/or safety incident or a supplier’s practices could lead to a smear campaign against the Group. In response, tracking tools have been deployed to detect early warning signs and dedicated crisis management and communication procedures are ready to be activated should such an event occur. In addition, employees are given specific training on how to prevent cases of sexual tourism involving minors in hotels.
�� Risks related to partnerships: the Group’s relations with hotel owners, lessors and franchisees are based on mutual trust and shared interests. However, these relations could deteriorate and expose the Group to conflictual situations. Moreover, the ability to renew franchise and management agreements depends on the appeal of our brands.
�� Risks relating to information systems: Group information systems could be subject to attacks, such as viruses and denial-of-service attacks, as well as data theft and technical failures causing a system shutdown. The Information Systems Security Department is tasked with securing all of our networks and systems and managing the applications necessary for our business continuity. In tandem, it regularly performs intrusion tests on all of our applications assets. Accor also has a specific Information Systems Internal Audit team which reports to Corporate Internal Audit and is dedicated to ensuring that information systems work effectively and securely.
�� Data protection risks: Accor faces competition from other hotel groups in deploying its organic and external growth strategies. Consequently, information on strategic, business and competition-related issues concerning organic growth and acquisitions and information relating to the Group’s customers is considered to be highly sensitive. If such information were to be disclosed it could have adverse consequences for the Group. Measures are therefore in place to raise employee awareness about confidentiality and to enhance the security and access control of our Intranet sites.
�� Employee-related risks: although management regularly holds constructive talks with employee representatives, both at head office and local level, certain strategies and/or financial decisions could give rise to local disputes or strikes that could adversely affect the business.
Environmental risks
In its risk identification process, Accor considers that potential environmental risks in the hotels business mainly concern the storage of gas and fuel oil in or near hotels, the malfunction of transformers containing polychlorinated biphenyls (PCBs), spillage of cleaning products and contamination from cooling towers.
In general, the risk of causing environmental damage remains low in the hotels business. In Europe, however, these risks are assessed with environmental inspections performed during onsite visits by insurance company experts.
Registration Document 2014124
3
CORPORATE GOVERNANCERisk management
More particularly, given that Accor uses very few toxic or hazardous products, there is little risk of accidental pollution likely to have an impact beyond its hotels. In seawater spas, however, procedures have been introduced to alert the public authorities in the event of non-compliant wastewater analyses.
Asbestos was used in the construction of certain hotels at a time when it was not yet prohibited. The use of asbestos in our buildings is now, however, completely forbidden. When hotel buildings containing asbestos are renovated, very strict protocols are implemented to protect workers, in compliance with the applicable local regulations.
Most Accor hotels are located in Europe and are subject to EU directives in the following main areas:
�� environmental responsibility;
�� building energy efficiency;
�� waste management, including non-hazardous waste (particularly packaging), electrical and electronic equipment, and hazardous waste (particularly batteries and compact fluorescent light bulbs);
�� management of cooling fluids;
�� management of chemical substances (compliance with the REACH directive).
In France, certain installations are covered by regulations relating to facilities listed for environmental protection purposes and must therefore be registered in accordance with the relevant procedures.
To mitigate the possibility of the above environmental risks occurring in any hotel worldwide, prevention policies have been put into place, based on:
�� the proprietary SET software program, which measures compliance with Safety, Environmental and Technical regulations, as described in the corporate responsibility section of this Registration Document on page 61;
�� deployment of the ISO 14001 certification program, as described in the corporate responsibility section of this Registration Document on page 61;
�� specific procedures implemented by the country organizations.
Exogenous risks, which mainly arise when hotels are located near industrial sites or airports, are identified and taken into account during onsite visits by insurers.
No provisions for environmental risks were recognized in 2014 as no major information on environmental issues was reported following the risk mapping exercise for the Group’s operations carried out by the Risk Management and Insurance Department.
Lastly, Accor was not the subject of any court rulings in connection with any environmental claims during the year.
Regulatory and legal risks
Regulatory risks
The Group is not subject to any specific regulations that could have a major impact on its operations.
In addition, as Accor operates on a global scale, no specific regulations are applicable across all of its businesses. Accor SA and its subsidiaries are subject to local legislation and regulations, in particular national regulations applicable to public access buildings.
Like all hotel operators, Accor is required to comply with the applicable disabled access regulations. This issue has long been addressed and most Accor hotels already have wheelchair-friendly rooms, but further expenditure may be required in the coming years to enhance hotel accessibility.
Risks relating to changes in tax legislation
In response to the difficult economic environment, some governments may be tempted to introduce new taxes or increase existing ones (e.g. carbon tax, VAT etc.). Changes in tax legislation are regularly monitored by our teams, who work with trade associations to effectively foresee these decisions and assess their impact.
Risks relating to legal and arbitration proceedings
In general, the Group is exposed to the risk of liability in proceedings that may be brought against it before the courts or administrative authorities.
Information concerning claims, litigation and arbitration proceedings that could have – or in 2014 had – a material effect on the Group’s financial position, business or results of operations is provided in note 40 to the consolidated financial statements on page 259 of this Registration Document. Management considers that apart from the cases described in said note, there are no governmental, legal or arbitration proceedings (including any threatened proceedings of which the Group was aware as of the date of filing) that could have – or in 2014 had – a material effect on the Group’s financial position, business or results of operations.
Liabilities are recognized and provided for in accordance with the applicable accounting standards (see note 2 to the consolidated financial statements on page 177).
If the Group receives a summons in a legal action, an assessment of the related risk is carried out jointly with its external advisers and based on this assessment a provision is recognized where appropriate. Details of these provisions are presented in note 34 to the consolidated financial statements on page 242.
Registration Document 2014 125
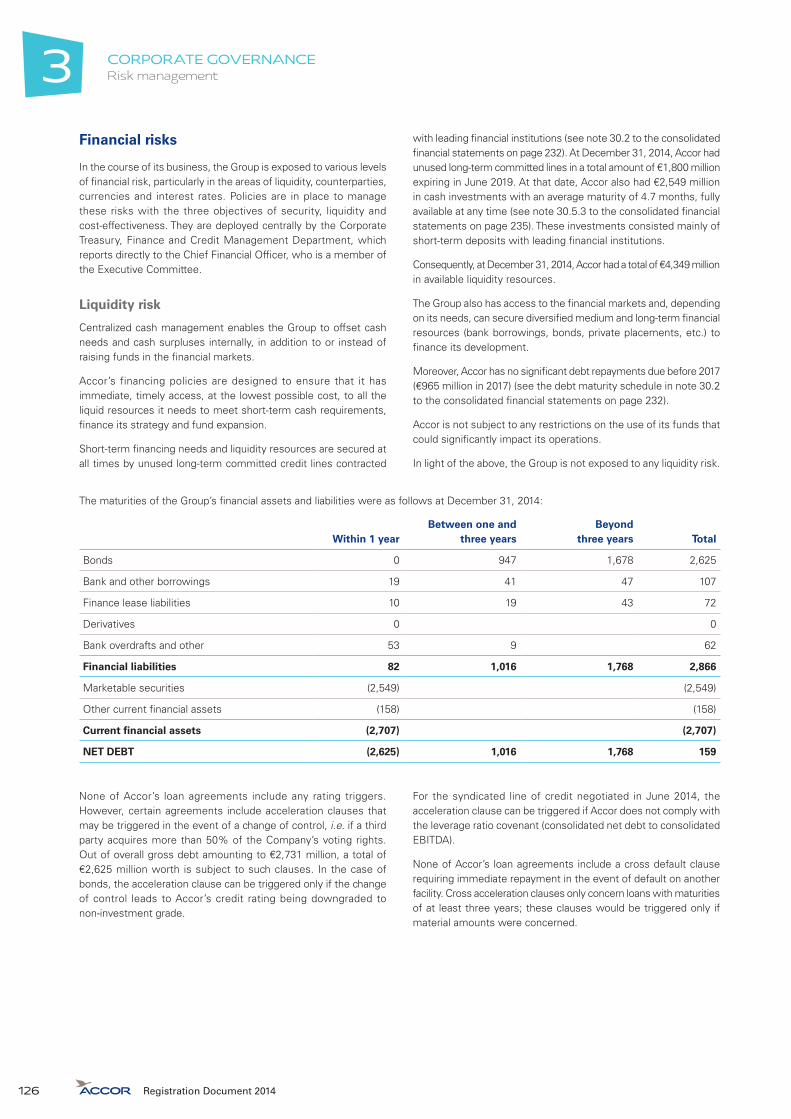
CORPORATE GOVERNANCERisk management3
Financial risks
In the course of its business, the Group is exposed to various levels of financial risk, particularly in the areas of liquidity, counterparties, currencies and interest rates. Policies are in place to manage these risks with the three objectives of security, liquidity and cost-effectiveness. They are deployed centrally by the Corporate Treasury, Finance and Credit Management Department, which reports directly to the Chief Financial Officer, who is a member of the Executive Committee.
Liquidity risk
Centralized cash management enables the Group to offset cash needs and cash surpluses internally, in addition to or instead of raising funds in the financial markets.
Accor’s financing policies are designed to ensure that it has immediate, timely access, at the lowest possible cost, to all the liquid resources it needs to meet short-term cash requirements, finance its strategy and fund expansion.
Short-term financing needs and liquidity resources are secured at all times by unused long-term committed credit lines contracted
with leading financial institutions (see note 30.2 to the consolidated financial statements on page 232). At December 31, 2014, Accor had unused long-term committed lines in a total amount of €1,800 million expiring in June 2019. At that date, Accor also had €2,549 million in cash investments with an average maturity of 4.7 months, fully available at any time (see note 30.5.3 to the consolidated financial statements on page 235). These investments consisted mainly of short-term deposits with leading financial institutions.
Consequently, at December 31, 2014, Accor had a total of €4,349 million in available liquidity resources.
The Group also has access to the financial markets and, depending on its needs, can secure diversified medium and long-term financial resources (bank borrowings, bonds, private placements, etc.) to finance its development.
Moreover, Accor has no significant debt repayments due before 2017 (€965 million in 2017) (see the debt maturity schedule in note 30.2 to the consolidated financial statements on page 232).
Accor is not subject to any restrictions on the use of its funds that could significantly impact its operations.
In light of the above, the Group is not exposed to any liquidity risk.
The maturities of the Group’s financial assets and liabilities were as follows at December 31, 2014:
Within 1 yearBetween one and
three yearsBeyond
three years Total
Bonds 0 947 1,678 2,625
Bank and other borrowings 19 41 47 107
Finance lease liabilities 10 19 43 72
Derivatives 0 0
Bank overdrafts and other 53 9 62
Financial liabilities 82 1,016 1,768 2,866
Marketable securities (2,549) (2,549)
Other current financial assets (158) (158)
Current financial assets (2,707) (2,707)
NET DEBT (2,625) 1,016 1,768 159
None of Accor’s loan agreements include any rating triggers. However, certain agreements include acceleration clauses that may be triggered in the event of a change of control, i.e. if a third party acquires more than 50% of the Company’s voting rights. Out of overall gross debt amounting to €2,731 million, a total of €2,625 million worth is subject to such clauses. In the case of bonds, the acceleration clause can be triggered only if the change of control leads to Accor’s credit rating being downgraded to non-investment grade.
For the syndicated line of credit negotiated in June 2014, the acceleration clause can be triggered if Accor does not comply with the leverage ratio covenant (consolidated net debt to consolidated EBITDA).
None of Accor’s loan agreements include a cross default clause requiring immediate repayment in the event of default on another facility. Cross acceleration clauses only concern loans with maturities of at least three years; these clauses would be triggered only if material amounts were concerned.
Registration Document 2014126

3
CORPORATE GOVERNANCERisk management
Accor’s ratings assigned by Standard & Poor’s and Fitch Ratings are as follows:
Rating agencyLong-term
debtShort-term
debtMost recentrating update Outlook
Most recent outlook update
Standard & Poor’s BBB- A-3 February 24, 2010 Stable March 9, 2012
Fitch Ratings BBB- F3 July 2, 2009 Stable May 25, 2011
Standard & Poor’s and Fitch Ratings confirmed Accor’s ratings and outlooks on June 17, 2014 and October 27, 2014 respectively.
Counterparty and country risk
Exposure to counterparty risk relating to trade receivables and payables is not material due to the breadth and geographic diversity of the Group’s customer and supplier portfolio.
Counterparty risk does, however, arise in relation to financial transactions. This risk is managed by:
�� carrying out transactions only with leading counterparties, depending on country risks;
�� diversifying the portfolio of counterparties;
�� setting credit ceilings (amount and term) per counterparty; and
�� continuously monitoring the different types of counterparties and their credit quality (based on credit ratings issued by rating agencies).
In view of the Group’s broad geographic footprint, country risk is limited.
Over 85% of cash investments are made in France with leading banks.
Currency and interest rate risks
A variety of financial instruments, including swaps and forward purchases and sales of foreign currencies, are used to manage and hedge interest rate and currency risks arising in the normal course of business. The use of these instruments forms part of the Group’s investment, financing and hedging policies, to help manage debt and to minimize the risks on business transactions. A dedicated treasury management information system is used to track the breakdown of debt by fixed/floating rate and currency.
Management of currency risks
Long-term investment policyWhen Accor SA invests directly or indirectly in a foreign subsidiary, the investment is generally made in the subsidiary’s local currency. These are very long-term positions and so far, the policy has been not to hedge the related currency risk.
FinancingAn internationally recognized signature allows Accor to raise various forms of financing, including through bond issues, private placements and bank loans.
From time to time, the Group also takes advantage of market opportunities to raise financing in a given currency and at a given rate of interest and then use a swap to convert the facility into the currency and interest rate required to finance business needs (see note 30.3 to the consolidated financial statements on page 232).
Generally, the Group’s policy is to finance its assets and operating requirements in the currency of the country concerned in order to create a natural hedge and avoid any currency risk.
By using its subsidiaries’ excess cash as well as the financial instruments described above, the Group is able to optimize the cost of its resources while reducing currency risks.
Other currency hedgesCurrency hedges are rarely used other than for financing transactions because revenues are generally denominated in the same currency as the related operating costs.
The Group does not hedge currency translation risk.
At December 31, 2014, the volume of forward sales and purchases of foreign currencies represented €69 million and €222 million respectively. All of the related instruments expire in 2015.
Management of interest rate risks
After currency hedging, 87% of consolidated gross debt is denominated in euros, with 98% at fixed rates and 2% at floating rates. The average maturity of fixed-rate debt is 4.5 years. An analysis of the Group’s exposure to interest rate risks before and after hedging is provided in note 30.3 to the consolidated financial statements on page 232). Target breakdowns between fixed and floating rate debt are determined separately for each currency, giving due regard to anticipated trends in interest rates and to changes in the composition of debt as a result of new borrowings and the repayment of existing borrowings.
These target breakdowns are reviewed at regular intervals and new targets are set for future periods by Executive Management. The related financing strategy is implemented by the Corporate Treasury, Financing and Credit Management Department.
In view of the average 4.7-month maturity, cash is invested at variable rates.
The interest rate and currency instruments used by the Group are contracted with banks based on the model recommended by the French Banking Federation.
At December 31, 2014, the volume of interest rate hedges represented €59 million.
Accor does not conduct any speculative transactions and has no plans to engage in any financial transactions that are not connected to the Group’s general requirements for its business. Neither the parent company nor the Group has any open currency or interest rate positions that would be likely to expose the Group to significant risks.
Registration Document 2014 127
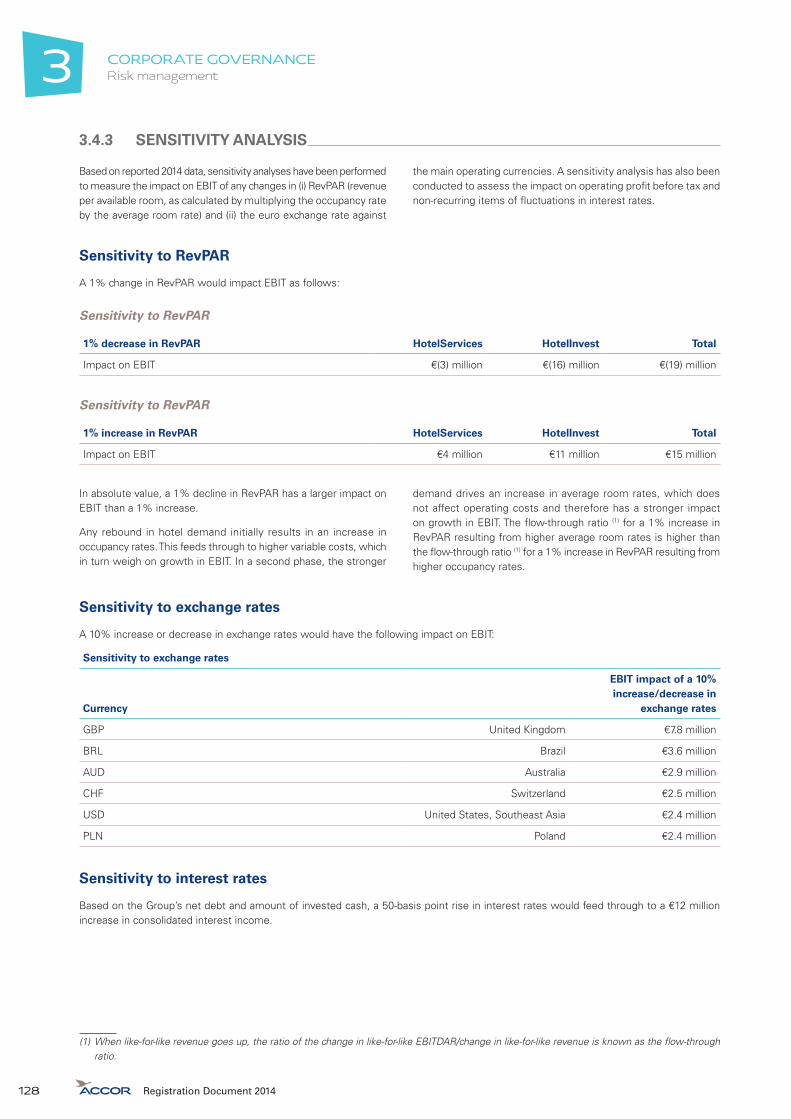
CORPORATE GOVERNANCERisk management3
3.4.3 SENSITIVITY ANALYSIS
Based on reported 2014 data, sensitivity analyses have been performed to measure the impact on EBIT of any changes in (i) RevPAR (revenue per available room, as calculated by multiplying the occupancy rate by the average room rate) and (ii) the euro exchange rate against
the main operating currencies. A sensitivity analysis has also been conducted to assess the impact on operating profit before tax and non-recurring items of fluctuations in interest rates.
Sensitivity to RevPAR
A 1% change in RevPAR would impact EBIT as follows:
Sensitivity to RevPAR
1% decrease in RevPAR HotelServices HotelInvest Total
Impact on EBIT €(3) million €(16) million €(19) million
Sensitivity to RevPAR
1% increase in RevPAR HotelServices HotelInvest Total
Impact on EBIT €4 million €11 million €15 million
In absolute value, a 1% decline in RevPAR has a larger impact on EBIT than a 1% increase.
Any rebound in hotel demand initially results in an increase in occupancy rates. This feeds through to higher variable costs, which in turn weigh on growth in EBIT. In a second phase, the stronger
demand drives an increase in average room rates, which does not affect operating costs and therefore has a stronger impact on growth in EBIT. The flow-through ratio (1) for a 1% increase in RevPAR resulting from higher average room rates is higher than the flow-through ratio (1) for a 1% increase in RevPAR resulting from higher occupancy rates.
Sensitivity to exchange rates
A 10% increase or decrease in exchange rates would have the following impact on EBIT:
Sensitivity to exchange rates
Currency
EBIT impact of a 10% increase/decrease in
exchange rates
GBP United Kingdom €7.8 million
BRL Brazil €3.6 million
AUD Australia €2.9 million
CHF Switzerland €2.5 million
USD United States, Southeast Asia €2.4 million
PLN Poland €2.4 million
Sensitivity to interest rates
Based on the Group’s net debt and amount of invested cash, a 50-basis point rise in interest rates would feed through to a €12 million increase in consolidated interest income.
(1) When like-for-like revenue goes up, the ratio of the change in like-for-like EBITDAR/change in like-for-like revenue is known as the flow-through ratio.
Registration Document 2014128

3
CORPORATE GOVERNANCERisk management
3.4.4 RISK FINANCING – INSURANCE
Accor’s risks are spread across a very wide number of locations throughout the world, which protects it to a large degree against severe risks. Property and business interruption cover is determined based on the Group site with the estimated maximum loss. In the case of liability insurance, estimated maximum loss has been benchmarked with industry practices, taking into account the fact that hotels are sometimes located in large property complexes or near sensitive sites such as airports or train stations.
The majority of Accor’s risks are covered via a global insurance program that comprises comprehensive policies (subject to named exclusions) covering property, business interruption and liability risks. In accordance with the Group’s insurance strategy, as validated by the Executive Committee, this program is being extended wherever possible under local laws and regulations.
As part of a move to standardize insurance coverage across the Group’s banners, since January 1, 2011, the owners of franchised and managed hotels can benefit from the Group program.
This program offers:
�� separate property and casualty coverage for Accor and the hotel-owning subsidiaries on the one hand, and for the owners of franchised and managed hotels on the other;
�� the possibility for owners of franchised and managed hotels to benefit from some of the Group’s liability coverage, so as to enhance the compensation paid out to guests in settlement of their claims.
As the coverage for owned properties is separate from that for franchised and managed hotels, the maximum coverage that the Group needs to take out is €150 million per policy for property claims.
In the case of liability claims, the maximum per claim coverage currently stands at €500 million.
Protection against natural disaster risk is a particular priority and special terms have been negotiated on a country-by-country basis wherever possible in the local insurance markets for owned hotels on the one hand and for franchised and managed hotels on the other. Similarly, specific coverage has been taken out for terrorism risks for countries where local coverage is not mandatory and where it is possible to do so under local legislation. This coverage is renewed each year.
All frequent property and liability risks covered by the Group’s global insurance program are self-insured through a fully owned reinsurance company, with all units sharing the related costs. The least frequent but more severe risks are reinsured in the global market in order to limit the Group’s commitments and avoid exhausting the capacity of the reinsurance subsidiary.
Local insurance programs have been set up in certain countries, such as Australia, New Zealand and India. In Australia and New Zealand, heavy exposure to natural disaster risks combined with favorable conditions in the local insurance market prompted the Group to take out local coverage for property and casualty and business interruption risks. In India, insurance legislation has made local programs mandatory.
As it has not suffered any major uninsured losses, Accor deems that its insurance coverage is adequate. The same is true for its self-insurance system capacity, based on the loss experience.
The Group organizes fire prevention inspections to reduce risk exposure and obtain cover on a cost-effective basis, taking into account conditions in the insurance and reinsurance markets. Changes in market insurance rates are closely tracked and, where appropriate, risks are self-insured in order to limit the insurance costs incurred by the various businesses and to avoid steep increases. The centralized risk management system rolled out in 2008 has enabled tighter tracking of the loss experience, allowing the Technical Department to take swift measures to reduce the related risk exposure. In 2013, new functions were added to this system, making it possible to systematically track fire prevention measures and perform fire risk self-assessments.
Other forms of global insurance, such as for construction-related risks and IT fraud, are also set up centrally in order to optimize insurance costs and ensure the quality of purchased coverage.
Registration Document 2014 129

CORPORATE GOVERNANCEInterests and compensation3
3.5 INTERESTS AND COMPENSATION
3.5.1 DIRECTORS’ AND OFFICERS’ COMPENSATION
Compensation policy for executive officers
Accor’s compensation policy for its executive officers complies with the AFEP/MEDEF Code.
As a result, the compensation paid to executive officers is determined by the Board of Directors based on recommendations put forward by the Compensation, Appointments and Corporate Governance Committee, and is benchmarked to compensation practices among leading French companies.
The compensation packages of executive officers comprise the following:
�� fixed compensation, which takes into account the officer’s experience and responsibilities as well as market practices;
�� annual variable compensation, which is contingent on the officer’s contribution to Accor’s success, particularly in terms of financial performance;
�� long-term incentive instruments, which are all subject to performance conditions and are aimed at closely aligning officers’ interests with those of the Company’s shareholders and encouraging them to deliver long-term performance.
In accordance with the AFEP/MEDEF Code, as amended in June 2013, these compensation packages will be submitted to an advisory vote at the next Annual Shareholders’ Meeting and a separate presentation will be included in the notice of meeting.
Compensation payable to Sébastien Bazin
The Board of Directors set Sébastien Bazin’s fixed annual compensation at €850,000 for 2013 and 2014, and at its meeting on December 12, 2014, it decided that this amount would remain unchanged for 2015.
For 2014, the Board decided that Mr. Bazin’s variable compensation would represent between 0% and 150% of an annual reference amount of €1,250,000, based on the achievement of the following objectives:
�� quantitative objectives:
�y consolidated EBIT in line with the 2014 budget (25% weighting),
�y free cash flow (excluding acquisitions and disposals), after change in working capital, in line with the 2014 budget (25% weighting),
�y share performance criterion: Accor’s Total Shareholder Return (TSR) compared with that of eight other international hotel groups (Marriott, Starwood, Choice, Hyatt, Whitbread, Intercontinental Hotels, NH Hoteles and Melia) (20% weighting);
�� qualitative objectives:
�y implementation of the strategic roadmap (organizational performance, employee relations, business strategy and market perception) (20% weighting),
�y general assessment by the Board (10% weighting).
The achievement rate of each of these objectives triggers the payment of between 0% and 150% of the amount allocated to them.
Following an assessment of the degree to which Sébastien Bazin’s objectives had been achieved, at its meeting on February 17, 2015 the Board set his variable compensation for 2014 at €1,369,188, breaking down as:
�� €806,688 for the three quantitative objectives, which were 72% met overall (0% for the share performance criterion and non-disclosable for the other two objectives in view of their confidential nature);
�� €562,500 for the qualitative objectives, which were 150% met overall (150% for the implementation of the strategic roadmap and 150% for the Board’s general assessment).
Consequently, Mr. Bazin’s total variable compensation for 2014 represented 109.5% of the annual reference amount (and 161% of his fixed compensation for the year).
On December 12, 2014, the Board decided that Mr. Bazin’s variable compensation for 2015 will represent between 0% and 150% of an annual reference amount – unchanged from the previous year – of €1,250,000, based on the achievement of the following objectives:
�� quantitative objectives:
�y consolidated EBIT in line with the 2015 budget (25% weighting),
�y free cash flow (excluding acquisitions and disposals), after change in working capital, in line with the 2015 budget (25% weighting),
�y share performance criterion: Accor’s TSR compared with that of eight other international hotel groups (Marriott, Starwood, Choice, Hyatt, Whitbread, Intercontinental Hotels, NH Hoteles and Melia) (10% weighting);
�y share performance criterion: Accor’s TSR compared with that of other CAC 40 companies (10% weighting);
�� qualitative objectives:
�y implementation of the strategic roadmap (organizational performance, employee relations, business strategy and market perception) (20% weighting),
�y general assessment by the Board (10% weighting).
Registration Document 2014130

3
CORPORATE GOVERNANCEInterests and compensation
Compensation payable to Sven Boinet
Sven Boinet’s annual fixed compensation for 2014 corresponded to €200,000 for his executive officer’s position and €400,000 under his employment contract for his salaried position.
At its meeting on December 12, 2014 the Board of Directors decided that these two amounts would remain unchanged for 2015.
For 2014, the Board decided that Mr. Boinet’s variable compensation would represent between 0% and 150% of an annual reference amount of €600,000, based on the achievement of the following objectives:
�� quantitative objectives:
�y consolidated EBIT in line with the 2014 budget (25% weighting),
�y free cash flow (excluding acquisitions and disposals), after change in working capital, in line with the 2014 budget (25% weighting),
�y share performance criterion: Accor’s total shareholder return (TSR) compared with that of eight other international hotel groups (Marriott, Starwood, Choice, Hyatt, Whitbread, Intercontinental Hotels, NH Hoteles and Melia) (20% weighting);
�� one qualitative objective, corresponding to the management of the Group’s transformation process (particularly the performance of the HotelServices/HotelInvest organization and employee relations) (30% weighting).
The achievement rate of each of these objectives triggers the payment of between 0% and 150% of the amount allocated to them.
Given the date on which he took up his position as Deputy Chief Executive Officer, Sven Boinet’s variable compensation for 2014 covers the 13 months from December 2, 2013 to December 31, 2014. Following an assessment of the degree to which his objectives had been achieved, at its meeting on February 17, 2015 the Board set Mr. Boinet’s variable compensation for 2014 at a gross amount of €711,978, breaking down as:
�� €419,478 for the three quantitative objectives, which were 72% met overall (0% for the share performance criterion and non-disclosable for the other two objectives in view of their confidential nature);
�� €292,500 for the qualitative objective, which was 150% met.
Consequently, Mr. Boinet’s total variable compensation for 2014 represented 109.5% of the applicable reference amount (calculated on a 13-month basis).
On December 12, 2014 the Board decided that Mr. Boinet’s variable compensation for 2015 will represent between 0% and 150% of an annual reference amount – unchanged from the previous year – of €600,000, based on the achievement of the following objectives:
�� quantitative objectives:
�y consolidated EBIT in line with the 2015 budget (25% weighting),
�y free cash flow (excluding acquisitions and disposals), after change in working capital, in line with the 2015 budget (25% weighting),
�y share performance criterion: Accor’s TSR compared with that of eight other international hotel groups (Marriott, Starwood, Choice, Hyatt, Whitbread, Intercontinental Hotels, NH Hoteles and Melia) (10% weighting),
�y share performance criterion: Accor’s TSR compared with that of other CAC 40 companies (10% weighting);
�� one qualitative objective, corresponding to the management of the Group’s transformation process (particularly the performance of the HotelServices/HotelInvest organization, employee relations and management culture) (30% weighting).
Termination benefits
Compensation payable to Sébastien Bazin in the event of loss of office as Chairman and Chief Executive Officer
At its meeting on December 16, 2013, the Board of Directors decided that the compensation payable to Sébastien Bazin in the event of loss of office would be equal to twice the aggregate amount of his fixed and variable compensation due for the fiscal year preceding that of the loss of office. This termination benefit would only be payable if (i) the applicable performance criteria are met, and (ii) his departure is involuntary, i.e. if Mr. Bazin’s term of office as Chairman and Chief Executive Officer is terminated (except in the event of gross or willful misconduct) or if he is not re-elected as a director. It would not be payable if Mr. Bazin resigns or decides not to stand for re-election as a director, if he moves to a new position within the Group, or if he would be able to claim his full-rate pension within a short period of time.
The performance criteria applicable to the termination benefit are as follows:
�� consolidated return on capital employed for the previous three years must have exceeded the Group’s cost of capital as published in the Registration Documents for those years;
�� operating free cash flow must have been positive in at least two of the previous three years;
�� like-for-like EBITDAR margin must have exceeded 27.5% in at least two of the previous three years.
The amount of the termination benefit would be as follows:
�� if all three criteria are met, the benefit would be payable in full;
�� if at least two of the three criteria are met, half of the benefit would be payable;
�� if none or only one of the three criteria is met, no benefit would be due.
Compensation payable to Sven Boinet in the event of loss of office as Deputy Chief Executive Officer
On February 19, 2014, the Board of Directors decided that the compensation payable to Mr. Boinet in the event of loss of office would amount to €600,000, plus the amount of variable compensation due to him for the fiscal year preceding that of the loss of office, and less any termination benefit due for the termination of his employment contract. This termination benefit would only be payable if (i) the applicable performance criteria are met, and (ii) his departure is involuntary, i.e. if Mr. Boinet’s term of office as Deputy Chief Executive Officer were terminated (except in the event of gross or willful misconduct). It would not be payable if Mr. Boinet resigns or moves to a new position within the Group, or if he would be able to claim his full-rate pension within a short period of time.
Registration Document 2014 131

CORPORATE GOVERNANCEInterests and compensation3
The performance criteria applicable to the termination benefit are as follows:
�� consolidated return on capital employed for the previous three years must have exceeded the Group’s cost of capital as published in the Registration Documents for those years;
�� operating free cash flow must have been positive in at least two of the previous three years;
�� like-for-like EBITDAR margin must have exceeded 27.5% in at least two of the previous three years;
The amount of the termination benefit would be as follows:
�� if all three criteria are met, the benefit would be payable in full;
�� if at least two of the three criteria are met, half of the benefit would be payable;
�� if none or only one of the three criteria is met, no benefit would be due.
Supplementary pension benefits
The Chairman and Chief Executive Officer, Deputy Chief Executive Officer and several dozen other senior executives are members of a supplementary pension plan set up within the Company. This plan complies with the recommendations contained in the AFEP/MEDEF Code, as described below.
The overall plan comprises an ”Article 83“ defined contribution plan and an ”Article 39“ defined benefit plan.
Under the defined contribution plan, members are entitled to a pension annuity (with survivor benefits), which is determined based on the contributions paid by the Company for each year of their membership of the plan. The annual contribution paid by the Company for each plan member corresponds to 5% of the member’s gross compensation received for the year concerned, capped at five times the annual ceiling used for calculating French social security contributions (the «PASS»). The maximum contribution paid by Accor for 2014 therefore amounted to €9,387 (1). Eligible members of this plan are executives who have served with the Group for at least one year and whose gross compensation is higher than four times the PASS, i.e. €150,192 for 2014. In accordance with the French Social Security Code, if a plan member leaves the Group before the date of retirement, he or she retains the rights accrued under the plan.
Under the defined benefit plan, members are entitled to a pension annuity (with survivor benefits) provided they remain with the Group until they retire. Each member progressively acquires their entitlement, calculated each year for which they are a plan member based on their annual reference compensation (2). Each year of plan membership represents between 1% and 3% of the reference compensation, depending on the compensation brackets concerned, i.e.:
�� portion of reference compensation representing between 4 and 8 times the PASS: 1%;
�� portion of reference compensation representing between 8 and 12 times the PASS: 2%;
�� portion of reference compensation representing between 12 and 24 times the PASS: 3%;
�� portion of reference compensation representing between 24 and 60 times the PASS: 2%.
The entitlement for any given year of plan membership therefore corresponds to the aggregate of the amounts accrued for each of the above compensation brackets. The amount of the final pension annuity equals the sum of the entitlements calculated for each year.
Two ceilings are applied to the final amount of the pension annuity:
�� the amount of the gross annuity may not exceed 30% of the member’s last reference compensation;
�� for members whose last reference compensation was more than 12 times the PASS, the overall replacement rate represented by pension benefits payable under government-sponsored plans and Accor supplementary pension plans is capped at 35% of the average of their best three years’ reference compensation in the ten years prior to retirement.
Approximately 80 executives were eligible for this plan in 2014.
To be eligible for a pension under the defined benefit plan, when they retire, members must have participated in the plan for at least five years or have served with the Accor Group for at least fifteen years. If they do not meet this requirement they are not entitled to any payments under the plan. The pension annuity payable under the defined benefit plan will be reduced by the amount of the annuity payable under the above-described defined contribution plan.
For example, for a reference compensation of €1,000,000 in 2014, provided that all of the plan’s eligibility criteria are met, the entitlement is calculated as follows:
�� 1% for compensation representing between 4 times the PASS (€150,192) and 8 times the PASS (€300,384), corresponding to 1% of €150,192, i.e. €1,502 (a);
�� 2% for compensation representing between 8 times and 12 times the PASS (€450,576), corresponding to 2% of €150,192, i.e. €3,004 (b);
�� 3% for compensation representing between 12 times and 24 times the PASS (€901,152), corresponding to 3% of €450,576, i.e. €13,517 (c);
�� 2% for compensation representing between 24 times the PASS and €1,000,000 (the reference compensation), corresponding to 2% of €98,848, i.e. €1,977 (d).
The sum of these components – i.e. (a)+(b)+(c)+(d) – represents a total potential annuity entitlement of €20,000 for 2014.
This calculation is performed for each year of plan membership based on the member’s reference compensation and the applicable PASS for that year. The final annuity corresponds to the aggregate of the annual amounts thus calculated.
This total final annuity under the defined benefit plan corresponds to an overall amount that includes any annuity to which the member would be entitled under the Company’s defined contribution plan, i.e. the defined contribution plan annuity is not added to the defined benefit plan annuity.
(1) For the defined contribution plan, the employer’s contribution recognized by Accor in its financial statements for 2014 for each of the Company’s two executive officers corresponded to a gross amount of €9,387.
(2) The reference compensation corresponds to total gross fixed and variable compensation plus any exceptional bonus paid during the reference year.
Registration Document 2014132

3
CORPORATE GOVERNANCEInterests and compensation
Both Sébastien Bazin and Sven Boinet were eligible for these supplementary pension plans in 2014. The potential annuity entitlements accrued in 2014 for Mr. Bazin and Mr. Boinet amounted to €27,056 and €8,988 respectively. The actual payment of these accrued entitlements will be subject to (i) Mr. Bazin and Mr. Boinet meeting the plans’ eligibility criteria when they retire, and (ii) any future changes to the applicable laws and regulations.
Unemployment insurance
A private insurance plan has been set up with Association pour la Garantie Sociale des Chefs et Dirigeants d’Entreprise (GSC) to provide the Chairman and Chief Executive Officer with unemployment
benefits should the need arise. The benefits under this plan would be based on net taxable professional-source income for the previous year, and would be payable as from the 31st unbroken day of unemployment.
For Mr. Bazin, the maximum length of time that he could be paid benefits under the plan was initially 12 months, and the total amount of benefits was capped at €187,740 (based on the applicable rate for 2014). However, as he has now been a member of the plan for more than one year, the maximum length of time that he could be paid benefits under the plan has been increased to 24 months, and the total amount of benefits is now capped at €380,400 (based on the applicable rate for 2015).
Analysis of directors’ and officers’ compensation
Analysis of compensation paid to executive officers
The following tables provide a summary of the total gross compensation and benefits paid and stock options and performance shares granted by Accor to its executive officers for 2013 and 2014.
Table 1: Compensation, stock options and performance shares granted to each executive officer in 2013 and 2014
Sébastien BazinChairman and Chief Executive Officer since August 27, 2013 2013 2014
Compensation for the year (see Table 2 for details) 838,566 2,280,192
Value of stock options granted during the year (see Table 5 for details) (1) 252,000 -
Value of performance shares granted during the year (see Table 11 for details) (2) - 1,655,000
TOTAL 1,090,566 3,935,192
Sven BoinetDeputy Chief Executive Officer since December 2, 2013 2013 2014
Compensation for the year (see Table 2 for details) 50,000 1,329,654
Value of stock options granted during the year (see Table 5 for details) (1) - -
Value of performance shares granted during the year (see Table 11 for details) (2) - 827,500
TOTAL 50,000 2,157,154
(1) Stock options may be exercised only if applicable performance and presence conditions are met. In accordance with the AFEP/MEDEF Corporate Governance Code, stock options are measured at their theoretical value at the grant date rather than at the value of the compensation received. This theoretical value was determined using the Monte-Carlo option pricing model for the performance stock options granted under the September 26, 2013 plan.
(2) In accordance with the AFEP/MEDEF Code, performance shares are measured at their theoretical value – corresponding to Accor’s opening share price on the grant date less the present value of unpaid dividends – rather than at the value of the compensation received. Performance shares are forfeited if the grantee leaves the Group before the shares vest or if the performance conditions are not met. Further details on performance shares granted to Accor’s executive officers and the applicable vesting dates are provided in Table 11 on page 140.
Registration Document 2014 133

CORPORATE GOVERNANCEInterests and compensation3
Table 2: Compensation and benefits paid to each executive officer in 2013 and 2014
Due for the year Paid during the year
2013 2014 2013 2014
Sébastien BazinChairman and Chief Executive Officer since August 27, 2013
�� Fixed compensation (1) 296,408 850,000 296,408 850,000
�� Variable compensation (2) 502,778 1,369,188 - 502,778
�� Directors’ fees (3) 33,100 - 54,588 33,100
�� Benefits-in-kind (4) 6,280 61,004 6,280 61,004
TOTAL 838,566 2,280,192 357,276 1,446,882
Sven BoinetDeputy Chief Executive Officer since December 2, 2013
�� Fixed compensation (1) 50,000 600,000 50,000 600,000
�� Variable compensation (2) - 711,978 - -
�� Directors’ fees (3) - - - -
�� Benefits-in-kind (4) - 17,676 - 17,676
�� Discretionary profit-sharing (5) - ND - -
�� Statutory profit-sharing (5) - ND - -
TOTAL 50,000 1,329,654 50,000 617,676
The above amounts are presented in euros on a gross pre-tax basis.(1) The fixed compensation of the Chairman and Chief Executive Officer and the Deputy Chief Executive Officer is paid in the year in which it is earned.(2) Variable compensation is calculated and paid at the beginning of the year following the year in which it was earned.
Mr. Boinet’s variable compensation for 2014 was calculated over a 13-month period in order to include the portion corresponding to 2013, as decided by the Board of Directors at its meeting on November 26, 2013.
(3) Directors’ fees paid in 2013 and 2014 to Sébastien Bazin cover his term of office as a director of the Accor Group before he became Chairman and Chief Executive Officer.(4) Corresponding to (i) a company car for Sébastien Bazin and Sven Boinet, (ii) the benefits under the unemployment insurance policy taken out by Accor for Sébastien
Bazin as described on page 133, and (iii) tax and asset management advisory services provided by an external company to Sébastien Bazin (capped at 100 hours) and Sven Boinet (capped at 50 hours).
(5) Statutory and discretionary profit-sharing are paid in the year following that for which they are due.The amount disclosed for statutory profit-sharing includes any additional profit-sharing bonuses paid.
In 2014, Yann Caillère received the amounts due to him under the Accor Group statutory profit-sharing agreement and the Accor SA head office discretionary profit-sharing agreement, corresponding to €1,089 and €1,063 respectively.
Table 3: Summary of commitments given to executive officers
Executive officerEmployment
contract
Supplementary pension
benefits (1)
Compensation or benefits payable in the case of:
Non-compete indemnity
termination/removal
from office (2)
transfer to a new
position within the Group
Sébastien BazinChairman and Chief Executive Officer since August 27, 2013 No Yes Yes No No
Sven BoinetDeputy Chief Executive Officer since December 2, 2013. Yes (3) Yes Yes No No
(1) See page 132 for details of the supplementary pension plans of which the Chairman and Chief Executive Officer and the Deputy Chief Executive Officer are members.(2) See pages 131 and 132 for details of these types of compensation and benefits payable to the Chairman and Chief Executive Officer and the Deputy Chief Executive Officer.(3) On November 26, 2013, the Board of Directors appointed Sven Boinet as Deputy Chief Executive Officer in charge of the Group’s Transformation, effective December 2,
2013. On the same date, it also authorized the Company to enter into an employment contract with Mr. Boinet for him to serve as Director in charge of Human Resources and Legal Affairs.
Registration Document 2014134

3
CORPORATE GOVERNANCEInterests and compensation
Compensation paid to other senior executives
The total gross compensation and benefits paid in 2014 by the Group’s French and non-French companies to the members of the Executive Committee – in its form as at December 31, 2014 and not including the Chairman and Chief Executive Officer and the Deputy Chief Executive Officer, whose compensation is described above – amounted to €5,773,000, including aggregate gross variable compensation of €1,413,000.
Provisions set aside at December 31, 2014 for pensions and other post-employment benefits payable to senior executives are presented in note 34 to the consolidated financial statements on page 242.
Directors’ fees
On February 21, 2012, the Board amended the provisions of its Bylaws concerning the individual allocation of directors’ fees, notably by increasing the variable portion based on actual attendance at Board and Committee meetings.
Consequently:
�� the annual amount of directors’ fees is divided into an amount set aside for the Board and an amount set aside for the Board Committees, as determined by the Board of Directors. The amount for the Board Committees is subsequently divided equally among the three Committees;
�� one-third of the amount set aside for the Board and for each Committee is used to pay the fixed portion of directors’ fees, based on a lump sum determined by the Board in line with the number of directors or Committee members concerned;
�� two-thirds of the amount set aside for the Board and each Committee is used to pay the variable portion of directors’ fees based on a per-meeting amount set by the Board depending on the total number of meetings held during the year;
�� the Vice-Chairman of the Board of Directors receives the fixed portion of directors’ fees payable to all directors as well as a fixed portion corresponding to a lump sum determined by the Board of Directors;
�� Committee Chairmen receive a fixed portion of directors’ fees equal to double the fixed portion payable to Committee members;
�� directors who also hold the position of Chairman and Chief Executive Officer, Chief Executive Officer or Deputy Chief Executive Officer do not receive any directors’ fees;
�� directors representing employees do not receive any directors’ fees. The directors’ fees that they would have received are not distributed and instead the Group has pledged to allocate the equivalent amount to supporting Group employees in difficulty;
�� directors’ fees are paid no later than three months following the end of the fiscal year for which they are due.
Based on the maximum gross amount of €575,000 in directors’ fees approved by shareholders at the Annual Meeting on May 30, 2011, the Board allocated a total gross amount of €541,241 to its members for 2014 in accordance with its amended Bylaws. The following table shows a breakdown of directors’ fees paid to the Board’s members in 2013 and 2014.
Table 4: Directors’ fees and other compensation paid to non-executive directors
Board member(in euros)
Due for the year Paid during the year
2013 2014 2013 2014
Fixed portion
Variable portion
Fixed portion
Variable portion
Fixed portion
Variable portion
Fixed portion
Variable portion
Jean-Paul Bailly 23,413 51,120 18,154 47,901 30,000 32,745 23,413 51,120
Thomas J. Barrack 7,117 5,942 N/A N/A 21,000 17,901 7,117 5,942
Sébastien Bazin (1) 10,517 22,582 N/A N/A 27,000 27,588 10,517 22,582
Philippe Citerne 38,014 37,033 41,332 42,274 69,000 42,056 38,014 37,033
Iliane Dumas (2) N/A N/A N/A N/A N/A N/A N/A N/A
Mercedes Erra 15,259 33,285 15,820 36,689 21,000 24,803 15,259 33,285
Sophie Gasperment 18,247 43,990 18,461 40,361 21,000 22,921 18,247 43,990
Jonathan Grunzweig N/A N/A 6,493 10,062 N/A N/A N/A N/A
Iris Knobloch 10,075 21,195 13,675 28,710 N/A N/A 10,075 21,195
Bertrand Meheut 19,935 33,967 18,958 31,681 27,000 27,588 19,935 33,967
Virginie Morgon 15,946 35,637 13,675 34,261 24,000 32,470 15,946 35,637
Nadra Moussalem 10,918 24,414 17,657 44,277 N/A N/A 10,918 24,414
Patrick Sayer 22,191 48,387 22,442 38,357 27,000 25,706 22,191 48,387
(1) Directors’ fees paid in relation to Mr. Bazin’s position as director up until August 27, 2013, the date on which he was appointed Chairman and Chief Executive Officer.(2) In accordance with Article 8 of the Board of Directors’ Bylaws, the director representing employees does not receive directors’ fees. Accor has pledged to allocate the
equivalent amount to the Solidarity Accor fund.
Registration Document 2014 135

CORPORATE GOVERNANCEInterests and compensation3
3.5.2 DIRECTORS’ AND EMPLOYEES’ INTERESTS
Accor regularly sets up stock-based incentive plans for executives, as well as for senior and middle managers. The terms and conditions of the plans are determined by the Board of Directors, which then gives the Chairman and Chief Executive Officer the necessary powers to carry out the grants. In accordance with the AFEP/MEDEF Corporate Governance Code, the plans set up in 2014 were launched during the same period as in previous years.
Stock option plans
Stock option plans set up in 2014
At its meeting on February 19, 2014 the Board of Directors decided not to set up any stock option plans in 2014.
Table 5: Stock options granted to executive officers in 2014
GranteePlan number
and dateType of options
Theoretical value based on the method used in the consolidated
financial statements(in euros)
Number of options
Exercise price
(in euros)
Exercise period
Sébastien Bazin _ _ _ _ _ _
Sven Boinet _ _ _ _ _ _
Achievement levels of performance conditions for outstanding stock option plans
Each year, the Board of Directors places on record the achievement level of the performance conditions applicable under the performance stock option plans set up for executive officers and other members of the Executive Committee. Consequently, at its meeting on February 17, 2015, the Board placed on record the degree to which the performance condition for the plans outstanding in 2014 had been met. The Board’s assessment related to a single external performance condition based on Accor’s TSR relative to that of eight other international hotel groups, as described in note 26.3 to the consolidated financial statements.
The achievement level of this performance condition is measured for each of the four years of the vesting periods under the plans, with between 0% and 37.5% of the options originally granted depending on the degree to which the condition has been met. However, the total number of options that may be exercised at the end of the four-year vesting period is capped at 100% of the number of options originally granted.
Table 6: Achievement levels in 2014 of the performance condition for stock option plans
Plan Grant date Performance conditionAchievement
level
Number of options vested
in 2014
Maximum number of options that could
have vested in 2014
Plan 24 April 4, 2011Accor’s TSR relative to that of eight other international hotel groups
6th 9,962 19,922
Plan 26 March 27, 2012Accor’s TSR relative to that of eight other international hotel groups
6th 0 17,766
Plan 27 September 26, 2013Accor’s TSR relative to that of eight other international hotel groups(1)
8th 0 15,000
(1) Calculated over the period from September 1, 2013 to August 31, 2014.
Registration Document 2014136

3
CORPORATE GOVERNANCEInterests and compensation
Table 7: Stock options granted to employees and/or executive officers
Plan Grant date
Date of Shareholders’
Meeting approval
Total number of options
Total number
of grantees
Exercisable from
Expiry date
Exercise price
(in euros)
Options exercised
in 2014
Total options
exercised through
12/31/2014
Total options cancelled
through 12/31/2014 (3)
Options outstanding
at 12/31/2014
Total number
of options
granted (1)
Of which to
executive officers
Of which to the
top ten employee grantees (2)
Stock option plans
Plan 14 03/22/2007 (4) 01/09/2006 2,183,901 94,250 192,270 958 03/23/2011 03/22/2014 45.52 - - 2,183,901 -
Plan 15 05/14/2007 (5) 01/09/2006 129,694 42,662 87,032 11 05/15/2011 05/14/2014 47.56 - - 129,694 -
Plan 17 03/28/2008 (6) 01/09/2006 2,080,442 94,250 303,108 1,022 03/29/2012 03/28/2015 30.81 810,265 932,810 180,072 967,560
Plan 18 09/30/2008 (7) 05/13/2008 110,052 - 110,052 6 10/01/2012 09/30/2015 28.32 71,224 71,224 7,508 31,320
Plan 19 03/31/2009 (8) 05/13/2008 1,429,456 131,950 190,008 1,138 04/01/2013 03/31/2017 18.20 251,336 705,111 164,483 559,862
Plan 20 04/02/2010 (9) 05/13/2008 2,618,770 190,125 (16) 317,434 1,020 04/03/2014 04/02/2018 26.66 552,164 553,069 481,366 1,584,335
Plan 21 04/02/2010 (5)(9) 05/13/2008 153,478 63,375 (16) 90,103 10 04/03/2014 04/02/2018 26.66 - - 76,287 77,191
Plan 22 11/22/2010 (10) 05/13/2008 92,448 - 92,448 5 11/23/2014 11/22/2018 30.49 - - - 92,448
Plan 23 04/04/2011 (11) 05/13/2008 621,754 99,375 (16) 107,439 783 04/05/2015 04/04/2019 31.72 - - 38,890 582,864
Plan 24 04/04/2011 (5)(11) 05/13/2008 53,125 33,125 (16) 20,000 8 04/05/2015 04/04/2019 31.72 - - 19,922 33,203
Plan 25 03/27/2012 (12) 05/30/2011 527,515 80,250 (16) 101,375 390 03/28/2016 03/27/2020 26.41 - - 23,950 503,565
Plan 26 03/27/2012 (5)(13) 05/30/2011 47,375 26,750 (16) 20,625 8 03/28/2016 03/27/2020 26.41 - - - 47,375
Plan 27 09/26/2013 (5)(15) 04/25/2013 40,000 40,000 - 1 09/27/2017 09/26/2021 30.13 - - - 40,000
Total options 10,088,010 1,684,989 2,262,214 3,306,073 4,519,723
Stock savings warrants (12)
Plan 16 09/13/2007 2,139 40 09/13/2010 09/13/2015 40.08 - - - 2,139
Total stock savings warrants 2,139 - - 2,139
TOTAL 10,090,149 2,262,214 3,306,073 4,521,862(14)
(1) After adjustments following the Group’s July 2, 2010 demerger, made to all of the plans apart from Plans 22, 23, 24, 25, 26 and 27.(2) Excluding executive officers.(3) Options cancelled due to grantees leaving the Group or performance conditions not being met. Cancellations due to failure to meet performance conditions are carried
out at the end of the last performance measurement period.(4) Granted by the Chief Executive Officer pursuant to the Board authorization of March 6, 2007.(5) All options granted subject to performance conditions.(6) Granted by the Chief Executive Officer pursuant to the Board authorization of February 26, 2008.(7) Granted by the Chief Executive Officer pursuant to the Board authorization of August 27, 2008.(8) Granted by the Chairman and Chief Executive Officer pursuant to the Board authorization of February 24, 2009.(9) Granted by the Chairman and Chief Executive Officer pursuant to the Board authorization of February 23, 2010.(10) Granted by the Chairman and Chief Executive Officer pursuant to the Board authorization of October 13, 2010.(11) Granted by the Chairman and Chief Executive Officer pursuant to the Board authorization of February 22, 2011.(12) Granted in connection with Accor employee share issues.(13) Granted by the Chairman and Chief Executive Officer pursuant to the Board authorization of February 21, 2012.(14) Representing 1.950% of the Company’s capital at December 31, 2014, of which 0.234% corresponding to grants to executive officers.(15) Granted by the Vice-Chairman of the Board of Directors pursuant to the Board authorization of August 27, 2013.(16) The condition requiring Mr. Hennequin and Mr. Caillère to still be a member of the Group was waived.
Registration Document 2014 137

CORPORATE GOVERNANCEInterests and compensation3
Stock options granted and exercised in 2014
Table 8: Stock options exercised by each executive officer in 2014
Grantee Plan number and dateNumber of options
exercised during the year Exercise price
Sébastien Bazin _ _ _
Sven Boinet _ _ _
Table 9: Stock options granted to and exercised by the ten employee grantees other than executive officers who received or exercised the largest number of options
Number of options
Average exercise price(in euros)
Options granted in 2014 to the ten employees other than executive officers who received the largest number of options - -
Options exercised in 2014 by the ten employees other than executive officers who exercised the largest number of options 228,167 26.83
Lock-up conditions
In accordance with the French Commercial Code and the AFEP/MEDEF Code, when executive officers or other Executive Committee members purchase shares on exercise of stock options granted since March 22, 2007, a certain proportion of these shares, as set by the Board of Directors, must be held by the grantee until he or she either leaves the Accor Group or ceases to hold the position of executive officer or Executive Committee member, as applicable. The lock-up conditions vary depending on the plan concerned, as shown in the table below.
Registration Document 2014138

3
CORPORATE GOVERNANCEInterests and compensation
Table 10: Lock-up conditions for shares purchased on exercise of stock options by executive officers and other members of the Executive Committee
Plan Grant date Lock-up conditions applicable to executive officersLock-up conditions applicable to other Executive Committee members
Plan 14Plan 15Plan 17Plan 18
03/22/200705/14/200703/28/200809/30/2008
Shares corresponding to the equivalent of 40% of the net capital gain on the exercised options may not be sold until the grantee leaves the Accor Group.
Shares corresponding to the equivalent of 25% of the net capital gain on the exercised options may not be sold until the grantee leaves the Accor Group.
Plan 19Plan 20Plan 21Plan 22
03/31/200904/02/201004/02/201011/22/2010
Shares corresponding to the equivalent of 40% of the net capital gain on the exercised options may not be sold until the grantee ceases to hold a directorship or an executive officer’s position.
Shares corresponding to the equivalent of 25% of the net capital gain on the exercised options may not be sold until the grantee ceases to be a member of the Executive Committee.
Plan 23Plan 24Plan 25Plan 26
04/04/201104/04/201103/27/201203/27/2012
Shares corresponding to the equivalent of 40% of the net capital gain on the exercised options may not be sold until the grantee ceases to hold a directorship or an executive officer’s position.However, if the value of the shares exceeds two years of the grantee’s fixed compensation, the minimum number of shares locked up following the exercise of stock options is reduced to the equivalent of 10% of the net capital gain on the exercised options.
Shares corresponding to the equivalent of 40% of the net capital gain on the exercised options may not be sold until the grantee ceases to be a member of the Executive Committee.However, if the value of the shares exceeds two years of the grantee’s fixed compensation, none of the shares purchased on exercise of the stock options will be locked up.
Plan 27 09/26/2013 Shares corresponding to the equivalent of 40% of the net capital gain on the exercised options may not be sold until the grantee ceases to hold an executive officer’s position within the Accor Group.However, if the value of the shares exceeds two years of the grantee’s fixed compensation, the minimum number of shares locked up following the exercise of stock options is reduced to the equivalent of 10% of the net capital gain on the exercised options.
N/A
Hedging instruments
Accor’s executive officers have undertaken not to use any hedging instruments in relation to their stock options, and members of the Executive Committee who receive stock options are banned by the Company from using any such instruments.
Performance share plans
Performance share plans set up in 2014
Under the terms of the authorization given in the twenty-second resolution of the April 25, 2013 Annual Shareholders’ Meeting, the number of performance shares granted may not correspond to more than 2.5% of the Company’s capital, with this percentage representing a blanket ceiling that also covers stock options.
In accordance with Article L. 225-197-6 of the French Commercial Code, Accor has a discretionary profit-sharing plan that covers at least 90% of all employees in the Company and its subsidiaries in France.
Accor set up the following two performance share plans on June 18, 2014:
�� the first, intended for senior and middle managers, concerned 890 beneficiaries in some 40 countries worldwide. The applicable performance conditions are based on the following:
�y actual versus budgeted EBIT margin (50% weighting),
�y actual versus budgeted operating cash flow (excluding acquisitions and disposals) (50% weighting).
The plan’s performance shares have a two-year vesting period followed by a two-year lock-up period, or a four-year vesting period without any lock-up, depending on the country;
�� the second plan, restricted to executive officers, other members of the Executive Committee, and certain senior managers, concerned 20 beneficiaries in four countries. Sébastien Bazin and Sven Boinet were the two executive officer grantees and the number of performance shares granted to them is set out in Table 11 on page 140. The applicable performance conditions are based on the following:
�y actual versus budgeted EBIT margin (30% weighting),
�y actual versus budgeted operating cash flow (excluding acquisitions and disposals) (30% weighting),
�y degree of completion of budgeted asset disposals (15% weighting),
�y Accor’s TSR relative to that of eight other international hotel groups (25% weighting).
The plan’s performance shares have a two-year vesting period followed by a two-year lock-up period, or a four-year vesting period without any lock-up, depending on the country.
Registration Document 2014 139

CORPORATE GOVERNANCEInterests and compensation3
The performance conditions under these plans are measured for each of their first two years, with between 0% and 50% of the share grants vesting in each of those years depending on the degree to which the performance conditions have been met. If the objectives under one performance condition are not met this
may be offset by any outperformance achieved with respect to an objective applicable under another performance condition for the same year. The number of shares that vest at the end of the two-year vesting period is capped at 100% of the number of shares originally granted and offsetting between the two years is not permitted.
Table 11: Performance shares granted to each executive officer in 2014
GranteeGrant date
Number of shares granted
Theoretical value based on the method used in the consolidated financial statements(in euros) Vesting date
End of lock-up period Performance conditions
Sébastien Bazin 06/18/2014 50,000 1,655,000 (1) 06/19/2016 06/19/2018 Actual versus budgeted EBIT marginActual versus budgeted operating cash flow (excluding acquisitions and disposals)Degree of completion of budgeted asset disposalsAccor’s Total Shareholder Return (TSR) relative to that of eight other international hotel groups
Sven Boinet 06/18/2014 25,000 827,500 (1) 06/19/2016 06/19/2018 Actual versus budgeted EBIT marginActual versus budgeted operating cash flow (excluding acquisitions and disposals)Degree of completion of budgeted asset disposalsAccor’s Total Shareholder Return (TSR) relative to that of eight other international hotel groups
(1) In accordance with the AFEP/MEDEF Corporate Governance Code, performance shares are measured at their theoretical value – corresponding to Accor’s opening share price on the grant date less the present value of unpaid dividends – rather than at the value of the compensation received.
The 73,125 performance shares granted to the Company’s executive officers in 2014 and which were still valid at the date of this Registration Document would represent 0.032% of the Company’s capital at December 31, 2014 should they fully vest.
Table 12: Performance shares granted in 2014 to the top ten employee grantees other than executive officers
Number of shares granted
Performance shares granted in 2014 to the ten employee grantees other than executive officers who received the largest number of shares 95,500
Achievement levels of performance conditions for outstanding performance share plans
Each year, the Board of Directors places on record the achievement level of the performance conditions applicable under outstanding performance share plans.
The table below shows the maximum number of shares that may vest and the number of shares that have actually vested based on the achievement level of the applicable performance conditions (as placed on record by the Board of Directors on February 17, 2015) for outstanding performance share plans.
Registration Document 2014140

3
CORPORATE GOVERNANCEInterests and compensation
Table 13: Achievement levels in 2014 of the performance conditions for performance share plans
Theoretical maximum number of shares that may vest
Actual number of shares vested in 2014
Grant date Performance conditionsCriteria
weighting
By performance
condition(before cap)
Aggregate(after cap)
By performance
condition(before
cap)
Aggregate(after
cap)
% of original grants
04/15/2013
Actual versus budgeted EBIT margin
50% 78,426
104,568
65,355
104,568 50%Actual versus budgeted operating cash flow (excluding acquisitions and disposals)
50% 78,426 78,426
04/15/2013
Actual versus budgeted EBIT margin
25% 10,781
28,750
8,988
19,769 34.38%
Actual versus budgeted operating cash flow (excluding acquisitions and disposals)
25% 10,781 10,781
Degree of completion of budgeted asset disposals
25% 10,781 0
Accor’s TSR relative to that of eight other international hotel groups
25% 10,781 0
06/18/2014
Actual versus budgeted EBIT margin
50% 105,525
140,700
87,938
140,700 50%Actual versus budgeted operating cash flow (excluding acquisitions and disposals)
50% 105,525 105,525
06/18/2014
Actual versus budgeted EBIT margin
30% 44,663
99,250
37,218
94,288 47.5%
Actual versus budgeted operating cash flow (excluding acquisitions and disposals)
30% 44,663 44,663
Degree of completion of budgeted asset disposals
15% 22,331 0
Accor’s TSR relative to that of eight other international hotel groups
25% 37,219 12,407
Registration Document 2014 141

CORPORATE GOVERNANCEInterests and compensation3
Table 14: Performance shares granted to employees and/or executive officers
Grant dateDate of Shareholders’
Meeting approvalTotal number
of grantees
Number of shares granted
Number of shares
cancelled (2) Vesting dateEnd of lock-up
period
Number of vested
shares subject to
lock-up
Number of vested shares no longer subject to
lock-up Performance conditions
Total number of shares
granted
Of which to executive
officers
Of which to the top ten
employee grantees (1)
04/04/2011 (6) 05/13/2008 783 228,657 16,625 31,766 13,576 04/04/2013 or 04/04/2015 (3)
04/04/2015 182,212 (4) 120 (5) Revenue growth based on constant scope of consolidation, actual versus budgeted EBIT and actual versus budgeted operating cash flow (excluding disposals)
04/04/2011 (6) 05/13/2008 1 20,450 20,450 (11) - 6,816 04/04/2014 04/04/2016 13,634 (4) - Successfully taking up the duties of Chairman and Chief Executive Officer
03/27/2012 (7) 05/30/2011 919 237,601 - 18,125 26,223 03/27/2014 or 03/27/16 (3)
03/27/2016 151,877 (4) 150 (5) Actual versus budgeted EBIT margin and actual versus budgeted operating cash flow (excluding acquisitions and disposals)
03/27/2012 (7) 05/30/2011 8 47,375 26,750 (11) 20,625 9,871 03/27/2014 03/27/2016 37,504 (4) - Actual versus budgeted EBIT margin, actual versus budgeted operating cash flow (excluding acquisitions and disposals), and degree of completion of budgeted asset disposals
04/15/2013 (8) 05/30/2011 793 218,050 - 25,750 8,915 04/15/2015 or 04/15/2017 (3)
04/15/2017 - - Actual versus budgeted EBIT margin and actual versus budgeted operating cash flow (excluding acquisitions and disposals)
04/15/2013 (8) 05/30/2011 8 72,500 32,500 (11) 40,000 31,169 04/15/2015 04/15/2017 - - Actual versus budgeted EBIT margin, actual versus budgeted operating cash flow (excluding acquisitions and disposals), degree of completion of budgeted asset disposals, and Accor’s Total Shareholder Return (TSR) relative to eight other international hotel groups
06/18/2014 (9) 04/25/2013 890 285,900 - 23,000 4,500 06/19/2016 or 06/19/2018 (3)
06/19/2018 - - Actual versus budgeted EBIT margin and actual versus budgeted operating cash flow (excluding acquisitions and disposals)
06/18/2014 (9) 04/25/2013 20 198,500 75,000 95,500 4,963 06/19/2016 or 06/19/2018 (3)
06/19/2018 - - Actual versus budgeted EBIT margin, actual versus budgeted operating cash flow (excluding acquisitions and disposals), degree of completion of budgeted asset disposals, and Accor’s Total Shareholder Return (TSR) relative to eight other international hotel groups
TOTAL SHARES (10) 1,309,033 106,033
(1) Excluding executive officers.(2) Shares cancelled due to grantees leaving the Group or performance conditions not being met.(3) In some countries, the vesting period is four years.(4) Shares acquired by grantees following a two-year vesting period but which are subject to a two-year lock-up period.(5) Shares vested following the death of a grantee, in accordance with Article L. 225-197-3 of the French Commercial Code.(6) Granted by the Chairman and Chief Executive Officer pursuant to the Board authorization of February 22, 2011.(7) Granted by the Chairman and Chief Executive Officer pursuant to the Board authorization of February 21, 2012.(8) Granted by the Chairman and Chief Executive Officer pursuant to the Board authorization of March 3, 2013.(9) Granted by the Chairman and Chief Executive Officer pursuant to the Board authorization of April 25, 2013.(10) The total number of shares granted less the total number of shares cancelled represented the equivalent of 0.519% of the Company’s capital
at December 31, 2014, of which 0.060% corresponding to grants to executive officers.(11) The condition requiring Mr. Hennequin and Mr. Caillère to still be a member of the Group was waived.
Registration Document 2014142
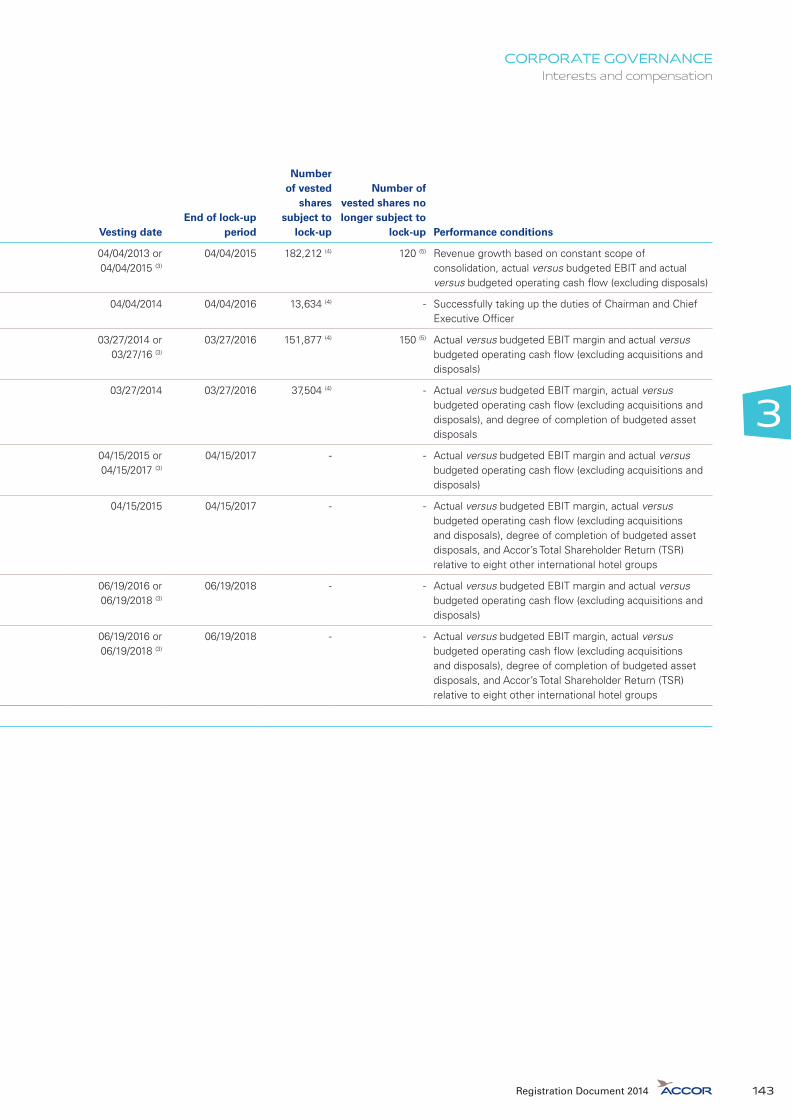
3
CORPORATE GOVERNANCEInterests and compensation
Table 14: Performance shares granted to employees and/or executive officers
Grant dateDate of Shareholders’
Meeting approvalTotal number
of grantees
Number of shares granted
Number of shares
cancelled (2) Vesting dateEnd of lock-up
period
Number of vested
shares subject to
lock-up
Number of vested shares no longer subject to
lock-up Performance conditions
Total number of shares
granted
Of which to executive
officers
Of which to the top ten
employee grantees (1)
04/04/2011 (6) 05/13/2008 783 228,657 16,625 31,766 13,576 04/04/2013 or 04/04/2015 (3)
04/04/2015 182,212 (4) 120 (5) Revenue growth based on constant scope of consolidation, actual versus budgeted EBIT and actual versus budgeted operating cash flow (excluding disposals)
04/04/2011 (6) 05/13/2008 1 20,450 20,450 (11) - 6,816 04/04/2014 04/04/2016 13,634 (4) - Successfully taking up the duties of Chairman and Chief Executive Officer
03/27/2012 (7) 05/30/2011 919 237,601 - 18,125 26,223 03/27/2014 or 03/27/16 (3)
03/27/2016 151,877 (4) 150 (5) Actual versus budgeted EBIT margin and actual versus budgeted operating cash flow (excluding acquisitions and disposals)
03/27/2012 (7) 05/30/2011 8 47,375 26,750 (11) 20,625 9,871 03/27/2014 03/27/2016 37,504 (4) - Actual versus budgeted EBIT margin, actual versus budgeted operating cash flow (excluding acquisitions and disposals), and degree of completion of budgeted asset disposals
04/15/2013 (8) 05/30/2011 793 218,050 - 25,750 8,915 04/15/2015 or 04/15/2017 (3)
04/15/2017 - - Actual versus budgeted EBIT margin and actual versus budgeted operating cash flow (excluding acquisitions and disposals)
04/15/2013 (8) 05/30/2011 8 72,500 32,500 (11) 40,000 31,169 04/15/2015 04/15/2017 - - Actual versus budgeted EBIT margin, actual versus budgeted operating cash flow (excluding acquisitions and disposals), degree of completion of budgeted asset disposals, and Accor’s Total Shareholder Return (TSR) relative to eight other international hotel groups
06/18/2014 (9) 04/25/2013 890 285,900 - 23,000 4,500 06/19/2016 or 06/19/2018 (3)
06/19/2018 - - Actual versus budgeted EBIT margin and actual versus budgeted operating cash flow (excluding acquisitions and disposals)
06/18/2014 (9) 04/25/2013 20 198,500 75,000 95,500 4,963 06/19/2016 or 06/19/2018 (3)
06/19/2018 - - Actual versus budgeted EBIT margin, actual versus budgeted operating cash flow (excluding acquisitions and disposals), degree of completion of budgeted asset disposals, and Accor’s Total Shareholder Return (TSR) relative to eight other international hotel groups
TOTAL SHARES (10) 1,309,033 106,033
(1) Excluding executive officers.(2) Shares cancelled due to grantees leaving the Group or performance conditions not being met.(3) In some countries, the vesting period is four years.(4) Shares acquired by grantees following a two-year vesting period but which are subject to a two-year lock-up period.(5) Shares vested following the death of a grantee, in accordance with Article L. 225-197-3 of the French Commercial Code.(6) Granted by the Chairman and Chief Executive Officer pursuant to the Board authorization of February 22, 2011.(7) Granted by the Chairman and Chief Executive Officer pursuant to the Board authorization of February 21, 2012.(8) Granted by the Chairman and Chief Executive Officer pursuant to the Board authorization of March 3, 2013.(9) Granted by the Chairman and Chief Executive Officer pursuant to the Board authorization of April 25, 2013.(10) The total number of shares granted less the total number of shares cancelled represented the equivalent of 0.519% of the Company’s capital
at December 31, 2014, of which 0.060% corresponding to grants to executive officers.(11) The condition requiring Mr. Hennequin and Mr. Caillère to still be a member of the Group was waived.
Registration Document 2014 143

CORPORATE GOVERNANCEInterests and compensation3
Table 15: Performance shares that vested in 2014 but which are subject to lock-up, and performance shares whose lock-up period expired in 2014
Grantee Grant date
Number of shares
granted Vesting date
End of lock-up period
Number of shares vested during
the year subject to lock-up
Number of vested shares no longer
subject to lock-up
Sébastien Bazin _ _ _ _ _ _
Sven Boinet _ _ _ _ _ _
Lock-up conditions
In accordance with the French Commercial Code and the AFEP/MEDEF Code, when executive officers or other Executive Committee members acquire shares under performance share plans set up since May 14, 2007, a certain proportion of these shares, as set
by the Board of Directors, may not be sold until the grantee either leaves the Accor Group or ceases to hold the position of executive officer or Executive Committee member, as applicable. The lock-up conditions vary depending on the plan concerned, as shown in the table below.
Table 16: Lock-up conditions for vested performance shares owned by executive officers and other members of the Executive Committee
Grant dateLock-up conditionsapplicable to executive officers
Lock-up conditions applicable toother Executive Committee members
03/31/2009 The following percentages of shares may not be sold until the grantee ceases to hold a directorship or an executive officer’s position:20% of the vested shares on fulfillment of the performance conditions. In addition, the grantee must purchase Accor shares corresponding to 3% of the number of vested shares.OR25% of the vested shares on fulfillment of the performance conditions.
25% of the vested shares on fulfillment of the performance conditions may not be sold until the grantee ceases to be a member of the Executive Committee.
04/4/2011 The following percentages of shares may not be sold until the grantee ceases to hold a directorship or an executive officer’s position:20% of the vested shares on fulfillment of the performance conditions. In addition, the grantee must purchase Accor shares corresponding to 3% of the number of vested shares.OR25% of the vested shares on fulfillment of the performance conditions.However, if the value of the shares exceeds two years of the grantee’s fixed compensation, the only lock-up condition is that the executive officer must purchase Accor shares corresponding to 3% of the number of vested shares.
The following percentages of shares may not be sold until the grantee ceases to be a member of the Executive Committee:20% of the vested shares on fulfillment of the performance conditions. In addition, the grantee must purchase Accor shares corresponding to 3% of the number of vested shares.OR25% of the vested shares on fulfillment of the performance conditions.However, if the value of the shares exceeds two years of the grantee’s fixed compensation, none of the vested shares will be subject to lock-up conditions.
03/27/2012 25% of the vested shares on fulfillment of the performance conditions may not be sold until the grantee ceases to hold a directorship or an executive officer’s position.However, if the value of the shares exceeds two years of the grantee’s fixed compensation, the only lock-up condition is that the executive officer must purchase Accor shares corresponding to 3% of the number of vested shares.
25% of the vested shares on fulfillment of the performance conditions may not be sold until the grantee ceases to be a member of the Executive Committee.However, if the value of the shares exceeds two years of the grantee’s fixed compensation, none of the vested shares will be subject to lock-up conditions.
Registration Document 2014144

3
CORPORATE GOVERNANCEInterests and compensation
Grant dateLock-up conditionsapplicable to executive officers
Lock-up conditions applicable toother Executive Committee members
04/15/2013 25% of the vested shares on fulfillment of the performance conditions may not be sold until the grantee ceases to hold an executive officer’s position within the Accor Group.However, if the value of the shares exceeds two years of the grantee’s fixed compensation, the only lock-up condition is that the executive officer must purchase Accor shares corresponding to 3% of the number of vested shares.
25% of the vested shares on fulfillment of the performance conditions may not be sold until the grantee ceases to be a member of the Executive Committee.However, if the value of the shares exceeds two years of the grantee’s fixed compensation, none of the vested shares will be subject to lock-up conditions.
06/18/2014 The following conditions apply until the grantee ceases to hold an executive officer’s position within the Accor Group:�� At the end of the lock-up period, the grantee must keep 25% of the vested shares on fulfillment of the performance conditions until the value of all the available shares held in registered form by the grantee represents the equivalent of a threshold corresponding to two years of his fixed compensation.For the purposes of the above paragraph:
�y the value of the shares held in registered form is determined based on the average of the Accor opening share price quoted over the 20 trading days preceding the measurement date;�y ”fixed compensation“ means the amount of the grantee’s annual gross fixed compensation at the measurement date.
�� Once the above threshold is reached:�y (i) the 25% lock-up condition no longer applies; and�y (ii) the grantee is required to acquire, or keep, 3% of his vested shares.
The following conditions apply until the grantee ceases to be a member of the Accor Group Executive Committee:�� At the end of the lock-up period, grantees who were Executive Committee members at the grant date are required to keep 25% of the shares that vest on fulfillment of the performance conditions until the value of all the available shares held in registered form by the grantee represents the equivalent of a threshold corresponding to two years of the grantee’s fixed compensation.For the purposes of the above paragraph:
�y the value of the shares held in registered form is determined based on the average of the Accor opening share price quoted over the 20 trading days preceding the measurement date;�y ”fixed compensation“ means the amount of the grantee’s annual gross fixed compensation at the measurement date.
�� Once the above threshold is reached the 25% lock-up condition no longer applies.
Hedging instruments
Accor’s executive officers have undertaken not to use any hedging instruments in relation to their performance shares and members of the Executive Committee who receive performance shares have been banned by the Company from using any such instruments.
Share equivalents
Stock options granted to employees and/or executive officers
At December 31, 2014, a total of 4,521,862 stock options were outstanding.
Exercise of all of these options would lead to the issuance of 4,521,862 shares, representing 1.950% of the Company’s capital at December 31, 2014.
Non-discretionary and discretionary profit-sharing agreements
Non-discretionary profit-sharing
In France, a Group-level non-discretionary profit-sharing agreement providing for payment in excess of the legally-mandated minimum (accord dérogatoire) has been negotiated with employee representatives.
It is applicable to Accor and its French subsidiaries that are at least 50%-owned, irrespective of the number of employees in the company concerned.
The agreement enables employees with more than three months’ seniority to receive profit-shares based on the results of all of the subsidiaries covered by the program.
Sums are paid into a special profit-sharing reserve, calculated by applying a standard legal formula to the profits of each company that falls within the scope of application of the agreement, as follows:
Special profit-sharing reserve = 1/2 x (net profit - 5% of equity) x (salaries/value added)
Based on this formula, a gross amount of €6.67 million was allocated to the profit-sharing reserve for 2013 (paid in 2014).
Registration Document 2014 145
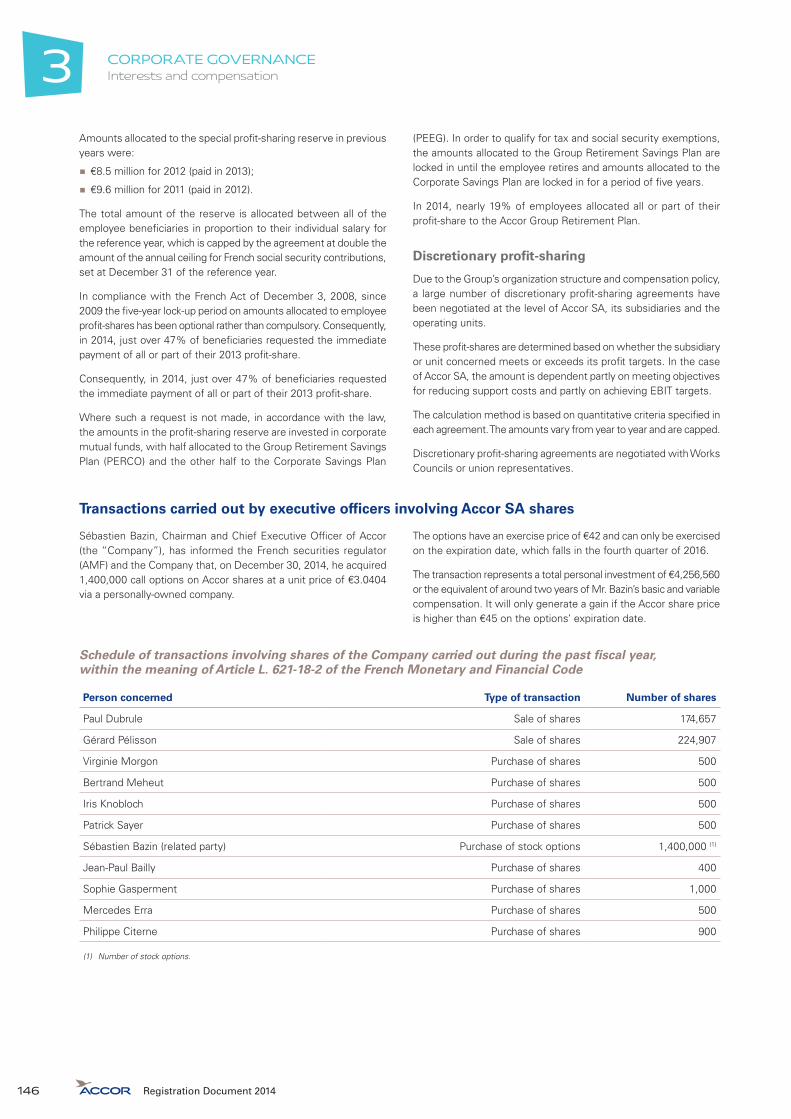
CORPORATE GOVERNANCEInterests and compensation3
Amounts allocated to the special profit-sharing reserve in previous years were:
�� €8.5 million for 2012 (paid in 2013);
�� €9.6 million for 2011 (paid in 2012).
The total amount of the reserve is allocated between all of the employee beneficiaries in proportion to their individual salary for the reference year, which is capped by the agreement at double the amount of the annual ceiling for French social security contributions, set at December 31 of the reference year.
In compliance with the French Act of December 3, 2008, since 2009 the five-year lock-up period on amounts allocated to employee profit-shares has been optional rather than compulsory. Consequently, in 2014, just over 47% of beneficiaries requested the immediate payment of all or part of their 2013 profit-share.
Consequently, in 2014, just over 47% of beneficiaries requested the immediate payment of all or part of their 2013 profit-share.
Where such a request is not made, in accordance with the law, the amounts in the profit-sharing reserve are invested in corporate mutual funds, with half allocated to the Group Retirement Savings Plan (PERCO) and the other half to the Corporate Savings Plan
(PEEG). In order to qualify for tax and social security exemptions, the amounts allocated to the Group Retirement Savings Plan are locked in until the employee retires and amounts allocated to the Corporate Savings Plan are locked in for a period of five years.
In 2014, nearly 19% of employees allocated all or part of their profit-share to the Accor Group Retirement Plan.
Discretionary profit-sharing
Due to the Group’s organization structure and compensation policy, a large number of discretionary profit-sharing agreements have been negotiated at the level of Accor SA, its subsidiaries and the operating units.
These profit-shares are determined based on whether the subsidiary or unit concerned meets or exceeds its profit targets. In the case of Accor SA, the amount is dependent partly on meeting objectives for reducing support costs and partly on achieving EBIT targets.
The calculation method is based on quantitative criteria specified in each agreement. The amounts vary from year to year and are capped.
Discretionary profit-sharing agreements are negotiated with Works Councils or union representatives.
Transactions carried out by executive officers involving Accor SA shares
Sébastien Bazin, Chairman and Chief Executive Officer of Accor (the “Company”), has informed the French securities regulator (AMF) and the Company that, on December 30, 2014, he acquired 1,400,000 call options on Accor shares at a unit price of €3.0404 via a personally-owned company.
The options have an exercise price of €42 and can only be exercised on the expiration date, which falls in the fourth quarter of 2016.
The transaction represents a total personal investment of €4,256,560 or the equivalent of around two years of Mr. Bazin’s basic and variable compensation. It will only generate a gain if the Accor share price is higher than €45 on the options’ expiration date.
Schedule of transactions involving shares of the Company carried out during the past fiscal year, within the meaning of Article L. 621-18-2 of the French Monetary and Financial Code
Person concerned Type of transaction Number of shares
Paul Dubrule Sale of shares 174,657
Gérard Pélisson Sale of shares 224,907
Virginie Morgon Purchase of shares 500
Bertrand Meheut Purchase of shares 500
Iris Knobloch Purchase of shares 500
Patrick Sayer Purchase of shares 500
Sébastien Bazin (related party) Purchase of stock options 1,400,000 (1)
Jean-Paul Bailly Purchase of shares 400
Sophie Gasperment Purchase of shares 1,000
Mercedes Erra Purchase of shares 500
Philippe Citerne Purchase of shares 900
(1) Number of stock options.
Registration Document 2014146

3
CORPORATE GOVERNANCEStatutory Auditors’ special report on related party agreements and commitments
3.6. STATUTORY AUDITORS’ SPECIAL REPORT ON RELATED PARTY AGREEMENTS AND COMMITMENTS
Shareholders’ Meeting to approve the financial statements for the year ended December 31, 2014
This is a free translation into English of the statutory auditor’s special report on regulated agreements and commitments with third parties that is issued in the French language and is provided solely for the convenience of English speaking readers. This report on regulated agreements and commitments should be read in conjunction with, and construed in accordance with, French law and professional auditing standards applicable in France. It should be understood that the agreements reported on are only those provided by the French Commercial Code (Code de Commerce) and that the report does not apply to those related party transactions described in IAS 24 or other equivalent accounting standards.
To the Shareholders,
In our capacity as Statutory Auditors of Accor, we hereby report to you on related party agreements and commitments.
It is our responsibility to report to shareholders, based on the information provided to us, on the main terms and conditions of agreements and commitments that have been disclosed to us or that we may have identified as part of our engagement, without commenting on their relevance or merit or identifying any other agreements or commitments. In accordance with Article R.225-31 of the French Commercial Code (Code de Commerce), it is the responsibility of the shareholders to determine whether the agreements and commitments are appropriate and should be approved.
It is also our responsibility to provide shareholders with the information required under Article R.225-31 of the French Commercial Code, on the performance during 2014 of any agreements and commitments already approved by shareholders.
We conducted our procedures in accordance with the professional guidelines of the French National Institute of Statutory Auditors (Compagnie Nationale des Commissaires aux Comptes) relating to this engagement. These procedures involved verifying that the information provided to us is consistent with the underlying documents.
AGREEMENTS AND COMMITMENTS SUBMITTED FOR SHAREHOLDER APPROVAL
Agreements and commitments authorized during 2014
In accordance with Article L.225-40 of the French Commercial Code, we have been informed of the following agreements and commitments authorized by the Board of Directors.
1. With Sébastien Bazin, Chairman and Chief Executive Officer
The agreements and commitments authorized in favor of Mr. Sébastien Bazin were approved by the Shareholders’ Meeting on April 29, 2014. Pursuant to Article L 225-42-1 of the French Commercial Code, since Mr. Bazin’s terms of office as Chairman and Chief Executive Officer and Director were approved at the same Shareholders’ Meeting, the agreements and commitments entered into on his behalf must be submitted once again for approval. These agreements and commitments had not been amended at the time of their renewal.
a) Type of commitment and purpose: Compensation for loss of office payable to Mr. Sébastien Bazin as Chairman and Chief Executive Officer or non-renewal of his Director’s term of office
Terms and conditions:
On February 19, 2014, the Board of Directors authorized the Company to enter into an agreement for the payment to Mr. Sébastien Bazin of a termination benefit as compensation for loss of office in the event that his appointment as Chairman and Chief Executive Office is terminated (except in the event of gross or willful misconduct) or his Director’s term of office is not renewed. The amount of the termination benefit would be equal to twice the amount of Mr. Bazin’s total fixed and variable compensation for the fiscal year preceding his loss of office, and its payment would be subject to the following performance criteria:
�y consolidated return on capital employed for the previous three years must have exceeded the Group’s cost of capital as published in the Registration Document for those years,
�y the Group must have reported positive operating free cash flow in at least two of the previous three years,
�y like-for-like EBITDAR margin must have exceeded 27.5% in at least two of the three previous years.
Registration Document 2014 147
CORPORATE GOVERNANCEStatutory Auditors’ special report on related party agreements and commitments3
These performance criteria would be applied as follows:
�y if all three criteria were met, the compensation would be payable in full,
�y if two of the three criteria were met, half of the compensation would be payable,
�y if none or only one of the three criteria were met, no compensation would be due.
b) Type of commitment and purpose: Inclusion of Mr. Sebastien Bazin in the supplementary pension plan set up for Accor senior executives.
Terms and conditions:
The Board of Directors authorized Mr. Sebastien Bazin’s inclusion in the supplementary pension plan whose members comprise several dozen Accor senior executives.
Under the terms of this overall plan, except in specific cases provided for by law, if a plan member leaves the Group before retirement, he or she only retains the rights accrued under the defined contribution plan (based on annual employer contributions of up to 5% of five times the annual cap on the basis for calculating social security contributions) and forfeits the rights accrued under the defined benefit plan.
The pension annuities payable to Mr. Sebastien Bazin on retirement would not exceed 30% of his end-of-career salary and the overall replacement rate to which he would be entitled (under government-sponsored plans and the Accor supplementary pension plan) is capped at 35% of the average of his best three years’ compensation (fixed plus variable) in the ten years prior to retirement.
In respect of 2014, the Company paid €9,387 under this plan.
c) Type of commitment and purpose: Private unemployment insurance plan.
Terms and conditions:
The Board of Directors authorized the Company to set up a private insurance plan with Association pour la Garantie Sociale des Chefs et Dirigeants d’Entreprise (GSC) to provide Mr. Bazin with unemployment benefits should the need arise. The benefits under this plan would be paid as from the 31st unbroken day of unemployment. The maximum length of time that Sebastien Bazin could be paid benefits under the plan is currently 12 months, but will be increased to 24 months once he has been a member of the plan for one year.
The premiums paid by the Company to GSC in 2014 on behalf of Mr. Bazin amounted to €11,828.
AGREEMENTS AND COMMITMENTS ALREADY APPROVED BY SHAREHOLDERS
A. Agreements and commitments approved in prior years or at the April 29, 2014 Shareholders’ Meeting that were implemented during 2014
Pursuant to Article R.225-30 of the Commercial Code, we have been advised of the following agreements and commitments that were approved by shareholders and were implemented during 2014.
1. With Sven Boinet, Deputy Chief Executive Officer
Type of commitment and purpose: Employment contract with Mr. Sven Boinet
Terms and conditions:
The Board of Directors authorized the Company to enter into an employment contract with Mr. Sven Boinet covering his position as Director of Human Resources and Legal Affairs. Pursuant to this contract, Mr. Sven Boinet receives a gross annual salary of €400,000, paid in twelve equal monthly installments.
Under his employment contract, Mr. Sven Boinet is eligible for membership in the defined contribution and defined benefit supplementary plans set up within the Company whose members comprise several dozen Accor Group senior executives.
Registration Document 2014148

3
CORPORATE GOVERNANCEStatutory Auditors’ special report on related party agreements and commitments
2. With Institut Paul Bocuse
Type of commitment and purpose: Agreement providing for a cash advance in the form of a loan
Executive officer concerned and other related party: Sven Boinet, Deputy Chief Executive Officer of Accor and Accor’s representative on the Board of Directors of Institut Paul Bocuse; and Gerard Pelisson, Founding Co-Chairman of Accor and Chairman of Institut Paul Bocuse
Terms and conditions:
The Board of Directors authorized Accor, in its capacity as a member of the non-profit organization, to grant to Institut Paul Bocuse, a €200,000 cash advance to the organization for a five-year period that bears interest at 2% per year.
Under this agreement – whose purpose is to help Institut Paul Bocuse invest in new equipment – Accor will play a part in expanding the operations, notably outside France, of one of its long-standing partners.
The Company paid the €200,000 grant and received the related interest in 2014.
3. With Paul Dubrule and Gérard Pélisson, Accor’s Founding Co-Chairmen
Type of commitment and purpose: Provision of resources
Terms and conditions:
On January 9, 2006, the Board of Directors authorized the Company to enter into an agreement with Paul Dubrule and Gerard Pelisson to provide them with an office at the Company’s Paris headquarters, an assistant and a chauffeur for their terms as Founding Co-Chairmen of the Group, and to reimburse any expenses incurred by them on Company business. This agreement remained in force in 2014.
Through these resources, the Founding Co-Chairmen are able to provide services that support the Group’s international expansion policy.
In 2014, the parties mutually agreed to terminate this agreement covering offices, assistants and a chauffeur; at the end of February 2014 for Mr. Paul Dubrule and at the end of June 2014 for Mr. Gérard Pélisson, respectively.
4. With ColSpa SAS
Type of commitment and purpose: Hotel management contract between ColSpa SAS and Accor.
Executive officer concerned and other related party:
Mr. Nadra Moussalem, Principal of Colony Capital Europe and Director of Accor and Mr. Jonathan Grunzweig, Principal of Colony Capital LLC and Director of Accor (since April 29, 2014).
Terms and conditions:
As part of Colony Capital SAS’s project to redevelop the site of the former Molitor swimming pool in Paris through its ColSpa SAS subsidiary, ColSpA undertook to grant a contract to Accor to manage, under the MGallery banner, the 124-room hotel and various related facilities to be built on the site.
This 10-year management contract will be automatically renewable for five years and its financial terms and conditions are comparable to those usually negotiated by the Group for similar contracts.
The transaction fits with the Group’s development strategy and will enable it to manage a hotel at a prestigious location in western Paris under its fast-growing MGallery brand.
Pursuant to this contract, the Company invoiced €292,398.58, excluding taxes, to ColSpa SAS in 2014.
Registration Document 2014 149

CORPORATE GOVERNANCEStatutory Auditors’ special report on related party agreements and commitments3
B. Agreements and commitments approved in prior years or at the April 29, 2014 Shareholders’ Meeting but not implemented in 2014
We were also informed of the following agreements and commitments that were approved by shareholders but were not implemented during 2014.
1. With Sven Boinet, Deputy Chief Executive Officer
Type of commitment and purpose: Compensation for loss of office payable to Sven Boinet as Deputy Chief Executive Officer
Terms and conditions:
The Board of Directors authorized the Company to enter into an agreement providing for the payment to Mr. Boinet of a termination benefit as compensation for loss of office in the event that his position as Deputy Chief Executive Officer is either terminated or not renewed (except in the event of gross or willful misconduct), compensation of €600,000 in addition to (i) variable compensation paid to him for the fiscal year preceding his loss of office, less (ii) any termination benefit due for the termination of his employment contract. The compensation would not be due if, at the date of his departure, Mr. Boinet would be able to claim his full-rate pension benefit within a short period of time.
Payment of the termination benefit would be subject to the following performance criteria:
�� consolidated return on capital employed for the previous three years must have exceeded the Group’s cost of capital as published in the Registration Documents for those years;
�� positive operating free cash flow in at least two of the previous three years;
�� like-for-like EBITDAR margin must have exceeded 27.5% in at least two of the previous three years.
These performance criteria would be applied as follows:
�� if all three criteria were met, the compensation would be payable in full;
�� if two of the three criteria were met, half of the compensation would be payable.
�� if none or only one of the three criteria were met, no compensation would be due.
2. With Edenred
Type of commitment and purpose: Signature of a tax-related agreement between Edenred and Accor
Executive officer concerned and other related party:
Messrs. Jean-Paul Bailly, Philippe Citerne, Bertrand Meheut and Nadra Moussalem, directors of both Accor and Edenred.
Terms and conditions:
The Italian tax authorities notified an Accor subsidiary and several Edenred subsidiaries of a €27.4 million reassessment of registration fees due on transactions carried out as part of the reorganization of Accor’s Services division in Italy prior to the demerger. Accor and Edenred are contesting the reassessments before the Italian courts and have signed an agreement to equally share the associated risks and costs of the proceedings between the two groups.
Given that the Asset Contribution-Demerger Agreement of April 19, 2010, before the dispute had arisen, does not contain any provisions covering this type of tax dispute, the agreement signed with Edenred has now protected the Group in the event of an unfavorable outcome of the aforementioned proceedings.
No payments were recorded by the Company in respect of this agreement in 2014.
Paris-La Défense and Neuilly-sur-Seine, March 13, 2015
The Statutory Auditors
ERNST & YOUNG et Autres
Jacques Pierres
DELOITTE & ASSOCIÉS
Pascale Chastaing-Doblin
Registration Document 2014150

44.1. FINANCIAL REVIEW 152
Analysis of consolidated financial results 152
Analysis of 2014 financial indicators by strategic business 156
4.2. REPORT ON THE PARENT COMPANY FINANCIAL STATEMENTS FOR THE YEAR ENDED DECEMBER 31, 2014 160Activities of Accor SA 160
4.3. MATERIAL CONTRACTS 163
4.4. SUBSEQUENT EVENTS 163
2014 Review OF THE YEAR
151Registration Document 2014

2014 REVIEW OF THE YEAR Financial review4
4.1. FINANCIAL REVIEW
ANALYSIS OF CONSOLIDATED FINANCIAL RESULTS
The in-depth transformation being carried out by Accor started to pay off in 2014. The Group posted record results, with excellent performances in both its businesses – HotelServices and HotelInvest. It strengthened its leadership by pursuing expansion in high-growth areas, consolidating its position as Europe’s leading hotel investor with the acquisition of 110 hotels, forging alliances with Huazhu in China and Orbis in Central Europe, and investing in Mama Shelter.
Accor also rose to the digital challenge during the year, with some very tangible results expected as early as 2015. Its €225 million five-year digital plan has given the Group the means to take fresh action to streamline and further customize its dealings with customers, employees and partners.
Earnings before interest and tax (EBIT) amounted to €602 million in 2014, representing year-on-year growth of 11.7% at constant scope of consolidation and exchange rates (like-for-like) and 15.6% as reported. Key features of the results were a €36 million reduction in rental expense following the restructuring of leased hotels, and a €29 million increase in revenue. At the same time, Accor refinanced its debt, generating a saving of €38 million compared with 2013, bringing net profit, Group share to €223 million, an increase of 77%.
Income statement
(in millions of euros) 2013 2014Change
(as reported)Change
(like-for-like) (1)
Revenue 5,425 5,454 +0.5% +3.8%
EBITDAR (2) 1,731 1,772 +2.4% +3.8%
EBITDAR margin 31.9% 32.5% +0.6 pt N/A
EBIT 521 602 +15.6% +11.7%
Operating profit before tax and non-recurring items 442 578 +30.7% +22.1%
Net profit before profit/(loss) from discontinued operations 125 227 +81.6% N/A
Profit/(loss) from discontinued operations 1 (4) N/A N/A
NET PROFIT, GROUP SHARE 126 223 +77.0% N/A
(1) Like-for-like: at constant scope of consolidation and exchange rates.(2) Earnings before interest, taxes, depreciation, amortization and rental expense.
Revenue
Revenue amounted to €5,454 million in 2014, up 3.8% year-on-year at constant scope of consolidation and exchange rates (up 0.5% as reported) thanks to a good level of demand in most of the Group’s key markets: Mediterranean, Middle-East and Africa (up 9.8%), Americas (up 7.2%), Europe (excluding France and Mediterranean) (up 4.7%) and Asia-Pacific (up 1.9%). France (up 0.4%) saw its performance improve slightly in the second half thanks to the Paris Motor Show and various trade fairs, but was significantly impacted by the increase in the VAT rate from 7% to 10%, only a small portion of which was passed through to the prices charged to customers.
Reported revenue reflects the following factors:
�� development, which added €44 million or 0.8% to reported growth, resulting mainly from the integration of 208 hotels totaling 29,556 new rooms over the year;
�� changes in the scope of consolidation due to asset disposals, which reduced revenue by €162 million or 3.0%;
�� a €62 million or 1.1% negative currency effect, reflecting lower exchange rates against the euro, notably for the Australian dollar and the Brazilian real.
Growth in the Group’s hotel portfolio returned to a fast pace during the year. A total of 29,556 new rooms or 208 hotels were opened, of which:
�� 91% (1) under management contracts and franchise agreements;
�� 71% outside Europe.
The development plan is well underway, with 156,000 rooms in the pipeline as of December 31, 2014, of which 91% under management contracts and franchise agreements.
(1) In number of rooms.
152 Registration Document 2014

4
2014 REVIEW OF THE YEAR Financial review
EBITDAR
Earnings before interest, taxes, depreciation, amortization and rental expense (EBITDAR) (1) is a key financial performance indicator. In 2014, it amounted to €1,772 million, up 3.8% like-for-like and 2.4% as reported year-on-year. The change breaks down as follows:
�� like-for-like growth: €66 million;
�� development (owned and leased hotels only): €9 million;
�� currency effect: -€13 million;
�� disposals: -€21 million.
EBITDAR margin was stable on a like-for-like basis at 32.5%.
EBIT
Earnings before interest and taxes (EBIT) reached an all-time high of €602 million, versus €521 million in 2013, an increase of 11.7% on a like-for-like basis. This result reflects a record margin of 11.0% (versus 9.6% at end-2013), the result of strong demand in most of its markets, the implementation of the cost-savings plan and the first effects of restructuring the HotelInvest portfolio.
(in millions of euros) 2013 2014Change
(as reported)Change
(like-for-like) (1)
EBITDAR 1,731 1,772 +2.4% +3.8%
Rental expense (885) (849) +4.1% -1.4%
Depreciation, amortization and provision expense (325) (321) +1.1% +2.2%
EBIT 521 602 +15.6% +11.7%
(1) At constant scope of consolidation and exchange rates.
Rental expense was €849 million in 2014, compared with €885 million in 2013, a trend in line with the transformation of HotelInvest.
Depreciation, amortization and provision expense was €321 million for the period.
Operating profit before tax and non-recurring items
Operating profit before tax and non-recurring items – corresponding to EBIT less net financial expense plus share of profit of associates – represents the result of operations after the cost of financing Group businesses and before tax. It amounted to €578 million in 2014, compared with €442 million in 2013, an increase of 22.1% on a like-for-like basis.
(in millions of euros) 2013 2014Change
(as reported)Change
(like-for-like) (1)
EBIT 521 602 +15.6% +11.7%
Net financial expense (90) (52) +42.3% +48.7%
Share of profit of associates after tax 11 28 +136.8% -59.9%
OPERATING PROFIT BEFORE TAX AND NON-RECURRING ITEMS 442 578 +30.7% +22.1%
(1) At constant scope of consolidation and exchange rates.
Net financial expense amounted to €52 million, compared with €90 million in 2013. The Group also reduced its borrowing costs by issuing €900 million worth of perpetual subordinated notes (treated as equity), as well as €750 million in 2.625% bonds, CHF 150 million in 1.75% bonds and €150 million in 1.728% bonds, and redeeming 7.5% bonds in an amount of €402 million. These operations significantly reduced the cost of debt from 4.28% at end-December 2013 to 3.11% at end-December 2014.
Accor also set up a new unused €1.8 billion confirmed long-term line of credit during the year.
Share of profit of associates amounted to €28 million, compared with €11 million in 2013. In 2014, the share of profit of associates was positively impacted by the payment of a special dividend of €17 million following the sale of the New York Sofitel.
(1) Earnings before interest, taxes, depreciation, amortization and rental expense.
153Registration Document 2014

2014 REVIEW OF THE YEAR Financial review4
Net profit, Group share
(in millions of euros) 2013 2014
Operating profit before tax and non-recurring items 442 578
Restructuring costs (132) (11)
Impairment losses (89) (55)
Gains and losses on management of hotel properties 68 (11)
Gains and losses on management of other assets (33) (82)
Operating profit before tax 256 419
Taxes (120) (175)
Profit or loss from discontinued operations 1 (4)
Net profit/(loss) 137 240
NET PROFIT, GROUP SHARE 126 223
EARNINGS PER SHARE (in euros) 0.55 0.97
Net profit attributable to non-controlling interests 11 17
Net profit excluding the impact of discontinued operations amounted to €227 million and net profit to €223 million, compared with €126 million in 2013.
Restructuring costs amounted to €11 million in 2014, and resulted mainly from various reorganization measures.
Asset impairment losses amounted to €55 million, of which €52 million relating to property, plant and equipment. This compared with €89 million in 2013.
Gains and losses on the management of hotel properties represented a net loss of €11 million.
Gains and losses on management of other assets represented a net loss of €82 million, which included an exceptional expense of €41 million for residual litigation, and €11 million in various fees.
Tax expense amounted to €175 million, compared with €120 million in 2013. The Group’s effective tax rate (tax expense at the standard rate as a proportion of operating profit before tax) was 28.5% in 2014, compared with 29.9% in 2013.
After deducting minority interests in the amount of €17 million and the €4 million net loss from discontinued operations, net profit, Group share amounted to €223 million, compared with €126 million in 2013.
Net profit, Group share was up a sharp €97 million. Based on the weighted average number of shares outstanding during the period (230,231,848), earnings per share amounted to €0.97 in 2014, compared with €0.55 in 2013.
Dividend and payout ratio
2013 2014 Change
Operating profit before non-recurring items, net of tax (1) (in millions of euros) 362 435 +20.2%
Weighted average shares outstanding (in millions) 228 230 +0.9%
Operating profit before non-recurring items, net of tax per share (in euros) 1.6 1.9 +18.8%
Ordinary dividend per share (in euros) 0.80 0.95 (2) +18.8%
Ordinary dividend payout (in millions of euros) 183 218 +19.1%
Payout ratio (3) 50% 50% -
(1) Operating profit before tax and non-recurring items less tax on recurring items and non-controlling interests.(2) Submitted for approval at the Combined Annual and Extraordinary Shareholders’ Meeting of April 28, 2015.(3) Based on operating profit before non-recurring items, net of tax.
At the Annual Meeting on April 28, 2015, shareholders will be asked to approve the payment of a dividend of €0.95 per share, compared with €0.80 the year before.
154 Registration Document 2014
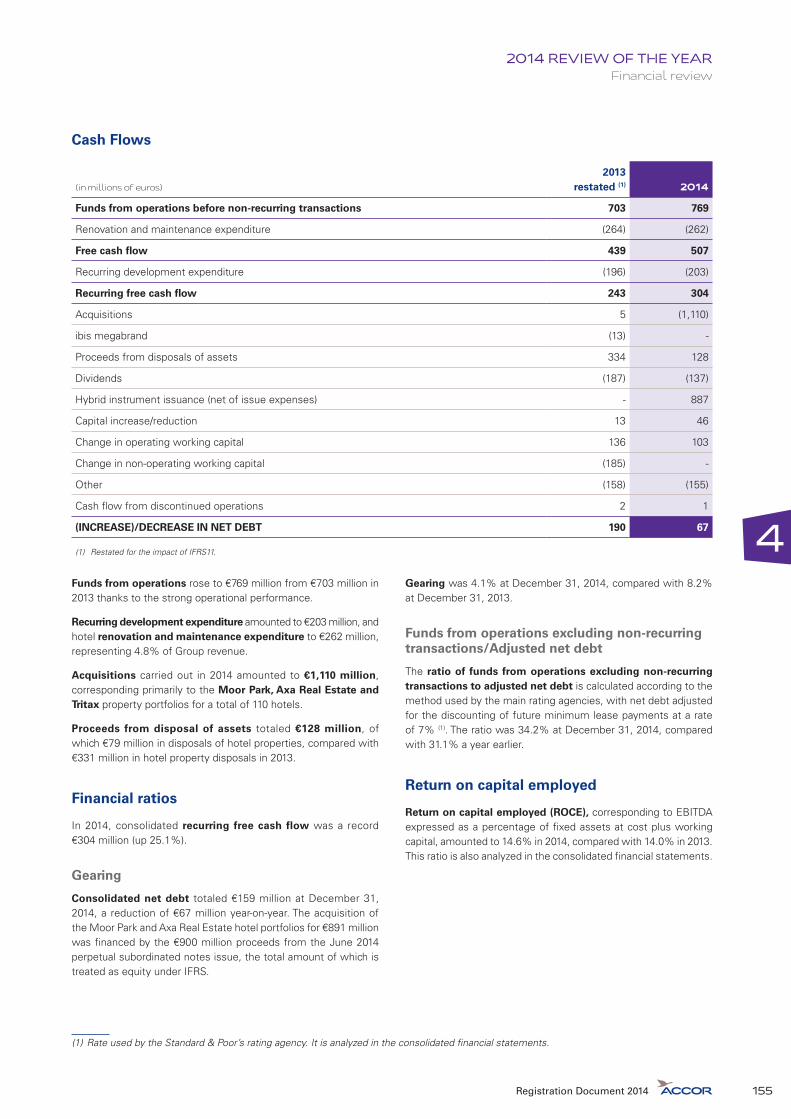
4
2014 REVIEW OF THE YEAR Financial review
Cash Flows
(in millions of euros)
2013restated (1) 2014
Funds from operations before non-recurring transactions 703 769
Renovation and maintenance expenditure (264) (262)
Free cash flow 439 507
Recurring development expenditure (196) (203)
Recurring free cash flow 243 304
Acquisitions 5 (1,110)
ibis megabrand (13) -
Proceeds from disposals of assets 334 128
Dividends (187) (137)
Hybrid instrument issuance (net of issue expenses) - 887
Capital increase/reduction 13 46
Change in operating working capital 136 103
Change in non-operating working capital (185) -
Other (158) (155)
Cash flow from discontinued operations 2 1
(INCREASE)/DECREASE IN NET DEBT 190 67
(1) Restated for the impact of IFRS11.
Funds from operations rose to €769 million from €703 million in 2013 thanks to the strong operational performance.
Recurring development expenditure amounted to €203 million, and hotel renovation and maintenance expenditure to €262 million, representing 4.8% of Group revenue.
Acquisitions carried out in 2014 amounted to €1,110 million, corresponding primarily to the Moor Park, Axa Real Estate and Tritax property portfolios for a total of 110 hotels.
Proceeds from disposal of assets totaled €128 million, of which €79 million in disposals of hotel properties, compared with €331 million in hotel property disposals in 2013.
Financial ratios
In 2014, consolidated recurring free cash flow was a record €304 million (up 25.1%).
Gearing
Consolidated net debt totaled €159 million at December 31, 2014, a reduction of €67 million year-on-year. The acquisition of the Moor Park and Axa Real Estate hotel portfolios for €891 million was financed by the €900 million proceeds from the June 2014 perpetual subordinated notes issue, the total amount of which is treated as equity under IFRS.
Gearing was 4.1% at December 31, 2014, compared with 8.2% at December 31, 2013.
Funds from operations excluding non-recurring transactions/Adjusted net debt
The ratio of funds from operations excluding non-recurring transactions to adjusted net debt is calculated according to the method used by the main rating agencies, with net debt adjusted for the discounting of future minimum lease payments at a rate of 7% (1). The ratio was 34.2% at December 31, 2014, compared with 31.1% a year earlier.
Return on capital employed
Return on capital employed (ROCE), corresponding to EBITDA expressed as a percentage of fixed assets at cost plus working capital, amounted to 14.6% in 2014, compared with 14.0% in 2013. This ratio is also analyzed in the consolidated financial statements.
(1) Rate used by the Standard & Poor’s rating agency. It is analyzed in the consolidated financial statements.
155Registration Document 2014

2014 REVIEW OF THE YEAR Financial review4
Value creation
Value created is calculated as follows:
- x( )ROCE aftertax
Capitalemployed
Weightedaverage
costof capital
Based on an ROCE after tax of 11.82%, a weighted average cost of capital of 8.57% in 2014 and capital employed of €6.63 billion, the Economic Value Added (EVA) created by Accor totaled €215 million in 2014, compared with €160 million in 2013.
ANALYSIS OF 2014 FINANCIAL INDICATORS BY STRATEGIC BUSINESS
Accor now reports its main financial indicators for its two strategic businesses, HotelServices and HotelInvest, to provide more clarity and improve strategic management.
As of December 31, 2014, hotel operator and brand franchiser HotelServices had 3,717 hotels and 482,296 rooms operated under franchise agreements and management contracts (including HotelInvest hotels), as well as a development pipeline of close to 156,000 rooms. This business, which enjoys leadership positions on four continents, represents an annual business volume of €11.9 billion.
As of December 31, 2014, hotel owner and investor HotelInvest had 1,354 owned and leased hotels, representing some 186,468 rooms. Ninety-five percent of these hotels are in the economy and midscale segments, and 77% are in France and in Europe (excluding France and Mediterranean) region.
All HotelInvest’s hotels are operated by HotelServices under management contracts. In 2014, these hotels generated 44% of the fees received by HotelServices.
Income statement by strategic business
(in millions of euros) Hotel Services Hotel InvestCorporate & Intercos Accor
Revenue 1,248 4,794 (588) 5,454
EBITDAR 435 1,401 (64) 1,772
EBITDAR margin 34.8% 29.2% N/A 32.5%
EBITDA 411 573 (61) 923
EBITDA margin 32.9% 11.9% N/A 16.9%
EBIT 376 292 (66) 602
EBIT margin 30.1% 6.1% N/A 11.0%
2013 EBIT (restated (1)) 380 197 (56) 521
2013 EBIT margin (restated (1)) 30.3% 4.1% N/A 9.6%
(1) Restated for the impact of IFRS 11.
Both businesses delivered good performances. The HotelServices EBIT margin was stable above 30%, while HotelInvest’s rose sharply by 2.0 percentage points.
156 Registration Document 2014

4
2014 REVIEW OF THE YEAR Financial review
EBIT by region and business
(in millions of euros) HotelServices HotelInvest Accor
2013 restated (1) 2014
2013 restated (1) 2014
2013 restated (1) 2014
Change (like-for-
like)
France 117 122 75 64 192 186 -2.9%
Europe (excluding France and Mediterranean) 117 110 92 169 209 279 +23.2%
Mediterranean, Middle East, Affrica 22 36 (27) -6 -5 30 N/A
Asia-Pacific 52 59 4 6 56 65 +12.1%
Americas 36 32 15 19 51 51 -3.6%
Worldwide structures 36 17 38 40 18 (2) (9) (3) N/A
TOTAL 380 376 197 292 521 602 +11.7%
(1) Restated for the impact of IFRS 11.(2) Includes €56 million in intercompany and corporate expenses.(3) Includes €66 million in intercompany and corporate expenses.
Accor recorded very satisfactory growth in most markets, with the exception of France (down 2.9%) and the Americas (down 3.6%). The other regions recorded double-digit growth in EBIT, driven by strong operational momentum.
HotelServices
HotelServices reported €11.9 billion in business volume (1), an increase of 3.9% at constant exchange rates, driven by the rapid development of hotel facilities, particularly in emerging markets.
HotelServices detailed 2014 results
(in millions of euros) 2013 restated (1) 2014
Revenue 1,254 1,248
EBITDA 412 411
EBITDA margin 32.8% 32.9%
Margin excluding Sales & Marketing Fund and loyalty program 47.4% 49.0%
EBIT 380 376
EBIT margin 30.3% 30.1%
(1) Restated for the impact of IFRS 11.
Revenue increased by 5.5% like-for-like to €1,248 million, with strong growth in the Americas (up 11.3%); the Mediterranean, Middle East, Africa region (up 8.2%), thanks primarily to a sharp increase in the Middle East; Europe (excluding France and Mediterranean) (up 6.1%); and to a lesser extent in the Asia-Pacific region (up 3.5%). Revenue also increased in France (up 1.0%) despite the impact of the higher VAT rate, which demonstrates HotelServices’ ability to weather change.
These favorable trends are also apparent in EBITDA, which increased by 5.3% like-for-like to €411 million, reflecting a high margin of 32.9%. Excluding the Sales & Marketing Fund and the loyalty programs, the EBITDA margin was 49%.
HotelServices EBIT amounted to €376 million, reflecting a stable margin of 30.1% (down 0.2 percentage points), despite the initial expenses related to the implementation of the digital plan.
(1) Business volume corresponds to revenue from owned, leased and managed hotels and room revenue from franchised hotels. Change is a reported, excluding the currency effect.
157Registration Document 2014

2014 REVIEW OF THE YEAR Financial review4
HotelServices cash flow
(in millions of euros) 2013 restated (1) 2014
EBITDA 412 411
Maintenance expenditure (36) (44)
Recurring development expenditure (38) (37)
EBITDA less Capex 338 331
% of EBITDA 82% 80%
(1) Restated for the impact of IFRS 11.
HotelServices’ P&L Performance in 2014 is as follows:
(in millions of euros)
Owned, leased, managed and franchised hotels
Sales & Marketing Fund
Other businesses HotelServices
Revenue 676 389 183 1248
EBITDAR 374 9 52 435
EBITDAR margin 55.3% 2.3% 28.2% 34.8%
EBITDA 367 1 43 411
EBITDA margin 54.3% 0.3% 23.5% 32.9%
EBIT 353 -9 32 376
EBIT margin 52.2% -2.4% 17.7% 30.1%
2013 EBITDA margin (restated) 53.5% 1.8% 22.5% 32.8%
It reflects a strong improvement in margins, stemming largely from robust business volumes.
HotelServices had an excellent year in terms of operating performance, with growth in the hotel portfolio returning to a brisk pace (208 hotels and 29,556 rooms) and an increase in the pipeline to a record 156,000 rooms.
The Le Club Accorhotels loyalty program also continued to grow, with 4 million members joining in 2014, bringing the total to 18 million.
HotelServices also benefited from the innovations flowing from the €225 million digital plan, of which €5 million were invested in 2014, primarily to improve the guest experience through the deployment of the Welcome project in more than 1,000 hotels and to acquire French start-up Wipolo.
HotelInvest
HotelInvest’s revenue rose by 3.0% like-for-like to €4,794 million, with strong growth across all regions except Asia-Pacific (down 0.5%), due to China, and France (down 0.2%), where the increase in VAT and a sluggish economy dampened the Group’s business volumes.
Revenue growth was reflected in EBITDAR, which increased by 3.6% like-for-like to €1,401 million.
HotelInvest detailed 2014 results
(in millions of euros) 2013 restated (1) 2014
Revenue 4,798 4,794
EBITDAR 1,354 1,401
EBITDAR margin 28.2% 29.2%
EBITDA 486 573
EBITDA margin 10.1% 11.9%
EBIT 197 292
EBIT margin 4.1% 6.1%
(1) Restated for the impact of IFRS 11.
158 Registration Document 2014

4
2014 REVIEW OF THE YEAR Financial review
HotelInvest’s EBIT climbed 26.9% like-for-like to €292 million, with a 6.1% margin, a year-on-year improvement of 2.0 percentage points.
The increase is chiefly attributable to the restructuring operations carried out since HotelInvest’s creation. In 2014, Accor acquired three hotel portfolios that were previously operated by the Group under variable leases. These portfolios (Moor Park, Axa Real Estate and Tritax) were acquired for a total of €980 million. Together, they represent 110 hotels or 14,072 rooms. Also during the year, 48 hotels were restructured, of which 30 hotels under leases and 18 hotels under direct ownership.
These transactions had the effect of reducing adjusted net debt by €137 million.
The performance was also driven by sustained hotel activity in Europe (excluding France and Mediterranean) region (revenue up 4.2% like-for-like), with strong demand in particular in the UK and the Benelux countries. Emerging markets also enjoyed very favorable trends, particularly in the Americas (up 7.2%) thanks to a strong first half-year, and the Mediterranean, Middle East, Africa region, which, after a loss of €27 million in 2013, moved closer to breakeven in 2014 thanks to the strong recovery in southern European countries.
HotelInvest cash flow
(in millions of euros) 2013 restated (1) 2014
EBITDA 486 573
Maintenance expenditure (224) (209)
NOI* (EBITDA less maintenance capital expenditure) 262 364
% EBITDA 53.9% 63.5%
Recurring development expenditure (182) (202)
EBITDA less Capex 80 162
% EBITDA 16.5% 28.4%
* Net operating income.(1) Restated for the impact of IFRS 11.
HotelInvest’s cashflow improved in step with the increase in EBITDA.
Net operating income (NOI), which corresponds to EBITDA less maintenance expenditure, was €364 million in 2014, with owned hotels contributing 56% of the total. One of HotelInvest’s objectives is to increase this contribution to 75% by 2016. Adjusted for development expenditure, the cash flow generated by HotelInvest in 2014 was €162 million, representing 28% of EBIT, a sharp increase compared with 2013.
HotelInvest’s gross asset value, which was remeasured in the second half, was €6.3 billion. As a proportion of gross asset value, its EBITDA at end-December, factoring in the full-year impact of portfolios acquired in 2014, showed a return on investment (ROI) of 9.7% on the HotelInvest assets.
Accor had HotelInvest’s hotel assets valued by three independent experts, which each analyzed a third of the portfolio. The valuation technique chosen was EBITDA multiples, defined in accordance with each hotel’s specific situation (market, segment, etc.) However for lease contracts, the valuation also took into account such factors as the time remaining on the lease, the options for terminating the contract and the potential lease termination costs. At December 31, 2014, HotelInvest’s gross asset value, as estimated by the experts, was €6.3 billion, of which €3.7 billion for the 378 owned hotels and €2.6 billion for the 976 lease contracts. The Group will have the HotelInvest portfolio valued every year.
HotelInvest’s P&L Performance in 2014 is as follows:
(in millions of euros) Owned Fixed lease Var. lease Others Total
Number of hotels 378 329 647 1,354
Revenue 1,042 1,303 2,374 75 4,794
EBITDAR 270 427 711 (7) 1,401
EBITDAR margin 25.9% 32.8% 29.9% -8.1% 29.2%
Rental expense (18) (320) (490) (828)
Depreciation, amortization and provisions (123) (57) (93) (8) (281)
EBIT 129 50 128 (15) 292
EBIT margin 12.4% 3.9% 5.4% -20.7% 6.1%
2013 EBIT (restated) 71 18 127 197
2013 EBIT margin (restated) 8.4% 1.3% 5.0% 4.1%
159Registration Document 2014

2014 REVIEW OF THE YEAR Report on the parent company financial statements for the year ended December 31, 20144
4.2. REPORT ON THE PARENT COMPANY FINANCIAL STATEMENTS FOR THE YEAR ENDED DECEMBER 31, 2014
ACTIVITIES OF ACCOR SA
Accor SA owns the Pullman, MGallery, Novotel, Suite Novotel, Mercure, ibis, ibis Styles, ibis budget and HotelF1 brands, and receives royalties from their licensing. It also owns hotel businesses in France and holds most of the hotel management contracts and franchise agreements in the country.
Accor SA provides other Group companies with hotel management, purchasing, cash management, IT and advertising services, as well as various advisory services, and assigns staff to them as required. Billings for these services correspond either to a percentage of the hotel’s revenue and/or profit, either as a flat fee or a fee per service. They are determined on an arm’s length basis.
As the Group’s holding company, Accor SA manages a substantial portfolio of equity interests, receives dividends from subsidiaries and leads the Group’s expansion.
At December 31, 2014, 61 hotels were managed by French subsidiaries under business leases: three Sofitel, 40 Novotel, 11 Suite Novotel, four Mercure, two ibis, one ibis Styles, and one ibis budget.
Review of 2014 results
Revenue from all of the Company’s operations amounted to €825.3 million in 2014, versus €807.3 million the year before. The 2.2%, or €18 million, increase reflected the €13.2 million rise in services provided by Accor SA (corporate services, purchases, technical support, etc.) as well as the €8.3 million increase in fees billed to non-related parties, which offset the €7.0 million decline in rental income and debt guarantee fees due to the ongoing deployment of the Group’s asset-right strategy.
Revenue includes hotel royalties, rental and business-lease revenue and service fees.
Accor SA revenue by source
(in millions of euros) 2013 2014 % of total
Royalties from subsidiaries 359 363 44%
Services fees (1) 250 263 32%
Rental and business-lease revenue 74 68 8%
Royalties from non-Group companies 115 123 15%
Guarantee fees 9 8 1%
TOTAL 807 825 100%
(1) Services provided by Accor SA include corporate services, purchasing, technical support, accounting fees and back-office systems.
At December 31, 2014, provision reversals, expense transfers and other income amounted to €85.7 million compared to €55.2 million in December 2013.
The €30.4 million increase primarily reflects the reversal of €30.7 million in provisions for restructuring, as well as €16.9 million in expense transfers relating to bond issues, which were offset in 2014 by a reduction in pension provision reversals in the amount of €14.6 million.
Operating expenses stood at €852.0 million at December 31, 2014 compared to €852.6 million at end-December 2013.
The €0.6 million dip was primarily due to a €28.0 million reduction in additions to provisions, a €10.6 million reduction in payroll costs and a €6.8 million reduction in operating expenses. These declines were offset by increases of €16.9 million in distribution fees, €16.9 million in bank fees relating to bond issues and €12.8 million in project royalties.
Operating profit stood at €58.9 million in 2014 compared to €9.9 million in 2013, an improvement of €49.0 million.
Net financial income came out at €169.1 million compared to €46.4 million in 2013, up €122.7 million, mainly as a result of an increase in dividends from subsidiaries.
Total provision movements included in net financial expense, corresponding mainly to write-downs of investments in subsidiaries, represented a net expense of €44.8 million in 2014 against net income of €14.8 million in 2013. In 2014, the most material additions to these provisions concerned the shares of Accor Partecipazioni Italia (€29.8 million) and Belle Rivière Hotel (€16.1 million).
160 Registration Document 2014

4
2014 REVIEW OF THE YEAR Report on the parent company financial statements for the year ended December 31, 2014
Income from investments in subsidiaries and affiliates totaled €323.9 million, versus €153.5 million in 2013. The main dividend payments received during the year were from Accor UK (€56.6 million vs. €32.1 million in 2013), PIH (€47.3 million vs. €5 million in 2013), SHNM (€35.2 million), SAS SEPHI (€23.0 million), Hotexco (€20.0 million vs. €1.9 million in 2013) and AAPC Limited (€16.0 million).
Recurring profit before tax stood at €228.1 million, compared to €56.3 million in 2013.
Net non-recurring expense stood at €2.3 million, compared to net non-recurring income of €24.9 million in 2013.
It primarily comprised a €14.1 million earn-out payment in relation to the disposal of the Pullman hotel at La Défense, capital losses of €3.7 million on the sale of shares in La Sablaise and €0.7 million on the sale of shares in Hosparginvest, a €10 million indemnity paid to settle a dispute, and a €0.7 million lease termination payment in relation to the Novotel Lille Aéroport.
In 2014, the Company recorded an income tax benefit of €21.7 million and an €8.1 million income tax expense (including the 3% surtax on dividends distributed of €3.7 million), compared with a benefit of €25.4 million and an expense of €5.2 million in 2013.
At December 31, 2014, the French tax group headed by Accor SA comprised 66 companies compared with 73 a year earlier.
Accor SA ended the year with a net profit of €239.3 million versus a net profit of €101.3 million in 2013.
Non-deductible provisions and accrued expenses carried in the balance sheet at December 31, 2014 amounted to €140.4 million versus €137.8 million in 2013.
In 2014, Accor paid an ordinary dividend of €0.80 per share for a total payout of €183.1 million split as follows: €123.0 million in cash and €60.1 million in shares. In 2013, Accor paid an ordinary dividend of €0.76 per share for a total payout of €172.9 million.
Details of the other directorships and positions held by the Company’s directors and officers, as well as their compensation, are provided in the Corporate Governance section, on page 89.
Supplier payment periods
Payment schedule for Accor SA’s trade payables
(in millions of euros)
Accrued payables < 30 days 30-60 days > 60 days
Trade payables - 36.3 12.5 -
Accruals for goods and services received but not invoiced 157.8 - - -
TOTAL 157.8 36.3 12.5 -
2014 business review
Accor took up the new shares issued by its Accor Partecipazioni Italia subsidiary for €364.0 million, by its Accor Hotel Belgium subsidiary for €324.6 million and by its Accor Hoteles España subsidiary for €67.1 million.
On the acquisitions front, Accor acquired a 36.6% stake in Mama Shelter in November 2014 for €28.8 million, took up shares in the Raise Investissement equity fund in October 2014 for €10.8 million and acquired a stake in Actimos (Wipolo) for €1.9 million.
Following capital reductions, Accor received €45.0 million from its Accor Hospitality Germany subsidiary.
Lastly, Accor received €8.1 million from the adjustment to the acquisition price for Posadas and a second earn-out payment of €2.1 million from the disposal of AHS AB in 2010.
Hotel transactions
The sale of the business assets and property improvements of the Novotel Montchanin and Novotel Lille Aéroport gave rise to a €0.2 million capital gain.
161Registration Document 2014

2014 REVIEW OF THE YEAR Report on the parent company financial statements for the year ended December 31, 20144
Transactions in Accor SA shares
In June 2014, Accor paid an ordinary dividend for 2013 of €0.80 per share for a total payout of €183.1 million split as follows: €123.0 million in cash and €60.1 million in shares.
In addition, equity was increased following the issuance of 3,783,297 shares. Together, these transactions had the net effect of increasing the share capital by €11.4 million and the additional paid-in capital and share premium by €30.2 million.
On May 27, 2013, Accor appointed Rothschild & Cie Banque to act as market maker in its shares on the Euronext Paris stock exchange, under a liquidity contract complying with the Code of Conduct issued by the French Financial Markets Association (AMAFI) and recognized by the French securities regulator (AMF). To fund the contract, an amount of €30 million has been allocated to the liquidity account. The related bank fees amount to a total of €260,000 per year.
Over the period, on behalf of Accor SA, Rothschild & Cie Banque purchased 11,160,327 shares at an average price of €36.34 and sold 11,160,327 shares at an average price of €36.36.
As of December 31, 2014, Accor SA did not hold any shares in treasury.
All these transactions are described in further detail on page 307 of the Registration Document.
The Company’s ownership structure is described in the «Capital and Ownership Structure» section on page 309.
Financing and investing transactions
In 2014, Accor issued four new bonds.
�� the first issue in February was for a €750 million, seven-year bond at 2.625%, to which a second €150 million tranche was added in September;
�� the second issue, on the Swiss market, was for a CHF150 million (€124.8 million), eight-year bond at 1.750%;
�� the third issue was a €900 million hybrid bond at 4.125% with a first call date at the end of the sixth year.
€6 million additional paid-in capital was deducted from this total. The remaining €894 million was booked to «Other Shareholders’ Equity» on the balance sheet in accordance with current accounting regulations;
�� a private €60 million, seven-year bond issue maturing in February 2022 at 1.679%.
During the same period, Accor redeemed €402 million (at 7.500%) in relation to its February 2009 bond.
Accor also issued a €600 million, six-year bond in 2013 at 2.50%, a €700 million, five-year bond in 2012 at 2.875% and the last tranche of a €250 million, eight-year bond issued in 2009 at 6.039%.
The Company also has a €1.8 billion, five-year syndicated credit facility set up in June 2014 and maturing in June 2019 to replace the previous €1.5 billion facility.
At December 31, 2014, the Company had €690.8 million in term deposits and €710.2 million in cash and cash equivalents. Accor also has €830 million invested in mutual funds.
Information about subsidiaries
Accor SA owns 50% or more of the capital of 127 companies. The main equity interests, based on net value, are as follows:
�� Accor Hotels Belgium (€1,326.9 million net) is the Belgian company that operates the hotels in Belgium and also owns interests in Accor Asia (100%), AAPC, the holding company for the Hotels business in Australia (81.9%), Portugal-based hotel operator AHS (50.0%), Accor Hoteles Espana (83.1%), Groen Brugge Hotel (99.99%) and Accor Hotels Luxembourg (100%).
Accor Hotels Belgium reported a net profit of €82.6 million in 2x014, versus €8.9 million in 2013.
�� Accor Hospitality Germany (€452.9 million net) is the German company that operates 335 hotels in Germany.
In 2014, it reported a net profit of €40.8 million, versus €39.6 million in 2013.
�� CIWLT (€381.6 million net). Compagnie Internationale des Wagons-Lits et Tourisme (CIWLT) is a Belgian company that provides on-board train services in Europe through its subsidiary Treno (100%) and owns stakes in the hotel companies SFPTH (100%) in France and in Macor (30.5%) and Accor Hotels SAE (99.99%) in Egypt.
CIWLT reported a net profit of €5.3 million in 2014, versus €7.5 million in 2013.
�� 82.9%-owned Société des Hôtels Novotel et Mercure (€269.3 million net) operates Novotel and Mercure hotels in France.
In 2014, it reported a net profit of €7.5 million, versus €20.8 million in 2013.
�� 100%-owned Accor United Kingdom (€92.8 million net) oversees the Group’s UK and Irish activities.
In 2014, it reported a net profit of €24.0 million, versus €34.0 million in 2013.
�� IBL (€54.9 million net) owns 37.9% of Accor Lodging North America, the holding company for the hotels business in the United States. IBL’s profit varies depending primarily on the interest income received from Accor on current account advances and on the amount of any dividends received from Accor Lodging North America.
In 2014, it reported a net profit of €0.3 million, versus €2.7 million in 2013.
The other interests held by Accor SA are listed in the table of subsidiaries and affiliates presented after the parent company financial statements on page 296.
162 Registration Document 2014

4
2014 REVIEW OF THE YEAR Subsequent events
4.3. MATERIAL CONTRACTS
In 2014, material contracts (other than contracts entered into in the ordinary course of business) corresponded to agreements signed in relation to disposals, acquisitions, organic growth and
real estate transactions, as described in note 3, paragraphs A to B, and in note 41 to the consolidated financial statements, pages 190 and 208 below.
4.4. SUBSEQUENT EVENTS
The following significant events have occurred since the end of 2014.
Sale and Management-Back of the Zurich MGallery for €55 million
As part of its asset management strategy, Accor has announced the sale and management-back of the Zurich MGallery to a private investor, already an Accor franchisee, for a total of €55 million. This amount includes the sale price of €32 million and a commitment from the buyer to carry out €23 million in renovations.
Ideally located close to the main railway station and the old town, and offering 138 rooms and suites, the hotel will continue to be operated by Accor under a long-term management contract. Accor purchased the hotel property in 2014 as part of a portfolio of properties previously owned by Axa.
Establishment of a sponsored Level 1 American Depository Receipt (ADR) program
Accor has also announced its decision to establish a sponsored Level 1 American Depository Receipt (ADR) program to enable US investors to hold Accor shares indirectly and to trade them in the US over-the-counter (OTC) market. BNY Mellon will issue ADR certificates representing Accor shares, with dividend and voting rights. As depositary bank, it will distribute dividends in US dollars and facilitate voting by ADR holders.
163Registration Document 2014

164 Registration Document 2014

55.1. STATUTORY AUDITOR’S REPORT ON
THE CONSOLIDATED FINANCIAL STATEMENTS 166
5.2. CONSOLIDATED FINANCIAL STATEMENTS AND NOTES 167
5.2.1. Consolidated Income Statements 167
5.2.2. Statements of profit or loss and other comprehensive income 168
5.2.3. Statements of financial position 168
5.2.4. Consolidated Cash Flow Statements 170
5.2.5. Changes in Consolidated Shareholders’ Equity 171
5.2.6. Notes to the Consolidated Financial Statements 174
5.3. STATUTORY AUDITORS’ REPORT ON THE FINANCIAL STATEMENTS 266
5.4. PARENT COMPANY FINANCIAL STATEMENTS AND NOTES 267
5.4.1. 2014 Balance Sheets 267
5.4.2. 2014 Income Statements 269
5.4.3. Notes to the financial statements 271
5.4.4. Five-Year Financial Summary 302
Financial STATEMEMENTS
Registration Document 2014 165

FINANCIAL STATEMEMENTSStatutory Auditor’s report on the consolidated financial statements5
5.1. STATUTORY AUDITOR’S REPORT ON THE CONSOLIDATED FINANCIAL STATEMENTS
Year ended December 31, 2014
This is a free translation into English of the statutory auditors’ report on the consolidated financial statements issued in the French language and is provided solely for the convenience of English speaking users. The statutory auditors’ report includes information specifically required by French law in such reports, whether modified or not. This information is presented below the opinion on the consolidated financial statements and includes explanatory paragraphs discussing the auditors’ assessments of certain significant accounting and auditing matters. These assessments were made for the purpose of issuing an audit opinion on the consolidated financial statements taken as a whole and not to provide separate assurance on individual account captions or on information taken outside of the consolidated financial statements. This report also includes information relating to the specific verification of information given in the management report. This report should be read in conjunction with, and is construed in accordance with, French law and professional auditing standards applicable in France.
To the Shareholders,
In compliance with the assignment entrusted to us by your Annual General Meeting, we hereby report to you, for the year ended December 31, 2014, on:�� the audit of the accompanying consolidated financial statements of Accor;�� the justification of our assessments;�� the specific procedure required by law.
These consolidated financial statements have been approved by the Board of Directors. Our role is to express an opinion on these consolidated financial statements based on our audit.
I. Opinion on the consolidated financial statements
We conducted our audit in accordance with professional standards applicable in France; those standards require that we plan and perform the audit to obtain reasonable assurance about whether the consolidated financial statements are free of material misstatement. An audit involves performing procedures, using sampling techniques or other methods of selection, to obtain audit evidence about the amounts and disclosures in the consolidated financial statements. An audit also includes evaluating the appropriateness of accounting policies used and the reasonableness of accounting estimates made, as well as the overall presentation of the consolidated financial statements. We believe that the audit evidence we have obtained is sufficient and appropriate to provide a basis for our audit opinion.
In our opinion, the consolidated financial statements give a true and fair view of the assets and liabilities and of the financial position of the Group as at December 31, 2014 and of the results of its operations for the year then ended in accordance with the IFRSs as adopted by the European Union.
Without qualifying our conclusion, we draw your attention to Note 2 to the year ended consolidated financial statements describing the new standards and amendments to existing standards used by Accor from January 1, 2014 and particularly the impacts resulting from the application of IFRS 11-Joint arrangements.
II. Justification of our assessments
In accordance with the requirements of Article L. 823-9 of the French Commercial Code (Code de commerce) relating to the justification of our assessments, we bring to your attention the following matters:�� notes 2.E.4., 2.E.6. and 2.E.7. to the consolidated financial statements describe the accounting policies and methods used to account for leases and sale-and-leaseback transactions as well as the policies and methods used to assess the recoverable amount of property, plant and equipment, intangible assets, and goodwill. We have verified the appropriateness of these accounting policies and methods and of the related disclosures provided in notes 7. 14. et 33. to the consolidated financial statements. We have also examined the consistency of the data and assumptions used and the supporting documentation, and on these bases assessed the reasonableness of the estimates made;�� note 40 to the consolidated financial statements describes the legal proceedings currently underway regarding tax audits in various countries, as well as Management’s positions concerning these disputes. Our work consisted of assessing the reasonableness of the elements on which these positions are based and verifying that the note to the consolidated financial statements provides appropriate disclosures.
These assessments were made as part of our audit of the consolidated financial statements taken as a whole, and therefore contributed to the opinion we formed which is expressed in the first part of this report.
III. Specific procedure
As required by law, we have also verified in accordance with professional standards applicable in France the information presented in the Group’s management report.
We have no matters to report as to its fair presentation and its consistency with the consolidated financial statements.
Paris-La Défense and Neuilly-sur-Seine, March 13, 2015
The Statutory AuditorsFrench original signed by
ERNST & YOUNG et Autres
Jacques Pierres
DELOITTE & ASSOCIÉS
Pascale Chastaing-Doblin
Registration Document 2014166
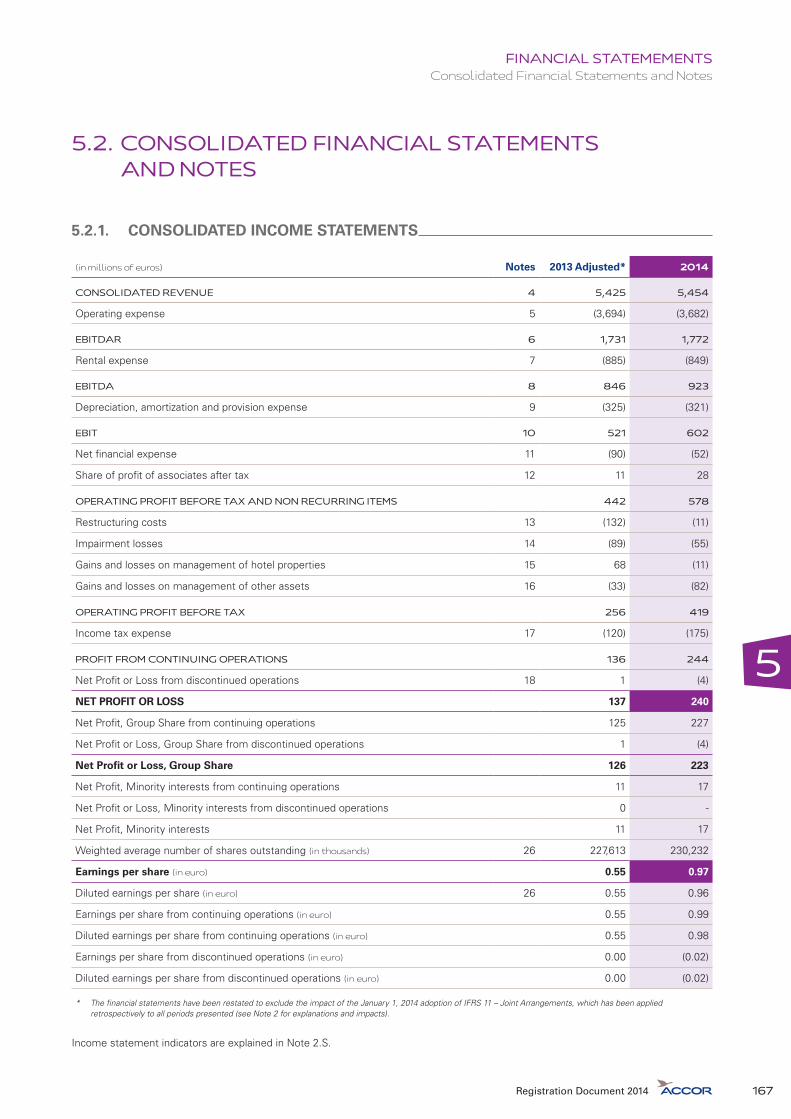
5
Consolidated Financial Statements and NotesFINANCIAL STATEMEMENTS
5.2. CONSOLIDATED FINANCIAL STATEMENTS AND NOTES
5.2.1. CONSOLIDATED INCOME STATEMENTS
(in millions of euros) Notes 2013 Adjusted* 2014
CONSOLIDATED REVENUE 4 5,425 5,454
Operating expense 5 (3,694) (3,682)
EBITDAR 6 1,731 1,772
Rental expense 7 (885) (849)
EBITDA 8 846 923
Depreciation, amortization and provision expense 9 (325) (321)
EBIT 10 521 602
Net financial expense 11 (90) (52)
Share of profit of associates after tax 12 11 28
OPERATING PROFIT BEFORE TAX AND NON RECURRING ITEMS 442 578
Restructuring costs 13 (132) (11)
Impairment losses 14 (89) (55)
Gains and losses on management of hotel properties 15 68 (11)
Gains and losses on management of other assets 16 (33) (82)
OPERATING PROFIT BEFORE TAX 256 419
Income tax expense 17 (120) (175)
PROFIT FROM CONTINUING OPERATIONS 136 244
Net Profit or Loss from discontinued operations 18 1 (4)
NET PROFIT OR LOSS 137 240
Net Profit, Group Share from continuing operations 125 227
Net Profit or Loss, Group Share from discontinued operations 1 (4)
Net Profit or Loss, Group Share 126 223
Net Profit, Minority interests from continuing operations 11 17
Net Profit or Loss, Minority interests from discontinued operations 0 -
Net Profit, Minority interests 11 17
Weighted average number of shares outstanding (in thousands) 26 227,613 230,232
Earnings per share (in euro) 0.55 0.97
Diluted earnings per share (in euro) 26 0.55 0.96
Earnings per share from continuing operations (in euro) 0.55 0.99
Diluted earnings per share from continuing operations (in euro) 0.55 0.98
Earnings per share from discontinued operations (in euro) 0.00 (0.02)
Diluted earnings per share from discontinued operations (in euro) 0.00 (0.02)
* The financial statements have been restated to exclude the impact of the January 1, 2014 adoption of IFRS 11 – Joint Arrangements, which has been applied retrospectively to all periods presented (see Note 2 for explanations and impacts).
Income statement indicators are explained in Note 2.S.
Registration Document 2014 167

Consolidated Financial Statements and NotesFINANCIAL STATEMEMENTS5
5.2.2. STATEMENTS OF PROFIT OR LOSS AND OTHER COMPREHENSIVE INCOME
(in millions of euros) Notes 2013 Adjusted* 2014
NET PROFIT OR LOSS 137 240
Currency translation adjustment (208) 83
Effective portion of gains and losses on hedging instruments in a cash flow hedge 4 0
Change in fair value resulting from “Available-for-sale financial assets” (4) (2)
Other comprehensive income that will be reclassified subsequently to profit or loss (208) 81
Actuarial gains and losses on defined benefit plans, net of deferred taxes 1 (11)
Other comprehensive income that will never be reclassified subsequently to profit or loss 1 (11)
Other comprehensive income, net of tax 29 (207) 69
TOTAL PROFIT OR LOSS AND OTHER COMPREHENSIVE INCOME (70) 309
Profit or loss and other comprehensive income, Group share (75) 295
Profit or loss and other comprehensive income, Minority interests 5 14
* The financial statements have been restated to exclude the impact of the January 1, 2014 adoption of IFRS 11 – Joint Arrangements, which has been applied retrospectively to all periods presented (see Note 2 for explanations and impacts).
Note: the amounts in the table are in millions of euros. The sum of these amounts may be slightly different from the totals shown due to rounding differences.
5.2.3. STATEMENTS OF FINANCIAL POSITION
Assets
(in millions of euros) Notes Dec. 2012 Adjusted* Dec. 2013 Adjusted* 2014
GOODWILL 19 823 691 701
INTANGIBLE ASSETS 20 263 281 283
PROPERTY, PLANT AND EQUIPMENT 21 2,542 2,396 3,157
Long-term loans 22 147 98 133
Investments in associates 23 306 276 324
Other financial investments 24 222 174 129
TOTAL NON-CURRENT FINANCIAL ASSETS 675 548 586
Deferred tax assets 17 153 149 68
Total non-current assets 4,456 4,065 4,795
Inventories 25 46 41 28
Trade receivables 25 390 379 417
Other receivables and accruals 25 512 473 461
Receivables on disposals of assets 30 & 31 48 41 14
Short-term loans 30 & 31 32 30 16
Cash and cash equivalents 30 & 31 1,863 1,913 2,677
Total current assets 2,891 2,877 3,613
Assets held for sale 33 156 61 347
TOTAL ASSETS 7,503 7,003 8,755
* The financial statements have been restated to exclude the impact of the January 1, 2014 adoption of IFRS 11 – Joint Arrangements, which has been applied retrospectively to all periods presented (see Note 2 for explanations and impacts).
Registration Document 2014168
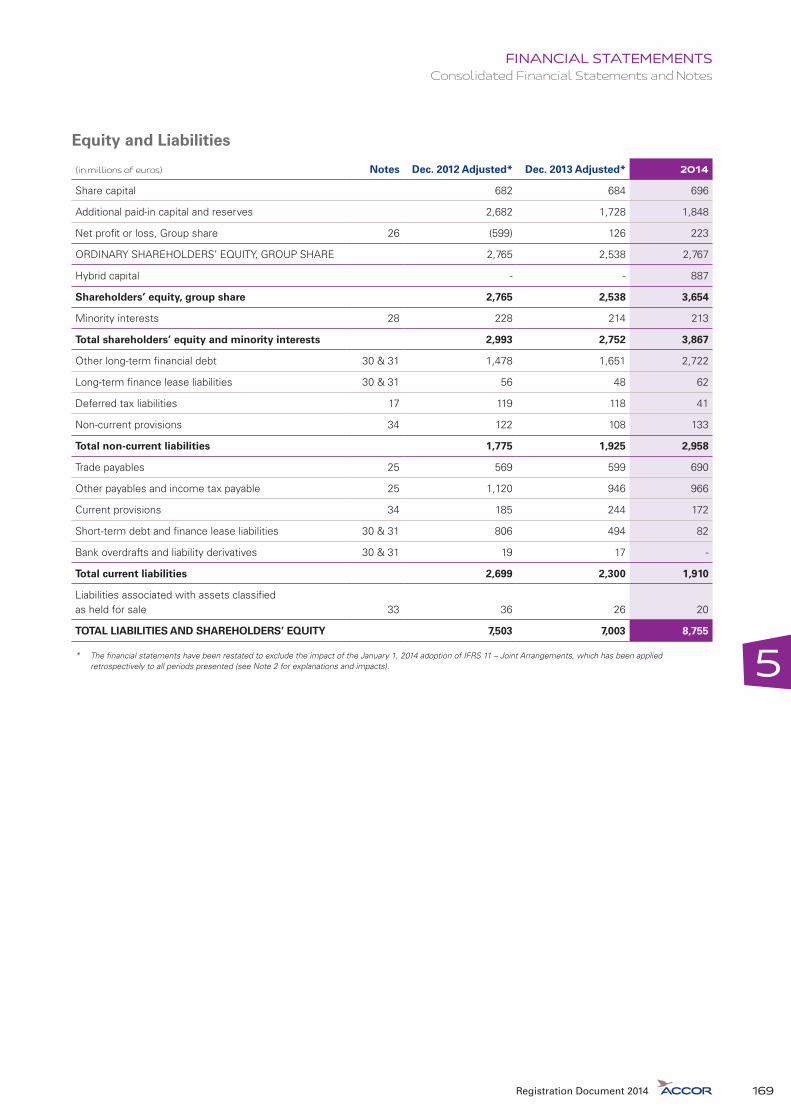
5
Consolidated Financial Statements and NotesFINANCIAL STATEMEMENTS
Equity and Liabilities
(in millions of euros) Notes Dec. 2012 Adjusted* Dec. 2013 Adjusted* 2014
Share capital 682 684 696
Additional paid-in capital and reserves 2,682 1,728 1,848
Net profit or loss, Group share 26 (599) 126 223
ORDINARY SHAREHOLDERS’ EQUITY, GROUP SHARE 2,765 2,538 2,767
Hybrid capital - - 887
Shareholders’ equity, group share 2,765 2,538 3,654
Minority interests 28 228 214 213
Total shareholders’ equity and minority interests 2,993 2,752 3,867
Other long-term financial debt 30 & 31 1,478 1,651 2,722
Long-term finance lease liabilities 30 & 31 56 48 62
Deferred tax liabilities 17 119 118 41
Non-current provisions 34 122 108 133
Total non-current liabilities 1,775 1,925 2,958
Trade payables 25 569 599 690
Other payables and income tax payable 25 1,120 946 966
Current provisions 34 185 244 172
Short-term debt and finance lease liabilities 30 & 31 806 494 82
Bank overdrafts and liability derivatives 30 & 31 19 17 -
Total current liabilities 2,699 2,300 1,910
Liabilities associated with assets classified as held for sale 33 36 26 20
TOTAL LIABILITIES AND SHAREHOLDERS’ EQUITY 7,503 7,003 8,755
* The financial statements have been restated to exclude the impact of the January 1, 2014 adoption of IFRS 11 – Joint Arrangements, which has been applied retrospectively to all periods presented (see Note 2 for explanations and impacts).
Registration Document 2014 169

FINANCIAL STATEMEMENTSConsolidated Financial Statements and Notes5
5.2.4. CONSOLIDATED CASH FLOW STATEMENTS
(in millions of euros) Notes 2013 Adjusted* 2014
+ EBITDA 8 846 923
+ Net financial expense 11 (90) (52)
+ Income tax expense (131) (151)
- Non cash revenue and expense included in EBITDA 20 11
- Elimination of provision movements included in net financial expense and non-recurring taxes 45 25
+ Dividends received from associates 13 13
+ Impact of discontinued operations 4 (2)
= FUNDS FROM OPERATIONS EXCLUDING NON-RECURRING TRANSACTIONS 35 707 767
+ Decrease (increase) in operating working capital 36 136 103
+ Impact of discontinued operations 36 5 6
= NET CASH FROM OPERATING ACTIVITIES 848 875
+ Cash received (paid) on non-recurring transactions (included restructuring costs and non-recurring taxes) (145) (186)
+ Decrease (increase) in non-operating working capital (1) (185) -
+ Impact of discontinued operations (2) -
= NET CASH FROM OPERATING ACTIVITIES INCLUDING NON-RECURRING TRANSACTIONS (A) 516 689
- Renovation and maintenance expenditure 37 (264) (262)
- Development expenditure 38 (190) (1,313)
+ Proceeds from disposals of assets 334 128
+ Impact of discontinued operations 1 -
= NET CASH USED IN INVESTMENTS/DIVESTMENTS (B) (120) (1,447)
+ Proceeds from issue of share capital 13 106
- Dividends paid (187) (197)
+ Issue of hybrid capital - 887
- Repayment of long-term debt (4) (17)
- Payment of finance lease liabilities (7) (1)
+ New long term debt 607 1,123
= INCREASE (DECREASE) IN LONG-TERM DEBT 596 1,106
+ Increase (decrease) in short-term debt (725) (398)
+ Impact of discontinued operations (2) 1
= NET CASH FROM FINANCING ACTIVITIES (C) (305) 1,505
+ Effect of changes in exchange rates (D) (37) 37
= NET CHANGE IN CASH AND CASH EQUIVALENTS (E) = (A) + (B) + (C) + (D) 54 784
- Cash and cash equivalents at beginning of period 1,844 1,896
- Effect of changes in fair value of cash and cash equivalents 5 -
- Net change in cash and cash equivalents for discontinued operations (7) (4)
+ Cash and cash equivalents at end of period 31 1,896 2,677
= NET CHANGE IN CASH AND CASH EQUIVALENTS 54 784
* The financial statements have been restated to exclude the impact of the January 1, 2014 adoption of IFRS 11 – Joint Arrangements, which has been applied retrospectively to all periods presented (see Note 2 for explanations and impacts).
(1) In 2013, this amount corresponds to the payment of ‘precompte’ dividend withholding tax for €184.7 million (see Note 40.2).
Registration Document 2014170

5
FINANCIAL STATEMEMENTSConsolidated Financial Statements and Notes
5.2.5. CHANGES IN CONSOLIDATED SHAREHOLDERS’ EQUITY
(in millions of euros)
Number of shares
outstandingShare capital
Addi-tional
paid-in capital
Currency translation reserve (1)
Fair value adjustments
on Financial
Instruments reserve
Reserve for
actuarial gains/losses
Reserve related
to employee benefits
Retained earnings
and profit
for the period
Shareholders’
equityMinority interests
Consolidated share
holders’ Equity
AT JANUARY 1, 2013 227,277,972 682 1,318 79 (4) (49) 148 591 2,765 230 2,995
Changes in accounting policies* - - - - - - - - - (2) (2)
RESTATED JANUARY 1, 2013* 227,277,972 682 1,318 79 (4) (49) 148 591 2,765 228 2,993
Issue of share capital
�� Performance share grants 202,988 1 - - - - - (1) - - -
�� On exercise of stock options 572,142 2 10 - - - - - 12 1 13
Dividends paid in cash (3) - - - - - - - (173) (173) (15) (187)
Change in reserve related to employee benefits - - - - - - 14 - 14 - 14
Effect of scope changes - - - - - (0) - (4) (5) (7) (11)
OTHER COMPREHENSIVE INCOME - - (199) (202) 0 1 - 199 (201) (6) (207)
Net Profit - - - - - - - 126 126 11 137
Total Profit and other comprehensive Income - - (199) (202) 0 1 - 325 (75) 5 (70)
RESTATED DECEMBER 31, 2013* 228,053,102 684 1,129 (123) (4) (48) 162 737 2,538 214 2,752
Issue of share capital
�� Performance share grants 203,015 1 - - - - - (1) - - -
�� On exercise of stock options 1,684,989 5 41 - - - - - 46 (0) 46
Issue of hybrid capital (2) - - - - - - - 887 887 - 887
Dividends paid (3) 1,895,293 6 54 - - - - (183) (123) (13) (137)
Change in reserve related to employee benefits - - - - - - 10 - 10 - 10
Effect of scope changes - - - - - 1 - 0 1 (0) 1
Other Comprehensive Income - - (76) 86 (2) (11) - 75 72 (3) 69
Net Profit - - - - - - - 223 223 17 240
Total Profit and other comprehensive Income - - (76) 86 (2) (11) - 298 295 14 309
AT DECEMBER 31, 2014 231,836,399 696 1,149 (37) (5) (59) 172 1,738 3,654 213 3,867
* The financial statements have been restated to exclude the impact of the January 1, 2014 adoption of IFRS 11 – Joint Arrangements, which has been applied retrospectively to all periods presented (see Note 2 for explanations and impacts).
Note: the amounts in the table are in millions of euros. The sum of these amounts may be slightly different from the totals shown due to rounding differences.(1) Exchange differences on translating foreign operations between December 31, 2013 and December 31, 2014, representing a positive impact of €86 million, mainly
concern changes in exchange rates against the euro of the US Dollar (€95 million positive impact), the Australian Dollar (€19 million positive impact), the Pound Sterling (€21 million positive impact), the Polish Zloty (€7 million negative impact) and the Chinese Yuan (€34 million negative impact).Exchange differences on translating foreign operations between December 31, 2012 and December 31, 2013, representing a negative impact of €202 million, mainly concern changes in exchange rates against the euro of the Australian Dollar (€85 million negative impact), the US Dollar (€41 million negative impact), the Brazilian Real (€40 million negative impact) and the Argentinian Peso (€11 million negative impact).
Registration Document 2014 171

FINANCIAL STATEMEMENTSConsolidated Financial Statements and Notes5
The period-end euro/local currency exchange rates applied to prepare the consolidated financial statements were as follows:
USD AUD PLN GBP CNY
December 2013 1.3791 1.5423 4.1543 0.8337 8.3491
December 2014 1.2141 1.4829 4.2732 0.7789 7.5358
(2) On June 30, 2014, Accor issued €887 million (net of transaction costs) worth of perpetual subordinated notes (see Note 3.G. for details).(3) The 2012 and 2013 dividends were as follows:
(in euros) 2012 2013 2014*
Dividend per share 0.76 0.80 0.95
Special dividend per share N/A N/A N/A
* Ordinary dividend per share recommended by the Board of Directors to the Annual Shareholders’ Meeting of April 28, 2015.
Part of the 2013 dividend was paid in cash and part in stock.
Number of Accor’s shares is detailed as follows:
Details on shares 2013 2014
Total number of shares authorized 228,053,102 231,836,399
Number of fully paid shares issued and outstanding 228,053,102 231,836,399
Number of shares issued and outstdanding not fully paid - -
Per value per share (in euros) 3 3
Treasury stock - -
Number of shares held for allocation on exercise of stock options and grants - -
Number of outstanding shares and number of potential shares that could be issued breaks down as follows:
Number of issued shares at January 1, 2014 228,053,102
Performance shares granted 203,015
Shares issued on exercise of stock options 1,684,989
Shares issued in payment of dividends 1,895,293
Number of issued shares at December 31, 2014 231,836,399
Accor’s share capital at December 31, 2014 231,836,399
Shares in treasury -
Outstanding shares at December 31, 2014 231,836,399
Stock option plans (see Note 26.3) 4,521,862
Performance shares plans (see Note 26.3) 817,503
Potential number of shares 237,175,764
Full conversion would have the effect of reducing debt at December 31, 2014 as follows:
(in millions of euros)
Theoretical impact of exercising stock options* 123
Theoretical impact on net debt of exercising all equity instruments 123
* Assuming exercise of all options outstanding.
Registration Document 2014172

5
FINANCIAL STATEMEMENTSConsolidated Financial Statements and Notes
Average number of ordinary shares before and after dilution is presented as follows:
Outstanding shares at December 31, 2014 231,836,399
Effect of share issues on the weighted average number of shares (48,207)
Adjustment for stock option plans exercised during the period (756,686)
Effect of stock dividends on weighted average number of shares (799,658)
Weighted average number of ordinary shares during the period (see Note 26) 230,231,848
Impact of dilutive stock options plans at December 31, 2014 1,208,686
Impact of dilutive performance shares at December 31, 2014 375,168
Weighted average number of shares used to calculate diluted earning per share 231,815,702
Registration Document 2014 173

FINANCIAL STATEMEMENTSConsolidated Financial Statements and Notes5
5.2.6. NOTES TO THE CONSOLIDATED FINANCIAL STATEMENTS
NOTE 1 Management Ratios 175
NOTE 2 Summary of Significant Accounting Policies 177
NOTE 3 Significant Events and Changes in Scope of Consolidation 190
NOTE 4 Consolidated Revenue by Strategic Business and by Region 196
NOTE 5 Operating Expense 198
NOTE 6 EBITDAR by Strategic Business and Region 198
NOTE 7 Rental Expense 199
NOTE 8 EBITDA by Strategic Business and Region 202
NOTE 9 Depreciation, Amortization and Provision Expense 203
NOTE 10 EBIT by Strategic Business and Region 203
NOTE 11 Net Financial Expense 204
NOTE 12 Share of Profit (Loss) of Associates after Tax 205
NOTE 13 Restructuring Costs 206
NOTE 14 Impairment Losses 206
NOTE 15 Gains and Losses on Management of Hotel Properties 208
NOTE 16 Gains and Losses on Management of Other Assets 208
NOTE 17 Income Tax Expense 209
NOTE 18 Profit or Loss from Discontinued Operations 211
NOTE 19 Goodwill 212
NOTE 20 Intangible Assets 213
NOTE 21 Property, Plant and Equipment 214
NOTE 22 Long-Term Loans 217
NOTE 23 Investment in Associates 217
NOTE 24 Other Financial Investments 222
NOTE 25 Receivables and Payables 222
NOTE 26 Potential Ordinary Shares 224
NOTE 27 Fair value adjustments on Financial Instruments reserve 229
NOTE 28 Minority interests 230
NOTE 29 Comprehensive Income 231
NOTE 30 Debt by Currency and Maturity 231
NOTE 31 Net Debt and Net Cash 236
NOTE 32 Analysis of financial assets and liabilities under IFRS 7 237
NOTE 33 Assets and Liabilities Held for Sale 241
NOTE 34 Provisions 242
NOTE 35 Reconciliation of Funds from Operations 251
NOTE 36 Change in Working Capital 252
NOTE 37 Renovation and Maintenance Expenditure 252
NOTE 38 Development Expenditure 253
NOTE 39 Segment Information 253
NOTE 40 Claims and litigation 259
NOTE 41 Off-Balance Sheet Commitments at December 31, 2014 260
NOTE 42 Main Consolidated Companies at December 31, 2014 262
NOTE 43 Related Party Transactions 264
NOTE 44 Corporate Officers’ Compensation 265
NOTE 45 Fees Paid to the Auditors 265
NOTE 46 Subsequent Events 265
Registration Document 2014174

5
FINANCIAL STATEMEMENTSConsolidated Financial Statements and Notes
NOTE 1 MANAGEMENT RATIOS
A. Key Management Ratios
Note Dec. 2013 Adjusted* Dec. 2014*
Gearing (a) 8.2% 4.1%
Adjusted Funds from Ordinary Activities/Adjusted Net Debt (b) 31.1% 34.2%
Return On Capital Employed (c) 14.0% 14.6%
Economic Value Added (EVA) (in millions of euros) (d) 160 215
* Based on continuing operations: i.e. excluding the Onboard Train Services business reclassified as a discontinued operation and restated to exclude the impact of the January 1, 2014 adoption of IFRS 11 – Joint Arrangements, which has been applied retrospectively to all periods presented.
Note (a): Gearing corresponds to the ratio of net debt to equity (including minority interests).
Note (b): Adjusted Funds from Ordinary Activities/Adjusted Net Debt is calculated as follows, corresponding to the method used by the main rating agencies:
Note Dec. 2013 Adjusted* Dec. 2014*
NET DEBT AT END OF THE PERIOD (SEE NOTE 31) 226 159
Restatement of perpetual subordinated notes (1) - 443
Restatement of the debt of sold and acquired businesses prorated over the period (2) 78 (160)
AVERAGE NET DEBT 304 442
Rental commitments discounted at 7% (3) 2,649 2,453
Total Adjusted net debt 2,953 2,895
FUNDS FROM ORDINARY ACTIVITIES 703 769
Rental amortization (see Note 7.C) 216 221
Adjusted Funds from Ordinary Activities 919 990
ADJUSTED FUNDS FROM ORDINARY ACTIVITIES/ADJUSTED NET DEBT 31.1% 34.2%
* Based on continuing operations: i.e. excluding the Onboard Train Services business reclassified as a discontinued operation and restated to exclude the impact of the January 1, 2014 adoption of IFRS 11 – Joint Arrangements, which has been applied retrospectively to all periods presented.
(1) For the calculation of the ratio, the perpetual subordinated notes (see Note 3.G) have been allocated for 50% to debt and for 50% to equity in line with the treatment applied by the rating agencies.
(2) Including:a. At December 31, 2014, including a €(643) million adjustment related to the acquisition of hotel portfolios from Moor Park, Axa Real Estate, Tritax and the interest
in Mama Shelter (see Notes 3.B.1 to 3.B.4), a €443 million adjustment for the June 2014 perpetual subordinated notes issue (see Note 3.G.) and a €37 million adjustment for disposals.
b. At December 31, 2013, including €126 million in adjustments for disposals and a €(48) million adjustment related to the “precompte” dividend withholding tax refund paid back to the French State (see Note 40.2).
(3) Rental commitments correspond to the amounts presented in Note 7.C. They do not include any variable or contingent rentals. The 7% rate is the rate used by Standard & Poor’s.
Note (c): Return On Capital Employed (ROCE) is defined below.
Note (d): Economic Value Added (EVA).
Registration Document 2014 175
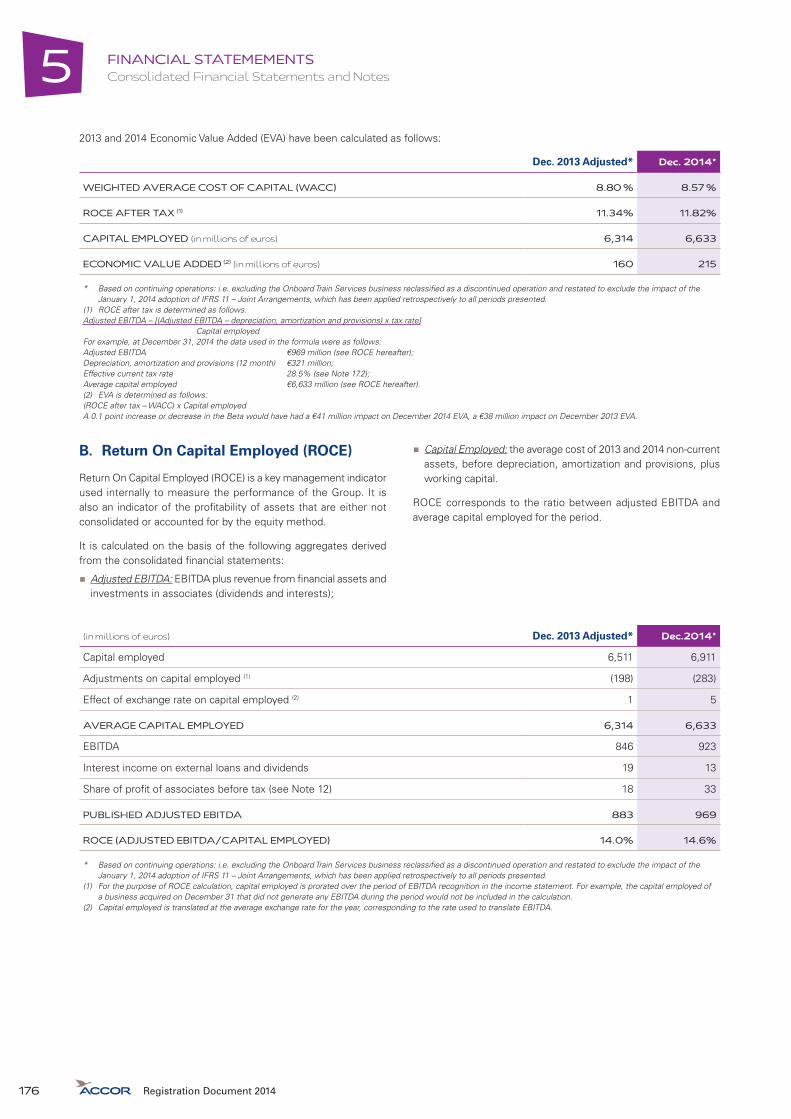
FINANCIAL STATEMEMENTSConsolidated Financial Statements and Notes5
2013 and 2014 Economic Value Added (EVA) have been calculated as follows:
Dec. 2013 Adjusted* Dec. 2014*
WEIGHTED AVERAGE COST OF CAPITAL (WACC) 8.80 % 8.57 %
ROCE AFTER TAX (1) 11.34% 11.82%
CAPITAL EMPLOYED (in millions of euros) 6,314 6,633
ECONOMIC VALUE ADDED (2) (in millions of euros) 160 215
* Based on continuing operations: i.e. excluding the Onboard Train Services business reclassified as a discontinued operation and restated to exclude the impact of the January 1, 2014 adoption of IFRS 11 – Joint Arrangements, which has been applied retrospectively to all periods presented.
(1) ROCE after tax is determined as follows:Adjusted EBITDA – [(Adjusted EBITDA – depreciation, amortization and provisions) x tax rate]
Capital employedFor example, at December 31, 2014 the data used in the formula were as follows:Adjusted EBITDA €969 million (see ROCE hereafter);Depreciation, amortization and provisions (12 month) €321 million;Effective current tax rate 28.5% (see Note 17.2);Average capital employed €6,633 million (see ROCE hereafter).(2) EVA is determined as follows:(ROCE after tax – WACC) x Capital employedA 0.1 point increase or decrease in the Beta would have had a €41 million impact on December 2014 EVA, a €38 million impact on December 2013 EVA.
B. Return On Capital Employed (ROCE)
Return On Capital Employed (ROCE) is a key management indicator used internally to measure the performance of the Group. It is also an indicator of the profitability of assets that are either not consolidated or accounted for by the equity method.
It is calculated on the basis of the following aggregates derived from the consolidated financial statements:
�� Adjusted EBITDA: EBITDA plus revenue from financial assets and investments in associates (dividends and interests);
�� Capital Employed: the average cost of 2013 and 2014 non-current assets, before depreciation, amortization and provisions, plus working capital.
ROCE corresponds to the ratio between adjusted EBITDA and average capital employed for the period.
(in millions of euros) Dec. 2013 Adjusted* Dec.2014*
Capital employed 6,511 6,911
Adjustments on capital employed (1) (198) (283)
Effect of exchange rate on capital employed (2) 1 5
AVERAGE CAPITAL EMPLOYED 6,314 6,633
EBITDA 846 923
Interest income on external loans and dividends 19 13
Share of profit of associates before tax (see Note 12) 18 33
PUBLISHED ADJUSTED EBITDA 883 969
ROCE (ADJUSTED EBITDA/CAPITAL EMPLOYED) 14.0% 14.6%
* Based on continuing operations: i.e. excluding the Onboard Train Services business reclassified as a discontinued operation and restated to exclude the impact of the January 1, 2014 adoption of IFRS 11 – Joint Arrangements, which has been applied retrospectively to all periods presented.
(1) For the purpose of ROCE calculation, capital employed is prorated over the period of EBITDA recognition in the income statement. For example, the capital employed of a business acquired on December 31 that did not generate any EBITDA during the period would not be included in the calculation.
(2) Capital employed is translated at the average exchange rate for the year, corresponding to the rate used to translate EBITDA.
Registration Document 2014176

5
FINANCIAL STATEMEMENTSConsolidated Financial Statements and Notes
NOTE 2 SUMMARY OF SIGNIFICANT ACCOUNTING POLICIES
General Framework
In accordance with European Commission regulation 1606/2002 dated July 19, 2002 on the application of international financial reporting standards, the Accor Group consolidated financial statements for the year ended December 31, 2014, have been prepared in accordance with the International Financial Reporting Standards (IFRSs) adopted by the European Union as of that date. They include comparative 2013 annual financial information, prepared in accordance with the same standards.
At December 31, 2014, all of the International Financial Reporting Standards (including IFRSs, IASs and Interpretations) published by the International Accounting Standards Board (“IASB”) had been adopted by the European Union, with the exception of IFRIC 21 – Levies. This interpretation is applicable in Europe in financial periods beginning on or after January 1, 2015 and the Group has decided to apply it as from that date. The effects of applying this interpretation on the consolidated financial statements taken as a whole will not be material. As a result, the Group’s consolidated financial statements have been prepared in accordance with International Financing Reporting Standards as published by the IASB.
The following new standards and amendments to existing standards adopted by the European Union were applicable from January 1, 2014:
�� IFRS 10 – Consolidated Financial Statements, IFRS 11 – Joint Arrangements, IFRS 12 – Disclosure of Interests in Other Entities, IAS 27R – Separate Financial Statements, IAS 28R – Investments in Associates and Joint Ventures, and their amendments. These standards introduce a new definition of control and no longer allow joint ventures to be consolidated by the proportionate method. Consequently, joint arrangements that are classified as joint ventures are now accounted for by the equity method, which is now the only recognized method. For joint arrangements that are classified as joint operations, the Group accounts for its contractual share of the assets and liabilities, revenues and expenses of the joint operation on the corresponding lines of the consolidated statement of financial position and income statement. The following companies are qualified as joint ventures based on the criteria in IFRS 11: Adagio, Reef Casinos and Société Immobilière d’Exploitation Hôtelière Algérienne. These companies have been accounted for by the equity method as from January 1, 2014. They were all previously consolidated by the proportionate method.
The first-time adoption of these standards represented a change in accounting policy under IAS 8 and the new policy has therefore been applied retrospectively to all periods presented. The effects on the consolidated financial statements are as follows:
(in millions of euros)
Dec. 2013 Published
Impact IFRS 11
Dec. 2013 Adjusted
CONSOLIDATED REVENUE 5,536 (111) 5,425
Operating Expense (3,777) 83 (3,694)
EBIT 536 (15) 521
Net financial expense (92) 2 (90)
Share of profit of associates after tax 2 9 11
OPERATING PROFIT BEFORE TAX AND NON RECURRING ITEMS 446 (4) 442
OPERATING PROFIT BEFORE TAX 259 (3) 256
Income tax expense (121) 1 (120)
NET PROFIT OR LOSS 139 (2) 137
NET PROFIT OR LOSS, GROUP SHARE 126 - 126
Registration Document 2014 177

FINANCIAL STATEMEMENTSConsolidated Financial Statements and Notes5
(in millions of euros)
Dec. 2012 Published
Impact IFRS 11
Dec. 2012 Adjusted
Dec. 2013 Published
Impact IFRS 11
Dec. 2013 Adjusted
GOODWILL 840 (17) 823 707 (16) 691
INTANGIBLE ASSETS 264 (1) 263 283 (2) 281
PROPERTY, PLANT AND EQUIPMENT 2,592 (50) 2,542 2,448 (52) 2,396
FINANCIAL ASSETS 632 43 675 502 46 548
DEFERRED TAX ASSETS 151 2 153 148 1 149
CURRENT ASSETS 2,925 (34) 2,891 2,911 (34) 2,877
ASSETS HELD FOR SALE 156 - 156 61 - 61
TOTAL ASSETS 7,560 (57) 7,503 7,060 (57) 7,003
Share capital 682 - 682 684 - 684
Additional paid-in capital and reserves 2,682 - 2,682 1,729 (1) 1,728
Net profit or loss, Group share (599) - (599) 126 - 126
Minority interests 230 (2) 228 217 (3) 214
TOTAL SHAREHOLDER’S EQUITY AND MINORITY INTERESTS 2,995 (2) 2,993 2,756 (4) 2,752
NON-CURRENT LIABILITIES 1,793 (18) 1,775 1,945 (20) 1,925
CURRENT LIABILITIES 2,736 (37) 2,699 2,333 (33) 2,300
LIABILITITES ASSOCIATED WITH ASSETS CLASSIFIED AS HELD FOR SALE 36 - 36 26 - 26
TOTAL LIABILITIES 7,560 (57) 7,503 7,060 (57) 7,003
�� Amendment to IAS 32 – Offsetting Financial Assets and Financial Liabilities, which clarifies IAS 32’s offsetting requirements. As Accor does not offset financial assets and financial liabilities, this amendment has no impact on the consolidated financial statements.
�� Amendment to IAS 39 – Novation of Derivatives and Continuation of Hedge Accounting. This amendment provides an exception to IAS 39’s requirement to discontinue hedge accounting in situations where derivatives designated in hedging relationships are directly or indirectly novated to a central counterparty as a consequence of laws or regulations. This amendment has no impact on the consolidated financial statements.
Registration Document 2014178
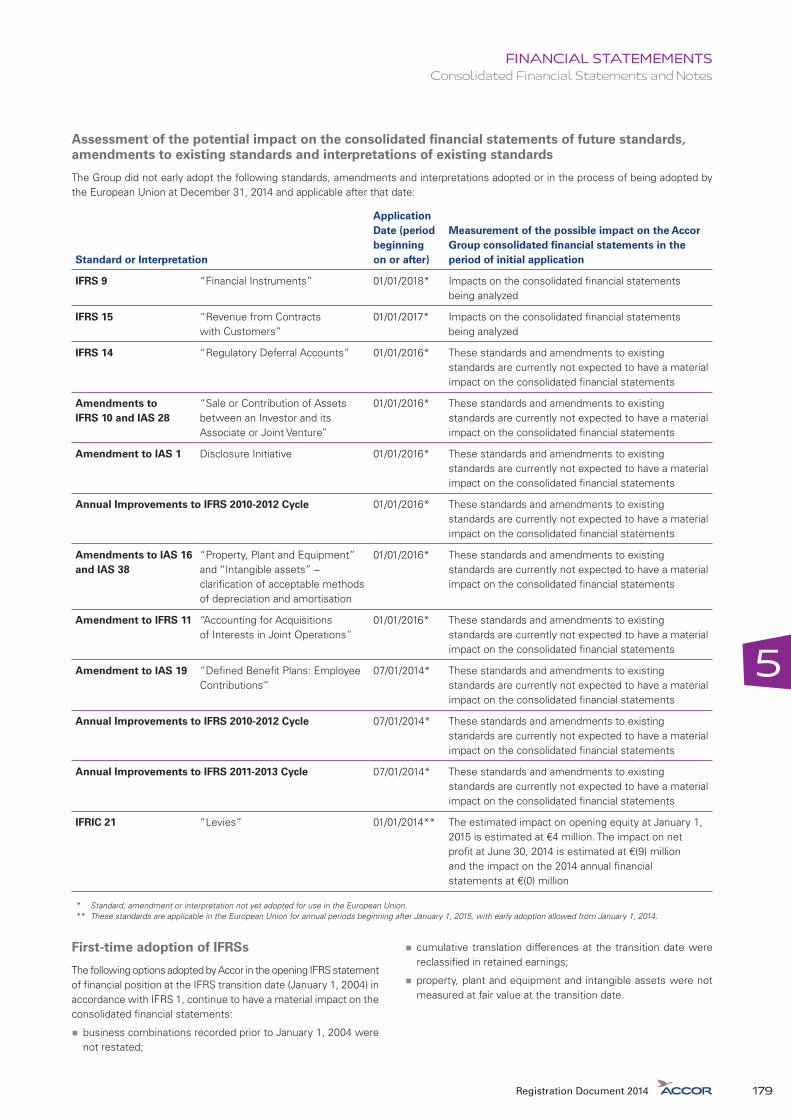
5
FINANCIAL STATEMEMENTSConsolidated Financial Statements and Notes
Assessment of the potential impact on the consolidated financial statements of future standards, amendments to existing standards and interpretations of existing standards
The Group did not early adopt the following standards, amendments and interpretations adopted or in the process of being adopted by the European Union at December 31, 2014 and applicable after that date:
Standard or Interpretation
Application Date (period beginning on or after)
Measurement of the possible impact on the Accor Group consolidated financial statements in the period of initial application
IFRS 9 “Financial Instruments” 01/01/2018* Impacts on the consolidated financial statements being analyzed
IFRS 15 “Revenue from Contracts with Customers”
01/01/2017* Impacts on the consolidated financial statements being analyzed
IFRS 14 “Regulatory Deferral Accounts” 01/01/2016* These standards and amendments to existing standards are currently not expected to have a material impact on the consolidated financial statements
Amendments to IFRS 10 and IAS 28
“Sale or Contribution of Assets between an Investor and its Associate or Joint Venture”
01/01/2016* These standards and amendments to existing standards are currently not expected to have a material impact on the consolidated financial statements
Amendment to IAS 1 Disclosure Initiative 01/01/2016* These standards and amendments to existing standards are currently not expected to have a material impact on the consolidated financial statements
Annual Improvements to IFRS 2010-2012 Cycle 01/01/2016* These standards and amendments to existing standards are currently not expected to have a material impact on the consolidated financial statements
Amendments to IAS 16 and IAS 38
“Property, Plant and Equipment” and “Intangible assets” – clarification of acceptable methods of depreciation and amortisation
01/01/2016* These standards and amendments to existing standards are currently not expected to have a material impact on the consolidated financial statements
Amendment to IFRS 11 “Accounting for Acquisitions of Interests in Joint Operations”
01/01/2016* These standards and amendments to existing standards are currently not expected to have a material impact on the consolidated financial statements
Amendment to IAS 19 “Defined Benefit Plans: Employee Contributions”
07/01/2014* These standards and amendments to existing standards are currently not expected to have a material impact on the consolidated financial statements
Annual Improvements to IFRS 2010-2012 Cycle 07/01/2014* These standards and amendments to existing standards are currently not expected to have a material impact on the consolidated financial statements
Annual Improvements to IFRS 2011-2013 Cycle 07/01/2014* These standards and amendments to existing standards are currently not expected to have a material impact on the consolidated financial statements
IFRIC 21 “Levies” 01/01/2014** The estimated impact on opening equity at January 1, 2015 is estimated at €4 million. The impact on net profit at June 30, 2014 is estimated at €(9) million and the impact on the 2014 annual financial statements at €(0) million
* Standard, amendment or interpretation not yet adopted for use in the European Union.** These standards are applicable in the European Union for annual periods beginning after January 1, 2015, with early adoption allowed from January 1, 2014.
First-time adoption of IFRSs
The following options adopted by Accor in the opening IFRS statement of financial position at the IFRS transition date (January 1, 2004) in accordance with IFRS 1, continue to have a material impact on the consolidated financial statements:
�� business combinations recorded prior to January 1, 2004 were not restated;
�� cumulative translation differences at the transition date were reclassified in retained earnings;
�� property, plant and equipment and intangible assets were not measured at fair value at the transition date.
Registration Document 2014 179

FINANCIAL STATEMEMENTSConsolidated Financial Statements and Notes5
Basis for preparation of the financial statements
The financial statements of consolidated companies, prepared in accordance with local accounting principles, have been restated to conform to Group policies prior to consolidation. All consolidated companies have a December 31 fiscal year-end, except for certain Indian companies that have a March 31 fiscal year-end and are therefore consolidated based on financial statements for the twelve months ended September 30.
The preparation of consolidated financial statements implies the consideration by Group management of estimates and assumptions that can affect the carrying amount of certain assets and liabilities, income and expenses, and the information disclosed in the notes to the financial statements. Group management reviews these estimates and assumptions on a regular basis to ensure that they are appropriate based on past experience and the current economic situation. Items in future financial statements may differ from current estimates as a result of changes in these assumptions.
The main estimates and judgments made by management in the preparation of financial statements concern the valuation and the useful life of intangible assets, property, plant and equipment and goodwill, the amount of provisions for contingencies and the assumptions underlying the calculation of pension obligations, claims and litigation and deferred tax balances.
The main assumptions made by the Group are presented in the relevant notes to the financial statements.
When a specific transaction is not covered by any standards or interpretations, management uses its judgment in developing and applying an accounting policy that results in the production of relevant and reliable information. As a result, the financial statements provide a true and fair view of the Group’s financial position, financial performance and cash flows and reflect the economic substance of transactions.
Capital management
The Group’s main capital management objective is to maintain a satisfactory credit rating and robust capital ratios in order to facilitate business operations and maximize shareholder value.
Its capital structure is managed and adjusted to keep pace with changes in economic conditions, by adjusting dividends, returning capital to shareholders or issuing new shares. Capital management objectives, policies and procedures were unchanged in 2014.
The main indicator used for capital management purposes is the gearing or debt-to-equity ratio (corresponding to net debt divided by equity: see Note “Key Management Ratios”). Group policy consists of keeping this ratio below 100%. For the purpose of calculating the ratio, net debt is defined as all short and long-term borrowings, including lease liabilities, derivative instruments with negative fair values and bank overdrafts less cash and cash equivalents, derivative instruments with positive fair values and disposal proceeds receivable in the short-term. Long-term loans, made primarily to hotel owners and to certain companies in which Accor holds a minority interest with the aim of developing long-term investments, are treated as cash flows from investing activities and not financing activities. Consequently, they are excluded from the net debt calculation.
Equity includes the Group’s share of reserves and retained earnings, and unrealized gains and losses recognized directly in equity, but excludes minority interests.
Moreover, the Group has set a target at the end of December 2014 of maintaining the Adjusted funds from ordinary activities/Adjusted net debt ratio at more than 25%.
The main accounting methods applied are as follows:
A. Consolidation methods
The Group’s organizational policy consists of creating subsidiaries in France and, generally, in all of its host countries. These subsidiaries are set up for the sole purpose of operating Accor Group hotels. In most cases, they are wholly owned by Accor and controlled exclusively by the Group. They are therefore fully consolidated.
IFRS 10 – Consolidated Financial Statements states that an investor controls an investee when it is exposed, or has rights, to variable returns from its involvement with the investee and has the ability to affect those returns through its power over the investee. No account is taken of the potential ability to direct the relevant activities arising from rights that cannot yet be exercised or that are subject to the occurrence of a future event. The investor must have the current, practical ability to direct the relevant activities that most significantly affect the returns of the investee. In the hotel business, an investor has power over a hotel operator, i.e. existing rights that give the investor the current ability to direct the relevant activities that significantly affect the hotel’s returns, when it has the ability to make all operational, financial and strategic management decisions. In practice, this means that the investor has the power to appoint the hotel operator’s management and to approve the operator’s business plan and annual budget. In the case of managed and franchised hotels, Accor has no such power and is not in a position to decide on the business plan or the annual budget. In the case of managed hotels, Accor acts on behalf and for the benefit of the hotel owner and as such is a representative of the owner.
The Group has not identified any companies that it controls despite holding less than half of the voting rights. Similarly, The Group has not identified any companies that it does not control despite holding more than half of the voting rights.
In connection with the development of certain hotel businesses, Accor may set up partnerships with other companies to pool their complementary skills. In all cases, the partnerships are organized as separate, independently managed vehicles in which both partners have rights to the net assets. All of these companies are controlled jointly by Accor and the partner under a contractual arrangement, according to which decisions about the relevant activities require the unanimous consent of the parties sharing control. They qualify as joint ventures based on the criteria in IFRS 11 – Joint Arrangements, and have therefore been accounted for by the equity method in the consolidated financial statements as from January 1, 2014 in line with the requirements of IFRS 11.
In some countries, Accor may choose to acquire a minority interest (generally less than 40%) in a local company that is then used as a vehicle for developing hotel projects. In exchange for its investment Accor generally acquires the right to manage the hotels concerned. In most cases, Accor has a seat on the Board, allowing it to participate in decisions proportionately to its percentage interest in the Company’s capital. However, the power to control the Company remains in the hands of the other investors. These companies over which Accor exercises significant influence, directly or indirectly, are qualified as associates and are accounted for by the equity method in the consolidated financial statements.
Registration Document 2014180

5
FINANCIAL STATEMEMENTSConsolidated Financial Statements and Notes
Accor may also acquire minority interests in real estate companies that own the hotel properties (land and buildings) operated by the Group under a lease or management contract. These interests do not entitle Accor to a seat on the real estate company’s Board, and Accor has no right to participate in the process for developing financial and operating policies. Consequently, they are classified as investments in non-consolidated companies under “Other financial investments” in the consolidated financial statements.
B. Business combinations and loss of control – changes in scope of consolidation
Applicable since January 1, 2010, IFRS 3 (revised) “Business Combinations” and IAS 27 (revised) “Consolidated and Separate Financial Statements” have led the Group to alter its accounting treatment of business combinations and transactions with non-controlling interests carried out on or after this date, as follows:
B.1. Business combinations
Business combinations are accounted for applying the acquisition method:
�� the acquisition cost is measured at the acquisition date at the fair value of the consideration transferred, including all contingent consideration. Subsequent changes in contingent consideration are accounted for either through profit or loss or through other comprehensive income;
�� identifiable assets and liabilities acquired are measured at fair value. Fair value measurements must be completed within one year or as soon as the necessary information to identify and value the assets and liabilities has been obtained. They are performed in the currency of the acquiree. In subsequent years, these fair value adjustments follow the same accounting treatment as the items to which they relate;
�� goodwill is the difference between the consideration transferred and the fair value of the identifiable assets and liabilities assumed at the acquisition date and is recognized as an asset in the statement of financial position (see Note 2.C. Goodwill).
Costs related to business combinations are recognized directly as expenses.
When a business combination is achieved in stages, the previously held equity interest is remeasured at fair value at the acquisition date through profit or loss. The attributable other comprehensive income, if any, is fully reclassified in operating income.
B.2. Loss of control with residual equity interest
The loss of control while retaining a residual equity interest may be analysed as the disposal of a controlling interest followed by the acquisition of a non-controlling interest. This process involves, as of the date when control is lost:
�� the recognition of a gain or loss on disposal, comprising:
�y a gain or loss resulting from the percentage ownership interest sold,
�y a gain or loss resulting from the remeasurement at fair value of the ownership interest retained in the entity;
�� the other comprehensive income items are reclassified in the profit or loss resulting from the ownership interest disposed.
B.3. Purchases or disposals of non-controlling interest
Transactions with non-controlling interests in fully consolidated companies that do not result in a loss of control, are accounted for as equity transactions, with no effect on profit or loss or on other comprehensive income.
B.4. Loss of significant influence while retaining a residual interest
The loss of significant interest while retaining a residual interest may be analyzed as the disposal of shares accounted for by the equity method followed by the acquisition of a financial asset. This process involves, as of the date of disposal:
�� the recognition of a gain or loss on disposal, comprising:
�y a gain or loss resulting from the percentage ownership interest sold, and,
�y a gain or loss resulting from the remeasurement at fair value of the retained percentage ownership interest;
�� the reclassification in profit of all of the other comprehensive income items.
B.5. Acquisitions of asset portfolios
As part of its strategy, the Group may acquire hotels that were previously operated under leases. These acquisitions are generally treated as asset acquisitions other than business combinations as the strategic business processes (i.e. hotel operations) and the generation of economic benefits (i.e. revenues from hotel operations) are already controlled by Accor.
When asset portfolios are acquired, the assets and liabilities are initially recognized at cost including transaction expenses. No deferred taxes are recognized, in accordance with IAS 12.
C. Goodwill
C.1. Positive goodwill
Goodwill, representing the excess of the cost of a business combination over the Group’s interest in the net fair value of the identifiable assets and liabilities acquired at the acquisition date, is recognized in assets under “Goodwill”. Residual goodwill mainly results from the expected synergies and other benefits arising from the business combination.
In accordance with IFRS 3 (revised), which is applicable to business combinations carried out on or after January 1, 2010, each time it acquires less than 100% interest in an entity, the Group must choose whether to recognize goodwill:
�� by the full goodwill method (i.e. on a 100% basis): in this case, non-controlling interests are measured at fair value and goodwill attributable to non-controlling interests is recognized in addition to the goodwill recognized on the acquired interest;
Registration Document 2014 181

FINANCIAL STATEMEMENTSConsolidated Financial Statements and Notes5
�� by the partial goodwill method (i.e. based on the percentage interest acquired, with no change possible later in the event of an additional interest being acquired that does not transfer control): in this case, non-controlling interests are measured as the non-controlling interest’s proportionate share of the acquiree’s identifiable net assets and goodwill is only recognized for the share acquired.
Goodwill arising on the acquisition of associates – corresponding to companies over which the Group exercises significant influence – is included in the carrying amount of the associate concerned.
Goodwill arising on the acquisition of subsidiaries and jointly controlled entities is reported separately.
In accordance with IFRS 3 (revised) “Business Combinations”, goodwill is not amortized but is tested for impairment at least once a year and more frequently if there is any indication that it may be impaired. The methods used to test goodwill for impairment are described in Note 2.E.6. If the carrying amount of goodwill exceeds its recoverable amount, an irreversible impairment loss is recognized in profit.
C.2. Negative goodwill
Negative goodwill, representing the excess of the Group’s interest in the net fair value of the identifiable assets and liabilities acquired at the acquisition date over the cost of the business combination, is recognized immediately in profit.
C.3. Reallocation of goodwill following reorganizations
IAS 36, paragraph 87, states that if an entity reorganizes its reporting structure in a way that changes the composition of one or more cash-generating units to which goodwill has been allocated, the goodwill must be reallocated to the units affected based on the relative values of the units’ discounted cash flows.
D. Foreign currency translation
The presentation currency is the euro.
The statements of financial position of foreign subsidiaries are translated into euros at the closing exchange rate, and their income statements are translated at the average rate for the period. Differences arising from translation are recorded as a separate component of equity and recognized in profit on disposal of the business.
Accor did not have any subsidiaries operating in hyperinflationary economies in any of the periods presented.
E. Non-current assets
E.1. Intangible assets
In accordance with IAS 38 “Intangible Assets”, intangible assets are measured at cost less accumulated amortization and any accumulated impairment losses.
Brands and lease premiums in France (droit au bail) are considered as having indefinite useful lives because the Group considers that there is no foreseeable limit to the period in which they can be used and are therefore not amortized. Their carrying amount is reviewed at least once a year and more frequently if there is any indication that they may be impaired. If their fair value is less than their carrying amount, an impairment loss is recognized (see Note 2.E.6).
Other intangible assets (licenses and software) are considered as having finite useful lives. They are amortized on a straight-line basis over their useful lives.
The clientele of hotels outside France is generally amortized over the life of the underlying lease.
Identifiable intangible assets recognized in a business combination are initially recognized at amounts determined by independent valuations, performed using relevant criteria for the business concerned that can be applied for the subsequent measurement of the assets. Identifiable brands are measured based on multiple criteria, taking into account both brand equity and their contribution to profit.
Software costs incurred during the development phase are capitalized as internally-generated assets if the Group can demonstrate all of the following in accordance with IAS 38:
�� its intention to complete the intangible asset and the availability of adequate technical, financial and other resources for this purpose;
�� how the intangible asset will generate probable future economic benefits;
�� its ability to measure reliably the expenditure attributable to the intangible asset during its development.
At the time of signature of management or franchise contracts, Accor may have to pay key money to the owners of the hotels. These payments are necessary to obtain the contracts and are qualified as intangible assets under IAS 38. Key money is amortized over the life of the contracts to which it relates.
E.2. Property, plant and equipment
Property, plant and equipment are measured at purchase cost less accumulated depreciation and any accumulated impairment losses, in accordance with IAS 16 “Property, Plant and Equipment”.
Assets under construction are measured at cost less any accumulated impairment losses. They are depreciated from the date when they are put in service.
Registration Document 2014182
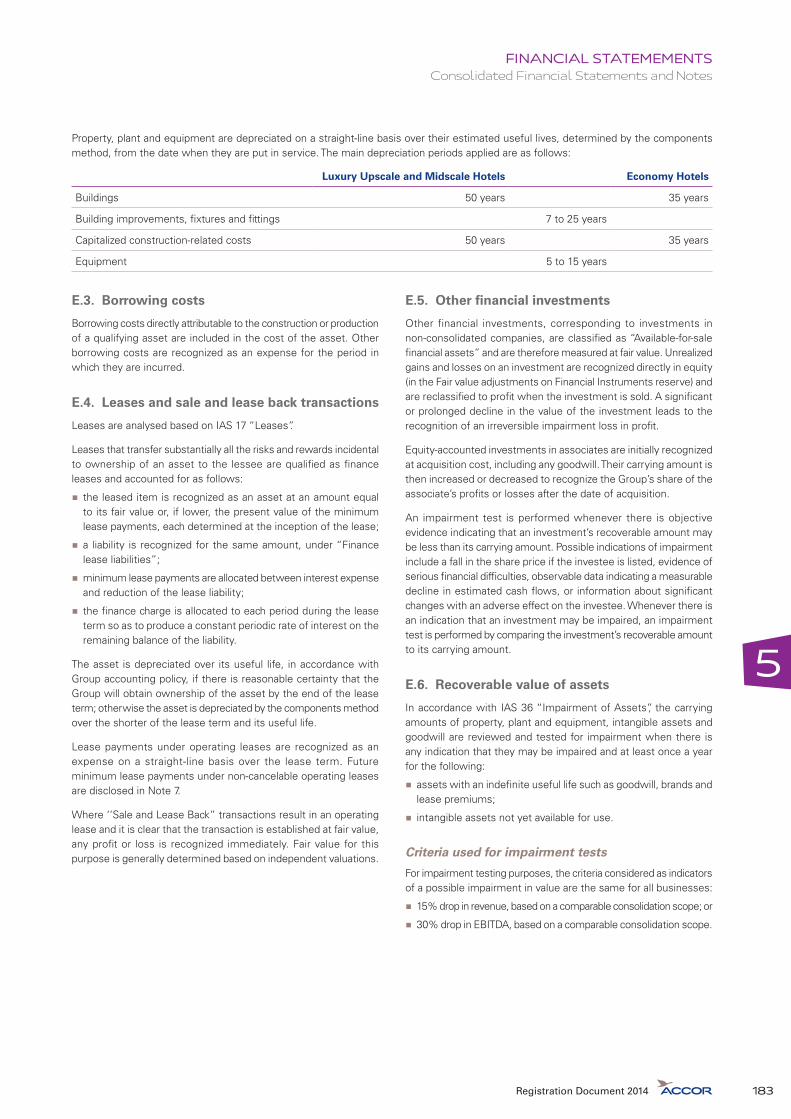
5
FINANCIAL STATEMEMENTSConsolidated Financial Statements and Notes
Property, plant and equipment are depreciated on a straight-line basis over their estimated useful lives, determined by the components method, from the date when they are put in service. The main depreciation periods applied are as follows:
Luxury Upscale and Midscale Hotels Economy Hotels
Buildings 50 years 35 years
Building improvements, fixtures and fittings 7 to 25 years
Capitalized construction-related costs 50 years 35 years
Equipment 5 to 15 years
E.3. Borrowing costs
Borrowing costs directly attributable to the construction or production of a qualifying asset are included in the cost of the asset. Other borrowing costs are recognized as an expense for the period in which they are incurred.
E.4. Leases and sale and lease back transactions
Leases are analysed based on IAS 17 “Leases”.
Leases that transfer substantially all the risks and rewards incidental to ownership of an asset to the lessee are qualified as finance leases and accounted for as follows:
�� the leased item is recognized as an asset at an amount equal to its fair value or, if lower, the present value of the minimum lease payments, each determined at the inception of the lease;
�� a liability is recognized for the same amount, under “Finance lease liabilities”;
�� minimum lease payments are allocated between interest expense and reduction of the lease liability;
�� the finance charge is allocated to each period during the lease term so as to produce a constant periodic rate of interest on the remaining balance of the liability.
The asset is depreciated over its useful life, in accordance with Group accounting policy, if there is reasonable certainty that the Group will obtain ownership of the asset by the end of the lease term; otherwise the asset is depreciated by the components method over the shorter of the lease term and its useful life.
Lease payments under operating leases are recognized as an expense on a straight-line basis over the lease term. Future minimum lease payments under non-cancelable operating leases are disclosed in Note 7.
Where ‘’Sale and Lease Back” transactions result in an operating lease and it is clear that the transaction is established at fair value, any profit or loss is recognized immediately. Fair value for this purpose is generally determined based on independent valuations.
E.5. Other financial investments
Other financial investments, corresponding to investments in non-consolidated companies, are classified as “Available-for-sale financial assets” and are therefore measured at fair value. Unrealized gains and losses on an investment are recognized directly in equity (in the Fair value adjustments on Financial Instruments reserve) and are reclassified to profit when the investment is sold. A significant or prolonged decline in the value of the investment leads to the recognition of an irreversible impairment loss in profit.
Equity-accounted investments in associates are initially recognized at acquisition cost, including any goodwill. Their carrying amount is then increased or decreased to recognize the Group’s share of the associate’s profits or losses after the date of acquisition.
An impairment test is performed whenever there is objective evidence indicating that an investment’s recoverable amount may be less than its carrying amount. Possible indications of impairment include a fall in the share price if the investee is listed, evidence of serious financial difficulties, observable data indicating a measurable decline in estimated cash flows, or information about significant changes with an adverse effect on the investee. Whenever there is an indication that an investment may be impaired, an impairment test is performed by comparing the investment’s recoverable amount to its carrying amount.
E.6. Recoverable value of assets
In accordance with IAS 36 “Impairment of Assets”, the carrying amounts of property, plant and equipment, intangible assets and goodwill are reviewed and tested for impairment when there is any indication that they may be impaired and at least once a year for the following:
�� assets with an indefinite useful life such as goodwill, brands and lease premiums;
�� intangible assets not yet available for use.
Criteria used for impairment tests
For impairment testing purposes, the criteria considered as indicators of a possible impairment in value are the same for all businesses:
�� 15% drop in revenue, based on a comparable consolidation scope; or
�� 30% drop in EBITDA, based on a comparable consolidation scope.
Registration Document 2014 183

FINANCIAL STATEMEMENTSConsolidated Financial Statements and Notes5
Cash-generating unit
Impairment tests are performed individually for each asset except when an asset does not generate cash inflows that are largely independent of those from other assets or groups of assets. In this case, it is included in a cash-generating unit (CGU) and impairment tests are performed at the level of the cash-generating unit.
In the opening balance sheet at January 1, 2014, goodwill was reallocated between the HotelServices and HotelInvest strategic businesses created to support the Group’s change of strategy and related reorganization.
In previous years, goodwill was allocated by region, country or hotel. The reallocation was based on discounted cash flow projections between the two strategic businesses for each region or country.
In the HotelInvest strategic business, the CGU’s carrying amount includes property and equipment and intangible assets for each hotel, including allocated goodwill. Impairment tests are performed at the level of each individual hotel.
In the HotelServices strategic business, the CGU’s carrying amount includes the property and equipment and intangible assets used in each region or country
Other assets, notably intangibles, are tested individually when they generate separately identifiable cash inflows.
Methods used to determine recoverable value
Impairment tests consist of comparing the carrying amount of the asset or the CGU with its recoverable value. The recoverable value of an asset or a CGU is the higher of its fair value less costs to sell and its value in use.
For property, plant and equipment and goodwill, the recoverable value of all the assets or the CGUs is determined by two methods, the EBITDA multiples method (fair value approach) and the after-tax discounted cash flows method (value in use approach).
For intangible assets except goodwill, the recoverable value of an intangible asset is determined according to the discounted cash flow method only, due to the absence of an active market and comparable transactions.
Description of the methods1. Valuation by the EBITDA multiples method
HotelInvest recoverable amounts are estimated using fair values calculated based on a standard EBITDA multiple. For hotel properties, this method is considered as the most appropriate approach to estimating fair value less costs to sell, as it most closely reflects the amount that would be expected to be recovered through the sale of the asset.
The multiples method consists of calculating each hotel’s average EBITDA for the last two years and applying a multiple based on the hotel’s location and category. The multiples applied by the Group correspond to the average prices observed on the market for transactions and are as follows:
Segment Coefficients
Luxury and Upscale Hotels 8 < x < 10.5
Midscale Hotels 7.5 < x < 9
Economy Hotels 6.5 < x < 8.5
This is a level 2 valuation technique under IFRS 13.
If the recoverable amount is less than the carrying amount, the asset’s recoverable amount will be recalculated according to the discounted cash flows method.
2. Valuation by the discounted cash flows method
HotelServices recoverable amounts are estimated using the value in use determined by the discounted cash flows method.
The projection period is limited to five years. Cash flows are discounted at a rate corresponding to the year-end weighted average cost of capital. Separation calculations are performed based on each country/region’s specific characteristics. The projected long-term rate of revenue growth reflects each country/region’s economic outlook.
This is a level 3 valuation technique under IFRS 13.
Impairment loss measurement
If the recoverable amount is less than the carrying amount, an impairment loss is recognized in an amount corresponding to the lower of the losses calculated by the EBITDA multiples and discounted cash flows methods. Impairment losses are recognized in the income statement under “Impairment losses” (see Note 2.S.6).
Reversal of an impairment loss
In accordance with IAS 36 “Impairment of Assets”, impairment losses on goodwill as well as on intangible assets with a finite useful life, such as patents and software, are irreversible. Losses on property, plant and equipment and on intangible assets with an indefinite useful life, such as brands, are reversible in the case of a change in estimates used to determine their recoverable amount.
E.7. Assets or disposal groups held for sale
Assets are classified as “held for sale” when they are available for immediate sale in their present condition, their sale is highly probable, management is committed to a plan to sell the asset and an active program to locate a buyer and complete the plan has been initiated.
Registration Document 2014184

5
FINANCIAL STATEMEMENTSConsolidated Financial Statements and Notes
In accordance with IFRS 5 “Non-Current Assets Held for Sale and Discontinued Operations”, assets or group of assets held for sale are presented separately on the face of the statement of financial position, at the lower of their carrying amount and fair value less costs to sell.
This item groups together:
�� non-current assets held for sale;
�� groups of assets held for sale;
�� the total current and non-current assets related to a business or geographical segment (i.e. to a discontinued operation) itself held for sale.
F. Inventories
Inventories are measured at the lower of cost and net realizable value, in accordance with IAS 2 “Inventories”. Cost is determined by the weighted average cost method.
G. Prepaid expense
Prepaid expense corresponds to expenses paid during the period that relate to subsequent periods. They also include the effect of recognizing rental expense on a straight-line basis over the life of the lease. Prepaid expense is included in “Other receivables and accruals”.
H. Employee benefits expense
Employee benefits expense includes all amounts paid or payable to employees, including statutory and discretionary profit-sharing, pension contributions, payroll taxes and the cost of share-based payments.
A “Crédit d’Impôt pour la Compétitivité et l’Emploi” (CICE) tax credit was introduced in the 3rd 2012 Rectified Finance Act with the aim of making French businesses more competitive by reducing labor costs for certain employees. The CICE consists in substance of a government grant to be spent by companies on measures to improve their competitiveness. It is therefore accounted for in accordance with IAS 20 “Accounting for Government Grants and Disclosure”. As allowed under IAS 20, the Group has chosen to record it as a deduction from the related expenses, i.e. as a deduction from payroll costs. The CICE recorded in the December 31, 2014 financial statements in respect of previously recognized payroll costs amounts to €18.8 million; it amounted to €10.5 million at December 31, 2013.
I. Provisions
In accordance with IAS 37 “Provisions, Contingent Liabilities and Contingent Assets”, a provision is recognized when the Group has a present obligation (legal, contractual or implicit) as a result of a past event and it is probable that an outflow of resources embodying economic benefits will be required to settle the obligation. Provisions are determined based on the best estimate of the expenditure required to settle the obligation, in application of certain assumptions. Provisions are discounted when the effect
of the time value of money is material, using a discount rate that reflects current market assessments of the time value of money. The most commonly applied rates are the prime long-term corporate bond rate or the government bond rate.
Provisions for restructuring costs are recorded when the Group has a detailed formal plan for the restructuring and the plan’s main features have been announced to those affected by it as of the close of accounts.
J. Pensions and other post-employment benefits
The Group offers various supplementary pension, length-of-service award and other post-employment benefit plans, in accordance with the laws and practices of the countries where it operates. These plans are either defined contribution or defined benefit plans.
Under defined contribution plans, the Group pays fixed contributions into a separate fund and has no legal or constructive obligation to pay further contributions if the fund does not hold sufficient assets to pay benefits. Contributions under these plans are recognized immediately as an expense.
For defined benefit plans, under which the Group has a legal or constructive obligation to provide agreed benefits to current and future employees in exchange for a given level of service (including multi-employer plans when the manager is able to provide the necessary information), the Group’s obligations are determined in accordance with IAS 19 “Employee Benefits”.
The Group’s obligation is determined by the projected unit credit method based on actuarial assumptions related to future salary levels, retirement age, mortality, staff turnover and the discount rate. These assumptions take into account the macro-economic environment and other specific conditions in the various host countries.
Pension and other retirement benefit obligations take into account the market value of plan assets. The amount recognized in the statement of financial position corresponds to the discounted present value of the defined benefit obligation less the fair value of plan assets. Any surpluses, corresponding to the excess of the fair value of plan assets over the projected benefit obligation, are recognized only when they represent the present value of any economic benefits available in the form of refunds from the plan or reductions in future contributions to the plan.
Current service cost, past service cost, administrative expense, taxes for the year, and paid contributions and benefits are recognized in operating expense, whereas net interest on the net defined benefit liability (asset) is recognized in financial expense (income).
For post-employment benefits, actuarial gains and losses arising from changes in actuarial assumptions and experience adjustments are recognized immediately in equity. However, actuarial gains and losses on long-term benefit obligations towards active employees (such as jubilees, seniority bonuses…) are recognized directly in profit or loss in net financial expense.
The net defined benefit obligation is recognized in the statement of financial position under “Non-current Provisions”.
Registration Document 2014 185

FINANCIAL STATEMEMENTSConsolidated Financial Statements and Notes5
K. Translation of foreign currency transactions
Foreign currency transactions are recognized and measured in accordance with IAS 21 “Effects of Changes in Foreign Exchange Rates”. As prescribed by this standard, each Group entity translates foreign currency transactions into its functional currency at the exchange rate on the transaction date.
Foreign currency receivables and payables are translated into euros at the closing exchange rate. Foreign currency financial liabilities measured at fair value are translated at the exchange rate on the valuation date. Gains and losses arising from translation are recognized in “Net financial expense”, except for gains and losses on financial liabilities measured at fair value which are recognized in equity.
L. Income taxes
Income tax expense (or benefit) includes both current and deferred tax expense (or benefit).
Current taxes on taxable profits for the reporting period and previous periods are recognized as liabilities until they are paid.
In accordance with IAS 12 “Income Taxes”, deferred taxes are recognized on temporary differences between the carrying amount of assets and liabilities and their tax base by the liability method. This method consists of adjusting deferred taxes at each period-end, based on the last tax rates (and tax laws) that have been enacted or substantively enacted. The effects of changes in tax rates (and tax laws) are recognized in the income statement for the period in which the rate change is announced.
A deferred tax is recognized for all temporary differences, except when it arises from the initial recognition of non-deductible goodwill or the initial recognition of an asset or liability in a transaction which is not a business combination and which, at the time of the transaction, affects neither accounting profit nor taxable profit.
A deferred tax liability is recognized for all taxable temporary differences associated with investments in subsidiaries, associates and interests in joint ventures except when:
�� the Group is able to control the timing of the reversal of the temporary difference; and
�� it is probable that the temporary difference will not reverse in the foreseeable future.
A deferred tax asset is recognized for ordinary and evergreen tax loss carryforwards only when it is probable that the asset will be recovered in the foreseeable future based on the most recently updated projections.
Income taxes are normally recognized in the income statement. However, when the underlying transaction is recognized in equity, the related income tax is also recorded in equity.
In accordance with IAS 12, deferred taxes are not discounted.
Since January 1, 2010, deferred tax assets of acquired companies that are not recognized at the time of the business combination or during the measurement period are recognized in profit or loss without adjusting goodwill if they arise from a post-acquisition event.
In France, the “taxe professionnelle” local business tax was replaced in the 2010 Finance Act by the “Contribution Économique Territoriale” tax (CET). The CET comprises two separate taxes, a tax assessed on the rental value of real estate (“CFE”) and a tax assessed on the value added by the business (“CVAE”). In its 2012 and 2013 financial statements, Accor decided therefore to classify CVAE as income tax.
The second Amended 2012 Finance Act introduced a 3% surtax on dividends and other distributions paid by companies that are subject to French corporate income tax. The surtax is treated as an income tax expense arising as of the date of the Annual Shareholders’ Meeting at which the dividend is approved. In 2014, the Group therefore recognized additional income tax expense of €3.7 million in its financial statements in respect of the 2013 dividends paid in 2014. In 2013, the Group recognized additional income tax expense of €5.2 million in its financial statements in respect of the 2012 dividends paid in 2013.
M. Share-based payments
M.1. Share-based payments
Stock Option Plans
Accor regularly sets up option plans for executives, as well as for senior and middle managers. IFRS 2 applies to all stock option plans outstanding at December 31, 2014. 12 of these plans do not have any specific vesting conditions except for the requirement for grantees to continue to be employed by the Group at the starting date of the exercised period:
�� for eight plans, grantees must still be employed by the Group at the starting date of the exercise period;
�� four other plans are a performance option plan with vesting conditions based on performance in relation to the market.
The service cost representing consideration for the stock options is recognized in expense over the vesting period by adjusting equity. The expense recognized in each period corresponds to the fair value of equity instruments granted at the grant date, as determined using the Black & Scholes option-pricing model. The grant date is defined as the date when the plan’s terms and conditions are communicated to Group employees corresponding to the dates on which the Board of Directors approved these plans.
Under IFRS 2, vesting conditions, other than market conditions, are not taken into account when estimating the fair value of the options but are taken into account by adjusting the number of equity instruments included in the measurement of the transaction amount, so that, ultimately, the amount recognized for goods and services received as consideration for the equity instruments granted is based on the number of equity instruments that eventually vest.
Market conditions are taken into account when estimating the fair value of the equity instruments granted, leading to the options being valued at a discounted price. The value attributed to the discount cannot be adjusted, whatever the extent to which the performance conditions have been met at the end of the vesting period. It is determined using the Monte Carlo method, which consists of simulating the performance of Accor shares and the corresponding index according to a sufficiently large number of Brown scenarios. Assumptions concerning the probability of options being exercised are also factored into the Monte Carlo model.
Registration Document 2014186

5
FINANCIAL STATEMEMENTSConsolidated Financial Statements and Notes
When the options are exercised, the cash settlement is recorded in cash and cash equivalents and in equity. The amount recognized in equity is allocated between “Share capital” and “Additional paid-in capital”.
Performance shares plans
Performance shares plans are also recognized and measured in accordance with IFRS 2. The recognition and the measurement principles are those used to recognize and measure the stock option plans excepted for the measurement of the cost of the performance share plans corresponding to the Accor opening share price on the grant date less the present value of dividends unpaid multiplied by the number of shares issued.
M.2. Treasury stock
Accor shares held by the Company and/or subsidiaries are recognized as a deduction from equity.
Gains and losses on sales of treasury stock (and the related tax effect) are recognized directly in equity without affecting profit. No impairment losses are recognized on treasury stock.
M.3. Perpetual subordinated notes
Perpetual subordinated notes are accounted for in accordance with IAS 32 taking into account their specific characteristics. They are recorded in equity at historical cost when Accor has an unconditional right to avoid delivering cash or another financial asset to settle the contractual obligation.
Interest paid on these notes is recorded as a deduction from equity. The related taxe effect is booked in Profit and Loss. The interest paid are taxe deductible.
N. Financial instruments
Financial assets and liabilities are recognized and measured in accordance with IAS 39 “Financial Instruments, Recognition and Measurement”, and its amendments.
Financial assets and liabilities are recognized in the statement of financial position when the Group becomes a party to the contractual provisions of the instrument.
N.1. Financial assets
Financial assets are classified between the three main categories defined in IAS 39, as follows:
�� “Loans and receivables” mainly comprise time deposits and loans to non-consolidated companies. They are initially recognized at fair value and are subsequently measured at amortized cost at each balance-sheet date. If there is an objective indication of impairment, an impairment loss is recognized at the balance-sheet date. The impairment loss corresponds to the difference between the carrying amount and the recoverable amount (i.e. the present
value of the expected cash flows discounted using the original effective interest rate) and is recognized in profit or loss. This loss may be reversed if the recoverable amount increases in a subsequent period.
�� “Held to maturity investments” mainly comprise bonds and other money market securities intended to be held to maturity. They are initially recognized at fair value and are subsequently measured at amortized cost at each balance-sheet date. If there is an objective indication of impairment, an impairment loss is recognized at the balance-sheet date. The impairment loss corresponds to the difference between the carrying amount and the recoverable amount (i.e. the present value of the expected cash flows discounted using the original effective interest rate) and is recognized in profit or loss. This loss may be reversed if the recoverable amount increases in a subsequent period.
For these two categories, initial fair value is equivalent to acquisition cost, because no material transaction costs are incurred.
�� “Available-for-sale financial assets” mainly comprise investments in non-consolidated companies, equities, mutual fund units and money market securities. These assets are measured at fair value, with changes in fair value recognized in equity. The fair value of listed securities corresponds to market price (level 1 valuation technique: see Note 2.R) and the fair value of unlisted equities and mutual funds corresponds to their net asset value (level 1 valuation technique: see Note 2.R). For unlisted securities, fair value is estimated based on the most appropriate criteria applicable to each individual investment (using level 3 valuation techniques that are not based on observable data: see Note 2.R). Securities that are not traded on an active market, for which fair value cannot be reliably estimated, are carried in the statement of financial position at historical cost plus any transaction expenses. When there is objective evidence of a significant or prolonged decline in value, the cumulative unrealized loss recorded in equity is reclassified to the income statement and can’t be reversed.
N.2. Derivative financial Instruments
Derivative financial instruments such as interest rate and currency swaps, caps and forward purchases of foreign currencies, are used solely to hedge exposures to changes in interest rates and exchange rates.
They are measured at fair value. Changes in fair value are recognized in profit, except for instruments qualified as cash flow hedges (hedges of variable rate debt) for which changes in fair value are recognized in equity.
The fair value of interest rate derivatives is equal to the present value of the instrument’s future cash flows, discounted at the interest rate for zero-coupon bonds.
The fair value of currency derivatives is determined based on the forward exchange rate at the period-end.
Registration Document 2014 187

FINANCIAL STATEMEMENTSConsolidated Financial Statements and Notes5
N.3. Financial liabilities hedged by derivative instruments
Financial liabilities hedged by derivative instruments qualify for hedge accounting. The derivative instruments are classified as either fair value hedges or cash flow hedges.
Financial liabilities hedged by fair value hedges are measured at fair value, taking into account the effect of changes in interest rates. Changes in fair value are recognized in profit and are offset by changes in the fair value of the hedging instrument.
Financial liabilities hedged by cash flow hedges are measured at amortized cost. Changes in the fair value of the hedging instrument are accumulated in equity and are reclassified into profit in the same period or periods during which the financial liability affects profit.
N.4. Bank borrowings
Interest-bearing drawdowns on lines of credit and bank overdrafts are recognized for the amounts received, net of direct issue costs.
N.5. Other financial liabilities
Other financial liabilities are measured at amortized cost. Amortized cost is determined by the effective interest method, taking into account the costs of the issue and any issue or redemption premiums.
O. Cash and cash equivalents
Cash and cash equivalents include cash at bank and in hand, and short-term investments in money market instruments. These instruments have maturities of less than three months and are readily convertible into known amounts of cash; their exposure to changes in value is minimal.
P. Liabilities associated with assets classified as held for sale
In accordance with IFRS 5 “Non-Current Assets Held for Sale and Discontinued Operations”, this item includes all the liabilities (excluding equity) related to assets or a disposal group classified as held for sale or to a discontinued operation (see Note 2.E.7).
Q. Put Options granted by Accor
IAS 32 “Financial Instruments: disclosures and presentation” requires that the value of the financial commitment represented by put options granted by Accor to minority interests in subsidiaries, be recognized as a debt. The difference between the debt and the related minority interests in the statement of financial position, corresponding to the portion of the subsidiary’s net assets represented by the shares underlying the put, is recognized as goodwill. When the exercise price is equal to the fair value of the shares, the amount of the debt is determined based on a multiple of the EBITDA reflected in the 5-year business plan of the subsidiary concerned and is discounted.
For put options granted before January 1, 2010, changes in the debt arising from business plan adjustments are recognized in goodwill. Discounting adjustments are recognized in financial expense.
For put options granted on or after January 1, 2010, changes in the debt are treated as reclassifications in equity and therefore have no impact on profit, in accordance with IAS 27 (revised).
R. Fair value
The fair value corresponds to the price that would be received to sell an asset or paid to transfer a liability in an orderly transaction between market participants at the measurement date. In accordance with IFRS 13 “Fair value measurement”, the fair value hierarchies have the following levels:
�� Level 1: fair value measured by reference to quoted prices (unadjusted) in active markets for identical assets or liabilities;
�� Level 2: fair value measured by reference to inputs other than quoted prices included within Level 1 that are observable for the asset or liability, either directly (i.e. as prices) or indirectly (i.e. derived from prices);
�� Level 3: fair value measured by reference to inputs for the asset or liability that are not based on observable data (unobservable inputs).
Registration Document 2014188

5
FINANCIAL STATEMEMENTSConsolidated Financial Statements and Notes
S. Income statement and cash flow statement presentation
S.1. Revenue
In accordance with IAS 18 “Revenue”, revenue corresponds to the value of goods and services sold in the ordinary course of business by fully consolidated companies. It includes:
�� for directly owned and leased hotels, all revenue received from clients for accommodation, catering and other services; and
�� for managed and franchised hotels, all management and franchise fees.
The Group applies the guidance provided in IAS 18 to determine whether it acts as the principal or an agent in its contractual hotel management relationships. For the purpose of applying IAS 18, the Group is considered as acting as the principal when it has exposure to the significant risks and rewards associated with the rendering of services. In this case, the revenue and related expenses are reported separately in the income statement. When the above criterion is not met, the Group is considered as acting as an agent and only the remuneration corresponding to the agency fee is recognized in revenue.
In accordance with IAS 18 “Revenue”, revenue is measured at the fair value of the consideration received or receivable, net of all discounts and rebates, VAT, other sales taxes and fair value of customer loyalty programs.
Revenue from product sales is recognized when the product is delivered and the significant risks and rewards of ownership are transferred to the buyer.
Revenue from sales of services is recognized when the service is rendered.
Revenue from sales of loyalty programs is recognized on a straight-line basis over the life of the cards in order to reflect the timing, nature and value of the benefits provided.
When sales of products or services are covered by a customer loyalty program, the revenue invoiced to the customer is allocated between the product or the service sold and the award credits given by the third party granting the loyalty points. The consideration allocated to the award credits, which is measured by reference to the fair value of the points granted, is deferred and recognized as revenue when the customer redeems the award credits – i.e. when an award is received in exchange for converting the loyalty points.
S.2. EBITDAR
Earnings before interest, tax, depreciation, amortization and rental expense and share of profit of associates after tax (EBITDAR) correspond to revenue less operating expense.
EBITDAR is used as a key management indicator.
It is also used to calculate the flow-through ratio and the reactivity ratio. The flow-through ratio, which is used when revenue goes up, corresponds to change in like-for-like EBITDAR/change in like-for-like revenue. The reactivity ratio, used when revenue goes down, is defined as 1 – (change in like-for-like EBITDAR/change in like-for-like revenue).
S.3. Rental expense and Depreciation, amortization and provision expense
Rental expense and depreciation, amortization and provision expense reflect the operating costs of holding leased and owned assets. For this reason, an additional sub-total has been included in the income statement. Under this presentation:
1. EBITDA corresponds to gross profit after the operating costs of holding leased assets;
2. EBIT corresponds to gross operating profit after the operating costs of holding both leased and owned assets. This indicator is also used as the benchmark for determining senior management and other executive compensation, as it reflects the economic performance of each business.
These two indicators are used regularly by the Group to analyze the impact of the operating costs of holding assets on the consolidated financial statements.
S.4. Operating profit before tax and non-recurring items
Operating profit before tax and non-recurring items corresponds to the results of operations of the Group’s businesses less the related financing cost. Net financial expense and the share of profit of associates after tax represent an integral part of consolidated operating profit before tax and non-recurring items to the extent that they contribute to the performance indicators used by the Group.
S.5. Restructuring costs
Restructuring costs correspond to all the costs incurred in connection with restructuring operations.
S.6. Impairment losses
Impairment losses correspond to all the losses and provisions recorded in accordance with IAS 36 “Impairment of Assets” including impairments of investments in associates.
S.7. Gains and losses on management of hotel properties
Gains and losses on management of hotel properties arise from the disposals of hotel assets.
S.8. Gains and losses on management of other assets
This item corresponds to gains and losses on management of fixed assets other than hotels and movements in provisions, as well as other gains and losses on non-recurring transactions. The concerned transactions are not directly related to the management of continuing operations.
S.9. Operating profit before tax
Operating profit before tax corresponds to operating profit after income and expenses that are unusual in terms of their amount and frequency that do not relate directly to the Group’s ordinary activities.
Registration Document 2014 189

FINANCIAL STATEMEMENTSConsolidated Financial Statements and Notes5
S.10. Profit or loss from discontinued operations
A discontinued operation is a component of Accor that has been disposed of or is classified as held for sale and:
�� represents a separate major line of business or geographical area of operations;
�� is part of a single coordinated plan to dispose of a separate major line of business or geographical area of operations or;
�� is a subsidiary acquired exclusively with a view to resale.
Profit or loss from discontinued operations corresponds to:
�� the profit or loss net of tax of the discontinued operations carried out until the date of transfer or until the closing date if the discontinued operation is not sold at this date;
�� the gain or loss net of tax recognized on the disposal of the discontinued operations if the discontinued operation has been sold before the closing date.
S.11. Cash flow statement
The cash flow statement is presented on the same basis as the management reporting schedules used internally to manage the business. It shows cash flows from operating, investing and financing activities.
Cash flows from operating activities include:
�� funds from operations, before non-recurring items and after adjustment for changes in deferred taxes and gains and losses on disposals of assets;
�� cash received and paid on non-recurring transactions;
�� changes in working capital.
Cash flows from investing activities comprise:
�� renovation and maintenance expenditure to maintain in a good state of repair operating assets held at January 1 of each year;
�� development expenditure, including the fixed assets and working capital of newly consolidated subsidiaries and additions to fixed assets of existing subsidiaries;
�� development expenditure on non-current assets classified as held for sale;
�� proceeds from disposals of assets.
Cash flows from financing activities include:
�� changes in equity;
�� changes in debt;
�� dividends.
T. Earnings per share
The methods used to calculate basic and diluted earnings per share are in accordance with IAS 33 “Earnings Per Share”.
The interest paid in relation to securities recognized as equity (see Note 2 M.3) is deducted from the earnings amount used to calculate earnings per share.
U. Other information
Current assets and liabilities are assets and liabilities that the Group expects to recover or settle:
�� in the normal course of business; or
�� within twelve months of the period-end.
The consolidated financial statements at December 31, 2014 have been prepared under the responsibility of Accor’s Chairman and Chief Executive Officer. They were approved by the Board of Directors of February 17, 2015.
NOTE 3 SIGNIFICANT EVENTS AND CHANGES IN SCOPE OF CONSOLIDATION
A. Strategy
On November 27, 2013, led by newly appointed Chairman and Chief Executive Officer Sébastien Bazin, Accor decided to redefine its business model around two strategic businesses:
�� Hotel operator and brand franchiser HotelServices, with a business model focused on generating revenue from fees and optimizing the income statement;
�� Hotel owner and first investor in Europe HotelInvest, with a business model aimed at improving the return on assets and optimizing the statement of financial position.
The new structure reaffirms the strategic nature of Accor’s two traditional areas of expertise – asset management and owner services – by separating the relevant functions, responsibilities and objectives to build a more efficient business model. The hotels owned by HotelInvest (owned or leased hotels) are operated by HotelServices under management contracts.
HotelServices’ main challenges are to:
�� implement a business model based on generating fees, with a portfolio of services adapted to owners’ needs, focusing on contract profitability and optimizing cost management to enhance the financial performance of Accor and its partners;
�� optimize sales and marketing strategies, with projects in such areas as customer relationship management, loyalty programs and, more generally, digital services to enable more agile revenue management and more effective use of distribution channels, including online travel agencies (see Note A.1 below);
�� strengthen the brands, which have now been reorganized into three segments: Luxury & Upscale, which focuses on service excellence and a development strategy that targets high-profile hotels in strategic cities; Midscale, where a particular emphasis is placed on innovation to more effectively differentiate the brands; and Economy, where the aim is to capitalize on the successful creation of the ibis megabrand to accelerate the growth, consolidate market leadership and capitalize on economies of scale.
Registration Document 2014190

5
FINANCIAL STATEMEMENTSConsolidated Financial Statements and Notes
HotelInvest’s main challenges are to:
�� strengthen its position as the leading hotel investor in the economy and midscale segments in Europe, with strategic positions in emerging markets;
�� optimize cash flow generation and reduce earnings volatility, particularly by reducing the number of lease contracts. To achieve this objective, certain hotels could be subject to restructuring and lease contracts will not be systematically renewed when they expire. In addition, hotel development will no longer take place via lease contracts, except for contracts on which Accor has already made a commitment;
�� manage and rationalize the asset portfolio, with a focus on value creation through the strategic allocation of capital expenditure;
�� support the Group’s growth strategy, by holding a selective portfolio of profitable hotel property assets.
With this new strategy, Accor has a solid base for maximizing operational performance and creating value for shareholders and all other stakeholders.
Deployment of this strategy during 2014 led to:
�� changes in the presentation of segment information in the consolidated financial statements (see Note 39);
�� reallocation of goodwill to the two businesses, based on discounted cash flow projections (see Note 2.E.6).
A.1. Digital Transformation
On October 30, 2014, Accor announced a five-year, €225 million investment plan. The aim of this strategic plan is to rethink and incorporate digital technology throughout the customer journey, improve the services on offer for investor partners and consolidate the Group’s distribution market share. The plan includes eight programs focused on clients (four programs), partners, employees, IT infrastructure and data management. The €225 million envelope earmarked for the 2014-2018 period will be allocated to capital expenditure for 55% and to operating expenditure for the remaining 45%.
In line with its digital transformation objectives, in 2014 Accor also acquired French start-up Wipolo, which has developed a cutting-edge mobile travel app, for an acquisition price of €1.9 million.
A.2. Strategic Alliance with Huazhu
On December 14, 2014, Accor and Nasdaq-listed Huazhu Hotels Group (also known as China Lodging) announced the signature of a strategic alliance in China. As part of the arrangement, Accor’s Economy and Midscale hotels in China will be sold to Huazhu, which will hold an exclusive master franchise agreement for the ibis, ibis Styles, Mercure, Novotel and Grand Mercure brands. Huazhu will also become a minority shareholder in Accor’s Luxury and Upscale business in China, with a 10% stake.
In exchange, Accor will receive a 10% interest in Huazhu and a seat on the Company’s Board of Directors. This major alliance will enable the two groups to accelerate their development, with a medium-term objective of 350 to 400 new hotels under Accor brands. The agreement will also give the members of both partners’ loyalty programs access to a combined network of 5,600 hotels worldwide.
The transaction is scheduled for completion in the second half of 2015. As a result, the 12 hotels earmarked for sale were reclassified as “Assets held for sale” at December 31, 2014.
B. HotelInvest
In light of their specific characteristics, all acquisitions of asset portfolios completed during the period have been classified as acquisitions of assets and not as business combinations (see Note 2.B.5). For Accor, all of these the transactions consisted of becoming the owner of hotels that it previously operated under leases.
B.1 Acquisition of an 86-hotel portfolio from Moor Park
On May 27, 2014, Accor announced the acquisition by HotelInvest of a portfolio of 86 hotels (11,286 rooms) – 67 in Germany and 19 in the Netherlands – that had been operated by Accor since 2007 under variable leases under the ibis, ibis budget, Mercure and Novotel brands. The hotels were acquired at a total cost of €715 million, of which €657 million for the repayment of debt. The vendors are two funds, Moor Park Fund I and II. The transaction was completed on June 30, 2014.
The acquisition price has been allocated to the 86 hotels and other assets and liabilities based on their fair values determined by the rental yield capitalization method applied to each hotel separately.
They include 27 hotels that have been reclassified as “Assets held for sale”.
B.2 Acquisition of an 11-hotel portfolio from Axa Real Estate
Accor also announced on May 27, 2014 the acquisition by HotelInvest of a portfolio of 11 Swiss hotels (1,592 rooms) that had been operated by Accor since 2008 under variable leases under the ibis, ibis budget, Novotel and MGallery brands. The hotels were acquired at a total cost of €176 million (CHF 219 million), of which €108 million for the repayment of debt. The transaction was completed on June 27, 2014.
The acquisition price has been allocated to the 11 hotels and other assets and liabilities based on their fair values determined by the rental yield capitalization method applied to each hotel separately.
They include one hotel that has been reclassified as “Assets held for sale” (see Note 46).
Registration Document 2014 191

FINANCIAL STATEMEMENTSConsolidated Financial Statements and Notes5
B.3. Acquisition of a 13-hotel portfolio from Tritax
On August 21, 2014, Accor’s HotelInvest division signed an agreement for the acquisition of 13 hotels (1,194 rooms) in the United Kingdom for €89 million (GBP71 million). The hotels concerned had been operated by Accor since 2001 under variable leases under the ibis and ibis budget brands. The transaction was completed on December 22, 2014.
The acquisition price has been allocated to the 13 hotels and other assets and liabilities based on their fair values as determined by an independent expert.
They include eight hotels that the Group expects to sell in the first half of 2015, which has been reclassified as “Assets held for sale”.The forecast loss on the sale, in the amount of €13 million, is covered by a provision recorded under “Gains and losses on the management of hotel properties”.
B.4. Acquisition of an Interest in Mama Shelter
On November 13, 2014, Accor acquired a 36.6% stake in hotel company Mama Shelter, via the acquisition of a 20.2% direct interest and a 16.4% indirect interest, for a total of €29 million. The associate is accounted for via the equity method in the Group’s accounts for the year ended December 31, 2014 and recorded at cost in accordance with paragraph 10 of IAS 28. The acquisition of an interest in Mama Shelter will enable Accor to expand its offering to include a modern “lifestyle” brand that has a particularly well-performing and attractive food services component. The objective is to open around 20 new Mama Shelter hotels over the next five years.
Accor has a call option on all outstanding Mama Shelter shares, exercisable in 2020. If Accor does not exercise this option, its partners will also have call options on all Mama Shelter shares, including those held by Accor. The options are not valued in Accor’s financial statements.
B.5 Transfer to Orbis of the management of Accor’s Central European operations
On October 21, 2014, Accor offered to transfer management of its Central European operations to Orbis.
Under the terms of the agreement signed on January 7, 2015, Orbis takes over all of Accor’s operations in the region, including in Poland, Hungary, the Czech Republic, Slovakia, Romania, Bulgaria and Macedonia. Its task is to develop all of Accor’s hotel banners in the region through a master franchise agreement for all of the Group’s brands. Orbis acquired Accor’s operating subsidiaries in the abovementioned countries for a total of €142 million, thereby taking control of a network of 38 existing hotels and 8 hotels currently in the pipeline.
Orbis is 52.7%-owned by Accor and is fully consolidated.
B.6 Accor’s interest in Reef Casino in Australia
In February 2014, Accor announced the sale of its interest in Reef Casino in Australia for AU$ 85 million (€55.5 million). The corresponding investments in associates – including goodwill – had therefore been reclassified as “Assets held for sale” at June 30, 2014, for a total of €36 million. The transaction was subject to administrative approvals, which were not obtained. The corresponding investments in associates – as well as the goodwill allocated to those investments – were therefore no longer classified as “Assets held for sale” in the December 31, 2014 accounts.
B.7. Sale of Accor’s stake in Onboard train services
In 2010 and 2012, Accor sold Compagnie des Wagons Lits’ onboard rail catering businesses in France, Austria and Portugal and part of the Italian business. The Italian Onboard Day Train Services business remained classified under “Assets held for sale” at December 31, 2014 (see Note 33) in view of the ongoing liquidation of the Company. The remaining amounts involved are not material.
B.8. Other real estate transactions
To meet its strategic goals, HotelInvest is rationalizing the hotel portfolio through restructuring and disposal programs.
The main real estate transactions carried out by the Group at December 31, 2014 are as follows:
2014Number of
transactionsSale price
Debt impact
Adjusted debt impact
“Sale & Variable Leaseback” transactions 2 8 (3) 2
“Sale & Management-back” transactions 3 35 30 30
“Sale & Franchise-back” transactions and outright sales 43 83 82 105
TOTAL 48 126 109 137
“Sale & Variable Lease Back” transactions consisted of selling the hotel property while continuing to manage the business, under a variable-rent lease based on a percentage of revenue without any guaranteed minimum. Following adoption of the HotelInvest strategy
(see Note 3 A), the practice of leasing hotels has been discontinued, with only the transactions in progress being finalized. In addition, negotiations are conducted with hotel owners to convert fixed-rent leases into variable rent leases.
Registration Document 2014192

5
FINANCIAL STATEMEMENTSConsolidated Financial Statements and Notes
At the end of December 2014, Accor paid €10 million to the consortium of French institutional investors in the OPCI property investment fund managed by ATREAM under the performance bond issued in connection with a 2009 “Sale & Variable Lease Back” transaction. This amount was provided for in full in the 2009 consolidated financial statements and the payment had no net impact on 2014 results.
Accor also received additional consideration on the sale of the Paris La Défense Pullman (profit impact: €7 million; net debt impact: €7 million).
“Sale and Management Back” transactions consist of selling the hotel properties while continuing to manage the business, retaining a minority interest depending on the circumstances.
At December 31, 2014, the main transactions concerned the sale of the Venice MGallery in Italy (profit impact: €7 million; net debt impact: €12 million), additional consideration received on the sale of the New York Novotel in the United States (profit impact: €6 million; net debt impact: €6 million) and the sale of the Edinburgh Centre St Andrew Square ibis Styles in the United Kingdom (profit impact: €0; net debt impact: €16 million).
“Sale & Franchise Back” transactions and outright sales consist of selling hotels, through outright asset sales, lease terminations at or before the expiry date and sale & franchise-back transactions.
The main ‘’Sale and Franchise Back’’ transactions carried out in 2014 were as follows:
�� individual sales of five ibis hotels in China (profit impact: €3 million; net debt impact: €15 million);
�� individual sales of seven ibis hotels in France (profit impact: €7 million; net debt impact: €12 million);
�� sale of the interest in the New York Sofitel (profit impact within the share of profit of associates (see Note 12): €17 million; net debt impact: €17 million);
�� sale of the Montreal West Novotel (profit impact: €(1) million; net debt impact: €6 million).
The main real estate transactions carried out by the Group in 2014 were as follows:
�� the separate acquisitions of 4 ibis hotels in the United Kingdom, Germany and France for a total of €58 million;
�� the acquisition of a portfolio of 2 ibis and 1 Mercure hotels in France (Graff) for a total of €40 million.
C. Transactions carried out in prior periods
Accor sells its 19.4% stake in TAHL in 2013
In November 2013, Accor sold its 19.4% stake in the Tourism Asset Holdings Ltd. (TAHL), Australia’s largest hotel owning Company, to the Abu Dhabi Investment Authority (ADIA) for a value of AU$66 million (€46 million), and a repayment of AU$76 million (€53 million) loans.
At the end of December 2013, the impact of this transaction amounts to €2 million on net result and the transaction enabled Accor to reduce adjusted net debt by a cumulative €101 million.
TAHL owned 31 hotels in Australia (4,097 rooms), all of which are operated by Accor through lease or management contracts under the ibis, ibis budget, ibis Styles, Mercure, Novotel and Pullman brands.
Other real estate transactions in 2013
A total of 53 hotels were sold or restructured in 2013, leading to a €408 million reduction in adjusted net debt and a €331 million increase in cash.
2013Number of
transactionsSale price
Debt impact
Adjusted debt impact
“Sale & Variable Leaseback” transactions 9 15 10 21
“Sale & Management-back” transactions 12 160 141 166
“Sale & Franchise-back” transactions and outright sales 32 152 180 221
TOTAL 53 327 331 408
Registration Document 2014 193

FINANCIAL STATEMEMENTSConsolidated Financial Statements and Notes5
D. Organic growth: Hotel portfolio and pipeline
The Group is pursuing its expansion plan in line with its strategy. During 2014, the Group added 208 hotels (29,556 rooms) to its portfolio through acquisitions and organic growth. In addition, 67 hotels (8,610 rooms) were closed during the period.
Hotel portfolio by segment and type of management at December 31, 2014
December 31, 2014
Managed FranchisedHotelInvest
(owned and leased) Total
Nb Hotels
Nb Rooms
Nb Hotels
Nb Rooms
Nb Hotels
Nb Rooms
Nb Hotels
Nb Rooms
Luxury and Upscale 204 49,964 78 9,305 59 11,812 341 71,081
Midscale 363 66,335 441 45,248 402 66,482 1,206 178,065
Economy 263 42,330 986 79,026 888 107,264 2,137 228,620
Other 27 3,542 1 78 5 910 33 4,530
TOTAL 857 162,171 1,506 133,657 1,354 186,468 3,717 482,296
Total (in %) 23.1% 33.6% 40.5% 27.7% 36.4% 38.7% 100.0% 100.0%
Hotel portfolio by region and type of management at December 31, 2014
December 31, 2014
Managed FranchisedHotelInvest
(owned and leased) Total
Nb Hotels
Nb Rooms
Nb Hotels
Nb Rooms
Nb Hotels
Nb Rooms
Nb Hotels
Nb Rooms
France 104 12,923 948 70,162 510 57,833 1,562 140,918
Europe (excl. France/Mediterranean) 104 14,685 265 29,317 533 80,415 902 124,417
Mediterranean, Middle East and Africa 120 23,921 85 8,964 147 20,097 352 52,982
Asia Pacific 403 89,205 150 18,247 68 10,556 621 118,008
Americas 126 21,437 58 6,967 96 17,567 280 45,971
TOTAL 857 162,171 1,506 133,657 1,354 186,468 3,717 482,296
Total (in %) 23.1% 33.6% 40.5% 27.7% 36.4% 38.7% 100.0% 100.0%
Hotel portfolio by region and segment at December 31, 2014
(in number of hotels) France
Europe (excl. France/
Mediterranean)
Mediterranean, Middle East,
Africa Asia Pacific Americas Total
Luxury and Upscale 44 40 55 178 24 341
Midscale 387 390 130 193 106 1,206
Economy 1,130 466 164 228 149 2,137
Other 1 6 3 22 1 33
TOTAL 1,562 902 352 621 280 3,717
Total (in %) 42.0% 24.3% 9.5% 16.7% 7.5% 100.0%
Registration Document 2014194

5
FINANCIAL STATEMEMENTSConsolidated Financial Statements and Notes
(in number of rooms) France
Europe (excl. France/
Mediterranean)
Mediterranean, Middle East,
Africa Asia Pacific Americas Total
Luxury and Upscale 6,635 9,017 11,768 38,007 5,654 71,081
Midscale 43,259 57,722 20,324 40,373 16,387 178,065
Economy 90,973 56,721 20,514 36,867 23,545 228,620
Other 51 957 376 2,761 385 4,530
TOTAL 140,918 124,417 52,982 118,008 45,971 482,296
Total (in %) 29.2% 25.8% 11.0% 24.5% 9.5% 100.0%
Hotel pipeline at December 31, 2014
The number of new rooms in the pipeline represented by ownership at December 31, 2014 and scheduled to be completed in the next four years is as follows:
(in number of rooms) Managed FranchisedHotelInvest
(owned and leased) Total
TOTAL 110,790 30,369 15,029 156,188
E. Colony Capital/Eurazeo
Colony Capital acquired an initial stake in the Accor Group in March 2005 by investing €1 billion in Accor equity notes and convertible bonds that were redeemed for/converted into shares in 2007. In exchange for this investment, Colony was given two seats on the Accor Board of Directors. In May 2008, Colony Capital and investment group Eurazeo announced a five-year shareholders’ agreement under which they would increase their combined stake in the Group’s capital. The agreement was followed by an increase in Eurazeo’s interest in Accor and led to Eurazeo being given a seat on the Accor Board of Directors. In 2009, the concert group represented by Colony Capital and Eurazeo purchased new Accor shares and Eurazeo was given an additional seat on the Accor Board of Directors, raising from three to four the number of directors representing Colony and Eurazeo.
Colony Capital and Eurazeo together held 48,673,442 shares at December 31, 2014, representing 20.99% of the capital and 30.75% of the voting rights. At that date, they no longer had any commitment to hold a minimum number of Accor shares.
F. Bond Issues
During the period, Accor placed the following bond issues:
�� February 5, 2014: €750 million 2.625% 7-year bond issue due February 5, 2021, augmenting by €150 million 1.728% 7 year tap issue on September 30, 2014;
�� June 27, 2014: CHF 150 million 1.75% 8-year bond issue due June 27, 2022;
�� December 18, 2014: €60 million 1.679% 7-year and 2 month bond issue due February 18, 2022.
On February 4, 2014, €402.25 million worth of 7.50% five-year bonds matured and were redeemed. The bonds formed part of a €600 million issue carried out on February 4, 2009, of which €197.75 million was repaid early in 2010 and 2011.
Bond issues carried out and redeemed in first-half 2013 were as follows:
�� March 21, 2013: €600 million 2.50% 6-year bond issue due March 21, 2019;
�� May 5, 2013: redemption of €393.7 million worth of 6.50% four-year bonds. The bonds formed part of a €600 million issue carried out on May 5, 2009, of which €206.3 million was repaid early in 2010 and 2011;
�� June 19, 2012: €600 million 2.875% 5-year bond issue due June 19, 2017, augmenting by €100 million 2.875% 5 year tap issue on September 28, 2012;
�� August 24, 2009: €250 million 6.039% 8-year and 3 month bond issue due November 6, 2017
G. Perpetual subordinated notes issue
On June 30, 2014, Accor issued €900 million worth of perpetual subordinated notes. The interest rate on the notes is set at 4.125% up until June 30, 2020 and will be re-set every five years thereafter, with a 25-bps step-up in June 2020 and a 275-bps step-up in June 2040.
The notes have no fixed maturity. They are repayable at Accor’s option on June 30, 2020, June 30, 2025 and on each anniversary of the issue date thereafter. Interest is payable on the notes only in those periods for which a dividend is paid to shareholders.
Registration Document 2014 195

FINANCIAL STATEMEMENTSConsolidated Financial Statements and Notes5
Due to their characteristics and in accordance with IAS 32 (see Note 2.M.3), the notes were recorded in equity upon receipt of the issue proceeds for €887 million (net of transaction costs). The potential interest would also be recorded in equity.
H. Signature of a syndicated line of credit
In June 2014, Accor signed a €1.8 billion syndicated line of credit that replaced the €1.5 billion syndicated credit facility signed in May 2011 and scheduled to expire in May 2016.
The five-year facility will lengthen the average maturity of Accor’s financing.
I. Voluntary redundancy plans
In 2013, Accor launched two voluntary redundancy plans at the Group’s Paris headquarters.
The first plan concerned 165 persons, leading to the recognition of a total expense of €47 million in the 2013 financial statements. Plan implementation was completed in 2014.
Besides, Following Accor’s announcement of its new strategic roadmap on November 27, 2013, the Group stated at the end of 2013 that a new voluntary redundancy plan would be launched to address the human resources implications of the resulting organizational changes. A total expense of €22 million was recorded in the 2013 financial statements for this plan.
The plan is currently in progress, and the majority of separations took place during the second half of 2014; the residual provision at December 31, 2014 is €7 million.
In 2014, the net cost recognized in respect of these plans represented less than €(1) million.
NOTE 4 CONSOLIDATED REVENUE BY STRATEGIC BUSINESS AND BY REGION
(in millions of euros) France
Europe (excl. France/
Mediterranean)
Mediterranean, Middle East,
AfricaAsia
Pacific AmericasWorldwide
Structures (1) 20142013
Adjusted
HOTELSERVICES 341 304 120 322 113 48 1,248 1,254
HOTELINVEST 1,607 2,107 408 272 400 - 4,794 4,798
CORPORATE & INTERCOS (211) (240) (45) (23) (44) (25) (588) (627)
TOTAL 2014 1,737 2,171 483 571 469 23 5,454
TOTAL 2013 ADJUSTED 1,799 2,070 458 598 473 27 5,425
(1) “Worldwide Structures” corresponds to revenue (royalties) that is not specific to a single geographic region.
Consolidated revenue at December, 31, 2014, totalled 5,454 million, compared with 5,425 million at December, 31, 2013.
The period-on-period decrease breaks down as follows:
�� Like-for-like growth +209 m€ +3.8%
�� Business expansion (owned and leased hotels only) +44 m€ +0.8%
�� Currency effects (62) m€ (1.1)%
�� Disposals (162) m€ (3.0)%
DECREASE IN 2014 REVENUE +29 m€ +0.5%
Registration Document 2014196
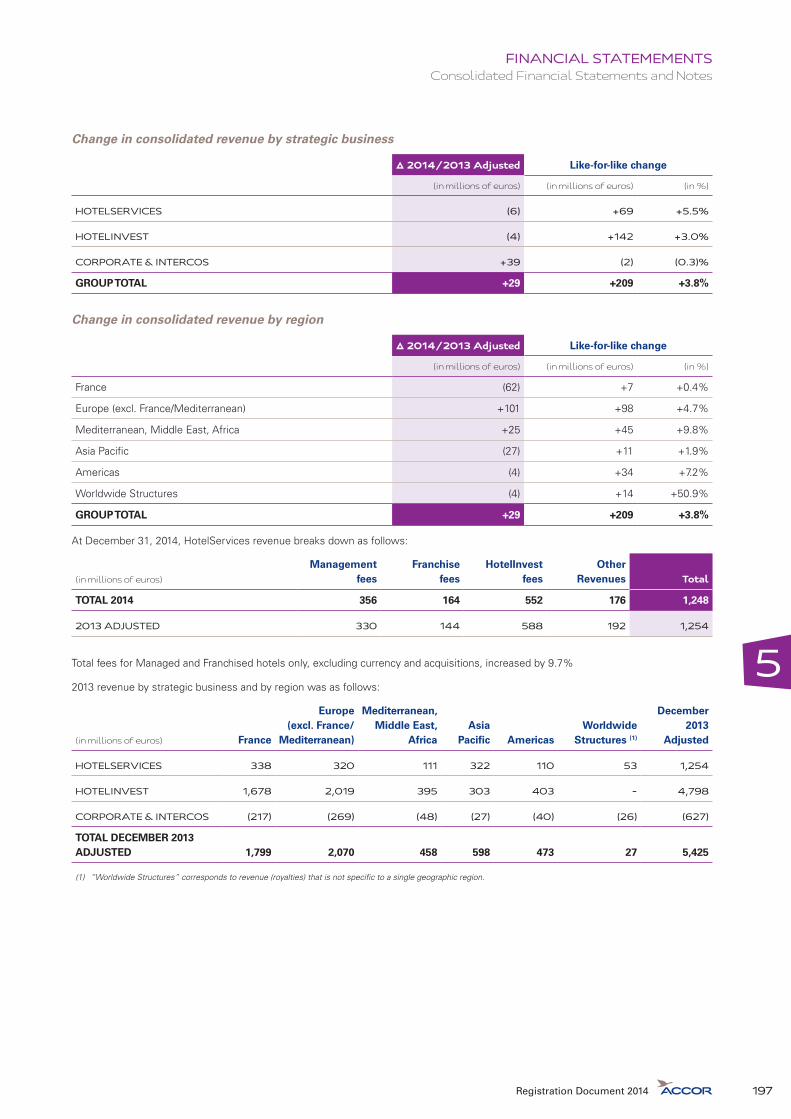
5
FINANCIAL STATEMEMENTSConsolidated Financial Statements and Notes
Change in consolidated revenue by strategic business
∆ 2014/2013 Adjusted Like-for-like change
(in millions of euros) (in millions of euros) (in %)
HOTELSERVICES (6) +69 +5.5%
HOTELINVEST (4) +142 +3.0%
CORPORATE & INTERCOS +39 (2) (0.3)%
GROUP TOTAL +29 +209 +3.8%
Change in consolidated revenue by region
∆ 2014/2013 Adjusted Like-for-like change
(in millions of euros) (in millions of euros) (in %)
France (62) +7 +0.4%
Europe (excl. France/Mediterranean) +101 +98 +4.7%
Mediterranean, Middle East, Africa +25 +45 +9.8%
Asia Pacific (27) +11 +1.9%
Americas (4) +34 +7.2%
Worldwide Structures (4) +14 +50.9%
GROUP TOTAL +29 +209 +3.8%
At December 31, 2014, HotelServices revenue breaks down as follows:
(in millions of euros)
Management fees
Franchise fees
HotelInvest fees
Other Revenues Total
TOTAL 2014 356 164 552 176 1,248
2013 ADJUSTED 330 144 588 192 1,254
Total fees for Managed and Franchised hotels only, excluding currency and acquisitions, increased by 9.7%
2013 revenue by strategic business and by region was as follows:
(in millions of euros) France
Europe (excl. France/
Mediterranean)
Mediterranean, Middle East,
AfricaAsia
Pacific AmericasWorldwide
Structures (1)
December 2013
Adjusted
HOTELSERVICES 338 320 111 322 110 53 1,254
HOTELINVEST 1,678 2,019 395 303 403 - 4,798
CORPORATE & INTERCOS (217) (269) (48) (27) (40) (26) (627)
TOTAL DECEMBER 2013 ADJUSTED 1,799 2,070 458 598 473 27 5,425
(1) “Worldwide Structures” corresponds to revenue (royalties) that is not specific to a single geographic region.
Registration Document 2014 197

FINANCIAL STATEMEMENTSConsolidated Financial Statements and Notes5
NOTE 5 OPERATING EXPENSE
(in millions of euros) 2013 Adjusted 2014
Cost of goods sold (1) (382) (347)
Employee benefits expense (2) (1,963) (1,940)
Energy, maintenance and repairs (289) (279)
Taxes, insurance and service charges (co-owned properties) (193) (194)
Other operating expense (3) (867) (922)
TOTAL OPERATING EXPENSE (3,694) (3,682)
(1) The cost of goods sold includes food and beverage purchases, laundry costs and the cost of telephone calls billed to clients.
(2) The Ratio employee benefits expense/Full-time equivalent (FTE) is presented as follows:
Full-time equivalent 2013 Adjusted 2014
Full-time equivalent* 48,710 48,270
Ratio employee benefits expense/FTE (in thousands of euros) (40) (40)
* Full-time equivalent employees are based on the ratio between the number of hours worked during the period and the total working legal hours for the period. There is no employee number for associates. At December 31, 2014, employee benefits expense includes €9.7 million related to stock option plans and performance share plans (see Note 26).
(3) Other operating expense consists mainly of marketing, advertising, promotional, selling and information systems costs. The total also includes various fee payments.
NOTE 6 EBITDAR BY STRATEGIC BUSINESS AND REGION
(in millions of euros) France
Europe (excl. France/
Mediterranean)
Mediterranean, Middle East,
AfricaAsia
Pacific AmericasWorldwide
Structures (1) 20142013
Adjusted
HOTELSERVICES 127 116 39 76 35 42 435 434
HOTELINVEST 397 686 95 78 106 39 1,401 1,354
CORPORATE & INTERCOS - - - - - (64) (64) (57)
TOTAL 2014 524 802 134 154 141 17 1,772
TOTAL 2013 ADJUSTED 537 743 104 157 152 38 1,731
(1) “Worldwide Structures” corresponds to revenue (royalties) and costs that are not specific to a single geographic region.
Consolidated EBITDAR at December, 31, 2014, totalled €1,772 million compared with €1,731 million at December, 31, 2013.
The period-on-period increase breaks down as follows:
�� Like-for-like growth +66 m€ +3.8%
�� Business expansion (owned and leased hotels only) +9 m€ +0.5%
�� Currency effects (13) m€ (0.7)%
�� Disposals (21) m€ (1.2)%
INCREASE IN 2014 EBITDAR +41 m€ +2.4%
Registration Document 2014198

5
FINANCIAL STATEMEMENTSConsolidated Financial Statements and Notes
Change in EBITDAR by Strategic Business
∆ 2014/2013 Adjusted Like-for-like change
(in millions of euros) (in millions of euros) (in %)
HOTELSERVICES +1 +24 +5.7%
HOTELINVEST +47 +49 +3.6%
CORPORATE & INTERCOS (7) (7) (13.1)%
GROUP TOTAL +41 +66 +3.8%
Change in EBITDAR by region
∆ 2014/2013 Adjusted Like-for-like change
(in millions of euros) (in millions of euros) (in %)
France (13) (5) (1.0)%
Europe (excl. France/Mediterranean) +59 +50 +6.7%
Mediterranean, Middle East, Africa +30 +36 +34.8%
Asia Pacific (3) +3 +1.8%
Americas (11) (2) (1.1)%
Worldwide Structures (21) (16) (42.5)%
GROUP TOTAL +41 +66 +3.8%
2013 EBITDAR by strategic business and by region was as follows:
(in millions of euros) France
Europe (excl. France/
Mediterranean)
Mediterranean, Middle East,
AfricaAsia
Pacific AmericasWorldwide
Structures (1)
2013 Adjusted
HOTELSERVICES 122 122 25 71 37 57 434
HOTELINVEST 415 621 79 86 115 38 1,354
CORPORATE & INTERCOS - - - - - (57) (57)
TOTAL 2013 ADJUSTED 537 743 104 157 152 38 1,731
(1) “Worldwide Structures” corresponds to revenue (royalties) and costs that are not specific to a single geographic region.
NOTE 7 RENTAL EXPENSE
Rental expense amounted to €849 million at December, 31, 2014 compared €885 million at December, 31, 2013.
In accordance with the policy described in Note 2.E.4, the expense reported on this line only concerns operating leases. Finance leases are recognized in the statement of financial position as an asset and a liability. The amount of the liability at December, 31, 2014 is €72 million (see Note 30.1).
Rental expense is recognized on a straight-line basis over the lease term, even if payments are not made on that basis. Most leases have been signed for periods exceeding the traditional nine-year term of commercial leases in France, primarily to protect Accor against the absence of commercial property rights in certain countries.
None of the leases contains any clauses requiring advance payment of rentals in the case of a ratings downgrade or other adverse events affecting Accor, and there are no cross-default clauses or covenants.
The €849 million in rental expense corresponds to 961 leased hotels, including less than 2% with a purchase option. Where applicable, the option price corresponds to either a pre-agreed percentage of the owner’s original investment or the property’s market value when the option is exercised. The options are generally exercisable after 10 or 12 years. Certain contracts allow for the purchase of the property at the appraised value at the end of the lease.
Registration Document 2014 199

FINANCIAL STATEMEMENTSConsolidated Financial Statements and Notes5
A. Rental expense by Strategic Business
Rental expense can be analyzed as follows by Strategic Business:
(in millions of euros) 2013 Adjusted 2014
HOTELSERVICES (22) (24)
HOTELINVEST (868) (828)
CORPORATE & INTERCOS 5 3
TOTAL (885) (849)
B. Rental expense by type of contract
Rental expense breaks down as follows by type of contract:
(in millions of euros)
Number of hotels (1) 2014 Rental
Fixed rental expense
Variable rental expense
Fixed rent with purchase option 9 (13) (13) -
Fixed rent without purchase option 247 (221) (221) -
Fixed rent with a variable portion (2) 62 (74) (63) (11)
Land rent - (10) (7) (3)
Office rental expenses (Hotels business) - (42) (32) (10)
Fees on intragroup rent guarantees on Hotels business - (13) (12) (1)
HOTEL FIXED RENTAL EXPENSE 318 (373) (348) (25)
Variable rent with a minimum (3) 92 (84) (71) (13)
Variable rent with a minimum and cap (4) 15 (27) (12) (15)
Variable rent without a minimum (5) 536 (333) - (333)
Rents of refinanced hotels (6) - (35) (7) (28)
HOTEL VARIABLE RENTAL EXPENSE 643 (479) (90) (389)
TOTAL HOTEL RENTAL EXPENSE 961 (852) (438) (414)
Rental expense not related to hotels - (10) (22) 12
Internal lease guarantee fees - 13 12 1
TOTAL RENTAL EXPENSE 961 (849) (448) (401)
(1) Leased hotels operated under the Adagio brand (11 units) and Adagio Access brand (four units) are not included in the list because the related rental expense is included directly in the Group’s share of the profits of associates. Rental expense by brand and type of contract at December 31, 2014 is presented as follows:
Registration Document 2014200
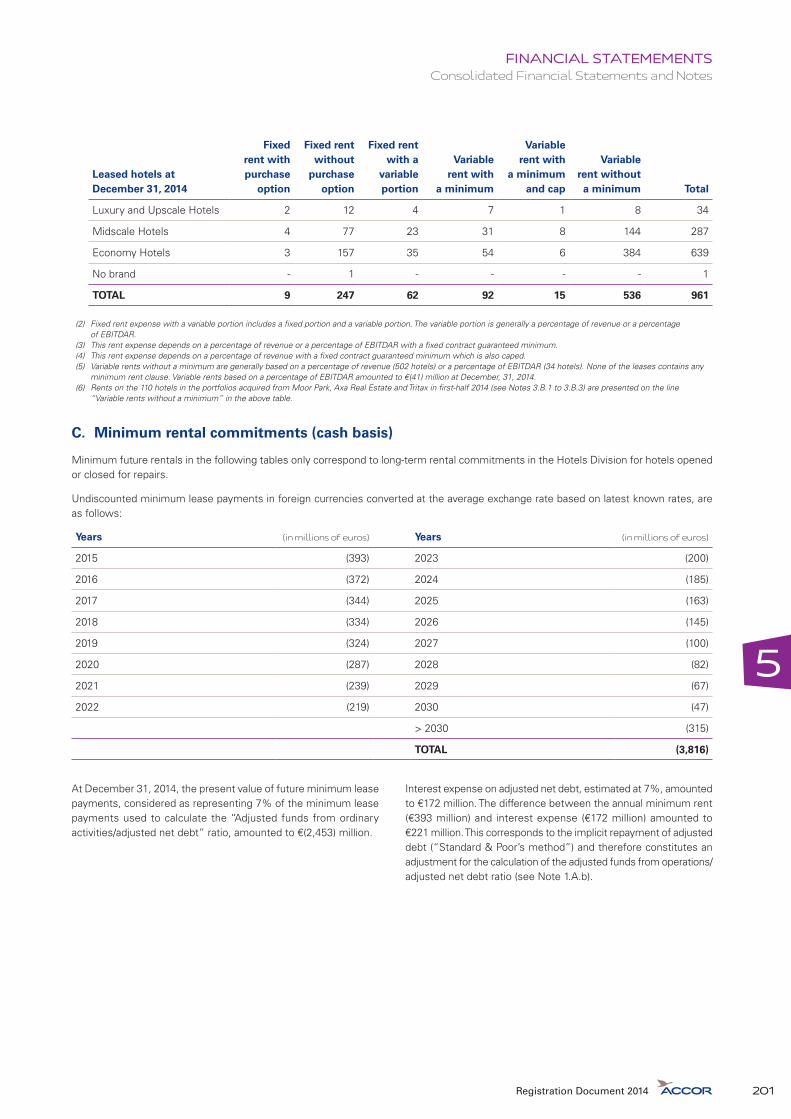
5
FINANCIAL STATEMEMENTSConsolidated Financial Statements and Notes
Leased hotels at December 31, 2014
Fixed rent with purchase
option
Fixed rent without
purchase option
Fixed rent with a
variable portion
Variable rent with
a minimum
Variable rent with
a minimum and cap
Variable rent without a minimum Total
Luxury and Upscale Hotels 2 12 4 7 1 8 34
Midscale Hotels 4 77 23 31 8 144 287
Economy Hotels 3 157 35 54 6 384 639
No brand - 1 - - - - 1
TOTAL 9 247 62 92 15 536 961
(2) Fixed rent expense with a variable portion includes a fixed portion and a variable portion. The variable portion is generally a percentage of revenue or a percentage of EBITDAR.
(3) This rent expense depends on a percentage of revenue or a percentage of EBITDAR with a fixed contract guaranteed minimum.(4) This rent expense depends on a percentage of revenue with a fixed contract guaranteed minimum which is also caped.(5) Variable rents without a minimum are generally based on a percentage of revenue (502 hotels) or a percentage of EBITDAR (34 hotels). None of the leases contains any
minimum rent clause. Variable rents based on a percentage of EBITDAR amounted to €(41) million at December, 31, 2014.(6) Rents on the 110 hotels in the portfolios acquired from Moor Park, Axa Real Estate and Tritax in first-half 2014 (see Notes 3.B.1 to 3.B.3) are presented on the line
“Variable rents without a minimum” in the above table.
C. Minimum rental commitments (cash basis)
Minimum future rentals in the following tables only correspond to long-term rental commitments in the Hotels Division for hotels opened or closed for repairs.
Undiscounted minimum lease payments in foreign currencies converted at the average exchange rate based on latest known rates, are as follows:
Years (in millions of euros) Years (in millions of euros)
2015 (393) 2023 (200)
2016 (372) 2024 (185)
2017 (344) 2025 (163)
2018 (334) 2026 (145)
2019 (324) 2027 (100)
2020 (287) 2028 (82)
2021 (239) 2029 (67)
2022 (219) 2030 (47)
> 2030 (315)
TOTAL (3,816)
At December 31, 2014, the present value of future minimum lease payments, considered as representing 7% of the minimum lease payments used to calculate the “Adjusted funds from ordinary activities/adjusted net debt” ratio, amounted to €(2,453) million.
Interest expense on adjusted net debt, estimated at 7%, amounted to €172 million. The difference between the annual minimum rent (€393 million) and interest expense (€172 million) amounted to €221 million. This corresponds to the implicit repayment of adjusted debt (“Standard & Poor’s method”) and therefore constitutes an adjustment for the calculation of the adjusted funds from operations/adjusted net debt ratio (see Note 1.A.b).
Registration Document 2014 201

FINANCIAL STATEMEMENTSConsolidated Financial Statements and Notes5
NOTE 8 EBITDA BY STRATEGIC BUSINESS AND REGION
(in millions of euros) France
Europe (excl. France/
Mediterranean)
Mediterranean, Middle East,
AfricaAsia
Pacific AmericasWorldwide
Structures (1) 20142013
Adjusted
HOTELSERVICES 123 111 37 70 33 37 411 412
HOTELINVEST 144 307 21 22 38 41 573 486
CORPORATE & INTERCOS - - - - - (61) (61) (52)
TOTAL 2014 267 418 58 92 71 17 923
TOTAL 2013 ADJUSTED 277 341 25 91 73 39 846
(1) “Worldwide Structures” corresponds to revenue (royalties) and costs that are not specific to a single geographic region.
Consolidated EBITDA at December 31, 2014 totalled €923 million compared with €846 million at December 31, 2013.
The period-on-period increase breaks down as follows:
�� Like-for-like growth +54 m€ +6.4%
�� Business expansion (owned and leased hotels only) +30 m€ +3.6%
�� Currency effects (5) m€ (0.6)%
�� Disposals (2) m€ (0.2)%
INCREASE IN 2014 EBITDA +77 m€ +9.2%
Change in EBITDA by Strategic business
∆ 2014/2013 Adjusted Like-for-like change
(in millions of euros) (in millions of euros) (in %)
HOTELSERVICES (1) +22 +5.3%
HOTELINVEST +87 +41 +8.5%
CORPORATE & INTERCOS (9) (9) (17.6)%
GROUP TOTAL +77 +54 +6.4%
Change in EBITDA by region
∆ 2014/2013 Adjusted Like-for-like change
(in millions of euros) (in millions of euros) (in %)
France (10) (5) (1.9)%
Europe (excl. France/Mediterranean) +77 +41 +12.0%
Mediterranean, Middle East, Africa +33 +35 +144.1%
Asia Pacific +1 +4 +4.3%
Americas (2) (3) (4.8)%
Worldwide Structures (22) (18) (45.3)%
GROUP TOTAL +77 +54 +6.4%
Registration Document 2014202
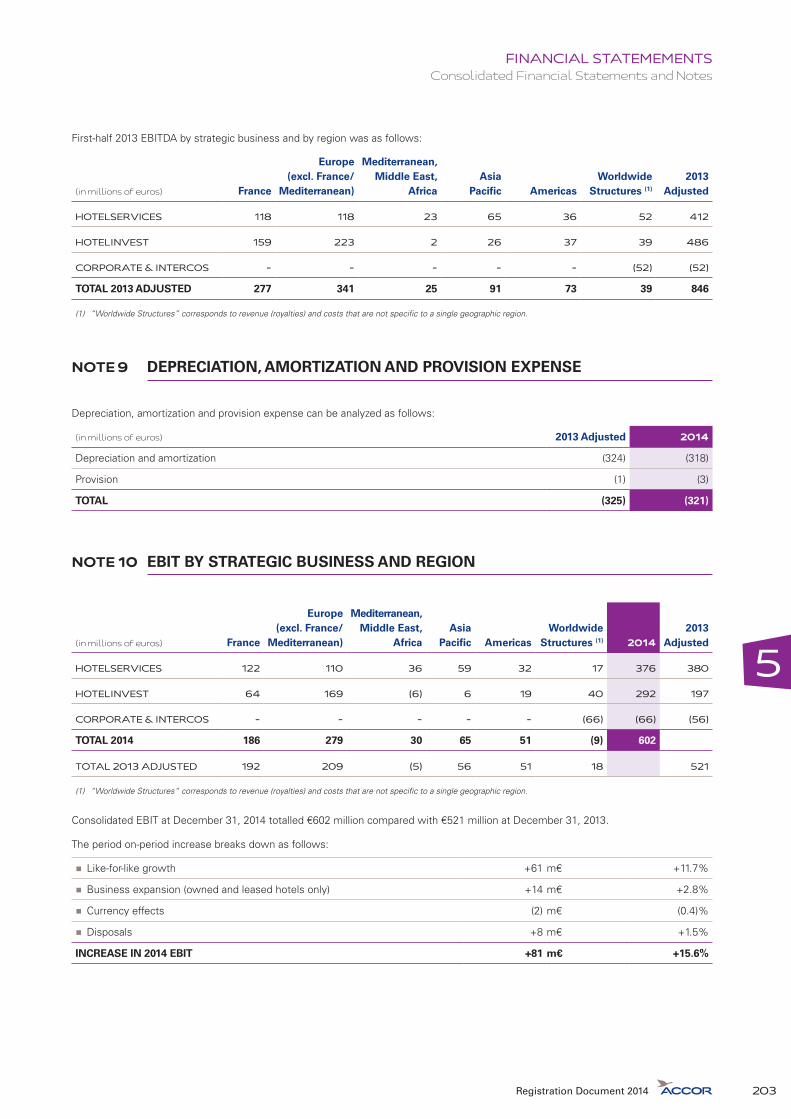
5
FINANCIAL STATEMEMENTSConsolidated Financial Statements and Notes
First-half 2013 EBITDA by strategic business and by region was as follows:
(in millions of euros) France
Europe (excl. France/
Mediterranean)
Mediterranean, Middle East,
AfricaAsia
Pacific AmericasWorldwide
Structures (1)
2013 Adjusted
HOTELSERVICES 118 118 23 65 36 52 412
HOTELINVEST 159 223 2 26 37 39 486
CORPORATE & INTERCOS - - - - - (52) (52)
TOTAL 2013 ADJUSTED 277 341 25 91 73 39 846
(1) “Worldwide Structures” corresponds to revenue (royalties) and costs that are not specific to a single geographic region.
NOTE 9 DEPRECIATION, AMORTIZATION AND PROVISION EXPENSE
Depreciation, amortization and provision expense can be analyzed as follows:
(in millions of euros) 2013 Adjusted 2014
Depreciation and amortization (324) (318)
Provision (1) (3)
TOTAL (325) (321)
NOTE 10 EBIT BY STRATEGIC BUSINESS AND REGION
(in millions of euros) France
Europe (excl. France/
Mediterranean)
Mediterranean, Middle East,
AfricaAsia
Pacific AmericasWorldwide
Structures (1) 20142013
Adjusted
HOTELSERVICES 122 110 36 59 32 17 376 380
HOTELINVEST 64 169 (6) 6 19 40 292 197
CORPORATE & INTERCOS - - - - - (66) (66) (56)
TOTAL 2014 186 279 30 65 51 (9) 602
TOTAL 2013 ADJUSTED 192 209 (5) 56 51 18 521
(1) “Worldwide Structures” corresponds to revenue (royalties) and costs that are not specific to a single geographic region.
Consolidated EBIT at December 31, 2014 totalled €602 million compared with €521 million at December 31, 2013.
The period on-period increase breaks down as follows:
�� Like-for-like growth +61 m€ +11.7%
�� Business expansion (owned and leased hotels only) +14 m€ +2.8%
�� Currency effects (2) m€ (0.4)%
�� Disposals +8 m€ +1.5%
INCREASE IN 2014 EBIT +81 m€ +15.6%
Registration Document 2014 203

FINANCIAL STATEMEMENTSConsolidated Financial Statements and Notes5
Change in EBIT by Strategic Business
∆ 2014/2013 Adjusted Like-for-like change
(in millions of euros) (in millions of euros) (in %)
HOTELSERVICES (4) +18 +4.7%
HOTELINVEST +95 +53 +26.9%
CORPORATE & INTERCOS (10) (10) (17.6)%
GROUP TOTAL +81 +61 +11.7%
Change in EBIT by region
∆ 2014/2013 Adjusted Like-for-like change
(in millions of euros) (in millions of euros) (in %)
France (6) (6) (2.9)%
Europe (excl. France/Mediterranean) +70 +49 +23.2%
Mediterranean, Middle East, Africa +35 +35 +768.7%
Asia Pacific +9 +7 +12.1%
Americas +0 (2) (3.6)%
Worldwide Structures (27) (22) (121.6)%
GROUP TOTAL +81 +61 +11.7%
First-half 2013 EBIT by strategic business and by region was as follows:
(in millions of euros) France
Europe (excl. France/
Mediterranean)
Mediterranean, Middle East,
AfricaAsia
Pacific AmericasWorldwide
Structures (1)
2013 Adjusted
HOTELSERVICES 117 117 22 52 36 36 380
HOTELINVEST 75 92 (27) 4 15 38 197
CORPORATE & INTERCOS - - - - - (56) (56)
TOTAL 2013 ADJUSTED 192 209 (5) 56 51 18 521
(1) “Worldwide Structures” corresponds to revenue (royalties) and costs that are not specific to a single geographic region.
NOTE 11 NET FINANCIAL EXPENSE
(in millions of euros) 2013 Adjusted 2014
Finance costs (1) (83) (58)
Other financial income and expenses (2) (7) 6
NET FINANCIAL EXPENSE (90) (52)
(1) Finance costs can be analyzed as follows between cash and non-cash items:
(in millions of euros) 2013 Adjusted 2014
Finance costs, net – cash (84) (59)
Finance costs, net – non-cash 1 1
TOTAL FINANCE COSTS (83) (58)
Finance costs net include interest received or paid on loans, receivables and debts measured at amortized cost.
Registration Document 2014204
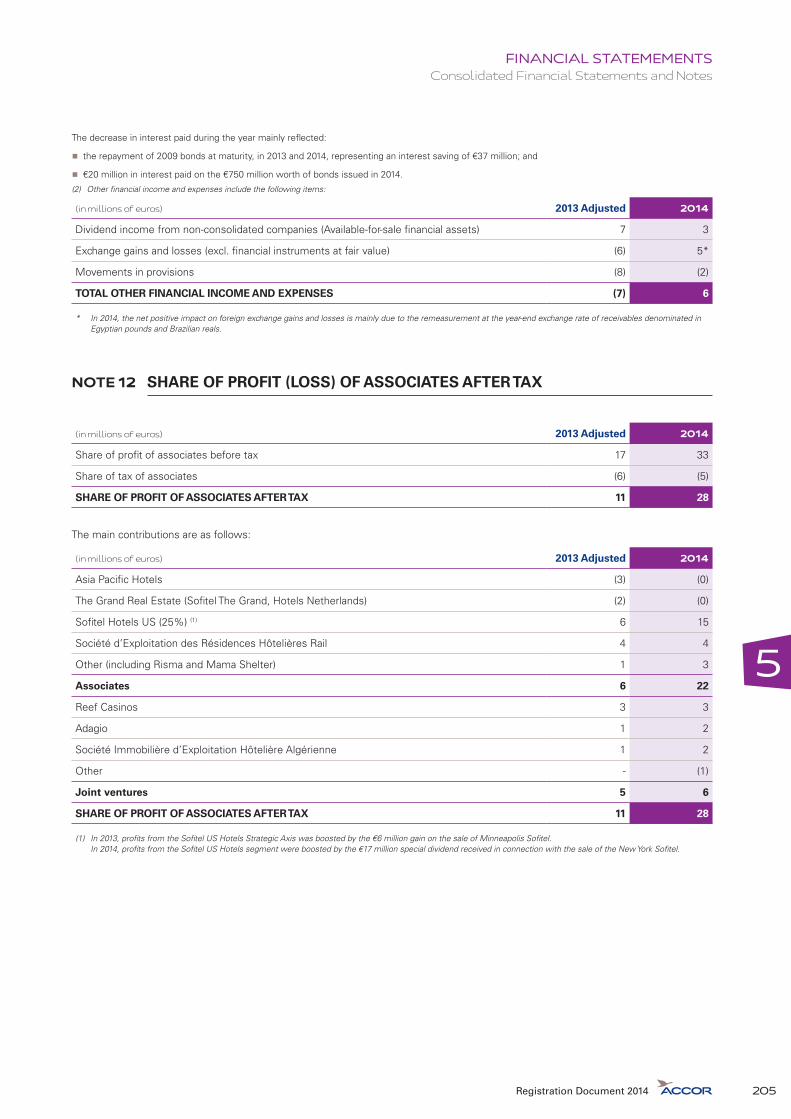
5
FINANCIAL STATEMEMENTSConsolidated Financial Statements and Notes
The decrease in interest paid during the year mainly reflected:
�� the repayment of 2009 bonds at maturity, in 2013 and 2014, representing an interest saving of €37 million; and
�� €20 million in interest paid on the €750 million worth of bonds issued in 2014.
(2) Other financial income and expenses include the following items:
(in millions of euros) 2013 Adjusted 2014
Dividend income from non-consolidated companies (Available-for-sale financial assets) 7 3
Exchange gains and losses (excl. financial instruments at fair value) (6) 5*
Movements in provisions (8) (2)
TOTAL OTHER FINANCIAL INCOME AND EXPENSES (7) 6
* In 2014, the net positive impact on foreign exchange gains and losses is mainly due to the remeasurement at the year-end exchange rate of receivables denominated in Egyptian pounds and Brazilian reals.
NOTE 12 SHARE OF PROFIT (LOSS) OF ASSOCIATES AFTER TAX
(in millions of euros) 2013 Adjusted 2014
Share of profit of associates before tax 17 33
Share of tax of associates (6) (5)
SHARE OF PROFIT OF ASSOCIATES AFTER TAX 11 28
The main contributions are as follows:
(in millions of euros) 2013 Adjusted 2014
Asia Pacific Hotels (3) (0)
The Grand Real Estate (Sofitel The Grand, Hotels Netherlands) (2) (0)
Sofitel Hotels US (25%) (1) 6 15
Société d’Exploitation des Résidences Hôtelières Rail 4 4
Other (including Risma and Mama Shelter) 1 3
Associates 6 22
Reef Casinos 3 3
Adagio 1 2
Société Immobilière d’Exploitation Hôtelière Algérienne 1 2
Other - (1)
Joint ventures 5 6
SHARE OF PROFIT OF ASSOCIATES AFTER TAX 11 28
(1) In 2013, profits from the Sofitel US Hotels Strategic Axis was boosted by the €6 million gain on the sale of Minneapolis Sofitel.In 2014, profits from the Sofitel US Hotels segment were boosted by the €17 million special dividend received in connection with the sale of the New York Sofitel.
Registration Document 2014 205
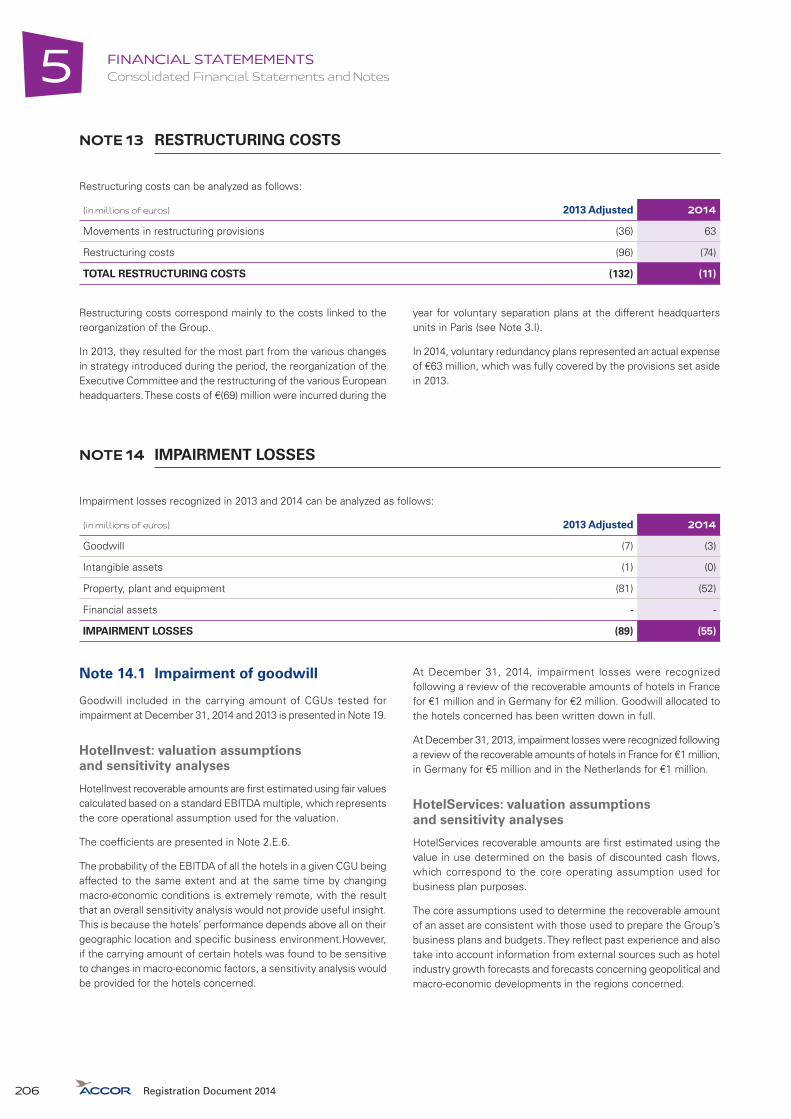
FINANCIAL STATEMEMENTSConsolidated Financial Statements and Notes5
NOTE 13 RESTRUCTURING COSTS
Restructuring costs can be analyzed as follows:
(in millions of euros) 2013 Adjusted 2014
Movements in restructuring provisions (36) 63
Restructuring costs (96) (74)
TOTAL RESTRUCTURING COSTS (132) (11)
Restructuring costs correspond mainly to the costs linked to the reorganization of the Group.
In 2013, they resulted for the most part from the various changes in strategy introduced during the period, the reorganization of the Executive Committee and the restructuring of the various European headquarters. These costs of €(69) million were incurred during the
year for voluntary separation plans at the different headquarters units in Paris (see Note 3.I).
In 2014, voluntary redundancy plans represented an actual expense of €63 million, which was fully covered by the provisions set aside in 2013.
NOTE 14 IMPAIRMENT LOSSES
Impairment losses recognized in 2013 and 2014 can be analyzed as follows:
(in millions of euros) 2013 Adjusted 2014
Goodwill (7) (3)
Intangible assets (1) (0)
Property, plant and equipment (81) (52)
Financial assets - -
IMPAIRMENT LOSSES (89) (55)
Note 14.1 Impairment of goodwill
Goodwill included in the carrying amount of CGUs tested for impairment at December 31, 2014 and 2013 is presented in Note 19.
HotelInvest: valuation assumptions and sensitivity analyses
HotelInvest recoverable amounts are first estimated using fair values calculated based on a standard EBITDA multiple, which represents the core operational assumption used for the valuation.
The coefficients are presented in Note 2.E.6.
The probability of the EBITDA of all the hotels in a given CGU being affected to the same extent and at the same time by changing macro-economic conditions is extremely remote, with the result that an overall sensitivity analysis would not provide useful insight.This is because the hotels’ performance depends above all on their geographic location and specific business environment.However, if the carrying amount of certain hotels was found to be sensitive to changes in macro-economic factors, a sensitivity analysis would be provided for the hotels concerned.
At December 31, 2014, impairment losses were recognized following a review of the recoverable amounts of hotels in France for €1 million and in Germany for €2 million. Goodwill allocated to the hotels concerned has been written down in full.
At December 31, 2013, impairment losses were recognized following a review of the recoverable amounts of hotels in France for €1 million, in Germany for €5 million and in the Netherlands for €1 million.
HotelServices: valuation assumptions and sensitivity analyses
HotelServices recoverable amounts are first estimated using the value in use determined on the basis of discounted cash flows, which correspond to the core operating assumption used for business plan purposes.
The core assumptions used to determine the recoverable amount of an asset are consistent with those used to prepare the Group’s business plans and budgets. They reflect past experience and also take into account information from external sources such as hotel industry growth forecasts and forecasts concerning geopolitical and macro-economic developments in the regions concerned.
Registration Document 2014206

5
FINANCIAL STATEMEMENTSConsolidated Financial Statements and Notes
The main other assumptions used to estimate recoverable amounts were as follows:
December 2014 Germany France Asia Australia Americas
Growth rate 2.00% 2.00% 2.00% 2.60% 4.24%
Discount rate 8.57% 8.57% 9.52% 8.05% 12.73%
December 2013 Germany France Asia Australia Americas
Growth rate 2.00% N/A 2.00% 2.60% N/A
Discount rate 8.80% N/A 10.40% 8.20% N/A
In 2013 and in 2014, analyses showed that, in the case of CGUs for which no impairment was recorded during the period, only a substantial, improbable change in the discount rate in the next twelve months would have caused their recoverable amount to fall to below their carrying amount.
Sensitivity tests performed on the main CGUs at December 31, 2014 showed that:
�� In Germany, the CGU’s carrying amount would exceed its recoverable amount if the discount rate increased by 2,727 basis points. As the enterprise value would be recovered in five years based on projected discounted cash flows, its carrying amount would represent less than its recoverable amount whatever the growth rate to perpetuity used for the calculation.
�� In Asia, the CGU’s carrying amount would exceed its recoverable amount if the discount rate increased by 5,052 basis points. As the enterprise value would be recovered in five years based on projected discounted cash flows, its carrying amount would represent less than its recoverable amount whatever the growth rate to perpetuity used for the calculation.
�� In Australia, the CGU’s carrying amount would exceed its recoverable amount if the discount rate increased by 810 basis points or the growth rate to perpetuity was reduced by 1,530 basis points.
�� In America, the CGU’s carrying amount would exceed its recoverable amount if the discount rate increased by 7,267 basis points. As the enterprise value would be recovered in five years based on projected discounted cash flows, its carrying amount would represent less than its recoverable amount whatever the growth rate to perpetuity used for the calculation.
�� In France, only a highly improbable 29,058-bps increase in the discount rate would result in the carrying amount becoming greater than the recoverable amount. As the enterprise value would be recovered by five years’ worth of discounted cash flows, the carrying amount would remain below the recoverable amount whatever the growth rate to perpetuity.
Sensitivity tests on these recoverable amounts show that a 10% decline in projected discounted operating cash flows would not result in the recognition of any impairment loss.
No impairment loss was recorded for HotelServices.
Note 14.2 Impairment of intangible assets
At December 31, 2014, impairment losses of €(0) million were recorded on intangible assets.
At December 31, 2013, impairment losses of €(1) million were recorded on intangible assets.
Note 14.3 Impairment of property, plant and equipment
(in millions of euros) France
Europe (excl. France/
Mediterranean)
Mediterranean, Middle East,
AfricaAsia
Pacific AmericasWorldwide Structures 2014
2013 Adjusted
HOTELSERVICES - - - - - - - -
HOTELINVEST (8) (22) (11) (11) (0) - (52) (81)
CORPORATE/INTERCOS - - - - - - - -
TOTAL 2014 (8) (22) (11) (11) (0) - (52)
TOTAL 2013 ADJUSTED (17) (20) (32) (6) (6) - (81)
At December 31, 2014, impairment losses on property, plant and equipment concerned 102 hotels for €50 million. No impairment losses were reversed.
Impairment losses of €5 million were recognized on ibis Shanghai Waigaoqio, ibis Weifang Qingnian, ibis Beijing Capital Airport and ibis Yangzhou Dev Zone hotels, based on the prices offered by potential buyers (level 2 valuation technique under IFRS 13: see Note 2.R).
Registration Document 2014 207

FINANCIAL STATEMEMENTSConsolidated Financial Statements and Notes5
At December 31, 2013, impairment losses on property, plant and equipment concerned 136 hotels for €80 million. No impairment losses were reversed.
Impairment losses were recognized on the Novotel Mississauga in Canada (€1 million), the Mercure Rosmalen Hertogenbosch in the Netherlands (€2 million), non-operating assets in Portugal (€0.2 million) and three ibis hotels in China – Dongguan Dongcheng, Dongguan Qingxi et Guangzhou Huangshi – (€4 million), based on the prices offered by potential buyers (level 2 valuation technique under IFRS 13: see Note 2.R).
NOTE 15 GAINS AND LOSSES ON MANAGEMENT OF HOTEL PROPERTIES
(in millions of euros) 2013 Adjusted 2014
Disposal gains and losses 78 (14)
Provisions for losses on hotel properties (10) 3
TOTAL 68 (11)
In 2014, gains and losses on the management of hotel properties included a €13 million provision to cover estimated losses on the sale of eight hotels in the Tritax portfolio.
At December 31, 2013, the total mainly included a net gain of €56 million on the “Sale & Management Back” of Sofitel Paris Le Faubourg.
NOTE 16 GAINS AND LOSSES ON MANAGEMENT OF OTHER ASSETS
(in millions of euros) 2013 Adjusted 2014
Disposal gains and losses - (26)
Provision movements (6) 36
Gains and losses on non-recurring transactions (27) (92)
TOTAL (33) (82)
In 2014, the total mainly included €(41) million in costs mostly related to a non-recurring transaction indemnity and miscellaneous fees for €(11) million.
In 2013, the total mainly included €(15) million in costs related to the ibis Megabrand project.
Registration Document 2014208
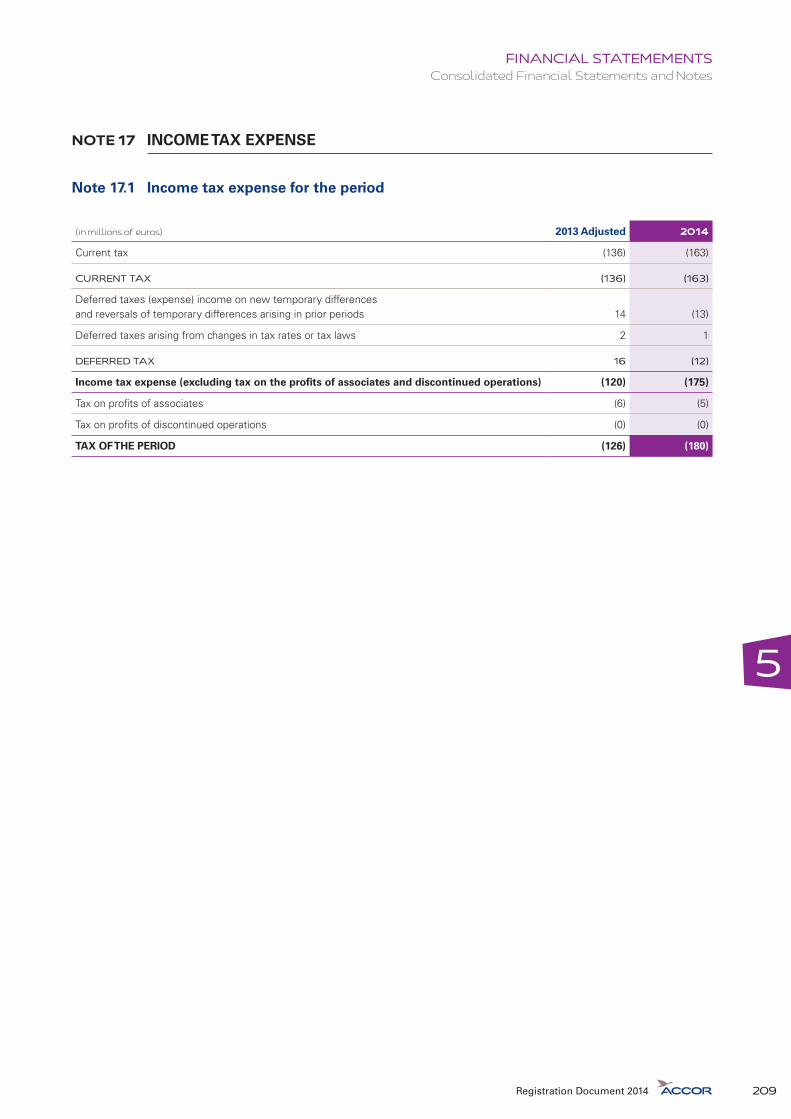
5
FINANCIAL STATEMEMENTSConsolidated Financial Statements and Notes
NOTE 17 INCOME TAX EXPENSE
Note 17.1 Income tax expense for the period
(in millions of euros) 2013 Adjusted 2014
Current tax (136) (163)
CURRENT TAX (136) (163)
Deferred taxes (expense) income on new temporary differences and reversals of temporary differences arising in prior periods 14 (13)
Deferred taxes arising from changes in tax rates or tax laws 2 1
DEFERRED TAX 16 (12)
Income tax expense (excluding tax on the profits of associates and discontinued operations) (120) (175)
Tax on profits of associates (6) (5)
Tax on profits of discontinued operations (0) (0)
TAX OF THE PERIOD (126) (180)
Registration Document 2014 209

FINANCIAL STATEMEMENTSConsolidated Financial Statements and Notes5
Note 17.2 Effective tax rate
(in millions of euros) 2013 Adjusted 2014
OPERATING PROFIT BEFORE TAX (A) 256 419
Non deductible impairment losses 44 34
Elimination of intercompany capital gains - -
Tax on share of profit (loss) of associates 6 5
Other 1 13
TOTAL PERMANENT DIFFERENCES (NON-DEDUCTIBLE EXPENSES) (B) 51 52
UNTAXED PROFIT AND PROFIT TAXED AT A REDUCED RATE (C) 12 1
Profit taxed at standard rate (D) = (A) + (B) + (C) 319 472
STANDARD TAX RATE IN FRANCE* (E) 38.00% 38.00%
TAX AT STANDARD FRENCH TAX RATE (F) = (D) X (E) (121) (180)
Effects on tax at standard French tax rate of:
�� Differences in foreign tax rates 26 44
�� Unrecognized tax losses for the period (36) (13)
�� Utilization of tax loss carryforwards 11 21
�� Share of profit (loss) of associates 6 5
�� Net charges to/reversals of provisions for tax risks (4) (12)
�� Effect of CET business tax in France (see Note 2.L) (22) (20)
�� Other items 20 (20)
TOTAL EFFECTS ON TAX AT STANDARD FRENCH TAX RATE (G) 1 5
Tax at standard rate (H) = (F) + (G) (120) (175)
TAX AT REDUCED RATE (I) - -
Income tax expense (J) = (H) + (I) (120) (175)
Profit taxed at standard rate 319 472
Income tax expense (95) (134)
GROUP EFFECTIVE TAX RATE** 29.9% 28.5%
* At December 31, 2013, and at December 31, 2014, the standard tax rate in France includes the 3.3% “Contribution sociale de solidarité” tax and the 10.7% “contribution additionnelle” surtax, both calculated on the 33.3% corporate income tax.
** At December 31, 2014, the effective tax rate (income tax expense/operating profit before tax and non-recurring items) amounts to 30.2%. It amounted to 27,1% at December 31, 2013.
Note 17.3 Details of deferred tax (Statement of financial position)
(in millions of euros)
Décember 2013 Adjusted
Décember 2014
Timing differences between company profit and taxable profit 57 54
Timing differences between consolidated profit and company profit (64) (62)
Recognized tax losees 38 35
DEFERRED TAX ASSETS, NET (LIABILITIES) 31 27
Deferred tax assets 149 68
Deferred tax liabilities 118 41
Registration Document 2014210

5
FINANCIAL STATEMEMENTSConsolidated Financial Statements and Notes
Note 17.4 Unrecognized deferred tax assets
Unrecognized deferred tax assets at December 31, 2014 amounted to €757 million. Unrecognized deferred tax assets at December 31, 2013 amounted to €721 million.
Unrecognized deferred tax assets at December 31, 2014 will expire in the following periods if not utilized:
(in millions of euros)
Deductible temporary differences
Tax loss carryforwards Tax credits Total*
Y+1 - 8 - 8
Y+2 - 4 0 4
Y+3 - 5 0 5
Y+4 - 5 0 5
Y+5 and beyond 1 498 3 502
Evergreen 36 197 - 233
DEFERRED TAX, NET 37 717 3 757
* In line with IFRS 5, unrecognized deferred tax assets of the Onboard Train Services business are not presented in this note.
In accordance with IAS 12, deferred tax assets are recognized for ordinary and evergreen tax loss carry forwards only to the extent that it is probable that future taxable profits will be available against which the assets can be utilized. The Group generally estimates those future profits over a five-year period, and each year reviews the projections and assumptions on which its estimates are based, in accordance with the applicable tax rules.
NOTE 18 PROFIT OR LOSS FROM DISCONTINUED OPERATIONS
Profit or loss from discontinued operations includes the profit generated by the Italian Onboard day Train Services business, which remained classified as a “discontinued operations” because of the ongoing liquidation process of the Company (see Note 3.B.7).
The consolidated income statements of discontinued operations classified in profit or loss from discontinued operations in Accor’s consolidated financial statements are presented below:
(in millions of euros) 2013 2014
CONSOLIDATED REVENUE 69 0
Operating expense (65) (4)
EBITDAR 4 (4)
Rental expense (1) (0)
EBITDA 3 (4)
Depreciation, amortization and provision expense (0) (0)
EBIT 3 (4)
Net financial expense 1 1
Share of profit of associates after tax - -
OPERATING PROFIT BEFORE TAX AND NON RECURRING ITEMS 4 (3)
Restructuring costs (0) -
Impairment losses (1) -
Gains and losses on management of hotel properties - -
Gains and losses on management of other assets (2) (1)
OPERATING PROFIT BEFORE TAX 1 (4)
Income tax expense (0) (0)
NET LOSS FROM DISCONTINUED OPERATIONS 1 (4)
Registration Document 2014 211

FINANCIAL STATEMEMENTSConsolidated Financial Statements and Notes5
NOTE 19 GOODWILL
(in millions of euros) 2013 Adjusted 2014
Goodwill (gross value) 785 795
Less impairment losses (94) (94)
GOODWILL, NET 691 701
(in millions of euros) Notes 2013 Adjusted 2014
Australia 123 128
France 111 111
Germany 84 84
Americas 60 60
Asia 38 43
Other 9 9
HOTELSERVICES 425 435
Germany 14.1 81 79
Switzerland 11 11
France 14.1 60 63
Americas 40 40
Egypt 19 20
Australia 23 23
The Netherlands 8 6
Ivory Coast 6 7
Other 18 17
HOTELINVEST 266 266
GOODWILL, NET 691 701
Registration Document 2014212

5
FINANCIAL STATEMEMENTSConsolidated Financial Statements and Notes
Changes in the carrying amount of goodwill over the period were as follows:
(in millions of euros) Notes 2013 Adjusted 2014
CARRYING AMOUNT AT BEGINNING OF PERIOD 823 691
Goodwill recognized on acquisitions for the period and other increases 1 2
�� Hotels, Asia Pacific (a) 1 -
�� Hotels, Europe (b) - 2
Disposals (c) (30) (2)
Impairment losses Note 14 (7) (3)
Translation adjustment (d) (38) 12
Reclassifications to Property, Plant and Equipment (e) (60) -
Reclassifications to Assets held for sale Note 33 3 (1)
Other reclassifications and movements (1) 2
CARRYING AMOUNT AT END OF PERIOD 691 701
(a) In 2012, Accor bought Mirvac, generating goodwill of €19.7 million. An additional €1.5 million in goodwill was recorded in 2013, after Accor took over the Sea Temple management contract.
(b) In 2014, Accor acquired the remaining shares in the ibis Suresnes operating company, which was previously 24%-owned and accounted for by the equity method.(c) In 2013, disposals include the Group’s interest in TAHL, Australia (see Note 3.C), leading to the write-off of net goodwill in the amount of (€24.1 million).(d) At December 31, 2014, this amount is due to the rise of the Australian and American dollars. In 2013, this amount is due to the fall in the Australian dollar.(e) In 2012, the difference between the cost of Grupo Posadas’ hotel network in South America and the book value of the net assets acquired amounted to €160 million.
In 2013, part of the difference (€50 million) was allocated to the assets and liabilities acquired and (€10 million) in price adjustment were obtained.
NOTE 20 INTANGIBLE ASSETS
(in millions of euros) HotelServices HotelInvestCorporate/
Intercos Dec. 2014Dec. 2013 Adjusted
Brands and rights (1) 28 24 12 64 59
Licenses, software 88 44 59 191 173
Other intangible assets (2) 173 106 4 283 276
Total intangible assets at cost 289 174 75 538 508
Brands and rights (1) (23) (2) (11) (36) (36)
Licenses, software (60) (35) (52) (147) (132)
Other intangible assets (2) (56) (16) - (72) (59)
Total accumulated amortization and impairment losses (139) (53) (63) (255) (227)
INTANGIBLE ASSETS, NET 150 121 12 283 281
(1) The carrying amount of other brands and rights was €28 million at December 31, 2014 including, for HotelInvest:- €8 million related to ibis and €4 million related to Mercure in France<0} (Graff portfolio – cf. Note 2.B.8);- €7 million related to Pullman in Brazil (concession fees);- €3 million related to ibis in China; and
For HotelServices, €5 million for the Sebel brand in Australia.(2) At December 31, 2014, the net book value of other intangible assets amounted to €211 million, including:
- €91 million in lease premiums, of which €79 million corresponding to the value attributed to Orbis’s land use rights in Poland;- €38 million corresponding to the value attributed to management contracts for HotelServices of which:
(i) €21 million for Mirvac’s Australian management contracts,(ii) €17 million for Grupo Posadas’ network of hotels in Brazil, Argentina and Chile;
- €49 million in key money for HotelInvest of which:(i) €18 million for 24 management contracts and 26 franchise contracts in the United Kingdom,(ii) €9 million for management contracts in Australia.
Registration Document 2014 213

FINANCIAL STATEMEMENTSConsolidated Financial Statements and Notes5
Changes in the carrying amount of intangible assets over the period were as follows
(in millions of euros) HotelServices HotelInvestCorporate/
Intercos Dec. 2014Dec. 2013 Adjusted
CARRYING AMOUNT AT BEGINNING OF PERIOD 134 140 7 281 263
Acquisitions 12 1 - 13 24
Internally-generated assets (1) 19 3 5 27 32
Intangible assets acquired (2) 2 12 - 14 23
Amortization for the period (22) (8) (3) (33) (32)
Impairment losses for the period - - - - (2)
Disposals of the period (2) (3) - (5) (8)
Translation adjustment 3 - - 3 (18)
Reclassifications of Assets held for sale (see Note 33) - (16) - (16) (3)
Other reclassifications 4 (8) 3 (1) 2
CARRYING AMOUNT AT END OF PERIOD 150 121 12 283 281
(1) In 2014 and 2013, mainly acquisitions of licenses and software.(2) In 2014, intangible assets acquired consisted of hotel entrance fees of €12 million recognized during the year (Graff portfolio).
In 2013, intangible assets acquired corresponded to assets recognized following the 2012 acquisition of Grupo Posadas’ hotel network in South America.
The following intangible assets are considered as having an indefinite useful life
(in millions of euros) HotelServices HotelInvestCorporate/
Intercos Dec. 2014Dec. 2013 Adjusted
Sebel brand (Australia) 5 - - 5 4
Other brands and rights with indefinite useful life - - 1 1 1
CARRYING AMOUNT AT END OF PERIOD 5 - 1 6 5
NOTE 21 PROPERTY, PLANT AND EQUIPMENT
Note 21.1 Property, plant and equipment by nature
(in millions of euros) HotelServices HotelInvestCorporate/
Intercos Dec. 2014Dec. 2013 Adjusted
Land 5 281 - 286 177
Buildings 42 2,254 - 2,296 1,589
Fixtures 43 1,551 10 1,604 1,545
Equipment and furniture 47 1,331 15 1,393 1,423
Constructions in progress 15 255 4 274 243
PROPERTY, PLANT AND EQUIPMENT, AT COST 152 5,672 29 5,853 4,977
Registration Document 2014214

5
FINANCIAL STATEMEMENTSConsolidated Financial Statements and Notes
(in millions of euros) HotelServices HotelInvestCorporate/
Intercos Dec. 2014Dec. 2013 Adjusted
Buildings (9) (567) - (576) (527)
Fixtures (28) (862) (5) (895) (833)
Equipment and furniture (36) (949) (7) (992) (985)
Constructions in progress - (4) - (4) (3)
TOTAL OF DEPRECIATION (73) (2,382) (12) (2,467) (2,348)
Land (1) (10) - (11) (10)
Buildings - (117) - (117) (116)
Fixtures - (59) - (59) (62)
Equipment and furniture - (32) - (32) (36)
Constructions in progress - (10) - (10) (9)
TOTAL OF IMPAIRMENT LOSSES (1) (228) - (229) (233)
ACCUMULATED DEPRECIATION AND IMPAIRMENT LOSSES (74) (2,610) (12) (2,696) (2,581)
(in millions of euros) HotelServices HotelInvestCorporate/
Intercos Dec. 2014Dec. 2013 Adjusted
Land 4 271 - 275 167
Buildings 33 1,570 - 1,603 946
Fixtures 15 630 5 650 650
Equipment and furniture 11 350 8 369 402
Constructions in progress 15 241 4 260 231
PROPERTY, PLANT AND EQUIPMENT, NET 78 3,062 17 3,157 2,396
Changes in the carrying amount of property, plant and equipment during the period were as follows:
(in millions of euros) HotelServices HotelInvestCorporate/
Intercos Dec. 2014Dec. 2013 Adjusted
NET CARRYING AMOUNT AT BEGINNING OF PERIOD 64 2,317 15 2,396 2,542
Property, plant and equipment acquired (1) - 1,000 - 1,000 54
Capital expenditure (2) 24 378 4 406 366
Depreciation for the period (12) (270) (2) (284) (293)
Impairment losses for the period recognized in impairment losses or in net loss from discontinued operations (see Note 14.2 and Note 18) - (52) - (52) (80)
Translation adjustment 3 12 - 15 (89)
Disposals for the period (1) (86) - (87) (118)
Reclassification of assets held for sale (see Note 33) - (294) - (294) 13
Other reclassifications (3) - 57 - 57 1
NET CARRYING AMOUNT AT END OF PERIOD 78 3,062 17 3,157 2,396
(1) At December 31, 2014, property, plant and equipment acquired correspond mainly to Moor Park portfolio for €704 million, Axa Real Estate portfolio for €180 million and Tritax portfolio for €89 million (see Note 3.B.1 to 3.B.3).In 2013, the €54 million in property, plant and equipment acquired corresponded to the allocation of the purchase price of Grupo Posadas.
(2) At December 31, 2014, capital expenditure included refurbishment work for €233 million, for the most part in France, Germany and the United Kingdom, as well as new buildings for €173 million for the most part in Germany and in the United Kingdom.Capital expenditure in 2013 included refurbishment work for €232 million, for the most part in France, Germany and the United Kingdom, as well as new buildings for €134 million including the acquisition of a €28 million plot of land in the Canary Wharf district of London, United Kingdom, for the construction of a Novotel unit.
(3) Other reclassifications at December 31, 2014 mainly concern the reclassification of the deposit paid in 2011 for the exercise of Accor’s pre-emptive right to acquire the building housing the Sofitel Rio de Janeiro Copacabana. The deposit was reclassified to property and equipment following a May 2014 court ruling that Accor was the rightful owner of the property.At December 31, 2014, contracts totaling €54 million have been signed for the purchase of property, plant and equipment. They are not recognized in the statement of financial position. At December 31, 2013, contracts totalized €83 million.
Registration Document 2014 215
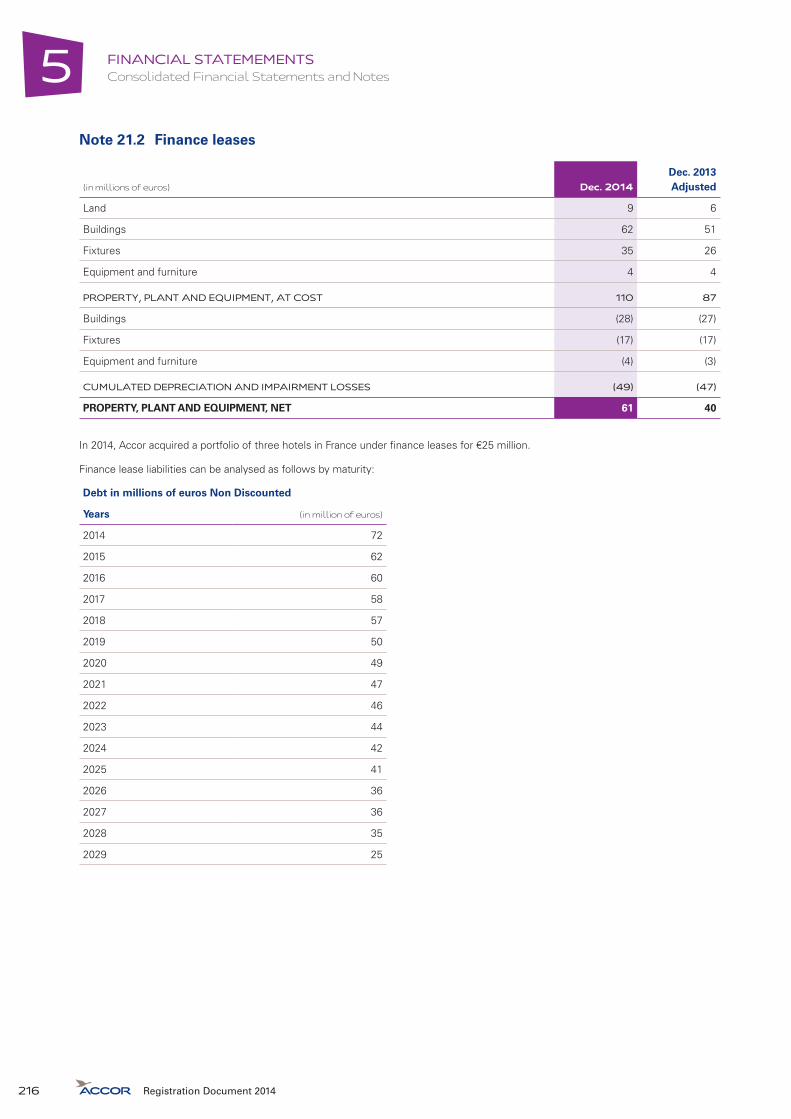
FINANCIAL STATEMEMENTSConsolidated Financial Statements and Notes5
Note 21.2 Finance leases
(in millions of euros) Dec. 2014Dec. 2013Adjusted
Land 9 6
Buildings 62 51
Fixtures 35 26
Equipment and furniture 4 4
PROPERTY, PLANT AND EQUIPMENT, AT COST 110 87
Buildings (28) (27)
Fixtures (17) (17)
Equipment and furniture (4) (3)
CUMULATED DEPRECIATION AND IMPAIRMENT LOSSES (49) (47)
PROPERTY, PLANT AND EQUIPMENT, NET 61 40
In 2014, Accor acquired a portfolio of three hotels in France under finance leases for €25 million.
Finance lease liabilities can be analysed as follows by maturity:
Debt in millions of euros Non Discounted
Years (in million of euros)
2014 72
2015 62
2016 60
2017 58
2018 57
2019 50
2020 49
2021 47
2022 46
2023 44
2024 42
2025 41
2026 36
2027 36
2028 35
2029 25
Registration Document 2014216

5
FINANCIAL STATEMEMENTSConsolidated Financial Statements and Notes
NOTE 22 LONG-TERM LOANS
(in millions of euros) HotelServices HotelInvestCorporate/
Intercos Dec. 2014Dec. 2013 Adjusted
Gross value 68 139 (67) 140 112
Accumulated impairment losses (2) (4) (1) (7) (14)
LONG-TERM LOANS, NET 66 135 (68) 133 98
(in millions of euros) HotelServices HotelInvestCorporate/
Intercos Dec. 2014Dec. 2013 Adjusted
Hotels, Asia Pacific (1) 34 18 - 52 39
Other (2) 32 117 (68) 81 59
TOTAL 66 135 (68) 133 98
(1) At December 31, 2014, loans to hotels in the Asia-Pacific region mainly consist of:- for HotelServices, a loan to A.P.V.C. Finance Pty Limited (a timeshare financing company) for an amount of €21 million at December 31, 2014
(€19 million at December 31, 2013), paying interest at an average rate of 14.75% and a €9 million loan made to Darling Harbour Hotel Trust, the future owner of the Sydney Darling Harbour Sofitel, in exchange for being awarded the hotel management contract;
- for HotelInvest, a loan to Shree Naman Hotels Private to finance the development of the Mumbai Sofitel in India. The total loan amounts to €18 million at December 31, 2014 (at December 31, 2013: €16 million).
(2) At December 31, 2014, loans to hotels excluding Asia-Pacific region mainly consist of the guaranteed minimum rent of €17 million for the Paris Tour Eiffel Pullman under a management contract, a €12 million loan to the owner company (SHTE) to finance the development of the Paris Tour Eiffel Pullman and a variable-price put option granted by Risma valued at €19 million.At December 31, 2014, loans to hotels include €67 million of internal loans between HotelInvest entities in the USA and Accor Holding.
NOTE 23 INVESTMENT IN ASSOCIATES
This caption includes investments in joint ventures, which have been accounted for by the equity method effective from January 1, 2014. Details of investments in associates and joint ventures are as follows:
(in millions of euros) Note** 2013 Adjusted 2014
Asia Pacific Hotels*(1) (2) (3)
(4) 129 143
Mama Shelter (5) - 29
The Grand Real Estate (Sofitel The Grand) (6) 14 14
Société Hôtelière Paris Les Halles (7) 12 12
Investment fund Egypt 6 6
Sofitel London St James (Hotel UK) 6 7
Hotels Sofitel US (25%) 6 3
Société d’exploitation des Résidences Hôtelières Rail 5 5
Other (Including Risma) 57 60
Associates 235 279
Société Immobilière d’Exploitation Hôtelière Algérienne (8) 19 21
Reef Casinos (9) 18 18
Adagio 2 4
Other 2 2
Joint Ventures 41 45
TOTAL 276 324
* The Asia Pacific investments primarily include Interglobe Hotels Entreprises Limited (the development company for ibis hotel in India) for €50 million, Caddie Hotels (the development company for a Novotel and a Pullman in New Delhi) for €22 million, a joint-venture for development partnerships under ibis and Novotel brands in India (Triguna) for €16 million and Ambassador Inc., Ambasstel and Ambatel Inc (South Korea) for €29 million. Beijing Peace Hotel Ltd (Novotel Beijing) previously owned was sold in 2013.
** See pages 218 to 221.
Registration Document 2014 217

FINANCIAL STATEMEMENTSConsolidated Financial Statements and Notes5
Note 23.1 Information about material associates
The following associates have a material impact on the consolidated financial statements:
(1) Interglobe Hotels, which owns and operates ibis hotels in India that are run by Accor under management contracts. Key figures for Interglobe Hotels as follows:
Interglobe Hotels (Hotels ibis India)
Development ibis India(in millions of euros) March 2013* March 2014*
Revenue 12 13
Net profit (loss) (3) (3)
Total current Assets 6 6
Total non-current Assets 145 157
Equity (including currency translation reserve) 95 100
Total current Liabilities 8 10
Total non-current Liabilities 49 53
Net cash/(Net debt) (21) (47)
Market capitalization N/A N/A
Dividends paid by the compagny to Accor during the period - -
% interest held 40.00% 40.00%
* As Interglobe Hotels has a March 31 year-end and Accor is only minority shareholder, the Group is not authorized to disclose details of the Interglobe accounts included in its consolidated financial statements. The key figures shown above are extracted from Interglobe’s latest audited and published financial statements.
(2) Ambassador, which owns and operates Novotel Seoul Ambassador Gangnam that is run by Accor under management contract. Key figures for Ambassador Inc are as follows:
Hotels Korea
Ambassador (Novotel Seoul Ambassador Gangnam)(in millions of euros) Dec. 2013 Dec. 2014
Revenue 24 24
Net profit (loss) 3 2
Total current Assets 5 5
Total non-current Assets 64 73
Equity (including currency translation reserve) 51 57
Total current Liabilities 9 11
Total non-current Liabilities 10 9
Net cash/(Net debt) (7) (10)
Market capitalization N/A N/A
Dividends paid by the compagny to Accor during the period 1 -
% interest held 30.19% 30.19%
Registration Document 2014218

5
FINANCIAL STATEMEMENTSConsolidated Financial Statements and Notes
(3) Ambasstel which owns and operates ibis Séoul Myeong Dong, ibis Séoul and ibis Seoul Ambassador Insadong that are run by Accor under management contract. Key figures Ambasstel are as follows:
Ambasstel (ibis in Seoul)(in millions of euros) Dec. 2013 Dec. 2014
Revenue 23 29
Net profit (loss) 3 4
Total current Assets 12 17
Total non-current Assets 25 27
Equity (including currency translation reserve) 33 39
Total current Liabilities 3 4
Total non-current Liabilities 1 1
Net cash/(Net debt) 2 15
Market capitalization N/A N/A
Dividends paid by the compagny to Accor during the period 0 -
% interest held 20.00% 20.00%
(4) Ambatel which owns and operates Novotel Seoul Ambassador Doksan that is run by Accor under management contract. Key figures for Ambatel Inc are as follows:
Ambatel (Novotel Seoul Ambassador Doksan)(in millions of euros) Dec. 2013 Dec. 2014
Revenue 10 9
Net profit (loss) 1 1
Total current Assets 2 2
Total non-current Assets 49 54
Equity (including currency translation reserve) 37 41
Total current Liabilities 5 5
Total non-current Liabilities 9 10
Net cash/(Net debt) (7) (7)
Market capitalization N/A N/A
Dividends paid by the compagny to Accor during the period - -
% interest held 21.83% 21.83%
(5) Mama Shelter is developing an eponymous hotel network. It currently has hotels in France and in Istanbul, and is expanding into the United States:
Mama Shelter(in millions of euros) Dec. 2013 Dec. 2014
Revenue N/A 7
Net profit (loss) N/A (0)
Total current Assets N/A 12
Total non-current Assets N/A 71
Equity (including currency translation reserve) N/A 44
Total current Liabilities N/A 26
Total non-current Liabilities N/A 14
Net cash/(Net debt) N/A (26)
Market capitalization N/A N/A
Dividends paid by the compagny to Accor during the period N/A -
% interest held 0.00% 36.60%
This financial information includes a non-allocated goodwill at December 31, 2014.
Registration Document 2014 219
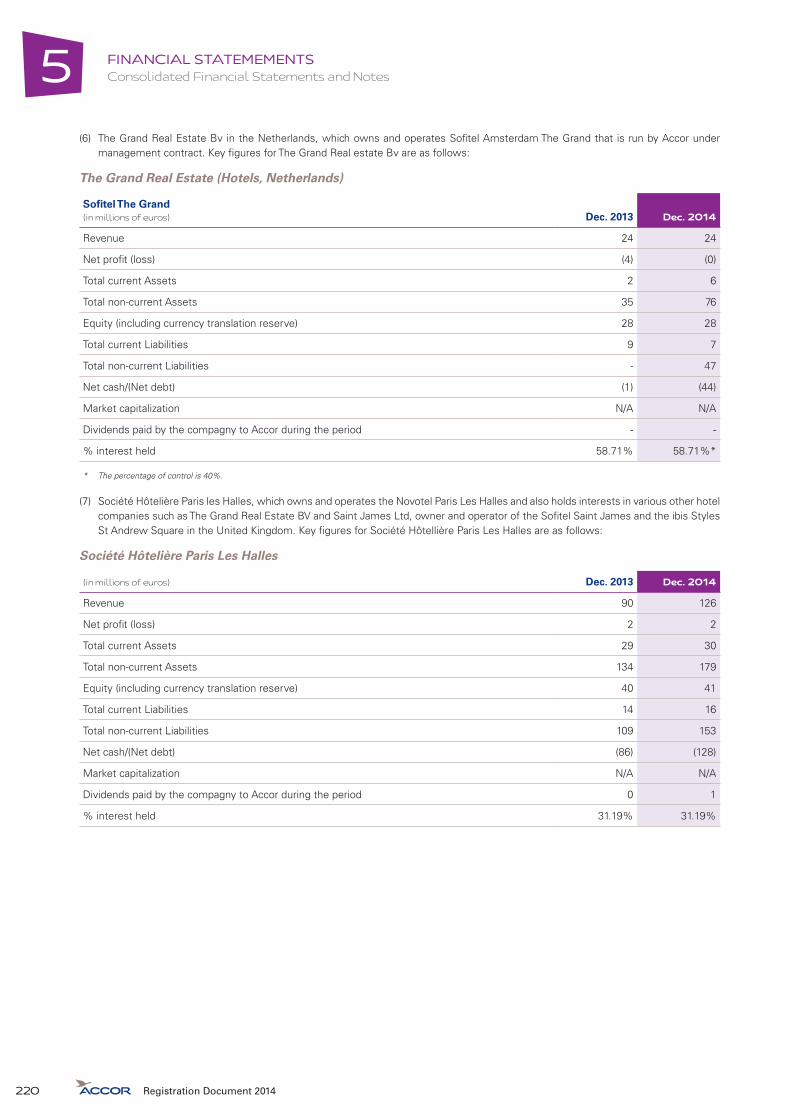
FINANCIAL STATEMEMENTSConsolidated Financial Statements and Notes5
(6) The Grand Real Estate Bv in the Netherlands, which owns and operates Sofitel Amsterdam The Grand that is run by Accor under management contract. Key figures for The Grand Real estate Bv are as follows:
The Grand Real Estate (Hotels, Netherlands)
Sofitel The Grand(in millions of euros) Dec. 2013 Dec. 2014
Revenue 24 24
Net profit (loss) (4) (0)
Total current Assets 2 6
Total non-current Assets 35 76
Equity (including currency translation reserve) 28 28
Total current Liabilities 9 7
Total non-current Liabilities - 47
Net cash/(Net debt) (1) (44)
Market capitalization N/A N/A
Dividends paid by the compagny to Accor during the period - -
% interest held 58.71% 58.71%*
* The percentage of control is 40%.
(7) Société Hôtelière Paris les Halles, which owns and operates the Novotel Paris Les Halles and also holds interests in various other hotel companies such as The Grand Real Estate BV and Saint James Ltd, owner and operator of the Sofitel Saint James and the ibis Styles St Andrew Square in the United Kingdom. Key figures for Société Hôtellière Paris Les Halles are as follows:
Société Hôtelière Paris Les Halles
(in millions of euros) Dec. 2013 Dec. 2014
Revenue 90 126
Net profit (loss) 2 2
Total current Assets 29 30
Total non-current Assets 134 179
Equity (including currency translation reserve) 40 41
Total current Liabilities 14 16
Total non-current Liabilities 109 153
Net cash/(Net debt) (86) (128)
Market capitalization N/A N/A
Dividends paid by the compagny to Accor during the period 0 1
% interest held 31.19% 31.19%
Registration Document 2014220
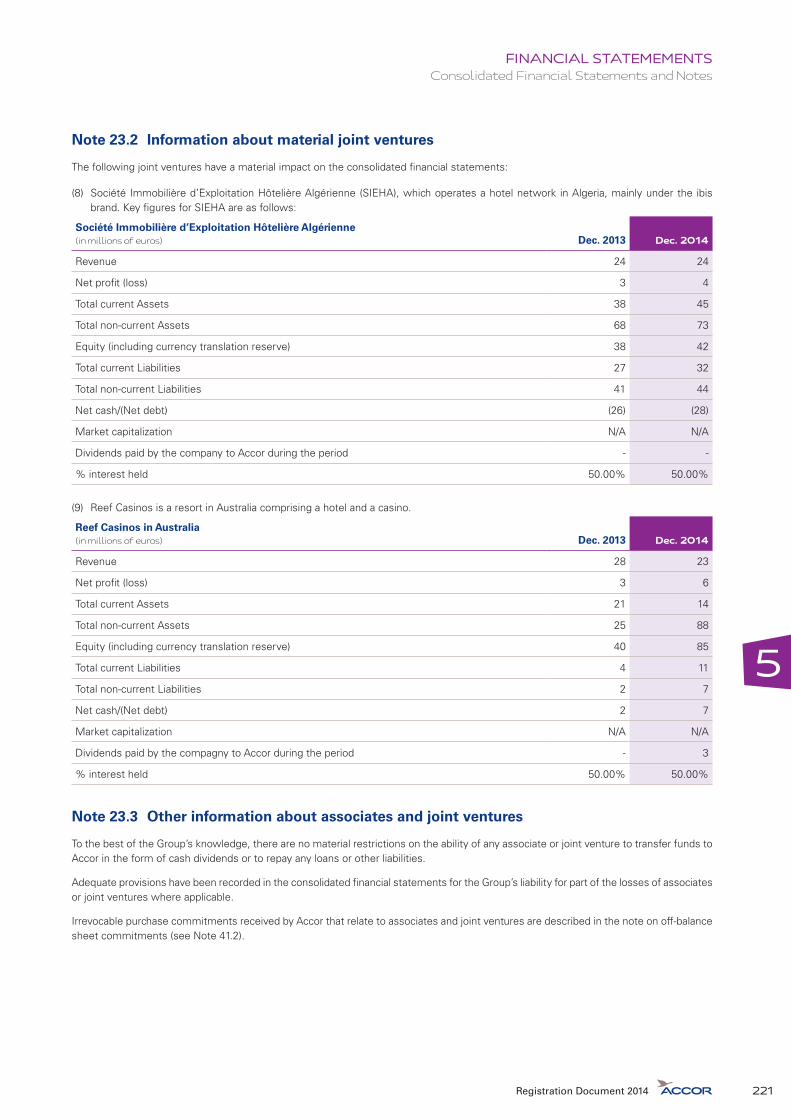
5
FINANCIAL STATEMEMENTSConsolidated Financial Statements and Notes
Note 23.2 Information about material joint ventures
The following joint ventures have a material impact on the consolidated financial statements:
(8) Société Immobilière d’Exploitation Hôtelière Algérienne (SIEHA), which operates a hotel network in Algeria, mainly under the ibis brand. Key figures for SIEHA are as follows:
Société Immobilière d’Exploitation Hôtelière Algérienne(in millions of euros) Dec. 2013 Dec. 2014
Revenue 24 24
Net profit (loss) 3 4
Total current Assets 38 45
Total non-current Assets 68 73
Equity (including currency translation reserve) 38 42
Total current Liabilities 27 32
Total non-current Liabilities 41 44
Net cash/(Net debt) (26) (28)
Market capitalization N/A N/A
Dividends paid by the company to Accor during the period - -
% interest held 50.00% 50.00%
(9) Reef Casinos is a resort in Australia comprising a hotel and a casino.
Reef Casinos in Australia(in millions of euros) Dec. 2013 Dec. 2014
Revenue 28 23
Net profit (loss) 3 6
Total current Assets 21 14
Total non-current Assets 25 88
Equity (including currency translation reserve) 40 85
Total current Liabilities 4 11
Total non-current Liabilities 2 7
Net cash/(Net debt) 2 7
Market capitalization N/A N/A
Dividends paid by the compagny to Accor during the period - 3
% interest held 50.00% 50.00%
Note 23.3 Other information about associates and joint ventures
To the best of the Group’s knowledge, there are no material restrictions on the ability of any associate or joint venture to transfer funds to Accor in the form of cash dividends or to repay any loans or other liabilities.
Adequate provisions have been recorded in the consolidated financial statements for the Group’s liability for part of the losses of associates or joint ventures where applicable.
Irrevocable purchase commitments received by Accor that relate to associates and joint ventures are described in the note on off-balance sheet commitments (see Note 41.2).
Registration Document 2014 221
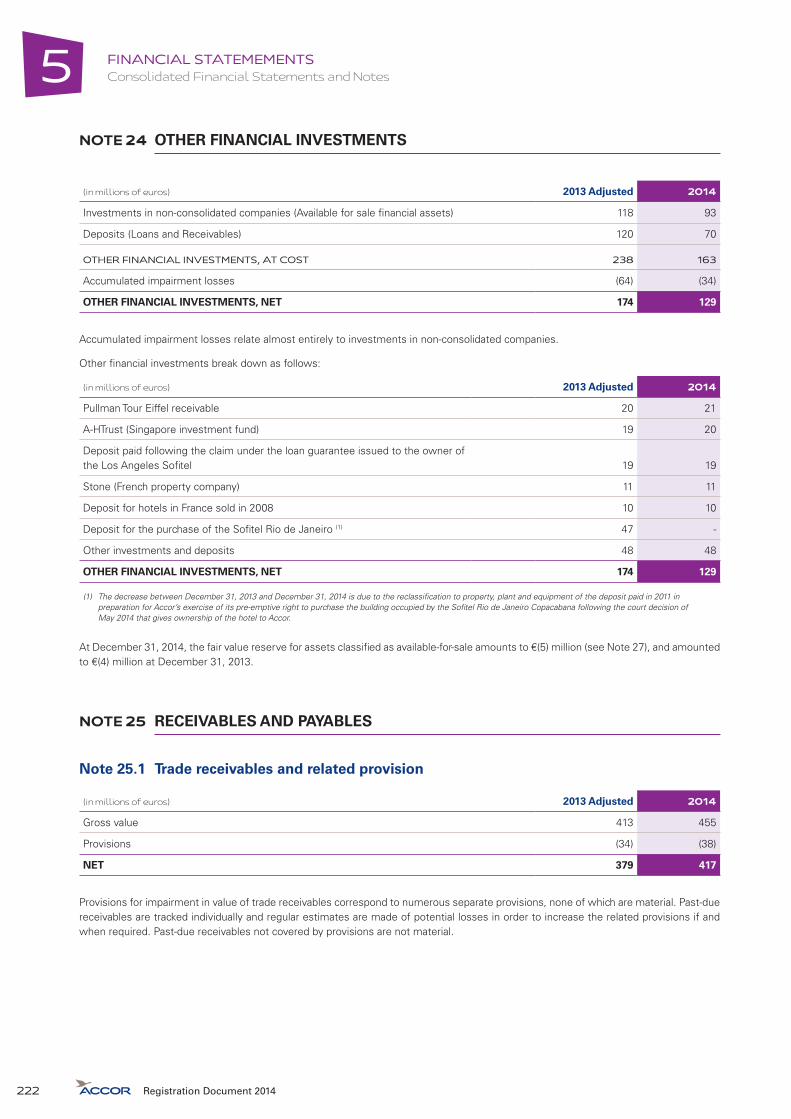
FINANCIAL STATEMEMENTSConsolidated Financial Statements and Notes5
NOTE 24 OTHER FINANCIAL INVESTMENTS
(in millions of euros) 2013 Adjusted 2014
Investments in non-consolidated companies (Available for sale financial assets) 118 93
Deposits (Loans and Receivables) 120 70
OTHER FINANCIAL INVESTMENTS, AT COST 238 163
Accumulated impairment losses (64) (34)
OTHER FINANCIAL INVESTMENTS, NET 174 129
Accumulated impairment losses relate almost entirely to investments in non-consolidated companies.
Other financial investments break down as follows:
(in millions of euros) 2013 Adjusted 2014
Pullman Tour Eiffel receivable 20 21
A-HTrust (Singapore investment fund) 19 20
Deposit paid following the claim under the loan guarantee issued to the owner of the Los Angeles Sofitel 19 19
Stone (French property company) 11 11
Deposit for hotels in France sold in 2008 10 10
Deposit for the purchase of the Sofitel Rio de Janeiro (1) 47 -
Other investments and deposits 48 48
OTHER FINANCIAL INVESTMENTS, NET 174 129
(1) The decrease between December 31, 2013 and December 31, 2014 is due to the reclassification to property, plant and equipment of the deposit paid in 2011 in preparation for Accor’s exercise of its pre-emptive right to purchase the building occupied by the Sofitel Rio de Janeiro Copacabana following the court decision of May 2014 that gives ownership of the hotel to Accor.
At December 31, 2014, the fair value reserve for assets classified as available-for-sale amounts to €(5) million (see Note 27), and amounted to €(4) million at December 31, 2013.
NOTE 25 RECEIVABLES AND PAYABLES
Note 25.1 Trade receivables and related provision
(in millions of euros) 2013 Adjusted 2014
Gross value 413 455
Provisions (34) (38)
NET 379 417
Provisions for impairment in value of trade receivables correspond to numerous separate provisions, none of which are material. Past-due receivables are tracked individually and regular estimates are made of potential losses in order to increase the related provisions if and when required. Past-due receivables not covered by provisions are not material.
Registration Document 2014222

5
FINANCIAL STATEMEMENTSConsolidated Financial Statements and Notes
Note 25.2 Details of other receivables and accruals
(in millions of euros) 2013 Adjusted 2014
Recoverable VAT 140 130
Prepaid wages and salaries and payroll taxes 7 3
Other prepaid and recoverable taxes 57 67
Other receivables 253 240
Other prepaid expenses 61 71
OTHER RECEIVABLES AND ACCRUALS, AT COST 518 511
Provisions (45) (50)
OTHER RECEIVABLES AND ACCRUALS, NET 473 461
Note 25.3 Details of other payables
(in millions of euros) 2013 Adjusted 2014
VAT payable 81 84
Wages and salaries and payroll taxes payable 335 336
Other taxes payable 76 82
Other payables 388 389
Deferred income 66 75
OTHER PAYABLES 946 966
Note 25.4 Analysis of other receivables/payables’ periods
(in millions of euros) < 1 year 1 to 5 years > 5 years 2014 2013 Adjusted
Inventories 28 - - 28 41
Trade receivables 416 1 - 417 379
Recoverable VAT 119 10 1 130 140
Prepaid payroll taxes 3 - - 3 7
Other prepaid and recoverable taxes 67 - - 67 57
Other receivables 190 0 - 190 208
CURRENT ASSETS 823 11 1 835 832
Trade payables 690 0 - 690 599
VAT payable 84 0 - 84 81
Wages and salaries and payroll taxes payable 335 1 - 336 335
Other taxes payable 82 0 - 82 76
Other payables 386 3 - 389 388
CURRENT LIABILITIES 1,577 4 - 1,581 1,479
Registration Document 2014 223
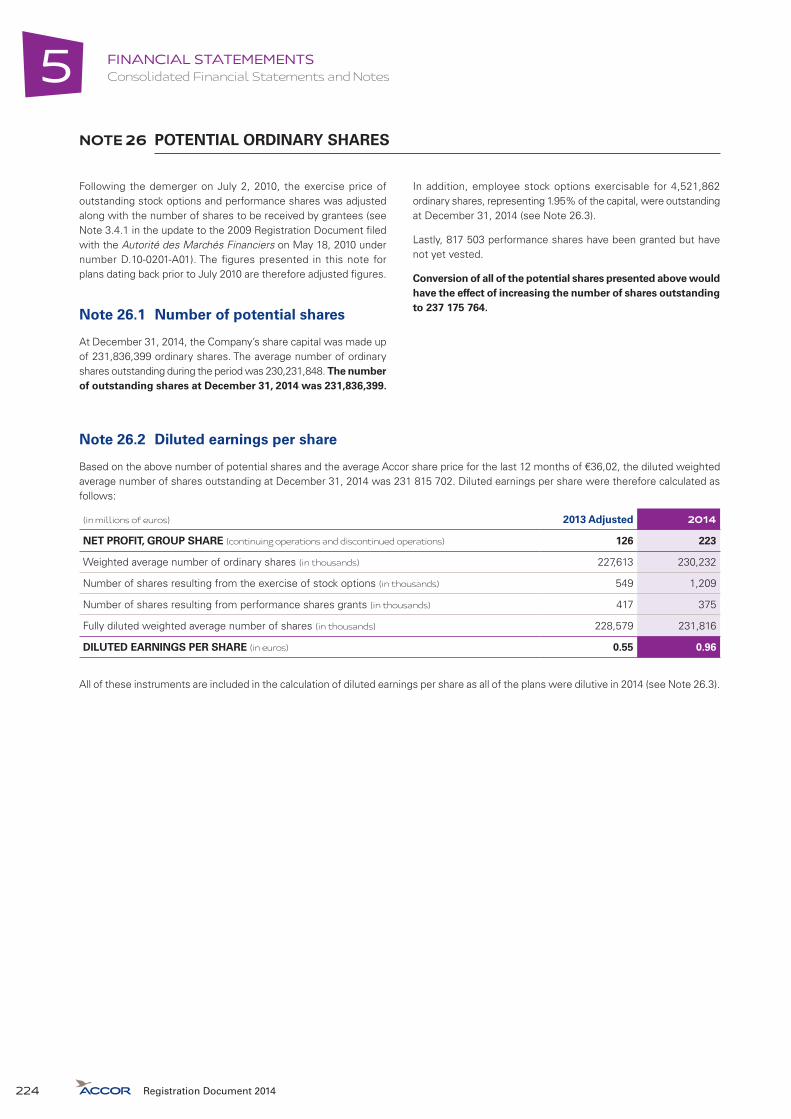
FINANCIAL STATEMEMENTSConsolidated Financial Statements and Notes5
NOTE 26 POTENTIAL ORDINARY SHARES
Following the demerger on July 2, 2010, the exercise price of outstanding stock options and performance shares was adjusted along with the number of shares to be received by grantees (see Note 3.4.1 in the update to the 2009 Registration Document filed with the Autorité des Marchés Financiers on May 18, 2010 under number D.10-0201-A01). The figures presented in this note for plans dating back prior to July 2010 are therefore adjusted figures.
Note 26.1 Number of potential shares
At December 31, 2014, the Company’s share capital was made up of 231,836,399 ordinary shares. The average number of ordinary shares outstanding during the period was 230,231,848. The number of outstanding shares at December 31, 2014 was 231,836,399.
In addition, employee stock options exercisable for 4,521,862 ordinary shares, representing 1.95% of the capital, were outstanding at December 31, 2014 (see Note 26.3).
Lastly, 817 503 performance shares have been granted but have not yet vested.
Conversion of all of the potential shares presented above would have the effect of increasing the number of shares outstanding to 237 175 764.
Note 26.2 Diluted earnings per share
Based on the above number of potential shares and the average Accor share price for the last 12 months of €36,02, the diluted weighted average number of shares outstanding at December 31, 2014 was 231 815 702. Diluted earnings per share were therefore calculated as follows:
(in millions of euros) 2013 Adjusted 2014
NET PROFIT, GROUP SHARE (continuing operations and discontinued operations) 126 223
Weighted average number of ordinary shares (in thousands) 227,613 230,232
Number of shares resulting from the exercise of stock options (in thousands) 549 1,209
Number of shares resulting from performance shares grants (in thousands) 417 375
Fully diluted weighted average number of shares (in thousands) 228,579 231,816
DILUTED EARNINGS PER SHARE (in euros) 0.55 0.96
All of these instruments are included in the calculation of diluted earnings per share as all of the plans were dilutive in 2014 (see Note 26.3).
Registration Document 2014224
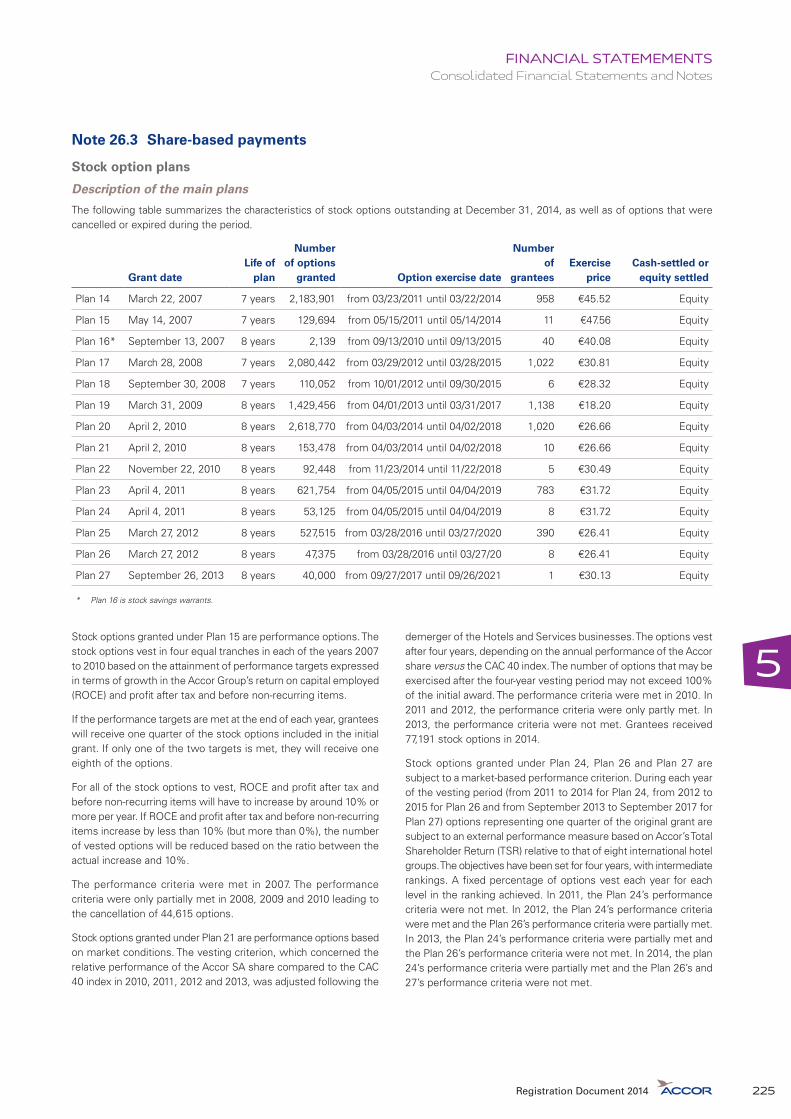
5
FINANCIAL STATEMEMENTSConsolidated Financial Statements and Notes
Note 26.3 Share-based payments
Stock option plans
Description of the main plans
The following table summarizes the characteristics of stock options outstanding at December 31, 2014, as well as of options that were cancelled or expired during the period.
Grant dateLife of
plan
Number of options
granted Option exercise date
Number of
granteesExercise
priceCash-settled or
equity settled
Plan 14 March 22, 2007 7 years 2,183,901 from 03/23/2011 until 03/22/2014 958 €45.52 Equity
Plan 15 May 14, 2007 7 years 129,694 from 05/15/2011 until 05/14/2014 11 €47.56 Equity
Plan 16* September 13, 2007 8 years 2,139 from 09/13/2010 until 09/13/2015 40 €40.08 Equity
Plan 17 March 28, 2008 7 years 2,080,442 from 03/29/2012 until 03/28/2015 1,022 €30.81 Equity
Plan 18 September 30, 2008 7 years 110,052 from 10/01/2012 until 09/30/2015 6 €28.32 Equity
Plan 19 March 31, 2009 8 years 1,429,456 from 04/01/2013 until 03/31/2017 1,138 €18.20 Equity
Plan 20 April 2, 2010 8 years 2,618,770 from 04/03/2014 until 04/02/2018 1,020 €26.66 Equity
Plan 21 April 2, 2010 8 years 153,478 from 04/03/2014 until 04/02/2018 10 €26.66 Equity
Plan 22 November 22, 2010 8 years 92,448 from 11/23/2014 until 11/22/2018 5 €30.49 Equity
Plan 23 April 4, 2011 8 years 621,754 from 04/05/2015 until 04/04/2019 783 €31.72 Equity
Plan 24 April 4, 2011 8 years 53,125 from 04/05/2015 until 04/04/2019 8 €31.72 Equity
Plan 25 March 27, 2012 8 years 527,515 from 03/28/2016 until 03/27/2020 390 €26.41 Equity
Plan 26 March 27, 2012 8 years 47,375 from 03/28/2016 until 03/27/20 8 €26.41 Equity
Plan 27 September 26, 2013 8 years 40,000 from 09/27/2017 until 09/26/2021 1 €30.13 Equity
* Plan 16 is stock savings warrants.
Stock options granted under Plan 15 are performance options. The stock options vest in four equal tranches in each of the years 2007 to 2010 based on the attainment of performance targets expressed in terms of growth in the Accor Group’s return on capital employed (ROCE) and profit after tax and before non-recurring items.
If the performance targets are met at the end of each year, grantees will receive one quarter of the stock options included in the initial grant. If only one of the two targets is met, they will receive one eighth of the options.
For all of the stock options to vest, ROCE and profit after tax and before non-recurring items will have to increase by around 10% or more per year. If ROCE and profit after tax and before non-recurring items increase by less than 10% (but more than 0%), the number of vested options will be reduced based on the ratio between the actual increase and 10%.
The performance criteria were met in 2007. The performance criteria were only partially met in 2008, 2009 and 2010 leading to the cancellation of 44,615 options.
Stock options granted under Plan 21 are performance options based on market conditions. The vesting criterion, which concerned the relative performance of the Accor SA share compared to the CAC 40 index in 2010, 2011, 2012 and 2013, was adjusted following the
demerger of the Hotels and Services businesses. The options vest after four years, depending on the annual performance of the Accor share versus the CAC 40 index. The number of options that may be exercised after the four-year vesting period may not exceed 100% of the initial award. The performance criteria were met in 2010. In 2011 and 2012, the performance criteria were only partly met. In 2013, the performance criteria were not met. Grantees received 77,191 stock options in 2014.
Stock options granted under Plan 24, Plan 26 and Plan 27 are subject to a market-based performance criterion. During each year of the vesting period (from 2011 to 2014 for Plan 24, from 2012 to 2015 for Plan 26 and from September 2013 to September 2017 for Plan 27) options representing one quarter of the original grant are subject to an external performance measure based on Accor’s Total Shareholder Return (TSR) relative to that of eight international hotel groups. The objectives have been set for four years, with intermediate rankings. A fixed percentage of options vest each year for each level in the ranking achieved. In 2011, the Plan 24’s performance criteria were not met. In 2012, the Plan 24’s performance criteria were met and the Plan 26’s performance criteria were partially met. In 2013, the Plan 24’s performance criteria were partially met and the Plan 26’s performance criteria were not met. In 2014, the plan 24’s performance criteria were partially met and the Plan 26’s and 27’s performance criteria were not met.
Registration Document 2014 225

FINANCIAL STATEMEMENTSConsolidated Financial Statements and Notes5
Changes in outstanding stock options during 2013 and 2014 are as follows:
December 31, 2013 December 31, 2014
Number of options
Weighted average
exercise priceNumber
of options
Weighted average
exercise price
OPTIONS OUTSTANDING AT BEGINNING OF PERIOD 11,587,420 €31.07 8,300,398 €31.77
Options granted during the period 40,000 €30.13 - -
Options cancelled or expired during the period (2,754,880) €31.08 (2,093,547) €44.92
Options exercised during the period (572,142) €20.90 (1,684,989) €27.46
OPTIONS OUTSTANDING AT END OF PERIOD 8,300,398 €31.77 4,521,862 €27.29
OPTIONS EXERCISABLE AT END OF PERIOD 4,704,861 €34.91 3,314,855 €26.57
Outstanding options at December 31, 2014 are as follows:
Exercise price
Number of outstanding options
Remaining life of the options
Plan 16 €40.08 2,139 8 months
Plan 17 €30.81 967,560 3 months
Plan 18 €28.32 31,320 9 months
Plan 19 €18.20 559,862 2 years and 3 months
Plan 20 €26.66 1,584,335 3 years and 3 months
Plan 21 €26.66 77,191 3 years and 3 months
Plan 22 €30.49 92,448 3 years and 11 months
Plan 23 €31.72 582,864 4 years and 3 months
Plan 24 €31.72 33,203 4 years and 3 months
Plan 25 €26.41 503,565 5 years and 3 months
Plan 26 €26.41 47,375 5 years and 3 months
Plan 27 €30.13 40,000 6 years and 9 months
Fair value of options
The fair value of these options at the grant date has been determined using the Black & Scholes or Monte Carlo option-pricing models, based on data and assumptions that were valid at that date. The
information presented in this table for plans 14 to 21 (particularly the exercise price, the share price at the grant date and the fair value) has not therefore been adjusted for the effects of the July 2, 2010 demerger.
Registration Document 2014226

5
FINANCIAL STATEMEMENTSConsolidated Financial Statements and Notes
The main data and assumptions used for the fair value calculations are as follows:
Plan 14 Plan 15 Plan 16 Plan 17 Plan 18 Plan 19 Plan 20
Accor share price at the option grant date €70.95 €70.45 €62.35 €47.10 €37.12 €25.49 €41.47
Option exercise price €68.65 €71.72 €60.44 €46.46 €42.70 €27.45 €40.20
Expected volatility (1) 31.73% 31.60% 27.57% 27.87% 26.72% 31.91% 33.96%
Contractual life of the options 7 years 7 years 8 years 7 years 7 years 8 years 8 years
Expected share yield (2) 3.94% 4.25% 4.15% 3.84% 4.03% 2.63% 2.29%
Dividend rate (3) 2.29% 2.29% 2.29% 2.53% 2.53% 2.53% 3.24%
Fair value of options (4) €20.38 €19.36 €16.66 €11.55 €7.00 €5.78 €10.28
Plan 21 Plan 22 Plan 23 Plan 24 Plan 25 Plan 26 Plan 27
Accor share price at the option grant date €41.47 €32.19 €31.96 €31.96 €26.55 €26.55 €30.88
Option exercise price €40.20 €30.49 €31.72 €31.72 €26.41 €26.41 €30.13
Expected volatility (1) 33.96% 34.99% 35.74% 35.74% 39.71% 39.71% 37.16%
Contractual life of the options 8 years 8 years 8 years 8 years 8 years 8 years 8 years
Expected share yield (2) 2.29% 1.98% 2.90% 2.60% 1.67% 1.67% 1.20%
Dividend rate (3) 3.24% 2.22% 2.19% 2.19% 2.42% 2.42% 3.04%
Fair value of options (4) €9.44 €9.25 €9.40 €8.89 €7.88 €6.50 €6.30
(1) Weighted volatility based on exercise periods.(2) Expected share yield based on exercise periods.(3) For the plans granted before 2011, the dividend rate used to measure the fair value of options correspond to the average payout rate for the previous two, three
or four years. For the plans granted in 2011, this rate corresponds to the expected payout rate for 2011. For the plans granted since 2012, this rate corresponds to the payout rate for the previous year.
(4) Fair value of options based on exercise periods.
Maturities of stock options
The Group has decided to base the exercise dates of stock options under these plans on observed exercise dates under previous plans. The same principle has been applied to all plans, as follows:
�� 35% of options exercised after 4 years;
�� 20% of options exercised after 5 years;
�� 35% of options exercised after 6 years;
�� 5% of options exercised after 7 years – 10% for plans 12, 13, 14, 15, 17 and 18;
�� 5% of options exercised after 8 years.
Maturities stock options correspond to the options’ expected lives.
Share price volatility
The Group has chosen to apply a volatility rate calculated by reference to historical data for the eight years preceding the grant date. Different volatility rates have been applied, calculated from granted date, to each maturity as presented above.
Performance share plans
2011 Plan
On April 4, 2011, Accor granted 249,107 performance shares to senior executives and certain employees. Of these:
�� 20,450 have a three-year vesting period followed by a two-year lock-up period;
�� 190,331 have a two-year vesting period followed by a two-year lock-up period;
�� 38,326 have a four-year vesting period with no subsequent lock-up period.
The performance shares are subject to vesting conditions based on business revenue, EBIT and operating cash flow for each of the years 2011 and 2012. Targets have been set for annual growth in relation to the budget over the next two years, with interim milestones, and a certain percentage of the shares vest each year as each milestone is met.
The cost of the performance share plan – corresponding to the fair value of the share grants – amounted to €7.6 million at April 4, 2011 and was being recognized on a straight-line basis over the vesting period under “Employee benefits expense” with a corresponding adjustment to equity. The fair value of the share grants was measured as the average of the Accor share prices for the twenty trading days preceding the grant date multiplied by the number of shares granted under the plan.
In 2011, the performance criteria were met. Plan costs recognized in 2011 amounted to €2.5 million.
In 2012, the performance criteria were almost met. Plan costs recognized in 2012 amounted to €3.3 million.
At December 31, 2013, plan costs recognized amounted to €1 million.
In 2014, plan costs recognized amounted to €0.2 million.
Registration Document 2014 227

FINANCIAL STATEMEMENTSConsolidated Financial Statements and Notes5
2012 Plan
On March 27, 2012, Accor granted 284,976 performance shares to senior executives and certain employees. Of these:
�� 170,332 have a two-year vesting period followed by a two-year lock-up period and are subject to two vesting conditions;
�� 67,269 have a four-year vesting period with no subsequent lock-up period, and are subject to two vesting conditions;
�� 47,375 have a two-year vesting period followed by a two-year lock-up period and are subject to three vesting conditions.
The performance shares are subject to vesting conditions based on EBIT margin, operating cash flow and disposals’ plan for each of the years 2012 and 2013. Targets have been set for annual growth in relation to the budget over the next two years, with interim milestones, and a certain percentage of the shares vest each year as each milestone is met.
The cost of the performance share plan – corresponding to the fair value of the share grants – amounted to €7.1 million at March 27, 2012 and was being recognized on a straight-line basis over the vesting period under “Employee benefits expense” with a corresponding adjustment to equity. The fair value of the share grants was measured as the Accor opening share price on the grant date less the present value of dividends unpaid multiplied by the number of shares granted under the plan.
In 2012, the performance criteria were almost met. Plan costs recognized in 2012 amounted to €2.4 million.
In 2013, the performance criteria were met. Plan costs recognized in 2013 amounted to €2.6 million.
In 2014, plan costs recognized amounted to €0.7 million.
2013 Plan
On April 15, 2013, Accor granted 290,550 performance shares to senior executives and certain employees. Of these:
�� 169,605 have a two-year vesting period followed by a two-year lock-up period and are subject to two vesting conditions;
�� 48,445 have a four-year vesting period with no subsequent lock-up period, and are subject to two vesting conditions;
�� 72,500 have a two-year vesting period followed by a two-year lock-up period and are subject to four vesting conditions.
The performance shares are subject to vesting conditions based on EBIT margin, operating cash flow from operating activities, disposals’ plan and an external vesting condition for each of the years 2013 and 2014. Targets have been set for annual growth in relation to the budget over the next two years, with interim milestones, and a certain percentage of the shares vest each year as each milestone is met.
The cost of the performance share plan – corresponding to the fair value of the share grants – amounted to €6.6 million at April 15, 2013 and was being recognized on a straight-line basis over the vesting period under “Employee benefits expense” with a corresponding adjustment to equity. The fair value of the share grants was measured as the Accor opening share price on the grant date less the present value of dividends unpaid multiplied by the number of shares granted under the plan.
In 2013, the performance criteria were almost met. Plan costs recognized in 2013 amounted to €2.6 million.
In 2014, plan costs recognized amounted to €2.4 million.
2014 Plan
On June 18, 2014, Accor granted 484,400 performance shares to senior executives and certain employees.
Of these:
�� 176,500 have a two-year vesting period followed by a two-year lock-up period and are subject to four vesting conditions;
�� 22,000 have a four-year vesting period with no subsequent lock-up period and are subject to four vesting conditions;
�� 206,050 have a two-year vesting period followed by a two-year lock-up period and are subject to two vesting conditions;
�� 79,850 have a four-year vesting period with no subsequent lock-up period and are subject to two vesting conditions.
The performance shares are subject to vesting conditions based on EBIT margin, operating cash flow from operating activities, completion of planned asset disposals and an external vesting condition for each of the years 2014 and 2015. Targets have been set for annual growth in relation to the budget over the next two years, with interim milestones, and a certain percentage of the shares vest each year as each milestone is met.
Registration Document 2014228

5
FINANCIAL STATEMEMENTSConsolidated Financial Statements and Notes
The cost of the performance share plan – corresponding to the fair value of the share grants – amounted to €16.6 million at June 18, 2014 and is being recognized on a straight-line basis over the vesting period under “Employee benefits expense” with a corresponding adjustment to equity. The fair value of the share grants was measured as the Accor opening share price on the grant date less the present value of unpaid dividends multiplied by the number of shares granted under the plan.
At December 31, 2014, the 2014 performance criteria had substantially been met. The cost of this plan recorded in 2014 amounted to €4.0 million.
Cost of share-based payments recognized in the accounts
The total cost recognized in profit or loss by adjusting equity in respect of share-based payments amounted to €10.0 million at December 31, 2014 when it amounted to €13.5 million at December 31, 2013 of which €2.7 million due to changes in the Executive Management.
NOTE 27 FAIR VALUE ADJUSTMENTS ON FINANCIAL INSTRUMENTS RESERVE
Fair value adjustments on financial instruments reserve break down as follows:
(in millions of euros) 2013 Adjusted 2014
Interest rate and currency swaps (0) (0)
Fair value adjustments to non-consolidated investments (4) (5)
TOTAL FAIR VALUE ADJUSTMENTS ON FINANCIAL INSTRUMENTS RESERVE (4) (5)
Changes in this reserve break down as follows:
(in millions of euros) 2013 Adjusted 2014
CASH FLOW HEDGES 4 0
Gains (losses) recognized in Equity during the period 4 0
Gains (losses) reclassified to profit or loss - -
AVAILABLE FOR SALE FINANCIAL ASSETS (4) (2)
Gains (losses) recognized in Equity during the period (4) (2)
Gains (losses) reclassified to profit or loss - -
CHANGES IN FAIR VALUE ADJUSTMENTS ON FINANCIAL INSTRUMENTS RESERVES 0 (2)
Registration Document 2014 229

FINANCIAL STATEMEMENTSConsolidated Financial Statements and Notes5
NOTE 28 MINORITY INTERESTS
Note 28.1 Changes in Minority Interests
Changes in minority interests break down as follows:
(in millions of euros)
AT DECEMBER 31, 2012 ADJUSTED 228
Minority interests in net profit for the period 11
Dividends paid to minority interests (14)
Increase in capital 1
Translation adjustment (6)
Changes in scope of consolidation (6)
AT DECEMBER 31, 2013 ADJUSTED 214
Minority interests in net profit for the period 17
Dividends paid to minority interests (13)
Capital increase (1)
Translation adjustment (4)
Changes in scope of consolidation (0)
AT DECEMBER 31, 2014 213
There are no significant changes in scope of consolidation, corresponding to changes in Accor’s percent interest without any loss of control.
Note 28.2 Information about material minority interests
Material minority interests are as follows:
Orbis/Hekon (Poland) % interests% voting
rights
Minority interests in net profit
for the period
Minority interests in equity
at period-end
Dividends paid by Accor to minority interests
during the period
December 31, 2013 Adjusted 47.31% 47.31% 8 173 7
December 31, 2014 47.31% 47.31% 9 168 8
Orbis/Hekon (Poland)
Selected financial information about the subsidiary
Current assets
Non-current assets
Current liabilities
Non-current liabilities Revenue
Net Profit or Loss
December 31, 2013 Adjusted 59 431 29 461 163 12
December 31, 2014 56 401 11 446 168 18
This financial information includes adjustments recorded by Accor in 2008 when the Group acquired control of Orbis.
To the best of the Group’s knowledge, no minority shareholders have any particular protective rights that could materially affect Accor’s ability to use and dispose of its subsidiaries’ assets or use and settle their liabilities.
Registration Document 2014230

5
FINANCIAL STATEMEMENTSConsolidated Financial Statements and Notes
NOTE 29 COMPREHENSIVE INCOME
The tax impact of other components of comprehensive income can be analyzed as follows:
(in millions of euros)
2013 Adjusted 2014
Before tax
Income tax
expenseNet of
taxBefore
tax
Income tax
expenseNet
of tax
Currency translation adjustment (208) - (208) 83 - 83
Change in fair value resulting from “Available-for-sale financial assets” (4) - (4) (2) - (2)
Effective portion of gains and losses on hedging instruments in a cash flow hedge 4 - 4 0 - 0
Actuarial gains and losses on defined benefits plans 1 (0) 1 (17) 5 (11)
Share of the other comprehensive income of associates and joint ventures accounted for using the equity method - - - - - -
TOTAL OTHER COMPREHENSIVE INCOME (207) (0) (207) 64 5 69
Note: the amounts in the table are in millions of euros. The sum of these amounts may be slightly different from the totals shown due to rounding differences.
NOTE 30 DEBT BY CURRENCY AND MATURITY
Note 30.1 Long and short-term debt
Long and short-term debt at December 31, 2014 breaks down as follows by currency and interest rate after hedging transactions:
(in millions of euros)
Dec. 2013 Adjusted Effective rate Dec. 2014 Effective rate
EUR 1,906 4.24 2,382 3.11
CHF 16 1.47 197 1.74
JPY 30 0.14 29 0.11
CNY 30 6.32 21 3.42
MUR 23 7.94 26 7.68
COP 16 9.06 15 9.63
Other currencies 57 4.82 61 5.25
LONG AND SHORT-TERM BORROWINGS 2,078 4.28 2,731 3.11
Long and short-term finance lease liabilities 49 72
Purchase commitments 9 11
Liability derivatives - -
Other short-term financial liabilities and bank overdrafts 74 52
LONG AND SHORT-TERM DEBT 2,210 2,866
(in millions of euros) 2013 Adjusted 2014
Long-term debt 1,699 2,784
Short-term debt 511 82
TOTAL LONG AND SHORT-TERM DEBT 2,210 2,866
Registration Document 2014 231

FINANCIAL STATEMEMENTSConsolidated Financial Statements and Notes5
Note 30.2 Maturities of debt
At December 31, 2014, maturities of debt were as follows:
(in millions of euros) 2013 Adjusted 2014
Year Y+1 511 82
Year Y+2 29 20
Year Y+3 21 965
Year Y+4 959 31
Year Y+5 12 614
Year Y+6 612 12
Beyond 66 1,142
TOTAL LONG AND SHORT-TERM DEBT 2,210 2,866
This analysis of debt by maturity over the long-term is considered as providing the most meaningful liquidity indicator. In the above presentation, all derivatives are classified as short-term. Borrowings and short-term investments denominated in foreign currencies have been translated into euros at the rate on the closure date. Interest rate and currency hedging instruments are analysed by maturity in Note 30.5 “Financial Instruments”.
On December 31, 2014, unused long-term committed line is amounting to €1,800 million, expiring in June 2019.
December 2014 financial costs amounted to €58 million. Future financial costs are estimated at €275 million for the period from January 2015 to January 2018 and €71 million thereafter.
2013 financial costs amounted to €83 million. Future financial costs were estimated at €294 million for the period from January 2014 to December 2017 and €90 million thereafter.
These estimates are based on the average cost of debt of the end of the period, after hedging. They have been determined by applying the assumption that no facilities will be rolled over at maturity.
Note 30.3. Long and short-term debt before and after hedging
At December 31, 2014, long and short-term debt breaks down as follows before hedging transactions:
(in millions of euros)
Total debt
Amount Rate % of total debt
EUR 2,510 2.98% 92%
CHF 138 1.73% 5%
JPY - 0.00% 0%
CNY 3 5.59% 0%
MUR 26 7.68% 1%
COP 15 9.63% 1%
Autres devises 39 7.45% 1%
TOTAL LONG AND SHORT-TERM DEBT 2,731 3.06% 100%
Registration Document 2014232

5
FINANCIAL STATEMEMENTSConsolidated Financial Statements and Notes
Long and short-term debt after currency and interest rate hedging breaks down as follows:
(in millions of euros)
Total debt
Amount Rate % of total debt
EUR 2,382 3.11% 87%
CHF 197 1.74% 7%
JPY 29 0.11% 1%
CNY 21 3.42% 1%
MUR 26 7.68% 1%
COP 15 9.63% 1%
Autres devises 61 5.25% 2%
TOTAL LONG AND SHORT-TERM DEBT 2,731 3.11% 100%
Note 30.4 Long and short-term debt by interest rate after hedging
(in millions of euros)
Total debt
Amount Rate
December 2014 2,731 3.11%
December 2013 2,078 4.28%
At December 31, 2014, 98% of long and short-term debt was fixed rate, with an average rate of 3.01%, and 2% was variable rate, with an average rate of 7.26%.
At December 31, 2014, fixed rate debt was denominated primarily in EUR (89%), while variable rate debt was denominated mainly in COP (24%), in MUR (21%) and in EUR (8%).
None of the loan agreements include any rating triggers. However, certain loan agreements include acceleration clauses that may be triggered in the event of a change of control, following the acquisition of more than 50% of outstanding voting rights. Of the overall gross debt of €2,731 million, a total of €2,625 million worth is subject to such clauses. In the case of bonds, the acceleration clause can be
triggered only if the change of control leads to Accor’s credit rating being downgraded to non-investment grade.
Note, however, that in the case of the syndicated loan renegotiated in June 2014, the acceleration clause can be triggered if Accor does not comply with the leverage ratio covenant (consolidated net debt to consolidated EBITDA).
None of the loan agreements include a cross default clause requiring immediate repayment in the event of default on another facility. Cross acceleration clauses only concern loans for periods of at least three years; these clauses would be triggered solely for borrowings and only if material amounts were concerned.
Note 30.5 Financial instruments
1. Currency hedges
The following tables analyzes the nominal amount of currency hedges by maturity and the carrying amount of these instruments in the statement of financial position, corresponding to their fair value, at December 31, 2014:
Forward sales and currency swaps(in millions of euros)
December 31, 2014
Maturity 2015 Nominal amount Fair value
JPY 30 30 -
CZK 11 11 -
HUF 7 7 -
CNY 17 17 -
Other 4 4 -
FORWARD SALES 69 69 -
Registration Document 2014 233

FINANCIAL STATEMEMENTSConsolidated Financial Statements and Notes5
Forward purchases and currency swaps(in millions of euros)
December 31, 2014
Maturity 2015 Nominal amount Fair value
GBP 38 38 1
HKD 91 91 1
AUD 53 53 -
USD 23 23 -
PLN 9 9 -
Other 8 8 -
FORWARD PURCHASES 222 222 2
TOTAL CURRENCY HEDGING 291 291 2
For each currency, the nominal amount corresponds to the amount of currency sold or purchased forward. Fair value corresponds to the difference between the amount of the currency sold (purchased) and the amount of the currency purchased (sold), converted in both cases at the period-end forward exchange rate.
All the currency instruments listed above are used for hedging purposes. Most are designated and documented fair value hedges of intra-group loans and borrowings that qualify for hedge accounting.
At December 31, 2014, the total fair value of currency derivatives was a positive €2 million, recorded in assets.
2. Interest rate hedges
The following table analyse the notional amount of interest rate hedges by maturity and the carrying amount of these instruments in the statement of financial position, corresponding to their fair value, at December 31, 2014:
December 31, 2014
(in millions of euros) 2015 2016 2017 Beyond Nominal amount Fair value
EUR: Fixed-rate borrower swaps and caps - - - 59 59 -
Interest rate hedges - - - 59 59 -
The “notional amount” corresponds to the amount covered by the interest rate hedge. “Fair value” corresponds to the amount that would be payable or receivable if the positions were unwound on the market.
All the interest rate instruments listed above are used for hedging purposes.
At December 31, 2014, the total fair value of rates derivatives was €0 million, recorded in assets.
Registration Document 2014234

5
FINANCIAL STATEMEMENTSConsolidated Financial Statements and Notes
3. Fair value
3.1 Fair value of financial instruments
The carrying amount and fair value of financial instruments at December 31, 2014 are as follows:
(in millions of euros)
December 31, 2014
Carrying amount Fair value
Bonds (1) 2,625 2,808
Bank borrowings 92 92
Finance lease liabilities 72 72
Other financial liabilities 77 77
FINANCIAL LIABILITIES 2,866 3,049
Money market securities (2,549) (2,549)
Cash (126) (126)
Other (30) (30)
Currency derivatives (Fair Value Hedge) (2) (2) (2)
FINANCIAL ASSETS (2,707) (2,707)
NET DEBT 159 342
(1) The fair value of listed bonds corresponds to their quoted market value on the Luxembourg Stock Exchange and on Bloomberg on the last day of the period (level 1 valuation technique: see Note 2.R).
(2) The fair value of forward foreign exchange contracts and interest rate and currency swaps corresponds to the market price that the Group would have to pay or receive to unwind these contracts (level 2 valuation technique: see Note 2.R).
3.2 Fair value of money market securities
The carrying amount and fair value of money market securities at December 31, 2014 are as follows:
(in millions of euros)
December 31, 2014
Carrying amount Fair value
Other negotiable debt securities (1) (1,701) (1,701)
Mutual fund units convertible into cash in less than three months* (2) (831) (831)
Other (accrued interest) (17) (17)
TOTAL MONEY MARKET SECURITIES (2,549) (2,549)
* The fair value of mutual fund units corresponds to their net asset value (level 1 valuation technique: see Note 2.R).(1) Held to maturity investments.(2) Loans and receivables issued by the Group.
Note 30.6 Credit rating
At December 31, 2014, Accor’s credit ratings are as follows:
Rating AgencyLong-term
debtShort-term
DebtLast update of the rating Outlook
Last update of the outlook
Standard & Poor’s BBB- A-3 February 24, 2010 Stable March 9, 2012
Fitch Ratings BBB- F-3 July 2, 2009 Stable May 25, 2011
Standard & Poor’s reaffirmed Accor’s ratings on June 17, 2014 whereas Fitch reaffirmed Accor’s ratings and outlooks on October 27, 2014.
Registration Document 2014 235

FINANCIAL STATEMEMENTSConsolidated Financial Statements and Notes5
NOTE 31 NET DEBT AND NET CASH
Net debt breaks down as follows:
(in millions of euros) 2013 Adjusted 2014
Other long-term financial debt (1) 1,651 2,722
Long-term finance lease liabilities 48 62
Short-term borrowings 494 82
Bank overdrafts 17 0
TOTAL DEBT 2,210 2,866
Short-term loans (30) (16)
Money market securities (2) (1,791) (2,549)
Cash (122) (126)
Asset derivatives - (2)
Short-term receivables on disposals of assets (41) (14)
FINANCIAL ASSETS (1,984) (2,707)
NET DEBT 226 159
(1) See Note 32.(2) See Note 30.5.
(in millions of euros) 2013 Adjusted 2014
NET DEBT AT BEGINNING OF PERIOD 416 226
Change in long-term debt 167 1,084
Change in short-term financial liabilities (316) (428)
Cash and cash equivalents change (53) (743)
Changes in other current financial assets 12 20
CHANGES FOR THE PERIOD (190) (67)
NET DEBT AT END OF PERIOD 226 159
The following table reconciles cash and cash equivalents in the statement of financial position to cash and cash equivalents in the cash flow statement:
(in millions of euros) 2013 Adjusted 2014
BALANCE SHEET CASH AND CASH EQUIVALENTS 1,913 2,677
Bank overdrafts (17) (0)
Derivatives included in liabilities - (0)
CASH FLOW STATEMENT CASH AND CASH EQUIVALENTS 1,896 2,677
Registration Document 2014236

5
FINANCIAL STATEMEMENTSConsolidated Financial Statements and Notes
NOTE 32 ANALYSIS OF FINANCIAL ASSETS AND LIABILITIES UNDER IFRS 7
At December 31, 2014, and December 31, 2013, financial assets and liabilities broke down as follows by category:
(in millions of euros)
Category in the balance-sheet
Fair value for financial instruments recognized
at fair value
Cash and cash
equivalents Loans
Receivables on
disposals of assets
Other financial
investmentsTrade
receivablesCarrying
amountLevel
1*Level
2*Level
3*
Fair value of the class
Bonds and other negotiable debt securities - - - - - - - - - -
HELD TO MATURITY FINANCIAL ASSETS - - - - - - - - -
Short-term loans - 16 - - - 16 - - - -
Long-term loans - 133 - - - 133 - - - -
Receivables on disposals of assets - - 14 - - 14 - - - -
Deposits - - - 70 - 70 - - - -
Trade receivables - - - - 417 417 - - - -
Money market securities 1,701 - - - - 1,701 - - - -
Other 17 - - - - 17 - - - -
LOANS AND RECEIVABLES 1,718 149 14 70 417 2,368 - - - -
Investments in non-consolidated companies - - - 59 - 59 - - 59 59
Mutual fund units convertible into cash 831 - - - - 831 831 - - 831
Other - - - - - - - - -
AVAILABLE FOR SALE FINANCIAL ASSETS 831 - - 59 - 890 831 - 59 890
Interest rate derivatives - - - - - - - - - -
Currency derivatives 2 - - - - 2 - 2 - 2
FINANCIAL ASSETS AT FAIR VALUE 2 - - - - 2 - 2 - 2
CASH AT BANK 126 - - - - 126 - - - -
FINANCIAL ASSETS AT DECEMBER 31, 2014 2,677 149 14 129 417 3,386 831 2 59 892
Registration Document 2014 237

FINANCIAL STATEMEMENTSConsolidated Financial Statements and Notes5
(in millions of euros)
Category in the balance-sheet
Fair value for financial instruments recognized
at fair value
Cash and cash
equivalents Loans
Receivables on
disposals of assets
Other financial
investmentsTrade
receivablesCarrying
amountLevel
1*Level
2*Level
3*
Fair value of the class
Bonds and other negotiable debt securities - - - - - - - - - -
HELD TO MATURITY FINANCIAL ASSETS - - - - - - - - - -
Short-term loans - 30 - - - 30 - - - -
Long-term loans - 98 - - - 98 - - - -
Receivables on disposals of assets - - 41 - - 41 - - - -
Deposits - - - 119 - 119 - - - -
Trade receivables - - - - 379 379 - - - -
Money market securities 1,753 - - - - 1,753 - - - -
Other - - - - - - - - - -
LOANS AND RECEIVABLES 1,753 128 41 119 379 2,420 - - - -
Investments in non-consolidated companies - - - 55 - 55 - - 55 55
Mutual fund units convertible into cash 38 - - - - 38 38 - - 38
Other - - - - - - - - -
AVAILABLE FOR SALE FINANCIAL ASSETS 38 - - 55 - 93 38 - 55 93
Interest rate derivatives - - - - - - - - - -
Currency derivatives - - - - - 0 - - - -
FINANCIAL ASSETS AT FAIR VALUE - - - - - 0 - - - -
CASH AT BANK 122 - - - - 122 - - - -
FINANCIAL ASSETS AT DECEMBER 31, 2013 1,913 128 41 174 379 2,635 38 - 55 93
Registration Document 2014238

5
FINANCIAL STATEMEMENTSConsolidated Financial Statements and Notes
(in millions of euros)
Category in the balance-sheet
Fair value for financial instruments recognized
at fair value
Bank overdrafts
Other long-term
financial debt
Short-term debt
Long-term finance
lease liabilities
Trade payables
Carrying amount
Level 1*
Level 2*
Level 3*
Fair value of the class
Currency derivatives - - - - - - - - - -
Interest rate derivatives - - - - - - - - - -
FINANCIAL LIABILITIES AT FAIR VALUE THROUGH PROFIT OR LOSS - - - - - - - - - -
Convertible bonds/Equity Notes - - - - - - - - - -
Other bonds - 2,625 - - - 2,625 - - - -
Bank Borrowings - 82 10 - - 92 - - - -
Finance lease liabilities - - 10 62 - 72 - - - -
Other debts - 15 62 - - 77 - - - -
Trade payables - - - - 690 690 - - - -
FINANCIAL LIABILITIES AT AMORTISED COST - 2,722 82 62 690 3,556 - - - -
CASH AT BANK - - - - - - - - - -
FINANCIAL LIABILITIES AT DECEMBER 31, 2014 0 2,722 82 62 690 3,556 - - - -
Registration Document 2014 239

FINANCIAL STATEMEMENTSConsolidated Financial Statements and Notes5
(in millions of euros)
Category in the balance-sheet
Fair value for financial instruments recognized
at fair value
Bank overdrafts
Other long-term
financial debt
Short-term debt
Long-term finance
lease liabilities
Trade payables
Carrying amount
Level 1*
Level 2*
Level 3*
Fair value of the class
Currency derivatives - - - - - - - - - -
Interest rate derivatives - - - - - - - - - -
FINANCIAL LIABILITIES AT FAIR VALUE THROUGH PROFIT OR LOSS - - - - - - - - - -
Convertible bonds/Equity Notes - - - - - - - - - -
Other bonds - 1,542 402 - - 1,944 - - - -
Bank Borrowings - 97 28 - - 125 - - - -
Finance lease liabilities - - 1 48 - 49 - - - -
Other debts - 12 63 - - 75 - - - -
Trade payables - - - - 599 599 - - - -
FINANCIAL LIABILITIES AT AMORTISED COST - 1,651 494 48 599 2,792 - - - -
CASH AT BANK 17 - - - - 17 - - - -
FINANCIAL LIABILITIES AT DECEMBER 31, 2013 17 1,651 494 48 599 2,809 - - - -
* The fair value hierarchies have three levels: see Note 2.R. Fair value hierarchies are presented only for financial instruments measured at fair value.
The methods used to measure the fair value of derivative instruments, mutual fund unit convertible into cash and bonds are described in Note 30. The method used to measure the fair value of investments in non-consolidated companies is described in Note 2.N.1.
No assets were transferred between fair value measurements levels during the periods presented.
Registration Document 2014240
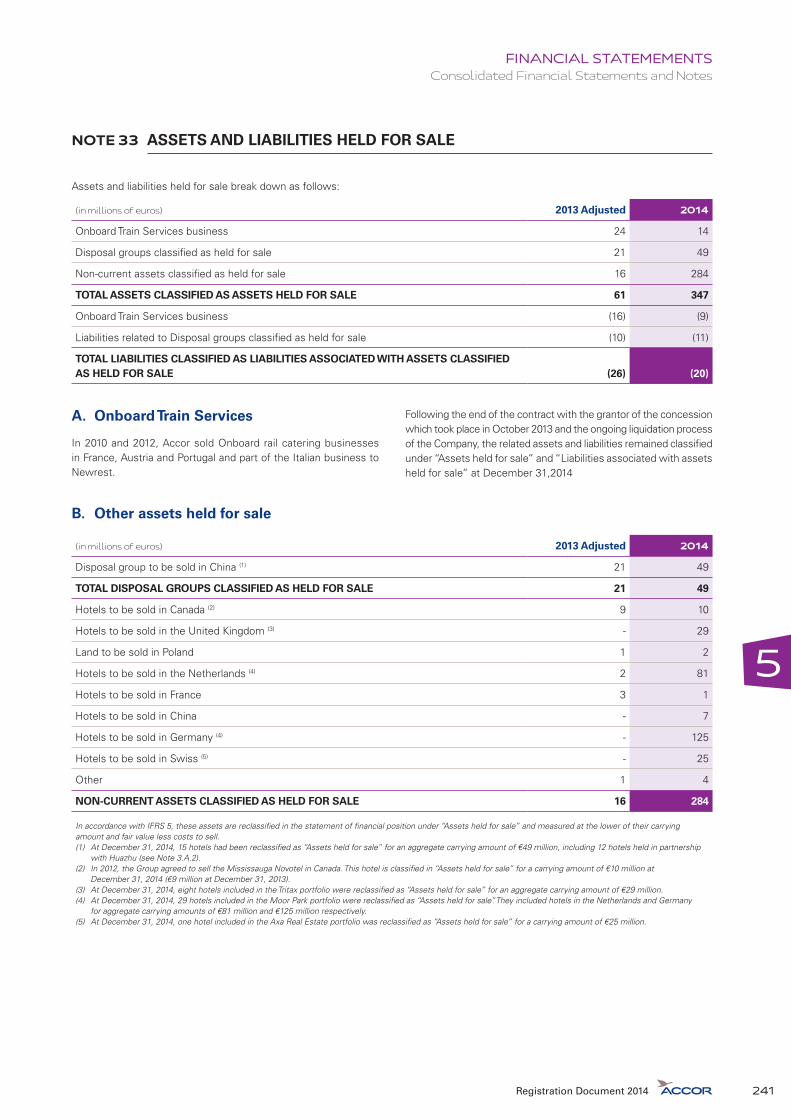
5
FINANCIAL STATEMEMENTSConsolidated Financial Statements and Notes
NOTE 33 ASSETS AND LIABILITIES HELD FOR SALE
Assets and liabilities held for sale break down as follows:
(in millions of euros) 2013 Adjusted 2014
Onboard Train Services business 24 14
Disposal groups classified as held for sale 21 49
Non-current assets classified as held for sale 16 284
TOTAL ASSETS CLASSIFIED AS ASSETS HELD FOR SALE 61 347
Onboard Train Services business (16) (9)
Liabilities related to Disposal groups classified as held for sale (10) (11)
TOTAL LIABILITIES CLASSIFIED AS LIABILITIES ASSOCIATED WITH ASSETS CLASSIFIED AS HELD FOR SALE (26) (20)
A. Onboard Train Services
In 2010 and 2012, Accor sold Onboard rail catering businesses in France, Austria and Portugal and part of the Italian business to Newrest.
Following the end of the contract with the grantor of the concession which took place in October 2013 and the ongoing liquidation process of the Company, the related assets and liabilities remained classified under “Assets held for sale” and “Liabilities associated with assets held for sale” at December 31,2014
B. Other assets held for sale
(in millions of euros) 2013 Adjusted 2014
Disposal group to be sold in China (1) 21 49
TOTAL DISPOSAL GROUPS CLASSIFIED AS HELD FOR SALE 21 49
Hotels to be sold in Canada (2) 9 10
Hotels to be sold in the United Kingdom (3) - 29
Land to be sold in Poland 1 2
Hotels to be sold in the Netherlands (4) 2 81
Hotels to be sold in France 3 1
Hotels to be sold in China - 7
Hotels to be sold in Germany (4) - 125
Hotels to be sold in Swiss (5) - 25
Other 1 4
NON-CURRENT ASSETS CLASSIFIED AS HELD FOR SALE 16 284
In accordance with IFRS 5, these assets are reclassified in the statement of financial position under “Assets held for sale” and measured at the lower of their carrying amount and fair value less costs to sell.(1) At December 31, 2014, 15 hotels had been reclassified as “Assets held for sale” for an aggregate carrying amount of €49 million, including 12 hotels held in partnership
with Huazhu (see Note 3.A.2).(2) In 2012, the Group agreed to sell the Mississauga Novotel in Canada. This hotel is classified in “Assets held for sale” for a carrying amount of €10 million at
December 31, 2014 (€9 million at December 31, 2013).(3) At December 31, 2014, eight hotels included in the Tritax portfolio were reclassified as “Assets held for sale” for an aggregate carrying amount of €29 million.(4) At December 31, 2014, 29 hotels included in the Moor Park portfolio were reclassified as “Assets held for sale”. They included hotels in the Netherlands and Germany
for aggregate carrying amounts of €81 million and €125 million respectively.(5) At December 31, 2014, one hotel included in the Axa Real Estate portfolio was reclassified as “Assets held for sale” for a carrying amount of €25 million.
Registration Document 2014 241

FINANCIAL STATEMEMENTSConsolidated Financial Statements and Notes5
NOTE 34 PROVISIONS
Movements in long-term provisions between December 31, 2013 and December 31, 2014 can be analysed as follows:
(in millions of euros)
2013 Adjusted
Equity impact Increases Utilizations
Reversals of unused provisions
Translation adjustment
Reclassifications and changes
in scope 2014
Provisions for pensions* 19 6 2 (1) (1) 0 (1) 24
Provisions for loyalty bonuses* 1 - - (0) (0) (0) 1 2
Provisions for claims and litigation and others contingencies 0 - - - - (0) 0 0
HOTELSERVICES 20 6 2 (1) (1) 0 0 26
Provisions for pensions* 36 8 5 (3) (1) 0 (0) 45
Provisions for loyalty bonuses* 18 - 2 (2) (0) (0) (0) 18
Provisions for claims and litigation and others contingencies 5 - 7 - - (0) (2) 10
HOTELINVEST 59 8 14 (5) (1) (0) (2) 73
CORPORATE/INTERCOS 29 3 3 - (2) - 1 34
TOTAL LONG-TERM PROVISIONS 108 17 19 (6) (4) 0 (1) 133
* See Note 34.C.
Movements in short-term provisions between December 31, 2013 and December 31, 2014 can be analysed as follows:
(in millions of euros)
2013 Adjusted Increases Utilizations
Reversals of unused provisions
Translation adjustment
Reclassifications and changes
in scope 2014
Tax provisions 0 1 (1) (0) 0 3 3
Restructuring provisions 32 3 (35) (4) 0 12 8
Provisions for claims and litigation and others contingencies 16 7 (3) (3) 1 (1) 17
HOTELSERVICES 48 11 (39) (7) 1 14 28
Tax provisions 11 2 (1) (0) (0) (3) 9
Restructuring provisions 11 3 (7) (3) 0 (0) 4
Provisions for claims and litigation and others contingencies 91 23 (29) (10) 1 12 88
HOTELINVEST 113 28 (37) (13) 1 9 101
CORPORATE/INTERCOS 83 7 (20) (5) - (22) 43
TOTAL SHORT-TERM PROVISIONS 244 46 (96) (25) 2 1 172
At December 31, 2014, ordinary provisions for claims and litigation and others include:
�� €38 million provisions for various claims;
�� €5 million in provisions for various litigations;
�� €8 million provision for employee-related claims.
At December 31, 2013, ordinary provisions for claims and litigation and others included:
�� €36 million in provisions for various claims;
�� €10 million in provisions for various litigations;
�� €10 million in provisions for performance bonds issued in connection with real estate transactions;
�� €9 million in provisions for employee-related claims.
Restructuring provisions at December 31, 2013 included €42 million in provisions for voluntary separation plans within the Group (see Note 3 I). The residual provision related to these plans amounted to €7 million at December 2014.
Registration Document 2014242

5
FINANCIAL STATEMEMENTSConsolidated Financial Statements and Notes
Net provision expense – corresponding to increase in provisions less reversals of utilized and unutilized provisions set up in prior periods – is recorded under the following income statement captions:
(in millions of euros) HotelServices HotelInvestCorporate/
Intercos 2014
EBIT (6) 2 2 (2)
Finance cost, net 1 2 1 4
Provision for losses on hotel properties - (10) - (10)
Provision on other assets and restructuring provisions (30) (9) (21) (60)
Provision for tax - 1 1 2
TOTAL (35) (14) (17) (66)
Provisions for pensions and other post-employment benefits
A. Description of the plans
Group employees receive various short-term benefits (paid vacation, paid sick leave and profit-shares), long-term benefits (long-service awards, long-term disability benefits, loyalty bonuses and seniority bonuses), as well as various post-employment benefits provided under defined contribution and defined benefit plans (length-of-service awards payable on retirement, pension benefits).
Short-term benefit obligations are recognized in the statements of financial position of the Group entities concerned.
Post-employment benefits are provided under either defined contribution or defined benefit plans.
Defined contribution plans
Obligations under these plans are funded by periodic contributions to external organizations that are responsible for the administrative and financial management of the plans. The external organization is responsible for all benefit payments and the Group has no liability beyond the payment of contributions. Examples of defined contribution plans include the government-sponsored basic pension and supplementary pension (ARRCO/AGIRC) schemes in France and defined contribution pension schemes in other countries.
Contributions to these plans are recognized in the period to which they relate.
Defined benefit plans
Benefits paid under the Group’s defined benefit plans are determined based on employees’ years of service with the Group. The benefit obligation is generally funded by plan assets, with any unfunded portion recognized as a liability in the statement of financial position.
The defined benefit obligation (DBO) is determined by the projected unit credit method, based on actuarial assumptions concerning future salary levels, retirement age, mortality rates, staff turnover rates and the discount rate. These assumptions take into account the macro-economic situation and other specific circumstances in each host country and region.
Actuarial gains and losses arising from changes in actuarial assumptions and experience adjustments are recognized immediately in equity, in accordance with Group accounting policy.
At Accor, the main post-employment defined benefit plans concern:
�� length-of-service awards in France:
�y these are lump-sum payments made to employees on retirement. They are determined by reference to the employee’s years of service and end-of-career salary,
�y the calculation is based on parameters defined by Corporate Finance and Human Resources once a year during the second half,
�y the related obligation is covered by a provision;
�� length-of-service awards in Italy:
�y these are lump-sum payments made to employees on retirement. They are determined by reference to the employee’s years of service, end-of-career salary, and whether they leave on their own initiative or on that of the Company,
�y the related obligation is covered by a provision;
�� pensions: the main defined benefit pension plans are for employees in France and in the Worldwide Structures (51% of the obligation), in the Netherlands (22% of the obligation), in Belgium (8% of the obligation) and in Switzerland (7% of the obligation). The plan in the Netherlands is closed to new participants and is fully funded, with the result that no provision has been recognized in the statement of financial position for this plan. Pension benefit obligations are determined by reference to employees’ years of service and end-of-career salary. They are funded by payments to external organizations that are legally separate from Accor Group. In the Worldwide Structures, the pension plan concerns senior executives. Pension rights are unvested and plan participants receive a regular pension, not a lump sum. In the Netherlands, the plan concerns all employees and provides for the payment of a lump sum to participants on retirement.
In 2013, the implementation of voluntary separation plans and the departure of certain Executive Committee members led to the recognition of a curtailment gain.
Registration Document 2014 243

FINANCIAL STATEMEMENTSConsolidated Financial Statements and Notes5
B. Actuarial assumptions
Actuarial valuations are based on a certain number of long-term parameters supplied by the Group, which are reviewed each year.
2014 France
Europe excluding FranceWorldwide Structures
Other countriesNetherlands Germany Belgium Poland Switzerland Italy
Rate of future salary increases 3.0% 3.0% 1.5% 3.0% 3.0% 1.5% 2.0% 3.0% 2%-10%
Discount rate 2.0% 2.0% 2.0% 2.0% 3.3% 1.5% 2.0% 2.0% 4%-8.7%
2013 France
Europe excluding FranceWorldwide Structures
Other countriesNetherlands Germany Belgium Poland Switzerland Italy
Rate of future salary increases 3.0% 3.0% 1.5% 3.0% 3.0% 1.0% N/A 4.0% 2%-10%
Discount rate 3.0% 3.0% 3.0% 3.0% 4.5% 2.0% 3.0% 3.0% 4%-8.7%
The assumptions concerning the discount rate applied to calculate the present value of benefit obligations were determined based on the recommendations of independent experts. For subsidiaries located in the euro zone, the discount rate is determined based on the iBoxx Corporate AA 10+ euro zone index. For subsidiaries outside the euro zone, the discount rate is based on an analysis of investment grade corporate bond yields in each region. The calculation method is designed to obtain a discount rate that is appropriate in light of the timing of cash flows under the plan. In all other cases, the discount rate is based on government bond rates.
The Accor Group’s pension obligations are funded under insured plans or by external funds. Plan assets therefore consist mainly of the classes of assets held in insurers’ general portfolios managed according to conservative investment strategies. Since January 1, 2013, in line with IAS 19 (revised), the expected long-term return on plan assets had been matched to the discount rate (see Note 2).
Registration Document 2014244

5
FINANCIAL STATEMEMENTSConsolidated Financial Statements and Notes
C. Funded status of post-employment defined benefit plans and long-term employee benefits
The method used by the Group is the “Projected Unit Credit” method.
At December 31, 2014(in millions of euros) Pensions
Other post-employment
benefits* Total
Present value of funded obligation 171 - 171
Fair value of plan assets (114) - (114)
EXCESS OF BENEFIT OBLIGATION/(PLAN ASSETS) 57 - 57
Present value of unfunded obligation - 66 66
LIABILITY RECOGNIZED IN THE BALANCE SHEET 57 66 123
* Including length-of-service awards and loyalty bonus.
At December 31, 2013(in millions of euros) Pensions
Other post-employment
benefits* Total
Present value of funded obligation 143 - 143
Fair value of plan assets (102) - (102)
EXCESS OF BENEFIT OBLIGATION/(PLAN ASSETS) 41 - 41
Present value of unfunded obligation - 63 63
LIABILITY RECOGNIZED IN THE BALANCE SHEET 41 63 104
* Including length-of-service awards and loyalty bonus.
Registration Document 2014 245

FINANCIAL STATEMEMENTSConsolidated Financial Statements and Notes5
Change in the funded status of post-employment defined benefit plans and long-term employee benefits by geographical area
(in millions of euros)
Pensions Pensions
Other benefits Total Dec. 2014Total Dec. 2013
AdjustedFrance
Europe excluding FranceWorldwide structures Other TotalNetherlands Germany Belgium Poland Switzerland Italy
PROJECTED BENEFIT OBLIGATION AT THE BEGINNING OF THE PERIOD 25 44 12 17 1 14 4 62 7 185 19 206 216
Current service cost 1 0 0 1 0 1 - 2 1 6 2 8 12
Interest Cost 1 1 0 1 0 0 0 2 0 6 1 6 6
Employee contributions for the period - 0 - 0 - 1 - - - 1 - 1 1
(Gains) losses on curtailments/settlements (0) - - - 0 - - (2) (0) (3) (0) (3) (19)
Taxes and administrative expenses - - - (0) - (1) - (0) - (1) - (1) (1)
Effect of changes in scope of consolidation 0 - - - - - - - - 0 - 0 0
Benefits paid during the period (0) (1) (1) (0) (0) (1) (1) (2) (0) (7) (2) (9) (9)
Actuarial (gains)/losses recognised during the period 4 9 2 7 0 2 - 5 0 29 0 29 (1)
Exchange differences - - - - (0) 0 - - 0 0 (0) 0 (1)
Transfers at beginning of period - - - - - - - (0) - (0) (0) (0) 1
Other 0 - - - - - (0) - - (0) - (0) (0)
PROJECTED BENEFIT OBLIGATION AT THE END OF THE PERIOD 30 53 13 25 1 17 3 67 8 217 20 238 206
FAIR VALUE OF PLAN ASSETS AT THE BEGINNING OF THE PERIOD - 44 5 13 - 11 - 29 - 102 - 102 101
Return on plan assets, excluding interest income - 9 - 0 - 1 - 2 - 12 - 12 0
Interest income - 1 0 0 - 0 - 1 - 3 - 3 3
Employer contributions for the period - 0 0 1 - 1 - - - 2 - 2 2
Employee contributions for the period - 0 - 0 - 1 - - - 1 - 1 1
Benefits paid during the period - (1) (0) (0) - (1) - (2) - (5) - (5) (5)
(Gains) losses on curtailments/settlements - - - - - - - - - - - - (1)
Taxes and administrative expenses - (0) - (0) - (1) - - - (1) - (1) (1)
Exchange differences - - - - - 0 - - - 0 - 0 (0)
FAIR VALUE OF PLAN ASSETS AT THE END OF THE PERIOD - 53 5 14 - 13 - 30 0 115 - 115 102
Registration Document 2014246

5
FINANCIAL STATEMEMENTSConsolidated Financial Statements and Notes
Change in the funded status of post-employment defined benefit plans and long-term employee benefits by geographical area
(in millions of euros)
Pensions Pensions
Other benefits Total Dec. 2014Total Dec. 2013
AdjustedFrance
Europe excluding FranceWorldwide structures Other TotalNetherlands Germany Belgium Poland Switzerland Italy
PROJECTED BENEFIT OBLIGATION AT THE BEGINNING OF THE PERIOD 25 44 12 17 1 14 4 62 7 185 19 206 216
Current service cost 1 0 0 1 0 1 - 2 1 6 2 8 12
Interest Cost 1 1 0 1 0 0 0 2 0 6 1 6 6
Employee contributions for the period - 0 - 0 - 1 - - - 1 - 1 1
(Gains) losses on curtailments/settlements (0) - - - 0 - - (2) (0) (3) (0) (3) (19)
Taxes and administrative expenses - - - (0) - (1) - (0) - (1) - (1) (1)
Effect of changes in scope of consolidation 0 - - - - - - - - 0 - 0 0
Benefits paid during the period (0) (1) (1) (0) (0) (1) (1) (2) (0) (7) (2) (9) (9)
Actuarial (gains)/losses recognised during the period 4 9 2 7 0 2 - 5 0 29 0 29 (1)
Exchange differences - - - - (0) 0 - - 0 0 (0) 0 (1)
Transfers at beginning of period - - - - - - - (0) - (0) (0) (0) 1
Other 0 - - - - - (0) - - (0) - (0) (0)
PROJECTED BENEFIT OBLIGATION AT THE END OF THE PERIOD 30 53 13 25 1 17 3 67 8 217 20 238 206
FAIR VALUE OF PLAN ASSETS AT THE BEGINNING OF THE PERIOD - 44 5 13 - 11 - 29 - 102 - 102 101
Return on plan assets, excluding interest income - 9 - 0 - 1 - 2 - 12 - 12 0
Interest income - 1 0 0 - 0 - 1 - 3 - 3 3
Employer contributions for the period - 0 0 1 - 1 - - - 2 - 2 2
Employee contributions for the period - 0 - 0 - 1 - - - 1 - 1 1
Benefits paid during the period - (1) (0) (0) - (1) - (2) - (5) - (5) (5)
(Gains) losses on curtailments/settlements - - - - - - - - - - - - (1)
Taxes and administrative expenses - (0) - (0) - (1) - - - (1) - (1) (1)
Exchange differences - - - - - 0 - - - 0 - 0 (0)
FAIR VALUE OF PLAN ASSETS AT THE END OF THE PERIOD - 53 5 14 - 13 - 30 0 115 - 115 102
Registration Document 2014 247

FINANCIAL STATEMEMENTSConsolidated Financial Statements and Notes5
(in millions of euros)
Pensions Pensions
Other benefits Total Dec. 2014Total Dec. 2013
AdjustedFrance
Europe excluding FranceWorldwide structures Other TotalNetherlands Germany Belgium Poland Switzerland Italy
UNFUNDED OBLIGATION AT THE BEGINNING OF THE PERIOD 25 0 7 4 1 3 4 33 7 84 19 104 115
Current service cost 1 0 0 1 0 1 - 2 1 6 2 8 12
Interest cost 1 0 0 0 0 0 0 1 0 3 1 3 3
(Gains) losses on curtailments/settlements (0) - - - 0 - - (2) (0) (3) (0) (3) (19)
Expense for the period (0) 0 (0) - (0) - (1) - (0) (2) (2) (4) (4)
Employer contributions for the period - (0) (0) (1) - (1) - - - (2) - (2) (2)
Employee contributions for the period - - - - - 0 - - - 0 - 0 0
Taxes and administrative expenses - 0 - 0 - 0 - (0) - (0) - (0) 0
Effect of changes in scope of consolidation 0 - - - - - - - - 0 - 0 0
Exchange differences - - - - (0) 0 - - 0 0 (0) (0) (1)
Actuarial (gains)/losses recognised during the period 4 (0) 2 6 0 1 - 3 0 17 0 17 (1)
Transfers at beginning of period - - - - - - - (0) - (0) (0) (0) 1
Other 0 - - - - - (0) - - (0) - (0) (0)
UNFUNDED OBLIGATION AT THE END OF THE PERIOD 30 0 8 11 1 4 3 37 8 103 20 123 104
Reclassification of Onboard Train Services in “Assets held for sale” - - - - - - (0) - - (0) - (0) (0)
PROVISION AT THE END OF THE PERIOD 30 0 8 11 1 4 3 37 8 103 20 123 104
Current service cost 1 0 0 1 0 1 - 2 1 6 2 8 12
Interest cost 1 0 0 0 0 0 0 1 0 3 - 3 3
(Gains) losses on curtailments/settlements (0) - - - 0 - - (2) (0) (3) (0) (3) (19)
Others - 0 - 0 - 0 - (0) - (0) - (0) 0
Actuarial (gains)/losses recognized during the period for long-term employee benefits - - - - - - - - - - - - -
EXPENSE FOR THE PERIOD 2 0 0 1 0 1 0 1 1 6 2 9 (4)
ACTUARIAL (GAINS) LOSSES RECOGNIZED IN EQUITY 4 (0) 2 6 0 1 - 3 0 17 - 17 (1)
Registration Document 2014248
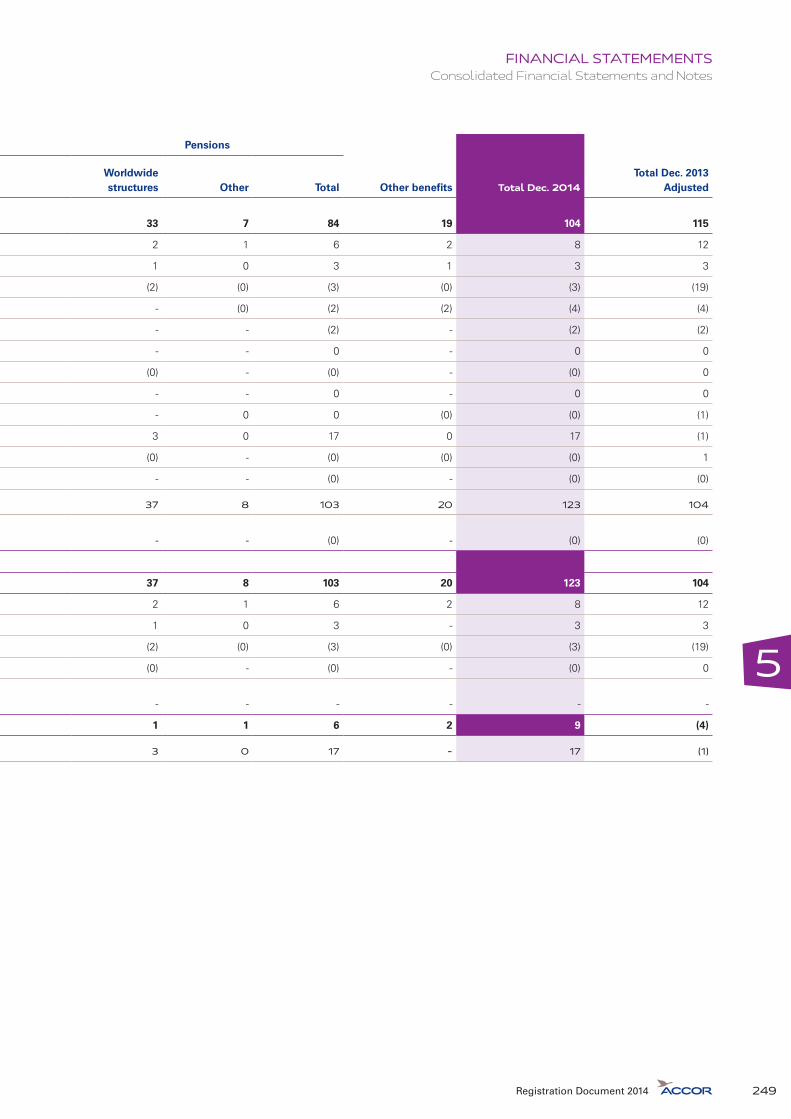
5
FINANCIAL STATEMEMENTSConsolidated Financial Statements and Notes
(in millions of euros)
Pensions Pensions
Other benefits Total Dec. 2014Total Dec. 2013
AdjustedFrance
Europe excluding FranceWorldwide structures Other TotalNetherlands Germany Belgium Poland Switzerland Italy
UNFUNDED OBLIGATION AT THE BEGINNING OF THE PERIOD 25 0 7 4 1 3 4 33 7 84 19 104 115
Current service cost 1 0 0 1 0 1 - 2 1 6 2 8 12
Interest cost 1 0 0 0 0 0 0 1 0 3 1 3 3
(Gains) losses on curtailments/settlements (0) - - - 0 - - (2) (0) (3) (0) (3) (19)
Expense for the period (0) 0 (0) - (0) - (1) - (0) (2) (2) (4) (4)
Employer contributions for the period - (0) (0) (1) - (1) - - - (2) - (2) (2)
Employee contributions for the period - - - - - 0 - - - 0 - 0 0
Taxes and administrative expenses - 0 - 0 - 0 - (0) - (0) - (0) 0
Effect of changes in scope of consolidation 0 - - - - - - - - 0 - 0 0
Exchange differences - - - - (0) 0 - - 0 0 (0) (0) (1)
Actuarial (gains)/losses recognised during the period 4 (0) 2 6 0 1 - 3 0 17 0 17 (1)
Transfers at beginning of period - - - - - - - (0) - (0) (0) (0) 1
Other 0 - - - - - (0) - - (0) - (0) (0)
UNFUNDED OBLIGATION AT THE END OF THE PERIOD 30 0 8 11 1 4 3 37 8 103 20 123 104
Reclassification of Onboard Train Services in “Assets held for sale” - - - - - - (0) - - (0) - (0) (0)
PROVISION AT THE END OF THE PERIOD 30 0 8 11 1 4 3 37 8 103 20 123 104
Current service cost 1 0 0 1 0 1 - 2 1 6 2 8 12
Interest cost 1 0 0 0 0 0 0 1 0 3 - 3 3
(Gains) losses on curtailments/settlements (0) - - - 0 - - (2) (0) (3) (0) (3) (19)
Others - 0 - 0 - 0 - (0) - (0) - (0) 0
Actuarial (gains)/losses recognized during the period for long-term employee benefits - - - - - - - - - - - - -
EXPENSE FOR THE PERIOD 2 0 0 1 0 1 0 1 1 6 2 9 (4)
ACTUARIAL (GAINS) LOSSES RECOGNIZED IN EQUITY 4 (0) 2 6 0 1 - 3 0 17 - 17 (1)
Registration Document 2014 249

FINANCIAL STATEMEMENTSConsolidated Financial Statements and Notes5
Reconciliation of provisions for pensions between January 1, 2013 and December 31, 2014
(in millions of euros) Amount
PROVISION AT JANUARY 1, 2013 ADJUSTED 115
Expense for the period (4)
Benefits paid (6)
Actuarial gains and losses recognized in equity (1)
Changes in exchange rates (0)
Other 0
PROVISION AT DECEMBER 31, 2013 ADJUSTED 104
Expense for the period 9
Benefits paid (6)
Actuarial gains and losses recognized in equity 17
Changes in scope of consolidation (0)
Changes in exchange rates (0)
Other 0
PROVISION AT DECEMBER 31, 2014 123
Actuarial gains and losses related to changes in demographic and financial assumptions and experience adjustment
(in millions of euros) 2013 Adjusted 2014
ACTUARIAL DEBT
Actuarial gains and losses related to experience adjustment (1) (6)
Actuarial gains and losses related to changes in demographic assumptions 0 0
Actuarial gains and losses related to changes in financial assumptions (0) 23
Detail of plan assets
The assets of insured defined benefit plans are invested in investment funds held by insurance companies in each of the countries concerned except for Worldwide Structures.
The following table shows the breakdown of these plan assets by country (except for the Netherlands for which no information is available):
Detail of plan assets Netherlands Germany Belgium SwitzerlandWorldwide Structures
Bonds - 5 12 5 25
Real Estate - - 1 3 2
Shares - - 1 3 3
Liquidity - - 0 1 -
Other 53 - 0 1 -
TOTAL VALUE OF PLAN ASSETS 53 5 14 13 30
Sensitivity analysis
At December 31, 2014, the sensitivity of provisions for pensions and other post-employment benefits to a change in discount rate is as follows: a 0.5 point increase in the discount rate would lead to a €12.7 million reduction in the projected benefit obligation, a 0.5 point decrease in the discount rate would lead to a €14.2 million increase in the projected benefit obligation. The impact on the cost for the year would not be material.
At December 31, 2013, the sensitivity of provisions for pensions and other post-employment benefits to a change in discount rate is as follows: a 0.5 point increase in the discount rate would lead to a €9.8 million reduction in the projected benefit obligation, a 0.5 point decrease in the discount rate would lead to a €10.7 million increase in the projected benefit obligation. The impact on the cost for the year would not be material.
Registration Document 2014250

5
FINANCIAL STATEMEMENTSConsolidated Financial Statements and Notes
Expected cash flows
The following table shows expected cash outflows for the coming years, without taking account any cash inflows generated by plan assets:
Expected cash flows(in millions of euros) France Netherlands Germany Belgium Poland Switzerland Italy
Worldwide Structures Total
Expected benefits payment in 2015 1 1 1 1 0 2 0 2 9
Expected benefits payment in 2016 0 1 1 1 0 1 0 2 7
Expected benefits payment from 2017 to 2023 9 14 5 7 4 6 2 14 60
Expected contributions in 2015 - 0 0 1 - 1 - - 3
NOTE 35 RECONCILIATION OF FUNDS FROM OPERATIONS
(in millions of euros) 2013 Adjusted 2014
Net Profit, Group share 125 227
Minority interests 11 17
Depreciation, amortization and provision expense 329 319
Share of profit of associates, net of dividends received 1 (15)
Deferred tax (16) 12
Change in financial provisions and provisions for losses on asset disposals 81 (76)
Impairment losses 89 55
Funds from operations from discontinued operations 2 (2)
FUNDS FROM OPERATIONS INCLUDING NON-RECURRING TRANSACTIONS 622 537
(Gains) losses on disposals of assets, net (78) 40
(Gains) losses on non-recurring transactions (included restructuring costs and exceptional taxes) 161 190
Non-recurring items from discontinued activities 2 0
FUNDS FROM OPERATIONS EXCLUDING NON-RECURRING TRANSACTIONS 707 767
Registration Document 2014 251

FINANCIAL STATEMEMENTSConsolidated Financial Statements and Notes5
NOTE 36 CHANGE IN WORKING CAPITAL
The change in working capital can be analyzed as follows:
(in millions of euros)
Dec. 2013 Adjusted Dec. 2014 Change
Inventories 41 27 (14)
Trade receivables 379 417 38
Other receivables and accruals 473 461 (12)
WORKING CAPITAL ITEMS – ASSETS 893 905 12
Trade payables 599 690 91
Other payables 946 966 20
WORKING CAPITAL ITEMS – LIABILITIES 1,545 1,656 111
WORKING CAPITAL 652 751 99
DECEMBER 31, 2013 ADJUSTED WORKING CAPITAL 652
Change in operating working capital 103
Change in operating working capital of discontinued operations 6
Working capital items included in development expenditure (7)
Working capital items included in assets disposals and assets reclassified as held for sale (20)
Translation adjustment 11
Change in provisions (1)
Reclassifications 7
NET CHANGE IN WORKING CAPITAL 99
DECEMBER 31, 2014 WORKING CAPITAL 751
NOTE 37 RENOVATION AND MAINTENANCE EXPENDITURE
The amounts reported under “Renovation and maintenance expenditure” correspond to capitalized costs for maintaining or improving the quality of assets held by the Group at the beginning of each period (January 1) as a condition of their continuing
operation. This caption does not include development expenditure corresponding to the property, plant and equipment and working capital of newly consolidated companies and the purchase or construction of new assets.
Renovation and maintenance expenditure breaks down as follows:
(in millions of euros) 2013 Adjusted 2014
HOTELSERVICES 36 44
HOTELINVEST 224 209
CORPORATE & INTERCOS 4 9
RENOVATION AND MAINTENANCE EXPENDITURE 264 262
Registration Document 2014252

5
FINANCIAL STATEMEMENTSConsolidated Financial Statements and Notes
NOTE 38 DEVELOPMENT EXPENDITURE
Development expenditure corresponds to the property, plant and equipment, and working capital of newly consolidated companies (in accordance with IAS 7 “Statement of cash flows”) and includes
the purchase or construction of new assets and the exercise of call options under sale-and-leaseback transactions, as follows:
Development expenditure excluding discontinued operations
(in millions of euros) France
Europe (excl. France/
Mediterranean)
Mediterranean, Middle East,
AfricaAsia
Pacific AmericasWorldwide
Structures* 20142013
Adjusted
HOTELSERVICES (1) 8 4 7 15 2 3 39 39
HOTELINVEST (2) 80 1,125 11 13 61 19 1,309 175
CORPORATE & INTERCOS (3) (0) (3) (1) - (37) 6 (35) (24)
TOTAL 2014 88 1,126 17 28 26 28 1,313
TOTAL 2013 ADJUSTED 24 110 12 19 24 1 190
* “Worldwide Structures” corresponds to development expenditure that is not specific to a single geographic region.(1) Including €8 million related to the guaranteed minimum rent on the Paris Tour Eiffel Pullman and €9 million corresponding to a loan made to the owner of the future
Sydney Darling Harbour Sofitel in exchange for being awarded the hotel management contract;(2) Including:
- €715 million related to the acquisition of an 86-hotel portfolio from Moor Park in Germany and in the Netherlands (see Note 3.B.1);- €176 million related to the acquisition of an 11-hotel portfolio from Axa Real Estate in Switzerland (see Note 3.B.2); €89 million related to the purchase of a portfolio of 13 Tritax hotels in the United Kingdom (see Note 3.B.3);- 29 million related to the acquisition of a stake in Mama Shelter (see Note 3.B.4);- €37 million of internal loans between HotelInvest entities in the USA and Accor Holding.
(3) Including €37 million of internal loans between Accor Holding and HotelInvest entities in the USA.
NOTE 39 SEGMENT INFORMATION
A. Chief operating decision maker
Accor’s chief operating decision maker is Executive management, assisted by the Executive Committee. Executive management assesses the results and performance of each operating segment and makes resource allocation decisions.
B. Operating segments
At the end of 2013, Accor announced a plan to redefine the Group’s business model around two strategic businesses:
�� Hotel operator and brand franchisor HotelServices, with a business model focused on generating revenue from fees and optimizing the income statement;
�� Hotel owner and investor HotelInvest, with a business model aimed at improving the return on assets and optimizing the statement of financial position.
To support the new business model, each strategic business has been reorganized by region, as follows:
�� France;
�� Europe (excluding France/Mediterranean);
�� Mediterranean, Middle East, Africa;
�� Asia Pacific;
�� Americas, comprising Latin America, the Caribbean and North America.
The reorganization has led to a change in the Group’s internal reporting presentation which is now based on the Strategic business/Region matrix. The Executive Committee now assesses the performance of each Strategic business/Region and makes resource allocation decisions based on their respective results.
As a result, the segment information presented in the consolidated financial statements concerns redefined operating segments that correspond to the segments whose operating results are regularly reviewed by the chief operating decision maker for resource allocation purposes. Prior period segment information has been restated on the same basis.
HotelServices
HotelServices corresponds to Accor’s business as a hotel operator and franchisor. It comprises all of the Group’s hotels, as the hotels owned by HotelInvest are operated by HotelServices under management contracts. Its business model focuses entirely on generating fee revenue, including fees received by hotel-owning subsidiaries that are eliminated in consolidation. HotelServices spans Management and Franchising activities, sales and marketing, distribution and information systems as well as other activities such as a timeshare business in Australia, Strata, a company that operates the common areas of hotels in Oceania, and the Accor loyalty program.
Registration Document 2014 253
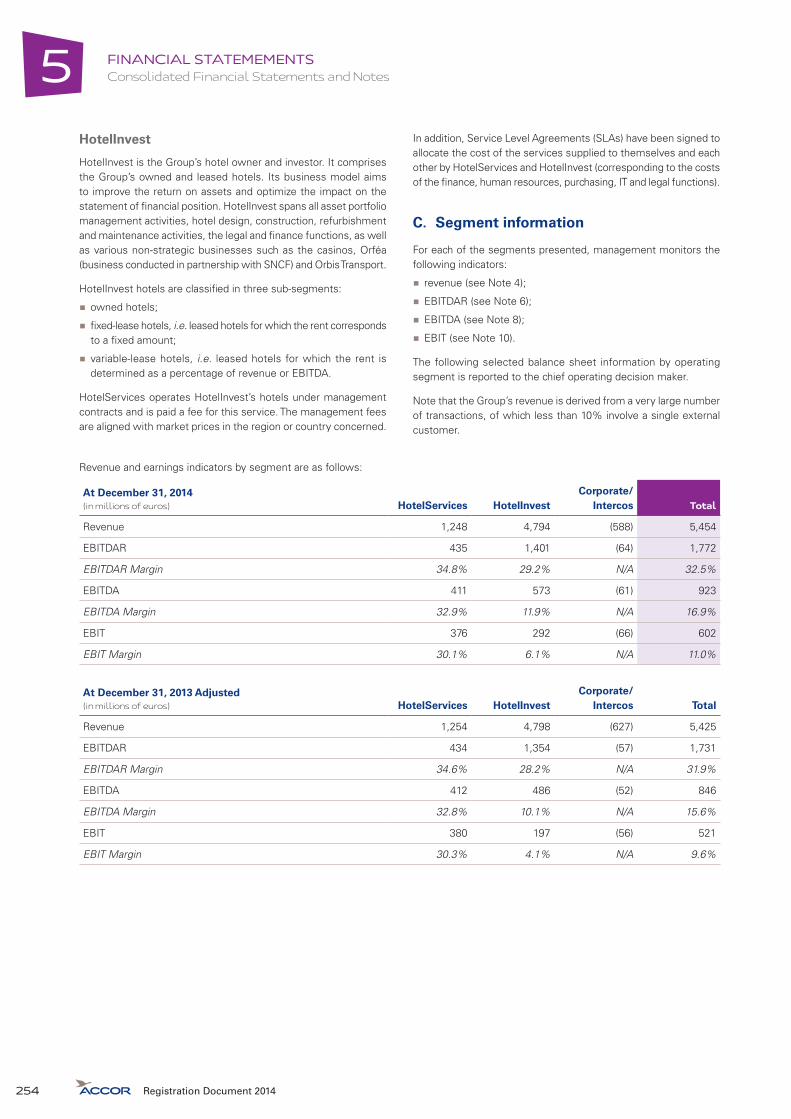
FINANCIAL STATEMEMENTSConsolidated Financial Statements and Notes5
HotelInvest
HotelInvest is the Group’s hotel owner and investor. It comprises the Group’s owned and leased hotels. Its business model aims to improve the return on assets and optimize the impact on the statement of financial position. HotelInvest spans all asset portfolio management activities, hotel design, construction, refurbishment and maintenance activities, the legal and finance functions, as well as various non-strategic businesses such as the casinos, Orféa (business conducted in partnership with SNCF) and Orbis Transport.
HotelInvest hotels are classified in three sub-segments:
�� owned hotels;
�� fixed-lease hotels, i.e. leased hotels for which the rent corresponds to a fixed amount;
�� variable-lease hotels, i.e. leased hotels for which the rent is determined as a percentage of revenue or EBITDA.
HotelServices operates HotelInvest’s hotels under management contracts and is paid a fee for this service. The management fees are aligned with market prices in the region or country concerned.
In addition, Service Level Agreements (SLAs) have been signed to allocate the cost of the services supplied to themselves and each other by HotelServices and HotelInvest (corresponding to the costs of the finance, human resources, purchasing, IT and legal functions).
C. Segment information
For each of the segments presented, management monitors the following indicators:
�� revenue (see Note 4);
�� EBITDAR (see Note 6);
�� EBITDA (see Note 8);
�� EBIT (see Note 10).
The following selected balance sheet information by operating segment is reported to the chief operating decision maker.
Note that the Group’s revenue is derived from a very large number of transactions, of which less than 10% involve a single external customer.
Revenue and earnings indicators by segment are as follows:
At December 31, 2014(in millions of euros) HotelServices HotelInvest
Corporate/ Intercos Total
Revenue 1,248 4,794 (588) 5,454
EBITDAR 435 1,401 (64) 1,772
EBITDAR Margin 34.8% 29.2% N/A 32.5%
EBITDA 411 573 (61) 923
EBITDA Margin 32.9% 11.9% N/A 16.9%
EBIT 376 292 (66) 602
EBIT Margin 30.1% 6.1% N/A 11.0%
At December 31, 2013 Adjusted(in millions of euros) HotelServices HotelInvest
Corporate/Intercos Total
Revenue 1,254 4,798 (627) 5,425
EBITDAR 434 1,354 (57) 1,731
EBITDAR Margin 34.6% 28.2% N/A 31.9%
EBITDA 412 486 (52) 846
EBITDA Margin 32.8% 10.1% N/A 15.6%
EBIT 380 197 (56) 521
EBIT Margin 30.3% 4.1% N/A 9.6%
Registration Document 2014254
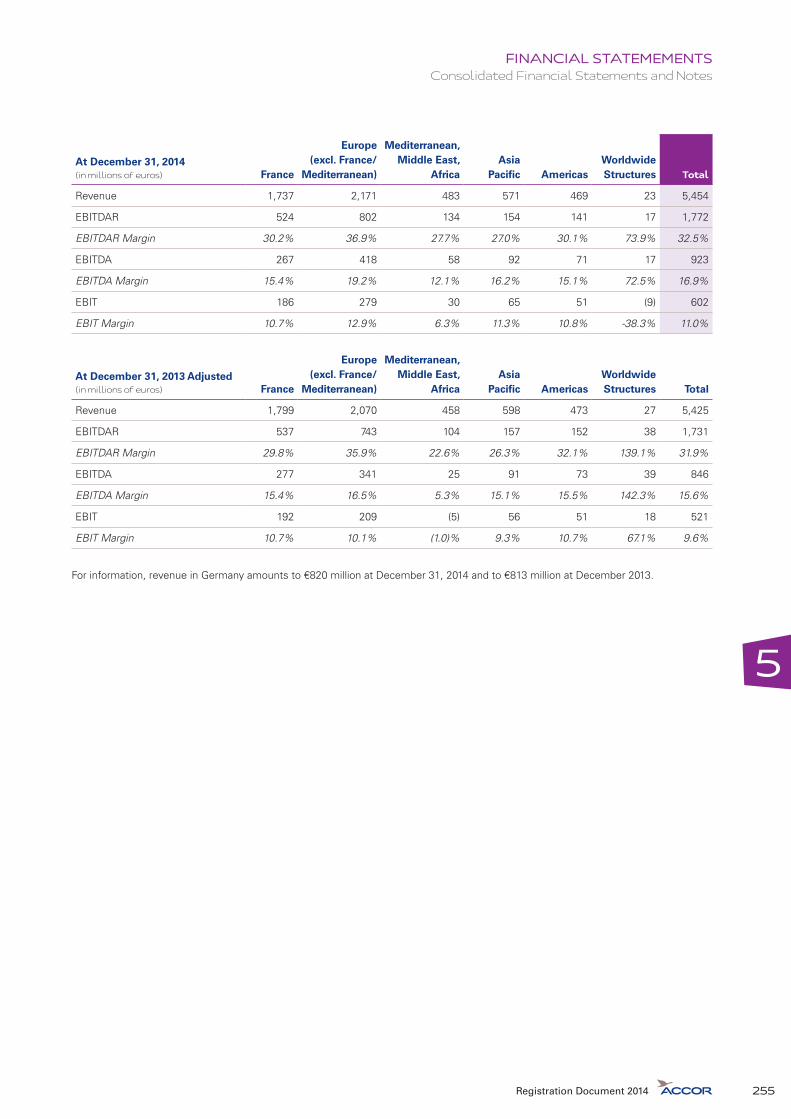
5
FINANCIAL STATEMEMENTSConsolidated Financial Statements and Notes
At December 31, 2014(in millions of euros) France
Europe (excl. France/
Mediterranean)
Mediterranean, Middle East,
AfricaAsia
Pacific AmericasWorldwide Structures Total
Revenue 1,737 2,171 483 571 469 23 5,454
EBITDAR 524 802 134 154 141 17 1,772
EBITDAR Margin 30.2% 36.9% 27.7% 27.0% 30.1% 73.9% 32.5%
EBITDA 267 418 58 92 71 17 923
EBITDA Margin 15.4% 19.2% 12.1% 16.2% 15.1% 72.5% 16.9%
EBIT 186 279 30 65 51 (9) 602
EBIT Margin 10.7% 12.9% 6.3% 11.3% 10.8% -38.3% 11.0%
At December 31, 2013 Adjusted(in millions of euros) France
Europe (excl. France/
Mediterranean)
Mediterranean, Middle East,
AfricaAsia
Pacific AmericasWorldwide Structures Total
Revenue 1,799 2,070 458 598 473 27 5,425
EBITDAR 537 743 104 157 152 38 1,731
EBITDAR Margin 29.8% 35.9% 22.6% 26.3% 32.1% 139.1% 31.9%
EBITDA 277 341 25 91 73 39 846
EBITDA Margin 15.4% 16.5% 5.3% 15.1% 15.5% 142.3% 15.6%
EBIT 192 209 (5) 56 51 18 521
EBIT Margin 10.7% 10.1% (1.0)% 9.3% 10.7% 67.1% 9.6%
For information, revenue in Germany amounts to €820 million at December 31, 2014 and to €813 million at December 2013.
Registration Document 2014 255

FINANCIAL STATEMEMENTSConsolidated Financial Statements and Notes5
Total assets and liabilities by strategic business break down as follows:
At December 31, 2014(in millions of euros) HotelServices HotelInvest
Corporate & Intercos Total
Goodwill 435 266 - 701
Intangible assets 150 121 12 283
Property, plant and equipment 78 3,062 17 3,157
Non-current financial assets 95 553 (62) 586
TOTAL NON-CURRENT ASSETS EXCL. DEFERRED TAX ASSETS 758 4,002 (33) 4,727
Deferred tax assets 17 27 24 68
TOTAL NON-CURRENT ASSETS 775 4,029 (9) 4,795
Cash, short-term debt and receivables on disposals of assets 2,707
Other current assets 1,191 1,050 (1,335) 906
Assets held for sale - 347 - 347
TOTAL ASSETS 8,755
Shareholders’ Equity & Minority Interests 3,867
Long-term debt 2,784
Deferred tax liabilities 5 33 3 41
Other non-current liabilities 25 73 35 133
Short-term debt 82
Other current liabilities 1,184 1,836 (1,192) 1,828
Liabilities associated to assets classified as held for sale - 17 3 20
TOTAL LIABILITIES AND SHAREHOLDERS’ EQUITY 8,755
Registration Document 2014256

5
FINANCIAL STATEMEMENTSConsolidated Financial Statements and Notes
At December 31, 2013 Adjusted(in millions of euros) HotelServices HotelInvest
Corporate & Intercos Total
Goodwill 425 266 - 691
Intangible assets 134 140 7 281
Property, plant and equipment 64 2,317 16 2,396
Non-current financial assets 77 494 (24) 548
TOTAL NON-CURRENT ASSETS EXCL. DEFERRED TAX ASSETS 700 3,218 (1) 3,916
Deferred tax assets 13 57 79 149
TOTAL NON-CURRENT ASSETS 713 3,275 78 4,065
Cash, short-term debt and receivables on disposals of assets 1,984
Other current assets 773 708 (588) 893
Assets held for sale - 61 - 61
TOTAL ASSETS 7,003
Shareholders’ Equity & Minority Interests 2,752
Long-term debt 1,699
Deferred tax liabilities 3 69 46 118
Other non-current liabilities 20 59 29 108
Short-term debt 511
Other current liabilities 795 1,533 (539) 1,789
Liabilities associated to assets classified as held for sale - 23 3 26
TOTAL LIABILITIES AND SHAREHOLDERS’ EQUITY 7,003
Registration Document 2014 257

FINANCIAL STATEMEMENTSConsolidated Financial Statements and Notes5
Total assets by region break down as follows:
At December 31, 2014(in millions of euros) France
Europe (excl. France/
Mediterranean)
Mediterranean, Middle East,
AfricaAsia
Pacific AmericasWorldwide Structures Total
Goodwill 175 199 28 199 100 - 701
Intangible assets 13 113 12 51 29 65 283
Property, plant and equipment 621 1,764 299 142 285 46 3,157
Non-current financial assets 100 52 619 241 98 (524) 586
TOTAL NON-CURRENT ASSETS EXCL. DEFERRED TAX ASSETS 909 2,128 958 633 512 (413) 4,727
Deferred tax assets (19) 29 4 10 14 30 68
Total non-current assets 890 2,157 962 643 526 (383) 4,795
TOTAL CURRENT ASSETS 1,600 787 196 452 165 413 3,613
Assets held for sale 1 266 13 57 10 - 347
Other Assets 1,601 1,053 210 509 175 413 3,960
TOTAL ASSETS 2,491 3,209 1,171 1,153 700 31 8,755
At December 31, 2013 Adjusted(in millions of euros) France
Europe (excl. France/
Mediterranean)
Mediterranean, Middle East,
AfricaAsia
Pacific AmericasWorldwide Structures Total
Goodwill 172 202 27 189 100 - 691
Intangible assets 2 118 7 65 32 57 281
Property, plant and equipment 608 1,016 319 181 236 35 2,396
Non-current financial assets 76 53 77 213 128 1 548
TOTAL NON-CURRENT ASSETS EXCL. DEFERRED TAX ASSETS 858 1,390 431 647 497 93 3,916
Deferred tax assets 32 44 3 9 22 40 149
Total non-current assets 890 1,434 435 656 519 133 4,065
TOTAL CURRENT ASSETS 749 988 186 483 134 339 2,877
Assets held for sale 4 3 24 21 9 0 61
Other Assets 753 991 210 504 143 339 2,938
TOTAL ASSETS 1,642 2,424 644 1,159 662 471 7,003
For information, total non-current assets (excluding deferred tax assets) in Germany amount to €671 million at December 31, 2014 and to €359 million at December 31, 2013.
Registration Document 2014258

5
FINANCIAL STATEMEMENTSConsolidated Financial Statements and Notes
NOTE 40 CLAIMS AND LITIGATION
Note 40.1 CIWLT tax audit
Following tax audits covering the year 2003 of the French branch of Compagnie Internationale des Wagons Lits et du Tourisme (CIWLT), a Belgian company that is 99.78%-owned by Accor SA, the French tax authorities concluded that CIWLT’s seat of management was in France, not Belgium.
The authorities therefore added CIWLT’s profit to the profit taxable in France. CIWLT contested this reassessment before the competent French courts.
The tax and related penalties totaling €17.5 million were paid in July 2011 and late interest of €2.7 million was paid in August 2011. Receivables for the same amounts were recorded in the consolidated statement of financial position at December 31, 2011, offset in full by provisions. The Versailles Administrative Court of Appeal found against CIWLT in a ruling handed down on May 21, 2013 and in August 2013 CIWLT filed a summary motion to institute proceedings before the French Supreme Court of Appeal (Conseil d’Etat). The motion was accepted and the appeal is currently being heard.
Note 40.2 Dividend withholding tax (précompte)
In 2002, Accor mounted a legal challenge to its obligation to pay “précompte” dividend withholding tax on the redistribution of European source dividends.
Until 2004, French parent companies were entitled to a 50% tax credit on dividends received from French subsidiaries, which could be set off against the “précompte” dividend withholding tax. However, no tax credit was attached to European source dividends.
Accor contested this rule, on the grounds that it breached European Union rules.
In the dispute between Accor and the French State, on December 21, 2006 the Versailles Administrative Court ruled that Accor was entitled to a refund of the “précompte” dividend withholding tax paid in the period 1999 to 2001, in the amount of €156 million. The amount of €156 million was refunded to Accor during the first half of 2007, together with €36.4 million in late interest due by the French State.
However, on March 8, 2007, the French State appealed the ruling before the Versailles Administrative Court of Appeal. The French State’s appeal was rejected on May 20, 2008. The French State’s appeal was rejected on May 20, 2008, thereby confirming Accor’s right to the refund decided by the Versailles Administrative Court.
As the State had not yet exhausted all avenues of appeal, a liability was recognized for the amounts received and the financial impact of the rulings by the Versailles Administrative Court and Court of Appeal was not recognized in the financial statements.
On July 3, 2009, the French Supreme Court of Appeal announced that it would postpone ruling on the French State’s appeal and on August 4, 2009, it applied to the Court of Justice of the European Communities (ECJ) for a preliminary ruling on this issue.
After reviewing the matter, the ECJ’s final ruling was handed down on September 15, 2011. In this ruling, the ECJ held that the French précompte/tax credit system restricts the freedom of establishment and free movement of capital.
In its ruling handed down on December 10, 2012, the French Supreme Court of Appeal considered that the dividend tax credit and précompte withholding tax systems had been shown to be incompatible. However, the Court also considered that the amount to be refunded was subject to strict rules which, to all intents and purposes, restricted Accor’s right to a refund. Accordingly, the Court found that Accor was entitled to only approximately €6.3 million of the €156 million in principal already refunded.
In addition to the €149.7 million to be returned to the French State, Accor was also required to repay the late interest received in 2007, amounting to approximately €36.4 million, less the portion related to the retained refund of €6.3 million. In all, €184.7 million in principal and interest was repaid to the French State during first-half 2013.
In the 2012 financial statements, the €6.3 million “précompte” dividend withholding tax refunded to Accor and not repayable to the French State was credited to a reserve account. The estimated €1.4 million in late interest received on this amount was considered as offsetting the early payment of tax, and was therefore recorded as a tax benefit in the income statement.
Accor has noted the Supreme Court of Appeal’s decision and intends to continue to use the avenues available to it to defend its position in the dispute with the French tax authorities.
On February 7, 2007, Accor filed an application originating proceedings before the Cergy-Pontoise Court on the same grounds, to obtain a refund of the €187 million in ‘’precompte’’ dividend withholding tax paid in the period 2002 to 2004. In a ruling handed down on May 27, 2014, the Cergy-Pontoise Court applied the restrictive principles governing the calculation of refunds described by the French Supreme Court of Appeal (Conseil d’État) in a decision dated December 10, 2012. In line with these principles, the Court found that Accor was entitled to a refund of €7.1 million in respect of the “précompte” dividend withholding tax for the years 2002, 2003 and 2004 together with interest of €3.3 million.
These amounts were recorded in the statement of financial position at December 31, 2014. They had no impact on the income statement as Accor appealed the decision before the Versailles Administrative Court of Appeal on July 23, 2014 and the ruling is therefore not final.
Note 40.3 Tax audit at Accor SA
A tax audit is currently in progress at Accor SA. On December 26, 2013, the tax authorities notified the Company of proposed adjustments to its 2010 and 2011 accounts. The proposal was timed to interrupt the statute of limitations that was due to expire for claims by the tax authorities on December 31, 2013 and December 31,2014. The tax authorities have not yet provided any indication of the financial consequences of the proposed adjustments for the tax group of which Accor SA is the filing entity, but the total risk including late interest is estimated at €29.5 million.
Registration Document 2014 259

FINANCIAL STATEMEMENTSConsolidated Financial Statements and Notes5
The tax authorities are challenging the independent valuation of the Accor Services brands that was used by Accor SA to calculate the taxable capital gain on the brands contributed at the time of the Group’s demerger in 2010. They have also queried the alleged waiver by Accor SA of income due by its wholly-owned Brazilian subsidiary, Hotelaria Accor Brasil S.A., which they say had corporate income tax and withholding tax implications. This represents a relatively minor risk.
Accor SA wrote to the tax authorities in February 2014 and December 2014 contesting the proposed adjustments, but has nevertheless recorded a contingency provision of €14.5 million in its 2014 financial statements.
Note 40.4 Other claims and litigation
In the normal course of its business, the Group is exposed to claims, litigations and proceedings that may be in progress, pending or threatened. The Company believes that these claims, litigations and proceedings have not and will not give rise to any material costs at Group level and have not and will not have a material adverse effect on the Group’s financial position, business and/or results of operations.
NOTE 41 OFF-BALANCE SHEET COMMITMENTS AT DECEMBER 31, 2014
Off-balance sheet commitments have been restated for the effect of applying IFRS 11 by excluding commitments given to and received by joint ventures. However, commitments given by Accor on behalf of joint ventures are included, in accordance with IFRS 12.
Note 41.1 Off-balance sheet commitments given
Off-balance sheet commitments (not discounted) given at December 31, 2014 break down as follows:
(in millions of euros)
Less than 1
year1 to 5 years
Beyond 5 years Dec. 31, 2014*
Dec. 31, 2013
Adjusted*
SECURITY INTERESTS GIVEN ON ASSETS (1) 1 10 63 74 84
PURCHASE COMMITMENTS (2) 18 51 - 69 40
�� Renovation commitment in Germany (3) 17 - 0 17 29
�� Renovation commitment in the United Kingdom 3 - - 3 -
�� Renovation commitment in Ivory Coast 3 - - 3 -
�� Renovation commitment in Switzerland 2 - - 2 8
�� Renovation commitment in the Netherlands 2 - - 2 12
�� Other renovation commitments (4) 9 14 5 28 34
CAPEX COMMITMENTS 36 14 5 54 83
LOAN GUARANTEES GIVEN 5 32 26 63 65
COMMITMENTS GIVEN IN THE NORMAL COURSE OF BUSINESS 25 152 25 202 122
CONTINGENT LIABILITIES 1 3 0 4 4
TOTAL DECEMBER 31, 2014* 86 262 119 466
TOTAL DECEMBER 31, 2013 ADJUSTED* 107 187 104 398
* In line with IFRS 5, off-balance sheet commitments given by the Onboard Train Services business are not presented in this note. Off-balance sheet commitments given by the Onboard Train Services business amounted to €6 million at December 31, 2013 and €6 million at December 31, 2014.
(1) Security interests given on assets correspond to pledges and mortgages valued at the net book value of the underlying assets.- Collateral for loans obtained from Banque Cantonale de Genève and UBS in Switzerland, consisting of pledges on all the assets of the Novotel Bern, ibis Bern
and ibis budget Bern. The pledged assets had a total net book value of €17 million at December 31, 2014.- A repayment guarantee for the mortgage loan from Zürcher Kantonalbank for the purchase of the ibis Basel Bahnhof hotel in Switzerland. The mortgage covers
the hotel’s net book value, in the amount of €11 million at December 31, 2014.- Bancolombia loan guarantees. These guarantees, in the amount of €25 million, consist of mortgages on the land, buildings, operations and goodwill of the Bogotá
Museo ibis, the Medellín ibis and on Cartagena ibis construction work.(2) In connection with property development projects:
- €40 million commitment related to a leaseholder and property development contract for the construction of the Canning Town ibis.- The Group is committed to carrying out €12 million worth of renovation work under the Moorfield contract concerning the management and rebranding of 24 Mercure
units in the United Kingdom.- €7 million guarantee covering the payment of termination penalties on laundry and uniform-cleaning contracts in Germany.
(3) In connection with development plans in Germany, commitments to carry out work mainly concerned development plans of the ibis and Novotel Arnulfstrasse (€12 million).(4) Other commitments mainly include €20 million in committed capital expenditure on Australian hotels.
Registration Document 2014260

5
FINANCIAL STATEMEMENTSConsolidated Financial Statements and Notes
The Group commits in most of the cases to spend a specified amount on hotel maintenance, generally expressed as a percentage of revenue. These commitments are not included in the above table due to the difficulty of estimating the amounts involved.
From time to time the Group may also issue performance guarantees to the owners of managed hotels. The guarantee may include a clawback clause applicable if the hotel’s performance improves in subsequent years.
To the best of the Group’s knowledge and in accordance with generally accepted accounting principles, no commitments given have been omitted from the above list.
Note 41.2. Off-balance sheet commitments received
Off-balance sheet commitments (not discounted) received at December 31, 2014 break down as follows:
(in millions of euros)
Less than 1
year1 to 5 years
Beyond 5 years
June 30, 2014*
Dec. 31, 2013
Adjusted*
Irrevocable commitments received for the purchase of intangible assets and property, plant and equipment 1 - - 1 11
Irrevocable commitments received for the purchase of financial assets (1) - - 19 19 20
PURCHASE COMMITMENTS RECEIVED 1 - 19 20 31
Sellers’ warranties received 1 - - 1 1
Other guarantees received in the normal course of business (2) 15 12 35 62 63
OTHER COMMITMENTS AND GUARANTEES RECEIVED 16 12 35 63 64
TOTAL DECEMBER 31, 2014* 17 12 54 83
TOTAL DECEMBER 31, 2013 ADJUSTED* 32 15 48 95
* In line with IFRS 5, off-balance sheet commitments received by the Onboard Train Services business are not presented in this note. Off-balance sheet commitments received by the Onboard Train Services business amounted to €0 million at December 31,2014 and €1 million at December 31, 2013.
(1) In connection with irrevocable commitments received for the purchase of financial assets:- Under the “Sale and Management Back” transaction concerning the Sofitel The Grand in Amsterdam with Société Hôtelière Paris Les Halles (SHPH), Accor has
an option to sell its 40% interest in this hotel to SHPH for €14 million at December 31, 2014 in the event that SHPH decides not to renew the 25-year management agreement.
- In connection with the Orféa joint venture with SNCF (set up to supply hotel services for the service apartments made available to SNCF employees), in the event of a disagreement between the partners:- SNCF Participations would have the option of buying out Accor’s stake in Orféa (held through its Soparfi 1 subsidiary), in which case Accor would be obliged to sell.- If SNCF Participations decided not to exercise its call option, Soparfi 1 would have the option of selling its entire stake to SNCF Participations, which would be
obliged to buy the shares.- In both cases, the sale price would be equal to Soparfi 1’s equity in Orféa’s net assets plus its share of outstanding dividends.
(2) Other commitments received mainly include:- In connection with the Silverstone project, Stone is committed to making an earn-out payment of €15 million to Accor if the Formule 1 hotels meet their business plan
objectives in 2019.- In connection with the sale by Invesco of the Paris La Défense Pullman, the new owner – QFI Luxembourg – gave a commitment to finance €10 million worth
of refurbishment and maintenance work described in the original lease. This guarantee will expire on May 30, 2022.- In connection with two properties transactions between Accor and Foncière des Murs in 2005 and 2006, Foncière des Murs, in an addendum signed in 2010, agreed
to finance an additional €39 million work program over the period to end-2014. At the end of December 2011, a new addendum has been signed, raising the total work program to €49 million. As of December 2014, the remaining work amounted to €6 million. Purchase options under finance leases are not included in this table.
Registration Document 2014 261

FINANCIAL STATEMEMENTSConsolidated Financial Statements and Notes5
NOTE 42 MAIN CONSOLIDATED COMPANIES AT DECEMBER 31, 2014
The main subsidiaries and associates represent 98% of consolidated revenue, 97% of EBITDAR and 90% of EBIT. The many other subsidiaries and associates represent individually less than 0.07% of consolidated revenue, EBITDAR and EBIT.
To the best of the Group’s knowledge, there are no material restrictions on the use and sale by Accor of the assets of subsidiaries controlled by the Group.
FRANCE
Académie France France IG 100.00%
Accor Redevances France France IG 100.00%
Compagnie ETAP Hotel Roissy France IG 96.00%
Ecotel France IG 99.45%
Exhotel France IG 100.00%
Gestal France IG 96.00%
Golfe d’Ajaccio France IG 100.00%
Ibis Budget France IG 96.00%
Ibis Styles Hotels France IG 100.00%
Mer & Montagne France IG 100.00%
Montreuilloise France IG 100.00%
Paris Clichy France IG 100.00%
Paris Porte de Saint Cloud France IG 100.00%
Pradotel France IG 100.00%
SH Defense Grande Arche France IG 100.00%
SHNM France IG 100.00%
SHORET France IG 100.00%
SIGEST 1 France IG 100.00%
SNC Exploitation Hotels SuiteHotelFrance IG 100.00%
SNC NMP France France IG 100.00%
Société Commerciale des Hôtels Economiques (SCHE) France IG 99.96%
Société de Management Intermarques France IG 100.00%
Société d’Etude et de Promotion Hôtelière International (SEPHI) France IG 100.00%
Société Hôtelière de Montparnasse (SHDM) France IG 100.00%
Société Hôtelière d’Exploitation Economique (HOTEXCO) France IG 100.00%
Société Hôtelière du Forum France IG 100.00%
Société Hôtelière Toulouse Centre France IG 51.44%
Sofitel Luxury Hôtels France France IG 100.00%
SOGECA France IG 100.00%
SPARHE France IG 100.00%
Ste du Domaine de Marlioz et Extensions France IG 100.00%
Ste Exploitation Hôtel Monegasque (SEHM) Monaco IG 100.00%
Ste Hot Exploitation Marseille France IG 100.00%
Ste Hôtelière 61 Quai de Grenelle France IG 100.00%
Ste Hôtelière Paris Eiffel Suffren France IG 75.00%
Ste Porte Montreuil France IG 99.96%
Thalamer France IG 100.00%
Varoise Shtcv France IG 100.00%
Société Hôtelière Paris Les Halles France MEE 31.19%
EUROPE (excluding France and Mediterranean)
Accor - Pannonia Hotels ZRT Hungary IG 99.94%
Accor Gestion Hôtelière & Services SA Switzerland IG 100.00%
Accor Hospitality Germany GMBH Germany IG 100.00%
Accor Hospitality Nederland N.V. The Netherland IG 100.00%
Accor Hôtelbetriebs GMBH Austria IG 100.00%
Accor Hôtels Belgium Belgium IG 100.00%
Accor Hôtels Luxembourg Luxembourg IG 100.00%
Accor Hôtels Romania Romania IG 99.97%
Accor Pannonia Slovakia S.r.o Slovakia IG 99.94%
Accor UK Business & Leisure United Kingdom IG 100.00%
Accor UK Economy Hotels LTD United Kingdom IG 100.00%
Berne Messe Switzerland IG 60.00%
Hekon-Hotele Ekonomiczne Poland IG 52.69%
Hôtek Polska Poland IG 100.00%
Hôtel Muranowska Poland IG 100.00%
Katerinska Hotel Jur Czech Republic IG 100.00%
Orbis Poland IG 52.69%
Pannonia Hotelbetriebs Austria IG 99.94%
Russian Management Hôtel Company LLC Russia IG 100.00%
Société d’Exploitation Hôtelière Switzerland IG 99.79%
The Grand Real Estate The Netherland MEE 58.71%**
ASIAPACIFIC
Aapc India Hotel Management Private HS India IG 70.42%
Aapc Properties Pty Ltd Australia IG 100.00%
Accor Asia Pacific Corp. Australia IG 100.00%
Marara French Polynesia IG 100.00%
Safari Club French Polynesia IG 100.00%
Pullman Reef Casino Australia MEE 50.00%
ACCOR SA
Registration Document 2014262

5
FINANCIAL STATEMEMENTSConsolidated Financial Statements and Notes
AMERICAS
Accor Business and Leisure North America
United States IG 100.00%
Accor Canada INC Canada IG 100.00%
Accor Chile Chile IG 100.00%
Accor Hospitality Arg SA Argentina IG 100.00%
Caesar Park Argentina Argentina IG 100.00%
Colombia Ibis Colombia IG 71.43%
Hotelaria Accor Brasil SA Brazil IG 100.00%
Posadas do Brasil Brazil IG 100.00%
Si Hotelera de Mexico Jur Mexico IG 100.00%
Sociedad de Desarrollo De Hoteles Peruanos S.A (SDHP) Peru IG 100.00%
Sociedad Inmobiliaria y de Hoteles Larcomar (SIHLSA) Peru IG 100.00%
Sofitel Support USA HI United States IG 100.00%
Sogedetu Dominican Republic IG 100.00%
MEDITERRANEAN, MIDDLE EAST, AFRICA
Accor Afrique Support HS Marocco IG 100.00%
Accor Gestion Maroc Marocco IG 77.99%
Risma Marocco MEE 33.34%
Accor Hospitality Italia SRL Italy IG 100.00%
Accor Hôtel SAE Egypt IG 99.78%
Accor Hoteles España S.A. Spain IG 100.00%
CIE Hoteliere Plateau Abidjan Ivory Coast IG 90.85%
EL Gezirah Hotels Tourism CY Egypt IG 65.01%
Hotel Union Pullman Senegal IG 100.00%
Pierre Loti S.A Cameroon IG 100.00%
Portis Portugal IG 100.00%
Saudi French Company Hotel MGT Saudi Arabia IG 99.98%
Société Abidjanaise d’Hôtellerie Ivory Coast IG 99.99%
Société Hôtelière Barachois Senegal IG 90.58%
STE Hôtelière Athène Centre Greece IG 100.00%
STE Hôtelière La Lagune Ivory Coast IG 100.00%
STE Togolaise d’Investissement et d’Exploitation Hôtelière Togo IG 100.00%
Tamaris Turizm Try Turkey IG 100.00%
Upsite Investimentos Hoteleiros Portugal IG 100.00%
Société Immobilière d’Exploitation Hôtelière Algerienne Algeria MEE 50.00%
OTHER SERVICES
Mama Shelter France MEE 36.60%
Compagnie Internationale des Wagons Lits & du Tourisme* – Belgium
Treno (*)Italy
Asset heldfor sale 99.78%
(*) These entities are not held directly by Accor SA, except for Compagnie Internationale des Wagons Lits & du Tourisme.
(**) For these entities, the percentage shown corresponds to Accor’s direct interest plus the interest held indirectly through Paris les Halles which owns 60% of The Grand Real Estate and 70% of Saint James Hotel.
IG: fully consolidated
MEE: accounted for by the equity method
The percentages correspond to the Group’s percentage interest.
ACCOR SA
Registration Document 2014 263

FINANCIAL STATEMEMENTSConsolidated Financial Statements and Notes5
NOTE 43 RELATED PARTY TRANSACTIONS
For the purpose of applying IAS 24, the Group has identified the following related parties:
�� all fully consolidated companies and all associated companies accounted for by the equity method;
�� all members of the Executive Committee and the Board of Directors and the members of their direct families;
�� all companies in which a member of the Executive Committee or the Board of Directors holds material voting rights;
�� companies that exercises significant influence over Accor;
�� fully or proportionately consolidated companies by a company that exercise significant influence over Accor.
Fully consolidated companies and all associated companies accounted for by the equity method
Relationships between the parent company and its subsidiaries, joint ventures and associates are presented in Note 41. Transactions between the parent company and its subsidiaries – which constitute related party transactions – are eliminated in consolidation and are therefore not disclosed in these notes. Transactions between the parent company and its joint ventures and associates were not material in 2013 and 2014.
Members of the Executive Committee and the Board of Directors
Transactions with members of the Executive Committee and Board of Directors are disclosed in full in Note 44. Commitments towards members of the Executive Committee and the Board of Directors, and direct or indirect agreements with one or several Board members not entered into on arm’s length terms in the normal course of business are described in the Auditors’ special report on related party agreements included in Section III of the 2014 Registration Document.
Companies in which a member of the Executive Committee or the Board of Directors holds material voting rights
All transactions with companies in which a member of the Executive Committee or the Board of Directors holds material voting rights are conducted in the normal course of business on arm’s length terms and are not material. Any agreements that did not fulfill this criterion would be discussed in the Statutory Auditors’ special report on related-party agreements and commitments.
Companies that exercises significant influence over Accor
Colony Capital and Eurazeo, acting in concert, together exercise significant influence over Accor through their shareholders’ pact (see Note 3.E). Transactions between the parent company and Eurazeo and Colony Capital were not material in 2013 and 2014.
An agreement with a Colony Group company is discussed in the Statutory Auditors’ special report on related-party agreements and commitments.
Registration Document 2014264

5
FINANCIAL STATEMEMENTSConsolidated Financial Statements and Notes
NOTE 44 CORPORATE OFFICERS’ COMPENSATION
(in millions of euros)
2013 2014
Charges Montant au bilan ExpensesBalance sheet
amount
Short-term benefits received 8 4 13 8
Post-employment benefits (1) (10) 3 1 2
Other long-term benefits - - - -
Compensation for loss of office (1) 13 3 - -
Share-based payments 4 - 2 -
TOTAL COMPENSATION 15 10 16 10
(1) At December 31, 2013, the amounts presented mainly arose from the departure of certain Executive Committee members during the period, leading notably to the reversal of provisions for post-employment benefits (pension benefits).
Corporate officers are defined as members of the Executive Committee which had eleven members at the end of December 31, 2014 (eight members at the end of December 2013) and the Board of Directors.
The compensation data for corporate officers presented above includes all the different forms of compensation received by the members of the Executive Committee.
Members of the Board of Directors do not receive any compensation and receive only attendance fees. Attendance fees paid by the Group to the members of the Supervisory Board for 2013 amounted to €549,184.
NOTE 45 FEES PAID TO THE AUDITORS
The table below shows the total fees billed by the Auditors recognized in the income statements in 2014 and prior year.
(in millions of euros) 2013 2014
Statutory and contractual audit fees (8) (9)
Fees for audit-related services (0) (1)
TOTAL FEES BILLED BY THE AUDITORS (8) (10)
NOTE 46 SUBSEQUENT EVENTS
Sale & Management Back of the Zurich MGallery
On February 18, 2015, Accor announced the signature of an agreement relating to the sale and management-back of the Zurich MGallery to a private investor, already an Accor franchisee, for a total of €55 million. This amount includes the sale price of €32 million and a commitment from the buyer to carry out €23 million worth of renovations.
The hotel will continue to be operated by Accor under a long-term management contract. The hotel property was bought back by Accor as part of a portfolio of properties previously owned by Axa (see Note 3.B.2).
Registration Document 2014 265

FINANCIAL STATEMEMENTSStatutory Auditors’ report on the financial statements5Financial
STATEMEMENTS 5.3. STATUTORY AUDITORS’ REPORT ON THE FINANCIAL STATEMENTS
Year ended December 31, 2014
This is a free translation into English of the statutory auditors’ report issued in French and is provided solely for the convenience of English speaking users. The statutory auditors’ report includes information specifically required by French law in such reports, whether modified or not. This information is presented below the opinion on the financial statements and includes an explanatory paragraph discussing the auditors’ assessments of certain significant accounting and auditing matters. These assessments were considered for the purpose of issuing an audit opinion on the financial statements taken as a whole and not to provide separate assurance on individual account captions or on information taken outside of the financial statements. This report also includes information relating to the specific verification of information given in the management report and in the documents addressed to shareholders. This report should be
read in conjunction with, and construed in accordance with, French law and professional auditing standards applicable in France.
To the Shareholders
In compliance with the assignment entrusted to us by your Annual General Meeting, we hereby report to you, for the year ended December 31, 2014 on:�� the audit of the accompanying financial statements of Accor;�� the justification of our assessments;�� the specific procedures and disclosures required by law.
These financial statements have been approved by the Board of Directors. Our role is to express an opinion on these financial statements based on our audit.
I. Opinion on the financial statements
We conducted our audit in accordance with professional standards applicable in France; those standards require that we plan and perform the audit to obtain reasonable assurance about whether the financial statements are free of material misstatement. An audit involves performing procedures, using sampling techniques or other methods of selection, to obtain audit evidence about the amounts and disclosures in the financial statements. An audit also includes evaluating the appropriateness of accounting policies used and the reasonableness of accounting estimates made, as well as the overall presentation of the financial statements. We believe that the audit evidence we have obtained is sufficient and appropriate to provide a basis for our audit opinion.
In our opinion, the financial statements give a true and fair view of the assets and liabilities and of the financial position of the Company as at December 31, 2014 and of the results of its operations for the year then ended in accordance with French accounting principles.
II. Justification of our assessments
In accordance with the requirements of Article L. 823-9 of the French Commercial Code (Code de commerce) relating to the justification of our assessments, we bring to your attention the following matters:�� Note 1.c to the financial statements sets out the accounting policies and methods used to value equity interests in subsidiaries and affiliates and other long-term investments. We have verified the
appropriateness of these accounting policies and methods and of the related disclosures in the notes to the financial statements. We have also examined the consistency of the data and assumptions used and the supporting documentation provided, and on these bases have assessed the reasonableness of the estimates made.�� Notes 7 and 23 to the financial statements describe the latest developments in a tax audit relating to 2010 and to 2011 and presents Management’s positions concerning the proposed adjustments that were notified in late 2013 and 2014. Our work consisted of assessing the reasonableness of the elements on which positions are based and verifying that the note to the financial statements provides appropriate disclosures.
These assessments were made as part of our audit of the financial statements taken as a whole, and therefore contributed to the opinion we formed which is expressed in the first part of this report.
III. Specific procedures and disclosures
We have also performed, in accordance with professional standards applicable in France, the specific procedures required by French law.
We have no matters to report as to the fair presentation and the consistency with the financial statements of the information given in the management report of Board of Directors and in the documents addressed to shareholders with respect to the financial position and the financial statements.
Concerning the information given in accordance with the requirements of Article L. 225-102-1 of the French Commercial Code relating to remunerations and benefits received by the directors and any other commitments made in their favor, we have verified its consistency with the financial statements, or with the underlying information used to prepare these financial statements and, where applicable, with the information obtained by your company from companies controlling your company or controlled by it. Based on this work, we attest the accuracy and fair presentation of this information.
In accordance with French law, we have verified that the management report contains the appropriate disclosures as to the acquisition of equity and controlling interests, and the identity of shareholders and holders of voting rights.
Paris-La Défense and Neuilly-sur-Seine, March 13, 2015
The Statutory AuditorsFrench original signed by
ERNST & YOUNG et Autres
Jacques Pierres
DELOITTE & ASSOCIÉS
Pascale Chastaing-Doblin
Registration Document 2014266
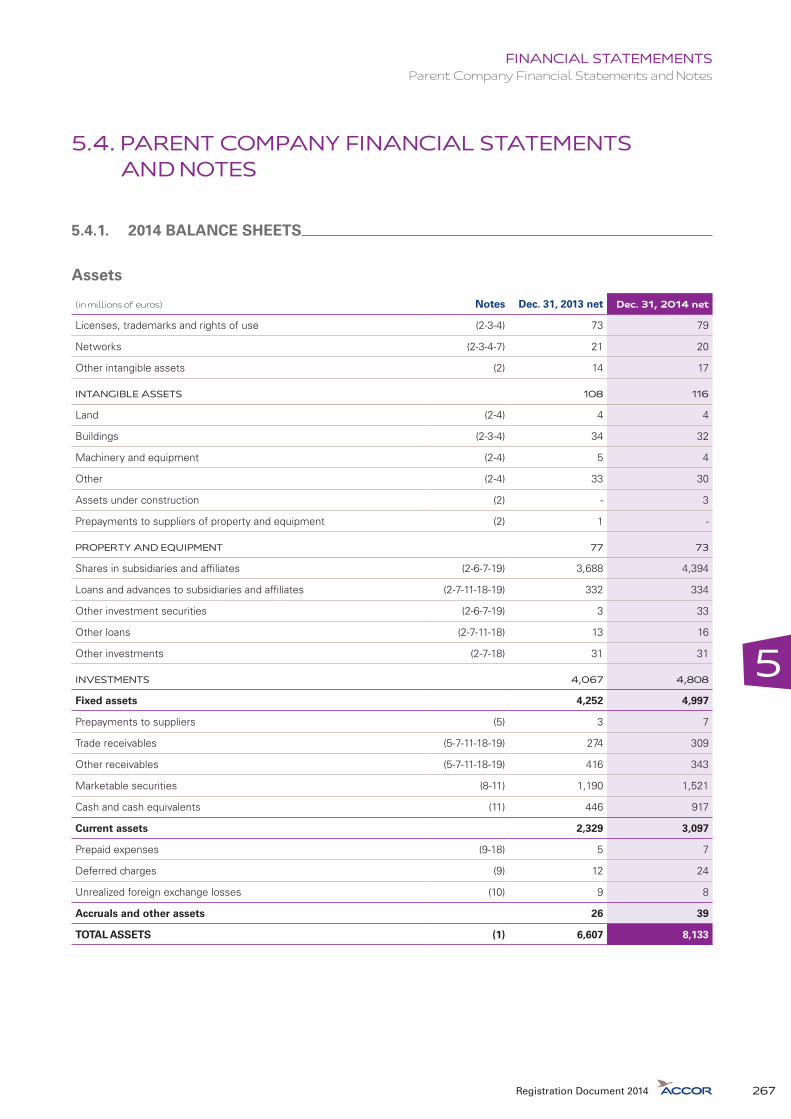
5
FINANCIAL STATEMEMENTSParent Company Financial Statements and Notes
5.4. PARENT COMPANY FINANCIAL STATEMENTS AND NOTES
5.4.1. 2014 BALANCE SHEETS
Assets
(in millions of euros) Notes Dec. 31, 2013 net Dec. 31, 2014 net
Licenses, trademarks and rights of use (2-3-4) 73 79
Networks (2-3-4-7) 21 20
Other intangible assets (2) 14 17
INTANGIBLE ASSETS 108 116
Land (2-4) 4 4
Buildings (2-3-4) 34 32
Machinery and equipment (2-4) 5 4
Other (2-4) 33 30
Assets under construction (2) - 3
Prepayments to suppliers of property and equipment (2) 1 -
PROPERTY AND EQUIPMENT 77 73
Shares in subsidiaries and affiliates (2-6-7-19) 3,688 4,394
Loans and advances to subsidiaries and affiliates (2-7-11-18-19) 332 334
Other investment securities (2-6-7-19) 3 33
Other loans (2-7-11-18) 13 16
Other investments (2-7-18) 31 31
INVESTMENTS 4,067 4,808
Fixed assets 4,252 4,997
Prepayments to suppliers (5) 3 7
Trade receivables (5-7-11-18-19) 274 309
Other receivables (5-7-11-18-19) 416 343
Marketable securities (8-11) 1,190 1,521
Cash and cash equivalents (11) 446 917
Current assets 2,329 3,097
Prepaid expenses (9-18) 5 7
Deferred charges (9) 12 24
Unrealized foreign exchange losses (10) 9 8
Accruals and other assets 26 39
TOTAL ASSETS (1) 6,607 8,133
Registration Document 2014 267

FINANCIAL STATEMEMENTSParent Company Financial Statements and Notes5
Liabilities and equity
(in millions of euros) Notes Dec. 31, 2013 net Dec. 31, 2014 net
Share capital (13-14) 684 696
Additional paid-in capital (13-14) 979 998
Legal reserve (13) 69 69
Untaxed reserves (13) 9 9
Other reserves (13-14) 14 14
Retained earnings (13) 6 -
Net profit for the year (13) 101 239
Untaxed provisions (7-13) 8 8
Shareholders’ equity 1,870 2,033
Proceeds from issue of non-voting securities (perpetual hybrid bonds) (15) - 894
Other equity - 894
Provisions for contingencies (7) 43 68
Provisions for charges (7) 107 79
Provisions for contingencies and charges 150 147
Other bonds (12-16-17) 2,005 2,682
Bank borrowings (12-17) 122 227
Other borrowings (12-17-19) 2,168 1,819
Trade payables (12-17-19) 179 207
Accrued taxes and payroll costs (12-17-24) 85 88
Due to suppliers of fixed assets (17) 3 9
Other payables (12-17) 16 19
Liabilities 4,578 5,051
Deferred income (9-17) 2 1
Unrealized foreign exchange gains (10) 7 7
Accruals and other liabilities 9 8
TOTAL LIABILITIES AND EQUITY (1) 6,607 8,133
Registration Document 2014268
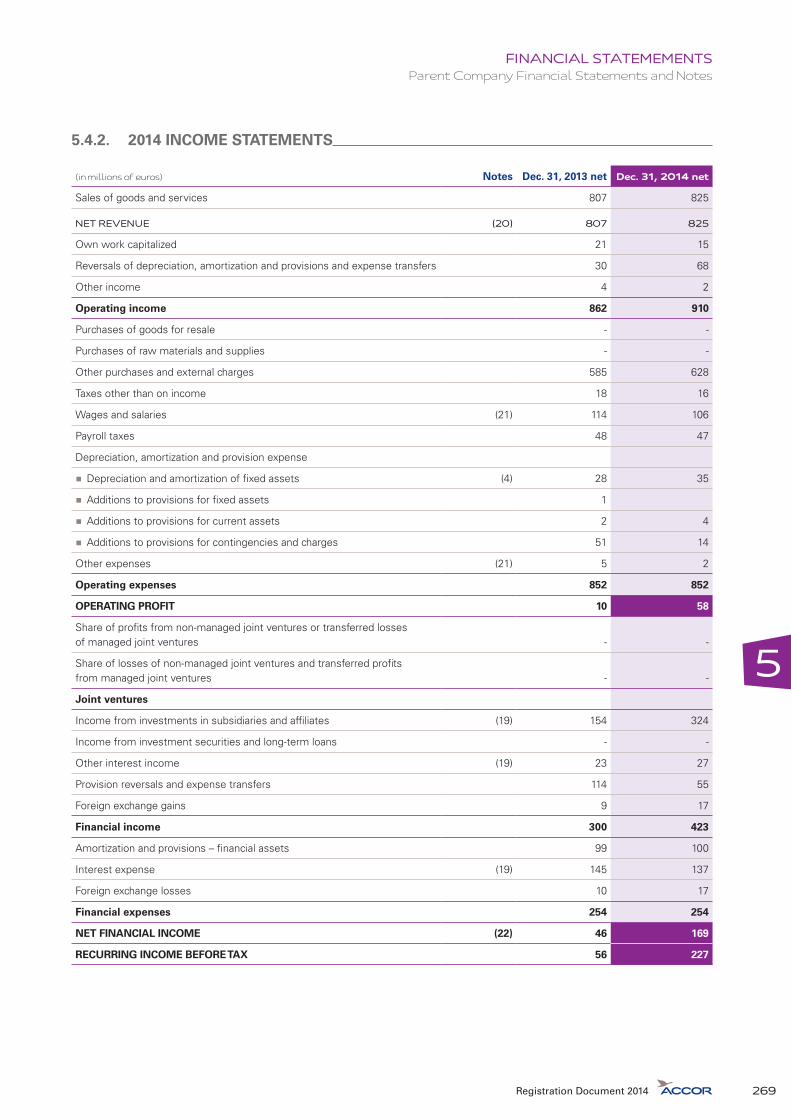
5
FINANCIAL STATEMEMENTSParent Company Financial Statements and Notes
5.4.2. 2014 INCOME STATEMENTS
(in millions of euros) Notes Dec. 31, 2013 net Dec. 31, 2014 net
Sales of goods and services 807 825
NET REVENUE (20) 807 825
Own work capitalized 21 15
Reversals of depreciation, amortization and provisions and expense transfers 30 68
Other income 4 2
Operating income 862 910
Purchases of goods for resale - -
Purchases of raw materials and supplies - -
Other purchases and external charges 585 628
Taxes other than on income 18 16
Wages and salaries (21) 114 106
Payroll taxes 48 47
Depreciation, amortization and provision expense
�� Depreciation and amortization of fixed assets (4) 28 35
�� Additions to provisions for fixed assets 1
�� Additions to provisions for current assets 2 4
�� Additions to provisions for contingencies and charges 51 14
Other expenses (21) 5 2
Operating expenses 852 852
OPERATING PROFIT 10 58
Share of profits from non-managed joint ventures or transferred losses of managed joint ventures - -
Share of losses of non-managed joint ventures and transferred profits from managed joint ventures - -
Joint ventures
Income from investments in subsidiaries and affiliates (19) 154 324
Income from investment securities and long-term loans - -
Other interest income (19) 23 27
Provision reversals and expense transfers 114 55
Foreign exchange gains 9 17
Financial income 300 423
Amortization and provisions – financial assets 99 100
Interest expense (19) 145 137
Foreign exchange losses 10 17
Financial expenses 254 254
NET FINANCIAL INCOME (22) 46 169
RECURRING INCOME BEFORE TAX 56 227
Registration Document 2014 269

FINANCIAL STATEMEMENTSParent Company Financial Statements and Notes5
(in millions of euros) Notes Dec. 31, 2013 net Dec. 31, 2014 net
Non-recurring income from revenue transactions -
Non-recurring income from capital transactions 82 22
Exceptional provision reversals and expense transfers 11 23
Non-recurring income 93 45
Non-recurring expenses on revenue transactions 3 11
Non-recurring expenses on capital transactions 52 31
Exceptional additions to depreciation, amortization and provisions 13 5
Non-recurring expenses 68 47
NET NON-RECURRING INCOME (EXPENSE) (23) 25 (2)
Income tax expense (24) (20) (14)
TOTAL INCOME 1,255 1,378
TOTAL EXPENSES 1,154 1,139
NET PROFIT 101 239
The financial statements of Accor SA have been prepared in accordance with French generally accepted accounting principles. All amounts are stated in millions of euros unless otherwise specified.
The notes below relate to the balance sheet at December 31, 2014 before appropriation of net profit for the year, which shows total assets of €8,133 million, and to the income statement for the year then ended, which shows a net profit of €239 million.
The financial statements cover the 12-month period from January 1 to December 31, 2014.
Accor SA’s individual financial statements are included in the consolidated financial statements of the Accor Group.
The preparation of financial statements requires the use of estimates and assumptions that can affect the carrying amount of certain assets and liabilities, income and expenses, and the information disclosed in the notes to the financial statements. Management reviews these estimates and assumptions on a regular basis to ensure that they are appropriate based on past experience and the current economic situation. Items in future financial statements may differ from current estimates as a result of changes in these assumptions.
The main estimates and judgments made by Management in the preparation of these financial statements concern the valuation and useful lives of intangible assets, property and equipment, and financial assets, as well as the amount of provisions for claims, litigation and contingencies and the assumptions underlying the calculation of pension obligations.
The main assumptions applied by the Company are presented in the relevant notes to the financial statements.
In 2014, Accor SA’s revenue rose by 2.2% compared with 2013.
During the year, Accor enhanced its flexibility by placing a €900 million issue of perpetual hybrid bonds and carrying out three new ordinary bond issues representing an aggregate amount of €1,083 million. In addition, in June it signed a new €1.8 billion five-year syndicated credit facility, replacing the €1.5 billion facility set up in May 2011, which was scheduled to expire in May 2016.
In October 2014, Accor launched “Leading Digital Hospitality”, a digital transformation plan structured around eight programs based on consolidating the Group’s IT systems and processes. The plan is customer-centric but also focuses on the Group’s employees and partners. Accor will invest a significant amount over a five-year period to bring all of the plan’s initiatives to fruition, several of which were already implemented in the last quarter of 2014.
On November 13, 2014, Accor acquired a 36.6% stake in Mama Shelter (a chain of affordable boutique hotels), through direct and indirect interests of 20.09% and 16.4% respectively, for an aggregate €29 million.
Registration Document 2014270
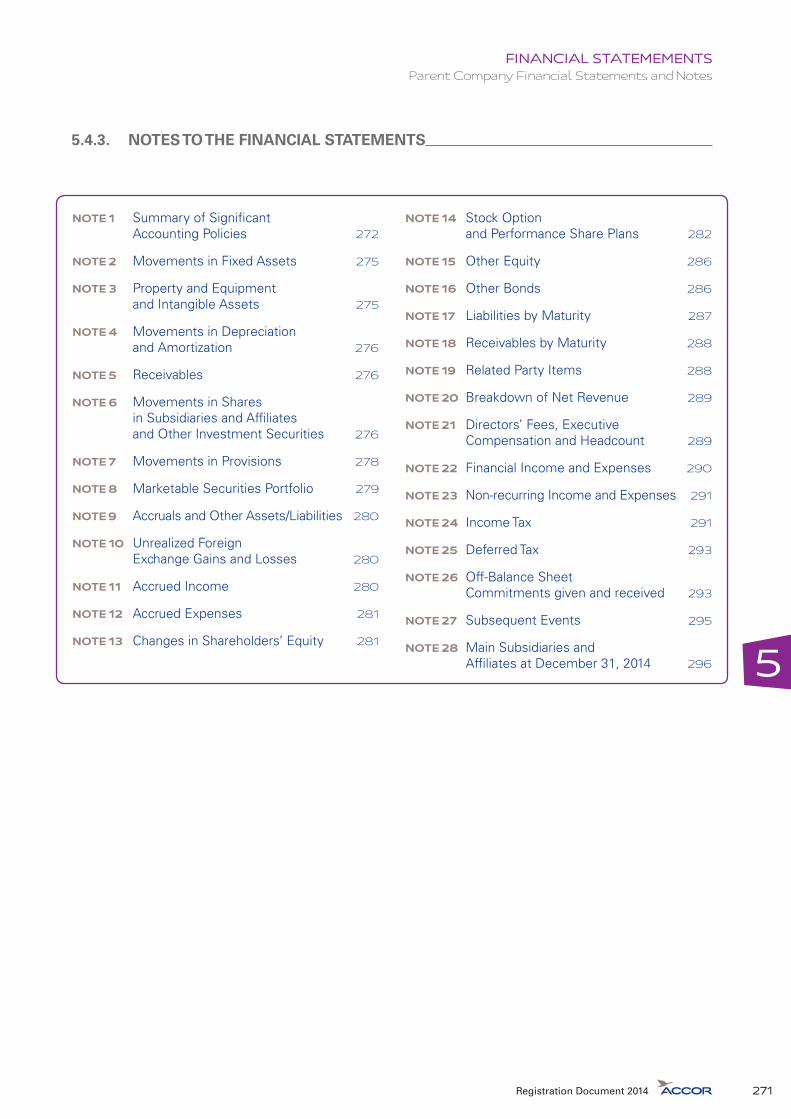
5
FINANCIAL STATEMEMENTSParent Company Financial Statements and Notes
5.4.3. NOTES TO THE FINANCIAL STATEMENTS
NOTE 1 Summary of Significant Accounting Policies 272
NOTE 2 Movements in Fixed Assets 275
NOTE 3 Property and Equipment and Intangible Assets 275
NOTE 4 Movements in Depreciation and Amortization 276
NOTE 5 Receivables 276
NOTE 6 Movements in Shares in Subsidiaries and Affiliates and Other Investment Securities 276
NOTE 7 Movements in Provisions 278
NOTE 8 Marketable Securities Portfolio 279
NOTE 9 Accruals and Other Assets/Liabilities 280
NOTE 10 Unrealized Foreign Exchange Gains and Losses 280
NOTE 11 Accrued Income 280
NOTE 12 Accrued Expenses 281
NOTE 13 Changes in Shareholders’ Equity 281
NOTE 14 Stock Option and Performance Share Plans 282
NOTE 15 Other Equity 286
NOTE 16 Other Bonds 286
NOTE 17 Liabilities by Maturity 287
NOTE 18 Receivables by Maturity 288
NOTE 19 Related Party Items 288
NOTE 20 Breakdown of Net Revenue 289
NOTE 21 Directors’ Fees, Executive Compensation and Headcount 289
NOTE 22 Financial Income and Expenses 290
NOTE 23 Non-recurring Income and Expenses 291
NOTE 24 Income Tax 291
NOTE 25 Deferred Tax 293
NOTE 26 Off-Balance Sheet Commitments given and received 293
NOTE 27 Subsequent Events 295
NOTE 28 Main Subsidiaries and Affiliates at December 31, 2014 296
Registration Document 2014 271

FINANCIAL STATEMEMENTSParent Company Financial Statements and Notes5
Notes 1 to 27 set out below form an integral part of the financial statements.
NOTE 1 SUMMARY OF SIGNIFICANT ACCOUNTING POLICIES
The financial statements of Accor SA have been prepared in accordance with French generally accepted accounting principles, including the principles of prudence, materiality and segregation of accounting periods, for the purpose of giving a true and fair view of the assets, liabilities and financial position of the Company and the results of its operations. They are presented on a going concern basis and accounting methods have been applied consistently from one year to the next.
Assets recorded in the balance sheet are stated at historical cost or contributed value, as applicable.
The significant accounting policies used are described below.
Concerning Notes a) and b): since January 1, 2005, the Company has applied standards CRC 2004-06 relating to the definition, recognition and measurement of property, plant and equipment and intangible assets, and CRC 2002-10 relating to the depreciation, amortization and impairment of these assets.
Property and equipment and intangible assets are recognized when the following two conditions are met:
�� it is probable that the expected future economic benefits that are attributable to the asset will flow to the Company;
�� the cost or value of the asset can be reliably measured.
a) Intangible assets
Purchased intangible assets are measured at cost less accumulated amortization and any accumulated impairment losses. Intangible assets with finite useful lives are amortized on a straight-line basis over their estimated useful lives, corresponding to between two and five years for software and between three and five years for licenses. Leasehold rights, networks and trademarks with indefinite useful lives are not amortized. Their value is assessed whenever events or circumstances indicate that they may be impaired. If an assessment of fair value based on the same criteria as at the time of acquisition indicates the existence of a prolonged impairment in value, a provision is recorded.
b) Property and equipment
Property and equipment are stated at cost, corresponding to i) the asset’s purchase price, ii) any costs directly attributable to bringing the asset to the location and condition necessary for it to be capable of operating in the manner intended by Management, and iii) borrowing costs directly attributable to the construction or production of the asset.
Property and equipment are depreciated on a straight-line basis over their estimated useful lives, as follows:
�� buildings: 35 to 50 years;
�� fixtures and fittings: 7 to 25 years;
�� other property and equipment: 5 to 15 years.
a and b bis) Fair values of intangible assets and property and equipment
At each year-end, the Company determines whether there are any indicators of impairment in value of intangible assets or property and equipment. Impairment indicators include obsolescence, physical damage, significant changes in the manner in which the asset is used, lower-than-expected economic performance, a steep fall in revenues, or other external indicators. Where there is an indication that the value of an asset may be impaired, its present value is assessed and compared with its carrying amount for the purpose of calculating the potential impairment charge.
The present value of an asset is deemed to be the higher of its fair value or value in use.
c) Investments
Shares in subsidiaries and affiliates are stated at cost. Transaction costs on these assets are recorded in the income statement.
At each year-end, the Company determines whether there are any indicators of impairment in value of its investments. Impairment indicators include lower-than-expected economic performance, a drop in share price, rating downgrades and steep falls in revenue or earnings.
Where there is an indication that the value of an asset may be impaired, its present value is assessed and compared with its carrying amount for the purpose of calculating the potential impairment charge. The present value of an investment is deemed to be the higher of its fair value or value in use.
Accor considers that the most appropriate method for measuring the fair value of its investments is to calculate its equity in the underlying net assets of the subsidiaries and affiliates concerned. Another method used for investments in hotel companies is to calculate their average EBITDA for the last two years and apply a multiple based on the type of hotels owned by the company concerned and their financial position. Accor also uses comparable recent transactions for the purpose of calculating fair values.
Registration Document 2014272

5
FINANCIAL STATEMEMENTSParent Company Financial Statements and Notes
If the fair value of an investment is lower than the asset’s carrying amount, the Company then also determines the investment’s value in use, which corresponds to the present value of the future cash flows expected to be derived from the investment. The value in use of investments in subsidiaries and affiliates is assessed using a range of indicators, including:
�� the historical data used to value the investment at the time of acquisition;
�� current profitability data and the current value of the underlying net assets;
�� projections of future profitability, realizable values and economic trends.
If shares in subsidiaries and affiliates or other investment securities are deemed to be impaired, they are written down to the lower of their fair value or value in use, based on the impairment tests performed and taking into account their financial position. Where the company concerned is not certain of achieving operating profitability in the future, the investment is written down to an amount corresponding to the Company’s equity in the underlying net assets. The measurement process also takes into account i) the maturity of the business (for example no provision is recorded for investments in companies that are in the start-up phase if their future profitability is assured) and ii) the fair value of certain of the subsidiary’s assets that are not included in the balance sheet (e.g. trademarks). Provisions for impairment recognized on these investments are not permanent and may be reversed if the financial position of the company concerned improves. However, any reversals of impairment provisions may not result in the investment’s carrying amount being increased to above its historical cost.
Additional provisions may be recorded to write down loans and advances to the company concerned and, where necessary, a provision for contingencies is also recorded.
d) Inventory
Inventory is measured at the lower of cost or probable realizable value. Cost is determined by the weighted average cost method.
e) Deferred charges
In accordance with the applicable French accounting standards relating to assets, since January 1, 2005 deferred charges have consisted solely of debt issuance costs, which are amortized over the life of the related debt.
f) Receivables
Receivables are recognized at nominal value and provisions for impairment are subsequently recorded if their fair value is lower than their carrying amount.
g) Marketable securities
Marketable securities are stated at the lower of cost or market value.
h) Revenue
Revenue includes the amount of services and contractual fees (i.e. management and franchise fees) billed to managed and franchised hotels, subsidiaries and non-related parties. It also includes amounts billed under real estate and business lease contracts as well as fees received in return for rent and debt guarantees issued by the Company.
Revenue from product sales is recognized when the product is delivered and ownership is transferred to the buyer. Revenue from sales of services is recognized when the service is rendered.
Consequently:
�� rental and business lease revenues are recognized on a straight-line basis over the life of the contract;
�� fees billed to subsidiaries and non-related parties are recognized on a straight-line basis over the life of the contract;
�� fees for guarantees are recognized on a straight-line basis over the term of the guarantee concerned;
�� revenue from other services is recognized when the service is rendered.
i) Untaxed provisions
Hotel fixed assets may be depreciated by the reducing balance method for tax purposes. Any difference between straight-line depreciation recorded in the accounts and reducing balance depreciation calculated for tax purposes is recorded as excess tax depreciation in shareholders’ equity.
j) Provisions for contingencies and charges
Provisions for contingencies and charges are determined in accordance with standard CRC 2000-06 relating to liabilities.
A provision is recorded when the Company has an obligation towards a third party, which is probable or certain of giving rise to an outflow of economic resources without any inflow of economic resources of at least an equivalent value being expected.
k) Provisions for pensions and other post-employment benefit obligations
Since 2013, the Company has applied ANC recommendation 2013-02 issued on November 7, 2013, which had the effect of repealing the previously applied CNC recommendation 2003-R01 of April 1, 2003. This change resulted in the reclassification of unrecognized past service costs in equity. The Company’s total obligation for the payment of pensions and other post-employment benefits is provided for in the balance sheet. This obligation concerns statutory length-of-service awards payable in France and other defined benefit plans. The projected benefit obligation is recognized on a straight-line basis over the vesting period of the plans concerned, taking into account the probability of employees leaving the Company before retirement age. The provision recorded in the balance sheet is equal to the discounted value of the defined benefit obligation, plus or minus any actuarial differences, which are taken to the income statement in the year in which they arise.
Registration Document 2014 273

FINANCIAL STATEMEMENTSParent Company Financial Statements and Notes5
In addition to these statutory benefit plans, certain employees are members of:
�� a defined contribution supplementary pension plan funded by periodic contributions to an external organization that is responsible for the administrative and financial management of the plan as well as for payment of the related annuities. The contributions made by Accor under this plan are expensed as incurred;
�� a defined benefit supplementary pension plan under which beneficiaries are entitled to pension benefits calculated based on their salary and the duration of their participation in the plan. The provision recorded for the Company’s obligation under this plan takes into account any amounts funded through an external organization (plan assets).
l) Plain vanilla bonds
For plain vanilla bonds issued at a discount to face value, the difference between the issue proceeds and the face value of the bonds is amortized on a straight-line basis over the life of the bonds.
m) Other equity
On June 30, 2014, Accor placed a €900 million issue of perpetual hybrid bonds. The bonds have no maturity date but are first callable as from June 30, 2020. They have been classified as “Other equity” in the Company’s balance sheet and the €6 million issue premium has been recorded as a deduction from the nominal amount of the debt.
The interest payable on the bonds is included in “Other borrowings” and the related debt issuance costs are being amortized through the income statement.
n) Foreign currency transactions
Income and expenses in foreign currencies are converted into euros at the exchange rate prevailing on the transaction date.
Payables, receivables and cash balances in foreign currencies are converted at the year-end exchange rate.
Translation differences are recorded in the balance sheet.
No provision for exchange losses is recorded for loans and borrowings denominated in the same currency with broadly equivalent maturities.
o) Currency risks
Currency risks arising on the conversion of euro cash reserves into foreign currencies to meet part of the financing needs of foreign subsidiaries are hedged by currency swaps with the same maturities as the loans to subsidiaries.
p) Corporate income tax
Accor has elected for group relief in application of the French Act of December 31, 1987. Under the group relief system, tax losses of companies in the tax group can be netted off against the profits of other companies in the group, provided that certain conditions are met. The applicable tax rules are defined in Articles 223 A et seq. of the French General Tax Code.
Each company in the tax group records in its accounts the tax charge it would have incurred if it had been taxed on a standalone basis. The group relief benefit or charge is recorded in the balance sheet of Accor SA as head of the tax group.
In accordance with tax regulations applicable since January 1, 2005, provisions for unrealized long-term losses on securities are not offset against unrealized capital gains on the same class of investments.
q) Stock options and performance shares
In compliance with the “Fillon 3 Act”, the Company uses the fair values of stock options and performance shares measured in accordance with IFRS 2 as the basis for calculating the related contribution sociale surtax.
Since 2008, Accor has accounted for performance share plans and employee stock option plans in accordance with standard CRC 2008-15. Since 2006, each year Accor SA has launched several stock option plans as well as performance share plans, which have vesting periods of between two and four years. New shares will be issued when the rights under these plans vest. Consequently, no provision has been recorded for the cost of these plans in the financial statements at December 31, 2014.
Registration Document 2014274

5
FINANCIAL STATEMEMENTSParent Company Financial Statements and Notes
NOTE 2 MOVEMENTS IN FIXED ASSETS
(in millions of euros)
Gross value at Jan. 1, 2014
Acquisitions and inter-item
transfers
Retirements and disposals and inter-item
transfers OtherGross value at Dec. 31, 2014
Trademarks and rights of use 59 - - - 59
Licenses and software 134 19 (1) - 152
Networks 57 - - - 57
Other intangible assets 15 17 (14) - 18
Prepayments to suppliers of intangible assets - - - - -
Intangible assets 265 36 (15) - 286
Land 5 - - - 5
Buildings 85 3 (5) - 83
Machinery and equipment 29 - (3) - 26
Other property and equipment 80 6 (2) - 84
Assets under construction - - - - -
Prepayments to suppliers of property and equipment 1 4 (1) - 4
Property and equipment 200 13 (11) - 202
Shares in subsidiaries and affiliates (1) 6,549 753 (24) - 7,278
Loans and advances to subsidiaries and affiliates (2) 412 206 (217) 4 405
Other investment securities (1) 3 30 - - 33
Other loans 20 3 - - 23
Other investments 31 - - - 31
Investments 7,015 992 (241) 4 7,770
TOTAL FIXED ASSETS 7,480 1,041 (267) 4 8,258
(1) See Note 6 for a breakdown of the aggregate €759 million increase in these items.(2) The decrease in this item reflects the combined effect of new loan originations and loans maturing during the year.
NOTE 3 PROPERTY AND EQUIPMENT AND INTANGIBLE ASSETS
Trademarks and rights of use
This item mainly relates to the valuation of the Novotel trademark and rights granted to subsidiaries to use the Accor Group’s trademarks.
Licenses and software
These correspond to IT licenses and software used by the Company in its operating activities.
Networks
Networks primarily correspond to the hotel networks of Novotel and Suite Novotel.
Buildings and fixtures and fittings
These items mainly correspond to buildings and fixtures and fittings related to hotels, headquarters premises and the Group’s training center.
Registration Document 2014 275

FINANCIAL STATEMEMENTSParent Company Financial Statements and Notes5
NOTE 4 MOVEMENTS IN DEPRECIATION AND AMORTIZATION
(in millions of euros) At Jan. 1, 2014 Increase Decrease At Dec. 31, 2014
Trademarks and rights of use - - - -
Licenses and software 104 13 (1) 116
Networks 36 1 - 37
Other intangible assets 1 1 - 2
Intangible assets 141 15 (1) 155
Land 1 - - 1
Buildings 49 3 (2) 50
Machinery and equipment 24 1 (3) 22
Other property and equipment 47 8 (1) 54
Property and equipment 121 12 (6) 127
FIXED ASSETS 262 27 (7) 282
NOTE 5 RECEIVABLES (1)
(in millions of euros)
Dec. 31, 2013Gross amount
Dec. 31, 2014Gross amount
Prepayments to suppliers 3 7
Trade receivables 289 325
Other receivables 451 363
Supplier-related receivables 1 2
Recoverable VAT and other taxes 75 69
Current accounts with subsidiaries 352 262
Other 23 30
TOTAL 743 695
(1) Including prepayments to suppliers.
NOTE 6 MOVEMENTS IN SHARES IN SUBSIDIARIES AND AFFILIATES AND OTHER INVESTMENT SECURITIES
Business acquisitions and purchases of newly-issued shares
Number of shares acquired
Amount(in millions of euros)
% interest at Dec. 31, 2014
MAMA SHELTER 36,787 16 20.19%
TOWN AND SHELTER 2,522 13 30.01%
RAISE INVESTISSEMENT 10,800,000 10 3.60%
ACTIMOS 323,096 2 100.00%
TOTAL ACQUISITIONS 41
Registration Document 2014276

5
FINANCIAL STATEMEMENTSParent Company Financial Statements and Notes
Additional investments
Number of shares acquired % acquired
Amount(in millions of euros)
% interestat Dec. 31, 2014
ACCOR PARTECIPAZIONI ITALIA - - 364 100.00% (2)
ACCOR HOTELS BELGIUM - - 325 100.00% (2)
ACCOR HOTELES ESPAGNA 5,987,325 - 67 16.40% (1)
THALAMER 925,000 - 15 100.00% (1)
HOTEL MÉTROPOLE SURESNES 25,610 76.00% 2 100.00% (a)
RISMA 35,709 - 1 33.34% (b)
REAL ESTATE HOTEL CY 530 - 1 93.37% (1)
ACCOR HOTEIS E SERVICOS 217,372 - 1 50.00% (2)
AURORA - - 1 100.00% (2)
TURAMBAR (Spain) - - (8) 100.00% (3)
TOTAL ACQUISITIONS 769
DisposalsNumber of shares sold % sold
Carrying amount derecognized
(in millions of euros)
% interestat Dec. 31, 2014
ACCOR HOSPITALITY GERMANY - 0.00% (45) 100.00% (4)
SHERATON GEZIRAH LE CAIRE 386,669 0.00% (2) 65.01% (5)
HOSPARGINVEST (Argentina) 57,000 95.00% (1) 0.00%
Sales (48)
CEPIH 43,000 100.00% (12) 0.00%
SOCIÉTÉ HÔTELIÈRE SABLAISE 1,657,350 100.00% (5) 0.00%
SOCIÉTÉ D’INFORMATION ET DE SERVICES 100 100.00% (3) 0.00%
SCI VIMA 29,999 100.00% (2) 0.00%
SCI LEBO 9,999 100.00% (1) 0.00%
Liquidations (23)
TOTAL SALES AND LIQUIDATIONS (71)
Other movements
Number of securities involved
Amount(in millions of euros)
% interestat Dec. 31, 2014
Bonds
Equity notes issued by Risma 2,122,932 20
TOTAL OTHER MOVEMENTS 20
Summary
TOTAL ACQUISITIONS 810 -
TOTAL DISPOSALS AND LIQUIDATIONS (71) -
TOTAL OTHER MOVEMENTS 20 -
TOTAL MOVEMENTS 759
(1) Partial or full take-up of shares in connection with a share issue.(2) Participation in a capital increase not entailing the issue of shares.(3) Decrease in the carrying amount of Accor’s investment following a price adjustment.(4) Decrease in the carrying amount of Accor’s investment following a capital reduction without the cancellation of shares.(5) Decrease in the carrying amount of Accor’s investment following a capital reduction with the cancellation of shares.(a) Acquisition raising the Company’s interest to more than 50%.(b) Acquisition raising the Company’s interest to more than 33.1/3%.
Registration Document 2014 277

FINANCIAL STATEMEMENTSParent Company Financial Statements and Notes5
NOTE 7 MOVEMENTS IN PROVISIONS
(in millions of euros) At Jan. 1, 2014 Increase
Decrease
At Dec. 31, 2014
Surplus provisions
Utilized provisions
Excess tax depreciation 8 1 - (1) 8
UNTAXED PROVISIONS 8 1 - (1) 8
Claims and litigation 2 2 (1) - 3
Foreign exchange losses 1 - - - 1
Other (1) 40 26 (2) - 64
PROVISIONS FOR CONTINGENCIES 43 28 (3) - 68
Pensions and other post-employment benefit obligations (3) 32 10 (4) - 38
Taxes 28 3 - (3) 28
Other 47 4 (6) (32) 13
PROVISIONS FOR CHARGES (2) 107 17 (10) (35) 79
Total untaxed provisions and provisions for contingencies and charges 158 46 (13) (36) 155
Intangible assets 17 - - - 17
Property and equipment 1 - - - 1
Investments* 2,949 63 (49) - 2,963
Trade receivables 14 4 (2) - 16
Other receivables* 35 8 (23) - 20
Total provisions for impairment in value (4) 3,016 75 (74) - 3,017
TOTAL PROVISIONS 3,174 121 (87) (36) 3,172
Income statement impact of movements in provisions Increase Decrease
Operating income and expenses 18 (46)
Financial income and expenses 98 (54)
Non-recurring income and expenses 5 (23)
Movements with no income-statement impact - -
TOTAL 121 (123)
* Recorded in accordance with the accounting policy described in Note 1c.
(1) Other provisions for contingencies mainly comprised €61 million in provisions for risks related to subsidiaries. These provisions are set aside after taking into account provisions for shares in and loans and advances to subsidiaries and affiliates.
Movements in this item primarily reflect i) additions to provisions for subsidiaries in an amount of €25 million and ii) reversals of provisions for subsidiaries amounting to €1 million.
(2) At the year-end, total provisions for charges included i) €38 million in provisions for pensions and other post-employment benefit obligations, ii) €28 million in provisions for taxes, iii) €10 million in restructuring provisions (of which €5 million for voluntary separation plans), and €2 million in provisions for future rental payments and charges.
Additions to and reversals of provisions for pensions and other post-employment benefit obligations amounted to €10 million and €4 million respectively. A total of €3 million was added to provisions for taxes following a tax audit relating to 2011 (see Note 23) and €3 million was reversed from these provisions following the
payment of reassessed tax following an audit related to the years 2008 and 2009. Movements in other provisions for charges corresponded to €4 million in additions (primarily for restructuring provisions) and €38 million in reversals (of which €36 million
from restructuring provisions and €2 million from provisions for future rental payments and charges).
Registration Document 2014278

5
FINANCIAL STATEMEMENTSParent Company Financial Statements and Notes
(3) Pension benefit obligations and underlying actuarial assumptions.
2013 2014
Discount rate 3.0% 2.0%
Mortality tables TG05 Générationnelle INSEE TG05 Générationnelle INSEE
Rate of future salary increases* 3.00% 3.00%
Retirement age 65 years 65 years
Voluntary or compulsory retirement Voluntary Voluntary
Staff turnover rate
Rate progressively decreasing in line with age:�� ranging between 7.1% and 0% for non-managerial employees and 0% as from 44 years of age;�� between 5.2% and 0% for managerial employees and 0% as from 55 years of age.
Rate progressively decreasing in line with age:�� ranging between 7.1% and 0% for non-managerial employees and 0% as from 44 years of age;�� between 5.2% and 0% for managerial employees and 0% as from 55 years of age.
Payroll tax rate 46,00% 46,00%
* This rate has been set at 4% for defined benefit plans.
2013 2014
Provisions for pensions and other post-employment benefit obligations at Jan. 1 41 32
Service cost 5 3
Interest expense 1 1
Actuarial (gains)/losses (1) 4
Curtailments and settlements (15) (2)
Other movements (1) -
PROVISIONS FOR PENSIONS AND OTHER POST-EMPLOYMENT BENEFIT OBLIGATIONS AT DEC. 31 32 38
(4) These provisions mainly concern impairment in value of shares in subsidiaries and affiliates, with the 2014 year-end balance primarily corresponding to write-downs of ALNA (€881 million), CIWLT (€769 million), IBL (€652 million), Accor Participation Italie (€131 million), SHNM (€76 million), Belle Rivière Hôtel (€44 million), Accor Hoteles Espagna (€41 million), SPFH (€24 million), La Thermale de France (€29 million), HOLPA (€25 million), Sofitel Luxury Hotels France (€27 million) and SIH Mexico (€22 million). Movements in these provisions in 2014 broke down as €75 million in additions and €74 million in reversals. Additions included €34 million for Accor Participation Italie, €11 million for Accor Hospitality Espagna, €8 million for Sofitel Luxury Hotels France and €3 million for Accor Hospitality Argentina. Reversals included €10 million for CEPIH, €6 million for SAHT, €6 million for Accor Afrique and €3 million for Holpa.
NOTE 8 MARKETABLE SECURITIES PORTFOLIO
(in millions of euros)
Dec. 31, 2013Gross value
Dec. 31, 2014Gross value
Mutual fund units 30 30
Money market funds - 800
Term deposits 1,160 691
TOTAL 1,190 1,521
No provisions for impairment in value were set aside in 2014 for marketable securities as their fair value exceeded or was equal to their carrying amount.
Registration Document 2014 279

FINANCIAL STATEMEMENTSParent Company Financial Statements and Notes5
NOTE 9 ACCRUALS AND OTHER ASSETS/LIABILITIES
(in millions of euros)
Net at Jan. 1, 2014 Increase Decrease
Net at Dec. 31, 2014
Debt issuance costs 9 22 (7) 24
DEFERRED CHARGES 9 22 (7) 24
Issue premiums 3 - (2) 1
BOND ISSUE PREMIUMS 3 - (2) 1
Prepaid IT rental and maintenance costs 2 1 - 3
Prepaid property rents 1 - - 1
Other 2 2 (1) 3
PREPAID EXPENSES 5 3 (1) 7
Marketing fund 2 - (1) 1
DEFERRED INCOME 2 - (1) 1
NOTE 10 UNREALIZED FOREIGN EXCHANGE GAINS AND LOSSES
(in millions of euros) 2013 2014
Decrease in receivables 8 3
Increase in payables 1 5
TOTAL ASSETS 9 8
(in millions of euros) 2013 2014
Increase in receivables 1 5
Decrease in payables 6 1
TOTAL LIABILITIES AND EQUITY 7 6
NOTE 11 ACCRUED INCOME
Accrued income is included in the following balance sheet items:(in millions of euros) 2013 2014
Loans and advances to subsidiaries and affiliates 1 2
Trade receivables 233 241
Other loans 1 1
Current accounts with subsidiaries 1 -
Marketable securities 10 16
Cash and cash equivalents - 1
TOTAL 246 261
Registration Document 2014280

5
FINANCIAL STATEMEMENTSParent Company Financial Statements and Notes
NOTE 12 ACCRUED EXPENSES
Accrued expenses are included in the following balance sheet items:(in millions of euros) 2013 2014
Bonds 52 47
Bank borrowings 1 20
Other borrowings 8 5
Trade payables 145 158
Accrued taxes and payroll costs 56 50
Other payables 2 2
TOTAL 264 282
NOTE 13 CHANGES IN SHAREHOLDERS’ EQUITY
(in millions of euros)
At Dec. 31, 2013
Appropriation of 2013
net profit
Capital increase/ reduction Other
2014 net profit
At Dec. 31, 2014
Number of shares making up the Company’s capital (1) 228,053,102 - 1,888,004 1,895,293 - 231,836,399
Share capital 684 - 6 6 - 696
Additional paid-in capital 979 (76) 41 54 - 998
Legal reserve 69 - - - - 69
Untaxed reserves 9 - - - - 9
Other reserves 14 - - - - 14
Retained earnings 6 (6) - - - -
Net profit 101 (101) - - 239 239
Untaxed provisions 8 - - - - 8
TOTAL SHAREHOLDERS’ EQUITY 1,870 (183) (2) 47 (3) 60 (4) 239 2,033
(1) With a par value of €3 per share.(2) €183 million in dividends paid on June 4, 2014.(3) Shares issued on the exercise of employee stock options.(4) Part of the 2013 dividend was paid in shares, which resulted in the issuance of 1,895,293 new Accor shares and a €60 million capital increase.
Potential shares: if all employee stock options had been exercised at December 31, 2014, the number of issued shares would have been increased by 5,339,365, raising the Company’s capital by €123 million.
Registration Document 2014 281
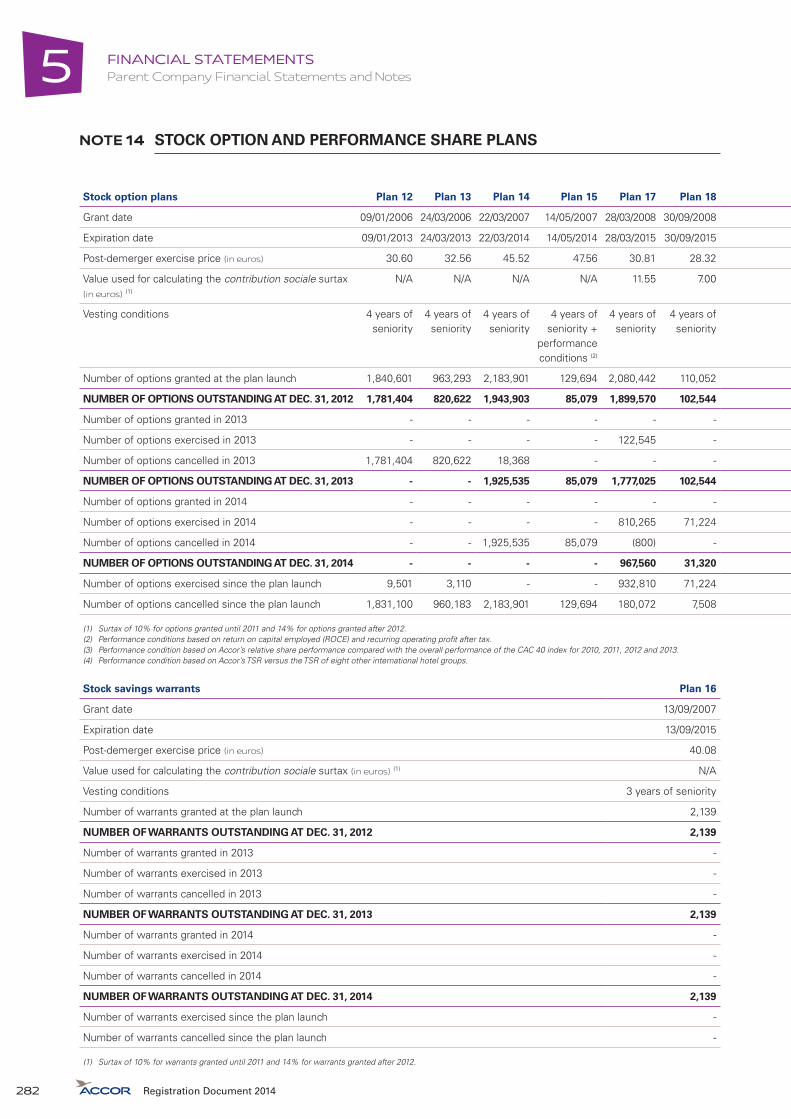
FINANCIAL STATEMEMENTSParent Company Financial Statements and Notes5
NOTE 14 STOCK OPTION AND PERFORMANCE SHARE PLANS
Stock option plans Plan 12 Plan 13 Plan 14 Plan 15 Plan 17 Plan 18 Plan 19 Plan 20 Plan 21 Plan 22 Plan 23 Plan 24 Plan 25 Plan 26 Plan 27
Grant date 09/01/2006 24/03/2006 22/03/2007 14/05/2007 28/03/2008 30/09/2008 31/03/2009 02/04/2010 02/04/2010 22/11/2010 04/04/2011 04/04/2011 27/03/2012 27/03/2012 26/09/2013
Expiration date 09/01/2013 24/03/2013 22/03/2014 14/05/2014 28/03/2015 30/09/2015 31/03/2017 02/04/2018 02/04/2018 22/11/2018 04/04/2019 04/04/2019 27/03/2020 27/03/2020 26/09/2021
Post-demerger exercise price (in euros) 30.60 32.56 45.52 47.56 30.81 28.32 18.20 26.66 26.66 30.49 31.72 31.72 26.41 26.41 30.13
Value used for calculating the contribution sociale surtax (in euros) (1)
N/A N/A N/A N/A 11.55 7.00 5.78 10.28 9.44 9.25 7.99 7.99 7.88 6.50 6.30
Vesting conditions 4 years of seniority
4 years of seniority
4 years of seniority
4 years of seniority +
performance conditions (2)
4 years of seniority
4 years of seniority
4 years of seniority
4 years of seniority
4 years of seniority +
performance conditions (3)
4 years of seniority
4 years of seniority
4 years of seniority +
performance conditions (4)
4 years of seniority
4 years of seniority +
performance conditions (4)
4 years of seniority +
performance conditions (4)
Number of options granted at the plan launch 1,840,601 963,293 2,183,901 129,694 2,080,442 110,052 1,429,456 2,618,770 153,478 92,448 621,754 53,125 527,515 47,375 40,000
NUMBER OF OPTIONS OUTSTANDING AT DEC. 31, 2012 1,781,404 820,622 1,943,903 85,079 1,899,570 102,544 1,273,857 2,213,777 137,228 92,448 607,334 53,125 527,015 47,375 -
Number of options granted in 2013 - - - - - - - - - - - - - - 40,000
Number of options exercised in 2013 - - - - 122,545 - 449,597 - - - - - - - -
Number of options cancelled in 2013 1,781,404 820,622 18,368 - - - 11,721 43,798 60,037 - 12,340 - 6,590 - -
NUMBER OF OPTIONS OUTSTANDING AT DEC. 31, 2013 - - 1,925,535 85,079 1,777,025 102,544 812,539 2,169,979 77,191 92,448 594,994 53,125 520,425 47,375 40,000
Number of options granted in 2014 - - - - - - - - - - - - - - -
Number of options exercised in 2014 - - - - 810,265 71,224 251,336 552,164 - - - - - - -
Number of options cancelled in 2014 - - 1,925,535 85,079 (800) - 1,341 33,480 - - 12,130 19,922 16,860 - -
NUMBER OF OPTIONS OUTSTANDING AT DEC. 31, 2014 - - - - 967,560 31,320 559,862 1,584,335 77,191 92,448 582,864 33,203 503,565 47,375 40,000
Number of options exercised since the plan launch 9,501 3,110 - - 932,810 71,224 705,111 553,069 - - - - - - -
Number of options cancelled since the plan launch 1,831,100 960,183 2,183,901 129,694 180,072 7,508 164,483 481,366 76,287 - 38,890 19,922 23,950 - -
(1) Surtax of 10% for options granted until 2011 and 14% for options granted after 2012.(2) Performance conditions based on return on capital employed (ROCE) and recurring operating profit after tax.(3) Performance condition based on Accor’s relative share performance compared with the overall performance of the CAC 40 index for 2010, 2011, 2012 and 2013.(4) Performance condition based on Accor’s TSR versus the TSR of eight other international hotel groups.
Stock savings warrants Plan 16
Grant date 13/09/2007
Expiration date 13/09/2015
Post-demerger exercise price (in euros) 40.08
Value used for calculating the contribution sociale surtax (in euros) (1) N/A
Vesting conditions 3 years of seniority
Number of warrants granted at the plan launch 2,139
NUMBER OF WARRANTS OUTSTANDING AT DEC. 31, 2012 2,139
Number of warrants granted in 2013 -
Number of warrants exercised in 2013 -
Number of warrants cancelled in 2013 -
NUMBER OF WARRANTS OUTSTANDING AT DEC. 31, 2013 2,139
Number of warrants granted in 2014 -
Number of warrants exercised in 2014 -
Number of warrants cancelled in 2014 -
NUMBER OF WARRANTS OUTSTANDING AT DEC. 31, 2014 2,139
Number of warrants exercised since the plan launch -
Number of warrants cancelled since the plan launch -
(1) Surtax of 10% for warrants granted until 2011 and 14% for warrants granted after 2012.
Registration Document 2014282

5
FINANCIAL STATEMEMENTSParent Company Financial Statements and Notes
Stock option plans Plan 12 Plan 13 Plan 14 Plan 15 Plan 17 Plan 18 Plan 19 Plan 20 Plan 21 Plan 22 Plan 23 Plan 24 Plan 25 Plan 26 Plan 27
Grant date 09/01/2006 24/03/2006 22/03/2007 14/05/2007 28/03/2008 30/09/2008 31/03/2009 02/04/2010 02/04/2010 22/11/2010 04/04/2011 04/04/2011 27/03/2012 27/03/2012 26/09/2013
Expiration date 09/01/2013 24/03/2013 22/03/2014 14/05/2014 28/03/2015 30/09/2015 31/03/2017 02/04/2018 02/04/2018 22/11/2018 04/04/2019 04/04/2019 27/03/2020 27/03/2020 26/09/2021
Post-demerger exercise price (in euros) 30.60 32.56 45.52 47.56 30.81 28.32 18.20 26.66 26.66 30.49 31.72 31.72 26.41 26.41 30.13
Value used for calculating the contribution sociale surtax (in euros) (1)
N/A N/A N/A N/A 11.55 7.00 5.78 10.28 9.44 9.25 7.99 7.99 7.88 6.50 6.30
Vesting conditions 4 years of seniority
4 years of seniority
4 years of seniority
4 years of seniority +
performance conditions (2)
4 years of seniority
4 years of seniority
4 years of seniority
4 years of seniority
4 years of seniority +
performance conditions (3)
4 years of seniority
4 years of seniority
4 years of seniority +
performance conditions (4)
4 years of seniority
4 years of seniority +
performance conditions (4)
4 years of seniority +
performance conditions (4)
Number of options granted at the plan launch 1,840,601 963,293 2,183,901 129,694 2,080,442 110,052 1,429,456 2,618,770 153,478 92,448 621,754 53,125 527,515 47,375 40,000
NUMBER OF OPTIONS OUTSTANDING AT DEC. 31, 2012 1,781,404 820,622 1,943,903 85,079 1,899,570 102,544 1,273,857 2,213,777 137,228 92,448 607,334 53,125 527,015 47,375 -
Number of options granted in 2013 - - - - - - - - - - - - - - 40,000
Number of options exercised in 2013 - - - - 122,545 - 449,597 - - - - - - - -
Number of options cancelled in 2013 1,781,404 820,622 18,368 - - - 11,721 43,798 60,037 - 12,340 - 6,590 - -
NUMBER OF OPTIONS OUTSTANDING AT DEC. 31, 2013 - - 1,925,535 85,079 1,777,025 102,544 812,539 2,169,979 77,191 92,448 594,994 53,125 520,425 47,375 40,000
Number of options granted in 2014 - - - - - - - - - - - - - - -
Number of options exercised in 2014 - - - - 810,265 71,224 251,336 552,164 - - - - - - -
Number of options cancelled in 2014 - - 1,925,535 85,079 (800) - 1,341 33,480 - - 12,130 19,922 16,860 - -
NUMBER OF OPTIONS OUTSTANDING AT DEC. 31, 2014 - - - - 967,560 31,320 559,862 1,584,335 77,191 92,448 582,864 33,203 503,565 47,375 40,000
Number of options exercised since the plan launch 9,501 3,110 - - 932,810 71,224 705,111 553,069 - - - - - - -
Number of options cancelled since the plan launch 1,831,100 960,183 2,183,901 129,694 180,072 7,508 164,483 481,366 76,287 - 38,890 19,922 23,950 - -
(1) Surtax of 10% for options granted until 2011 and 14% for options granted after 2012.(2) Performance conditions based on return on capital employed (ROCE) and recurring operating profit after tax.(3) Performance condition based on Accor’s relative share performance compared with the overall performance of the CAC 40 index for 2010, 2011, 2012 and 2013.(4) Performance condition based on Accor’s TSR versus the TSR of eight other international hotel groups.
Stock savings warrants Plan 16
Grant date 13/09/2007
Expiration date 13/09/2015
Post-demerger exercise price (in euros) 40.08
Value used for calculating the contribution sociale surtax (in euros) (1) N/A
Vesting conditions 3 years of seniority
Number of warrants granted at the plan launch 2,139
NUMBER OF WARRANTS OUTSTANDING AT DEC. 31, 2012 2,139
Number of warrants granted in 2013 -
Number of warrants exercised in 2013 -
Number of warrants cancelled in 2013 -
NUMBER OF WARRANTS OUTSTANDING AT DEC. 31, 2013 2,139
Number of warrants granted in 2014 -
Number of warrants exercised in 2014 -
Number of warrants cancelled in 2014 -
NUMBER OF WARRANTS OUTSTANDING AT DEC. 31, 2014 2,139
Number of warrants exercised since the plan launch -
Number of warrants cancelled since the plan launch -
(1) Surtax of 10% for warrants granted until 2011 and 14% for warrants granted after 2012.
Registration Document 2014 283

FINANCIAL STATEMEMENTSParent Company Financial Statements and Notes5
Performance share plans 2009 Plan 2011 Plan 2011 Plan 2011 Plan 2012 Plan 2012 Plan 2012 Plan 2013 Plan 2013 Plan 2013 Plan 2014 Plan 2014 Plan 2014 Plan 2014 Plan
Grant date 31/03/2009 04/04/2011 04/04/2011 04/04/2011 27/03/2012 27/03/2012 27/03/2012 15/04/2013 15/04/2013 15/04/2013 18/06/2014 18/06/2014 18/06/2014 18/06/2014
Expiration date 31/03/2013 04/04/2015 04/04/2015 04/04/2016 27/03/2016 27/03/2016 27/03/2016 15/04/2017 15/04/2017 15/04/2017 18/06/2016 18/06/2018 18/06/2016 18/06/2018
Value used for calculating the contribution sociale surtax (in euros) (1)
25.49 30.62 29.35 29.98 25.32 24.16 25.32 23.40 22.94 21.10 35.31 34.82 33.10 32.93
Vesting conditions 4 years of seniority +
performance conditions (2)
2 years of seniority +
performance conditions (3)
4 years of seniority +
performance conditions (3)
3 years of seniority +
performance conditions (4)
2 years of seniority +
performance conditions (5)
4 years of seniority +
performance conditions (5)
2 years of seniority +
performance conditions (6)
Performance conditions (7)
Performance conditions (7)
Performance conditions (8)
2 performance conditions (7)
2 performance conditions (7)
4 performance conditions (8)
4 performance conditions (8)
Number of performance shares granted at the plan launch 51,299 190,331 38,326 20,450 170,332 67,269 47,375 169,605 48,445 72,500 206,050 79,850 176,500 22,000
POTENTIAL NUMBER OF NEW SHARES ISSUABLE AT DEC. 31, 2012 IF PERFORMANCE CONDITIONS MET 21,393 184,823 37,040 20,450 158,772 62,361 37,504 - - - - - - -
Number of performance shares granted in 2013 - - - - - - - 169,605 48,445 72,500 - - - -
Number of performance shares vested in 2013 20,506 182,332 - - 150 - - - - - - - - -
Number of performance shares forfeited in 2013 887 2,491 3,844 - 1,741 2,382 - 665 - - - - - -
Number of performance shares cancelled in 2013 due to failure to achieve the performance conditions - - - 6,816 - - - 1,215 200 22,187 - - - -
POTENTIAL NUMBER OF NEW SHARES ISSUABLE AT DEC. 31, 2013 IF PERFORMANCE CONDITIONS MET - - 33,196 13,634 156,881 59,979 37,504 167,725 48,245 50,313 - - - -
Number of performance shares granted in 2014 - - - - - - - - - - 206,050 79,850 176,500 22,000
Number of performance shares vested in 2014 - - - 13,634 151,877 - 37,504 - - - - - - -
Number of performance shares forfeited in 2014 - - 447 - - 628 - 6,260 575 - 2,800 1,700 - -
Number of performance shares cancelled in 2014 due to failure to achieve the performance conditions - - - - 5,004 - - - - 8,982 - - 4,413 550
POTENTIAL NUMBER OF NEW SHARES ISSUABLE AT DEC. 31, 2014 IF PERFORMANCE CONDITIONS MET - - 32,749 - - 59,351 - 161,465 47,670 41,331 203,250 78,150 172,087 21,450
Number of performance shares vested since the plan launch 20,883 182,332 - - 152,027 - - - - - - - - -
Number of performance shares cancelled since the plan launch 30,416 7,999 5,577 6,816 18,305 7,918 9,871 8,140 775 31,169 2,800 1,700 4,413 550
(1) Surtax of 10% for performance shares granted until 2011 and 14% for performance shares granted after 2012.(2) Performance condition based on Accor Hospitality ROCE, Accor Services revenue and consolidated recurring operating profit after tax.(3) Performance condition based on revenue growth and EBIT and operating cash flow targets.(4) Performance condition based on the Chairman and CEO successfully taking up his duties, including successfully implementing changes in the Group’s organizational structure.(5) Performance condition based on actual versus budgeted EBIT margin, and actual versus budgeted operating cash flow excluding acquisitions and disposals.(6) Performance condition based on actual versus budgeted EBIT margin, actual versus budgeted operating cash flow excluding acquisitions and disposals, and the degree
of completion of the asset disposal plan included in the budget.(7) Performance condition based on actual versus budgeted EBIT margin, and actual versus budgeted operating cash flow excluding acquisitions and disposals.(8) Performance condition based on actual versus budgeted EBIT margin, actual versus budgeted operating cash flow excluding acquisitions and disposals, the degree of
completion of the asset disposal plan included in the budget, and Accor’s TSR versus the TSR of eight other international hotel groups.
Registration Document 2014284

5
FINANCIAL STATEMEMENTSParent Company Financial Statements and Notes
Performance share plans 2009 Plan 2011 Plan 2011 Plan 2011 Plan 2012 Plan 2012 Plan 2012 Plan 2013 Plan 2013 Plan 2013 Plan 2014 Plan 2014 Plan 2014 Plan 2014 Plan
Grant date 31/03/2009 04/04/2011 04/04/2011 04/04/2011 27/03/2012 27/03/2012 27/03/2012 15/04/2013 15/04/2013 15/04/2013 18/06/2014 18/06/2014 18/06/2014 18/06/2014
Expiration date 31/03/2013 04/04/2015 04/04/2015 04/04/2016 27/03/2016 27/03/2016 27/03/2016 15/04/2017 15/04/2017 15/04/2017 18/06/2016 18/06/2018 18/06/2016 18/06/2018
Value used for calculating the contribution sociale surtax (in euros) (1)
25.49 30.62 29.35 29.98 25.32 24.16 25.32 23.40 22.94 21.10 35.31 34.82 33.10 32.93
Vesting conditions 4 years of seniority +
performance conditions (2)
2 years of seniority +
performance conditions (3)
4 years of seniority +
performance conditions (3)
3 years of seniority +
performance conditions (4)
2 years of seniority +
performance conditions (5)
4 years of seniority +
performance conditions (5)
2 years of seniority +
performance conditions (6)
Performance conditions (7)
Performance conditions (7)
Performance conditions (8)
2 performance conditions (7)
2 performance conditions (7)
4 performance conditions (8)
4 performance conditions (8)
Number of performance shares granted at the plan launch 51,299 190,331 38,326 20,450 170,332 67,269 47,375 169,605 48,445 72,500 206,050 79,850 176,500 22,000
POTENTIAL NUMBER OF NEW SHARES ISSUABLE AT DEC. 31, 2012 IF PERFORMANCE CONDITIONS MET 21,393 184,823 37,040 20,450 158,772 62,361 37,504 - - - - - - -
Number of performance shares granted in 2013 - - - - - - - 169,605 48,445 72,500 - - - -
Number of performance shares vested in 2013 20,506 182,332 - - 150 - - - - - - - - -
Number of performance shares forfeited in 2013 887 2,491 3,844 - 1,741 2,382 - 665 - - - - - -
Number of performance shares cancelled in 2013 due to failure to achieve the performance conditions - - - 6,816 - - - 1,215 200 22,187 - - - -
POTENTIAL NUMBER OF NEW SHARES ISSUABLE AT DEC. 31, 2013 IF PERFORMANCE CONDITIONS MET - - 33,196 13,634 156,881 59,979 37,504 167,725 48,245 50,313 - - - -
Number of performance shares granted in 2014 - - - - - - - - - - 206,050 79,850 176,500 22,000
Number of performance shares vested in 2014 - - - 13,634 151,877 - 37,504 - - - - - - -
Number of performance shares forfeited in 2014 - - 447 - - 628 - 6,260 575 - 2,800 1,700 - -
Number of performance shares cancelled in 2014 due to failure to achieve the performance conditions - - - - 5,004 - - - - 8,982 - - 4,413 550
POTENTIAL NUMBER OF NEW SHARES ISSUABLE AT DEC. 31, 2014 IF PERFORMANCE CONDITIONS MET - - 32,749 - - 59,351 - 161,465 47,670 41,331 203,250 78,150 172,087 21,450
Number of performance shares vested since the plan launch 20,883 182,332 - - 152,027 - - - - - - - - -
Number of performance shares cancelled since the plan launch 30,416 7,999 5,577 6,816 18,305 7,918 9,871 8,140 775 31,169 2,800 1,700 4,413 550
(1) Surtax of 10% for performance shares granted until 2011 and 14% for performance shares granted after 2012.(2) Performance condition based on Accor Hospitality ROCE, Accor Services revenue and consolidated recurring operating profit after tax.(3) Performance condition based on revenue growth and EBIT and operating cash flow targets.(4) Performance condition based on the Chairman and CEO successfully taking up his duties, including successfully implementing changes in the Group’s organizational structure.(5) Performance condition based on actual versus budgeted EBIT margin, and actual versus budgeted operating cash flow excluding acquisitions and disposals.(6) Performance condition based on actual versus budgeted EBIT margin, actual versus budgeted operating cash flow excluding acquisitions and disposals, and the degree
of completion of the asset disposal plan included in the budget.(7) Performance condition based on actual versus budgeted EBIT margin, and actual versus budgeted operating cash flow excluding acquisitions and disposals.(8) Performance condition based on actual versus budgeted EBIT margin, actual versus budgeted operating cash flow excluding acquisitions and disposals, the degree of
completion of the asset disposal plan included in the budget, and Accor’s TSR versus the TSR of eight other international hotel groups.
Registration Document 2014 285

FINANCIAL STATEMEMENTSParent Company Financial Statements and Notes5
NOTE 15 OTHER EQUITY
In line with its strategy of increasing the maturity of its borrowings and ensuring the sustainability of its financial resources, in 2014 Accor placed a €900 million issue of perpetual hybrid bonds.
These bonds have no maturity date, but are first callable as from June 30, 2020.
(in millions of euros) Currency
Original issue
amount
Fixed/variable
rateInterest
rate
Outstanding principal at
Dec. 31, 2013
Outstanding principal
at Dec. 31, 2014
June 2014 issue of perpetual hybrid bonds Euros 900 Fixed 4.125% - 900
Issue premium on perpetual hybrid bonds Euros - (6)
OTHER EQUITY - (894)
NOTE 16 OTHER BONDS
In line with its strategy of increasing the maturity of its borrowings and ensuring the sustainability of its financial resources, Accor carried out three new issues of plain vanilla bonds in 2014.
(in millions of currency units) Currency
Original issue amount
(in currency units)
Original issue
amount(in euros)
Fixed/variable
rateInterest
rate Term
Outstanding principal
at Dec. 31, 2013
Outstanding principal
at Dec. 31, 2014
January 2009 bond issue Euros 600 600 Fixed 7.500% 5 years 402 -
July 2009 bond issue Euros 250 250 Fixed 6.039% 8 years 250 250
June 2012 bond issue Euros 700 700 Fixed 2.875% 5 years 700 700
March 2013 bond issue Euros 600 600 Fixed 2.500% 6 years 600 600
February 2014 bond issue Euros 900 900 Fixed 2.625% 7 years - 900
June 2014 bond issue Swiss francs
150 123 Fixed 1.750% 8 years - 125
December 2014 bond issue Euros 60 60 Fixed 1.679% 7 years and 2 months
- 60
Registration Document 2014286

5
FINANCIAL STATEMEMENTSParent Company Financial Statements and Notes
NOTE 17 LIABILITIES BY MATURITY
(in millions of euros) Gross amountDue within
1 yearDue
in 1-5 yearsDue beyond
5 years
Other bonds (1) (3) 2,682 47 1,550 1,085
Bank borrowings (1) (3) 227 227 - -
Other borrowings (1) (2) (3) 1,819 1,819 - -
BORROWINGS 4,728 2,093 1,550 1,085
Trade payables (3) 207 207 - -
OPERATING PAYABLES 207 207 - -
Accrued taxes and payroll costs (3) 88 88 - -
Due to suppliers of fixed assets (3) 9 9 - -
Other payables (3) 19 19 - -
Deferred income (3) 1 1 - -
MISCELLANEOUS PAYABLES 117 117 - -
TOTAL 5,052 2,417 1,550 1,085
(1) Gross amount of new borrowings during the year: €1,169 million. Gross amount of borrowings repaid during the year: €402 million.(2) Including €1,819 million due to related parties.(3) Breaking down as follows by currency:
Liabilities by currency
AUD 53
CHF 128
EUR 4,670
GBP 39
HKD 92
ILS 1
MXN 3
PLN 9
SGD 3
USD 54
TOTAL 5,052
Financing policy
At December 31, 2014, Accor had a confirmed line of credit maturing in more than one year. The unused portion of this facility totaled €1,800 million, expiring in 2019.
Registration Document 2014 287

FINANCIAL STATEMEMENTSParent Company Financial Statements and Notes5
NOTE 18 RECEIVABLES BY MATURITY
(in millions of euros) Gross amountDue within 1
yearDue beyond 1
year
Loans and advances to subsidiaries and affiliates 405 17 388
Other loans 23 8 15
Other investments 31 - 31
FIXED ASSETS 459 25 434
Trade receivables 325 325 -
Other receivables 363 363 -
Prepaid expenses 7 7 -
CURRENT ASSETS 695 695 -
TOTAL RECEIVABLES (1) 1,154 720 434
(1) Breaking down as follows by currency:
Receivables by currency
CHF 200
CNY 39
CZK 11
EGP 2
EUR 810
HKD 1
HUF 6
JPY 29
NZD 2
THB 3
USD 51
TOTAL 1,154
NOTE 19 RELATED PARTY ITEMS (1)
(in millions of euros) 2013 2014
Shares in subsidiaries and affiliates 6,466 7,165
Loans and advances to subsidiaries and affiliates 397 404
Other investment securities - -
Trade receivables 170 198
Other receivables 343 255
Borrowings 2,168 1,819
Trade payables 51 45
Income from investments in subsidiaries and affiliates 143 307
Other financial income 15 21
Financial expenses 41 38
(1) Companies that are fully consolidated in the Accor Group consolidated financial statements are deemed to be related parties.
Registration Document 2014288

5
FINANCIAL STATEMEMENTSParent Company Financial Statements and Notes
NOTE 20 BREAKDOWN OF NET REVENUE
(in millions of euros) 2013 2014
France 551 550
International 256 275
TOTAL NET REVENUE 807 825
NOTE 21 DIRECTORS’ FEES, EXECUTIVE COMPENSATION AND HEADCOUNT
Compensation paid to members of the Company’s administrative and supervisory bodies
(in millions of euros) 2013 2014
Directors’ fees 0.60 0.60
Members of the Executive Committee (excl. payroll taxes) 15.44 4.41
Retirement benefits - -
Headcount
Employee category 2013 2014
Managerial staff 778 775
Supervisors 173 155
Administrative staff 76 70
Apprentices 24 33
TOTAL 1,051 1,033
The Company had 1,033 employees at December 31, 2014, including 17 whose salaries are rebilled to subsidiaries.
Statutory training entitlement (DIF)
In accordance with Recommendation 2004F issued by the Urgent Issues Task Force of the French National Accounting Board, Accor did not set aside any provisions relating to employees’ statutory training entitlement in the 2014 financial statements.
At December 31, 2014, Accor employees had accumulated a total of 79,425 training hours under this entitlement.
Registration Document 2014 289

FINANCIAL STATEMEMENTSParent Company Financial Statements and Notes5
NOTE 22 FINANCIAL INCOME AND EXPENSES
(in millions of euros) 2013 2014
Dividends received from subsidiaries 145 315
Interest received on intragroup loans and receivables 9 8
INCOME FROM INVESTMENTS IN SUBSIDIARIES AND AFFILIATES 154 323
INCOME FROM INVESTMENT SECURITIES AND LONG-TERM LOANS - 1
Interest on current accounts 7 6
Interest on marketable securities 11 12
Interest on bank deposits 3 6
Interest on interest rate swaps - 2
Interest on currency swaps 1 -
Other 1 1
OTHER INTEREST INCOME 23 27
Reversals of provisions for shares in subsidiaries and affiliates 59 23
Reversals of provisions for loans and advances to subsidiaries and affiliates 16 11
Reversals of provisions for other receivables 26 19
Reversals of provisions for contingencies and charges 13 2
Expense transfers - -
REVERSALS OF PROVISIONS FOR FINANCIAL ITEMS 114 55
FOREIGN EXCHANGE GAINS 9 17
Total financial income 300 423
Interest on bonds (86) (73)
Interest on bank borrowings (5) (19)
Interest on other borrowings (38) (36)
Interest on interest rate swaps (6) -
Interest on currency swaps (1) (1)
Other (9) (8)
INTEREST EXPENSE (145) (137)
Additions to provisions for shares in subsidiaries and affiliates (70) (60)
Additions to provisions for loans (6) (3)
Additions to provisions for current assets (12) (8)
Amortization of bond issue premiums (1) (2)
Additions to provisions for contingencies and charges (10) (27)
AMORTIZATION AND PROVISIONS – FINANCIAL ASSETS (99) (100)
FOREIGN EXCHANGE LOSSES (10) (17)
Financial expenses (254) (254)
NET FINANCIAL INCOME 46 169
Registration Document 2014290

5
FINANCIAL STATEMEMENTSParent Company Financial Statements and Notes
NOTE 23 NON-RECURRING INCOME AND EXPENSES
In 2014, total non-recurring items before tax represented a net expense of €2 million, breaking down as follows:
(in millions of euros) 2013 2014
Non-recurring income and expenses on revenue transactions (1) (2) (11)
Gains (losses) on disposals of intangible assets and property and equipment (2) 12 14
Gains (losses) on disposals and liquidations of investments (3) 18 (19)
Reversals of provisions for contingencies and charges 2 3
Additions to provisions for contingencies and charges (4) (11) (4)
Non-recurring income and expenses on capital transactions - (4)
Reversals of provisions for current accounts - 4
Reversals of provisions for shares in subsidiaries and affiliates (5) 7 15
Additions to provisions for excess tax depreciation (2) (1)
Reversals of provisions for excess tax depreciation 1 1
NET NON-RECURRING INCOME (EXPENSE) 25 (2)
(1) Primarily corresponding to a €(10) million indemnity paid to settle a dispute.(2) Mainly comprising an earn-out payment received from Invesco related to the sale of the Pullman La Défense Grande Arche hotel in 2010.(3) Primarily corresponding to €(18) million in losses on liquidations of investments.(4) Primarily corresponding to additions to provisions for tax risks. On December 26, 2013 and October 22, 2014, the Company was notified of proposed adjustments
to its 2010 and 2011 accounts following tax audits carried out in 2013 and 2014. The financial consequences of the proposed adjustments for the tax group of which Accor SA is the filing entity have not yet been notified, but the total risk including late interest is estimated at €30 million. Accor SA wrote to the French tax authorities in February and December 2014 contesting the proposed adjustments, but has nevertheless recorded a contingency provision of €4 million in its 2014 financial statements (see Note 7).
(5) The main provision reversals in 2014 were recorded following the liquidation of non-trading property companies (€15 million).
NOTE 24 INCOME TAX
A. Accor SA income tax
(in millions of euros) 2013 2014
Group relief 25 22
Adjustment to prior-year tax benefit - (4)
Corporate income tax, withholding tax and other taxes (5) (4)
TOTAL 20 14
In 2014, the Company’s contribution to the tax group was a loss of €47.3 million taxed at the standard rate.
B. Group relief
Group relief for the Company in its capacity as head of the French tax group amounted to €21.7 million in 2014.
Registration Document 2014 291

FINANCIAL STATEMEMENTSParent Company Financial Statements and Notes5
C. Tax group
The tax group headed by Accor SA comprises the following 65 subsidiaries:
ACCOR Afrique MARCQ HÔTEL SNC Management Hôtels
ACCOR Centres de Contacts Clients Mer et Montagne SNC SODETIS
Chammans Finance SHNM Sofitel Luxury Hôtels France
Cie d’Exploitation Hôtelière de Bagnolet NMP France SOLUXURY HMC SARL
Cie d’Exploitation Hôtelière de Roissy NOVOBIENS SOPARAC
Cie Toulon. d’Invest. et de Développement ORPA SCI SOPARFI
CIWLT Succursale France Paris Clichy SOPHIA ANTIPOLIS
DEVIMCO Paris Porte de St-Cloud SPARHE
Domaine de Marlioz P.I.H. Sté Commerciale des Hôtels Économiques
ECOTEL PRADOTEL Sté Comtoise Hôtels Brochets
EHS SNC PROFID Sté de Construction des Hôtels Suite
EXHOTEL SA des Hôtels de Tradition Sté Française de Participations et d’Investissements Européens
FIMAKER SEORIM Sté Internationale de Participations
GESTAL SEPHI Sté Management Intermarques
HOSPITEL SH 61 QG Sté Participations et d’Investissements de Motels
Hôtel de Porticcio SH Du Montparnasse SNC Sté Participations d’Île-de-France
HOTEXCO SH de Thalasso Côte Varoise Sté de Participations Financières d’hôtellerie
ibis budget SH Forum SUDAIX sci
ibis Style Hôtels SH Porte de Sèvres THALAMER
IBL SHEMA
Immobilière Perrache SNC SHORET
La Thermale de France SIDH
Lionest SCI SIGEST 1
D. Provision recognized in accordance with Article 312-1 of standard CRC 99-03
In 2014, Accor applied Recommendation 2005-G issued on October 12, 2005 by the French National Accounting Board’s Urgent Issues Task Force concerning the conditions applicable for recognizing a provision within a parent company that has set up a tax group.
Under the Group relief agreement between Accor SA and its subsidiaries, the tax benefits resulting from the utilization by the tax group of a subsidiary’s tax losses revert to the subsidiary if it leaves the tax group.
As required by Article 312-1 of CRC standard 99-03, a provision is recorded for the Company’s liability when it is probable that the tax benefit will be transferred as a result of a subsidiary leaving the tax group.
In practice, over the past five years the majority of the companies that have left the tax group have done so as a result of a liquidation, merger or disposal not requiring any transfer of tax benefits. There has only been one case where the sale of a subsidiary to a party outside the tax group led to the transfer of a tax benefit.
E. Dividend withholding tax (précompte)
In 2002, Accor launched a legal challenge to its obligation to pay withholding tax on the redistribution of European-source dividends.
Until 2004, French parent companies that received dividends from their French subsidiaries were entitled to a 50% tax credit, which could be set off against the withholding tax payable on redistribution of the dividends. However, no such tax credit was available for European-source dividends.
Accor claimed that the absence of a tax credit on European-source dividends breached European Union rules.
Ruling on a dispute between Accor and the French State, on December 21, 2006 the Versailles Administrative Court ordered the State to refund the précompte withholding tax paid by Accor in the period from 1999 to 2001, for a total of €156 million.
The amount of €156 million was refunded to Accor during the first half of 2007, together with €36.4 million in late payment interest due by the French State.
Registration Document 2014292

5
FINANCIAL STATEMEMENTSParent Company Financial Statements and Notes
However, on March 8, 2007, the French State appealed the ruling to the Versailles Administrative Court of Appeal. On May 20, 2008 the Versailles Administrative Court of Appeal ruled in favor of Accor and confirmed the Company’s right to the refunded amount.
The French State went on to appeal the ruling to the French Supreme Court and a provision was therefore booked for the amount of the refund and the late payment interest, with the result that the decisions of the Versailles Administrative Court and Administrative Court of Appeal had no net impact on the 2011 accounts.
After examining the case in 2012, the Supreme Court issued an unfavorable ruling for Accor. Consequently, in 2013 Accor was required to repay a principal amount of €149.8 million and €34.9 million in late payment interest. The €6.3 million out of the original principal amount refunded by the State that Accor was not required to repay was recognized in reserves at December 31, 2012 and the €1.4 million in late payment interest received from the State that Accor did not have to repay was recognized as a tax benefit in the 2012 income statement.
In addition, on February 7, 2007, Accor filed an application instituting proceedings before the Cergy Pontoise Administrative Court to obtain a refund of the €187 million in précompte withholding tax paid in the years 2002 to 2004.
In a ruling handed down on May 27, 2014, the Cergy Pontoise Court applied the restrictive principles governing the calculation of refunds described by the French Supreme Court in its decision dated December 10, 2012. In line with these principles, the Court found that Accor was entitled to a refund of €7.1 million in respect of the précompte dividend withholding tax for the years 2002, 2003 and 2004 together with late payment interest of €3.3 million.
These amounts were recorded in the balance sheet at December 31, 2014. They had no impact on the income statement as Accor appealed the decision to the Versailles Administrative Court of Appeal on July 23, 2014 (which is currently investigating the case) and the ruling is therefore not final.
NOTE 25 DEFERRED TAX
Additions and reversals of non-deductible provisions recorded in 2014 by subsidiaries that form part of the Accor tax group represented a net non-taxable provision reversal of €4.4 million, resulting in a
€1.5 million reduction in deferred tax assets calculated at the rate of 33.33% excluding the 3.3% contribution sociale surtax and the 10.7% special contribution.
NOTE 26 OFF-BALANCE SHEET COMMITMENTS GIVEN AND RECEIVED
Lease commitments
Commitments given by Accor SA to its subsidiaries concerning fixed and variable lease payments were as follows at December 31, 2014 and 2013:
(in millions of euros) Dec. 31, 2013 Dec. 31, 2014
Fixed lease payment commitments given to subsidiaries 1,215 1,100
Variable lease payment commitments given to subsidiaries 1,674 1,091
TOTAL LEASE PAYMENT COMMITMENTS GIVEN 2,890 2,190
Registration Document 2014 293

FINANCIAL STATEMEMENTSParent Company Financial Statements and Notes5
Other off-balance sheet commitments
Other off-balance sheet commitments given at December 31, 2014 and 2013 break down as follows:
(in millions of euros) Dec. 31, 2013 Dec. 31, 2014
COMMITMENTS GIVEN (LIABILITIES)
Pledge of BRH shares (1) - -
Purchase commitments related to two hotels (Pullman and ibis Styles) (2) 5 4
Other purchase commitments 1 -
Pledge of networks – France - 1
TOTAL PURCHASE COMMITMENTS 6 5
Construction performance bonds – France (3) 70 108
TOTAL WORKS COMMITMENTS 70 108
Guarantees given (4) 50 71
Guarantees for confirmed credit lines (5) 69 20
Guarantees for bank borrowings (5) 29 29
Guarantees given to third parties (5) 30 36
Guarantees for liabilities (5) (6) (7) 263 290
TOTAL GUARANTEE COMMITMENTS 442 446
COMMITMENTS GIVEN IN THE NORMAL COURSE OF BUSINESS - -
TOTAL COMMITMENTS GIVEN 518 558
(1) Security interests given on assets correspond to pledges and mortgages valued at the acquisition cost of the underlying assets.Accor has fully written down its original €25.74 million interest in BRH, which has been pledged as collateral for a loan in the same amount granted to BRH by Mauritius Commercial Bank. As this pledge was indexed to the net value of the shares held by Accor SA, its amount was zero at December 31, 2014.
(2) In connection with the sale of SH Roissypôle, when the construction lease was signed with ADP for building a Pullman and an ibis Styles hotel at Roissypôle, Accor acted as guarantor on behalf of the subsidiary concerned and on March 20, 2013 it granted Eiffage Construction a €3.6 million guarantee. The property developer has undertaken to complete the building work by May 31, 2015.
(3) The Company has given a total of €70 million in commitments in the capacity as property developer for refurbishment works to be carried out on the Pullman Paris Tour Eiffel hotel. In addition, Accor gave a €38 million financial guarantee on October 31, 2014 on behalf of its subsidiaries for performance bonds on work that they have taken on (the Iris, Sunlight and BAC Orly projects).
(4) This item includes various guarantees given on behalf of direct and indirect subsidiaries either to banks or directly to the subsidiaries’ customers. Also, since January 1, 2014, Accor has stood as guarantor for the rental payments for 6 Adagios hotels, representing an aggregate amount of €41 million.
(5) Accor has given guarantees for (i) borrowings (€29 million), (ii) confirmed credit lines (€19.6 million) and (iii) liabilities of SNC limited partnerships (€279.5 million). Total guarantees given to other third parties came to €35.6 million at December 31, 2014.
(6) Accor granted a €10 million seller’s warranty to WBA Saint-Honoré in connection with the sale of WBA that took place on March 28, 2013.(7) Accor granted an asset and liability warranty to SHTE in connection with the sale of SNH SH 18 Suffren in October 2012. This warranty, which is capped at €1 million
(excluding for tax, para-fiscal and payroll liabilities) expires in November 2017.
Registration Document 2014294
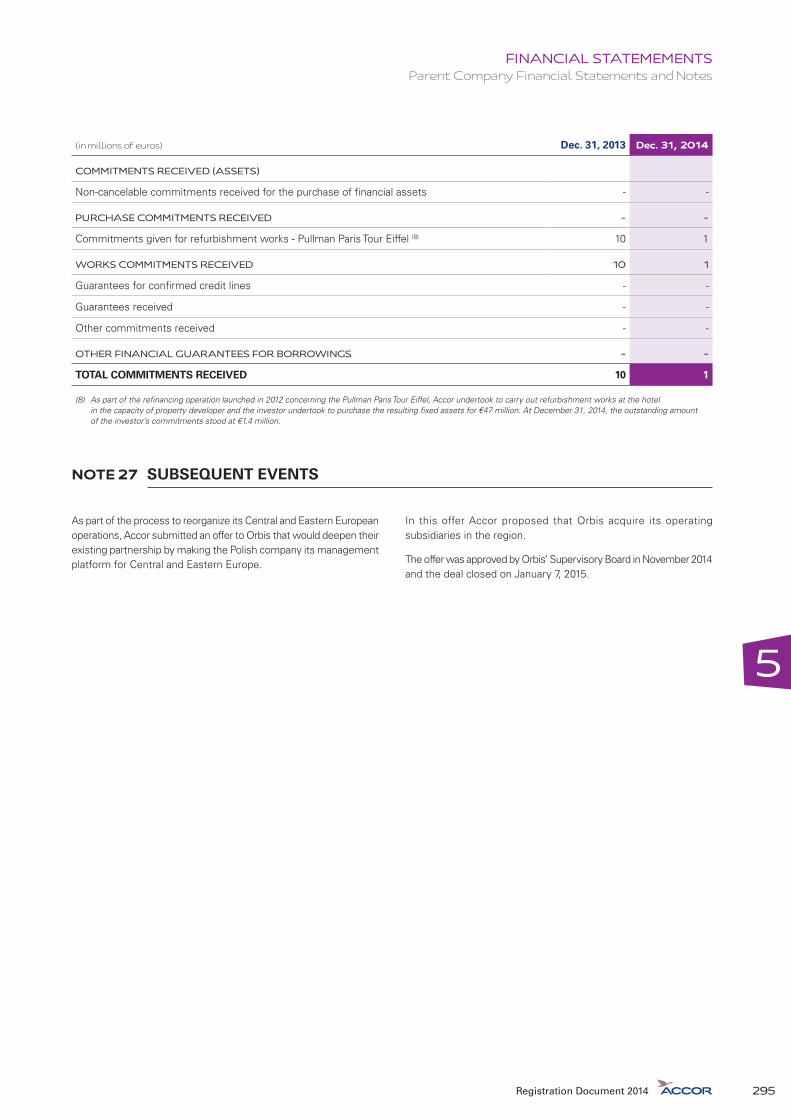
5
FINANCIAL STATEMEMENTSParent Company Financial Statements and Notes
(in millions of euros) Dec. 31, 2013 Dec. 31, 2014
COMMITMENTS RECEIVED (ASSETS)
Non-cancelable commitments received for the purchase of financial assets - -
PURCHASE COMMITMENTS RECEIVED - -
Commitments given for refurbishment works - Pullman Paris Tour Eiffel (8) 10 1
WORKS COMMITMENTS RECEIVED 10 1
Guarantees for confirmed credit lines - -
Guarantees received - -
Other commitments received - -
OTHER FINANCIAL GUARANTEES FOR BORROWINGS - -
TOTAL COMMITMENTS RECEIVED 10 1
(8) As part of the refinancing operation launched in 2012 concerning the Pullman Paris Tour Eiffel, Accor undertook to carry out refurbishment works at the hotel in the capacity of property developer and the investor undertook to purchase the resulting fixed assets for €47 million. At December 31, 2014, the outstanding amount of the investor’s commitments stood at €1.4 million.
NOTE 27 SUBSEQUENT EVENTS
As part of the process to reorganize its Central and Eastern European operations, Accor submitted an offer to Orbis that would deepen their existing partnership by making the Polish company its management platform for Central and Eastern Europe.
In this offer Accor proposed that Orbis acquire its operating subsidiaries in the region.
The offer was approved by Orbis’ Supervisory Board in November 2014 and the deal closed on January 7, 2015.
Registration Document 2014 295

FINANCIAL STATEMEMENTSParent Company Financial Statements and Notes5
NOTE 28 MAIN SUBSIDIARIES AND AFFILIATES AT DECEMBER 31, 2014
Subsidiaries and affiliates
(in thousands of local currency units) (in thousands of euros)
CurrencyShare
capital
Reserves (retained earnings)
Percent interest
Carrying amount of shares
Outstanding loans and advances
granted by Accor SA
Guarantees given by Accor SA
Last published net revenue
Last published net profit (loss)
Dividends received by Accor SA during
the yearCost Net
A. SUBSIDIARIES AND AFFILIATES WITH A BALANCE SHEET VALUE IN EXCESS OF 1% OF ACCOR’S CAPITAL
1. Subsidiaries (at least 50%-owned)
a) French subsidiaries
SPFH, 110, avenue de France 75013 Paris EUR 29,796 (24,183) 100.00% 29,796 5,587 - - - 2 -
SOCIÉTÉ HÔTELIÈRE DE MONTPARNASSE, 2, rue de la Mare Neuve 91000 Évry EUR 16,008 285 100.00% 34,623 25,017 - - 65,053 1,019 1,067
IBL, 110, avenue de France 75013 Paris (3) EUR 28,767 18,304 100.00% 706,501 54,906 - - - 288 11,507
STÉ DE CONSTRUCTION DES HÔTELS SUITES, 2, rue de la Mare Neuve 91000 Évry EUR 29,296 (2,184) 100.00% 33,887 29,424 - - 43 2,543 -
SOLUXURY HMC, 110, avenue de France 75013 Paris EUR 10,226 5,120 100.00% 10,226 10,226 - - 53,650 15,586 -
CHAMMANS 110, avenue de France 75013 Paris EUR 102,048 1,425 100.00% 108,151 108,151 31,409 - - 15,040 5,102
PROFID, 2, rue de la Mare Neuve 91000 Évry EUR 3,500 (1,373) 100.00% 13,903 13,364 - - 96,751 1,788 -
SNC SH 61 QG, 2, rue de la Mare Neuve 91000 Évry EUR 10,038 (11,294) 100.00% 10,038 - 269 10 50,649 543 -
STÉ DES HÔTELS DE TRADITION, 2, rue de la Mare Neuve 91000 Évry EUR 13,366 (139) 100.00% 13,095 - 8,761 - 5,574 (311) -
THALAMER, 2, rue de la Mare Neuve, 91000 Évry EUR 15,384 226 100.00% 20,286 20,286 2,952 10 47,962 (3,806) -
LA THERMALE DE FRANCE, 2, rue de la Mare Neuve 91000 Évry EUR 23,905 (24,306) 100.00% 31,548 2,561 364 - - (28) -
SEPHI, 6-8, rue du Bois Briard 91000 Évry EUR 8,000 24,218 99.99% 40,399 40,399 - 10 115,211 9,872 23,000
SFPIE, 110, avenue de France 75013 Paris (3) EUR 15,129 2,072 99.99% 24,640 24,640 - - - (2,184) 9,942
SOFITEL LUXURY HÔTELS FRANCE, 2, rue de la Mare Neuve 91000 Évry EUR 2,338 723 99.99% 26,390 - 6,973 10 38,169 (4,391) -
P.I.H., 2, rue de la Mare Neuve 91000 Évry EUR 32,236 13,554 99.99% 29,263 29,263 - - - 7,629 47,264
HOTEXCO, 6-8, rue du bois briard 91000 Évry EUR 39,071 56,457 99.99% 12,469 12,469 - 10 96,259 5,305 20,023
FIMAKER, 6-8, rue du Bois Briard 91000 Évry EUR 1,103 1,607 99.99% 7,240 7,240 - - 3,732 268 140
SPARHE, 2, rue de la Mare Neuve 91000 Évry EUR 9,000 1,839 99.99% 12,845 12,845 - - 13,634 1,383 1,500
CTID, 2, rue de la Mare Neuve 91000 Évry EUR 3,481 198 99.99% 7,331 5,099 - - 597 293 366
SCHE, 6-8, rue du Bois Briard 91000 Évry EUR 44,570 18,225 99.09% 65,382 65,382 - - 114,099 (6,926) 4,967
ACCOR AFRIQUE, 2, rue de la Mare Neuve 91000 Évry EUR 29,709 11,473 97.22% 76,681 70,450 2,040 - 12,800 11,139 5,738
MARCQ HÔTEL, 2, rue de la Mare Neuve 91000 Évry EUR 6,789 4,003 96.91% 9,392 9,050 - - 2,364 883 1,491
PRADOTEL 6-8, rue du Bois Briard 91000 Évry EUR 789 14,931 90.67% 7,357 7,357 1,566 10 18,184 1,510 760
SOCIÉTÉ DES HÔTELS NOVOTEL ET MERCURE, 2, rue de la Mare Neuve 91000 Évry EUR 4,724 305,674 82.85% 345,663 269,316 - 10 82,361 7,471 35,224
SEORIM, 2, rue de la Mare Neuve 91000 Évry EUR 31,359 2,822 70.94% 22,164 22,164 - - - 3,783 139
SCI DES HÔTELS DE TOURS ET ORLY, 6/8, rue du Bois Briard 91000 Évry EUR 2,970 1,492 70.06% 9,101 6,076 1,296 36,408 - (392) -
SHTC, 84, allée Jean Jaurès 31000 Toulouse EUR 195 2,903 51.44% 7,984 4,776 - 9,442 (387) -
Registration Document 2014296

5
FINANCIAL STATEMEMENTSParent Company Financial Statements and Notes
Subsidiaries and affiliates
(in thousands of local currency units) (in thousands of euros)
CurrencyShare
capital
Reserves (retained earnings)
Percent interest
Carrying amount of shares
Outstanding loans and advances
granted by Accor SA
Guarantees given by Accor SA
Last published net revenue
Last published net profit (loss)
Dividends received by Accor SA during
the yearCost Net
A. SUBSIDIARIES AND AFFILIATES WITH A BALANCE SHEET VALUE IN EXCESS OF 1% OF ACCOR’S CAPITAL
1. Subsidiaries (at least 50%-owned)
a) French subsidiaries
SPFH, 110, avenue de France 75013 Paris EUR 29,796 (24,183) 100.00% 29,796 5,587 - - - 2 -
SOCIÉTÉ HÔTELIÈRE DE MONTPARNASSE, 2, rue de la Mare Neuve 91000 Évry EUR 16,008 285 100.00% 34,623 25,017 - - 65,053 1,019 1,067
IBL, 110, avenue de France 75013 Paris (3) EUR 28,767 18,304 100.00% 706,501 54,906 - - - 288 11,507
STÉ DE CONSTRUCTION DES HÔTELS SUITES, 2, rue de la Mare Neuve 91000 Évry EUR 29,296 (2,184) 100.00% 33,887 29,424 - - 43 2,543 -
SOLUXURY HMC, 110, avenue de France 75013 Paris EUR 10,226 5,120 100.00% 10,226 10,226 - - 53,650 15,586 -
CHAMMANS 110, avenue de France 75013 Paris EUR 102,048 1,425 100.00% 108,151 108,151 31,409 - - 15,040 5,102
PROFID, 2, rue de la Mare Neuve 91000 Évry EUR 3,500 (1,373) 100.00% 13,903 13,364 - - 96,751 1,788 -
SNC SH 61 QG, 2, rue de la Mare Neuve 91000 Évry EUR 10,038 (11,294) 100.00% 10,038 - 269 10 50,649 543 -
STÉ DES HÔTELS DE TRADITION, 2, rue de la Mare Neuve 91000 Évry EUR 13,366 (139) 100.00% 13,095 - 8,761 - 5,574 (311) -
THALAMER, 2, rue de la Mare Neuve, 91000 Évry EUR 15,384 226 100.00% 20,286 20,286 2,952 10 47,962 (3,806) -
LA THERMALE DE FRANCE, 2, rue de la Mare Neuve 91000 Évry EUR 23,905 (24,306) 100.00% 31,548 2,561 364 - - (28) -
SEPHI, 6-8, rue du Bois Briard 91000 Évry EUR 8,000 24,218 99.99% 40,399 40,399 - 10 115,211 9,872 23,000
SFPIE, 110, avenue de France 75013 Paris (3) EUR 15,129 2,072 99.99% 24,640 24,640 - - - (2,184) 9,942
SOFITEL LUXURY HÔTELS FRANCE, 2, rue de la Mare Neuve 91000 Évry EUR 2,338 723 99.99% 26,390 - 6,973 10 38,169 (4,391) -
P.I.H., 2, rue de la Mare Neuve 91000 Évry EUR 32,236 13,554 99.99% 29,263 29,263 - - - 7,629 47,264
HOTEXCO, 6-8, rue du bois briard 91000 Évry EUR 39,071 56,457 99.99% 12,469 12,469 - 10 96,259 5,305 20,023
FIMAKER, 6-8, rue du Bois Briard 91000 Évry EUR 1,103 1,607 99.99% 7,240 7,240 - - 3,732 268 140
SPARHE, 2, rue de la Mare Neuve 91000 Évry EUR 9,000 1,839 99.99% 12,845 12,845 - - 13,634 1,383 1,500
CTID, 2, rue de la Mare Neuve 91000 Évry EUR 3,481 198 99.99% 7,331 5,099 - - 597 293 366
SCHE, 6-8, rue du Bois Briard 91000 Évry EUR 44,570 18,225 99.09% 65,382 65,382 - - 114,099 (6,926) 4,967
ACCOR AFRIQUE, 2, rue de la Mare Neuve 91000 Évry EUR 29,709 11,473 97.22% 76,681 70,450 2,040 - 12,800 11,139 5,738
MARCQ HÔTEL, 2, rue de la Mare Neuve 91000 Évry EUR 6,789 4,003 96.91% 9,392 9,050 - - 2,364 883 1,491
PRADOTEL 6-8, rue du Bois Briard 91000 Évry EUR 789 14,931 90.67% 7,357 7,357 1,566 10 18,184 1,510 760
SOCIÉTÉ DES HÔTELS NOVOTEL ET MERCURE, 2, rue de la Mare Neuve 91000 Évry EUR 4,724 305,674 82.85% 345,663 269,316 - 10 82,361 7,471 35,224
SEORIM, 2, rue de la Mare Neuve 91000 Évry EUR 31,359 2,822 70.94% 22,164 22,164 - - - 3,783 139
SCI DES HÔTELS DE TOURS ET ORLY, 6/8, rue du Bois Briard 91000 Évry EUR 2,970 1,492 70.06% 9,101 6,076 1,296 36,408 - (392) -
SHTC, 84, allée Jean Jaurès 31000 Toulouse EUR 195 2,903 51.44% 7,984 4,776 - 9,442 (387) -
Registration Document 2014 297
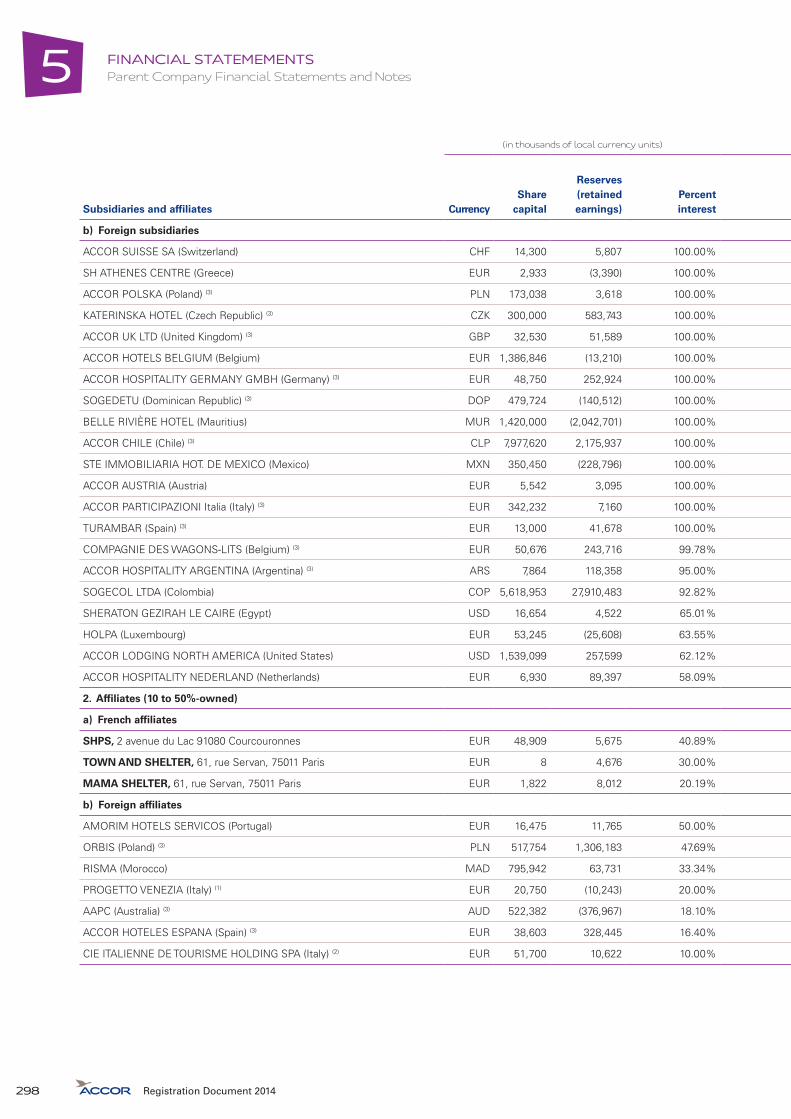
FINANCIAL STATEMEMENTSParent Company Financial Statements and Notes5
Subsidiaries and affiliates
(in thousands of local currency units) (in thousands of euros)
CurrencyShare
capital
Reserves (retained earnings)
Percent interest
Carrying amount of shares
Outstanding loans and advances
granted by Accor SA
Guarantees given by Accor SA
Last published net revenue
Last published net profit (loss)
Dividends received by Accor SA during
the yearCost Net
b) Foreign subsidiaries
ACCOR SUISSE SA (Switzerland) CHF 14,300 5,807 100.00% 25,907 25,907 - - - 13,005 11,523
SH ATHENES CENTRE (Greece) EUR 2,933 (3,390) 100.00% 10,362 - 2 845 4,577 (359) -
ACCOR POLSKA (Poland) (3) PLN 173,038 3,618 100.00% 60,481 60,481 - - 4,972 3,543 2,374
KATERINSKA HOTEL (Czech Republic) (3) CZK 300,000 583,743 100.00% 9,125 9,125 10,824 - 22,937 2,488 -
ACCOR UK LTD (United Kingdom) (3) GBP 32,530 51,589 100.00% 92,790 92,790 - - - 22 56,572
ACCOR HOTELS BELGIUM (Belgium) EUR 1,386,846 (13,210) 100.00% 1,326,923 1,326,923 - - 116,433 82,627 -
ACCOR HOSPITALITY GERMANY GMBH (Germany) (3) EUR 48,750 252,924 100.00% 452,919 452,919 4,455 6,778 814,654 40,802 -
SOGEDETU (Dominican Republic) (3) DOP 479,724 (140,512) 100.00% 20,855 872 - - 4,296 (425) -
BELLE RIVIÈRE HOTEL (Mauritius) MUR 1,420,000 (2,042,701) 100.00% 35,315 - 8,413 - 4,068 (16,691) -
ACCOR CHILE (Chile) (3) CLP 7,977,620 2,175,937 100.00% 10,498 10,498 - 4,393 16,489 1,535 -
STE IMMOBILIARIA HOT. DE MEXICO (Mexico) MXN 350,450 (228,796) 100.00% 28,707 6,859 - - 14,297 71 -
ACCOR AUSTRIA (Austria) EUR 5,542 3,095 100.00% 21,573 21,573 - - 5,726 2,037 -
ACCOR PARTICIPAZIONI Italia (Italy) (3) EUR 342,232 7,160 100.00% 460,863 329,693 72 2,611 - (984) -
TURAMBAR (Spain) (3) EUR 13,000 41,678 100.00% 180,970 180,970 - - - (4) 2,130
COMPAGNIE DES WAGONS-LITS (Belgium) (3) EUR 50,676 243,716 99.78% 1,150,689 381,585 115,812 - - 5,349 -
ACCOR HOSPITALITY ARGENTINA (Argentina) (3) ARS 7,864 118,358 95.00% 20,474 6,365 1,086 - 16,659 (1,271) -
SOGECOL LTDA (Colombia) COP 5,618,953 27,910,483 92.82% 11,359 10,309 - - 2,272 690 -
SHERATON GEZIRAH LE CAIRE (Egypt) USD 16,654 4,522 65.01% 33,913 33,720 - - 8,851 4,871 660
HOLPA (Luxembourg) EUR 53,245 (25,608) 63.55% 44,585 19,775 - - - (3,105) -
ACCOR LODGING NORTH AMERICA (United States) USD 1,539,099 257,599 62.12% 917,764 37,102 - 9,613 - 3 -
ACCOR HOSPITALITY NEDERLAND (Netherlands) EUR 6,930 89,397 58.09% 17,746 17,746 - - 183,363 (18,447) -
2. Affiliates (10 to 50%-owned)
a) French affiliates
SHPS, 2 avenue du Lac 91080 Courcouronnes EUR 48,909 5,675 40.89% 20,000 20,000 - - 11,891 1,869 663
TOWN AND SHELTER, 61, rue Servan, 75011 Paris EUR 8 4,676 30.00% 12,995 12,995 - - 556 (142) -
MAMA SHELTER, 61, rue Servan, 75011 Paris EUR 1,822 8,012 20.19% 15,802 15,802 - - 37,034 (823) -
b) Foreign affiliates
AMORIM HOTELS SERVICOS (Portugal) EUR 16,475 11,765 50.00% 8,238 8,238 36,031 4,580 - (441) -
ORBIS (Poland) (3) PLN 517,754 1,306,183 47.69% 206,534 206,534 - - 125,183 19,270 7,934
RISMA (Morocco) MAD 795,942 63,731 33.34% 44,709 44,709 19,601 - 59,015 6,516 -
PROGETTO VENEZIA (Italy) (1) EUR 20,750 (10,243) 20.00% 8,568 - - - - - -
AAPC (Australia) (3) AUD 522,382 (376,967) 18.10% 66,758 66,758 - - 4,068 24,313 16,008
ACCOR HOTELES ESPANA (Spain) (3) EUR 38,603 328,445 16.40% 97,323 55,880 11,854 11,132 109,804 (18,024) -
CIE ITALIENNE DE TOURISME HOLDING SPA (Italy) (2) EUR 51,700 10,622 10.00% 8,985 - - - - - -
Registration Document 2014298

5
FINANCIAL STATEMEMENTSParent Company Financial Statements and Notes
Subsidiaries and affiliates
(in thousands of local currency units) (in thousands of euros)
CurrencyShare
capital
Reserves (retained earnings)
Percent interest
Carrying amount of shares
Outstanding loans and advances
granted by Accor SA
Guarantees given by Accor SA
Last published net revenue
Last published net profit (loss)
Dividends received by Accor SA during
the yearCost Net
b) Foreign subsidiaries
ACCOR SUISSE SA (Switzerland) CHF 14,300 5,807 100.00% 25,907 25,907 - - - 13,005 11,523
SH ATHENES CENTRE (Greece) EUR 2,933 (3,390) 100.00% 10,362 - 2 845 4,577 (359) -
ACCOR POLSKA (Poland) (3) PLN 173,038 3,618 100.00% 60,481 60,481 - - 4,972 3,543 2,374
KATERINSKA HOTEL (Czech Republic) (3) CZK 300,000 583,743 100.00% 9,125 9,125 10,824 - 22,937 2,488 -
ACCOR UK LTD (United Kingdom) (3) GBP 32,530 51,589 100.00% 92,790 92,790 - - - 22 56,572
ACCOR HOTELS BELGIUM (Belgium) EUR 1,386,846 (13,210) 100.00% 1,326,923 1,326,923 - - 116,433 82,627 -
ACCOR HOSPITALITY GERMANY GMBH (Germany) (3) EUR 48,750 252,924 100.00% 452,919 452,919 4,455 6,778 814,654 40,802 -
SOGEDETU (Dominican Republic) (3) DOP 479,724 (140,512) 100.00% 20,855 872 - - 4,296 (425) -
BELLE RIVIÈRE HOTEL (Mauritius) MUR 1,420,000 (2,042,701) 100.00% 35,315 - 8,413 - 4,068 (16,691) -
ACCOR CHILE (Chile) (3) CLP 7,977,620 2,175,937 100.00% 10,498 10,498 - 4,393 16,489 1,535 -
STE IMMOBILIARIA HOT. DE MEXICO (Mexico) MXN 350,450 (228,796) 100.00% 28,707 6,859 - - 14,297 71 -
ACCOR AUSTRIA (Austria) EUR 5,542 3,095 100.00% 21,573 21,573 - - 5,726 2,037 -
ACCOR PARTICIPAZIONI Italia (Italy) (3) EUR 342,232 7,160 100.00% 460,863 329,693 72 2,611 - (984) -
TURAMBAR (Spain) (3) EUR 13,000 41,678 100.00% 180,970 180,970 - - - (4) 2,130
COMPAGNIE DES WAGONS-LITS (Belgium) (3) EUR 50,676 243,716 99.78% 1,150,689 381,585 115,812 - - 5,349 -
ACCOR HOSPITALITY ARGENTINA (Argentina) (3) ARS 7,864 118,358 95.00% 20,474 6,365 1,086 - 16,659 (1,271) -
SOGECOL LTDA (Colombia) COP 5,618,953 27,910,483 92.82% 11,359 10,309 - - 2,272 690 -
SHERATON GEZIRAH LE CAIRE (Egypt) USD 16,654 4,522 65.01% 33,913 33,720 - - 8,851 4,871 660
HOLPA (Luxembourg) EUR 53,245 (25,608) 63.55% 44,585 19,775 - - - (3,105) -
ACCOR LODGING NORTH AMERICA (United States) USD 1,539,099 257,599 62.12% 917,764 37,102 - 9,613 - 3 -
ACCOR HOSPITALITY NEDERLAND (Netherlands) EUR 6,930 89,397 58.09% 17,746 17,746 - - 183,363 (18,447) -
2. Affiliates (10 to 50%-owned)
a) French affiliates
SHPS, 2 avenue du Lac 91080 Courcouronnes EUR 48,909 5,675 40.89% 20,000 20,000 - - 11,891 1,869 663
TOWN AND SHELTER, 61, rue Servan, 75011 Paris EUR 8 4,676 30.00% 12,995 12,995 - - 556 (142) -
MAMA SHELTER, 61, rue Servan, 75011 Paris EUR 1,822 8,012 20.19% 15,802 15,802 - - 37,034 (823) -
b) Foreign affiliates
AMORIM HOTELS SERVICOS (Portugal) EUR 16,475 11,765 50.00% 8,238 8,238 36,031 4,580 - (441) -
ORBIS (Poland) (3) PLN 517,754 1,306,183 47.69% 206,534 206,534 - - 125,183 19,270 7,934
RISMA (Morocco) MAD 795,942 63,731 33.34% 44,709 44,709 19,601 - 59,015 6,516 -
PROGETTO VENEZIA (Italy) (1) EUR 20,750 (10,243) 20.00% 8,568 - - - - - -
AAPC (Australia) (3) AUD 522,382 (376,967) 18.10% 66,758 66,758 - - 4,068 24,313 16,008
ACCOR HOTELES ESPANA (Spain) (3) EUR 38,603 328,445 16.40% 97,323 55,880 11,854 11,132 109,804 (18,024) -
CIE ITALIENNE DE TOURISME HOLDING SPA (Italy) (2) EUR 51,700 10,622 10.00% 8,985 - - - - - -
Registration Document 2014 299

FINANCIAL STATEMEMENTSParent Company Financial Statements and Notes5
Subsidiaries and affiliates
(in thousands of local currency units) (in thousands of euros)
CurrencyShare
capital
Reserves (retained earnings)
Percent interest
Carrying amount of shares
Outstanding loans and advances
granted by Accor SA
Guarantees given by Accor SA
Last published net revenue
Last published net profit (loss)
Dividends received by Accor SA during
the yearCost Net
B. OTHER INVESTMENTS IN COMPANIES WITH A BALANCE SHEET VALUE OF LESS THAN 1% OF ACCOR’S CAPITAL
1- Subsidiaries (at least 10%-owned)
a) French subsidiaries (aggregate) 82,054 46,850 48,980 72,385 25,672
b) Foreign subsidiaries (aggregate) 47,734 30,146 64,826 10,188 16,435
2. Other investments (less than 10%-owned)
a) French companies (aggregate) 18,052 16,769 30 30 6
b) Foreign companies (aggregate) 3,586 1,068 - - 31
TOTAL (NOTE 28) 7,291,511 4,407,009 377,616 159,033 308,238
(1) Balance sheets at December 31, 2004.(2) Balance sheets at December 31, 2003.(3) Provisional or unaudited balance sheets.
Registration Document 2014300
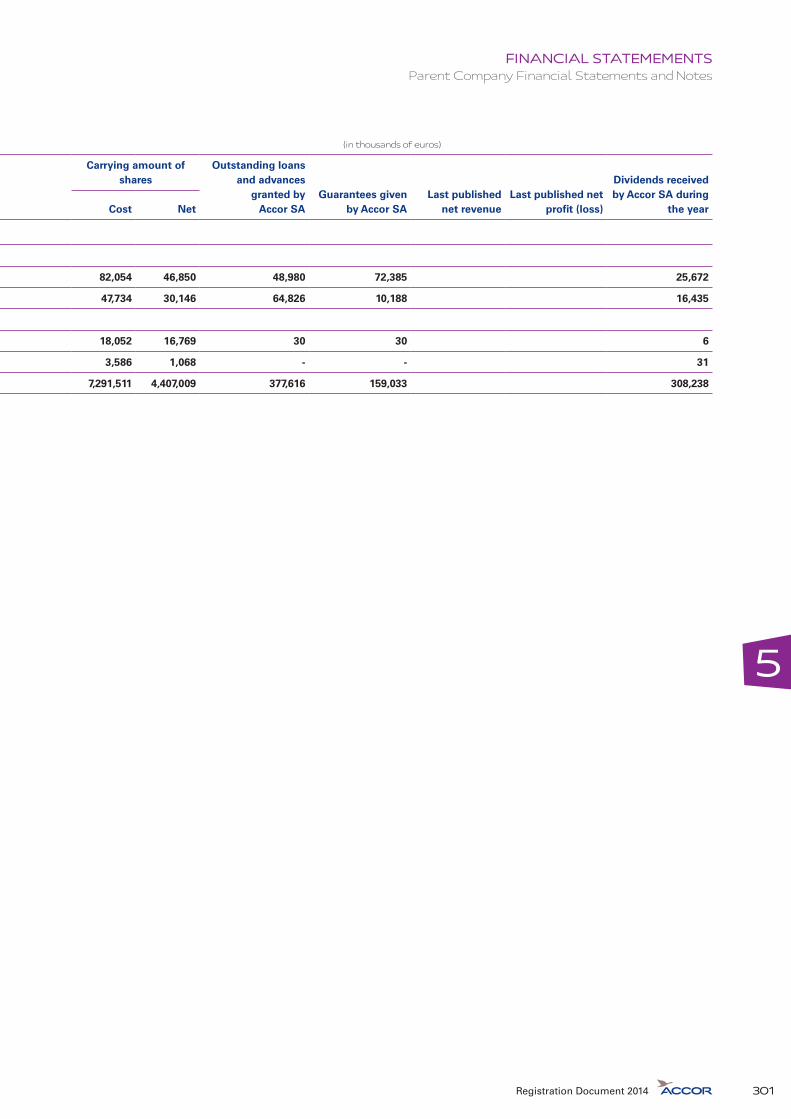
5
FINANCIAL STATEMEMENTSParent Company Financial Statements and Notes
Subsidiaries and affiliates
(in thousands of local currency units) (in thousands of euros)
CurrencyShare
capital
Reserves (retained earnings)
Percent interest
Carrying amount of shares
Outstanding loans and advances
granted by Accor SA
Guarantees given by Accor SA
Last published net revenue
Last published net profit (loss)
Dividends received by Accor SA during
the yearCost Net
B. OTHER INVESTMENTS IN COMPANIES WITH A BALANCE SHEET VALUE OF LESS THAN 1% OF ACCOR’S CAPITAL
1- Subsidiaries (at least 10%-owned)
a) French subsidiaries (aggregate) 82,054 46,850 48,980 72,385 25,672
b) Foreign subsidiaries (aggregate) 47,734 30,146 64,826 10,188 16,435
2. Other investments (less than 10%-owned)
a) French companies (aggregate) 18,052 16,769 30 30 6
b) Foreign companies (aggregate) 3,586 1,068 - - 31
TOTAL (NOTE 28) 7,291,511 4,407,009 377,616 159,033 308,238
(1) Balance sheets at December 31, 2004.(2) Balance sheets at December 31, 2003.(3) Provisional or unaudited balance sheets.
Registration Document 2014 301

FINANCIAL STATEMEMENTSParent Company Financial Statements and Notes5
5.4.4. FIVE-YEAR FINANCIAL SUMMARY
(in millions of euros) 2010 2011 2012 2013 2014
Capital at year-end
Share capital 680 682 682 684 696
Number of shares in issue 226,793,949 227,251,446 227,277,972 228,053,102 231,836,399
Results of operations
Net revenues 721 725 753 807 825
Profit before tax, depreciation, amortization and provisions 649 751 67 124 261
Income tax (26) (24) (32) (20) (14)
Net profit (loss) 173 771 (584) 101 239
Dividends 141 261 173 183 220 (1)
Per-share data (in euros)
Earnings per share after tax, before depreciation, amortization and provisions 2.98 3.41 0.44 0.63 1.18
Earnings (loss) per share 0.76 3.39 (2.57) 0.44 1.03
Dividend per share (before tax credit/allowance) 0.62 1.15 0.76 0.80 0.95 (1)
Employees
Number of employees 1,066 1,042 1,069 1,051 1,033 (2)
Total payroll and employee benefits 138 130 127 158 146
(1) Recommended dividend for 2014 proposed at the Annual Shareholders’ Meeting of April 29, 2015 based on 231,836,399 shares outstanding at December 31, 2014.(2) Number of employees on the Accor SA payroll at December 31, 2014.
Registration Document 2014302

66.1. INFORMATION ABOUT THE COMPANY 304
6.2. SHARE CAPITAL 3066.2.1. Share capital 306
6.2.2. Share buyback program 306
6.2.3. Financial authorizations 307
6.2.4. Employee stock ownership 308
6.2.5. Shares not representing capital 308
6.2.6. Changes in capital 309
6.3. OWNERSHIP STRUCTURE 3106.3.1. Ownership and voting rights structure 310
6.3.2. Dividends 312
6.4. THE MARKET FOR ACCOR SECURITIES 313
Capital and OWNERSHIP STRUCTURE
Registration Document 2014 303
CAPITAL AND OWNERSHIP STRUCTUREInformation about the Company6
6.1. INFORMATION ABOUT THE COMPANY
Company name
Accor
Registered office
110, avenue de France – 75013 Paris.
Legal form
Joint stock company (société anonyme) governed by the applicable French laws and regulations, including Articles L. 225-17 to L. 225-56 of the French Commercial Code.
Governing law
The laws and regulations of France.
Term
The Company was incorporated on April 22, 1960 and will be dissolved on April 22, 2059 unless it is wound up in advance or its term is extended.
Corporate purpose
(Article 3 of the Bylaws)
The Company’s corporate purpose is to engage in the following activities, in France and other countries, on its own behalf, or on behalf of third parties, or jointly with third parties:
�� the ownership, financing and management, directly, indirectly, or under specified mandates, of hotels, restaurants and bars of any nature or category and, more generally, any establishment related to accommodation, food, tourism, leisure, and services;
�� the economic, financial, and technical review of projects and, generally, all services related to the development, organization and management of the above-mentioned establishments, including all actions related to their construction or the provision of any related consulting services;
�� the review and provision of services intended to facilitate the supply of meals to employees in companies, institutions and other organizations;
�� the creation of any new company and the acquisition of interests by any method in any company operating in any business;
�� all civil, commercial, industrial and financial transactions, involving both securities and property, related to the purposes of the Company and all similar or related purposes.
Trade register
The Company is registered in Paris under number 602 036 444.Business Identification (APE) Code: 7010Z.
Documents on display
Corporate documents, including the Bylaws, balance sheets, income statements, Board of Directors’ reports and Auditors’ Reports, may be inspected at the Company’s registered office.
Fiscal year
The Company’s fiscal year begins on January 1 and ends on December 31.
Profit available for distribution(Article 27 of the Bylaws)
Profit available for distribution consists of net profit for the year, less any losses brought forward from prior years and any amounts to be credited to reserves pursuant to the law, plus any unappropriated retained earnings brought forward from prior years.
After approving the accounts for the year, the Annual Shareholders’ Meeting may decide to appropriate all or part of the profit available for distribution, if any, to the payment of a dividend. In the event of partial distribution, the Annual Shareholders’ Meeting may decide to appropriate the remaining profit to one or more reserve accounts. Alternatively, the Annual Shareholders’ Meeting may decide to appropriate all of the profit available for distribution to said reserve accounts.
Shareholders’ Meetings
Notice of Shareholders’ Meetings(Article 24 of the Bylaws)
Shareholders’ Meetings shall be called as provided for by law. The meetings shall take place at the Company’s registered office or at any other venue specified in the notice of meeting.
Attendance and representation(Article 24 of the Bylaws)
In accordance with applicable laws and regulations, all shareholders are entitled to attend or be represented at Shareholders’ Meetings, regardless of the number of shares they hold, provided they can present legally sufficient evidence that the shares are registered in their name in the Company’s share register (registered shares) or recorded in a share account in their name administered by an accredited financial intermediary (bearer shares), in compliance with paragraph 7 of Article L. 228-1 of the French Commercial Code, at least three business days prior to midnight CET on the date of the Meeting.
In the case of bearer shares, such evidence shall take the form of a statement of share ownership (attestation de participation) issued by the accredited financial intermediary in accordance with the law.
Registration Document 2014304

6
CAPITAL AND OWNERSHIP STRUCTUREInformation about the Company
Organization of Shareholders’ Meetings(Article 25 of the Bylaws)
All shareholders have the right to attend or be represented at Shareholders’ Meetings, under the conditions set by law. They may vote by post in accordance with Article L. 225-107 of the French Commercial Code. The proxy/postal voting form may be sent to the Company or to the Company’s registrar in paper form or, by decision of the Board of Directors published in the notice of meeting, by electronic mail in accordance with the applicable laws and regulations.
In addition, if decided by the Board of Directors when the meeting is called, shareholders who participate in the meeting by videoconference or by any electronic means enabling their identification, on the basis and by the method stipulated in the applicable laws and regulations, will be considered as being physically present for the calculation of the quorum and voting majority.
To cast a vote or execute a proxy by electronic means, shareholders or their duly authorized representative or attorney must either:
�� provide a secure electronic signature fulfilling the requirements of the applicable laws and regulations; or
�� enter a unique username and password on the Company’s website, if such a website exists, in accordance with the applicable laws and regulations. This type of electronic signature shall be considered a reliable mechanism for identifying shareholders and their votes, in compliance with the first sentence of paragraph 2 of Article 1316-4 of the French Civil Code.
Meetings are chaired by the Chairman of the Board of Directors or, in his or her absence, by a director designated by the Board. Otherwise, the meeting elects its own Chairman.
The function of Scrutineer of the Meeting is fulfilled by the two shareholders present at the Meeting who represent the largest number of voting rights and who consent to take on the role. The Bureau thus formed names a Secretary, who may or may not be a shareholder.
An attendance register is kept, pursuant to the law.
Copies or excerpts of the Meeting minutes may be certified by the Chairman of the Board of Directors, the Chairman of the meeting, or the meeting Secretary.
Ordinary and Extraordinary Shareholders’ Meetings fulfilling the relevant quorum and majority voting requirements exercise the powers vested in them by law.
Double voting rights(Article 25 of the Bylaws)
All fully paid shares registered in the name of the same holder for at least two years carry double voting rights.
In the event of a capital increase through the capitalization of retained earnings, profits or additional paid-in capital, the resulting bonus shares distributed in respect of registered shares carrying double voting rights will similarly carry double voting rights.
Registered shares converted into bearer shares or sold to a different holder lose their double voting rights. However, transfers through inheritance, liquidation of marital assets, inter vivos transfers to a spouse or to a relative in the ascending or descending line do not result in the loss of double voting rights or a break in the qualifying period. The merger of the Company has no impact on double voting rights, provided that the Bylaws of the surviving company allow for their exercise.
When shares are held by beneficial and non-beneficial owners, voting rights in Ordinary and Extraordinary Shareholders’ Meetings are exercised by the beneficial owner.
Disclosure thresholds(Article 9 of the Bylaws)
Any shareholder, acting alone or in concert with other shareholders within the meaning of Article L. 233-10 of the French Commercial Code, that directly or indirectly acquires an interest, or raises its interest, in the capital or voting rights of the Company, including any equivalent shares or voting rights as defined in Article L. 223-9-1 of the Commercial Code, to above or below any statutory disclosure threshold is required to disclose its interest to the Company. In the case of failure to make such disclosure, the sanctions provided for by law will apply.
In addition, any shareholder that acquires or raises its interest to 1% of the capital or voting rights is required to disclose its interest to the Company by registered letter with return receipt requested sent to the head office, within five trading days of the transaction date or the signature of any agreement resulting in the disclosure threshold being crossed, whatever the date on which the shares are recorded in the holder’s account. The notification must include details of the total number of shares and/or share equivalents held and the number of voting rights held as provided for above.
Above said 1% threshold, the same disclosure rules as defined above will apply to any increase in a shareholder’s interest by any multiple of 0.5% of the capital or voting rights and to any reduction in a shareholder’s interest by any multiple of 1% of the capital or voting rights.
For the application of the above paragraphs, the shares or voting rights referred to in paragraphs 1 to 8 of Article L. 233-9-1 of the French Commercial Code are considered as being equivalent to the shares or voting rights held by the shareholder.
Restrictions on voting rights(Article 9 of the Bylaws)
In the case of failure to comply with the applicable disclosure rules, at the request of one or several shareholders representing at least 3% of the Company’s capital or voting rights, as duly recorded in the minutes of the Shareholders’ Meeting, the undisclosed shares will be stripped of voting rights at all Shareholders’ Meetings held in the two years following the date when the omission is remedied.
Registration Document 2014 305
CAPITAL AND OWNERSHIP STRUCTUREShare capital6
Notification of intentions(Article 9 of the Bylaws)
Any shareholder that acquires or raises its interest to more than one-twentieth, three-twentieths or one quarter of the capital or voting rights is required to notify the Company of its intentions over the following twelve months.
At the end of each successive twelve-month period, any shareholder that continues to hold a number of shares or voting rights in excess of the above fractions will be required to notify the Company of its intentions for the following twelve months.
In particular, the shareholder must inform the Company of whether it is acting alone or in concert with other shareholders, whether or not it plans to purchase additional shares, and whether or not it intends to acquire control of the Company or to request its election or the election of one or several candidates of its choice as directors of the Company. The Company will have the right to inform the public and shareholders of the said shareholder’s disclosed intentions, or of the shareholder’s failure to comply with this requirement.
For the application of the above paragraphs, the shares or voting rights referred to in paragraphs 1 to 8 of Article L. 233-9-1 of the French Commercial Code are considered as being equivalent to the shares or voting rights held by the shareholder.
6.2. SHARE CAPITAL
6.2.1. SHARE CAPITAL
At December 31, 2014, the Company’s share capital amounted to €695,509,197 divided into 231,836,399 common shares with a par value of €3.00, all fully paid-up and in the same class.
Shares may be held in either registered or bearer form.
The Company avails itself of legal procedures to identify its shareholders.
Shares are freely transferable within legal and regulatory limits.
The transfer of shares, regardless of price or terms, is made by account transfer, pursuant to the regulations in force.
6.2.2. SHARE BUYBACK PROGRAM
Authorization granted by the Annual Meeting of April 29, 2014
At the Annual Meeting on April 29, 2014, shareholders authorized the Board of Directors to trade in the Company’s shares on the stock market. The authorization was given for a period of 18 months and superseded all previous authorizations.
The number of shares acquired under the authorization may not exceed 22,000,000, or 9.64% of the share capital at April 29, 2014 and the maximum total investment in the buyback program may not exceed €1,100 million.
The authorization may be used to purchase, sell or transfer shares for the following purposes:
�� for cancellation at a later date in connection with a capital reduction decided or authorized by shareholders in an Extraordinary Meeting;
�� for allocation upon exercise of stock options granted under plans governed by Articles L. 225-177 et seq. of the French Commercial Code, or to members of an employee stock ownership plan governed by Articles L. 3332-1 et seq. of the Labor Code or to recipients of stock grants made under plans governed by Articles L. 225-197-1 et seq. of the Commercial Code;
�� for allocation on the conversion, redemption, exchange or exercise of share equivalents;
�� to be held in treasury for subsequent remittance in exchange or payment in connection with external growth transactions, a merger, demerger or asset contribution within a limit of 5% of the Company’s capital;
�� to make a market in the Company’s shares under a liquidity contract that complies with the Code of Conduct recognized by the Autorité des Marchés Financiers (AMF).
Implementation of the share buyback program in 2014
As of May 30, 2013, and for a period of twelve months tacitly renewable for successive twelve-month terms, Accor contracted with Rothschild & Cie Banque to implement a liquidity contract complying with the Code of Conduct issued by the French Financial Markets Association (AMAFI) and approved by the French securities regulator (AMF) on March 24, 2011. To fund the contract, €30 million has been allocated to the liquidity account.
At December 31, 2014 Accor did not hold any shares in treasury.
Registration Document 2014306

6
CAPITAL AND OWNERSHIP STRUCTUREShare capital
6.2.3. FINANCIAL AUTHORIZATIONS
Shareholders have granted the Board of Directors the following authorizations.
Type of authorizationDate of authorization
Nominal amount authorized
Term and expiry date Utilization in 2014
Reduction of capital by canceling treasury stock
Annual Meeting of April 29, 201415th resolution
10% of the share capital 24 monthsApril 29, 2016
Issuance of shares and share equivalents:
Annual Meeting of April 25, 201313th to 17th resolutions
26 monthsJune 25, 2015
�� with pre-emptive subscription rights €340 million
�� by public offering without pre-emptive subscription rights
€34 millionwith or without priority subscription rights
�� by restricted offering without pre-emptive subscription rights
€34 million
�� in connection with a stock-for-stock offer
€34 million
�� to increase the amount of any issues that are oversubscribed
15% of the initial issue (or according to legislation prevailing on the issue date)
�� in payment for contributed assets €34 million
Issuance of new shares by capitalizing reserves, retained earnings or additional paid-in capital
Annual Meeting of April 25, 201318th resolution
€340 million 26 monthsJune 25, 2015
Blanket ceiling on the authorizations to issue shares and/or other securities (par value)
Annual Meeting of April 25, 201319th resolution
�� with or without pre-emptive subscription rights (13th to 18th resolutions)
€340 million
�� without pre-emptive subscription rights (14th to 17th resolutions)
€34 million
Employee share issue Annual Meeting of April 25, 201320th resolution
2% of the share capital at April 25, 2013
26 monthsJune 25, 2015
Stock option plans for employees and executive directors
Annual Meeting of April 25, 201321st resolution
2.5% of the share capital at April 25, 2013(blanket ceiling including stock granted without consideration by virtue of the 22nd resolution)
38 monthsJune 25, 2016
Stock grants without consideration Annual Meeting of April 25, 201322nd resolution
2.5% of the share capital at April 25, 2013(blanket ceiling including stock options granted by virtue of the 21st resolution)
38 monthsJune 25, 2016
484,400 performance shares granted on June 18, 2014
Registration Document 2014 307

CAPITAL AND OWNERSHIP STRUCTUREShare capital6
6.2.4. EMPLOYEE STOCK OWNERSHIP
The first employee share issue, open to participants in the «Accor en Actions» Corporate Savings Plan, was carried out in France in 1999, with 7,900 employees purchasing shares.
In 2000, Accor launched its first international employee share issue in 23 countries, demonstrating its commitment to offering a significant number of employees worldwide the opportunity to become Accor shareholders by tailoring the plan rules to comply with legal and tax restrictions in each country. A total of 16,000 people participated in the offer.
International employee share issues were again carried out in 2002 in 25 host countries, with more than 12,600 taking part.
In 2004, another share issue for employees in over 20 countries took place. A total of 9,100 participated in the offer.
Lastly, in 2007, for the first time, a leveraged employee share ownership plan was offered in the 26 countries where such plans are permitted by local legislation, with 8,736 employees purchasing shares.
At December 31, 2011, 0.97% of the Company’s capital was held by 17,488 employees through employee stock ownership plans.
At December 31, 2012, 0.69% of the Company’s capital was held by 11,514 employees through employee stock ownership plans.
At December 31, 2013, 0.62% of the Company’s capital was held by 10,122 employees through employee stock ownership plans.
At December 31, 2014, 0.552% of the Company’s capital was held by 8,249 employees through employee stock ownership plans.
6.2.5. SHARES NOT REPRESENTING CAPITAL
None.
Registration Document 2014308

6
CAPITAL AND OWNERSHIP STRUCTUREShare capital
6.2.6. CHANGES IN CAPITAL
Year Changes in capital over the past five years
Increase/(decrease) in capital(in euros)
New Capital(in euros)
New Shares outstanding
Share capital
Additional paid-in capital
2010
Exercise of stock options at €21.11 234,825 1,417,560 676,609,422 225,536,474
Exercise of stock options at €21.50 922,257 5,687,252 677,531,679 225,843,893
Exercise of stock options at €23.66 1,530,156 10,537,674 679,061,835 226,353,945
Exercise of stock options at €30.60 14,931 137,365 679,076,766 226,358,922
Exercise of stock options at €31.83 1,950 18,740 679,078,716 226,359,572
Exercise of stock options at €32.42 926,250 9,083,425 680,004,966 226,668,322
Exercise of stock options at €32.56 5,430 53,504 680,010,396 226,670,132
Exercise of stock options at €35.68 311,745 3,395,942 680,322,141 226,774,047
Exercise of stock options at €37.77 41,850 485,041 680,363,991 226,787,997
Exercise of stock savings warrants at €22.51 37,560 244,265 680,401,551 226,800,517
Exercise of stock savings warrants at €33.94 5,712 58,910 680,407,263 226,802,421
Vested performance shares 78,498 - 680,485,761 226,828,587
Issue of 1,985,428 new shares as consideration for SEIH shares 5,956,284 68,901,754 686,442,045 228,814,015
Distribution of Edenred shares to shareholders, as part of the demerger 0 (1,099,185,386) 680,485,761 228,814,015
Cancellation of shares (6,060,198) (68,717,522) 680,381,847 226,793,949
2011
Exercise of stock options at €18.20 9,048 45,843 680,390,895 226,796,965
Exercise of stock options at €21.50 596,580 3,678,910 680,987,475 226,995,825
Exercise of stock options at €23.66 420,447 2,895,478 681,407,922 227,135,974
Exercise of stock options at €30.60 13,572 124,862 681,421,494 227,140,498
Exercise of stock savings warrants at €22.51 8,775 57,067 681,430,269 227,143,423
Vested performance shares 324,069 - 681,754,338 227,251,446
2012
Exercise of stock options at €18.20 3,486 17,662 681,757,824 227,252,608
Exercise of stock options at €21.50 4,074 25,123 681,761,898 227,253,966
Exercise of stock options at €26.66 2,715 21,412 681,764,613 227,254,871
Exercise of stock savings warrants €22.51 69,303 450,701 681,833,916 227,277,972
2013
Exercise of stock options at €18.20 1,348,791 6,833,874 683,182,707 227,727,569
Exercise of stock options at €30.81 367,635 3,407,976 683,550,342 227,850,114
Vested performance shares 608,964 - 684,159,306 228,053,102
Distribution of 2012 dividend - (58,768,161) 684,159,306 228,053,102
2014
Exercise of stock options at €18.20 754,008 3,820,307 684,913,314 228,304,438
Exercise of stock options at €26.66 1,656,492 13,064,200 686,569,806 228,856,602
Exercise of stock options at €28.32 213,672 1,803,392 686,783,478 228,927,826
Exercise of stock options at €30.81 2,430,795 22,533,470 689,214,273 229,738,091
Vested performance shares 609,045 - 689,823,318 229,941,106
Distribution of 2013 dividend - (65,467,481) 689,823,318 229,941,106
Dividend reinvestment at €31.73 5,685,879 54,451,768 695,509,197 231,836,399
N.B.: There are no options outstanding to purchase existing shares of the Company. All options granted are to purchase new shares.
Registration Document 2014 309
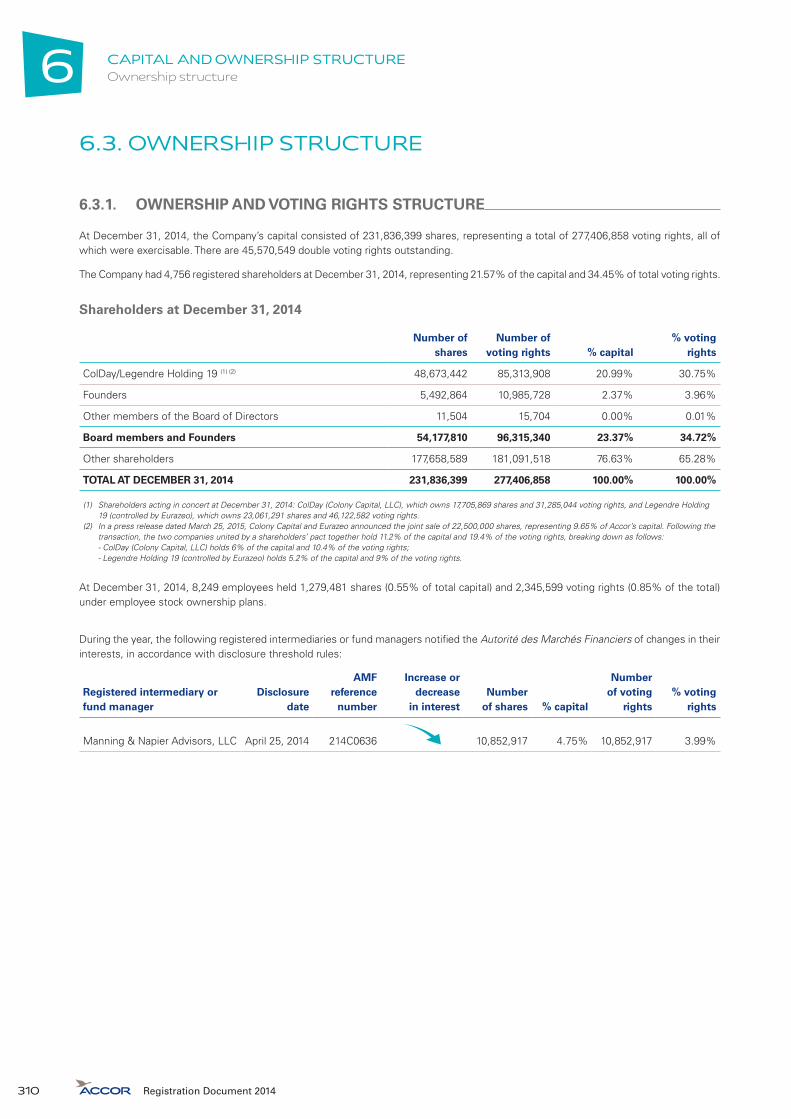
CAPITAL AND OWNERSHIP STRUCTUREOwnership structure6
6.3. OWNERSHIP STRUCTURE
6.3.1. OWNERSHIP AND VOTING RIGHTS STRUCTURE
At December 31, 2014, the Company’s capital consisted of 231,836,399 shares, representing a total of 277,406,858 voting rights, all of which were exercisable. There are 45,570,549 double voting rights outstanding.
The Company had 4,756 registered shareholders at December 31, 2014, representing 21.57% of the capital and 34.45% of total voting rights.
Shareholders at December 31, 2014
Number of shares
Number of voting rights % capital
% voting rights
ColDay/Legendre Holding 19 (1) (2) 48,673,442 85,313,908 20.99% 30.75%
Founders 5,492,864 10,985,728 2.37% 3.96%
Other members of the Board of Directors 11,504 15,704 0.00% 0.01%
Board members and Founders 54,177,810 96,315,340 23.37% 34.72%
Other shareholders 177,658,589 181,091,518 76.63% 65.28%
TOTAL AT DECEMBER 31, 2014 231,836,399 277,406,858 100.00% 100.00%
(1) Shareholders acting in concert at December 31, 2014: ColDay (Colony Capital, LLC), which owns 17,705,869 shares and 31,285,044 voting rights, and Legendre Holding 19 (controlled by Eurazeo), which owns 23,061,291 shares and 46,122,582 voting rights.
(2) In a press release dated March 25, 2015, Colony Capital and Eurazeo announced the joint sale of 22,500,000 shares, representing 9.65% of Accor’s capital. Following the transaction, the two companies united by a shareholders’ pact together hold 11.2% of the capital and 19.4% of the voting rights, breaking down as follows:
- ColDay (Colony Capital, LLC) holds 6% of the capital and 10.4% of the voting rights; - Legendre Holding 19 (controlled by Eurazeo) holds 5.2% of the capital and 9% of the voting rights.
At December 31, 2014, 8,249 employees held 1,279,481 shares (0.55% of total capital) and 2,345,599 voting rights (0.85% of the total) under employee stock ownership plans.
During the year, the following registered intermediaries or fund managers notified the Autorité des Marchés Financiers of changes in their interests, in accordance with disclosure threshold rules:
Registered intermediary or fund manager
Disclosure date
AMFreference
number
Increase or decrease
in interestNumber
of shares % capital
Number of voting
rights% voting
rights
Manning & Napier Advisors, LLC April 25, 2014 214C0636 10,852,917 4.75% 10,852,917 3.99%
Registration Document 2014310

6
CAPITAL AND OWNERSHIP STRUCTUREOwnership structure
Changes in ownership structure over the past three years
Dec. 31, 2012 Dec. 31, 2013 Dec. 31, 2014
Number of shares % capital
% voting rights
Number of shares % capital
% voting rights
Number of shares % capital
% voting rights
ColDay/Legendre Holding 19 48,673,442 21.42% 30.08% 48,673,442 21.34% 31.18% 48,673,442 20.99% 30.75%
Founders 6,083,430 2.68% 3.35% 5,923,809 2.60% 3.40% 5,492,864 2.37% 3.96%
Other shareholders 172,521,100 75.91% 66.57% 173,455,851 76.06% 65.42% 177,670,093 76.64% 65.29%
TOTAL 227,277,972 100.00% 100.00% 228,053,102 100.00% 100.00% 231,836,399 100.00% 100.00%
Sources: Accor share register, disclosures made to the Autorité des Marchés Financiers and the Company.
There were no shares held in treasury as of December 31, 2014.
A Euroclear France survey of financial institutions holding at least 100,000 shares and of shareholders holding at least 250 shares at December 31, 2014 identified 8,529 shareholders owning an aggregate 73.51% of the Company’s capital, representing 61.44% of total voting rights.
Analysis by shareholder category at December 31, 2014 % capital% voting
rights
Private shareholders 1.59% 1.33%
Institutional investors 66.67% 55.72%
French institutions 12.63% 10.56%
Foreign institutions 54.04% 45.16%
Unidentified in the Euroclear survey 31.74% 42.95%
TOTAL 100.00% 100.00%
Source: Euroclear France.
Shareholders’ agreements relating to the shares making up the Company’s capital
Apart from the shareholders’ pact described below, the Company is not aware of any other shareholders’ agreements relating to the shares making up its capital.
On May 4, 2008, a memorandum of understanding was signed by Colony Capital (represented by ColTime (1) and ColDay (2)) and Eurazeo (represented by Legendre Holding 19 (3)), acting in concert in accordance with the memorandum of understanding regarding their investment in Accor, which they had signed on January 27, 2008.
On December 18, 2009, an amendment to the memorandum was signed following the Accor Board of Directors’ approval of the potential benefits of demerging the Group’s Hotels and Prepaid Services businesses to create two separate listed companies. The purpose of the amendment was (i) to extend the provisions of the memorandum of understanding to the shares in Edenred, and (ii) to extend the undertaking in the memorandum not to sell their shares in Accor and Edenred until January 1, 2012.
(1) ColTime SARL is controlled by the investment funds ColonyInvestors VI, LP and ColyzeoInvestors LP, which are managed by the Colony Capital, LLC investment company.
(2) ColDay SARL is controlled by the investment funds ColonyInvestors VIII, LP and ColyzeoInvestors II, LP, which are managed by the Colony Capital, LLC investment company.
(3) Controlled by Eurazeo SA.
Registration Document 2014 311

CAPITAL AND OWNERSHIP STRUCTUREOwnership structure6
The main clauses of the agreement are as follows:
�� an undertaking to cast the same votes on strategic matters at Board of Directors’ meetings;
�� an undertaking to cast the same votes at Accor Shareholders’ Meetings;
�� an agreement that the parties should have equal representation on Accor’s Board;
�� an agreement that if either of the undertakings set out above with respect to voting are breached by one of the parties, the party that has breached the undertaking shall offer to sell its Accor shares to the other party, at a price equal to 80% of the lower of i) the weighted average price of the Accor share over the twenty trading days preceding the breach, and ii) the closing price on the day of the breach. This offer must be made and taken up within a month of the date of breach;
�� an undertaking not to enter into any acquisition or other agreement with a third party that would result in the concert group raising its interest to above one third of Accor’s capital and/or voting rights;
�� in the event that one of the parties decides to sells its shares to an identified purchaser, a right of first refusal for the other party, exercisable within ten days following notification of the intention to sell. The price for the shares sold will be proposed by the selling party;
�� a duty for each party to give the other party four days’ notice if they decide to sell their shares on the market to unidentified purchasers;
�� in the event that one of the parties sells its shares, a right for the other party to sell the same proportion of shares, exercisable within ten days following the related notification;
�� in the event that the two parties’ existing shareholdings are equal, the obligation for either party that decides to purchase additional shares to propose the acquisition of the same number of shares to the other party;
�� a priority share purchase right for the party holding the least number of shares. However, ColDay may freely acquire shares enabling it to raise its interest to 11% of Accor’s capital and Eurazeo may freely acquire shares enabling it to raise its interest to 10% of the capital;
�� in the event of a public offer initiated by a third party, if one of the two parties does not wish to tender its shares whereas the other one does, the right for the former to acquire the shares tendered to the offer by the other party at the offer price or at a higher price;
�� in the event of a public offer initiated by one of the parties, in which the other party does not wish to participate, the right for either of the parties to terminate the concert arrangement. If the party not participating in the offer wishes to sell its Accor shares, the right for the initiator of the offer to acquire said shares before filing the offer, at the offer price or at a higher price.
The shareholders’ pact had a five-year term, which means that the concert arrangement may now be terminated with 30 days’ notice.
On December 6, 2012, the concert group increased its interest to more than 30% of the Company’s voting rights, simply because of a decrease in the number of total voting rights outstanding. In line with its General Regulations, and given the concert group’s undertaking not to «actively increase» its interest in the Company, the AMF has waived the concert group’s obligation to file a public tender offer.
Items likely to have an influence in the event of a public takeover offer
To the best of the issuer’s knowledge, there are no items likely to have a material influence on the execution of lease, management or franchise contracts in the event of public takeover bid.
On the other hand, as mentioned on page 126 above, certain financing contracts contain change of control clauses.
6.3.2. DIVIDENDS
Year
Shares outstanding at
December 31
Dividend for the year
(in euros) Paid on
Share price (in euros)Yield based on year-end
closing priceHigh LowYear-end
closing
2010 226,793,949 0.62 June 6, 2011 34.03 22.26 33.29 1.86%
2011 227,251,446 1.15 June 14, 2012 36.20 17.03 19.59 5.87%
2012 227,277,972 0.76 June 5, 2013 27.76 18.32 26.70 2.85%
2013 228,053,102 0.80 June 4, 2014 34.32 24.54 34.30 2.33%
2014 231,836,399 0.95 (1) June 3, 2015 39.58 28.87 37.34 2.54%
(1) Submitted for approval at the Annual Shareholders’ Meeting of April 28, 2015.
No interim dividend was paid. Dividends are paid through Euroclear France.
Dividends not claimed within five years from the date of payment are forfeited, as provided for by law.
The Board of Directors will recommend that shareholders at the Combined Ordinary and Extraordinary Shareholders’ Meeting of April 28, 2015 approve the payment of a 2014 dividend of €0.95 per share. Shareholders may opt to receive the entire dividend in cash or to receive half in cash and reinvest the other half in new shares, at a 5% discount.
Registration Document 2014312
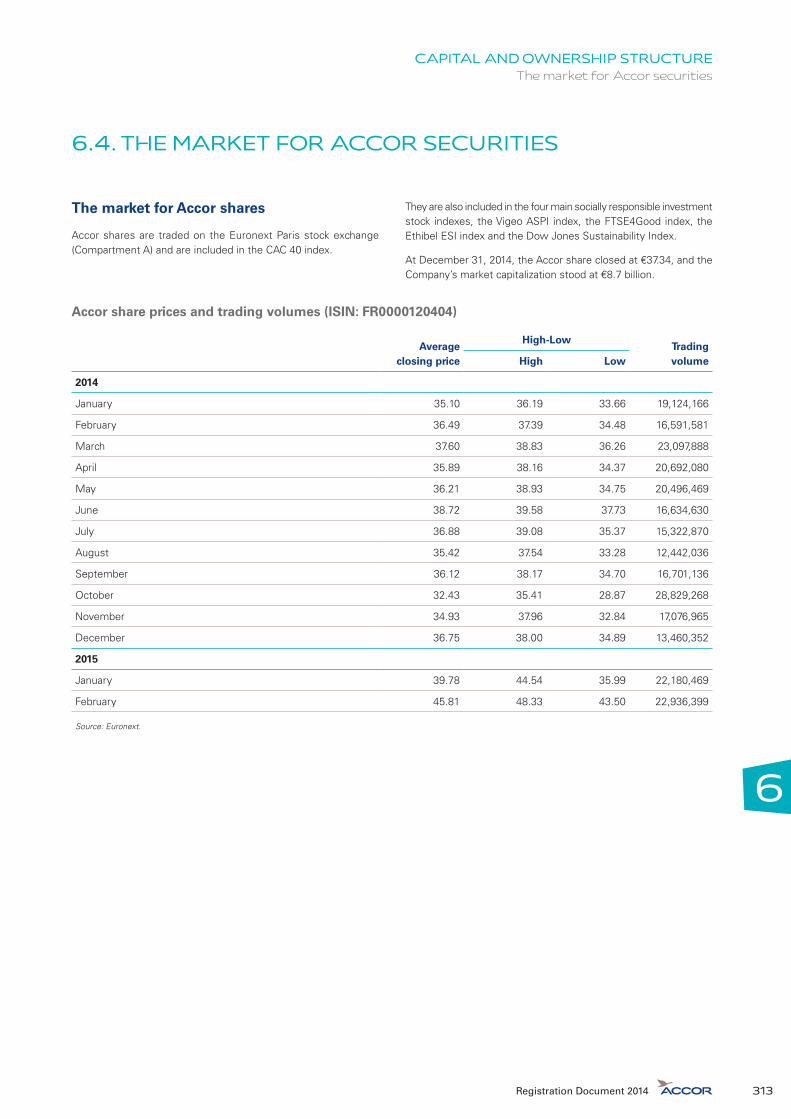
6
CAPITAL AND OWNERSHIP STRUCTUREThe market for Accor securities
6.4. THE MARKET FOR ACCOR SECURITIES
The market for Accor shares
Accor shares are traded on the Euronext Paris stock exchange (Compartment A) and are included in the CAC 40 index.
They are also included in the four main socially responsible investment stock indexes, the Vigeo ASPI index, the FTSE4Good index, the Ethibel ESI index and the Dow Jones Sustainability Index.
At December 31, 2014, the Accor share closed at €37.34, and the Company’s market capitalization stood at €8.7 billion.
Accor share prices and trading volumes (ISIN: FR0000120404)
Average closing price
High-LowTrading volumeHigh Low
2014
January 35.10 36.19 33.66 19,124,166
February 36.49 37.39 34.48 16,591,581
March 37.60 38.83 36.26 23,097,888
April 35.89 38.16 34.37 20,692,080
May 36.21 38.93 34.75 20,496,469
June 38.72 39.58 37.73 16,634,630
July 36.88 39.08 35.37 15,322,870
August 35.42 37.54 33.28 12,442,036
September 36.12 38.17 34.70 16,701,136
October 32.43 35.41 28.87 28,829,268
November 34.93 37.96 32.84 17,076,965
December 36.75 38.00 34.89 13,460,352
2015
January 39.78 44.54 35.99 22,180,469
February 45.81 48.33 43.50 22,936,399
Source: Euronext.
Registration Document 2014 313

Registration Document 2014314

77.1. INVESTOR RELATIONS
AND DOCUMENTS ON DISPLAY 316
7.2. PERSONS RESPONSIBLE FOR THE REGISTRATION DOCUMENT AND THE AUDIT OF THE ACCOUNTS 318
7.3. FEES PAID TO THE AUDITORS 319
7.4. INFORMATION INCORPORATED BY REFERENCE 319
7.5. CROSS-REFERENCE TABLE FOR THE REGISTRATION DOCUMENT 320
7.6. CROSS-REFERENCE TABLE FOR THE ANNUAL FINANCIAL REPORT 322
7.7. CROSS-REFERENCE TABLE – CORPORATE SOCIAL RESPONSIBILITY 323
Other INFORMATION
Registration Document 2014 315

OTHER INFORMATIONInvestor relations and documents on display7
7.1. INVESTOR RELATIONS AND DOCUMENTS ON DISPLAY
In addition to the Annual Meeting and the events organized to present the annual results, Accor keeps both individual and institutional shareholders informed of the latest developments on a highly responsive daily basis. This information is tailored to the specific needs of different types of shareholders and financial analysts while constantly complying with the principle of fair access to information.
Meetings with investors
In 2014, Accor met with 611 representatives from more than 372 financial institutions and organized 23 roadshows in Europe, North America and Asia.
These events included hotel visits that enabled investors to talk with line managers and gain a better understanding of management practices and processes. Accor also took part in eight investor conferences during the year, in France, the United Kingdom and the United States.
Held on April 29, 2014 at the Novotel Paris Tour Eiffel, the Annual Shareholders’ Meeting was attended by 298 people and provided many opportunities for exchanging views and opinions.
Accor Shareholders Club
Created in May 2000, the Accor Shareholders Club had 10,050 members at year-end 2014, with each one owning at least 50 bearer shares or one registered share.
Among the many advantages members enjoy are regular e-mail updates throughout the year with press releases, the Letter to Shareholders and other news, the possibility of subscribing to all of our other corporate publications, the opportunity to discover our businesses in a more personal way through site visits, and VIP invitations to investor events in which Accor participates.
As part of the Le Club Accorhotels loyalty program, Shareholders Club members receive a Le Club Accorhotels Platinum Card, which doubles the points earned when they stay at participating hotels and offers them exclusive advantages. Club members also receive promotional offers on Group products.
Discussions were initiated in early 2015 on how to improve the Club and more effectively meet our members’ expectations, particularly in the area of digital technology. In addition, an information campaign will be finalized in the first half of the year to enable all of our individual shareholders to comply with the Club’s new terms and conditions.
Working group on the individual shareholder relations process
Created in 2007, a working group of Shareholders Club members is exploring ways to encourage exchanges of views and opinions with our individual shareholders and to improve the individual shareholder relations process.
The group currently comprises 13 members, who met twice in 2014 – first on April 7 at Accor’s registered office, which was followed by lunch at the Sofitel Arc de Triomphe and a tour of the hotel, and then on November 20 at the Molitor hotel in Paris.
The agenda for the two meetings was as follows:
�� April 7, 2014:
�y preparations for the 2014 Annual Shareholders’ Meeting,
�y a discussion about the new strategy defined by Sébastien Bazin for Accor, based on leveraging the value and strategic fit between HotelServices and HotelInvest;
�� November 20, 2014:
�y a presentation on the challenges facing Accor in the area of digital technology and its digital transformation strategy, which will be implemented through eight dedicated programs, as part of a five-year, €225 million investment plan,
�y a look back at the first Shareholder Webzine published in August 2014 and a discussion about the second edition, which was released in December 2014,
�y a discussion about the replacement of the Shareholder Club working group with Accor’s Shareholder Advisory Committee in December 2014 and the revamping of the Shareholders Club in February 2015 with the addition of new benefits.
In first-half 2015, the Shareholders Club working group will be replaced by a new Shareholder Advisory Committee with nine members. The new Committee aims to provide greater visibility for our stakeholders and be more representative of the new generations of Accor’s individual shareholders.
Registration Document 2014316
7
OTHER INFORMATIONInvestor relations and documents on display
Easily accessible information tailored to shareholder profiles
All of the Group’s financial news and publications can be accessed in the «Finance» section of the accor.com website, which serves as a comprehensive investor relations database. The site carries live and deferred webcasts of results presentations, Investor Days and Annual Shareholders’ Meetings. It also tracks the Accor share price in real time and features a dedicated section for retail shareholders and members of the Shareholders Club.
A wide array of documents far exceeding regulatory requirements may be viewed in the «Finance» section of the website. These documents, which cover both current and previous years, include:
�� the Registration Document filed with the Autorité des Marchés Financiers (available in electronic form since 1997);
�� the Annual Report;
�� a corporate brochure describing the Group and its values;
�� information memoranda filed with the Autorité des Marchés Financiers concerning corporate actions;
�� notices of Shareholders’ Meetings, sent systematically to registered shareholders and on request to members of the Shareholders Club;
�� the Shareholders webzine.
Legal documents are on display at the Company’s primary business office, Immeuble Odyssey, 110, avenue de France, 75013, France.
Since January 20, 2007, when the European Transparency Directive was transposed into French law, Accor has issued its regulatory filings through a professional disclosure service that complies with the criteria set out in the AMF’s General Regulations. The filings are also available on the corporate website.
Shareholder hotline
Shareholders in France can call 0805 650 750 (free from a landline) at any time to obtain general information about the Group, the share price, the latest news and practical guidelines for individual shareholders. Operators are available to answer questions from 9:00 a.m. to 6:00 p.m. from Monday to Friday. Messages left out of hours are answered as soon as possible.
Senior Vice-President, Investor Relations and Financial Communication
�� Sébastien ValentinImmeuble Odyssey 110, avenue de France 75013 Paris France
Phone: +33 (0)1 45 38 86 25Fax: + 33 (0)1 45 38 85 95
Shareholder hotline (France only): 0805 650 750 (free from a landline)E-mail: [email protected]
Registration Document 2014 317
OTHER INFORMATIONPersons responsible for the registration document and the audit of the accounts7
7.2. PERSONS RESPONSIBLE FOR THE REGISTRATION DOCUMENT AND THE AUDIT OF THE ACCOUNTS
Name and position of the person responsible for the Registration Document
�� Sébastien BazinChairman and Chief Executive Officer
Statement by the person responsible for the Registration Document
I hereby declare that, having taken all reasonable care to ensure that such is the case, the information contained in this Registration Document is, to the best of my knowledge, in accordance with the facts and contains no omission likely to affect its import.
I further declare that, to the best of my knowledge, the financial statements included in the Registration Document have been prepared in accordance with the applicable accounting standards and give a true and fair view of the assets and liabilities, financial position and results of Accor and its subsidiaries, and that the Management report represents a fair view of the business, results and financial position of Accor and its subsidiaries and provides a description of the main risks and uncertainties to which they are exposed.
I obtained a statement from the Statutory Auditors at the end of their engagement affirming that they have read the whole of the Registration Document and examined the information about the financial position and the accounts contained therein.
The consolidated financial statements for the year ended December 31, 2014 are the subject of a Statutory Auditors’ report, which can be found on page 166 of the Registration Document and includes an observation relating to the application from January 1st, 2014 of IFRS 11 – Joint Arrangements.
Sébastien Bazin
Persons responsible for information
�� François PinonGroup General CounselPhone: + 33 (0)1 45 38 87 33
�� Sophie StabileMember of the Executive Committee – Global Chief Financial OfficerPhone: + 33 (0)1 45 38 87 03
�� Sébastien ValentinSenior Vice-President, Investor Relations and Financial CommunicationsPhone: +33 (0)1 45 38 86 25
Statutory Auditors
Statutory Auditors
�� Ernst & Young et AutresMember of the Ernst & Young network Jacques Pierres 1/2, place des Saisons 92400 Courbevoie – Paris-La Défense 1
Date of first appointment: June 16, 1995.
Re-appointed for six years at the April 25, 2013 Annual Shareholders’ Meeting.
�� Deloitte & AssociésPascale Chastaing-Doblin 185, avenue Charles-de-Gaulle – BP 136 92203 Neuilly-sur-Seine Cedex, France
Date of first appointment: June 16, 1995.
Re-appointed for six years at the April 25, 2013 Annual Shareholders’ Meeting.
Alternate Auditors
�� AuditexTour Ernst & Young – 11, allée de l’Arche 92037 Paris, La Défense Cedex, France
Appointed for six years at the April 25, 2013 Annual Shareholders’ Meeting.
�� BEAS7, villa Houssay 92200 Neuilly-sur-Seine, France
Date of first appointment: May 29, 2001.
Re-appointed for six years at the April 25, 2013 Annual Shareholders’ Meeting.
Registration Document 2014318

7
OTHER INFORMATIONInformation incorporated by reference
7.3. FEES PAID TO THE AUDITORS
The fees paid to the Auditors and the members of their networks by the Group may be analyzed as follows:
(in millions of euros)
Deloitte Ernst & Young
2013 2014 2013 2014
Amount % Amount % Amount % Amount %
AUDIT SERVICES
Statutory and contractual audit services
France: issuer 0.6 13% 1 13% 0.6 15% 0.8 17%
France: subsidiaries 1 22% 1 17% 0.9 22% 0.8 17%
International: subsidiaries 2.4 53% 2.5 43% 2.2 54% 2.7 56%
Other audit-related services
France: issuer 0 0% 0.9 16% 0.1 2% 0.1 2%
France: subsidiaries 0.1 2% 0.1 1% 0 0% 0 0%
International: subsidiaries 0.2 4% 0.3 6% 0 0% 0 0%
Sub-total 4.3 96% 5.8 100% 3.8 93% 4.4 92%
OTHER SERVICES
Legal, tax and employee relations advice
France 0 0% 0.0 0% 0.2 5% 0 0%
International 0.1 2% 0.0 0% 0.1 2% 0.4 8%
Other services (representing less than 10% of the audit budget)
France 0 0% 0.0 0% 0 0% 0 0%
International 0 0% 0.0 0% 0 0% 0 0%
Sub-total 0.1 2% 0.0 0% 0.3 7% 0.4 8%
TOTAL 4.5 100% 5.8 100% 4.1 100% 0.4 100%
7.4. INFORMATION INCORPORATED BY REFERENCE
In accordance with Article 28 of European Commission Regulation (EC) 809/2004, the Registration Document incorporates by reference the following information:
�� the consolidated financial statements and the related Auditors’ Reports contained in the 2013 Registration Document filed with the Autorité des Marchés Financiers on March 28, 2014 under no. D.14-0235 (pages 179 to 279, and 178);
�� the financial information contained in pages 164 to 171 of the 2013 Registration Document filed with the Autorité des Marchés Financiers on March 28, 2014 under no. D.14-0235;
�� the consolidated financial statements and the related Auditors’ Reports contained in the 2012 Registration Document filed with the Autorité des Marchés Financiers on March 28, 2013 under no. D.13-0241 (pages 159 to 269, and 158);
�� the financial information contained in pages 142 to 150 of the 2012 Registration Document filed with the Autorité des Marchés Financiers on March 28, 2013 under no. D.13-0241;
Sections of these documents that are not mentioned above are either not applicable to investors or are covered in another part of the Registration Document.
Registration Document 2014 319

OTHER INFORMATIONCross-reference table for the Registration Document7
7.5. CROSS-REFERENCE TABLE FOR THE REGISTRATION DOCUMENT
The table below cross-references the pages in the Registration Document and the key information required under European Commission Regulation (EC) no. 809/2004 implementing EC Directive 2003/71/EC of the European Parliament and of the Council.
Key information required under Annex 1 of European Commission Regulation 809/2004 Numéros de pages
1. Persons responsible 318
2. Statutory Auditors 318
3. Financial highlights
3.1. Historical financial information 11; 152-159; 302
3.2. Selected financial information for interim periods N/A
4. Risk factors 124-129
5. Information about the issuer
5.1. History and development of the issuer 12-15 ; 190-196
5.2. Investments17; 19-20; 155-156;
194-195; 252-253
6. Business overview
6.1. Principal activities 4-10
6.2. Principal markets 4-10 ; 152-159 ; 196-205
6.3. Exceptional factors N/A
6.4. Dependence on patents or licenses, industrial, commercial or financial contracts or new manufacturing processes N/A
6.5. Competitive position 9-10
7. Organizational structure
7.1. Brief description of the Group 103; 163; 262-263
7.2. List of significant subsidiaries 160-161; 262-263; 296-301
8. Property, plant and equipment
8.1. Material tangible fixed assets and any major encumbrances thereon 9; 206; 207-208
8.2. Environmental issues that may affect the utilization of tangible fixed assets 61-62
9. Operating and financial review
9.1 Financial condition 155-156; 162 ;175-176
9.2. Operating results
10. Cash and capital resources
10.1. Information concerning capital resources 155-156; 171; 180; 281
10.2. Cash flows 126-128; 170; 236
10.3. Borrowing requirements and funding structure 231-235; 286-287
10.4. Restrictions on the use of capital resources 126-128
10.5. Anticipated sources of funds 126-128; 195; 286
11. Research and development, patents and licenses N/A
12. Trend information
12.1. Significant recent trends 19; 163
12.2. Known trends or events that are reasonably likely to have a material effect on the issuer’s prospects 163; 265; 295
Registration Document 2014320
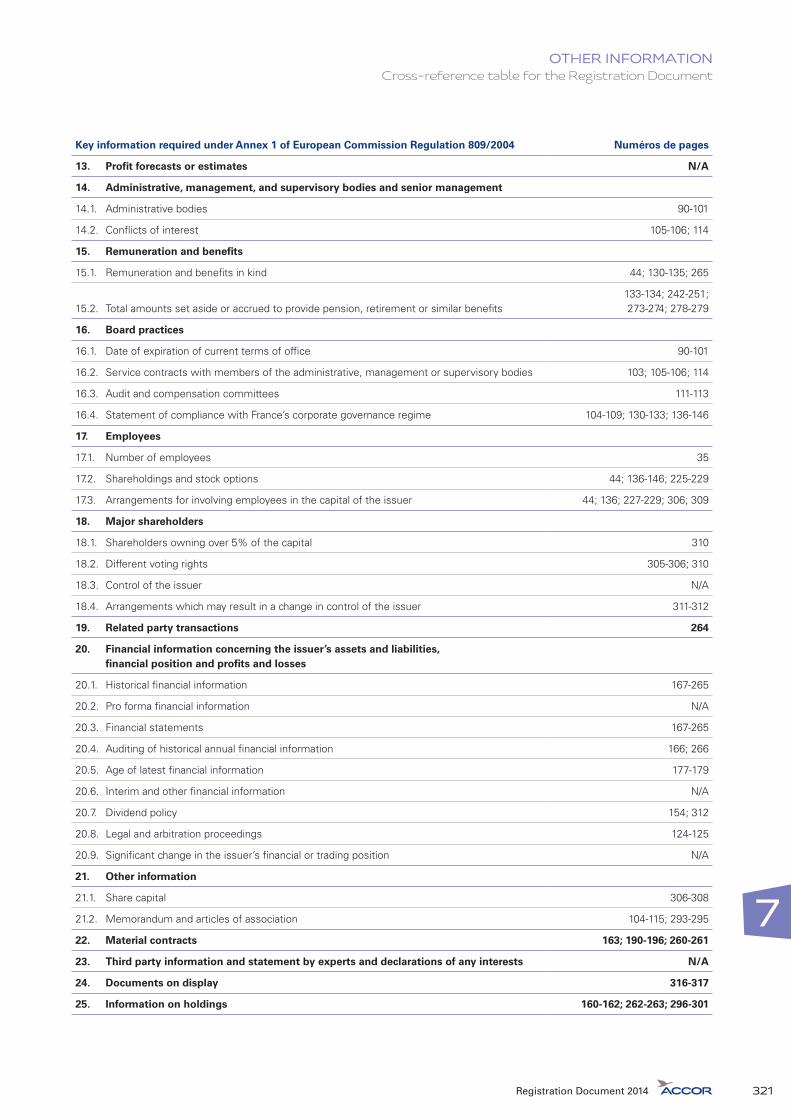
7
OTHER INFORMATIONCross-reference table for the Registration Document
Key information required under Annex 1 of European Commission Regulation 809/2004 Numéros de pages
13. Profit forecasts or estimates N/A
14. Administrative, management, and supervisory bodies and senior management
14.1. Administrative bodies 90-101
14.2. Conflicts of interest 105-106; 114
15. Remuneration and benefits
15.1. Remuneration and benefits in kind 44; 130-135; 265
15.2. Total amounts set aside or accrued to provide pension, retirement or similar benefits133-134; 242-251; 273-274; 278-279
16. Board practices
16.1. Date of expiration of current terms of office 90-101
16.2. Service contracts with members of the administrative, management or supervisory bodies 103; 105-106; 114
16.3. Audit and compensation committees 111-113
16.4. Statement of compliance with France’s corporate governance regime 104-109; 130-133; 136-146
17. Employees
17.1. Number of employees 35
17.2. Shareholdings and stock options 44; 136-146; 225-229
17.3. Arrangements for involving employees in the capital of the issuer 44; 136; 227-229; 306; 309
18. Major shareholders
18.1. Shareholders owning over 5% of the capital 310
18.2. Different voting rights 305-306; 310
18.3. Control of the issuer N/A
18.4. Arrangements which may result in a change in control of the issuer 311-312
19. Related party transactions 264
20. Financial information concerning the issuer’s assets and liabilities, financial position and profits and losses
20.1. Historical financial information 167-265
20.2. Pro forma financial information N/A
20.3. Financial statements 167-265
20.4. Auditing of historical annual financial information 166; 266
20.5. Age of latest financial information 177-179
20.6. Interim and other financial information N/A
20.7. Dividend policy 154; 312
20.8. Legal and arbitration proceedings 124-125
20.9. Significant change in the issuer’s financial or trading position N/A
21. Other information
21.1. Share capital 306-308
21.2. Memorandum and articles of association 104-115; 293-295
22. Material contracts 163; 190-196; 260-261
23. Third party information and statement by experts and declarations of any interests N/A
24. Documents on display 316-317
25. Information on holdings 160-162; 262-263; 296-301
Registration Document 2014 321

OTHER INFORMATIONCross-reference table for the Annual Financial Report7
7.6. CROSS-REFERENCE TABLE FOR THE ANNUAL FINANCIAL REPORT
The 2012 Registration Document contains all of the information in the Annual Financial Report governed by article L. 451-1-2 of the French Monetary and Financial Code. To make this information easier to find, the following cross-reference table lists it by main topic.
Numéros de pages
1. Parent company financial statements 267-302
2. Consolidated financial statements 167-265
3. Management report (within the meaning of the Monetary and Financial Code)
3.1. Information provided in compliance with article L. 225-100 of the Commercial Code
Revenue analysis 152; 210-212
Earnings analysis 153-159
Balance sheet analysis 154-159
Significant events 163
Key human resources and environmental indicators 35-85
Main risks and uncertainties 124-129
Accor SA five-year financial summary 302
Summary table of authorizations to issue new shares granted by shareholders to the Board of Directors 296-299
3.2. Information provided in compliance with article L. 225-100-3 of the Commercial Code
Items likely to have an influence in the event of a public takeover offer 126-128; 311-312
3.3. Information provided in compliance with article L. 225-211 of the Commercial Code
Share buybacks 306
3.4. Total compensation and benefits paid to each Executive Officer (L. 225-102-1 of the French Commercial)
Remuneration and benefits in kind 44; 130-135; 265
Total amounts set aside or accrued to provide pension, retirement or similar benefits132-133; 242-251; 272-273; 278-279
4. Statement by the persons responsible for the Annual Financial Report 318
5. Auditors’ reports on the parent company and consolidated financial statements 166; 266
6. Statutory Auditors’ fees 319
7. Report of the Chairman on internal control 104-121
8. Auditors’ report on the report of the Chairman on internal control 122
Registration Document 2014322

7
OTHER INFORMATIONCross-reference table – corporate social responsibility
7.7. CROSS-REFERENCE TABLE – CORPORATE SOCIAL RESPONSIBILITY
Accor CSR indicator
Registration Document
page Provisions of article 225 of the Grenelle 2 Act
Global Compact principle
Background and challenges
Stakeholder relations 23-26 Relationships with people or organizations interested in the Company’s business
/
Procedures for dialogue with these people or organizations
CSR process and commitments
Ethical principles 27-28 Honest business practices: actions taken to prevent bribery
Principles 1 to 6 and Principle 10
CSR policies 30 Organization of the company to take into account environmental concerns
Principle 8
Outside commitments, partnerships and awards
26; 72 Promotion and respect for the clauses of ILO conventions
/
Governance 28-29 / /
Employee-relations commitments
Accor’s employment model and human capital
Total employees worldwide by operating structure and region
35-36
Total employees and payroll employees by gender and region
Principles 1, 3 and 6
Payroll employees by gender, age and seniority
37
Separations by reason 37Hirings and terminations
Hirings 37
Absenteeism 37 Absenteeism
Number of resignations 37
An ambitious goal for human resources management
Motivating employees and deepening their engagement
Working conditions that enhance employee well-being and team performance
Registration Document 2014 323

OTHER INFORMATIONCross-reference table – corporate social responsibility 7
Accor CSR indicator
Registration Document
page Provisions of article 225 of the Grenelle 2 Act
Global Compact principle
Part-time employees 39 Working hours
Principles 1, 3 and 6
Health and safety policies, agreements and training
40 Health and safety conditionsWorkplace health and safety agreements signed with unions or employee representatives
Lost-time injury rate 41 Lost-time injury rate
Incident severity rate for workplace and commuting accidents
41 Severity of workplace accidents
Number of work-related fatalities 41 Severity of workplace accidents
Training and awareness-building 40
Supporting employees throughout their career
Number of promotions 41
Training hours 42 Total training hours
Training policies 41 Specific employee training programs
Management age pyramid 43
Compensation and benefits
Compensation and benefits policies 44-45Principles 1, 3 and 6Employee benefits costs (from the
financial statements)198
Diversity and equal opportunity policies
Policies implemented 45 Policies implemented and measures taken to encourage gender equality, hire and retain the disabled, fight against discrimination and promote diversity Principles
1, 3 and 6Resources deployed 45
% women by job category 46
Number of disabled employees 46
Social dialogue
Organization of the social dialogue process and main social dialogue bodies
47 Social dialogue organization
Principles 1, 3 and 6
Separations by reason 47 Hirings and terminations
Outcome of collective agreements signed in 2014
48 Outcome of collective agreements
Social responsibility commitments
Support for and engagement in local communities
Protecting children from abuse 57-58 Regional, economic and social impact of the Company’s business on neighboring or local communities
/
Respecting and promoting local traditions and cultures
58-60
Registration Document 2014324
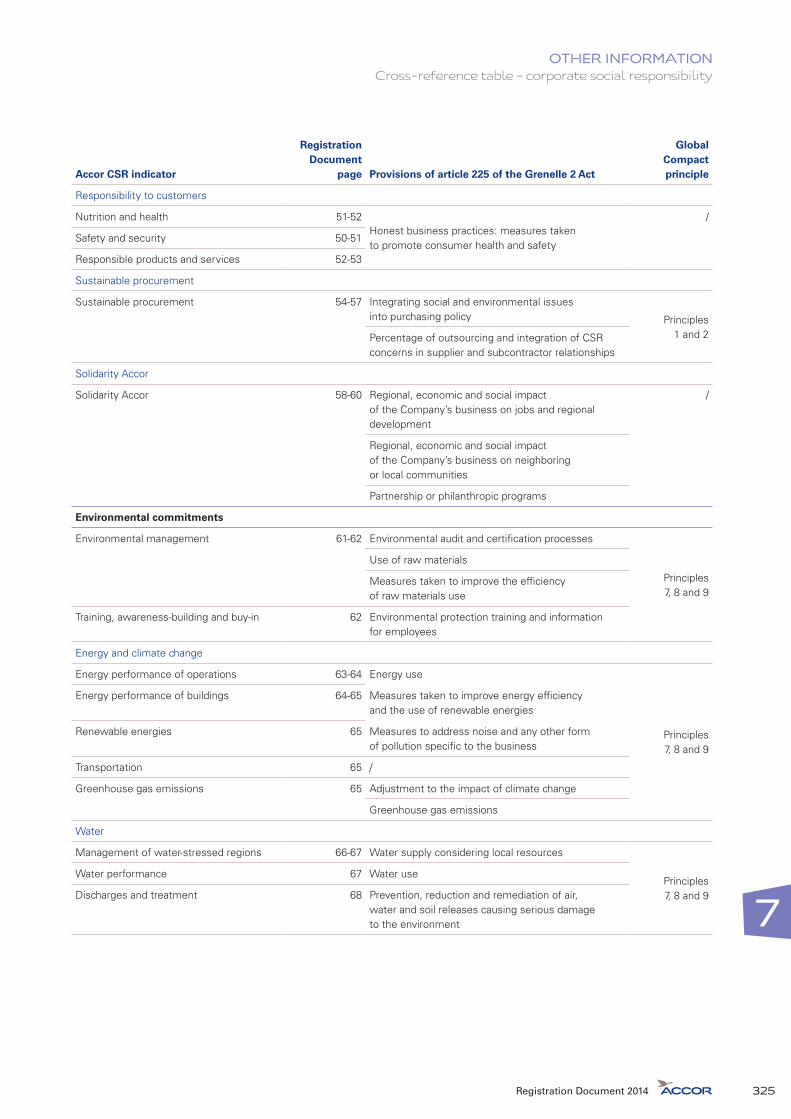
7
OTHER INFORMATIONCross-reference table – corporate social responsibility
Accor CSR indicator
Registration Document
page Provisions of article 225 of the Grenelle 2 Act
Global Compact principle
Responsibility to customers
Nutrition and health 51-52Honest business practices: measures taken to promote consumer health and safety
/
Safety and security 50-51
Responsible products and services 52-53
Sustainable procurement
Sustainable procurement 54-57 Integrating social and environmental issues into purchasing policy Principles
1 and 2Percentage of outsourcing and integration of CSR concerns in supplier and subcontractor relationships
Solidarity Accor
Solidarity Accor 58-60 Regional, economic and social impact of the Company’s business on jobs and regional development
/
Regional, economic and social impact of the Company’s business on neighboring or local communities
Partnership or philanthropic programs
Environmental commitments
Environmental management 61-62 Environmental audit and certification processes
Principles 7, 8 and 9
Use of raw materials
Measures taken to improve the efficiency of raw materials use
Training, awareness-building and buy-in 62 Environmental protection training and information for employees
Energy and climate change
Energy performance of operations 63-64 Energy use
Principles 7, 8 and 9
Energy performance of buildings 64-65 Measures taken to improve energy efficiency and the use of renewable energies
Renewable energies 65 Measures to address noise and any other form of pollution specific to the business
Transportation 65 /
Greenhouse gas emissions 65 Adjustment to the impact of climate change
Greenhouse gas emissions
Water
Management of water-stressed regions 66-67 Water supply considering local resources
Principles 7, 8 and 9
Water performance 67 Water use
Discharges and treatment 68 Prevention, reduction and remediation of air, water and soil releases causing serious damage to the environment
Registration Document 2014 325
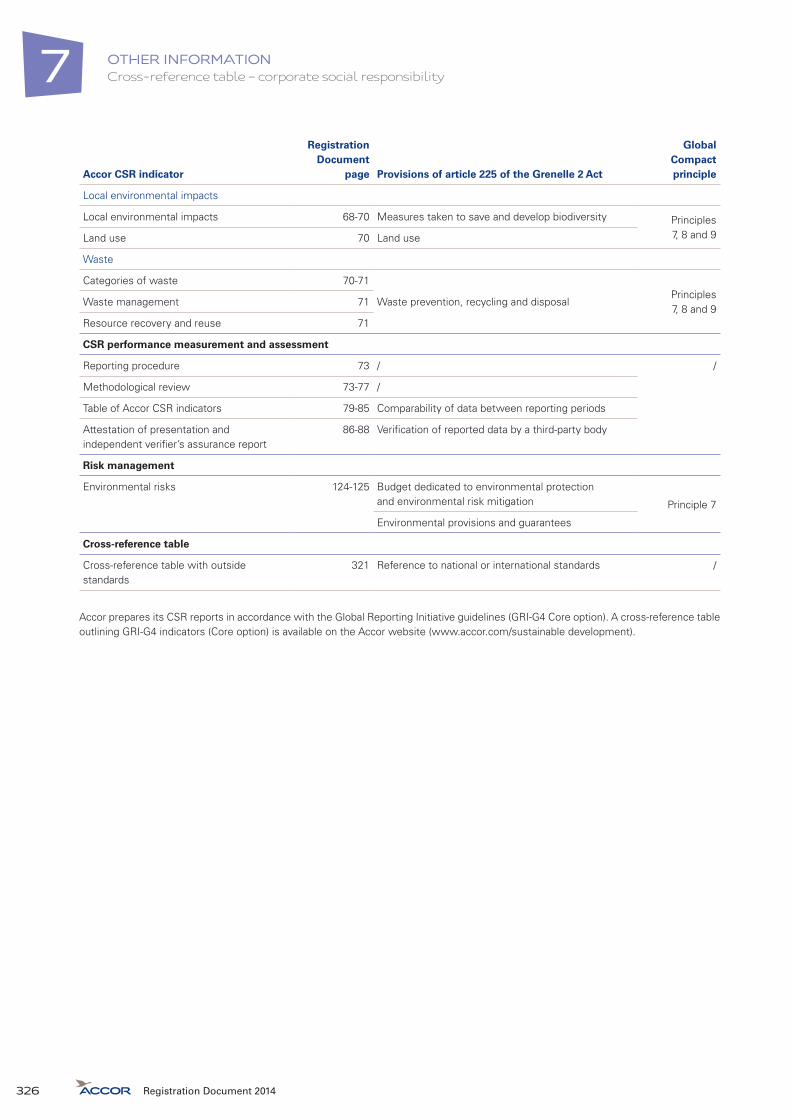
OTHER INFORMATIONCross-reference table – corporate social responsibility 7
Accor CSR indicator
Registration Document
page Provisions of article 225 of the Grenelle 2 Act
Global Compact principle
Local environmental impacts
Local environmental impacts 68-70 Measures taken to save and develop biodiversity Principles 7, 8 and 9Land use 70 Land use
Waste
Categories of waste 70-71
Waste prevention, recycling and disposalPrinciples 7, 8 and 9
Waste management 71
Resource recovery and reuse 71
CSR performance measurement and assessment
Reporting procedure 73 / /
Methodological review 73-77 /
Table of Accor CSR indicators 79-85 Comparability of data between reporting periods
Attestation of presentation and independent verifier’s assurance report
86-88 Verification of reported data by a third-party body
Risk management
Environmental risks 124-125 Budget dedicated to environmental protection and environmental risk mitigation Principle 7
Environmental provisions and guarantees
Cross-reference table
Cross-reference table with outside standards
321 Reference to national or international standards /
Accor prepares its CSR reports in accordance with the Global Reporting Initiative guidelines (GRI-G4 Core option). A cross-reference table outlining GRI-G4 indicators (Core option) is available on the Accor website (www.accor.com/sustainable development).
Registration Document 2014326


Design and published by:
Tel.: +33 (0)1 55 32 29 74
We are serious about sustainability!
Printed on paper certified by the Programme for
the Endorsement of Forest Certification, which
guarantees that the pulp comes from sustainable,
responsibly managed forests.