Effect of Inhibitor Concentration and EndProduct Accumulation on Estimates of Ruminal in Vitro...
12
J. Dairy Sci. 87:1360–1371 © American Dairy Science Association, 2004. Effect of Inhibitor Concentration and End-Product Accumulation on Estimates of Ruminal in Vitro Protein Degradation* Glen A. Broderick, 1 Michael L. Murphy, 2,† and Peter Ude ´n 2 1 Agricultural Research Service, USDA, US Dairy Forage Research Center, Madison, WI 53706 2 Kungsa ¨ ngen forskningscentrum, Sveriges Lantbruksuniversitet, 753 23 Uppsala, Sweden ABSTRACT Effects of varying the concentrations of hydrazine sulfate (HS) and chloramphenicol (CAP), inhibitors of microbial-N uptake and protein synthesis, on rates of protein degradation estimated from net appearance of NH 3 and total amino acids (TAA) were studied in a ruminal in vitro fermentation system. Without inhibi- tors, recoveries of N added as NH 3 and TAA were 4 and 6% after 4-h incubations, and apparent degradation rates estimated from release of NH 3 and TAA for casein, solvent soybean meal (SSBM), and expeller soybean meal (ESBM) approached 0. Increasing inhibitor con- centrations from the standard amounts of 1 mM HS plus 30 mg of CAP/L to 2 mM HS plus 90 mg of CAP/ L gave rise to numerically greater N recoveries and degradation rates, but these differences were not statis- tically significant. Compared with the standard inhibi- tor concentrations, use of 2 mM HS, without CAP, yielded similar recoveries and rates, but 30 or 90 mg of CAP/L, without HS, was not satisfactory. Versus that with 1 mM HS plus 30 mg of CAP/L, media containing 2mM HS plus 90 mg of CAP/L gave increased TAA recoveries and higher rates for casein, but not SSBM, in the presence of added starch. Faster degradation rates were obtained for casein, but slower rates for SSBM and ESBM, in Sweden versus Wisconsin using inocula from cows fed different diets but with similar CP and energy contents. Differences in microbial catab- olism of peptides may account for differences in degra- dation rates observed between Sweden and Wisconsin. Adding NH 3 plus free and peptide-bound amino acids Received June 10, 2003. Accepted October 28, 2003. Corresponding author: G. A. Broderick; e-mail: [email protected]. *Mention of any trademark or proprietary product in this paper does not constitute a guarantee or warranty of the product by the USDA or the Agricultural Research Service and does not imply its approval to the exclusion of other products that also may be suitable. †Present address: Lantmannen Animal Feeds Division, PO Box 30192, Stockholm, S-10425, Sweden. 1360 to the inoculum reduced apparent degradation rates, possibly via end-product inhibition. Analysis of data from multiple time-point incubations indicated that ca- sein degradation followed simple, first-order kinetics, while a biexponential model fitted degradation patterns for both SSBM and ESBM. (Key words: protein degradation, rumen, inhibitor in vitro) Abbreviation key: CAP = chloramphenicol, ESBM = expeller soybean meal, HS = hydrazine sulfate, IIV = inhibitor in vitro, SSBM = solvent soybean meal, TAA = total AA. INTRODUCTION In the inhibitor in vitro (IIV) method, rates of protein degradation are quantified from the time-course of N appearance as NH 3 and total free AA (TAA) in the presence of hydrazine sulfate (HS) and chlorampheni- col (CAP; Broderick, 1987a). Adding 1 mM HS and 30 mg of CAP/L to the medium did not alter proteolytic activity of mixed ruminal microorganisms (Broderick, 1987b) and yielded quantitative recovery of NH 3 and TAA. However, protein degradation rates obtained with the IIV method for the tannin-containing forages sain- foin and lespedeza were very slow or approximated to zero (Broderick and Albrecht, 1997). Moreover, rates of about 0.01/h were determined by IIV for blood meal and corn gluten meal, while rates estimated in vivo for the same proteins were 0.05 and 0.10/h (Reynal and Broderick, 2003). It is possible that some uptake of degradation end-products may still occur in the IIV system; this “leakage” would be most problematic for estimating rates of slowly degraded proteins. More than 50% of the total CP in alfalfa silage was present as NPN (Broderick, 1995); degradation rates obtained by IIV for the residual (insoluble) protein in these silages were slower than those obtained using uninhibited ru- minal inoculum in which 15 N was used to account for microbial uptake of degraded-N (Peltekova and Broder-
Transcript of Effect of Inhibitor Concentration and EndProduct Accumulation on Estimates of Ruminal in Vitro...
J. Dairy Sci. 87:1360–1371© American Dairy Science Association, 2004.
Effect of Inhibitor Concentration and End-Product Accumulationon Estimates of Ruminal in Vitro Protein Degradation*
Glen A. Broderick,1 Michael L. Murphy,2,† and Peter Uden21Agricultural Research Service,USDA, US Dairy Forage Research Center,Madison, WI 537062Kungsangen forskningscentrum,Sveriges Lantbruksuniversitet,753 23 Uppsala, Sweden
ABSTRACT
Effects of varying the concentrations of hydrazinesulfate (HS) and chloramphenicol (CAP), inhibitors ofmicrobial-N uptake and protein synthesis, on rates ofprotein degradation estimated from net appearance ofNH3 and total amino acids (TAA) were studied in aruminal in vitro fermentation system. Without inhibi-tors, recoveries of N added as NH3 and TAA were 4 and6% after 4-h incubations, and apparent degradationrates estimated from release of NH3 and TAA for casein,solvent soybean meal (SSBM), and expeller soybeanmeal (ESBM) approached 0. Increasing inhibitor con-centrations from the standard amounts of 1 mM HSplus 30 mg of CAP/L to 2 mM HS plus 90 mg of CAP/L gave rise to numerically greater N recoveries anddegradation rates, but these differences were not statis-tically significant. Compared with the standard inhibi-tor concentrations, use of 2 mM HS, without CAP,yielded similar recoveries and rates, but 30 or 90 mgof CAP/L, without HS, was not satisfactory. Versus thatwith 1 mM HS plus 30 mg of CAP/L, media containing2 mM HS plus 90 mg of CAP/L gave increased TAArecoveries and higher rates for casein, but not SSBM,in the presence of added starch. Faster degradationrates were obtained for casein, but slower rates forSSBM and ESBM, in Sweden versus Wisconsin usinginocula from cows fed different diets but with similarCP and energy contents. Differences in microbial catab-olism of peptides may account for differences in degra-dation rates observed between Sweden and Wisconsin.Adding NH3 plus free and peptide-bound amino acids
Received June 10, 2003.Accepted October 28, 2003.Corresponding author: G. A. Broderick; e-mail: [email protected].*Mention of any trademark or proprietary product in this paper
does not constitute a guarantee or warranty of the product by theUSDA or the Agricultural Research Service and does not imply itsapproval to the exclusion of other products that also may be suitable.
†Present address: Lantmannen Animal Feeds Division, PO Box30192, Stockholm, S-10425, Sweden.
1360
to the inoculum reduced apparent degradation rates,possibly via end-product inhibition. Analysis of datafrom multiple time-point incubations indicated that ca-sein degradation followed simple, first-order kinetics,while a biexponential model fitted degradation patternsfor both SSBM and ESBM.(Key words: protein degradation, rumen, inhibitorin vitro)
Abbreviation key: CAP = chloramphenicol, ESBM =expeller soybean meal, HS = hydrazine sulfate, IIV =inhibitor in vitro, SSBM = solvent soybean meal, TAA =total AA.
INTRODUCTION
In the inhibitor in vitro (IIV) method, rates of proteindegradation are quantified from the time-course of Nappearance as NH3 and total free AA (TAA) in thepresence of hydrazine sulfate (HS) and chlorampheni-col (CAP; Broderick, 1987a). Adding 1 mM HS and 30mg of CAP/L to the medium did not alter proteolyticactivity of mixed ruminal microorganisms (Broderick,1987b) and yielded quantitative recovery of NH3 andTAA. However, protein degradation rates obtained withthe IIV method for the tannin-containing forages sain-foin and lespedeza were very slow or approximated tozero (Broderick and Albrecht, 1997). Moreover, rates ofabout 0.01/h were determined by IIV for blood mealand corn gluten meal, while rates estimated in vivo forthe same proteins were 0.05 and 0.10/h (Reynal andBroderick, 2003). It is possible that some uptake ofdegradation end-products may still occur in the IIVsystem; this “leakage” would be most problematic forestimating rates of slowly degraded proteins. More than50% of the total CP in alfalfa silage was present asNPN (Broderick, 1995); degradation rates obtained byIIV for the residual (insoluble) protein in these silageswere slower than those obtained using uninhibited ru-minal inoculum in which 15N was used to account formicrobial uptake of degraded-N (Peltekova and Broder-
INHIBITOR IN VITRO DETERMINATION OF PROTEIN DEGRADATION 1361
ick, 1996). This suggested that rates may have beenunderestimated with the IIV method due to the pres-ence of NPN compounds of alfalfa silage. The additionof HS and CAP results in accumulation of NH3, freeAA, and small peptides, which may also contribute toend-product inhibition in the IIV system. Veresegyhizyet al. (1993) reported that adding more than 19 mMNH3 or 12 mM total free AA inhibited the rate of caseindegradation by ruminal microbes in vitro.
The objectives of these studies on the IIV system wereto: 1) reevaluate effects of inhibitor concentrations onNH3 and TAA recovery and observed degradation rates;2) assess the importance of accumulation of NH3, freeAA, and small peptides as end-product inhibitors; and3) evaluate use of mono- and biexponential kinetic mod-els for quantifying protein degradation.
MATERIALS AND METHODS
Locations and Donor Animals
Experiments were conducted at Uppsala, Sweden,and Madison, Wisconsin. Inocula were obtained fromdonor cows (Swedish Red or Holstein Friesian) surgi-cally fitted with 10-cm ruminal cannulas (Bar Diamond,Parma, ID); surgical care and general maintenance ofthe animals followed IACUC requirements at both loca-tions. Donor cows were fed one of 2 different lactationdiets based on grass silage plus concentrate (a mixtureof barley, oats, sugarbeet pulp, rapeseed meal, soybeanmeal, and vitamins and minerals) in Sweden or on al-falfa silage and corn silage plus concentrate (a mixtureof rolled high moisture corn, soybean meal, and vita-mins and minerals) in Wisconsin. Diets averaged (DMbasis) 17% CP and 1.60 Mcal/kg of NEL in Sweden and16.5% CP and 1.55 Mcal/kg of NEL in Wisconsin (NEL
computed at 3× maintenance; NRC, 2001). Donor cowswere fed ad libitum but intake was not measured.
Protein Sources
The in vitro studies reported here were conductedwith 3 protein sources: casein (no. C-5890, Sigma Chem-icals, St. Louis, MO), one sample of solvent-extractedsoybean meal (SSBM), and one sample of expeller-ex-tracted soybean meal (ESBM; West Central Coop., Ral-ston, IA). The designation ESBM.1 was used in thispaper to distinguish this sample from a second expellersoybean meal that was used in our other work. Proteinsources were ground with a cyclone mill (Udy Corp.,Fort Collins, CO) fitted with a 1-mm screen. More com-plete composition data are reported on these proteinsin the companion paper (Broderick et al., 2004).
Journal of Dairy Science Vol. 87, No. 5, 2004
Standard in Vitro Protocol
In studies conducted in both Sweden and Wisconsin,inocula were prepared using only preincubated strainedruminal fluid. Whole ruminal contents were collectedfrom beneath the fibrous mat in the rumen and filteredat the barn through 2 layers of cheesecloth into awarmed thermos bottle that had been flushed with CO2.This filtrate was transported to the laboratory and thenfiltered again through 4 layers of cheesecloth. In Wis-consin, four 10-mL aliquots were centrifuged (10,000 ×g, 30 min, 4°C); pellets were dried (48 h in 60°C forceddraft oven) and analyzed later for total N. Duplicatealiquots were taken in Sweden. Because of the proxim-ity of animal facilities at both locations, <10 min elapsedfrom initial collection of whole ruminal contents untilthe preincubations were begun under CO2. Per liter ofstrained ruminal fluid, 8 g of maltose (Sigma no. M-2250), 4 g of xylose (Sigma no. X-1500), 4 g of solublestarch (Sigma no. S-2004), and 2.5 g of NaHCO3 wereweighed into an Erlenmeyer flask and suspended withslow stirring in 100 mL of McDougall’s buffer (McDou-gall, 1948) that had been freshly gassed with CO2. Fourgrams of citrus pectin (Sigma no. P-9135) was dispersedin 100 mL of water with heating and stirring and thenadded to the flask before flushing with CO2. Filteredstrained ruminal fluid (1000 mL) and 0.2 mL of surfac-tant (Antifoam 204; Sigma no. A-6426) were added andthe inoculum preincubated for 3 or 4-h using slow stir-ring in a 39°C bath. The flask headspace was continu-ally flushed with a CO2 stream during preincubationto maintain anaerobiosis. At 0 h and every hour sampleswere taken for analysis of NH3, and TAA and pH wasmeasured; if pH was <6.2, pH was adjusted to 6.4 byslow addition of 3 N NaOH. Two solutions for inhibitingNH3 and TAA uptake were prepared by dissolving 72mM of HS (Sigma no. H-7394) and 2250 mg/L of CAP(Sigma no. C-0378) in 39°C McDougall’s buffer. Twenty-five milliliters of each, plus 0.293 g of mercaptoethanol(Sigma no. M-6250), were added to give an inoculumwith 1.5 mM HS, 45 mg of CAP/L, and 3 mM mercapto-ethanol. Concentrations of HS and CAP were variedin some experiments. This inoculum was held at 39°Cunder a CO2 stream until dispensed at the start of theincubation (typically about 20 min).
Incubations were conducted in either 50-mL polypro-pylene centrifuge tubes (Wisconsin) or 50-mL round-bottom glass tubes (Sweden). In Wisconsin experi-ments, protein substrate equal to 1.9 to 2.0 mg of N(equivalent to 14.0 to 70 mg of the protein sources stud-ied, weighed to the nearest 0.1 mg) was added to eachtube. Then 5 mL of warm (39°C) McDougall’s buffer wasadded to each tube to wet the proteins, tube headspaceflushed with CO2, and tubes were stoppered, and held
BRODERICK ET AL.1362
at 39°C for about 1 h prior to inoculation. Incubationswere begun by dispensing 10 mL of inoculum/tube usingeither a repipet or a Cornwall repeating syringe. Twotimes these amounts were used in incubations con-ducted in Sweden, and inoculum was dispensed usinga Cornwall syringe, but otherwise the same protocolswere used. Four blank tubes containing all ingredientsexcept protein substrate were used for each time pointin each incubation. Final concentrations in the stan-dard medium were 1.0 mM HS, 30 mg of CAP/L, 2 mMmercaptoethanol (to maintain reducing conditions), and0.13 mg/mL of protein-N from each source; however,HS and CAP concentrations were an experimental vari-able in some trials. Immediately after inoculating, tubeheadspace was flushed with CO2, tubes were cappedwith Bunsen valves, swirled, and incubated at 39°C ina warm room (Wisconsin) or a water bath (Sweden).Mixing was accomplished using a wrist-arm shaker at150 cycles/min. (Wisconsin) or by hand swirling at 1-h intervals (Sweden). A preliminary study in Swedenshowed that mixing tube contents every hour yieldedthe same degradation rates as continuous shaking. In-cubations were run from 0 to 4 h with hourly samplingin most studies. In Sweden, incubations were killed bytransferring 1-mL aliquots of medium to 1.5-mL centri-fuge tubes containing 0.1 mL of 55%, wt/vol, TCA (finalsample concentration of 5%, wt/vol). Killed sampleswere immediately capped and mixed by inversion, thenplaced on ice for 30 min before centrifuging (10 min at17,700 × g). In Wisconsin, incubations were killed byadding 1.25 mL of 65%, wt/vol, TCA to the entire 15mL of medium in each tube. Tube contents were mixedimmediately by swirling, placed on ice for 30 min, andthen about 4 mL of sample was transferred to 12- × 75-mm plastic tubes and centrifuged (15 min at 15,300 ×g). Supernatants were either held at 5°C until analyzedfor degraded-N later the same day or stored at −18°Cfor later analysis. All incubation experiments were rep-licated twice.
Computation of Rate and Extent of Degradation
Rate and extent of protein degradation were com-puted from net release of NH3 and TAA as describedin the companion paper (Broderick et al., 2004). Reiter-ating, fractions degraded (FD) and fractions unde-graded (FUD) at each time-point were computed:
FD = degraded-N/protein-NFUD = 1 − FD,
where degraded-N was the net release of N in mg/tubedetected as NH3 and TAA and protein-N was the total Nin mg/tube added from each protein source. Degraded-N
Journal of Dairy Science Vol. 87, No. 5, 2004
released as NH3 and TAA in TCA supernatants wascomputed using the equation:
degraded-N, mg = { ( [NH3]prot − [NH3]blank)× 0.0140067+ ( [TAA]prot - [TAA]blank)/(TAA/N) } × Vol,
where [NH3]prot and [NH3]blank and [TAA]prot and[TAA]blank were NH3 and TAA concentrations in mM(μmol/mL) in, respectively, protein-containing andblank tubes, 0.0140067 was the NH3-N constant (mgN/μmol NH3), TAA/N was 50 μmol/mg N, which wasthe mean ratio of TAA (after HCl hydrolysis) to totalN in the proteins studied, and Vol was the total tubevolume in milliliters. The TAA released by HCl-hydroly-sis were assumed to represent all of the degradable Nin each protein.
Rates of ruminal protein degradation (kd) were esti-mated in most experiments by fitting FUD data to asingle exponential model: 1) by nonlinear regression ofFUD on time at each time-point using the nonlinearprocedure of SAS (1999-2000); or 2) using ln FUD onlyat times = 0 h (FUD0) and 4 h (FUD4) from the equation:
degradation rate (kd), /h = [ln (FUD4) − ln (FUD0)]/4.
The potentially degradable fraction of total CP (frac-tion B) was computed using the equation:
fraction B, % = (FUD0) × 100.
As discussed earlier (Broderick et al., 2004), FUD0was not corrected for undegradable-N. Extents of rumi-nal protein escape were computed using the equation(Waldo et al., 1972):
ruminal protein escape, % = B × [kp/(kd + kp)],
where kp, the ruminal passage rate, was set equal to0.06/h. In one study, the nonlinear procedure of SAS(1999-2000) was used to fit FUD data from SSBM andESBM.1 to the biexponential model:
ruminal protein escape, % =B1 × [kp/(k1 + kp)] + B2 × [kp/(k2 + kp)],
where B1 and B2 were the protein fractions degraded,respectively, at rates k1 and k2, and passage rate, kp,was set equal to 0.06/h for both fractions. Fractions B1and B2 were set to sum to FUD0.
Chemical Analyses
Proteins were analyzed for total N, DM, acid deter-gent insoluble-N, and acid-hydrolyzed to TAA as de-
INHIBITOR IN VITRO DETERMINATION OF PROTEIN DEGRADATION 1363
scribed earlier (Broderick et al., 2004). Protein hydroly-sates and TCA-supernatants from in vitro incubationsin all Swedish studies were analyzed for NH3 and TAAusing phenol-hypochlorite and ninhydrin assaysadapted to continuous-flow analysis as described earlier(Broderick and Kang, 1980; Broderick, 1987a) exceptwith an analysis rate of 60/h. In Wisconsin, NH3 wasdetermined by phenol-hypochlorite assay using flow-injection analysis (Lachat method 18-107-06-1-A; La-chat Quick-Chem 8000 FIA; Zellweger Analytical, Mil-waukee, WI) and TAA were determined using a fluori-metric procedure based on o-phthalaldehyde (Roth,1971) that also was adapted to flow-injection analysis.Other details on sample analyses, including the ratio-nale for using the mean value of 50 μmol of TAA/mgtotal N to compute FD and mean composition data onthe proteins studied are in the companion paper (Brod-erick et al., 2004).
Experimental Studies
Effect of inhibitor concentration. Two trials wereconducted in Sweden to study varying the concentra-tions of the inhibitors HS and CAP in ruminal inoculaon estimated protein degradation rates. In the first ex-periment, solutions containing 36 mM HS and 1080 mgof CAP/L were dissolved in McDougall’s buffer. To nine500-mL Erlenmeyer flasks, the following respective vol-umes (mL) of McDougall’s buffer, 36 mM HS, and 1080mg of CAP/L were added: A) 50, 0, and 0; B) 40, 10,and 0; C) 30, 20, and 0; D) 40, 0, and 10; E) 20, 0, and30; F) 30, 10, and 10; G) 20, 20, and 10; H) 10, 10, and30; and I) 0, 20, and 30. A magnetic stir bar was placedin each flask, and flasks were flushed with CO2, stop-pered, and warmed to 39°C in a water bath. After com-pleting 3 h of preincubation using the standard protocol,the inoculum was made 3 mM mercaptoethanol, and190 mL was added to each flask (total 240 mL). Flaskswere swirled, flushed again with CO2, stoppered, andreplaced in the water bath. After 10 min had elapsed,20 mL of each inocula was dispensed while stirring toduplicate tubes prepared (using the standard Swedishprotocol) to contain: no additive (blanks), 4.0 mg of sub-strate N added as casein, SSBM, or ESBM.1, or 66.7μmol of NH3 or 66.7 μmol of TAA (added as acid-hy-drolyzed casein; Sigma no. C-9386) in 10 mL of McDou-gall’s buffer (previously warmed to 39°C). As inoculawere dispensed, 0-h samples were withdrawn and killedwith TCA, then tubes were flushed with CO2, cappedwith Bunsen valves and incubated at 39°C. The se-quence of inoculum addition was A) through I); an aver-age of 2.5 min was required to inoculate each set oftubes (total elapsed time 20 min). In this experiment,tubes were sampled again and killed after 4 h only.
Journal of Dairy Science Vol. 87, No. 5, 2004
Analysis of TCA supernatants for NH3 and TAA wasdone using continuous-flow analysis, and degradationparameters were computed using the 2-point equation;NH3 and TAA recoveries were computed based on theconcentrations present at 0 h for each of the 9 inocula.
A second trial compared the effect of energy addedto inocula F (containing the standard inhibitor concen-trations of 1.5 mM HS and 45 mg of CAP/L) versusinocula I (containing inhibitor concentrations of 3 mMHS and 135 mg of CAP/L). The 2 inocula were preparedas in the 9-inocula experiment, except 720 mL wasmade of each. Twenty tubes were prepared for bothinocula: duplicate blanks, 10 with 4.0 mg of substrateN added as casein, and 8 with 4.0 mg of substrate Nadded as SSBM. Soluble starch was added to duplicatecasein tubes at 0, 34, 86, 215, and 430 mg/tube; solublestarch was added to duplicate SSBM tubes at 0, 65,172, and 344 mg/tube. McDougall’s buffer (10 mL/tube)was added and tubes were warmed to 39°C. Inoculationof tubes, swirling, sampling at 0 and 4 h, analyses andcomputations of degradation parameters were done asin the 9-inocula experiment.
End-product concentration. Two trials were con-ducted in Sweden to assess whether the end-productsfrom protein degradation inhibit observed rates. In thefirst experiment, 1.44 L of inoculum I containing 3 mMHS, 135 mg of CAP/L, and 3 mM mercaptoethanol, and1.44 L of McDougall’s buffer containing 2 mM HS, 90 mgof CAP/L, and 2 mM mercaptoethanol, were prepared asdescribed and held at 39°C under CO2. Ten glass tubesand ten 100-mL Erlenmeyer flasks were prepared induplicate: blank, 4.0 mg of substrate N added as casein,SSBM, or ESBM.1, or 66.7 μmol of NH3 or 66.7 μmolof TAA (added as acid-hydrolyzed casein). McDougall’sbuffer (10 mL/vessel) was added to tubes and flasks,and they were then flushed with CO2, stoppered, andreplaced in the water bath. Just before inoculation, 30mL of the McDougall’s buffer containing the HS, CAP,and mercaptoethanol was added to each flask. Tubesand flasks were then inoculated with 20 mL of inocu-lum, swirled, sampled for 0-h analyses, then flushedwith CO2, stoppered with Bunsen valves, and replacedin the 39°C water bath. All vessels contained 2 mM HS,90 mg of CAP/L and 2 mM mercaptoethanol, and thetypical amounts of protein and inoculum. However,flasks were diluted to twice the typical volume. Vesselswere swirled and sampled every hour through the 4-hincubation. Analyses and computations of degradationparameters were done using the standard protocol de-scribed above.
In the second experiment, preincubation for 4-h wasused in preparation of 1.44 L of inoculum I (containing3 mM HS, 135 mg of CAP/L, and 3 mM mercaptoetha-nol) that was then held for 30 min at 39°C under CO2.
BRODERICK ET AL.1364
Sixteen tubes were prepared in quadruplicate with thestandard Swedish protocol: blank or plus 4.0 mg of sub-strate N added as casein, SSBM, or ESBM.1. McDou-gall’s buffer (10 mL/tube) was added, and tubes werestoppered and placed in the 39°C water bath. Just be-fore starting the incubation, the inoculum was split:half was control and to the other half was added 5.0mM NH3 as (NH4)2SO4, 333 mg/L of acid-hydrolyzedcasein, and 83 mg/L of enzymatically hydrolyzed casein(Sigma no. C-1026). Tubes were then inoculated with20 mL of either control inoculum or inoculum withadded N, then swirled, sampled at 0 h, flushed withCO2, stoppered with Bunsen valves, and replaced inthe 39°C water bath. Tubes were swirled every hour,sampled again at 4 h only and then analyzed, and degra-dation parameters were computed using the 2-pointprotocol described above.
Time-course of protein degradation. A study con-ducted in Sweden examined the effect of backgroundconcentration of N end-products in conjunction withmore frequent sampling over a 6- rather than 4-h incu-bation to estimate degradation parameters. The samemethods used in the second end-product inhibition ex-periment were employed to prepare 2.40 L of inoculumI (containing 3 mM HS, 135 mg of CAP/L, and 3 mMmercaptoethanol) that was held for 30 min at 39°Cunder CO2. Sixteen 250-mL Erlenmeyer flasks wereprepared in quadruplicate: blank or 20.0 mg of sub-strate N added as casein, SSBM, or ESBM.1. McDou-gall’s buffer (50 mL/flask) was added, and flasks werestoppered and placed in the 39°C water bath. Just be-fore the incubation was started, the inoculum was split;half was control and to the other half was added 5.0mM NH3 as (NH4)2SO4, 333 mg/L of acid-hydrolyzedcasein, and 83 mg/L of enzymatically hydrolyzed casein.Flasks were inoculated with 100 mL of either controlinoculum or inoculum with added N, then swirled, sam-pled for 0-h analyses, flushed with CO2, stoppered withBunsen valves, and replaced in the 39°C water bath.Flasks were swirled and sampled every 20 min through-out the 6-h incubation. Analyses and computation ofFD and FUD from degraded-N at each time-point wereconducted with the standard protocol. These data wereused with nonlinear analysis of the mono-exponentialmodel for all 3 proteins and with the biexponentialmodel for SSBM and ESBM.1 as described above.
Statistical Analysis
Quadruplicate blank and duplicate substrate-con-taining tubes were assayed in duplicate for NH3 andTAA at each time-point in each incubation. Means fromthese assays were used to compute net N release, andFD and FUD values, for each protein replicate tube
Journal of Dairy Science Vol. 87, No. 5, 2004
at each time-point by the methods described. Proteindegradation parameters determined in this way werestatistically analyzed at Wisconsin with the generallinear model of SAS (1999-2000). Effect of inhibitor con-centrations was assessed using a model including incu-bation run, replicate(run), and inoculum source (9 in-hibitor concentrations). Recoveries of added N and deg-radation rates of individual proteins were analyzedseparately. Effect of inhibitor concentration and starchaddition was assessed using a model including incuba-tion run, replicate(run), inoculum (F vs. I), starch level,and inoculum × starch interactions. Degradation ratesof casein and SSBM were analyzed separately. Effectof location was assessed using a model including proteinsubstrate, location (Wisconsin vs. Sweden), and protein× location interaction. Effect of end-product inhibitionwas assessed using a model including incubation run,replicate(run), protein substrate, medium (control ordiluted inoculum; with or without added N), and protein× run and protein × medium interactions. Effect ofmethod for estimating degradation parameters was as-sessed using a model including incubation run, repli-cate(run), protein substrate, method (nonlinear regres-sion vs. two-point assay), and protein × run and protein× method interactions. Replicate(run) was used as theerror term in testing for significance of treatments and2-way interactions in all models except in the test oflocation effect. Interaction terms were removed frommodels when P ≥ 0.25. Differences were declared sig-nificant at a < 0.05. When the F-test for a treatmentwas significant (P ≤ 0.05), mean separation was con-ducted by least significant difference at a = 0.05.
RESULTS AND DISCUSSION
Effect of Inhibitor Concentration
Inhibitor concentrations of 1 mM HS and 30 mg/L ofCAP were identified in earlier studies as “optimal”based on maximal N recoveries from added NH3 andTAA and on maximal degradation rates for both caseinand SSBM (Broderick, 1987a). We were interested inconfirming the effectiveness of these concentrations un-der Swedish conditions and, because of the toxic natureof hydrazine (Lenga, 1988), in determining whetherelevated levels of CAP alone would be as effective asthe mixture of these compounds. The effect of 9 differentcombinations of inhibitors on recovery of added N andrate of protein degradation was evaluated (Table 1). Asobserved previously, microbial uptake invalidated ratesestimated from appearance of protein degradation prod-ucts without inhibitors in the medium. Recoveries ofNH3 and TAA (added as acid-hydrolyzed casein) werevery low, only 4 and 6%, and apparent degradationrates approached 0 for all three proteins, on control
INHIBITOR IN VITRO DETERMINATION OF PROTEIN DEGRADATION 1365
Table 1. Effect of inhibitor concentrations on N recoveries and observed rates of protein degradation.1
Recovery,2 % Degradation rate, /h
Inoculum [HS], mM [CAP], mg/L NH3-N CHA-N Casein SSBM ESBM.1
A 0 0 4.2c 6.2d 0.032e 0.010c −0.001c
B 1 0 92.1a 85.3a 0.259bc 0.096a 0.022b
C 2 0 100.3a 95.6a 0.286ab 0.093a 0.036a
D 0 30 20.6c 26.0c 0.108d 0.018c −0.002c
E 0 90 52.7b 55.7b 0.232c 0.044bc 0.001c
F 1 30 95.2a 92.0a 0.292ab 0.100a 0.027ab
G 2 30 97.5a 94.9a 0.291ab 0.087ab 0.033a
H 1 90 98.9a 93.2a 0.309a 0.091a 0.027ab
I 2 90 100.4a 95.7a 0.318a 0.121a 0.033a
SE 5.6 4.4 0.010 0.014 0.003Probability3
Inoculum <0.001 <0.001 <0.001 0.005 <0.001
a,b,c,d,eLS means in the same column with differing superscripts were different (P < 0.05).1CAP = Chloramphenicol; CHA-N = N added as acid-hydrolyzed casein; HS = hydrazine sulfate; SSBM =
solvent soybean meal; ESBM.1 = expeller soybean meal. In vitro incubations conducted in Sweden.2Recovery of N as NH3 + TAA, added to the media as NH3 or CHA-N, after 4-h incubations.3Probability of significant effects of inoculum source using replicate-within-incubation run as the error
term.
inoculum A. Adding HS only, at 1 or 2 mM, yieldedN recoveries that were not different from those withstandard inoculum F (1 mM HS and 30 mg of CAP/L).Adding 30 or even 90 mg/L of CAP without HS gavelower recoveries and rates. More recent work in whichup to 300 mg of CAP/L was added did not yield N recov-eries or degradation rates that were equivalent to thosewith 1 mM HS plus 30 mg/L of CAP (data not shown).The 3 inocula with elevated HS and CAP (G, H, and I)were not different from standard inoculum F, indicatingthat there was no apparent advantage of increasing HSor CAP when the other inhibitor was also present. Withthis combination of compounds, it was clear that HScould not be deleted from the medium. Hydrazine func-tions as an inhibitor of a large number of microbialpyridoxine enzymes, including those involved in trans-amination and other amino transfer reactions (Sauber-lich, 1968). Chloramphenicol is a classical antibioticthat inhibits protein synthesis (Gale and Folkes, 1953;Mahler and Cordes, 1966). The addition of HS inhibitedincorporation of N from both NH3 and exogenous freeAA. However, the finding that casein rate was increasedwhen 30 mg/L of CAP was also added with HS (Broder-ick, 1987a), versus 1 mM HS alone (our original inhibi-tor concentration; Broderick, 1978), suggested thatsome N originating from protein degradation was stillused for protein synthesis. Peptides produced duringextracellular proteolysis are transported into microbialcells (Broderick et. al., 1988; Wallace et al., 1999). Wespeculated that peptides derived from extracellular pro-teolysis may have contributed to an intracellular freeAA pool that was used directly for protein synthesiseven in the presence of HS. This may explain why add-
Journal of Dairy Science Vol. 87, No. 5, 2004
ing CAP with HS was required for complete recoveryof protein degradation products. Earlier work showedthat methylhydrazine, phenylhydrazine, and p-nitro-phenylhydrazine also were effective for inhibiting NH3and free AA uptake by mixed ruminal organisms (Brod-erick and Balthrop, 1979). However, these compoundshave LD50 that indicate greater toxicity than HS(Lenga, 1988). Of course, this work did not precludeother, as yet unidentified inhibitors that may be aseffective but less toxic.
Although not significantly different, NH3 and TAArecoveries and casein and SSBM degradation rateswere numerically greater using 2 mM HS plus 90 mgof CAP/L (inoculum I, Table 1). Based on this observa-tion, a study compared degradation rates obtained withthe standard 1/30 medium versus the 2/90 medium,with or without addition of soluble starch, that couldhave stimulated microbial-N uptake and underesti-mated rates. In this experiment, conducted in Sweden,there was a significant effect of starch addition, andoverall degradation rates were slower for both caseinand SSBM using the standard 1/30 versus 2/90 (mediaF and I; Table 2). Expressing starch addition as if theprotein were present in a concentrate feed with increas-ing carbohydrate dilution indicated that there was nodecrease in apparent degradation rate until casein andSSBM were diluted to, respectively, less than 3.5 and1.8% N. The 2 proteins behaved differently in the 2media: SSBM degradation rates were not differentwhen starch addition diluted total N to 7.2 (no starch)and 3.3% N in medium F or 7.2, 3.3, and 1.8% N inmedium I. For casein, all rates determined with me-dium I were more rapid than those with medium F.
BRODERICK ET AL.1366
Table 2. Effect of inhibitor concentration and soluble starch addition on degradation rates observed for casein and SSBM.1
[HS], [CAP], Starch, N-dilution,2 Casein Starch, N-dilution,2 SSBMInoculum mM mg/L mg/mL % of DM rate, /h mg/mL % of DM rate, /h
F 1 30 0.252 0.092I 2 90 0.333 0.102SE 0.004 0.002
Across inocula 0.0 14.05 0.295ab 0.0 7.17 0.101a
1.1 6.37 0.303a 2.2 3.32 0.100a
2.9 3.47 0.301a 5.7 1.77 0.097ab
7.2 1.64 0.283bc 11.5 1.01 0.090b
14.3 0.86 0.279c
SE 0.005 0.003Probability3
Inoculum <0.001 0.030Starch 0.001 0.001Inoculum*Starch 0.586 0.371
a,b,cLS mean degradation rates in the same column across inocula among the five starch additions with differing superscripts are different(P < 0.05).
1CAP = Chloramphenicol; HS = hydrazine sulfate; SSBM = solvent soybean meal. In vitro incubations conducted in Sweden.2Effective N concentration resulting from diluting protein source by addition of soluble starch to the medium.3Probability of significant effects of inoculum source, starch addition, and their two-way interaction, using replicate-within-incubation
run as the error term.
These results were taken to mean that, at least underSwedish conditions, the 2/90 medium would give riseto more reliable estimates of degradation rate for casein(and perhaps other rapidly degraded proteins) becausemicrobial uptake of degradation end-products was pre-vented.
Effect of Location
Differences in rates by location were found when re-sults from these same samples of protein, determinedat both locations using inocula from lactating cows (i.e.,at high feed intakes), were compared (Table 3): caseindegradation rates were more rapid, and rates for the 2soybean meals slower, in Sweden versus Wisconsin.Although overall mean rates for all 3 proteins were notdifferent (P = 0.49), there was a clear protein × locationinteraction. We speculated that, despite apparently
Table 3. Effect of location of IIV incubation on protein degradation rates observed for casein, solvent soybeanmeal (SSBM), and expeller soybean meal (ESBM.1).
Protein Location (n)1 LS Mean/h SE P > F2
Casein Sweden (36) 0.258 0.008 <0.001Wisconsin (102) 0.207 0.005
SSBM Sweden (32) 0.067 0.008 <0.001Wisconsin (92) 0.119 0.005
ESBM.1 Sweden (18) 0.017 0.011 0.355Wisconsin (73) 0.029 0.006
Location (all 3 proteins) 0.492Location × Protein <0.001
1Number of IIV incubations conducted at each location used in computing LS mean degradation rate.2Probability of significant effect of location and location-by-protein interaction using replicate-within-
incubation run as the error term.
Journal of Dairy Science Vol. 87, No. 5, 2004
similar relative intakes of NEL and CP, different micro-bial populations and degradative enzyme activitieswere found in the rumens at these locations. Thereare substantial differences among ruminal microbes intheir ability to catabolize small oligopeptides and inoc-ula rich in Prevotella ruminicola and other members ofthe genus Prevotella, which are active peptide de-graders, would be expected to clear peptides more rap-idly (Wallace et al., 1999). As reported in our companionpaper (Broderick et al., 2004), Wisconsin work showedthat adding N in peptides to that released as NH3 andTAA substantially increased estimated degradationrates for casein but not SSBM or ESBM. Based on thesefindings, it appeared that peptide hydrolysis activitymay have been relatively low in ruminal inocula usedin Wisconsin studies. Other Wisconsin work indicatedthat fluid-phase microbes were most effective in degrad-ing SSBM and that both SSBM and ESBM were less
INHIBITOR IN VITRO DETERMINATION OF PROTEIN DEGRADATION 1367
Table 4. Effects of medium dilution or end-product addition on initial NH3 and total AA (TAA) concentrationsand on observed rates of protein degradation.1
Medium dilution2
Item 1X 2X SE P > F3
NH3, mM 2.48 1.50 0.24 <0.051TAA, mM 2.46 1.35 0.15 <0.013Casein rate, /h 0.238 0.232 0.023 0.857SSBM rate, /h 0.055 0.057 0.002 0.699ESBM.1 rate, /h 0.017 0.021 0.001 0.106Overall mean rate, /h 0.104 0.103 0.008 0.970
End-product addition4
Item 0 + SE P > F2
NH3, mM 1.05 5.09 0.01 <0.001TAA, mM 1.38 2.01 0.01 <0.001Casein rate, /h 0.327 0.283 0.013 <0.001SSBM rate, /h 0.059 0.046 0.006 0.013ESBM.1 rate, /h 0.018 0.020 0.002 0.641Overall mean rate, /h 0.135 0.117 0.002 <0.001
1In vitro incubations conducted in Sweden.2Extent of dilution of incubation medium; 1X = undiluted and 2X = dilution of medium to twice its original
volume by addition of McDougall’s buffer.3Probability of significant effects of medium dilution (top panel) or addition of degradation end-products
(bottom panel) on initial NH3 and of TAA concentrations and observed degradation rates.4Nitrogen added to “+” vessels as NH4SO4 plus acid- and enzymatically-hydrolyzed casein to increase
background concentrations of protein breakdown products.
rapidly degraded using inocula obtained after feeding(Broderick et al., 2004). We speculated that introduc-tion of small particulates into the rumen with feedingmay have reduced numbers of fluid-phase organismsand that, perhaps because of lower initial populations,proteolytic activity was reduced in Swedish inoculasuch that apparent degradation rates for the 2 soybeanmeals were depressed. Although there was substantialvariation among individual experiments, increaseddegradation rates after feeding were observed consis-tently for all 3 proteins in Wisconsin. None of thesespeculations have been tested experimentally.
Effect of Degradation End-Product Concentration
Earlier, we observed that preincubating inocula withadded peptides, but not with added NH3, increasedbackground NH3 and TAA concentrations in the me-dium and was associated with reduced degradationrates (Broderick et al., 2004). Thus, under conditionsin which NH3 and/or TAA accumulated or where back-ground concentrations were elevated, end-product inhi-bition may have reduced estimates of protein degrada-tion in the IIV system. The magnitude of this possibleeffect was assessed in 2 experiments. In the first, thestandard incubation medium was compared to the samemedium diluted to twice the original volume usingMcDougall’s buffer. Doubling medium volume reducedbackground concentrations of both NH3 and TAA by 40
Journal of Dairy Science Vol. 87, No. 5, 2004
and 45%, respectively, but had no effect on apparentrates of degradation of casein, SSBM, or ESBM (toppanel, Table 4). These concentrations were not unusu-ally high and initial NH3 levels often approached 10mM in other incubations (Broderick et al., 2004). In thesecond experiment, a mixture of NH3, acid-hydrolyzedcasein plus enzymatically hydrolyzed casein was addedto a series of time-course incubations. Mean back-ground concentrations of NH3 were increased from 1.0to 5.1 mM and of TAA were increased from 1.4 to 2.0mM. Addition of the N metabolites reduced the appar-ent degradation rates for casein and SSBM rates by 13and 22%, respectively, but did not affect degradationof ESBM (bottom panel, Table 4). This latter resultsuggested that NH3 concentration exceeding 5 mM mayresult in end-product inhibition, at least for more rap-idly degraded proteins. Veresegyhizy et al. (1993) ob-served inhibition of protein degradation in vitro whenNH3 exceeded 19 mM. Thus, it appeared that methodssuch as preincubation that reduced background NH3were valuable. These findings also suggested that freeAA were not inhibitory to protein degradation in thesestudies because background TAA did not exceed 2 mMin most incubations. It is possible that peptides, im-portant intermediates in protein catabolism (Brodericket al., 1988; Wallace et al., 1999) but not measuredin this study, might act as end-product inhibitors. Weobserved peptide accumulation only in casein IIV incu-bations (Broderick et al., 2004) and peptides may accu-
BRODERICK ET AL.1368
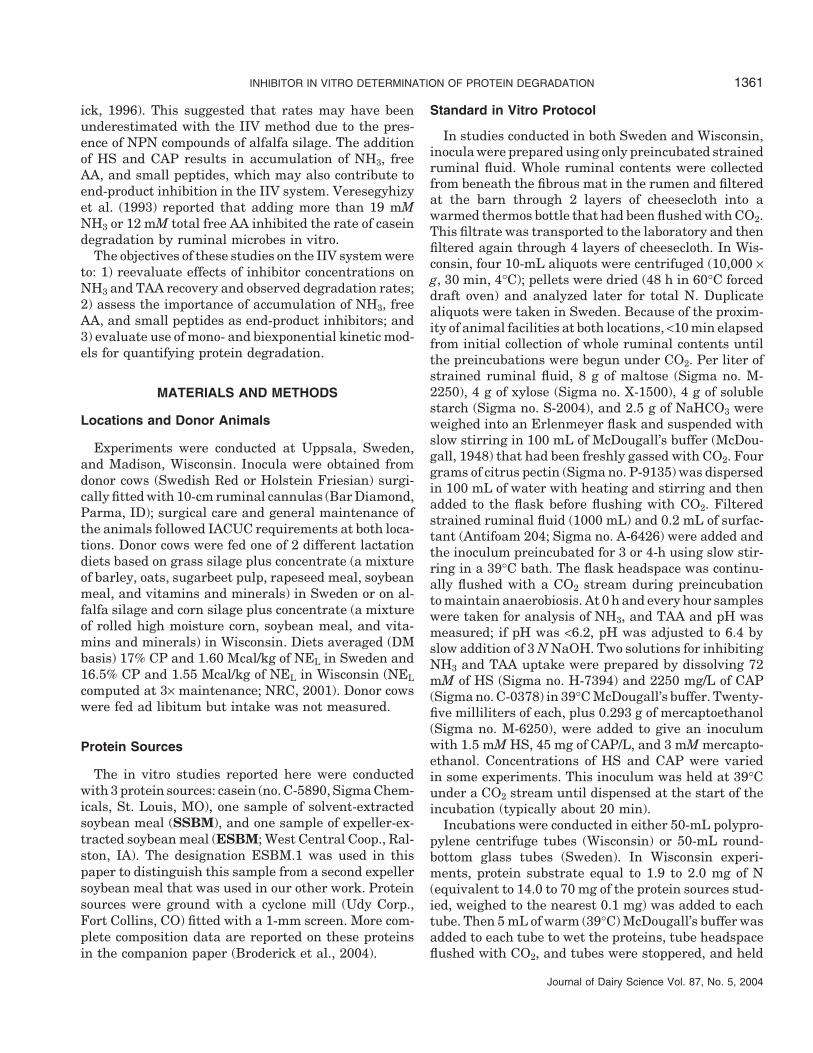
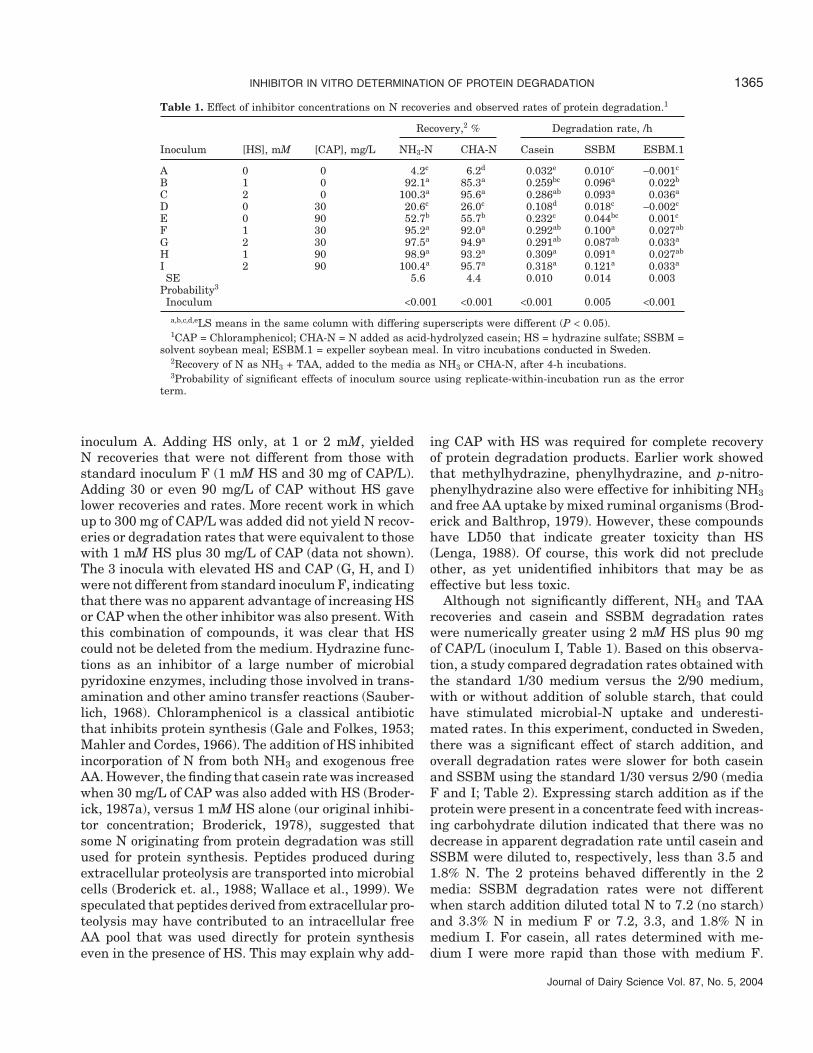
Figure 1. Protein degradation curves obtained in Sweden for ca-sein over 6 h using the IIV system, with and without N added at 0h as a mixture of NH4SO4 plus acid- and enzymatic-hydrolyzed caseinto increase background concentrations of protein breakdown prod-ucts. Equations obtained using nonlinear regression (SAS, 1999-2000) to fit a mono-exponential model to data from 0 to 4.5 h were:FUD = 0.993*e−0.266t (plus added N); and FUD = 0.993*e−0.313t (noadded N). Error bars are not visible because they fall within theplot symbols.
mulate during breakdown of rapidly degraded proteins(Broderick and Craig, 1989).
Time-Course of Protein Degradation
We expected that degradation of casein would be amono-exponential process but that degradation of bothSSBM and ESBM might require a 2-compartmentmodel with 2 fractions degraded at 2 different rates.The time-course of degradation of these 3 proteins over6 h, with and without added background N-metabolites,is shown in Figures 1 to 3. Casein degradation wasadequately described by a mono-exponential model over4.5 h of the 6-h incubation (Figure 1). Without addedbackground N, 74% of the casein was degraded by 4.5 h.Degradation may have deviated from first-order beyondthis time because most of the substrate was degradedor because of accumulation of N end-products in theIIV system. Degradation of casein in the presence ofadded N also was linear over 4.5 h, but only 68% of theoriginal casein was degraded; degradation in this casedid not proceed linearly until 74% of the casein wasconsumed. This suggested that end-product accumula-tion in the IIV system was more important than sub-strate limitation in slowing casein degradation belowthe initial first-order rate.
Journal of Dairy Science Vol. 87, No. 5, 2004
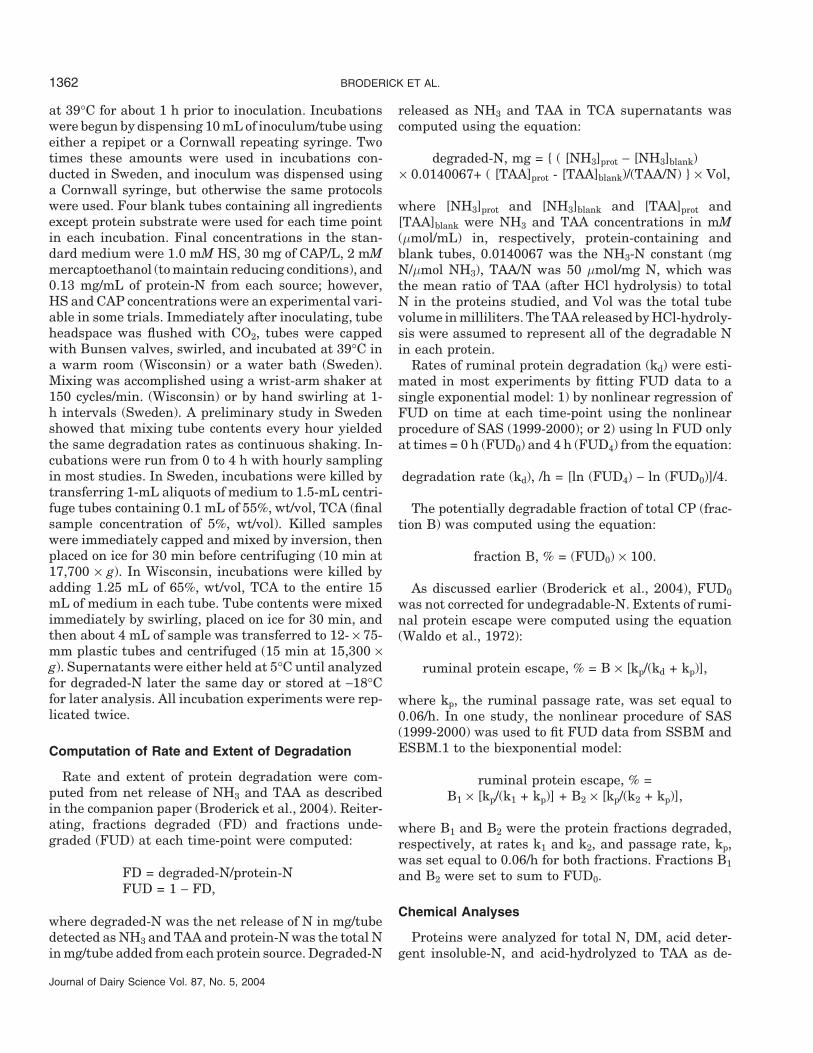
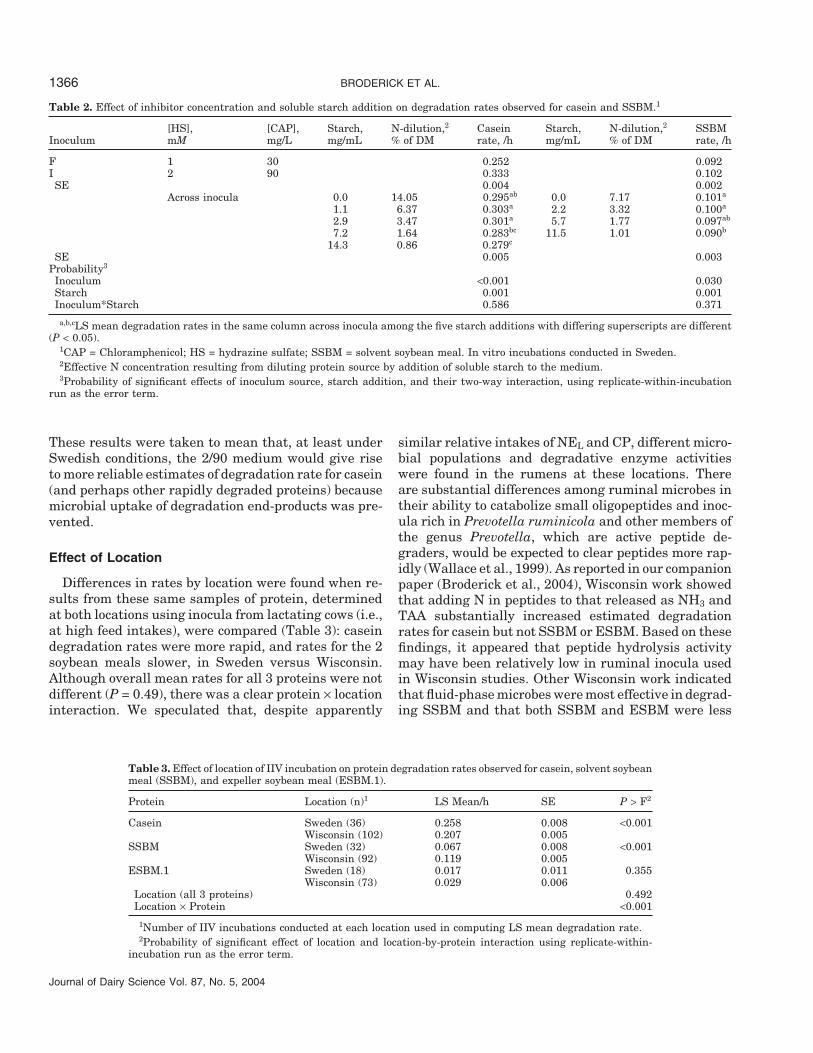
Figure 2. Protein degradation curves obtained in Sweden for sol-vent soybean meal (SSBM) over 6 h using the IIV system, with andwithout N added at 0-h as a mixture of NH4SO4 plus acid- and enzy-matic-hydrolyzed casein to increase background concentrations ofprotein breakdown products. Equations obtained from non-linear re-gressions (SAS, 1999-2000) to fit a bi-exponential model to data were:FUD = 0.088*e−1.447t + 0.900*e−0.029t (plus added N); and FUD =0.114*e−1.628t + 0.875*e−0.036t (no added N). Error bars are ± 1 SE.
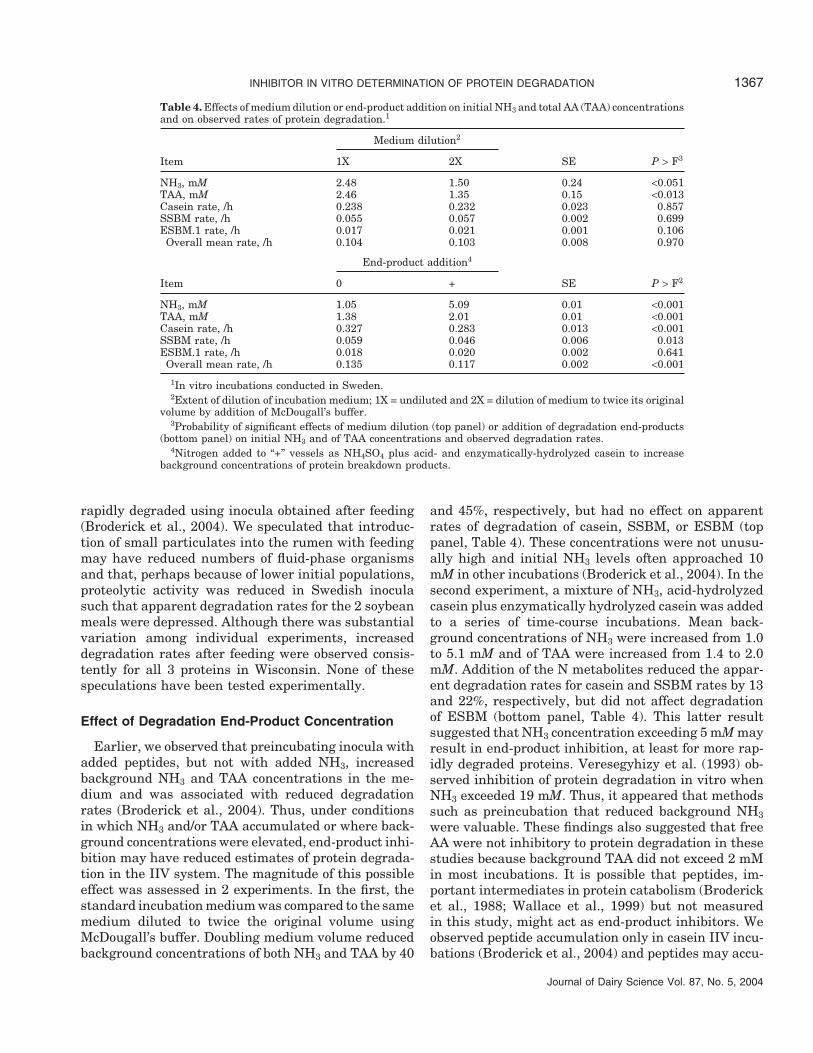
Degradation of both SSBM (Figure 2) and ESBM (Fig-ure 3) were well described by biexponential models.This was expected because soybean meals (Broderickand Clayton, 1992) and most protein concentrates(Broderick and Cochran, 2000) may be considered to bemixtures of soluble and insoluble protein fractions thatare degraded at 2 different rates. Breakdown of SSBM,but not ESBM, was slowed by addition of N metabolitesto the medium. Degradation parameters obtained usingthe nonlinear model of SAS (1999-2000) for both themono- and biexponential kinetic fits of the data are inTable 5. Rates estimated for rapidly degraded fractionsB1 were very fast, ranging from to 1.35 to 1.63/h for4.3 to 11.4% of the total CP in SSBM and ESBM.1.Degradation rates ranging from 0.87 to 1.08/h wereestimated for the rapidly degraded fractions in commer-cial samples of solvent and screw-press extracted cot-tonseed meal using a biexponential model (Broderickand Craig, 1980). Degradation rates for casein, esti-mated using a Michaelis-Menten variant of the presentmethod, ranged from 0.68 to 0.99/h over a large numberof IIV incubations (Broderick and Clayton, 1992). Theaddition of degradation end-products reduced the ratesobtained with the mono-exponential model for caseinand SSBM, but not for ESBM. Significant effects ofprotein source, N addition, and their 2-way interac-tions, were found using biexponential fitting of the soy-
INHIBITOR IN VITRO DETERMINATION OF PROTEIN DEGRADATION 1369
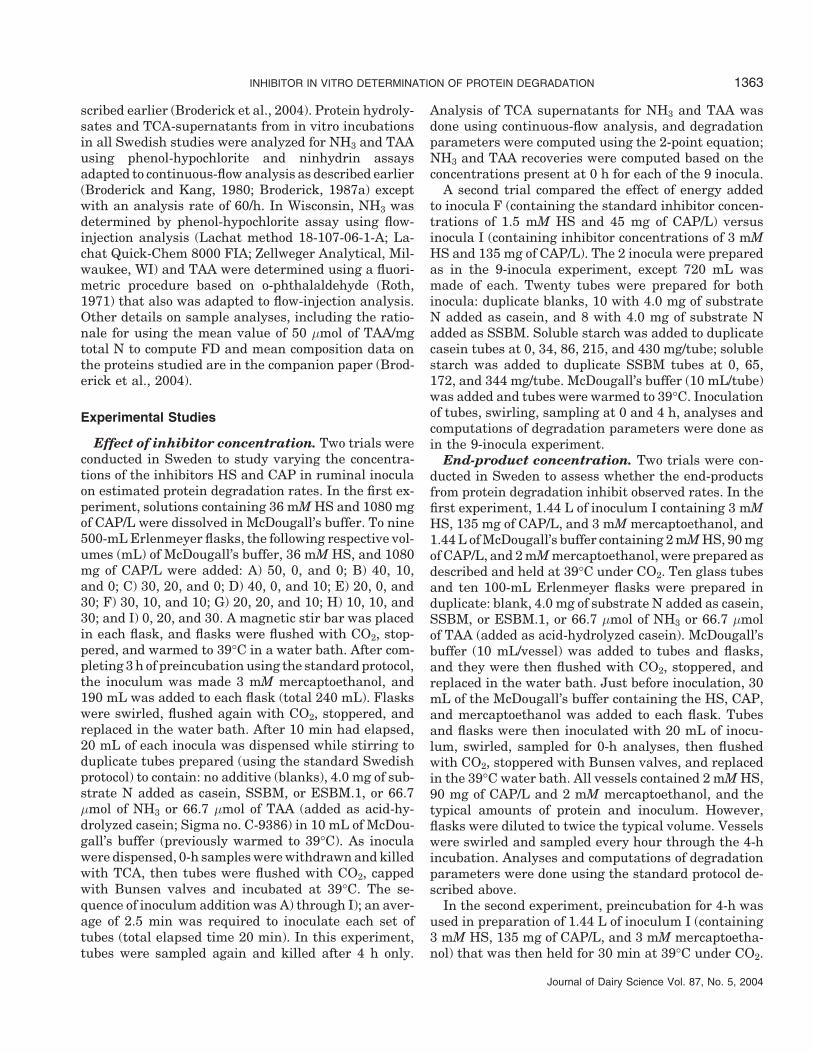
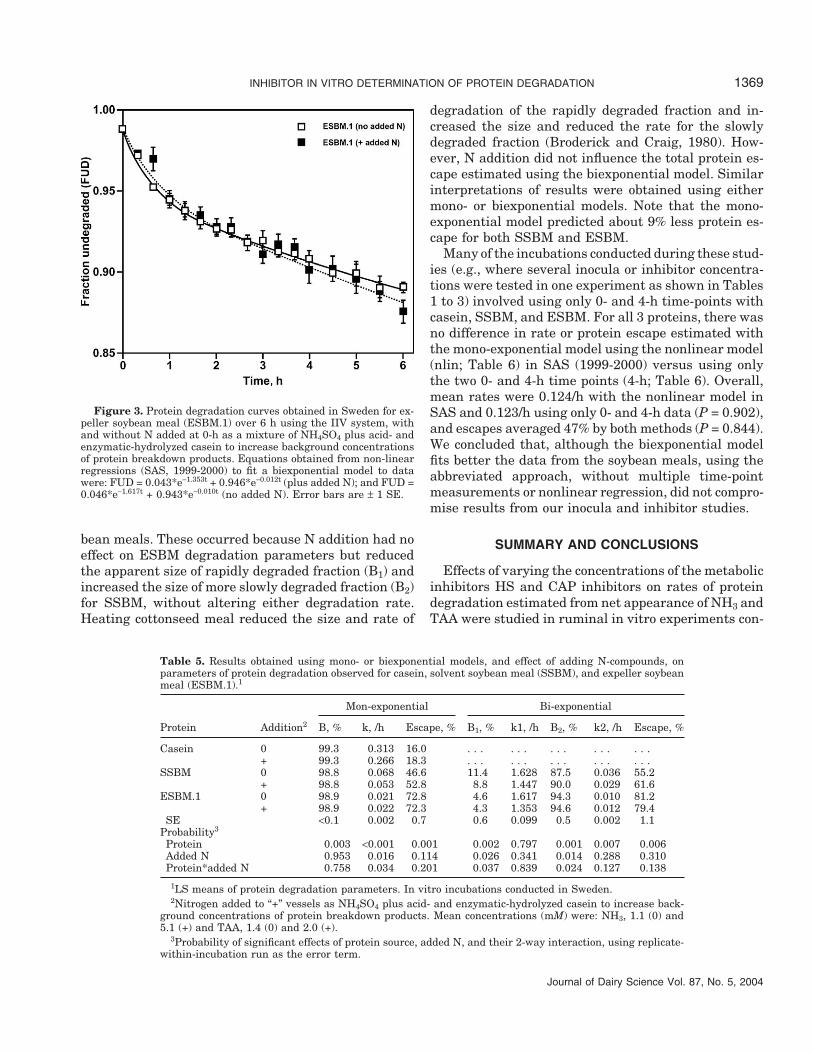
Figure 3. Protein degradation curves obtained in Sweden for ex-peller soybean meal (ESBM.1) over 6 h using the IIV system, withand without N added at 0-h as a mixture of NH4SO4 plus acid- andenzymatic-hydrolyzed casein to increase background concentrationsof protein breakdown products. Equations obtained from non-linearregressions (SAS, 1999-2000) to fit a biexponential model to datawere: FUD = 0.043*e−1.353t + 0.946*e−0.012t (plus added N); and FUD =0.046*e−1.617t + 0.943*e−0.010t (no added N). Error bars are ± 1 SE.
bean meals. These occurred because N addition had noeffect on ESBM degradation parameters but reducedthe apparent size of rapidly degraded fraction (B1) andincreased the size of more slowly degraded fraction (B2)for SSBM, without altering either degradation rate.Heating cottonseed meal reduced the size and rate of
Table 5. Results obtained using mono- or biexponential models, and effect of adding N-compounds, onparameters of protein degradation observed for casein, solvent soybean meal (SSBM), and expeller soybeanmeal (ESBM.1).1
Mon-exponential Bi-exponential
Protein Addition2 B, % k, /h Escape, % B1, % k1, /h B2, % k2, /h Escape, %
Casein 0 99.3 0.313 16.0 . . . . . . . . . . . . . . .+ 99.3 0.266 18.3 . . . . . . . . . . . . . . .
SSBM 0 98.8 0.068 46.6 11.4 1.628 87.5 0.036 55.2+ 98.8 0.053 52.8 8.8 1.447 90.0 0.029 61.6
ESBM.1 0 98.9 0.021 72.8 4.6 1.617 94.3 0.010 81.2+ 98.9 0.022 72.3 4.3 1.353 94.6 0.012 79.4
SE <0.1 0.002 0.7 0.6 0.099 0.5 0.002 1.1Probability3
Protein 0.003 <0.001 0.001 0.002 0.797 0.001 0.007 0.006Added N 0.953 0.016 0.114 0.026 0.341 0.014 0.288 0.310Protein*added N 0.758 0.034 0.201 0.037 0.839 0.024 0.127 0.138
1LS means of protein degradation parameters. In vitro incubations conducted in Sweden.2Nitrogen added to “+” vessels as NH4SO4 plus acid- and enzymatic-hydrolyzed casein to increase back-
ground concentrations of protein breakdown products. Mean concentrations (mM) were: NH3, 1.1 (0) and5.1 (+) and TAA, 1.4 (0) and 2.0 (+).
3Probability of significant effects of protein source, added N, and their 2-way interaction, using replicate-within-incubation run as the error term.
Journal of Dairy Science Vol. 87, No. 5, 2004
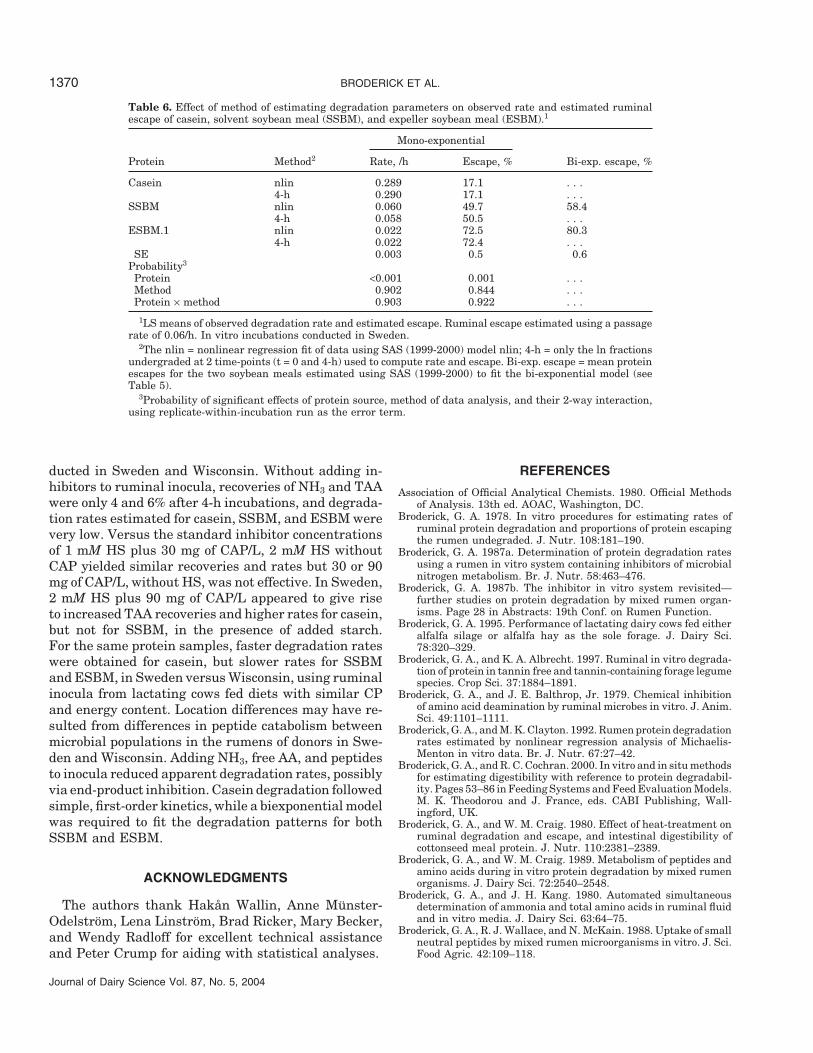
degradation of the rapidly degraded fraction and in-creased the size and reduced the rate for the slowlydegraded fraction (Broderick and Craig, 1980). How-ever, N addition did not influence the total protein es-cape estimated using the biexponential model. Similarinterpretations of results were obtained using eithermono- or biexponential models. Note that the mono-exponential model predicted about 9% less protein es-cape for both SSBM and ESBM.
Many of the incubations conducted during these stud-ies (e.g., where several inocula or inhibitor concentra-tions were tested in one experiment as shown in Tables1 to 3) involved using only 0- and 4-h time-points withcasein, SSBM, and ESBM. For all 3 proteins, there wasno difference in rate or protein escape estimated withthe mono-exponential model using the nonlinear model(nlin; Table 6) in SAS (1999-2000) versus using onlythe two 0- and 4-h time points (4-h; Table 6). Overall,mean rates were 0.124/h with the nonlinear model inSAS and 0.123/h using only 0- and 4-h data (P = 0.902),and escapes averaged 47% by both methods (P = 0.844).We concluded that, although the biexponential modelfits better the data from the soybean meals, using theabbreviated approach, without multiple time-pointmeasurements or nonlinear regression, did not compro-mise results from our inocula and inhibitor studies.
SUMMARY AND CONCLUSIONS
Effects of varying the concentrations of the metabolicinhibitors HS and CAP inhibitors on rates of proteindegradation estimated from net appearance of NH3 andTAA were studied in ruminal in vitro experiments con-
BRODERICK ET AL.1370
Table 6. Effect of method of estimating degradation parameters on observed rate and estimated ruminalescape of casein, solvent soybean meal (SSBM), and expeller soybean meal (ESBM).1
Mono-exponential
Protein Method2 Rate, /h Escape, % Bi-exp. escape, %
Casein nlin 0.289 17.1 . . .4-h 0.290 17.1 . . .
SSBM nlin 0.060 49.7 58.44-h 0.058 50.5 . . .
ESBM.1 nlin 0.022 72.5 80.34-h 0.022 72.4 . . .
SE 0.003 0.5 0.6Probability3
Protein <0.001 0.001 . . .Method 0.902 0.844 . . .Protein × method 0.903 0.922 . . .
1LS means of observed degradation rate and estimated escape. Ruminal escape estimated using a passagerate of 0.06/h. In vitro incubations conducted in Sweden.
2The nlin = nonlinear regression fit of data using SAS (1999-2000) model nlin; 4-h = only the ln fractionsundergraded at 2 time-points (t = 0 and 4-h) used to compute rate and escape. Bi-exp. escape = mean proteinescapes for the two soybean meals estimated using SAS (1999-2000) to fit the bi-exponential model (seeTable 5).
3Probability of significant effects of protein source, method of data analysis, and their 2-way interaction,using replicate-within-incubation run as the error term.
ducted in Sweden and Wisconsin. Without adding in-hibitors to ruminal inocula, recoveries of NH3 and TAAwere only 4 and 6% after 4-h incubations, and degrada-tion rates estimated for casein, SSBM, and ESBM werevery low. Versus the standard inhibitor concentrationsof 1 mM HS plus 30 mg of CAP/L, 2 mM HS withoutCAP yielded similar recoveries and rates but 30 or 90mg of CAP/L, without HS, was not effective. In Sweden,2 mM HS plus 90 mg of CAP/L appeared to give riseto increased TAA recoveries and higher rates for casein,but not for SSBM, in the presence of added starch.For the same protein samples, faster degradation rateswere obtained for casein, but slower rates for SSBMand ESBM, in Sweden versus Wisconsin, using ruminalinocula from lactating cows fed diets with similar CPand energy content. Location differences may have re-sulted from differences in peptide catabolism betweenmicrobial populations in the rumens of donors in Swe-den and Wisconsin. Adding NH3, free AA, and peptidesto inocula reduced apparent degradation rates, possiblyvia end-product inhibition. Casein degradation followedsimple, first-order kinetics, while a biexponential modelwas required to fit the degradation patterns for bothSSBM and ESBM.
ACKNOWLEDGMENTS
The authors thank Hakan Wallin, Anne Munster-Odelstrom, Lena Linstrom, Brad Ricker, Mary Becker,and Wendy Radloff for excellent technical assistanceand Peter Crump for aiding with statistical analyses.
Journal of Dairy Science Vol. 87, No. 5, 2004
REFERENCES
Association of Official Analytical Chemists. 1980. Official Methodsof Analysis. 13th ed. AOAC, Washington, DC.
Broderick, G. A. 1978. In vitro procedures for estimating rates ofruminal protein degradation and proportions of protein escapingthe rumen undegraded. J. Nutr. 108:181–190.
Broderick, G. A. 1987a. Determination of protein degradation ratesusing a rumen in vitro system containing inhibitors of microbialnitrogen metabolism. Br. J. Nutr. 58:463–476.
Broderick, G. A. 1987b. The inhibitor in vitro system revisited—further studies on protein degradation by mixed rumen organ-isms. Page 28 in Abstracts: 19th Conf. on Rumen Function.
Broderick, G. A. 1995. Performance of lactating dairy cows fed eitheralfalfa silage or alfalfa hay as the sole forage. J. Dairy Sci.78:320–329.
Broderick, G. A., and K. A. Albrecht. 1997. Ruminal in vitro degrada-tion of protein in tannin free and tannin-containing forage legumespecies. Crop Sci. 37:1884–1891.
Broderick, G. A., and J. E. Balthrop, Jr. 1979. Chemical inhibitionof amino acid deamination by ruminal microbes in vitro. J. Anim.Sci. 49:1101–1111.
Broderick, G. A., and M. K. Clayton. 1992. Rumen protein degradationrates estimated by nonlinear regression analysis of Michaelis-Menton in vitro data. Br. J. Nutr. 67:27–42.
Broderick, G. A., and R. C. Cochran. 2000. In vitro and in situ methodsfor estimating digestibility with reference to protein degradabil-ity. Pages 53–86 in Feeding Systems and Feed Evaluation Models.M. K. Theodorou and J. France, eds. CABI Publishing, Wall-ingford, UK.
Broderick, G. A., and W. M. Craig. 1980. Effect of heat-treatment onruminal degradation and escape, and intestinal digestibility ofcottonseed meal protein. J. Nutr. 110:2381–2389.
Broderick, G. A., and W. M. Craig. 1989. Metabolism of peptides andamino acids during in vitro protein degradation by mixed rumenorganisms. J. Dairy Sci. 72:2540–2548.
Broderick, G. A., and J. H. Kang. 1980. Automated simultaneousdetermination of ammonia and total amino acids in ruminal fluidand in vitro media. J. Dairy Sci. 63:64–75.
Broderick, G. A., R. J. Wallace, and N. McKain. 1988. Uptake of smallneutral peptides by mixed rumen microorganisms in vitro. J. Sci.Food Agric. 42:109–118.
INHIBITOR IN VITRO DETERMINATION OF PROTEIN DEGRADATION 1371
Broderick, G. A., P. Uden, M. L. Murphy, and A. Lapins. 2004. Sourcesof variation in rates of in vitro rumen protein degradation. J.Dairy Sci. 87:1345–1359.
Gale, E. F., and J. P. Folkes. 1953. Effect of chloramphenicol of proteinsynthesis in Staphylococcus aureus. Biochem. J. 53:493–498.
Lenga, R. E. 1988. The Sigma-Aldrich Library of Chemical SafetyData, Ed. II, Vol. I and II.
Mahler, H. R., and E. H. Cordes. 1966. Pages 810–811 in BiologicalChemistry. Harper and Row, New York, NY.
McDougall, E. I. 1948. Studies on ruminant saliva. I. The compositionand output of sheep’s saliva. Biochem. J. 43:99–109.
National Research Council. 2001. Nutrient Requirements of DairyCattle. 7th rev. ed. Natl. Acad. Sci., Washington, DC.
Peltekova, V. D., and G. A. Broderick. 1996. In vitro ruminal degrada-tion and synthesis of protein on fractions extracted from alfalfahay and silage. J. Dairy Sci. 79:612–619.
Journal of Dairy Science Vol. 87, No. 5, 2004
Reynal, S. M., and G. A. Broderick. 2003. Effects of feeding dairycows protein supplements of varying ruminal degradability. J.Dairy Sci. 86:835–843.
Roth, M. 1971. Fluorescence reaction of amino acids. Anal. Chem.43:880–882.
SAS. 1999-2000. SAS/STAT User’s Guide (Release 8.1), SAS Inst.,Inc., Cary, NC.
Sauberlich, H. E. 1968. Vitamin B6 group. VIII. Active compoundsand antagonists. Pages 33–44 in The Vitamins. Vol. II. 2nd ed. W.H. Sebrell and R. S. Harris, eds. Academic Press, New York, NY.
Veresegyhizy, T., S. Fekete, and M. Hegedus. 1993. Factors influenc-ing ruminal bacterial activity. I. Effect of end-product concentra-tion on proteolytic activity. J. Anim. Physiol. Anim. Nutr. 70:1–5.
Waldo, D. R., L. W. Smith, and E. L.Cox. 1972. Model of cellulosedisappearance from the rumen. J. Dairy Sci. 55:125–129.
Wallace, R. J., C. Atasoglu, and C. J. Newbold. 1999. Role of peptidesin rumen microbial metabolism: Review. Asian-Australasian-J.Anim. Sci. 12:139–147.