Effect of group size on behavior, health, production, and welfare of veal calves
35
E. M. Abdelfattah, M. M. Schutz, D. C. Lay, Jr., J. N. Marchant-Forde and S. D. Eicher Effect of group size on behavior, health, production, and welfare of veal calves published online August 29, 2013 J ANIM SCI http://www.journalofanimalscience.org/content/early/2013/08/28/jas.2013-6308 the World Wide Web at: The online version of this article, along with updated information and services, is located on www.asas.org at Serials Unit on September 13, 2013 www.journalofanimalscience.org Downloaded from
Transcript of Effect of group size on behavior, health, production, and welfare of veal calves

E. M. Abdelfattah, M. M. Schutz, D. C. Lay, Jr., J. N. Marchant-Forde and S. D. EicherEffect of group size on behavior, health, production, and welfare of veal calves
published online August 29, 2013J ANIM SCI
http://www.journalofanimalscience.org/content/early/2013/08/28/jas.2013-6308the World Wide Web at:
The online version of this article, along with updated information and services, is located on
www.asas.org
at Serials Unit on September 13, 2013www.journalofanimalscience.orgDownloaded from

1
Group housing of veal calves
Effect of group size on behavior, health, production, and welfare of veal calves1,2
E. M. Abdelfattah,* M. M. Schutz, ¶ D. C. Lay Jr., § J. N. Marchant-Forde, § S. D. Eicher, 3§
*Department of Animal Hygiene, Behavior and Management, Faculty of Veterinary Medicine,
Benha University, Al Qalyubiyah, Moshtohor 13736, Egypt; ¶Purdue University, Department of
Animal Sciences, West Lafayette, IN 47907, USA and §USDA-ARS, Livestock Behavior
Research Unit, West Lafayette, IN 47907, USA.
1The authors wish to acknowledge the assistance of the Sekel Group for calf use and
management and the help of Antoinette Harris in the compilation of the behavior data of this
study.
2Mention of trade names or commercial products in this manuscript are solely for the purpose of
providing specific information and does not imply recommendation or endorsement by the U.S.
Department of Agriculture. U.S.D.A. is an equal opportunity employer.
3Corresponding author: [email protected]
Published Online First on August 29, 2013 as doi:10.2527/jas.2013-6308 at Serials Unit on September 13, 2013www.journalofanimalscience.orgDownloaded from

2
ABSTRACT
The objective of this study was to investigate the effect of group size on behavior, growth,
health, and welfare of veal calves. Holstein-Friesian bull calves (n = 168; 44 ± 3 d of age) were
assigned randomly to 1 of 3 treatments of group housing with 2, 4, or 8 calves/pen. The pens
used for housing were 3 × 1.20 m (2 calves/pen), 3 × 2.40 m (4 calves/pen), and 3 × 4.80 m (8
calves/pen), supplying a total pen space allowance of 1.82 m2 /calf, regardless of pen size.
Behavior was recorded from video data throughout the day from 0700 to 1900 h, during a single
day each month for 5 mo using scan sampling every 5 min within 30-min observation sessions.
On d 0, 1, 5, 14, 42, and 70 after grouping, continuous focal sampling around feeding time (30-
min intervals before, during, and after feeding) focused on oral and aggressive behaviors. Calves
housed in large groups (4 or 8 calves/pen) showed more (P ≤ 0.001) conspecific contact,
walking, and standing, and less (P < 0.001) manipulation of objects, self-licking, and lying when
compared to calves housed in small groups (2 calves/pen). Group size had no effect on play
behavior (P = 0.11) throughout the experiment. During feeding times group size had no (P ≥
0.07) effect on any behavioral patterns except for duration of conspecific contact (P < 0.01).
Aggression at feeding time was not (P > 0.23) affected by treatment. Group size treatments were
similar for hip height change (P = 0.41) and heart girth change (P = 0.18) over the duration of
the experiment; however, both hip height and heart girth increased (P = 0.001) with calf age.
During mo 1, calves in groups of 8 or 4 coughed more than calves in groups of 2, whereas calves
in groups of 8 coughed more than calves in groups of 4 or 2 in mo 2 (treatment × month, P =
0.03). Furthermore, during mo 4, calves in groups of 8 had less nasal discharge than calves in
groups of 2 or 4 (treatment × month, P = 0.02). Ocular discharge, ears, and fecal scores did not
differ (P ≥ 0.05) among treatments. Plasma cortisol was not (P ≥ 0.37) affected by group size.
at Serials Unit on September 13, 2013www.journalofanimalscience.orgDownloaded from

3
The number of veal calves in a group when given the same space did not affect production and
physiological indicators of welfare but had a transient effect on health during the 5-mo finishing
period. If increased play, social contact, and decreased aggression are considered as primary
indicators of welfare, group size did not alter calf welfare.
Key Words: behavior, group size, growth, health, veal calves, welfare
INTRODUCTION
The optimal environment for housing newborn and growing dairy calves should provide
thermal, physical, psychological, and behavioral comfort (Stull and Reynolds, 2008). A majority
of North American veal farms utilize individual stalls or pens, which is believed to be beneficial
because of easy observation of each calf, effective management and handling of waste materials,
limited cross contamination with pathogens among calves, and possible prevention of cross-
sucking. Housing in single pens or hutches prevents calves from having physical contact with
conspecifics. Total isolation, where calves are prevented from physical as well as visual contact
with other calves, will influence their social development and affect their behavior thereafter
(Bøe and Færevik, 2003).
The American Veal Association (2007) called upon all U.S. veal producers to transition
to group-housing by December 31, 2017 to address animal well-being pressures. From a welfare
point of view, group housing is preferable to individual housing because it enables calves to run
and play (Jensen et al., 1998; Babu et al., 2004), and have full social interactions with other
calves (Svensson and Liberg, 2006). However, calves housed in groups may develop cross-
sucking behavior (de Passille, 2001; Jensen, 2003; Jensen and Budde, 2006;), experience chronic
social stress (Veissier et al., 1998), have higher risks of infection (Svensson and Liberg, 2006),
at Serials Unit on September 13, 2013www.journalofanimalscience.orgDownloaded from

4
and experience greater displacements from the feed trough (Færevik et al., 2007). Overall,
information regarding group size and veal calf well-being is scarce; therefore, the objective of
the present study was to determine the effect of group size on behavior, health, growth, and
welfare of veal calves. The hypothesis tested in this experiment was that calves housed in smaller
groups will have fewer incidences of disease, improved growth performance, lower circulating
cortisol concentrations, and display less aggression than those in larger groups.
MATERIALS AND METHODS
The study was conducted at a Strauss Veal Feeds Inc. (North Manchester, IN) finisher barn,
which provided facilities, calves, and feed, and the study was carried out over 5 mo, from March
to July, 2012. All experimental procedures were in compliance with the Guide for the Care and
Use of Agricultural Animals in Research and Teaching (2010), and approved by Purdue
University Animal Care and Use committee (Protocol no. 1112000434).
Experimental Animals and Housing
Holstein-Friesian bull calves (n = 168) from Strauss Veal Feeds Inc. (North Manchester,
IN) starter barns were housed in individual pens until they were moved to the experimental pens
in the finishing barn for this experiment. On arrival to the finishing barn, bull calves (44 ± 3 d of
age) were allotted randomly in pairs to 84 pens that were in 2 rooms of the same barn.
Experimental pens (3 m length × 1.2 m width × 1.21 m height) consisted of stainless steel
partitions that enabled visual and tactile contact between calves. After 1 wk of acclimation,
calves were assigned randomly to 1 of 3 group-housing treatments (2, 4, or 8 calves/pen). Those
assigned to 2 calves/pen remained as they were, whereas those assigned to 4 or 8 calves/pen had
at Serials Unit on September 13, 2013www.journalofanimalscience.orgDownloaded from

5
the metal partitions between neighboring pens removed to form the larger groups. Twelve
replicated pens (6/room) of each treatment were formed; however; 1 pen of 8 calves was
removed from the trial because of a congenital deformity of one calf. Pens used for housing were
3 × 1.2 m (2 calves/pen), 3 × 2.4 m (4 calves/pen), and 3 × 4.8 m (8 calves/pen), but the total pen
area allowance was kept constant at 1.82 m2 /calf for all group sizes (Prevedello et al., 2012).
Initial BW of calves were 65.3 ± 3.7, 66.5 ± 3.7, and 67.5 ± 3.7 kg for calves in groups of 2, 4,
and 8 calves, respectively. The barn was naturally ventilated, utilizing automated curtain
controllers and a chimney vent. The barn was new and had not been occupied previously. When
calves arrived, the temperature was set to 12.7°C and lowered twice weekly by approximately
0.3°C each time over 5 wk until the temperature reached 10°C. Experimental pens were
equipped with radiant floor heating to control the temperature of slatted concrete floors without
additional bedding. No additional cooling was required during the time of the experiment.
Natural lighting was used and the barn included transparent insulated curtains and a transparent
ridge cap to maximize the natural lighting exposure. A feeding trough at the front of each pen
was divided with a solid metal partition and provided a separated eating area for each calf (38.1
× 30.5 × 20.3 cm).
Animal Management and Feeding
Blood hemoglobin concentration (Hb), packed cell volume (PCV), and red and white blood
cell counts (RBC and WBC, respectively) were monitored at the beginning of experiment (41 to
43 d of age) for all experimental calves and repeated in the middle of the experiment (85 to 97 d
of age) for one calf/pen (Table 1) to check the health of calves and to ensure that hemoglobin
levels of calves at the beginning of the experiment were not below the normal level (7 to 8
gm/dL; Schwartz, 1990) as a part of normal farm management. Blood samples were collected by
at Serials Unit on September 13, 2013www.journalofanimalscience.orgDownloaded from
6
jugular venipuncture into 5-mL EDTA vacuum tubes (BD, Franklin Lakes, NJ), and analyzed
using STKS hematology analyzer (Beckman Coulter, Indianapolis, IN). Calves that had low Hb
and WBC levels were given 10-cc, whereas those with only low Hb level were given 5-cc, i.m.
injection of iron dextrin (FerroDex 100, AgriLabs, St. Joseph, MO) in accordance with the
standard operating procedures of the farm. Additional iron was added in the milk replacer
depending on blood tests (Vita-Iron, Strauss Veal Feeds Inc. North Manchester, IN). The number
of calves treated for iron deficiency at the onset of the experiment was 42, 13, and 10 for groups
of 8, 4, and 2, respectively.
All experimental calves were individually identified with ear tags, and received a
prophylactic treatment of oxytetracycline and lincomycine spectinomycine (LS-50; Zoetis,
Madison, NJ), which was added to milk for 2 consecutive days after arrival to the finishing barn.
Calves were fed their allowance of milk replacer and solid feed twice daily at 12-h intervals
(0500 and 1700 h). They were offered a combination of dry and liquid milk replacer (Agri-Best
Balancer 51/12 and LiquiKalf veal feed; Strauss Veal Feeds Inc., North Manchester, IN) which
were blended together at ratio of 15% dry to 85% liquid milk replacer (16% CP and 18% crude
fat), referred to as milk. Milk was delivered to the calves by a hose and metered into an
individualized trough which provided a separate feeding area for each calf in the pen. Once the
milk was fed, calves were allowed 15 min to eat the dry-grain mixture (12% CP and 4% fiber) in
the same trough before water was added to the trough. During the experiment, calf health was
monitored daily by trained, experienced personnel and appropriate medical treatment was
provided when needed. The percentage of calves which were treated with antibiotics throughout
the experiment was 62.5, 66.7, and 61.5 for groups of 2, 4, and 8, respectively.
Behavioral Observations
at Serials Unit on September 13, 2013www.journalofanimalscience.orgDownloaded from

7
Behavior was recorded by video cameras (CB-HD39N-L; Nuvico Corp., Englewood, NJ)
between 0700 to 1900 h. One camera was able to record behavior in 1 to 3 pens; so, there were
10 cameras in each room. Output from the cameras was recorded with Easy Net (DVRED-
U1600; Nuvico Corp.) and Geovision (USA Vision Systems, Inc., Irvine, CA) digital video
recorders. Continuous observations were conducted by a single observer using an automated
behavior recording program (Observer XT, Version 5; Noldus Information Technology,
Wageningen, Netherlands). Observations were carried out using 2 sampling methods;
instantaneous scan-sampling every 5 min within 30-min observation sessions from 0700 to 1900
h during the 1st, 2nd, 3th, 4th, and 5th mo of the experiment to determine daily time budgets of
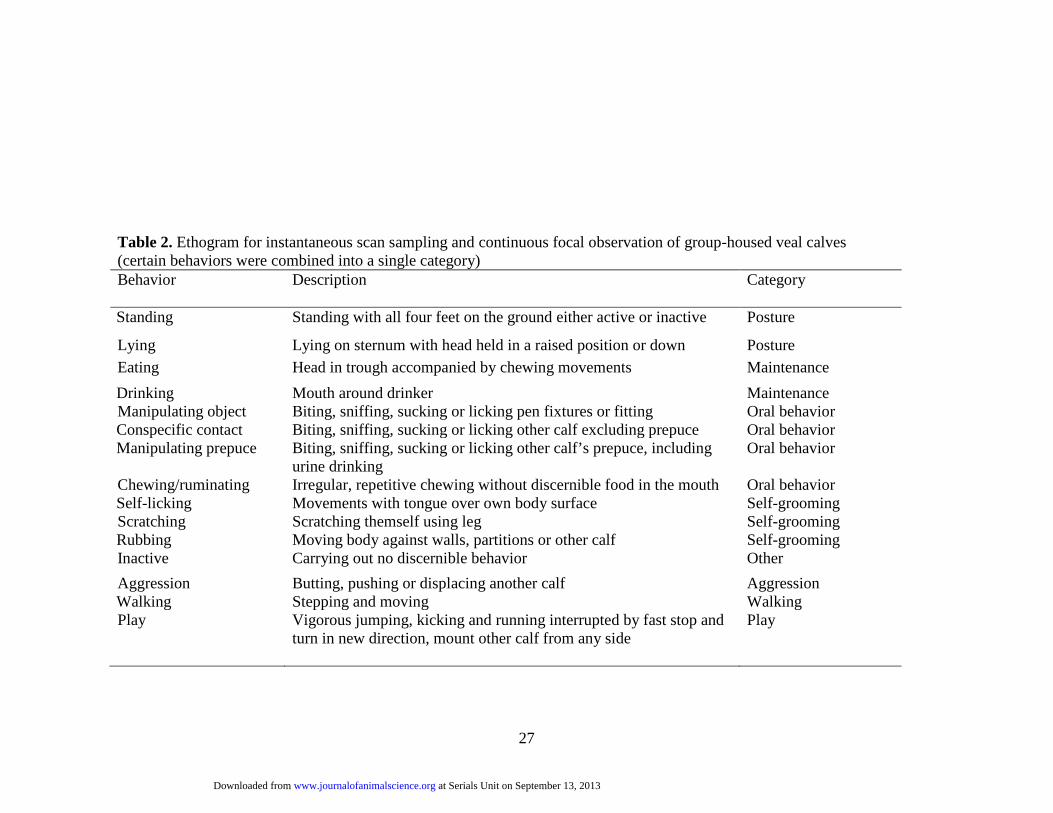
calves using a complete ethogram (Table 2). The percentage of calves involved in maintenance,
activity, oral, and postural behaviors within the pen was calculated by dividing the number of
calves in the act of the behavior within each 30-min observation session by the total number of
calves in the group, and data are presented as the mean percentage of calves performing each
behavior within the day of observation. Day of observation was divided into 4 time periods
(0700 to 0900, 0900 to 1300, 1300 to 1700, and 1700 to 1900 referred to as periods 1, 2, 3, and
4, respectively), and these times were selected to include a time immediately after morning
feeding, a time of inactivity after feeding, and a time of increased activities before and during
evening feeding. Certain behaviors were combined to create behavior categories for posture,
maintenance, oral, self-grooming, aggressive, walking, play, and other behaviors. The second
method of recording behavior was by continuous focal sampling; on d 0, 1, 5, 14, 42, and 70
relative to day of group formation, one randomly selected calf from each pen was observed
continuously around feeding time (30-min intervals before, during, and after feeding). Calves
were observed during the evening feeding time from 1700 to 1900 h. Continuous behavior
at Serials Unit on September 13, 2013www.journalofanimalscience.orgDownloaded from
8
recordings focused on all instances of oral and aggressive behaviors to determine number of
bouts, average bout length, and total time spent engaged in these behaviors (Webb et al., 2012).
Growth Performance and Health Status
Body weights were obtained at the day of grouping (initial BW) and when calves moved out
of the facility for slaughter at 157 ± 3 d of age (final BW), and ADG was calculated at the end of
the experiment. Two mid-weight calves (based on visual body condition) from the 4- and 8-calf
treatment groups were selected to represent the pen throughout the experiment. Hip height and
heart girth were measured on these calf pairs monthly during the 5-mo experiment. Hip height
was measured as the distance from the floor beneath the calf to the top of the hip by using a
measuring stick, whereas heart girth was measured as the minimal circumference around the
body immediately behind the front shoulder using measuring tapes for the same selected calves
(Wilson et al, 1997).
Health scores were evaluated by using the University of Wisconsin calf health scoring chart.
Fecal scores of calves were evaluated using a 3-point scale (1 = firm/dry; 2 = creamy; and 3 =
loose/wet; Cozzi et al., 2002). A visual observation of calves’ feces consistency was carried out
once a month for 4 mo and used as an indicator of gastrointestinal diseases. Ear (0 = normal; 1 =
ear flick or head shake; and 2 = slight unilateral droop), eye (0 = normal; 1 = small amount of
ocular discharge; and 2 = moderate amount of bilateral discharge), cough (0 = none; 1 = induce
single cough; and 2 = induced repeated coughs or occasional spontaneous coughing), and nasal
discharge scores (0 = normal serous discharge; 1 = small amount of unilateral, cloudy discharge;
and 2 = bilateral cloudy or excessive mucus discharge) were visually evaluated on all calves in
the whole group every month for 4 mo.
at Serials Unit on September 13, 2013www.journalofanimalscience.orgDownloaded from

9
Plasma Cortisol Assay
Blood samples (10-mL EDTA vacuum tube, Tyco Healthcare Group, Mansfield, MA) of 2
randomly selected calves from each pen were collected at 1000 h by jugular venipuncture on the
day calves were moved into their assigned treatment groups, and then monthly for 4 mo at the
same time of day. The samples were centrifuged at 1,000 × g for 10 min at room temperature,
and plasma was harvested into 0.5-mL microcentrifuge tubes and stored at -20ºC until analyzed.
Plasma cortisol concentrations were determined using a previously-validated (Burdick et al.,
2011), commercially-available ELISA according to the manufacturer’s directions (Arbor Assays,
Ann Arbor, MI). The inter- and intra-assay CV were 6.1% and 11.8%, respectively, and assay
sensitivity was 17.3 pg/mL (results are presented as ng/mL).
Statistical Analysis
A randomized complete block design with repeated measures was adopted for the
experiment. Distributions of responses in the study were tested for normality with PROC
UNIVARIATE of SAS (version 9.2; SAS Inst., Inc., Cary, NC). All data were analyzed using the
mixed model procedure of SAS, with pen as the experimental unit and barn as a random effect.
For growth performance data (the mean of 2 calves/ pen), group size (2, 4, or 8 calves/pen) was
the lone fixed effect in the model. Using the means of 2 calves/pen, month of trial (1st, 2nd, 3rd,
4th, or 5th), and the 2-way interaction were the fixed effects in the ANOVA for growth indicators
(hip height and heart girth), health status scores (ocular and nasal discharges, cough, ears, and
fecal scores), and plasma cortisol concentration. Group size, month and observation period
within day, as well as all 2- and 3-way interactions were fixed effects in the model for behavior
data analysis, except for play and aggression. Least squares means were calculated (LSMEANS
at Serials Unit on September 13, 2013www.journalofanimalscience.orgDownloaded from
10
statement) and separated statistically (P ≤ 0.05) using the PDIFF option of SAS. Behavioral data
that were not normally distributed were transformed using log transformation prior to analysis,
and least squares means and SE were back-transformed for presentation of results in tabular
form. However, data which were not normally distributed even after transformation (play and
aggression) were analyzed using Chi-square testing (PROC FREQ of SAS) within each
observation month.
RESULTS
Behavioral Observation
Instantaneous, 5-min Scan Sampling. Analysis of 12-h scan sampling revealed that more (P
= 0.001) calves ate and drank in groups of 2 than calves in the groups of 4 or 8 (Table 3).
Furthermore, more (P < 0.001) calves ate and drank from 1700 to 1900 than during the other
periods. Similarly, more (P < 0.001) calves in pens of 2 were observed chewing and ruminating
than calves in groups of 4 or 8, and, as expected, calves chewed and ruminated more (P < 0.001)
between 0700 and 0900 than in other time periods. In addition, more (P = 0.012) calves were
observed chewing and ruminating during the 3rd and 4th mo than during the first 2 mo. Pens with
only 2 calves manipulated objects more (P < 0.05) throughout the day than calves in the groups
of 4 or 8 during the 3rd observation month, whereas calves in groups of 2 and 4 manipulated
objects more (P < 0.05) than calves in groups of 8 during the 4th mo of the experiment (treatment
× month, P = 0.029). Moreover, calves manipulated objects more (P < 0.001) from 1700 to 1900
than in other time periods.
More (P < 0.001) calves in groups of 4 and 8 participated in conspecific contact than
calves in groups of 2 (Table 3). However, conspecific contact was often observed around feeding
at Serials Unit on September 13, 2013www.journalofanimalscience.orgDownloaded from

11
time (from 1700 to 1900; P = 0.01), in particular licking and sucking on the areas of face and
ears. More calves in groups of 8 were inactive (P < 0.001) compared to calves in groups of 2 or
4, whereas calves were more (P = 0.001) active in the 4th mo than in other months. In addition,
the greatest (P < 0.001) proportion of inactivity was in period 3 (1300 to 1700), and the lowest
(P < 0.001) percentage of inactivity was observed in period 4 (1700 to 1900). More (P < 0.001)
calves in groups of 2 were observed self-grooming than calves in groups of 4 and 8, but period of
day did not (P = 0.241) affect self-grooming.
Prepuce sucking occurrences were rare and typically short in duration and not subjected
to statistical analysis. Chi-square analysis of play and aggressive behaviors throughout the day
for each observation month revealed that group size had no effect on play and aggressive (P =
0.11, Table 4) behaviors. However, in the 3rd mo of the experiment, calves in groups of 4 tended
(P = 0.06, Figure 1) to play more than calves in groups of 2 and 8.
More (P = 0.001) calves in groups of 4 and 8 stood throughout the day compared to
calves in groups of 2 (Table 3). Calves stood the most (P = 0.001) during period 4 (1700 to
1900) than during any other observation period. Calves housed in pens of 2 were observed lying
more (P < 0.05) in the 2nd mo than calves from groups of 4 or 8, whereas calves in groups of 2
and 4 lay more (P < 0.05) than calves in groups of 8 in mo 3 and 5 (treatment × month, P <
0.001;Table 3). Most calves were observed lying in period 3, and the fewest (P < 0.001) calves
were observed lying in period 4. In the 4th and 5th mo, calves housed in groups of 4 and 8 walked
more (P < 0.05) than calves from groups of 2 (treatment × month, P = 0.003). Moreover, calves
walked more (P = 0.001) from 0700 to 0900 and 1700 to 1900 than between 0900 and 1700.
Continuous Focal Observations.
at Serials Unit on September 13, 2013www.journalofanimalscience.orgDownloaded from

12
Frequency. Group size had no (P ≥ 0.09) effect on frequency of eating and drinking,
chewing and ruminating, manipulation of objects, conspecific contact, and aggression (Table 5).
The most common aggression encounter subjectively observed during feeding time was
displacement from the feeding trough to gain access to milk or solid feed, whereas butting and
mounting were rarely seen.
Total duration. Continuous observations around feeding time revealed that the total duration
of eating and drinking, chewing, objects manipulation, conspecific contact, and aggression were
similar (P > 0.05) among treatments (Table 5). Even though more (P = 0.01) aggression occurred
at the feed trough on d 1, 14, and 70 than on d 5 and 42, observation day had no (P ≥ 0.10) effect
on durations of eating and drinking, chewing, rumination, or conspecific contact.
Bout duration. Group size had no (P ≥ 0.11) effect on bout duration of eating and drinking,
chewing and ruminating, objects manipulation, and aggressive behaviors during feeding times
(Table 5). Conversely, calves in groups of 2 had greater (P = 0.01) bout duration of conspecific
contact than calves in groups of 4 and 8, and bout duration of aggression was greater (P ˂ 0.01)
on d 1, 14, and 70 than d 5 and 42 of behavior observation.
Growth Performance
Throughout the 5-mo study, no (P ≥ 0.50) differences among group sizes were found
regarding initial and final BW, BW gain, and ADG (Table 6). As expected, hip height and heart
girth increased (P = 0.001) as calf age increased; however, neither hip height (P = 0.38) nor heart
girth (P = 0.82) were affected by the number of calves in a pen.
Health Status
at Serials Unit on September 13, 2013www.journalofanimalscience.orgDownloaded from

13
There were no (P = 0.15) differences among group sizes regarding the incidence of diarrhea,
but fecal scores were greater (P < 0.001) during the 3rd month than during mo 1, 2, or 4 (Table
7). In the 1st month of the trial, calves in groups of 8 coughed more (P < 0.05) than calves in
groups of 2 and coughed more than calves in groups of 4 and 2 during the 2nd month (treatment ×
month, P = 0.03) in response to an induced cough. In addition, nasal discharge scores were
similar (P > 0.05) among group sizes during mo 1, 2, and 3, but calves in groups of 2 and 4 had
more (P < 0.05) nasal discharge than calves in groups of 8 in the 4th month (treatment × month, P
= 0.02). Ocular discharge and ears scores did not (P ≥ 0.06) differ among group sizes; however,
calves had more ocular discharge (P = 0.003) and drooped ears (P = 0.04) in mo 1 than mo 2, 3,
and 4.
Cortisol Concentrations
Plasma cortisol concentration were similar (P = 0.37, data not shown) among calves in
groups of 2, 4, and 8; however, calves had greater (P = 0.03) cortisol levels during mo 3, 4, and 5
(15.5 ± 5.7, 18.4 ± 5.5, and 20.3 ± 5.3 ng/mL, respectively) than the first 2 mo of the experiment
(10.8 ± 5.8, and 10.8 ± 5.8 ng/mL for mo 1 and 2, respectively).
DISCUSSION
This is the first study to investigate the effect of number of veal calves/group with equal
space/calf and equal age on behavioral, productive, and physiological indicators of well-being
during the entire finishing period. Previous studies have tested the effect of regrouping or group
size in different spaces. Housing veal calves in large groups while maintaining calf floor space
allowance offers more total space and increases options for calves to select their preferred areas
in the pen. However, there are increased concerns about housing veal calves in large groups;
at Serials Unit on September 13, 2013www.journalofanimalscience.orgDownloaded from

14
thus, integrating physiological, behavioral, hematological, and productive indicators form the
best basis for assessing the impact of increasing group size on the welfare of veal calves (Rushen
and de Passillé, 1992).
Effect of Group Size on Behavior
Maintenance Behaviors. In the current study, group size affected eating and drinking
behavior, but did not affect growth performance of calves. Fewer percentages of calves eating
and drinking throughout the day in the groups of 4 and, especially, 8 may be caused by the
increased social interaction among calves in these groups, which could have increased the speed
of diet consumption, thereby reducing eating and drinking behavior in comparison to calves in
groups of 2. Jensen and Budde (2006) showed that calves housed in groups of 6 ingested milk
faster than calves housed in groups of 2. Furthermore, the greatest percentage of calves observed
eating and drinking were in groups of 2 and is likely attributed to increased number of visits to
feeder by these calves throughout the day. De Paula et al. (2010) found that paired calves spent
more time at the feeder, visited the feeder more often, and started ingesting concentrate more
rapidly than did individually housed calves. Conversely, the frequency, total duration, and bout
duration of eating and drinking behavior during the feeding time were similar among group sizes
in the present study, which corresponds to growth performance. The greatest periods of chewing
and rumination were observed after morning feeding, when most calves, regardless of group size,
were lying and engaged in rumination. Calves spent more time chewing and ruminating in
periods from 1000 to 1400 h, similar to Viessier et al. (1998), and the greatest percentage of
calves chewing and ruminating was observed during the last 3 mo of the present experiment,
indicating, as expected, that rumination increased with age.
at Serials Unit on September 13, 2013www.journalofanimalscience.orgDownloaded from

15
Oral behaviors. Group size changed how oral needs of veal calves were manifested, with
calves housed in groups of 2 having less social contact. So, oral behavior appeared to be directed
to either objects (greater objects manipulation) or to itself (greater self-grooming). Social
deprivation enhanced the non-nutritive oral activities in dairy calves (Veissier et al., 1997; Chua
et al., 2002). Furthermore, Veissier et al. (1998) mentioned that calves housed in individual stalls
spent more time licking the objects than those housed in groups of 4/pen. Bokkers and Koene
(2001) mentioned that the low level of social contact in dairy calves is an important factor in
directing oral behavior to objects. In the current study, oral behaviors were performed usually
around the feeding time and most object manipulation was seen close to feeding times. Bokkers
and Koene (2001) reported that most calves, regardless of group size, engaged in manipulation of
objects before and after milk feeding. Frequency, total duration, and bout duration of object
manipulation around feeding times were similar among group sizes, which is consistent with the
finding of Jensen and Budde (2006), who found that group size had no effect on time spent
licking fixtures around milk feeding time.
More calves interacted (conspecific contact) with each other socially in groups of 4 and 8
when compared with calves housed in groups of 2. These results were strongly supported by
previous research (Babu et al., 2004; Færevik et al., 2007), which concluded that group housing
affords calves an opportunity to interact with each other and perform normal social behavior.
Moreover, the period of greatest conspecific contact was observed directly after drinking milk,
when calves sucked and licked on areas around the mouth and ears in order to obtain remnants of
milk in those areas. Jensen and Budde (2006) did 30-min behavioral recording immediately after
milk feeding, and found that most cross-sucking was directed to the head and around the muzzle,
which was covered with milk. However, in the present study, bout duration of conspecific
at Serials Unit on September 13, 2013www.journalofanimalscience.orgDownloaded from
16
contact during feeding time was greatest for calves in groups of 2 than those in groups of 4 and
8, which may indicate that calves in groups of 2 had no disturbance from pen-mates.
In the present study, the percentage of calves performing prepuce sucking was low (mean
0.86). Only1 pen of 8 exhibited excessive prepuce sucking and only in the last month of the
experiment when they were treated with anti-sucking devices and excluded from behavior
observation during that month. The feeding regime used in this study (giving calves solid food
with an adjusted fiber concentration of 4% directly after milk feeding) may have contributed to
the low percentage of prepuce sucking. Several studies suggested that cross-sucking occurs less
frequently when calves have free access to food (Chua et al., 2002) and are given roughage or
food with high fiber content (Bøe and Havrevoll, 1993).
Aggressive Behavior. In agreement with Grasso et al. (1999), the insignificant amount of
aggressive interactions observed in this study may be attributed to use of instantaneous scan
sampling, which is considered to be insensitive to short-lasting behaviors, such as aggression in
calves. When continuous observations were used, the most common aggression encounter
observed subjectively during feeding time was displacement from the feeding trough. Frequency
of agression at the feed trough was not affected by treatment, which may be attributed to
allowing each calf an ample feeder space allowance by portioning the trough. Results of the
present study agree with those of Telezhenko et al. (2012), who found that number of
displacements at the feed bunk was not affected by group size (6 vs. 12 calves/group). Kundo et
al. (1989) reported that sufficient space was of greater importance than group size in order to
reduce the occurrence of agonistic behavior in calves. In the current study, the space allowance
of 1.82 m2 /calf for all groups exceeded the European Community’s minimum space allowance
recommendation (Council Directive 2008/119/EC; European Council, 2008), which resulted in
at Serials Unit on September 13, 2013www.journalofanimalscience.orgDownloaded from

17
similar degree of aggression among treatments. Greater aggression, as evidenced by greater total
and bout durations of aggression during feeding, was observed on d 1, 14, and 70 after grouping,
with no particular pattern. In contrast, Færevik et al. (2010) reported that the number of
displacements from the feed manger increased over time.
Play Behavior. Jensen and Kyhn (2000) noted that keeping calves in groups while
providing space above the minimum requirements of 1.5 m2 /calf afforded them a greater
opportunity to play, and play behavior may be a good indicator of well-being in veal calves. In
the current study, the similarity in occurrence of play behavior in all treatments may be attributed
to similarity in space allowance (1.82 m2 /calf).
Inactivity. More calves in groups of 8 were inactive than calves in groups of 2 or 4 which
could be a result of displaced calves waiting for access to the feed (Færevik et al., 2007).
However, the greatest period of inactivity was from 1300 to 1700 h, where most calves showed a
typical afternoon lying bout, whereas most activity was from 1700 to 1900 h, which
corresponded with feeding time. Calves spent 38% of their day inactive and the most inactive
period occurred between milk meals (Veissier et al., 1998).
Posture. Calves in the groups of 4 and 8 stood more when compared with calves in groups of
2, which may be attributed to available free space in these groups which gives an opportunity for
calves to stand and walk more. Although calves in the present study had the same space
allowance, there was greater usable space as group size increased. Space allowance seems to be
an important factor for expression of all types of postures. Veissier et al. (1997) found that calves
moved more easily when they were housed together in a pen than when they were housed in
individual stalls because they can walk together around the pen and lie down close to other
at Serials Unit on September 13, 2013www.journalofanimalscience.orgDownloaded from

18
calves leaving space for others to remain standing. In addition, most standing behavior was
observed around the time of feeding, which includes standing while engaged in eating and
drinking.
On the other hand, the reduced lying behavior in groups of 8 and 4 could be attributed to
greater social interaction between calves and disturbance from pen-mates, which prevent lying in
those groups. Færevik et al. (2007) concluded that time spent lying decreased with increasing
group size. In addition, most lying behavior occurred from 1300 to 1700 h, which was typical of
afternoon lying bouts between morning and evening feeding times. Babu et al. (2004) noted that
calves ruminated more while lying than standing, and most rumination occurred during the post-
milk feeding period.
Walking. Calves housed in groups of 8 and 4 walked more than calves housed in small
groups of 2, suggesting that increased group size was accompanied with increased locomotion.
The increased locomotion in larger groups may be attributed to the higher social interaction
which force calves to move away to escape competitors (Færevik et al., 2007), moving away to
avoid prepuce sucking and aggression between calves (Bøe and Færevik, 2003), or may be
attributed to increased usable space in pens of these groups (Chua et al. 2002). Telezhenko et al.
(2012) found that group size had no effect on movement of cows. They concluded that pen size
may be more important than density or group size because group-housed dairy cows were able to
share the space in the pen, and even with the same number of cows/m2, larger pens provided
more free space for cows to move about. More walking was observed at the time of feeding from
0700 to 0900 h and 1700 to 1900 h which corresponded to greater activity in these periods
(Bokkers and Koene, 2001; Webb et al., 2012).
at Serials Unit on September 13, 2013www.journalofanimalscience.orgDownloaded from

19
Effect of Group Size on Growth Performance
Veal producers are concerned that group housing of calves will affect performance and,
consequently, their profits. In the current study, grouping of calves had no adverse effect on
growth performance of veal calves. These results are in agreement with Fæverik et al. (2007) and
De Paula Vieira et al. (2010), who reported similar growth performance among different group
sizes, but contradict previous studies that reported increased weight gains for group-housed
calves (Chua et al., 2002; Xicatto et al., 2002; Tapki, 2007). These conflicting results may be
attributed to differences in the focus of the investigation. Proper management of the housing
system, like feeding, ventilation, cleanliness, and calves’ immunity, may play more important
roles in growth and performance of calves than group size.
Effect of Group Size on Health Status
Greater coughing observed in groups of 4 and 8 during the first 2 mo after grouping may be
a response to the close physical contact between many calves and increased social contacts in
large groups which increased susceptibility to infection; however, visual observation is not a
definitive measure of the health status of calves. Detecting sick calves and treating them are
more difficult in large groups. The risk of respiratory disease was 2.8 times greater in calves
housed in large groups than in individual pens (Svensson et al., 2003). Results of the current
experiment demonstrate that group housing of young calves in groups up to 8 calves/pen does
not inevitably lead to increased health problems. The incidence of diarrhea was similar among
treatments, which agrees with results of Svensson and Liberg (2006), who found no difference in
diarrhea between calves kept in the small- vs. large-sized groups.
Effect of Group Size on Plasma Cortisol Concentrations
at Serials Unit on September 13, 2013www.journalofanimalscience.orgDownloaded from

20
Group housing of veal calves may represent a source of chronic stress for the calf
(Veissier et al., 1998), and plasma cortisol levels have been used in cattle to detect activation of
the hypothalamo-pituitary-adrenocortical axis due to external stressors (Friend et al., 1987;
Munksgaard et al., 1999; Burdick et al., 2011). It was hypothesized that calves housed in larger
groups would have greater plasma cortisol levels, but results of the present study revealed that
group size did not alter circulating cortisol concentrations, which may be attributed to housing of
calves in the same space area per calf; yet, at the same time, calves housed in groups of 8 were
subjectively observed to be difficult to handle during data collection and blood sampling. This
may not be calf reactivity per se, but calves can escape more easily from the handler due to
increased floor space and increased interference because of the number of calves. Veissier et al.
(1998) observed no effect of group housing on circulating ACTH level in response to a
corticotrophin releasing factor challenges or on cortisol level during dexamethasone and ACTH
challenges. However, they found that calves housed in groups had greater basal cortisol
concentrations and those calves were more reactive to weighing than calves housed individually.
The increased plasma cortisol level with advancing age may be attributed to normal changes
associated with increased growth. Researchers (Stull and McMartin, 1992; Wilson et al., 1999)
have noted that cortisol concentrations increased over time during the production cycle of
Holstein veal calves.
CONCLUSIONS
When provided with the identical space allowances, the number of veal calves in a group did
not affect production and physiological indicators of welfare and had transient effects on health
during the finishing period. Housing of veal calves in groups of 4 and 8 after 6 wk of age had no
detrimental effects on growth and performance, and provided calves with a greater opportunity to
at Serials Unit on September 13, 2013www.journalofanimalscience.orgDownloaded from

21
interact socially and utilize available space when compared with calves housed in groups of 2.
However, calves housed in groups of 2 had the benefits of more eating and drinking, self-
grooming, and lying behaviors, and less inactive periods.
LITERATURE CITED
American Veal Association. 2007. Group housing of veal calves. Animal Care. Housing.
http://www.vealfarm.com/housing.aspx.
Babu, L.K., H.N. Pandy, and A. Sahoo. 2004. Effect of individual versus group rearing on
ethological and physiological responses of crossbred calves. Appl. Anim. Behav. Sci. 87:
177-191.
Bøe, K. E., and G. Færevik. 2003. Grouping and social preferences in calves, heifers and cows.
Appl. Anim. Behav. Sci. 80:175-190.
Bøe, K., Havrevoll, Ø., 1993. Cold housing and computer-controlled milk feeding for dairy
calves: behavior and performance. Anim. Prod. 57:183-191.
Bokkers, E. A. M., and P. Koene. 2001. Activity, oral behavior and slaughter data as welfare
indicators in veal calves: a comparison of three housing systems. Appl. Anim. Behav.
Sci. 75:1-15.
Burdick, N. C., B. C. Bernhard, J. A. Carroll, R. J. Rathmann, and B. J. Johnson. 2011.
Enhancement of the acute phase response to a lipopolysaccharide challenge in steers
supplemented with chromium. Innate Immunol. 18:592-601.
Chua, B., J. van Delen Coenen, and D.M. Weary. 2002. Effects of pair verses individual housing
on the behavior and performance of dairy calves. J. Dairy Sci. 85:3360-3364.
at Serials Unit on September 13, 2013www.journalofanimalscience.orgDownloaded from
22
Cozzi, G., F.Gottardo, S. Mattiello, E. Canali, E. Scanziani, M. Verga, and I. Andrighetto. 2002.
The provision of solid feeds to veal calves: I. Growth performance, forestomach
development, and carcass and meat quality. J. Anim. Sci. 80:357-366.
de Passillé, A. M. B. 2001. Sucking motivation and related problems in calves. Appl. Anim.
Behav. Sci. 72:175-186.
De Paula Vieira A., M. A. G. von Keyserlingk, and D. M. Weary. 2010. Effects of pair versus
single housing on performance and behavior of dairy calves before and after weaning
from milk. J. Dairy Sci. 93:3079-3085.
European Council. 2008. Council Directive 2008/119/EC. Laying down minimum standards for
the protection of calves (codified version). Off. J. Eur. Union, Jan. 15, 2009, No. L 010.
Færevik, G. I., L. Andersen, M. B. Jensen, and K. E. Bøe. 2007. Increased group size reduces
conflicts and strengthens the preference for familiar group mates after regrouping of
weaned dairy calves (Bos Taurus). Appl. Anim. Behav. Sci. 108:215-228.
Færevik, G., M. B. Jensen, and K. E. Bøe. 2010. The effect of group composition and age on
social behavior and competition in groups of weaned dairy calves. J. Dairy Sci. 93:4274-
4279.
Friend, T. H., G. R. Dellmeier, and E. E. Gbur. 1987. Effect of changing housing on physiology
of calves. J. Dairy Sci. 70:1595-1600.
Grasso, F., N. Fabio, D. R. Giueppe, Q. Teresa, S. Luigi, and B. Aldo. 1999. Effect of pen size
on behavioral, endocrine, and immune responses of Water Buffalo (Babalus bubalis)
calves. J. Anim. Sci.77:2039-2046.
Guide for the Care and Use of Agriculture Animals in Research and Teaching. 2010. 3rd ed.
Federation of Animal Science Societies, Champaign, IL.
at Serials Unit on September 13, 2013www.journalofanimalscience.orgDownloaded from

23
Jensen, M. B. 2003. The effects of feeding method, milk allowance and social factors on milk
feeding behavior and cross-sucking in group housed dairy calves. Appl. Anim. Behav.
Sci. 80:191-206.
Jensen, M. B., and M. Budde. 2006. The effects of milk feeding method and Group size on
feeding behavior and cross-sucking in group-housed dairy caves. J. Dairy Sci. 89:4778-
4783.
Jensen, M.B., and R. Kyhn. 2000. Play behavior in group-housed dairy calves, the effect of space
allowance. Appl. Anim. Behav. Sci. 67:35-46.
Jensen, M.B., K. S. Vestergaard, and C.C. Krohn. 1998. Play behavior in dairy calves kept in
pens: The effect of social contact and space allowance. Appl. Anim. Behav. Sci. 56:97-
108.
Kundo, S., J. Sekine, M. Okubo, and Y. Asahida. 1989. The effect of group size and space
allowance on agonistic and spacing behavior of cattle. Appl. Anim. Behav. Sci. 24:127-
135.
Munksgaard, L., K. L. Ingvartsen, L. J. Pedersen, and V. K. M. Nielsen. 1999. Deprivation of
lying down affects behavior and pituitary-adrenal axis responses in young bulls. Acta
Agric. Scand. Sect. A. Anim. Sci. 49:172-178.
Prevedello, P., M. Brscic, E. Schiavon, G. Cozzi, and F. Gottardo. 2012. Effects of the provision
of large amounts of solid feeds to veal calves on growth and slaughter performance and
intravitam and postmortem welfare indicators. J. Anim. Sci. 90:3538-3546.
Rushen, J., and A.M.B. de Passillé. 1992. The scientific assessment of the impact of housing on
animal welfare: a critical review. Can. J.Anim. Sci. 72:721-743.
Schwartz, A. 1990. The politics of formula-fed veal calf production. JAVMA. 196:1578-1586.
at Serials Unit on September 13, 2013www.journalofanimalscience.orgDownloaded from
24
Stull, C. L., and D. A. McMartin. 1992. Welfare parameters in veal calf production facilities.
Special Report. P 23. Coop. Ext., School of Vet. Med., Univ. of California, Davis.
Stull, C., and J. Reynolds. 2008. Calf welfare. Vet. Clin. Food Anim. 24:191-203.
Svensson, C., and P. Liberg. 2006. The effect of group size on health and growth rate of Swedish
dairy calves housed in pens with automatic milk-feeders. Prev. Vet. Med. 73:43-53.
Svensson, C., K. Lundborg, U. Emanuelson, and S.O. Olsson. 2003. Morbidity in Swedish dairy
calves from birth to 90 d of age and individual calf-level risk factors for infectious
diseases. Prev. Vet. Med. 58:179-197.
Tapki, I. 2007. Effects of individual or combined housing systems on behavioral and growth
responses of dairy calves. Acta Agric. Scand. 57:55-60.
Telezhenko, E., M. A. G. von Keyserlingk, A. Talebi, and D. M. Weary. 2012. Effect of pen
size, group size, and stocking density on activity in freestall-housed dairy cows. J. Dairy
Sci. 95:3064-3069.
Veissier, I., P. Chazal, P. Pradel, and P. le Neindre. 1997. Providing social contacts and objects
for nibbling moderates reactivity and oral behaviors in veal calves. J. Anim. Sci. 75:356-
365.
Veissier, I., A. R. Ramirez de la Fe, P. Pradel. 1998. Nonnutritive oral activities and stress
responses of veal calves in relation to feeding and housing conditions. Appl. Anim.
Behav. Sci. 57:35-49.
Webb, L.E., E.A.M. Bokkers, Bas Engel, W.J.J. Gerrits, Harma Berends, and C.G. van Reenen.
2012. Behavior and welfare of veal calves fed different amounts of solid feed
at Serials Unit on September 13, 2013www.journalofanimalscience.orgDownloaded from

25
supplemented to a milk replacer ration adjusted for similar growth. Appl. Anim. Behav.
Sci. 136:108-116.
Wilson, L. L., C. L. Egan, and T. L. Terosky. 1997. Body measurements and body weights of
special-fed Holstein Veal Calves. J. Dairy Sci. 80:3077-3082.
Wilson, L. L., T. L. Terosky, C. L. Stull, and W. R. Stricklin. 1999. Effects of individual housing
design and size on behavior and stress indicators of special-fed Holstein veal calves. J.
Anim. Sci. 77:1341-1347.
Xicatto, G., A. Trocino, P. I. Queaque, A. Sartori, and A. Carazzolo. 2002. Rearing veal calves
with respect to animal welfare: effects of group housing and solid feed supplementation
on growth, performance and meat quality. Livest. Prod. Sci. 75:269-274.
at Serials Unit on September 13, 2013www.journalofanimalscience.orgDownloaded from

26
Table 1. Least-squares means (± SE) of various hematological measures in veal calves as affected by group-housing size and calf age Group size, calves/pen Calf age, d1 P- value2
Measures 2 4 8 41 to 43 85 - 97 GS d GS × d Total white blood cell count, 106 cell/mL
8.7 ± 1.2 7.7 ± 1.1 9.0 ± 1.2 8.4 ± 1.1 8.4 ± 1.1 0.142 0.993 0.814
Total red blood cell count, 106 cell/mL
9.6 ± 0.4 9.5 ± 0.4 9.3 ± 0.4 9.6 ± 0.4 9.4 ± 0.41 0.266 0.266 0.941
Hemoglobin, g/dL 9.7 ± 0.2 9.2 ± 0.2 8.9 ± 0.2 9.6 ± 0.1 8.9 ± 0.2 0.019 0.008 0.460
Packed cell volume, % 28.3 ± 0.6 26.9 ± 0.7 26.0 ± 0.6 28.3 ± 0.4 25.8 ± 0.6 0.034
0.001 0.417
1Blood samples were collected from all calves at the beginning of experiment (41 to 43 d of age) in order to detect initial health status
(calves with low blood hemoglobin and white blood cell counts were i.m. injected with either 5 or 10 cc of iron dextrin (FerroDex
1000, AgriLabs, St. Joseph, MO), and blood samples were collected from one calf/pen at the middle of the fattening period (85 to 97 d
of age).
2Probability values for the main effects of group size (GS) and calf age (d), and the interactive effect of GS × d.
at Serials Unit on September 13, 2013www.journalofanimalscience.orgDownloaded from
27
Table 2. Ethogram for instantaneous scan sampling and continuous focal observation of group-housed veal calves (certain behaviors were combined into a single category) Behavior Description
Category
Standing Standing with all four feet on the ground either active or inactive Posture
Lying Lying on sternum with head held in a raised position or down Posture Eating Head in trough accompanied by chewing movements Maintenance Drinking Mouth around drinker Maintenance Manipulating object Biting, sniffing, sucking or licking pen fixtures or fitting Oral behavior Conspecific contact Biting, sniffing, sucking or licking other calf excluding prepuce Oral behavior Manipulating prepuce Biting, sniffing, sucking or licking other calf’s prepuce, including
urine drinking Oral behavior
Chewing/ruminating Irregular, repetitive chewing without discernible food in the mouth Oral behavior Self-licking Movements with tongue over own body surface Self-grooming Scratching Scratching themself using leg Self-grooming Rubbing Moving body against walls, partitions or other calf Self-grooming Inactive Carrying out no discernible behavior Other Aggression Butting, pushing or displacing another calf Aggression Walking Stepping and moving Walking Play Vigorous jumping, kicking and running interrupted by fast stop and
turn in new direction, mount other calf from any side
Play
at Serials Unit on September 13, 2013www.journalofanimalscience.orgDownloaded from

28
Table 3. Percentage of veal calves performing each behavior1 as affected by group-housing size, observation month, and observation period
Main effect
3Eating & drinking2
Chewing & ruminating2
Object
manipulation2
Conspecific contact2
Inactivity3
Self-
grooming2
Standing
Lying2
Walking2
Group size (GS), calves/pen 2 9.5 ± 0.5a 12.3 ± 0.7a 38.6 ± 0.8a 4.7 ± 0.3b 51.7 ± 2.1b 9.0 ± 0.4a 40.2 ± 1.5b 48.6 ± 0.9a 1.1 ± 0.2c 4 6.2 ± 0.4b 7.1 ± 0.5b 26.3 ± 0.6b 8.4 ± 0.4a 52.8 ± 2.1b 5.1 ± 0.3b 43.1 ± 1.6a 42.0 ± 0.8b 1.2 ± 0.1b 8 4.1 ± 0.3c 5.5 ± 0.5c 21.5 ± 0.5c 7.9 ± 0.4a 57.9 ± 1.9a 2.8 ± 0.2c 43.1 ± 2.4a 41.5 ± 0.7c 1.4 ± 0.1a P-value < 0.001 < 0.001 < 0.001 <0.001 <0.001 <0.001 ˂0.001 <0.001 <0.001 Observation month (M) 1st mo 5.8 ± 0.3 6.7 ± 0.5b 30.3 ± 0.7 6.3 ± 0.3 56.4 ± 2.1a 4.8 ± 0.3 37.3 ± 1.9 48.1 ± 0.9 1.2 ± 0.2b
2nd mo 5.8 ± 0.4 7.1 ± 0.5b 28.6 ± 0.7 6.5 ± 0.2 57.3 ± 2.1a 4.9 ± 0.3 42.0 ± 1.6 41.4 ± 0.8 1.1 ± 0.2b
3rd mo 5.7 ± 0.4 8.5 ± 0.6a 26.2 ± 0.6 6.9 ± 0.3 55.3 ± 2.1a 4.7 ± 0.3 42.5 ± 1.6 43.9 ± 0.9 1.2 ± 0.2b
4th mo 6.8 ± 0.5 8.7 ± 0.6a 29.6 ± 0.9 7.1 ± 0.5 46.8 ± 2.6b 5.5 ± 0.3 43.1 ± 2.4 42.8 ± 1.1 1.4 ± 0.1a
5th mo 6.7 ± 0.4 8.2 ± 0.5ab 25.5 ± 0.6 7.2 ± 0.4 55.0 ± 2.0a 5.3 ± 0.3 43.1 ± 1.6 43.7 ± 0.8 1.4 ± 0.1a
P-value 0.17 0.01 0.09 0.49 <0.001 0.13 0.19 0.25 <0.001 Observation period (O) 0700 to 0900 6.7 ± 0.4b 9.5 ± 0.6a 21.9 ± 0.6c 6.4 ± 0.4b 56.8 ± 2.3b 5.2 ± 0.2 34.7 ± 2.3b 50.3 ± 1.1b 1.3 ± 0.2a 0900 to 1300 4.5 ± 0.3c 8.7 ± 0.6ab 26.6 ± 0.6b 6.7 ± 0.3b 57.7 ± 2.0b 5.1 ± 0.3 32.3 ± 1.2b 53.4 ± 0.9b 1.2 ± 0.1b 1300 to 1700 4.6 ± 0.1c 6.9 ± 0.5c 26.6 ± 0.6b 5.3 ± 0.3c 62.1 ± 1.9a 4.7 ± 0.3 30.5 ± 1.2b 56.6 ± 0.9a 1.2 ± 0.1b 1700 to 1900 10.2 ± 0.5a 6.6 ± 0.5c 39.3 ± 0.9a 9.3 ± 0.4a 40.1 ± 2.1c 5.1 ± 0.3 68.8 ± 1.7a 24.5 ± 0.6c 1.3 ± 0.1a P-value < 0.001 < 0.001 < 0.001 < 0.001 < 0.001 0.24 < 0.001 < 0.001 0.001 GS × M4 0.08 0.77 0.03 0.80 0.17 0.16 0.53 0.001 0.003 GS × P4 0.05 0.04 0.03 0.005 0.44 0.21 0.91 0.22 0.02 GS × M × P4 0.97 0.26 0.24 0.68 0.80 0.54 0.68 < 0.001 0.003
a-d Within a column and main effect, least-squares means (± SE) lacking a common superscript letter differ, P < 0.05. 1 Refer to Table 2 for description of each behavior. 2 Back transformation of log transformed least-squares means. 3 Least-squares means (± SE) of untransformed results. 4 P-values for 2- and 3-way interactions.
at Serials Unit on September 13, 2013www.journalofanimalscience.orgDownloaded from

29
Table 4. Percentage of veal calves performing aggressive behavior1 as affected by group-housing size, and observation month
Group size (GS), calves/pen P- value2
Observation month (M) 2 4 8 GS
1st mo 0.23 ± 0.40 0.25 ± 0.40 0.05 ± 0.37 0.23 2nd mo 0.00 ± 0.40 0.11 ± 0.40 0.04 ± 0.37 0.13 3rd mo 0.07 ± 0.41
0.15 ± 0.41 0.08 ± 0.39 0.59 4th mo 0.52 ± 0.54 0.83 ± 0.53 0.35 ± 0.46 0.10 5th mo 0.42 ± 0.39 0.05 ± 0.39 0.36 ± 0.38 0.70
1Refers to Table 2 for description of each behavior. 2Aggressive behavior was analyzed using Chi-square testing (PROC FREQ of SAS) for each observation month.
at Serials Unit on September 13, 2013www.journalofanimalscience.orgDownloaded from

30
Table 5. Behaviors1 observed at 30-min intervals before, during, and after feeding as affected by group-housing size and observation day after group formation Group size (GS), calves/pen Observation day (D) 2 4 8 0 1 5 14 42 70 Frequency, total numbers Eating & drinking 5 ± 0.3 6 ± 0.3 6 ± 0.3 4 ± 0.5 6 ± 0.4 6 ± 0.5 5 ± 0.5 6 ± 0.5 7 ± 0.5 Chewing & ruminating 1 ± 1.3 1 ± 0.8 1 ± 1.2 1 ± 1.0 1 ± 1.8 1 ± 2.7 1 ± 1.2 1 ± 1.2 1 ± 0.7
Object manipulation 10 ± 0.7 11 ±0.7 9 ± 0.6 10 ± 1.2 10 ± 0.8 11 ± 1.0 10 ± 0.9 9 ± 1.0 9 ± 0.9
Conspecific contact 7 ± 0.5 8 ± 0.5 7 ± 0.5 7 ± 0.9 8.1 ± 0.6 6 ± 0.7 7 ± 0.7 7 ± 0.7 7 ± 0.7 Aggression 2 ± 0.5 2 ± 0.3 2 ± 0.3 2 ± 0.9 2.0 ± 0.4 2 ± 0.5 2 ± 0.5 2 ± 0.7 2 ± 0.4 Total duration, s Eating & drinking 108 ± 9.8 136 ± 11.9 139 ± 12.1 81 ± 2.7 142 ± 13.9 146 ± 13.3 111± 11.7 189 ± 16.1 188 ± 18.4 Chewing & ruminating 4 ± 1.1 4 ± 1.1 3 ± 1.1 5 ± 1.4 3 ± 1.2 2 ± 1.4 4 ± 1.3 3 ± 1.1 7 ± 1.5
Object manipulation 171 ± 4.2 177 ± 4.4 162 ± 3.9 242 ± 9.5 181 ± 5.2 200 ± 6.7 151 ± 5.2 136 ± 4.8 132 ± 5.1
Conspecific contact 105 ± 2.9 94 ± 2.6 105 ± 2.8 128 ± 5.7 121 ± 3.7 97 ± 3.8 93 ± 3.6 80 ± 3.2 93 ± 3.8 Aggression 2 ± 2.0 4 ± 2.0 7 ± 2.4 2 ± 1.9b 8 ± 3.1a 2 ± 2.2b 8 ± 3.2a 2 ± 2.1b 7 ± 3.0a Bout duration, s Eating & drinking 19 ± 1.6 20 ± 1.7 22 ± 1.7 17 ± 1.6 22 ± 2.1 23 ± 2.8 18 ± 1.8 16 ± 1.5 26 ± 2.4 Chewing & ruminating 4 ± 0.7 3 ± 0.6 2 ± 0.7 3 ± 0.8 3 ± 0.8 2 ± 1.0 3 ± 0.8 3 ± 0.6 4 ± 0.8
Object manipulation 21 ± 1.8 18 ± 1.6 22 ± 1.8 26 ± 1.9 20 ± 2.2 20 ± 1.7 18 ± 2.3 20 ± 1.7 18 ± 1.9
Conspecific contact 20 ± 0.6a 13 ± 0.4b 16 ± 0.4b 19 ± 0.8 18 ± 0.5 16 ± 0.6 15 ± 0.5 14 ± 0.6 16 ± 0.6 Aggression 2 ± 1.8 2 ± 1.3 3 ± 1.2 2 ± 1.5b 4 ± 1.6a 1 ± 4.4b 4 ± 1.6a 1 ± 1.5b 3 ± 1.5a a,bWithin a row and main effect, least squares means (± SE) lacking a common superscript letter differ, P < 0.05.
1Refer to Table 2 for description of each behavior.
at Serials Unit on September 13, 2013www.journalofanimalscience.orgDownloaded from

31
1Probability values for the main effects of group size (GS) and observation month (M), and the interactive effect of GS × M.
Table 6. Growth Performance of veal calves as affected by group-housing size (2, 4, or 8 calves/pen) and observation month Group Size (GS), calves/pen P- value1
Items 2 4 8 GS M GS × M
Initial BW 65.3 ± 3.7 66.5 ± 3.7 67.6 ± 3.7 0.50 - -
Final BW 232.4 ± 15.7 241.4 ± 15.3 237.6 ± 15.3 0.50 - -
BW gain, kg 170.1 ± 13.2 177.8 ± 12.7 172.9 ± 15.7 0.60 - -
ADG, kg/d 1.08 ± 0.1 1.13 ± 0.1 1.10 ± 0.1 0.50 - -
Hip height change, cm 21.6 ± 0.8 23.3 ± 0.8 22.4 ± 0.8 0.38 0.001 0.35
Mo 1 95.3 ± 1.2 94.6 ± 1.2 95.1 ± 1.2 - - -
Mo 2 101.6 ± 1.2 101.4 ± 1.2 101.4 ± 1.2 - - -
Mo 3 105.5 ± 1.2 108.3 ± 1.2 107.3 ± 1.2 - - -
Mo 4 112.7 ± 1.2 111.5 ± 1.2 114.3 ± 1.2 - - -
Mo 5 117.1 ± 1.2 117.9 ± 1.2 117.6 ± 1.2 - - -
Heart girth change, cm 47.7 ± 5.3 48.2 ± 5.3 46.7 ± 5.3 0.82 0.001 0.78
Mo 1 103.1 ± 1.6 104.0 ± 1.6 104.1 ± 1.6 - - -
Mo 2 111.8 ± 1.6 113.1 ± 1.6 113.2 ± 1.6 - - -
Mo 3 120.8 ± 1.6 120.1 ± 1.6 123.4 ± 1.6 - - -
Mo 4 133.4 ± 1.6 135.4 ± 1.6 134.4 ± 1.6 - - -
Mo 5 148.3 ± 1.6 150.8 ± 1.6 149.3 ± 1.5 - - -
at Serials Unit on September 13, 2013www.journalofanimalscience.orgDownloaded from

32
Table 7. Health status indicators of veal calves as affected by group-housing size and observation month Group size (GS), calves/pen Observation month P-values
2 4 8 1st 2nd 3rd 4th GS M GS × M Ocular discharge1 0.1 ± 0.0 0.1 ± 0.0 0.1 ± 0.0 0.2 ± 0.0 0.1 ± 0.0 0.1 ± 0.0 0.2 ± 0.1 0.45 0.003 0.16
Nasal discharge2 0.3 ± 0.1 0.3 ± 0.1 0.2 ± 0.1 0.3 ± 0.1 0.2 ± 0.1 0.3 ± 0.1 0.4 ± 0.1 0.63 0.52 0.02
Cough3 0.2 ± 0.1 0.3 ± 0.1 0.4 ± 0.1 0.4 ± 0.2 0.3 ± 0.2 0.2 ± 0.2 0.2 ± 0.2 0.02 0.02 0.03
Ears orentation4 0.1 ± 0.0 0.0 ± 0.0 0.1 ± 0.0 0.2 ± 0.0 0.1 ± 0.0 0.0 ± 0.0 0.1 ± 0.0 0.06 0.04 0.39
Fecal score5 1.4 ± 0.0 1.2 ± 0.0 1.3 ± 0.0 1.2 ± 0.1 1.2 ± 0.1 1.6 ± 0.1 1.2 ± 0.1 0.15 < 0.001 0.20 abWithin a row and main effect, least squares means (± SE) lacking common superscript letters differ, P < 0.05. 10 = normal to 2 = moderate amount of bilateral discharge. 20 = normal serous discharge to 2 = bilateral cloudy to excessive mucus discharge. 30 = none to 2 = induced repeated coughs or occasional spontaneous coughing. 40 = normal to 2 = slight unilateral droop. 10 = firm/dry to 3 = loose/wet (Cozzi et al., 2002).
at Serials Unit on September 13, 2013www.journalofanimalscience.orgDownloaded from

33
Figure 1. The effect of group size within each month on the percentage of calves playing (P =
0.06 for mo 3). Play behavior was analyzed using chi-square testing (PROC FREQ of SAS)
within each observation month.
at Serials Unit on September 13, 2013www.journalofanimalscience.orgDownloaded from

34
Abdelfattah et al.
Figure 1.
at Serials Unit on September 13, 2013www.journalofanimalscience.orgDownloaded from