Effect of different technologies and animal manures on solid-liquid separation efficiencies
10
[Journal of Agricultural Engineering 2012; XLIII:e9] [page 55] Effect of different technologies and animal manures on solid-liquid separation efficiencies Giorgia Cocolo, 1 Silvia Curnis, 1 Maibritt Hjorth, 2 Giorgio Provolo 1 1 Department of Agricultural Engineering, University of Milano, Italy; 2 Department of Engineering, University of Aarhus, Tjele, Denmark Journal of Agricultural Engineering 2012; volume XLIII:e9 Abstract Solid-liquid separation is a widely used manure treatment option. However, little information is available to predict separator perform- ance in a specific operating condition. This study investigates the effect on the separation efficiency of animal species (cattle and swine), use of flocculants, and separator construction and operating characteristics (filtration, pressurised filtration, settling and centrifugation). Using data available from published experiments, we evaluated correlations of the separation efficiencies with the physical and chemical character- istics of the inlet slurries (dry matter, total nitrogen, ammoniacal nitro- gen, phosphorus and potassium). Dry matter concentration of the input manure was found to be the best parameter used to calculate and vali- date regression equations. Regressions for the operating conditions of 7 of the 14 subgroups evaluated were significant (P<0.05) for at least one parameter. Pressurised filtration seems to be the process best rep- resented by these regressions that can predict dry matter and nitrogen efficiency with relative root mean squared errors of less than 50%. However, they could only be used for some of the parameters and sepa- ration techniques. Therefore, it was not possible to use the available experimental data to define and validate empirical predictive models for all the conditions. Specific studies are needed to define more pre- cise and physically-based models. Introduction Globally, intensification of agricultural systems increases the environ- mental impact of food production, leading to large amounts of manure that are used in crop systems in excess of crop requirements (Petersen et al., 2007). These excesses may result in discharge and emission of pollutants, such as nitrogen (N) and phosphorus (P) compounds, to the environment. In order to face these environmental problems, many farmers need to find technologically and economically effective solutions (Balsari et al., 2006). Nowadays, there is a wide range of manure treatment processes that meet various requirements (Burton and Turner, 2003). Among these techniques, solid-liquid separation is one of the cheapest treat- ment options and is often feasible within the specific farming system (Burton, 2007). Solid-liquid treatment allows farmers to separate solids from slurry, producing two final products; a dry matter (DM)-rich and nutrient-rich fraction, and a liquid fraction that can both be managed separately. In particular, the nutrient- and DM-rich fraction could be more easily transported off farm or to fields far from the farmstead, reducing transportation costs (Møller et al., 2000; Bertora et al., 2008). Furthermore, solid-liquid separation can be followed by other manure treatments, such as anaerobic digestion, composting or N reduction (Zhang and Lei, 1998; Tilche et al., 1999; Møller et al., 2007; Brito et al., 2008). Two solid-liquid separation technologies could also be coupled in order to increase the efficiency of the treatment process, as demonstrat- ed by previous studies (Westerman and Bicudo, 2000; Chastain et al., 2001b; Converse and Karthikeyan, 2004; Balsari et al., 2006; Fangueiro et al., 2008a, 2008b and 2008c). Several separation devices have been designed to carry out the solid-liquid separation treatment by different processes. Hence, separation techniques can be classified according to their operation (Table 1) (Zhang and Westerman, 1997; Ford and Flemming, 2002; Hjorth et al., 2010). To more efficiently remove nutri- ents, which are in smaller particles, physical and mechanical separation can be performed with the addition of chemical additives, flocculants and/or coagulants (Vanotti et al., 2002). Several additive types have been studied in various experiments to coagulate manure, to flocculate it or to remove ortophosphorate (PO 4 3- ). These are iron (Fe), aluminium (Al) and calcium (Ca) salts, several types of polyacrylamides (PAM), and clay (Henriksen et al., 1998; Vanotti and Hunt, 1999; Vanotti et al., 2002; Westerman and Arogo Ogejo, 2005; Møller et al., 2007; Rico et al., 2007; Garcia et al., 2009; Hjorth et al., 2009). The performance of the different separation techniques mentioned above is often expressed by the sepa- ration efficiency. This could be expressed thorough the removal efficien- cy or the separation index (Burton, 2007; Hjorth et al., 2010). The removal efficiency (R) expresses efficiency in removing a specific com- pound (DM or nutrients) from slurry to the solid fraction: (Eq. 1) Correspondence: Giorgia Cocolo, Department of Agricultural Engineering, University of Milano, via Celoria 2, 20133 Milano, Italy. E-mail: [email protected] Key words: correlation, efficiency, manure, separation, treatment. Acknowledgements: supported by Progetto AGER, grant n. 2010-2220. Received for publication: 3 May 2012. Accepted for publication: 3 August 2012. ©Copyright G. Cocolo et al., 2012 Licensee PAGEPress, Italy Journal of Agricultural Engineering 2012; XLIII:e9 doi:10.4081/jae.2012.e9 This article is distributed under the terms of the Creative Commons Attribution Noncommercial License (by-nc 3.0) which permits any noncom- mercial use, distribution, and reproduction in any medium, provided the orig- inal author(s) and source are credited. Non-commercial use only
-
Upload
independent -
Category
Documents
-
view
0 -
download
0
Transcript of Effect of different technologies and animal manures on solid-liquid separation efficiencies
[Journal of Agricultural Engineering 2012; XLIII:e9] [page 55]
Effect of different technologies and animal manures on solid-liquid separation efficienciesGiorgia Cocolo,1 Silvia Curnis,1 Maibritt Hjorth,2 Giorgio Provolo11Department of Agricultural Engineering, University of Milano, Italy; 2Department of Engineering,University of Aarhus, Tjele, Denmark
Journal of Agricultural Engineering 2012; volume XLIII:e9
Abstract
Solid-liquid separation is a widely used manure treatment option.However, little information is available to predict separator perform-ance in a specific operating condition. This study investigates the effecton the separation efficiency of animal species (cattle and swine), useof flocculants, and separator construction and operating characteristics(filtration, pressurised filtration, settling and centrifugation). Usingdata available from published experiments, we evaluated correlationsof the separation efficiencies with the physical and chemical character-istics of the inlet slurries (dry matter, total nitrogen, ammoniacal nitro-gen, phosphorus and potassium). Dry matter concentration of the inputmanure was found to be the best parameter used to calculate and vali-date regression equations. Regres sions for the operating conditions of7 of the 14 subgroups evaluated were significant (P<0.05) for at leastone parameter. Pressurised filtration seems to be the process best rep-resented by these regressions that can predict dry matter and nitrogenefficiency with relative root mean squared errors of less than 50%.However, they could only be used for some of the parameters and sepa-ration techniques. Therefore, it was not possible to use the availableexperimental data to define and validate empirical predictive modelsfor all the conditions. Specific studies are needed to define more pre-cise and physically-based models.
Introduction
Globally, intensification of agricultural systems increases the environ-mental impact of food production, leading to large amounts of manurethat are used in crop systems in excess of crop requirements (Petersenet al., 2007). These excesses may result in discharge and emission ofpollutants, such as nitrogen (N) and phosphorus (P) compounds, to theenvironment.
In order to face these environmental problems, many farmers need tofind technologically and economically effective solutions (Balsari et al.,2006). Nowadays, there is a wide range of manure treatment processesthat meet various requirements (Burton and Turner, 2003). Amongthese techniques, solid-liquid separation is one of the cheapest treat-ment options and is often feasible within the specific farming system(Burton, 2007). Solid-liquid treatment allows farmers to separate solidsfrom slurry, producing two final products; a dry matter (DM)-rich andnutrient-rich fraction, and a liquid fraction that can both be managedseparately. In particular, the nutrient- and DM-rich fraction could bemore easily transported off farm or to fields far from the farmstead,reducing transportation costs (Møller et al., 2000; Bertora et al., 2008).Furthermore, solid-liquid separation can be followed by other manuretreatments, such as anaerobic digestion, composting or N reduction(Zhang and Lei, 1998; Tilche et al., 1999; Møller et al., 2007; Brito et al.,2008). Two solid-liquid separation technologies could also be coupled inorder to increase the efficiency of the treatment process, as demonstrat-ed by previous studies (Westerman and Bicudo, 2000; Chastain et al.,2001b; Converse and Karthikeyan, 2004; Balsari et al., 2006; Fangueiroet al., 2008a, 2008b and 2008c). Several separation devices have beendesigned to carry out the solid-liquid separation treatment by differentprocesses. Hence, separation techniques can be classified according totheir operation (Table 1) (Zhang and Westerman, 1997; Ford andFlemming, 2002; Hjorth et al., 2010). To more efficiently remove nutri-ents, which are in smaller particles, physical and mechanical separationcan be performed with the addition of chemical additives, flocculantsand/or coagulants (Vanotti et al., 2002). Several additive types have beenstudied in various experiments to coagulate manure, to flocculate it orto remove ortophosphorate (PO4
3-). These are iron (Fe), aluminium (Al)and calcium (Ca) salts, several types of polyacrylamides (PAM), and clay(Henriksen et al., 1998; Vanotti and Hunt, 1999; Vanotti et al., 2002;Westerman and Arogo Ogejo, 2005; Møller et al., 2007; Rico et al., 2007;Garcia et al., 2009; Hjorth et al., 2009). The performance of the differentseparation techniques mentioned above is often expressed by the sepa-ration efficiency. This could be expressed thorough the removal efficien-cy or the separation index (Burton, 2007; Hjorth et al., 2010). Theremoval efficiency (R) expresses efficiency in removing a specific com-pound (DM or nutrients) from slurry to the solid fraction:
(Eq. 1)
Correspondence: Giorgia Cocolo, Department of Agricultural Engineering,University of Milano, via Celoria 2, 20133 Milano, Italy.E-mail: [email protected]
Key words: correlation, efficiency, manure, separation, treatment.
Acknowledgements: supported by Progetto AGER, grant n. 2010-2220.
Received for publication: 3 May 2012.Accepted for publication: 3 August 2012.
©Copyright G. Cocolo et al., 2012Licensee PAGEPress, ItalyJournal of Agricultural Engineering 2012; XLIII:e9doi:10.4081/jae.2012.e9
This article is distributed under the terms of the Creative CommonsAttribution Noncommercial License (by-nc 3.0) which permits any noncom-mercial use, distribution, and reproduction in any medium, provided the orig-inal author(s) and source are credited.
Non-co
mmercial
use o
nly

[page 56] [Journal of Agricultural Engineering 2012; XLIII:e9]
where c(x) slurry and c(x) liquid are the concentrations of DM or nutri-ents (N, P) in the slurry and the liquid fraction.
The separation index (Et) is the ratio of the total mass recovery of agiven component (DM or nutrients) in the solid phase as a proportionof the total input of that component (DM or nutrient) (Svarovsky, 1981;Møller et al., 2000; Burton 2007). This index expresses the distributionof a specific compound in the solid and the liquid fraction:
(Eq. 2)
where m(x) slurry and m(x) solid are the mass of DM or nutrients (N,P) in the slurry and the solid fractions.
The separation efficiency is influenced by several factors (Burtonand Turner, 2003): - Type of separator; - Sieve mesh size or centrifugal force;- Manure type (species, pre-treatments and total solids’ content); Use of additives.
Therefore, as described by Zhang and Westerman (1997), the above-mentioned separator types have different separation efficiencies, lead-ing to the production of end products with different characteristics thatmake them preferable for certain uses. Thus, because the performanceof the various separator types differs, a decision support tool is neces-sary to identify the separation technology most suitable for the farmer’sneeds, given particular manure properties.
In recent years, several decision support systems for manure man-agement have been developed (Karmakar et al., 2007), but only some ofthem take manure treatment processes into consideration.Additionally, few models have been elaborated for solid-liquid separa-
tion processes. For instance, Rico et al. (2006) obtained a predictiveempirical model to estimate the concentrations of DM, volatile solids(VS), carbon oxygen demand (COD) and total organic carbon in thesolid fraction, as functions of the doses of ferric chloride (FeCl3) and amedium cationic polyacrylamide (MCP1). In other studies, Chastainand Vanotti (2003) defined some correlation equations to predict theseparation efficiencies for DM, VS, COD, N and P for gravity settling ofswine manure. However, the proposed models for solid-liquid separa-tion concern only one separation process (i.e. chemical separation orgravity settling). For this reason, they could not be used as tools to sup-port our decisions because they do not estimate and compare the sep-aration efficiencies of different devices and then identify the bettersolution according to the farmer’s needs.
Article
Table 2. Values count for separation efficiencies and references for collected data. Data are divided according to separator type.
Separator type Efficiency (%) SourceDM N NH4 P
Belt press 10 11 12 Campos et al., 2002; Henriksen et al., 1998; Hjorth et al., 2009; Møller et al., 2000; Pieters et al., 1999; Walker and Kelley, 2005; Zhang and Westerman, 1997.
Centrifuge 69 68 19 68 Balsari et al., 2006; Duarte et al., 2001; Fangueiro et al., 2009; Hansen et al., 2006; Karakashev et al., 2008; Loyon et al., 2006; Melse and Verdoes, 2005; Møller et al., 2002; Møller et al., 2007; Petersen and Sørensen, 2008; Pieters et al., 1999; Sørensen and Møller, 2006; Westerman and Arogo Ogejo, 2005; Zhang and Westerman, 1997.
Inclined screen 67 66 7 60 Barrow et al., 1997; Chastain et al., 2001a; Chastain, 2009; Garcia et al., 2007a; Garcia et al., 2009; Gonzàlez-Fernàndez et al., 2008; Hill and Baier, 2000; Kaparaju and Rintala, 2008; Kunz et al., 2009;Meyer et al., 2007; Møller et al., 2000; Rico et al., 2007; Vanotti et al., 2002; Wright, 2005; Zhang and Lei, 1998; Zhang and Westerman, 1997.
Roller press 14 14 1 14 Balsari et al., 2006; Curnis, 2008.Rotating screen 2 2 12 Garcia et al., 2007b; Gooch et al., 2005; Marcato et al., 2008; Møller et al., 2000; Walker and Kelley, 2005;
Zhang and Westerman, 1997.Screw press 44 28 4 29 Balsari et al., 2006; Bertora et al., 2008; Brito et al., 2008; Burns et al., 2003; Burton and Turner, 2003;
Chastain et al., 2001b; Converse et al., 2000; Converse and Karthikeyan, 2004; Curnis, 2008; Dinuccio et al., 2008; Fangueiro et al., 2008a, 2008b and 2008c; Loyon et al., 2006; Melse and Verdoes,2005; Møller et al., 2002; Møller et al., 2000; Pieters et al., 1999; Westerman and Bicudo, 2000; Westermanand Arogo Ogejo, 2005; Wu, 2007.
Sedimentation 69 86 19 86 Barrow et al., 1997; Campos et al., 2008; Chastain et al., 2001a; Converse and Karthikeyan, 2004; Fangueiro et al., 2008a, 2008b and 2008c; Garcia et al., 2007b; Gooch et al., 2005; Henriksen et al., 1998; Loughrin et al., 2009; Martinez-Almela et al., 2003; Martinez-Almela and Barrera Marza, 2005; Møller et al., 2007; Ndegwa, 2004; Rico et al., 2007; Szögi and Vanotti, 2007; Vanotti and Hunt, 1999; Westerman and Bicudo, 2000; Westerman and Arogo Ogejo, 2005; Worley and Das, 2000.
Vibrating screen 18 6 3 7 Curnis, 2008; Pieters et al., 1999; Zhang and Westerman, 1997.DM, dry matter; N, nitrogen; NH4, ammonium; P, phosphorous.
Table 1. Separator types grouped according to their separationtechnique.
Separation technique Separator type
Gravity filtration Inclined screenVibrating screenRotating screen
Pressurised filtration Screw pressRoller pressBelt press
Centrifugation Decanting centrifugeSettling Sedimentation Settling
Non-co
mmercial
use o
nly

The present study aims to: i) identify the effect of animal species,manure pre-treatment, use of additive and type of separator on the sep-aration efficiency to distinguish different operational groups; and ii)for each of the identified groups, evaluate correlations of the separa-tion efficiencies with the physical and chemical characteristics of theinlet slurries, using data available from published experiments onmanure solid-liquid separation.
Materials and methods
Database To define and validate the model, we first collected the necessary
data. We conducted a bibliographical search that allowed us to collectpapers about solid-liquid separation published in the last decade.
To obtain data expressed in the same units of measurement, the col-lected data were revised, if necessary, using the relationships betweenthe relative density and the DM or nutrient concentrations in the rawslurry proposed by Piccinini et al. (1990).
Bibliographical data were collected in a database, organised as fol-lows:- Input related to the effluent: animal species (cattle and swine), efflu-
ent type (raw, digested and liquid from separation);- Input related to the technology: separator type, use of chemical addi-
tives (additive yes/no);- Slurry characteristics: DM concentration, N, P, potassium (K);- Output: separation efficiency for DM (Eff. DM), nitrogen (Eff. N),
phosphorus (Eff. P);- References.
Operative data such as mesh size, centrifugal force or settling timewere not used since none or few were available.
Data collectionThe database is composed of data found through a bibliographical
search. We collected 98 papers, published in the last decade. Thesemainly consisted of scientific papers, but also included proceedingsfrom conferences, chapters from books, graduation theses and publica-tions by universities and public institutions.
Hence, it is worth noting that data concerning experiments weregathered for a different purpose, so the studies are rather heteroge-neous and not completely comparable. Furthermore, the separationefficiencies are calculated using different equations, affecting dataelaboration. Most studies contained information about the DM concen-tration of input slurry but few had information about the consideredseparation efficiencies. In fact, some papers did not report the separa-tion indexes, but did report the DM and nutrient concentrations in thesolid and liquid fractions. Other papers did not give any informationabout the separation efficiencies, but provided nutrient concentrationsof the input slurry and of the final products. Since there are differentequations to calculate separation efficiency, we did not calculate sepa-ration efficiencies and, therefore, the data were not used in the analy-sis. In some cases, articles by the same authors referred to the sameexperiments. After this further selection, 60 publications were used(Table 2). The collected data were revised, if necessary, so as to beexpressed in the same units of measurement. Finally, they wereuploaded onto the database (n=482 observations).
Data processingThe SPSS 18.0 statistical package (IBM Corp., Armonk, NY, USA) was
used to analyse the collected data. Mean efficiency and variability for different categorical variables
(animal species, effluent type, use of flocculants, separator type) wereanalysed by mean of error and bar plots were then produced. In thiscase, error bars represent the double standard error mean of separationefficiencies for DM, N and P. This analysis allowed us to identify thevariables, which mainly affect separation efficiency, and to indicate iftheir means differed.
Definition of relationships and model validationTo define the correlations of the separation efficiencies with the
physical and chemical characteristics of the inlet slurries, a regressionanalysis was performed using DM, N, P and K of the raw slurries asindependent variables.
Model definition and validation was carried out on each of thegroups using two methods:- Random: using the SPSS 18.0 statistical package (IBM Corp.), the
database was first divided into the identified groups. Each datasetwas then randomly split into two fractions of 70% and 30% of obser-vations, respectively (Preece et al., 2009). The first observationswere used to define linear regressions that allowed us to model therelationships between the separation efficiencies and the DM con-centration, distinguishing data through the presence or absence ofchemical additives. Data sets containing 30% of the observationswere used for model validation.
- Crossvalidation: the leave-one-out crossvalidation was performedusing Unscrambler© X 10.0.1 software (CAMO Software, Oslo,Norway) (Soriano-Disla et al., 2010) that was applied to eachgroup.For every regression, we calculated the coefficient of determination
(r2) and the significance values. For crossvalidation, the coefficients ofdetermination for calibration (r2 cal) and validation (r2 val) were calcu-lated.
Finally, for every validation method, the reliability of predictionsand their deviation from observed values were analysed both graphi-cally and by means of error calculations. In particular, we calculated
[Journal of Agricultural Engineering 2012; XLIII:e9] [page 57]
Article
Table 3. Description of the 8 groups used for the elaborations.
Group Animal Separation Separatorspecies technique type
1 Cattle Gravity filtration Inclined screenVibrating screenRotating screen
2 Cattle Pressurised filtration Screw pressRoller pressBelt press
3 Cattle Settling SedimentationSettling
4 Cattle Centrifugation Decanting centrifuge5 Swine Gravity filtration Inclined screen
Vibrating screenRotating screen
6 Swine Pressurised filtration Screw pressRoller pressBelt press
7 Swine Settling SedimentationSettling
8 Swine Centrifugation Decanting centrifuge
Non-co
mmercial
use o
nly

[page 58] [Journal of Agricultural Engineering 2012; XLIII:e9]
the root mean squared error (RMSE) and the relative root meansquared error (RRMSE):
(Eq. 3)
(Eq. 4)
where n is the number of data used, Pi are the predicted values, Oi are
the observed values and is the mean of the observed data.RMSE evaluates the model’s accuracy as the difference between pre-
dicted and measured values, and it indicates the fitting’s absolutemean error, while RRMSE shows the magnitude of the error. They wereused to quantify model accuracy and to compare between them.
Article
Table 4. Descriptive statistics of each group for the entire database divided by the use of chemicals.
Group Additive Efficiency (%) N. Min Max Mean Std. Dev.
1Cattle gravity filtration Without DM 35 6.00 71.70 32.26 16.43
N 11 8.30 49.20 28.21 14.26P 11 12.10 62.80 35.46 16.56
With DM 31 63.00 95.70 81.99 11.52N 41 14.00 86.00 51.97 16.00P 41 16.30 99.00 66.86 26.22
2Cattle pressurised filtration Without DM 36 4.34 77.80 40.17 16.69
N 22 3.97 39.28 17.25 10.48P 22 5.72 73.70 31.44 20.57
3Cattle settling Without DM 11 18.10 64.90 44.58 17.51
N 11 1.60 40.00 20.25 11.59P 11 13.50 61.40 40.24 16.45
With DM 44 29.30 92.80 78.38 11.59N 60 3.71 74.00 40.25 14.39P 61 16.30 91.70 66.05 20.17
4Cattle centrifugation Without DM 11 53.50 69.10 59.84 5.61
N 11 20.30 49.12 28.64 7.42P 11 45.50 93.80 71.84 16.64
5Swine gravity filtration Without DM 21 3.00 58.70 26.75 16.86
N 15 3.50 42.00 16.34 11.67P 12 3.00 46.50 17.55 14.11
With DM 0N 7 13.00 35.00 25.71 8.24P 15 21.00 80.30 60.37 18.16
6Swine pressurised filtration Without DM 28 5.50 68.25 31.01 18.94
N 25 0.83 33.50 9.34 8.47P 27 7.00 73.70 25.33 18.37
With DM 4 38.10 79.37 54.40 18.50N 6 13.11 79.50 38.16 29.61P 6 53.97 90.48 75.94 14.26
7Swine settling Without DM 3 49.00 64.00 57.33 7.64
N 0P 0
With DM 11 34.00 87.00 65.57 16.15N 15 16.10 58.30 37.77 14.76P 14 70.00 91.30 81.44 8.53
8Swine centrifugation Without DM 46 8.00 70.40 48.53 15.29
N 45 7.00 35.50 20.84 7.22P 45 26.00 90.95 66.57 13.34
With DM 12 47.00 76.00 57.83 11.19N 12 17.00 48.00 32.83 11.65P 12 54.00 88.00 71.00 11.82
DM, dry matter; N, nitrogen; P, phosphorous; Std. Dev, standard deviation.
Non-co
mmercial
use o
nly
Results and discussion
Data analysis
Factors influencing separation efficiencyThis analysis aimed to identify the categorical variables mainly
affecting the separation efficiencies. In particular, we considered theseparation efficiencies for DM, N and P, expressed as functions of ani-
mal species, effluent type, use of additives and separator type. Whenthe separation efficiencies are grouped according to species (Figure1A), mean values have significantly different variations for all the sep-aration efficiencies considered. Specifically, the separation efficienciesfor cattle slurries are higher, meaning more DM, N and P are in thesolid fraction at separation of cattle slurry rather than in swine slurry.This result agrees with previous findings (Peters et al., 2011).
The mean values also present different variations when separationefficiencies are classified by the use of chemical additives (Figure 1B).
[Journal of Agricultural Engineering 2012; XLIII:e9] [page 59]
Article
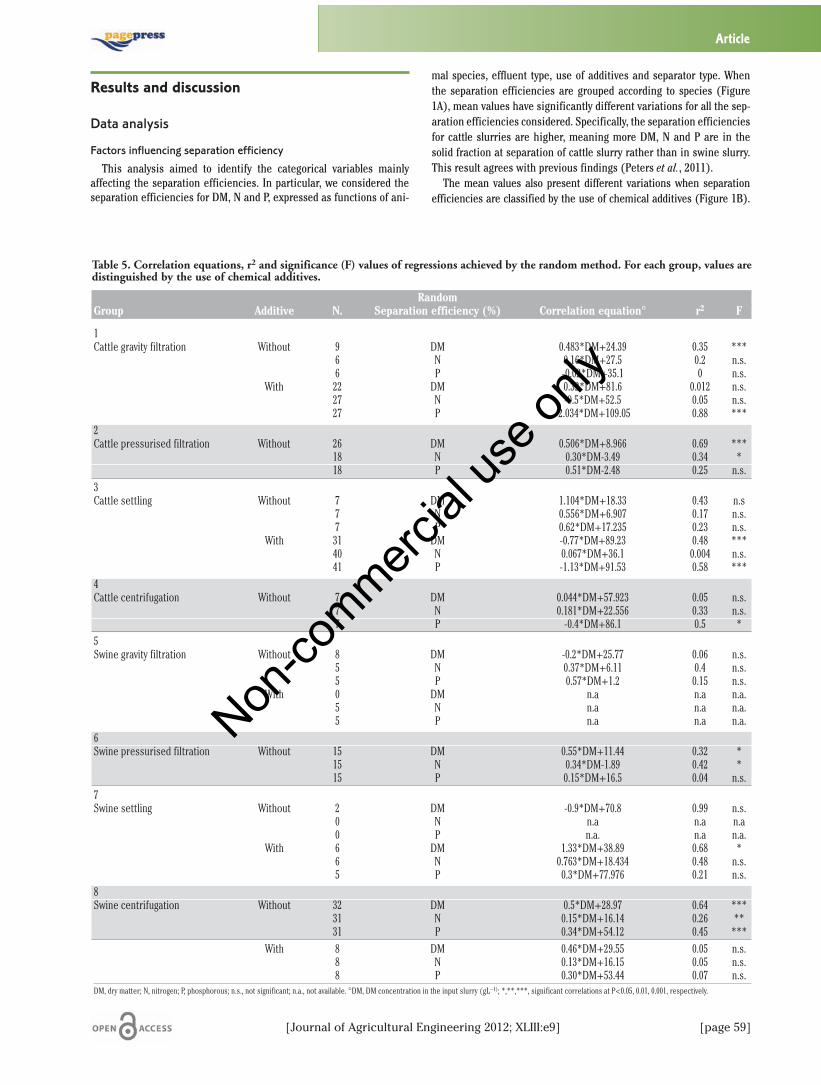
Table 5. Correlation equations, r2 and significance (F) values of regressions achieved by the random method. For each group, values aredistinguished by the use of chemical additives.
RandomGroup Additive N. Separation efficiency (%) Correlation equation° r2 F
1Cattle gravity filtration Without 9 DM 0.483*DM+24.39 0.35 ***
6 N 0.16*DM+27.5 0.2 n.s.6 P -0.02*DM+35.1 0 n.s.
With 22 DM 0.32*DM+81.6 0.012 n.s.27 N -0.5*DM+52.5 0.05 n.s.27 P -2.034*DM+109.05 0.88 ***
2Cattle pressurised filtration Without 26 DM 0.506*DM+8.966 0.69 ***
18 N 0.30*DM-3.49 0.34 *18 P 0.51*DM-2.48 0.25 n.s.
3Cattle settling Without 7 DM 1.104*DM+18.33 0.43 n.s
7 N 0.556*DM+6.907 0.17 n.s.7 P 0.62*DM+17.235 0.23 n.s.
With 31 DM -0.77*DM+89.23 0.48 ***40 N 0.067*DM+36.1 0.004 n.s.41 P -1.13*DM+91.53 0.58 ***
4Cattle centrifugation Without 7 DM 0.044*DM+57.923 0.05 n.s.
7 N 0.181*DM+22.556 0.33 n.s.7 P -0.4*DM+86.1 0.5 *
5Swine gravity filtration Without 8 DM -0.2*DM+25.77 0.06 n.s.
5 N 0.37*DM+6.11 0.4 n.s.5 P 0.57*DM+1.2 0.15 n.s.
With 0 DM n.a n.a n.a.5 N n.a n.a n.a.5 P n.a n.a n.a.
6Swine pressurised filtration Without 15 DM 0.55*DM+11.44 0.32 *
15 N 0.34*DM-1.89 0.42 *15 P 0.15*DM+16.5 0.04 n.s.
7Swine settling Without 2 DM -0.9*DM+70.8 0.99 n.s.
0 N n.a n.a n.a0 P n.a. n.a n.a.
With 6 DM 1.33*DM+38.89 0.68 *6 N 0.763*DM+18.434 0.48 n.s.5 P 0.3*DM+77.976 0.21 n.s.
8Swine centrifugation Without 32 DM 0.5*DM+28.97 0.64 ***
31 N 0.15*DM+16.14 0.26 **31 P 0.34*DM+54.12 0.45 ***
With 8 DM 0.46*DM+29.55 0.05 n.s.8 N 0.13*DM+16.15 0.05 n.s.8 P 0.30*DM+53.44 0.07 n.s.
DM, dry matter; N, nitrogen; P, phosphorous; n.s., not significant; n.a., not available. °DM, DM concentration in the input slurry (gL–1); *,**,***, significant correlations at P<0.05, 0.01, 0.001, respectively.
Non-co
mmercial
use o
nly

[page 60] [Journal of Agricultural Engineering 2012; XLIII:e9]
As expected, flocculants improve the separation efficiencies and it is arelevant predictive variable. Digestion and removal of solids with separa-tion reduce the DM content of the liquid fraction and increase relativecontent of the dissolved total ammoniacal nitrogen in the nitrogen pool.Therefore, effects on the separation index could be expected. However,considering separation efficiency for DM (Figure 1C), means having dif-ferent variations only for separated slurry, whereas the three effluenttypes (digested, raw and liquid from separation) do not present different
variations in the means for the separation efficiency of N and P.Therefore, we could not confirm that the effluent type statistically affectsthe separation efficiencies. This absence of a significant statistical dif-ference could be due to the fact that manures from different origins areincluded in the different pool; they are not, therefore, suitable for defin-itively ruling out a correlation/ variation. In conclusion, from this analy-sis, the categorical variables, which mainly affect separation efficiencies,are animal species, use of chemical additives and separator type.
Article
Table 6. Correlation equations, r2 and significance (F) values of regressions achieved by the cross-validation method. For each group,values are distinguished by the use of chemical additives.
Cross-validationGroup Additive N. Separation efficiency (%) Correlation equation° r2 F
1Cattle gravity filtration Without 17 DM 0.392*DM+23.41 0.27 **
11 N 0.251*DM+16.855 0.15 n.s.11 P 0.085*DM+31.605 0.09 n.s.
With 31 DM 0.004*DM+81.9 0.0 n.s.41 N -0.4*DM+59.84 0.09 *41 P -1.99*DM+104.97 0.86 ***
2Cattle pressurised filtration Without 38 DM 0.45*DM+10.27 0.47 ***
22 N 0.28*DM-2.13 0.29 **22 P 0.34*DM+7.48 0.11 n.s.
3Cattle settling Without 9 DM 0.31*DM+41.3 0.05 n.s.
9 N 0.4*DM+13.5 0.13 n.s.9 P -0.3*DM+44.2 0.04 n.s.
With 44 DM n.a n.a n.a60 N n.a. n.a n.a61 P n.a n.a. n.a.
4Cattle centrifugation Without 11 DM 0.04*DM+58.30 0.04 n.s.
11 N 0.12*DM+24.10 0.21 n.s.11 P -0.36*DM+85.35 0.6 *
5Swine gravity filtration Without 21 DM 0.22*DM+21.73 0.04 n.s.
14 N 0.25*DM+2.28 0.29 n.s.9 P 0.88*DM-8.08 0.54 n.s.
With 0 DM n.a. n.a. n.a7 N n.a. n.a. n.a.7 P n.a. n.a. n.a.
6Swine pressurised filtration Without 26 DM 0.62*DM+8.04 0.32 **
23 N 0.33*DM-2.75 0.42 **25 P 0.30*DM+13.55 0.08 n.s.
7Swine settling Without 3 DM n.a. n.a. n.a.
2 N n.a. n.a. n.a.0 P n.a. n.a. n.a.
With 11 DM 0.91*DM+50.95 0.42 *8 N 0.3 *DM+29.9 0.0 n.s.7 P n.a. n.a. n.a.
8Swine centrifugation Without 46 DM 0.48*DM+29.28 0.61 **
45 N 0.14*DM+15.40 0.21 **45 P 0.33*DM+53.39 0.37 **
With 12 DM 0.49*DM+49.67 0.07 n.s.12 N -0.05*DM+33.71 0.05 n.s.12 P 0.65*DM+60.13 0.12 n.s.
DM, dry matter; N, nitrogen; P, phosphorous; n.s., not significant; n.a., not available. °DM, DM concentration in the input slurry (gL–); *,**,***, significant correlations at P<0.05, 0.01, 0.001, respectively.
Non-co
mmercial
use o
nly

Separator groupingSome separator types behave similarly in accordance with their
functioning characteristics, as described above (Table 1). Therefore,separator types were grouped according to their construction and oper-ating characteristics (gravity filtration, pressurised filtration, settlingand centrifugation), taking into account the results of dispersion anderror bar plots. Thus, separation devices were divided in 8 groups: 4 forcattle slurry and 4 for swine slurry (Table 3).
Finally, for every group, data were distinguished by the presence orabsence of chemical additives. Since some separator types are not usedwith chemical additives in the collected experiments (groups 2 and 4),14 subgroups were obtained.
For each identified group, descriptive statistics were calculated(Table 4). It is clear in Table 4 that, for some groups, more data areavailable (e.g. groups 2 and 8). For every group, each variable has a dif-ferent number of observations; there were more observations for sepa-ration efficiencies achieved without chemical additives, except for sed-imentation (groups 3 and 7). Considering all groups, some separationefficiencies present few data. Furthermore, for each cluster, the datapresent a high range of variation, particularly without flocculants.
The order of the separation efficiencies for DM, N and P withinswine and cattle slurry are equivalent, i.e. pressurised filtration < grav-ity filtration < centrifugation (with additive) < settling (with additive).Hence, sedimentation techniques are superior to filtration. Applyingfiltration without chemical additives is the least effective technique.Application of additives causes the most efficient separation. Withoutchemical additives, sedimentation techniques are superior to filtration,as also indicated in the error bar plots. Gravity filtration without chem-ical additives requires large mesh so only large particles are retainedin the solid fraction. Settling under optimal conditions, i.e. high forceapplied and long retention time, also cause retention of small particlesin the solid fraction. This is supported by previous findings (Møller etal., 2002).
The order of efficiency of the separator types for N and P separationefficiencies was similar to DM separation efficiency. This is supportedby the fact that N, and particularly P, are associated with the particles(Christensen et al., 2009).
[Journal of Agricultural Engineering 2012; XLIII:e9] [page 61]
Article
Table 7. Root mean squared error and relative root mean squared error values for significant equations.
Group Additive Efficiency (%) RMSE RRMSE (%)Random Cross-validation Random Cross-validation
1Cattle gravity filtration Without DM 17.29 14.26 53.60 44.20
With P 17.73 12.19 26.52 18.232Cattle pressurised filtration Without DM 15.66 12.38 38.98 30.82
N 8.65 9.06 50.14 52.524Cattle centrifugation Without P 15.93 14.00 24.38 19.496Swine pressurised filtration Without DM 15.60 15.22 50.31 49.08
N 4.87 6.94 52.14 74.307Swine settling With DM 22.02 15.68 33.13 23.918Swine centrifugation Without DM 7.67 9.69 15.80 19.97
N 5.83 6.47 27.98 31.05P 8.52 10.73 12.80 16.12
DM, dry matter; N, nitrogen; P, phosphorous; RMSE, root mean squared error; RRMSE, relative root mean squared error.
Figure 1. Error bar plots of separation efficiencies for dry matter,nitrogen and phosphorous grouped by species (A), use of chemi-cal additives (B) and effluent type (C).
Non-co
mmercial
use o
nly
[page 62] [Journal of Agricultural Engineering 2012; XLIII:e9]
Correlation definitionUsing the methods described above, we carried out the regressions
for model definition (random and crossvalidation). In particular, wedefined regressions that identify the relationships between the separa-tion efficiencies for DM, N and P with the DM, N, P and K concentrationof the slurry. DM was the only parameter included in the regressionmodel used and, therefore, results are shown using only this parameteras independent variable.
As shown in Table 3, some separator types, corresponding to groups2 (cattle slurry/pressurised filtration) and 4 (cattle slurry/centrifuga-tion), are not used with chemical additives. Furthermore, for group 6(swine slurry/pressurised filtration), data for separation indexesachieved with chemicals refer only to belt presses and are highly vari-able. For this reason, only regressions for separation efficiencies ofswine manure treated by pressurised filtration without additives werecalculated.
Tables 5 and 6 present the correlation equations, and their r2 and sig-nificance (F) values obtained applying the random and crossvalidationmethods, respectively. In some cases, the methods used did not achievesignificant regressions for all the separation efficiencies because ofthe lack of data or because of the presence of some anomalous valuesfor the DM concentration of the input slurry.
After model definition, regressions were validated using plots anderror calculation. In particular, we calculated the RMSE error and theRRMSE only for regressions that resulted significant for both randomand crossvalidation methods (Table 7). In most cases, the RRMSE val-ues are below 50% for both random and crossvalidation methods.
For solid-liquid separation of cattle slurry by gravity filtration (group1) without using chemical additives, only the correlations for the DMseparation efficiencies were significant. However, the separation effi-ciency for DM is not entirely correlated to the input DM concentration;in this case, the measured values are highly variable and, therefore, theRRMSEs are large for both random and crossvalidation models. Hence,a larger amount of experimental data could allow us to achieve multiplelinear regression lines depending not only on the DM concentration ofthe input slurry, but also on other criteria that affect the separationefficiency, such as mesh size.
Using additives, only the regressions for the separation efficiency ofP were significant. The random and the crossvalidation models showeda decreasing trend, matching that of the data.
Overall, for cattle manure treated by pressurised filtration withoutchemical additives, the random and the crossvalidation regressionswere significant only for DM and N separation indexes. However,RRMSE for N separation efficiency was high (Table 7).
There are few and variable measured data related to the P separationefficiency for the separation of cattle slurry by centrifugation withoutchemical additives.
As for cattle slurry, only the separation efficiencies for DM and Npresent significant regressions for swine slurry separated with pres-surised filtration without additives. Separation efficiencies of DM dataare very variable and so, even though the random and crossvalidationmodels are similar, the regression error is greater. Generally, the sepa-ration efficiency of DM and N for pressurised filtration of cattle andswine slurry (groups 2 and 6) are both correlated to the DM content ofthe input slurry. Of all the separator types, these pressurised filtrationseparators result in the fewest of the minor particles being retained inthe solid fraction, which may be why this correlation is so simple and,therefore, reaches significance.
The separation efficiency for DM of the solid-liquid separation of swinemanures by sedimentation using flocculants presents few data showing aclear tendency and has a good fit in both of the two models. For the sepa-ration of swine slurry by centrifugation, only the separation efficienciesfor DM, N and P without the addition of flocculants present significantregressions. Separation efficiencies for DM, N and P were very similar.
Generally, we did not find significant correlations for separation effi-ciencies obtained using flocculants, except for groups 1 and 7. In gen-eral, correlations may be complicated by the applied flocculation treat-ments, which vary greatly between the different experiments.Therefore, it is necessary to take into account the chemical applied andthe added dose relative to the optimal chemical dose.
Conclusions
The analysis allowed us to distinguish several technological and oper-ational conditions that affect separation efficiency. The most relevantcharacteristic of the input slurry is DM. The main variables affecting sep-aration efficiency are species, use of additives and separator type.
For 7 of the 14 subgroups, it was possible to define and validate thepredictive models. These present RRMSEs that are less than 50% andcould, therefore, be implemented in a decision support tool to identifythe most effective treatment option according to the farmer’s needs.For the remaining separation technologies and operative conditions,most of which include the use of flocculants, more data are needed todefine and validate empirical predictive models.
Except for settling, most of the correlations related to the use of addi-tives were not significant. This is due to the wide variety of additivesused in the different experiments. In fact, the different types of chem-icals and their dosages affect the separation efficiencies in differentways and to different degrees. Therefore, experiments concerning theuse of flocculants are often not comparable.
With regard to N separation efficiency, only pressurised filtrationwas significantly correlated for both cattle and pig slurry, while cen-trifugation was significant only for pig manure.
More detailed predictive models might be defined only if uniformand complete sets of data are available. In fact, bibliographic dataderive from different kinds of experiments that often had differentaims and could not be compared. Furthermore, they seldom include allthe relevant information required to evaluate efficiency variations(pressure, mesh size, flow rate).
Therefore, more precise and physically-based models should bedefined with the support of specific studies in order to predict separa-tion efficiencies in practical conditions.
References
Balsari P., Gioelli F., Dinuccio E., Santoro E. 2006. Monitoraggio degliimpianti di separazione solido liquido dei liquami di suini e dibovini. Relazione finale della ricerca. Università di Torino, Torino,Italy.
Barrow J.T., Van Horn H.H., Anderson D.L., Nordstedt R.A. 1997. Effectsof Fe and Ca additions to dairy wastewaters on solids and nutrientremoval by sedimentation. Appl. Eng. Agric. 13:259-67.
Bertora C., Alluvione F., Zavattaro L., van Groeningen J.W, Velthof G.,Grignani C. 2008. Pig slurry treatment modifies slurry composition,N2O, and CO2 emissions after soil incorporation. Soil Biol.Biochem. 40:1999-2006.
Brito L.M., Coutinho J., Smith S.R. 2008. Methods to improve the com-posting process of the solid fraction of dairy cattle slurry.Bioresource Technol. 99:8955-8960.
Burns R.T., Moody L.B. 2003. Development of a standard method fortesting mechanical manure solids separators. ASAE AnnualInternational Meeting, July 27-30, Las Vegas, Nevada, USA.
Burton C.H. 2007. The potential contribution of separation technologiesto the management of livestock manure. Livest. Sci. 112:208-16.
Article
Non-co
mmercial
use o
nly

Burton C.H., Turner C. 2003. Manure management - Treatment strate-gies for sustainable agriculture. 2nd Ed. Silsoe Research Institute,Bedford, UK.
Campos E., Almirall M., Mtnez-Almela J., Flotats X. 2002. Anaerobicdigestion of solid fraction of pig slurry. Proc. of Int. Symposium onAnaerobic Digestion of Solid Waste, 1-8 September, Munich,Germany.
Campos E., Almirall M., Mtnez-Almela J., Palatsi J., Flotats X. 2008.Feasibility study of the anaerobic digestion of dewatered pig slurryby means of polyacrylamide. Bioresource Technol. 99:387-95.
Chastain J.P. 2009. Field evaluation of a two-stage liquid-solid separa-tion system at a California dairy. ASABE Annual InternationalMeeting, June 21-24, Reno, Nevada, USA.
Chastain J.P., Lucas W.D., Albrecht J.E., Pardue J.C., Adams III J., MooreK.P. 2001a. Removal of solids and major plants nutrients fromswine manure using a screw press separator. Appl. Eng. Agric.17:355-63.
Chastain J.P., Vanotti M.B. 2003. Correlation equations to predict thesolids and plant nutrient removal efficiencies for gravity settling ofswine manure. Proc. 9th Int. Symp. Animal Agr. Food Proces.Wastes, 12-15 October, Research Triangle Park, North Carolina,USA, 487-95.
Chastain J.P., Vanotti M.B., Wingfield M.M. 2001b. Effectiveness of liq-uid-solid separation for treatment of flushed dairy manure: a caseof study. Appl. Eng. Agric. 17:343-54.
Christensen M.L., Hjorth M., Keiding K. 2009. Characterization of pigslurry with reference to flocculation and separation. Water Res.43:773-83.
Converse J.C., Karthikeyan K.G. 2004. Nutrient and solids separation offlushed dairy manure by gravity settling. Appl. Eng. Agric. 20:503-7.
Converse J.C., Koegel R.G., Straub R.J. 2000. Nutrient separation ofdairy manure. Proc. 8th Int. Symp. Animal Agr. Food Proces. Wastes,October 9-11, Des Moines, Iowa, USA, 118-31.
Curnis S. 2008. Analisi della funzionalità di impianti per la separazionesolido-liquido degli effluenti in aziende francesi e italiane di bovinida latte. Degree Diss., University of Milan.
Dinuccio E., Berg W., Balsari P. 2008. Gaseous emissions from the stor-age of untreated slurries and the fractions obtained after mechan-ical separation. Atmos. Environ. 42:2448-59.
Duarte E.A., Neto I., Queda C.C. 2001. An integrated waste manage-ment technology applied to a swine intensive production unit with-out available farmland. Technology Transfer. Proc. 9th Int. Conf.“FAO ESCORENA network on recycling of agricultural, municipaland industrial residues in agriculture”, September 6-9.Gargano,Italy, 175-9.
Fangueiro D., Coutinho J., Chadwick D., Moreira N., Trindade H. 2008a.Effect of cattle slurry separation on greenhouse gas and ammoniaemissions during storage. J. Environ. Qual. 37:2332-1.
Fangueiro D., Pereira J., Chadwick D., Coutinho J., Moreira N.,Trindade H. 2008b. Laboratory assessment of the effect of cattleslurry pre-treatment on organic N degradation after soil applicationand N2O and N2 emissions. Nutr. Cycl. Agroecosyst. 80:107-20.
Fangueiro D., Ribeiro H., Vasconcelos E., Coutinho J., Cabral F. 2009.Treatment by acidification followed by solid-liquid separationaffects slurry and slurry fractions composition and their potentialon N mineralization. Bioresource Technol. 100:4914-7.
Fangueiro D., Senbayran M., Trindade H., Chadwick D. 2008c. Cattleslurry treatment by screw press separation and chemicallyenhanced settling: effect on greenhouse gas emissions after landspreading and grass yield. Bioresource Technol. 99:7132-42.
Ford M., Flemming R. 2002. Mechanical solid liquid separation of live-stock manure. Literature Review. Ridgetown College - University ofGuelp, Ridgetown, Ontario, Canada.
Garcia M.C., Szögi A.A., Canotti M.B., Chastain J.P. 2007a. Solid-liquid
separation of dairy manure with PAM and chitosan polymer.ASABE. International Symposium on Air Quality and Waste,September 16-19, Broomfield, Colorado, USA.
Garcia M.C., Szögi A.A., Vanotti M.B., Chastain J.P., Millner P.D. 2009.Enhanced solid-liquid separation of dairy manure with natural floc-culants. Bioresource Technol. 100:5417-23.
Garcia M.C., Vanotti M.B., Szögi A.A. 2007b. Simultaneous separation ofphosphorus sludge and manure solids with polymers. Trans. ASABE50:2205-15.
Gonzàlez-Fernàndez C., Nieto-Diez P.P., Leòn-Cofreces C., Garcìa-Encina C.A. 2008. Solids and nutrients removals from the liquidfraction of swine slurry through screening and flocculation treat-ment and influence of these processes on anaerobic biodegradabil-ity. Bioresource Technol. 99:6233-9.
Gooch C.A.P.E., Inglis S.F., Czymmek K.J. 2005. Mechanical solid-liquidmanure separation: performance evaluation on four New YorkState dairy farms – A preliminary report. ASAE AnnualInternational Meeting, July 17-20, Tampa, Florida, USA.
Hansen M.N., Kai P., Møller H.B. 2006. Effects of anaerobic digestionand separation of pig slurry on odor emission. Appl. Eng. Agric.22:135-9.
Henriksen K., Berthelsen L., Matzen R. 1998. Separation of liquid pigmanure by flocculation and ion exchange. Part 2: pilot-scale sys-tem. J. Agric. Eng. Res. 69:127-31.
Hill D.T., Baier J.W. 2000. Physical and chemical properties of screened-flushed pig slurry waste. J. Agric. Eng. Res. 77:441-8.
Hjorth M., Christensen K.V., Christensen M.L., Sommer S.G. 2010.Solid-liquid separation of animal slurry in theory and practice. Areview. Agron. Sustain. Dev. 30: 153-180.
Hjorth M., Nielsen A.M., Nyord T., Hansen M.N., Nissen P., Sommer S.G.2009. Nutrient value, odour emission and energy production ofmanure as influenced by anaerobic digestion and separation.Agron. Sustain. Dev. 29:329-38.
Kaparaju P.L.N., Rintala J.A. 2008. Effects of solid-liquid separation onrecovering residual methane and nitrogen from digested cowmanure. Bioresourche Technol. 99:120-7.
Karakashev D., Schmidt J.E., Angelidaki I. 2008. Innovative processscheme for removal of organic matter, phosphorus and nitrogenfrom pig manure. Water Res. 42:4083-90.
Karmakar S., Laguë C., Landry H. 2007. Integrated decision support sys-tem (DSS) for manure management: A review and perspective.Comput. Electron. Agr. 57:190-201.
Kunz A., Miele M., Steinmetz R.L.R. 2009. Advanced swine manuretreatment and utilization in Brazil. Bioresource Technol. 100:5485-9.
Loughrin J.H., Vanotti M.B., Szögi A.A., Lovanh N. 2009. Evaluation ofsecond-generation multistage wastewater treatment system for theremoval of malodors from liquid swinw waste. J. Environ. Qual.38:1739-48.
Loyon L., Guiziou F., Béline F., Peu P. 2006. Gasseous emissions (NH3,N2O, CH4, CO2) during pig slurry biological aerobic treatment andtreatment by-product storages. Int. Congr. Series. 1293:299-302.
Marcato C.E., Pinelli E., Pouech P., Winterton P., Guiresse M. 2008.Particle size and metal distribution in anaerobically digested pigslurry. Bioresource Technol. 99:2340-8.
Martinez-Almela J., Barrera Marza J.M. 2005. SELCO-ECOPURIN® pigslurry treatment. Bioresource Technol. 96:223-8.
Martinez-Almela J., Barrera Marza J.M., Salmo Casals D., LorenzoNavarro M. 2003. SELCO-ECOPURIN® separation technology forconversion of animal waste into added value products and energy.Proc. 9th Int. Symp. Animal Agr. Food Proces. Wastes, October 12-15,Research Triangle Park, North Carolina, USA.
Melse R.W., Verdoes N. 2005. Evaluation of four farm-scale systems forthe treatment of liquid pig manure. Biosyst. Eng. 92:47-57.
[Journal of Agricultural Engineering 2012; XLIII:e9] [page 63]
Article
Non-co
mmercial
use o
nly

[page 64] [Journal of Agricultural Engineering 2012; XLIII:e9]
Meyer D., Ristow P.L., Lie M. 2007. Particle size and nutrient distribu-tion in fresh dairy manure. Appl. Eng. Agric. 23:113-7.
Møller H.B., Hansen J.D., Sørensen C.A.G. 2007. Nutrient recovery bysolid-liquid separation and methane productivity of solids. Trans.ASABE 50:193-200.
Møller H.B., Lund I., Sommer S.G. 2000. Solid-liquid separation of live-stock slurry: efficiency and cost. Bioresource Technol. 74:223-9.
Møller H.B., Sommer S.G., Ahring B.K. 2002. Separation efficiency andparticle size distribution in relation to manure type and storageconditions. Bioresource Technol. 85:189-96.
Ndegwa P.M. 2004. Solids separation enhances reduction of organicstrength of swine manure subjected to aeration treatments. Trans.ASAE 47:1659-66.
Peters K., Hjorth M., Jensen L.S., Magid J. 2011. Carbon, nitrogen andphosphorus distribution in particle size-fractioned separated pigand cattle slurry. J. Environ. Qual. 40:224-32.
Petersen J., Sørensen P. 2008. Loss of nitrogen and carbon during stor-age of the fibrous fraction of separated pig slurry and influence onnitrogen availability. J. Agric. Sci. 146:403-13.
Petersen S.O., Sommer S.G., Béline F., Burton C., Dach J., DourmadJ.Y., Leip A., Misselbrook T., Nicholson F., Poulsen H.D., Provolo G.,Søresen P., Vinnerås B., Weiske A., Bernal M.P., Böhm R., JuhàszR., Mihelic R. 2007. Recycling of livestock manure in a whole-farmperspective. Livest. Sci. 112:180-91.
Piccinini S., Bortone G., Meglioli M. 1990. Valore fertilizzante dei liqua-mi zootecnici: metodo rapido e semplice di misura. Genio Rurale53:21-6.
Pieters J.G., Neukermans G.G.J., Colanbeen M.B.A. 1999. Farm-scalemembrane filtration of sow slurry. J. Agric. Eng. Res. 73:403-9.
Preece S.L., Morgan C.L.S., Auvermann B. W., Wilke K., Heflin K. 2009.Determination of ash content in solid cattle manure with visiblenear-infrared diffuse reflectance spectroscopy. Trans. ASABE52:609-14.
Rico J.L., Garcìa H., Rico C., Pérez N. 2006. Two-factor design coagu-lant/flocculant doses for solid-liquid separation of dairy manure.Environ. Technol. 27:143-51.
Rico J.L., Garcìa H., Rico C., Tejero I. 2007. Characterisation of solidand liquid fractions of dairy manure with regard to their compo-nent distribution and methane production. Bioresource Technol.98:971-9.
Sørensen, C.G., Møller, H.B. 2006. Operational and economic modellingand optimization of mobile slurry separation. Appl. Eng. Agric.
22:185-93.Soriano-Disla J.M., Gòmez I., Guerrero C., Navarro-Pedreño J., Garcìa-
Orenes F. 2010. The potential of NIR spectroscopy to predict stabil-ity parameters in sewage sludge and derived compost. Geoderma.158:93-100.
Svarovsky L. 1981. Solid-liquid separation (2nd Ed.). Butterworths,Oxford, UK.
Szögi A.A., Vanotti M.B. 2007. Abatement of ammonia emissions fromswine lagoons using polymer-enhanced solid-liquid separation.Appl. Eng. Agric. 23:837-45.
Tilche A., Bacilieri E., Bortone G., Malaspina F., Piccinini S., Stante L.1999. Biological phosphorus and nitrogen removal in a full scalesequencing batch reactor treating piggery wastewaters. Water Sci.Technol. 40:199-206.
Vanotti M.B., Hunt P.G. 1999. Solids and nutrient removal from flushedmanure using polyacrylamides. Trans. ASAE 42:1833-40.
Vanotti M.B., Rashash D.M.C., Hunt P.G. 2002. Solid-liquid separationof flushed swine manure with PAM: effect of wastewater strength.Trans. ASAE 45:1959-69.
Walker P., Kelley T. 2005. Comparison of a static gravity screen-rollpress combination separator to a PAM-assisted gravity belt thicken-er system for swine waste slurry solids separation. BioresourceTechnol. 96:571-6.
Westerman P.W., Arogo Ogejo J. 2005. Centrifuge solids/liquid separa-tion of swine flushed manure and lagoon sludge. ASAE AnnualInternational Meeting, July 17-20, Tampa, Florida, USA.
Westerman P.W., Bicudo J.R. 2000. Tangential flow separation andchemical enhancement to recover swine manure solids, nutrientsand metals. Bioresource Technol. 73:1-11.
Worley J.W., Das K. 2000. Swine manure solids separation and compost-ing using alum. Appl. Eng. Agric. 16:555-61.
Wright W.F. 2005. Dairy manure particle size distribution, properties,and implications for manure handling and treatment. ASAE AnnualInternational Meeting, July 17-20, Tampa, Florida, USA.
Wu Z. 2007. Phosphorus and nitrogen distribution of screw press sepa-rated dairy manure with recovery of bedding material. Appl. Eng.Agric. 23:757-62.
Zhang R.H., Lei F. 1998. Chemical treatment of animal manure forsolid-liquid separation. Trans. ASAE 41:1103-8.
Zhang R.H., Westerman P.W. 1997. Solid-liquid separation of animalmanure for odor control and nutrient management. Appl. Eng.Agric. 23:757-62.
Article
Non-co
mmercial
use o
nly


![[Evaluation of composts from liquid manures for production of forest and ornamental plants]](https://static.fdokumen.com/doc/165x107/63417e5042b596795b0f72a7/evaluation-of-composts-from-liquid-manures-for-production-of-forest-and-ornamental.jpg)