
Effect of different parameters on the direct reduction processes ...
35
1 KTH - School of Industrial Engineering and Management Effect of different parameters on the direct reduction processes of natural iron ores from Uganda Master of Science Thesis by Wu Yunyun Division of Applied Process Metallurgy Department of Material Science and Engineering Royal Institute of Technology (KTH) Stockholm, Sweden 2012-04-10
-
Upload
khangminh22 -
Category
Documents
-
view
0 -
download
0
Transcript of Effect of different parameters on the direct reduction processes ...
1
KTH - School of Industrial Engineering and Management
Effect of different parameters on the direct
reduction processes of natural iron ores from
Uganda
Master of Science Thesis
by
Wu Yunyun
Division of Applied Process Metallurgy
Department of Material Science and Engineering
Royal Institute of Technology (KTH)
Stockholm, Sweden
2012-04-10

2
Content ABSTRACT……………………………………………………………………………...………3 ACKNOWLEDGEMENT…………………………………………………………………….....4 1. INTRODUCTION…………………………………………………………………….…....5
1.1 Chemical properties………………………………………………………………….….5 1.2 Physical properties………………………………………………………………….…...6 1.3 Thermal properties……………………………………………………………………....6 1.4 Main reduction routes for Butare iron lump ores……………………………………….7 1.5 Aim and Objective……………………………………………………………………....8
2. EXPERIMENTAL WORK…………………………………………………………….…...9
2.1 Experimental parameters design…………………………………………………….…..9 2.1.1 Reducing agent and flow rate…………………………………………………….....9 2.1.2 Temperature ………………………………………………………………………..10 2.1.3 Sample size………………………………………………………………………....12 2.1.4 Microstructure……………………………………………………………………...13 2.2 Experiment apparatus…………………………………………………………………..13 2.3 Experimental operations………………………………………………………………..14 2.4 Experiment proceeding graph…………………………………………………………..15
3. RESULTS AND DISCUSSION……………………………………………………....…...16
3.1 Reduction degree…………………………………………………………………….….16 3.2 Sample microstructure……………………………………………………………….….19 3.3 Reduction tendency of samples…………………………………………………………20 3.4 Effective parameters on reduction degree………………………………………….…...21 3.4.1 Flow rare……………………………………………………………………….……...21 3.4.2 Temperature………………………………………………………………………..….22 3.4.3 Sample weight………………………………………………………………………...23 3.4.4 The composition and microstructure of samples after reduction……………….…24
3.4.4.1 Sample A201……………………………………………………………………..25 3.4.4.2 Sample A206……………………………………………………………………..26 3.4.4.3 Sample A214……………………………………………………………………..27 3.4.4.4 Sample A220……………………………………………………………………..28
3.5 Reduction time of Butare iron lump ores ……………………………………………...29
4 CONCLUSIONS……………………………………………………………………….......33 5 FUTURE WORK…………………………………………………………………...……....34 6 REFERENCES…………………………………………………………………….…….…35

3
Abstract
Around 50 million tones hematite iron ores with high iron content at a grade of 68% were found
in Muko area of Uganda. Currently, the iron and steel making industry in the country has not yet
developed to meet the demand to process the natural ores. Based on the analysis of its
composition and mechanical properties, I infer that the natural iron lump ores can charge directly
into reduction furnace without any prior treatment, so that the cost of whole process without
additional enrichment and sintering will be reduced quite much. Also direct reduction iron (DRI)
process use natural gases instead of coals which can greatly reduce the environmental pollution
and lower the processes cost. If the raw materials that fit for requirements of majority plants, the
seller´s market can get greater control over prices, terms due to the easy and cheap processing. All
lump ores were from Butare area which is one occurrence of Muko and named sample A in this
work. This research aims to use the lowest cost method to reduce Butare area iron ores and find
out the optimum parameters on reduction reactions of Butare iron lump ores, such as flow rate,
temperature, size of samples. Base on experiments with different designed parameters, Butare
iron lump ores successfully reduced by DR furnace and microstructure was found to be an
important parameter that strongly influent reduction degree of Butare iron lump ores.
Keywords: Butare iron lump ores, direct reduction, temperature, flow rate, weight,
microstructure.
4
Acknowledgements
Firstly, I would like to thank professors Pär Jönsson and Du Sichen to offer me to do my master
thesis on metallurgy field and give me a lot of suggestions to do experiments.
Secondly, I want to express my gratitude to my supervisor Docent Andrey Karasev and Docent
Teng Lidong for their advices.
Lastly, I am very grateful to Ph.D student Mania Kazemi for doing experiments together with me.

5
1. Introduction
Worldwide, iron ore consumption for steelmaking was standing at 850 million tons at the end of
the twentieth century and was estimated to reach more than 1.3 billion tones over the first quarter
of the twenty-first century [1]. Uganda is a country that was famous by plenty of natural
resources underground. The deposit of iron ores in southwest region named Muko, estimated exist
30-50 million tones with a grade of 68% iron content. To find out the main elements that could
influence whole reduction process and the best reduction method, both internal factors, such as
sample chemical composition, mechanical properties, thermal stability and external reducing
environment were studied in this paper. All samples that tested by experiments were named
sample A and came from Butare area of Uganda.
1.1 Chemical properties
Samples came from Butare area are high grade hematite iron ores which have around 65% total
iron content. Hereby, I checked some high grade iron ores from references, which shown similar
compositions with quite low gangue materials (SiO2 +Al2Oз) as sample A in table 1. Many
researchers have studied that gangue materials strongly harmful effect on the iron ore reduction
process. But for Butare mine, the percentage of SiO2 +Al2Oз were investigated less than 4%
which means this influence would be neglected. Meanwhile, deterioration elements such as S, P
are around 0.001% and 0.009% respectively. Consequently, iron lump ores from Butare area have
a very high level of advantages on getting purer iron process at temperature lower than melting
point.
Table 1: Comparisons of chemical composition of different lump ores
Iron Ore
source
Chemical composition, mass%
Ref. Fe (total) Fe2O3 SiO2 Al2O3 MnO TiO₂
Butare mine
(Uganda)
64.82 92.6 2.28 1.35 0.01 0.07 2
L-A
(Australia)
65.34 91.76 2.17 1.34 0.47 0.03 3
L-B
(Australia)
64.22 90.22 2.30 0.57 0.14 0.02 3
L-C
(Australia)
64.07 91.05 2.18 1.10 0.17 0.03 3
Zenith mine
(India)
64.51 92.25 1.55 2.34 0.03 0.14 4
M.G.Mohanty mine
(India)
64.52 92.27 1.81 2.11 0.02 0.08 4
D.R.Pattnaikmine
(India)
65.22 93.26 0.92 1.62 0.06 0.07 4
6
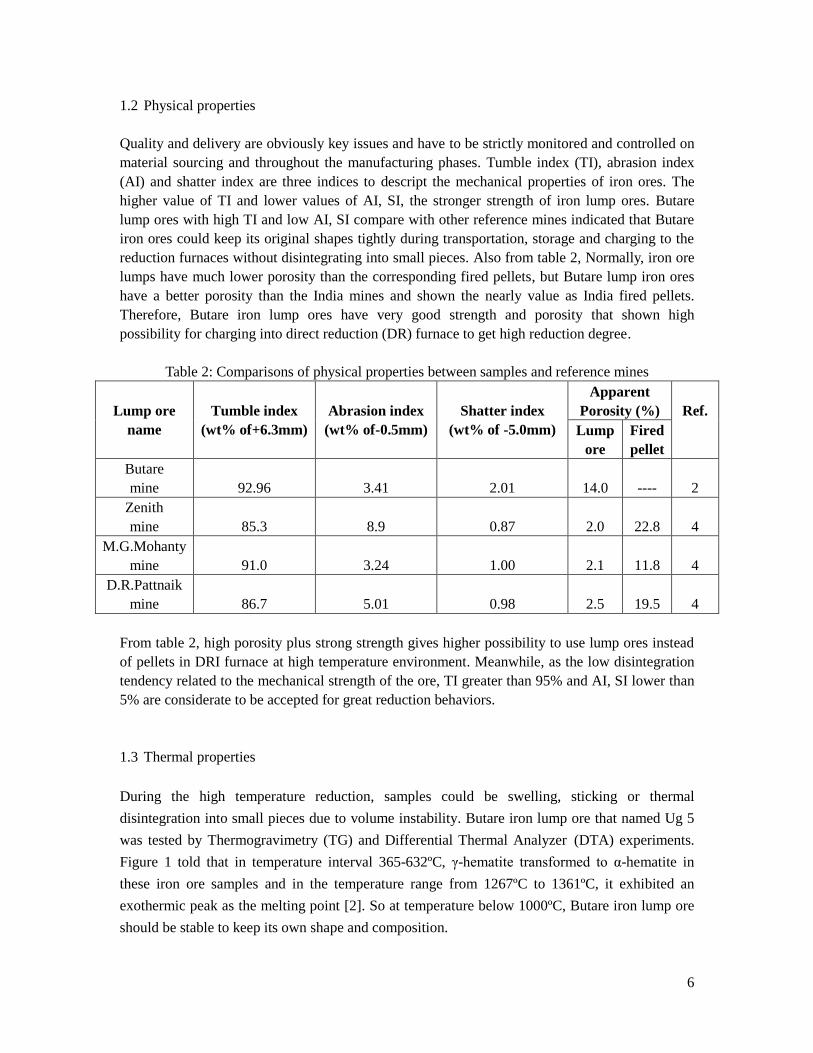
1.2 Physical properties
Quality and delivery are obviously key issues and have to be strictly monitored and controlled on
material sourcing and throughout the manufacturing phases. Tumble index (TI), abrasion index
(AI) and shatter index are three indices to descript the mechanical properties of iron ores. The
higher value of TI and lower values of AI, SI, the stronger strength of iron lump ores. Butare
lump ores with high TI and low AI, SI compare with other reference mines indicated that Butare
iron ores could keep its original shapes tightly during transportation, storage and charging to the
reduction furnaces without disintegrating into small pieces. Also from table 2, Normally, iron ore
lumps have much lower porosity than the corresponding fired pellets, but Butare lump iron ores
have a better porosity than the India mines and shown the nearly value as India fired pellets.
Therefore, Butare iron lump ores have very good strength and porosity that shown high
possibility for charging into direct reduction (DR) furnace to get high reduction degree.
Table 2: Comparisons of physical properties between samples and reference mines
Lump ore
name
Tumble index
(wt% of+6.3mm)
Abrasion index
(wt% of-0.5mm)
Shatter index
(wt% of -5.0mm)
Apparent
Porosity (%)
Ref.
Lump
ore
Fired
pellet
Butare
mine
92.96
3.41
2.01
14.0
----
2
Zenith
mine
85.3
8.9
0.87
2.0
22.8
4
M.G.Mohanty
mine
91.0
3.24
1.00
2.1
11.8
4
D.R.Pattnaik
mine
86.7
5.01
0.98
2.5
19.5
4
From table 2, high porosity plus strong strength gives higher possibility to use lump ores instead
of pellets in DRI furnace at high temperature environment. Meanwhile, as the low disintegration
tendency related to the mechanical strength of the ore, TI greater than 95% and AI, SI lower than
5% are considerate to be accepted for great reduction behaviors.
1.3 Thermal properties
During the high temperature reduction, samples could be swelling, sticking or thermal
disintegration into small pieces due to volume instability. Butare iron lump ore that named Ug 5
was tested by Thermogravimetry (TG) and Differential Thermal Analyzer (DTA) experiments.
Figure 1 told that in temperature interval 365-632ºC, γ-hematite transformed to α-hematite in
these iron ore samples and in the temperature range from 1267ºC to 1361ºC, it exhibited an
exothermic peak as the melting point [2]. So at temperature below 1000ºC, Butare iron lump ore
should be stable to keep its own shape and composition.

7
Sam
ple
weig
ht
(%
)
Temperature (O C)
Heat
flow
(
mW
/mg)
4
2
0
-2
-4
-692
94
96
98
100
200 400 600 800 1000 1200 1400
Butare - Ug5
Figure 1: Thermo-grams results of Butare lump iron ores. Curve 1 is the mass change of
samples by TG, Curve 2 is ex/end-othermic reactions by DTA [2]
1.4 Main reduction routes for Butare iron lump ores
Currently, Metallurgy method should meet the feasible technological and economical keys to
reach the industrial scale level and fulfill the production of green steelmaking process. The main
routes for lump ores to produce iron productions are sintering, direct reduction (DRI) and blast
furnace (BF) three categories. Butare lump iron ore was found to meet most of the feed raw
material requirements (physical, chemical and metallurgical) for both blast furnace and the major
direct reduction processes [2].
DR process generally defined as the reactions occurred below the melting point but blast furnace
normally worked in temperature higher than iron ores melt points which means BF method
consume more energy than DR route. On the other hand, due to the utilization of coal coke as the
reducing agent, much carbon and sulfur pollutant generated from the process. But for known
natural gases, which cost cheaper, produce less pollutant and easy to capture the generated gases.
Considering many factors such as lower energy consumption, lower investment costs, high
production value a higher flexible and using cheaper raw materials and reducing gases, less
pollutant from natural reducing gases and increasing cost of coke, DR technology presently has
demonstrated its flexibility and reliability through the operation of different industrial plants
worldwide. Furthermore, The Midrex and HYL process contributes the biggest share of the DRI
produced, which corresponds to about 60% of the world DR production. From the supply chain
view, raw materials could boost its value if fits with many manufacture plant and the supplier
could less depend on fluctuations from the purchasing market.
Curve 1
Curve 2
8
1.5 Aim and objective
The main purpose of this study is to use the cheapest reduction method, find out the main
influence factors on reduction process of Butare iron lump ores and determine the best parameters
of overall reduction process. Based on the analysis of its composition and properties, it is possible
to determine whether Butare area iron lump ores can appropriately serve as a raw material for
iron production by using the directly reduction (DR) method.
Design ideal reduction system for the processing of Uganda lump ore reduction to get high
reduction degree within short reduction time.
Find out the main influence factors on the reduction process
Determine the optimum parameters of reduction reactions.
Establish the possible prospects to use the lowest cost and pollutants green process.

9
2. Experimental work
All samples were tested in a lab direct reduction (DR) furnace. As investigated by many
researchers, four main experimental factors should be designed first for experiments.
2.1 Experimental parameters design
Reducing agent and flow rate
Temperature
Sample size
Microstructure
2.1.1 Reducing agent and flow rate
Argon was used to protect the resistor of furnaces and clean up air and pollutant gases inside the
reactor chamber. Generally, whole gas system of reduction process was performed by reactant
hydrogen and carbon monoxide and productions of CO2 and H2O, CH4 for suitable steel industry.
Carbon could be generated during the overall process as high content of CO in syngas. High
percentage of reducing gas CO also indicated the higher possibility to get carbon deposition and
carbides formation.
As investigated by researchers and steelmaking plants, the fastest reduction reaction obtained
when using as much as H₂ content with lowest CO% composition of mixture gases. CO gas is
cheap and can easily find at natural gases, mixture gases with CO and H₂ mainly used in
steelmaking plants. Table 3 listed the gas system of different DR process. Also Midrex gas gives
intermediate result and worked as the biggest DR steelmaking industry. It was recommend that
the ratio of mixture gases of hydrogen and carbon monoxide (H₂: CO) should be 1.6 to 1.8 for
steel industry [5]. In addition, the experimental setup was checked that it works stable if using
reducing gas ratio of H₂: CO = 1.5.
Table 3: Reducing Gas system used by various DR processes [5]

10
As many researcher studied, H2 have higher diffusion rate than CO in higher temperature
environment so that the reduction velocity of H2 is higher than CO. Figure 2 shown, at
temperature greater than 812°C, hydrogen is the primary reducing gas. But while the reducing
gases contain both H2O and CO2, the effective concentration of CO and H2 could be reduced by
the water gas shift reaction (WGSR): CO (g) + H2O (g) ↔ CO2 (g) + H2 (g), which shown the
method to converting CO gas to more usable H₂ , so that WGSR strongly influenced the speed of
reduction reactions. The “dash-dot” line in figure 2 indicates the WGSR: equilibrium line for a
gas mixture (CO + H2) [6]. Temperature change will shift the equilibrium position along this line
depending on temperature, higher temperature T₁ line in figure indicated more H₂O and less CO₂
content environment compare with lower temperature line T₂. In this case, WGSR turns to right
side and preferred to generate more hydrogen gas. Limited by WGSR, temperature was suggested
to be higher than 812°C to get faster process.
Figure 2: Water Gas Shift Reaction (WGSR) equilibrium diagram in general; definition of
variables: Temperature axis is normal to the paper and T2 is lower than T1 [6]
Flow rate defined as the gas velocity and strongly connect with the pressure in the reactor of
furnace. Theoretically, flow rate should be as high as possible to supply heat for reactions and
give the highest reduction until reaction equilibrium situation. But too high flow rate could obtain
dust carryout and the greater reducing gases than equilibrium state generate waste. According to
the overall reduction system and experiment equipment system, flow rate that higher than
equilibrium requirement was not suggested because of wasting. So hereby, flow rate was tested
from 0.25 to 1 L/min by experiment setup limitations.
2.1.2 Temperature
Reduction reaction of hematite will produce higher metallization degree as increase in reducing
gas inlet temperature. However, this increasing temperature is limited by physical properties of
iron. Based on the plant data, ring reduction temperature over than 880°C (1155K) will initiate
formation of sticky iron. It implies that reduction gas inlet temperature should be below than
973°C (1246 K), although metallization degree will still increase as shown on figure 3 [7]. Under
different temperature ranges, different reactions would happen, it means temperature setting used

11
in experiments was bounded by three reactions, sample thermal properties and limitation of
experimental setups.
Figure 3: Metallization degree as function of gas inlet temperature [7]
Reverse boudouard reaction: 2CO (g) →CO2 (g) + C (s). Samples should heat up greater than
725°C according to Ellingham diagram on figure 4. Otherwise, the carbon would be
deposited severely and formatted carbonization simultaneously during iron reduction process
then hinder the reduction reactions ongoing. Figure 4 also shown that the reduction of hematite to
wustite is favored at high temperatures. However, the capture of exhaust gas CO₂ via lime (CaO)
is generally favored at temperatures less than 900ºC. Nonetheless, the temperature window of
725–900ºC affords thermodynamically favorable reaction conditions for both the oxidation of
CO to CO₂ using iron oxide and the subsequent sequestration of CO₂ by lime [8]. Hence, in
this investigation, the temperature range of 725–900ºC was studied for the reduction process
by mixture gases hydrogen and carbon monoxide.
Figure 4: Gibbs free energy with temperature [8]

12
Water-gas-shift (WGS) reaction: CO (g) + H2O (g) ↔ CO2 (g) + H2 (g). As mixture gases of
hydrogen and carbon monoxide worked as the reducing agent, the performance of Hydrogen
restricted by temperature that should higher than 812ºC.
Reduction reactions on figure 5 indicated that temperature should be greater than 570ºC to
generate less magnetite. As all samples reduced by hydrogen and carbon monoxide, the
reduction process follow the stepwise as hematite to magnetite, magnetite to wustite, wustite
to iron finally. Fe2O3 transformation to Fe3O4 leaded to a volume change during the
reduction process. Crystallographic changes occur in the molecular arrangement,
consequently, high thermal strain increased volumetric strain and cracking tendency.
Figure 5: Mechanism of hematite reduction process [9]
Reduction gas temperature over than 973ºC (1246 K) is not recommended because the formation
of sticky iron. It implies that reduction gas inlet temperature should be lower than 973ºC (1246
K). It also mentioned that the pure iron ore could be swelling at 800-950ºC in DR process which
might reduce porosity of iron lump ores then decrease the reduction efficiency [10]. Meanwhile,
the controller temperature of experiment equipment must be no higher than 1100ºC which has
around 100ºC difference with reaction zone so that the reaction temperature should lower than
950°C. Hence, reduction temperature at 800-900ºC proved to show good performance during
DRI process.
2.1.3 Sample size
The sizes of particles linked with the gas-solid contact surface area. The larger area it is, the
higher reduction degree could be obtained. But the reactor tube of experimental equipment has an
inner diameter of 28 mm. To enable reducing gases passing through the reaction tube smoothly
together with the sample piece could be soaked in the reducing gas atmosphere completely, all
tested samples were made with the largest length around 20mm.
Sishen iron ores from South Africa had the similar composition and mechanical properties as our
samples which already studied in HYL methods. It suggested the oversize of iron lump ore was
20mm in table 4. Because the shapes of sample lump ores were difficult to control by operators.
Also if we respect the microstructure of samples which could cause different shapes after
crushing steps, all iron lump ores shown irregularly shapes. So that it is difficult to set the size as
main parameter. Since density of sample was fixed to be 5.7 g/cm³, the weight of sample instead
of sample size was set as the main parameter of reduction degree. According to estimate value of
sample volume, the weights of samples were checked ranging from 1 to 7 g.

13
Table 4: Comparisons of sizes between Sishen ores and sample A
Description Fe(%) SiO2(%) P(%) Oversize
(max)
Undersize
(max)
Ref
(Sishen)20mm
lump ore
66.00 3.70 0.057 20.0%+20mm 9.0%-8mm 11
Sample A 65.1 2.28 0.0087 23.27mm 11.31mm 2
2.1.4 Microstructure
Microstructure of sample gave information on grain size and shape, porosity and shapes of
sample after crushing, which is a very important parameter for DRI process. As we know, larger
sizes of grains are more difficult to react and have high resistance on corrosion. The reduction
normally occurred from out layer of grains then gradually went inside. So samples with smaller
size grains and high porosity microstructure could be reduced more completely under the same
reduction conditions.
2.2 Experiment apparatus
Experimental device worked on thermal gravimetric analysis (TGA) principles. Environment of
high temperature and high reducing gases content resulted in high iron reduction degree
according the Baur-Glaessner diagrams on figure 6. The graph of the apparatus described as
below figure 7: Reduction temperature controlled by controller and reducing gases passed
through downside of furnace which closed to the boating materials. It indicated that the whole
reduction atmosphere was surrounded by CO and H₂ with very high ratios of H₂/H₂O and CO
/CO₂ and production gases went away by the blowing reducing gases. Basing on the operator
skills, two thermocouples generally had not the same position which given two different reading
temperatures on the display panel. Both boating materials and reactor had no reaction with any
input ingredients.
Figure 6: Combination of the Baur-Glaessner diagram for H2-H2O and CO-CO2 atmosphere [12]

14
Figure 7: Sketch of experimental equipment
2.3 Experimental operations
Measure sample size and sample weight.
Clean the reaction container.
Set the computer parameters and run COM2 software program.
Put sample into the reaction zone and record the weight of sample from COM2 software.
Open the tap of cold water and switch Argon gas to be 1L/min around 20 minutes to clean up
reaction zone and balance zone.
Move up the sample from reaction zone and heat reaction zone up to reduction temperature.
Set the Argon flow rate to be 0.2L/min and wait the temperature to reach reduction
temperature.
Keep 10 minutes and check the conditions are all stable or not.
Switch reduction gases and set reduction flow rate then close Argon gas inlet in the reaction
tube and open the gas reaction tube.
Check the leaking of reduction gas.
Let the reduction gases inlet and wait around 5 to 10 minutes.
Move down the sample to the reduction furnace chamber.
Move up the sample from reduction zone while the reaction ended.
Turn off the reduction gases and set the Argon flow rate to be 1 L/min.
Close the gas reaction tube and open the Argon reaction tube.
Cooling sample and pick sample out from reaction tube.

15
2.4 Experiment proceeding graph
Twenty samples were tested to check the reduction properties of Butare iron lump ores. As shown
in figure 8 , sample weight keep decreasing which caused by vapor water and dust blowing away,
during period 0-A of sample heated form room temperature to around 170°C with a heating rate 6
degree/min.
Figure 8: Reduction process of sample A
As the sample was balanced after moving it down to the reduction furnace chamber at A point in
figure 8, I point is sample initial weight before put it into equipment. During I to A period, water
weight loss due to temperature higher than 100°C and dust remove by gas inlet lead to weight of
sample keeping decrease firstly. But while the sample move down to furnace, the force added on
the reaction chamber caused the increasing of sample weight in a short moment. Iron lump ore
reacted with reducing gases so that the weight of sample keeping decrease until C point. Point C
is the moment that weight did not decrease which means the reduction process end up. Point F is
the moment that sample was picked out from experimental equipment. So reduction time (RT) =
tC – tA and weight change caused by reduction process ∆W = WI - WF.
Meanwhile, the temperature of sample increased very fast from D point while it move down to
the reaction furnace and took 3-5 minutes to reach the reaction zone temperature. Temperature of
sample was obtained increase to 600°C within 1 min which could give very fast reduction
reactions. Period D-E takes less than 5% of whole reduction process. So we can assume that
samples were reduced at the setting constant reduction temperature.
16
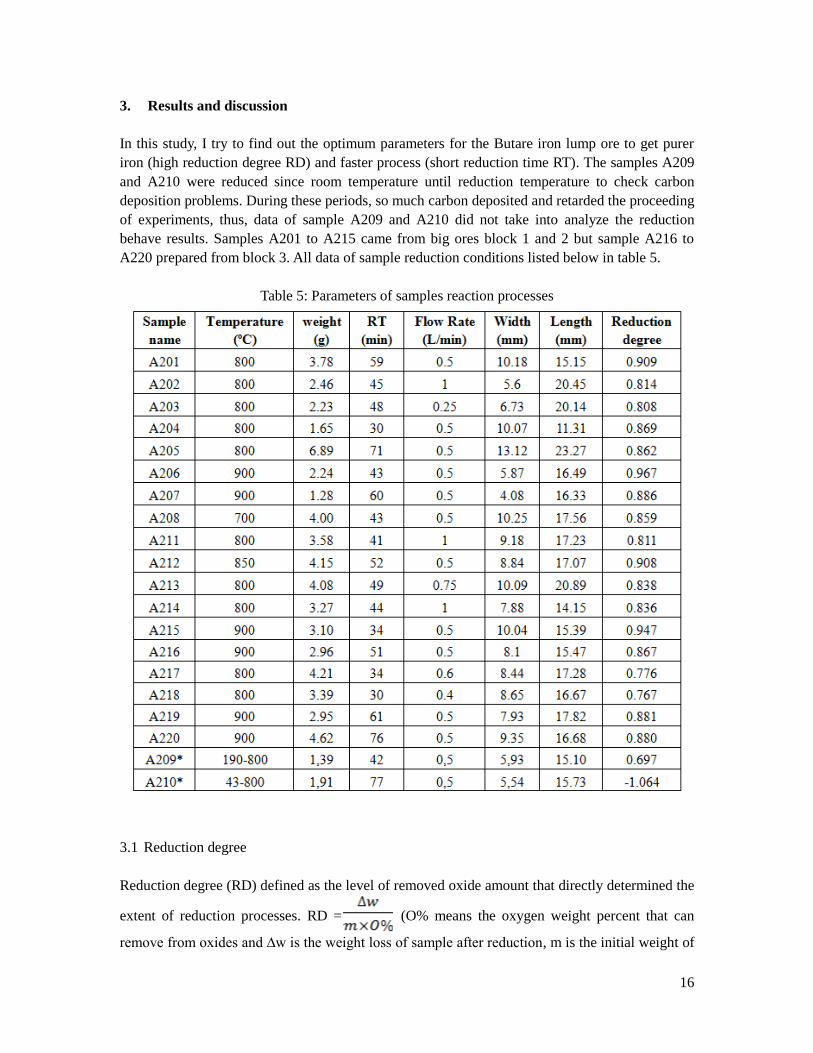
3. Results and discussion
In this study, I try to find out the optimum parameters for the Butare iron lump ore to get purer
iron (high reduction degree RD) and faster process (short reduction time RT). The samples A209
and A210 were reduced since room temperature until reduction temperature to check carbon
deposition problems. During these periods, so much carbon deposited and retarded the proceeding
of experiments, thus, data of sample A209 and A210 did not take into analyze the reduction
behave results. Samples A201 to A215 came from big ores block 1 and 2 but sample A216 to
A220 prepared from block 3. All data of sample reduction conditions listed below in table 5.
Table 5: Parameters of samples reaction processes
3.1 Reduction degree
Reduction degree (RD) defined as the level of removed oxide amount that directly determined the
extent of reduction processes. RD = (O% means the oxygen weight percent that can
remove from oxides and ∆w is the weight loss of sample after reduction, m is the initial weight of
17
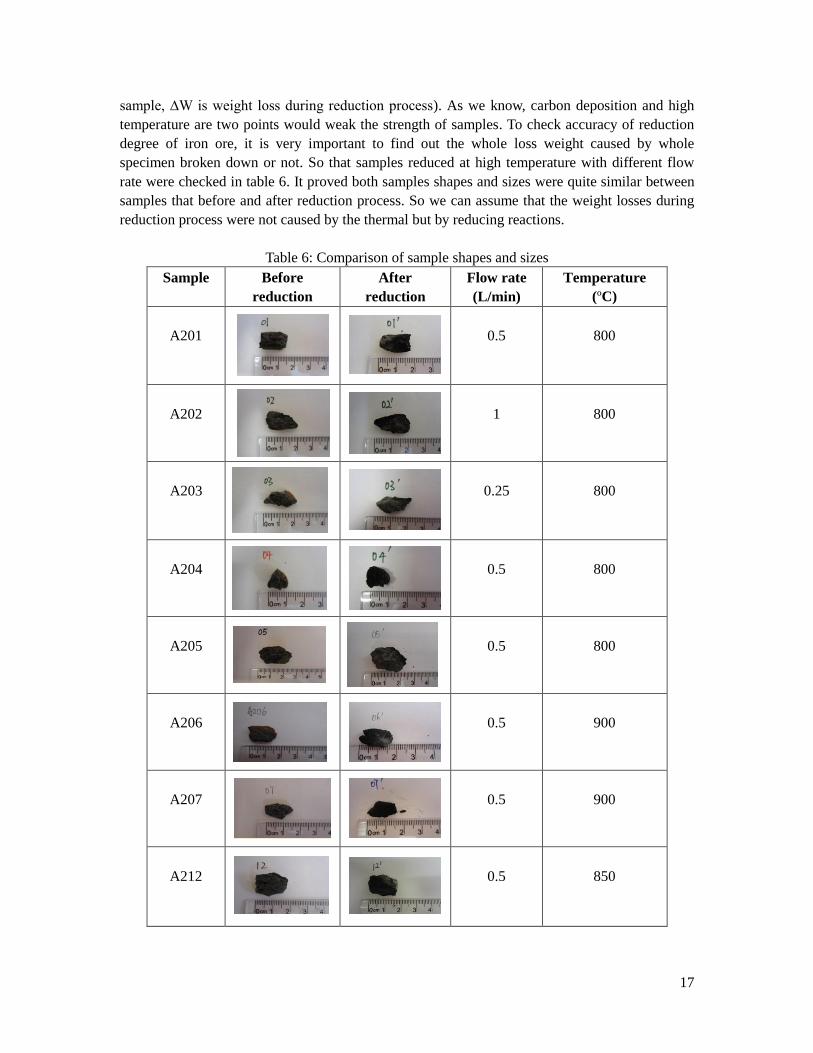
sample, ∆W is weight loss during reduction process). As we know, carbon deposition and high
temperature are two points would weak the strength of samples. To check accuracy of reduction
degree of iron ore, it is very important to find out the whole loss weight caused by whole
specimen broken down or not. So that samples reduced at high temperature with different flow
rate were checked in table 6. It proved both samples shapes and sizes were quite similar between
samples that before and after reduction process. So we can assume that the weight losses during
reduction process were not caused by the thermal but by reducing reactions.
Table 6: Comparison of sample shapes and sizes
Sample Before
reduction
After
reduction
Flow rate
(L/min)
Temperature
(ºC)
A201
0.5
800
A202
1
800
A203
0.25
800
A204
0.5
800
A205
0.5
800
A206
0.5
900
A207
0.5
900
A212
0.5
850
18
The chemical composition of sample A is listed in table 7. Only oxides (FeO and Fe2O3) were
calculated to be reduced during the overall reduction process due to below two points.
At temperature range 700 – 900°C, according to Ellingham-diagram, FeO and Fe2O3 will
be reduced together with the neglect content of ZnO and CuO before others oxides.
The sulfur and phosphide would De-S and De-P after reduction process which happened
in EAF at high temperature ranges greater than melting point.
Table 7: Composition of sample A [2]
Ore
name
Chemical composition, mass%
Fe2O3 FeO SiO2 Al2O3 MnO TiO2 ZnO CuO MgO P2O5 S
Sample
A
92.6
0.44
2.28
1.35
0.01
0.07
<0.01
<0.01
0.11
0.02
0.001
Consequently, the totally removed oxygen content O% = * 100% =
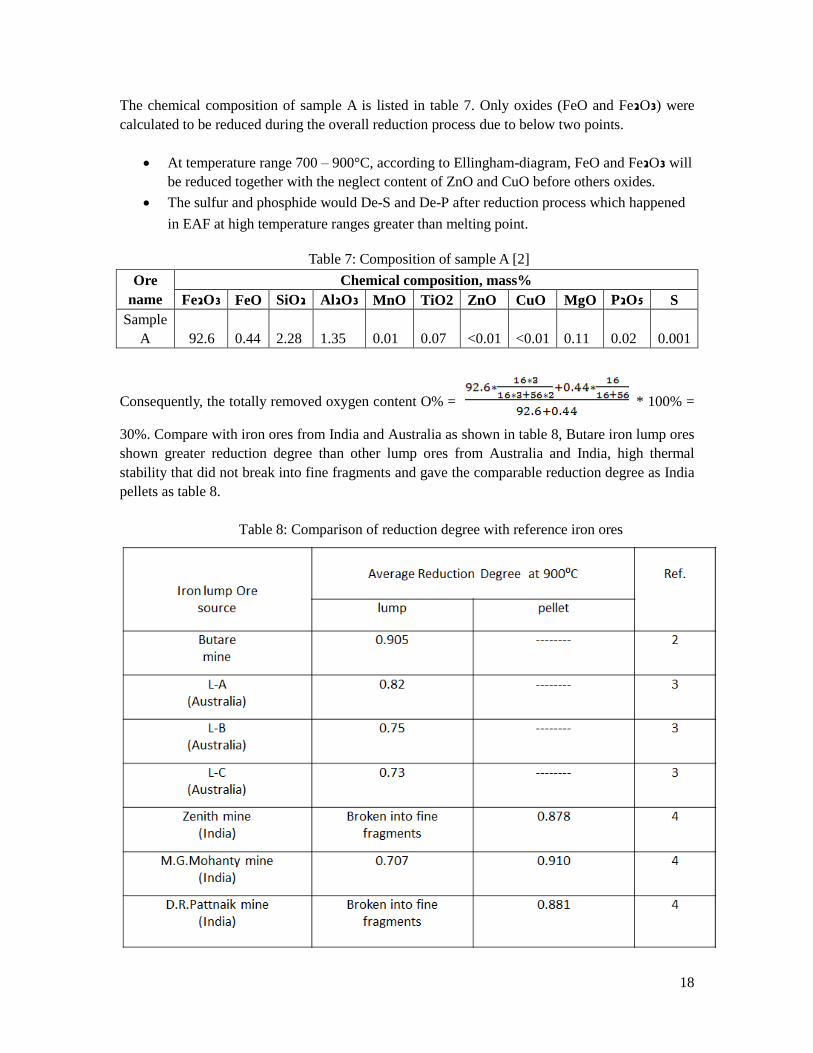
30%. Compare with iron ores from India and Australia as shown in table 8, Butare iron lump ores
shown greater reduction degree than other lump ores from Australia and India, high thermal
stability that did not break into fine fragments and gave the comparable reduction degree as India
pellets as table 8.
Table 8: Comparison of reduction degree with reference iron ores

19
3.2 Sample microstructure
All samples used in this research came from Butare area of Uganda. Different positions of mine
might have different chemical compositions and microstructures then influent the reduction
process. In this case, all samples tested, respectively, were from top side, middle part and bottom
layer of mine and named block 1(B1), block 2(B2), and block 3(B3) here to check reduction
characterizers of sample ores.
The microstructures were checked by scanning electron microscope (SEM) as figure 9, samples
iron ores that that came from block 1 (B1) and block 2 (B2) almost have the same microstructure
which were consist by the long and small strip grains, the clear grain boundary and small pores
between each grains. But samples from block 3 shown it have much bigger grain size and fewer
pores between each grain. As all tested samples were from different blocks, we can predict that
samples from block 3 could obtain lower reduction degree compare with smaller grain size
samples from block 1 and 2. Meanwhile, the whole reduction reactions started from outside layer
then went inside. Bigger size grains were adjusted by researchers would more difficult to be
reduced so block 3 could need longer reduction time compare with block 1 and 2 samples.
Figure 9: Microstructures of three Butare iron lump ore Block

20
3.3 Reduction tendency of all samples
The weight loss tendency of all samples during whole reduction processes was shown in figure 10,
weight loss gradually decrease with reduction time. The red area in figure 10 is the period which
samples took to reach the desired reduction temperature in reaction zone. As shown in figure 8
that A-B period is 3 to 5 minutes, which is a short time compared with the whole process. But the
reduction degrees of samples in period are relatively large around 10-20%. Fe3O4 supposed to be
generated more at temperature lower than 600°C. The drawback can be eliminated by improve
operation steps and there are four factors to cause this undesired result:
As we know, the porosity of out layer determined the rate of diffusion reducing gases,
furthermore decrease the reduction degree and reduce quality of reduction processes.
Transformation of hematite to magnetite leaded to crystallization swelling and sample
volume change at out layer. In this case, the porosity of sample would reduce and caused
a lower and slower reduction process.
It was easier for reducing gas diffuse through outside layer and getting more and more
difficult inside, thus the reduction process was very fast during A-B period.
Hematite started to react by hydrogen and carbon monoxide since beginning at very low
temperature and sample temperature reached to 600ºC within one minute, then reaction
would be very fast from outside layer went to inner part.
The Gas-solid contact area was larger and outer reduced iron part had higher content of
weight compare with inner part as shown in figure 11. So the total removed oxygen
weight was high and the process finished fast.
Figure 10: Weight change (ΔW) within the reduction time
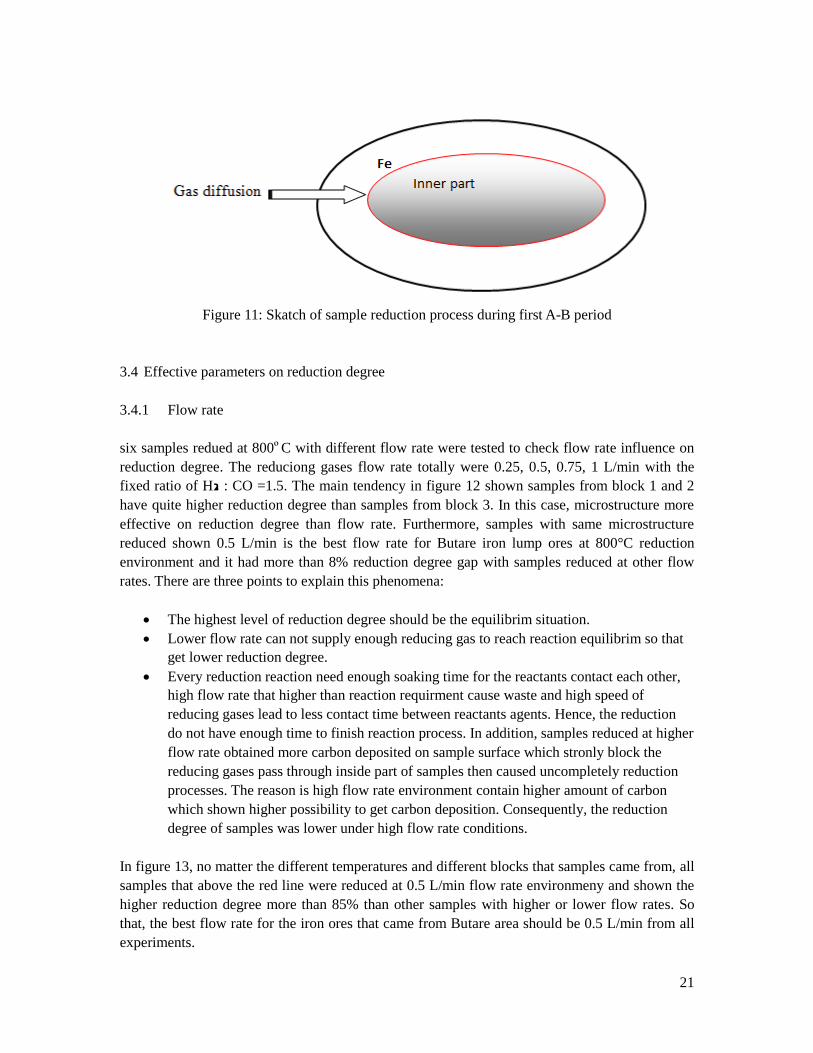
21
Figure 11: Skatch of sample reduction process during first A-B period
3.4 Effective parameters on reduction degree
3.4.1 Flow rate
six samples redued at 800ºC with different flow rate were tested to check flow rate influence on
reduction degree. The reduciong gases flow rate totally were 0.25, 0.5, 0.75, 1 L/min with the
fixed ratio of H2 : CO =1.5. The main tendency in figure 12 shown samples from block 1 and 2
have quite higher reduction degree than samples from block 3. In this case, microstructure more
effective on reduction degree than flow rate. Furthermore, samples with same microstructure
reduced shown 0.5 L/min is the best flow rate for Butare iron lump ores at 800°C reduction
environment and it had more than 8% reduction degree gap with samples reduced at other flow
rates. There are three points to explain this phenomena:
The highest level of reduction degree should be the equilibrim situation.
Lower flow rate can not supply enough reducing gas to reach reaction equilibrim so that
get lower reduction degree.
Every reduction reaction need enough soaking time for the reactants contact each other,
high flow rate that higher than reaction requirment cause waste and high speed of
reducing gases lead to less contact time between reactants agents. Hence, the reduction
do not have enough time to finish reaction process. In addition, samples reduced at higher
flow rate obtained more carbon deposited on sample surface which stronly block the
reducing gases pass through inside part of samples then caused uncompletely reduction
processes. The reason is high flow rate environment contain higher amount of carbon
which shown higher possibility to get carbon deposition. Consequently, the reduction
degree of samples was lower under high flow rate conditions.
In figure 13, no matter the different temperatures and different blocks that samples came from, all
samples that above the red line were reduced at 0.5 L/min flow rate environmeny and shown the
higher reduction degree more than 85% than other samples with higher or lower flow rates. So
that, the best flow rate for the iron ores that came from Butare area should be 0.5 L/min from all
experiments.

22
Figure 12: Redcution degree and flow rate
Figure 13: Reduciton degree and sample weight
3.4.2 Temperature
As we know, Diffusion rate of reducing gases increased with reaction temperature from 700 to
900°C. Thus, reduction degree of samples increased with reaction temperature as many
researchers have proved. Besides, samples reduced at high temperature 900°C shown small
cracks on the surface which lead to free diffusion of reducing gases. As we know, free diffusion
rate offer more completely reactions and faster processes so that the reduction degree could be
higher than other samples that reduced by volume diffusion.
Under same flow rate conditions, all samples with same microstructure shown reduction degree

23
of sample increased with reaction temperature under the same flow rate 0.5 L/min. But samples
came from block 1 and 2 had the reduction degree of around 8% higher than block 3, it
furthermore proved the strong influence from microstructure.
Figure 14: Reduction degree Vs temperature
3.4.3 Sample weight
Theoretically, finer particles have better reduction degree because the reactions happened more
completely. For raw iron ore materials, the exact size range was bounded with crushing skills that
indicated high fluctuation could obtained on sample size. As the density of hematite iron ore were
stable at a vule of 5.7 g/cm³, the volume or size of samples changed together with the mass of
samples then weight of sample turned to be the parameters which was easier to control.
Figure 15 shown every curve have a peak point 3.78g, 3.27g, 2.24g for different environment
reduction processes. It means diverse conditions have each the best range of sample weight and
the best weight range could be 2 to 4 g. Furthermore, under 800ºC, samples tested at 1 L/min and
0.5 L/min shown a minimum 7.3% gap of reduction degree. Samples reduced at 900 ºC in Fig.
15 b shown better reduction degree than samples reduced at 800 ºC. So, Butare iron lump ores
should choose temperature at 900 ºC and 0.5 L/min flow rate conditions to get better reduction
degree.
High flow rate caused more carbon deposite on samples surface which blocked the
reaction proceeding. Thus the reduction degree of samples were lower in high flow rate
environment.
High temperature lead to free diffusion of gases and higher diffusion rate of reducing
gases that gave higher reduction degree.
Different reduction environment with different flow rate and temperature shown different
equilibrium situations which means sample weight that meet the requirment of equilibrim

24
could be different. The equilibrium state means highest reduction degree could obtained,
in this case, the sample weight shown its best range under different reduction processes.
Figure 15: reduction degree and sample weight. a) all samples reduced at 800ºC; b) all samples
reduced at 900ºC.
3.4.4 The composition and microstructure of samples after reduction process
How much volume of samples had reduced during the process, why microstructure shown its
important influence on reduction degree compare with flow rate and temperatuer and which kind
of reduction mechanisams for our relatively high porosity iron lump ores?
To understand well about this three points, microstructures and compositions in the middle part of
each sample were checked by SEM to ensure the whole reduction reaction have done completely
on total pieces or not.

25
Iron ore from different blocks shown quite different results although reduced at same conditions
in table 5. Thus, microstructure could be an important parameter on effect reduction processing.
Normally, the middle inner part of sample would reduce more difficult due to lower diffusion rate
of reductant gases and lower porosity of sample in high temperature range. Hereby, I choosed
samples which represented different parameters (temperature, flow rate, microstructure) and the
highest reduction degree sample A206 to be tested. Also, the tested four samples had four
different shapes respectively as triangle, tectangular, oval, and irregularity.
Sample from different blocks such as A206 and A220.
Sample A201 and A206 were from different temperature.
Sample A201 and A206 had different flow rate.
3.4.4.1 Sample A201
Sample A201 came from block 1 was reduced at 800ºC with 0.5 L/min flow rate and seen as the
normal situation. The reduction degree was 90.9%. Table 9 listed compositions of the different
points that choosed as different phases in SEM photos.
White area represented the pure iron which means the part of iron ore totally be reduced as point
2. Gray area as point 1 was check to be FeO content in figure 16. So the middle part of sample
A201 was reduced and have many pores inside. Thus, the whole reduction process determined by
porosity and diffusion rate of reducing gases. Figure 16 shown the pure iron content area was
larger than FeO content surface and it still have some samller pores as point 5, so that the
reduction degree was high and take up around 90.9%. Also, we can check each grain of sample
was reduced from out layer went inside. So it proved that bigger size grains take longer time to be
reduced and the reduced pure iron part took up less weight percentage of each grains.
Table 9: Composition of sample A201
Spectrum
(A201)
Element ( wt% )
Composition
O
Fe Others (Si, Al)
1
24.11
75.58
0.31
FeO
2
0
99.90
0.10
Fe
3
14.03
85.33
0.64
Fe mix FeO
5
2.86
96.92
0.22
Pore
6
10.82
88.67
0.51
Fe mix FeO

26
Figure 16: Microstructure of sample A201
3.4.4.2 Sample A206
Sample A206 tested at 900ºC with 0.5L/min flow rate and was from block 1. White areas in the
picture represent pure iron. The reduction degree of A206 was 96.7% which proved by the figure
17 under SEM photo.
The middle part of sample still shown high reduced iron content which indicated the reduction
time of process governed by gases diffusion rate into inner layer. But it still shown many small
pores inside the materials which means reducing gases can pass through into middle part easier
than other samples. Only a little dark area in the bigger grains of the middle part that surrounded
by compacted iron was not reduced. As the reduction process went gradually from out layer
inside inner part, at 900°C, high temperature have high efficiency diffusion rate, so that higher
temperature caused completely reduction process.

27
Table 10: Composition of sample A206
Spectrum
(A206)
Element (wt%)
Composition
O
Fe Others (Si, Al)
1
24.11 75.58 0.31 FeO
2
0 99.90 0.10 Fe
3
14.03 85.33 0.64 Fe mix FeO
4
2.86 96.92 0.22 Fe
Figure 17: Microstructure of sample A206
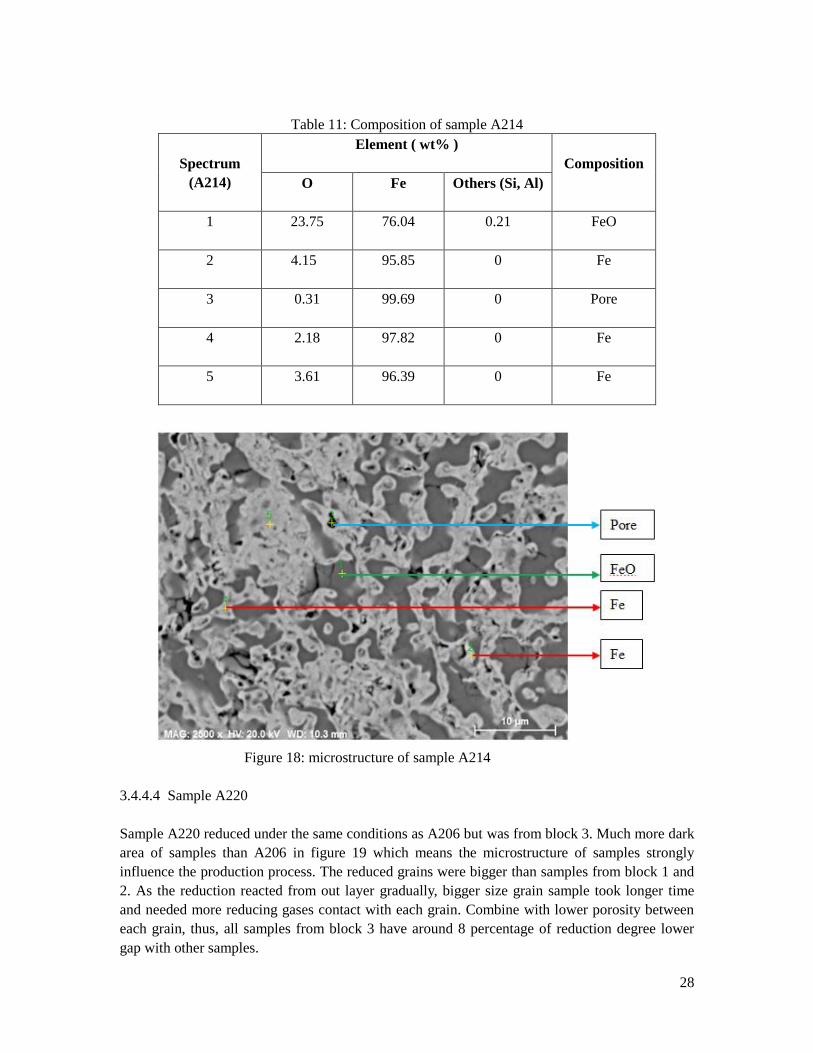
3.4.4.3 Sample A214
Sample A214 from block 2 and reduced at 800ºC with high flow rate 1 L/min. Compare with
normal situation, high flow rate gave high amount of CO content in whole reduction gas system
which could cause high possibility of carbon deposition. Compare with sample A201, large area
of FeO still did not be reduced and the white pure iron area was very small. It looked like that the
reduction process was limited by the high flow rate. Carbon deposited more service on the surface
of sample which blocked the reducing gases diffused inside the inner part. Thus, larger area of
grey surfaces obtained in sample A214 grains.
28
Table 11: Composition of sample A214
Spectrum
(A214)
Element ( wt% )
Composition
O
Fe Others (Si, Al)
1
23.75 76.04 0.21 FeO
2
4.15 95.85 0 Fe
3
0.31 99.69 0 Pore
4
2.18 97.82 0 Fe
5
3.61 96.39 0 Fe
Figure 18: microstructure of sample A214
3.4.4.4 Sample A220
Sample A220 reduced under the same conditions as A206 but was from block 3. Much more dark
area of samples than A206 in figure 19 which means the microstructure of samples strongly
influence the production process. The reduced grains were bigger than samples from block 1 and
2. As the reduction reacted from out layer gradually, bigger size grain sample took longer time
and needed more reducing gases contact with each grain. Combine with lower porosity between
each grain, thus, all samples from block 3 have around 8 percentage of reduction degree lower
gap with other samples.

29
Table 12: Composition of sample A220
Spectrum
(A220)
Element (wt%)
Composition
O
Fe Others (Si, Al)
1
24.04 75.96 0 FeO
2
0 100 0 Fe
3
0.89 99.11 0 Pore
Figure 19: Microstructure of sample A220
3.5 Reduction time of Butare iron lump ore
Not only reduction degree seems as the main feature to evaluate the reduction processes of iron
ores, but also the reduction time. Nowadays, every factory for steelmaking wants the fast and
great reduction process. Reduction time defined as the period that reduction of iron ore start until
the weight of sample did not change during whole reduction process. Thus, the overall gas-solid
reduction process is constituted by five steps:
Transportation of Reducing gas into the surface of lump ore
Chemical reaction of reducing gases and lump iron ore
The reducing gases passed through iron and diffuse inward to the inner part.
The product gases outwards from iron ores
Reducing gas transport to outside

30
Consequently, the whole reduction process should be determined by two steps: the speed of
chemical reaction and the diffusion process. If the temperature is not so high, the whole process
could be controlled by chemical step, because of the high porosity and flow rate. Oppositely, high
temperature cause bigger granularity then the diffusion step determined the total reduction
periods. The slower step controls the whole process and generally, there are three reduction
modes for iron ores:
The first mode, while the iron ore is compacted structure that has low porosity, the
reduced layer diffuse into the inner part gradually which indicated the middle unreduced
part getting smaller and smaller.
The second mode described the high porosity iron ores that reducing gas can diffuse
inside easily and our samples are belongs to this reduction mode which already checked
by SEM. Also in high temperature the diffusion step controlled whole process so that gas
diffusion rate determined reduction time.
If the soften temperature is low, the porosity getting very small while the sample reach
the soften temperature. In this case, the reduction speed is decreased in the high
temperature environment.
Normally, the main parameters effect on reduction time were carbon deposition and temperature
which strongly influent the diffusion rate of reducing gases. Carbon deposited on the surface area
strongly hindered the reducing gases diffusion.
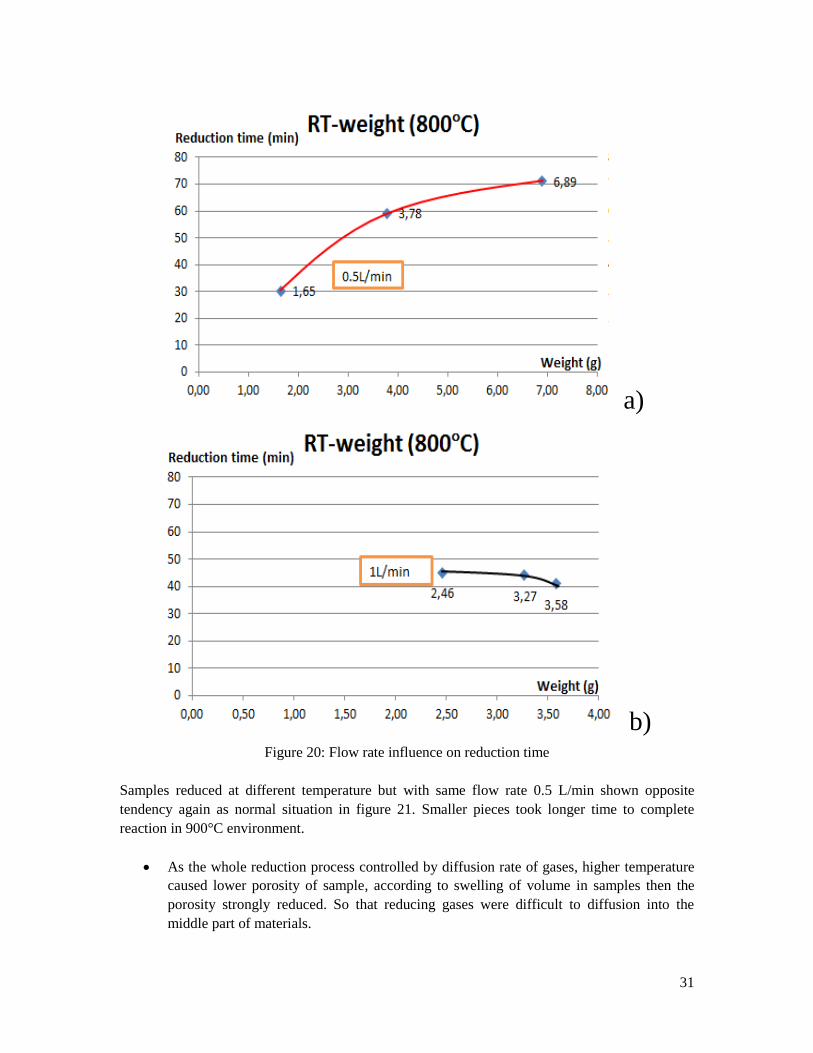
Hereby, reduction reactions happened at 800 degree with 0.5 L/min seen as the normal situation.
In figure 20 a), samples took longer time to complete reduction process with increasing sample
weight. But figure 20 b) shown the opposite tendency as samples reduced at high flow rate.
Checked by SEM, samples after reduction with high flow rate shown larger unreduced area and
reduction degrees all were lower than normal situation. Also, samples reduced at high flow rate
could see more carbon deposition on the surface layer while we picked out samples from reaction
furnace. Relatively, samples at high flow rate reduction environments take shorter reduction time
to finish whole processes since the surface carbon block the whole proceeding.
Why smaller size samples reduced at high flow rate takes longer time to finish reduction process
in figure 20 b)?
Specific surface area (SSA) is a very important paratmeters to check absorption and
reaction happened on surface and it defines as surface area devide sample weight, in this
case, smaller weight samples respectively have bigger value of SSA.
As the high flow rate gave higher carbon depositon on surface which caused by high
concentration of carbon monoxide gas, thus, smaller sample with high SSA will be
blocked easier and took longer time to diffuse reducing gases inside. So, smaller samples
took longer time to complete whole process.
31
a)
b)
Figure 20: Flow rate influence on reduction time
Samples reduced at different temperature but with same flow rate 0.5 L/min shown opposite
tendency again as normal situation in figure 21. Smaller pieces took longer time to complete
reaction in 900°C environment.
As the whole reduction process controlled by diffusion rate of gases, higher temperature
caused lower porosity of sample, according to swelling of volume in samples then the
porosity strongly reduced. So that reducing gases were difficult to diffusion into the
middle part of materials.

32
Smaller size samples with bigger value SSA were easier to get sinterskin on surface in
high temperature (900°C) environment and sinterskin on the surface strongly blocked the
reduction process.
Samples reduced at 900°C shown many small cracks on the surface. While sample move
down to reduction furnace, the uneven heat distribution of samples yielded cracks on
bigger samples surfaces and leaded to gas free diffuse inside the samples which gave
much higher reduction degree compare with smaller samples.
a)
b)
Figure 21: Temperature influence on reduction time
33
4. Conclusions
Butare area iron lump ores can be reduced by direct reduction method and get relatively
high reduction degree. The reduced sample kept its shape without breaking into small
fragments at high temperature 900°C.
Reduction degree of samples increases with reaction temperature. Samples reduced at
high temperature 900 ºC shown higher reduction degree in comparison with samples
reduced at 700 - 850°C (the difference of reduction degree ∆RD is around 8 - 11%).
At 900°C, H2 worked as the more effective reducing gas to give higher reduction degree
and faster process.
0.5 L/min is the best flow rate for Butare iron lump ores compare with other flow rates
(∆RD ~ 8 - 10%).
Sample weight influent reduction degree, under different reduction conditions, samples
shown the best weight ranges. Although the reduction process occurred at its own best
weight range, the different reduction processes still shown the difference ∆RD ~ 2.5 –
8%.
Microstructure strongly influent reduction degree, smaller grain size samples reduced
faster and more completely (∆RD ~ 8%).
Samples reduced at high flow rate 1L/min and high temperature 900°C took longer
reduction time although the sample weight was smaller.
Butare iron lump ores could get its best reduction degree at 900°C with 0.5 L/min flow
rate.

34
5. Future work
Improve experimental operations.
Do more experiments on high temperature with high flow rate.
Do more experiments on each parameter to ensure every tendency.
Check the thermal degradation index of samples.
Focus on microstructure influence.
35
6. References
1) F. E. Katrak, Iron and Steel Future of Encyclopedia of Materials Science and Technology,
2008, 4292-4295
2) Abraham Judah Bumalirivu Muwanguzi, Characterisation of Muko Iron Ores (Uganda) for
the different Routes of Iron Production, ISBN: 978-91-7415-725-3
3) S. L. Wu, H. F. Xu and Y. Q. Tian, Evaluation of lump ores for use in modern blast furnaces
as part of mixed burden practice, Ironmaking & Steelmaking, 2009, Vol. 36, No. 1. pp. 19-23
4) M. Kumar, S. Jena, and S. K. Patel, Characterization of properties and reduction behavior of
iron ores for application in sponge ironmaking, ISSN: 0882-7508
5) http://www.teamorissa.org/Convention_%20Presentations_%20Sessionwise/Session-4/Sessio
n4-5%20Rajesh_Jha_Coal%20Gasification%20&%20SynGas%20based%20DRI_PPT_5.pdf
6) Raymond Longbottom and Leiv Kolbeinsen, Iron ore Reduction with CO and H2 Gas
Mixtures – Thermodynamic and Kinetic Modelling, Proceedings of the 4th Ulcos seminar,
1st & 2nd October 2008
7) Bayu Alamsari, Shuichi Torii, Yazid Bindar and Azis Trianto, Numerical Analysis of the
Effect of Reduction Gas Composition and Temperature on the Quality of Sponge Iron
Product, 2010 Second International Conference on Computer Engineering and Applications
8) K. Mondal, H. Lorethova, E. Hippo and T. Wiltowski, S.B. Lalvani, Reduction of iron oxide
in carbon monoxide atmosphere—reaction controlled kinetics, Fuel Processing Technology
86 (2004), pp. 33– 47
9) A. Pineau, N. Kanari and I. Gaballah, Kinetics of reduction of iron oxides by H2 Part I: Low
temperature reduction of hematite, Thermochimica Acta 447 (2006), pp. 89–100
10) http://www.energiron.com/Tour/HYL%20DR-Minimill%20QTVR%20tour/files/supportdocs
/overview/ironore.pdf
11) http://www.exxaro.com/pdf/icpr/ip/metal_processing/iron.htm
12) http://www.patentgenius.com/image/6569377-6.html
http://www.energiron.com/Tour/HYL%20DR-Minimill%20QTVR%20tour/files/supportdocs/overview/ironore.pdf