Effect of Diet Supplementation on Water Quality, Phytoplankton Community Structure, and the Growth...
24
Effect of Diet Supplementation on Water Quality, Phytoplankton Community Structure, and the Growth of Nile Tilapia, Oreochromis niloticus (L.), Common Carp, Cyprinus carpio (L.), and Silver Carp, Hypophthalmichthys molitrix (V.), Polycultured in Fertilized Earthen Ponds Mohsen Abdel-Tawwab Ali E. Abdelghany Mohammad H. Ahmad ABSTRACT. In semi-intensive aquaculture systems, cultured fish can rely on natural food, produced through fertilization, up to certain size. Beyond this size, supplemental diet becomes imperative to sustain opti- mum fish growth. The application of supplemental diet to fish ponds should be optimized. In this regard, the present study was carried out to examine the relative importance of top-down (fish predation) and bot- tom-up (nutrient addition) control to phytoplankton dynamics in earthen fish ponds receiving different rates of supplemental feed for 19 weeks, and polycultured with Nile tilapia, Oreochromis niloticus (L.); common carp, Cyprinus carpio (L.); and silver carp, Hypophthalmichthys molitrix Mohsen Abdel-Tawwab, Fish Ecology Department, Ali E. Abdelghany and Mohammad H. Ahmad , Fish Nutrition Department, Central Laboratory for Aquaculture Research, Abbassa, Abo-Hammad, Sharqia, Egypt. Address correspondence to: Mohsen Abdel-Tawwab at the above address (E-mail: [email protected]). Journal of Applied Aquaculture, Vol. 19(1) 2007 Available online at http://jaa.haworthpress.com © 2007 by The Haworth Press, Inc. All rights reserved. doi:10.1300/J028v19n01_01 1
-
Upload
independent -
Category
Documents
-
view
0 -
download
0
Transcript of Effect of Diet Supplementation on Water Quality, Phytoplankton Community Structure, and the Growth...

Effect of Diet Supplementationon Water Quality, Phytoplankton
Community Structure,and the Growth of Nile Tilapia,
Oreochromis niloticus (L.), Common Carp,Cyprinus carpio (L.), and Silver Carp,
Hypophthalmichthys molitrix (V.),Polycultured in Fertilized Earthen Ponds
Mohsen Abdel-TawwabAli E. Abdelghany
Mohammad H. Ahmad
ABSTRACT. In semi-intensive aquaculture systems, cultured fish canrely on natural food, produced through fertilization, up to certain size.Beyond this size, supplemental diet becomes imperative to sustain opti-mum fish growth. The application of supplemental diet to fish pondsshould be optimized. In this regard, the present study was carried out toexamine the relative importance of top-down (fish predation) and bot-tom-up (nutrient addition) control to phytoplankton dynamics in earthenfish ponds receiving different rates of supplemental feed for 19 weeks,and polycultured with Nile tilapia, Oreochromis niloticus (L.); commoncarp, Cyprinus carpio (L.); and silver carp, Hypophthalmichthys molitrix
Mohsen Abdel-Tawwab, Fish Ecology Department, Ali E. Abdelghany andMohammad H. Ahmad , Fish Nutrition Department, Central Laboratory for AquacultureResearch, Abbassa, Abo-Hammad, Sharqia, Egypt.
Address correspondence to: Mohsen Abdel-Tawwab at the above address (E-mail:[email protected]).
Journal of Applied Aquaculture, Vol. 19(1) 2007Available online at http://jaa.haworthpress.com
© 2007 by The Haworth Press, Inc. All rights reserved.doi:10.1300/J028v19n01_01 1

(V.). Ten earthen ponds (0.1 ha each) were used in this study. Each pondwas stocked with 1,000 Nile tilapia (13.7�1.2 g), 200 common carp(10.7�1.7 g) and 1,000 silver carp (1.8�0.3 g). The supplemental dietwas provided to the ponds at a daily rate of 0.0% (control), 0.5%, 1%,3%, and 5% of fish biomass. Water quality analyses revealed that watertemperature, pH, free ammonia, and water conductivity were not signifi-cantly affected by feeding rate, while dissolved oxygen, orthophosphate,and nitrate levels were significantly (P < 0.05) increased with increasingfeeding levels. Average Secchi disk reading was significantly (P < 0.05)lower at higher feeding rates. Chlorophyll a content and phytoplanktonand zooplankton densities were also directly correlated to feeding rateup to 5%. The maximum growth of Nile tilapia and common carp wasobtained at feeding rate of 3% and 5%, respectively, while the maximumgrowth of silver carp was obtained at 0.5% feeding rate. The best totalfish production was obtained at 3% feeding rate. This study suggestedthat the optimum feeding rate for Nile tilapia, common carp, and silvercarp reared in a polyculture system, in earthen ponds is 3% of fish bio-mass. doi:10.1300/J028v19n01_01 [Article copies available for a fee fromThe Haworth Document Delivery Service: 1-800-HAWORTH. E-mail address:<[email protected]> Website: <http://www.HaworthPress.com>© 2007 by The Haworth Press, Inc. All rights reserved.]
KEYWORDS. Water quality, phytoplankton, zooplankton, Nile tilapia,Oreochromis niloticus, common carp, Cyprinus carpio, silver carp, Hypoph-thalmichthys molitrix, feeding rate, fish growth
INTRODUCTION
Fish are generally farmed in extensive, semi-intensive, and intensivesystems depending on stocking density and culture inputs (Edwards1988; Egna and Boyd 1997). In semi-intensive systems, fish are reared inearthen ponds, and rely on pond fertilization to enhance natural food pro-duction and/or supplemental diets. Therefore, both pond fertilizationandsupplemental diets are essential for successful semi-intensive aqua-culture.
It has been reported that semi-intensively cultured fish can rely totallyon natural food, produced through fertilization, up to critical standingcrop (CSC). Beyond this CSC, fish growth will decrease, because naturalfood will become insufficient to meet their requirement. At this stage, asupplemental diet becomes necessary to sustain fish growth (Green1992; Diana et al. 1994; Diana et al. 1996; Diana 1997; Abdelghany and
2 JOURNAL OF APPLIED AQUACULTURE

Ahmad 2002; Abdelghany et al. 2002; Liti et al. 2005). However, theadoption of optimum diet supplementation rates for cultured species islikely to reducedietwastes and costs, and maximize feed conversion effi-ciency (Diana 1997; Abdelghany and Ahmad 2002; Abdelghany et al.2002). At excessive feeding rates, the excess diet will settle down, de-compose and be considered as expensive pond fertilizer (Green et al.2002) leading to the increase in diet costs (Omondi et al. 2001).
It could be hypothesized that fish in diet-driven stagnant ponds reducetheirdependencyon natural foods. If different foods areused, differencesin food webs of fertilized and fed ponds are likely to be observed. Theflow of energy through the food web will influence water characteristicsand food webs differently. Muendo et al. (2006) reported that in manure-and diet-driven tilapia culture environments, both autotrophic and hetero-trophicpathways are importantprocesses that result in natural food avail-ability for the fish.
The present study was carried out to investigate the effects of feedsupplementationratesonwaterquality, summerphytoplankton,andzoo-plankton communities, and the growth and production of Nile tilapia,common carp, and silver carp polycultured in fertilized earthen ponds.
MATERIALS AND METHODS
Pond Management and Fish Culture Technique
The present study was carried out at the Central Laboratory forAquaculture Research, Abbassa, Abo-Hammad, Sharqia, Egypt, using10 earthen ponds (0.1 ha each). Two ponds were randomly assigned toeach treatment. All ponds received the same type and amount of organicand inorganic fertilizers. Chicken litter was broadcast over the pond bot-tom at a rate of 750 kg/ha, and the ponds were filled to 20 cm deep withwater via a supply canal from the Ismailia canal throughout El-Gad’oonirrigation canal. After 2 weeks, the level of water in all ponds was raisedto 1 m, and fish were then stocked. Each pond also was biweekly fertil-ized with 15 kg chicken litter, 2 kg urea (46.5% N) and 6 kg super-phosphate (15.5% P2O5). The inorganic fertilizers were dissolved andsplashed on the water surface. The inorganic fertilizers were applied atbiweekly intervalsalongwith thechicken litteruntil theendof theexperi-ment (19 weeks).
At thebeginningof theexperiment (1May),eachpondwasstockedwith1,000 Nile tilapia (13.7�1.2 g), 200 common carp (10.7�1.7 g), and
Abdel-Tawwab et al. 3

1,000 silver carp (1.8�0.3 g). The ponds received supplemental feedingat a rate of 0.0% (control), 0.5%, 1.0%, 3.0%, or 5.0% of fish live biomassper day. The supplemental diet contained 10.2% moisture, 25.5% crudeprotein, 6.1% ether extract, and 13.1% ash. The diet was offered manu-ally, twice a day (50% in the morning and 50% in the afternoon), 6 daysper week.
Every two weeks, 40 fish of each species from each pond were sam-pled, and their individual weights were recorded to the nearest 0.1 g, andthe amounts of diet given were readjusted accordingly. Sampled fisheswere returned to their respective ponds immediately after weighing. Ny-lon screen enclosures were installed on the water inlet and outlet pipesof each pond to prevent any escape of the cultured fish and entry ofunwanted fish.
Water Quality Measurements
Water samples for chemical analyses were collected biweekly fromeach pond, between 08:30 and 09:30 hrs at 30 cm depth. Dissolved oxy-gen and water temperature were measured at 30 cm depth with a YSImodel 58 Oxygen Meter (Yellow Spring Instrument Co., Yellow Springs,Ohio1). Simultaneously,Secchi disk visibilitywas measured. Water con-ductivity was measured with a YSI model 33 Conductivity Meter (Yel-low Spring Instrument Co., Yellow Springs, Ohio). Free ammonia andpH values were measured by using Hach kits (Hach Co., Loveland, Colo-rado). Orthophosphate was colorimetrically determined by the stannouschloride method and nitrate was colorimetrically determined by thephenoldisulphonic acid method (Boyd 1984).
Phytoplankton and Zooplankton Productivity
Chlorophyll a content was determined by filtering 100 mL of watersample through Millipore filter paper (0.45 μm) and extracting it in 90%acetone. Chlorophyl a was then measured spectrophotometrically ac-cording to Boyd (1984). At the same time, water samples (1-liter bottle)were collected from the same depth and preserved by adding 1 mL of 4%formalin for phytoplankton determination. Water samples were allowedto settle for 15 days and the supernatant was siphoned to 50 mL. Watersamples for zooplankton determination were collected by filtering 20 L
4 JOURNAL OF APPLIED AQUACULTURE
1. Use of trade or manufacturer’s name does not imply endorsement.

of pond water through 50 μm plankton net and preserved by adding 1 mLof 10% formalin. The counts of phytoplankton and zooplankton wereperformed using Sedgwick-Rafter cell under a binocular microscope.
The resultsof thedifferentanalyseswere expressed permonthas mg/Lor individuals/L. The phytoplankton communities in samples were iden-tified to genus level (Prescott 1961), and zooplankton were identified toorder or family (Pennak 1953). Phytoplankton diversity (H`) was calcu-latedaccording to the followingequation(ShannonandWeaver1949):
H` = �Σ ni / N Ln2 ni / N; where, ni = number of organism i andN = total number of taxa
Statistical Analysis
The homogeneity of variances was tested with Levene’s test while thenormalityof thedatawas testedwitha Kolmogorov-Smirnov test.A two-way ANOVA was used to test whether differences among treatments andtime were significant at P = 0.05. Mean separations were determined byusing Tukey’s Test. Partial correlation and all statistical analyses weremade using SPSS for windows version 10 (SPSS, Richmond) as de-scribed by Dytham (1999).
RESULTS
Physico-Chemical Parameters
The monthly means of the investigated variables are presented inTable 1 and Figures 1 and 2. Water temperature showed slight monthlyvariations, with maximum values being recorded in August and lowestvalues in May, for all treatments. Dissolved oxygen (DO) was positivelycorrelated with feeding rates (r = 0.85; P < 0.01). DO value was higher inthe 5% feeding rate treatment (8.0 mg/L) than in the control, 0.5%, 1%,and 3% feeding rates treatments. It gradually decreased with time, andthe lowest value (5.2 mg/L) was obtained in control ponds. The maxi-mum values of DO were obtained in June and August in ponds that re-ceived the 5% feeding rate treatment (8.5 and 8.3 mg/L, respectively).Secchi disk was significantly decreased by increasing the feeding rate(r = �0.766; P < 0.01). It also decreased with time until the end of the ex-periment in all treatments except the control, which increased in August(15.5 cm). The highest mean values of Secchi disk were observed in the
Abdel-Tawwab et al. 5

TA
BLE
1.M
ean
chan
ges
(ran
ges)
inw
ater
prop
ertie
sof
fert
ilize
dea
rthe
npo
nds
affe
cted
bydi
ffere
ntfe
edin
gra
tes.
Mea
nsw
ithth
esa
me
lette
rin
the
sam
eco
lum
nar
eno
tsig
nific
antly
diffe
rent
atP
�0.
05.
Fee
ding
rate
Par
amet
ers
Con
trol
(0.0
%)
0.5%
1%3%
5%P
valu
e
Tem
pera
ture
(oC
)26
.7�
0.89
a(2
4.2-
28.2
)27
.2�
0.86
a(2
4.7-
28.7
)26
.9�
0.88
a(2
4.5-
28.6
)26
.8�
1.13
a(2
3.6-
28.7
)27
.0�
0.87
a(2
4.6-
28.5
)0.
998
Sec
chid
isk
(cm
)14
.6�
0.4
a(1
3.5-
15.5
)14
.1�
0.3
a(1
3.5-
14.5
)14
.0�
0.2
ab(1
3.5-
14.5
)12
.7�
0.3
b(1
2.0-
13.5
)12
.8�
0.3
c(1
2.0-
13.5
)0.
002
Dis
solv
edox
ygen
(mg/
L)5.
7�0.
19d
(5.2
-6.0
)6.
5�0.
28c
(6.0
-7.1
)6.
8�0.
21bc
(6.3
-7.2
)7.
0�0.
29bc
(6.4
-7.6
)8.
0�0.
26a
(7.4
-8.5
)0.
001
pHva
lue
8.7�
0.08
a(8
.5-8
.8)
8.6�
0.09
a(8
.4-8
.8)
8.6�
0.05
a(8
.5-8
.7)
8.7�
0.08
a(8
.5-8
.8)
8.7�
0.07
a(8
.5-8
.8)
0.80
3
Fre
eam
mon
ia(m
g/L)
0.60
�0.
03a
(0.4
8-0.
75)
0.57
�0.
02a
(0.4
3-0.
74)
0.51
�0.
02a
(0.4
4-0.
59)
0.57
�0.
05a
(0.4
4-0.
65)
0.59
�0.
05a
(0.5
0-0.
74)
0.77
5
Con
duct
ivity
(mS
/cm
)0.
99�
0.03
b(0
.89-
1.05
)1.
04�
0.07
ab(0
.90-
1.16
)1.
07�
0.05
ab(0
.88-
1.18
)1.
15�
0.05
a(1
.03-
1.25
)1.
198�
0.02
a(1
.15-
1.25
)0.
037
Ort
hoph
osph
ate
(mg/
L)3.
36�
0.18
b(3
.04-
3.88
)3.
55�
0.12
ab(3
.32-
3.81
)3.
61�
0.25
ab(3
.33-
3.88
)3.
88�
0.25
ab(3
.25-
4.45
)4.
20�
0.38
a(3
.27-
5.05
)0.
029
Nitr
ate
(mg/
L)8.
2�0.
92b
(6.5
-10.
6)9.
5�1.
26ab
(6.5
-11.
8)10
.1�
1.81
ab(6
.8-1
2.8)
11.1
�1.
81ab
(6.5
-15.
1)13
.5�
2.08
a(7
.9-1
7.7)
0.04
1
Chl
orop
hyll
a(�
g/L)
90.7
�16
.18
c(5
1.4-
127.
5)10
5.7�
11.7
9bc
(78.
9-13
3.7)
107.
6�13
.27
bc(7
1.4-
133.
3)14
8.4�
9.71
ab(1
24.2
-171
.3)
185.
6�9.
38a
(161
.8-2
01.2
)0.
001
6

Abdel-Tawwab et al. 7
AugustJulyJuneMonths
May
9
8.8
8.6
8.4
8.2
8
pH
10
11
12
13
1415
16
Sec
chi d
isk
(cm
)
7
8
6
9
5
4
Dis
solv
ed o
xyge
n (m
g/L)
30Control 0.5% 1% 3%
28
26
24
22
Tem
pera
ture
(°C
)
5%
FIGURE 1. Changes in water temperature (oC), dissolved oxygen (mg/L),Secchi disk reading (cm), and pH in fertilized earthen ponds receiving differentfeeding rates.
8 JOURNAL OF APPLIED AQUACULTURE
Months
0.5%Control 5%3%1%
0.8
0.7
0.6
0.5
0.4
0.3
0.18
0.17
0.16
0.15
0.14Con
duct
ivity
(m
S/c
m)
5.5
4.5
3.5
2.5
5
15
10
20
Nitr
ate
(mg/
L)P
hosp
hate
(m
g/L)
May June July August
Free
am
mon
ia (
mg/
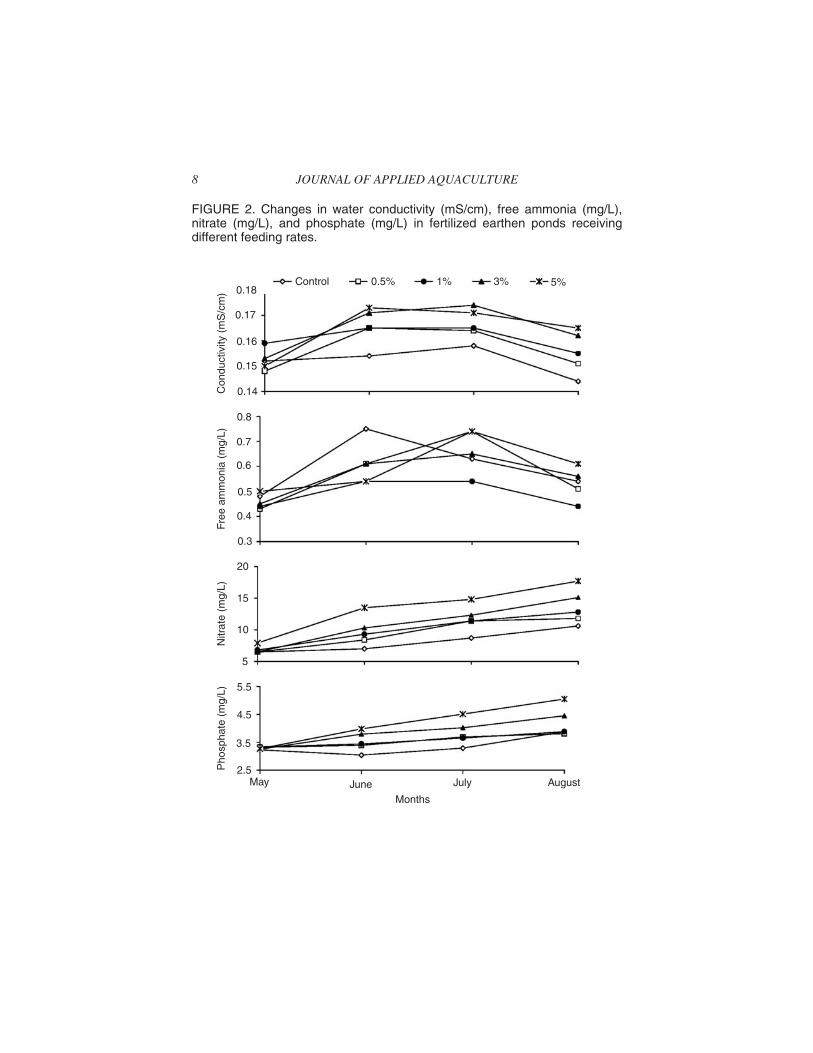
L)FIGURE 2. Changes in water conductivity (mS/cm), free ammonia (mg/L),nitrate (mg/L), and phosphate (mg/L) in fertilized earthen ponds receivingdifferent feeding rates.

control and 0.5% feeding rate treatments (14.6 and 14.1 cm, respec-tively), while the lowest one was obtained at 5% feeding rate treatment(12.8 cm). The pH values in all treatments ranged from 8.4 to 8.8, andincreased with time (Table 1; Figure 1).
Water conductivity also increased with time in all treatments and wassignificantly higher in ponds that received the 5% feeding rate than incontrol ponds. Free ammonia concentration increased with increasingthe feeding rates (r = 0.312; P > 0.05), and it ranged from 0.148 to 0.173mg/L. Nitrate and phosphate concentrations increased significantly withthe increase in feeding rate (r = 0.495; P < 0.05 and r = 0.521; P < 0.05,respectively). Nitrate and phosphate concentrations also increased withtime and reached their highest values in August for all treatments (Figure2). The maximum nitrate value was obtained in August for the 5% feed-ing rate treatment (17.7 mg/L), while the minimum value was obtainedin May in the control, 0.5% and 3% feeding rate treatments (6.5 mg/L).Similarly, the maximum phosphate value was obtained in August in the5% feeding rate treatment (5.05 mg/L), while the minimum value wasobtained in May in the control treatment (3.23 mg/L).
Chlorophyll a Content
Chlorophyll a content in fish pond was significantly increased with in-creasing feeding rate (r = 0.803; P < 0.01; Figure 3). In the control, 0.5%,and 1% feeding rate treatments, chlorophyll a decreased, while in 5%feeding rate treatment it increased with time. In the 3% treatment, chloro-phyll a also decreased with timeexcept for June where it increased (171.3μg/L).Themaximumvalueofchlorophyllawas obtained inJulyandAu-gust (200 and 201.2 μg/L, respectively) in the 5% feeding rate treatment,while the minimum value was observed in August in the control ponds(51.4 μg/L).
Phytoplankton Abundance
Bacillariophyceae,Chlorophyceae,Cyanobacteria,andEuglenophyceaewere the major phytoplankton groups in all treatments (Figure 4; Table2). Bacillariophyceae, Chlorophyceae, and Euglenophyceae were themost abundant groups. The mean highest counts of Bacillariophyceaewere recorded in the 3% and 5% feeding rates treatments without signifi-cant differences (P > 0.05), while the lowest counts were recorded in con-trol ponds (Table 2). The maximum counts of Bacillariophyceae were
Abdel-Tawwab et al. 9

observed in August in the 3% and 5% feeding rate treatment (275 and 276individuals/mL, respectively), while less numbers were observed duringMay and August (56 and 54 individuals/mL, respectively) in the control.The mean highest counts of Chlorophyceae were recorded in the 3% and5% feeding rate treatments without significant differences (P > 0.05),while the lowest counts were recorded in control (Figure 4; Table 2). Themaximum counts of Chlorophyceae were observed in June in the 3% and5% feeding rates (429 and 461 individuals/mL, respectively), whilelower number was recorded in August (71 individuals/mL) in thecontrol.However, Cyanobacteria exhibited lower abundance than other groups,and it completely disappeared in some months in some treatments. Themean count of Cyanobacteria decreased when the diet increased for 3%or 5% feeding rate. There was no significant difference for Cyanobacteria
10 JOURNAL OF APPLIED AQUACULTURE
Control 0.5%
150
50
250
200
5%3%1%
0
100
Chl
orop
hyll
a co
nten
t (μg
/L)
May JuneMonths
July Aug.
FIGURE 3. Changes in chlorophyll a content (�g/L) in fertilized earthen pondsreceiving different feeding rates.

Abdel-Tawwab et al. 11
Bac
illar
ioph
ycea
e (%
)C
hlor
ophy
ceae
(%
)C
yano
bact
eria
(%
)E
ugle
noph
ycea
e (%
)
Control
40
30
20
10
55
45
35
25
15
10
8
6
4
2
0
10May June July
MonthsAugust
20
30
40
50
60
0.5% 1% 3% 5%
FIGURE 4. Percentage composition of phytoplankton divisions in fertilizedearthen ponds receiving different feeding rates.

TA
BLE
2.T
hem
ain
phyt
opla
nkto
nge
nera
(indi
vidu
als/
mL)
inha
bitin
gfe
rtili
zed
eart
hen
pond
sre
ceiv
eddi
ffere
ntfe
edin
gra
tes.
M.=
May
;Ju.
=Ju
ne;J
l.=
July
;and
A.=
Aug
ust.
Phy
topl
ankt
onta
xa
Fee
ding
rate
Con
trol
(0.0
%)
0.5%
1.0%
3.0%
5.0%
M.
Ju.
Jl.
A.
M.
Ju.
Jl.
A.
M.
Ju.
Jl.
A.
M.
Ju.
Jl.
A.
M.
Ju.
Jl.
A.
Bac
illar
ioph
ycea
e
Cyc
lote
lla-
--
12-
15-
-2
35-
26-
--
478
2137
73
Cym
bella
-15
10-
--
--
--
--
--
--
--
-2
Gyr
osig
ma
17
--
--
--
--
--
-10
--
1-
--
Mel
osira
--
--
8-
--
--
-17
6-
10-
--
--
Nav
icul
a8
1012
-16
3530
1075
5850
4074
109
117
7811
510
190
75
Nitz
schi
a18
1238
4239
3550
878
5356
4661
7284
9825
6755
105
Pin
nula
ria29
31-
-2
--
-26
--
--
--
-8
--
21
Syn
edra
-13
11-
9-
2-
1-
56-
819
-5
819
60-
Tab
ella
ria-
-22
--
-25
--
--
22-
-49
47-
--
-
Tot
alnu
mbe
r56
8893
5474
8510
797
112
146
162
151
149
210
260
275
165
208
242
276
Chl
orop
hyce
ae
Ank
istr
odes
mus
25-
--
--
--
--
16-
-47
1112
--
-56
Chl
orel
la14
2-
2-
9226
16-
-74
7-
615
--
184
1474
Coe
last
rum
--
--
-11
--
-42
-5
--
--
--
-4
12

Cru
cige
nia
14-
473
1-
27
--
-24
-6
555
62-
-24
Pan
dorin
a-
-1
--
--
--
--
-38
--
--
--
4
Ped
iast
rum
19
-6
7-
-3
5817
-5
-2
1034
67-
-4
Sce
nede
smus
6692
4553
8120
8655
9364
9391
237
346
155
7413
224
024
519
3
Tet
raed
ron
138
-2
1611
-25
52
-5
822
1511
412
137
324
Shr
eode
ria-
--
523
--
2-
--
24-
--
48-
--
-
Tot
alnu
mbe
r12
114
193
7112
813
411
410
815
712
518
316
128
342
921
133
738
246
126
238
3
Cya
noba
cter
ia
Ana
baen
a1
--
310
--
--
--
91
--
-8
--
-
Mer
ism
oped
ia-
--
1-
--
--
--
-1
--
-1
14
7
Osc
illat
oria
8-
--
110
15-
1411
2510
1710
-27
83
55
Spi
rulin
a-
--
21-
--
--
10-
--
21-
2-
--
9
Tot
alnu
mbe
r9
00
2511
1015
014
2152
1919
310
2917
49
21
Eug
leno
phyc
eae
Eug
lena
8859
7610
395
3688
125
8971
115
102
111
4693
120
8212
510
512
1
Pha
cus
4252
6893
5778
6178
5032
9599
7886
6986
142
7699
109
Tot
alnu
mbe
r13
011
114
419
615
111
414
920
313
910
321
019
118
913
216
220
622
420
120
423
0
Tot
alph
yto-
coun
t31
634
033
034
636
434
338
540
842
239
560
752
264
080
263
384
778
887
471
791
0
13

among the different treatments (P > 0.05). There was no significant dif-ference of Euglenophyceae among the different treatments (P > 0.05),and its maximum counts were observed during August 5% feeding ratetreatment (230 individuals/mL), while the lower number was observedduring June (103 individuals/mL) in the 1% feeding rate treatment.
Phytoplankton occurrence was positively correlated with feeding pe-riod (r = 0.893; P < 0.01). It was significantly higher in the 3% and 5%feeding rate treatments than other treatments (P < 0.01; Figure 4). Themaximum phytoplankton count was recorded in August (910 individu-als/mL) in the 5% feeding rate treatment, while the minimum count wasrecorded in May in the control pond (316 individuals/mL).
Table 2 contains the different genera of each phytoplankton group.The recorded genera were 9, 9, 4, and 2 for Bacillariophyceae, Chlo-rophyceae, Cyanobacteria, and Euglenophyceae, respectively. The abun-dant genera of Bacillariophyceae were Navicula, Nitschia, and Synedraspp. Other less abundant genera of Bacillariophyceae were CyclotellaCymbella, Gyrosigma, Melosira, Pinnularia, and Tabellaria spp.Navicula and Nitzschia were recorded in all months, and in all treatmentsexcept the control where Navicula disappeared during August. Naviculaexhibited its highest count during July (117 individuals/mL) and May(109 individuals/mL) in the 3% and 5% feeding rate treatments, re-spectively. Also, the highest count of Nitzschia was obtained duringAugust (105 individuals/mL) in the 5% feeding rate treatment. AmongChlorophyceae, Chlorella, Crucigenia, Pediastrum, Scenedesmus, andTetradron spp. were the most abundant genera. Ankistrodesmus, Coela-strum, Pandorina, and Shreoderia spp. were also recorded.Scenedesmuswas recorded in all months at all treatments,with a maximumcount beingrecorded in June in the 3% feeding rate treatment (346 individuals/mL),and minimum count in June in the 0.5% feeding rate treatment (20 indi-viduals/mL). The highest count of Tetraedron was also recorded duringMay in the 5% feeding rate treatment (121 individuals/mL), while thehighest count of Chlorella was recorded during June in the 5% feedingrate treatment (184 individuals/mL). Pandorina was the least abundantgenus, and was observed in July (1 individuals/mL), May (38 individu-als/mL), and August (4 individuals/mL) in the control, 3%, and 5% feed-ing rate treatments, respectively.
Among Cyanobacteria, Anabaena, Merismopedia, Oscillatoria, andSpirulina were present in the ponds. The highest count was recorded forOscillatoriaduring August in the3% feeding rate treatment (27 individu-als/mL) and during July in the 1% feeding rate treatment (25 individuals/mL). Euglenophyceae was only represented by Euglena and Phacus in
14 JOURNAL OF APPLIED AQUACULTURE
this investigation, and they were recorded in all months and in all treat-ments. The highest occurrence of Euglena was recorded during Augustand July in the1% and 5% feeding rates treatments (125 individuals/mL),while the lowest record was obtainedduring June in the 0.5% feeding ratetreatment (36 individuals/mL). In case of Phacus, the highest count wasrecorded in May in the 5% feeding rate treatment (142 individuals/mL),while the lowest record was obtained during June in the 1% feeding ratetreatment (32 individuals/mL).
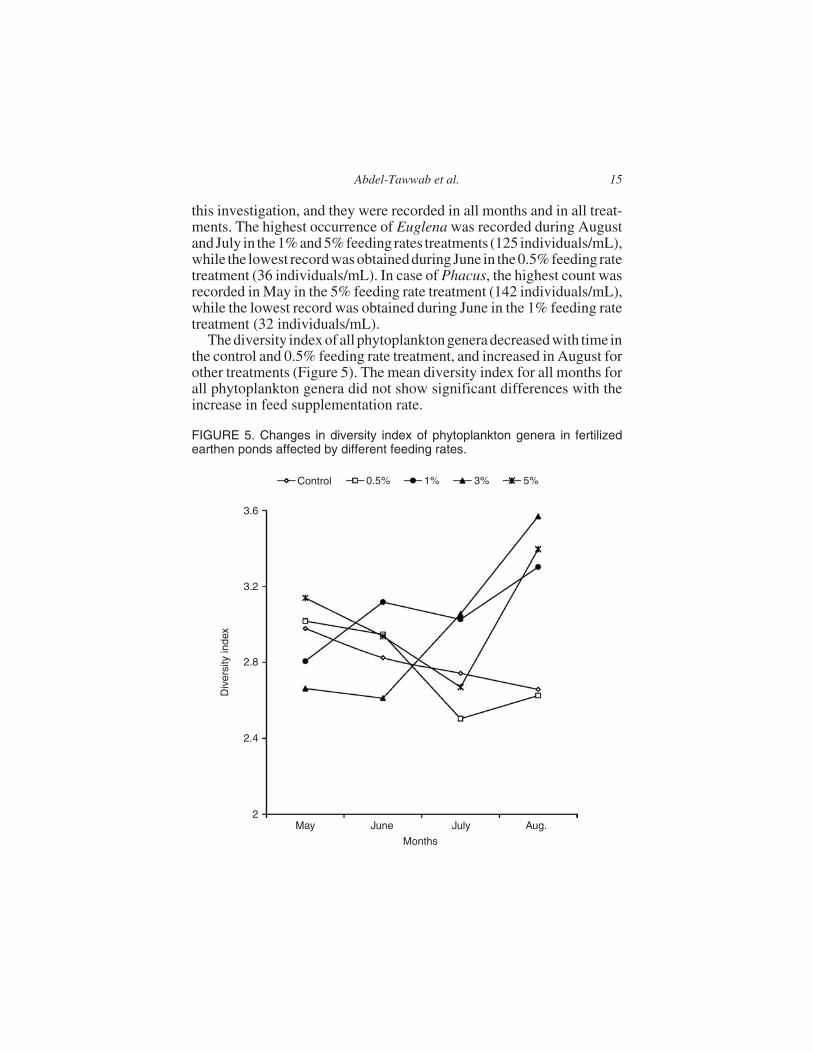
The diversity index of all phytoplankton genera decreased with time inthe control and 0.5% feeding rate treatment, and increased in August forother treatments (Figure 5). The mean diversity index for all months forall phytoplankton genera did not show significant differences with theincrease in feed supplementation rate.
Abdel-Tawwab et al. 15
3.6
3.2
2.8
2.4
2May June
Months
July Aug.
Control
Div
ersi
ty in
dex
0.5% 1% 3% 5%
FIGURE 5. Changes in diversity index of phytoplankton genera in fertilizedearthen ponds affected by different feeding rates.

Zooplankton Abundance
Zooplankton occurrence was significantly correlated with feeding rate(r=0.632;P<0.01).Table3showsthat thedominantdivisionofzooplank-ton was cladocera followed by copepods, while rotifers exhibited the leastabundance. All zooplankton divisions significantly increased with in-creasing thefeedingrates (P<0.05).Themaximumcountofcladocerawasrecorded during July (154 individuals/L) in the 5% feeding rate treatment,and the minimum was recorded during May (39 individuals/L) for the con-trol. Also, the maximum count of copepoda was recorded during June (61individuals/L) and July (60 individuals/L) in the 5% and 3% feeding ratestreatments, respectively. The minimum count was recorded during May(16 individuals/L) for the control and 0.5% feeding rate treatment. Themaximumrotifers countwas recordedduringJuly (27 individuals/L) in the5% feeding rate treatment, and the minimum was recorded during May (5individuals/L) for the control and 0.5% feeding rate treatment. The maxi-mum zooplankton count was recorded during July (247 individuals/L) inthe 5% feeding rate treatment, and the minimum was recorded during May(61 individuals/L) for the control. Dominant cladocera included Moina,Bosmania, Simocephalus, Diaphanosoma, and Daphnia spp. Cyclops,Mesocyclops, and Thermocyclops spp. were the most common copepods.TherotifercommunitywasdominatedbyBrachionusandKeratellaspp.
Fish Growth and Production
Fish growth exhibited a slight correlation with feeding rates (r = 0.535,0.632, and �0.311 for Nile tilapia, common carp, and silver carp, respec-tively). Figure 6 shows that fish gradually grew with time, and the highestindividualweightof eachspecieswas obtained in August. Thehighest in-dividual weight of Nile tilapia was obtained at the 3% feeding rate treat-ment (162.0 g), while the lowest weight was obtained in the control (77.3g). Maximum individual weight of common carp was obtained at the 5%feeding rate treatment (713.3 g) and the lowestweightwas obtained in thecontrol (210.9 g). Maximum individual weight of silver carp was ob-tained at the 0.5% feeding rates treatment (426.7 g), while the lowestweights were obtained in the 3% and 5% feeding rates treatments (235.0and 247.1 g, respectively).
The production of Nile tilapia as weights of stocked tilapia, recruits,and both increased with increasing the feeding rate (P < 0.05) up to 3%(1,602.2, 1,264.0, and 2,866.2 kg/ha, respectively;Figure 7) compared tothe control ponds (92.0, 625.4, and 717.4 kg/ha, respectively). Produc-
16 JOURNAL OF APPLIED AQUACULTURE

TA
BLE
3.C
hang
esin
zoop
lank
ton
divi
sion
s(in
divi
dual
s/L)
inea
rthe
npo
nds
affe
cted
bydi
ffere
ntfe
edin
gra
tes.
M.
=M
ay;J
u.=
June
;Jl.
=Ju
ly;a
ndA
.=A
ugus
t.
Zoo
plan
kton
Div
isio
ns
Fee
ding
rate
Con
trol
(0.0
%)
0.5%
1.0%
3.0%
5.0%
M.
Ju.
Jl.
A.
M.
Ju.
Jl.
A.
M.
Ju.
Jl.
A.
M.
Ju.
Jl.
A.
M.
Ju.
Jl.
A.
Cla
doce
ra39
7591
6951
9511
194
5710
011
410
272
108
132
113
7710
415
411
6
%of
tota
l64
.060
.559
.963
.868
.966
.462
.464
.462
.664
.661
.061
.866
.060
.060
.561
.761
.154
.862
.461
.4
Cop
epod
s16
3544
3116
3546
3621
3849
4423
5260
4926
6159
51
%of
tota
l26
.228
.228
.928
.721
.624
.525
.824
.723
.124
.526
.226
.721
.128
.927
.526
.820
.632
.123
.927
.0
Rot
ifers
510
126
59
1612
912
1815
1114
2018
1920
2718
%of
tota
l8.
28.
17.
95.
66.
86.
39.
08.
29.
97.
79.
69.
110
.17.
89.
29.
815
.110
.510
.99.
5
Oth
ers
14
52
24
54
45
64
36
63
45
74
%of
tota
l1.
63.
23.
31.
92.
72.
82.
82.
74.
43.
23.
22.
42.
83.
32.
81.
73.
22.
62.
82.
1
Tot
alco
unt
6112
415
210
874
143
178
146
9115
518
716
510
918
021
818
312
619
024
718
9
%of
tota
l10
010
010
010
010
010
010
010
010
010
010
010
010
010
010
010
010
010
010
010
0
17

tion of common carp was significantly increased with increasing the feedrate (P < 0.05) up to 5% (1,333.9 kg/ha), while the lowest production wasobtained in thecontrol (371.2 kg/ha).Maximumproductionof silvercarpwas obtained in the 0.5% feeding rate treatment followed by 1% feedingrate treatment (3,059.4 and 2,632.7 kg/ha, respectively). Total fish
18 JOURNAL OF APPLIED AQUACULTURE
Control
Nile tilapia
180
160
140
120
100
80
60
40
20
800
700
600500
400
300200
1000
500
400
300
200
100
00 4 7 10
Weeks
Silver carp
Fis
h w
eigh
t (g)
Fis
h w
eigh
t (g)
Fis
h w
eigh
t (g)
Common carp
13 16 19
0
0.5% 1% 3% 5%
FIGURE 6. Changes in body weight (g/fish) of Nile tilapia, common carp, andsilver carp fed different feeding rates.

production of each treatment was significantly increased with increasingfeeding rate treatment (P < 0.05), and the best production was obtained inthe 3% feeding rate (5,866.2 kg/ha). The least fish production wasobtained in the control (2,852.7 kg/ha).
DISCUSSION
Since the ponds had similar fertilization history and received the sametypes and amounts of fertilizers during this study, the differences in ni-trate and phosphorus concentrations among treatments may have beenrelated to the variation in the amount of diet given. The introduction of
Abdel-Tawwab et al. 19
7000
Nile tilapia (recruits)
Nile tilapia (stocked)
Nile tilapia (total)
Common carp
Silver carp
Total fish production
d
d ee
c
d
c
cd
b
aa
a
b
c
c
c
c
b
d
a
c c
ab
c
a
b
bb
6000
5000
4000
Fis
h pr
oduc
tion
(kg/
ha)
3000
2000
1000
Control 0.5% 1%
Feeding rates
3% 5%0
FIGURE 7. The production of Nile tilapia, common carp, and silver carp (kg/ha)fed different feeding rates. Bars with the same letter within the same treatmentare not significantly different at P < 0.05.

supplemental diet at a high rate (5%) affected phosphate and nitrate con-centrations. These results revealed that the un-utilized diet decomposed,producing more nutrients and resulting in the accumulation of phospho-rus and nitrogenous in the pond. Subsequently, water conductivity in-creased in ponds receiving a high feeding rate (5%). The similarity ofnutrients concentrations in the other treatments may be due to theefficient use of supplemented diet.
The highly available nutrients in ponds fed at high feeding rate led tosubsequent increases in phytoplanktonic production (Hargreaves 1998).Despite the fact that phytoplankton biomass supports fish growth (Dianaet al. 1991), it increases water turbidity, resulting in low Secchi disktransparency (Boyd 1990). In this regard, Hietala et al. (2004) found thatnutrient enrichment clearly increased the biomass of phytoplankton, andthe chlorophylla concentration.They also reported that the highly signif-icant effects of nutrients on the total biomass of phytoplankton probablymasked the effects of fish. Van de Bund and Van Donk (2004) also foundthat algal blooms occurred at high nutrient levels regardless of fishabundance.
The low phytoplanktondensities in ponds in the control, 0.5%, and 1%feeding rate treatments may be due to the unavailability of nutrients and/or the top-down control by herbivorous zooplankton, and/or fish. In thesetreatments, the impact of zooplankton and/or fish on phytoplankton mayhave been the main cause of lowering phytoplankton biomass, where thefish obtained their requirements through the efficient use of both naturalfood and prepared diet. On the other hand, the count of phytoplankton atthe 5% feeding rate treatment was much greater, indicating that fish ob-tained their nutrient requirements from the diet, whereas the consump-tion of phytoplankton only occasionally occurred. In this regard, Diana(1997) reported that, in some cases, supplemental diet applied wouldsupplant natural food, resulting in an increase in fish growth.
The low abundance of Cyanobacteria in the present study may have beendue to the impact of cultured fish, especially Nile tilapia and silver carp. Inthis regard, Abdel-Tawwab (2003) and Abdel-Tawwab and El-Marakby(2004) reported that Nile tilapia has the capability to select Cyanobacteriaas a food item, in addition to Bacillariophyceae, Chlorophyceae, andEuglenophyceae. On the other hand, Perry et al. (1990) found that greenalgae and diatoms were dominant in summer, while blue green algae weredominant in autumn.
It is known that the Shannon-Weaver index embraces both aspects ofdiversity, richness, and evenness. The Shannon-Weaver index of phyto-plankton in the present study was significantly higher in the control and
20 JOURNAL OF APPLIED AQUACULTURE

0.5%feedingrate treatment.Thephytoplanktondiversitymayberelated tothe competition for nutrients (D’Elia et al. 1986), predation by zooplank-ton and planktivorous fish (Verity 1986).
In the present study, zooplankton production was correlated with phy-toplankton biomass (r = 0.681; P < 0.01). The importance of phyto-plankton and zooplankton to freshwater aquatic food webs would varyamong consumers, seasons, and years (Murkin 1989). Yang et al. (2005)found that large changes in zooplankton community structure coincidedwith markedly changes in concentration of chlorophyll a in LakeDonghu, China. The changes in zooplankton count and structure arestrongly effected by environmental conditions, phytoplankton occur-rence, and/or the impact of cultured fish. Reid et al. (2000) reviewed evi-dence for top-down control in the North Sea, and concluded that therewas a strong interaction between different fish species and the plankton,which may at times, be an important contributor to changes in the NorthSea ecosystem.
The growth responses of fish species in all the treatments in the presentstudy were generally satisfactory, since they reached the marketablesizes at harvest. Fish grown on fertilizer alone achieved a reasonablegrowth and production, while supplemental feeding resulted in morerapid growth and higher production than fertilizationalone. The obtainedresults revealed that Nile tilapia and common carp are capable of con-suming the supplemental diet, while silver carp is not. This finding sug-gests that supplemental diet may be unnecessary for silver carp duringtheir early stages, until they grow to large sizes over 150 g (Abdelghanyand Ahmad 2002; Abdelghany et al. 2002). In support, Cremer andSmitherman (1980) and Oposzynski (1981) found that silver carp did notconsume prepared diets. Muller (1979) also reported that supplementaldiet had no significant effect on the growth of silver carp. On the otherhand, Harpaz and Uni (1999) reported that although the silver carp areknown as filter feeders, relying mainly on small unicellular algae, underaquaculture conditions they can consume prepared diet in addition totheir natural foods. Ahmad et al. (2007) found that silver carp couldconsume diets up to 1.0% feeding rate in monoculture system.
The highest fish production in the present study was obtainedat the 3%feeding level. At 5% feeding rate treatment, the un-utilized diet may havebeen the direct or indirect source for the organic matter, which accumu-lates on the pond bottom, resulting in the inhibition of fish growth. Simi-larly, Ofojekwu and Ejike (1984) found that feeding rate 3% is satisfiedto produce the optimum growth of Nile tilapia. Moreover, Abdelghanyand Ahmad’s (2002) recommended feed amount equivalent to 2.76% of
Abdel-Tawwab et al. 21

fish biomass per day appeared to be optimal to produce the highest pro-duction of Nile tilapia, common carp, and silver carp polycultured infertilized earthen ponds.
Differences in the growth and production of each fish species hereinare likely due to the feeding rate, because all other factors that may influ-ence the growth were similar. Therefore, these results could providetechnical guidance to farmers about feeding practices that optimize fishgrowth and pond production.
REFERENCES
Abdelghany, A.E., and M.H. Ahmad. 2002. Effects of feeding rates on growth andproduction of Nile tilapia, common carp and silver carp polycultured in fertilizedponds. Aquaculture Research 33: 415-423.
Abdelghany, A.E., M.-S. Ayyat, and M.H. Ahmad. 2002. Appropriate timing of sup-plemental feeding for production of Nile tilapia, silver carp, and common carp infertilized polyculture ponds. Journal of the World Aquaculture Society 33(3):307-315.
Abdel-Tawwab, M. 2003. Occurrence of phytoplankton in stomach content and itsselectivity by Nile tilapia (Oreochromis niloticus L.) cultured in fertilized earthenponds. Qatar University Science Journal 23: 153-166.
Abdel-Tawwab, M., and H.I. El-Marakby. 2004. Length-weight relationship, naturalfood and feeding selectivity of Nile tilapia; Oreochromis niloticus (L.) in fertilizedearthen ponds. Pages 500-509 in R. Bolivar, G. Mair, and K. Fitzsimmons, eds.Sixth International Symposium on Tilapia in Aquaculture, Manila, Philippines.
Ahmad, M.H., M. Abdel-Tawwab, and Y.A.E. Khattab. 2007. Growth response of sil-ver carp, Hypophthalmichthys molitrix Val. to feed supplementation in earthen fishponds. Journal of Applied Aquaculture 19(1): 25-38.
Boyd, C.E. 1984. Water Quality in Warmwater Fishponds. Auburn University, Agri-cultural Experimental Station, Auburn, Alabama.
Boyd, C.E. 1990. Water Quality in Ponds for Aquaculture. Birmingham PublishingCo., Birmingham, Alabama.
Cremer, M.C., and R.O. Smitherman. 1980. Food habits and growth of silver andbighead carp in cages and ponds. Aquaculture 20: 57-64.
D’Elia, C.F., J.G. Sanders, and W.R. Boynton. 1986. Nutrient enrichment studies ina coastal plain estuary: Phytoplankton growth in large-scale, continuous cultures.Canadian Journal of Fisheries and Aquatic Sciences 43: 397-406.
Diana, J.S. 1997. Feeding strategies. Pages 245-262 in H.S. Egna and C.E. Boyd, eds.Dynamics of Pond Aquaculture. CRC Press, Boca Raton, Florida.
Diana, J. S., Lin, C.K., and Yang, Y. 1996. Timing of supplemental feeding for tilapiaproduction. Journal of the World Aquaculture Society 27(4): 410-419.
Diana, J.S., Lin, C.K., and Jaiyen, K. 1994. Supplemental feeding of tilapia in fertilizedponds. Journal of the World Aquaculture Society 25: 497-506.
22 JOURNAL OF APPLIED AQUACULTURE

Diana, J.S., Lin, C.K., and Schneeberger, P.J. 1991. Relationships among nutrient in-puts, water nutrient concentrations, primary productivity and yield of Oreochromisniloticus in ponds. Aquaculture 92: 323-341.
Dytham, C. 1999. Choosing and Using Statistics: A Biologist’s Guide. Blackwell Sci-ence Ltd., London, United Kingdom.
Edwards, P. 1988. Environmental issues in integrated agri-aquaculture and waste fedfish culture systems. Pages 359 in R.S.V. Pullin, H. Rosenthal, and J.L. Maclean,eds. Environment and Aquaculture in Developing Countries. ICLARM ConferenceProceedings, 1993. Volume 31. ICLARM, Manila, Philippines.
Egna, H.S., and Boyd, C.E. 1997. Dynamics of Pond Aquaculture. CRC Press, BocaRaton, Florida.
Green, B.W. 1992. Substitution of organic manure for pelleted feed in tilapia produc-tion. Aquaculture 101: 213-222.
Green, B.W., El Nagdy, Z., and Hebicha, H. 2002. Evaluation of Nile tilapia pond man-agement strategies in Egypt. Aquaculture Research 33: 1037-1048.
Hargreaves, J.A. 1998. Nitrogen biogeochemistry of aquaculture ponds. Aquaculture166: 181-212.
Harpaz, S., and Uni, Z. 1999. Activity of intestinal mucosal brush border membraneenzymes in relation to the feeding habits of three aquaculture fish species. Compar-ative Biochemistry and Physiology (Part A) 124: 155-160.
Hietala, J., Vakkilainen, K., and Kairesalo, T. 2004. Community resistance and changeto nutrient enrichment and fish manipulation in a vegetated lake littoral. FreshwaterBiology 49: 1525-1537.
Liti, D., Cherop, L., Munguti, J., and Chhorn, L. 2005. Growth and economic perfor-mance of Nile tilapia (Oreochromis niloticus L.) fed on two formulated diets andtwo locally available feeds in fertilized ponds. Aquaculture Research 36: 746-752.
Muendo, P.N., Milstein, A., van Dam, A., El-Naggar, G., Stoorvogel, J.J., and Verdegem,M.C.J. 2006. Exploring the trophic structure in organically fertilized and feed-driventilapia culture environments using multivariate analyses. Aquaculture Research 37:151-163.
Muller, F. 1979. The European and Hungarian results of cage culture of fish. Pages30-40 in SEAFDEC/IDRC International Workshop on Cage Culture and Pen Cul-ture. SEAFDEC, Iloilo, Philippines.
Murkin, H.R. 1989. The basis for food chain in prairie wetland. Pages 316-338 in A.G.van der Valk, ed. Northern Prairie Wetlands. Iowa State University Press, Ames, Iowa.
Ofojekwu, P.C., and Ejike, C. 1984. Growth response and feed utilization in tropicalcichlid (Oreochromis niloticus). Aquaculture 42: 27-36.
Omondi, J.G., Gichuri, W.M., and Veverica, K. 2001. A partial economic analysis forNile tilapia Oreochromis niloticus (L.) and sharptoothed catfish Clarias gariepinus(Burchell 1822) polyculture in central Kenya. Aquaculture Research 32: 693-700.
Oposzynski, K. 1981. Comparison of the usefulness of the silver and bighead carp asadditional fish in carp ponds. Aquaculture 25: 223-233.
Pennak, R.W. 1953. Freshwater Invertebrates of the United States. The Ronald PressCo., New York, New York.
Perry, S.A., Perry, W.B., and Simmons, G.M. 1990. Bacterioplankton and phytoplanktonpopulations in a rapidly flushed eutrophic reservoir. Internationale Revue dergesamte Hydrobiologie 75: 27-44.
Abdel-Tawwab et al. 23

Prescott, G.W. 1961. Algae of the Western Great Lakes Area. W.M.C. Brown Com-pany Publishers, Dubuque, Iowa.
Reid, P.C., Battle, E.J.V., Batten, S.D., and Brander, K.M. 2000. Impact of fisheries onplankton community structure. ICES Journal of Marine Science 57: 495-502.
Shannon, C.R., and Weaver, W. 1949. The Mathematical Theory of Communication.Urbana University Press, Urbana, Illinois.
Van de Bund, W.J., and Van Donk, E. 2004. Effects of fish and nutrient additions onfood-web stability in a charophyte-dominated lake. Freshwater Biology 49: 1565-1573.
Verity, P.G. 1986. Grazing of phototrophic nanoplankton by microzooplankton inNarragansett Bay. Marine Ecology Progress Series 29: 105-115.
Yang, Y.F, Huang, X.F., Liu, J.K., and Jiao, N.Z. 2005. Effects of fish stocking on thezooplankton community structure in a shallow lake in China. Fisheries Manage-ment and Ecology 12: 81-89.
doi:10.1300/J028v19n01_01
24 JOURNAL OF APPLIED AQUACULTURE