effect of competitive strategies on organizational - USIU-A ...
88
EFFECT OF COMPETITIVE STRATEGIES ON ORGANIZATIONAL PERFORMANCE: CASE STUDY OF BRIDGE INTERNATIONAL ACADEMIES, NAIROBI BY WENDY MASALE UNITED STATES INTERNATIONAL UNIVERSITY – AFRICA SPRING 2018
-
Upload
khangminh22 -
Category
Documents
-
view
3 -
download
0
Transcript of effect of competitive strategies on organizational - USIU-A ...
EFFECT OF COMPETITIVE STRATEGIES ON ORGANIZATIONAL
PERFORMANCE: CASE STUDY OF BRIDGE INTERNATIONAL
ACADEMIES, NAIROBI
BY
WENDY MASALE
UNITED STATES INTERNATIONAL UNIVERSITY – AFRICA
SPRING 2018
EFFECT OF COMPETITIVE STRATEGIES ON ORGANIZATIONAL
PERFORMANCE: CASE STUDY OF BRIDGE INTERNATIONAL
ACADEMIES, NAIROBI
BY
WENDY MASALE
A Research Project Report Submitted to the School of Business in Partial Fulfillment of the Requirement for the Degree of Masters in Business
Administration (MBA)
UNITED STATES INTERNATIONAL UNIVERSITY – AFRICA
SPRING 2018
ii
STUDENT’S DECLARATION
I, the undersigned, declare that this is my original work and has not been submitted to any
other college, institution or university other than the United States International University
in Nairobi for academic credit.
Signed:__________________________ Date:____________________________
Wendy Masale (Reg No: 600664)
This project has been presented for examination with my approval as the appointed
supervisor.
Signed:__________________________
Date:____________________________
Dr. Joyce W. Ndegwa
Signed:__________________________ Date:____________________________
Dean, Chandaria School of Business

iii
COPYRIGHT
All rights reserved. No part of this project may be reproduced, stored in a retrieval system
or transmitted in any form or by any means electronic or mechanical without prior written
permission of the author.
Wendy Masale Copyright © 2018
iv
ABSTRACT
The purpose of this study was to investigate the effect of competitive strategies on the
organizational performance of Bridge International Academies in Nairobi. The study was
guided by the following research questions. What effect does cost leadership strategy have
on the organizational performance of Bridge International academies in Nairobi? What
effect does effect of differentiation strategy have on the organizational performance of
Bridge International academies in Nairobi? What effect does focus strategy have on the
organizational performance of Bridge International academies in Nairobi?
The study used a descriptive research design where quantitative research methods were
applied because they facilitated collection of data and the reporting of numerical results for
the variables. The target population of the study was 156 members of staff of the Bridge
International Academies located in Nairobi. The sampling frame consisted of a list of
school management and teaching staff of Bridge International Academies. The study
utilized stratified random sampling technique in the selection of the appropriate sample and
applied Yamane’s formula to come up with a sample size of 111 manager and teachers. A
semi-structured questionnaire was used to collect data from the selected respondents and a
pilot study was conducted to test the validity of the data collection instrument. The data
collected was then analysed using Statistical Package for Social Sciences (SPSS) version
24 using descriptive statistics such as means, standard deviation, frequency and percentage.
Tables and graphs were used to present, summarize and organize data. For inferential
analysis, correlation was used to measure the strength of the relationship between
differentiation, focus, cost leadership and organizational performance. Additionally,
regression analysis was used to establish the nature of the relationship between dependent
and independent variables.
Findings on the first research question revealed that majority of respondents agreed that
cost leadership strategy techniques are employed by management to minimize costs,
increase profit margins and grow market share. A correlation analysis between cost
leadership strategy and organizational performance indicated a moderate positive
relationship and the regression coefficients showed a positive and significant relationship
between cost leadership strategy and organizational performance. Findings from the
second research question, established that Bridge markets its brand, products and services
aggressively, offers higher value products and services than those of competitors and
v
emphasises innovation and continuous improvement. A correlation analysis between
differentiation strategy and performance was a strong positive one and the regression
coefficients showed a positive and significant relationship between differentiation strategy
and organizational performance. Finally, on the third research question, focus strategy was
found to have a positive but negligible effect on organizational performance. The main
focus strategy methods used by the firm include aggressive marketing, specialization,
emphasis on quality and specialization.
The study concludes that differentiation contributes the most towards improved
organizational performance at the Bridge International Academies in Nairobi and the
academies have also managed to enhance performance by pursuing cost leadership
techniques such as cost reduction, leveraging economies of scale, use of technology,
outsourcing and vertical integration. The study also concludes that focus strategy is
adopted by Bridge to target the low income market segment although this strategy has a
negligible positive effect on organizational performance.
This study recommends that Bridge International Academies should embrace and invest
more in cost leadership strategy since it clearly has a positive impact on organizational
performance. Bridge International Academies should also refine the differentiating
techniques they are implementing by differentiating their personnel through continuous
training and enhancing continuous improvement of products and processes to make them
more unique and attractive. Focus strategy has the lowest effect on performance at Bridge.
There is however potential for further growth from the application of this strategy
Additionally, the study recommends that Bridge International Academies should clarify
their long term goals and carry out a capability analysis before selecting the competitive
strategy or combination of strategies they will execute to drive up the firm’s performance.
vi
ACKNOWLEDGEMENT
I would like to thank the Almighty God for strength and provision that enabled me to
proceed with this research. I would also like to express my gratitude to my supervisor, Dr.
Joyce Ndegwa for her patience, guidance and dedication without which I would not have
been able to complete this project.
I would also like to thank my family and close friends for their encouragement and support
throughout this Master’s program as well as the USIU community comprising of lecturers,
students and staff who have made this chapter of my life more fulfilling. Finally, special
appreciation goes out to my boss - Samit Gehlot – for allowing me to take time off for
classes and exams.

vii
DEDICATION
I would like to dedicate this labour of love to my Mum and Wycliffe Ajwang’ - for their
unwavering support, sacrifice and encouragement. I also dedicate this project to the special
little ones in my life - Kijala, Sifa, Shana and Ian. I pray that you excel in your journeys of
learning and discovery. God bless you all.
viii
TABLE OF CONTENTS
STUDENT’S DECLARATION .......................................................................................... ii
COPYRIGHT ..................................................................................................................... iii
ABSTRACT ........................................................................................................................ iv
ACKNOWLEDGEMENT ................................................................................................. vi
DEDICATION ................................................................................................................... vii
LIST OF TABLES ............................................................................................................... x
LIST OF FIGURES ............................................................................................................ xi
CHAPTER ONE .................................................................................................................. 1
1.0 INTRODUCTION ......................................................................................................... 1
1.1 Background of the Problem ............................................................................................. 1
1.2 Statement of the Problem ................................................................................................ 4
1.3 Purpose of the Study ........................................................................................................ 6
1.4 Research Questions ......................................................................................................... 6
1.5 Significance of the Study ................................................................................................. 6
1.6 Scope of the study ........................................................................................................... 7
1.7 Definition of Terms ......................................................................................................... 7
1.8 Chapter Summary ............................................................................................................ 8
CHAPTER TWO ................................................................................................................. 9
2.0 LITERATURE REVIEW ............................................................................................. 9
2.1 Introduction ..................................................................................................................... 9
2.2 Effect of Cost Leadership Strategy on Organizational Performance .............................. 9
2.3 Effect of Differentiation Strategy on Organizational Performance ............................... 13
2.4 Effect of Focus Strategies on Organizational Performance........................................... 19
2.5 Chapter Summary .......................................................................................................... 23
CHAPTER THREE ........................................................................................................... 24
3.0 RESEARCH METHODOLOGY ............................................................................... 24
3.1 Introduction ................................................................................................................... 24
3.2 Research Design ............................................................................................................ 24
ix
3.3 Population and Sampling Design .................................................................................. 24
3.4 Data Collection Methods ............................................................................................... 27
3.5 Research Procedures ...................................................................................................... 28
3.6 Data Analysis Methods .................................................................................................. 28
3.7 Chapter Summary .......................................................................................................... 29
CHAPTER FOUR ............................................................................................................. 30
4.0 RESULTS AND FINDINGS ....................................................................................... 30
4.1 Introduction ................................................................................................................... 30
4.2 Response Rate ............................................................................................................... 30
4.3 General and Demographic Information ......................................................................... 30
4.4 Effect of Cost Leadership Strategy on Organizational Performance ............................ 35
4.5 Effect of Differentiation Strategy on Organizational Performance ............................... 39
4.6 Effect of Focus Strategies on Organizational Performance........................................... 44
4.7 Chapter Summary .......................................................................................................... 47
CHAPTER FIVE ............................................................................................................... 48
5.0 DISCUSSION, CONCLUSIONS AND RECOMMENDATIONS .......................... 48
5.1 Introduction ................................................................................................................... 48
5.2 Summary ........................................................................................................................ 48
5.3 Discussion ...................................................................................................................... 49
5.4 Conclusions ................................................................................................................... 54
5.5 Recommendations ......................................................................................................... 56
REFERENCES .................................................................................................................. 58
APPENDICES .................................................................................................................... 71
APPENDIX I: LETTER OF INTRODUCTION ................................................................. 71
APPENDIX II: QUESTIONNAIRE ................................................................................... 72
x
LIST OF TABLES
Table 3.1 Target population distribution table…………….………………………….25
Table 3.2 Sample size distribution table…………………….………………………..27
Table 4.1 Response Rate…….….…………………………………………………….30
Table 4.2 Age of Respondents………………………….…………………………….30
Table 4.3 Level of Education of Respondents …….…………………………………32
Table 4.4 Occupation of Respondents .………………………………………………34
Table 4.5 Perception of Strategy Adopted …….……………………………………..34
Table 4.6 Effect of Cost Leadership on Organizational Performance ……………….36
Table 4.7 Model Summary of Cost Leadership and Organizational
Performance ................................................................................................. 37
Table 4.8 ANOVA of Cost Leadership and Organizational Performance.…………...38
Table 4.9 Coefficients Variation of Cost Leadership and Organizational
Performance ................................................................................................. 39
Table 4.10 Effect of Differentiation on Organizational Performance…………………41
Table 4.11 Model Summary of Differentiation and Organizational
Performance ……………………………………………………………….42
Table 4.12 ANOVA of Differentiation and Organizational Performance …………….42
Table 4.13 Coefficients Variation of Differentiation and Organizational
Performance…………………………………….………………………….43
Table 4.14 Effect of Focus Strategies on Organizational Performance….…………….45
Table 4.15 Model Summary of Focus Strategies and Organizational
Performance ……………………………………………………. ............... 46
Table 4.16 ANOVA of Focus Strategies and Organizational Performance…….……...46
Table 4.17 Coefficients Variation of Focus Strategies and Organizational
Performance…………………………………………………….. ............... 47
xi
LIST OF FIGURES
Figure 2.1 Alignment between Technology, Strategy and Leadership………………..18
Figure 4.1 Respondents’ Gender Distribution.……………………….………………..32
Figure 4.2 Level of Experience of Respondents……………………….……………...33
1
CHAPTER ONE
1.0 INTRODUCTION
1.1 Background of the Problem
Any business entity that is focused on achieving organizational growth and success
considers its main objective to be the maximization of shareholder’s wealth. A firm attains
this goal by selecting a competitive strategy that will give it an edge over other players in
the industry. This competitive edge is referred to as competitive advantage. According to
Dirisu, Iyiola and Ibidunni (2013), a competitive advantage exists when the firm is able to
deliver the same benefits as competitors but at a lower cost (cost advantage), or deliver
benefits that exceed those of competing products (differentiation advantage). The source of
the advantage can be something the business does that is distinctive and difficult to
replicate, also known as a core competency (Jabbouri & Zahari, 2014).
Competitive strategies are integrated sets of actions that management implements as a
model for how the company will best compete, based on the match between its type of
competitive advantage and the target market pursued, as the key determinants of choice
(Auka, 2014). While making a decision on which competitive strategy to pursue, firms
therefore decide between two broad competitive advantages: lower cost than competitors
or the ability to differentiate and charge a premium price that covers costs (Hitt, Ireland &
Hoskisson, 2015). In the dynamic and growing business environment, it is crucial that
management map out their strategic orientation carefully to match their capabilities with
existing opportunities. There are three main competitive strategies a firm may choose to
deploy to gain a competitive advantage: cost-leadership strategy, differentiation strategy
and focus strategy.
According to Pulaj, Kume and Cipi (2015), cost leadership is founded on organizational
efficiency where a firm is able to produce or distribute products and services at a lower
cost than other players in the industry. The sources of cost advantage may include the
pursuit of economies of scale; proprietary technology; preferential access to raw materials
and other factors (Asieh, 2016). Asieh further elaborates that low cost leaders must
however sustain this competitive advantage, by investing in capital intensive technology
and automation systems that significantly reduce costs. They may also employ highly
2
efficient logistics and maintain a lower cost base on labour, materials and resources
compared to competitors.
While cost leadership is founded on cost minimization and operational efficiency, the
differentiation strategy is built on product innovation or services that are perceived to be
different from those of competitors (Chang and Tripathy, 2015). Firms that pursue a
differentiation strategy create customer value by offering high quality products and
services at a premium price. These firms can afford to charge a premium fee based on the
perception they create in their customers’ minds that there is a value add on their products
and services. This differentiation is what that makes the products and services more unique
and appealing than those of competitors based on image, brand, quality, reliability and
other factors (Baroto, Abdullah & Wan, 2012). A company therefore attains a competitive
advantage by creating, making and selling a product that better satisfies customer needs
than its rivals (Jones & Hill, 2013).
Focus is the third competitive strategy. This strategic approach involves the targeting of a
specific market segment or niche (Pulaj et al., 2015). According to Sumer (2012), this
strategy targets a specific and typically small niche which could be a particular buyer
group, a narrow segment of a given product line, a geographic or regional market, or a
niche with distinctive, special tastes and preferences. A focused strategy can take on a low
cost approach where a firm aims at serving customers in a target market niche at a lower
cost and price than competitors or a firm can adopt a focused differentiation business
model by aiming to attract a group of well-defined buyers that have unique preferences and
are willing to pay a premium price for special product and service features (Hough,
Thompson & Gamble, 2011).
Strategic factors and a changing business environment have forced some firms to adopt a
different strategy or in some cases customize a hybrid of two competitive strategies that
will suit their needs and lead to growth in market share. Baroto et al. (2012) propose that
since cost based or differentiation based strategies are difficult to sustain in a dynamic
business environment, firms that pursue a hybrid or combination strategy may achieve
higher performance in the long term than firms that pursue a pure strategy. The successful
implementation of a hybrid or combination strategy therefore facilitates optimal response
to the dynamic business environment. This flexibility allows the firm to exploit the
3
strengths of pure strategies while minimizing the weaknesses of a single strategy approach
thus avoiding the stuck in the middle outcome (Lapersonne, Shangavi & De Mattos, 2015).
A dynamic business environment and competitors who can imitate capabilities are just
some of the factors that make it very difficult for firms to sustain a competitive advantage.
According to Hurduzeu (2015), firms measure this competitive advantage not just by
external measures but also by internal measures of organizational performance such as
financial performance, customer perspective, internal business processes and learning and
growth. Organizational performance is therefore an important measure of the effectiveness
of a firm. Maduenyi, Oke and Fadenyi (2015) further define organizational performance as
the ability to achieve organizational goals and objectives. They explain further that it is the
organization’s ability to accomplish its aims and objectives through the use of resources in
a properly structured manner. Businesses must therefore aspire not only to maximize
profits, but also to benefit all stakeholders by offering quality goods and services.
For profit organizations in the education sector are increasingly integrating competitive
strategies in business model formulation and implementation. Firms in the lower education
sector, also referred to as elementary, grammar or primary school are also taking a more
strategic approach on growing market share and gaining a competitive advantage over
other players. Globally, school management and leadership teams in the USA, Canada and
South America are working with consultants and industry experts to analyze market trends
(Drouin, 2014). According to Drouin, schools in the West are more competitive and are
adopting business models that will attract customers in their target market. Differentiation
of facilities, curriculum, amenities and services is common in exclusive, high-end private
and independent academies which target the affluent and rich (Whitehurst, 2014).
In Africa, there is a penetration of low fee private schools (LFPS) as an alternative to
government schools which are either free or affordable and target the poor and low income
earners. According to East African Centre for Human Rights (2017), these schools employ
the cost leadership approach to attract parents who are not satisfied with the quality of
education in understaffed and resource deficient public schools. Omega School Franchise
in Ghana – a self-sustainable school model, currently operates low cost private schools in
the country. The franchise has grown at a very fast rate since the launch of operations in
2009. By 2011, Omega had enrolled a population of 11,000 students in 3 years
(Whitehurst, 2014). At the other end of the spectrum, are exclusive privately managed
4
schools that offer a differentiated education model with an assortment of attractive features
to the wealthy.
An example is the GEMS Cambridge network of schools which currently has 2 schools in
East Africa and charges premium annual fees of over USD 15,000 (Gems, 2017). Non-
profit organizations such as churches and charities adopt the focus strategy to offer
education to a particular niche for example children with special needs. Competition in the
Kenyan education sector has also gained momentum in recent years and players in the
sector have realized they have to employ effective strategies to survive the turbulent
environment. Apart from the government owned institutions, individual proprietors, church
based organizations, not for profit and for profit organizations are competing to meet the
high demand for education. Players such as the government, GEMS Cambridge, Bridge,
Aga Khan Academies and others are executing appropriate competitive strategies to
educate a population of over 20 million children (United Nations Statistics Division, 2016).
Bridge International Academies also referred to as “Bridge” in the shorthand, is one of the
private education organizations that are utilizing its competencies and capabilities to ward
of the competition in a burgeoning market (Kwauk and Robinson, 2016). Bridge entered
the Kenyan market in 2008 and opened its first private school in Mukuru slum in 2009
(International Finance Corporation, 2016). The challenge for co-founders May and
Kimmelman was to develop a model that will leverage low cost advantages to offer not
only low cost but also differentiated quality education that will deliver high learning
outcomes. This study explores the effect of cost leadership, differentiation and focus
strategy on the organizational performance of Bridge.
1.2 Statement of the Problem
According to Spring Singapore (2017), school management and leadership teams have
over the last decade evolved and shifted their focus from a predominantly internal
perspective to a realization that there is a dynamic environment that also requires external
environmental scanning. A research study conducted by Jabbar (2015) of the Education
Research Alliance, to understand the effect of market based reforms in schools in the
United States indicates that management teams of lower education institutions are
increasingly embracing strategic thinking and alignment. Jabbar reports that schools in the
survey employ cost leadership by focusing on offering lower fees through budget cuts and
increasing market share by opening additional schools to drive up enrollment numbers.
5
Some of the schools have opted to target a specific market niche by specializing on
developing specific skills for example art, music and drama thus adopting a focus strategy.
Most of the schools studied opted for differentiation by offering a bouquet of unique
extracurricular programs and activities (Mamaev et. al., 2015).
Another study by Bau (2017) which was carried out on schools in India and Pakistan
revealed that differentiation is applied mostly by high-end private schools while low cost
private schools employ cost leadership to attract and retain children from poor families in
the population. Bau adds that government policies in countries like India have encouraged
school competition in the private education sector by requiring a quota of 25% enrollment
of poor students. According to Pearson (2016), in the Indian Subcontinent and the rest of
the developing world, upwards of 40% of children living in poverty are already enrolled in
low-cost private schools. In larger cities the figure rises to 70%. Researchers propose that
this surge in enrollment in low-fee private schools in developing countries over the last 20
years is due to the fact that millions of parents are increasingly seeking better alternatives
to dismal government owned schools (The Economist, 2015).
Nthambi (2016) in her study argues that schools need to take a more proactive approach to
planning and strategy if they want to avoid being overwhelmed by an increasingly
turbulent environment. The author posits that by building organizational capabilities and
core competencies which they can leverage to gain market share and customer loyalty,
schools stand a better chance of sustaining competitive advantage. Mamaev et.al. (2015)
surveyed 165 institutions to analyze strategies their management teams employed to
increase market share and competitiveness. They discovered three generic templates: -
lower and attractive fees through cost reduction; provision of high quality services and
facilities at a premium cost and focusing on specific market segments for example distance
learning. This study however like numerous others, was limited to higher education.
Private primary schools have in the recent past changed tact and more institutions are
implementing competitive strategies to grow market share (Pearson, 2016). Varied studies
have been conducted on the implementation of competitive strategies in educational
institutions. These studies are however not sufficient to give a clear picture on the
relationship between the competitive strategies and organizational performance in the
context of the lower education sector. One of the main reasons for this observation is that
most of the research conducted focuses on universities and other institutions that offer
6
higher education. Additionally, there is minimal scrutiny into the effect of these strategies
on organizational performance. More studies therefore need to be conducted specifically
on the effect of competitive strategies on the organizational performance of primary
schools in the private sector. For this reason, this research on Bridge International
Academies provides new insight into the competitive strategies applied by this institution
which provides primary level education and the effect of these strategies on various
perspectives of organizational performance.
1.3 Purpose of the Study
The purpose of the study was to investigate the effect of the competitive strategies on
organizational performance in the Bridge International Academies in Nairobi.
1.4 Research Questions
1.4.1 What effect does Cost Leadership strategy have on the organizational performance
of Bridge International academies?
1.4.2 What effect does Differentiation strategy have on the organizational performance of
Bridge International academies?
1.4.3 What effect does Focus strategy have on the organizational performance of Bridge
International academies?
1.5 Significance of the Study
The findings of the study are beneficial to various stakeholders.
1.5.1 Bridge Academies
This study is of benefit to the target population which is Bridge International Academies.
The findings and recommendations guide the management of this organization on making
critical strategic decisions and serves as a reference point for improvements on the
application of competitive strategies for the benefit all stakeholders and the enhancement
of overall organizational performance.
1.5.2 Government and Industry Regulators
The information obtained from the study gives new insight to the Kenyan government and
regulators who are keen on regulating low cost education in the country. It will facilitate
the development of sustainable business models that will help to improve access to
education for the poor and disadvantaged.
7
1.5.3 Education Stakeholders
This study enlightens stakeholders such as parents, school managers and head teachers,
school owners in the education sector especially those in the private sector who are
interested in the impact of strategy on organizational performance and the importance of
analysing and implementing feasible business models that will improve not just access but
also the quality of education.
1.5.4 Scholars
The research enriches the information and knowledge base for academicians and
researchers who are interested in learning more about the competitive strategies and their
effect on organizational performance. The study has supplemented previous studies done
on the two variables in the private education sector.
1.6 Scope of the study
The study focused on the Bridge international academies in Kenya. There were over 400
Bridge schools in the country. This study was however limited to schools located in
Rongai, Kayole, Sinai, Kwa Reuben, Diamond, Korogocho, Kingston, Lunga Lunga,
Matopeni, Gumba, Kiambio and Tassia within Nairobi County. This study was conducted
between the months of September 2017 to April 2018. The study covered academy
managers, assistant academy managers and teachers at the Bridge International Academies.
The organization’s confidentiality policy hindered provision of detailed information by the
interviewees. The study however addressed this limitation by assuring respondents that the
research would be used strictly for academic purposes and that their identities would
remain anonymous.
1.7 Definition of Terms
1.7.1 Cost Leadership Strategy
This is a competitive strategy that consists of a set of integrated actions taken to produce
goods and services with features that are acceptable to customers at the lowest cost relative
to those of competitors (Hitt et al., 2015).
1.7.2 Differentiation Strategy
This is a competitive strategy that involves creating a market position that can be based
upon design or brand image, distribution, and so forth. In particular, differentiator firms
8
create customer value by offering high-quality products supported by good service at
premium prices (Dirisu et al. 2013).
1.7.3 Focus Strategy
This is a competitive strategy that a firm adopts to produce goods and services that meet
the needs of a particular segment or market niche (Hitt et al., 2015).
1.7.4 Organizational Performance
The ability of an organization to accomplish its goals and objectives by utilizing resources
in a properly structured manner (Maduenyi et al., 2015).
1.8 Chapter Summary
This study is organized into five chapters. This chapter introduces the case study
organization, background to the study, statement of the problem, significance of this study
and the scope within which the study was conducted. In chapter two a review of existing
literature on cost leadership, differentiation and focus strategies is done. Chapter Three
focuses on research methodology adopted for this study; population and sampling design,
data collection procedures, research procedures and data analysis methods to be used.
Chapter Four captures the research results and findings while Chapter Five will contain a
summary of the findings, discussions, conclusion and recommendations.
9
CHAPTER TWO
2.0 LITERATURE REVIEW
2.1 Introduction
This chapter presents a review of literature on existing studies that have been carried out in
relation to the effect of cost leadership strategy, differentiation strategy and focus strategy
on organizational performance.
2.2 Effect of Cost Leadership Strategy on Organizational Performance
Cost leadership is a competitive strategy that consists of a set of integrated actions taken to
produce goods and services with features that are acceptable to customers at the lowest
cost relative to those of competitors (Hitt et al., 2015). Cost leadership which is also
referred to as low cost leadership is one of three main competitive strategies for
outperforming competitors in the long-run (Chaudhry & Gul, 2017). As illustrated by
Pearce and Robinson (2013) in the image below, cost leadership targets a broad industry
wide market and uses the cost advantage to gain a defendable position against competitors.
In the cost leadership arena, Easyjet the largest low-cost airline in Europe dominates the
low cost carrier industry. The airline has outclassed rivals by providing good value and
quality service with a “no-frills” approach. Their focus on volumes rather than high
margins led to a competitive advantage over rival airlines (Tanwar, 2013). In Kenya, firms
that have employed cost leadership strategies include Equity Bank which targets the low
income market segment by implementing a low-cost, high-volume business model
(Kipgnetich, 2015).
A study by Tanwar (2013) indicates that through cost leadership, a firm can identify and
exploit all sources of cost advantage with a goal of becoming the lowest cost producer in
the industry. This strategy’s cornerstone is efficiency. By integrating efficient practices
throughout the organization and in all relevant functions, the firm is able to minimize costs
and offer lower prices than competitors. According to Nyauncho and Nyagara (2015), who
carried out a study on the impact of cost leadership on the performance of liquefied
petroleum gas companies in Kenya, the core philosophy of the cost leadership strategy
requires that whilst controlling costs to maintain low prices; firms should ensure quality
and customer preferences are not compromised.
10
One of the greatest challenges for cost leaders is sustaining a competitive advantage. This
is because competitors can imitate the industry leader’s capabilities, drive their prices
down and offer substitutes to the market. According to Tanwar (2013), buyers in a low
cost market are price sensitive and tend to switch easily to cheaper brands. In such cases,
brand image and loyalty will give the cost leader a defendable position as in the case of US
retailing giant –Walmart. Hough et al. (2011) add that a firm achieves cost leadership when
it becomes the industry’s lowest cost producer rather than just being one of several
competitors with comparatively low costs. However, firms must be careful not to
compromise the attractiveness of the product or service while pursuing a low cost
advantage.
Jones and Hill (2013) propose that firms can sustain a cost leadership position by
constantly innovating and coming up with ways of operating efficiently. Cost reduction
and creating efficiency are therefore critical activities for any firm that is executing a cost
leadership business model. This advantageous positon is also attained through experience
and learning; investment in production facilities, capturing all economies of scale and other
avenues (Birjandi et. al, 2014). According to Price Waterhouse Coopers (2016), examples
of cost reduction techniques that a firm can implement to manage and control its costs
include, discontinuing non-essential activities that do not have cost advantages;
outsourcing some activities, for example payroll processing; intensive research and
development for innovation and continuous improvement; automating processes or using
technology for efficiencies; streamlining processes for operational excellence and
backward vertical integration so as to minimize costs. These techniques may have a high
initial outlay but if implemented successfully, then the benefits outweigh the costs
(Gildemeister et al., 2013).
Hagen (2010) explores instances of cost leaders losing their advantageous position to
industry rivals that identified their strengths and responded quickly before they gained a
sustainable competitive advantage. The study cites the example of Cisco Systems, a global
network manufacturer that was the market leader in China in the 1990s until Huawei – a
little known Chinese brand entered the market and rapidly scanned the competitive
landscape before it launched an aggressive takeover. Huawei took advantage of its
organizational capabilities and core competences for example lower networking equipment
costs and strategic partnerships to overtake Cisco. It is clear that not even strong,
established brands are safe from low cost rivals (Jones & Hill, 2013). Huawei
11
demonstrated this by constantly reinventing itself, redesigning its value chain and rapidly
responding to a turbulent environment. Eventually, the firm thrived and cut Cisco’s market
share from 60% to 40% increasing revenues from $2.3 billion to almost $ 6 billion (Hagen,
2010).
By achieving a cost advantage the low cost leader can therefore improve organizational
performance if it is able to sustain a lower cost structure than competitors thus increasing
its profit margin. Additionally, the firm should continually reinvent itself and respond
rapidly to changes in the environment. However, for overall enhancement in organizational
performance, management must not neglect other indicators in its effort to minimize costs.
Hagen (2010) proposes a strong change management strategy to realign all functions to the
new strategic approach. There also needs to be a focus on quality. Despite a no frills
approach the attractiveness of products and the band should not be compromised and
organizational capabilities and core competencies need to be strengthened and enhanced
(Tanwar, 2013).
2.2.1 Economies of Scale and Experience curve Economies of scale are created when the costs of offering goods and services decreases as
a firm is able to sell more items (Edwards, 2017). Economies of scale may also describe
the economic advantages that show when higher volumes of output are produced with as
compared to smaller ones and that result in cost reduction per unit for that particular
output, and for the same price of input (Celli, 2013). According to Hough et al. (2011), a
firm can achieve economies of scale by operating a large plant or distribution warehouse
rather than a small one or in a manufacturing concern, common parts and components are
more cost effective than customized ones. A number of companies have successfully
captured economies of scale to their advantage. An example is Fedex and United Parcel
who own a large fleet of airplanes which they run efficiently thus cutting their unit costs
significantly (Goedhart, Koller & Wessels, 2017).
According to Hough et al., (2011), the cost of performing an activity can decline over time
as the skill and experience of the firm’s staff improves. A study by Lee (2014) indicates
that gains in learning and continuous improvement can lead to improvement in
performance and cost reduction as in the case of Toyota which through intensive research
and development, identified the most efficient sequence for each manufacturing and
assembly process (Gao & Low, 2014). These sources of cost reduction include improved
12
product design, direct labour efficiency, indirect labour efficiency and process
improvements.
2.2.2 Capacity Utilization and Technology Average production costs normally decrease as the level of output increases therefore
higher capacity utilization can be a source of cost advantage. Operating at full capacity is
therefore desirable because fixed costs are spread over more units (Learnloads, 2014). In
addition, the more capital intensive the business and the higher the fixed costs then the
greater the need for full capacity utilization in order to capture cost advantages. Full
capacity utilization can be a source of much needed efficiency for a cost leadership
position (Hough et al., 2011). Technology is the practical application of knowledge
especially in a particular area or field. It is a manner of accomplishing a task especially
using technical processes, methods, or knowledge. It can also be defined as the specialized
aspects of a particular field of endeavour (Khayali, Koubaa & Zouaoui, 2014). Technology
is one of the most critical components for cost leadership. A cost leader must invest in
technology to achieve efficiencies and cost reductions that will lead to an increase its profit
margins. However, this technology can be imitated by competitor hence the need for
continuous improvement and innovation to help the firm acquire inimitable capabilities
(Pearce & Robinson, 2013).
2.2.3 Outsourcing, Vertical integration and Supply chain efficiency
Bacea and Borza (2014) define outsourcing as the process of contracting another firm to
perform activities that were done or that could be done in-house. Gildemeister et al.,
(2013) list outsourcing and vertical integration as some of the cost reduction techniques
that a firm can implement to manage and control its costs. Examples of activities that can
be outsourced include payroll processing and cleaning services. They define backward
vertical integration as a tactic firms use to gain control of distributors or suppliers so as to
minimize costs. These two techniques may have a high initial outlay but if implemented
successfully, then the benefits outweigh the costs.
A firm that is pursuing a cost leadership position in the industry must develop distinctive
competencies that will enable it to streamline its supply chain management in order to
reduce storage, shipping and handling costs (Jones & Hill, 2013). In a study on supply
chain best practices PLS Logistics Services (2017) recommends that firms regularly
evaluate their logistics strategy to improve operational efficiency. The study reports that
13
informed decisions and changes can save a company up to 40% in logistics costs. An
example of a trendsetter in supply chain management is Walmart. Walmart’s greatest
strength is its inventory control. The firm has effective distribution centres in strategic
locations which are close to its stores. The company also cuts out the “middleman” and
receives products directly from manufacturers thus significantly reducing costs (Sawad,
2017). The only way firms can achieve this efficiency is by constantly evaluating processes
and altering the logistics management strategy to fit the company’s changing needs.
2.3 Effect of Differentiation Strategy on Organizational Performance
A differentiation strategy is one that involves the firm creating a product/service, which is
considered unique in some aspect that the customer values because the customer’s needs
are satisfied (Dirisu et al., 2013). Differentiation is characterized by innovation and rapid
response to customer needs. According to Mahdi et.al (2015), the core of this strategy is
innovation. To cope with competition in the industry and constantly meet changing
consumer needs, firms must leverage their distinctive competencies and organizational
capabilities to produce new product features, products, services and processes. Gehani
(2013) emphasizes that to sustain a competitive advantage these enterprises must establish
high barriers to entry for their rivals by going beyond their incremental improvements and
transforming themselves into radically innovating enterprises with protected proprietary
intellectual property or unique distribution channels.
Zehira, Canb and Karabogac (2015) argue that from the beginning of the millennium, due
to the speed of globalization, the intensity of competition has increased and as a result
firms are focusing more on formulating and executing business models that will give them
a competitive edge over other industry players. Many organizations opted to innovate to
cope with changing lifestyles, tastes and preferences and this led to the push to
differentiate products and services from those of competitors. There are varied approaches
to achieving differentiation. Yang (2013) in a study on innovation in the Chinese tourism
industry describes innovation as one of the pillars of the differentiation that drives
competitiveness in a firm. According to the Organization of Economic Cooperation and
Development (2017), innovation refers to the introduction of a good or service that is new
or significantly improved with respect to its characteristics or intended uses. These
significant improvements may include technical specifications, components and materials,
14
incorporated software, user friendliness, service experiences or other functional and
aesthetic characteristics.
According to Awwad, Al Khattab and Anchor (2013), most manufacturing concerns
consider quality to be a competitive marketplace weapon. This is because quality as an
aspect of differentiation creates a competitive advantage when products and services meet
or exceed customer needs and expectations. Fields et. al (2014) while citing Garvin’s
Comprehensive framework, define quality as the degree of excellence of a product or
service. They present eight dimensions for measuring quality. These include performance,
features, reliability, conformance, durability, serviceability, aesthetics, and perceived
quality. The pursuit of high quality in differentiation improves product attractiveness
which consequently leads to an increase in sales and brand loyalty. Other features of a
differentiation strategy include brand positioning, innovation in marketing techniques,
control of distribution channels, advertising campaigns, intensive research and
development, improving brand image and company reputation (Zehira et al., 2015).
Differentiation is therefore a source of competitive advantage. By seeking out customers’
needs that other competitors have not met, a firm executing the differentiation strategy can
offer products and services that are unique and of high quality to these consumers. Cao
(2017) posits that this unique offering provides higher profitability because buyers are
willing to pay higher prices for the distinctive features that surpass those of competitors.
Zehira et al., (2015) emphasise that the differentiation strategy provides higher profitability
by creating brand loyalty and low price sensitivity. This strategy reduces price sensitivity,
decreases power of suppliers, creates a powerful entry barrier and reduces threat of
substitute products. Through effective brand positioning, aggressive advertising and
marketing, superior logistics, technological developments, quality control and revamping
brand image an enterprise can grow its revenues, maximize shareholders’ wealth and
satisfy internal and external stakeholders (Awwad et al., 2013).
Globally, there are numerous examples of successful companies in different industries that
have excelled on the strength of competitive strategies. An example of a firm that has
sustained a competitive advantage through the differentiation strategy is Nike (Forbes,
2017). Nike incorporated is an American multinational that designs, manufactures, markets
and sells sports footwear, equipment and accessories. Nike focuses on developing high
quality products for its target market and charges a premium price for the value addition. In
15
2016 the brand was valued at $15.9 billion, making it the most valuable brand among
sports businesses (Forbes, 2017). Another example of a successful differentiator is Apple –
a market leader in the computer and electronics industry. The American brand’s huge
success has been driven by a culture of continuous innovation and a customer driven
outlook. Apple has consistently trounced its competitors with its cutting edge innovation.
The company upgrades its products inexhaustibly, offering great colour choices, artistic
designs and elegant product features that appeal to customers who are willing to pay a
premium price for their high quality products (Jinjin, 2013).
2.3.1 Uniqueness and Quality
A firm following a differentiation strategy attempts to convince customers to pay a
premium price for its good or services by providing unique and desirable features (Aliqah,
2012). Such firms build on their capabilities and resources to provide unique and desirable
product or service features that customers are willing to pay a premium price for.
According to Fathali (2016), differentiating firms unlike cost leaders compete based of
uniqueness rather than price when they seek to attract a large customer base. Young (2017)
emphasizes that uniqueness is a key pillar for such firm since the main focus of this
competitive strategy is its emphasis on features or characteristics that make the company’s
products stand out against competitors. The author presents the example of Unilever which
produces personal care products like Dove Cream Bars to satisfy consumers’ need for
soaps that are not harsh or drying. Despite their relatively high selling prices, such
Unilever products are competitive because they stand out from a majority of soaps that
focus more on cleaning than moisturizing.
Quality in differentiation refers to the customers’ perception of how well a company’s
products and services meet their expectations (McFarlane, 2013). Thomasson and Wallin
(2013) define quality as the conformance to standards, requirements or expectations. The
authors suggest that this definition originated from the quality control concept in the
manufacturing industry. They state further that the quality of a product is therefore
measured in terms of its conformance to specifications or expectations. Another definition
by Elassy (2015) relates quality to customer satisfaction and business growth. Quality in
this perspective defines the state of meeting or exceeding customer needs. The author
stresses the importance of understanding and knowing what the firm’s customers want and
16
then satisfying those needs. In addition, the delivery of high quality can lead to growth in
market share and profits (McFarlane, 2013).
Pearce and Robinson (2015) postulate that it may however be difficult for a firm to sustain
this growth and competitive advantage because other firms in the industry may replicate its
competencies or capabilities and create similar features, thus eroding the distinguishing
characteristics of a product or service. According to Baroto et. al, (2012), companies
having an advantage in terms of financial and technological resources, trained human
capital, new and modern management systems, innovative production methods better fulfil
the conditions required to implement a differentiation strategy successfully since they have
the resources to develop high quality or unique products and charge a premium price.
2.3.2 Innovation and Technology Technology is the practical application of knowledge especially in a particular area or
field. It is a manner of accomplishing a task especially using technical processes, methods,
or knowledge. It can also be defined as the specialized aspects of a particular field of
endeavour (Khayali et al., 2014). Technology may also refer to digital devices and
applications that help people and businesses meet their needs (Vaughan, 2013). According
to Giesler and Heller (2013), technology refers to an artefact or instrument that enables
individuals and organizations to achieve their desires or goals. Therefore technology refers
to all the tools, devices and systems which are clearly identifiable, whether tangible or
intangible and which can be manipulated. The authors support this definition by asserting
that technology has distinct features that qualify to be defined thus.
Technology should be operational, instrumental and functional. Apart from these features,
the user should also derive some benefit from it. Benefits may include ease and speed of
work (Giesler & Heller 2013). Technology has evolved over the decades as people find
new ways of making work and processes simpler, less costly and more effective. As ideas
build on each other to form new technologies, these new technologies are set up to become
components of future new technologies, and so on, and so forth. Existing technologies
evolve into something far more powerful and greater than we had before (Samaroo, 2013).
According to Genpact Research Institute (2017), we are entering an era in which new yet
robust technologies – such as cloud computing, analytics, collaboration, mobile technology
- will catalyze the evolution of process operations, and multiply operations’ impact in
addressing the numerous challenges that large enterprises face.
17
Kinyuira (2014) in a study of competitive strategies deployed by savings and cooperative
societies in Kenya established that technology was used mainly to differentiate product and
service features; to control resources and to schedule operations. A firm may patent
specialized technology that it uses to manufacture products. Blue chip companies like
IBM, Samsung and Microsoft take up numerous patents to protect technology they have
developed to create unique and high value products (Fisher & Oberholzer-Gee, 2013).
According to Samaroo (2013), this drive to improve technology is based on a proven
premise that it is a tool for improved performance. It is therefore a core competence that
organizations want to harness to gain a competitive advantage hence the need for
continuous improvement and aggressive research and development. Technology must
therefore be complemented by creative thinking and innovation. Vaughan (2013) adds that
businesses should create a culture of learning if they seek to harness and improve this
valuable resource. For this reason, some scholars blend their definitions of technology with
innovation.
The Organization of Co-operation and Development (2016) defines innovation as the
implementation of a new or significantly improved product (good or service), or process, a
new marketing method, or a new organisational method in business practices, workplace
organization or external relations. According to Greenhalgh and Rogers (2010), innovation
is the application of new ideas to the products, processes, or other aspects of the activities
of a firm that lead to increased value. This value is defined in a broad way to include
higher value added for the firm and also benefits to consumers or other stakeholders.
Innovation therefore facilitates operational improvements, which enhance cost efficiency.
Innovation is an organisational capability to adopt and apply new ideas, products, and
processes (Bayraklar et.al, 2016). This continuous improvement the author stresses, leads
to improved organizational performance, long-term success and competitiveness.
Innovation is a source of sustainable competitive advantage that has been shown as one of
the most crucial strategic positioning tactics necessary for long term success.
Vaughan (2013) defines technological innovation as a process that develops new, creative
and efficient methods of accomplishing tasks and responding to customer needs. Therefore
technology, coupled with innovation can have a great positive impact on organizational
performance. The Boston Consulting Group (2016) in its 2016 Most Innovative
Companies Survey, mentions Apple, Google, Tesla, Microsoft, Amazon and Netflix as
some of the most innovative companies. These companies are also high performers on
18
other indicators such as financial performance, employee motivation and customer
satisfaction. However, technology and ideas can be imitated by competitors hence the need
for continuous improvement and innovation to help the firm acquire inimitable capabilities
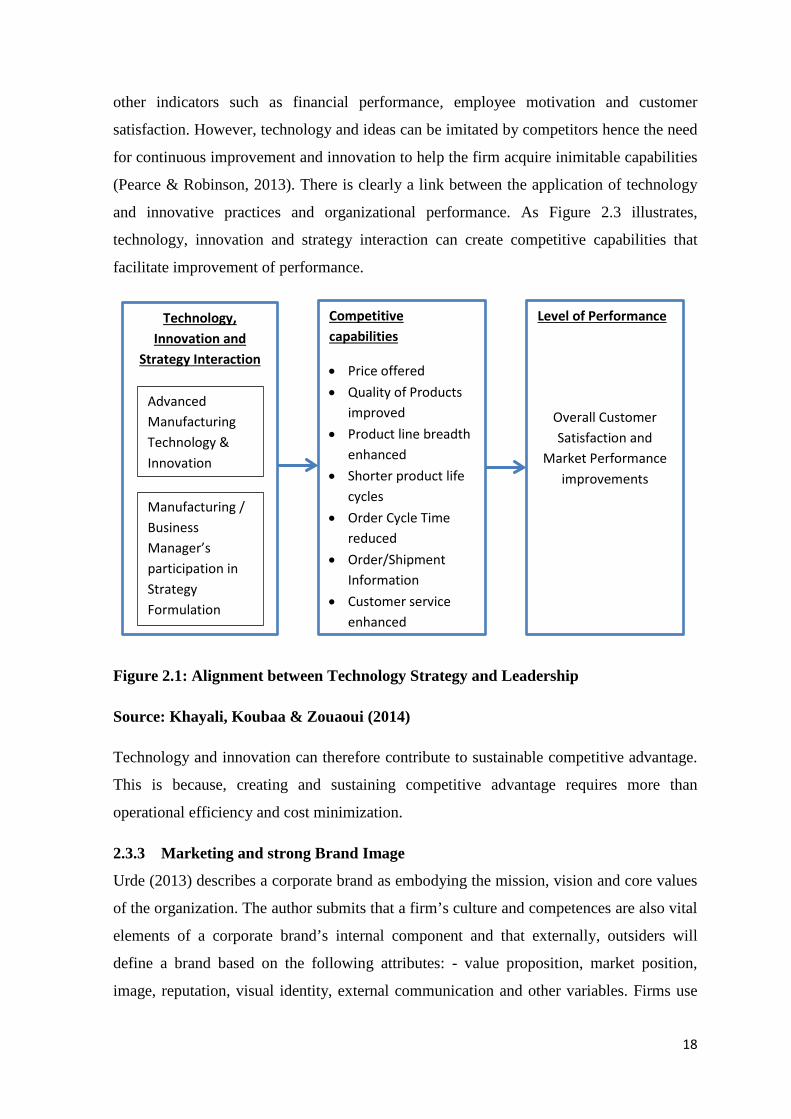
(Pearce & Robinson, 2013). There is clearly a link between the application of technology
and innovative practices and organizational performance. As Figure 2.3 illustrates,
technology, innovation and strategy interaction can create competitive capabilities that
facilitate improvement of performance.
Figure 2.1: Alignment between Technology Strategy and Leadership
Source: Khayali, Koubaa & Zouaoui (2014)
Technology and innovation can therefore contribute to sustainable competitive advantage.
This is because, creating and sustaining competitive advantage requires more than
operational efficiency and cost minimization.
2.3.3 Marketing and strong Brand Image
Urde (2013) describes a corporate brand as embodying the mission, vision and core values
of the organization. The author submits that a firm’s culture and competences are also vital
elements of a corporate brand’s internal component and that externally, outsiders will
define a brand based on the following attributes: - value proposition, market position,
image, reputation, visual identity, external communication and other variables. Firms use
Technology, Innovation and
Strategy Interaction
Competitive capabilities
• Price offered • Quality of Products
improved • Product line breadth
enhanced • Shorter product life
cycles • Order Cycle Time
reduced • Order/Shipment
Information • Customer service
enhanced
Level of Performance
Overall Customer Satisfaction and
Market Performance improvements
Advanced Manufacturing Technology & Innovation
Manufacturing / Business Manager’s participation in Strategy Formulation
19
branding as a way to control and manage consumers’ perceptions about their products and
image. In many cases, branding creates sustainable competitive advantage for firms (World
Intellectual Property Report, 2013). For a company that is implementing the differentiation
strategy, brand is a highly valuable intangible asset, and one these firms develop as a top
priority (Hsu, Wang & Chen, 2013).
Brand loyalty and a strong brand image are essential for retention of established customers
and to attract new ones. This is especially the case for these firms since they charge
premium process for their products and services. Loureiro, Sarmento and Bellego (2017)
support this argument by presenting results from a study on various brands which
confirmed that emotional brand attachment is a key success factor for all of these
companies, brands, and firms. This is motivated by the finding that such connections lead
to higher level of consumer loyalty, which increases a company’s financial performance.
However, there is no conclusive empirical evidence of how brand reputation can impact
organizational performance. In addition to building a strong, positive brand, differentiating
firms must also aggressively market their products to increase awareness of their distinct
products or features in comparison to those of competitors.
2.4 Effect of Focus Strategies on Organizational Performance
A firm may choose to concentrate its competitive scope on a specific market segment or
niche instead of a broad market segment as in the cost leadership and differentiation
strategies. Bertozzi, Ali and Gul (2017) describe this strategic orientation as a focus
strategy. The target segment can be defined by geographic location, special needs or by
special product features that appeal to that particular market niche (Hough et al., 2011).
The authors add that the focus strategy has two variants: - a cost focus strategy and a
differentiation focus strategy. When pursuing a focus strategy, firms must understand the
needs of the customers in the market niche they have selected. This niche can be based on
demographics, geographic location, psychographics or specific needs (Fathali, 2016).
2.4.1 Cost Focus Strategy
In cost focus strategy, a firm seeks a cost advantage in its target segment. A firm that
follows this strategy does not necessarily charge the lowest prices in the industry. Instead,
it charges low prices relative to other firms that compete within the target market (Fathali,
2016). On the other hand, firms that compete based on uniqueness and target a specific
market niche are following a differentiation focus strategy (Tanwar, 2013). According to
20
the results of a study carried out by Pulaj et al. (2015), a focused strategy aimed at securing
a competitive edge based on either low cost or differentiation becomes increasingly
attractive as some critical conditions are met. Some of the conditions include:- a big
enough target market niche to be profitable and one that offers good growth potential. The
market niche should not be popular with other industry players otherwise there will be
intense jostling for market share which can quickly erode revenue. Fathali (2016) supports
this premise by emphasizing that barriers of entry will protect a firm that is executing the
focus strategy since it is costly or difficult for multi segment competitors to put capabilities
in place to meet the specialized needs of buyers within the target market niche and at the
same time satisfy the expectations of their mainstream customers.
A cost focuser firm can therefore attain and sustain competitive advantage if it analyzes its
market niche and understands how to meet their needs and respond rapidly to unique
customer dynamics. Other key factors of success that a cost focuser should consider
include excellence in operational efficiency, customer service, cost reduction, use of
technology and focus on quality (Wagner, 2013). An advantage of the focus strategy is that
industries have many different niches and segments available, thus a cost focuser can select
a competitively attractive niche that matches its resource strengths and capabilities.
(Lappersonne, Shangavi, & De Mattos, 2015).
2.4.1.1 Customer orientation, Operational efficiency and Cost reduction
The segment of customers selected by a firm specializing on the focus strategy have
distinct needs and requirements based on either demographics, geographic location,
psychographics and customer needs. A focuser selects this competitively attractive niche to
match its resource strengths and capabilities (Pulaj et al., 2015). Since this is a narrow
market base, a focuser must employ customer centered tactics to maintain customer loyalty
and drive up sales. The company must develop unique capabilities to serve the target buyer
segment. According to Fathali (2016), companies that use focus strategies must understand
the dynamics of that market and the unique needs of customers within it, develop uniquely
low-cost or well-specified products for the market. Since they serve customers in their
market uniquely well, they tend to build strong brand loyalty amongst their customers.
This brand loyalty makes their particular market segment less attractive to competitors.
Pillars of this customer orientation include after-sale services, product customization,
21
product support, customer information, quality control and dependable promise (Awwad et
al., 2013). A cost focuser firm that seeks a competitive advantage based on an attractive
price offering to market niche must also identify, analyse and control its costs, by
examining different activities within the business and determining their individual
contribution to customer value. This process is known as value chain analysis. (Srivastava
et al., 2013) Value chain analysis carried out by firm such as Redbox – the self-service
DVD rental company enabled the business to reconfigure its chain of activities so as to
achieve a cost advantage over other competitors (Pearson & Robinson 2013) Coupled with
benchmarking and an assessment of expected benefits, value chain analysis will facilitate
selection of appropriate cost reduction techniques.
2.4.2 Differentiation Focus Strategy
A differentiation focus strategy can exploit the specific needs of customers in a particular
niche. These customers are willing to pay high prices for special product features (Tanwar,
2013). Consequently, focuser firms that differentiate like Mercedes Benz have successfully
sold highly priced, luxury vehicles to an affluent niche of customers who are attracted to
the strong brand. This brand loyalty has led to steady growth of the company’s revenues
from 57.4 – 89.3 billion Euros between 2011 and 2016 (Statista, 2017). Mwangi and
Ombui (2013) emphasize that a strong brand image and company reputation is also vital
for success in this strategy. Consumers must perceive that the products or services offered
by this firm are superior or of high quality an associate them with a solid and reputable
brand. A positive brand therefore builds trust and customer loyalty.
2.4.2.1 Product development and Market penetration
With a strong brand, differentiation focuser firm Harley Davidson has established itself as
a market leader in motorcycle manufacturing. By practicing intensive growth strategies -
specifically product development and market penetration, Harley Davidson has created a
brand image of excellence, continuous improvement and customer focus. This messaging
resonates with its target market niche which consists of motorcycle enthusiasts especially
those interested in the chopper biking culture (Meyer, 2017). Novo Nordisk is a firm that
has excelled through the focus strategy. The Danish pharmaceutical giant has steadily
maximized profits and shareholder returns by focusing on diabetes care and heavily
investing in research and development capabilities that have led to brand loyalty and
undisputed global market leadership in diabetes care for over thirty years (Kim &
Mauborgne, 2005).
22
Several successful differentiation focuser firms have demonstrated that expertise and
specialization on core business is a critical competence for focus strategy (Hill, Jones &
Schilling, 2014). Novo Nordisk proved this when it intensified its research and
development and shifted its focus from doctors to diabetes patients with an aim of better
understanding their needs and developing products that would meet those needs (Kim &
Mauborgne, 2005). This specialization and continuous improvement if executed
effectively, strengthens customer loyalty, drives up sales, improves the product features or
facilitates the development of new ones. Harley Davidson recovered from a slump in
revenue in 2009 by adopting an intensive long term strategy which they dubbed
“Delivering results through focus” (Hill et al., 2014).
2.4.2.2 Innovation, Technology and Expertise
Pulaj et al. (2015) in their study on the effect of competitive strategies on the performance
of firms argue that an enterprise that is interested in practicing the differentiation focus
strategy should consider what unique products or features they can offer to the selected
market niche. They elaborate that a firm can grow market share, improve organizational
performance and gain a competitive advantage by offering a unique feature that
distinguishes it from rivals in the industry. In the pharmaceutical industry, Danish insulin
producer - Novo Nordisk perfected this approach by creating a unique solution for diabetes
patients. Novo Nordisk discovered that insulin, which was supplied to diabetes patients in
vials, presented challenges in administering. Through rigorous research and development,
the company launched the NovoPen, the first user-friendly insulin delivery solution that
was designed to remove the hassle and embarrassment of administering insulin. This
unique offering was a huge success with the diabetes market segment and thrust Novo
Nordisk into the top market position in diabetes management (Kim & Mauborgne, 2005).
Product innovation and development are key drivers for companies that have adopted the
focus differentiation business model. If competitive advantage is to be sustained, firm must
rapidly respond to the changing preferences of their customer base. The must in fact,
anticipate the market dynamics to continually satisfy consumers and increase revenue.
Tesla Motors’ secondary intensive growth strategy is focus differentiation. In this
intensive strategy, the company grows by developing new products that generate new
sales. Through product and process innovation Tesla develops new products that
23
emphasize advanced technologies for minimal environmental impact. For example, the
company developed the Tesla Roadster, which was the world’s first fully electric sports
car. The company has steadily grown its customer and revenue base over the years. This
level of success requires extensive investments in research and development, technology,
quality management and a culture that fosters of innovation and learning (Rowland, 2017).
2.5 Chapter Summary
This chapter discussed the theoretical and empirical research covered in relation to the
research questions. Literature reviewed in this section includes cost leadership and its
effect on organizational performance; differentiation and its effect on organizational
performance and focus strategy and its effect on organizational performance. Chapter three
discusses the research methodology applied in the study.
24
CHAPTER THREE
3.0 RESEARCH METHODOLOGY
3.1 Introduction
This chapter discusses the research methodology that was applied in this research study.
The chapter presents critical research methodology elements in detail. These include the
research design, population design, sampling design, sampling frame, sampling technique,
sample size, data collection methods, research procedures and data analysis.
3.2 Research Design
Cooper and Schindler (2014) define research design as a blueprint for the collection,
measurement and analysis of data. It is a map for an objective research study aimed at
answering specific research questions or testing specific hypotheses. Research design also
plays a critical role of providing the link between the theory and the practical findings from
empirical evidence or other methods or strategies such as survey (Kindy, Shah & Jusoh,
2016). This study utilized a descriptive research design to determine the effect of
competitive strategies on the organizational performance of Bridge International
Academies in Nairobi. Descriptive research design was appropriate for this study because
it facilitates the analysis of the relationship between competitive strategies and
organizational performance at a particular point in time (Saunder et al., 2007). A
descriptive design generalizes the findings from a representative sample to a larger target
population (Omair, 2015). Descriptive design was also suitable for this study because it
facilitated collection of data and the reporting of numerical results for the variables. The
independent variables are cost leadership, differentiation and focus strategies while
dependent variables are organizational performance perspectives at Bridge International
Academies, Nairobi.
3.3 Population and Sampling Design
3.3.1 Population
McMillan (2016) defines a population as a group of elements or cases, whether
individuals, objects, or events, that conform to specific criteria and to which we intend to
generalize the results of the research. According to Alvi (2016) a target population refers to
all the members who meet the particular criterion specified for a research investigation. He
adds that a target population can be further defined as homogenous when its every element
25
is similar to each other in all aspects; or heterogeneous when some of its elements are
dissimilar for example, different levels of education. It is important that a population of
interest is defined specifically. This will improve the ability to describe and explain the
behaviour the researcher intends to study (Blumberg, Cooper & Schindler, 2014). The
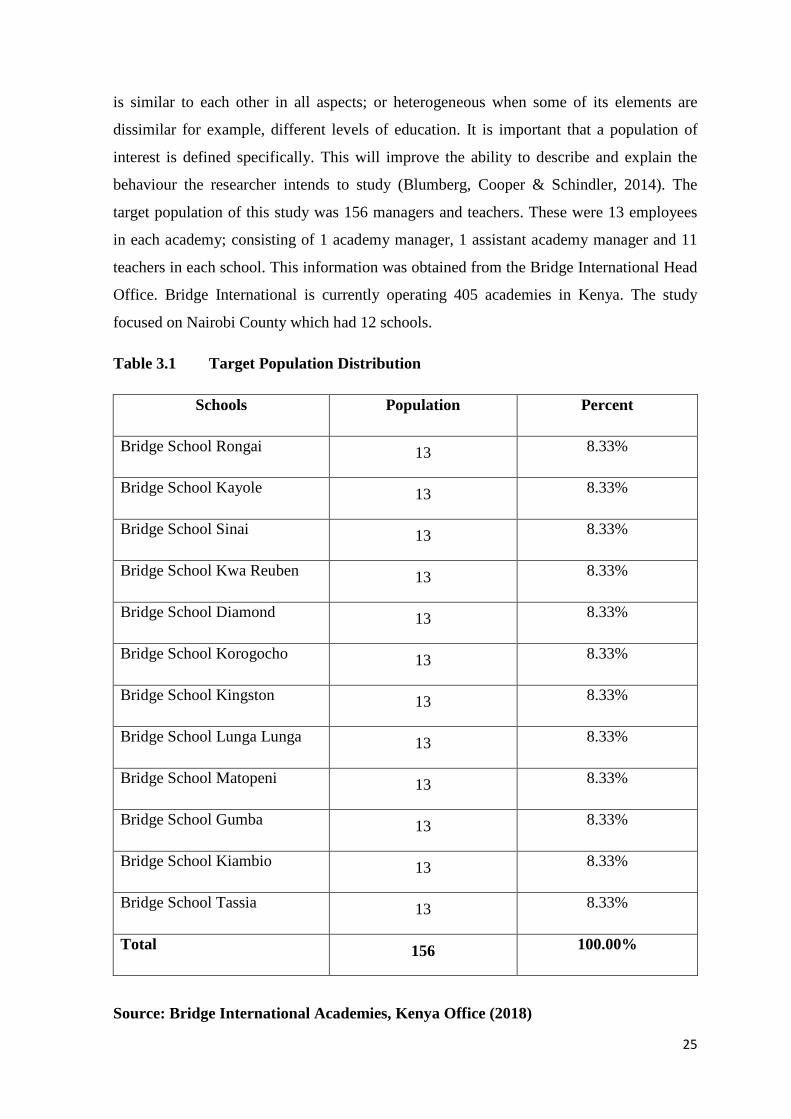
target population of this study was 156 managers and teachers. These were 13 employees
in each academy; consisting of 1 academy manager, 1 assistant academy manager and 11
teachers in each school. This information was obtained from the Bridge International Head
Office. Bridge International is currently operating 405 academies in Kenya. The study
focused on Nairobi County which had 12 schools.
Table 3.1 Target Population Distribution
Schools Population Percent
Bridge School Rongai 13 8.33%
Bridge School Kayole 13 8.33%
Bridge School Sinai 13 8.33%
Bridge School Kwa Reuben 13 8.33%
Bridge School Diamond 13 8.33%
Bridge School Korogocho 13 8.33%
Bridge School Kingston 13 8.33%
Bridge School Lunga Lunga 13 8.33%
Bridge School Matopeni 13 8.33%
Bridge School Gumba 13 8.33%
Bridge School Kiambio 13 8.33%
Bridge School Tassia 13 8.33%
Total 156 100.00%
Source: Bridge International Academies, Kenya Office (2018)
26
3.3.2 Sampling Design
A sampling design can be defined as a process by which cases or members in the target
population are drawn from which accurate conclusions can be made about the entire
population (Cooper & Schindler, 2014). The sampling design is the method the researcher
uses to ensure that the sample is a representation of the study population.
3.3.2.1 Sampling Frame
According to Rahi (2017), a sampling frame can be defined as a list of all units in the
population from which a research sample will be selected. A sampling frame defines a list
where a sample of target population can be drawn. The sampling frame for this study
comprised of the list of all academy managers and teachers from the target population of
the twelve Bridge International Academies in Nairobi.
3.3.2.2 Sampling Technique
Bhattacherjee (2013) describes a sampling technique as a well-defined method a researcher
uses to select the study sample from the sampling frame. There are two broad categories of
sampling techniques or methods. These are probability and non-probability methods. Rahi
(2017) defines probability sampling is a sampling approach in which each unit has an equal
chance or probability to be selected. Non probability sampling on the other hand refers to a
sampling technique where the samples are gathered in a process that does not give all the
participants or units in the population equal chances of being included (Etika, Musa &
Alkassim, 2015). This research adopted probability sampling; specifically stratified
sampling technique to select a sample size. According to Cooper and Schindler (2014), a
stratified sampling technique is applicable when conducting research on a population that
is not homogenous. This study adopted stratified sampling as a method of categorizing the
different occupations of the employees in the sampling frame.
3.3.2.3 Sample Size
According to Alvi (2016), a sample can be defined as a group of relatively smaller number
of people selected from a population for investigation purpose. Alvi also defines a sample
size as the number of sample units that are selected to be included in the sample. The
sample size for this study was 111 employees. Yamane’s formula (1967) guided in the
selection of an appropriate sample size for the employees at the 12 Bridge academy
schools in Nairobi.
The sample size was guided by Yamane’s formula:-
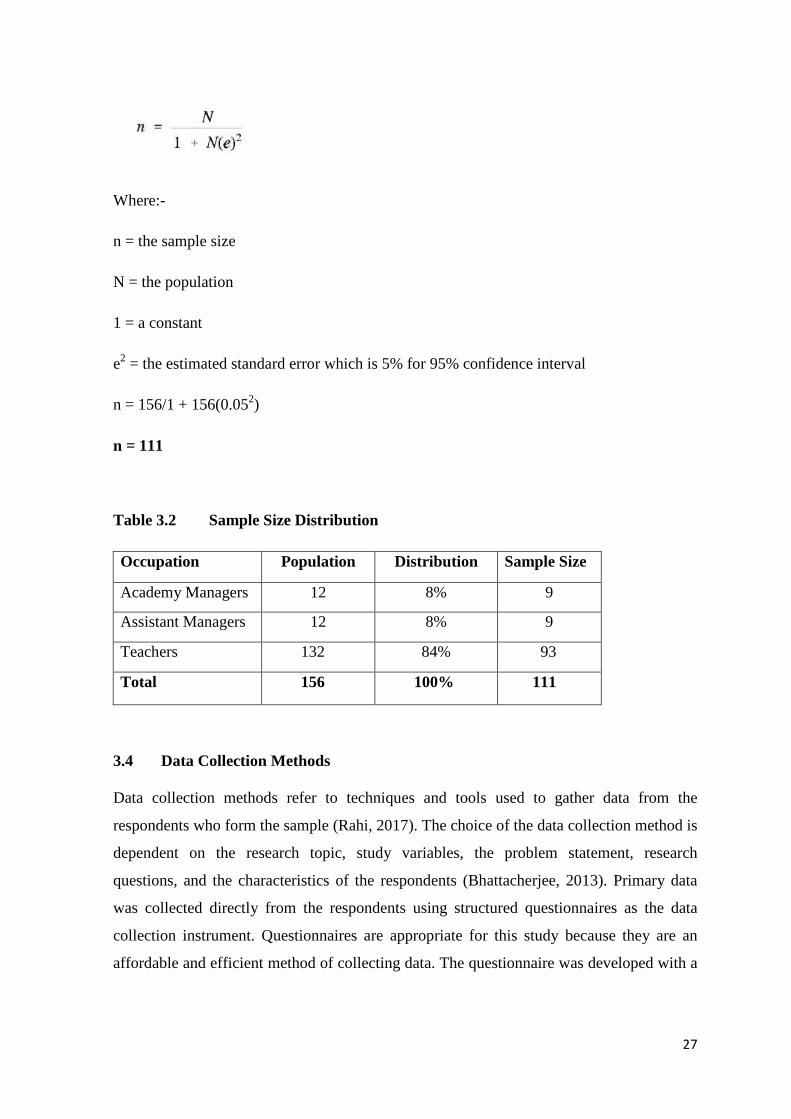
27
Where:-
n = the sample size
N = the population
1 = a constant
e2 = the estimated standard error which is 5% for 95% confidence interval
n = 156/1 + 156(0.052)
n = 111
Table 3.2 Sample Size Distribution
Occupation Population Distribution Sample Size
Academy Managers 12 8% 9
Assistant Managers 12 8% 9
Teachers 132 84% 93
Total 156 100% 111
3.4 Data Collection Methods
Data collection methods refer to techniques and tools used to gather data from the
respondents who form the sample (Rahi, 2017). The choice of the data collection method is
dependent on the research topic, study variables, the problem statement, research
questions, and the characteristics of the respondents (Bhattacherjee, 2013). Primary data
was collected directly from the respondents using structured questionnaires as the data
collection instrument. Questionnaires are appropriate for this study because they are an
affordable and efficient method of collecting data. The questionnaire was developed with a
28
5 point Likert scale based on the research questions. The Likert scale is simpler to
understand and easier to respond to it will also simplify the data analysis process.
The questionnaire was divided into three sections. The first section captured background
and general information; the second section captured data on the first research question
which is cost leadership; the third section was based on the differentiation strategy and the
fourth section presented questions related to the focus strategy - based on the third research
question. All questions are linked to organizational performance. The questionnaires were
administered through a drop and pick method. Research assistants were recruited and
trained on how to administer the data collection instruments. They were also trained on
how to guide respondents before they completed the questionnaires. Secondary data such
as revenue, profits, return on assets and return on equity was used to supplement the
primary data collected.
3.5 Research Procedures
The research required the use of both primary and secondary data and collected both
qualitative and quantitative data. Primary data was obtained from questionnaire
administered to sampled respondents while the secondary data was obtained from Bridge
International Annual Reports, the schools’ enrollment data and literature from other
scholars. Questions on the questionnaire were optimized to minimize writing by
respondents to improve on the return and completion rate. A letter of permission to carry
out the study was obtained from United States International University-Africa, Chandaria
School of Business for delivery to Bridge International Head Office, Nairobi. This letter
provided information on the identity of the researcher and the purpose of the study. The
questionnaires were tested during a pilot study on 10% of the sample to assess whether the
questions are easily understood and unambiguous (Cooper & Schindler, 2014). The
questionnaires were then administered to respondents through the drop and pick approach.
Research assistants who assisted in data collection were trained on how to administer the
questionnaires. The respondents were given two weeks to complete the questionnaires
before collection, giving them ample time to understand and answer the questions.
3.6 Data Analysis Methods
Data analysis refers to the process of interpreting data collected for the purpose of drawing
conclusions based on the research questions of interest (Bhattacherjee, 2013). The goal of
29
this stage of the research is to convert raw data collected from the field into information
that can be understood by the researcher and other stakeholders. The first step taken was to
code the data collected from the questionnaires and to generate a code sheet for reference.
Data was entered into Statistical Package for Social Sciences (SPSS) before the utilizing
descriptive statistics including means, median and standard deviation to present the
information in summary for interpretation. Inferential statistics including correlation and
regression analysis were also applied to show the relationship between the study variables.
Data was presented using tables and figures.
3.7 Chapter Summary
This chapter presented a detailed description of the research methodology that was used in
this study. It discussed critical elements of the research methodology including the
research design, population design, sampling design, sampling frame, sampling technique,
sample size, data collection methods, research procedures and data analysis techniques that
were applied in the study. The sampling technique and the sampling frame, and sample
size have also been discussed in the chapter. Chapter four discusses the results and findings
of the data collected.
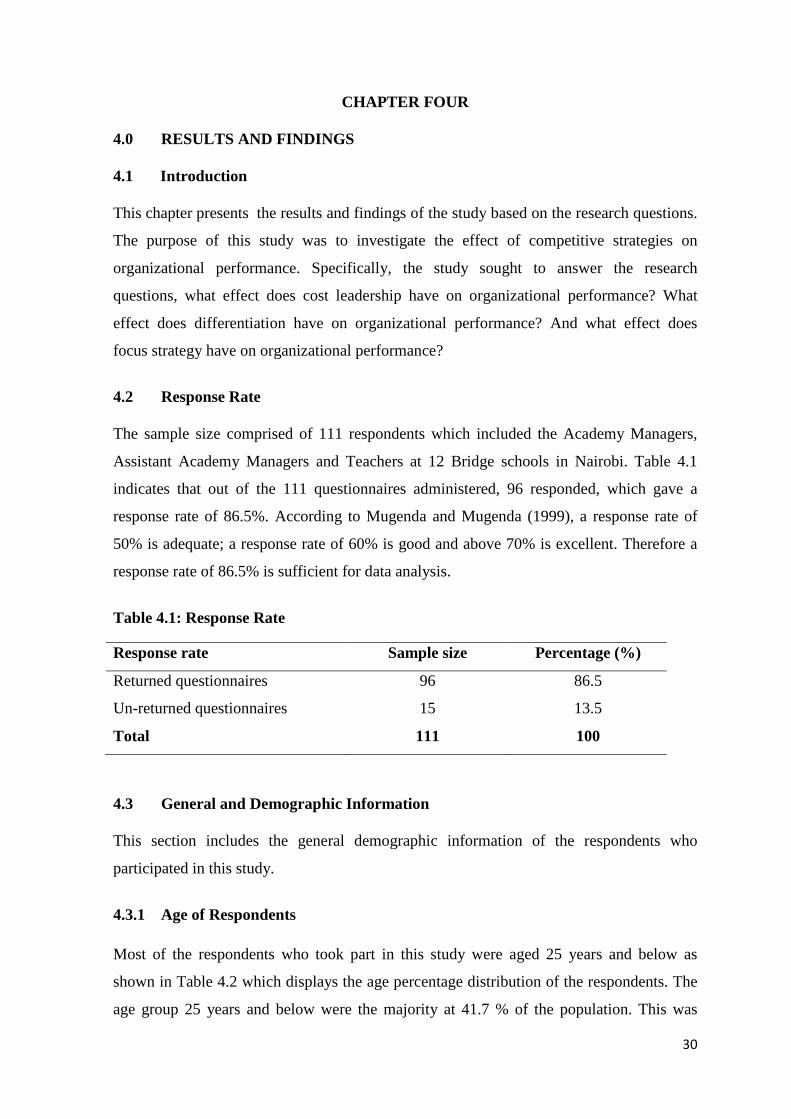
30
CHAPTER FOUR
4.0 RESULTS AND FINDINGS
4.1 Introduction
This chapter presents the results and findings of the study based on the research questions.
The purpose of this study was to investigate the effect of competitive strategies on
organizational performance. Specifically, the study sought to answer the research
questions, what effect does cost leadership have on organizational performance? What
effect does differentiation have on organizational performance? And what effect does
focus strategy have on organizational performance?
4.2 Response Rate
The sample size comprised of 111 respondents which included the Academy Managers,
Assistant Academy Managers and Teachers at 12 Bridge schools in Nairobi. Table 4.1
indicates that out of the 111 questionnaires administered, 96 responded, which gave a
response rate of 86.5%. According to Mugenda and Mugenda (1999), a response rate of
50% is adequate; a response rate of 60% is good and above 70% is excellent. Therefore a
response rate of 86.5% is sufficient for data analysis.
Table 4.1: Response Rate
Response rate Sample size Percentage (%)
Returned questionnaires 96 86.5
Un-returned questionnaires 15 13.5
Total 111 100
4.3 General and Demographic Information
This section includes the general demographic information of the respondents who
participated in this study.
4.3.1 Age of Respondents
Most of the respondents who took part in this study were aged 25 years and below as
shown in Table 4.2 which displays the age percentage distribution of the respondents. The
age group 25 years and below were the majority at 41.7 % of the population. This was
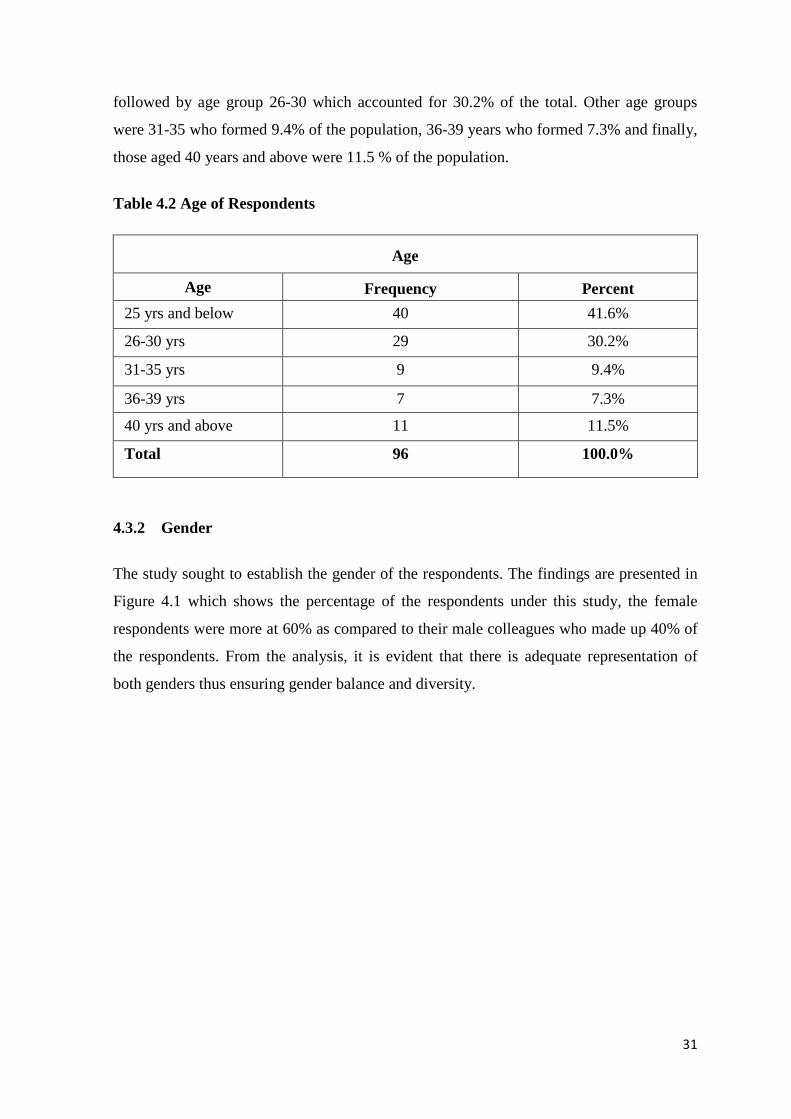
31
followed by age group 26-30 which accounted for 30.2% of the total. Other age groups
were 31-35 who formed 9.4% of the population, 36-39 years who formed 7.3% and finally,
those aged 40 years and above were 11.5 % of the population.
Table 4.2 Age of Respondents
Age
Age Frequency Percent 25 yrs and below 40 41.6%
26-30 yrs 29 30.2%
31-35 yrs 9 9.4%
36-39 yrs 7 7.3%
40 yrs and above 11 11.5%
Total 96 100.0%
4.3.2 Gender
The study sought to establish the gender of the respondents. The findings are presented in
Figure 4.1 which shows the percentage of the respondents under this study, the female
respondents were more at 60% as compared to their male colleagues who made up 40% of
the respondents. From the analysis, it is evident that there is adequate representation of
both genders thus ensuring gender balance and diversity.
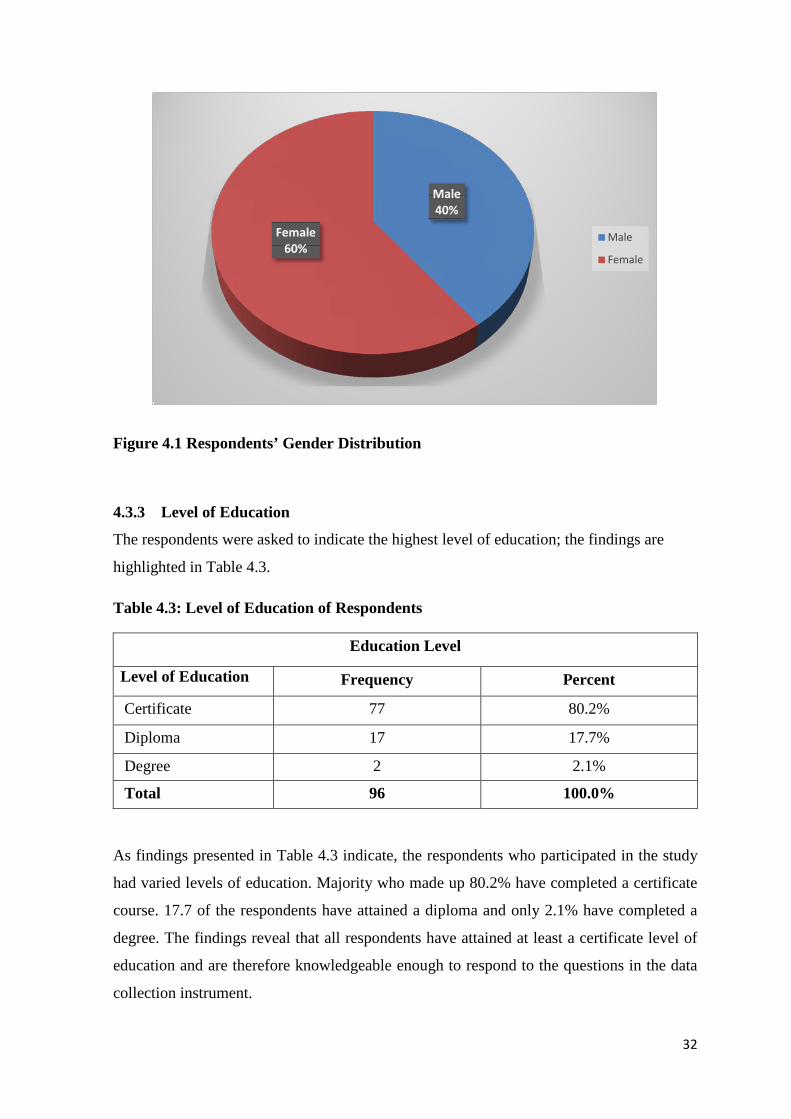
32
Figure 4.1 Respondents’ Gender Distribution
4.3.3 Level of Education
The respondents were asked to indicate the highest level of education; the findings are
highlighted in Table 4.3.
Table 4.3: Level of Education of Respondents
Education Level
Level of Education Frequency Percent
Certificate 77 80.2%
Diploma 17 17.7%
Degree 2 2.1%
Total 96 100.0%
As findings presented in Table 4.3 indicate, the respondents who participated in the study
had varied levels of education. Majority who made up 80.2% have completed a certificate
course. 17.7 of the respondents have attained a diploma and only 2.1% have completed a
degree. The findings reveal that all respondents have attained at least a certificate level of
education and are therefore knowledgeable enough to respond to the questions in the data
collection instrument.
Male 40%
Female 60%
Male
Female
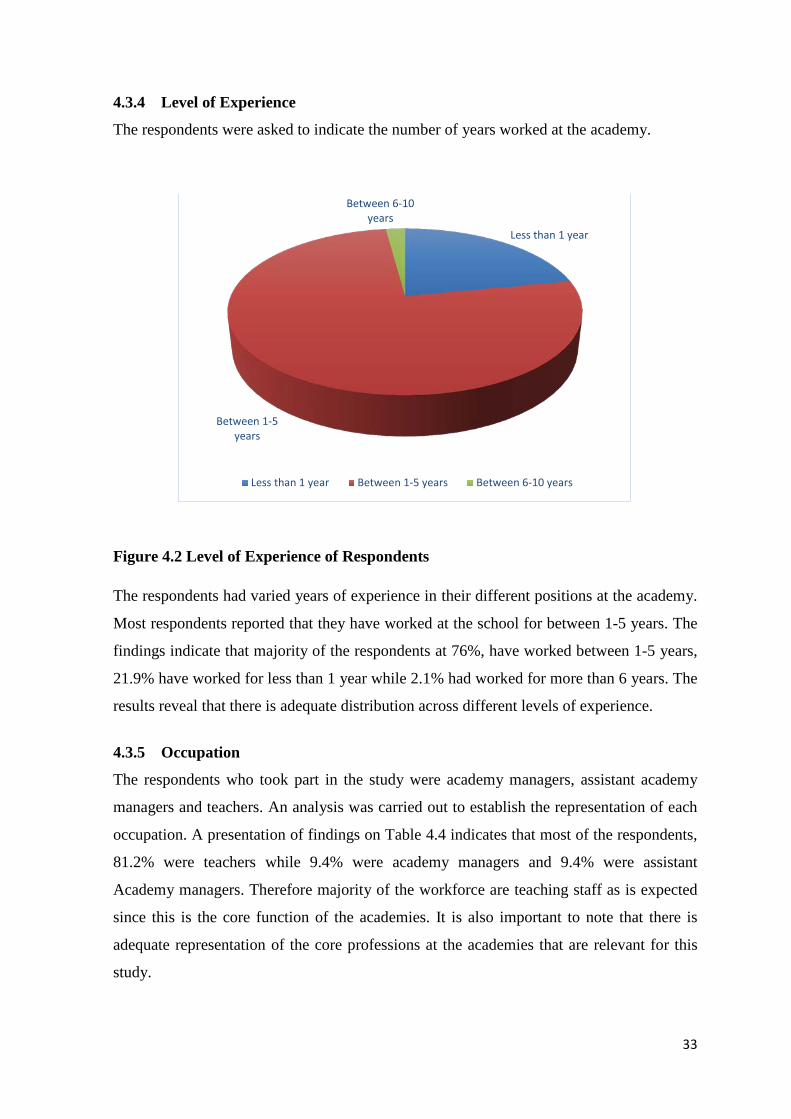
33
4.3.4 Level of Experience
The respondents were asked to indicate the number of years worked at the academy.
Figure 4.2 Level of Experience of Respondents
The respondents had varied years of experience in their different positions at the academy.
Most respondents reported that they have worked at the school for between 1-5 years. The
findings indicate that majority of the respondents at 76%, have worked between 1-5 years,
21.9% have worked for less than 1 year while 2.1% had worked for more than 6 years. The
results reveal that there is adequate distribution across different levels of experience.
4.3.5 Occupation
The respondents who took part in the study were academy managers, assistant academy
managers and teachers. An analysis was carried out to establish the representation of each
occupation. A presentation of findings on Table 4.4 indicates that most of the respondents,
81.2% were teachers while 9.4% were academy managers and 9.4% were assistant
Academy managers. Therefore majority of the workforce are teaching staff as is expected
since this is the core function of the academies. It is also important to note that there is
adequate representation of the core professions at the academies that are relevant for this
study.
Less than 1 year
Between 1-5 years
Between 6-10 years
Less than 1 year Between 1-5 years Between 6-10 years
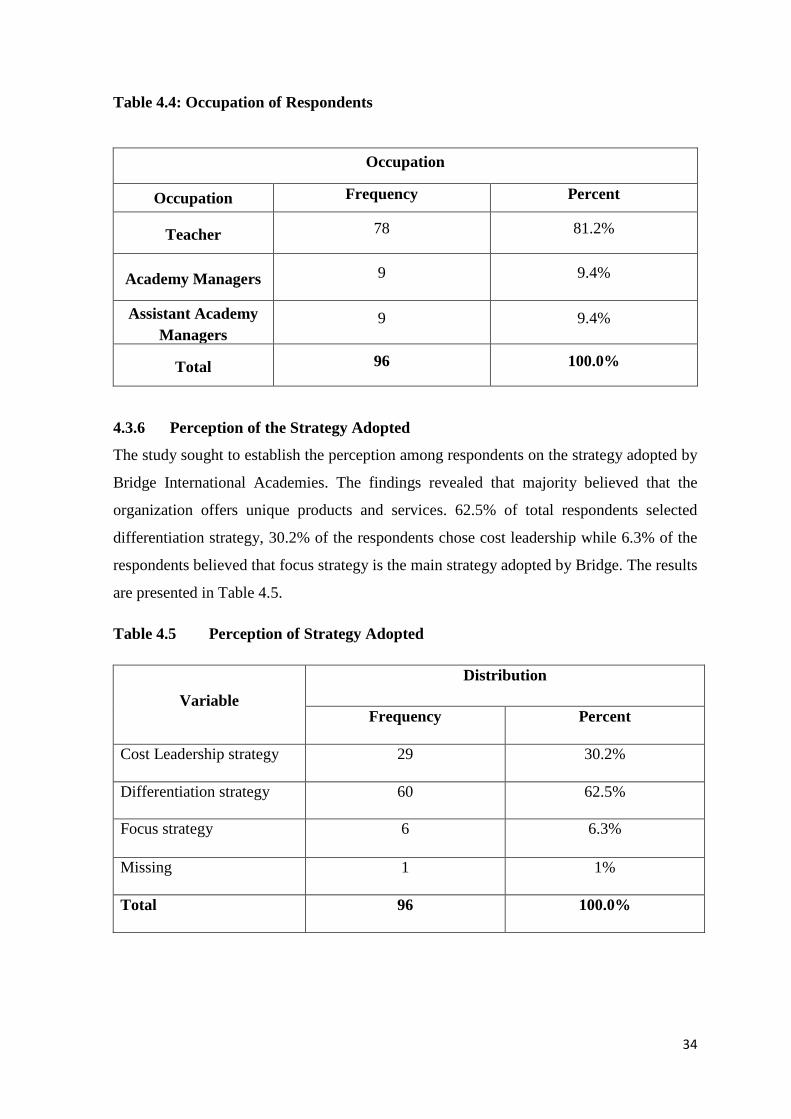
34
Table 4.4: Occupation of Respondents
Occupation
Occupation Frequency Percent
Teacher 78 81.2%
Academy Managers 9 9.4%
Assistant Academy Managers
9 9.4%
Total 96 100.0%
4.3.6 Perception of the Strategy Adopted
The study sought to establish the perception among respondents on the strategy adopted by
Bridge International Academies. The findings revealed that majority believed that the
organization offers unique products and services. 62.5% of total respondents selected
differentiation strategy, 30.2% of the respondents chose cost leadership while 6.3% of the
respondents believed that focus strategy is the main strategy adopted by Bridge. The results
are presented in Table 4.5.
Table 4.5 Perception of Strategy Adopted
Variable Distribution
Frequency Percent
Cost Leadership strategy 29 30.2%
Differentiation strategy 60 62.5%
Focus strategy 6 6.3%
Missing 1 1%
Total 96 100.0%
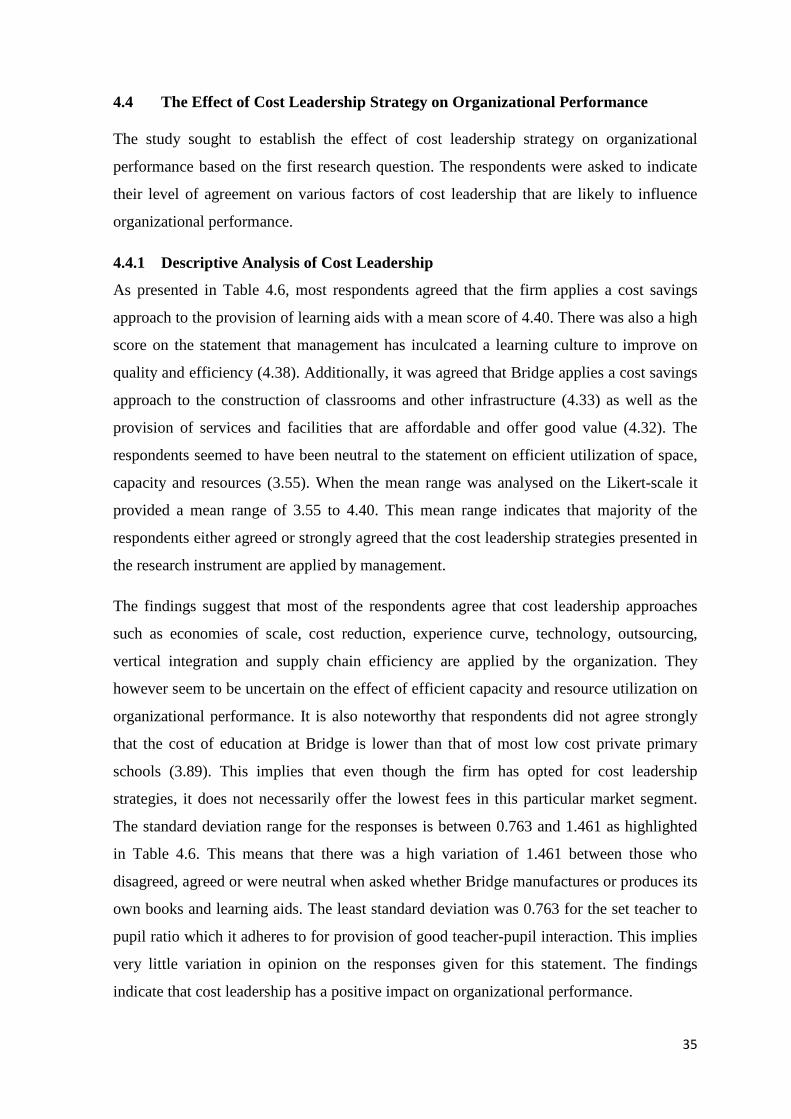
35
4.4 The Effect of Cost Leadership Strategy on Organizational Performance
The study sought to establish the effect of cost leadership strategy on organizational
performance based on the first research question. The respondents were asked to indicate
their level of agreement on various factors of cost leadership that are likely to influence
organizational performance.
4.4.1 Descriptive Analysis of Cost Leadership
As presented in Table 4.6, most respondents agreed that the firm applies a cost savings
approach to the provision of learning aids with a mean score of 4.40. There was also a high
score on the statement that management has inculcated a learning culture to improve on
quality and efficiency (4.38). Additionally, it was agreed that Bridge applies a cost savings
approach to the construction of classrooms and other infrastructure (4.33) as well as the
provision of services and facilities that are affordable and offer good value (4.32). The
respondents seemed to have been neutral to the statement on efficient utilization of space,
capacity and resources (3.55). When the mean range was analysed on the Likert-scale it
provided a mean range of 3.55 to 4.40. This mean range indicates that majority of the
respondents either agreed or strongly agreed that the cost leadership strategies presented in
the research instrument are applied by management.
The findings suggest that most of the respondents agree that cost leadership approaches
such as economies of scale, cost reduction, experience curve, technology, outsourcing,
vertical integration and supply chain efficiency are applied by the organization. They
however seem to be uncertain on the effect of efficient capacity and resource utilization on
organizational performance. It is also noteworthy that respondents did not agree strongly
that the cost of education at Bridge is lower than that of most low cost private primary
schools (3.89). This implies that even though the firm has opted for cost leadership
strategies, it does not necessarily offer the lowest fees in this particular market segment.
The standard deviation range for the responses is between 0.763 and 1.461 as highlighted
in Table 4.6. This means that there was a high variation of 1.461 between those who
disagreed, agreed or were neutral when asked whether Bridge manufactures or produces its
own books and learning aids. The least standard deviation was 0.763 for the set teacher to
pupil ratio which it adheres to for provision of good teacher-pupil interaction. This implies
very little variation in opinion on the responses given for this statement. The findings
indicate that cost leadership has a positive impact on organizational performance.
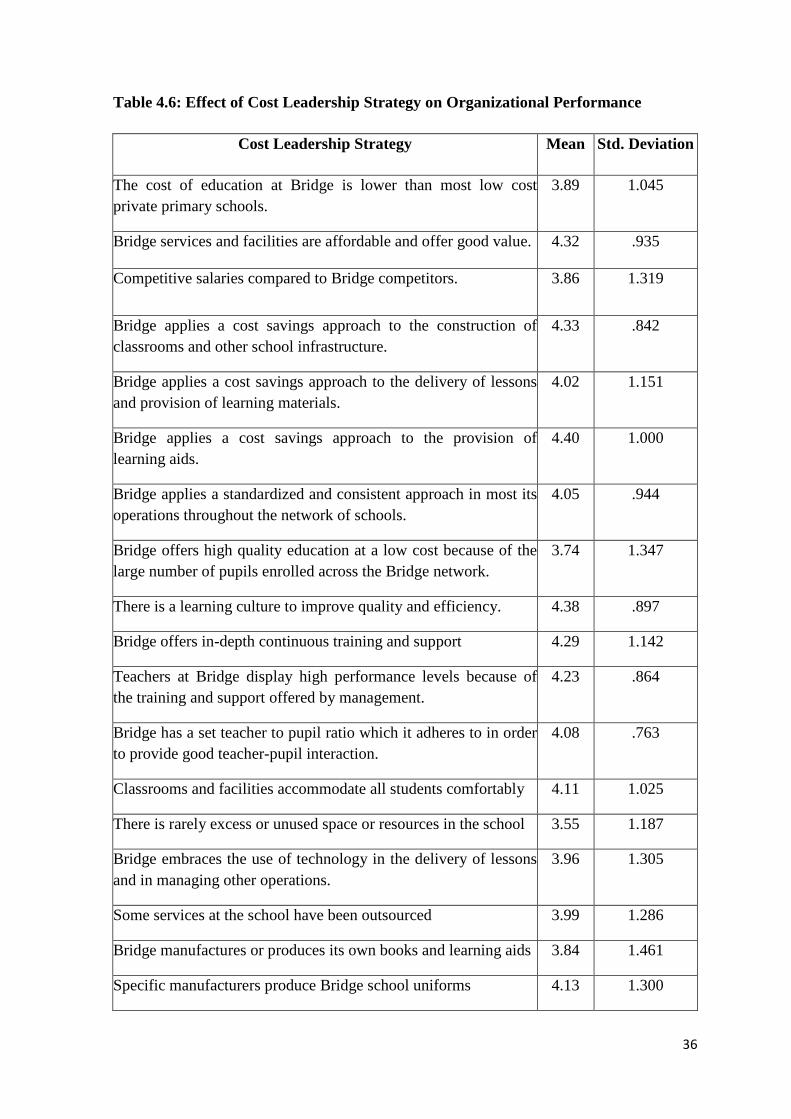
36
Table 4.6: Effect of Cost Leadership Strategy on Organizational Performance
Cost Leadership Strategy Mean Std. Deviation
The cost of education at Bridge is lower than most low cost private primary schools.
3.89 1.045
Bridge services and facilities are affordable and offer good value. 4.32 .935
Competitive salaries compared to Bridge competitors. 3.86 1.319
Bridge applies a cost savings approach to the construction of classrooms and other school infrastructure.
4.33 .842
Bridge applies a cost savings approach to the delivery of lessons and provision of learning materials.
4.02 1.151
Bridge applies a cost savings approach to the provision of learning aids.
4.40 1.000
Bridge applies a standardized and consistent approach in most its operations throughout the network of schools.
4.05 .944
Bridge offers high quality education at a low cost because of the large number of pupils enrolled across the Bridge network.
3.74 1.347
There is a learning culture to improve quality and efficiency. 4.38 .897
Bridge offers in-depth continuous training and support 4.29 1.142
Teachers at Bridge display high performance levels because of the training and support offered by management.
4.23 .864
Bridge has a set teacher to pupil ratio which it adheres to in order to provide good teacher-pupil interaction.
4.08 .763
Classrooms and facilities accommodate all students comfortably 4.11 1.025
There is rarely excess or unused space or resources in the school 3.55 1.187
Bridge embraces the use of technology in the delivery of lessons and in managing other operations.
3.96 1.305
Some services at the school have been outsourced 3.99 1.286
Bridge manufactures or produces its own books and learning aids 3.84 1.461
Specific manufacturers produce Bridge school uniforms 4.13 1.300
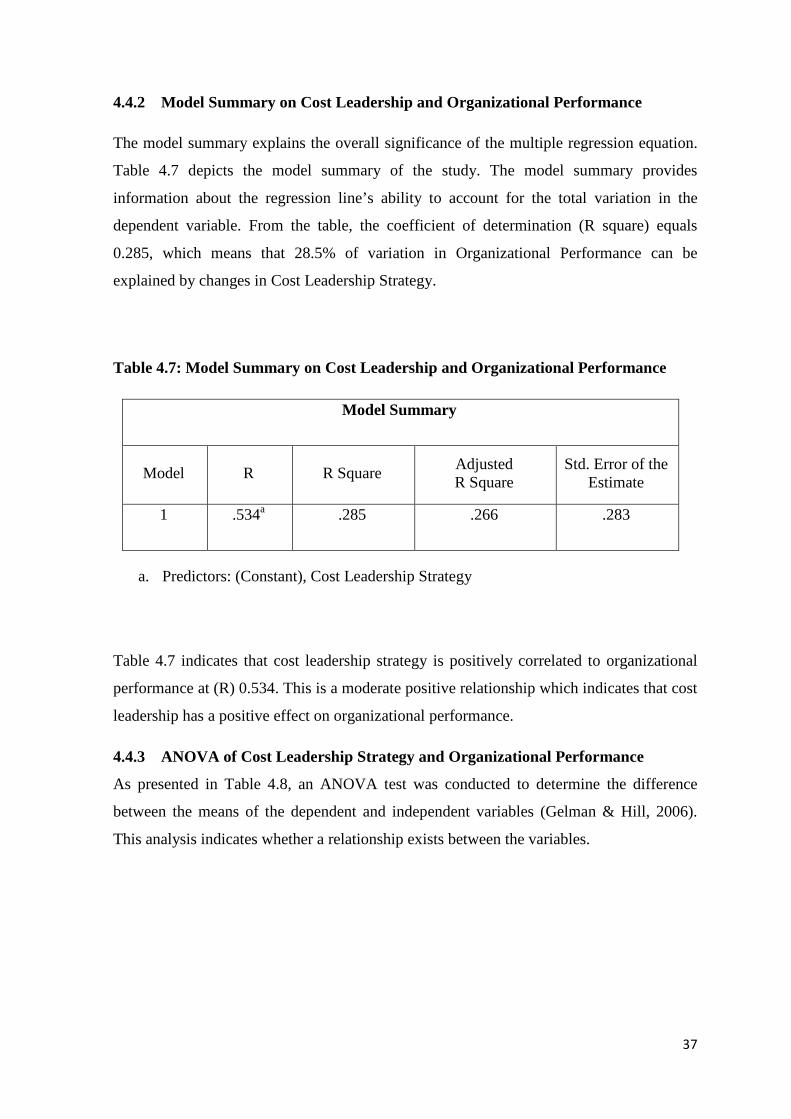
37
4.4.2 Model Summary on Cost Leadership and Organizational Performance
The model summary explains the overall significance of the multiple regression equation.
Table 4.7 depicts the model summary of the study. The model summary provides
information about the regression line’s ability to account for the total variation in the
dependent variable. From the table, the coefficient of determination (R square) equals
0.285, which means that 28.5% of variation in Organizational Performance can be
explained by changes in Cost Leadership Strategy.
Table 4.7: Model Summary on Cost Leadership and Organizational Performance
Model Summary
Model R R Square Adjusted R Square
Std. Error of the Estimate
1 .534a .285 .266 .283
a. Predictors: (Constant), Cost Leadership Strategy
Table 4.7 indicates that cost leadership strategy is positively correlated to organizational
performance at (R) 0.534. This is a moderate positive relationship which indicates that cost
leadership has a positive effect on organizational performance.
4.4.3 ANOVA of Cost Leadership Strategy and Organizational Performance
As presented in Table 4.8, an ANOVA test was conducted to determine the difference
between the means of the dependent and independent variables (Gelman & Hill, 2006).
This analysis indicates whether a relationship exists between the variables.
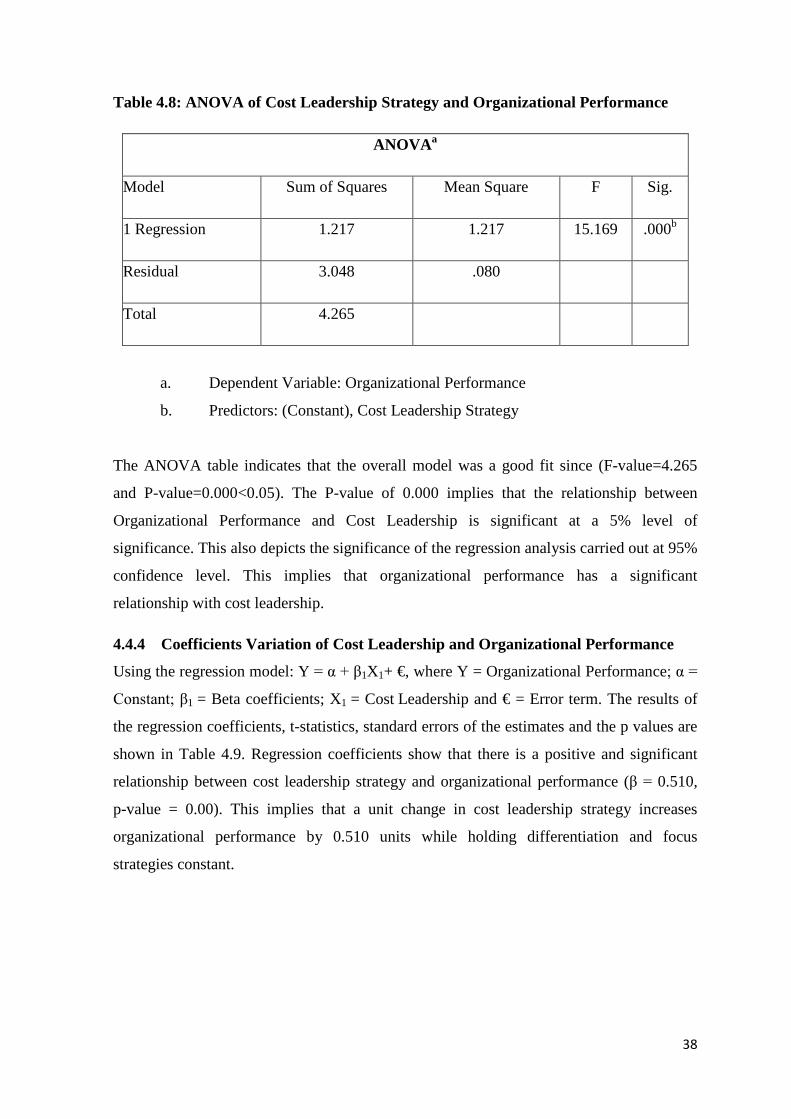
38
Table 4.8: ANOVA of Cost Leadership Strategy and Organizational Performance
ANOVAa
Model Sum of Squares Mean Square F Sig.
1 Regression 1.217 1.217 15.169 .000b
Residual 3.048 .080
Total 4.265
a. Dependent Variable: Organizational Performance
b. Predictors: (Constant), Cost Leadership Strategy
The ANOVA table indicates that the overall model was a good fit since (F-value=4.265
and P-value=0.000<0.05). The P-value of 0.000 implies that the relationship between
Organizational Performance and Cost Leadership is significant at a 5% level of
significance. This also depicts the significance of the regression analysis carried out at 95%
confidence level. This implies that organizational performance has a significant
relationship with cost leadership.
4.4.4 Coefficients Variation of Cost Leadership and Organizational Performance
Using the regression model: Y = α + β1X1+ €, where Y = Organizational Performance; α =
Constant; β1 = Beta coefficients; X1 = Cost Leadership and € = Error term. The results of
the regression coefficients, t-statistics, standard errors of the estimates and the p values are
shown in Table 4.9. Regression coefficients show that there is a positive and significant
relationship between cost leadership strategy and organizational performance (β = 0.510,
p-value = 0.00). This implies that a unit change in cost leadership strategy increases
organizational performance by 0.510 units while holding differentiation and focus
strategies constant.
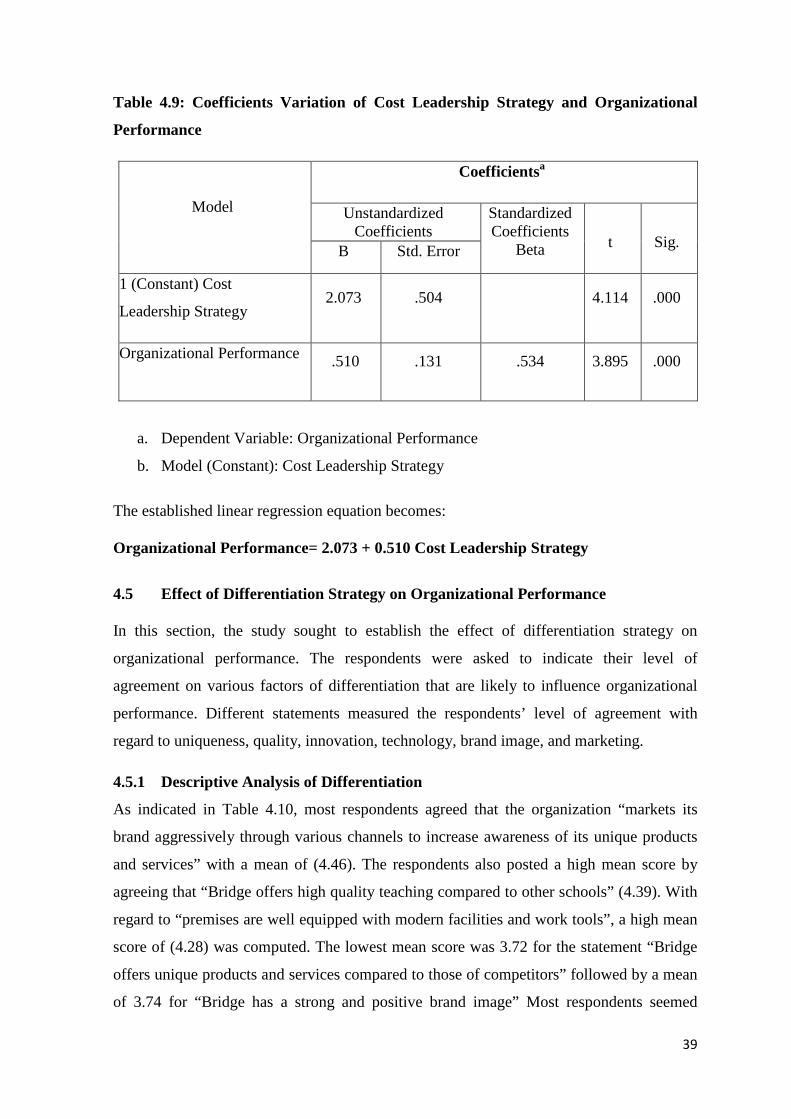
39
Table 4.9: Coefficients Variation of Cost Leadership Strategy and Organizational
Performance
Model
Coefficientsa
Unstandardized Coefficients
Standardized Coefficients
Beta t Sig. B Std. Error
1 (Constant) Cost
Leadership Strategy 2.073 .504
4.114 .000
Organizational Performance .510 .131 .534 3.895 .000
a. Dependent Variable: Organizational Performance
b. Model (Constant): Cost Leadership Strategy
The established linear regression equation becomes: Organizational Performance= 2.073 + 0.510 Cost Leadership Strategy
4.5 Effect of Differentiation Strategy on Organizational Performance
In this section, the study sought to establish the effect of differentiation strategy on
organizational performance. The respondents were asked to indicate their level of
agreement on various factors of differentiation that are likely to influence organizational
performance. Different statements measured the respondents’ level of agreement with
regard to uniqueness, quality, innovation, technology, brand image, and marketing.
4.5.1 Descriptive Analysis of Differentiation
As indicated in Table 4.10, most respondents agreed that the organization “markets its
brand aggressively through various channels to increase awareness of its unique products
and services” with a mean of (4.46). The respondents also posted a high mean score by
agreeing that “Bridge offers high quality teaching compared to other schools” (4.39). With
regard to “premises are well equipped with modern facilities and work tools”, a high mean
score of (4.28) was computed. The lowest mean score was 3.72 for the statement “Bridge
offers unique products and services compared to those of competitors” followed by a mean
of 3.74 for “Bridge has a strong and positive brand image” Most respondents seemed
40
uncertain about the uniqueness of products and services offered and the strength of the
Bridge brand. There was also uncertainty on the uniqueness of services and facilities
offered compared to those of competitors (3.83).
The findings suggest that most of the respondents agree overwhelmingly that
differentiation techniques such as aggressive marketing, high value product offering, high
quality teaching, use of technology, continuous improvement, emphasis on innovation and
unique product / service features are employed by the firm’s management. Of significance
however is the fact that respondents were uncertain about Bridge offering unique products
and services. This is interesting because uniqueness is a key attribute of the differentiation
strategy. The respondents were also uncertain about Bridge having a strong and positive
brand image which is critical for customer loyalty and market share growth. These lower
scores were however due to many respondents returning more “neutral” responses than
“disagree” responses on their questionnaires meaning they were unsure.
The standard deviation range for the responses was between 0.706 and 1.382 as
highlighted in Table 4.10. The lowest standard deviation for the statement “Bridge is well
equipped with modern premises, facilities and work tools”. This means that there was a
small variation of (0.706) between those who disagreed, agreed or were neutral. The
highest standard deviation of 1.382 was for the statement “Bridge offers services and
facilities that are clearly different compared to those of competitors”. This indicates a wide
variation in opinion and no general consensus on this statement. Overall, the findings
indicate that differentiation has a high positive impact on organizational performance.
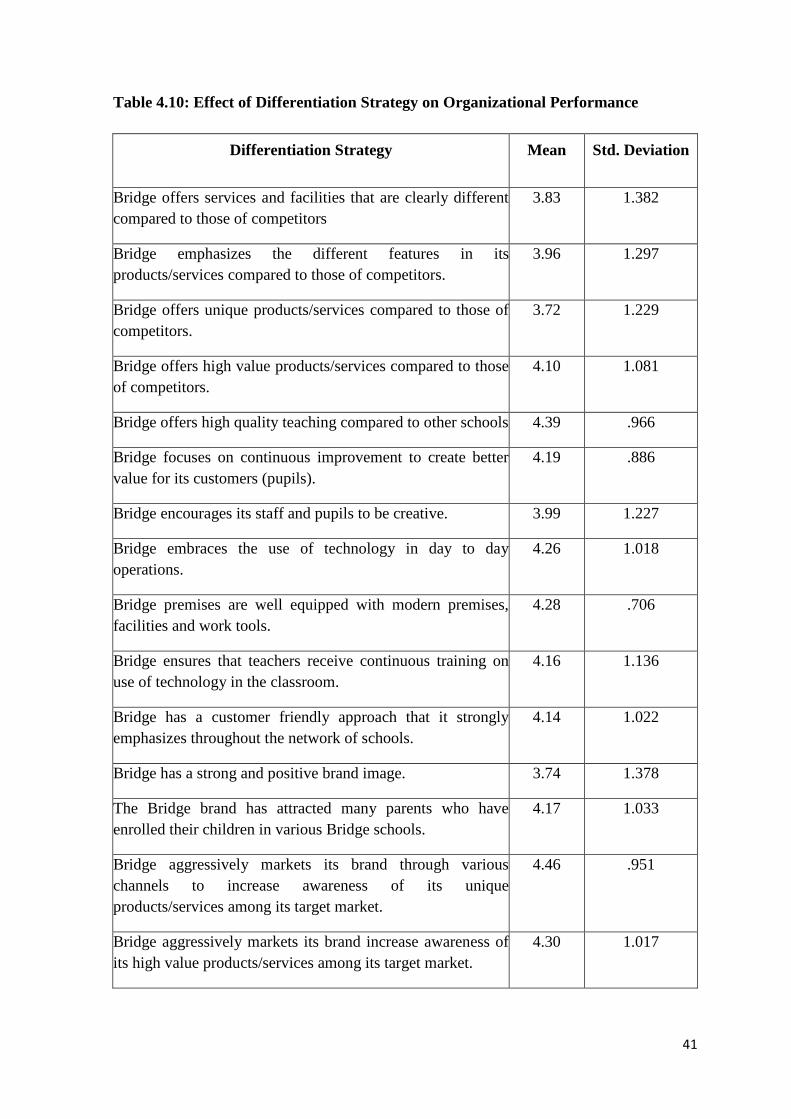
41
Table 4.10: Effect of Differentiation Strategy on Organizational Performance
Differentiation Strategy Mean Std. Deviation
Bridge offers services and facilities that are clearly different compared to those of competitors
3.83 1.382
Bridge emphasizes the different features in its products/services compared to those of competitors.
3.96 1.297
Bridge offers unique products/services compared to those of competitors.
3.72 1.229
Bridge offers high value products/services compared to those of competitors.
4.10 1.081
Bridge offers high quality teaching compared to other schools 4.39 .966
Bridge focuses on continuous improvement to create better value for its customers (pupils).
4.19 .886
Bridge encourages its staff and pupils to be creative. 3.99 1.227
Bridge embraces the use of technology in day to day operations.
4.26 1.018
Bridge premises are well equipped with modern premises, facilities and work tools.
4.28 .706
Bridge ensures that teachers receive continuous training on use of technology in the classroom.
4.16 1.136
Bridge has a customer friendly approach that it strongly emphasizes throughout the network of schools.
4.14 1.022
Bridge has a strong and positive brand image. 3.74 1.378
The Bridge brand has attracted many parents who have enrolled their children in various Bridge schools.
4.17 1.033
Bridge aggressively markets its brand through various channels to increase awareness of its unique products/services among its target market.
4.46 .951
Bridge aggressively markets its brand increase awareness of its high value products/services among its target market.
4.30 1.017
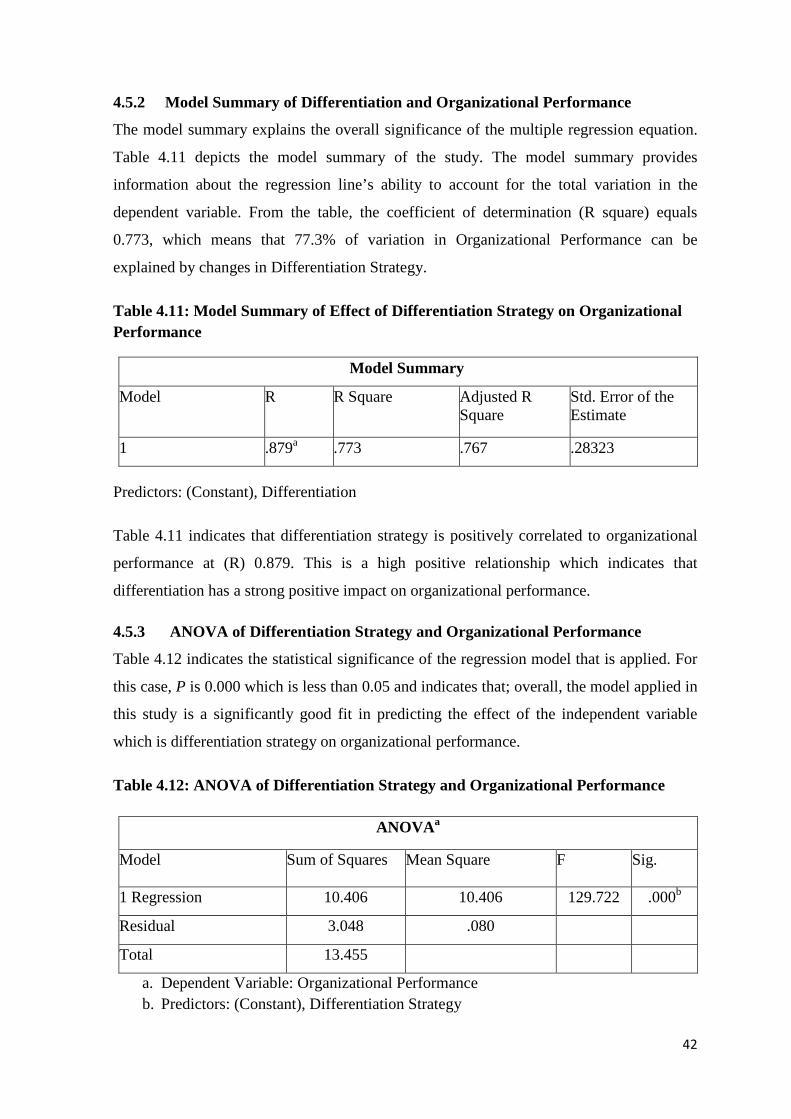
42
4.5.2 Model Summary of Differentiation and Organizational Performance
The model summary explains the overall significance of the multiple regression equation.
Table 4.11 depicts the model summary of the study. The model summary provides
information about the regression line’s ability to account for the total variation in the
dependent variable. From the table, the coefficient of determination (R square) equals
0.773, which means that 77.3% of variation in Organizational Performance can be
explained by changes in Differentiation Strategy.
Table 4.11: Model Summary of Effect of Differentiation Strategy on Organizational Performance
Model Summary
Model R R Square Adjusted R Square
Std. Error of the Estimate
1 .879a .773 .767 .28323
Predictors: (Constant), Differentiation
Table 4.11 indicates that differentiation strategy is positively correlated to organizational
performance at (R) 0.879. This is a high positive relationship which indicates that
differentiation has a strong positive impact on organizational performance.
4.5.3 ANOVA of Differentiation Strategy and Organizational Performance
Table 4.12 indicates the statistical significance of the regression model that is applied. For
this case, P is 0.000 which is less than 0.05 and indicates that; overall, the model applied in
this study is a significantly good fit in predicting the effect of the independent variable
which is differentiation strategy on organizational performance.
Table 4.12: ANOVA of Differentiation Strategy and Organizational Performance
ANOVAa
Model Sum of Squares Mean Square F Sig.
1 Regression 10.406 10.406 129.722 .000b
Residual 3.048 .080
Total 13.455
a. Dependent Variable: Organizational Performance b. Predictors: (Constant), Differentiation Strategy
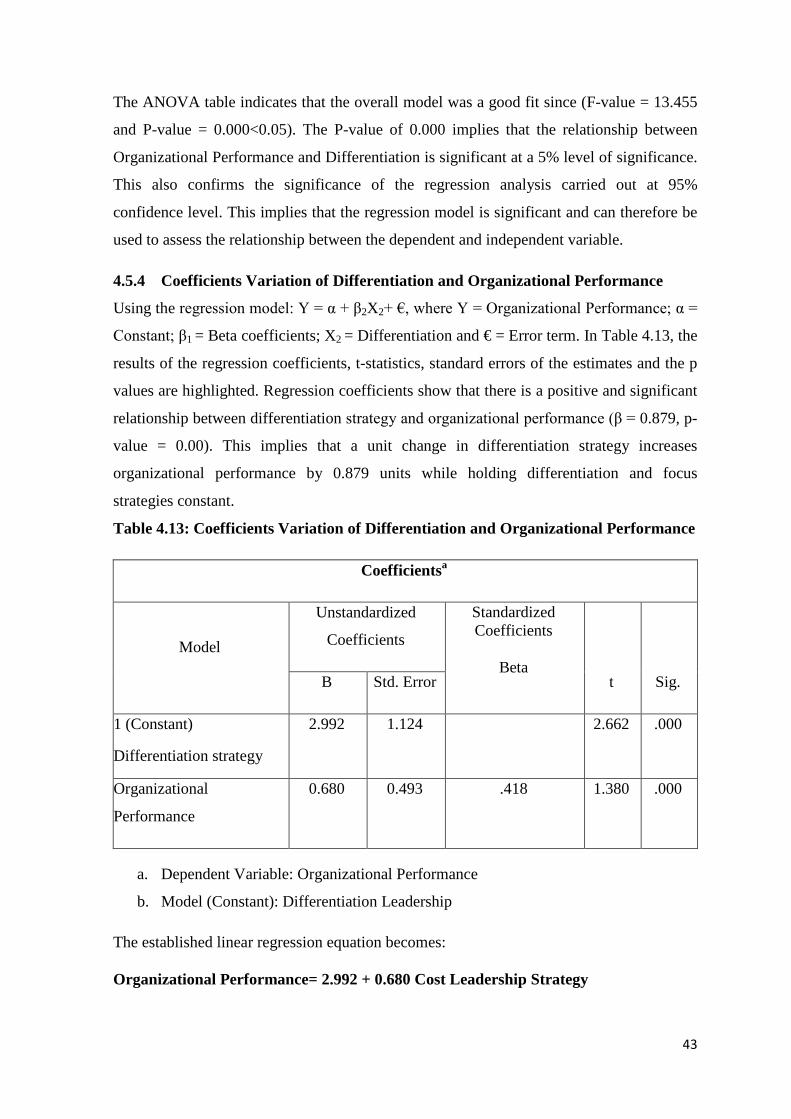
43
The ANOVA table indicates that the overall model was a good fit since (F-value = 13.455
and P-value = 0.000<0.05). The P-value of 0.000 implies that the relationship between
Organizational Performance and Differentiation is significant at a 5% level of significance.
This also confirms the significance of the regression analysis carried out at 95%
confidence level. This implies that the regression model is significant and can therefore be
used to assess the relationship between the dependent and independent variable.
4.5.4 Coefficients Variation of Differentiation and Organizational Performance
Using the regression model: Y = α + β2X2+ €, where Y = Organizational Performance; α =
Constant; β1 = Beta coefficients; X2 = Differentiation and € = Error term. In Table 4.13, the
results of the regression coefficients, t-statistics, standard errors of the estimates and the p
values are highlighted. Regression coefficients show that there is a positive and significant
relationship between differentiation strategy and organizational performance (β = 0.879, p-
value = 0.00). This implies that a unit change in differentiation strategy increases
organizational performance by 0.879 units while holding differentiation and focus
strategies constant.
Table 4.13: Coefficients Variation of Differentiation and Organizational Performance
Coefficientsa
Model
Unstandardized
Coefficients
Standardized Coefficients
Beta
t Sig. B Std. Error
1 (Constant)
Differentiation strategy
2.992 1.124 2.662 .000
Organizational
Performance
0.680 0.493 .418 1.380 .000
a. Dependent Variable: Organizational Performance
b. Model (Constant): Differentiation Leadership
The established linear regression equation becomes: Organizational Performance= 2.992 + 0.680 Cost Leadership Strategy
44
4.6 Effect of Focus Strategies on Organizational Performance
The study sought to establish the effect of cost leadership strategy on organizational
performance based on the first research question. The respondents were asked to indicate
their level of agreement on various factors of cost leadership that are likely to influence
organizational performance.
4.6.1 Descriptive Analysis of Focus Strategy
Table 4.14 presents the results of the descriptive statistics done on the responses given to
the focus strategy statements on the questionnaire. When the mean range was analyzed on
the Likert scale it provided values of between 3.52 and 4.41. Majority of the respondents
agreed that “Bridge is able to offer fair prices by providing better quality education” with a
mean of 4.41. Most of respondents also agreed that “Bridge responds quickly to complaints
from pupils or their parents and works hard to resolve them (4.36). Additionally, most
respondents agreed that “Bridge aggressively markets its brand through various channels to
increase awareness of its high value products/services among its target market” with a
mean of 4.30. Other notable high mean values include “Bridge exploits the use of
technology to keep operation costs down and to improve on quality” (4.26) and “Bridge is
known for its high caliber staff” (4.25).
The mean range of 3.52 to 4.41 and standard deviation range of 0.762 to 1.256 suggest that
the most respondents agreed with the focus strategy statements presented in the
questionnaire. This means that most of the respondents agree that focus strategy techniques
such as aggressive marketing, quick response to change, customer service, responding to
customer needs, specialization, technology driven processes, high value service offering
and an emphasis on quality. There was however a low mean score posted on the statement
“Bridge offers low cost tuition options to specific customers who are in the low income
bracket” (3.52). The responses indicate that most respondents either disagreed or were
uncertain about the firm serving the low income market segment thus weakening the
perception that cost focus strategy is the strategy employed by Bridge. The standard
deviation range for the responses is between 0.762 and 1.256 as highlighted in Table 4.14.
The least standard deviation was 0.762 for offering of fair prices by providing better
quality education. This implies very little variation in opinion on the responses given for
this statement. The findings imply that differentiation focus strategy has a positive impact
on organizational performance.
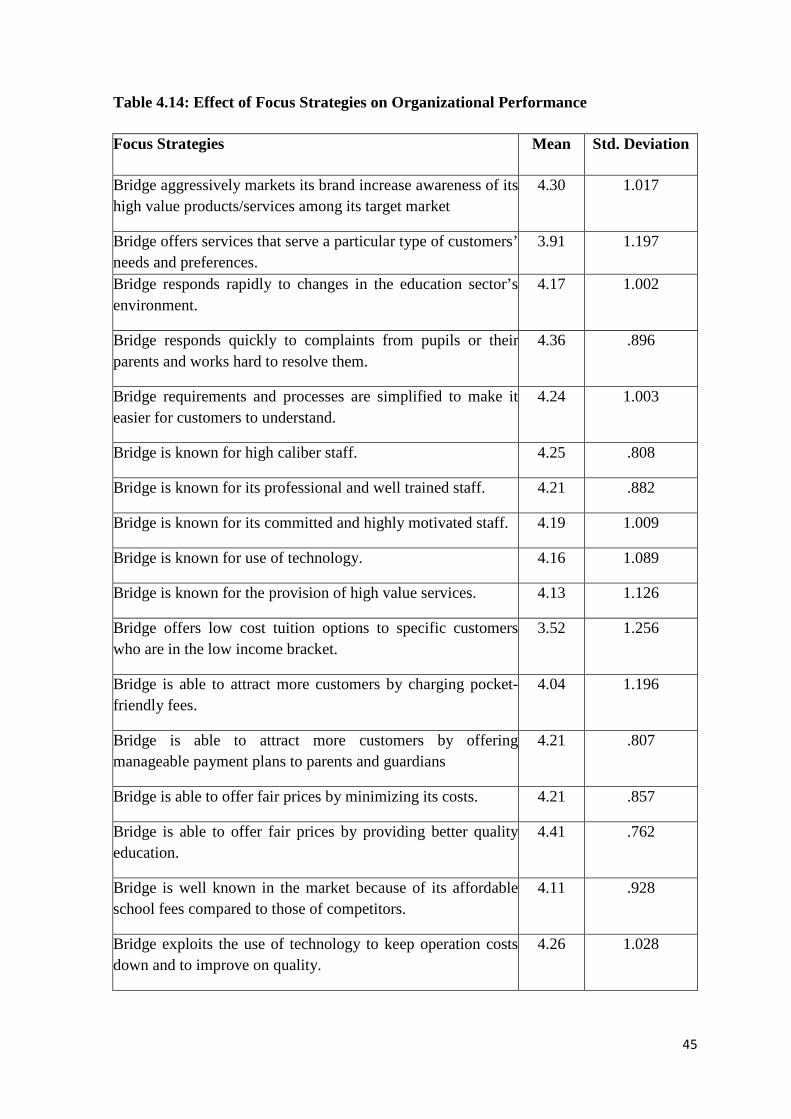
45
Table 4.14: Effect of Focus Strategies on Organizational Performance
Focus Strategies Mean Std. Deviation
Bridge aggressively markets its brand increase awareness of its high value products/services among its target market
4.30 1.017
Bridge offers services that serve a particular type of customers’ needs and preferences.
3.91 1.197
Bridge responds rapidly to changes in the education sector’s environment.
4.17 1.002
Bridge responds quickly to complaints from pupils or their parents and works hard to resolve them.
4.36 .896
Bridge requirements and processes are simplified to make it easier for customers to understand.
4.24 1.003
Bridge is known for high caliber staff. 4.25 .808
Bridge is known for its professional and well trained staff. 4.21 .882
Bridge is known for its committed and highly motivated staff. 4.19 1.009
Bridge is known for use of technology. 4.16 1.089
Bridge is known for the provision of high value services. 4.13 1.126
Bridge offers low cost tuition options to specific customers who are in the low income bracket.
3.52 1.256
Bridge is able to attract more customers by charging pocket-friendly fees.
4.04 1.196
Bridge is able to attract more customers by offering manageable payment plans to parents and guardians
4.21 .807
Bridge is able to offer fair prices by minimizing its costs. 4.21 .857
Bridge is able to offer fair prices by providing better quality education.
4.41 .762
Bridge is well known in the market because of its affordable school fees compared to those of competitors.
4.11 .928
Bridge exploits the use of technology to keep operation costs down and to improve on quality.
4.26 1.028
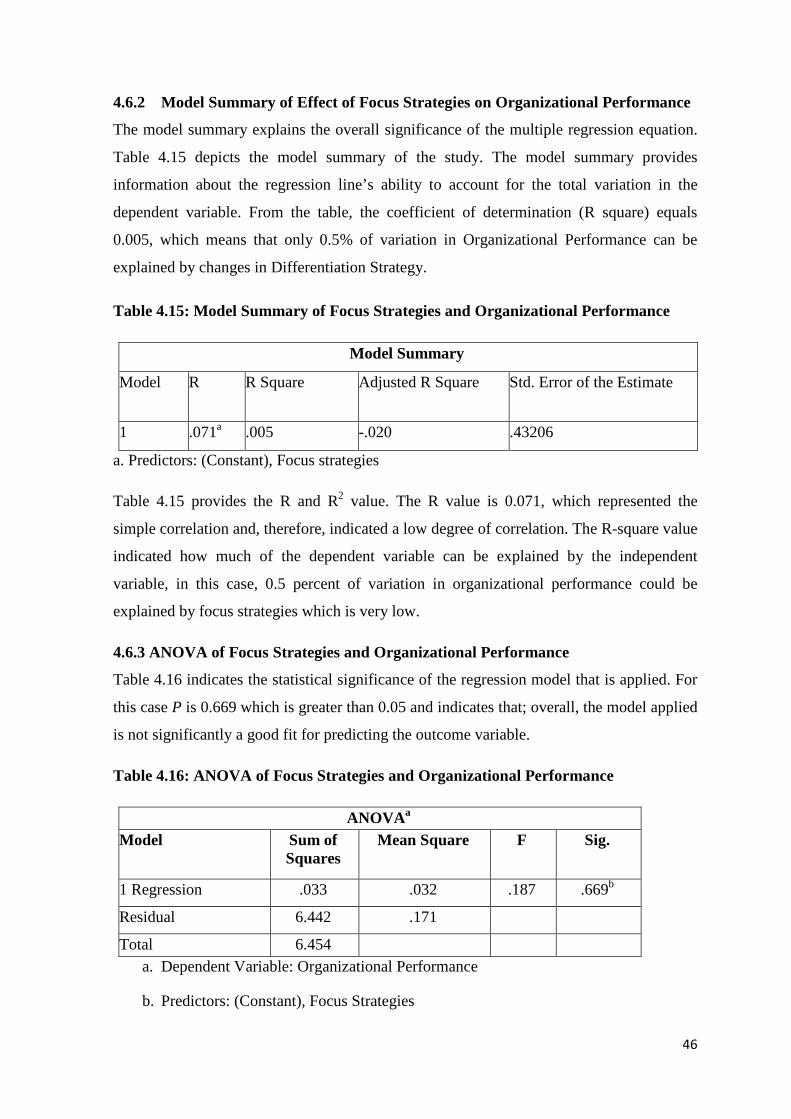
46
4.6.2 Model Summary of Effect of Focus Strategies on Organizational Performance
The model summary explains the overall significance of the multiple regression equation.
Table 4.15 depicts the model summary of the study. The model summary provides
information about the regression line’s ability to account for the total variation in the
dependent variable. From the table, the coefficient of determination (R square) equals
0.005, which means that only 0.5% of variation in Organizational Performance can be
explained by changes in Differentiation Strategy.
Table 4.15: Model Summary of Focus Strategies and Organizational Performance
Model Summary
Model R R Square Adjusted R Square Std. Error of the Estimate
1 .071a .005 -.020 .43206
a. Predictors: (Constant), Focus strategies
Table 4.15 provides the R and R2 value. The R value is 0.071, which represented the
simple correlation and, therefore, indicated a low degree of correlation. The R-square value
indicated how much of the dependent variable can be explained by the independent
variable, in this case, 0.5 percent of variation in organizational performance could be
explained by focus strategies which is very low.
4.6.3 ANOVA of Focus Strategies and Organizational Performance
Table 4.16 indicates the statistical significance of the regression model that is applied. For
this case P is 0.669 which is greater than 0.05 and indicates that; overall, the model applied
is not significantly a good fit for predicting the outcome variable.
Table 4.16: ANOVA of Focus Strategies and Organizational Performance
ANOVAa Model Sum of
Squares Mean Square F Sig.
1 Regression .033 .032 .187 .669b
Residual 6.442 .171
Total 6.454 a. Dependent Variable: Organizational Performance
b. Predictors: (Constant), Focus Strategies
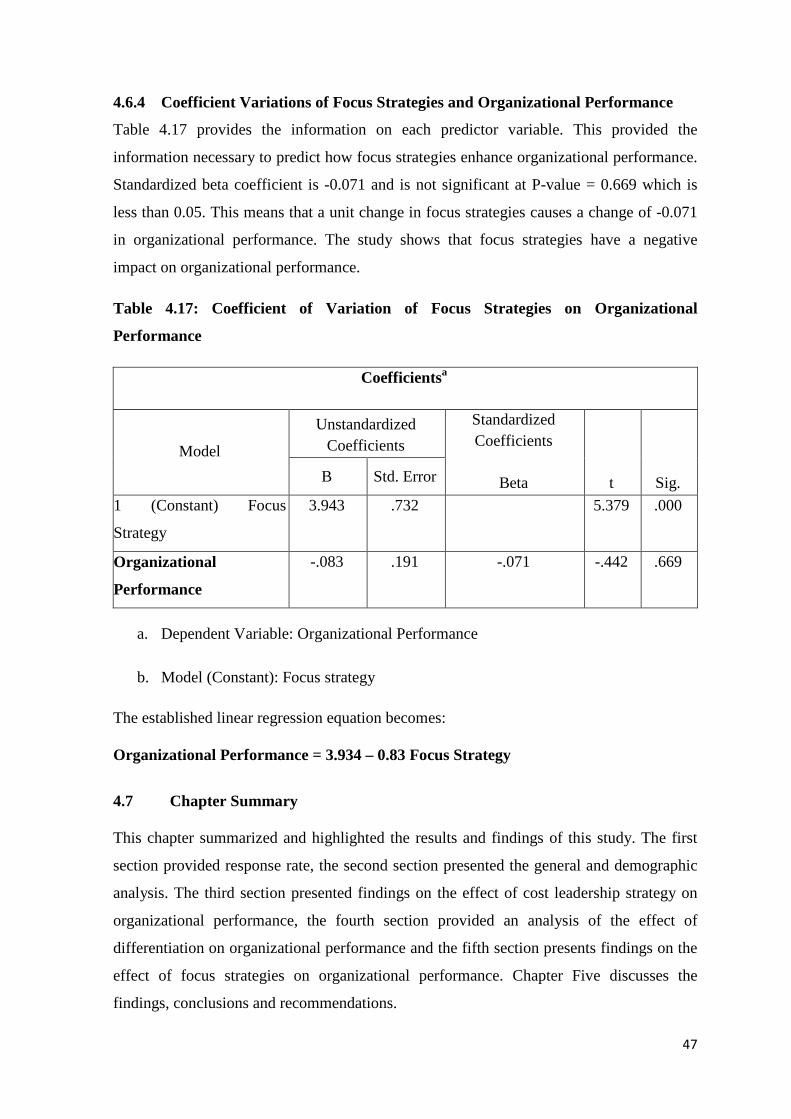
47
4.6.4 Coefficient Variations of Focus Strategies and Organizational Performance
Table 4.17 provides the information on each predictor variable. This provided the
information necessary to predict how focus strategies enhance organizational performance.
Standardized beta coefficient is -0.071 and is not significant at P-value = 0.669 which is
less than 0.05. This means that a unit change in focus strategies causes a change of -0.071
in organizational performance. The study shows that focus strategies have a negative
impact on organizational performance.
Table 4.17: Coefficient of Variation of Focus Strategies on Organizational
Performance
Coefficientsa
Model
Unstandardized Coefficients
Standardized Coefficients
Beta t Sig. B Std. Error
1 (Constant) Focus
Strategy
3.943 .732 5.379 .000
Organizational
Performance
-.083 .191 -.071 -.442 .669
a. Dependent Variable: Organizational Performance
b. Model (Constant): Focus strategy
The established linear regression equation becomes: Organizational Performance = 3.934 – 0.83 Focus Strategy
4.7 Chapter Summary
This chapter summarized and highlighted the results and findings of this study. The first
section provided response rate, the second section presented the general and demographic
analysis. The third section presented findings on the effect of cost leadership strategy on
organizational performance, the fourth section provided an analysis of the effect of
differentiation on organizational performance and the fifth section presents findings on the
effect of focus strategies on organizational performance. Chapter Five discusses the
findings, conclusions and recommendations.
48
CHAPTER FIVE
5.0 DISCUSSION, CONCLUSIONS AND RECOMMENDATIONS
5.1 Introduction
This chapter presents a summary of the research findings and summarizes the findings
established from the data analysis. The findings are also discussed in comparison to
literature review carried out by other scholars. Finally, conclusions drawn from the study
are presented as well as recommendations for improvement and further studies on the
effect of competitive strategies on organizational performance.
5.2 Summary
The aim of this study was to investigate the effect of the competitive strategies on
organizational performance in the Bridge International Academies located in Nairobi. This
was to be achieved under the guidance of the three research questions: What effect does
cost leadership strategy have on the organizational performance of Bridge International
academies? What effect does differentiation strategy have on the organizational
performance of Bridge International academies? What effect does focus strategy have on
the organizational performance of Bridge International Academies? The study adopted a
descriptive research design and data collection was done through questionnaires to obtain
relevant information from the respondents. The target population comprised of employees
of Bridge International Academies in Nairobi. A sample size of 111 respondents was
selected. As displayed on Table 4.1, out of the 111 questionnaires administered, 96
responded, which gave a response rate of 86.5%. Data collected were entered into SPSS
(version 24) which was also used to summarize the responses to give both the descriptive
and inferential statistics. After analysis, the output was summarized using percentages and
frequencies then presented using tables and figures.
The first research question sought to establish the effect of cost leadership strategy on
organizational performance. The study aspects addressed in the questionnaires include: the
cost of education; affordability of services and facilities; competitiveness of salaries paid to
staff; cost savings strategies; capacity utilization; use of technology; outsourcing and
vertical integration initiatives. The findings based on this research question revealed that
most of the employees agreed that the organization pursued cost reduction and emphasised
learning and continuous improvement to enhance the quality of education offered. There
49
was however a lack of consensus on whether Bridge offers the lowest cost of education in
this market segment. Majority of respondents also neither disagreed nor agreed that Bridge
manufactures or produces its own books and learning aids. A regression analysis revealed
that 28.5% of the variation in organizational performance can be explained by changes in
cost leadership strategy.
Study findings based on the second research question indicated that most of the
respondents agreed that the firm undertakes aggressive marketing, high value product
offering, high quality teaching, use of technology and continuous improvement. It was
established that the firm has also improved its performance by placing an emphasis on
continuous and innovation and by offering unique product and service features. There was
however uncertainty on whether Bridge offers unique products and services compared to
other low cost schools. Most respondents were also unsure about Bridge having a strong
and positive brand image. A regression analysis revealed that 77.3% of the variation in
organizational performance can be explained by changes in differentiation strategy.
Findings based on the third research question revealed that most of the respondents agreed
that Bridge applies aggressive marketing, quick response to change, customer service,
responding to customer needs, specialization, technology driven processes, high value
service offering and an emphasis on quality to improve organizational performance.
Respondents were generally unsure about whether offers low cost tuition options to
specific customers who are in the low income bracket. There was also general neutrality in
response given on whether the firm is attracting more customers by offering pocket-
friendly fees. Findings in this section implied that Bridge leans more towards the
differentiation focus strategy than the cost focus strategy. However, a regression analysis
revealed that only 0.5% of the variation in organizational performance can be explained by
changes in focus strategies. This is a negligible effect of the independent variable on the
dependent variable.
5.3 Discussion
5.3.1 Effect of Cost Leadership Strategy on Organizational Performance
Interestingly, cost leadership was found to contribute positively and significantly to the
Bridge International Academies’ performance in Kenya. This implies that as competitive
pricing and efficiency in the services offered (measures of cost leadership) continues to be
50
enhanced, then the performance of Bridge International Academies will improve.
According to Bloucher, Juraras & Cokins (2015), business entities are increasingly
adopting cost leadership as a strategy to minimize costs, increase revenue and grow market
share. This would explain why the management of Bridge has adopted cost leadership
techniques such as cost reduction, exploiting economies of scale, outsourcing, use of
technology for efficiency among others to drive costs down and increase profit margins
and market share.
The study findings indicate that Bridge pursues a cost savings approach to delivery of
lessons, construction of infrastructure and to the provision of learning aids. The research
established that this cost reduction approach has contributed to an improvement in
organizational performance. Other studies have come up with similar findings. According
to Gildemeister et al., (2013), examples of cost reduction techniques that a firm can
implement to manage and control its costs include, discontinuing non-essential activities
that do not have cost advantages; outsourcing some activities, for example payroll
processing; intensive research and development for innovation and continuous
improvement; automating processes or using technology for efficiencies; streamlining
processes for operational excellence and backward vertical integration which involves
gaining control of distributors or suppliers so as to minimize costs. These techniques may
have a high initial outlay but if implemented successfully, then the benefits outweigh the
costs.
The research findings in this study demonstrate that for sure operational efficiency is a key
strategic driver for firms aiming to produce at a low cost which in turn helps to maximize
profit in the long term. In particular, findings by Porter (1985) demonstrated that the main
way to achieve sustainable competitive advantage is through controlling production costs
as well as non-production costs which are similar techniques employed by the management
of Bridge. From the findings, respondents also indicated that indeed focusing on low cost
strategies would help to achieve economies of scale. Hansen et al., (2015), purported that
the only way to beat the market was to employ technology and experienced employees
who would oversee cost control measures. This proposition has also been confirmed by the
current study findings.
From the findings it was also obvious that Bridge has inculcated a learning culture to
improve on quality and efficiency technique employed by Bridge. Continuous
51
improvement and skills enhancement has ensured that the school offers high quality
education, learning aids and other services. This in turn has given the academies an edge
over players in the sector and led to growth in market share and consequently an
improvement in organizational performance. This premise is supported by a study
conducted by Mora (2014) on the effect of continuous improvement strategy on firm
performance. The findings of that study indicate that a culture of continuous learning and
process improvement led to enhanced product value and customer satisfaction which
contributed to increased profit margins.
Results of a regression analysis carried out between factor of cost leadership strategy and
the organizational performance of Bridge International revealed that positive change in
organizational performance can be attributed to variations in cost leadership strategy.
These results are similar to those in the findings of a research carried out by Atikiya (2015)
where it was established that there was a positive relationship between cost leadership and
manufacturing firms’ performance. Hence, a unit increase in cost leadership strategy led to
an increase in organizational performance.
5.3.2 Effect of Differentiation Strategy on Organizational Performance
On differentiation study, the research findings proved the assertion that differentiation
strategy uniquely determines the Bridge International Academies’ performance as viewed
from the growth in sales and profit. The findings of the study revealed that most
respondents agreed that Bridge has adopted differentiation approaches to remain
competitive. A high mean score was posted from the results of the data collection. The
study further found that the relationship between differentiation strategy and organizational
performance tends to move in the same direction implying a positive relationship.
In the case of aggressive marketing, most respondents agreed that Bridge aggressively
markets its brand through various channels to increase awareness of its high value and
unique products and services. As observed by Hugosson and McCluskey (2009) in
Swedish sawmill companies, differentiation provides the business with relationship
marketing which enables continued demand for the companies’ product. Davcik and
Sharma (2016) add that marketing is a crucial driver of a differentiator firm’s business
strategy as it helps the firms gain a competitive advantage over the competition and leads
to better performance. Therefore focused and intense marketing has led to demand for
education at Bridge which in turn has increased revenue and possibly brand awareness.
52
As in the case of Hugosson and McCluskey (2009), this study established that
differentiation, as is done through adding product features, provision of value based
services and focusing on strengthening core competencies, immensely contributes to
increased demand for the academies’ services. In a study by Organ (2014), majority of
respondents surveyed agreed that products and services that are differentiated by the use of
technology and innovation attract more customers. Similarly, most respondents agreed that
the use of technology gave the academies an edge over other schools in the low cost
private education segment. This attractiveness has had a positive impact on perspectives of
organizational performance such as school enrollment and revenue. There was also an
overwhelming consensus that brand image, a range of products, technology and customer-
oriented services help improve the performance of Bridge International Academies.
Similarly, a study of telecommunication companies in Kenya by Arasa and Gathinji
(2014), revealed that adoption of numerous differentiation strategies does not only make a
firm stand out uniquely but may also enhance the profitability of the firms.
In addition, high quality and high value are factors most respondents agreed are
emphasized at Bridge. These are key features that drive up demand for their services
because they create a perception among customers that there is a good return for the cost of
education. A study by Dirisu et al., (2013), also established that high product quality and
value added are critical variables of differentiation strategy. Strategists have to come to
realize that in order to improve performance, the organization must continually seek
opportunities to create the most value and provide product features that increase customer
satisfaction. Mwanzia (2015) in his research on market share among tea export firms adds
weight to the link between high quality and differentiation by stating that the quality of
goods/services of a firm that is superior to the one of other firms’ contributes to its
performance.
The study also revealed that most respondents were uncertain about Bridge providing
unique products and services. They were also unsure about Bridge having a strong and
positive brand image. These findings contradict the results of studies that have listed
uniqueness and a strong brand as some of the essential variables of a differentiator firm.
Competitive advantage can arise from a business providing products that are unique and
that create a perception of superior value (Dirisu et. al., 2013). A study done by Ingenhoff
and Fuhrer (2010), on corporate brand positioning revealed that a strong, positive brand is
imperative for any firm pursuing market dominance through a differentiation strategy.
53
From the regression analysis, it is evident that the adoption of differentiation strategies has
led to enhanced organizational performance at Bridge.
5.3.3 Effect of Focus Strategies on Organizational Performance
The findings based on the third research question revealed that Bridge has employed
various focus strategy marketing techniques in its goal to maximize shareholder wealth.
Focus strategy as presumed at the beginning was confirmed to have a positive although
insignificant effect on the Bridge International Academies’ performance. Focus strategies
as assessed by the specialty of products and/or service and low cost focus has been found
to improve the performance of the Bridge International Academies. Most of the
respondents in this study, agreed that focus on a specific niche- in this case children from
low income communities; specific geographical market; specialty in product and broad
product serving improved the firm’s performance. This is similar to findings by Atikiya
(2015), which revealed that focusing on a market segment with growth potential
guarantees an increase in sales as compared to a saturated market.
Most of the respondents in the study agreed that by offering high quality education, Bridge
has steadily grown its enrollment and can therefore offer fair prices by exploiting
economies of scale. According to Bertozzi, Ali and Gul (2017), when a firm adopts a focus
strategy, specifically the cost focus variant, it increases brand loyalty and market share by
offering good quality products and services at an affordable price to a particular market
segment. Ouma and Oloko’s (2015) study on bus companies established that firms may
achieve financial growth by gaining a cost advantage in a particular segment. In this study,
most respondents agreed that “Bridge is able to attract more customers by charging pocket-
friendly fees”, “Bridge is able to attract more customers by offering manageable payment
plans to parents and guardians” and “Bridge is able to offer fair prices by minimizing its
costs”. There is therefore a consensus that Bridge has employed some focus strategy
techniques that unfortunately from the data analysis have not yielded a strong positive
effect on organizational performance.
Analysis of the responses from the study align to a study by Waiyaki (2014), where it was
found that differences in market segment require companies to focus on differentiated
products/services that have attractive design to cater for the customers need and wants.
Therefore, proper identification of the niche market is critical for the successful
implementation of focus strategies. The fact that the niche can disappear with time due to
54
changing the preference, taste and fashion, demands that the companies have to pay close
attention to these changing tastes and preferences and adapt rapidly to customer demands
(Lynch, 2003). In his summation, Yasar (2010) noted that in many departments such as
marketing, procurement and R&D, focus strategy is instrumental as it indicates where
more resources should be allocated for improved performance. This research also confirms
the importance of this strategy, especially for the Bridge International Academies. In this
case, Bridge is focusing on providing quality education to the low income segment of the
population by developing a product that is attractive, fairly priced and that will generate
increased revenue. However, the main weakness of focus strategy is observed when the
focused segment is too confined to be economical or when the segment declines with time
(Atikiya, 2015). A regression analysis was done between the variables of focus strategy
and organizational performance. The analysis revealed that a very negligible percentage
change in focus strategy causes a variation in organizational performance. Therefore the
effect of focus strategy on organizational performance perspectives is positive but
insignificant.
5.4 Conclusions
5.4.1 Effect of Cost Leadership Strategy on Organizational Performance
From the findings, most of the respondents agree that strategies such as cost reduction,
standardization, organizational learning, continuous improvement, investing in technology,
outsourcing and vertical integration have a positive effect on organizational performance.
The principle of charging lower prices, investing in technology in a bid to lower costs
should however be managed carefully to avoid compromising on the quality of products
and services. Cost saving benefits can be realized from automation, outsourcing, improved
internal efficiency and procuring raw materials at reduced prices. Bridge should however
be careful not to undermine quality at the expense of minimizing operational costs. The
firm should also not sacrifice other revenue generating strategies in their pursuit of being a
cost leader. Lower prices may lead to a rise in demand and increased market share but a
firm that is applying cost minimization strategies may compromise on quality and
customer satisfaction and eventually experience a decline in revenues. While applying cost
leadership measures, Bridge should also ensure its brand image is not eroded.
55
5.4.2 Effect of Differentiation Strategy on Organizational Performance
The study revealed that Bridge has adopted the differentiation strategy to gain a
competitive advantage and improve organizational performance. Majority of the
respondents affirmed that Bridge pursues aggressive marketing, value add product
offering, high quality teaching, technological advances and continuous improvement. In
addition, the firm increased demand and revenues by offering unique product and service
features. Further, it can be said that companies should also aim to be the first in releasing
new products that cannot be imitated easily so as to maintain their market share.
From the findings of the study, differentiation strategy has proved to be a technique that
can be employed by those firms wishing to outperform the market. This strategy’s
relevance and positivity towards organizational performance cannot be ignored. It can also
be said that firms need to explore more areas of differentiation. From the study, it is
evident that by applying technology, continuous development, innovation and addition of
unique product features, Bridge has managed to improve organizational performance.
Some notable areas of success that can be attributed to the differentiation strategy are
enhanced brand image, growth in customer base, outstanding customer service, efficiency
through use of technology and product development.
5.4.3 Effect of Focus Strategies on Organizational Performance
Bridge has targeted the low income segment of the population with specific focus on
communities living in the rural area and urban slum settlement. The firm has embedded its
schools in these distinct locations and reached out to customers by offering specialized
services and products, unique features, affordable payment plans and highly trained
teachers. However, there seems to be a negligible effect of focus strategy on organizational
performance. Bridge International Academies should apply their expertise and specialized
skills to focus on capturing a larger share of the market segment. Through this approach,
they can minimize operational costs, grow their customer base and drive up profit. By
targeting a specific niche of low income school going children, Bridge has developed an
educational approach that offers quality learning, affordability, technology and continuous
improvement. This strategy can strengthen their position in a sector where the public
education system is struggling to offer quality education to the low income segment of the
population.
56
5.5 Recommendations
5.5.1 Recommendation for Improvement
5.5.1.1 Effect of Cost Leadership Strategy on Organizational Performance
The findings of the study indicate that cost leadership strategy is a contributor to the
organizational performance of the Bridge International Academies. This means that
continued implementation of this strategy may yield better results thus companies that
deploy this strategy effectively can outperform competitors in the industry and improve in
the four organizational perspectives: - financial, customers, internal processes and learning
and growth.
This study recommends that Bridge International Academies should embrace and invest in
cost leadership strategies specifically by forming linkages with service providers, suppliers
and other supplementary institutions since it will enable them to achieve a competitive
advantage over other schools that are not investing in these strategies.
The management should also respond swiftly to environmental changes and eroded value
that arises from competitor activities. To develop core competences there is need for good
leadership from the management and involvement of all stakeholders. Government and
teachers’ unions buy-in is especially critical for the continued success of the organization.
This process of strategic choice will lead to motivation and commitment during
implementation. For involvement of stakeholders which is critical, communication has to
be effective.
5.5.1.2 Effect of Differentiation Strategy on Organizational Performance
The study findings confirm that differentiation has a very strong positive effect on
organizational performance. Since this strategy has a positive influence on the firm’s
performance, for Bridge International Academies should refine the differentiating
techniques they are implementing and invest more in differentiating their personnel
through continuous training, enhance continuous improvement of internal business
processes in order to make them unique and innovative. Career growth and job satisfaction
initiatives will also improve staff motivation and retention while ensuring valuable
expertise and core competences are retained in the firm for sustained competitive
advantage. Bridge International Academies should also avoid complacency and constantly
57
monitor the environment to counter fundamental competitive forces that drive industry
competition which include threat of new entrants; threat of substitute products; bargaining
power of suppliers; bargaining power of buyers and rivalry among current competitors.
5.5.1.3 Effect of Focus Strategies on Organizational Performance
The study concludes that focus strategy contributes the least to organizational performance
at the Bridge International Academies. It however has a positive effect evident from the
increased brand awareness due to aggressive marketing and the growth in customer base.
There is potential for further growth from the application of this strategy. The organization
will therefore need to carry out an in-depth study on the target segment to understand how
to meet the customers’ needs and preferences and explore viable initiatives that will
improve organizational performance measures.
5.5.2 Recommendation for Further Research
The study was limited to one institution – Bridge International Academies – in Nairobi. It
was therefore not possible to generalize the study to other low cost private schools. Further
research is therefore necessary to include other players in the private and low cost primary
education sector in order to make a more comprehensive conclusion. The study was also
confined to investigating the effect of competitive strategies on organizational performance
and the results indicated a combination of cost leadership, differentiation and focus
strategies. Thus it is recommended that further research is done on for profit organizations
in the education sector that are integrating competitive strategies and employing a hybrid
approach for superior organizational performance. Additionally, the study recommends
that Bridge International Academies clarify their long term goals and carry out a capability
analysis before selecting the competitive strategy or combination of strategies they will
execute to drive up the firm’s performance.
58
REFERENCES
Abidin, N.Z., Yosof, N., Hassan, H., & Adros, N. (2011). Applying a competitive strategy
in quantity surveying firms: An evolving process. Asian Journal of Management
Research 2(1), 61-73.
Aliqah, K.M.A. (2012). Differentiation and Organizational Performance: Empirical
evidence form Jordanian companies. Journal of Economics, 3(1), 7-11.
Altuntas, G., Semerciözb, F. , Mertc, A. & Pehlivand, C. (2014). Industry forces,
competitive and functional strategies and organizational performance: Evidence from
restaurants in Istanbul, Turkey. Procedia - Social and Behavioural Sciences, 150, 300 –
309.
Alvi, M. (2016). A Manual for Selecting Sampling Techniques in Research. Munich
Personal Repec Archive.
Arasa, M., & Gathinji, S. (2014). Competitive Strategies and Firm’s Performance in
Telecommunication Industry in Kenya. Strathmore University.
Arasa, R. & Gathinji, L. (2014). The relationship between competitive strategies and firm
performance: a case of mobile telecommunication companies in Kenya. International
Journal of Economics, Commerce and Management, 2 (9).
Atikiya, R. (2015). Effect of Competitive Strategies on the performance of Manufacturing
Firms in Kenya. Unpublished Ph.D. thesis, Jomo Kenyatta University of Agriculture
and Technology.
Auka, D.O. (2014). Porter’s Generic Competitive Strategies & Customer Satisfaction in
Commercial Banks in Kenya. Eurasian Business and Marketing Journal. 1(1), 1-31.
Awwad, A.S., Al Khattab, A.A. & Anchor, J.R. (2013). Competitive Priorities and
Competitive Advantage in Jordanian Manufacturing. Journal of Service Science and
Management, 6, 69-79.
Bacea, A. & Borza, A. (2015). Outsourcing: Why and why not? "Management and
Innovation for Competitive Advantage", November 5th-6th, 2015, Bucharest, Romania,
13-20.
59
Baroto, M.B., Abdullah, M.M and Wan, H.L. (2012). Hybrid strategy: A new strategy for
competitive advantage. International Journal of Business and Management, 7(20) 120-
131.
Bayraklar, C.A., Hancerliogullari, G., Cetinguc, B. & Calisir, F. (2016). Competitive
strategies, innovation, and firm performance: an empirical study in a developing
economy environment. Technology Analysis and Strategic Management Journal. 29(1).
Bertozzi, F. Chaudhry, M.A. & Gul, F.A. (2017). Porter’s five Generic strategies: A case
study of the Hospitality Industry. International Journal for Research in Mechanical and
Civil Engineering, 3(2), 9-23.
Bhattacherjee, A. (2013). Social Science Research: Principles, Methods, and Practices.
USF Tampa Library Open Access Collections – Textbook collections. Florida:
University of South Florida.
Birjandi, H., Jahromi, N.M., Darabi, S.A. & Birjandi, M. (2014). The Effect of Cost
Leadership Strategy on ROA and performance of companies in Tehran Stock Exchange.
Research Journal of Finance and Accounting, 5(7), 152-158.
Blumberg, B., Cooper, D.R. & Schindler, P. S. (2014). Business Research Methods, 4th
Revised Edition. London: McGraw-Hill Higher Education.
Bloucher, E.J., Stout, D.E., Juras, P. & Cokins, G. (2015). Cost Management: A Strategic
Emphasis, 7th edition. New York, NY: MrGraw-Hill Inc.
Cao, X. (2017). Marketing Strategies of Chinese Mobile Phone MNCs in the European
Market - A Case Study of Huawei. Sweden: Linnaeus University.
Celli, M. (2013). Determinants of Economies of Scale in Large Businesses—A Survey on
UE Listed Firms. American Journal of Industrial and Business Management, 3, 255-
261.
Chang, H., Fernando, G.D., & Tripathy, A. (2015). An Empirical Study of Strategic
Positioning and Production Efficiency. Advances in Operations Research, 2015, 1-11.
Chege, F. (2015). An Investigation of Competitive Strategies Adopted by Small and
Medium. Nairobi: University of Nairobi.
60
Chitour, H.L. (2013). The Key drivers behind Novo Nordisk’s growth in the diabetes
market in China. European Journal of Interdisciplinary Studies.
Cooper, D.R. & Schindler, P.S. (2014). Business Research Methods. New York, NY:
McGraw-Hill.
Darsono, N., Yahya, A., & Amalia, R. (2016). Analysis of Distinctive Capabilities and
Competitive Advantage on Business Performance of Tourism Industry in Aceh.
International Journal of Business and Management,4(3), 231-234.
Das, K.K. & Ara, A. (2014). Harley Davidson, Success Speaks- Brand Image and Culture:
An HR Perspective, Bonfring International Journal of Industrial Engineering and
Management Science, 4 (2), 48-56.
Davick, N.S & Sharma, P. (2016). Marketing resources, performance, and competitive
advantage: A review and future research directions, Journal of Business Research, 92-
115.
Dirisu, J.I., Iyiola, O & Ibidunni, O.S. (2013). Product differentiation: A tool of
Competitive Advantage and Optimal Organizational Performance: A study of Unilever
Nigeria PLC. European Scientific Journal. 9(34), 258-281.
Drouin, C. (2014). Strategic Planning for Schools & Admission. New Jersey: The
Enrollment Management Association.
Elassy, N. (2015). The concepts of quality, quality assurance and quality enhancement:
Quality Assurance in Education. Emerald Insight. 23(2), 250-261.
Eskandari, M. J., Miri, M., Gholami, S. & Nia, S. R. (2015) Factors affecting the
Competitiveness of the Food Industry by using Porter's Five Forces Model: Case Study
of Hamadan Province, Iran. Journal of Asian Scientific Research. 5(4), 185-197.
Etika, I., Musa, S.A. & Alkassim, R.S. (2015) Comparison of Convenience Sampling and
Purposive Sampling. American Journal of Theoretical and Applied Statistics, 5(1), 1-4.
Fathali, A. (2016). Examining the Impact of Competitive Strategies on Corporate
Innovation: An Empirical Study in the Automobile Industry. International Journal of
Asian Social Science, 6(2), 135-145.
61
Fields, P., Hague, D., Koby, G.S., Lommel, A. & Melby, A. (2014). What Is Quality? A
Management Discipline and the Translation Industry Get Acquainted. Revista
Tradumatica, 12, 404-412.
Fisher, W.W., & Obrholzer-Gee, F. (2013). Strategic Management of Intellectual Property:
An Integrated Approach. California Management Review, 55(4), 157-183.
Forbes (2017). Forbes Fab 40: The most valuable brands in sports. New Jersey: Forbes
Media.
Gao, S & Low, S.P. (2014). The Toyota Way model: an alternative framework for lean
construction. Total Quality Management, 25,(6), 664–682.
Gehani, R.R. (2013). Innovative Strategic Leader Transforming From a Low-Cost Strategy
to Product Differentiation Strategy. Journal of Technology Management and
Innovation. 8(2), 144-155.
Geisler, E. & Heller, O. (2013). Management of Medical Technology: Theory, Practice
and Cases. New York: NY. Springer Science and Business Media.
Gelman, A. & Hill, J. (2006). Data Analysis using Regression and Multilevel /
Hierarchical models. Cambridge: Cambridge University Press.
GEMS Cambridge International Schools. (2017). Fee Structure for 2017- 2018. Nairobi:
GEM Prospectus.
Genpact Research Institute. (2017). The Impact of Technology on Business Process
Operations. Bermuda: Genpact Research Institute Report.
Ghasemi, A. & Zahediasl, S. (2012). Normality tests for Statistical Analysis: A guide for
Non statisticians. International Journal of Endrocrinology & Metabolism, 10(2), 486-
489.
Gildemeister, J., Gossy, G., Klevenz, M., Messenbock, R. & Wray, J. (2013). Six steps to
achieving Competitive Advantage through Cost Excellence. Boston: Boston Consulting
Group.
Goedhart, M., Koller, T. & Wessels, D. (2017) The six types of successful acquisitions.
New York: Mckinsey & Company
62
Greenhalgh, C. & Rogers, M. (2010). Innovation, Intellectual Property and Economic
Growth. Princeton: NJ. Princeton University Press.
Gupta, A. (2013). Environment and PEST Analysis: An Approach to External Business
Environment. International Journal of Modern Social Sciences, 2(1), 34-43.
Hagen, C. (2010). Beating Low cost Rivals. United Kingdom: Emerald Publishing Group.
Hill, C.W.L., Jones, G.R & Schilling, M.A. (2014). Strategic Management: Theory and
Cases: An Integrated Approach. New York: NY. Cengage Learning.
Hitt, M.A., Ireland, D.R., & Hoskisson, R.E. (2015). Strategic Management:
Competitiveness and globalization. Stamford: USA. Cengage Learning.
Hilman, H. (2009). Relationship of competitive, strategic flexibility and sourcing strategy
on organizational performance. Universiti Putra Malaysia.
Hough, J., Thompson, A.A. & Gamble, J. (2011). Crafting and Executing Strategy. New
York: McGraw Hill Higher Education.
Hoyle, R.H. & Gottfredson, N.C. (2015). Sample Size Considerations in Prevention:
Research Applications of Multilevel Modelling and Structural Equation Modelling.
National Institute for Health, 16(7), 987-996.
Hugosson, M. & Mccluskey, D. (2009). Marketing competencies of Swedish sawmill
firms. Journal of Forest Products Business Research.
Hurduzeu, R.E. (2015). Impact of Leadership on Organizational Performance. SEA-
Practical Application of Science, 1(4), 289-294.
Hsu, F.J., Wang, T.Y. & Chen, M.Y. (2013). The Impact of Brand Value on Financial
Performance. Advances in Management and Applied Economics, 3(6), 129-141.
Ibrahim, M. (2015). Investigating the use of the four perspectives of Balanced Scorecard as
a technique for assessing the performance of Nigerian bank. Journal of Accounting and
Taxation, 7(4), 62-70.
International Finance Corporation. (2016). IFC Inclusive Business Case Study: Bridge
International Academies. New York: World Bank Group.
63
Jabbar, H. (2015). How do school leaders respond to competition? Policy Brief. New
Orleans: Education Research Alliance.
Jawad, S. (2017). A literature analysis of Walmart’s supply chain excellence in terms of
integration, distribution and operations. Helsinki: Haaga Helia University of Applied
Sciences.
Jabbouri, N.I., & Zahari, I. (2014). The Role of Core Competences and Organizational
Performance: An Empirical Study of the Iraqi Private Banking Sector. European
Scientific Journal, 1, 130-139.
Johnson, K., Li,Y., Phan, H., Singer, J., & Trinh, H. (2012). The Innovative Success that is
Apple Inc. Marshall University.
Jinjin, T. (2013). A Strategic Analysis of Apple Computer Inc. and Recommendations for
the Future Direction. Management Science and Engineering, 7(2), 94-103.
Jones, G.R, & Hill, G.W.L. (2013). Theory of Strategic Management with Cases, 10th
Edition, London: Cengage Learning.
Kenya Bureau of Statistics (2011). Kenya Population Data Sheet.
Kim, W.C., & Mauborgne, R. (2005). Blue Ocean Strategy. Boston: Harvard Business Review.
Kindy, A.M., Shah, I.M. & Jusoh, A. (2016). Consideration and Methodological
Approaches in Studying Transformational leadership Impact on Work Performance
Behaviors. International Journal of Advanced Research, 4 (1), 889- 907.
Kinyuira, D. (2014). Effects of Porter’s Generic Competitive Strategies on the
Performance of Savings and Credit Cooperatives (Saccos) in Murang’a County, Kenya.
Journal of Business and Management, 16(6), 93-105.
Kipngetich, B.M. (2015). Competitive Strategies adopted by Equity Bank (Kenya) Limited
to achieve Sustainable Competitive Advantage in Kenya. University of Nairobi.
Khayali, L.H., Koubaa, M.B. & Zouaoui, M. (2014). Technological Innovation and
Business Strategy. International Journal of Research in Management & Business
Studies, 1(1), 130-140.
64
Kwauk, C. & Robinson J. P. (2016). Bridge International Academies: Delivering Quality
Education at a low cost in Kenya, Nigeria and Uganda. Boston, Massachusetts. The
Brookings Institute.
Lapersonne, A., Shangavi, N & De Mattos, C. (2015). Hybrid Strategy, Ambidexterity and
Environment: Toward an Integrated typology. Universal Journal of Management, 3(12),
497-508.
Lazko, E., Pavlushkina, E., Moiseeva, E., & Nesterenko, A. (2016). Cost cutting:
Methodology and Tools. Moscow: Deloitte.
Learnloads (2014). Capacity Utilization. Dorchester: Learnloads E-books.
Lee, Q., (2014). Learning and Experience curves in Manufacturing. Florida: Strategos,
Group.
Li, J. J., & Zhou, K. Z. (2010). How foreign firms achieve competitive advantage in the
chinese emerging economy: managerial ties and market orientation. Journal Business of
Research, 63(8), 856–862.
Loureiro, S.M.C., Sarmento, E.M. & Bellego, G. (2017). The Effect of Corporate brand
reputation on brand attachment and brand loyalty: Automobile Sector. Cogent Business
and Management, 4, 1-10.
Lynch, R. (2003). Corporate Strategy (3rd ed.). Harlow, England: Prentice Hall Financial
Times.
Maduenyi, S., Oke, A.O. & Fadenyi, O. (2015). Impact of Organizational Structure on
Organizational Performance. International Conference on African Development Issues,
54-358.
Mahdi, H.A., Abbas, M., Mazar, T.I. & George, S. (2015). A Comparative Analysis of
Strategies and Business Models of Nike, Inc. and Adidas Group with special reference
to Competitive Advantage in the context of a Dynamic and Competitive Environment.
International Journal of Business Management and Economic Research, 6(3), 167-177.
Mamaev, A.E., Shvestov, M.N., Mamaeva, V.E. & Lebedev, A.V. (2015). Competitive
Development Strategies of the Educational Institutions of Higher Education.
Mediterranean Journal of Social Sciences, 6(3), 389-395.
65
Marcin, M., (2017). The History of the Assembly line. Atlanta: The Resource Light.
McCluskey, F. (2009). Integrated product and process design and development: the
product realization process. CRC Press.
McFarlane, D. (2013). The Strategic Importance of Customer Value. Atlantic Marketing
Journal, 2(1), 62-75.
McMillan, J.H. (2016). Fundamentals of Educational Research, 7th edition. Boston,
Massachusetts: Pearson Education.
Meyer, P. (2017). Harley Davidson’s Generic and Intensive Growth Strategies. Panmore
Institute.
Millennium Development Goal Monitor (2017). Tracking the Millenium Development
Goals. Millennium Development Goals.
Mora, J.N.C. (2014). Continuous Improvement Strategy. European Scientific Journal,
10(34), 117-126.
Mwangi, E.W., & Ombui, K. (2013). Effects of Competitive Strategies on the Performance
of Mission Hospitals in Kenya: A Case of Kijabe Mission Hospital. International
Journal of Science and Research, 2(11), 14-19.
Mwanzia, J.K. (2015) The Effect of Differentiation Strategy on Market Share of Tea Export
Firms in Kenya, University of Nairobi.
Njambi, E., Lewa, P. & Katuse, P. (2016) Relationship between Threat of Substitutes and
Competitive Advantage of Large Multinationals in Kenyan Beverage Industry.
International Journal of Business and Management, 4(7), 412-423.
Ngware, M., Abuya, B., Admassu, K., Mutisya, M., Musyoka, P., & Oketch, M. (2013).
Quality and Access to Education in Urban Informal Settlements in Kenya. Africa
Population and Health Research Centre, 77.
Nyauncho, M. J., & Nyagara, I. (2015). Assessment of the effect of Cost Leadership
Strategy on the performance of Liquefied Petroleum Gas Companies in Eldoret town,
Uasin Gishu County, Kenya. International Journal of Business and Management
Invention, 4(4) 1-7.
66
Omair, A. (2015). Selecting the appropriate study design for your research: Descriptive
study designs. Journal of Health Specialities, 3(3), 153-156.
Organ, T. (2014). How life insurers can differentiate themselves in the marketplace.
Lifehealthpro ALM Media.
Organization of Co-operation and Economic Development (2016). Defining and
Measuring Innovation in all Sectors of the Economy: Policy Relevance.
Organization of Co-operation and Economic Development (2017). Defining Innovation.
OECD Innovation Strategy
Orodho, A.J. (2003). Essentials of Educational and Social research methods. Nairobi:
Mazola Publishers. London: Primary Teaching Methods.
Ouma, G. & Oloko, M. (2015). The Relationship between Porter’s Generic Strategies and
Competitive Advantage: A Case Study of Bus Companies Plying the Kisumu-Nairobi
Route, Kenya. International Journal of Economics, Commerce and Management, 3(6),
1058-1092.
Pearce, J., & Robinson, R. (2013). Strategic Management: Planning for domestic and
global competition, 13th ed. New York, NY: McGraw Hill.
Pearce, J., & Robinson, R. (2015). Strategic Management: Planning for domestic and
global competition, 14th ed. New York, NY: McGraw Hill.
Pearson (2016). The Pearson Affordable Learning Fund: Myths and Facts. United
Kingdom: Pearson Education Ltd.
Pierce, A. (2015) Cost Reduction as an Element of Business Strategy. California: DCA
Partners White Paper.
PLS Logistics Services (2017). Logistics Services Best Practices: All for superior
Customer Service. Pennsylvania: PLS Logistics Company.
Porter, M. (1980). Competitive Strategy: Techniques for analysing industry and
competitors. New York: The Free Press.
Porter, M. (1985). Competitive Advantage. New York: The Free Press.
67
Porter, M. E. (1990). The Competitive Advantage of Nations: With A New Introduction.
New York, NY: Free Press.
Porter, M. E. (1998). Competitive Strategy: Techniques for analysing industries and
competitors. New York, NY: The Free Press.
Porter, M. E. (2008). ‘The Five Competitive Forces That Shape Strategy’, Harvard
Business Review, pp. 1-16.
Price Waterhouse Coopers (2016). More for less: Five steps to strategic cost reduction.
Switzerland: PWC Switzerland.
Price Waterhouse Coopers (2016). Prospects in the Retail and Consumer goods Sector in
ten Sub-Saharan countries. South Africa: PWC.
Pulaj, E., Kume, V. & Cipi, A. (2015). The impact of generic competitive strategies on
organizational performance: The evidence from the Albanian context. European
Scientific Journal, 11(28), 273-284.
Rahi, S. (2017). Research Design and Methods: A Systematic Review of Research
Paradigms, Sampling Issues and Instruments Development. International Journal of
Economics & Management Science, 6(2), 1-5.
Rahman, N. A. & Ramli, A. (2014). Entrepreneurship management, competitive
advantage and firm performances in the craft industry: concepts and framework.
Procedia - Social and Behavioural Sciences, 145, 129 – 137.
Ringel, M., Taylor, A. & Zablit, H. (2017). Most Innovative Companies 2016. Boston:
Boston Consulting Group.
Rothaermel, F.T. (2016). Strategic Management: Concepts, 3rd Edition. New York: NY.
McGraw Hill Education.
Rowland, C. (2017). Tesla Motors, Inc.’s Generic & Intensive Growth Strategies (An
Analysis). Panmore Institute.
Saif, N.M.A. (2015). How does Marketing Strategy Influence Firm Performance?
Implementation of Marketing Strategy for Firm Success. International Journal of
Innovation and Economic Development, 1(3), 7-15.
68
Samaroo, M. (2013). Past, Present and Future: The evolution of technology. Florida:
Discover Tec.
Samuels, P.S. (2013). Gun making and the origins of the Industrial Revolution. The
Clayman Institute for Gender Research. California: Stanford University.
Saunder et al. (2007). Business Research Methods. Fourth Harlow, England, FT Prentice
Hall, Pearson Education.
Spring Singapore (2017). Innovation in Education: The Handbook for Education
Innovators. Singapore: Spring.
Srivastava, M., Franklin A., & Martinette, L. (2013). Building a sustainable competitive
advantage. Journal of Technology, Management and Innovation, 8(2), 47-59.
Statista (2017). Mercedes-Benz Cars: revenue from FY 2011 to FY 2016. Boston: The
Statistics Portal.
Sumer, K. (2012). Business Strategies and Gaps in Porter’s Typology: A Literature
Review. Journal of Management Research. 4(3), 100-119.
Taber, K.S. (2017). The Use of Cronbach’s Alpha When Developing and Reporting
Research Instruments in Science Education. Cambridge: Springer.
Tanwar, R. (2013). Porter’s generic competitive strategies. International Journal of
Business and Management,15(1), 11-17.
Teich, S.T. & Faddoul, F. F. (2013). Lean Management: The Journey from Toyota to
Healthcare. Rambam Maimonides Medical Journal. London: National Institute of
Health.
The Economist (2015). Low-cost Private Schools: Learning Unleashed. London: The
Economist Group.
The Organization for Economic Cooperation and Development (2015). Household net
adjusted disposable income ranking. Better Life Index. Paris: OECD.
Thomasson, M. & Wallin, J. (2013). Cost of poor Quality: Definition and development of a
process based framework. Sweden: Chalmers University of Technology.
69
United Nations Statistics Division (2016). Kenya Age Structure. United Nations
Urde, M. (2013). The Corporate Brand Identity Matrix. Journal of Brand Management.
20(9), 742-761.
Vaughan, J. (2013). Technological Innovations: Perceptions and Definitions. Library
Technology Reports. 49 (7).
Wagner, E. (2013). 3 Ways to Sustain a Competitive Advantage with a Focus Strategy.
Portland: I7 Marketing.
Waiyaki, L. A. (2014). Strategic responses adopted by non-governmental organizations
dealing with HIV/aids to environmental influences in Kenya (Doctoral dissertation,
University of Nairobi).
Wawira, M. & Ochieng, A. (2017) Low Cost Private Schools: School Choice for the Poor
at the Expense of Quality? Nairobi: East Africa Centre for Human Rights.
Wilkinson, J. (2013). Cost Driver. Texas: The Strategic CFO.
Wilson, J.M. (2014). Henry Ford vs. assembly line balancing. International Journal of
Production Research. 52 (3), 757-765.
Whitehurst, G.J. (2014). Education Choice and Competition Index 2015: Summary and
Commentary. Washington: Brookings Institute.
World Intellectual Property Report (2013). Brands – Reputation and Image in the Global
Marketplace. Geneva: World Intellectual Property Organization.
Young, J. (2017). Unilever’s Generic Strategy & Intensive Growth Strategies. Panmore
Institute.
Yang, Z. (2013). Analysis on Product Differentiation Strategy and Product Innovation of
Travel Agency in China. Proceedings of the 7th International Conference on Innovation
& Management.
Yasar, M. (2010). The Performance Implications of Fit among Business Strategy,
Marketing Organization Structure, and Strategic Behaviour. Journal of Marketing,
69(3), 49-65.
70
Zehira, C., Canb, E. & Karabogac, T. (2015). Linking entrepreneurial orientation to firm
performance: the role of differentiation strategy and innovation performance. Procedia -
Social and Behavioral Sciences, 210, 358 – 367.
Zizlavsky, O. (2014). The Balanced Scorecard: Innovative Performance Measurement and
Management Control System. Journal of Technology, Management & Innovation. 9(3)
210-222.
71
APPENDICES
APPENDIX I: LETTER OF INTRODUCTION
Wendy Masale
P.O. BOX 52429-00100
Nairobi, Kenya
Email: [email protected]
28th February 2018
Dear Respondent,
RE: REQUEST FOR PARTICIPATION IN RESEARCH WORK
I am a graduate student at the United States International University – Africa pursuing a
Master’s degree in Business Administration (MBA) with a concentration in Strategic
Management. I am conducting a research on the “Effects of Competitive strategies on the
Organizational Performance of Bridge International Academies in Nairobi” and need the
views of management and teaching staff at the academies.
For this purpose, I require your assistance in getting responses for the attached
questionnaire. Please note that all the information provided will be treated with
confidentiality and for the purposes of this research only.
Please feel free to contact the undersigned should you require any clarification.
Thank you for your co-operation.
Yours faithfully,
Wendy Masale
Student ID: 600664
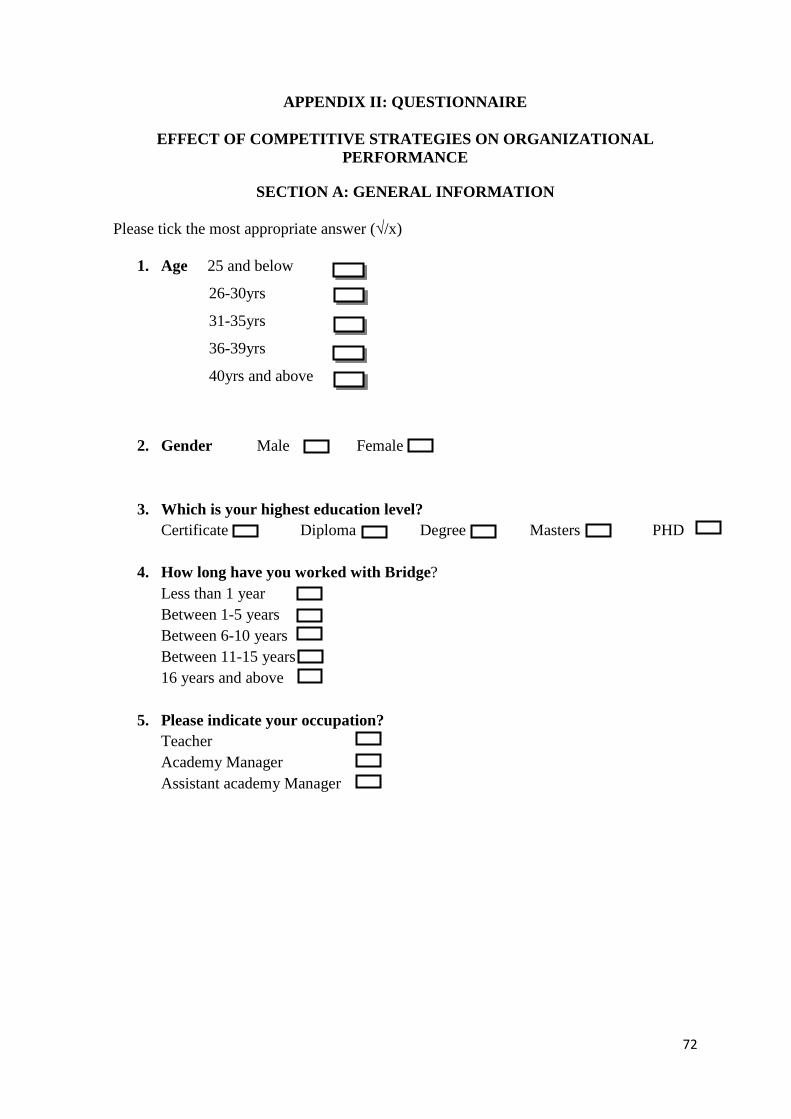
72
APPENDIX II: QUESTIONNAIRE
EFFECT OF COMPETITIVE STRATEGIES ON ORGANIZATIONAL PERFORMANCE
SECTION A: GENERAL INFORMATION
Please tick the most appropriate answer (√/x)
1. Age 25 and below
26-30yrs
31-35yrs
36-39yrs
40yrs and above
2. Gender Male Female
3. Which is your highest education level? Certificate Diploma Degree Masters PHD
4. How long have you worked with Bridge? Less than 1 year Between 1-5 years Between 6-10 years Between 11-15 years 16 years and above
5. Please indicate your occupation? Teacher Academy Manager Assistant academy Manager
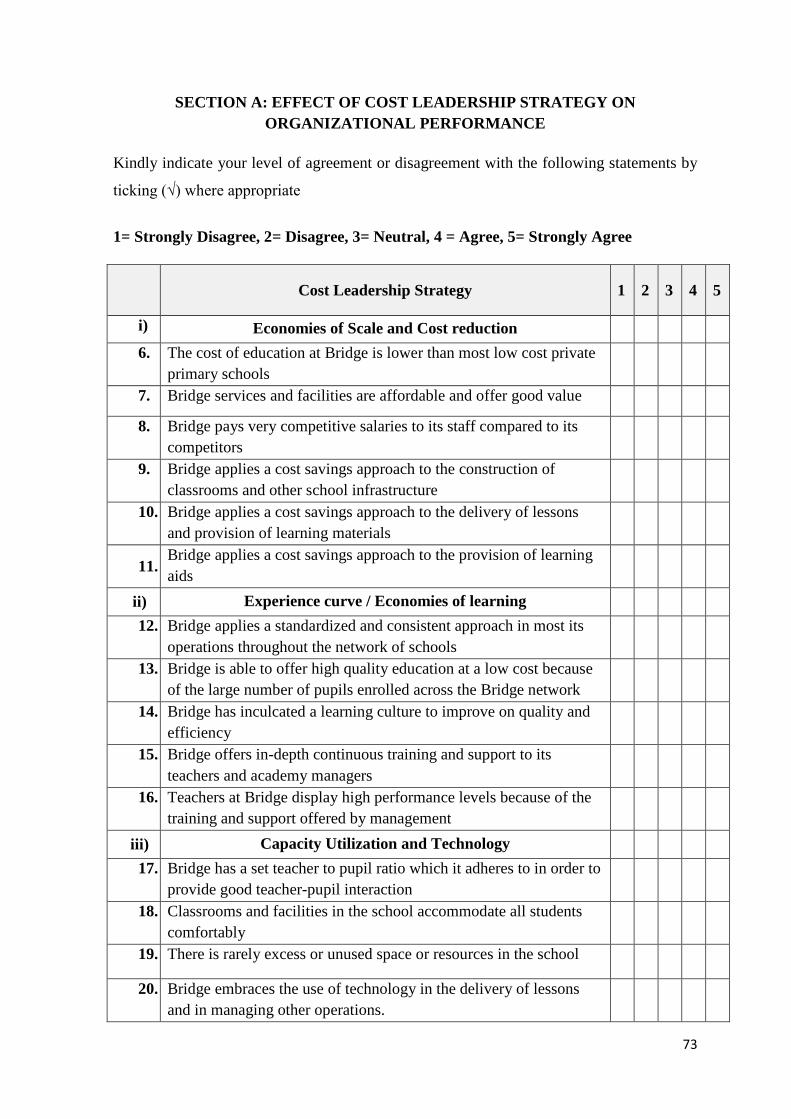
73
SECTION A: EFFECT OF COST LEADERSHIP STRATEGY ON ORGANIZATIONAL PERFORMANCE
Kindly indicate your level of agreement or disagreement with the following statements by
ticking (√) where appropriate
1= Strongly Disagree, 2= Disagree, 3= Neutral, 4 = Agree, 5= Strongly Agree
Cost Leadership Strategy 1 2 3 4 5
i) Economies of Scale and Cost reduction
6. The cost of education at Bridge is lower than most low cost private primary schools
7. Bridge services and facilities are affordable and offer good value
8. Bridge pays very competitive salaries to its staff compared to its competitors
9. Bridge applies a cost savings approach to the construction of classrooms and other school infrastructure
10. Bridge applies a cost savings approach to the delivery of lessons and provision of learning materials
11. Bridge applies a cost savings approach to the provision of learning aids
ii) Experience curve / Economies of learning 12. Bridge applies a standardized and consistent approach in most its
operations throughout the network of schools
13. Bridge is able to offer high quality education at a low cost because of the large number of pupils enrolled across the Bridge network
14. Bridge has inculcated a learning culture to improve on quality and efficiency
15. Bridge offers in-depth continuous training and support to its teachers and academy managers
16. Teachers at Bridge display high performance levels because of the training and support offered by management
iii) Capacity Utilization and Technology 17. Bridge has a set teacher to pupil ratio which it adheres to in order to
provide good teacher-pupil interaction
18. Classrooms and facilities in the school accommodate all students comfortably
19. There is rarely excess or unused space or resources in the school
20. Bridge embraces the use of technology in the delivery of lessons and in managing other operations.
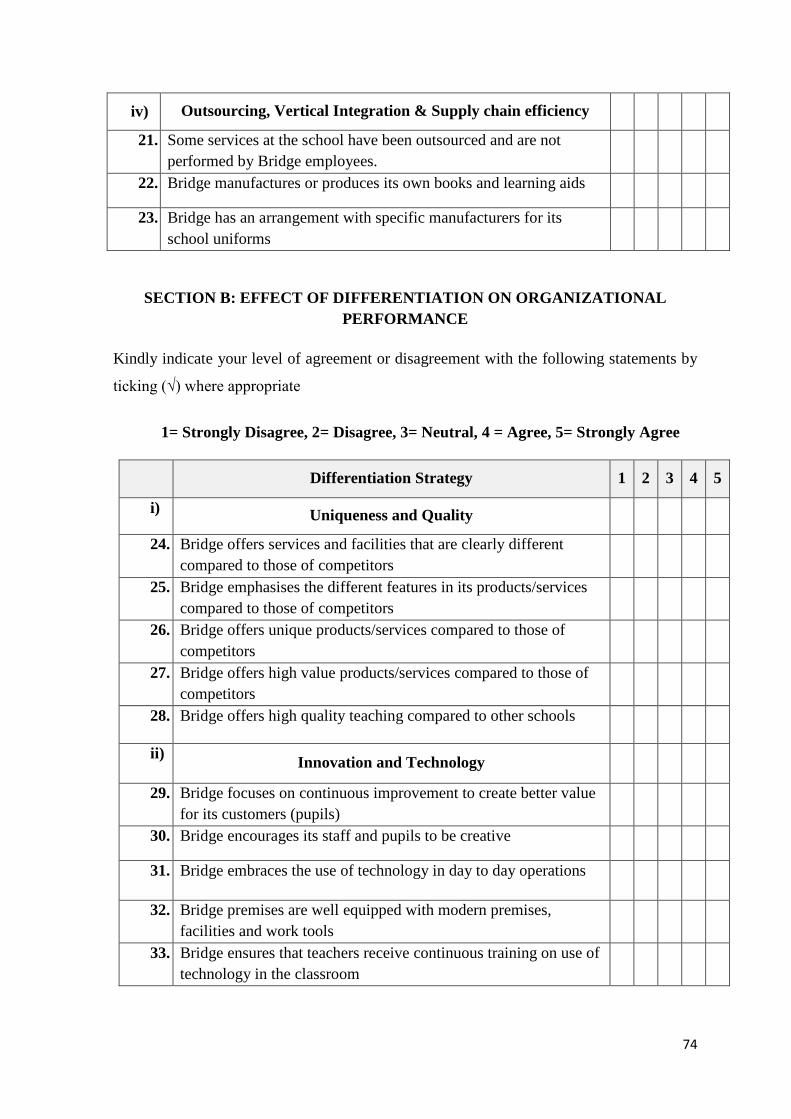
74
iv) Outsourcing, Vertical Integration & Supply chain efficiency
21. Some services at the school have been outsourced and are not performed by Bridge employees.
22. Bridge manufactures or produces its own books and learning aids
23. Bridge has an arrangement with specific manufacturers for its school uniforms
SECTION B: EFFECT OF DIFFERENTIATION ON ORGANIZATIONAL PERFORMANCE
Kindly indicate your level of agreement or disagreement with the following statements by
ticking (√) where appropriate
1= Strongly Disagree, 2= Disagree, 3= Neutral, 4 = Agree, 5= Strongly Agree
Differentiation Strategy 1 2 3 4 5
i) Uniqueness and Quality
24. Bridge offers services and facilities that are clearly different compared to those of competitors
25. Bridge emphasises the different features in its products/services compared to those of competitors
26. Bridge offers unique products/services compared to those of competitors
27. Bridge offers high value products/services compared to those of competitors
28. Bridge offers high quality teaching compared to other schools
ii) Innovation and Technology
29. Bridge focuses on continuous improvement to create better value for its customers (pupils)
30. Bridge encourages its staff and pupils to be creative
31. Bridge embraces the use of technology in day to day operations
32. Bridge premises are well equipped with modern premises, facilities and work tools
33. Bridge ensures that teachers receive continuous training on use of technology in the classroom
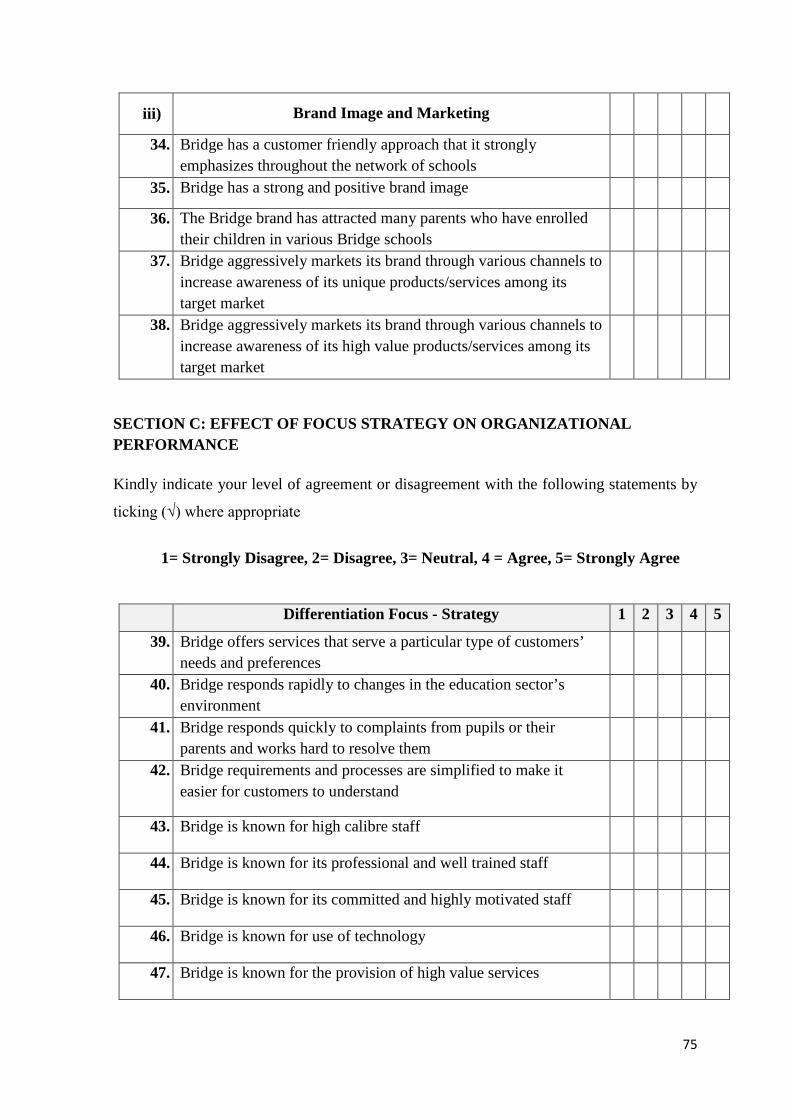
75
iii) Brand Image and Marketing
34. Bridge has a customer friendly approach that it strongly emphasizes throughout the network of schools
35. Bridge has a strong and positive brand image
36. The Bridge brand has attracted many parents who have enrolled their children in various Bridge schools
37. Bridge aggressively markets its brand through various channels to increase awareness of its unique products/services among its target market
38. Bridge aggressively markets its brand through various channels to increase awareness of its high value products/services among its target market
SECTION C: EFFECT OF FOCUS STRATEGY ON ORGANIZATIONAL PERFORMANCE
Kindly indicate your level of agreement or disagreement with the following statements by
ticking (√) where appropriate
1= Strongly Disagree, 2= Disagree, 3= Neutral, 4 = Agree, 5= Strongly Agree
Differentiation Focus - Strategy 1 2 3 4 5
39. Bridge offers services that serve a particular type of customers’ needs and preferences
40. Bridge responds rapidly to changes in the education sector’s environment
41. Bridge responds quickly to complaints from pupils or their parents and works hard to resolve them
42. Bridge requirements and processes are simplified to make it easier for customers to understand
43. Bridge is known for high calibre staff
44. Bridge is known for its professional and well trained staff
45. Bridge is known for its committed and highly motivated staff
46. Bridge is known for use of technology
47. Bridge is known for the provision of high value services
76
Cost Focus –Strategy 1 2 3 4 5
48. Bridge offers low cost tuition options to specific customers who are in the low income bracket.
49. Bridge is able to attract more customers by charging pocket-friendly fees.
50. Bridge is able to attract more customers by offering manageable payment plans to parents and guardians
51. Bridge is able to offer fair prices by minimizing its costs.
52. Bridge is able to offer fair prices by providing better quality education.
53. Bridge is well known in the market because of its affordable school fee compared to those of competitors also offering private education.
54. Bridge exploits the use of technology to keep operation costs down and to improve on quality.
SECTION D: FINANCIAL PERSPECTIVE OF ORGANIZATIONAL PERFORMANCE
Kindly indicate your level of agreement or disagreement with the following statements by
ticking (√) where appropriate
1= Strongly Disagree, 2= Disagree, 3= Neutral, 4 = Agree, 5= Strongly Agree
Financial Indicators 2015 2016 2017 1 Annual Profit: Bridge posted an increase in Annual
Profit this year
2 Return on Assets: Bridge efficiently used its assets this year to generate profit
3 Return on Equity: Investors received good return for their financial investment this year
In your opinion, which among the three competitive strategies listed below do you think is mostly utilized by Bridge?
a) Cost leadership strategy b) Differentiation Strategy c) Focus strategy
Thank you for taking time to answer this questionnaire.