Effect of Casting Position on Mechanical Performance of Ultra ...
10
Citation: Zhao, S.; Bo, Y. Effect of Casting Position on Mechanical Performance of Ultra-High Performance Concrete. Materials 2022, 15, 404. https://doi.org/10.3390/ ma15020404 Academic Editor: Doo-Yeol Yoo Received: 28 November 2021 Accepted: 2 January 2022 Published: 6 January 2022 Publisher’s Note: MDPI stays neutral with regard to jurisdictional claims in published maps and institutional affil- iations. Copyright: © 2022 by the authors. Licensee MDPI, Basel, Switzerland. This article is an open access article distributed under the terms and conditions of the Creative Commons Attribution (CC BY) license (https:// creativecommons.org/licenses/by/ 4.0/). materials Article Effect of Casting Position on Mechanical Performance of Ultra-High Performance Concrete Sujing Zhao * and Yiheng Bo College of Mechanics and Materials, Hohai University, Nanjing 211106, China; [email protected] * Correspondence: [email protected] Abstract: The mechanical performance of ultra-high performance concrete (UHPC) is a function of fiber distribution and orientation, which are affected by the processing of the fresh material. In this study, the influences of two casting positions (mid-cast and end-cast) on strength and fracture properties of UHPCs with different fiber types and fiber contents were investigated. The results show that mid-cast specimens have higher flexural strength and fracture properties than end-cast specimens, while the compressive strength is almost unaffected by casting position. Compared to specimens with straight fibers, the flexural strength of specimens with hooked-end fibers is more likely to be affected by casting position. The residual load-to-peak load ratio is independent of casting position but affected by fiber type and fiber content. Keywords: UHPC; casting; strength; fracture property 1. Introduction Ultra-high performance concrete (UHPC) is a kind of advanced cementitious material with enhanced packing density, which is produced through improved homogenization, low water/binder ratio (w/b), and use of reactive powders [1]. With the combination of micro steel fibers, the material exhibits outstanding performance in terms of strength, toughness, ultimate strain, and durability [2]. Over the last twenty years, UHPC has been increasingly used in areas such as structural segments, bridge decks, pipes, cladding panels, rehabilitation, and wear protection [3–7]. Compared with conventional fiber reinforced concrete, UHPC is characterized by strain-hardening or deflection-hardening behavior after matrix cracking [8,9]. This superior post-cracking performance is derived from the stress transfer provided by microfibers bridging at the crack surface. The load-bearing capacity of the bridging fibers is governed by the property of fibers, matrix formulation, and fiber–matrix interactions, as well as the distribution and orientation of fibers [10–12]. For structural applications, the influence of fiber distribution and orientation on mechanical performance must be considered because variations in fiber distribution and orientation could lead to significant differences in mechanical properties within the large sections and thus cause structural instability [13]. Many researchers have revealed that fiber distribution and orientation can be affected by the rheology of the fresh mix, the methods of mixing used, casting, vibrating, and the geometry and dimensions of the mold, etc. Zhou and Uchida found that the flowability of UHPC dictates fiber orientation in areas close to the formwork surface and that with the increase of flowability fibers are prone to be oriented parallel to the longitudinal direction of slabs [14]. Barnett et al. investigated the influence of three different casting methods (concrete poured at the center of the panel, poured at several points around the perimeter of the panel, and poured randomly) on the fiber orientation and flexural strength of UHPC round panels, and the results indicated that the fiber tended to align perpendicularly to the direction of flow and that panels poured from the center showed much higher strength than panels poured by the other two methods [15]. Similar results were obtained by Zhou and Materials 2022, 15, 404. https://doi.org/10.3390/ma15020404 https://www.mdpi.com/journal/materials
-
Upload
khangminh22 -
Category
Documents
-
view
0 -
download
0
Transcript of Effect of Casting Position on Mechanical Performance of Ultra ...
�����������������
Citation: Zhao, S.; Bo, Y. Effect of
Casting Position on Mechanical
Performance of Ultra-High
Performance Concrete. Materials 2022,
15, 404. https://doi.org/10.3390/
ma15020404
Academic Editor: Doo-Yeol Yoo
Received: 28 November 2021
Accepted: 2 January 2022
Published: 6 January 2022
Publisher’s Note: MDPI stays neutral
with regard to jurisdictional claims in
published maps and institutional affil-
iations.
Copyright: © 2022 by the authors.
Licensee MDPI, Basel, Switzerland.
This article is an open access article
distributed under the terms and
conditions of the Creative Commons
Attribution (CC BY) license (https://
creativecommons.org/licenses/by/
4.0/).
materials
Article
Effect of Casting Position on Mechanical Performance ofUltra-High Performance ConcreteSujing Zhao * and Yiheng Bo
College of Mechanics and Materials, Hohai University, Nanjing 211106, China; [email protected]* Correspondence: [email protected]
Abstract: The mechanical performance of ultra-high performance concrete (UHPC) is a functionof fiber distribution and orientation, which are affected by the processing of the fresh material. Inthis study, the influences of two casting positions (mid-cast and end-cast) on strength and fractureproperties of UHPCs with different fiber types and fiber contents were investigated. The resultsshow that mid-cast specimens have higher flexural strength and fracture properties than end-castspecimens, while the compressive strength is almost unaffected by casting position. Compared tospecimens with straight fibers, the flexural strength of specimens with hooked-end fibers is morelikely to be affected by casting position. The residual load-to-peak load ratio is independent of castingposition but affected by fiber type and fiber content.
Keywords: UHPC; casting; strength; fracture property
1. Introduction
Ultra-high performance concrete (UHPC) is a kind of advanced cementitious materialwith enhanced packing density, which is produced through improved homogenization,low water/binder ratio (w/b), and use of reactive powders [1]. With the combinationof micro steel fibers, the material exhibits outstanding performance in terms of strength,toughness, ultimate strain, and durability [2]. Over the last twenty years, UHPC has beenincreasingly used in areas such as structural segments, bridge decks, pipes, cladding panels,rehabilitation, and wear protection [3–7].
Compared with conventional fiber reinforced concrete, UHPC is characterized bystrain-hardening or deflection-hardening behavior after matrix cracking [8,9]. This superiorpost-cracking performance is derived from the stress transfer provided by microfibersbridging at the crack surface. The load-bearing capacity of the bridging fibers is governedby the property of fibers, matrix formulation, and fiber–matrix interactions, as well as thedistribution and orientation of fibers [10–12]. For structural applications, the influence offiber distribution and orientation on mechanical performance must be considered becausevariations in fiber distribution and orientation could lead to significant differences inmechanical properties within the large sections and thus cause structural instability [13].
Many researchers have revealed that fiber distribution and orientation can be affectedby the rheology of the fresh mix, the methods of mixing used, casting, vibrating, and thegeometry and dimensions of the mold, etc. Zhou and Uchida found that the flowability ofUHPC dictates fiber orientation in areas close to the formwork surface and that with theincrease of flowability fibers are prone to be oriented parallel to the longitudinal directionof slabs [14]. Barnett et al. investigated the influence of three different casting methods(concrete poured at the center of the panel, poured at several points around the perimeterof the panel, and poured randomly) on the fiber orientation and flexural strength of UHPCround panels, and the results indicated that the fiber tended to align perpendicularly to thedirection of flow and that panels poured from the center showed much higher strength thanpanels poured by the other two methods [15]. Similar results were obtained by Zhou and
Materials 2022, 15, 404. https://doi.org/10.3390/ma15020404 https://www.mdpi.com/journal/materials

Materials 2022, 15, 404 2 of 10
Uchida, who reported that for a circular panel cast from the center fibers tend to orientatein concentric circles within the panel [16]. Another study adopted two different castingmethods to induce a random fiber distribution and a preferred fiber distribution along theflow direction, and the results showed that the obtained tensile strength of the latter wastwice that of the former [17]. In addition, Huang reported that, due to geometrical restrainteffects on fiber rotation, better fiber orientation and higher flexural performance can beobtained near formwork boundaries [18,19].
Therefore, the manufacturing process can significantly influence fiber distributionand orientation in the fresh material and thus affect mechanical performance. In thisrespect, previous studies have mainly focused on strength properties and there are fewstudies that have reported effects on other mechanical behaviors, such as toughness andfracture properties. Moreover, there is a lack of research concerning the effect of fiber typeon mechanical behavior when different manufacturing processes are involved. In thisresearch, UHPC specimens were prepared using two different casting methods, i.e., middlecasting (mid-cast) and end casting (end-cast), and the influence of casting position on themechanical properties of UHPC with different fiber types and contents was investigated.The research is expected to reveal the importance of casting to material properties and toprovide some insights into specimen preparation and testing.
2. Materials and Methods2.1. Raw Materials and Mix Proportion
Portland cement with a type of P•II 52.5 (Conch, Wuhu, China) in accordance withChinese Standard GB 175–2020 [20] and silica fume (Elkem, Shanghai, China) were used ascementitious materials. The physical and chemical properties of the two reactive powdersare given in Table 1. Natural river sand (Yangtze River, Nanjing, China) with an air-dryapparent density of 2.65 g/cm3 and fineness modulus of 2.3 was used as aggregate, andthe mixing water was tape water (Nanjing, China). In order to make the material workableat low water/binder ratio (w/b), a polycarboxylate-based superplasticizer (PCA-I, Sobute,Nanjing, China) was admixed. Moreover, micro steel fibers were added to improve thestrength and toughness of the material. Three types of brass-coated steel fibers, i.e., shortstraight fibers (WSF0108, Daye, Ganzhou, China), long straight fibers (WSF0213, Daye,Ganzhou, China), and hooked-end fibers (GSF0325, Daye, Ganzhou, China), were used inthis study and their dimensions are given in Table 2.
Table 1. Physical properties and chemical composition of cement and silica fume.
Property Cement Silica Fume
Specific surface area, m2/kg 362 22,200Specific gravity 3.1 2.26
SiO2, % 21.35 91.2Al2O3, % 4.67 2.22Fe2O3, % 3.31 0.88CaO, % 62.6 1.2MgO, % 3.08 1.25SO3, % 2.25 0.64
Na2O, % 0.54 -K2O, % 0.21 -LOI, % 1.45 2.14
Table 2. Dimensions of three types of steel fibers.
Type Diameter (mm) Length (mm) Aspect Ratio
Short straight 0.1 8 80Long straight 0.2 13 65Hooked-end 0.34 21 -
Materials 2022, 15, 404 3 of 10
The mix proportion of the UHPC is given in Table 3. A relatively low aggregate-to-binder ratio and a high dose of superplasticizer were adopted to make the UHPC exhibitself-consolidating properties, so that with a fixed casting position the fresh mix could flowinto every corner of the mold effortlessly. The volume fraction of steel fibers in UHPCwas 1% or 1.5%. Five UHPC mixes, which have the same matrix but different fibers, weredesigned in this study. Based on fiber type and fiber content, the five mixes were denotedby S1, S1.5, L1, L1.5, and H1.5, where S, L, and H are the initials of the three types of fiber,and the Arabic number indicates the fiber volume content in the mix.
Table 3. Mix proportion of ultra-high performance concrete (UHPC).
Components of Binder (%) Aggregate-to-BinderRatio
w/b Superplasticizer (% Solidby Weight of Binder)
Fiber (% byVolume)Cement Silica Fume
88 12 1 0.2 0.9 1, 1.5
2.2. Specimen Preparation and Curing
The raw materials were mixed using a mortar mixer (UJZ-15, Lanbiao, Cangzhou,China) with a capacity of 0.015 m3. The cement, silica fume, and sand were first dry-mixedfor 3 min to homogenize the material. Then, water and superplasticizer were graduallyadded before the fresh material was mixed for 5 min. Finally, fibers were spread into theflowable mixture followed by mixing for 2 min to disperse the fibers in the material.
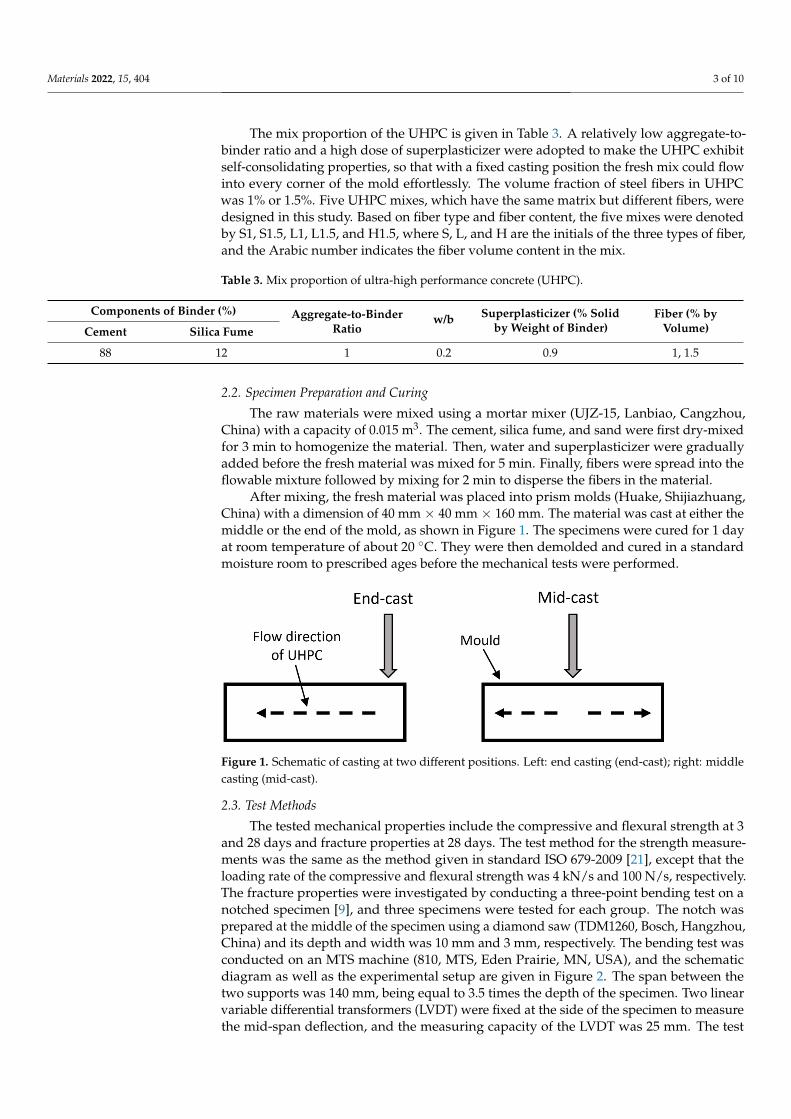
After mixing, the fresh material was placed into prism molds (Huake, Shijiazhuang,China) with a dimension of 40 mm × 40 mm × 160 mm. The material was cast at either themiddle or the end of the mold, as shown in Figure 1. The specimens were cured for 1 dayat room temperature of about 20 ◦C. They were then demolded and cured in a standardmoisture room to prescribed ages before the mechanical tests were performed.
Materials 2022, 15, x FOR PEER REVIEW 3 of 10
Table 2. Dimensions of three types of steel fibers.
Type Diameter (mm) Length (mm) Aspect Ratio Short straight 0.1 8 80 Long straight 0.2 13 65 Hooked-end 0.34 21 -
The mix proportion of the UHPC is given in Table 3. A relatively low aggregate-to-binder ratio and a high dose of superplasticizer were adopted to make the UHPC exhibit self-consolidating properties, so that with a fixed casting position the fresh mix could flow into every corner of the mold effortlessly. The volume fraction of steel fibers in UHPC was 1% or 1.5%. Five UHPC mixes, which have the same matrix but different fibers, were de-signed in this study. Based on fiber type and fiber content, the five mixes were denoted by S1, S1.5, L1, L1.5, and H1.5, where S, L, and H are the initials of the three types of fiber, and the Arabic number indicates the fiber volume content in the mix.
Table 3. Mix proportion of ultra-high performance concrete (UHPC).
Components of Binder (%) Aggregate-to-
Binder Ratio w/b Superplasticizer (% Solid
by Weight of Binder) Fiber (% by
Volume) Cement Silica Fume
88 12 1 0.2 0.9 1, 1.5
2.2. Specimen Preparation and Curing The raw materials were mixed using a mortar mixer (UJZ-15, Lanbiao, Cangzhou,
China) with a capacity of 0.015 m3. The cement, silica fume, and sand were first dry-mixed for 3 min to homogenize the material. Then, water and superplasticizer were gradually added before the fresh material was mixed for 5 min. Finally, fibers were spread into the flowable mixture followed by mixing for 2 min to disperse the fibers in the material.
After mixing, the fresh material was placed into prism molds (Huake, Shijiazhuang, China) with a dimension of 40 mm × 40 mm × 160 mm. The material was cast at either the middle or the end of the mold, as shown in Figure 1. The specimens were cured for 1 day at room temperature of about 20 °C. They were then demolded and cured in a standard moisture room to prescribed ages before the mechanical tests were performed.
Figure 1. Schematic of casting at two different positions. Left: end casting (end-cast); right: middle casting (mid-cast).
2.3. Test Methods The tested mechanical properties include the compressive and flexural strength at 3
and 28 days and fracture properties at 28 days. The test method for the strength measure-ments was the same as the method given in standard ISO 679-2009 [21], except that the loading rate of the compressive and flexural strength was 4 kN/s and 100 N/s, respectively. The fracture properties were investigated by conducting a three-point bending test on a
Figure 1. Schematic of casting at two different positions. Left: end casting (end-cast); right: middlecasting (mid-cast).
2.3. Test Methods
The tested mechanical properties include the compressive and flexural strength at 3and 28 days and fracture properties at 28 days. The test method for the strength measure-ments was the same as the method given in standard ISO 679-2009 [21], except that theloading rate of the compressive and flexural strength was 4 kN/s and 100 N/s, respectively.The fracture properties were investigated by conducting a three-point bending test on anotched specimen [9], and three specimens were tested for each group. The notch wasprepared at the middle of the specimen using a diamond saw (TDM1260, Bosch, Hangzhou,China) and its depth and width was 10 mm and 3 mm, respectively. The bending test wasconducted on an MTS machine (810, MTS, Eden Prairie, MN, USA), and the schematicdiagram as well as the experimental setup are given in Figure 2. The span between thetwo supports was 140 mm, being equal to 3.5 times the depth of the specimen. Two linearvariable differential transformers (LVDT) were fixed at the side of the specimen to measurethe mid-span deflection, and the measuring capacity of the LVDT was 25 mm. The test

Materials 2022, 15, 404 4 of 10
was controlled by actuator displacement. The displacement rate was initially 0.5 mm/minuntil a displacement of 0.5 mm and then was doubled to 1 mm/min for 1 min, followedby 2 mm/min for 1 min, and finally was increased to 5 mm/min for 3 min before the testwas ended. Load and deflection data were recorded throughout the loading process andfracture properties, such as peak load, residual load as well as fracture energy, could beanalyzed based on the acquired load–deflection (P–δ) curves. The fracture energy GF wasdetermined according to RILEM TC 50-FMC [22] using the following formula:
GF = (W0 + mgδ0)/Alig (1)
where W0 is the area enclosed by the P–δ curve, m is the mass of the specimen between thetwo roller supports, δ0 is the deflection at the failure of the specimen, and Alig is the area ofthe initial ligament. In this study, the value of δ0 is set as 15 mm and the value of Alig is1200 mm2.
Materials 2022, 15, x FOR PEER REVIEW 4 of 10
notched specimen [9], and three specimens were tested for each group. The notch was prepared at the middle of the specimen using a diamond saw (TDM1260, Bosch, Hang-zhou, China) and its depth and width was 10 mm and 3 mm, respectively. The bending test was conducted on an MTS machine (810, MTS, Eden Prairie, MN, USA), and the sche-matic diagram as well as the experimental setup are given in Figure 2. The span between the two supports was 140 mm, being equal to 3.5 times the depth of the specimen. Two linear variable differential transformers (LVDT) were fixed at the side of the specimen to measure the mid-span deflection, and the measuring capacity of the LVDT was 25 mm. The test was controlled by actuator displacement. The displacement rate was initially 0.5 mm/min until a displacement of 0.5 mm and then was doubled to 1 mm/min for 1 min, followed by 2 mm/min for 1 min, and finally was increased to 5 mm/min for 3 min before the test was ended. Load and deflection data were recorded throughout the loading pro-cess and fracture properties, such as peak load, residual load as well as fracture energy, could be analyzed based on the acquired load–deflection (P–δ) curves. The fracture energy GF was determined according to RILEM TC 50-FMC [22] using the following formula: 𝐺 = (𝑊 +𝑚𝑔𝛿 )/𝐴 (1)
where W0 is the area enclosed by the P–δ curve, m is the mass of the specimen between the two roller supports, δ0 is the deflection at the failure of the specimen, and Alig is the area of the initial ligament. In this study, the value of δ0 is set as 15 mm and the value of Alig is 1200 mm2.
(a)
(b)
Figure 2. Schematic (a) and experimental setup (b) of the three-point bending test. Figure 2. Schematic (a) and experimental setup (b) of the three-point bending test.
3. Results and Discussion3.1. Flexural Strength
The flexural strengths of all the mixes with two different casting positions are given inFigure 3a,b. It can be readily observed that flexural strength increases with fiber content.As the fiber content increases from 1% to 1.5%, the strength gain of the mid-cast specimensis about 15% while that of the end-cast specimens shows great variation, ranging from 4%

Materials 2022, 15, 404 5 of 10
to 34%. The flexural strength at 3 days is about 90% of that at 28 days, which indicatesthe formation of a strong fiber–matrix bond at the early age. In addition, specimens withshort straight fibers have higher flexural strength than those with long straight fibers orhooked-end fibers.
Materials 2022, 15, x FOR PEER REVIEW 5 of 10
3. Results and Discussion 3.1. Flexural Strength
The flexural strengths of all the mixes with two different casting positions are given in Figure 3a,b. It can be readily observed that flexural strength increases with fiber con-tent. As the fiber content increases from 1% to 1.5%, the strength gain of the mid-cast specimens is about 15% while that of the end-cast specimens shows great variation, rang-ing from 4% to 34%. The flexural strength at 3 days is about 90% of that at 28 days, which indicates the formation of a strong fiber–matrix bond at the early age. In addition, speci-mens with short straight fibers have higher flexural strength than those with long straight fibers or hooked-end fibers.
(a) (b)
(c) (d)
Figure 3. Flexural and compressive strengths of ultra-high performance concrete (UHPC) with two different casting positions: (a) flexural strength at 3 days, (b) flexural strength at 28 days, (c) com-pressive strength at 3 days, (d) compressive strength at 28 days.
In Figure 3a,b, it can be seen that the mid-cast specimens show higher flexural strength than their end-cast counterparts. This is mainly because during casting the fibers move more slowly than the mortar and thus, in mid-cast mode, fibers tend to aggregate at the middle of the mold, which leads to an enhanced load-bearing capacity in the flexural test. Compared to specimens with straight fibers, the flexural strength of specimens with hooked-end fibers is more likely to be affected by the casting position. At 28 days, the flexural strengths of S1.5 and L1.5 with end casting are 90% and 86% of their mid-cast counterparts, respectively, while the ratio is merely 73% for H1.5. This could be attributed to the relatively large dimension and irregular shape of the hooked-end fibers, which might encounter more resistance during migration, resulting in a big difference in fiber content at the middle of the specimen using the two casting methods. Moreover, it can be
Figure 3. Flexural and compressive strengths of ultra-high performance concrete (UHPC) withtwo different casting positions: (a) flexural strength at 3 days, (b) flexural strength at 28 days,(c) compressive strength at 3 days, (d) compressive strength at 28 days.
In Figure 3a,b, it can be seen that the mid-cast specimens show higher flexural strengththan their end-cast counterparts. This is mainly because during casting the fibers movemore slowly than the mortar and thus, in mid-cast mode, fibers tend to aggregate at themiddle of the mold, which leads to an enhanced load-bearing capacity in the flexuraltest. Compared to specimens with straight fibers, the flexural strength of specimens withhooked-end fibers is more likely to be affected by the casting position. At 28 days, theflexural strengths of S1.5 and L1.5 with end casting are 90% and 86% of their mid-castcounterparts, respectively, while the ratio is merely 73% for H1.5. This could be attributedto the relatively large dimension and irregular shape of the hooked-end fibers, which mightencounter more resistance during migration, resulting in a big difference in fiber content atthe middle of the specimen using the two casting methods. Moreover, it can be seen thatthe influence of casting position on flexural strength is affected by fiber content. With theincrease of fibers in the material, the flexural strength of specimens with short straight fibersbecome less affected by the casting position while that of specimens with long straightfibers shows an opposite trend.

Materials 2022, 15, 404 6 of 10
3.2. Compressive Strength
The compressive strengths of all the mixes with two different casting positions aregiven in Figure 3c,d. The compressive strength increases with fiber content, and the strengthgain is quite different for different samples. For mid-cast specimens, with an increase infiber content from 1% to 1.5%, the strength gain is about 10% at 3 days and varies from 5%to 20% at 28 days; for end-cast specimens, the strength gain with an increase of fiber variesfrom 3% to 11% at 3 days, and from 5% to 13% at 28 days. Compared to flexural strength,the strength gain of compressive strength is generally less significant when fiber contentincreases from 1% to 1.5%. Like the trend observed in flexural strength, the compressivestrengths of specimens with short straight fibers are higher than those with the other twofibers. In addition, the compressive strength at 3 days is about 70–80% of that at 28 days,which is lower than the ratio for flexural strength. This is because flexural strength is mainlyrelated to the strength of the fiber and the mechanical bond between the fiber and the matrix,while the compressive strength is mainly governed by the strength of the matrix, whichdevelops with age as the internal pores are progressively filled by hydration products.
Though most mid-cast samples show slightly higher strength than their end-cast coun-terparts, the influence of casting position on compressive strength is much less significantthan that on flexural strength. At 3 days, the strength difference owing to the differentcasting position is within 5% for all the mixes, and at 28 days the difference is below8% except for H1.5. Therefore, it can be concluded that casting position has a negligibleinfluence on compressive strength regardless of fiber type and fiber content.
3.3. Fracture Properties
The P–δ curves of four groups of UHPCs with fiber contents of 1.5% are presentedin Figure 4, and all the curves show deflection-hardening behavior. For the first threegroups, which are mid-cast samples, the P–δ curves were almost superposed on eachother, indicating that in the middle cast mode, the fracture property is quite similar amongdifferent replicates. The softening curves of UHPCs with straight fibers are relativelysmooth, while those with hooked-end fibers show sporadic jags. This could be because, asfibers are pulled out progressively, the bearing capacity of the specimen experiences a sharpdrop when the anchoring effects of the bridging hooked-end fibers disappear. Comparingthe right two graphs in Figure 4, i.e., the P–δ curves of L1.5 with different casting methods,it can be observed that the peak loads of the end-cast samples are scattered to some extent,thus leading to large divergences in the curves. This could be attributed to discrepancies infiber orientation and distribution at the middle of the specimen among different replicates.
The representative P–δ curves of all the mixes with two different casting positions aregiven in Figure 5, and the peak loads of all the samples are presented in Figure 6. Similar tothe results for flexural strength, specimens with short straight fibers have higher peak loadsthan those with long straight fibers. However, the latter exhibit higher toughness, whichcan be characterized by the area under the P–δ curve, than the former. This is ‘sbecausethe densely distributed short fibers can arrest and delay the formation and coalescence ofmicro-cracks, which leads to a higher peak load, while the long fibers are more effective inpreventing the propagation of macro-cracks and thus contribute to a higher toughness [23].Compared to specimens with straight fibers, the samples with hooked-end fibers showlower mechanical performance, which is inconsistent with the results in the literature [24,25].This might indicate that in this work the hooked-end fibers have a poor orientation anddistribution at the middle of the specimen, and thus the enhancing effects of the fibers arenot well developed.

Materials 2022, 15, 404 7 of 10Materials 2022, 15, x FOR PEER REVIEW 7 of 10
Figure 4. Load–deflection curves of four groups of UHPCs.
(a) (b)
Figure 5. Representative load–deflection curves of all UHPCs with two different casting positions: (a) mid-cast, (b) end-cast.
Figure 6. Peak loads of all the UHPCs with two different casting positions.
The residual loads at δ = 3 mm of all the mixes with two different casting positions are presented in Figure 7. Compared with Figures 3 and 6, it can be seen that the influences
Figure 4. Load–deflection curves of four groups of UHPCs.
Materials 2022, 15, x FOR PEER REVIEW 7 of 10
Figure 4. Load–deflection curves of four groups of UHPCs.
(a) (b)
Figure 5. Representative load–deflection curves of all UHPCs with two different casting positions: (a) mid-cast, (b) end-cast.
Figure 6. Peak loads of all the UHPCs with two different casting positions.
The residual loads at δ = 3 mm of all the mixes with two different casting positions are presented in Figure 7. Compared with Figures 3 and 6, it can be seen that the influences
Figure 5. Representative load–deflection curves of all UHPCs with two different casting positions:(a) mid-cast, (b) end-cast.
Materials 2022, 15, x FOR PEER REVIEW 7 of 10
Figure 4. Load–deflection curves of four groups of UHPCs.
(a) (b)
Figure 5. Representative load–deflection curves of all UHPCs with two different casting positions: (a) mid-cast, (b) end-cast.
Figure 6. Peak loads of all the UHPCs with two different casting positions.
The residual loads at δ = 3 mm of all the mixes with two different casting positions are presented in Figure 7. Compared with Figures 3 and 6, it can be seen that the influences
Figure 6. Peak loads of all the UHPCs with two different casting positions.

Materials 2022, 15, 404 8 of 10
The residual loads at δ = 3 mm of all the mixes with two different casting positions arepresented in Figure 7. Compared with Figures 3 and 6, it can be seen that the influencesof casting position on peak load and residual load are similar to that on flexural strength.Mid-cast specimens generally have higher peak loads and residual loads than their end-castcounterparts. For mix H1.5, the influence of casting position on the two loads is much lesssignificant than that on flexural strength, which again indicates that the distribution ofhooked-end fibers varies considerably between different replicates. Moreover, the residual-to-peak load ratio (R/P) can be used to evaluate the post-cracking load-bearing capacity ofa structural member. For each mix, the R/P values are close independent of the two castingpositions. The R/P value is affected by fiber type, with higher values for long straightfiber reinforced specimens, medium values for short straight fiber reinforced specimens,and lower values for hooked-end fiber reinforced specimens. In addition, the R/P valuedecreases as fiber content increases. Therefore, among the five mixes, L1 shows the highestR/P value of about 0.7, and H1.5 gives the lowest R/P value of about 0.48.
Materials 2022, 15, x FOR PEER REVIEW 8 of 10
of casting position on peak load and residual load are similar to that on flexural strength. Mid-cast specimens generally have higher peak loads and residual loads than their end-cast counterparts. For mix H1.5, the influence of casting position on the two loads is much less significant than that on flexural strength, which again indicates that the distribution of hooked-end fibers varies considerably between different replicates. Moreover, the re-sidual-to-peak load ratio (R/P) can be used to evaluate the post-cracking load-bearing ca-pacity of a structural member. For each mix, the R/P values are close independent of the two casting positions. The R/P value is affected by fiber type, with higher values for long straight fiber reinforced specimens, medium values for short straight fiber reinforced specimens, and lower values for hooked-end fiber reinforced specimens. In addition, the R/P value decreases as fiber content increases. Therefore, among the five mixes, L1 shows the highest R/P value of about 0.7, and H1.5 gives the lowest R/P value of about 0.48.
Figure 7. Residual loads of all UHPCs with two different casting positions.
Figure 8 presents the fracture energies of all the UHPCs with two different casting positions. It can be observed that the basic shape and trend of the bar graph are almost the same as those shown in Figure 7, which implies that the residual load could be used as a simplified toughness index. With the increase of fiber content from 1% to 1.5%, the fracture energy of UHPC is increased by about 20%. The fracture energy of specimens with long straight fibers is higher than that with the other two fibers, and even L1 shows higher fracture energy than S1.5 and H1.5. Compared with end casting, the fracture en-ergy is increased under middle casting. The increase rate is 12% and 20% for short straight and long straight fiber reinforced specimens, respectively, and merely 4% for specimens with hooked-end fibers. In addition, the fracture energy of end-cast samples is generally more scattered than that of mid-cast ones.
Figure 8. Fracture energies of all UHPCs with two different casting positions.
Figure 7. Residual loads of all UHPCs with two different casting positions.
Figure 8 presents the fracture energies of all the UHPCs with two different castingpositions. It can be observed that the basic shape and trend of the bar graph are almostthe same as those shown in Figure 7, which implies that the residual load could be usedas a simplified toughness index. With the increase of fiber content from 1% to 1.5%, thefracture energy of UHPC is increased by about 20%. The fracture energy of specimens withlong straight fibers is higher than that with the other two fibers, and even L1 shows higherfracture energy than S1.5 and H1.5. Compared with end casting, the fracture energy isincreased under middle casting. The increase rate is 12% and 20% for short straight andlong straight fiber reinforced specimens, respectively, and merely 4% for specimens withhooked-end fibers. In addition, the fracture energy of end-cast samples is generally morescattered than that of mid-cast ones.
Materials 2022, 15, x FOR PEER REVIEW 8 of 10
of casting position on peak load and residual load are similar to that on flexural strength. Mid-cast specimens generally have higher peak loads and residual loads than their end-cast counterparts. For mix H1.5, the influence of casting position on the two loads is much less significant than that on flexural strength, which again indicates that the distribution of hooked-end fibers varies considerably between different replicates. Moreover, the re-sidual-to-peak load ratio (R/P) can be used to evaluate the post-cracking load-bearing ca-pacity of a structural member. For each mix, the R/P values are close independent of the two casting positions. The R/P value is affected by fiber type, with higher values for long straight fiber reinforced specimens, medium values for short straight fiber reinforced specimens, and lower values for hooked-end fiber reinforced specimens. In addition, the R/P value decreases as fiber content increases. Therefore, among the five mixes, L1 shows the highest R/P value of about 0.7, and H1.5 gives the lowest R/P value of about 0.48.
Figure 7. Residual loads of all UHPCs with two different casting positions.
Figure 8 presents the fracture energies of all the UHPCs with two different casting positions. It can be observed that the basic shape and trend of the bar graph are almost the same as those shown in Figure 7, which implies that the residual load could be used as a simplified toughness index. With the increase of fiber content from 1% to 1.5%, the fracture energy of UHPC is increased by about 20%. The fracture energy of specimens with long straight fibers is higher than that with the other two fibers, and even L1 shows higher fracture energy than S1.5 and H1.5. Compared with end casting, the fracture en-ergy is increased under middle casting. The increase rate is 12% and 20% for short straight and long straight fiber reinforced specimens, respectively, and merely 4% for specimens with hooked-end fibers. In addition, the fracture energy of end-cast samples is generally more scattered than that of mid-cast ones.
Figure 8. Fracture energies of all UHPCs with two different casting positions. Figure 8. Fracture energies of all UHPCs with two different casting positions.
Materials 2022, 15, 404 9 of 10
4. Conclusions
This study investigated the influence of casting position on strength and fractureproperties of UHPC with different fiber types and fiber contents. It was found that mid-castspecimens generally show higher flexural strength and fracture properties than end-castspecimens, and that the flexural strength of specimens with hooked-end fibers is morelikely to be affected by the casting position. The findings confirm the significance of castingon the mechanical properties of UHPCs, and it is recommended that in order to achieveconsistent and reliable experimental results or high-quality industrial products, materialmanufacturing details, such as casting position, should be seriously taken into account.
Author Contributions: Conceptualization, S.Z.; methodology, S.Z.; formal analysis, S.Z. and Y.B.; in-vestigation, S.Z. and Y.B.; resources, S.Z. and Y.B.; data curation, S.Z. and Y.B.; writing—original draftpreparation, S.Z.; writing—review and editing, S.Z.; supervision, S.Z.; project administration, S.Z.;funding acquisition, S.Z. All authors have read and agreed to the published version of the manuscript.
Funding: This research was funded by the National Natural Science Foundation of China (grant no.51908190), the Natural Science Foundation of Jiangsu Province, China (grant no. BK20170881), andthe Open Research Fund of Jiangsu Key Laboratory of Construction Materials (grant no. CM2018-09).
Data Availability Statement: The data used to support the findings of this study are available fromthe corresponding author (Zhao. S) upon request.
Acknowledgments: The authors would like to thank Sobute New Materials Co., Ltd. for providingsuperplasticizer for the experimental work.
Conflicts of Interest: The authors declare no conflict of interest.
References1. Richard, P.; Cheyrezy, M. Composition of reactive powder concretes. Cem. Concr. Res. 1995, 25, 1501–1511. [CrossRef]2. Wang, D.; Shi, C.; Wu, Z.; Xiao, J.; Huang, Z.; Fang, Z. A review on ultra high performance concrete: Part II. Hydration,
microstructure and properties. Constr. Build. Mater. 2015, 96, 368–377. [CrossRef]3. Guerrini, G.L. Applications of High-Performance Fiber-Reinforced Cement-Based Composites. Appl. Compos. Mater. 2000, 7,
195–207. [CrossRef]4. Yoo, D.-Y.; Yoon, Y.-S. A Review on Structural Behavior, Design, and Application of Ultra-High-Performance Fiber-Reinforced
Concrete. Int. J. Concr. Struct. Mater. 2016, 10, 125–142. [CrossRef]5. Wang, J.; Liu, J.; Wang, Z.; Liu, T.; Liu, J.; Zhang, J. Cost-Effective UHPC for accelerated bridge construction: Material properties,
structural elements, and structural applications. J. Bridge Eng. 2021, 26, 04020117. [CrossRef]6. Semendary, A.A.; Hamid, W.K.; Steinberg, E.P.; Khoury, I. Shear friction performance between high strength concrete (HSC) and
ultra high performance concrete (UHPC) for bridge connection applications. Eng. Struct. 2020, 205, 110122. [CrossRef]7. Li, J.; Wang, X.; Chen, D.; Wu, D.; Han, Z.; Hou, D.; Zhen, Z.; Peng, C.; Ding, Q.; Yin, B. Design and application of UHPC with
high abrasion resistance. Constr. Build. Mater. 2021, 309, 125141. [CrossRef]8. Brandt, A.M. Fibre reinforced cement-based (FRC) composites after over 40 years of development in building and civil engineering.
Compos. Struct. 2008, 86, 3–9. [CrossRef]9. Zhao, S.; Jiang, L.; Chu, H. A preliminary investigation of energy consumption in fracture of ultra-high performance concrete.
Constr. Build. Mater. 2020, 237, 117634. [CrossRef]10. Yoo, D.Y.; Banthia, N. Mechanical properties of ultra-high-performance fiber-reinforced concrete: A review. Cem. Concr. Compos.
2016, 73, 267–280. [CrossRef]11. Mudadu, A.; Tiberti, G.; Germano, F.; Plizzari, G.A.; Morbi, A. The effect of fiber orientation on the post-cracking behavior of
steel fiber reinforced concrete under bending and uniaxial tensile tests. Cem. Concr. Compos. 2018, 93, 274–288. [CrossRef]12. Abrishambaf, A.; Pimentel, M.; Nunes, S. Influence of fibre orientation on the tensile behaviour of ultra-high performance fibre
reinforced cementitious composites. Cem. Concr. Res. 2017, 97, 28–40. [CrossRef]13. Kang, S.-T.; Kim, J.-K. Numerical simulation of the variation of fiber orientation distribution during flow molding of ultra high
performance cementitious composites (UHPCC). Cem. Concr. Compos. 2012, 34, 208–217. [CrossRef]14. Zhou, B.; Uchida, Y. Influence of flowability, casting time and formwork geometry on fiber orientation and mechanical properties
of UHPFRC. Cem. Concr. Res. 2017, 95, 164–177. [CrossRef]15. Barnett, S.J.; Lataste, J.-F.; Parry, T.; Millard, S.G.; Soutsos, M.N. Assessment of fibre orientation in ultra high performance fibre
reinforced concrete and its effect on flexural strength. Mater. Struct. 2010, 43, 1009–1023. [CrossRef]16. Zhou, B.; Uchida, Y. Relationship between fiber orientation/distribution and post-cracking flexural strength in ultra-high-
performance fiber-reinforced concrete (UHPFRC). Cem. Concr. Compos. 2017, 83, 66–75. [CrossRef]

Materials 2022, 15, 404 10 of 10
17. Choi, M.S.; Kang, S.-T.; Lee, B.Y.; Koh, K.-T.; Ryu, G.-S. Improvement in predicting the post-cracking tensile behavior of ultra-highperformance cementitious composites based on fiber orientation distribution. Materials 2016, 9, 829. [CrossRef]
18. Huang, H.; Gao, X.; Li, L.; Wang, H. Improvement effect of steel fiber orientation control on mechanical performance of UHPC.Constr. Build. Mater. 2018, 188, 709–721. [CrossRef]
19. Huang, H.; Su, A.; Gao, X.; Yang, Y. Influence of formwork wall effect on fiber orientation of UHPC with two casting methods.Constr. Build. Mater. 2019, 215, 310–320. [CrossRef]
20. GB 175-2020; Common Portland Cement. Chinese National Standards: Beijing, China, 2020. (In Chinese)21. ISO 679-2009; Cement—Test Methods—Determination of Strength. International Organization for Standardization: London,
UK, 2009.22. Rilem TC162-TDF. Test and design methods for steel fibre reinforced concrete: Bending test. Mater. Struct. 2000, 33, 3–5. [CrossRef]23. Banthia, N.; Sappakittipakorn, M. Toughness enhancement in steel fiber reinforced concrete through fiber hybridization. Cem.
Concr. Res. 2007, 37, 1366–1372. [CrossRef]24. Wille, K.; Kim, D.J.; Naaman, A.E. Strain-hardening UHP FRC with low fiber contents. Mater. Struct. 2011, 44, 583–598. [CrossRef]25. Wille, K.; El-Tawil, S.; Naaman, A. Properties of strain hardening ultra high performance fiber reinforced concrete (UHP-FRC)
under direct tensile loading. Cem. Concr. Compos. 2014, 48, 53–66. [CrossRef]