Classification of Eyelid Position and Eyeball Movement Using Eeg Signals

Epilepsia, **(*):1–9, 2008doi: 10.1111/j.1528-1167.2008.01724.x
FULL-LENGTH ORIGINAL RESEARCH
EEG-fMRI study of the ictal and interictal epilepticactivity in patients with eyelid myoclonia with absences
∗Yonghong Liu, ∗Tianhua Yang, †Wei Liao, ∗Xuhong Yang, ∗Iing Liu, ∗Bo Yan,†Huafu Chen, ‡Qiyong Gong, §Hermann Stefan, and ∗Dong Zhou
∗Department of Neurology, West China Hospital, Si Chuan University, Cheng du, Sichuan, P. R. China; †Schoolof Life Science and Technology School of Mathematics, University of Electronic Science and Technology of China,
Chengdu, Sichuan, P. R. China; ‡Huaxi MR Research Center (HMRRC), Department of Radiology, West ChinaHospital of Sichuan University, P. R. China; and §Department of Neurology, Center of Epilepsy (ZEE),
University of Erlangen-Nuremberg, Erlangen, Germany
SUMMARYPurpose: To investigate the blood oxygenationlevel-dependent (BOLD) signal changes correlatedwith ictal and interictal epileptic discharges us-ing electroencephalography-correlated functionalmagnetic resonance imaging (EEG-fMRI) in pa-tients with eyelid myoclonia with absences (EMA)and then to explore the pathophysiological mech-anisms of epileptic discharges and their effect onbrain function.Methods: Four patients with EMA were investi-gated through the method of EEG-fMRI. The char-acteristics of BOLD signal changes linked to ictaland interictal epileptic discharges under differentstates of consciousness were explored.Results: Seven sessions of EEG-fMRI scanning in thefour patients were obtained. The main regions ofactivation included thalamus, mesial frontal cor-tex, middle parietal lobe, temporal lobe, insula,
midline structures, and cerebellum. Deactivationswere mainly in the anterior frontal lobe, posteriorparietal lobe, and posterior cingulate gyrus. Thala-mic BOLD change was predominantly activation inmost of our cases. The distribution of activation as-sociated with ictal epileptic discharges was wider,and the distribution of deactivation was closer topericortex compared with the BOLD change linkedwith interictal epileptic discharges.Conclusions: The activation in the thalamus maybe associated with generalized spike wave in EMA;the combination of different patterns of activationwith consistent pattern of deactivations (“default”pattern) in patients with EMA may prognosticatedifferent states of consciousness in response to ictaland interictal epileptic discharges.KEY WORDS: EEG-fMRI, Interictal period, Ictalperiod, BOLD, EMA.
Eyelid myoclonia with absences (EMA) is a uniquetype of epileptic seizure. The syndrome of EMA was firstdescribed by Jeavons in 1977 (Jeavons, 1977) and hassince been confirmed by other investigators (Duncan &Panayiotopoulos, 1996; Kent et al., 1998; Incorpora et al.,2002; Striano et al., 2002). This form of epilepsy ischaracterized by eyelid myoclonia with and without ab-
Accepted May 26, 2008; Online Early publication xxxxxx xxxxxx.
Address correspondence to Dong Zhou, Department of Neurology,West China Hospital, Si Chuan University, 610041 Chengdu, Sichuan,P. R. China. E-mail: [email protected]
Yonghong Liu and Tianhua Yang contributed equally to this work.
Wiley Periodicals, Inc.C© 2008 International League Against Epilepsy
sences, eye closure-induced seizures, electroencephalog-raphy (EEG) paroxysms, and photosensitivity. It oftenpresents with unique clinical and EEG features, and usuallyoccurs with genetic clustering. This syndrome is consid-ered to be among idiopathic generalized epilepsies (IGEs),but the underlying physiology of it is unknown (Appletonet al., 1993). The characteristic EEG of EMA in interic-tal and ictal periods is rapid, generalized, often irregularspike-waves and polyspike-waves that belong to general-ized spike wave (GSW) disorders (Commission on Clas-sification and Terminology of the International LeagueAgainst Epilepsy, 1989). The pathophysiological mecha-nisms of GSW remain controversial, and the focus of pre-vious work has mainly been on where the epileptogeniczone is and whether the subcortical structures are involved
1

2
Y. Liu et al.
(Gloor, 1968; Marcus et al., 1968; Avoli et al., 2001;Blumenfeld, 2003; Timofeev & Steriade, 2004). The re-cently developed technique of EEG-correlated functionalmagnetic resonance imaging (EEG-fMRI) can obtain bothelectrophysiologic and metabolic information and can thenbe used to explore the pathophysiological mechanismsof epileptic discharges and improve the diagnosis for anepileptogenic focus. A study of blood oxygenation level-dependent (BOLD)-associated neuronal activity in patientswith EMA by EEG-fMRI has not been reported. This studyaimed to investigate the BOLD signal changes correlatedwith epileptic discharges using EEG-fMRI in patients withEMA. The BOLD signal changes were examined underdifferent states of consciousness, and the epileptogeniczone of EMA was localized.
MATERIALS AND METHODS
Patients
Inclusion criteria for the diagnosis of EMA were ac-cording to Panayiotopoulos and included eyelid myocloniaand brief absences, which were related to EEG generalizedparoxysmal activity and were triggered by eye closure orby intermittent photo stimulation (IPS) (Panayiotopoulos,2005). The study was conducted in four patients with EMA(2 males, 2 females, mean age 10.25, mean onset age8.5, range 8–9) recruited from the epilepsy clinics at theWest China Hospital for Neurology of Sichuan Universitybetween June 2005 and January 2007. All patients under-went routine clinical neuroimaging and 24-h video EEGmonitoring. No structural abnormalities were found dur-ing neuroimaging, including computed tomography (CT)and MRI, but frequent and stereotypical ictal and interic-tal epileptic discharges were confirmed. During the exper-imental sessions, patients were continuously monitored todetect seizure occurrence inside the scanner. In the EEG-fMRI scanning sessions of ictal activity, when patients pre-sented with clinical symptoms such as eyelid myoclonusand absence, motor activity did not induce image artifactsduring the seizure. Patients with mental disorder or cog-nitive handicaps were excluded. This study was approvedby a responsible governmental agency at the Sichuan Uni-versity. Informed consent for the study was obtained fromeach subject.
EEG acquisition
The EEG was recorded using a 10-20 system with21 Ag/AgCl electrodes soldered to 12 kV current-limitingresistors applied on the scalp with conductive cream. TheEEG device was an EBNeuro Mizar 40 (EBNeuro, Flo-rence, Italy) with 32 channels adapted for MR and a sam-pling rate of 4 kHz, which allowed suitable time resolutionfor detecting the switching effect of the readout gradientin the high slew rate condition. The EEG dynamic range
was ± 65.5 mV in order to prevent MRI artifact wave-forms from saturating the EEG/electrocardiogram (ECG).The amplifier was connected to the recording computeroutside the scanner room via a fiber-optic cable. The MRartifact was filtered online (Garreffa et al., 2003). The pulseartifact was minimized by using a locked arrangement ofparticular wires and an elastic cap. If no spikes were foundin one session, that run’s fMRI data was excluded in thefuture analysis.
fMRI acquisition
A 3.0 T GE MRI scanner (EXCITE, Milwaukee, WI,U.S.A.) was used to acquire BOLD sensitive echo-planarimages (EPI) with continuous, simultaneous EEG. Foampadding was used to help secure the EEG leads, minimizemotion, and improve patient comfort. At the same time, thepatient’s ears were packed with cotton balls and the patientassumed a resting state with their eyes closed. The gradi-ent echo EPI sequence’s parameters were as follows: 30slices, 200 volumes, TR = 2000 ms, TE = 40 ms, FOV =24 cm, matrix = 64 × 64, in-plane resolution = 2 × 2 mm,and a flip angle = 90◦. The structural image was also ac-quired during the interval of the first and second run (TR =8.5 ms, TE = 3.4 ms, FOV = 24 × 24 cm, flip angle =12◦, matrix = 512 × 512, 156 slices). BOLD fMRI datawere collected in successive runs of 6 min and 40 s. Addi-tional scanning sessions were acquired in the same patientif no spikes were recorded during the real-time EEG in onesession.
Data analysis
The data analysis proceeded in four steps. First, theexperimental data were analyzed using SPM2 software(http://www.fil.ion.ucl.ac.uk/spm) (Friston et al., 1994,1995). Spatial transformation and realignment were per-formed using a three-dimensional (3-D) rigid-body regis-tration to correct for head motion. Second, to increase anal-ysis efficiency, only signals in the brain were processed.Voxels with values lower than a certain threshold were re-garded as background. We set the threshold values empiri-cally to be one-tenth of the highest intensity in the inputimage. Third, a spatial smoothing filter was used foreach brain 3D volume by convolution with an isotropicGaussian kernel [full width at half maximum (FWHM) =8 mm for our data] to increase the MR signal-to-noiseratio. Fourth, we systematically removed noise from theconsidered data after eliminating background noise fromthe fMRI data. Linear trends were removed from thedata to eliminate the effect of gross signal drifts, whichcould be caused by scanner instabilities and/or gross phys-iological change in the subject. A high-pass filter witha cut-off of 128 s was used to remove low-frequencynoise.
The fMRI data were initially preprocessed according tothe steps mentioned above. According to the EEG records,
Epilepsia, **(*):1–9, 2008doi: 10.1111/j.1528-1167.2008.01724.x

3
EEG-fMRI Study in Patients with Eyelid Myoclonia with Absences
the time point at which epilepsy occurred was when thefirst spike-time signal was acquired. Then, EEG canoni-cal hemodynamic response function (HRF) was modeledby two γ -variant functions (Friston et al., 1998) convolvedwith the spike-time signal. Finally, the canonical HRF wasspecified as an interested regressor in the SPM design ma-trix. The other six regressors were derived from the six pa-rameters that were obtained by the rigid-body correctionof head motion. The specific activated areas were calcu-lated using the Student’s t-test statistic with five contigu-ous voxels above a t-value of 3.1 (uncorrected). The lowestthreshold (t > 3.1, p < 0.001) according to the Hull hypno-sis theory, must satisfy the statistical difference of approx-imately p < 0.05. Generally, during fMRI data processing,thresholds should be specified to exceed the statistical sig-nificance level of p < 0.05, thus it was specified as p <
0.001, whose corresponding t threshold value was t > 3.1,and the highest threshold that resulted in mean global max-imum activity was used (Chen et al., 2005). To remove theinfluence of noise, in general, a number of continuouslyactivated voxles were specified as the true activation vox-els by an evoked task, otherwise, they were not specifiedas true activation voxels, but considered as being evokedby noise. The number of continuous voxles was specifiedby experimentation and experience; here it is specified as5. Responses to positive t-values were labeled as activa-tions, and those with negative t-values were labeled as de-activations (Archer et al., 2003).
Figure 1.Examples of EEG for patient 2. The EEG is displayed as a unipolar montage showing runs of generalized systemic3–4 Hz rhythmic spikes-wave activity and polyspike-waves with a high amplitude after eyes blinking on the backgroundof predominantly α waves.Epilepsia C© ILAE
RESULTS
Clinical features
Four patients with EMA were recruited (2 males, 2 fe-males, mean age 10.25, mean onset age 8.5, range 8–9).The clinical manifestations were EMA or not, and oc-casional generalized tonic–clonic seizures (GTCS). Theseizures of the four patients occurred multiple timesper day. Before the study of EEG-fMRI, 24-h videoEEG was recorded. Interictal and ictal EEGs demon-strated rapid, generalized, and often irregular 2.5–6 Hzspike-waves and polyspike-waves (Fig. 1). Every patientwas administered intermittent medications, but the ef-fect was poor. Clinical details of patients were shown inTable 1.
EEG-fMRI
Seven sessions were produced in all during the EEG-fMRI scans. Among them, two sessions of BOLD changesassociated with ictal epileptic discharges were observed intwo patients (patients 1 and 2), who presented with repet-itive EMA during EEG-fMRI scans. The EEG recordingsof patients 1 and 2 exhibited frequent bursts of rapid, gen-eralized, 3–4 Hz spike-waves and polyspike-waves. Thesewave forms were always associated with unresponsivenessand not always recalled by the patient. Before, during, andafter EEG-fMRI scanning, patients 1 and 2 had frequentand repetitive seizures as described above. The mean num-ber of interictal GSW epochs was 19.4 (range, 4–35), and
Epilepsia, **(*):1–9, 2008doi: 10.1111/j.1528-1167.2008.01724.x

4
Y. Liu et al.
Table 1. Clinical details of patients studied based on ILAE diagnostic categories
Frequency of GSW (Hz) andaccompanied symptomsSeizure
Patient Age onset age Seizure type frequency Antiepileptic Frequency AccompaniedID no. (years) Sex (years) (age onset/years) drugs (Hz) symptoms
1 13 Male 8 Eyelid myoclonus accompanied with absenceor not, 5–8/d (8)
PB VPA 3–6 Eyelid myoclonus absence
2 13 Male 8 Eyelid myoclonus accompanied with absenceor not 5–8/d (8); GTCS 1/y (11)
PB VPA 3–6 Eyelid myoclonus absence
3 11 Female 9 Eyelid myoclonus accompanied with absenceor not 2–5/d (10)
VPA 3.5 Eyelid myoclonus absence
4 14 Female 9 Eyelid myoclonus accompanied with absenceor not 2–5/d (9)
TCM 2.5–4 Eyelid myoclonus absence
International League Against Epilepsy (ILAE) diagnostic categories show age and sex of the patients, seizure type and frequency,age of onset, medication at time of study, and frequency of GSW and accompanying symptoms.
GTCS, generalized tonic–clonic seizures; d, day; y, year; CBZ, carbamazepine; PB, phenobarbitone; VPA, sodium valproate;TCM, traditional Chinese medicine; GSW, generalized spike-wave.
the duration ranged from 0.7 to 4 s. The number of ic-tal GSW for patient 1 was nine, and for patient 2 waseight. The duration ranged from 3 to 5 s (details shown inTable 2).
BOLD change in response to epileptic discharges
The regions of BOLD signal changes (activation anddeactivation) linked to epileptic discharges were bilater-ally and symmetrically distributed over the cerebral hemi-spheres. BOLD signal changes were shown in the follow-ing sequence: parietal lobe (seven times), frontal cortex(six times), temporal lobe (six times), posterior cingulategyrus (seven times), occipital lobe (five times), cerebel-lum (five times), thalamus (five times), insula (two times),brain stem (two times), and basal ganglia (one time).The activation in the thalamus was positive in four ses-sions, and there was predominant biphasic activation in onesession.
Table 2. Summary of results for all sessions during which GSW activity occurred; detailing numberand duration of GSW epochs, and regions of significant BOLD signal change
Regions of significant BOLD signal change
ID Number Duration Posteriorno. of GSW of GSW (s) Thalamus Frontal Parietal Temporal Occipital cingulate Cerebellum Brain stem Insula
1 9 3–5 ↑ ↓↑ ↓m↑ ↑↓ ↓↑ ↓ ↓ ↓ ↑2a 8 3–6 ↑ ↓↑ ↓↑ ↑ ↑m ↑ ↑ — —2b 4 2–3 ↑L ↓ ↑ — ↑ ↑m ↑ — —2c 35 2–3 — ↓m ↓ ↓ — ↓ — — —3a 24 0.7–1.5 ↑↓ ↓↑ ↓ ↓↑ ↓ ↓ ↓ — —3b 25 0.7–1.5 ↓ ↓ ↓ ↓ ↓ ↓ ↓ ↓ ↓4 9 1–4 — — ↓ ↑↓ — ↓ — — —
Id no., identification number corresponding to that in Table 1. (a), (b), and (c) are given for those studied with three sessions.The BOLD changes of 1 and 2a were in response to ictal electroclinical activity. ↑, activation; ↓, deactivation; ↑↓, activationpredominantly; ↓↑, deactivation predominantly, —, no response, B, bilateral L, left; R, right; m, global maxima.
BOLD change in response to IEDsThe map of activation and deactivation in response to in-
terictal epileptic discharges (IEDs) possessed unique char-acteristics. Activation regions involved the entire brain, in-cluding the thalamus and brain stem with symmetrical andsubmedian distributions (seen in Figs. 2, 3, and 4). Themain regions of activation included the thalamus, mesialfrontal cortex, middle parietal lobe, temporal lobe, insula,midline structures, and cerebellum. However, the maxi-mum activation area was not fixed, two sessions demon-strated activation in occipital lobe, scattered in parietallobe, frontal cortex, or cingulate gyrus. Deactivations weremainly in the anterior frontal lobe, parietal area, and cingu-late gyrus where they were in close vicinity to the regionsof activation in the cortex. Deactivation was only relatedto IEDs in the second session of patient 3 and occurredsymmetrically and bilaterally in the temporal lobe, parietallobe, occipital lobe, posterior cingulate gyrus, and insula.
Epilepsia, **(*):1–9, 2008doi: 10.1111/j.1528-1167.2008.01724.x
5
EEG-fMRI Study in Patients with Eyelid Myoclonia with Absences
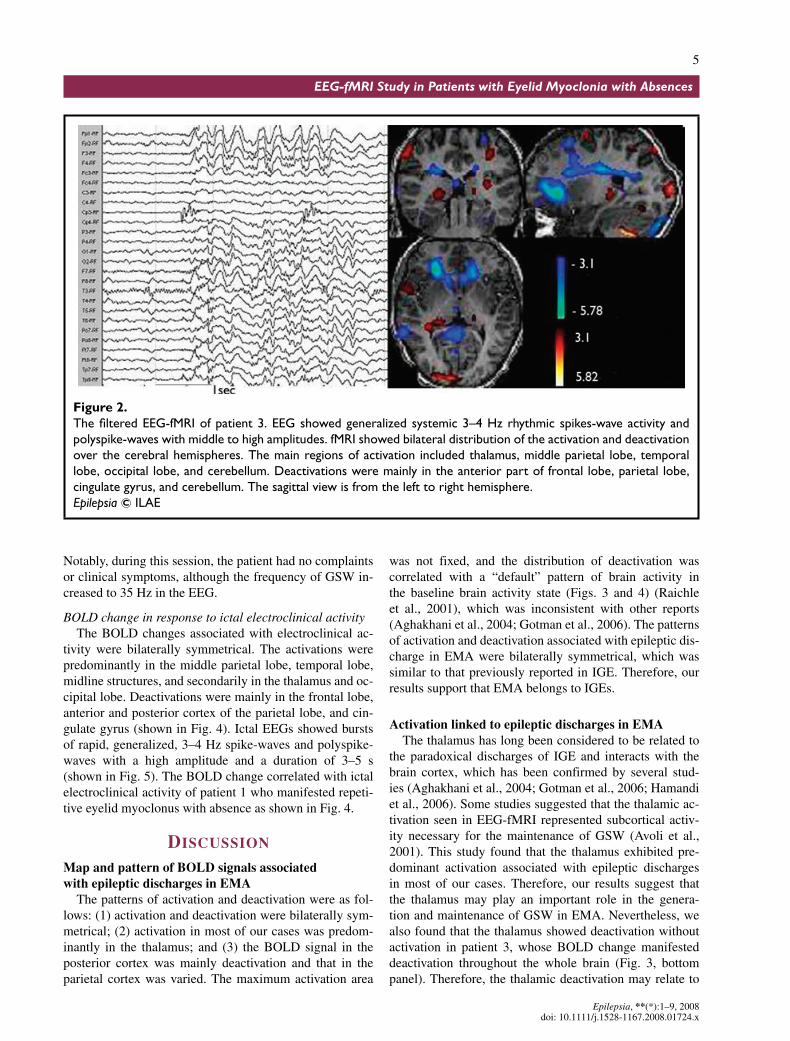
Figure 2.The filtered EEG-fMRI of patient 3. EEG showed generalized systemic 3–4 Hz rhythmic spikes-wave activity andpolyspike-waves with middle to high amplitudes. fMRI showed bilateral distribution of the activation and deactivationover the cerebral hemispheres. The main regions of activation included thalamus, middle parietal lobe, temporallobe, occipital lobe, and cerebellum. Deactivations were mainly in the anterior part of frontal lobe, parietal lobe,cingulate gyrus, and cerebellum. The sagittal view is from the left to right hemisphere.Epilepsia C© ILAE
Notably, during this session, the patient had no complaintsor clinical symptoms, although the frequency of GSW in-creased to 35 Hz in the EEG.
BOLD change in response to ictal electroclinical activityThe BOLD changes associated with electroclinical ac-
tivity were bilaterally symmetrical. The activations werepredominantly in the middle parietal lobe, temporal lobe,midline structures, and secondarily in the thalamus and oc-cipital lobe. Deactivations were mainly in the frontal lobe,anterior and posterior cortex of the parietal lobe, and cin-gulate gyrus (shown in Fig. 4). Ictal EEGs showed burstsof rapid, generalized, 3–4 Hz spike-waves and polyspike-waves with a high amplitude and a duration of 3–5 s(shown in Fig. 5). The BOLD change correlated with ictalelectroclinical activity of patient 1 who manifested repeti-tive eyelid myoclonus with absence as shown in Fig. 4.
DISCUSSION
Map and pattern of BOLD signals associated
with epileptic discharges in EMA
The patterns of activation and deactivation were as fol-lows: (1) activation and deactivation were bilaterally sym-metrical; (2) activation in most of our cases was predom-inantly in the thalamus; and (3) the BOLD signal in theposterior cortex was mainly deactivation and that in theparietal cortex was varied. The maximum activation area
was not fixed, and the distribution of deactivation wascorrelated with a “default” pattern of brain activity inthe baseline brain activity state (Figs. 3 and 4) (Raichleet al., 2001), which was inconsistent with other reports(Aghakhani et al., 2004; Gotman et al., 2006). The patternsof activation and deactivation associated with epileptic dis-charge in EMA were bilaterally symmetrical, which wassimilar to that previously reported in IGE. Therefore, ourresults support that EMA belongs to IGEs.
Activation linked to epileptic discharges in EMA
The thalamus has long been considered to be related tothe paradoxical discharges of IGE and interacts with thebrain cortex, which has been confirmed by several stud-ies (Aghakhani et al., 2004; Gotman et al., 2006; Hamandiet al., 2006). Some studies suggested that the thalamic ac-tivation seen in EEG-fMRI represented subcortical activ-ity necessary for the maintenance of GSW (Avoli et al.,2001). This study found that the thalamus exhibited pre-dominant activation associated with epileptic dischargesin most of our cases. Therefore, our results suggest thatthe thalamus may play an important role in the genera-tion and maintenance of GSW in EMA. Nevertheless, wealso found that the thalamus showed deactivation withoutactivation in patient 3, whose BOLD change manifesteddeactivation throughout the whole brain (Fig. 3, bottompanel). Therefore, the thalamic deactivation may relate to
Epilepsia, **(*):1–9, 2008doi: 10.1111/j.1528-1167.2008.01724.x

6
Y. Liu et al.
Figure 3.The BOLD signal of patient 3 dur-ing two EEG-fMRI scans. (Top panel)The first fMRI session showed thatthe main activation clusters were lo-cated bilaterally in the thalamus, peri-parietal lobe, occipital lobe, and pre-dominantly in the right frontal lobe.Bilateral deactivation clusters wereobserved in the anterior frontal cor-tex, middle parietal lobe, cingulategyrus, in addition to some in the tha-lamus. (Bottom panel) The secondsession of fMRI showed deactivationlocated bilaterally in the frontal cor-tex, parietal lobe, temporal lobe, oc-cipital lobe, thalamus, cingulate gyrus,cerebellum, and insula.Epilepsia C© ILAE
the whole brain deactivation; however, this response re-mains to be elucidated. In addition, activation was foundin the mesial midfrontal region concomitant with the bilat-eral insula and cerebellum in our patients with EMA. Themesial midfrontal region was associated with the propa-gation and generalization of epileptic discharges in focalepilepsy and IGE. In addition, the predominant activationin the frontal region was concordant with the frontocen-tral predominance of epileptic discharges seen in the EEG.The insula is a region of convergence of multisensory in-puts and has been shown to be pertinent to partial epilepsy(Isnard et al., 2004) rather than IGE; however, it is con-nected with the thalamus extensively, and this may con-tribute to the activation shown in the insula in our patients(Mesulam & Mufson, 1985). The activation in the cerebel-lum may be due to hyperperfusion in IGE (Bohnen et al.,1998). Previously, it was not recognized that cerebel-
lar neuronal activity contributes to spike-and-wave EEGpatterns, until it was found that the cerebellum was in-volved in the spike-and-wave discharges in an experimen-tal model (Kandel & Buzsaki, 1993). The presence of ac-tivation in the frontal cortex, temporal lobe, and parietallobe was correlated with the propagation of epileptic dis-charges between the lobes of the brain through callosalfibers.
Deactivation associated with epileptic discharges
in EMA and the default pattern of brain activity
Deactivations have been reported in areas directly or in-directly involved in stimulus processing or task completion(Born et al., 2002; Czisch et al., 2004), as well as task-independent stimulus processing (Raichle et al., 2001). De-activations in the bilateral posterior cingulate gyrus andparietooccipital areas superimposed with other signals in
Epilepsia, **(*):1–9, 2008doi: 10.1111/j.1528-1167.2008.01724.x

7
EEG-fMRI Study in Patients with Eyelid Myoclonia with Absences
Figure 4.The BOLD change of patient 1with myoclonia occurring during thescanning (R1 and R2 were the suc-cessive axial views). fMRI showedbilateral and symmetrical distribu-tion of the activation and deactiva-tion over the cerebral hemispheres.The main regions of activation in-cluded temporal lobe, middle pari-etal lobe, and midline structures,and secondarily in the thalamus andoccipital lobe. Deactivations weremainly in the anterior frontal lobe,parietal lobe, and cingulate gyrus.Epilepsia C© ILAE
our study were consistent with the default pattern of brainactivity. This phenomenon, related to GSW, has been re-ported in several previous reports (Archer et al., 2003;Aghakhani et al., 2004).
Deactivation in the default areas may relate to burstsof generalized epileptic discharges and represent the tem-porarily suspended normal brain function in the restingstate (Gotman et al., 2006; Kobayashi et al., 2006) and arenot necessarily indicative of the region responsible for thegeneration of the epileptic discharge (Aarts et al., 1984).Patients do not always manifest a clinical absence in everyburst of spike-and-wave activity in clinics, but responsive-ness is often impaired during such bursts (Gloor, 1986). Atthe same time, the level of cognitive impairment increaseswhen discharges become longer (McKiernan et al., 2003).Thus, this suspending of the default state combined withthe delay of sensory signal inputs and the degradation ofreactive potency resulting from the activation of thalamus,
middle frontal regions, and insula can explain the state ofaltered consciousness related to GSW.
BOLD change in response to ictal and interictal
epileptic discharges and conscious states
The BOLD change in response to IEDs was manifestedby two distinct patterns. One was shown in Fig. 3, toppanel, which was the most common type of BOLD in ourstudy. The other pattern was shown in Fig. 3, bottom panel.These two patterns occurred in different sessions in patient3 on the same day with no clinical manifestations. Whetherthe two patterns of BOLD change indicate the epilepticprocess or not remains to be determined. The ictal BOLDchanges during EMA were different from that observedin response to IEDs, as shown in Figs. 4 and 5. Duringthe EEG-fMRI sessions, these patients showed EMA. Theictal activation was different from the interictal activation,
Epilepsia, **(*):1–9, 2008doi: 10.1111/j.1528-1167.2008.01724.x

8
Y. Liu et al.
Figure 5.Ictal EEG of patient 1 with repetitive EMA. Ictal EEG after artifact removal showed bursts of rapid, generalized,3–4 Hz spike-waves and polyspike-waves with a high amplitude and a duration of 3–5 s.Epilepsia C© ILAE
which may be due to different types of seizure and statesof consciousness.
The distribution pattern of deactivations during ictal andinterictal epileptic discharges in our patients were similarand were consistent with the default pattern of brain func-tion (Mazoyer et al., 2001; Raichle et al., 2001). Neverthe-less, the distribution of activation showed no fixed pattern.According to the clinical manifestations of subjects duringthe EEG-fMRI scanning, we propose that consistent pat-terns of deactivation combined with different patterns ofactivation may prognosticate different types of consciousstates related to epileptic discharges. Other studies (Archeret al., 2003; Aghakhani et al., 2004; Laufs et al., 2006)also showed an alteration of activity in these regions duringGSW, which would be consistent with the clinical man-ifestation of absence seizures. Therefore, the BOLD sig-nals observed in this study (Figs. 3 and 4) may reflectdifferent states of consciousness, such as a mild cogni-tive handicap, staring, and absence associated with GSW.Nevertheless, this needs further study with larger samplesizes.
In conclusion, activation in the thalamus and cortexmay be associated with generalized spike-waves in EMA,while deactivation in the anterior frontal regions, parietallobe, and cingulate gyrus might be suspending the defaultstate induced by spike-wave and slow-wave complexes.The combination of consistent patterns of deactivation andvaried patterns of activation in patients with EMA mayprognosticate different types of states of consciousness inresponse to ictal and interictal epileptic discharges.
ACKNOWLEDGMENTS
We confirm that we have read the Journal’s position on issues involvedin ethical publication and affirm that this report is consistent with thoseguidelines.
Conflict of interest: The authors have no conflicts of interests to disclose.
REFERENCES
Aarts JH, Binnie CD, Smit AM, Wilkins AJ. (1984) Selective cognitiveimpairment during focal and generalized epileptiform EEG activity.Brain 107:293–308.
Aghakhani Y, Bagshaw AP, Benar CG, Hawco C, Andermann F, DubeauF, Gotman J. (2004) fMRI activation during spike and wave dis-charges in idiopathic generalized epilepsy. Brain 127:1127–1144.
Appleton RE, Panayiotopoulos CP, Acomb BA, Beirne M. (1993) Eye-lid myoclonia with typical absences: an epilepsy syndrome. J NeurolNeurosurg Psychiatry 56:1312–1316.
Archer JS, Abbott DF, Waites AB, Jackson GD. (2003) fMRI “deacti-vation” of the posterior cingulate during generalized spike and wave.NeuroImage 23:1915–1922.
Avoli M, Rogawski MA, Avanzini G. (2001) Generalized epileptic disor-ders: an update. Epilepsia 42:445–457.
Blumenfeld H. (2003) From molecules to networks: cortical/subcorticalinteractions in the pathophysiology of idiopathic generalized epilepsy.Epilepsia 44(Suppl 2):7–15.
Bohnen NI, O’Brien TJ, Mullan BP, So EL. (1998) Cerebellar changes inpartial seizures: clinical correlations of quantitative SPECT and MRIanalysis. Epilepsia 39:640–650.
Born AP, Law I, Lund TE, Rostrup E, Hanson LG, Wildschiodtz G, LouHC, Paulson OB. (2002) Cortical deactivation induced by visual stim-ulation in human slow-wave sleep. Neuroimage 17:1325–1335.
Chen H, Yao D, Chen W, Chen L. (2005) Delay correlation subspacedecomposition algorithm and its application in fMRI IEEE trans. MedImaging 24:1647–1650.
Commission on Classification and Terminology of the InternationalLeague Against Epilepsy (1989) Proposal for revised classificationof epilepsies and epileptic syndromes. Epilepsia 30:389–399.
Epilepsia, **(*):1–9, 2008doi: 10.1111/j.1528-1167.2008.01724.x
9
EEG-fMRI Study in Patients with Eyelid Myoclonia with Absences
Czisch M, Wehrle R, Kaufmann C, Wetter TC, Holsboer F, PollmacherT, Auer DP. (2004) Functional MRI during sleep: BOLD signaldecreases and their electrophysiological correlates. Eur J Neurosci20:566–574.
Duncan JS, Panayiotopoulos CP. (1996) Eyelid myoclonia with absences.John Libbey & Company Ltd, London.
Friston KJ, Jezzard P, Turner R. (1994) Analysis of functional MRI time-series. Hum Brain Mapp 1:153–171.
Friston KJ, Holmes AP, Poline JB, Grasby PJ, Williams SC, FrackowiakRS, Turner R. (1995) Analysis of fMRI time-series revisited. Neu-roImage 2:45–53.
Friston KJ, Fletcher P, Josephs O, Holmes A, Rugg MD, Turner R. (1998)Event-related fMRI: characterizing differential responses. Neuroim-age 7:30–40.
Garreffa G, Carnı M, Gualniera G, Ricci GB, Bozzao L, De Carli D,Morasso P, Pantano P, Colonnese C, Roma V, Maraviglia B. (2003)Real-time MR artifacts filtering during continuous EEG/fMRI acqui-sition. Magn Reson Imaging 21:1175–1189.
Gloor P. (1968) Generalized cortico-reticular epilepsies. Some consider-ations on the pathophysiology of generalized bilaterally synchronousspike and wave discharge. Epilepsia 9:249–263.
Gloor P. (1986) Consciousness as a neurological concept in epileptology:a critical review. Epilepsia 27:S14–S26.
Gotman J, Grova C, Bagshaw A, Kobayashi E, Aghakhani Y, Dubeau F.(2006) Generalized epileptic discharges show thalamocortical activa-tion and suspension of the default state of the brain. Proc Natl AcadSci USA 102:15236–15240.
Hamandi K, Salek-Haddadi A, Laufs H, Liston A, Friston K, Fish DR,Duncan JS, Lemieux L. (2006) EEG–fMRI of idiopathic and secon-darily generalized epilepsies. NeuroImage 31:1700–1710.
Incorpora G, Sofia V, Pavone P, Biondi R, Barone B, Parano E.(2002) Clinical heterogeneity in eyelid myoclonia, with absences,andepilepsy. Eur J Pediatr 161:175–177.
Isnard J, Guenot M, Sindou M, Mauguiere F. (2004) Clinical manifesta-tions of insular lobe seizures: a stereo-electroencephalographic study.Epilepsia 45:1079–1090.
Jeavons PM. (1997) Nosological problems of myoclonic epilepsies inchildhood and adolescence. Dev Med Child Neurol 19:3–8.
Kandel A, Buzsaki G. (1993) Cerebellar neuronal activity correlateswith spike and wave EEG patterns in the rat. Epilepsy Res 16:1–9.
Kent L, Blake A, Whitehouse W. (1998) Eyelid myoclonia with absences:phenomenology in children. Seizure 7:193–199.
Kobayashi E, Bagshaw AP, Grova C, Dubeau F, Gotman J. (2006) Neg-ative BOLD responses to epileptic spikes. Hum Brain Mapp 27:488–497.
Laufs H, Lengler U, Hamandi K, Kleinschmidt A, Krakow K. (2006)Linking generalized spike-and-wave discharges and resting state brainactivity by using EEG/fMRI in a patient with absence seizures.Epilepsia 47:444–448.
Marcus EM, Watson CW, Simon SA. (1968) An experimental modelof some varieties of petit mal epilepsy. Electrical-behavioral correla-tions of acute bilateral epileptogenic foci in cerebral cortex. Epilepsia9:233–248.
Mazoyer B, Zago L, Mellet E, Bricogne S, Etard O, Houde O, CrivelloF, Joliot M, Petit L, Tzourio-Mazoyer N. (2001) Cortical networksfor working memory and executive functions sustain the consciousresting state in man. Brain Res Bull 54:287–298.
McKiernan KA, Kaufman JN, Kucera-Thompson J, Binder JR. (2003)A parametric manipulation of factors affecting task-induced de-activation in functional neuroimaging. J Cognit Neurosci 15:394–408.
Mesulam MM, Mufson EJ. (1985) In Peters A, Jones EG (Eds) Cerebralcortex. Plenum, New York.
Panayiotopoulos CP. (2005) Reflex seizures and reflex epilepsies.In Panayiotopoulos CP (Ed) The epilepsies: seizures, syndromesand management. Bladon Medical Publishing, Oxford, pp. 449–496.
Raichle ME, MacLeod AM, Snyder AZ, Powers WJ, Gusnard DA,Shulman GL. (2001) A default mode of brain function. Proc NatlAcad Sci 98:676–682.
Striano S, Striano P, Nocerino C, Boccella P, Bilo L, Meo R, Ruosi P.(2002) Eyelid myoclonia with absence: an overlooked epileptic syn-drome? Clin Neurophysiol 32:287–296.
Timofeev I, Steriade M. (2004) Neocortical seizures: initiation, develop-ment and cessation. Neuroscience 123:299–336.
Epilepsia, **(*):1–9, 2008doi: 10.1111/j.1528-1167.2008.01724.x
Copyright © 2022 FDOKUMEN