Educational systems efficiency in European Union countries
15
Educational systems efficiency in European Union countries § Francesca Giambona, Erasmo Vassallo *, Elli Vassiliadis Dipartimento di Contabilita ` Nazionale e Analisi dei Processi Sociali, University of Palermo, Viale delle Scienze, Ed.2, Parco d’Orle ´ans, 90128 PA, Italy 1. Introduction In literature, as the innate ability cannot be measured, the student background has been considered the most decisive factor in explaining student performances. The background includes personal characteristics and information on parents’ origin, or education and number of books at home and so on (Hanushek & Luque, 2003; Wo ¨ ßmann, 2003). In this paper, we explore the students’ competen- cies allowing for some educational resources available at students’ home and some components of students’ family background. In particular, we say that the educational system will be more efficient if, with equal family conditions, it achieves a higher students’ proficiency. Hence, the greater efficiency can be explained by other factors, for example school resources or institutional context. Through the students’ scholastic competencies in mathematics, reading and science, we use the PISA 2006 data to represent human capital in the following European Union countries: Austria, Belgium, Bulgaria, Czech Republic, Denmark, Estonia, Finland, France, Germany, Greece, Hungary, Ireland, Italy, Lithuania, Luxembourg, Netherlands, Poland, Portugal, Romania, Slovak Republic, Slovenia, Spain, Sweden, United Kingdom. 1 If greater competencies denote greater human capital, then the effectiveness and the efficiency of the educational system become a basic target, although economic and social contexts where students live and study have the main role (Currie & Moretti, 2003; Lam & Duryea, 1999; Martin, 2004). Therefore, the purpose of this paper is to connect the students’ competencies in mathematics, reading and science to a measure of educational resources available at home and a measure of family background as proxy of socio-economic students’ conditions. To this aim, we have constructed two specific indexes named IAR (educational resources available at home) and IFB (family background) while, for the efficiency score, we have applied a bootstrap version of Data Envelopment Analysis (DEA). The paper is divided into five sections. Section 2 presents a brief literature review. Section 3 illustrates the construction and some peculiarities of the IAR and IFB indexes and exposes a concise description of the DEA-bootstrap technique. Section 4 presents the DEA efficiency scores where IAR and IFB are inputs of the educational process and the competencies in mathematics, reading and science are outputs. In the same section, for a better interpretation of the efficiency scores, a cluster analysis is done to assay the presence of heterogeneous groups of countries in relation to the inputs and outputs. Section 5 concludes the paper with a discussion of the main findings. Finally, Appendix includes some useful tables and figures. 2. Research problem in context Many papers in the economic field address some aspects of the educational process and factors that directly or indirectly influence it (for example, Bramanti & Odifreddi, 2006; Brunello & Checchi, 2005; Coleman, 1966; Putnam & Helliwell, 1999; Putnam, 1993). This is a relevant issue for the sustainable development of the Studies in Educational Evaluation 37 (2011) 108–122 A R T I C L E I N F O Article history: Received 27 August 2010 Received in revised form 16 April 2011 Accepted 12 May 2011 Available online 16 June 2011 JEL classification: I21 N30 C14 Keywords: PISA Educational achievement Efficiency analysis A B S T R A C T We use the PISA 2006 results to analyse students’ proficiency in EU countries with regard to two indexes that represent the home background, viz the educational resources available at home and the family background of students. However, many factors affect proficiency and therefore, using a DEA-bootstrap, we intend to measure the efficiency of the European educational systems as capability to ensure high students’ competencies despite adverse conditions about the educational resources available at home and the family background. Results show an unexpected differentiation among EU countries. In particular, the most developed countries often show disappointing students’ proficiency despite good levels of home background. In this case, an important role is played by the social and economic context. ß 2011 Elsevier Ltd. All rights reserved. § The authors thank the editor and two anonymous referees for their helpful comments and suggestions on a previous version of the paper. Any errors and omissions are the responsibility of the authors. * Corresponding author. Tel.: +39 91 6561 518; fax: +39 91 6561 501. E-mail address: [email protected] (E. Vassallo). 1 PISA 2006 involves 57 countries with 30 OECD members. In the paper, we choose 24 countries in the European Union: Cyprus and Malta are not participants in PISA 2006 and Latvia has many missing data. Contents lists available at ScienceDirect Studies in Educational Evaluation jo ur n al ho mep ag e: www .elsevier .c om /st u ed u c 0191-491X/$ – see front matter ß 2011 Elsevier Ltd. All rights reserved. doi:10.1016/j.stueduc.2011.05.001
-
Upload
independent -
Category
Documents
-
view
0 -
download
0
Transcript of Educational systems efficiency in European Union countries
Studies in Educational Evaluation 37 (2011) 108–122
Educational systems efficiency in European Union countries§
Francesca Giambona, Erasmo Vassallo *, Elli Vassiliadis
Dipartimento di Contabilita Nazionale e Analisi dei Processi Sociali, University of Palermo, Viale delle Scienze, Ed.2, Parco d’Orleans, 90128 PA, Italy
A R T I C L E I N F O
Article history:
Received 27 August 2010
Received in revised form 16 April 2011
Accepted 12 May 2011
Available online 16 June 2011
JEL classification:
I21
N30
C14
Keywords:
PISA
Educational achievement
Efficiency analysis
A B S T R A C T
We use the PISA 2006 results to analyse students’ proficiency in EU countries with regard to two indexes
that represent the home background, viz the educational resources available at home and the family
background of students. However, many factors affect proficiency and therefore, using a DEA-bootstrap,
we intend to measure the efficiency of the European educational systems as capability to ensure high
students’ competencies despite adverse conditions about the educational resources available at home
and the family background. Results show an unexpected differentiation among EU countries. In
particular, the most developed countries often show disappointing students’ proficiency despite good
levels of home background. In this case, an important role is played by the social and economic context.
� 2011 Elsevier Ltd. All rights reserved.
Contents lists available at ScienceDirect
Studies in Educational Evaluation
jo ur n al ho mep ag e: www .e lsev ier . c om / s t u ed u c
1. Introduction
In literature, as the innate ability cannot be measured, the studentbackground has been considered the most decisive factor inexplaining student performances. The background includes personalcharacteristics and information on parents’ origin, or education andnumber of books at home and so on (Hanushek & Luque, 2003;Woßmann, 2003). In this paper, we explore the students’ competen-cies allowing for some educational resources available at students’home and some components of students’ family background. Inparticular, we say that the educational system will be more efficientif, with equal family conditions, it achieves a higher students’proficiency. Hence, the greater efficiency can be explained by otherfactors, for example school resources or institutional context.
Through the students’ scholastic competencies in mathematics,reading and science, we use the PISA 2006 data to represent humancapital in the following European Union countries: Austria, Belgium,Bulgaria, Czech Republic, Denmark, Estonia, Finland, France,Germany, Greece, Hungary, Ireland, Italy, Lithuania, Luxembourg,Netherlands, Poland, Portugal, Romania, Slovak Republic, Slovenia,Spain, Sweden, United Kingdom.1 If greater competencies denotegreater human capital, then the effectiveness and the efficiency of
§ The authors thank the editor and two anonymous referees for their helpful
comments and suggestions on a previous version of the paper. Any errors and
omissions are the responsibility of the authors.
* Corresponding author. Tel.: +39 91 6561 518; fax: +39 91 6561 501.
E-mail address: [email protected] (E. Vassallo).1 PISA 2006 involves 57 countries with 30 OECD members. In the paper, we
choose 24 countries in the European Union: Cyprus and Malta are not participants
in PISA 2006 and Latvia has many missing data.
0191-491X/$ – see front matter � 2011 Elsevier Ltd. All rights reserved.
doi:10.1016/j.stueduc.2011.05.001
the educational system become a basic target, although economicand social contexts where students live and study have the main role(Currie & Moretti, 2003; Lam & Duryea, 1999; Martin, 2004).
Therefore, the purpose of this paper is to connect the students’competencies in mathematics, reading and science to a measure ofeducational resources available at home and a measure of familybackground as proxy of socio-economic students’ conditions. Tothis aim, we have constructed two specific indexes named IAR(educational resources available at home) and IFB (familybackground) while, for the efficiency score, we have applied abootstrap version of Data Envelopment Analysis (DEA).
The paper is divided into five sections. Section 2 presents a briefliterature review. Section 3 illustrates the construction and somepeculiarities of the IAR and IFB indexes and exposes a concisedescription of the DEA-bootstrap technique. Section 4 presents theDEA efficiency scores where IAR and IFB are inputs of the educationalprocess and the competencies in mathematics, reading and scienceare outputs. In the same section, for a better interpretation of theefficiency scores, a cluster analysis is done to assay the presence ofheterogeneous groups of countries in relation to the inputs andoutputs. Section 5 concludes the paper with a discussion of the mainfindings. Finally, Appendix includes some useful tables and figures.
2. Research problem in context
Many papers in the economic field address some aspects of theeducational process and factors that directly or indirectly influenceit (for example, Bramanti & Odifreddi, 2006; Brunello & Checchi,2005; Coleman, 1966; Putnam & Helliwell, 1999; Putnam, 1993).This is a relevant issue for the sustainable development of the
F. Giambona et al. / Studies in Educational Evaluation 37 (2011) 108–122 109
modern economies and an important key to promote developmentin all nations of the world (Sen, 1999; De La Fuente & Ciccone, 2002).The first major scientific contributions of Mincer (1958), Schultz(1961) and Becker (1964) on the education economics haveencouraged studies about the relationship between human capitaland productivity, the distribution of wealth and, more generally, theeconomic and social development of countries (Romer, 1990). Briefly,more education and then more human capital generate economicand social well-being and ensure economic and social progress(Nelson & Phelps, 1966). In human capital theory the education ofpopulation is highly instrumental and necessary to improve theproduction (Psacharopoulos & Woodhall, 1997; Sakamota & Powers,1995; Schultz, 1971). Essentially, human capital theorists argue thatan educated population is a productive population because a higherhuman capital and, so, a higher cognitive stock of workers withhigher income, promotes the adoption of new technologiesincreasing productivity and generating economic growth and socialprogress (Harmon, Walker, & Westergaard-Nielsen, 2001; Mankiw,Romer, & Weil, 1992). Thus, the formal education is a productiveinvestment in human capital considered as important as physicalcapital (Temple, 1999). The training success of a population impliesa better educated population, more skilled and competent workers,and it determines, in fact, the success of the scholastic educationalsystem whose main purpose is human capital accumulation.
Generally, human capital is measured through the participationrate of the population in education and through the number ofyears of schooling (Barro, 2001; Barro & Lee, 1993), but the simpleconsideration that a year of study and training may not have thesame value in all countries, has brought to consider also measuresof human capital quality (Hanushek & Kim, 1995). Indeed, a largepart of the investment in human capital is aimed at increasing theintellectual ability and the cognitive skills which, however, dependon the family background too (Coleman, 1966; Cutillo et al., 2004;Fagerlind & Saha, 1997). In particular, Hanushek and Kimko (2000)underline that the differences of growth among countries aresignificantly affected by human capital and its quality is influencedby cultural, racial, family and scholastic conditions.
The role of human capital in economic and social development ofa country is not a trivial issue. Although the theory is clear, theempirical evidence is less clear and sometimes discordant (Cohen &Soto, 2007; Krueger & Lindahl, 2001). The unavailability of statisticalsources and the difficulty to build good variables make everythingmore uncertain (Barro, 2001). For this reason, among the useful toolsto measure human capital, the surveys about skills, capabilities andcompetencies appear relevant (Tyler, Murnane, & Willett, 2000).Specifically, it is useful to measure human capital through thescholastic competency of students (the future workers) even if thisdoes not capture completely their attitudes and motivations.Anyhow, the results could provide some important evidences aboutlevel and quality of human capital in some countries (Afonso &Aubyn, 2005).
The first question is: how can we represent students’ skills?Many important surveys measure knowledge, students’ skills andabilities from a number of countries, i.e.: the International AdultLiteracy Survey (IALS) carried out in three editions (1994, 1996 and1998) by OECD and Statistics Canada; the Trends in Maths andScience Study (TIMSS) (in 1995, 1999, 2003 and 2007) and theProgress in International Reading Literacy Study (PIRLS) (in 2001and 2006), both conducted by the International Association for theEvaluation of Educational Achievement (IEA) through its Interna-tional Study Center at Boston College.2 Finally, the Program forInternational Student Assessment (PISA), conducted every three
2 There are other less important and less known surveys. They are not cited since
carried out on a smaller number of countries or carried out with strong discontinuity;
for example, Adult Literacy and Lifeskills (or ALL) (Smyth & Lane, 2009).
years and organized by OECD in 2000, 2003, 2006 and 2009 (OECD,2006, 2007a, 2009a). The PISA OECD project aims to measure 15-year-old students’ skills on mathematics, reading and scienceliteracy scales and to monitor the trends over time. PISA 2006 is thethird PISA assessment and the last available survey at time ofwriting this paper. We note that the choice of 15-year-old studentsis not accidental in PISA, since it marks for many countries thetransition from a basic education to a more specific instruction orprofessional training.
Compared to the IEA surveys, the PISA project shows somedifferences, particularly: (a) the target population, for example inTIMSS 2007, is fourth grade and eighth grade students, while in PISA isthe 15-year-old students; (b) PISA is not constrained by the need ofhaving comparable contents of the school programme among theparticipating countries, the knowledge is not defined in terms of acommon school curriculum but in terms of skills that are consideredessential for students’ future life. Indeed, OECD assesses: ‘‘theknowledge, skills, competencies and other attributes embodied inindividuals [. . .] are relevant to personal, social and economic well-being’’ (OECD, 2001, p. 18). In this paper, we prefer to use the PISAsurvey as: (a) it collects information on all three areas of competencies(mathematics, reading and science), unlike the IEA surveys collectinformation in reading literacy (PIRLS) and mathematics and scienceliteracy (TIMSS) separately; (b) it is carried out every 3 years whilePIRLS and TIMSS every 5 and 4 years respectively; (c) it considers the15-year-old students and therefore it allows to compare the compe-tency level, useful for labour market inclusion. In general terms, PISAis useful for our goal as it is a comprehensive survey that analysesthe disparities of students’ proficiencies among countries and itallows us to easily explore the students’ socio-demographic charac-teristics (Bratti et al., 2007; Checchi, 2004; Checchi & Flabbi, 2006).
Then, the second question is: how can we represent the contextand the conditions in which students live? To this aim, we haveconstructed two specific indexes named IAR (educationalresources available at home) and IFB (family background). Besides,to highlight some sources of heterogeneity, the students aresubdivided by gender (male and female), school management(public and private), school size (small, medium and large), andcommunity size (village, town and city).
In this way, we build an efficiency rank of the educationalsystems giving a greater value to those systems where thecompetencies are high despite an unfavorable context of theeducational resources available at home and the family back-ground (Cunha, Heckman, Lochner, & Masterov, 2006).
As general rule, a high students’ skill with low resources athome and poor family background is translated in a high efficiencyscore assuming the positive presence of institutional factors, localand global school policy, school facilities, teachers’ expertise, etc.But, the inclusion of these elements in the analysis is affected bymeasurement difficulties or lack of data, rather they are treated asexplanatory factors of the efficiency scores. In brief, a greaterefficiency score represents the success of the educational system(Bishop & Woßmann, 2004).
In fact, higher values of IAR and IFB should be related to higherskills. So, it is interesting to underline the countries with low IARand IFB values and high competencies (high efficiency) and, viceversa, the countries with high IAR and IFB and low competencies(low efficiency). It should be noted immediately that we use microdata but, at the end, we are interested in a national framework and,therefore, a comparison of countries about the educational systemuseful for policy and to identify clearly the macro benchmarkamong the European Union countries.3
3 The micro level analysis allows for high detail at student level but it does not
allow to generalize at country level. Then, in the paper, we shift from a micro to a
macro approach.
F. Giambona et al. / Studies in Educational Evaluation 37 (2011) 108–122110
The final question is: how can we get these efficiency scores? Theefficiency score is obtained through the statistical technical efficiencyapproach with a nonparametric method based on a DEA-bootstrapalgorithm. This method can be applied with a few of data, it correctsthe typical bias of the classical DEA estimates and avoids the curse ofdimensionality. The score varies from 0 (worse state) to 1 (betterstate) and represents a measure of the ability of a country to stimulatebetter students’ skills despite unfavorable socio-economic condi-tions. It represents the success of the educational system.4
3. Research approach and methods
3.1. Home background indexes
In order to evaluate the differences between countries, we haveconsidered the three students’ competencies in mathematics,reading and science and two indexes representing the students’conditions from PISA 2006.5 In particular, we have considered: (1)the educational resources available for the student at home(named IAR); (2) some features related to the family background(named IFB). The role of the students’ conditions and, in particular,the dimensions represented in the two indexes have a significantrelationship with the students’ skills (Acemoglu & Angrist, 2000;Currie & Thomas, 2001; Feinstein, 2004; Fuchs & Woßmann, 2004;Moretti, 2004; OECD, 2007b; Schulz, 2005).
The two indexes must be constructed from micro data and,therefore, to maintain consistency in the analysis and to provide adetailed study of the skills by subgroups, we need the proficiencyvalues for each student.6
In order to represent the educational resources available at homewhich are useful for the student training, following the literatureindicated in this and in the previous section, we have selected the
4 In literature, both nonparametric DEA methods and classical parametric
frontier models are utilized to analyse the educational process and to measure its
statistical efficiency (Cooper & Cohn, 1997; Johnes, 2006; Soares de Mello et al.,
2006). But, a robust nonparametric DEA approach is here preferable.5 The PISA target population consists of 15-year-old students attending schools in
grades 7 and higher. In PISA 2006 the target population could be defined as all students
born in 1990 attending a school or other educational institution. It is almost impossible
to examine the whole population and, so, taking advantage of the statistic theory, it is
opportune to use a representative subset of the population. The sample is collected
(sampling) following a specific design and statistics are calculated from the sample so
that one can make inferences from the sample to the population. In all but one country,
the sampling design is a two-stage stratified sample. The first-stage units are schools
with 15-year-old students with sampling probabilities proportional to size. The
second-stage units are students within sampled schools. In one country, a three-stage
design is used: the first-stage units are geographical areas, the second-stage units are
schools and the third-stage units are students. A minimum of 150 schools are selected
in each country and, within each school, a prearranged number of students, usually 35,
is randomly selected with equal probability. Prior to sampling, schools are stratified.
The stratification operation classifies units into groups according to some stratification
variables; it is useful, i.e., to improve the statistical characteristics of the sample or to
ensure adequate representation of all parts of a population. The students included in
the sample for a given country are chosen randomly, but the selection probabilities of
the students vary. Therefore, some weights are incorporated into the analysis to ensure
that each sampled student represents the correct number of students in the PISA
population. More details are in OECD (2009a).6 We use the five Plausible Values (or PV) for each of the three competencies in
reading, mathematics and science. Plausible values were first developed for the
analyses of National Assessment of Educational Progress data by Mislevy, Sheehan,
Beaton and Johnson, based on Rubin’s work on multiple imputations. Plausible
values were used in all subsequent NAEP surveys, TIMSS and PISA. The simplest way
to describe plausible values is to say that they are some kind of student ability
estimates (Wu, 2004). In our paper, the five PV are kept separate throughout the
analysis and they are aggregated (by means) just at the end when at country level
the bias effects became irrelevant. This method is not the usual technique to
aggregate PV but it is simply a summary measure of students’ competencies. It is an
obvious simplification, but since we are interested in aggregated data for the whole
country, the results are not biased; in fact, when available, they are equal to official
data published by OECD (2007a). It should be noted that for all computations, for
data aggregations and indexes construction, we weight the micro data by the final
students’ weights and the final schools’ weights according to circumstances.
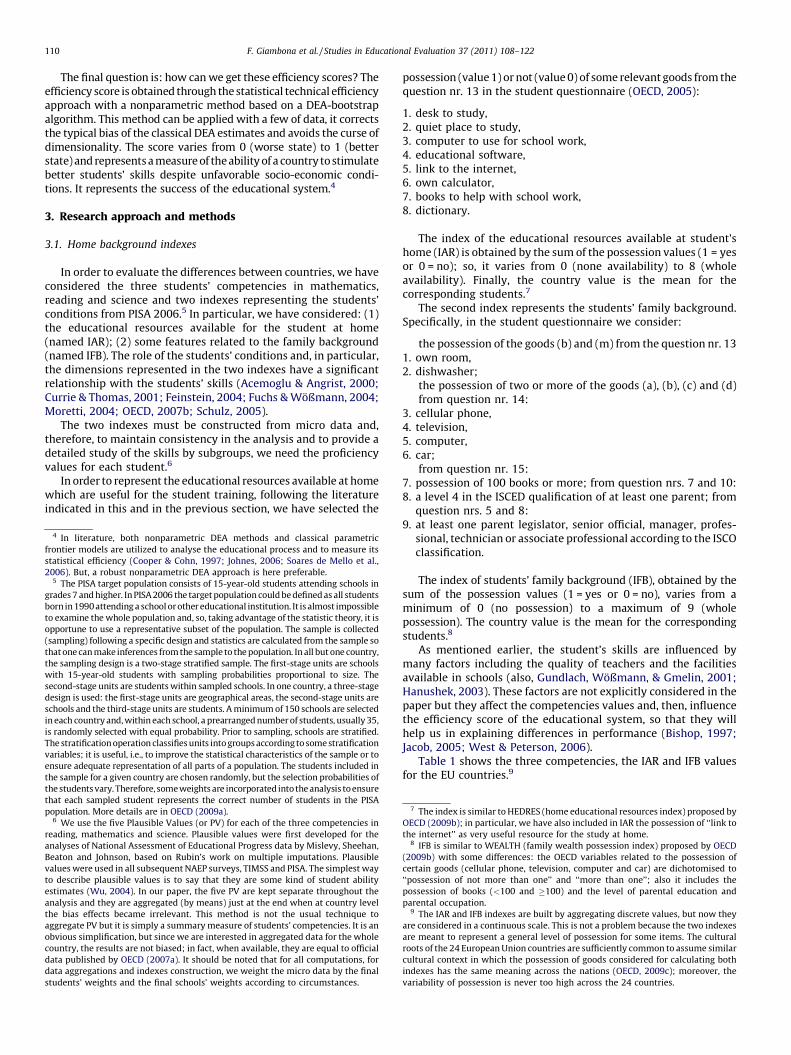
possession (value 1) or not (value 0) of some relevant goods from thequestion nr. 13 in the student questionnaire (OECD, 2005):
1. desk to study,2. quiet place to study,3. computer to use for school work,4. educational software,5. link to the internet,6. own calculator,7. books to help with school work,8. dictionary.
The index of the educational resources available at student’shome (IAR) is obtained by the sum of the possession values (1 = yesor 0 = no); so, it varies from 0 (none availability) to 8 (wholeavailability). Finally, the country value is the mean for thecorresponding students.7
The second index represents the students’ family background.Specifically, in the student questionnaire we consider:
the possession of the goods (b) and (m) from the question nr. 131. own room,2. dishwasher;
the possession of two or more of the goods (a), (b), (c) and (d)from question nr. 14:
3. cellular phone,4. television,5. computer,6. car;
from question nr. 15:7. possession of 100 books or more; from question nrs. 7 and 10:8. a level 4 in the ISCED qualification of at least one parent; from
question nrs. 5 and 8:9. at least one parent legislator, senior official, manager, profes-
sional, technician or associate professional according to the ISCOclassification.
The index of students’ family background (IFB), obtained by thesum of the possession values (1 = yes or 0 = no), varies from aminimum of 0 (no possession) to a maximum of 9 (wholepossession). The country value is the mean for the correspondingstudents.8
As mentioned earlier, the student’s skills are influenced bymany factors including the quality of teachers and the facilitiesavailable in schools (also, Gundlach, Woßmann, & Gmelin, 2001;Hanushek, 2003). These factors are not explicitly considered in thepaper but they affect the competencies values and, then, influencethe efficiency score of the educational system, so that they willhelp us in explaining differences in performance (Bishop, 1997;Jacob, 2005; West & Peterson, 2006).
Table 1 shows the three competencies, the IAR and IFB valuesfor the EU countries.9
7 The index is similar to HEDRES (home educational resources index) proposed by
OECD (2009b); in particular, we have also included in IAR the possession of ‘‘link to
the internet’’ as very useful resource for the study at home.8 IFB is similar to WEALTH (family wealth possession index) proposed by OECD
(2009b) with some differences: the OECD variables related to the possession of
certain goods (cellular phone, television, computer and car) are dichotomised to
‘‘possession of not more than one’’ and ‘‘more than one’’; also it includes the
possession of books (<100 and �100) and the level of parental education and
parental occupation.9 The IAR and IFB indexes are built by aggregating discrete values, but now they
are considered in a continuous scale. This is not a problem because the two indexes
are meant to represent a general level of possession for some items. The cultural
roots of the 24 European Union countries are sufficiently common to assume similar
cultural context in which the possession of goods considered for calculating both
indexes has the same meaning across the nations (OECD, 2009c); moreover, the
variability of possession is never too high across the 24 countries.
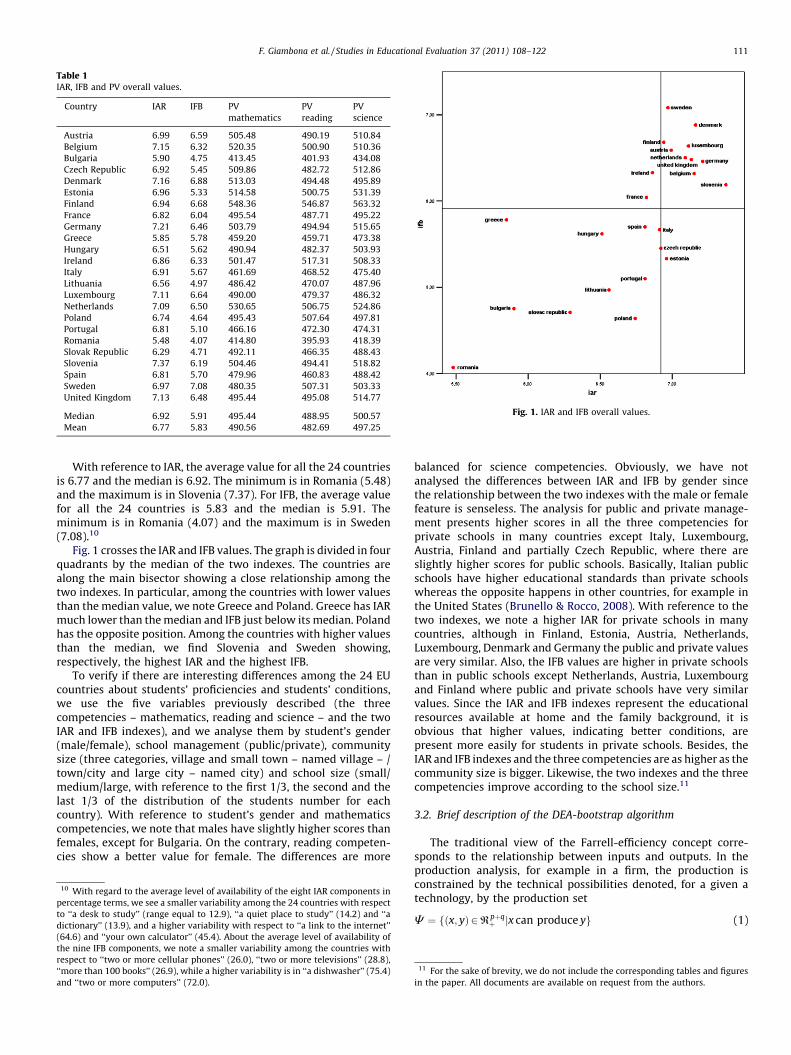
Fig. 1. IAR and IFB overall values.
Table 1IAR, IFB and PV overall values.
Country IAR IFB PV
mathematics
PV
reading
PV
science
Austria 6.99 6.59 505.48 490.19 510.84
Belgium 7.15 6.32 520.35 500.90 510.36
Bulgaria 5.90 4.75 413.45 401.93 434.08
Czech Republic 6.92 5.45 509.86 482.72 512.86
Denmark 7.16 6.88 513.03 494.48 495.89
Estonia 6.96 5.33 514.58 500.75 531.39
Finland 6.94 6.68 548.36 546.87 563.32
France 6.82 6.04 495.54 487.71 495.22
Germany 7.21 6.46 503.79 494.94 515.65
Greece 5.85 5.78 459.20 459.71 473.38
Hungary 6.51 5.62 490.94 482.37 503.93
Ireland 6.86 6.33 501.47 517.31 508.33
Italy 6.91 5.67 461.69 468.52 475.40
Lithuania 6.56 4.97 486.42 470.07 487.96
Luxembourg 7.11 6.64 490.00 479.37 486.32
Netherlands 7.09 6.50 530.65 506.75 524.86
Poland 6.74 4.64 495.43 507.64 497.81
Portugal 6.81 5.10 466.16 472.30 474.31
Romania 5.48 4.07 414.80 395.93 418.39
Slovak Republic 6.29 4.71 492.11 466.35 488.43
Slovenia 7.37 6.19 504.46 494.41 518.82
Spain 6.81 5.70 479.96 460.83 488.42
Sweden 6.97 7.08 480.35 507.31 503.33
United Kingdom 7.13 6.48 495.44 495.08 514.77
Median 6.92 5.91 495.44 488.95 500.57
Mean 6.77 5.83 490.56 482.69 497.25
F. Giambona et al. / Studies in Educational Evaluation 37 (2011) 108–122 111
With reference to IAR, the average value for all the 24 countriesis 6.77 and the median is 6.92. The minimum is in Romania (5.48)and the maximum is in Slovenia (7.37). For IFB, the average valuefor all the 24 countries is 5.83 and the median is 5.91. Theminimum is in Romania (4.07) and the maximum is in Sweden(7.08).10
Fig. 1 crosses the IAR and IFB values. The graph is divided in fourquadrants by the median of the two indexes. The countries arealong the main bisector showing a close relationship among thetwo indexes. In particular, among the countries with lower valuesthan the median value, we note Greece and Poland. Greece has IARmuch lower than the median and IFB just below its median. Polandhas the opposite position. Among the countries with higher valuesthan the median, we find Slovenia and Sweden showing,respectively, the highest IAR and the highest IFB.
To verify if there are interesting differences among the 24 EUcountries about students’ proficiencies and students’ conditions,we use the five variables previously described (the threecompetencies – mathematics, reading and science – and the twoIAR and IFB indexes), and we analyse them by student’s gender(male/female), school management (public/private), communitysize (three categories, village and small town – named village – /town/city and large city – named city) and school size (small/medium/large, with reference to the first 1/3, the second and thelast 1/3 of the distribution of the students number for eachcountry). With reference to student’s gender and mathematicscompetencies, we note that males have slightly higher scores thanfemales, except for Bulgaria. On the contrary, reading competen-cies show a better value for female. The differences are more
10 With regard to the average level of availability of the eight IAR components in
percentage terms, we see a smaller variability among the 24 countries with respect
to ‘‘a desk to study’’ (range equal to 12.9), ‘‘a quiet place to study’’ (14.2) and ‘‘a
dictionary’’ (13.9), and a higher variability with respect to ‘‘a link to the internet’’
(64.6) and ‘‘your own calculator’’ (45.4). About the average level of availability of
the nine IFB components, we note a smaller variability among the countries with
respect to ‘‘two or more cellular phones’’ (26.0), ‘‘two or more televisions’’ (28.8),
‘‘more than 100 books’’ (26.9), while a higher variability is in ‘‘a dishwasher’’ (75.4)
and ‘‘two or more computers’’ (72.0).
balanced for science competencies. Obviously, we have notanalysed the differences between IAR and IFB by gender sincethe relationship between the two indexes with the male or femalefeature is senseless. The analysis for public and private manage-ment presents higher scores in all the three competencies forprivate schools in many countries except Italy, Luxembourg,Austria, Finland and partially Czech Republic, where there areslightly higher scores for public schools. Basically, Italian publicschools have higher educational standards than private schoolswhereas the opposite happens in other countries, for example inthe United States (Brunello & Rocco, 2008). With reference to thetwo indexes, we note a higher IAR for private schools in manycountries, although in Finland, Estonia, Austria, Netherlands,Luxembourg, Denmark and Germany the public and private valuesare very similar. Also, the IFB values are higher in private schoolsthan in public schools except Netherlands, Austria, Luxembourgand Finland where public and private schools have very similarvalues. Since the IAR and IFB indexes represent the educationalresources available at home and the family background, it isobvious that higher values, indicating better conditions, arepresent more easily for students in private schools. Besides, theIAR and IFB indexes and the three competencies are as higher as thecommunity size is bigger. Likewise, the two indexes and the threecompetencies improve according to the school size.11
3.2. Brief description of the DEA-bootstrap algorithm
The traditional view of the Farrell-efficiency concept corre-sponds to the relationship between inputs and outputs. In theproduction analysis, for example in a firm, the production isconstrained by the technical possibilities denoted, for a given atechnology, by the production set
C ¼ fðx; yÞ 2 Rpþqþ jx can produce yg (1)
11 For the sake of brevity, we do not include the corresponding tables and figures
in the paper. All documents are available on request from the authors.
F. Giambona et al. / Studies in Educational Evaluation 37 (2011) 108–122112
where x 2 Rpþ represents a matrix of inputs and y 2 R
qþ one of
outputs. If
8 y 2 C ; XðyÞ ¼ fx 2 Rpþjðx; yÞ 2 Cg (2)
then the radial input-oriented efficient frontier is
@XðyÞ ¼ fxjx 2 XðyÞ; ux =2 XðyÞ 8 0 < u < 1g (3)
Consequently, the Farrell input-oriented technical efficiency for ageneric point (x, y) is
uðx; yÞ ¼ inffujux 2 XðyÞg (4)
Therefore, a production unit is technically efficient when itminimises the input levels for a given level of output. It is easy totranspose this analysis to the output-oriented case: then, a unit istechnically efficient when it is able to maximise output for a givenlevel of input.
In this paper, the units are the 24 EU countries, but theproduction process is virtual because we consider the two indexesIAR and IFB as inputs and the three proficiencies in mathematics,reading and science as outputs.
The production possibilities set C is unknown and only thecombinations (x, y) of the effectively observed units are know.Therefore, it will be necessary to estimate in some way C, X(y),@X(x) and u(x, y) for the input orientation, or with a similarreasoning, Y(x), @Y(x) and f(x,y) for the output orientation. Amongall the alternatives, the estimates obtained using DEA (DataEnvelopment Analysis) are the most common (Førsund &Sarafoglou, 2005).
For an input-oriented DEA, we have the following estimator
udeaðx0; y0Þ ¼ inffujðux0; y0Þ 2 Cdeað@nÞg (5)
and
Cdeað@nÞ ¼�ðx; yÞ 2 R
pþqþ jy �
Xn
i¼1
g iyi; x �Xn
i¼1
g ixi;
Xn
i¼1
g i ¼ 1; g i� 0 8 i ¼ 1; . . . ; n
�(6)
where @n = {(xi, yi), i = 1, . . ., n} and with
Cdea� C and uðx0; y0Þ � udeaðx0; y0Þ � 1 (7)
It is immediate to translate this in output-oriented terms,where
8 x 2 C ; YðxÞ ¼ fy 2 Rqþjðx; yÞ 2 Cg;
@YðxÞ ¼ fyjy 2 YðxÞ; fy =2 YðxÞ 8 f > 1g;fðx; yÞ ¼ supffjfy 2 YðxÞg (8)
In the paper, we have chosen the output orientation. Therefore,a country has higher efficiency score of the educational system if,for given inputs (educational resources available at home andfamily background), its students have higher proficiencies inmathematics, reading and science.
Besides, since the Farrell output-oriented efficiency score variesfrom 1 to infinite, we use the reciprocal 1/f that varies from 0 to 1as in the Shephard representation.
The classic DEA approach has considerable advantages and itdoes not demand a specific, often unjustifiable, mathematicalform between inputs and outputs, but it has also somedrawbacks not wholly negligible at times. In particular, theDEA scores show a bias (see formula (7)) yet a correction ispossible. The absence of theoretical information about the DEAestimates suggests a bootstrap procedure to simulate the DataGenerating Process (DGP) (Simar & Wilson, 1998, 2000a, 2000b).Following the Simar–Wilson approach, it is possible to obtain
bootstrap samples so that from each sample we have oneefficiency score for each specific country and, consequently, tostudy the statistical characteristics of the efficiency values and,so, to correct the bias.
If the data @n are from the process P(C, f(x, y)) where C is theunknown set and f is a suitable probability density function, fromthe same @n it is possible to derive an estimator of P, C and score u(or f). Let Pð@nÞ be a consistent estimator of the DGP P, thenPð@nÞ ¼ PðC ; fðx; yÞÞ. In a bootstrap way, a new dataset or pseudo-sample @�n ¼ fðx�i ; y�i Þ; i ¼ 1; . . . ; ng is drawn from P: An estimatorof C is now C
�ð@�nÞ; and so, for a fixed point (x0, y0), we have
u�deaðx0; y0Þ as estimator of udeaðx0; y0Þ: If the bootstrap is consistent,
then approximately
ðu�deaðx0; y0Þ � udeaðx0; y0ÞÞjPð@nÞ � ðudeaðx0; y0Þ � uðx0; y0ÞÞjP (9)
In theory, the sampling distribution of u�deaðx0; y0Þ is known but,
in practice, for impossibility of computation it is indispensable touse Monte Carlo simulations. Then, we use Pð@nÞ to generate B
samples, so we have @�n;b of size n with b = 1, . . ., B; consequently,we obtain B pseudo-estimates u
�dea;bðx0; y0Þ and their empirical
distribution provides an approximation of the sampling distribu-tion of u
�deaðx0; y0Þ. Evidently, the quality of the bootstrap procedure
is greater if B and n are big.Furthermore, (if some circumstances are verified) the bootstrap
procedure allows to correct the bias of the DEA estimators. It is
biasðudeaðx0; y0ÞÞ ¼ Eðudeaðx0; y0ÞÞ � uðx0; y0Þ (10)
and, then,
dbiasBðudeaðx0; y0ÞÞ ¼ 1
B
XB
b¼1
u�dea;bðx0; y0Þ � udeaðx0; y0Þ (11)
Consequently, confidence intervals obtained using Efron’spercentile method (the simplest and most straightforwardmethod) should be corrected by subtracting 2 times the estimatedbias from both the lower and upper bounds. Here, the problem isavoided following Simar and Wilson (2000b) by using Hallpercentile intervals based on differences.
4. Results
4.1. Efficiency of the educational systems
The previous sections show that mathematical, reading andscientific literacy of students may vary widely among countries.The reasons may be numerous: different family characteristics,high or low social and economic conditions, presence or absence ofspecific educational policies, and so on.
Therefore, we aim at looking at students’ proficiency in the 24countries taking into account the educational resources availableat home (IAR) and the family background (IFB) also consideringstudent’s gender, school management, school size and communi-ty size. With a high level of educational resources available athome and a good family background, we expect a high students’proficiency and, analogously, we expect low proficiency with pooravailable resources and poor family background (Acemoglu, 2001;Ryan, 1998). In an optimal combination, we could observe highstudents’ ability with low resources and poor background. So, thesuccess of an educational system in a country is as much evident ashigher is the proficiency score with given educational resourcesavailable at home and family background, where the positiveeffect of factors about schools, institutions, etc., explains higherperformances.
We are interested in this measurement, that is, we areinterested in the differences of performance (efficiency) of the
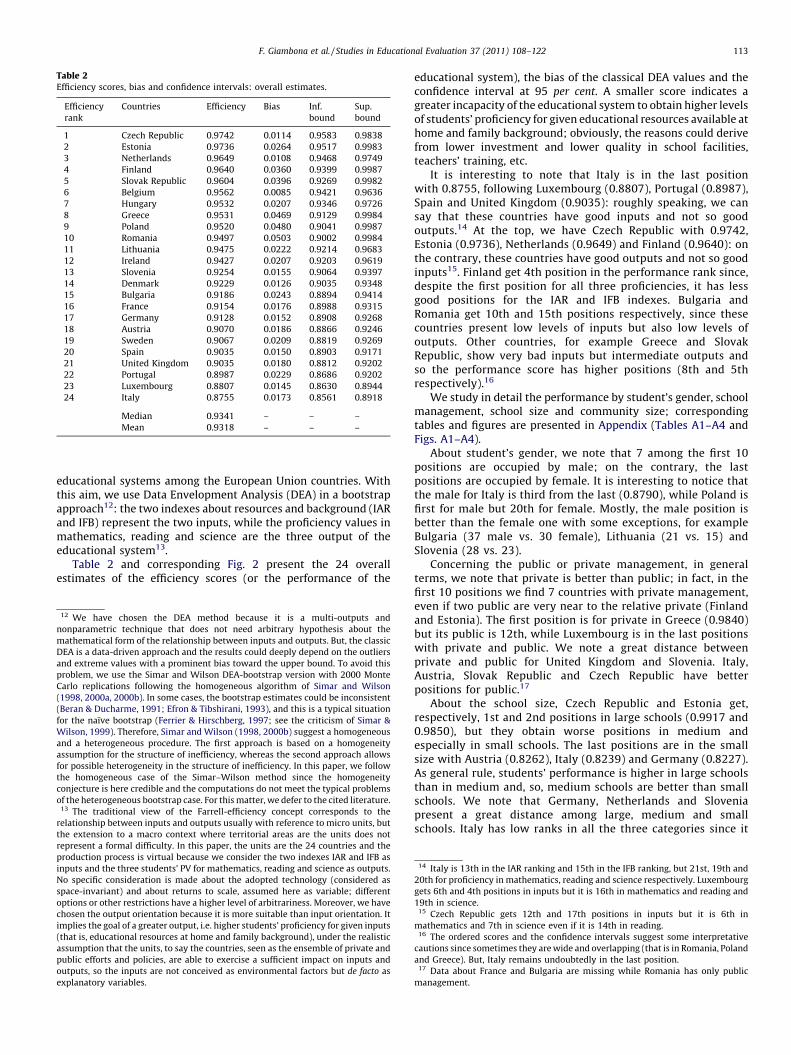
Table 2Efficiency scores, bias and confidence intervals: overall estimates.
Efficiency
rank
Countries Efficiency Bias Inf.
bound
Sup.
bound
1 Czech Republic 0.9742 0.0114 0.9583 0.9838
2 Estonia 0.9736 0.0264 0.9517 0.9983
3 Netherlands 0.9649 0.0108 0.9468 0.9749
4 Finland 0.9640 0.0360 0.9399 0.9987
5 Slovak Republic 0.9604 0.0396 0.9269 0.9982
6 Belgium 0.9562 0.0085 0.9421 0.9636
7 Hungary 0.9532 0.0207 0.9346 0.9726
8 Greece 0.9531 0.0469 0.9129 0.9984
9 Poland 0.9520 0.0480 0.9041 0.9987
10 Romania 0.9497 0.0503 0.9002 0.9984
11 Lithuania 0.9475 0.0222 0.9214 0.9683
12 Ireland 0.9427 0.0207 0.9203 0.9619
13 Slovenia 0.9254 0.0155 0.9064 0.9397
14 Denmark 0.9229 0.0126 0.9035 0.9348
15 Bulgaria 0.9186 0.0243 0.8894 0.9414
16 France 0.9154 0.0176 0.8988 0.9315
17 Germany 0.9128 0.0152 0.8908 0.9268
18 Austria 0.9070 0.0186 0.8866 0.9246
19 Sweden 0.9067 0.0209 0.8819 0.9269
20 Spain 0.9035 0.0150 0.8903 0.9171
21 United Kingdom 0.9035 0.0180 0.8812 0.9202
22 Portugal 0.8987 0.0229 0.8686 0.9202
23 Luxembourg 0.8807 0.0145 0.8630 0.8944
24 Italy 0.8755 0.0173 0.8561 0.8918
Median 0.9341 – – –
Mean 0.9318 – – –
F. Giambona et al. / Studies in Educational Evaluation 37 (2011) 108–122 113
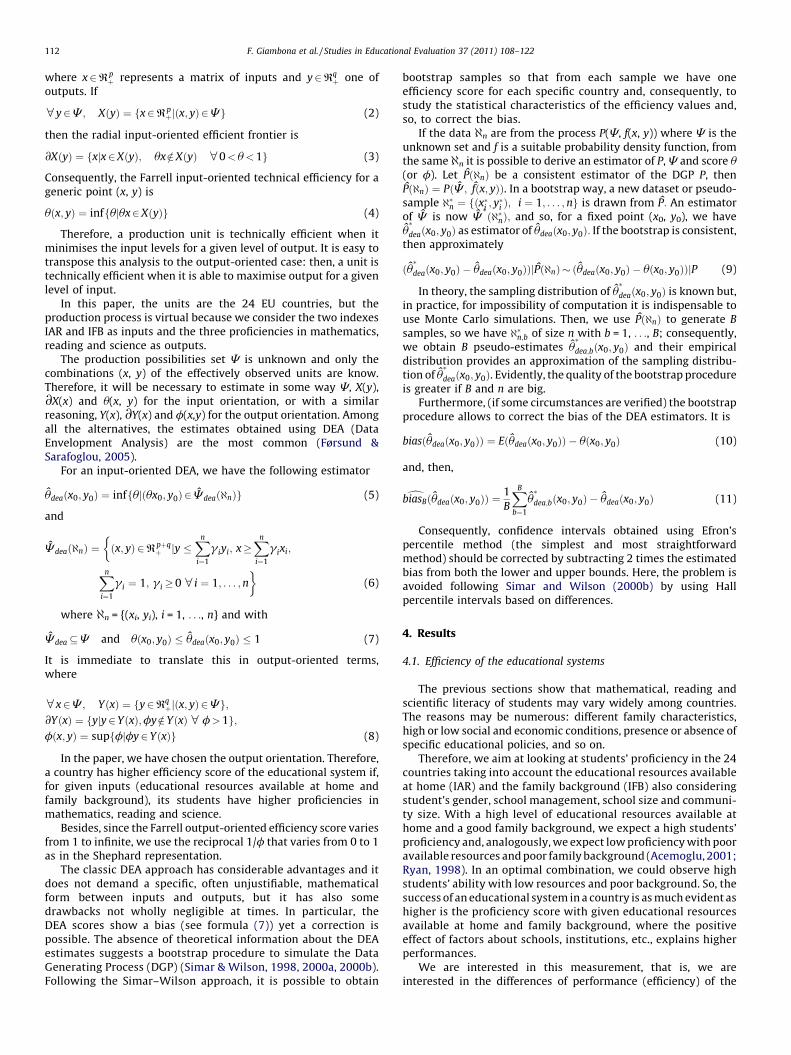
educational systems among the European Union countries. Withthis aim, we use Data Envelopment Analysis (DEA) in a bootstrapapproach12: the two indexes about resources and background (IARand IFB) represent the two inputs, while the proficiency values inmathematics, reading and science are the three output of theeducational system13.
Table 2 and corresponding Fig. 2 present the 24 overallestimates of the efficiency scores (or the performance of the
12 We have chosen the DEA method because it is a multi-outputs and
nonparametric technique that does not need arbitrary hypothesis about the
mathematical form of the relationship between inputs and outputs. But, the classic
DEA is a data-driven approach and the results could deeply depend on the outliers
and extreme values with a prominent bias toward the upper bound. To avoid this
problem, we use the Simar and Wilson DEA-bootstrap version with 2000 Monte
Carlo replications following the homogeneous algorithm of Simar and Wilson
(1998, 2000a, 2000b). In some cases, the bootstrap estimates could be inconsistent
(Beran & Ducharme, 1991; Efron & Tibshirani, 1993), and this is a typical situation
for the naıve bootstrap (Ferrier & Hirschberg, 1997; see the criticism of Simar &
Wilson, 1999). Therefore, Simar and Wilson (1998, 2000b) suggest a homogeneous
and a heterogeneous procedure. The first approach is based on a homogeneity
assumption for the structure of inefficiency, whereas the second approach allows
for possible heterogeneity in the structure of inefficiency. In this paper, we follow
the homogeneous case of the Simar–Wilson method since the homogeneity
conjecture is here credible and the computations do not meet the typical problems
of the heterogeneous bootstrap case. For this matter, we defer to the cited literature.13 The traditional view of the Farrell-efficiency concept corresponds to the
relationship between inputs and outputs usually with reference to micro units, but
the extension to a macro context where territorial areas are the units does not
represent a formal difficulty. In this paper, the units are the 24 countries and the
production process is virtual because we consider the two indexes IAR and IFB as
inputs and the three students’ PV for mathematics, reading and science as outputs.
No specific consideration is made about the adopted technology (considered as
space-invariant) and about returns to scale, assumed here as variable; different
options or other restrictions have a higher level of arbitrariness. Moreover, we have
chosen the output orientation because it is more suitable than input orientation. It
implies the goal of a greater output, i.e. higher students’ proficiency for given inputs
(that is, educational resources at home and family background), under the realistic
assumption that the units, to say the countries, seen as the ensemble of private and
public efforts and policies, are able to exercise a sufficient impact on inputs and
outputs, so the inputs are not conceived as environmental factors but de facto as
explanatory variables.
educational system), the bias of the classical DEA values and theconfidence interval at 95 per cent. A smaller score indicates agreater incapacity of the educational system to obtain higher levelsof students’ proficiency for given educational resources available athome and family background; obviously, the reasons could derivefrom lower investment and lower quality in school facilities,teachers’ training, etc.
It is interesting to note that Italy is in the last positionwith 0.8755, following Luxembourg (0.8807), Portugal (0.8987),Spain and United Kingdom (0.9035): roughly speaking, we cansay that these countries have good inputs and not so goodoutputs.14 At the top, we have Czech Republic with 0.9742,Estonia (0.9736), Netherlands (0.9649) and Finland (0.9640): onthe contrary, these countries have good outputs and not so goodinputs15. Finland get 4th position in the performance rank since,despite the first position for all three proficiencies, it has lessgood positions for the IAR and IFB indexes. Bulgaria andRomania get 10th and 15th positions respectively, since thesecountries present low levels of inputs but also low levels ofoutputs. Other countries, for example Greece and SlovakRepublic, show very bad inputs but intermediate outputs andso the performance score has higher positions (8th and 5threspectively).16
We study in detail the performance by student’s gender, schoolmanagement, school size and community size; correspondingtables and figures are presented in Appendix (Tables A1–A4 andFigs. A1–A4).
About student’s gender, we note that 7 among the first 10positions are occupied by male; on the contrary, the lastpositions are occupied by female. It is interesting to notice thatthe male for Italy is third from the last (0.8790), while Poland isfirst for male but 20th for female. Mostly, the male position isbetter than the female one with some exceptions, for exampleBulgaria (37 male vs. 30 female), Lithuania (21 vs. 15) andSlovenia (28 vs. 23).
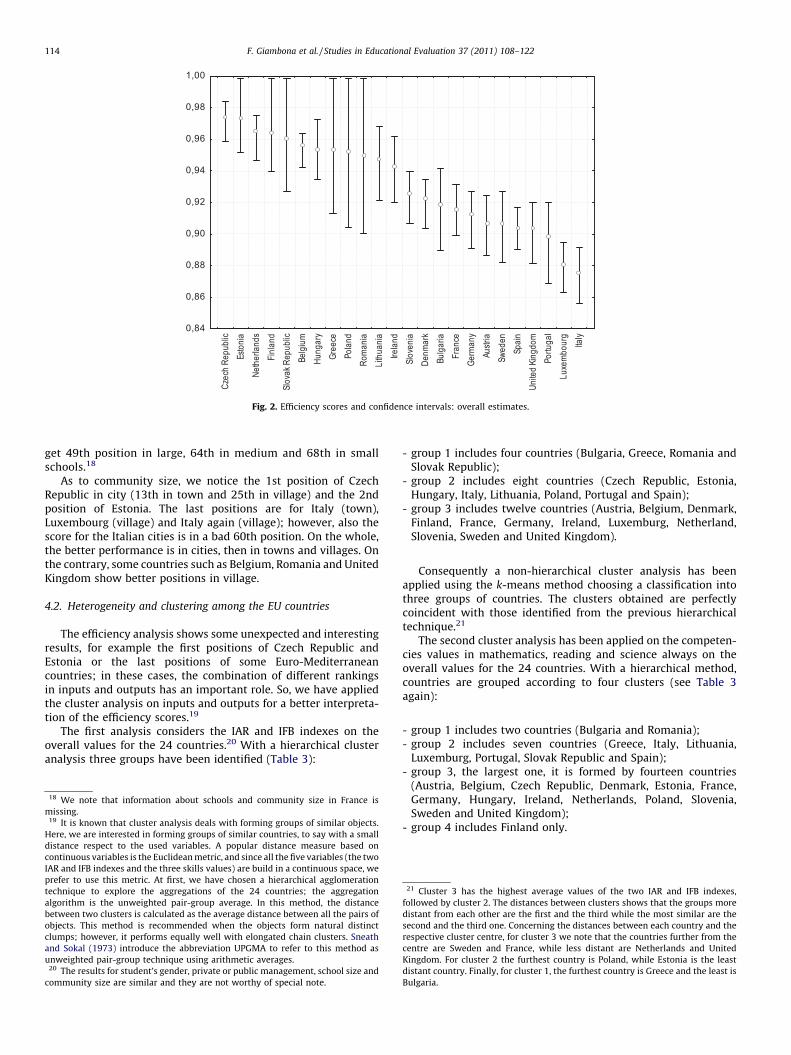
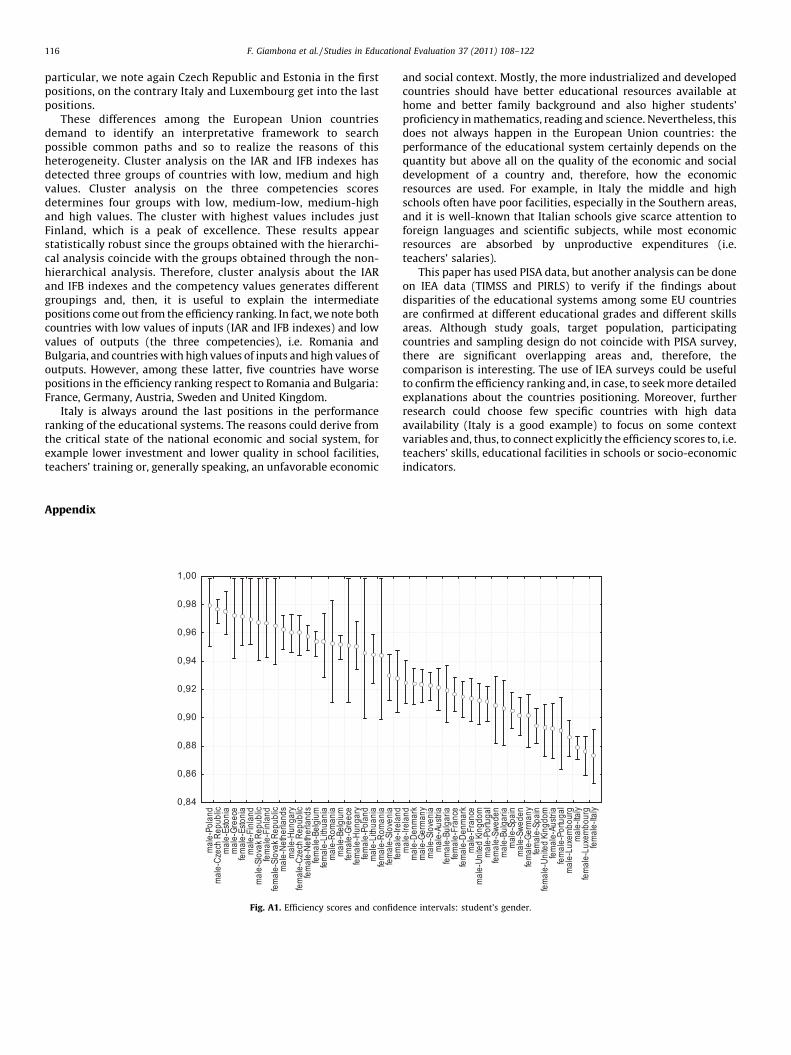
Concerning the public or private management, in generalterms, we note that private is better than public; in fact, in thefirst 10 positions we find 7 countries with private management,even if two public are very near to the relative private (Finlandand Estonia). The first position is for private in Greece (0.9840)but its public is 12th, while Luxembourg is in the last positionswith private and public. We note a great distance betweenprivate and public for United Kingdom and Slovenia. Italy,Austria, Slovak Republic and Czech Republic have betterpositions for public.17
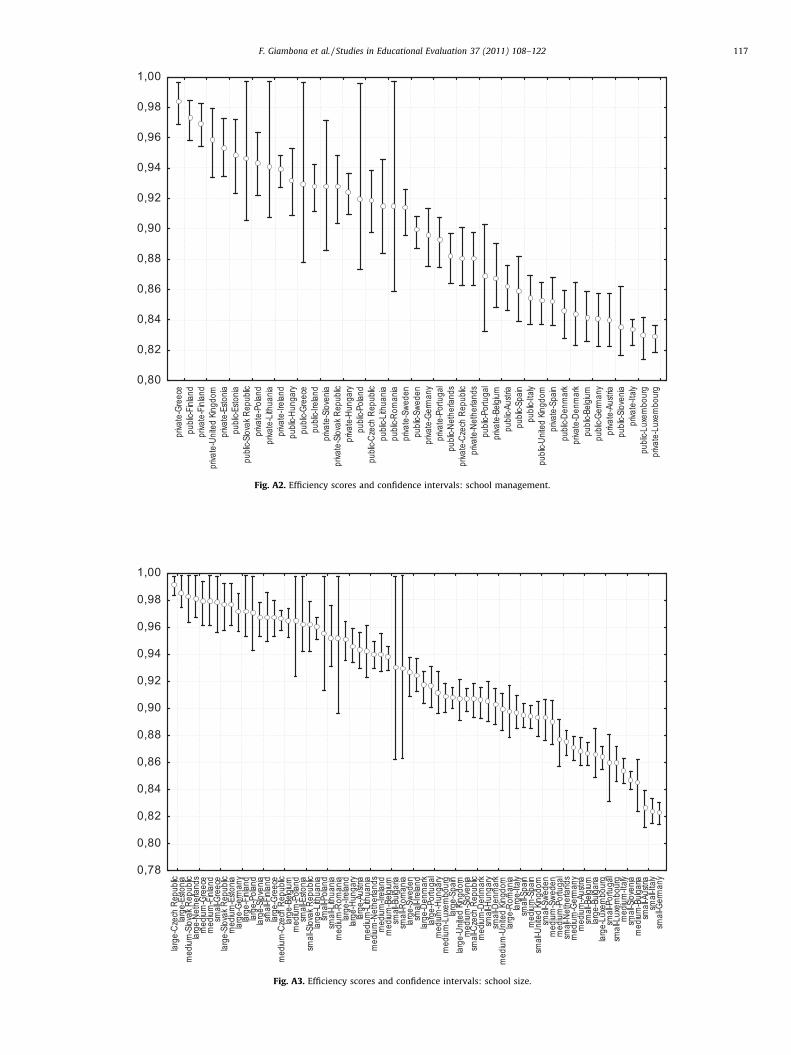
About the school size, Czech Republic and Estonia get,respectively, 1st and 2nd positions in large schools (0.9917 and0.9850), but they obtain worse positions in medium andespecially in small schools. The last positions are in the smallsize with Austria (0.8262), Italy (0.8239) and Germany (0.8227).As general rule, students’ performance is higher in large schoolsthan in medium and, so, medium schools are better than smallschools. We note that Germany, Netherlands and Sloveniapresent a great distance among large, medium and smallschools. Italy has low ranks in all the three categories since it
14 Italy is 13th in the IAR ranking and 15th in the IFB ranking, but 21st, 19th and
20th for proficiency in mathematics, reading and science respectively. Luxembourg
gets 6th and 4th positions in inputs but it is 16th in mathematics and reading and
19th in science.15 Czech Republic gets 12th and 17th positions in inputs but it is 6th in
mathematics and 7th in science even if it is 14th in reading.16 The ordered scores and the confidence intervals suggest some interpretative
cautions since sometimes they are wide and overlapping (that is in Romania, Poland
and Greece). But, Italy remains undoubtedly in the last position.17 Data about France and Bulgaria are missing while Romania has only public
management.
Czec
h Re
publ
icEs
toni
aNe
ther
lands
Finl
and
Slov
ak R
epub
licBe
lgiu
mHu
ngar
yGr
eece
Pola
ndRo
man
iaLi
thua
nia
Irela
ndSl
oven
iaDe
nmar
kBu
lgar
iaFr
ance
Germ
any
Austr
iaSw
eden
Spai
nUn
ited K
ingd
omPo
rtuga
lLu
xem
bour
gIta
ly
0,84
0,86
0,88
0,90
0,92
0,94
0,96
0,98
1,00
Fig. 2. Efficiency scores and confidence intervals: overall estimates.
F. Giambona et al. / Studies in Educational Evaluation 37 (2011) 108–122114
get 49th position in large, 64th in medium and 68th in smallschools.18
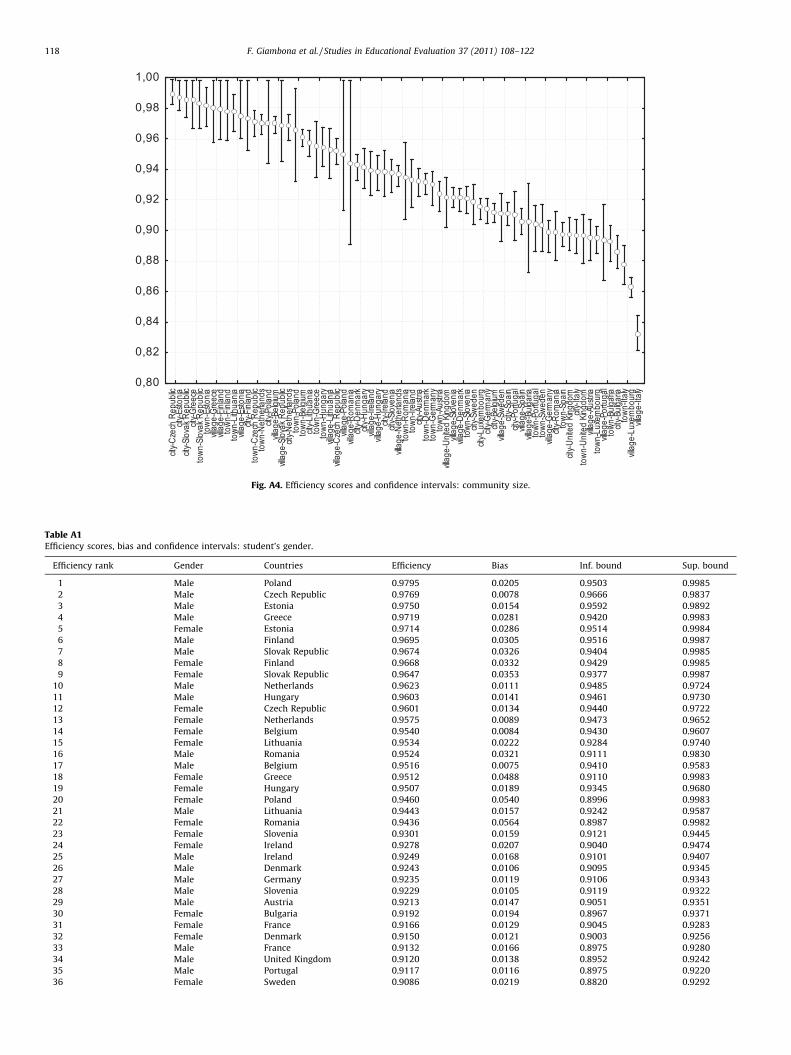
As to community size, we notice the 1st position of CzechRepublic in city (13th in town and 25th in village) and the 2ndposition of Estonia. The last positions are for Italy (town),Luxembourg (village) and Italy again (village); however, also thescore for the Italian cities is in a bad 60th position. On the whole,the better performance is in cities, then in towns and villages. Onthe contrary, some countries such as Belgium, Romania and UnitedKingdom show better positions in village.
4.2. Heterogeneity and clustering among the EU countries
The efficiency analysis shows some unexpected and interestingresults, for example the first positions of Czech Republic andEstonia or the last positions of some Euro-Mediterraneancountries; in these cases, the combination of different rankingsin inputs and outputs has an important role. So, we have appliedthe cluster analysis on inputs and outputs for a better interpreta-tion of the efficiency scores.19
The first analysis considers the IAR and IFB indexes on theoverall values for the 24 countries.20 With a hierarchical clusteranalysis three groups have been identified (Table 3):
18 We note that information about schools and community size in France is
missing.19 It is known that cluster analysis deals with forming groups of similar objects.
Here, we are interested in forming groups of similar countries, to say with a small
distance respect to the used variables. A popular distance measure based on
continuous variables is the Euclidean metric, and since all the five variables (the two
IAR and IFB indexes and the three skills values) are build in a continuous space, we
prefer to use this metric. At first, we have chosen a hierarchical agglomeration
technique to explore the aggregations of the 24 countries; the aggregation
algorithm is the unweighted pair-group average. In this method, the distance
between two clusters is calculated as the average distance between all the pairs of
objects. This method is recommended when the objects form natural distinct
clumps; however, it performs equally well with elongated chain clusters. Sneath
and Sokal (1973) introduce the abbreviation UPGMA to refer to this method as
unweighted pair-group technique using arithmetic averages.20 The results for student’s gender, private or public management, school size and
community size are similar and they are not worthy of special note.
- group 1 includes four countries (Bulgaria, Greece, Romania andSlovak Republic);
- group 2 includes eight countries (Czech Republic, Estonia,Hungary, Italy, Lithuania, Poland, Portugal and Spain);
- group 3 includes twelve countries (Austria, Belgium, Denmark,Finland, France, Germany, Ireland, Luxemburg, Netherland,Slovenia, Sweden and United Kingdom).
Consequently a non-hierarchical cluster analysis has beenapplied using the k-means method choosing a classification intothree groups of countries. The clusters obtained are perfectlycoincident with those identified from the previous hierarchicaltechnique.21
The second cluster analysis has been applied on the competen-cies values in mathematics, reading and science always on theoverall values for the 24 countries. With a hierarchical method,countries are grouped according to four clusters (see Table 3again):
- group 1 includes two countries (Bulgaria and Romania);- group 2 includes seven countries (Greece, Italy, Lithuania,
Luxemburg, Portugal, Slovak Republic and Spain);- group 3, the largest one, it is formed by fourteen countries
(Austria, Belgium, Czech Republic, Denmark, Estonia, France,Germany, Hungary, Ireland, Netherlands, Poland, Slovenia,Sweden and United Kingdom);
- group 4 includes Finland only.
21 Cluster 3 has the highest average values of the two IAR and IFB indexes,
followed by cluster 2. The distances between clusters shows that the groups more
distant from each other are the first and the third while the most similar are the
second and the third one. Concerning the distances between each country and the
respective cluster centre, for cluster 3 we note that the countries further from the
centre are Sweden and France, while less distant are Netherlands and United
Kingdom. For cluster 2 the furthest country is Poland, while Estonia is the least
distant country. Finally, for cluster 1, the furthest country is Greece and the least is
Bulgaria.
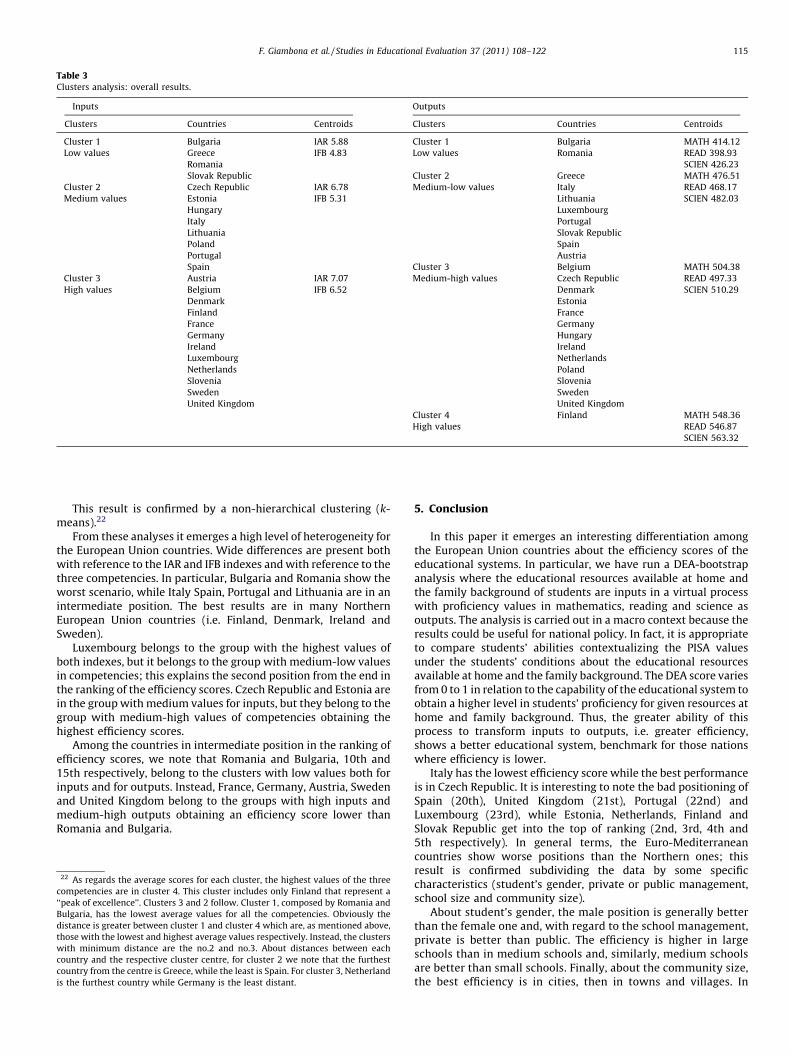
Table 3Clusters analysis: overall results.
Inputs Outputs
Clusters Countries Centroids Clusters Countries Centroids
Cluster 1 Bulgaria IAR 5.88 Cluster 1 Bulgaria MATH 414.12
Low values Greece IFB 4.83 Low values Romania READ 398.93
Romania SCIEN 426.23
Slovak Republic Cluster 2 Greece MATH 476.51
Cluster 2 Czech Republic IAR 6.78 Medium-low values Italy READ 468.17
Medium values Estonia IFB 5.31 Lithuania SCIEN 482.03
Hungary Luxembourg
Italy Portugal
Lithuania Slovak Republic
Poland Spain
Portugal Austria
Spain Cluster 3 Belgium MATH 504.38
Cluster 3 Austria IAR 7.07 Medium-high values Czech Republic READ 497.33
High values Belgium IFB 6.52 Denmark SCIEN 510.29
Denmark Estonia
Finland France
France Germany
Germany Hungary
Ireland Ireland
Luxembourg Netherlands
Netherlands Poland
Slovenia Slovenia
Sweden Sweden
United Kingdom United Kingdom
Cluster 4 Finland MATH 548.36
High values READ 546.87
SCIEN 563.32
F. Giambona et al. / Studies in Educational Evaluation 37 (2011) 108–122 115
This result is confirmed by a non-hierarchical clustering (k-means).22
From these analyses it emerges a high level of heterogeneity forthe European Union countries. Wide differences are present bothwith reference to the IAR and IFB indexes and with reference to thethree competencies. In particular, Bulgaria and Romania show theworst scenario, while Italy Spain, Portugal and Lithuania are in anintermediate position. The best results are in many NorthernEuropean Union countries (i.e. Finland, Denmark, Ireland andSweden).
Luxembourg belongs to the group with the highest values ofboth indexes, but it belongs to the group with medium-low valuesin competencies; this explains the second position from the end inthe ranking of the efficiency scores. Czech Republic and Estonia arein the group with medium values for inputs, but they belong to thegroup with medium-high values of competencies obtaining thehighest efficiency scores.
Among the countries in intermediate position in the ranking ofefficiency scores, we note that Romania and Bulgaria, 10th and15th respectively, belong to the clusters with low values both forinputs and for outputs. Instead, France, Germany, Austria, Swedenand United Kingdom belong to the groups with high inputs andmedium-high outputs obtaining an efficiency score lower thanRomania and Bulgaria.
22 As regards the average scores for each cluster, the highest values of the three
competencies are in cluster 4. This cluster includes only Finland that represent a
‘‘peak of excellence’’. Clusters 3 and 2 follow. Cluster 1, composed by Romania and
Bulgaria, has the lowest average values for all the competencies. Obviously the
distance is greater between cluster 1 and cluster 4 which are, as mentioned above,
those with the lowest and highest average values respectively. Instead, the clusters
with minimum distance are the no.2 and no.3. About distances between each
country and the respective cluster centre, for cluster 2 we note that the furthest
country from the centre is Greece, while the least is Spain. For cluster 3, Netherland
is the furthest country while Germany is the least distant.
5. Conclusion
In this paper it emerges an interesting differentiation amongthe European Union countries about the efficiency scores of theeducational systems. In particular, we have run a DEA-bootstrapanalysis where the educational resources available at home andthe family background of students are inputs in a virtual processwith proficiency values in mathematics, reading and science asoutputs. The analysis is carried out in a macro context because theresults could be useful for national policy. In fact, it is appropriateto compare students’ abilities contextualizing the PISA valuesunder the students’ conditions about the educational resourcesavailable at home and the family background. The DEA score variesfrom 0 to 1 in relation to the capability of the educational system toobtain a higher level in students’ proficiency for given resources athome and family background. Thus, the greater ability of thisprocess to transform inputs to outputs, i.e. greater efficiency,shows a better educational system, benchmark for those nationswhere efficiency is lower.
Italy has the lowest efficiency score while the best performanceis in Czech Republic. It is interesting to note the bad positioning ofSpain (20th), United Kingdom (21st), Portugal (22nd) andLuxembourg (23rd), while Estonia, Netherlands, Finland andSlovak Republic get into the top of ranking (2nd, 3rd, 4th and5th respectively). In general terms, the Euro-Mediterraneancountries show worse positions than the Northern ones; thisresult is confirmed subdividing the data by some specificcharacteristics (student’s gender, private or public management,school size and community size).
About student’s gender, the male position is generally betterthan the female one and, with regard to the school management,private is better than public. The efficiency is higher in largeschools than in medium schools and, similarly, medium schoolsare better than small schools. Finally, about the community size,the best efficiency is in cities, then in towns and villages. In
F. Giambona et al. / Studies in Educational Evaluation 37 (2011) 108–122116
particular, we note again Czech Republic and Estonia in the firstpositions, on the contrary Italy and Luxembourg get into the lastpositions.
These differences among the European Union countriesdemand to identify an interpretative framework to searchpossible common paths and so to realize the reasons of thisheterogeneity. Cluster analysis on the IAR and IFB indexes hasdetected three groups of countries with low, medium and highvalues. Cluster analysis on the three competencies scoresdetermines four groups with low, medium-low, medium-highand high values. The cluster with highest values includes justFinland, which is a peak of excellence. These results appearstatistically robust since the groups obtained with the hierarchi-cal analysis coincide with the groups obtained through the non-hierarchical analysis. Therefore, cluster analysis about the IARand IFB indexes and the competency values generates differentgroupings and, then, it is useful to explain the intermediatepositions come out from the efficiency ranking. In fact, we note bothcountries with low values of inputs (IAR and IFB indexes) and lowvalues of outputs (the three competencies), i.e. Romania andBulgaria, and countries with high values of inputs and high values ofoutputs. However, among these latter, five countries have worsepositions in the efficiency ranking respect to Romania and Bulgaria:France, Germany, Austria, Sweden and United Kingdom.
Italy is always around the last positions in the performanceranking of the educational systems. The reasons could derive fromthe critical state of the national economic and social system, forexample lower investment and lower quality in school facilities,teachers’ training or, generally speaking, an unfavorable economic
Appendix
mal
e-Po
land
mal
e-Cz
ech R
epub
licm
ale-E
stonia
male
-Gre
ece
fem
ale-
Esto
nia
mal
e-Fi
nlan
dm
ale-S
lova
k Rep
ublic
fem
ale-
Finl
and
fem
ale-
Slov
ak R
epub
licm
ale-
Neth
erla
nds
mal
e-Hu
ngar
yfe
male
-Cze
ch R
epub
licfe
mal
e-Ne
ther
lands
fem
ale-
Belgi
umfe
mal
e-Li
thua
nia
mal
e-Ro
man
iam
ale-B
elgi
umfe
mal
e-Gr
eece
fem
ale-
Hung
ary
fema
le-P
olan
dm
ale-L
ithua
nia
fema
le-R
oman
iafe
mal
e-Sl
oven
ia
0,84
0,86
0,88
0,90
0,92
0,94
0,96
0,98
1,00
Fig. A1. Efficiency scores and confide
and social context. Mostly, the more industrialized and developedcountries should have better educational resources available athome and better family background and also higher students’proficiency in mathematics, reading and science. Nevertheless, thisdoes not always happen in the European Union countries: theperformance of the educational system certainly depends on thequantity but above all on the quality of the economic and socialdevelopment of a country and, therefore, how the economicresources are used. For example, in Italy the middle and highschools often have poor facilities, especially in the Southern areas,and it is well-known that Italian schools give scarce attention toforeign languages and scientific subjects, while most economicresources are absorbed by unproductive expenditures (i.e.teachers’ salaries).
This paper has used PISA data, but another analysis can be doneon IEA data (TIMSS and PIRLS) to verify if the findings aboutdisparities of the educational systems among some EU countriesare confirmed at different educational grades and different skillsareas. Although study goals, target population, participatingcountries and sampling design do not coincide with PISA survey,there are significant overlapping areas and, therefore, thecomparison is interesting. The use of IEA surveys could be usefulto confirm the efficiency ranking and, in case, to seek more detailedexplanations about the countries positioning. Moreover, furtherresearch could choose few specific countries with high dataavailability (Italy is a good example) to focus on some contextvariables and, thus, to connect explicitly the efficiency scores to, i.e.teachers’ skills, educational facilities in schools or socio-economicindicators.
fema
le-Ir
elan
dm
ale-
Irela
ndm
ale-
Denm
ark
mal
e-Ge
rman
ym
ale-
Slov
enia
male
-Aus
tria
fema
le-B
ulga
riafe
male
-Fra
nce
fema
le-D
enm
ark
mal
e-Fr
ance
male
-Uni
ted K
ingd
omm
ale-
Portu
gal
fem
ale-
Swed
enm
ale-
Bulg
aria
male
-Spa
inm
ale-S
wede
nfe
male
-Ger
many
fem
ale-
Spain
fem
ale-
Unite
d Ki
ngdo
mfe
mal
e-Au
stria
fema
le-P
ortu
gal
mal
e-Lu
xemb
ourg
mal
e-Ita
lyfe
male
-Lux
embo
urg
fema
le-Ita
ly
nce intervals: student’s gender.
priva
te-G
reec
epu
blic-F
inlan
dpr
ivate
-Finl
and
priva
te-U
nited
King
dom
priva
te-E
stonia
publi
c-Esto
niapu
blic-S
lovak
Rep
ublic
priva
te-P
oland
priva
te-L
ithua
niapr
ivate
-Irela
ndpu
blic-H
unga
rypu
blic-G
reec
epu
blic-I
relan
dpr
ivate
-Slov
enia
priva
te-S
lovak
Rep
ublic
priva
te-H
unga
rypu
blic-P
oland
publi
c-Cze
ch R
epub
licpu
blic-L
ithua
niapu
blic-R
oman
iapr
ivate
-Swe
den
publi
c-Swe
den
priva
te-G
erm
any
priva
te-P
ortu
gal
publi
c-Net
herla
nds
priva
te-C
zech
Rep
ublic
priva
te-N
ethe
rland
spu
blic-P
ortu
gal
priva
te-B
elgium
publi
c-Aus
triapu
blic-S
pain
publi
c-Ita
lypu
blic-U
nited
King
dom
priva
te-S
pain
publi
c-Den
mar
kpr
ivate
-Den
mar
kpu
blic-B
elgium
publi
c-Ger
man
ypr
ivate
-Aus
triapu
blic-S
loven
iapr
ivate
-Italy
publi
c-Lux
embo
urg
priva
te-L
uxem
bour
g
0,80
0,82
0,84
0,86
0,88
0,90
0,92
0,94
0,96
0,98
1,00
Fig. A2. Efficiency scores and confidence intervals: school management.
large
-Cze
ch R
epub
liclar
ge-E
stonia
med
ium-S
lovak
Rep
ublic
large
-Net
herla
nds
med
ium-G
reec
em
edium
-Finl
and
small
-Gre
ece
large
-Slov
ak R
epub
licm
edium
-Esto
nialar
ge-G
erm
any
large
-Finl
and
large
-Pola
ndlar
ge-S
loven
iasm
all-F
inlan
dlar
ge-G
reec
em
edium
-Cze
ch R
epub
liclar
ge-B
elgium
med
ium-P
oland
small
-Esto
niasm
all-S
lovak
Rep
ublic
large
-Lith
uania
small
-Pola
ndsm
all-L
ithua
niam
edium
-Rom
ania
large
-Irela
ndlar
ge-H
unga
rylar
ge-A
ustria
med
ium-L
ithua
niam
edium
-Net
herla
nds
med
ium-Ir
eland
med
ium-B
elgium
small
-Bulg
aria
small
-Rom
ania
large
-Swe
den
small
-Irela
ndlar
ge-D
enm
ark
large
-Por
tuga
lm
edium
-Hun
gary
med
ium-L
uxem
bour
glar
ge-S
pain
large
-Unit
ed K
ingdo
mm
edium
-Slov
enia
small
-Cze
ch R
epub
licm
edium
-Den
mar
ksm
all-H
unga
rysm
all-D
enm
ark
med
ium-U
nited
King
dom
large
-Rom
ania
large
-Italy
small
-Spa
inm
edium
-Spa
insm
all-U
nited
King
dom
small
-Swe
den
med
ium-S
wede
nm
edium
-Por
tuga
lsm
all-N
ethe
rland
sm
edium
-Ger
man
ym
edium
-Aus
triasm
all-B
elgium
large
-Bulg
aria
large
-Lux
embo
urg
small
-Por
tuga
lsm
all-L
uxem
bour
gm
edium
-Italy
small
-Slov
enia
med
ium-B
ulgar
iasm
all-A
ustria
small
-Italy
small
-Ger
man
y0,78
0,80
0,82
0,84
0,86
0,88
0,90
0,92
0,94
0,96
0,98
1,00
Fig. A3. Efficiency scores and confidence intervals: school size.
F. Giambona et al. / Studies in Educational Evaluation 37 (2011) 108–122 117
city-C
zech
Rep
ublic
city-E
stonia
city-S
lovak
Rep
ublic
city-G
reec
eto
wn-S
lovak
Rep
ublic
town
-Esto
niavill
age-
Gree
cevill
age-
Finlan
dto
wn-F
inlan
dto
wn-L
ithua
niavill
age-
Esto
niacit
y-Finl
and
town
-Cze
ch R
epub
licto
wn-N
ethe
rland
scit
y-Pola
ndvill
age-
Belgi
umvill
age-
Slova
k Rep
ublic
city-N
ethe
rland
sto
wn-P
oland
town
-Belg
iumcit
y-Lith
uania
town
-Gre
ece
town
-Hun
gary
villag
e-Lit
huan
iavill
age-
Czec
h Re
publi
cvill
age-
Polan
dvill
age-
Rom
ania
city-D
enm
ark
city-H
unga
ryvill
age-
Irelan
dvill
age-
Hung
ary
city-I
relan
dcit
y-Slov
enia
villag
e-Ne
ther
lands
town
-Rom
ania
town
-Irela
ndcit
y-Aus
triato
wn-D
enm
ark
town
-Ger
man
yto
wn-A
ustria
villag
e-Un
ited
Kingd
omvill
age-
Slove
niavill
age-
Denm
ark
town
-Slov
enia
city-S
wede
ncit
y-Lux
embo
urg
city-G
erm
any
city-B
elgium
villag
e-Sw
eden
city-S
pain
city-P
ortu
gal
villag
e-Sp
ainvill
age-
Bulga
riato
wn-P
ortu
gal
town
-Swe
den
villag
e-Ge
rman
ycit
y-Rom
ania
town
-Spa
incit
y-Unit
ed K
ingdo
mcit
y-Ita
lyto
wn-U
nited
King
dom
villag
e-Au
stria
town
-Lux
embo
urg
villag
e-Po
rtuga
lto
wn-B
ulgar
iacit
y-Bulg
aria
town
-Italy
villag
e-Lu
xem
bour
gvill
age-
Italy
0,80
0,82
0,84
0,86
0,88
0,90
0,92
0,94
0,96
0,98
1,00
Fig. A4. Efficiency scores and confidence intervals: community size.
Table A1Efficiency scores, bias and confidence intervals: student’s gender.
Efficiency rank Gender Countries Efficiency Bias Inf. bound Sup. bound
1 Male Poland 0.9795 0.0205 0.9503 0.9985
2 Male Czech Republic 0.9769 0.0078 0.9666 0.9837
3 Male Estonia 0.9750 0.0154 0.9592 0.9892
4 Male Greece 0.9719 0.0281 0.9420 0.9983
5 Female Estonia 0.9714 0.0286 0.9514 0.9984
6 Male Finland 0.9695 0.0305 0.9516 0.9987
7 Male Slovak Republic 0.9674 0.0326 0.9404 0.9985
8 Female Finland 0.9668 0.0332 0.9429 0.9985
9 Female Slovak Republic 0.9647 0.0353 0.9377 0.9987
10 Male Netherlands 0.9623 0.0111 0.9485 0.9724
11 Male Hungary 0.9603 0.0141 0.9461 0.9730
12 Female Czech Republic 0.9601 0.0134 0.9440 0.9722
13 Female Netherlands 0.9575 0.0089 0.9473 0.9652
14 Female Belgium 0.9540 0.0084 0.9430 0.9607
15 Female Lithuania 0.9534 0.0222 0.9284 0.9740
16 Male Romania 0.9524 0.0321 0.9111 0.9830
17 Male Belgium 0.9516 0.0075 0.9410 0.9583
18 Female Greece 0.9512 0.0488 0.9110 0.9983
19 Female Hungary 0.9507 0.0189 0.9345 0.9680
20 Female Poland 0.9460 0.0540 0.8996 0.9983
21 Male Lithuania 0.9443 0.0157 0.9242 0.9587
22 Female Romania 0.9436 0.0564 0.8987 0.9982
23 Female Slovenia 0.9301 0.0159 0.9121 0.9445
24 Female Ireland 0.9278 0.0207 0.9040 0.9474
25 Male Ireland 0.9249 0.0168 0.9101 0.9407
26 Male Denmark 0.9243 0.0106 0.9095 0.9345
27 Male Germany 0.9235 0.0119 0.9106 0.9343
28 Male Slovenia 0.9229 0.0105 0.9119 0.9322
29 Male Austria 0.9213 0.0147 0.9051 0.9351
30 Female Bulgaria 0.9192 0.0194 0.8967 0.9371
31 Female France 0.9166 0.0129 0.9045 0.9283
32 Female Denmark 0.9150 0.0121 0.9003 0.9256
33 Male France 0.9132 0.0166 0.8975 0.9280
34 Male United Kingdom 0.9120 0.0138 0.8952 0.9242
35 Male Portugal 0.9117 0.0116 0.8975 0.9220
36 Female Sweden 0.9086 0.0219 0.8820 0.9292
F. Giambona et al. / Studies in Educational Evaluation 37 (2011) 108–122118
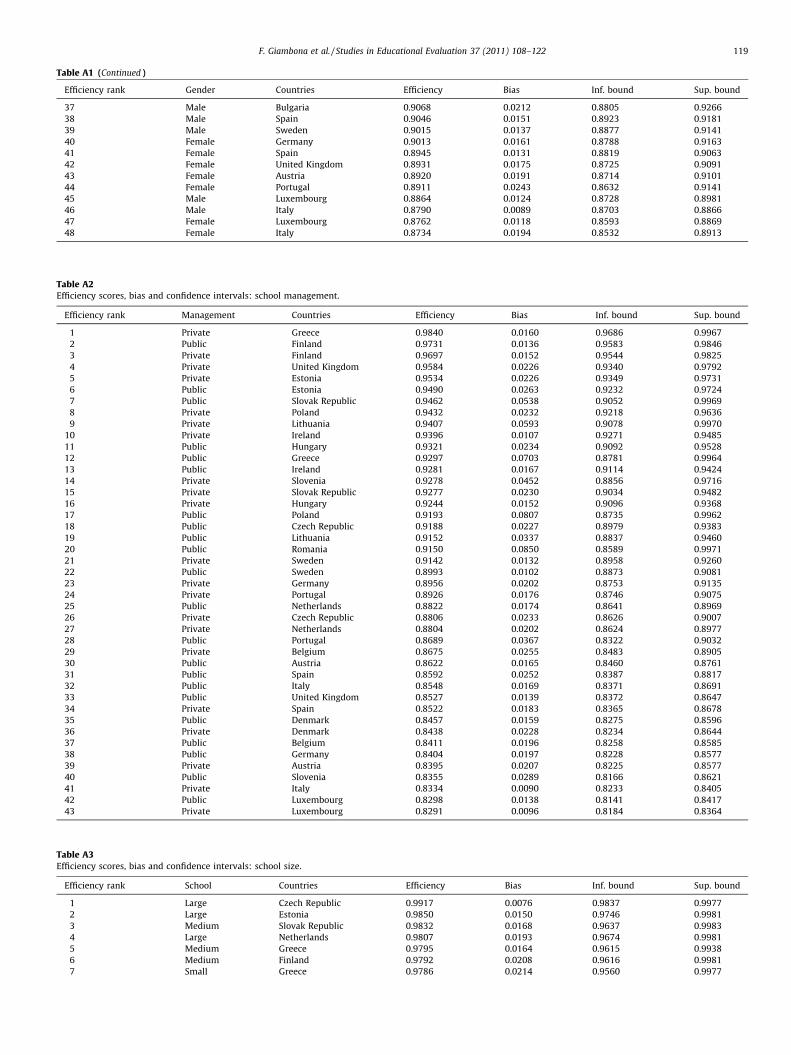
Table A2Efficiency scores, bias and confidence intervals: school management.
Efficiency rank Management Countries Efficiency Bias Inf. bound Sup. bound
1 Private Greece 0.9840 0.0160 0.9686 0.9967
2 Public Finland 0.9731 0.0136 0.9583 0.9846
3 Private Finland 0.9697 0.0152 0.9544 0.9825
4 Private United Kingdom 0.9584 0.0226 0.9340 0.9792
5 Private Estonia 0.9534 0.0226 0.9349 0.9731
6 Public Estonia 0.9490 0.0263 0.9232 0.9724
7 Public Slovak Republic 0.9462 0.0538 0.9052 0.9969
8 Private Poland 0.9432 0.0232 0.9218 0.9636
9 Private Lithuania 0.9407 0.0593 0.9078 0.9970
10 Private Ireland 0.9396 0.0107 0.9271 0.9485
11 Public Hungary 0.9321 0.0234 0.9092 0.9528
12 Public Greece 0.9297 0.0703 0.8781 0.9964
13 Public Ireland 0.9281 0.0167 0.9114 0.9424
14 Private Slovenia 0.9278 0.0452 0.8856 0.9716
15 Private Slovak Republic 0.9277 0.0230 0.9034 0.9482
16 Private Hungary 0.9244 0.0152 0.9096 0.9368
17 Public Poland 0.9193 0.0807 0.8735 0.9962
18 Public Czech Republic 0.9188 0.0227 0.8979 0.9383
19 Public Lithuania 0.9152 0.0337 0.8837 0.9460
20 Public Romania 0.9150 0.0850 0.8589 0.9971
21 Private Sweden 0.9142 0.0132 0.8958 0.9260
22 Public Sweden 0.8993 0.0102 0.8873 0.9081
23 Private Germany 0.8956 0.0202 0.8753 0.9135
24 Private Portugal 0.8926 0.0176 0.8746 0.9075
25 Public Netherlands 0.8822 0.0174 0.8641 0.8969
26 Private Czech Republic 0.8806 0.0233 0.8626 0.9007
27 Private Netherlands 0.8804 0.0202 0.8624 0.8977
28 Public Portugal 0.8689 0.0367 0.8322 0.9032
29 Private Belgium 0.8675 0.0255 0.8483 0.8905
30 Public Austria 0.8622 0.0165 0.8460 0.8761
31 Public Spain 0.8592 0.0252 0.8387 0.8817
32 Public Italy 0.8548 0.0169 0.8371 0.8691
33 Public United Kingdom 0.8527 0.0139 0.8372 0.8647
34 Private Spain 0.8522 0.0183 0.8365 0.8678
35 Public Denmark 0.8457 0.0159 0.8275 0.8596
36 Private Denmark 0.8438 0.0228 0.8234 0.8644
37 Public Belgium 0.8411 0.0196 0.8258 0.8585
38 Public Germany 0.8404 0.0197 0.8228 0.8577
39 Private Austria 0.8395 0.0207 0.8225 0.8577
40 Public Slovenia 0.8355 0.0289 0.8166 0.8621
41 Private Italy 0.8334 0.0090 0.8233 0.8405
42 Public Luxembourg 0.8298 0.0138 0.8141 0.8417
43 Private Luxembourg 0.8291 0.0096 0.8184 0.8364
Table A1 (Continued )
Efficiency rank Gender Countries Efficiency Bias Inf. bound Sup. bound
37 Male Bulgaria 0.9068 0.0212 0.8805 0.9266
38 Male Spain 0.9046 0.0151 0.8923 0.9181
39 Male Sweden 0.9015 0.0137 0.8877 0.9141
40 Female Germany 0.9013 0.0161 0.8788 0.9163
41 Female Spain 0.8945 0.0131 0.8819 0.9063
42 Female United Kingdom 0.8931 0.0175 0.8725 0.9091
43 Female Austria 0.8920 0.0191 0.8714 0.9101
44 Female Portugal 0.8911 0.0243 0.8632 0.9141
45 Male Luxembourg 0.8864 0.0124 0.8728 0.8981
46 Male Italy 0.8790 0.0089 0.8703 0.8866
47 Female Luxembourg 0.8762 0.0118 0.8593 0.8869
48 Female Italy 0.8734 0.0194 0.8532 0.8913
Table A3Efficiency scores, bias and confidence intervals: school size.
Efficiency rank School Countries Efficiency Bias Inf. bound Sup. bound
1 Large Czech Republic 0.9917 0.0076 0.9837 0.9977
2 Large Estonia 0.9850 0.0150 0.9746 0.9981
3 Medium Slovak Republic 0.9832 0.0168 0.9637 0.9983
4 Large Netherlands 0.9807 0.0193 0.9674 0.9981
5 Medium Greece 0.9795 0.0164 0.9615 0.9938
6 Medium Finland 0.9792 0.0208 0.9616 0.9981
7 Small Greece 0.9786 0.0214 0.9560 0.9977
F. Giambona et al. / Studies in Educational Evaluation 37 (2011) 108–122 119
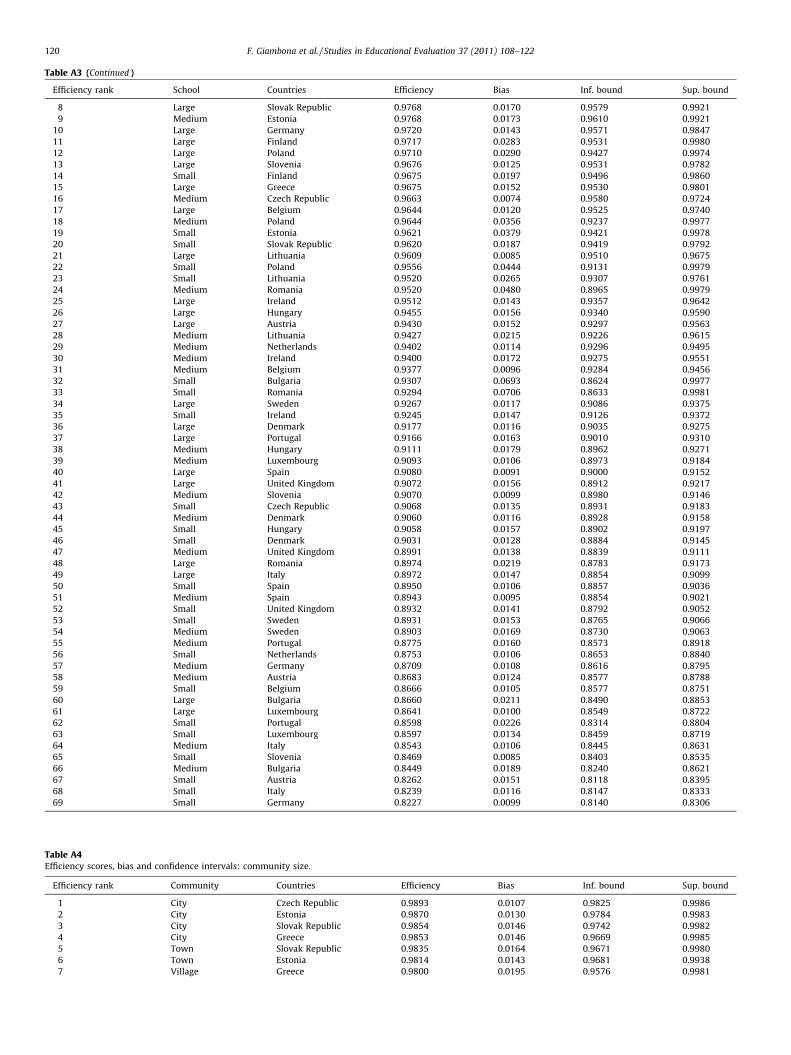
Table A3 (Continued )
Efficiency rank School Countries Efficiency Bias Inf. bound Sup. bound
8 Large Slovak Republic 0.9768 0.0170 0.9579 0.9921
9 Medium Estonia 0.9768 0.0173 0.9610 0.9921
10 Large Germany 0.9720 0.0143 0.9571 0.9847
11 Large Finland 0.9717 0.0283 0.9531 0.9980
12 Large Poland 0.9710 0.0290 0.9427 0.9974
13 Large Slovenia 0.9676 0.0125 0.9531 0.9782
14 Small Finland 0.9675 0.0197 0.9496 0.9860
15 Large Greece 0.9675 0.0152 0.9530 0.9801
16 Medium Czech Republic 0.9663 0.0074 0.9580 0.9724
17 Large Belgium 0.9644 0.0120 0.9525 0.9740
18 Medium Poland 0.9644 0.0356 0.9237 0.9977
19 Small Estonia 0.9621 0.0379 0.9421 0.9978
20 Small Slovak Republic 0.9620 0.0187 0.9419 0.9792
21 Large Lithuania 0.9609 0.0085 0.9510 0.9675
22 Small Poland 0.9556 0.0444 0.9131 0.9979
23 Small Lithuania 0.9520 0.0265 0.9307 0.9761
24 Medium Romania 0.9520 0.0480 0.8965 0.9979
25 Large Ireland 0.9512 0.0143 0.9357 0.9642
26 Large Hungary 0.9455 0.0156 0.9340 0.9590
27 Large Austria 0.9430 0.0152 0.9297 0.9563
28 Medium Lithuania 0.9427 0.0215 0.9226 0.9615
29 Medium Netherlands 0.9402 0.0114 0.9296 0.9495
30 Medium Ireland 0.9400 0.0172 0.9275 0.9551
31 Medium Belgium 0.9377 0.0096 0.9284 0.9456
32 Small Bulgaria 0.9307 0.0693 0.8624 0.9977
33 Small Romania 0.9294 0.0706 0.8633 0.9981
34 Large Sweden 0.9267 0.0117 0.9086 0.9375
35 Small Ireland 0.9245 0.0147 0.9126 0.9372
36 Large Denmark 0.9177 0.0116 0.9035 0.9275
37 Large Portugal 0.9166 0.0163 0.9010 0.9310
38 Medium Hungary 0.9111 0.0179 0.8962 0.9271
39 Medium Luxembourg 0.9093 0.0106 0.8973 0.9184
40 Large Spain 0.9080 0.0091 0.9000 0.9152
41 Large United Kingdom 0.9072 0.0156 0.8912 0.9217
42 Medium Slovenia 0.9070 0.0099 0.8980 0.9146
43 Small Czech Republic 0.9068 0.0135 0.8931 0.9183
44 Medium Denmark 0.9060 0.0116 0.8928 0.9158
45 Small Hungary 0.9058 0.0157 0.8902 0.9197
46 Small Denmark 0.9031 0.0128 0.8884 0.9145
47 Medium United Kingdom 0.8991 0.0138 0.8839 0.9111
48 Large Romania 0.8974 0.0219 0.8783 0.9173
49 Large Italy 0.8972 0.0147 0.8854 0.9099
50 Small Spain 0.8950 0.0106 0.8857 0.9036
51 Medium Spain 0.8943 0.0095 0.8854 0.9021
52 Small United Kingdom 0.8932 0.0141 0.8792 0.9052
53 Small Sweden 0.8931 0.0153 0.8765 0.9066
54 Medium Sweden 0.8903 0.0169 0.8730 0.9063
55 Medium Portugal 0.8775 0.0160 0.8573 0.8918
56 Small Netherlands 0.8753 0.0106 0.8653 0.8840
57 Medium Germany 0.8709 0.0108 0.8616 0.8795
58 Medium Austria 0.8683 0.0124 0.8577 0.8788
59 Small Belgium 0.8666 0.0105 0.8577 0.8751
60 Large Bulgaria 0.8660 0.0211 0.8490 0.8853
61 Large Luxembourg 0.8641 0.0100 0.8549 0.8722
62 Small Portugal 0.8598 0.0226 0.8314 0.8804
63 Small Luxembourg 0.8597 0.0134 0.8459 0.8719
64 Medium Italy 0.8543 0.0106 0.8445 0.8631
65 Small Slovenia 0.8469 0.0085 0.8403 0.8535
66 Medium Bulgaria 0.8449 0.0189 0.8240 0.8621
67 Small Austria 0.8262 0.0151 0.8118 0.8395
68 Small Italy 0.8239 0.0116 0.8147 0.8333
69 Small Germany 0.8227 0.0099 0.8140 0.8306
Table A4Efficiency scores, bias and confidence intervals: community size.
Efficiency rank Community Countries Efficiency Bias Inf. bound Sup. bound
1 City Czech Republic 0.9893 0.0107 0.9825 0.9986
2 City Estonia 0.9870 0.0130 0.9784 0.9983
3 City Slovak Republic 0.9854 0.0146 0.9742 0.9982
4 City Greece 0.9853 0.0146 0.9669 0.9985
5 Town Slovak Republic 0.9835 0.0164 0.9671 0.9980
6 Town Estonia 0.9814 0.0143 0.9681 0.9938
7 Village Greece 0.9800 0.0195 0.9576 0.9981
F. Giambona et al. / Studies in Educational Evaluation 37 (2011) 108–122120
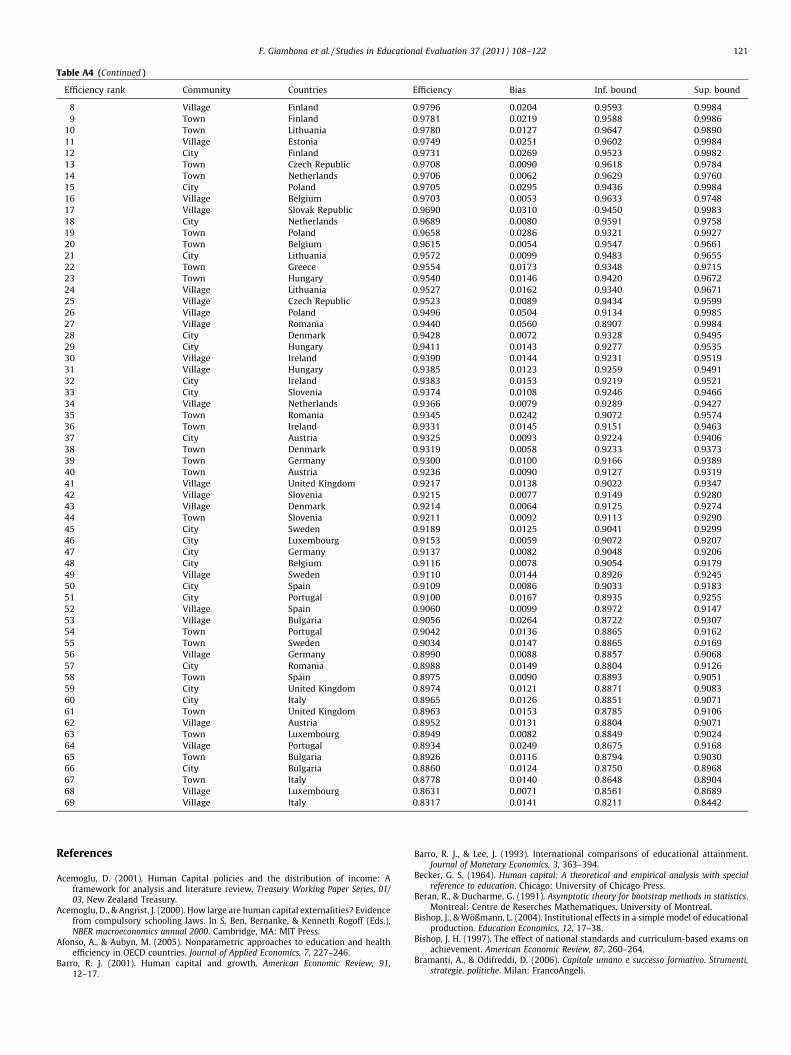
Table A4 (Continued )
Efficiency rank Community Countries Efficiency Bias Inf. bound Sup. bound
8 Village Finland 0.9796 0.0204 0.9593 0.9984
9 Town Finland 0.9781 0.0219 0.9588 0.9986
10 Town Lithuania 0.9780 0.0127 0.9647 0.9890
11 Village Estonia 0.9749 0.0251 0.9602 0.9984
12 City Finland 0.9731 0.0269 0.9523 0.9982
13 Town Czech Republic 0.9708 0.0090 0.9618 0.9784
14 Town Netherlands 0.9706 0.0062 0.9629 0.9760
15 City Poland 0.9705 0.0295 0.9436 0.9984
16 Village Belgium 0.9703 0.0053 0.9633 0.9748
17 Village Slovak Republic 0.9690 0.0310 0.9450 0.9983
18 City Netherlands 0.9689 0.0080 0.9591 0.9758
19 Town Poland 0.9658 0.0286 0.9321 0.9927
20 Town Belgium 0.9615 0.0054 0.9547 0.9661
21 City Lithuania 0.9572 0.0099 0.9483 0.9655
22 Town Greece 0.9554 0.0173 0.9348 0.9715
23 Town Hungary 0.9540 0.0146 0.9420 0.9672
24 Village Lithuania 0.9527 0.0162 0.9340 0.9671
25 Village Czech Republic 0.9523 0.0089 0.9434 0.9599
26 Village Poland 0.9496 0.0504 0.9134 0.9985
27 Village Romania 0.9440 0.0560 0.8907 0.9984
28 City Denmark 0.9428 0.0072 0.9328 0.9495
29 City Hungary 0.9411 0.0143 0.9277 0.9535
30 Village Ireland 0.9390 0.0144 0.9231 0.9519
31 Village Hungary 0.9385 0.0123 0.9259 0.9491
32 City Ireland 0.9383 0.0153 0.9219 0.9521
33 City Slovenia 0.9374 0.0108 0.9246 0.9466
34 Village Netherlands 0.9366 0.0079 0.9289 0.9427
35 Town Romania 0.9345 0.0242 0.9072 0.9574
36 Town Ireland 0.9331 0.0145 0.9151 0.9463
37 City Austria 0.9325 0.0093 0.9224 0.9406
38 Town Denmark 0.9319 0.0058 0.9233 0.9373
39 Town Germany 0.9300 0.0100 0.9166 0.9389
40 Town Austria 0.9236 0.0090 0.9127 0.9319
41 Village United Kingdom 0.9217 0.0138 0.9022 0.9347
42 Village Slovenia 0.9215 0.0077 0.9149 0.9280
43 Village Denmark 0.9214 0.0064 0.9125 0.9274
44 Town Slovenia 0.9211 0.0092 0.9113 0.9290
45 City Sweden 0.9189 0.0125 0.9041 0.9299
46 City Luxembourg 0.9153 0.0059 0.9072 0.9207
47 City Germany 0.9137 0.0082 0.9048 0.9206
48 City Belgium 0.9116 0.0078 0.9054 0.9179
49 Village Sweden 0.9110 0.0144 0.8926 0.9245
50 City Spain 0.9109 0.0086 0.9033 0.9183
51 City Portugal 0.9100 0.0167 0.8935 0.9255
52 Village Spain 0.9060 0.0099 0.8972 0.9147
53 Village Bulgaria 0.9056 0.0264 0.8722 0.9307
54 Town Portugal 0.9042 0.0136 0.8865 0.9162
55 Town Sweden 0.9034 0.0147 0.8865 0.9169
56 Village Germany 0.8990 0.0088 0.8857 0.9068
57 City Romania 0.8988 0.0149 0.8804 0.9126
58 Town Spain 0.8975 0.0090 0.8893 0.9051
59 City United Kingdom 0.8974 0.0121 0.8871 0.9083
60 City Italy 0.8965 0.0126 0.8851 0.9071
61 Town United Kingdom 0.8963 0.0153 0.8785 0.9106
62 Village Austria 0.8952 0.0131 0.8804 0.9071
63 Town Luxembourg 0.8949 0.0082 0.8849 0.9024
64 Village Portugal 0.8934 0.0249 0.8675 0.9168
65 Town Bulgaria 0.8926 0.0116 0.8794 0.9030
66 City Bulgaria 0.8860 0.0124 0.8750 0.8968
67 Town Italy 0.8778 0.0140 0.8648 0.8904
68 Village Luxembourg 0.8631 0.0071 0.8561 0.8689
69 Village Italy 0.8317 0.0141 0.8211 0.8442
F. Giambona et al. / Studies in Educational Evaluation 37 (2011) 108–122 121
References
Acemoglu, D. (2001). Human Capital policies and the distribution of income: Aframework for analysis and literature review, Treasury Working Paper Series, 01/03, New Zealand Treasury.
Acemoglu, D., & Angrist, J. (2000). How large are human capital externalities? Evidencefrom compulsory schooling laws. In S. Ben, Bernanke, & Kenneth Rogoff (Eds.),NBER macroeconomics annual 2000. Cambridge, MA: MIT Press.
Afonso, A., & Aubyn, M. (2005). Nonparametric approaches to education and healthefficiency in OECD countries. Journal of Applied Economics, 7, 227–246.
Barro, R. J. (2001). Human capital and growth. American Economic Review, 91,12–17.
Barro, R. J., & Lee, J. (1993). International comparisons of educational attainment.Journal of Monetary Economics, 3, 363–394.
Becker, G. S. (1964). Human capital: A theoretical and empirical analysis with specialreference to education. Chicago: University of Chicago Press.
Beran, R., & Ducharme, G. (1991). Asymptotic theory for bootstrap methods in statistics.Montreal: Centre de Reserches Mathematiques, University of Montreal.
Bishop, J., & Woßmann, L. (2004). Institutional effects in a simple model of educationalproduction. Education Economics, 12, 17–38.
Bishop, J. H. (1997). The effect of national standards and curriculum-based exams onachievement. American Economic Review, 87, 260–264.
Bramanti, A., & Odifreddi, D. (2006). Capitale umano e successo formativo. Strumenti,strategie, politiche. Milan: FrancoAngeli.
F. Giambona et al. / Studies in Educational Evaluation 37 (2011) 108–122122
Bratti, M., Checchi, D., & Filippin A. (2007). Territorial differences in Italian studentsmathematical competences: Evidence from PISA 2003. Discussion Paper Series IZA2603.
Brunello, G., & Checchi, D. (2005). School quality and family background in Italy.Economics of Education Review, 24, 563–577.
Brunello, G., & Rocco, L. (2008). Educational standards in private and public schools. TheEconomic Journal, 118(533), 1866–1887.
Checchi, D. (2004). Da dove vengono le competenze scolastiche? L’indagine PISA 2000in Italia. Stato e Mercato, 72, 413–453.
Checchi, D., & Flabbi, L. (2006). Mobilita intergenerazionale e decisioni scolastiche inItalia. In G. Ballarino & D. Checchi (Eds.), Scelte individuali e vincoli strutturali.Sistema scolastico e disuguaglianza sociale. Bologna: Il Mulino.
Cohen, D., & Soto, M. (2007). Growth and human capital: Good data, good results.Journal of Economic Growth, 12, 51–76.
Coleman, J. (1966). Equality of educational opportunity. Washington: US Department ofHealth, Educational and Welfare, Office of Education, Government Printing Office.
Cooper, S. T., & Cohn, E. (1997). Estimation of a frontier production function for theSouth Carolina educational process. Economics of Education Review, 3, 313–327.
Cunha, F., Heckman, J. J., Lochner, L., & Masterov, D. V. (2006). Interpreting the evidenceon life cycle skill formation. In E. A. Hanushek & F. Welch (Eds.), Handbook of theeconomics of education. Amsterdam: North-Holland.
Currie, J., & Moretti, E. (2003). Mother’s education and the intergenerational transmis-sion of human capital: Evidence from college openings. Quarterly Journal ofEconomics, 118, 1495–1532.
Currie, J., & Thomas, D. (2001). Early test scores, school quality and SES: Longrun effectson wage and employment outcomes. Research in Labor Economics, 20, 103–132.
Cutillo, A., Strozza, M., & Ungaro, P. (2004). Il processo di costruzione del capitaleumano: analisi delle determinanti dei percorsi formativi nell’universita italiana. Isensi della ricerca: interdisciplinarieta e temi di frontiera negli studi di popolazione.Rome: Dipartimento di Scienze Demografiche, Universita degli Studi La Sapienza.
De La Fuente, A., & Ciccone A. (2002). Human capital and growth in a global andknowledge-based Economy. Report for the European Commission, Directorate-General for Employment and Social Affairs. Brussels.
Efron, B., & Tibshirani, R. (1993). An introduction to the bootstrap. London: Chapman andHall.
Fagerlind, A., & Saha, L. J. (1997). Education and national developments. New Delhi: ReedEducational and Professional Publishing.
Feinstein, L. (2004). Mobility in pupils’ cognitive attainment during school life. OxfordReview of Economic Policy, 20, 213–229.
Ferrier, G. D., & Hirschberg, J. G. (1997). Bootstrapping confidence intervals for linearprogramming efficiency scores: With an illustration using Italian bank data. Journalof Productivity Analysis, 8, 19–33.
Førsund, F., & Sarafoglou, N. (2005). The tale of two research communities: Thediffusion of research on productive efficiency. International Journal of ProductionEconomics, 98, 17–40.
Fuchs, T., & Woßmann, L. (2004). Governance and primary-school performance: Interna-tional evidence. IFO Institute for Economic Research, University of Munich. Mimeo.
Gundlach, E., Woßmann, L., & Gmelin, J. (2001). The decline of schooling productivity inOECD countries. Economic Journal, 111, C135–C147.
Hanushek, E. A. (2003). The failure of input-based schooling policies. Economic Journal,113, F64–F98.
Hanushek, E. A., & Kim, D. (1995). Schooling, labour force quality and economic growth.Working Paper NBER, 5399.
Hanushek, E. A., & Kimko, D. D. (2000). Schooling, labor-force quality, and the growth ofnations. American Economic Review, 90, 1184–1208.
Hanushek, E. A., & Luque, J. (2003). Efficiency and equity in schools around the world.Economics of Education Review, 22, 481–502.
Harmon, C., Walker, I., & Westergaard-Nielsen, N. (Eds.). (2001). Education andearnings in Europe: A cross country analysis of the returns to education. Cheltenham:Elgar.
Jacob, B. A. (2005). Accountability, incentives and behavior: The impact of high-stakes testing in the Chicago public schools. Journal of Public Economics, 89,761–796.
Johnes, J. (2006). Data envelopment analysis and its application to the measurement ofefficiency in higher education. Economics of Education Review, 3, 273–288.
Krueger, A. B., & Lindahl, M. (2001). Education for growth: Why and for whom? Journalof Economic Literature, 39, 1101–1136.
Lam, D., & Duryea, S. (1999). Effects of schooling on fertility, labour supply, andinvestments in children with evidence from Brazil. Journal of Human Resources,34, 160–192.
Mankiw, N. G., Romer, D., & Weil, D. (1992). A contribution to the empirics of economicgrowth. Quarterly Journal of Economics, 107, 408–437.
Martin, S. P. (2004). Growing evidence for a ‘‘divorce divide’’? Education and maritaldissolution rates in the U.S. Since the 1970s. Russell Sage Foundation WorkingPapers: Series on Social Dimensions of Inequality.
Mincer, J. (1958). Investment in human capital and personal income distribution.Journal of Political Economy, 66, 281–302.
Moretti, E. (2004). Workers’ education, spillovers, and productivity: Evidence fromplant-level production functions. American Economic Review, 94, 656–690.
Nelson, R. R., & Phelps, E. S. (1966). Investment in humans, technological diffusion, andeconomic growth. American Economic Review, 56, 69–75.
OECD. (2001). The well-being of nations: The role of human and social capital. Paris: OECD.OECD. (2005). PISA 2006 Questionnaires. Paris: OECD.OECD. (2006). Assessing scientific, reading and mathematical literacy: A framework for
PISA 2006. Paris: OECD.OECD. (2007a). PISA 2006 science competencies for tomorrow’s world. Paris: OECD.OECD. (2007b). PISA 2006 data set. Paris: OECD.OECD. (2009a). PISA 2006 technical report. Paris: OECD.OECD. (2009b). PISA data analysis manual. Paris: OECD.OECD. (2009c). Education at a glance 2009. Paris: OECD.Psacharopoulos, G., & Woodhall, M. (1997). Education for development: An analysis of
investment choice. New York: Oxford University Press.Putnam, R. D. (1993). The prosperous community: Social capital and public life. The
American Prospect, 4, 35–42.Putnam, R. D., & Helliwell, J. F. (1999). Education and Social Capital. NBER Working
Paper, 7121. Cambridge, MA: NBER.Romer, P. M. (1990). Endogenous technological change. Journal of Political Economy, 98,
S71–S102.Ryan, P. (1998). Is apprenticeship better? A review of the economic evidence. Journal of
Vocational Education and Training, 50, 289–325.Sakamota, A., & Powers, P. A. (1995). Education and the dual labour market for Japanese
men. American Sociological Review, 2, 222–246.Schultz, T. W. (1961). Investment in human capital. American Economic Review, 51, 1–17.Schultz, T. W. (1971). Investment in human capital. New York: The Free Press.Schulz, W. (2005). Measuring the socio-economic background of students and its effect
on achievement in PISA 2000 and PISA 2003. Annual meetings of the AmericanEducational Research Association (pp. 1–29). San Francisco: Australian Council forEducational Research.
Sen, A. (1999). Development as freedom. Oxford: Oxford University Press.Simar, L., & Wilson, P. (1998). Sensitivity analysis of efficiency scores: How to bootstrap
in nonparametric frontier models. Management Science, 44, 49–61.Simar, L., & Wilson, P. (1999). Some problems with the Ferrier/Hirschberg bootstrap
idea. Journal of Productivity Analysis, 11, 67–80.Simar, L., & Wilson, P. (2000a). Statistical inference in nonparametric frontier models:
The state of the art. Journal of Productivity Analysis, 13, 49–78.Simar, L., & Wilson, P. (2000b). A general methodology for bootstrapping in nonpara-
metric frontier models. Journal of Applied Statistics, 27, 779–802.Smyth, R., Lane, C. (2009). Skills and education. Report from the Ministry of Education,
New Zealand.Sneath, P. H. A., & Sokal, R. R. (1973). Numerical taxonomy. San Francisco: Freeman.Soares de Mello, J. C., Gomes, E. G., Meza, L. A., Soares de Mello, M. C., & Soares de Mello,
A. J. (2006). Engineering post-graduate programmes: A quality and productivityanalysis. Studies in Educational Evaluation, 32, 136–152.
Temple, J. R. W. (1999). The new growth evidence. Journal of Economic Literature, 37,112–156.
Tyler, J. H., Murnane, R. J., & Willett, J. B. (2000). Do the cognitive skills of schooldropouts matter in the labor market? Journal of Human Resources, 35, 748–754.
West, M. R., & Peterson, P. E. (2006). The efficacy of choice threats within schoolaccountability systems: Results from legislatively-induced experiments. EconomicJournal, 116, C46–C62.
Woßmann, L. (2003). Schooling resources, educational institutions, and student per-formance: The international evidence. Oxford Bulletin of Economics and Statistics, 65,117–170.
Wu, M. (2004). Plausible values. Rasch Measurement Transactions, 18, 976–978.