Active Ageing Index for 28 European Union Countries
17
Active Ageing Index for 28 European Union Countries November 2014
Transcript of Active Ageing Index for 28 European Union Countries

Active Ageing Index for 28 European Union Countries
November 2014

The 2014 Active Ageing Index for the EU28
Policy messages
1. Greater policy efforts are required to fully mobilise the potential of active
ageing in EU countries: Overall, while active living in older age is already a reality
for older people in many parts of Europe, there is considerable scope for
improving active ageing experiences within many countries. Such policy efforts
towards higher active ageing for older populations will need to be pursued by
joined-up policies and programmes at the European, national, regional and local
levels. In particular, Greece and the majority of Central and Eastern European
countries lag behind their EU neighbours, and thus greater policy efforts are
required to fully mobilise the potential of active ageing within these countries.
2. Generating higher capacity and stronger enabling environments for active
ageing will be a key prerequisite, particularly for Central and Eastern European
Union countries: The policies and programmes required are multi-faceted, in
terms of not just improving labour market outcomes of older people but also
incentivising their social participation and facilitating their independent, healthy
and autonomous living. Policies which generate higher capacity and stronger
enabling environments for active ageing are an essential requirement, especially
in many Central and Eastern European Union countries.
This Brief presents the latest results for the Active Ageing Index (AAI), covering
all 28 EU Member States. It also reviews the main changes since the publication
of the 2012 Index.1
The results confirm the stability of the relative position of most countries during
the two year period in question. Sweden remains the top ranked country,
whereas a good majority of the Central and Eastern European countries and also
Greece are ranked at the bottom.
In absolute terms, a rise in the AAI score is observed for the majority of EU
countries, except for Greece and Cyprus. As a consequence, Cyprus lost its
position among the top ranking countries of the EU, and Greece slumps further
to become the bottom-ranked country, below Poland. France improved its
ranking to be placed among the top 10 countries within EU28
The development of the Active Ageing Index offers a framework that can be
used by policymakers and stakeholders to identify challenges and opportunities
linked with population ageing. This work also enables them to identify priorities
and set targets for improvements based on international comparisons.

2
3. Stability observed in the relative position of EU countries: Comparing with 2012
AAI results, a certain degree of stability is observed in the relative position of
EU28 countries: Sweden, Denmark and Finland as well as the Netherlands and
the United Kingdom remaining at the top, while Poland, Hungary, Slovakia,
Romania and Greece continue to trail in the ranking.
4. Index rise observed for the majority of EU countries: In absolute terms, a small
rise in the AAI score is observed for the majority of EU countries during the two
year period in question, especially for Latvia. Greece and Cyprus are the only
exceptions where a decline in the AAI score is observed. As a consequence, Cyprus
lost its position among the top ranking countries of the EU. Greece slumps further
to become the bottom-ranked country in active ageing, below Poland.
5. Specific focus identified for additional policies to reduce gender disparity: The
2014 AAI results confirm the specific policy priority in improving older women’s
experiences of active ageing in many EU countries (particularly in Malta and
Cyprus, but also in Luxembourg and the Netherlands). The improvement is
required particularly in employment experiences for older women in many EU
countries.
Key findings
Three Nordic countries (Sweden, Denmark and Finland), and the Netherlands
are confirmed as the top performers across the four domains of active ageing,
while Greece and Central and Eastern European countries (excepting Estonia
and the Czech Republic) remain at the low end of the 2014 AAI results.
The highest 2014 AAI score stands at 44.8 points (Sweden). The AAI score for
the bottom-ranked countries (in particular Poland, Greece, Slovakia, Hungary,
Slovenia, Bulgaria and Romania) is considerably lower, hardly reaching 30
points. Thus, much greater policies and programmes are required in Greece and
in the Central and Eastern European countries to follow the good practice of
active ageing in Nordic and Western European countries.
In terms of gender differentials, only two EU Member States, Estonia and Latvia,
have better results for women than for men, while gender differences are
minimal in Finland. In all other cases, women fare worse than men, particularly
so in Malta and Cyprus but also in Luxembourg and the Netherlands.
The gender disparity is observed across all domains of AAI, although it is most
notable in the first (Employment) and the third (Independent living) domain
where the gender gap of financial security is considerable in most EU countries.
This disparity to a large extent arises from the unequal experiences of

3
employment during the life course, a legacy which impacts severely on the
income and employment experiences of current generations of elderly women.
The employment gap between men and women remains high, despite
considerable improvements of women’s labour force participation in the EU in
recent decades. Therefore there is a need for additional policy reforms in
improving further older women’s employment in many EU countries.
The overall picture reveals a slight rise in the AAI score for the majority of
countries comparing with 2012 results,: eleven EU Member States observe a
rise that approximates 1.0 point in the AAI score. For Latvia, the rise is close to
2.0 points in the AAI score, and above average improvements are also noted for
Estonia, France and Germany.
A notable exception is the decline in the AAI score for two southern European
states (Greece and Cyprus). Small decline in the AAI score is also observed for
Slovenia and Portugal. As a consequence, Cyprus lost their position among the
top 10 countries of the EU, as observed previously in the 2012 AAI. Slovenia’s
ranking also declined from 20th in 2012 to 23rd in the 2014 AAI. France
improved its ranking to be placed among the top 10 countries within EU28
More details on the 2014 findings
Sweden on top of overall ranking
The latest 2014 AAI results for the EU28 are presented in Figure 1. It ranks all EU
countries on the basis of the overall 2014 AAI score. Sweden comes at the top of the
ranking across the 28 EU Member States, followed closely by Denmark, the
Netherlands, Finland, the United Kingdom and Ireland. The four southern European
countries (Italy, Portugal, Spain and Malta) are middle-ranked countries. In contrast,
Greece and the majority of the Central and Eastern European countries are at the
bottom of the ranking.
Notably, the current top-ranked countries like Sweden, Denmark or the Netherlands
barely pass the 40 point mark which highlights the room for further improvements
even in these top performing countries. The countries at the other end of the
spectrum (Greece, Poland, Slovakia, Hungary, Romania and Slovenia) have AAI values
below 30, suggesting much greater untapped potentials of active ageing among older
people and a need for greater policy efforts to mobilise these potentials.
Two countries, Estonia and the Czech Republic, perform exceptionally well in
comparison to other EU Member States from Central and Eastern Europe, as they are
ranked 11th and 12th, respectively. However, their AAI score is also considerably lower
(around 35 points) than Sweden (44.8) - the best performing country in the EU.

4
Figure 1: Ranking of 28 EU Member States on the basis of the 2014 Active Ageing Index (using the overall index, for men and women together)
Contrasting performances from one domain to another
The rank order of countries differs across the four domains of the AAI (Table 1;
Figure 2). The three Nordic countries (Sweden, Denmark and Finland), as well as the
Netherlands, are among a few countries that perform the best in all four domains.
Most countries, however, show dissimilar patterns across domains.
Ireland is the top-ranked country in the second domain (Social participation), but it is
not among the top 10 countries in the first domain (Employment). Luxembourg, on
the other hand, ranks among the top in the second, third and fourth domains, but it is
one of the lowest-ranked countries in the first domain.
5
Table 1: Ranking of EU 28 countries on the basis of the overall Active Ageing index and its domain specific indices
Country Index Rank Country Index Rank Country Index Rank Country Index Rank Country Index RankSweden 44.8 1 Sweden 43.4 1 Ireland 25.2 1 Denmark 79.0 1 Sweden 69.2 1
Denmark 40.5 2 Estonia 39.7 2 Italy 24.1 2 Finland 79.0 2 Denmark 65.1 2
Netherlands 39.9 3 Denmark 35.8 3 Luxembourg 22.6 3 Netherlands 78.9 3 Luxembourg 63.6 3
Finland 39.6 4 United Kingdom 35.8 4 Sweden 22.6 4 Sweden 78.6 4 Netherlands 61.8 4
United Kingdom 39.2 5 Germany 34.4 5 France 22.4 5 Luxembourg 76.7 5 United Kingdom 61.3 5
Ireland 39.0 6 Netherlands 33.9 6 Netherlands 22.4 6 France 75.9 6 Finland 60.5 6
Luxembourg 35.9 7 Finland 33.7 7 Finland 22.4 7 Ireland 74.9 7 Belgium 60.3 7
Germany 35.9 8 Portugal 32.6 8 Austria 21.4 8 Germany 74.4 8 Ireland 60.0 8
France 35.7 9 Latvia 32.0 9 Belgium 20.4 9 Slovenia 74.2 9 France 59.1 9
Austria 35.2 10 Cyprus 31.4 10 Denmark 20.1 10 Austria 73.8 10 Austria 58.2 10
Estonia 34.8 11 Romania 31.0 11 United Kingdom 20.0 11 United Kingdom 73.7 11 Malta 57.1 11
Czech Republic 34.6 12 Ireland 30.6 12 Czech Republic 19.4 12 Belgium 72.5 12 Spain 56.3 12
Cyprus 34.4 13 Lithuania 30.5 13 Cyprus 18.7 13 Czech Republic 71.2 13 Germany 55.8 13
Italy 34.0 14 Czech Republic 28.0 14 Spain 18.3 14 Malta 70.1 14 Czech Republic 54.3 14
Belgium 33.8 15 Bulgaria 25.1 15 Malta 18.2 15 Spain 69.8 15 Italy 53.4 15
Portugal 33.6 16 Austria 24.7 16 Croatia 17.8 16 Croatia 69.5 16 Croatia 52.8 16
Spain 32.8 17 France 24.1 17 Slovenia 16.7 17 Italy 69.0 17 Bulgaria 52.2 17
Malta 31.8 18 Spain 23.3 18 Hungary 16.1 18 Hungary 68.0 18 Portugal 52.1 18
Lithuania 31.7 19 Italy 23.0 19 Lithuania 15.3 19 Cyprus 68.0 19 Cyprus 50.4 19
Latvia 31.6 20 Poland 22.4 20 Germany 14.9 20 Estonia 67.3 20 Slovenia 50.0 20
Croatia 31.3 21 Slovakia 21.9 21 Portugal 14.3 21 Portugal 67.3 21 Latvia 48.2 21
Bulgaria 30.0 22 Luxembourg 21.9 22 Greece 14.2 22 Lithuania 66.2 22 Poland 47.9 22
Slovenia 29.9 23 Croatia 21.7 23 Latvia 13.9 23 Slovakia 65.8 23 Estonia 47.5 23
Romania 29.7 24 Belgium 21.0 24 Slovakia 13.7 24 Poland 64.9 24 Slovakia 47.1 24
Hungary 28.6 25 Greece 20.4 25 Estonia 13.3 25 Greece 64.9 25 Hungary 46.9 25
Slovakia 28.5 26 Malta 20.1 26 Romania 12.9 26 Bulgaria 62.7 26 Greece 45.8 26
Poland 28.2 27 Hungary 19.3 27 Bulgaria 12.9 27 Romania 61.8 27 Lithuania 45.3 27
Greece 27.7 28 Slovenia 19.1 28 Poland 12.2 28 Latvia 58.7 28 Romania 40.9 28
OVERALL Employment Social participation Independent living Capacity for active ageing

6
Figure 2: Ranking of 28 EU Member States in each of the four domains of the 2014 AAI (for men and women together)
1. Employment
3. Independent, healthy and secure Living
2. Social participation
4. Capacity and enabling environment for active ageing

7
The top two performers from Central and Eastern Europe, Estonia and the Czech
Republic, exhibit different patterns across the domains. Estonia’s high overall AAI
score is entirely due to its second best score (after Sweden) in the employment
domain while Estonia’s scores in the other three domains are among the five lowest.
The Czech Republic, on the other hand, is a middle-ranked country consistently in all
four domains.
The results observed for Portugal, Romania and Latvia across the four domains exhibit
patterns that are similar to results for Estonia: a high position in the employment
domain coupled with a position in the lower half in the other three domains. This
might be attributed to low pension incomes that constrain older people to stay in
employment for longer in these countries. The reverse is true for Luxembourg where
higher retirement income may contribute to low participation of older people in the
labour market.
The ranking for France also varies significantly from domain to domain, with a
particularly low rank in the employment domain (17th). Two large southern European
countries (Spain and Italy) are also ranked rather low in the employment domain (18th
and 19th, respectively). In contrast, Sweden, the United Kingdom and Germany are
among the best-performing countries in the employment domain, at 1st, 4th and 5th
position).
The overall AAI scores for three largest EU Member States Germany, France and Italy
are rather similar, ranging between 34 and 35.9 points; however, these countries
show quite different patterns in domain-specific results. Germany, for instance, is way
ahead in the employment domain, whereas France and Italy are ranked higher in the
social participation domain.
These results point to different institutional settings and cultural preferences
towards different forms of activities in old age. Older people in Italy and France have a
tendency to take an early exit from the labour market, but they seem to fare much
better in terms of their social contributions to the society, in terms of voluntary
activities, in providing care to their children and grandchildren, services to elderly or
disabled relatives and in their political participation.
The United Kingdom and the Netherlands perform rather similarly in two domains.
One exception is the domain of ‘Independent living’ where the United Kingdom falls
considerably behind the Netherlands. The underlying indicators reveal that the older
population in the United Kingdom fares considerably worse, compared to the
Netherlands, in their financial security, highlighting the importance of policy changes in
the United Kingdom aimed at improving financial security in old age.
Hungary and Slovakia are the bottom-ranked countries on the basis of the overall
index, with a rather similar AAI score of around 29 points. These two countries also

8
have comparable index score for the fourth domain ‘Capacity for active ageing’ –
around 47 points. However, Slovakia is notably stronger in the employment domain.
Hungary, on the other hand, is ranked higher in the social participation and
independent living domains. Poland, which is ranked only above Greece in the overall
ranking, has a bottom-ranked position only in the social participation domain.
Situation of men and women differs
Ageing experiences of women and men are expected to differ considerably. The AAI
takes this into account and allows assessing active ageing outcomes separately for men
and women for individual domains and for the overall index in each country. This has
been done by making use of gender-disaggregated data for all 22 AAI indicators.
Women fare worse than men in almost all countries, particularly in Malta and Cyprus,
but also in Luxembourg and the Netherlands (Figure 3). Only two EU Member States,
Estonia and Latvia, have better AAI results for women than for men, while gender
differences are minimal in Finland.
Figure 3: Differences in the overall AAI between men and women for EU 28 countries
Women lower
than men
Women higher
than men
9
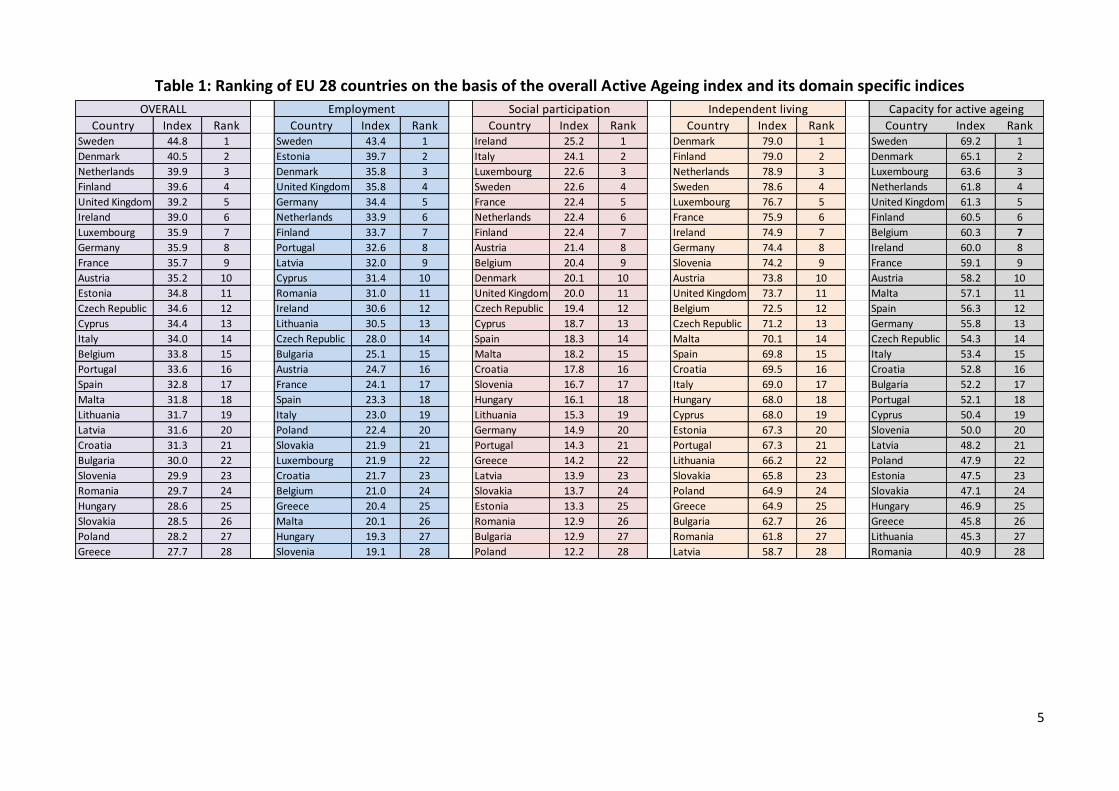
Figure 4: Differences in AAI between men and women across four domains 1. Employment
3. Independent, healthy and secure living
2. Social participation
4. Capacity and enabling environment for active ageing

10
Most notably, there is a great deal of gender disparity in the employment
experiences of older people (Figure 4). Despite considerable improvements in the EU
with respect to employment of women in recent decades, in particular among older
women, the gap remains high. These results show that additional policy reforms are
required in mobilising the full potential of older women’s employment in many EU
countries.
The gender disparity in employment is particularly large in the two Mediterranean
countries Malta and Cyprus, but also in the Netherlands, Greece and Italy. In 14 EU
Member States, the gender differential in employment exceeds 10 points.
In other domains, the difference in AAI for men and women is smaller. In some cases,
the gender differential is opposite to that observed for the employment domain.
In the second domain ‘Social participation’, women fare worse than men
particularly in Luxembourg and also in Denmark, Austria, the Czech Republic
and the Netherlands, where higher men’s involvement in voluntary and
political activities outweighs women’s prevalence in care provision. In contrast,
Latvia, Greece, Poland, Ireland, Finland and Spain are the countries that exhibit
higher AAI in this domain for women than for men.
In the third domain ‘Independent, healthy and secure living’, the AAI for
women is lower than the AAI for men in almost all countries as the underlying
financial and physical security indicators are notably worse for women. An
exception is observed for Malta, where the AAI for women is slightly higher
than the AAI for men in this domain. A better outcome for older Maltese
women in this domain is almost entirely due to their higher physical activity
every day.
In the fourth domain ‘Capacity for active ageing’, women fare worse than men
particularly in Cyprus, but also in Greece and Luxembourg. An opposite trend is
observed for Estonia where AAI is notably higher for women than for men. The
Estonian older females fare better than their male counterparts in almost all
individual indicators, but noticeably better in the remaining life expectancy and
social connectedness.
A slight index rise in most countries between 2012 and 2014
The comparison of the latest 2014 AAI to the 2012 AAI results show a certain degree of
stability in the relative position of countries (Table 2). Sweden, Denmark and Finland as
well as the Netherlands and the United Kingdom remain at the top while Poland,
Hungary, Slovakia, Romania and Greece continue to trail the ranking. There are also
some interesting changes in the mid-ranking countries.

11
Table 2: Change between the 2014 AAI and 2012 Active Ageing Index on the basis of the overall one
AAI_2014 Rank AAI_2012 Rank AAI_2014 Rank AAI_2012 Rank AAI_2014 Rank AAI_2012 Rank
Belgium 33.8 15 33.3 15 35.7 16 35.7 14 32.1 13 31.1 16
Bulgaria 30.0 22 29.5 23 31.6 23 31.4 24 28.8 21 28.0 22
Czech Republic 34.6 12 34.0 13 37.4 11 37.1 10 32.2 12 31.3 14
Denmark 40.5 2 40.2 2 42.8 3 42.6 2 38.3 3 37.9 3
Germany 35.9 8 34.7 9 38.2 9 37.0 11 33.8 9 32.6 9
Estonia 34.8 11 33.1 16 33.9 19 32.3 20 35.5 7 33.7 7
Ireland 39.0 6 38.9 6 40.9 5 41.2 5 37.0 5 36.6 5
Greece 27.7 28 29.2 25 30.0 28 32.0 21 25.7 28 26.6 25
Spain 32.8 17 32.6 17 34.3 17 34.5 16 31.4 17 30.8 17
France 35.7 9 34.2 11 36.7 13 35.3 15 34.8 8 33.3 8
Italy 34.0 14 33.8 14 36.8 12 36.7 12 31.5 15 31.2 15
Cyprus 34.4 13 35.9 7 38.3 8 40.6 6 30.7 19 31.4 13
Latvia 31.6 20 29.6 22 30.8 24 28.5 28 32.1 14 30.4 18
Lithuania 31.7 19 30.9 18 32.8 20 31.7 23 31.0 18 30.4 19
Luxembourg 35.9 7 35.4 8 39.4 6 39.0 8 32.8 10 32.0 11
Hungary 28.6 25 27.8 26 30.3 26 29.4 26 27.2 25 26.5 26
Malta 31.8 18 30.9 19 36.0 15 34.4 17 27.4 24 26.8 24
Netherlands 39.9 3 38.9 5 43.3 2 42.4 3 36.8 6 35.6 6
Austria 35.2 10 34.7 10 38.1 10 37.7 9 32.6 11 32.0 12
Poland 28.2 27 27.2 28 30.1 27 29.1 27 26.6 27 25.5 28
Portugal 33.6 16 34.2 12 36.1 14 36.5 13 31.5 16 32.2 10
Romania 29.7 24 29.5 24 32.0 21 31.8 22 27.8 23 27.6 23
Slovenia 29.9 23 30.6 20 32.0 22 33.2 18 28.1 22 28.2 21
Slovakia 28.5 26 27.7 27 30.6 25 30.1 25 26.7 26 25.6 27
Finland 39.6 4 39.0 4 39.4 7 39.1 7 39.9 2 39.1 2
Sweden 44.8 1 44.0 1 46.5 1 46.0 1 43.2 1 42.2 1
United Kingdom 39.2 5 39.2 3 41.2 4 41.2 4 37.5 4 37.3 4
Croatia 31.3 21 30.5 21 33.9 18 33.1 19 28.9 20 28.2 20
TotalCountry
WomenMen
12
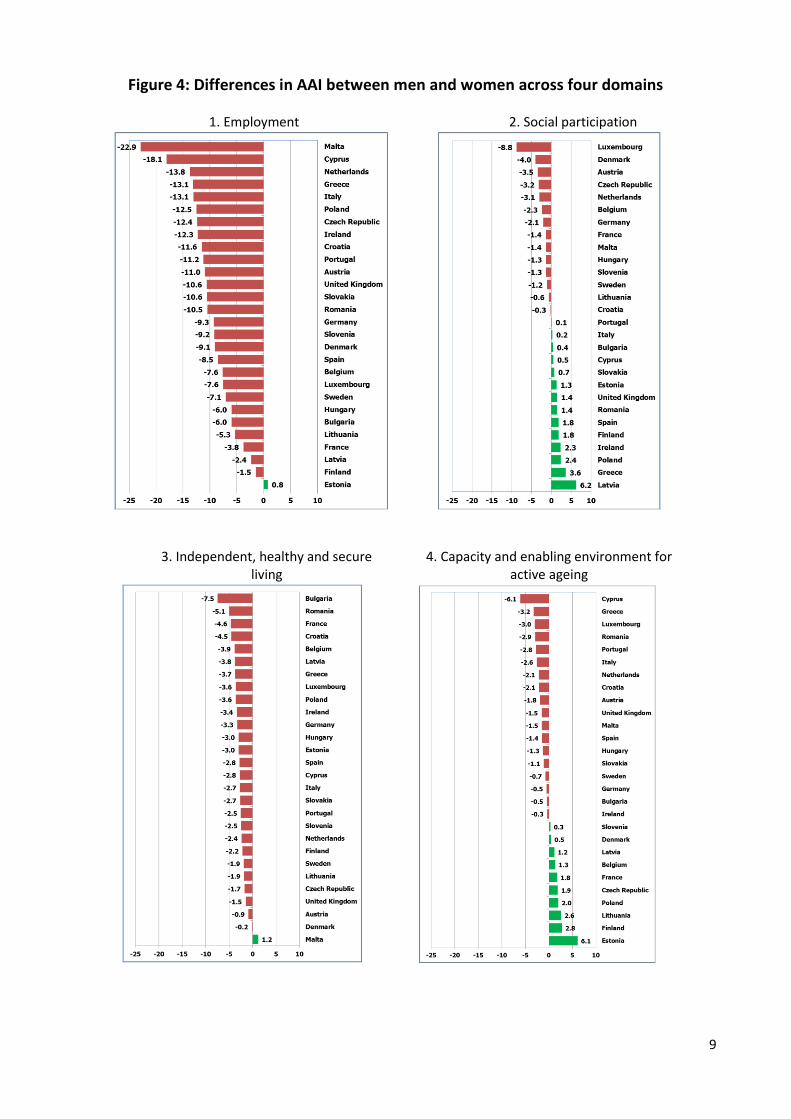
In absolute terms, the overall picture is that there is a slight rise in the AAI score for
the majority of countries. This positive trend is observed in particular for Latvia, where
the rise is close to 2.0 points in the AAI score, but also in France, Estonia and Germany.
Altogether, eleven EU Member States observe a rise that approximates 1.0 point in the
AAI score.
A notable exception of the above result is the decline in the AAI score for two southern
European states (Greece and Cyprus) and also for Portugal and Slovenia. As a
consequence, Cyprus lost its position among the top 10 countries of the EU, as
observed previously in the 2012 AAI. Greece’s position slumped further, and it is now
ranked at the bottom, below Poland. Slovenia’s ranking declined from 20th in the 2012
AAI to 23rd in the 2014 AAI. In contrast, Estonia improved its AAI score and the relative
position between the 2012 AAI and 2014 AAI.
The drivers
The trends observed between 2012 and 2014 show that:
The positive changes in the AAI score have been similar for men and women
in Germany, France and Estonia, whereas the rise for Latvian AAI score is
higher for men than for women. By contrast, in Greece, the reduction in the AAI
score is observed more strongly for men than for women.
The decline in the relative position of Cyprus and Greece is largely attributed
to the decline in the AAI value in the domain of employment, where
employment decline is observed across all four age groups.
The improvement in the position of Latvia is a mix of change in the domains of
employment and capacity for active ageing, whereas for Estonia the change is
almost entirely due to changes in the employment domain.
For Latvia, the improvement in employment is greater for men than for
women during the period in question. For Estonia, on the other hand, the
improvement in the employment situation is observed for both men and
women.
France improved its ranking to be placed among the top 10 countries within
EU28, and this improvement in active ageing is observed mainly in employment
outcomes, and the changes are higher for men than for women.

13
Active ageing strategies help dealing with economic and social challenges
A concern is often expressed that adopting and implementing a comprehensive active
ageing approach may be expensive, in particular for those countries that are resource-
constrained and only now emerging from the economic downturn. In fact, active
ageing strategies based on social investment principles help to prevent the loss of
valuable expertise and wisdom of older people, as well as strengthen society’s human
and structural resilience to deal with the longer-term economic and social challenges.
The Active Ageing Index offers a credible contribution to this discussion on how best to
measure and mobilise the potential of active and healthy ageing in Europe. It can be
used by policymakers and stakeholders to identify challenges and opportunities and to
set targets for improvements, based on international comparisons. The AAI evidence is
raising awareness of the challenges and opportunities for older people as well to seek
ways to develop their full potential, not just to enhance their own well-being but also
contribute towards improving the future sustainability of public welfare systems of the
countries in which they live.

14
Annex: What does the Active Ageing Index offer?
The Active Ageing Index provides unique multi-faceted evidence on the contribution of
older people across EU countries to their social and economic lives. It covers not only
employment of older people but also their unpaid familial, social, and cultural
contributions, and their independent, healthy, and secure living. It also captures how
the EU countries differ with respect to capacity and enabling environments for active
and healthy ageing. As the ageing experiences of men and women are expected to be
different, the AAI also provides a breakdown by gender.
The Active Ageing Index serves as a flexible tool to enable a range of stakeholders to
develop evidence-based strategies to address the challenges of population ageing and
its impact on society. It was developed in the course of the 2012 European Year for
Active Ageing and Solidarity between Generations (EY 2012). It is also being used to
monitor the implementation of national ageing-related policies in the context of the
Madrid International Plan of Action on Ageing (MIPAA).
The first wave of AAI was launched in 2012, largely based on data from 2010. For the
latest 2014 AAI, the survey data used corresponds to the calendar year 2012. Thus, the
results released in this Brief highlight the baseline situation observed across EU
countries during the EY 2012. The methods used in calculating the 2014 AAI are the
same as those used for the 2012 AAI, with some minor exceptions for changes in the
definition of the indicators and in the data sources used.
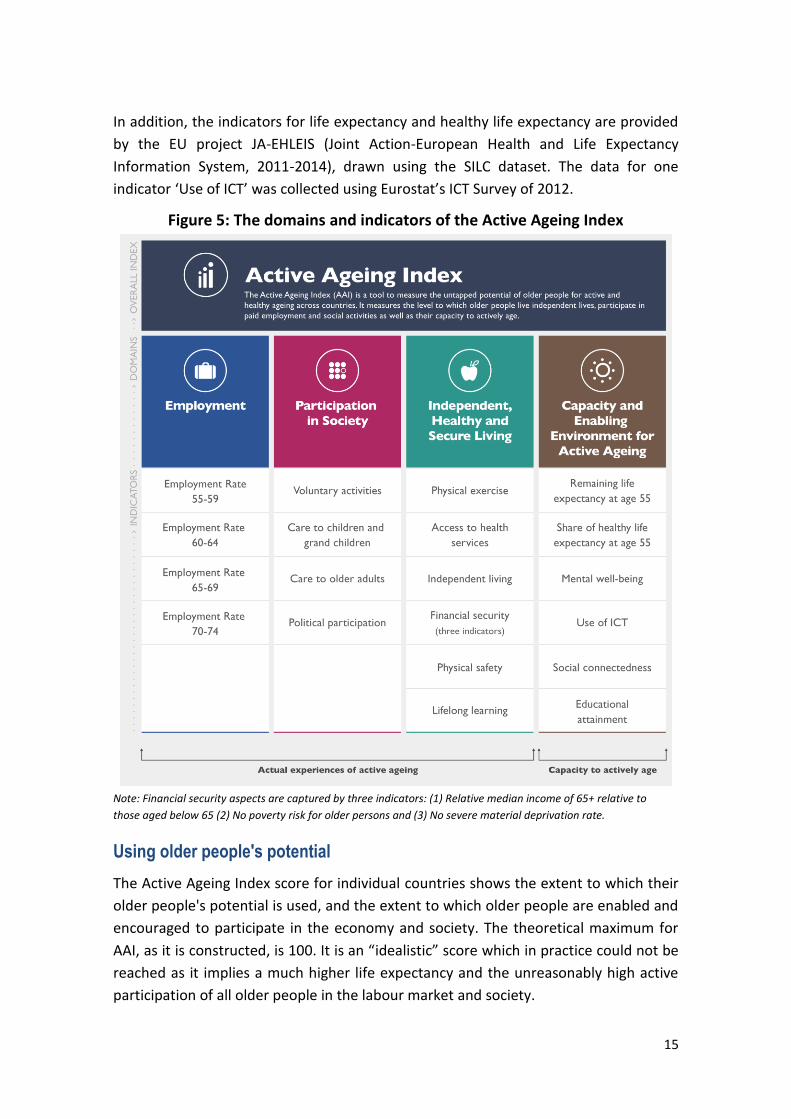
How is the Active Ageing Index constructed?
The Active Ageing Index is constructed on the basis of four distinct domains (Figure 5):
(1) Employment
(2) Participation in Society
(3) Independent, Healthy and Secure Living
(4) Capacity and Enabling Environment for Active Ageing.
The first three domains together refer to the ‘actual experiences’ of active ageing,
reflecting various activities that older persons are involved in as well as their
experiences of independent, autonomous and secure lives. The fourth domain
captures the capacity and enabling environment for active ageing, as determined by
individual characteristics of older persons which can facilitate or hinder active ageing.
The four domains are populated by a set of 22 indicators, drawn mainly from four
major European household surveys. The surveys used in constructing the 2014 AAI are:
EU Labour Force Survey (LFS) 2012
EU Survey of Income and Living Conditions (SILC) 2012
European Quality of Life Survey (EQLS) 2011/1012
European Social Survey (ESS) 2012.
15
In addition, the indicators for life expectancy and healthy life expectancy are provided
by the EU project JA-EHLEIS (Joint Action-European Health and Life Expectancy
Information System, 2011-2014), drawn using the SILC dataset. The data for one
indicator ‘Use of ICT’ was collected using Eurostat’s ICT Survey of 2012.
Figure 5: The domains and indicators of the Active Ageing Index
Note: Financial security aspects are captured by three indicators: (1) Relative median income of 65+ relative to
those aged below 65 (2) No poverty risk for older persons and (3) No severe material deprivation rate.
Using older people's potential
The Active Ageing Index score for individual countries shows the extent to which their
older people's potential is used, and the extent to which older people are enabled and
encouraged to participate in the economy and society. The theoretical maximum for
AAI, as it is constructed, is 100. It is an “idealistic” score which in practice could not be
reached as it implies a much higher life expectancy and the unreasonably high active
participation of all older people in the labour market and society.

16
Contact
Comments and suggestions for improving the Active Ageing Index are most welcome.
Please email to [email protected], mentioning ‘The 2014 AAI’ in the subject of the email.
Acknowledgement
This Brief is prepared by Asghar Zaidi of Centre for Research on Ageing, University of
Southampton (UK), in consultation with Ralf Jacob and Kasia Jurczak (both from
European Commission’s Directorate-General for Employment, Social Affairs and
Inclusion) and Vitalija Gaucaite Wittich and Olga Kharitonova (both from UNECE).
Computational assistance from Marge Unt is also gratefully acknowledged.
The Brief compiles the work of the AAI project, which is managed jointly by the
European Commission's Directorate General for Employment, Social Affairs and
Inclusion (DG EMPL) and the United Nations Economic Commission for Europe
(UNECE). It arises from the work undertaken during the 2012 European Year for Active
Ageing and Solidarity between Generations by the European Centre for Social Welfare
Policy and Research in Vienna. The current second phase – conducted at the Centre for
Research on Ageing in University of Southampton and advised by the Expert Group on
Active Ageing Index – is updating the Index to additional time points, extending it to
new countries, dialoguing with stakeholders and encouraging its wider take-up.
November 2014