Education Tech Research Dev DOI 10.1007/s11423-007-9069-y DEVELOPMENT ARTICLE
24
DEVELOPMENT ARTICLE Assessing and tracking students’ problem solving performances in anchored learning environments Brian A. Bottge Enrique Rueda Jung Min Kwon Timothy Grant Perry LaRoque Ó Association for Educational Communications and Technology 2007 Abstract The purpose of this randomized experiment was to compare the performance of high-, average-, and low-achieving middle school students who were assessed with parallel versions of a computer-based test (CBT) or a paper-pencil test (PPT). Tests delivered in interactive, immersive environments like the CBT may have the advantage of providing teachers with diagnostic tools that can lead to instruction tailored to the needs of students at different achievement levels. To test the feasibility of CBT, students were randomly assigned to the CBT or PPT test conditions to measure what they had learned from an instructional method called enhanced anchored math instruction. Both assessment methods showed that students benefited from instruction and differentiated students by achievement status. The navigation maps generated from the CBT revealed that the low-achieving students were able to navigate the test, spent about the same amount of time solving the subproblems as the more advanced students, and made use of the learning scaffolds. Keywords Classroom learning Mathematics Interactive learning environments Low achievers Assessment Introduction Government reports such as What Work Requires of Schools: A SCANS Report for America 2000 (U.S. Department of Labor 1991) and more recent publications (e.g., Gray and Herr 1998; National Center on Education and the Economy 2007; Thornburg 2002; Uchida et al. 1996) stress the importance of workers having a sound foundation in basic skills and B. A. Bottge (&) Department of Special Education and Rehabilitation Counseling, University of Kentucky, 222 Taylor Education Building, Lexington, KY 40506, USA e-mail: [email protected] E. Rueda J. M. Kwon T. Grant P. LaRoque Wisconsin Center for Education Research, University of Wisconsin – Madison, 1025 W. Johnson St., Madison, WI 53706, USA 123 Education Tech Research Dev DOI 10.1007/s11423-007-9069-y
Transcript of Education Tech Research Dev DOI 10.1007/s11423-007-9069-y DEVELOPMENT ARTICLE

DEVELOPMENT A RTICLE
Assessing and tracking students’ problem solvingperformances in anchored learning environments
Brian A. Bottge Æ Enrique Rueda Æ Jung Min Kwon ÆTimothy Grant Æ Perry LaRoque
� Association for Educational Communications and Technology 2007
Abstract The purpose of this randomized experiment was to compare the performance of
high-, average-, and low-achieving middle school students who were assessed with parallel
versions of a computer-based test (CBT) or a paper-pencil test (PPT). Tests delivered in
interactive, immersive environments like the CBT may have the advantage of providing
teachers with diagnostic tools that can lead to instruction tailored to the needs of students at
different achievement levels. To test the feasibility of CBT, students were randomly
assigned to the CBT or PPT test conditions to measure what they had learned from an
instructional method called enhanced anchored math instruction. Both assessment methods
showed that students benefited from instruction and differentiated students by achievement
status. The navigation maps generated from the CBT revealed that the low-achieving
students were able to navigate the test, spent about the same amount of time solving the
subproblems as the more advanced students, and made use of the learning scaffolds.
Keywords Classroom learning � Mathematics � Interactive learning environments �Low achievers � Assessment
Introduction
Government reports such as What Work Requires of Schools: A SCANS Report for America2000 (U.S. Department of Labor 1991) and more recent publications (e.g., Gray and Herr
1998; National Center on Education and the Economy 2007; Thornburg 2002; Uchida
et al. 1996) stress the importance of workers having a sound foundation in basic skills and
B. A. Bottge (&)Department of Special Education and Rehabilitation Counseling, University of Kentucky,222 Taylor Education Building, Lexington, KY 40506, USAe-mail: [email protected]
E. Rueda � J. M. Kwon � T. Grant � P. LaRoqueWisconsin Center for Education Research, University of Wisconsin – Madison, 1025 W. Johnson St.,Madison, WI 53706, USA
123
Education Tech Research DevDOI 10.1007/s11423-007-9069-y
the ability to use technology to solve important problems. To achieve this level of expertise
in math, teachers should provide their students with problem situations that develop their
procedural skills (e.g., adding fractions) as they work on developing their conceptual
understanding (i.e., solving problems that involve rational numbers), a strategy that cog-
nitive science research supports (Rittle-Johnson and Koedinger 2002; Rittle-Johnson et al.
2001). Furthermore, these problems should be presented in authentic-like contexts and
align closely with actual work applications (Stone et al. 2006).
Available evidence suggests, however, that many high school students leave school
without the ability to solve the kinds of problems required for employment in the con-
temporary job market (Kirsch et al. 2007; Murnane and Levy 1996). Recent test results
seem to support this claim. For example, the 2005 National Assessment of Educational
Progress (NAEP; Perie et al. 2005) revealed that 69% of 8th-grade students with dis-
abilities scored below Basic performance levels in mathematics compared to 28% of
students without disabilities. The problem becomes even worse as students progress to high
school when more than one-third (37%) of 12th-grade students score below Basic. The
NAEP descriptor Basic includes both basic foundation skills and the ability to solve
problems with diagrams, graphs, and charts using technology tools.
To address this problem, we have studied the effects of a technology-assisted instruc-
tional method called Enhanced Anchored Instruction (EAI) for helping adolescents acquire
more sophisticated problem solving skills. EAI is based on the concept of anchored
instruction originally developed by the Cognition and Technology Group at Vanderbilt
(Cognition & Technology Group at Vanderbilt 1990, 1997). Anchored instruction uses a
video format to embed complex problems and related subproblems in realistic-looking
situations. Students search these learning environments for information that they can use to
generate plausible solutions. The visual and auditory format of the video eliminates the
need to read and comprehend text, a potential barrier for many students who have difficulty
in math and reading. In their problem solving groups, students discuss and formulate
plausible solutions to problems as teachers carefully monitor their discussions and provide
just-in-time guidance as needed. At intervals throughout anchored instruction, teachers
model analogous and less complex problems to help students practice emerging skills and
deepen their understanding of important concepts.
EAI extends learning beyond the multimedia contexts by having students solve prob-
lems embedded in applied projects, such as constructing a skateboard ramp or planning and
building a hovercraft. Our previous development work with EAI involved combinations of
special education, mathematics, and technology education teachers who collaborated to
teach the multimedia-based and applied problems to students of all ability levels, including
students with disabilities (e.g., learning disabilities, emotional/behavioral disorders) in
middle school (Bottge 1999; Bottge et al. 2002; Bottge et al. 2007a), high school (Bottge
and Hasselbring 1993), and alternative school settings (Bottge et al. 2006).
Solving difficult problems such as the ones in EAI requires extraordinary self-man-
agement skills (e.g., metacognition and evaluation) (Glasgow 1997; Hannafin et al. 1997;
Palinscar 1986; Palinscar and Brown 1984). Although the notion of scaffolding tradi-
tionally emphasized the role of dialogue and social interaction with an external source (i.e.,
a teacher) (Bruner 1975; Vygotsky 1978), scaffolding also refers to the learner’s use of
internal cognitive tools (Ge and Land 2003). In a technology-supported environment,
Hannafin et al. (1999) suggest that students make use of four kinds of scaffolds: (a)
conceptual, (b) metacognitive, (c) procedural, and (d) strategic. According to Brush and
Saye (2001), conceptual scaffolds help students determine what to consider when solving a
problem, metacognitive scaffolds support students’ self-regulation or self-management,
B. A. Bottge et al.
123

procedural scaffolds assist students with learning how to use resources or tools built into an
environment, and strategic scaffolds help make students aware of different approaches and
techniques for solving problems. The newest of our EAI problems called Fraction of theCost includes all four types of scaffolds.
Although EAI has produced promising findings, two nagging concerns have surfaced in
our studies. The first issue has to do with the pencil-paper tests (PPT) we have used to judge
whether students had learned the concepts embedded in the EAI problems. We are confident
that the constructed response items in the PPT distinguished students who understood the
problems from those who did not in recent studies (e.g., Bottge et al. 2007a, b), but some
universal design for learning principles (Sireci et al. 2005) that guided development of the
EAI were not altogether possible in the PPT format. For example, PPT did provide students
with pictorial representations and less text for students with reading difficulties thereby
giving them more opportunities to understand what the questions were asking, but the static
format of PPT did not allow students to interact with the problem contexts (Rose and Meyer
2007). This universal test design principle has been suggested for making tests more
accessible for low-achieving students (Dolan and Hall 2001; Hasselbring et al. 2005).
Using the PPT format has also restricted our ability to collect important diagnostic
information about students’ problem solving behaviors. Although we routinely analyze
student performance at the item level and use these results to modify EAI, it was not possible
to measure how much time students spent answering items or to what extent they made use of
the learning scaffolds. Other investigators (e.g., Puntambekar and Stylianou 2005; Punt-
ambekar et al. 2003) have successfully tracked students’ navigation patterns as they worked
on problem-solving tasks and being able to collect similar information would provide us with
important clues for modifying both the instructional and assessment features of EAI.
To address both these issues, we constructed a computer-based test (CBT) based on
universal design principles to map the performance of students as they worked on the
anchored math problems. The first goal of the study was to assess the comparability of the
PPT we had used in previous research to that of the newly created CBT. If the overall
performance of students on the CBT matched the performance of students on the PPT
across ability levels, we could be reasonably assured of its usefulness in measuring the
learning objectives in EAI. We could then set out to accomplish the second goal of tracing
the navigation patterns of students to gain a deeper understanding of their problem solving
strategies as they solved the EAI problems. In line with these goals, the study was con-
ducted to answer three research questions:
1. Does the problem-solving performance differ between students who take a paper-
pencil test (PPT) and students who take a computer-based test (CBT)?
2. Does the problem-solving performance differ for low achievers (LA), average
achievers (AA), and high achievers (HA) by assessment format (PPT versus CBT)?
3. What are the problem-solving patterns of students on the CBT and how do they
compare for students who are low achievers (LA), average achievers (AA), and high
achievers (HA) in math?
Method
Participants
All seventh-grade students (N = 109) and their two math teachers (MT1, MT2) in one rural
middle school in the Midwest participated in the study. Each math teacher taught three
Assessing and tracking students’ problem solving performances
123
classes. There were 56 boys and 53 females and all of the students were white. Individual
Educational Plans indicated that seven students were receiving special education services
an average of 43 min for learning disabilities (LD) in math and one student was getting
special services in both math and reading. All eight students with LD were included in the
general education math classes and received the same instruction as the students without
disabilities.
Students in each of the six classes were randomly assigned to either CBT or PPT via an
alternate ranks procedure (Dalton and Overall 1977) based results on the state-mandated
Wisconsin Knowledge and Concepts Exam (WKCE) math subtest. The WKCE was
developed from the TerraNova standardized test (CTB/McGraw-Hill 2003) and custom-
ized to align with Wisconsin content standards. The test scores of students were ranked
from highest to lowest and then grouped into foursomes. The student with the top score in
the highest achieving foursome was randomly assigned to either the PPT or CBT group, the
second and third students were assigned to the other assessment group, and the fourth
student was assigned to the first student’s group. This procedure was repeated until stu-
dents in all foursomes were assigned. Students in the PPT and CBT groups received the
same instruction.
The mean scores and standard deviations in normal curve equivalents (NCEs) of stu-
dents in the PPT and CBT groups were 58.6 (n = 25, SD = 16.8) and 59.5 (n = 25,
SD = 16.3) for MT1 and 70.7 (n = 28, SD = 19.0) and 67.9 (n = 31, SD = 20.8) for MT2.
MT2’s scores were higher because he taught one class of high-achieving students. Overall
NCEs and standard deviations of students taking the PPT or CBT were 65.0 (n = 53,
SD = 18.9) and 64.2 (n = 56, SD = 19.2), respectively. No significant differences were
found between the CBT and PPT comparisons.
The two math teachers were primarily responsible for the instruction. MT1 had a
bachelor’s degree, was in her third year of teaching, and had taught with EAI the previous
year. MT2 was chairperson of the math department, had a master’s degree in middle-level
education, was beginning his 13th year of teaching, and had taught with EAI the past four
years. A special education teacher was on hand to help students with LD who were
included in the math classes, but she provided no direct, whole-group instruction.
The special education teacher was in her 15th year of teaching, had a master’s degree in
general education grades 1 through 8, and licensed to teach special education in grades K
through 12.
Instructional methods and materials
Instruction involved one EAI problem called Fraction of the Cost, which had been inte-
grated into the math curriculum the previous year. MT1 and MT2 assigned 3-to-4 students
to problem-solving groups based on whom they thought would work well together. In
classes where there were students with LD, one student with LD worked with two or three
general education students. At the beginning of each class period, the teachers led students
in a 10-min warm-up activity to review concepts they had worked on the previous day and
to introduce new material. For the remainder of class, each group worked on a laptop
computer, which contained the learning tools (i.e., scaffolds) students could use to help
solve each of the subproblems. Teachers circulated from group to group, answering
questions and posing new ones. After students solved the video-based anchor, they worked
on the hands-on applications.
B. A. Bottge et al.
123

The authors developed Fraction of the Cost, which features three students from a local
middle school. Available in Spanish and English, the video was filmed at a local skate-
boarding store, a garage, and the backyard of a local home. The video opens in a
skateboard store and rink, where the students are shown discussing how they can afford to
buy materials for building a skateboard ramp. To solve the problem, students need to (a)
calculate the percent of money in a savings account and sales tax on a purchase, (b) read a
tape measure, (c) convert feet to inches, (d) decipher building plans, (e) construct a table of
materials, (f) compute whole numbers and mixed fractions, (g) estimate and compute
combinations, and (h) calculate total cost.
Teachers showed Fraction of the Cost without interruption the first day and asked
students to describe the problems associated with it. Students then worked in small groups
to complete their problem-solving packets. To figure out the most economical use of two-
by-four (200 · 400) lumber in Fraction of the Cost, students first needed to identify the
lengths of boards shown in the plan. Then they converted these dimensions from feet and
inches to inches and calculated several combinations of lengths to maximize their use of
the wood available. Once they computed what additional wood was needed, they consulted
the store advertisement to decide what to buy. Their final task was to make a materials list
to show the total cost of the project. To help solidify students’ understanding, the math
teachers often led students in brief practice sessions the first 10 min of class. For example,
one day the teachers projected on the projector screen four narrow rectangles, which
represented two-by-four dimension lumber. Then students were asked to respond to a
series of questions about how to convert feet-and-inches to inches. Finally, students
calculated the most economical way of cutting the boards.
After students solved the problems posed in Fraction of the Cost, they planned and built
a rollover cage out of PVC pipe for a hovercraft in a related problem called the HovercraftChallenge. The teacher divided the class into groups of three students, and each group
planned how they could make the cage in the most economical way. Once the teacher
approved the plans, students worked on measuring, cutting, and assembling. When the
cages were complete, they lifted them onto a 40 · 40 plywood platform, which served as the
hovercraft base. A leaf blower inserted into the base powered the hovercraft. On the last
day of the project, students rode their hovercrafts in relay races up and down the halls of
the school. Each teacher taught the video-based and hands-on problems a total of 14
instructional days.
Instrumentation
The CBT and PPT were developed to address the knowledge and concepts in the NCTM
standards recommended for students in grades 6–8 (i.e., Numbers and Operations, Mea-
surement, Problem Solving, Communication, and Representation) and both tests contained
constructed-response items that measured the concepts in Fraction of the Cost (video-
based problem) and the Hovercraft Challenge (hands-on problem). The total number of
points possible for both tests was 38. Internal consistency (Cronbach’s coefficient alpha)
was .74 for CBT and .73 for PPT. Students in each testing condition could spend a
maximum of 80 min taking the test.
Sets of items developed for the PPT were awarded full or partial credit and weighted
according to their complexity and the contribution to solving the over-arching problem.
The items were grouped into seven clusters, which made it possible to analyze student
work at both the item and cluster (concept) levels (Lester and Kroll 1990; Shafer and
Assessing and tracking students’ problem solving performances
123

Romberg 1999). Prior to its use in this research, the PPT had gone through cycles of
refinement in several studies (Bottge et al. 2002; Bottge et al. 2004; Bottge et al. 2001;
Bottge et al. 2007b) and was modified based on suggestions from math and assessment
specialists (i.e., math teachers, math researchers, test consultants). A previous study
showed the concurrent validity correlation coefficient of the PPT was .59 based on pretest
scores of the Iowa Tests of Basic Skills (University of Iowa 2001) Problem Solving and
Data Interpretation Subtest. This correlation was significant and appears acceptable given
that the range of mathematics concepts sampled by the PPT was more restricted than that
sampled on the ITBS.
The newly created CBT was designed to measure the same concepts as the PPT, with
the additional benefit of providing students a similar level of interactivity they had
experienced during EAI. The software included a set of constructed response items and
information reservoirs (i.e., scaffolds). The figures representing information for answering
items were also similar across tests. The major difference between the tests was the
hyperlinks that students taking the CBT could use to access information reservoirs, which
contained relevant details for solving the subproblems. The eight hyperlinks consisted of
the following: (a) the video-based anchor, (b) schematic plans of a skateboard ramp, (c) a
bank statement showing how much money one of the students could spend, (d) a materials
list for building the skateboard ramp, (e) a newspaper advertisement from a hardware store,
(f) a screen showing the names of the students, (g) navigation assistance about how to
operate the markers and ruler, and (h) a tracking feature that helped students monitor their
use of the lumber for building the skateboard ramp. Figure 1 shows the information
reservoirs.
Cluster comparisons between PPT and CBT
The test consisted of the same seven item clusters as the PPT and the items within clusters
were weighted the same. For the most part, the screens in the CBT looked similar to the
figures on the PPT although the interactive components of the CBT made it necessary to
modify them somewhat. Figures 2 and 3 show the PPT and CBT item clusters,
respectively.
Cluster 1 asks how much the kids shown in the video-based problem decide to spend on
supplies for building the skateboard ramp. The PPT shows a bank statement next to the
question, which the students use to figure out the money Michael can spend. From the
video, the students know that the three kids will each spend the same amount ($19), which
they total to $57. Cluster 1 of the CBT does not show the bank statement alongside the
questions. Rather, students need to access the information from the statement and the video
located in the information reservoirs. This cluster is worth two points.
Cluster 2 asks students to interpret schematic plans (e.g., 1- and 3-dimensional draw-
ings) of the skateboard ramp shown in the video, indicate the length in feet and inches of
each 2 · 4-inch board required for building the frame, and then convert these lengths to
inches. Students also indicate how many boards of each length are needed. The PPT shows
the schematic plans with each part of the skateboard frame labeled in feet and inches.
Students complete a table of the required information. The same information is required for
the CBT but the plans are not shown next to the table as they are on the PPT. Instead,
students must navigate the software to locate the plans. The plans on both assessments are
the same except that those on PPT are shaded in black and grays and labeled (e.g., diagonal
brace, top side support) whereas the CBT plans are shown in color and not labeled.
B. A. Bottge et al.
123

Fig. 1 Information reservoirs in the computer-based test (CBT)
Assessing and tracking students’ problem solving performances
123

However, there is a tracking feature on the CBT that enables students to keep track of the
boards they have accounted for. This cluster of items is worth a total of six points.
Cluster 3 requires students to read a tape to measure the five lengths two-by-fours
(2 · 4s) that the kids in the video find in the garage. Students learn that they should make
Fig. 2 Item clusters in the paper-pencil test (PPT)
B. A. Bottge et al.
123

Fig. 3 Item clusters in the computer-based test (CBT)
Assessing and tracking students’ problem solving performances
123
the best use of this wood before deciding how much new wood they need to buy. Both the
PPT and CBT versions require students to read a tape measure to an eighth of an inch and
to record the lengths in inches. The CBT also asks students to match relative lengths of the
2 · 4s to the lengths shown on the tape measure. This cluster is worth three points.
Cluster 4 on the CBT asks students to transfer the five lengths from cluster 3 to a table
showing representations of 2 · 4s. Students have to label 2 · 4s shown in the table
according to their relative lengths. This cluster is shown together with cluster 5 on the PPT.
Since this group of items does not call for students to use computation skills, the cluster is
worth only two points.
Cluster 5 items are worth a total of 10 points, because they are especially important for
solving the overall problem. On both the PPT and CBT, students are to indicate the most
economical lengths to cut the 2 · 4s for building the ramp frame. This work involves
adding combinations of wood in such a way as to waste as little wood as possible. To figure
out the correct combinations, students must accurately add mixed numbers. They must also
indicate how much of each board is left over after cutting the wood, which involves
subtracting mixed numbers. In addition, students must label each piece they cut with the
part of the ramp frame shown in the schematic drawing. On the PPT, students show the
combinations and label them with their pencil. On the CBT, students show where to cut the
boards by dragging markers to the appropriate places on each board. The CBT also pro-
vides students with a virtual ruler they can use to doublecheck the lengths of the wood they
have cut. This cluster is worth a total of 10 points.
Cluster 6 is worth six points and the items are similar to those in cluster 5 because
students are to show the most economical use of new wood they need to buy for building
the rest of the ramp after making use of the wood in the garage. Students are to indicate
where they would cut 6-foot, 8-foot, or 10-foot lengths of 2 · 4s they would purchase from
the lumberyard and correctly label them. As in cluster 5, the students who take the PPT are
to use a pencil to show where they would cut the wood and label the piece with the part of
the ramp. On the CBT, students are required drag the marker to the cut points and move the
correct ramp labels onto the boards.
Cluster 7 asks students to complete a materials list using all the relevant from their
calculations. In addition to indicating the screws, the 2 · 4 lumber, and plywood decking
they need to buy, they compute the total cost of the project, including sales tax. On the
PPT, the materials list (not the quantities) and the store advertisement are shown on the
same page as the item. On the CBT, students must access the information reservoirs to
retrieve the information for the expense table (e.g., plans, store ad). This cluster is worth
nine points.
Research design
The study was conducted on two levels. The first level consisted of a randomized pretest–
posttest design that assessed the performance of students who took the CBT compared to
students who took the PPT after all students had been taught with EAI. Specifically, the
purpose was to assess whether students at three levels of math achievement (i.e., high,
average, and low) would demonstrate the same or different levels of understanding on the
CBT compared with PPT. Students were matched on math ability based on a standardized
measure and then assigned to either the CBT or PPT assessment group. Before and after
instruction with EAI, students in both groups took either the CBT or PPT.
B. A. Bottge et al.
123

A second objective was to trace the search-path maps of six students who were clas-
sified as high achievers, average achievers, and low achievers by their teachers. The
students were video-recorded while they were taking the CBT pretest and posttest. One
camera was positioned in front of the students to record their facial and body movements.
The other camera was connected to the computer monitor to record the student’s on-screen
activity. The on-screen video was captured, digitized, and compressed into 14.25 GB in
MPEG-1 encoding format and then merged into video analysis software called vPrism. The
software enabled us to determine the navigations students made through the CBT along
with the frequency of visits and the amount of time students at the cluster questions,
information reservoirs, and help screens.
Implementation fidelity
Several methods converged to help ensure that the instruction and assessment procedures
were followed. Both teachers had taught EAI in previous years and participated in con-
trolled intervention studies using the Fraction of the Cost problem. One of the math
teachers (MT2) had helped write the lesson plans and had conducted two training sessions
with teachers from other school districts on implementing EAI in general education and
special education settings. The math teachers had common planning times when they
discussed their instructional plans. In addition, research staff observed classroom practices
on several occasions. Finally, members of the research staff were on hand throughout the
testing process, both at pretest and posttest, to observe and video record students as they
took the PPT and CBT. The implementation data showed that procedures were followed as
planned except in one instance when the special education teacher was observed pointing
to items on the paper of one student with LD who was taking the PPT. It is unclear how
much help this student actually received from the special education teachers or what effect
this may have had on the overall score. She was not present during the CBT testing and
students with disabilities took the test as planned.
Results
Overall comparisons
Prior to conducting the analyses, the two groups of students that had been randomly
assigned to CBT or PPT based on their WKCE scores were stratified into groups of high
achievers (HA), average achievers (AA), or low achievers (LA). The lowest-achieving
25% and highest-achieving 25% students were considered LA and HA, respectively.
Overall means and standard deviations (reported as NCEs) were 39.7 for LA (n = 26, SD12.9), 65.2 for AA (n = 57, SD = 6.9), and 88.0 for HA (n = 26, SD = 26). No differences
were found in student performance between teachers within achievement for LA, t(24) =
–0.681, p = .502 (n = 9 [MT1], n = 17 [MT2]) or for AA, t(55) = 0.635, p = .528 (n = 31
[MT1], n = 26 [MT2]. There was a difference between teachers for HA, t(24) = 2.181,
p = .039 (n = 19 [MT1], n = 7 [MT2]) but there were no overall differences because half
the students from each of the teacher’s classes was randomly assigned to one or the other
test condition (see ‘‘Participants’’ section).
Table 1 shows descriptive information of the HA, AA, and LA students who took PPT
or CBT. The data were analyzed in a 3 (HA, AA, LA) · 2 (PPT, CBT) ANOVA with time
Assessing and tracking students’ problem solving performances
123
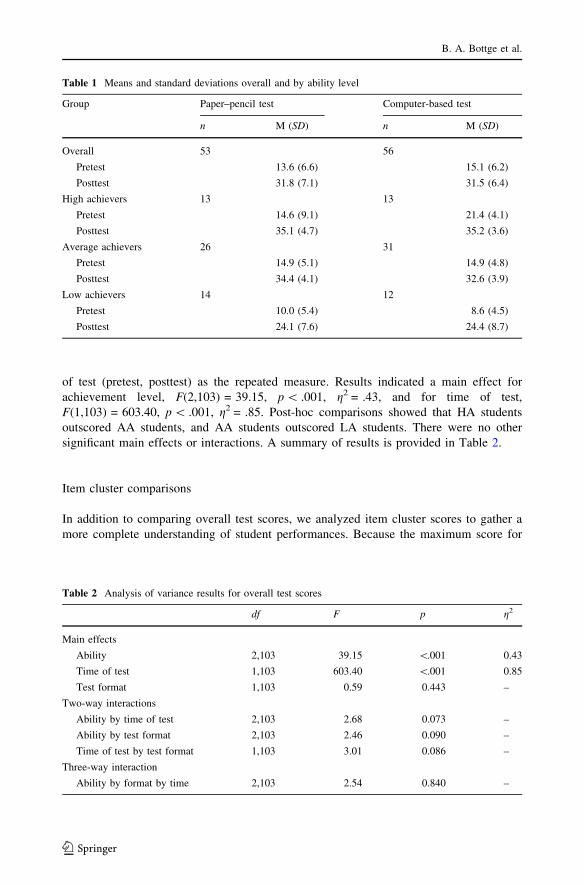
of test (pretest, posttest) as the repeated measure. Results indicated a main effect for
achievement level, F(2,103) = 39.15, p \ .001, g2 = .43, and for time of test,
F(1,103) = 603.40, p \ .001, g2 = .85. Post-hoc comparisons showed that HA students
outscored AA students, and AA students outscored LA students. There were no other
significant main effects or interactions. A summary of results is provided in Table 2.
Item cluster comparisons
In addition to comparing overall test scores, we analyzed item cluster scores to gather a
more complete understanding of student performances. Because the maximum score for
Table 1 Means and standard deviations overall and by ability level
Group Paper–pencil test Computer-based test
n M (SD) n M (SD)
Overall 53 56
Pretest 13.6 (6.6) 15.1 (6.2)
Posttest 31.8 (7.1) 31.5 (6.4)
High achievers 13 13
Pretest 14.6 (9.1) 21.4 (4.1)
Posttest 35.1 (4.7) 35.2 (3.6)
Average achievers 26 31
Pretest 14.9 (5.1) 14.9 (4.8)
Posttest 34.4 (4.1) 32.6 (3.9)
Low achievers 14 12
Pretest 10.0 (5.4) 8.6 (4.5)
Posttest 24.1 (7.6) 24.4 (8.7)
Table 2 Analysis of variance results for overall test scores
df F p g2
Main effects
Ability 2,103 39.15 \.001 0.43
Time of test 1,103 603.40 \.001 0.85
Test format 1,103 0.59 0.443 –
Two-way interactions
Ability by time of test 2,103 2.68 0.073 –
Ability by test format 2,103 2.46 0.090 –
Time of test by test format 1,103 3.01 0.086 –
Three-way interaction
Ability by format by time 2,103 2.54 0.840 –
B. A. Bottge et al.
123

each cluster was small (range = 2–10 points), the clusters were analyzed with non-para-
metric techniques. The Mann–Whitney test compared performances of students by test
format (PPT vs. CBT) whereas the Kruskal–Wallis test compared performances of students
by achievement group (HA, AA, LA). The large sample approximations of these tests were
used for the tests of two-way interactions while exact tests were used for the three-way
interaction due to small group sizes. The Holm procedure was used to control family wide
Type I error rate to 0.05. Table 3 shows the CBT and PPT item cluster scores on the CBT
and PPT for each ability group.
Performance between test format within ability group
At posttest, there were no significant differences between PPT and CBT. At pretest,
however, results showed three clusters where CBT students outscored PPT students: cluster
3 (Z = 3.012, p = .003), cluster 4 (Z = 3.594, p \ .001), and cluster 5 (Z = 3.752,
p \ .001). Much of this difference can be attributed to the HA students who scored higher
on the CBT than on the PPT in cluster 2 (Z = 3.021, p = .003), cluster 4 (Z = 2.726,
p = .006), and cluster 5 (Z = 2.808, p = .005). This trend is reversed in cluster 7 where the
PPT students outscored the CBT students (Z = 5.08, p \ .001).
Performance between ability groups within test format
Differences between achievement levels were studied within each cluster for test format
and testing time using the Kruskal–Wallis test and the Holm Method with Shaffer logic to
protect against inflation of the Type I error rate. The four families compared were PPT at
pretest, PPT at posttest, CBT at pretest, and CBT at posttest.
On the PPT pretest, there were no differences between achievement groups. However,
on the CBT pretest, there were differences in cluster 1 (v2 (2) = 14.412, p = 0.001), cluster
2 (v2 (2) = 21.961, p \ 0.001), and cluster 5 (v2 (2) = 20.536, p \ 0.001). There was more
variability in posttest performance on the both the PPT and CBT. On the PPT posttest,
there were differences in three clusters: Cluster 1 (v2 (2) = 17.564, p \ 0.001), Cluster 5
(v2 (2) = 18.592, p \ 0.001), and Cluster 6 (v2 (2) = 10.627, p = 0.005). Subsequent pair
wise comparisons using exact Mann–Whitney tests revealed that HA and AA students
outscored LA students in clusters 1 and 5. In cluster 6, AA students scored higher than LA
students. On the CBT posttest there were three clusters for which there were significant
differences between achievement groups: Cluster 2 (v2 (2) = 11.209, p = 0.004), Cluster 5
(v2 (2) = 11.884, p = 0.003), and Cluster 6 (v2 (2) = 8.867, p = 0.010). In all three clus-
ters, HA outperformed LA. However, there were no significant differences between LA
and AA scores on any of the seven clusters.
Time in clusters and navigation maps
A total of six students’ navigations were mapped (2 HA, 2 AA, 2LA). Table 4 shows the
proportion of time students spent on the item clusters compared to information reservoirs.
Math composite scores on the standardized WKCE test in percentile ranks were 82 and 83
for the HA students, 56 and 61 for the AA students, and 22 and 12 for the LA students.
Both of the LA students were receiving special education services for LD. All students
Assessing and tracking students’ problem solving performances
123
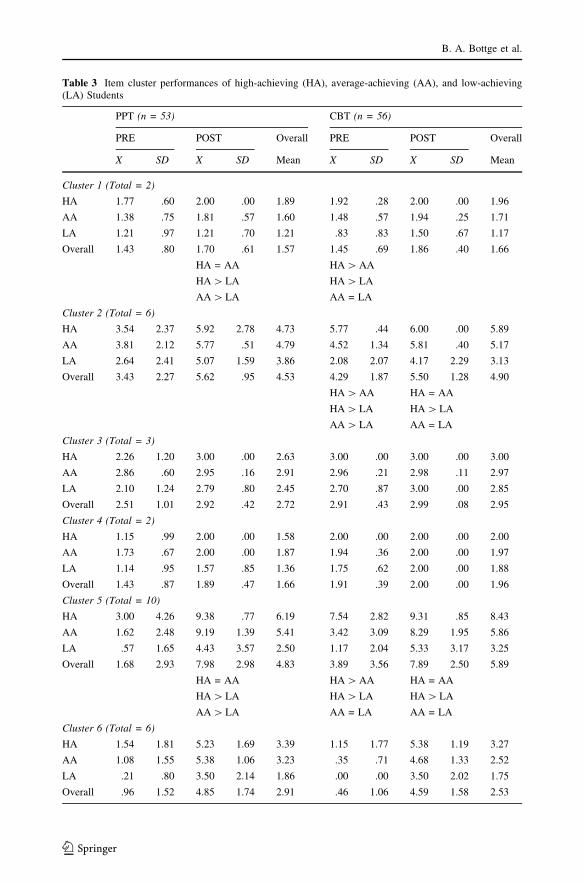
Table 3 Item cluster performances of high-achieving (HA), average-achieving (AA), and low-achieving(LA) Students
PPT (n = 53) CBT (n = 56)
PRE POST Overall PRE POST Overall
X SD X SD Mean X SD X SD Mean
Cluster 1 (Total = 2)
HA 1.77 .60 2.00 .00 1.89 1.92 .28 2.00 .00 1.96
AA 1.38 .75 1.81 .57 1.60 1.48 .57 1.94 .25 1.71
LA 1.21 .97 1.21 .70 1.21 .83 .83 1.50 .67 1.17
Overall 1.43 .80 1.70 .61 1.57 1.45 .69 1.86 .40 1.66
HA = AA HA [ AA
HA [ LA HA [ LA
AA [ LA AA = LA
Cluster 2 (Total = 6)
HA 3.54 2.37 5.92 2.78 4.73 5.77 .44 6.00 .00 5.89
AA 3.81 2.12 5.77 .51 4.79 4.52 1.34 5.81 .40 5.17
LA 2.64 2.41 5.07 1.59 3.86 2.08 2.07 4.17 2.29 3.13
Overall 3.43 2.27 5.62 .95 4.53 4.29 1.87 5.50 1.28 4.90
HA [ AA HA = AA
HA [ LA HA [ LA
AA [ LA AA = LA
Cluster 3 (Total = 3)
HA 2.26 1.20 3.00 .00 2.63 3.00 .00 3.00 .00 3.00
AA 2.86 .60 2.95 .16 2.91 2.96 .21 2.98 .11 2.97
LA 2.10 1.24 2.79 .80 2.45 2.70 .87 3.00 .00 2.85
Overall 2.51 1.01 2.92 .42 2.72 2.91 .43 2.99 .08 2.95
Cluster 4 (Total = 2)
HA 1.15 .99 2.00 .00 1.58 2.00 .00 2.00 .00 2.00
AA 1.73 .67 2.00 .00 1.87 1.94 .36 2.00 .00 1.97
LA 1.14 .95 1.57 .85 1.36 1.75 .62 2.00 .00 1.88
Overall 1.43 .87 1.89 .47 1.66 1.91 .39 2.00 .00 1.96
Cluster 5 (Total = 10)
HA 3.00 4.26 9.38 .77 6.19 7.54 2.82 9.31 .85 8.43
AA 1.62 2.48 9.19 1.39 5.41 3.42 3.09 8.29 1.95 5.86
LA .57 1.65 4.43 3.57 2.50 1.17 2.04 5.33 3.17 3.25
Overall 1.68 2.93 7.98 2.98 4.83 3.89 3.56 7.89 2.50 5.89
HA = AA HA [ AA HA = AA
HA [ LA HA [ LA HA [ LA
AA [ LA AA = LA AA = LA
Cluster 6 (Total = 6)
HA 1.54 1.81 5.23 1.69 3.39 1.15 1.77 5.38 1.19 3.27
AA 1.08 1.55 5.38 1.06 3.23 .35 .71 4.68 1.33 2.52
LA .21 .80 3.50 2.14 1.86 .00 .00 3.50 2.02 1.75
Overall .96 1.52 4.85 1.74 2.91 .46 1.06 4.59 1.58 2.53
B. A. Bottge et al.
123

except one (HA student) spent more time on item clusters at posttest than at pretest
possibly indicating they had less need for the learning scaffolds following instruction and
could immediately turn their attention to problem solving.
Table 5 shows the proportion of time the six students spent in each item cluster and the
points they earned at pretest and posttest. The students, regardless of ability level, spent
most of their item on the most critical items for solving the overall problem. The LA
students spent more than one-third of their time in cluster 2, which requires students to
‘‘read’’ the schematic plan, construct a table that includes labels and dimensions of each
part of the plan, and convert from feet and inches to inches. All four of the HA and AA
students received full credit on this posttest item whereas the two LA students earned five
points and two points. Students also spent a large portion of their time on cluster 5 where
they are asked to figure out the most economical way of cutting the 2 · 4s in the garage.
Table 4 Proportion of time students spent in item clusters and information reservoirs
Student Pretest Posttest
Score Proportion of time Score Proportion of time
Item clusters Information reservoirs Item clusters Information reservoirs
High achievers
Student 1 15 .85 .15 28 .76 .24
Student 2 18 .55 .45 31 .87 .13
Average achievers
Student 3 11 .76 .24 29 .81 .19
Student 4 16 .62 .38 29 .89 .11
Low achievers
Student 5 5 .61 .39 13 .75 .25
Student 6 6 .66 .34 17 .71 .29
Table 3 continued
PPT (n = 53) CBT (n = 56)
PRE POST Overall PRE POST Overall
X SD X SD Mean X SD X SD Mean
HA = AA HA = AA
HA = LA HA [ LA
AA [ LA AA = LA
Cluster 7 (Total = 9)
HA 1.38 2.36 7.54 2.60 4.46 .00 .00 7.54 2.60 3.77
AA 2.42 2.66 7.31 2.28 4.87 .26 1.44 6.90 2.43 3.58
LA 2.14 2.35 5.5 2.65 3.82 .08 .29 4.92 2.94 2.50
Overall 2.09 2.50 6.89 2.55 4.49 .16 1.07 6.63 2.70 3.40
TOTAL (Total = 38)
13.55 6.61 31.84 7.06 22.70 15.08 6.22 31.45 6.42 23.27
Type I error rate controlled for each family, PPT Pre, PPT Post, CBT Pre, and CBT Post
The = in the group comparisons indicates that there is not a significant difference
Assessing and tracking students’ problem solving performances
123

Ta
ble
5P
erce
nta
ge
of
tim
esp
ent
inin
div
idual
clust
ers
for
sele
cted
studen
ts
Item
Clu
ster
Stu
den
t1
(HA
)S
tud
ent
2(H
A)
Stu
den
t3
(AA
)S
tud
ent
4(A
A)
Stu
den
t5
(LA
)S
tud
ent
6(L
A)
Pre
Po
stP
reP
ost
Pre
Po
stP
reP
ost
Pre
Po
stP
reP
ost
10
.76
8.7
49
.42
1.6
94
.58
10
.01
8.5
64
.13
16
.51
9.3
21
0.3
85
.01
4p
ts.
(1)
(2)
(2)
(2)
(0)
(2)
(2)
(2)
(0)
(1)
(1)
(2)
22
2.9
41
7.2
91
1.2
73
3.7
72
0.8
11
2.1
02
2.1
92
8.9
62
9.9
23
8.7
22
3.3
23
5.2
1
6p
ts.
(3)
(6)
(3)
(6)
(6)
(6)
(4)
(6)
(0)
(2)
(0)
(5)
31
2.6
28
.48
8.5
64
.48
9.7
45
.71
15
.01
5.2
61
0.9
31
5.4
79
.44
11
.89
3p
ts.
(3)
(3)
(3)
(3)
(3)
(3)
(3)
(3)
(3)
(3)
(3)
(3)
42
.84
2.3
74
.03
2.8
41
.62
1.6
03
.31
1.9
42
.75
4.8
72
.19
2.5
7
2p
ts.
(2)
(2)
(2)
(2)
(2)
(2)
(2)
(2)
(2)
(2)
(2)
(2)
54
3.2
23
8.3
14
4.6
43
0.6
63
7.1
13
4.5
25
0.5
85
4.1
71
8.9
63
0.9
02
7.6
82
5.1
0
10
pts
.(5
)(9
)(6
)(9
)(0
)(9
)(5
)(8
)(0
)(5
)(0
)(4
)
61
7.0
92
0.2
02
2.0
71
6.0
14
.58
19
.47
0.3
65
.40
12
.53
0.2
32
4.7
31
4.7
9
6p
ts.
(1)
(6)
(2)
(5)
(0)
(6)
(0)
(4)
(0)
(0)
(0)
(1)
70
.54
4.6
10
.00
10
.55
21
.55
16
.60
0.0
00
.14
8.3
90
.48
2.2
75
.43
9p
ts.
(0)
(0)
(0)
(4)
(0)
(9)
(0)
(4)
(0)
(0)
(0)
(0)
To
tal
10
01
00
10
01
00
10
01
00
10
01
00
10
01
00
10
01
00
38
pts
.(1
5)
(28
)(1
8)
(31
)(1
1)
(29
)(1
6)
(29
)(5
)(1
3)
(6)
(17
)
Nu
mb
ers
inp
aren
thes
es(
)in
dic
ate
ob
tain
edsc
ore
s
B. A. Bottge et al.
123

The HA and AA students were quite successful on this item cluster whereas the LA
students earned about half the points. All six students received full credit for clusters 3 and
4, which involved reading a tape measure and matching the lengths of boards to the
dimensions. However, students did poorly on clusters 6 and 7, possibly because they ran
out of time.
Figures 4–7 show the CBT screens and the navigation routes of one HA student and one
LA student at pretest and posttest. The HA and LA student scored 15 and 6 on the pretest
and 33 and 19 on the posttest, respectively. The boxes along the top and the bottom of the
figure show the information reservoirs (e.g., video, plans, tracking, who’s who); those in the
center of the page show the item clusters. The lines between the boxes represent the number
of navigations students made between test locations with the thicker lines indicating more
frequent visits. The actual frequencies to and from each location are provided in paren-
theses. On the HA student pretest, the heaviest traffic was between the skateboard ramp
plans and between questions 5 and 6, which asked the student to cut the lumber in the
appropriate lengths thereby wasting as little wood as possible. The student also used the
tracking feature of the program to help her remember which parts of the ramp she had
already ‘‘built’’. Her posttest map differed from her pretest map somewhat because she went
directly from question 2 to question 5 without having to rely on the support screens. She also
traveled frequently to the last item where she summarized her solution to the problem.
The LA student traveled many times during the pretest between the ramp plans and item
cluster 2, which asked him to complete a table with the lengths and quantity of wood
required for each part of the ramp. He also made use of the help button, but he rarely went
to questions 5 and 6. However, on the posttest he spent more time working on the difficult
items of the assessment and his search map grew more similar to that of the HA student.
His map also suggests that he realized he needed to access information from the schematic
plans, bank statement, and the store ad for answering item cluster 7.
Fig. 4 Navigation map of high-achieving student on the computer-based pretest
Assessing and tracking students’ problem solving performances
123

Fig. 5 Navigation map of high-achieving student on the computer-based posttest
Fig. 6 Navigation map of low-achieving student on the computer-based pretest
B. A. Bottge et al.
123

Anecdotal findings
Observers were on hand to watch students as they took the PPT and CBT pretest and
posttest. The following informal findings were noted. First, students in the CBT condition
worked for the entire class time on the pretest and the posttest. Although students taking
the CBT did not score higher than students in the PPT condition overall, it was evident that
the multimedia format of the test genuinely interested the students. Many students taking
the PPT also worked for most of the time but several students appeared to stop early, either
because they were finished or they could do no more. Second, the students who took the
CBT asked very few questions about how to navigate the program. This was unexpected
because the application was new to students. Students explored the CBT as though it was
an instructional tool rather than an assessment tool.
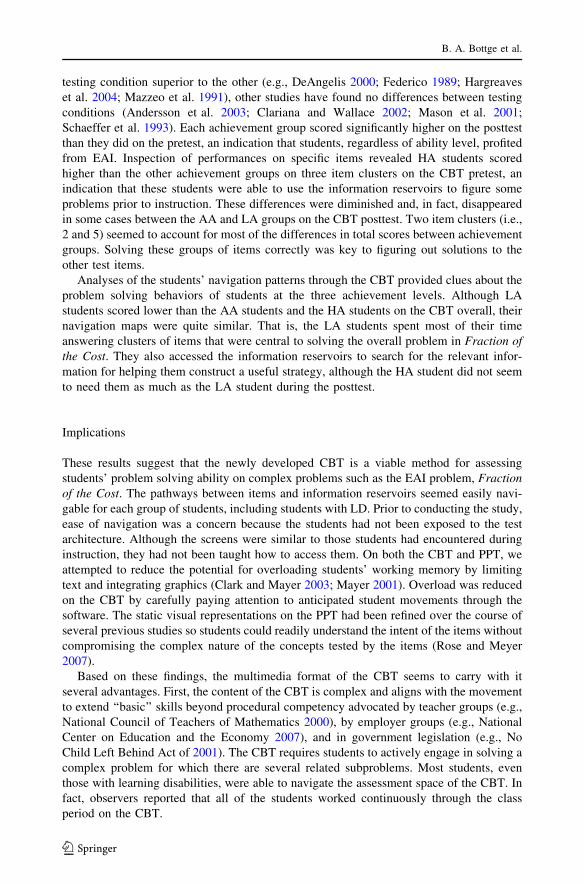
Discussion
The purpose of this randomized experiment was twofold. First, we compared two methods
(CBT or PPT) of assessing the math skills of HA, AA, and LA students after they had been
taught with EAI. Second, we used the CBT to gain a deeper understanding of students’
problem solving performance as they navigated between item clusters and information
reservoirs. This information could be used in future work to revise test items on both tests,
provide more adaptive navigation routes for low-achieving students on the CBT, and
identify what kind of learning scaffolds are needed in both the instructional and assessment
software.
Related to the first purpose, the results showed there were no differences between
assessment methods (CBT or PPT) for total test score within the three achievement levels.
Although some studies comparing pencil-paper and computer test formats have shown one
Fig. 7 Navigation map of low-achieving student on the computer-based posttest
Assessing and tracking students’ problem solving performances
123
testing condition superior to the other (e.g., DeAngelis 2000; Federico 1989; Hargreaves
et al. 2004; Mazzeo et al. 1991), other studies have found no differences between testing
conditions (Andersson et al. 2003; Clariana and Wallace 2002; Mason et al. 2001;
Schaeffer et al. 1993). Each achievement group scored significantly higher on the posttest
than they did on the pretest, an indication that students, regardless of ability level, profited
from EAI. Inspection of performances on specific items revealed HA students scored
higher than the other achievement groups on three item clusters on the CBT pretest, an
indication that these students were able to use the information reservoirs to figure some
problems prior to instruction. These differences were diminished and, in fact, disappeared
in some cases between the AA and LA groups on the CBT posttest. Two item clusters (i.e.,
2 and 5) seemed to account for most of the differences in total scores between achievement
groups. Solving these groups of items correctly was key to figuring out solutions to the
other test items.
Analyses of the students’ navigation patterns through the CBT provided clues about the
problem solving behaviors of students at the three achievement levels. Although LA
students scored lower than the AA students and the HA students on the CBT overall, their
navigation maps were quite similar. That is, the LA students spent most of their time
answering clusters of items that were central to solving the overall problem in Fraction ofthe Cost. They also accessed the information reservoirs to search for the relevant infor-
mation for helping them construct a useful strategy, although the HA student did not seem
to need them as much as the LA student during the posttest.
Implications
These results suggest that the newly developed CBT is a viable method for assessing
students’ problem solving ability on complex problems such as the EAI problem, Fractionof the Cost. The pathways between items and information reservoirs seemed easily navi-
gable for each group of students, including students with LD. Prior to conducting the study,
ease of navigation was a concern because the students had not been exposed to the test
architecture. Although the screens were similar to those students had encountered during
instruction, they had not been taught how to access them. On both the CBT and PPT, we
attempted to reduce the potential for overloading students’ working memory by limiting
text and integrating graphics (Clark and Mayer 2003; Mayer 2001). Overload was reduced
on the CBT by carefully paying attention to anticipated student movements through the
software. The static visual representations on the PPT had been refined over the course of
several previous studies so students could readily understand the intent of the items without
compromising the complex nature of the concepts tested by the items (Rose and Meyer
2007).
Based on these findings, the multimedia format of the CBT seems to carry with it
several advantages. First, the content of the CBT is complex and aligns with the movement
to extend ‘‘basic’’ skills beyond procedural competency advocated by teacher groups (e.g.,
National Council of Teachers of Mathematics 2000), by employer groups (e.g., National
Center on Education and the Economy 2007), and in government legislation (e.g., No
Child Left Behind Act of 2001). The CBT requires students to actively engage in solving a
complex problem for which there are several related subproblems. Most students, even
those with learning disabilities, were able to navigate the assessment space of the CBT. In
fact, observers reported that all of the students worked continuously through the class
period on the CBT.
B. A. Bottge et al.
123

The second advantage of the CBT is the diagnostic information it provides. Having
the ability to trace students’ movements to and from items and scaffolds furnishes
important information on whether the students are paying attention to the most critical
subproblems, the time students spend answering these items, and the scaffolds students
make use of for helping them understand the problem. These interactions are complex
but are made more visible by the tracking features used with the software. The problems
embedded in Fraction of the Cost are considered to be highly interactive because the
overall problem cannot be solved without all the elements being processed together. The
use of learning scaffolds in the form of story contexts, visual representations, and other
interactive tools can help students reduce the cognitive load imposed by this interactivity
(Clark and Mayer 2003; Mousavi et al. 1995; Rittle-Johnson and Koedinger 2005;
Mayer and Moreno 2003). Knowing where in the learning and assessment process
overload happens may lead to more accessible designs of both instructional and
assessment tools.
Although the results show promise for using CBT formats, the conclusions that can be
drawn from the findings are somewhat limited. First, the rural school from which the
students were drawn was relatively high performing and not diverse. In addition, the
average achievement levels within the ability groups were quite high and it is not clear
whether similar results would have been obtained with a lower-achieving or more heter-
ogeneous student population. Second, it was not possible to generate the strategic maps of
more than six students because of the constraints imposed by the data collection proce-
dures. The search maps were generated post-hoc in a labor-intensive process, which
involved tracking and recording each movement of the student’s cursor. In future research,
the software will generate these maps automatically for all students in the class providing
us with more confidence in our findings.
Despite these limitations, this research provides a first step in developing multimedia-
based assessments that can match the contextualized nature of the authentic-like problems
used in EAI. The accommodations afforded by more flexible test formats may have the
potential to more adequately probe deeper understandings of students with poor language
skills (e.g., receptive in the form of reading and expressive in the form of writing). The
impact of such work is likely to provide clues about how to more appropriately measure the
understanding of secondary school students where research on test accommodations is
especially lacking (Sireci et al. 2005).
In future research, we expect to merge interactive assessments as used in this study with
interactive instructional tools to provide both ongoing formative measures of skills to help
teachers individualize instruction and summative assessments to evaluate the overall
effectiveness of instructional practices. Our objective will be to collect information from
the CBT to explore changes in students’ mathematical abilities that may have contributed
to differences in their test performance over time. In a recent study of EAI (Cho et al.
2007), the response patterns of low-achieving, average-achieving, and high-achieving
students on a criterion-referenced problem-solving test were compared using mixture item
response theory (IRT) models (Baker 1992; Baker and Kim 2004; Hambleton et al. 1991;
Lord 1980). The results suggested that latent class membership reflected a clear change in
ability from pretest to posttest. That is, many of the students who were considered low
achieving on the basis of standardized, curriculum-aligned pretests joined the average-
achieving students at posttest. Using the CBT format will enable us to map the individual
student’s performances on each item to more completely understand how these changes
occur.
Assessing and tracking students’ problem solving performances
123
Acknowledgements The research reported in this article was supported by a grant from the U. S.Department of Education, Institute of Education Sciences Cognition and Student Learning (CASL) Program,Award No. R305H040032. Any opinions, findings, or conclusions are those of the authors and do notnecessarily reflect the views of the supporting agency.
References
Andersson, G., Kaldo-Sandstrom, V., Strom, L., & Stromgren, T. (2003). Internet administration of theHospital Anxiety and Depression Scale in a sample of tinnitus patients. Journal of PsychosomaticResearch, 55, 259–262.
Baker, F. B. (1992). Item response theory: Parameter estimation techniques. New York: Marcel Dekker.Baker, F. B., & Kim, S. H. (2004). Item response theory: Parameter estimation techniques (2nd ed.). New
York: Marcel Dekker.Bottge, B. A. (1999). Effects of contextualized math instruction on problem solving of average and below-
average achieving students. Journal of Special Education, 33, 81–92.Bottge, B. A., & Hasselbring, T. S. (1993). A comparison of two approaches for teaching complex, authentic
mathematics problems to adolescents in remedial math classes. Exceptional Children, 59, 556–566.Bottge, B. A., Heinrichs, M., Chan, S., & Serlin, R. (2001). Anchoring adolescents’ understanding of math
concepts in rich problem-solving environments. Remedial and Special Education, 22, 299–314.Bottge, B. A., Heinrichs, M., Mehta, Z., & Hung, Y. (2002). Weighing the benefits of anchored math
instruction for students with disabilities in general education classes. The Journal of Special Education,35, 186–200.
Bottge, B. A., Rueda, E., LaRoque, P. T., Serlin, R. C., & Kwon, J. (2007a). Integrating reform- orientedmath instruction in special education settings. Learning Disabilities Research & Practice, 22, 96–109.
Bottge, B. A., Rueda, E., Serlin, R. C., Hung, Y., & Kwon, J. (2007b). Shrinking achievement differenceswith anchored math problems: Challenges and possibilities. The Journal of Special Education, 41,31–49.
Bottge, B., Rueda, E., & Skivington, M. (2006). Situating math instruction in rich problem-solving contexts:Effects on adolescents with challenging behaviors. Behavioral Disorders, 31, 394–407.
Bruner, J. S. (1975). The ontogenesis of speech acts. Journal of Child Language, 2, 1–40.Brush, T., & Saye, J. (2001). The use of embedded scaffolds with hypermedia-supported student-centered
learning. Journal of Multimedia and Hypermedia, 10, 333–356.Cho, S., Cohen, A., Kim, S., & Bottge, B. (2007). Latent transition analysis with a mixture response theory
measurement model. Paper to be presented at the National Council on Measurement in EducationAnnual Conference, Chicago, IL.
Clariana, R., & Wallace, P. (2002). Paper-based versus computer-based assessment: Key factors associatedwith the test mode effect. British Journal of Educational Technology, 33, 593–602.
Clark, R. C., & Mayer, R. E. (2003). E-Learning and the science of instruction. Hoboken, NJ: John Wiley &Sons, Inc.
Cognition, Technology Group at Vanderbilt (1990). Anchored instruction and its relationship to situatedcognition. Educational Researcher, 19(3), 2–10.
Cognition, Technology Group at Vanderbilt (1997). The Jasper Project: Lessons in curriculum, instruction,assessment, and professional development. Mahwah, NJ: Erlbaum.
CTB McGraw-Hill (2003). TerraNova Comprehensive Tests of Basic Skills. Monterey, CA.Dalton, S., & Overall, J. E. (1977). Nonrandom assignment in ANCOVA: The alternate ranks design.
Journal of Experimental Education, 46, 58–62.DeAngelis, S. (2000) Equivalency of computer-based and paper-and-pencil testing. Journal of Allied
Health, 29(3), 21–29.Dolan, R. P., & Hall, T. E. (2001). Universal design for learning: Implications for large-scale assessment.
IDA Perspectives, 27(4), 22–25.Federico, P. A. (1989). Computer-based and paper-based measurement of recognition (Research Report No.
NPRDC-TR-89-7): Navy Personnel Research and Development Centre Report.Ge, X., & Land, S. M. (2003). Scaffolding students’ problem-solving processes in an ill-structured task
using question prompts and peer interactions. Educational Technology Research and Development,51(1), 21–38.
Glasgow, N. (1997). New curriculum for new times: A guide to student-centered, problem-based learning.Thousand Oaks, CA: Corwin.
Gray, K. C., & Herr, E. L. (1998). Workforce education: The basics. Boston: Allyn and Bacon.
B. A. Bottge et al.
123

Hambelton, R. K., Swaminathan, H., & Rogers, H. J. (1991). Fundamentals of item response theory.Newbury Park, CA: Sage.
Hannafin, M. J., Hill, J., & Land, S. (1997). Student-centered learning and interactive multimedia: Status,issues, and implications. Contemporary Education, 68(2), 94–99.
Hannafin, M., Land, S., & Oliver, K. (1999). Open learning environments: Foundations, methods, andmodels. In C. M. Reigeluth (Ed.), Instructional design theories and models: A new paradigm ofinstructional theory (pp. 115–140). Mahwah, NJ: Erlbaum.
Hargreaves, M., Shorrocks-Taylor, D., Swinnerton, B., Tait, K., & Threlfall, J. (2004). Computer or paper?That is the question: does the medium in which assessment questions are presented affect children’sperformance in mathematics? Educational Research, 46(1), 29–42.
Hasselbring, T. S., Lewis, P., & Bausch, M. E. (2005). Assessing students with disabilities: Movingassessment forward through universal design. Insight, 5, 1–16.
Kirsch, I., Braun, H., & Sum, A. (2007). America’s perfect storm: Three forces changing our nation’s future.Princeton, NJ: Educational Testing Service.
Lester, J., & Kroll, D. L. (1990). Assessing student growth in mathematical problem solving: Assessinghigher order thinking in mathematics. Washington, DC: American Association for the Advancement ofScience.
Lord, F. N. (1980). Applications of item response theory to practical testing problems. Mahweh, NJ:Erlbaum.
Mason, B. J., Patry, M., & Berstein, D. J. (2001). An examination of the equivalence between non-adaptivecomputer-based and traditional testing. Journal of Educational Computing Research, 24(1), 29–39.
Mayer, R. E. (2001). Multi-media learning. New York: Cambridge University Press.Mayer, R. E., & Moreno, R. (2003). Nine ways to reduce cognitive load in multimedia learning. Educational
Pschology, 38(1), 43–52.Mazzeo, J., Druesne, B., Raffeld, P., Checketts, K. T., & Muhlstein, E. (1991). Comparability of computer
and paper-and-pencil scores for two CLEP general examinations (ETS Report No. RR-92-14).Princeton, NJ: Educational Testing Service.
Mousavi, S. Y., Low, R., & Sweller, J. (1995). Reducing cognitive load by mixing auditory and visualpresentation modes. Journal of Educational Psychology, 87, 319–334.
Murnane, R. J., & Levy, F. (1996). Teaching the new basic skills. New York, NY: The Free Press.National Center on Education, the Economy (2007). Tough choices or tough times: The report of the new
commission on the skills of the American workforce. Washington, DC.National Council of Teachers of Mathematics (2000). Principles and standards for school mathematics.
Reston, VA: Author.No Child Left Behind Act of 2001, Pub. L. No. 107–110, 115 Stat. 1425 (2002).Palincsar, A. S. (1986). The role of dialogue in providing scaffolded instruction. Educational Psychologist,
21, 73–98.Palincsar, A. S., & Brown, A. L. (1984). Reciprocal teaching of comprehension-fostering and compre-
hension-monitoring activities. Cognition and Instruction, 1, 117–175.Perie, M., Grigg, W., & Dion, G. (2005). The Nation’s Report Card: Mathematics 2005 (NCES 2006-453).
U. S. Department of Education. National Center for Education Statistics. Washington, DC: GovernmentPrinting Office.
Puntambekar, S., & Stylianou, A. (2005). Designing navigation support in hypertext systems based onnavigation patterns. Instructural Science, 33, 451–481.
Puntambekar, S., Stylianou, A., & Hubscher, R. (2003). Improving navigation and learning in hypertextenvironments with navigable concept maps. Human-Computer Interaction, 18, 395–428.
Rittle-Johnson, B., & Koedinger, K. R. (2005). Designing knowledge scaffolds to support mathematicalproblem solving. Cognition and Instruction, 23, 313–349.
Rittle-Johnson, B., Siegler, R. S., & Alibali, M. W. (2001). Developing conceptual understanding andprocedural skill in mathematics: An iterative process. Journal of Educational Psychology, 93, 346–362.
Rose, D. H., & Meyer, A. (2007). Teaching every student in the digital age: Universal design for learning.Retrieved February 2, 2007 from: http://www.cast.org/teachingeverystudent/ideas/tes/
Schaeffer, G., Reese, C. M., Steffen, M., McKinley, R. L., & Mills, C. N. (1993). Field test of a computer-bases GRE general test (Report No. ETS-RR-93-07). Princeton, NJ: Educational Testing Service.
Shafer, M. C., & Romberg, T. A. (1999). Assessment in classrooms that promote understanding. InE. Fennema & T. A. Romberg (Eds.), Mathematics classrooms that promote understanding (pp. 159–184). Mahwah, NJ: Erlbaum.
Sireci, S. G., Scarpati, S. E., & Shuhong, L. (2005). Test accommodations for students with disabilities: Ananalysis of the interaction hypothesis. Review of Educational Research, 75, 475–490.
Assessing and tracking students’ problem solving performances
123

Stone, J. R., Alfeld, C., Pearson, D., Lewis, M. V., & Jensen, S. (2006). Building academic skills in context:Testing the value of enhanced math learning in CTE. Minneapolis: University of Minnesota.
Thornburg, D. (2002). The new basics: Education and the future of work in the telematic age. Alexandria,VA: Association for Supervision and Curriculum Development.
Uchida, D., Cetron, M., & Mckenzie, F. (1996). Preparing students for the 21st century. Arlington, VA:American Association of School Administrators.
University of Iowa (2001). The Iowa Tests of Basic Skills (ITBS). Itasca, IL: Riverside Publishing.U.S. Department of Labor (1991). What work requires of schools: A SCANS report for America
Washington, DC: Author.Vygotsky, L. S. (1978). Mind in society. Cambridge, MA: Harvard University Press.
Brian A. Bottge Brian A. Bottge is the William T. Bryan Endowed Chair in Special Education in theDepartment of Special Education and Rehabilitation Counseling at the University of Kentucky. His researchfocuses on using multimedia and hands-on learning applications for improving the problem-solving skills oflow-achieving students in mathematics.
Enrique Rueda Enrique Rueda is Associate Researcher at the Wisconsin Center for Education Researchat the University of Wisconsin-Madison. Mr. Rueda is a multimedia artist and develops curricula thatintegrate digital media into the process of learning/teaching mathematics.
Jung Min Kwon Jung Min Kwon is working on her doctoral degree in the Department of RehabilitationPsychology and Special Education at the University of Wisconsin-Madison. Her research interests center onusing technology in special education to promote authentic learning.
Timothy Grant Timothy Grant is working on his doctoral degree in the Department of EducationalPsychology at the University of Wisconsin-Madison. His research interests include hierarchical linearmodeling and Bayesian methods.
Perry LaRoque Perry T. LaRoque completed his PhD in Special Education from the Department ofRehabilitation Psychology and Special Education. His research interests involve adolescent deviance and theeffects of peer group orientation on school conduct.
B. A. Bottge et al.
123