
Editor's note - STIKes Cirebon
67
-
Upload
khangminh22 -
Category
Documents
-
view
3 -
download
0
Transcript of Editor's note - STIKes Cirebon

Suryono and Nafrialdi.Editorial
195
Editor's note
Isnani A.S. Suryono,1 Nafrialdi21 Editor-in-chief Emeritus, Medical Journal of Indonesia, Jakarta, Indonesia2 Editor-in-chief, Medical Journal of Indonesia, Jakarta, Indonesia
Editorial
Medical Journal of Indonesia
How time flies! It has been 23 years since the Medical JournaI of Indonesia (MJI) was founded by our founding fathers, Professors Abdul Bari Saifuddin, Sahala M. Lumbantobing, Arjatmo Tjokronegoro, and R.M. Susworo in 1992. Since the beginning, in days of struggling to get enough research articles worth publishing, we have been supported by our Faculty of Medicine, Universitas Indonesia, and also the Directorate General of Higher Education (DGHE), the Ministry of Education. We, the people of MJI are very grateful of the ongoing support given.
As for the struggle to reach more readers and authors, be they national or international, we have tried to be noticed by all through many ways. Besides trying our best to reach the standard of a worthy scientific journal, we submitted to several indexing companies such as the Pub Med, to no avail. We tried to convince DGHE to acknowledge the MJI as ‘international’, and was told to try to submit to SCOPUS. After studying the criteria, we finally gather enough courage to enlist to SCOPUS by the year 2011, but was turned down, and were kindly informed that it was due to ‘weak’ articles and lack of international authors and reviewers. It is not easy to obtain articles from internationally known authors since our journal was ‘only’ nationally accredited, which is one step below the internationally acknowledged journal in our country!
In the meantime, we did several internal changes, we rejuvenate our board of editors, add several professional administrative staffs, set up our electronic form of publishing using Open Journal System built by Public Knowledge Project (2013), applied the system for online submission, reviewing and editing. We were also indexed by DOAJ (Directory of Open Access Journals), Proquest, EBSCO, IMSEAR, and other indexing
systems. Besides, we have uploaded back issues till 1994. Through all the efforts, we can see from the citations taken from Google Scholar, our citations has risen two times annualy. By February 2015, we tried approaching SCOPUS for the second time, and after a long wait of almost a year, finally, our very dedicated senior editor Prof. Hans Joachim Freisleben was informed that MJI is accepted to be indexed in SCOPUS, starting from first of December 2015! Thank God, Alhamdulillah! Everyone in MJI were very happy and immensely relieved! We pray that our founding fathers, some of them deceased, would be relieved and happy as well!
Along with what apparently seem as an improvement of recognition to our MJI, we fully realize that with the increasing acknowledgment we will (hopefully) receive more and even better quality articles from authors nationally as well as internationally. It means, we will have to increase the capacity of work by our board of editors and office, in article management, and keep on improving our system internally, to be able to give better service to our authors and readers specifically, and for the medical research and scientific world in general.
We would like to thank our partners, our fellow Indonesian medical journal society, the Asia-Pacific Association of Medical Journal Editors (APAME), our distinguished reviewers and friends from all over the world, Prof. Farrokh Habibzadeh, former president of the World Association of Medical Editors (WAME), Prof. Wilfred Peh, the secretary general of APAME, and many more. We look forward to future collaborations to further increase our journal’s integrity, professionalism, and achieve a rightful place among world renown and prestigious medical journals. We also want to thank our honored reviewers, who is most
196 Med J Indones, Vol. 24, No. 4December 2015
important to maintain the quality of this peer reviewed journal. We also thank the authors who have trusted their works to be disseminated by this journal.
Finally, we would like to thank and give appreciation to everyone in the MJI, to our editors, who are most deserving and hardworking and who serve the authors to disseminate their prestigious works and to assure readers that the articles are ethical, useful, and not misleading. And finally to our
very update young people, editors and assistant editors, especially doctors Felix Firyanto Widjaja and Laurentius Aswin Pramono, Ms. Devita A. Prabowo, Mr. Yudi Tarmizi, and Mrs. Khadijah Buyoyok, you are the future of our MJI, keep on improving! This is not the end my friends, just another beginning!
As another end of year is approaching, we would like to greet you all with a Happy Holiday Season and with hope for a bright, promising, productive, and peacefully Happy New Year 2016!
Copyright @ 2015 Authors. This is an open access article distributed under the terms of the Creative Commons Attribution-NonCommercial 4.0 International License (http://creativecommons.org/licenses/by-nc/4.0/), which permits unrestricted non-commercial use, distribution, and reproduction in any medium, provided the original author and source are properly cited.
pISSN: 0853-1773 • eISSN: 2252-8083 • http://dx.doi.org/10.13181/mji.v24i4.1359 • Med J Indones. 2015;24:195–6
Correspondence author: Isnani A.S. Suryono, [email protected]
http://mji.ui.ac.id
Wulandari, et al.HPV 16 strains isolated in Indonesia
197
Phylogenetic analysis and predicted functional effect of protein mutations of E6 and E7 HPV16 strains isolated in Indonesia
Keywords: cervical cancer, E6 & E7 gene, E6 & E7 proteins, HPV16 variant, phylogenetic, SNAP
pISSN: 0853-1773 • eISSN: 2252-8083 • http://dx.doi.org/10.13181/mji.v24i4.1197 • Med J Indones. 2015;24:197–205• Received 02 Feb 2015 • Accepted 27 Nov 2015
Correspondence author: Dwi Wulandari, [email protected]
Copyright @ 2015 Authors. This is an open access article distributed under the terms of the Creative Commons Attribution-NonCommercial 4.0 International License (http://creativecommons.org/licenses/by-nc/4.0/), which permits unrestricted non-commercial use, distribution, and reproduction in any medium, provided the original author and source are properly cited.
Dwi Wulandari,1,3 Lisnawati Rachmadi,2,4 Tjahjani M. Sudiro3,4
1 Research Center for Biotechnology, Indonesian Institute of Sciences-LIPI, Bogor, Indonesia 2 Department of Anatomical Pathology, Faculty of Medicine, Universitas Indonesia, Cipto Mangunkusumo Hospital, Jakarta,
Indonesia 3 Department of Microbiology, Faculty of Medicine, Universitas Indonesia, Cipto Mangunkusumo Hospital, Jakarta, Indonesia4 Center for Research and Integrated Development of Tropical Health and Infectious Diseases, Universitas Indonesia, Jakarta,
Indonesia
Basic Medical Research
Medical Journal of Indonesia
ABSTRAK
Latar belakang: Protein E6 dan E7 merupakan onkoprotein HPV. Variasi alami protein E6 HPV16 dapat mengubah potensi karsinogeniknya. Penelitian ini bertujuan untuk menganalisis filogenetik gen dan protein E6 dan E7 HPV16 dari Indonesia dan mempredikasi efek substitusi asam amino tunggal terhadap fungsi protein. Analisis ini digunakan sebagai penapis awal dalam pemilihan protein untuk diuji coba secara in vitro ataupun in vivo sehingga dapat menghemat waktu, tenaga, dan biaya penelitian.
Metode: Data sekuen gen E6 dan E7 yang digunakan berasal dari 12 sampel isolat Indonesia yang dibandingkan dengan HPV16R (prototipe) dan 6 isolat standar yang merupakan varian HPV16 dengan kategori cabang Eropa (E), Asia (As), Asia-Amerika (AA), Afrika-1 (Af-1), Afrika-2 (Af-2), dan Amerika utara (NA) yang diperoleh dari Genbank. Sekuen DNA dianalisis menggunakan BioEdit v.7.0.0 untuk mendapatkan komposisi dan substitusi asam amino tunggal. Analisis filogenetik gen dan protein E6 dan E7 menggunakan software Clustal X (1.81) dan NJPLOT. Analisis efek subtitusi asam amino tunggal menggunakan metode SNAP.
Hasil: Isolat Java dan ui66* termasuk dalam cabang Eropa sedangkan yang lain termasuk cabang Asia dan Afrika. Terdapat 12 mutasi asam amino pada protein E6 dan 1 mutasi pada protein E7. Analisis SNAP menghasilkan 2 mutasi non netral, yaitu R10I dan C63G pada protein E6. Mutasi R10I ditemukan pada AF472509 (Af-2) dan isolat Indonesia yaitu Afrika-2 (Af2*). Mutasi C63G ditemukan hanya pada isolat Af2*.
Kesimpulan: Protein E6 lebih bervariasi dibanding dengan protein E7. Analisis metode SNAP menunjukkan hanya protein E6 dari cabang Afrika-2 yang diprediksi memiliki perbedaan fungsional protein dibandingkan dengan HPV16R.
ABSTRACT
Background: E6 and E7 are oncoproteins of HPV16. Natural amino acid variation in HPV16 E6 can alter its carcinogenic potential. The aim of this study was to analyze phylogenetically E6 and E7 genes and proteins of HPV16 from Indonesia and predict the effects of single amino acid substitution on protein function. This analysis could be used to reduce time, effort, and research cost as initial screening in selection of protein or isolates to be tested in vitro or in vivo.
Methods: In this study, E6 and E7 gene sequences were obtained from 12 samples of Indonesian isolates, which were compared with HPV16R (prototype) and 6 standard isolates in the category of European (E), Asian (As), Asian-American (AA), African-1 (Af-1), African-2 (Af-2), and North American (NA) branch from Genbank. Bioedit v.7.0.0 was used to analyze the composition and substitution of single amino acids. Phylogenetic analysis of E6 and E7 genes and proteins was performed using Clustal X (1.81) and NJPLOT softwares. Effects of single amino acid substitutions on protein function of E6 and E7 were analysed by SNAP.
Results: Java variants and isolate ui66* belonged to European branch, while the others belonged to Asian and African branches. Twelve changes of amino acids were found in E6 and one in E7 proteins. SNAP analysis showed two non neutral mutations, i.e. R10I and C63G in E6 proteins. R10I mutations were found in Af-2 genotype (AF472509) and Indonesian isolates (Af2*), while C63G mutation was found only in Af2*.
Conclusion: E6 proteins of HPV16 variants were more variable than E7. SNAP analysis showed that only E6 protein of African-2 branch had functional differences compared to HPV16R.

198 Med J Indones, Vol. 24, No. 4December 2015
Human papillomaviruses (HPVs) can induce hyperproliferation of the skin and mucosal epithelia causing benign and malignant tumors. HPVs belong to the family Papillomaviridae, a deoxyribose nucleic acid (DNA) virus with a genome size 7900 bp. HPV genome consists of early genes (E1, E2, E4, E5, E6, and E7), late genes (L1 and L2) and the long control region (LCR) for regulatory functions. Among the HPV proteins, E6 and E7 proteins of HR-HPV are oncoproteins required to induce malignancy. E6 and E7 are small proteins disrupting important cellular pathway, p53 and pRB, respectively, involved in apoptosis and cell cycle regulation.1-3
Factors related to the virus contribute to progression of the infection to cancer, such as HPV type involved in the infection, viral variants, persistance and viral load. Currently, more than 120 different types of HPV have been identified featuring distinct tropisms for different body sites (skin, mouth, and genitalia).4,5 About 40 genotypes are involved in anogenital tract infection, causing various diseases ranging from genital warts to invasive cancer. HPV types 16, 18, 31, 33, 35, 39, 45, 51, 52, 56, 58, 59, 68, 73, and 82 have been considered as high risk (HR-HPV). HPV type 16 and 18 are the most common cause of cervical cancer. HPV16 is related to 50% of cervical cancer and cancer precursor lesions in the world and 38% in Indonesia.6,7
Human papillomavirus isolates historically were classified into types by comparing their DNA with a set of HPV reference genomes. Isolates that belong to the same HPV type are closely related to one another on the basis of nucleotide sequence and represent a discrete phylogenetic group.3,8 Today, different types of HPV are defined as having more than 10% variation in L1 gene. Viruses differing by 2–10% are called subtypes and are infrequently observed, while those differing by <2% are more frequently seen and called intratypic variants.9
The intratypic evolutionary variant studies were initially inferred from the partial upstream regulatory region (URR) and E6 sequences, and have been recently expanded to include the complete genomes. HPV16 variants are geographically distributed. Yamada et al10 have categorized HPV16 variants into six phylogenetic branches namely: European (E), Asian (As), Asian-American (AA), African-1 (Af-1), African-2 (Af-2),
and North American (NA). The prototype variant named HPV16R (K02718), which was reported by Seedorf et al8 was isolated from Germany is included in the European branch.
The description and understanding of HPV genome variants is an important area for molecular pathogenesis and for the development of molecular diagnostics for HPV, vaccines and other therapeutic approaches to control and/or eliminate virus-induced diseases. Despite phylogenetic relatedness, HPV variants can differ in pathogenicity. There is a three-fold or greater risk of cervical cancer for Asian-American (AA) or African (Af) HPV16 variants compared to European (E) variants; and, non-European variants of HPV16 may be more common in cancer tissues and high-grade cervical lesions.11-13
HPV16 variants' data in Indonesia are still limited. de Boer et al14 reported the presence of a variant of Java from samples taken at Cipto Mangunkusumo Hospital, Jakarta, and found that Java variant (JV) was dominant compared to other variants (15 of 22 samples). JV having mutation in the E6 open reading frame (ORF; 276G), gave the predicted amino acid change N58S.14
The changes in gene sequences may cause changes in biological function of the protein encoded by these genes, which may affect the course of the disease. Phylogenetic analysis of genetic and protein variation especially E6 and E7 of HPV16 variants is the essential factor to determine differences in biological properties of the virus and to be used for studies of infectivity and pathogenicity.15,16
Screening for non-acceptable polymorphisms (SNAP) method has been developed by de Boer et al14 to determine the predictive effect of a single non-synonymous nucleotide polymorphism to the function of the protein compared with the wild-type protein. Non-synonymous single nucleotide polymorphisms (SNPs) are ‘neutral’ if the resulting point-mutated protein is not functionally discernible from the wild type and ‘non-neutral’ otherwise. The ability to identify non-neutral substitutions could significantly aid in targeting disease causing detrimental mutations, as well as SNPs that increase the fitness of particular phenotypes.17-19 SNAP analysis is useful to guide selection of isolates
http://mji.ui.ac.id
Wulandari, et al.HPV 16 strains isolated in Indonesia
199
Variants Genbank accesion number Year of discovery Isolated fromReference (HPV16R ) K02718 1985 GermanyAfrica 1 (Af1) AF472508 2003 AfricaAfrica 2 (Af-2) AF472509 2003 AfricaEurope (E) U118173 2007 GermanyAsia (As) AF534061 2003 East AsianAsia-america (AA) AY686579 2005 Costa RicaNorth America (NA) AF125673 2000 Unknown
Table 1. List of HPV16 reference strains representing variants of HPV16 used as standard in phylogenetic and SNAP analysis
(Modified from Lurchachaiwong et al)20
to be tested experimentally in vitro, especially in resource-limited laboratory.
Despite the prevalence of HPV16, analysis of E6 and E7 proteins of HPV16 variants from Indonesia has not been reported. Therefore in this work, we analyzed phylogenetic of E6 and E7 gene and protein and used SNAP to predict the effect of a single non-synonymous nucleotide polymorphisms on the function of the protein of HPV16 isolates from Indonesia compared to the existing HPV reference in GenBank. This analysis could be used to reduce time, effort, and cost research as initial screening in selection of protein or isolates to be tested in vitro or in vivo.
METHODS
The laboratory work was done for six months in 2012 at Microbiology Department, Faculty of Medicine, Universitas Indonesia, Jakarta, Indonesia. The protocol of this study has been approved by Medical Ethics Committee of Universitas Indonesia (No.278/PT02.FK/ETIK/2010).
Data collection Sequence data of E6 and E7 genes in this paper used 12 samples of Indonesian isolates which were 11 samples (Java1*, Java2*, Java276G1*, Java276G2*, Java276G3*, Af2*, As647G1*, As647G2*, E647G*, E350G*, E109C*) obtained from data published by de Boer et al14 and one sample of ui66*. Indonesian isolates were compared with the data of HPV16R (prototype) and six standard variant isolates of HPV16 in the category of European (E), Asian (As), Asian-American (AA), African-1 (Af-1), African-2 (Af-
2), and North American (NA) branches obtained from the Genbank (Table 1).
Sample and DNA isolationui66 DNA was isolated from cytology samples from cervical swab of a patient with cervical intraepithelial neoplasia (CIN) two obtained from Department of Pathological Anatomy, Faculty of Medicine, Universitas Indonesia, Jakarta in 2012. The sample ui66* was tested by Linear Array® HPV Genotyping Test (Roche) method, and was found containing HPV16. DNA was isolated by QIamp DNA Blood Mini Kit (Qiagen) method.
PCR procedurePrimers HPV16–7531F 5’GTA CGT TTC CTG CTT GCC AT 3’ and HPV16–2450R 5’CAA CAG GGC ACT GTA GCA TC 3’ were used to amplify fragments of ui66* DNA. Polymerase chain reaction (PCR) mixture contained: 1 µl DNA isolate, 1 x KOD Plus Neo DNA polymerase (Toyobo) buffer, 1.5 mM MgSO4, 0.2 mM dNTPs, 0.3 U enzyme KOD Plus Neo DNA polymerase (Toyobo) and 0.2 mM each primer for total a volume of 15 µl. Amplifications were performed with the following reaction condition: 95°C five minutes, followed by 40 cycles of 30 second denaturation at 95°C, 30 second annealing at 52°C, and a two minutes 30 second elongation at 68°C. The last cycle was followed by a final extension step of seven minutes at 68°C.
DNA sequencingPrimers HPV16–7811F 5’GTT AGT CAT ACA TTG TTC ATT TGT 3’ and HPV16–552R 5’CAA CAA GAC ATA CAT CGA CCG3’, HPV16–368F 5’ACA GCA ATA CAA CAA ACC GTT 3’, and HPV16–1664R 5’GCA GCA ATA CAC CAA TCG CA 3’ were used for DNA sequencing. The sequencing was done at Eijkman
Medical Journal of Indonesia

200 Med J Indones, Vol. 24, No. 4December 2015
Variant
Nucleutide position of E6 Nucleotide position of E7
1 1 1 1 1 1 1 1 1 1 1 2 2 2 2 2 3 3 3 4 4 4 4 5 5 6 6 6 7 7 8 80 3 3 3 4 4 5 7 7 7 8 1 5 7 8 8 1 3 5 0 0 3 8 2 3 1 4 6 8 9 4 49 1 2 5 3 5 3 3 6 8 8 9 6 6 6 9 0 5 0 2 3 3 8 2 2 8 7 6 9 5 3 6
HPV16R (E) (Ref) T A G A C G C C G T G G C A T A T C T A A G A A A A A G T T T Tui66* AY686579 (AA) T A A G T G G AF125673 (NA) T A G AF472508 (AF-1) C G T A G T G AF472509 (AF-2) C T G T T G G EU118173 (E) AF534061 (AS) G CJava1* C A Java2* A Java276G1* A G A Java276G 2* G A Java276G3* G G A Af2* C T G T A G T G G G C G As647G1* G G CAs647G2* G G C CE647G* G CE350G* G E109C* C C
Table 2. Nucleotide sequence variations among the HPV16 isolates relative to reference HPV16 (HPV16R)
Note: E6 and E7 nucleotide positions at which variations observed are written vertically across. E: European, As: Asian, Java: Javanese, Af1: African1, Af2: African-2, NA: North-American, and AA: Asian–American with their accession number. Indonesian isolates coded with symbol (*)
Institute for Molecular Biology, Jakarta, by the dye-deoxy terminator method on a 310 ABI Prism Sequencer (PE Applied Biosystems) using 5 pmol of either forward or back primers.
Phylogenetic analysisDeoxy-ribonucleic acid (DNA) sequence of ui66* was compared to data of E6 and E7 gene sequences of HPV16 from Indonesia published by de Boer et al.14 HPV16 reference strains representing variants of HPV16 was used as standard in phylogenetic. SNAP analysis referred to research of Lurchachaiwong et al20 (table 1), and the sequence data were obtained from the national center for biotechnology (NCBI). DNA sequences were analyzed using BioEdit v.7.0.0 to get the amino acid composition and single amino acid substitution.21 A multiple sequenced alignment of genes and proteins was perform using ClustalX1.81.22 Then
dnd. file were exported to obtain phylogenetic tree by NJPLOT V 2.3.23
SNAP analysisEffects of single amino acid substitutions on protein function of E6 and E7 were analyzed by SNAP feature.17
RESULTS
Phylogenetic tree analysis in figure 1 and 2 showed the branches of HPV16 variants. Results of analysis of both E6 and E7 genes and proteins showed different patterns of phylogenetic branch. For example E6 gene analysis results showed Java 276G1*, 2*, 3* were sublineages of HPV16R, while the E6 protein analysis results were on a different branch of HPV16R.
http://mji.ui.ac.id

Wulandari, et al.HPV 16 strains isolated in Indonesia
201
SNAP analysis mutation
E6 protein E7 protein
R10T R10I Q14H Q14D D25E D25N L27I E29Q N58S C63G H78Y L83V N29SNet Non Net Net Net Net Net Net Net Non Net Net Net
AY686579 (AA) √ √ √ √AF125673 (NA) √ √AF472508 (AF-1) √ √ √ √AF472509 (AF-2) √ √ √ √ √EU118173 (E) √ √AF534061 (AS) √ √ √Java1*Java2*Java276G1* √ √Java276 G2* √Java276G3* √ √Af2* √ √ √ √ √As647G1* √ √As647G2* √ √E647G* √E350G* √E109C* √ui66*
Table 3. Analysis E6 and E7 using SNAP method
Note: E6 and E7 amino acid mutation comparison to HPV16R at which the variations were observed are written vertically across the top and the SNAP analysis result, net: neutral, non: non-neutral
Comparison analysis between E6 to E7 genes produces different patterns of branching. Phylogenetic tree of E6 and E7 genes showed ui66* and Java isolates were included in the European branches except Java276G3* in figure 2 that was showed in a separate branch. This suggests the possibility that the isolates derived from Europe.
While based on phylogenetic tree E6 and E7 proteins showed ui66*, Java1*, Java2* into the European branch, Java276G1*, 2*, 3* were closer to Asia. Phylogenetic analysis of E6 genes and proteins revealed genetic divergence, while there was only one nucleotide mutation in the E7 gene that cause amino acid changes. Thus the phylogenetic tree of the E7 proteins revealed into two branches only.
Mutations in E6 and E7 proteins as can be seen in table 2 was obtained by Clustal X software analysis. There were 12 mutations of amino acids of protein E6 and one mutation of E7 proteins. These
mutation has been analyzed using SNAP method and showed two non-neutral mutations, R10I and C63G in E6 proteins. R10I mutations were found in AF472509 (Af-2) and in the Indonesian isolates belonged to African-2 branch (Af2*). The C63G mutation was found only in Indonesian isolate which belonged to Af2* (table 3). Thus suggests that only E6 proteins of the African-2 branch had functional differences compared to HPV16R. It is necessary to do laboratory tests in vitro or in vivo to determine the implications as carcinogenic agents.
DISCUSSION
Phylogenetic analysis is the study of evolutionary relationships among molecules, phenotypes, and organisms.11 The physicochemical properties of nucleic acids or amino acids are crucial factors that affect their structures or functions, thus it may provide function prediction, and in relation with pathogens, it may relate to pathogenicity.21
Medical Journal of Indonesia

202 Med J Indones, Vol. 24, No. 4December 2015
Figure 1. Comparative phylogenetic trees of E6 gene and protein of different HPV16 isolates. E6 genes and proteins formed branching with different pattern and member
Figure 2. Comparative phylogenetic trees of E7 gene and protein of different HPV16 isolates. E7 genes and proteins formed branching with different pattern and member
Relationship analysis of some isolates, as could be seen from phylogenetic tree, could give different results when different genes or proteins were used as point of view. Phylogenetic tree result of genes and proteins of E6 and E7 showed different
pattern relationship for example Java276G3* showed inconsistency of which branch it belong to. de Boer et al14 revealed that Javanese variant would belong to European branch but it was argumented to define these variants as a
E6 gene E6 protein0.002E109C* E350G*
EU118173_E_
AF472509_Af-2_
AF472508_Af-1_
AF125673_NA_
AY686579_AA_Java276G3*Java276G2*
Java276G1*
AF534061_As_
As647G2*
ui66
E109C*
E647G*
Java2*
Java1*
HPV16R
As647G1*
Java1*
Java2*
ui66E647G*
Java276G3*
Java276G2*
Java276G1*
HPV16R
As647G2*As647G1*
E350G*
Af2*
AF472509_Af-2_
AF472508_Af-1_
AY686579_AA_
EU118173_E_
AF125673_NA_
AF534061_As_
0.002
Af2*
E7 geneE7 protein
E647G*E647G*As647G2*As647G1*Af2*
ui66E109C*E350G*Java276G2*Java276G1*Java2*Java1*
EU118173_E_
AF472508_Af-1AF125673_NA_AY686579_AA_HPV16R
Java276G3*
AF534061_As_AF472509_Af-2_
0.002 0.001
Es647G2*
As647G1*
Java276G3*ui66E109C*E350G*
EU118173_E_
AF125673_NA_HPV16R
Java276G2*Java276G1*Java2*Java1*
Af2*AF472509_Af-2_
AF472508_Af-1_AY686579_AA_
AF534061_As_
http://mji.ui.ac.id
Wulandari, et al.HPV 16 strains isolated in Indonesia
203
separate branch. So it is difficult to choose which phylogenetic tree can be used as a benchmark. In this paper, variants other than E were also found i.e. As, Af-1 and Af-2 although in small amounts.
However, for functional studies it may be more appropriate to use protein sequences for such analysis. The fundamental building blocks of life are proteins. The catalysts of virtually all of the chemical transformations in the cell, are proteins. The functional properties of proteins is determined by the sequence of the 20 amino acids. For protein-encoding genes, the object on which natural selection acts is the protein.25
Determination of related phylogenetic classi-fication or naming isolates should be based on one of the most conserved gene. The result of International Workshop of Papillomavirus in Quebec in 1995 have agreed to use the L1 gene to determine the types of HPV.4 Further studies discovered that there are variants in one type of HPV that related to their pathogenicity and distribution.1,26
Human papilomavirus variant data are important in developing HPV diagnostics, vaccines, and other therapeutic approaches to control virus-induced diseases. HPV16 variants have been shown to have different biological as well as biochemical effects, resulting in altered oncogenic potentials. The oncogenicity of distinct HPV variants may also differ between geographical regions because of population history and host genetics, such as the difference in the distribution of HLA in the population.27,28
In this study, branching pattern of phylogenetic trees did not match with the results of Yamada et al.1 For example, the NA should be closer to AA than E. It is possible that our analysis used only E6 or E7 gene alone, while Yamada et al1 used E6, L1, L2 and LCR to determine HPV16 variant branches.
The results of phylogenetic analysis of HPV16 variants from Indonesia showed that Java and ui66* isolates were included in the European branches. de Boer et al14 revealed that Java isolate was found dominantly (15 of 22 samples) and Java variants belonged to European branch, which was not in accordance with Hildesheim and Wang,9 stating that there was greater risk
of cervical cancer for non-European variants of HPV16.9 It could be because of the lack of sample number. The majority of isolates analysis in this study were isolated in year 2004. Since there are not many published data on recent HPV isolates from Indonesia, to know the recent distribution of HPV variants in Indonesia needs further study.
Screening for non-acceptable polymorphisms (SNAP) prediction of E7 proteins from all isolates showed no change in protein functional properties. The non-neutral (R10I & C63G) mutations were found only in E6 protein of the African-2 branch. It is estimated that these mutations alter protein function, but actually to determine how this mutation change the carcinogenicity of the protein is still unknown. Of the two HPV16 E6 and E7 oncogenes, E6 has been found to show more variation than E7, which is relatively conserved.17 Due to the fact that several codons can code a same amino-acid, the amino-acid sequence is usually more conserved than the nucleotide sequence
Genetic studies had reported correlation between specific HPV16 variants and persistent viral infection, followed by the development of malignant lesions.29-31 Non-European variants were found to be associated with an excess risk of cervical cancer.32,33 Lichtig, et al32
experiment showed that protein E6 of HPV16 variants naturally had a different activity on the carcinogenic potential. The observations were carried out about the activity of p53 degradation, Bax degradation, inhibition of p53 transactivation, binding to E6BP, and hDIg. The L83V variant, previously associated with the risk of cancer development in some populations, had the same level of activity as prototype in some functional tests. On the other hand, L83V showed more efficient degradation of Bax and binding E6BP, but lower binding to hDlg.34
To determine the implications of oncoproteins, HPV research needs laboratory experiment both in vitro and in vivo. The use of this software analysis is only to predict mutations that may cause functional changes in protein so it can be as early screening for the selection of the sample to be tested in vitro and in vivo.
In conclusion, E6 genes and proteins of HPV16 variants have been found more varied than E7. SNAP method of analysis results showed that only
Medical Journal of Indonesia
204 Med J Indones, Vol. 24, No. 4December 2015
the E6 protein of African-2 branch had functional differences compared to HPV16R. This prediction has to be proved by laboratory experiments to determine the effects of the mutation as carcinogen.
AcknowledgmentThe authors would like to acknowledge Ulima Darmania Amanda, S.Si at the Department of Pathological Anatomy, Faculty of Medicine, Universitas Indonesia, Jakarta for maintaining material sample. Financial support for this study was provided by PHKI CRID-TROPHID FKUI 2012.
Conflict of interestThe authors affirm no conflict of interest in this study.
REFERENCES
1. Yamada T, Manos MM, Peto J, Greer CE, Munoz N, Bosch FX, et al. Human papillomavirus type 16 sequence variation in cervical cancers: a worldwide perspective. J Virol. 1997;71(3):2463–72.
2. Narisawa-Saito M, Kiyono T. Basic mechanisms of high-risk human papillomavirus-induced carcinogenesis: roles of E6 and E7 proteins. Cancer Sci. 2007;98(10):1505–11.
3. Smith B, Chen Z, Reimers L, van Doorslaer K, Schiffman M, Desalle R, et al. Sequence imputation of HPV16 genomes for genetic association studies. PLoS One. 2011;6(6):e21375.
4. de Villiers EM, Fauquet C, Broker TR, Bernard HU, zur Hausen H. Classification of papillomaviruses. Virology. 2004;324(1):17–27.
5. Bernard HU, Burk RD, Chen Z, van Doorslaer K, zur Hausen H, de Villiers EM. Classification of papillomaviruses (PVs) based on 189 PV types and proposal of taxonomic amendments. Virology. 2010;401(1):70–9.
6. Muñoz N, Bosch FX, de Sanjosé S, Herrero R, Castellsagué X, Shah KV, et al. Epidemiologic classification of human papillomavirus types associated with cervical cancer. N Engl J Med. 2003;348(6):518–27.
7. hpvcentre.net [internet]. Spain: ICO Information Centre on HPV and Cervical Cancer (HPV Information Centre), [update 2014 Dec 18]. Available from: http://www.hpvcentre.net/statistics/reports/XWX.pdf
8. Seedorf K, Krämmer G, Dürst M, Suhai S, Röwekamp WG. Human papillomavirus type 16 DNA sequence. Virology. 1985;145(1):181–5.
9. Hildesheim A, Wang SS. Host and viral genetics and risk of cervical cancer: a review. Virus Res. 2002;89(2):229–40.
10. Yamada T, Wheeler CM, Halpern AL, Stewart AC, Hildesheim A, Jenison SA. Human papillomavirus type 16 variant lineages in United States populations characterized by nucleotide sequence analysis
of the E6, L2, and L1 coding segments. J Virol. 1995;69(12):7743–53.
11. Chen Z, Schiffman M, Herrero R, Desalle R, Anastos K, Segondy M, et al. Evolution and taxonomic classification of human papillomavirus 16 (HPV16)-related variant genomes: HPV31, HPV33, HPV35, HPV52, HPV58 and HPV67. PloS One. 2011;6(5):e20183.
12. Burk RD, Chen Z, Harari A, Smith BC, Kocjan BJ, Maver PJ, et al. Classification and nomenclature system for human alphapapillomavirus variants: general features, nucleotide landmarks and assignment of HPV6 and HPV11 isolates to variant lineages. Acta Dermatovenerol Alp Pannonica Adriat. 2011;20(3):113–23.
13. Cornet I, Gheit T, Franceschi S, Vignat J, Burk RD, Sylla BS, et al. Human papillomavirus type 16 genetic variants: phylogeny and classification based on E6 and LCR. J Virol. 2012.86(12):6855–61.
14. de Boer MA, Peters LA, Aziz MF, Siregar B, Cornain S, Vrede MA, et al. Human papillomavirus type 16 E6, E7, and L1 variants in cervical cancer in Indonesia, Suriname, and The Netherlands. Gynecol Oncol. 2004;94(2):488–94.
15. Daf S, Jena L, Kumar S. Comparative phylogenetic analysis of E6 and E7 proteins of different 42 strains of HPV. JK Science. 2010;12(1):6–10.
16. Pientong C, Wongwarissara P, Ekalaksananan T, Swangphon P, Kleebkaow P, Kongyingyoes B, et al. Association of human papillomavirus type 16 long control region mutation and cervical cancer. Virol J. 2013;10(30):1–9.
17. Bromberg Y, Rost B. SNAP: predict effect of non-synonymous polymorphisms on function. Nucleic Acids Res. 2007;35(11):3823–35.
18. Katsonis P, Koire A, Wilson SJ, Hsu TK, Lua RC, Wilkins AD, et al. Single nucleotide variations: biological impact and theoretical interpretation. Protein Sci. 2014;23(12):1650–66.
19. Adeel MM, Qasim M, Ashfaq UA, Masoud MS, ur Rehman M, ul Qamar MT, et al. Modelling and simulation of mutant alleles of breast cancer metastasis suppressor 1 (BRMS1) gene. Bioinformation. 2014;10(7):454–9.
20. Lurchachaiwong W, Junyangdikul P, Payungporn S, Chansaenroj J, Sampathanukul P, Tresukosol D, et al. Entire genome characterization of human papillomavirus type 16 from infected Thai women with different cytological findings. Virus Genes. 2009;39(1):30–8.
21. Bioedit software. (internet).available from http://bioedit.software.informer.com
22. ClustalX software. (internet).available from http://www.clustal.org/download/1.X/ftp-igbmc.u-strasbg.fr/pub/ClustalX
23. NJPLOT software. (internet). available from http://en.freedownloadmanager.org/Windows-PC/NJPLOT-FREE.html
24. Zhang S, Wang T. Phylogenetic analysis of protein sequences based on conditional LZ complexity. MATCH Commun. Math. Comput. Chem. 2010;63:701–16.
25. Oppedoes F. Phylogenetic analysis using protein sequences In: Salemi M, Vandamme A-M, editors. The phylogenetic handbook: a practical approach to DNA and protein phylogeny. Cambridge: Cambridge University Press. 2003; p. 210–43.
http://mji.ui.ac.id
Wulandari, et al.HPV 16 strains isolated in Indonesia
205
26. Giannoudis A, Herrington CS. Human papillomavirus variants and squamous neolasia of the cervix. J Pathol. 2001;193(3):295–302.
27. Pande S, Jain N, Prusty BK, Bhambhani S, Gupta S, Sharma R, et al. Human papillomavirus type 16 variant analysis of E6, E7, and L1 genes and long control region in biopsy samples from cervical cancer patients in north India. J Clin Microbiol. 2008;46(3):1060–6.
28. Metcalfe S, Roger M, Faucher MC, Coutlée F, Franco EL, Brassard P. The frequency of HLA alleles in a population of Inuit women of northern Quebec. Int J Circumpolar Health. 2013;5(72):1–4.
29. Berumen J, Ordoñez RM, Lazcano E, Salmeron J, Galvan SC, Estrada RA, et al. Asian-American variants of human papillomavirus 16 and risk for cervical cancer: a case-control study. J Natl Cancer Inst. 2001;93(17):1325–30.
30. Hildesheim A, Schiffman M, Bromley C, Wacholder S, Herrero R, Rodriguez A, et al. Human papillomavirus
type 16 variants and risk of cervical cancer. J Natl Cancer Inst. 2001;93(4):315–8.
31. Xi LF, Koutsky LA, Hildesheim A, Galloway DA, Wheeler CM, Winer RL, et al. Risk for high-grade cervical intraepithelial neoplasia associated with variants of human papillomavirus types 16 and 18. Cancer Epidemiol Biomarkers Prev. 2007;16(1):4–10.
32. Sichero L, Ferreira S, Trottier H, Duarte-Franco E, Ferenczy A, Franco EL, et al. High grade cervical lesions are caused preferentially by non-European variants of HPVs16 and 18. Int J Cancer. 2007;120(8):1763–8.
33. Freitas LB, Chen Z, Muqui EF, Boldrini NA, Miranda AE, Spano LC, et al. Human papillomavirus 16 non-European variants are preferentially associated with high-grade cervical lesions. 2014. PLoS One. 2014;9(7):e100746.
34. Lichtig H, Algrisi M, Botzer LE, Abadi T, Verbitzky Y, Jackman A, et al. HPV16 E6 natural variants exhibit different activities in functional assays relevant to the carcinogenic potential of E6. Virology. 2006;350(1):216–27.
Medical Journal of Indonesia

206 Med J Indones, Vol. 24, No. 4December 2015
Clinical symptoms and related factors of obstructive sleep apnea among overweight and obese taxi drivers
Keywords: obstructive sleep apnea, occupational lung disease, taxi driver
pISSN: 0853-1773 • eISSN: 2252-8083 • http://dx.doi.org/10.13181/mji.v24i4.1279 • Med J Indones. 2015;24:206–14• Received 01 Sep 2015 • Accepted 15 Dec 2015
Correspondence author: Agus D. Susanto, [email protected]
Copyright @ 2015 Authors. This is an open access article distributed under the terms of the Creative Commons Attribution-NonCommercial 4.0 International License (http://creativecommons.org/licenses/by-nc/4.0/), which permits unrestricted non-commercial use, distribution, and reproduction in any medium, provided the original author and source are properly cited.
Agus D. Susanto,1,3 Barmawi Hisyam,1,2 Lientje S. Maurits,1 Faisal Yunus3
1 Doctoral programme, Faculty of Medicine, Gadjah Mada University, Yogyakarta, Indonesia2 Department of Internal Medicine, Faculty of Medicine, Gadjah Mada University, Sardjito Hospital, Yogyakarta, Indonesia3 Department of Pulmonology and Respiratory Medicine, Faculty of Medicine, Universitas Indonesia, Persahabatan Hospital,
Jakarta, Indonesia
Clinical Research
Medical Journal of Indonesia
ABSTRAK
Latar belakang: Obstructive sleep apnea (OSA) merupakan kondisi yang umum pada pengemudi kendaraan komersil dengan berat badan lebih dan obesitas, diketahui merupakan faktor risiko terpenting. Penelitian ini bertujuan untuk mengetahui gejala klinis serta faktor-faktor risiko OSA pada pengemudi taksi dengan berat badan lebih dan obesitas di Jakarta, Indonesia.
Metode: Penelitian potong-lintang ini dilakukan pada 103 pengemudi taksi di Jakarta sejak November 2011–September 2013, secara systematic random sampling di 10 pool taksi. Kriteria inklusi adalah pengemudi taksi dengan indeks massa tubuh (IMT) 23–29,9 dan terbukti OSA ringan atau sedang. Diagnosis OSA dengan pemeriksaan polisomnografi (PSG). Analisis bivariat menggunakan uji parametrik dan nonparametrik. Regresi logistik multivariabel untuk evaluasi faktor-faktor risiko.
Hasil: Sebanyak 54 (52,4%) dari 103 pengemudi terbukti OSA dan 49 (47,6%) bukan OSA. Gejala OSA yang signifikan (p<0,05) adalah mendengkur, bangun tidur tidak segar, tertidur saat mengendarai mobil dan sakit kepala atau mual saat bangun tidur. Faktor yang berhubungan dengan OSA adalah peningkatan IMT (OR=0,60, 95% CI=0,45–0,79, p=0,001), riwayat mendengkur dalam keluarga (OR = 4,92, 95% CI=1,82–13,31, p=0,002) dan lama tidur <7 jam dalam 24 jam (OR=5,14, 95% CI=1,37–19,23, p=0,015).
Kesimpulan: Gejala klinis OSA adalah mendengkur, bangun tidur tidak segar, tertidur saat mengendarai mobil dan sakit kepala atau mual saat bangun tidur. Faktor risiko OSA adalah peningkatan IMT, riwayat keluarga mendengkur, dan lama tidur <7 jam dalam 24 jam.
ABSTRACT
Background: Obstructive sleep apnea (OSA) is common condition in commercial drivers while overweight and obesity as the most important risk factors. This study aimed to know the clinical symptoms and risk factors of OSA in overweight and obese taxi drivers in Jakarta, Indonesia.
Methods: A cross-sectional study was done in 103 taxi drivers in Jakarta from November 2011–September 2013, by systematic random sampling from 10 taxi stations. Inclusion criteria were taxi drivers with body mass index (BMI) which 23–29.9 and mild or moderate OSA. Portable polysomnography (PSG) test was used to diagnose OSA. Parametric and nonparametric test were used in bivariate analysis. Logistic regression multivariable was used to final evaluate risk factors of OSA.
Results: There were 54 (52.4%) of 103 drivers with OSA and 49 (47.6%) without OSA. Clinical symptoms found significantly (p<0.05) were snoring, unrefreshing sleep, occasional sleep while driving, and headache or nausea on waking up in the morning. Risk factors for OSA were increased BMI (OR=0.60, 95% CI=0.45–0.79, p=0.001), snoring history in the family (OR=4.92, 95% CI=1.82–13.31, p=0.002) and sleep duration <7 hours within 24 hours (OR=5.14, 95% CI=1.37–19.23, p=0.015).
Conclusion: Clinical symptoms of OSA were snoring, unrefreshing sleep, occasional sleep while driving and headache or nausea on waking up in the morning. Risk factors of OSA were increased BMI, snoring history in the family and sleep duration <7 hours within 24 hours.
Susanto, et al.Clinical symptoms of OSA
207
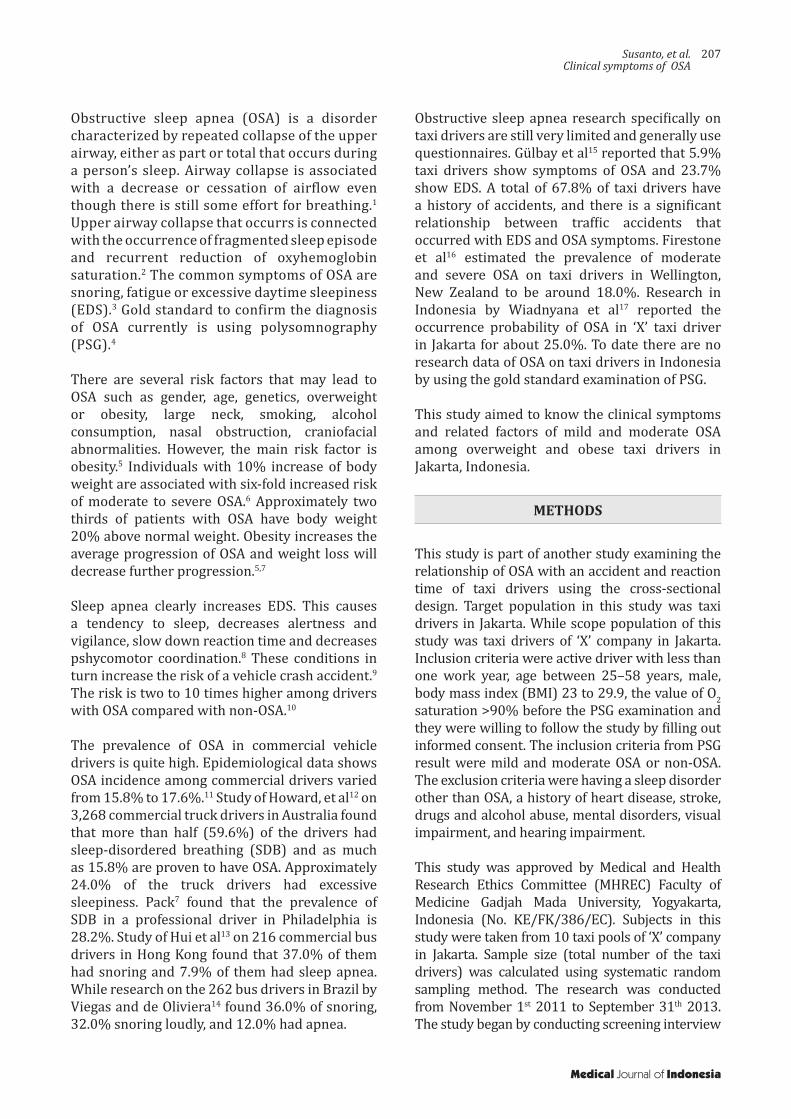
Obstructive sleep apnea (OSA) is a disorder characterized by repeated collapse of the upper airway, either as part or total that occurs during a person’s sleep. Airway collapse is associated with a decrease or cessation of airflow even though there is still some effort for breathing.1 Upper airway collapse that occurrs is connected with the occurrence of fragmented sleep episode and recurrent reduction of oxyhemoglobin saturation.2 The common symptoms of OSA are snoring, fatigue or excessive daytime sleepiness (EDS).3 Gold standard to confirm the diagnosis of OSA currently is using polysomnography (PSG).4
There are several risk factors that may lead to OSA such as gender, age, genetics, overweight or obesity, large neck, smoking, alcohol consumption, nasal obstruction, craniofacial abnormalities. However, the main risk factor is obesity.5 Individuals with 10% increase of body weight are associated with six-fold increased risk of moderate to severe OSA.6 Approximately two thirds of patients with OSA have body weight 20% above normal weight. Obesity increases the average progression of OSA and weight loss will decrease further progression.5,7
Sleep apnea clearly increases EDS. This causes a tendency to sleep, decreases alertness and vigilance, slow down reaction time and decreases pshycomotor coordination.8 These conditions in turn increase the risk of a vehicle crash accident.9 The risk is two to 10 times higher among drivers with OSA compared with non-OSA.10
The prevalence of OSA in commercial vehicle drivers is quite high. Epidemiological data shows OSA incidence among commercial drivers varied from 15.8% to 17.6%.11 Study of Howard, et al12 on 3,268 commercial truck drivers in Australia found that more than half (59.6%) of the drivers had sleep-disordered breathing (SDB) and as much as 15.8% are proven to have OSA. Approximately 24.0% of the truck drivers had excessive sleepiness. Pack7 found that the prevalence of SDB in a professional driver in Philadelphia is 28.2%. Study of Hui et al13 on 216 commercial bus drivers in Hong Kong found that 37.0% of them had snoring and 7.9% of them had sleep apnea. While research on the 262 bus drivers in Brazil by Viegas and de Oliviera14 found 36.0% of snoring, 32.0% snoring loudly, and 12.0% had apnea.
Obstructive sleep apnea research specifically on taxi drivers are still very limited and generally use questionnaires. Gülbay et al15 reported that 5.9% taxi drivers show symptoms of OSA and 23.7% show EDS. A total of 67.8% of taxi drivers have a history of accidents, and there is a significant relationship between traffic accidents that occurred with EDS and OSA symptoms. Firestone et al16 estimated the prevalence of moderate and severe OSA on taxi drivers in Wellington, New Zealand to be around 18.0%. Research in Indonesia by Wiadnyana et al17 reported the occurrence probability of OSA in ‘X’ taxi driver in Jakarta for about 25.0%. To date there are no research data of OSA on taxi drivers in Indonesia by using the gold standard examination of PSG.
This study aimed to know the clinical symptoms and related factors of mild and moderate OSA among overweight and obese taxi drivers in Jakarta, Indonesia.
METHODS
This study is part of another study examining the relationship of OSA with an accident and reaction time of taxi drivers using the cross-sectional design. Target population in this study was taxi drivers in Jakarta. While scope population of this study was taxi drivers of ‘X’ company in Jakarta. Inclusion criteria were active driver with less than one work year, age between 25–58 years, male, body mass index (BMI) 23 to 29.9, the value of O2 saturation >90% before the PSG examination and they were willing to follow the study by filling out informed consent. The inclusion criteria from PSG result were mild and moderate OSA or non-OSA. The exclusion criteria were having a sleep disorder other than OSA, a history of heart disease, stroke, drugs and alcohol abuse, mental disorders, visual impairment, and hearing impairment.
This study was approved by Medical and Health Research Ethics Committee (MHREC) Faculty of Medicine Gadjah Mada University, Yogyakarta, Indonesia (No. KE/FK/386/EC). Subjects in this study were taken from 10 taxi pools of ‘X’ company in Jakarta. Sample size (total number of the taxi drivers) was calculated using systematic random sampling method. The research was conducted from November 1st 2011 to September 31th 2013. The study began by conducting screening interview
Medical Journal of Indonesia

208 Med J Indones, Vol. 24, No. 4December 2015
using questionnaires. Data were obtained from the interview, questionnaires, physical examination, and PSG done at driver’s residence. The questionnaire, which had been used, was a questionnaire assessing the identity, work history, habits, health conditions and symptoms of OSA, the Berlin questionnaire18 and epworth sleepines scale (ESS)19 were used to assess the likelihood of OSA. PSG examination was conducted at driver’s residence (portable home monitoring) when the driver was off from his work hour. PSG is done by using device that consist of electroencephalogram (EEG), electrooculogram (EOG), electromyogram (EMG), nasal airflow, thoraco-abominal movement, and oximetry.
Criteria for OSA is stated if it fulfills the criteria of the American Academy of Sleep Medicine (AASM) 2005.20 The patient was diagnosed as OSA when apnea-hypopnea index (AHI) ≥15 or AHI ≥5 which is accompanied by one or more of the following symptoms: 1) unintentional sleep episodes during wakefullness, daytime sleepiness, unrefreshing sleep, fatigue, or insomnia; 2)
wakened from sleep by breath holding, gasping or choking, and 3) bed partner reported loud snore, breathing interruptions or both during the patient’s sleep. OSA severity is classified based on the frequency of AHI during sleep. The category called mild when the AHI five to <15 events/hour and moderate when AHI of 15 to 30 events/hour.
Data were analyzed using computer programme. Parametric and non-parametric test were used in bivariate analysis. Multivariate analysis using binary logistic regression test was used to do final evaluation of OSA related factors.
RESULTS
Polysomnography characteristicsA total of 103 taxi drivers who met the inclusion criteria participated in this study. Taxi drivers who proven to have OSA (mild and moderate) consist of 54 subjects (52.4%) and non-OSA were about 49 subjects (47.6%). Polysomnography examinations
VariablesOSA Non-OSA
p* 95% CIMean SD Mean SDApnea hypopnea index 15.66 6.26 4.92 3.46 0.001 8.78–12.70Total in bed 412.93 63.37 421.43 67.41 0.511 -34.07–17.06Sleep periode time 374.68 63.42 363.31 65.29 0.372 -13.79–36.55Total sleep time 338.45 66.41 332.26 64.98 0.634 -19.54–31.92Sleep onset 32.05 23.12 37.46 26.43 0.273 -15.15–4.32Rapid eye movement (REM) latency 74.65 93.21 89.53 94.26 0.423 -51.56–21.79Sleep eff 0.82 0.11 0.79 0.12 0.235 -0.02–0.07Arousal 16.50 5.85 18.38 7.57 0.159 -4.51–0.75Apnea 3.11 3.56 0.47 0.49 0.001 1.65–3.61Central apnea 0.47 0.47 0.14 0.24 0.001 0.18–0.47Obstructive apnea 2.45 3.14 0.29 0.37 0.001 1.29–3.01Hypopnea 12.56 4.77 4.53 3.20 0.001 6.45–9.61Oxygen saturation (SpO2) mean 0.95 0.01 0.96 0.01 0.171 -0.007–0.001SpO2 lowest 0.86 0.05 0.90 0.05 0.001 -0.06–-0.02Desat index 11.27 6.85 4.43 6.85 0.001 4.50–9.19Limb move 44.94 44.57 34.16 22.53 0.121 -2.89–24.44Total desat 64.70 45.98 25.33 29.94 0.001 24.27–54.47Heart rate 35.32 64.73 30.06 50.46 0.649 -17.59–28.11Snoring 245.61 339.46 88.86 133.86 0.003 57.05–256.46% Snoring 0.04 0.05 0.01 0.02 0.001 0.01–0.04
*unpaired T-test, OSA=Obstructive sleep apnea
Table 1. Characteristics of polysomnography (PSG) results
http://mji.ui.ac.id
Susanto, et al.Clinical symptoms of OSA
209
on 103 subjects show the results that are listed in table 1. There are significant differences in the mean AHI, apnea, obstructive apnea, hypopnea and snoring between subjects with OSA and non-OSA (p<0.05). There are significant differences in mean oxygen saturation, mean of the lowest oxygen saturation and total oxygen desaturation during apnea hypopnea period (p<0.05).
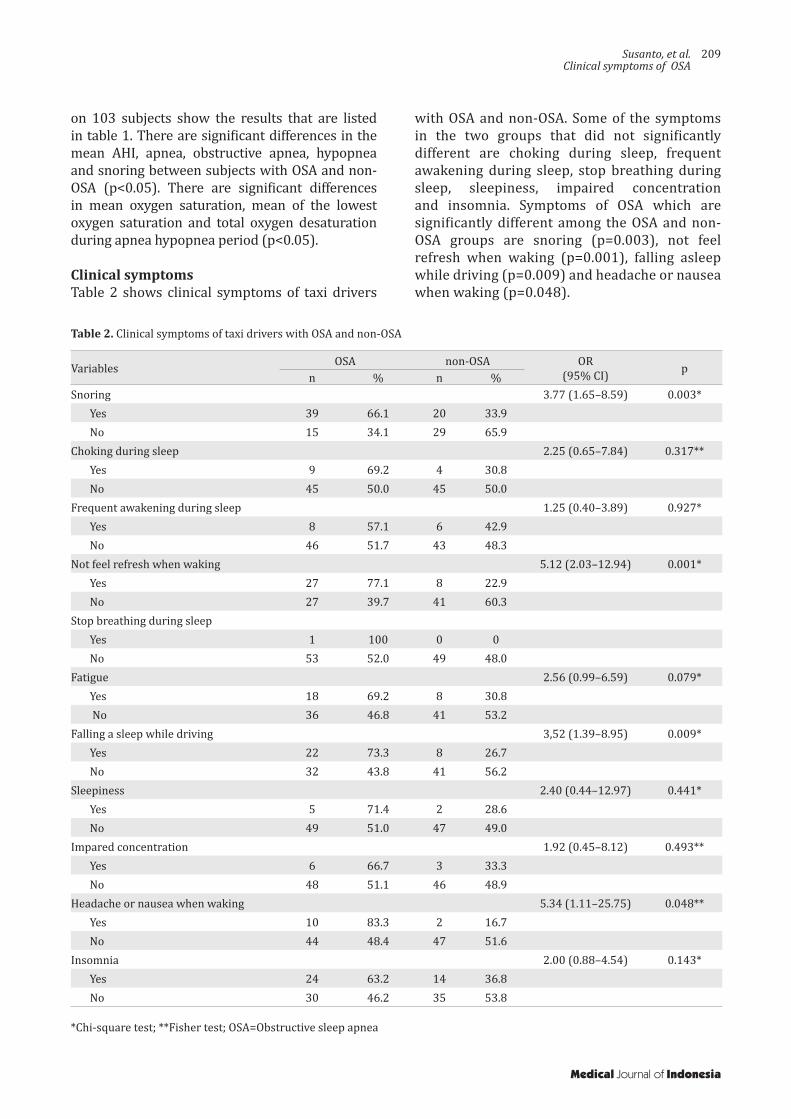
Clinical symptomsTable 2 shows clinical symptoms of taxi drivers
Variables OSA non-OSA OR(95% CI) p
n % n %Snoring 3.77 (1.65–8.59) 0.003*
Yes 39 66.1 20 33.9No 15 34.1 29 65.9
Choking during sleep 2.25 (0.65–7.84) 0.317**Yes 9 69.2 4 30.8No 45 50.0 45 50.0
Frequent awakening during sleep 1.25 (0.40–3.89) 0.927*Yes 8 57.1 6 42.9No 46 51.7 43 48.3
Not feel refresh when waking 5.12 (2.03–12.94) 0.001*Yes 27 77.1 8 22.9No 27 39.7 41 60.3
Stop breathing during sleepYes 1 100 0 0No 53 52.0 49 48.0
Fatigue 2.56 (0.99–6.59) 0.079*Yes 18 69.2 8 30.8 No 36 46.8 41 53.2
Falling a sleep while driving 3,52 (1.39–8.95) 0.009*Yes 22 73.3 8 26.7No 32 43.8 41 56.2
Sleepiness 2.40 (0.44–12.97) 0.441*Yes 5 71.4 2 28.6No 49 51.0 47 49.0
Impared concentration 1.92 (0.45–8.12) 0.493**Yes 6 66.7 3 33.3No 48 51.1 46 48.9
Headache or nausea when waking 5.34 (1.11–25.75) 0.048**Yes 10 83.3 2 16.7No 44 48.4 47 51.6
Insomnia 2.00 (0.88–4.54) 0.143*Yes 24 63.2 14 36.8No 30 46.2 35 53.8
Table 2. Clinical symptoms of taxi drivers with OSA and non-OSA
*Chi-square test; **Fisher test; OSA=Obstructive sleep apnea
with OSA and non-OSA. Some of the symptoms in the two groups that did not significantly different are choking during sleep, frequent awakening during sleep, stop breathing during sleep, sleepiness, impaired concentration and insomnia. Symptoms of OSA which are significantly different among the OSA and non-OSA groups are snoring (p=0.003), not feel refresh when waking (p=0.001), falling asleep while driving (p=0.009) and headache or nausea when waking (p=0.048).
Medical Journal of Indonesia
210 Med J Indones, Vol. 24, No. 4December 2015
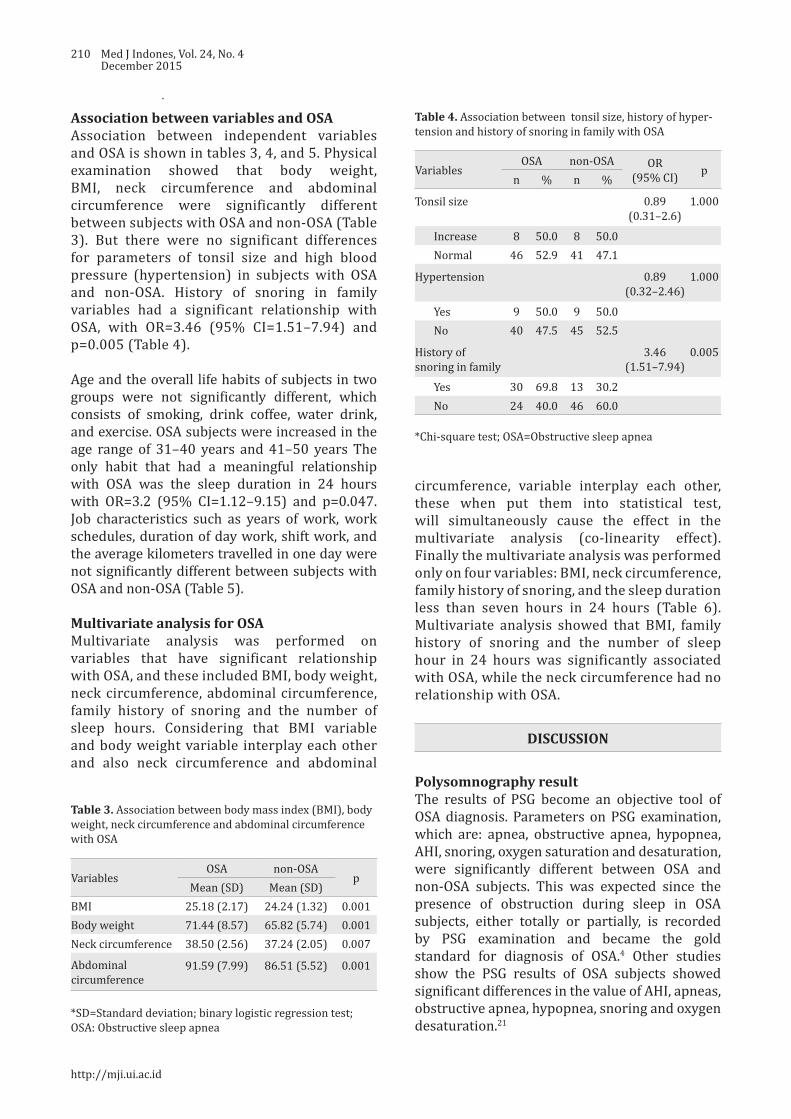
Association between variables and OSAAssociation between independent variables and OSA is shown in tables 3, 4, and 5. Physical examination showed that body weight, BMI, neck circumference and abdominal circumference were significantly different between subjects with OSA and non-OSA (Table 3). But there were no significant differences for parameters of tonsil size and high blood pressure (hypertension) in subjects with OSA and non-OSA. History of snoring in family variables had a significant relationship with OSA, with OR=3.46 (95% CI=1.51–7.94) and p=0.005 (Table 4).
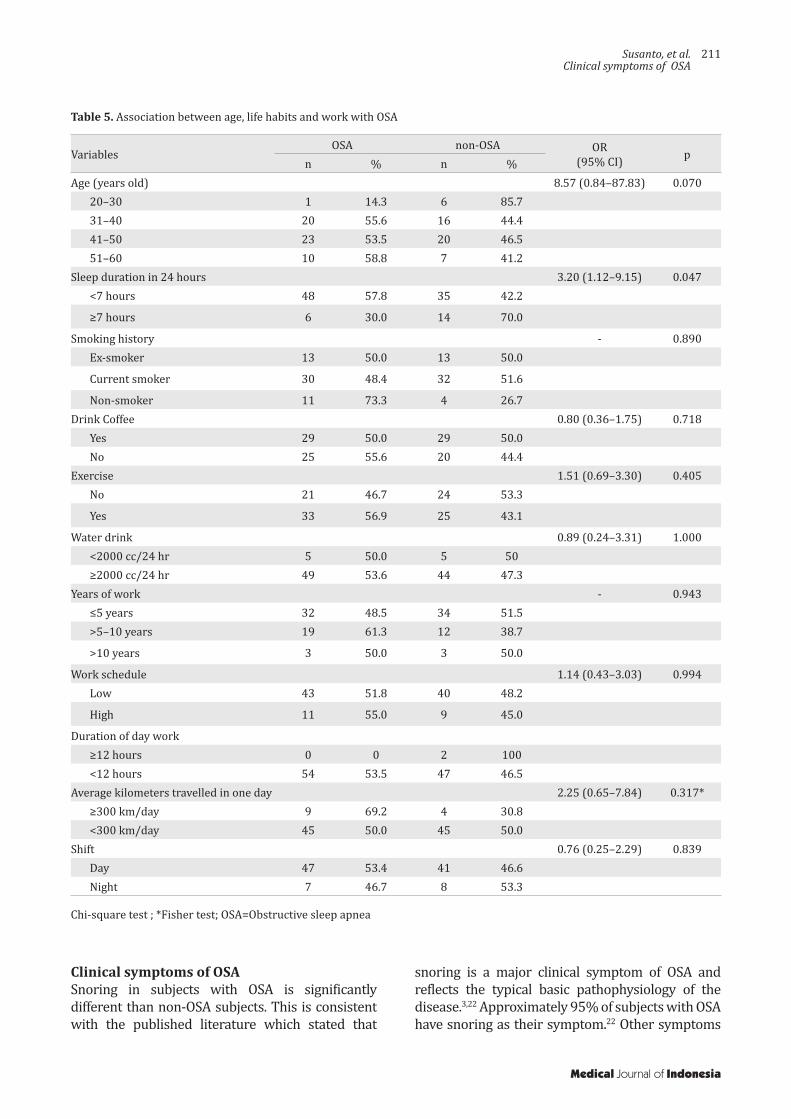
Age and the overall life habits of subjects in two groups were not significantly different, which consists of smoking, drink coffee, water drink, and exercise. OSA subjects were increased in the age range of 31–40 years and 41–50 years The only habit that had a meaningful relationship with OSA was the sleep duration in 24 hours with OR=3.2 (95% CI=1.12–9.15) and p=0.047. Job characteristics such as years of work, work schedules, duration of day work, shift work, and the average kilometers travelled in one day were not significantly different between subjects with OSA and non-OSA (Table 5).
Multivariate analysis for OSAMultivariate analysis was performed on variables that have significant relationship with OSA, and these included BMI, body weight, neck circumference, abdominal circumference, family history of snoring and the number of sleep hours. Considering that BMI variable and body weight variable interplay each other and also neck circumference and abdominal
VariablesOSA non-OSA
pMean (SD) Mean (SD)
BMI 25.18 (2.17) 24.24 (1.32) 0.001Body weight 71.44 (8.57) 65.82 (5.74) 0.001Neck circumference 38.50 (2.56) 37.24 (2.05) 0.007
Abdominal circumference
91.59 (7.99) 86.51 (5.52) 0.001
Table 3. Association between body mass index (BMI), body weight, neck circumference and abdominal circumference with OSA
*SD=Standard deviation; binary logistic regression test; OSA: Obstructive sleep apnea
VariablesOSA non-OSA OR
(95% CI) pn % n %
Tonsil size 0.89 (0.31–2.6)
1.000
Increase 8 50.0 8 50.0Normal 46 52.9 41 47.1
Hypertension 0.89(0.32–2.46)
1.000
Yes 9 50.0 9 50.0No 40 47.5 45 52.5
History of snoring in family
3.46(1.51–7.94)
0.005
Yes 30 69.8 13 30.2No 24 40.0 46 60.0
Table 4. Association between tonsil size, history of hyper-tension and history of snoring in family with OSA
*Chi-square test; OSA=Obstructive sleep apnea
circumference, variable interplay each other, these when put them into statistical test, will simultaneously cause the effect in the multivariate analysis (co-linearity effect). Finally the multivariate analysis was performed only on four variables: BMI, neck circumference, family history of snoring, and the sleep duration less than seven hours in 24 hours (Table 6). Multivariate analysis showed that BMI, family history of snoring and the number of sleep hour in 24 hours was significantly associated with OSA, while the neck circumference had no relationship with OSA.
DISCUSSION
Polysomnography resultThe results of PSG become an objective tool of OSA diagnosis. Parameters on PSG examination, which are: apnea, obstructive apnea, hypopnea, AHI, snoring, oxygen saturation and desaturation, were significantly different between OSA and non-OSA subjects. This was expected since the presence of obstruction during sleep in OSA subjects, either totally or partially, is recorded by PSG examination and became the gold standard for diagnosis of OSA.4 Other studies show the PSG results of OSA subjects showed significant differences in the value of AHI, apneas, obstructive apnea, hypopnea, snoring and oxygen desaturation.21
http://mji.ui.ac.id
Susanto, et al.Clinical symptoms of OSA
211
VariablesOSA non-OSA OR
(95% CI) pn % n %
Age (years old) 8.57 (0.84–87.83) 0.07020–30 1 14.3 6 85.731–40 20 55.6 16 44.441–50 23 53.5 20 46.551–60 10 58.8 7 41.2
Sleep duration in 24 hours 3.20 (1.12–9.15) 0.047<7 hours 48 57.8 35 42.2
≥7 hours 6 30.0 14 70.0
Smoking history - 0.890Ex-smoker 13 50.0 13 50.0
Current smoker 30 48.4 32 51.6
Non-smoker 11 73.3 4 26.7Drink Coffee 0.80 (0.36–1.75) 0.718
Yes 29 50.0 29 50.0No 25 55.6 20 44.4
Exercise 1.51 (0.69–3.30) 0.405No 21 46.7 24 53.3
Yes 33 56.9 25 43.1
Water drink 0.89 (0.24–3.31) 1.000<2000 cc/24 hr 5 50.0 5 50≥2000 cc/24 hr 49 53.6 44 47.3
Years of work - 0.943≤5 years 32 48.5 34 51.5>5–10 years 19 61.3 12 38.7
>10 years 3 50.0 3 50.0
Work schedule 1.14 (0.43–3.03) 0.994Low 43 51.8 40 48.2
High 11 55.0 9 45.0
Duration of day work≥12 hours 0 0 2 100<12 hours 54 53.5 47 46.5
Average kilometers travelled in one day 2.25 (0.65–7.84) 0.317*≥300 km/day 9 69.2 4 30.8<300 km/day 45 50.0 45 50.0
Shift 0.76 (0.25–2.29) 0.839Day 47 53.4 41 46.6Night 7 46.7 8 53.3
Table 5. Association between age, life habits and work with OSA
Chi-square test ; *Fisher test; OSA=Obstructive sleep apnea
Clinical symptoms of OSASnoring in subjects with OSA is significantly different than non-OSA subjects. This is consistent with the published literature which stated that
snoring is a major clinical symptom of OSA and reflects the typical basic pathophysiology of the disease.3,22 Approximately 95% of subjects with OSA have snoring as their symptom.22 Other symptoms
Medical Journal of Indonesia

212 Med J Indones, Vol. 24, No. 4December 2015
Variables Adjusted OR95% CI
pLower Upper
BMI 0.60 0.45 0.79 0.001Neck circumference 0.50 0.80 1.35 0.815Family history of snoring 4.92 1.82 13.31 0.002Sleep duration less than 7 hours in 24 hours 5.14 1.37 19.23 0.015
Table 6. Multivariate analysis of BMI, neck circumference, family history of snoring, and sleep duration less than seven hours in 24 hours with OSA
Binary logistic regression test
that were significantly associated in this study were headache or nausea when waking up. McNicholas22 reported that other symptoms that can occur in OSA patients include fatigue, morning sickness and headaches. Subjects with OSA did not feel refresh when waking up and fall asleep easily while driving. These complaints are suitable with one of the clinical symptoms in the criteria of the AASM 2005, which are unintentional sleep episodes during alertness and not refreshed after sleep.20
Sleep apnea is one of the symptoms commonly reported from patient partner.22 In this study, sleep apnea is not a significant symptom, probably because the interview in this study was conducted directly to the subjects who do not know whether this condition is happening to them or not. In addition, most of the subjects lived in a rented house or in the company’s inn alone, so that no one recognized whether apnea events occurred or not.
Drowsiness during the day (daytime sleepiness) is also a major symptom of OSA.3 In this study, daytime sleepiness which was assessed by ESS was not significantly different between OSA subjects (five people) and non-OSA (three people). Only 8.1% of subjects who have that complaint. The difference may be caused by posibility that subject is not entirely familiar with the questions from ESS. In addition, drowsiness may be obscured by the fatigue felt by the subject since his profession is taxi driving. McNicholas22 stated that drowsiness should be distinguished from other symptoms, such as feeling tired which is often underestimated by patients.
Factors associated with OSA The age range among OSA and non-OSA was not significantly different. OSA subjects were increased in the age range of 31–40 years and
41–50 years. This is consistent with the study from Wiadnyana, et al17 which concluded that patients who were >36 years old had two-fold risk of OSA compared to patients who were <36 years of age. OSA incidence increased progressively by increase of age.23 Young et al24 mentioned that the incidence of OSA increased especially in middle age. The mechanisms proposed for the age-related OSA are an increase deposition of fat in the parapharyngeal area, lenghthening of the soft palate and changes in body structures surrounding the pharynx.23
Physical examination showed that body weight, BMI, neck circumference, and abdominal circumference were significantly different between subjects with OSA and non-OSA. Study from Wiadnyana et al17 concluded that BMI >25 and neck circumference >40 cm had a significant relationship with suspected of OSA. The same results were reported by the sleep heart health study which stated that OSA was significantly associated with BMI, neck circumference and abdominal circumference.23 Weight gain by 10% was known to be associated with a six-fold increased risk of OSA.6 Weight gain can affect airway during sleep through some mechanisms. The mechanisms are: 1) an increase in fat deposition on peripharynx cause upper airway constriction, 2) affects the neural compensatory mechanisms for maintaining the patency of airway, 3) instability of respiratory control system, and 4) reduction in the functional residual capacity due to the resultant decrease in the stability of the upper airway caudal traction.23
Tonsil size was not significantly different between OSA and non-OSA subjects. Enlargement of tonsils as a risk factor for OSA in adults is debatable. As per one of the research, tonsil enlargement is one of risk factors of OSA.7 Lee et al25 in reported that enlargement of tonsils stage III or IV is an
http://mji.ui.ac.id
Susanto, et al.Clinical symptoms of OSA
213
independent factor of the OSA. There are few studies that assess enlargement of tonsils as a risk factor for OSA in adults.24 Some studies stated that tonsil and adenoid hypertrophy are major risk factors for OSA in children.5,26
Hypertension status in subjects with OSA and non-OSA had no significant difference. This result was consistent with the study of Wiadnyana et al17 that concluded the absence of correlation between hypertension and suspected OSA. But, this result was in contrast with some of the previous studies which stated that hypertension was associated with OSA. There is a consistent association between OSA and hypertension in various studies.22,27,28 Incidence of hypertension increases in subjects suspected with OSA.22 Several studies reported that OSA was a cause of hypertension or uncontrolled hypertension.27,28 But only few studies have reported that hypertension is a risk factor of OSA.
Our study indicate that snoring history in family has a significant relationship with OSA. These results are consistent with existing research data. Previous data suggest that research inquiries about family history can certainly aid in identifying those that have OSA. Familial susceptibility to OSA directly increases with the number of affected relatives.23 Young et al29 reported that snoring history or OSA in family increases the risk of OSA. Wiadnyana et al17 reported that snoring history in family was significantly associated with suspected OSA.
Smoking is estimated as one of the risk factors associated with OSA. Epidemiological studies have shown that smoking is associated with an increased prevalence of snoring and OSA. Airway inflammation and damage due to cigarette smoke can affect the mechanical support function and neural upper airway, also increase posibility of airway collapse during sleep.23 Even so, Young et al24 said that only a few studies have reported association between smoking and OSA. Although there is a biological plausibility for a causal role of smoking, it is not yet firmly established as a risk factor. Results of this study showed no association between smoking and OSA. Smoking habits were not significantly different between OSA and non-OSA subjects. The same result was reported by Wiadnyana et al17 that showed no difference in smoking habits of taxi driver between those with and without suspected OSA. Differences in study
results are likely because taxi drivers usually smoke. Chuang et al30 reported that 57.9% taxi drivers in Taiwan had smoking habits. Smoking habits are also common in Jakarta, Indonesia. It was estimated that approximately one-third of Jakarta population are smokers.31
Habits for drinking coffee, water in 24 hours and exercise habits did not differ between OSA and non-OSA subjects. Similar results were reported by Wiadnyana et al17 which stated that daily habits of taxi drivers are not associated with likelihood of OSA. Other habit that has a significant association with OSA is sleep duration less than seven hours in 24 hours. These results are in accordance with some recent studies regarding the association between sleep duration, obesity and OSA. Chin et al32 in his study at Japan said that number of sleep hours should be considered as an important factor in investigating the prevalence of severe OSA and metabolic syndrome.32 Risso et al33 reported that sleep duration may be associated to the low mean oxygen saturation in OSA Patients. Kim et al34 even proved that there is a significant relationship between sleep duration, OSA and visceral obesity in adult patients.
Job characteristics such as work period, work schedules, duration of day work, shift work and the average distance travelled in one day were not significantly different between subjects with OSA and non-OSA. Similar results were reported by Wiadnyana et al17 who reported that a taxi driver’s job characteristics were not related to the suspected OSA. He reported that only work schedules variable is associated with suspected OSA.
In conclusion, significant symptoms of taxi drivers with mild and moderate OSA are snoring, unrefreshing sleep, headache or nausea while waking up in the morning and occasional sleep while a driving. Factors associated with OSA in taxi drivers with overweight and obesity are the increase of BMI, snoring history in family and sleep duration less than seven hours in 24 hours. Limitation of this study were small sample size, further studies are needed with larger sample size to validate these results.
Acknowledgment:We thank and acknowledge Aria Kekalih, MD, PhD and Mrs. Dhanti for their helps in statistical analysis of this study.
Medical Journal of Indonesia
214 Med J Indones, Vol. 24, No. 4December 2015
Conflict of interest: The authors confirm there is no conflict of interest in this study.
REFERENCES
1. De Backer W. Obstructive sleep apnea/hypopnea syndrome. Definitions and pathopysiology. In: Randerath WJ, Sanner BM, Somers VK, editors. Sleep apnea. Current diagnosis and treatment. Prog Respir Res; 2006. p. 90–6.
2. White DP. Sleep apnea. Proc Am Thorac Soc. 2006;3:124–8.3. Patil SP, Schneider H, Schwartz AR, Smith PL. Adult
obstructive sleep apnea: pathophysiology and diagnosis. Chest. 2007;132(1):325–7.
4. American Academy of Sleep Medicine. Sleep-related breathing disorders in adults: recommendations for syndrome definition and measurement techniques in clinical research. Sleep. 1999;22(5):667–89.
5. Young T, Skatrud J, Peppard PE. Risk factors for obstructive sleep apnea in adults. JAMA. 2004;291(16):2013–6.
6. Smith IE. Alternatif therapies for obstructive sleep apnea syndrome: behavioral and pharmacological options. In: Randerath WJ, Sanner BM, Somers VK, editors. Sleep apnea. Current diagnosis and treatment. Prog Respir Res; 2006. p. 174–9.
7. Pack AI. Advances in sleep-disordered breathing. Am J Respir Crit Care Med. 2006;173(1):7–15.
8. Scott AJ. Sleepiness and fatigue risk for the transportation industry. Occupational and Environmental Med. 2003;3:81–108.
9. George CF. Sleep apnea, alertness, and motor vehicle crash. Am J Respir Crit Care. 2007;176(10):954–6.
10. Hartenbaum N, Collop N, Rosen IM, Philips B, George CF, Rowley JA, et al. Sleep apnea and commercial motor vehicle operators: statement from the joint task force of the American College of Chest Physicians, American College of Occupational and Environmental Medicine, and the National Sleep Foundation. Chest. 2006;130(3):902–5.
11. George CF. Sleepiness, sleep apnea, and driving: still miles to go before we safely sleep. Am J Respir Crit Care Med. 2004;170(9):927–8.
12. Howard ME, Desai AV, Grunstein RR, Hukins C, Armstrong JG, Joffe D, et al. Sleepiness, sleep-disordered breathing, and accident risk factors in commercial vehicle drivers. Am J Respir Crit Care Med. 2004;170(9):1014–21.
13. Hui DS, Chan JK, Ko FW, Choy DK, Li TS, Chan AT, et al. Prevalence of snoring and sleep-disordered breathing in a group of commercial bus drivers in Hong Kong. Intern Med J. 2002;32(4):149–57.
14. Viegas CA, de Oliviera HW. Prevalence of risk factors for obstructive sleep apnea syndrome in interstate bus drivers. J Bras Pneumol. 2006;32(2):144–9.
15. Gülbay BE, Acican T, Doğan R, Baççioğlu A, Güllü E, Karadağ G. The evaluation of excessive daytime sleepiness in taxi drivers. Tuberk Toraks. 2003;51(4):385–9. Turkish.
16. Firestone RT, Mihaere K, Gander PH. Obstructive sleep apnea among professional taxi drivers: a pilot study. Accid Anal Prev. 2009;41(3):552–6.
17. Wiadnyana IPGP, Susanto AD, Amri Z, Antariksa B. The Prevalence of suspected obstructive sleep apnea and related factors on “X” taxi drivers in Jakarta. J Respir Indo. 2010;30:32–8. Indonesian.
18. Chung F, Yegneswaran B, Liao P, Chung SA, Vairavanathan S, Islam S, et al. Validation of the Berlin questionnaire and American Society of Anesthesiologist checklist as screening tools for obstructive sleep apnea in surgical patients. Anesthesiology. 2008;108(5):822–30.
19. Johns MW. A new method for measuring daytime sleepiness: the Epworth sleepiness scale. Sleep. 1991;14(6):540–5.
20. Shiomi T, Sasanabe R. Advances in diagnosis and treatment of sleep apnea syndrome in Japan. JMAJ. 2009;52(4):224–30.
21. Widysanto A, Yunus F, Yusuf I, Sutrisna B, Suradi. Oxygen desaturation index as a risk factor for coronary artery disease in male subject with obstructive sleep apnea. J Respir Indo. 2012;3:161–6. Indonesian.
22. McNicholas WT. Diagnosis of obstructive sleep apnea in adults. Proc Am Thorax Soc. 2008;5(2):154–60.
23. Punjabi NM. The epidemiology of adult obstructive sleep apnea. Proc Am Thorac Soc. 2008:5(2);136–43.
24. Young T, Peppard PE, Gottlieb DJ. Epidemiology of obstructive sleep apnea: a population health perspective. Am J Respir Crit Care Med. 2002;165(9):1217–39.
25. Lee YC, Eun YG, Shin SY, Kim SW. Prevalence of snoring and high risk of obstructive sleep apnea syndrome in young male soldiers in Korea. J Korean Med Sci. 2013;28(9):1373–7.
26. Chang SJ, Chae KY. Obstructive sleep apnea syndrome in children: epidemiology, pathophysiology, diagnosis and sequelae. Korean J Pediatr. 2010;53(10):863–71.
27. Wolk R, Shamsuzzaman ASM, Somers VK. Obesity, sleep apnea, and hypertension. Hypertension. 2013;42(6):1067–74.
28. Khan A, Patel NK, O’Hearn DJ, Khan S. Resistant hypertension and obstructive sleep apnea. Int J Hypertension. 2013:2013:1–6.
29. Young T, Palta M, Dempsey J, Skatrud J, Weber S, Badr S. The occurrence of sleep-disordered breathing among middle-aged adults. N Engl J Med. 1993;328(17):1230–5.
30. Chuang CY, Lee CC, Chang YK, Sung FC. Oxidative DNA damage estimated by urinary 8-hydroxydeoxyguanosine: influence of taxi driving, smoking and areca chewing. Chemosphere. 2003:52(7):1163–71.
31. Authority of Health Research and Developed, Ministry of Health Republic of Indonesia. Basic Health Research (RISKESDAS) 2010. Ministry of Health Republic of Indonesia. 2010. p. 400–16. Indonesian.
32. Chin K, Oga T, Takahashi K, Takegami M, Nakayama-Ashida Y, Wakamura T, etal. Associations between obstructive sleep apnea, metabolic syndrome, and sleep duration, as measured with an actigraph, in an urban male working population in Japan. Sleep. 2010;33(1):89–95.
33. Risso TT, Poyares D, Rizzi CF, Pulz C, Guilleminault C, Tufik S, et al. The impact of sleep duration in obstructive sleep apnea patients. Sleep Breath. 2013;17(2):837–43.
34. Kim NH, Lee SK, Eun CR, Seo JA, Kim SG, Choi KM, et al. Short sleep duration combined with obstructive sleep apnea is associated with visceral obesity in Korean adults. Sleep. 2013;36(5):723–9.
http://mji.ui.ac.id
Andriastuti, et al.Steroid in childhood ALL
215
Steroid response as prognostic factor and its correlation with molecular assessment of childhood acute lymphoblastic leukemia
Keywords: acute lymphoblastic leukemia, molecular assessment, prognostic factor, steroid
pISSN: 0853-1773 • eISSN: 2252-8083 • http://dx.doi.org/10.13181/mji.v24i4.1177 • Med J Indones. 2015;24:215–20• Received 30 Dec 2014 • Accepted 24 Dec 2015
Correspondence author: Murti Andriastuti, [email protected]
Copyright @ 2015 Authors. This is an open access article distributed under the terms of the Creative Commons Attribution-NonCommercial 4.0 International License (http://creativecommons.org/licenses/by-nc/4.0/), which permits unrestricted non-commercial use, distribution, and reproduction in any medium, provided the original author and source are properly cited.
Murti Andriastuti,1 Djajadiman Gatot,1 Riadi Wirawan,2 Rianto Setiabudy,3 Muchtaruddin Mansyur,4 I Dewa G. Ugrasena5
1 Department of Child Health, Faculty of Medicine, Universitas Indonesia, Cipto Mangunkusumo Hospital, Jakarta, Indonesia2 Department of Clinical Pathology, Faculty of Medicine, Universitas Indonesia, Cipto Mangunkusumo Hospital, Jakarta, Indonesia 3 Department of Pharmacology, Faculty of Medicine, Universitas Indonesia, Jakarta, Indonesia4 Department of Community Medicine, Universitas Indonesia, Jakarta, Indonesia5 Department of Child Health, Faculty of Medicine, University of Airlangga, Dr. Sutomo Hospital, Surabaya, Indonesia
Clinical Research
Medical Journal of Indonesia
ABSTRAK
Latar belakang: Angka kesintasan leukemia limfoblastik akut (LLA) anak di Indonesia masih rendah. Ketepatan stratifikasi risiko merupakan hal penting dalam meningkatkan kesintasan. Di negara maju, stratifikasi risiko dibuat berdasarkan pemeriksaan fusi gen yang terkait dengan resistensi steroid. Respons steroid hari ke-8 berhubungan dengan prognosis. Pemeriksaan ini dapat diaplikasikan di pusat rujukan yang belum dapat melakukan pemeriksaan molekular secara rutin. Penelitian ini bertujuan untuk menilai apakah respons steroid berhubungan dengan pemeriksaan molekular.
Metode: Studi potong-lintang dilakukan di Departemen Ilmu Kesehatan Anak, FKUI-RSCM (Januari 2013–Maret 2014 dengan 73 subjek penelitian). Steroid diberikan selama 7 hari. Sel blas darah tepi diperiksa pada hari ke-8, respons dikatakan baik bila blas <1000 /µL dan buruk jika ≥1000 /µL. Pemeriksaan fusi gen dilakukan sebagai standar baku. Data dianalisis menggunakan SPSS versi 20.0.
Hasil: Fusi gen ditemukan pada 45 subjek. Sebanyak 26/32 (81%) subjek berusia 1–10 tahun menunjukkan respons baik, sementara 75% subjek <1 tahun dan 7/9 (78%) subjek ≥10 tahun menunjukkan respons buruk. Sebanyak 5/7 (71%) subjek dengan leukosit >100.000 /µL dan 7/8 (88%) dengan sel-T memiliki respons buruk. Usia, jumlah leukosit, dan sel-T berhubungan dengan respons steroid (p<0,05). Fusi gen E2A-PBX1 adalah yang tersering 19/45 (42%), diikuti TEL-AML1 17/45 (38%), BCR-ABL, 5/45 (17%), dan MLL-AF4 1/45 (3%). Sebanyak 4 dari 5 (80%) subjek dengan BCR-ABL dan 1 subyek dengan MLL-AF4 menunjukkan respons buruk. Sebaliknya, 12/19 (63%) subjek dengan E2A-PBX1 dan 13/17 (77%) dengan TEL-AML1 memiliki respons baik. Tidak terdapat hubungan antara respons steroid dengan pemeriksaan molekular.
Kesimpulan: Respons steroid berhubungan bermakna dengan usia, jumlah leukosit, dan jenis sel-T namun tidak dengan pemeriksaan molekular.
ABSTRACT
Background: Survival rate of children with acute lymphoblastic leukemia (ALL) in Indonesia remains low. Risk stratification accuracy is important to improve survival. In developed countries, risk stratification is determined based on gene fusion that is known related to steroid resistency. Steroid response at day-8 correlates with prognosis. The assessment can be applied in centers that cannot perform molecular assessment. This study aims to evaluate whether steroid response correlated to molecular assessment.
Methods: A cross-sectional study was performed at Child Health Department, Cipto Mangunkusumo Hospital (January 2013-March 2014), a total of 73 patients were enrolled. Steroid was given for 7 days. Peripheral blast count at day 8 was evaluated, good response if blast count <1000 /µL and poor if ≥1000 /µL. Fusion gene detection was also performed. The data was analysed using Statistical Package for Social Sciences (SPSS) version 20.0.
Results: Fusion gene was detected in 45 patients. In 1–10 years age group, 26/32 (81%) subjects had good response, while 75% in <1 year age group and 7/9 (78%) in ≥10 years age group had poor response. 5/7 (71%) subjetcs had leukocyte count >100,000 /µL and 7/8 (88%) with T-cell showed poor response. Age, leukocyte count, and T-cell were statistically correlated with steroid response (p<0.05). E2A-PBX1 fusion gene was the most common 19/45 (42%), followed by TEL-AML1 17/45 (38%), BCR-ABL 5/45 (17%), and MLL-AF4 1/45 (3%). Four of five subjects (80%) with BCR-ABL and one subject with MLL-AF4 had poor steroid response. On the other hand, 12/19 (63%) with E2A-PBX1 and 13/17 (77%) with TEL-AML1 had good response. There was no correlation between steroid response and molecular assessment.
Conclusion: Steroid response correlates with age, leukocyte count, and T-cell but not with molecular assessment.
216 Med J Indones, Vol. 24, No. 4December 2015
Acute lymphoblastic leukemia (ALL) is the most common type of childhood leukemia which accounts for 75–80% of all cases.1 From 2007 to 2012, there were 1,957 cases from 15 referral hospitals in Indonesia.2 In Cipto Mangunkusumo Hospital (CMH), Jakarta, there were 579 cases during 2007–2013 with approximately 80 new cases each year.3,4
The event free survival (EFS) rates in developed countries is 80–90% but it is very different in developing countries.5 Gatot and Windiastuti3
reported EFS rates of 53% from ALL patients in CMH from 1998–2004, 53% while Mulatsih et al6 reported that in Dr. Sardjito Hospital, Yogyakarta, Indonesia, the EFS rates were 53%. A high relapse rate in ALL is also another major problem. Windiastuti7 found that relapse rates in CMH was 29%, almost three times higher compared to developed countries. These differences can be attributed to numerous factors, such as early detection, referral system, diagnostic tools, treatment choice, remission monitoring, nutritional status, evaluation of side effect from chemotherapy, and supportive facilities which in turn influences the treatment outcome.5
Risk stratification in developing countries is based on the National Cancer Institute (NCI) criteria; age 1–0 years old and leukocyte count <50,000 /µL.8 Pediatric Hematology Oncology Division, Child Health Department, Faculty of Medicine Universitas Indonesia (FMUI-CMH) is using the following criteria; age, leukocyte count, mediatinal mass, and central nervous system (CNS) infiltration. This criteria stratifies ALL patients into high risk or standard risk.7
Meanwhile, developed countries are already using molecular risk stratification for ALL patients.5
Molecular assessment shows that certain fusion gene plays a role in leukemic cell proliferation and differentiation, affect the clinical characteristics and now becomes one of important prognostic factors. Some important fusion genes of leukemia are TEL-AML1, BCR-ABL, MLL-AF4, E2A-PBX1 in B-cell ALL.9 Patient with TEL-AML1 has an excellent prognosis with EFS rates of approximately 90%, regardless age and leukocyte count.10 Infant <1 year old was originally categorized as high risk based on NCI criteria, but studies have found that if there is no MLL-AF4 gene changes, the prognosis is similar
to those aged >1 year.11 Fusion gene BCR-ABL and MLL-AF4 are related to cytostatic drug resistence including steroid.12 E2A-PBX1 needs intensive chemotherapy to reach good EFS. This indicates the importance of genetic factors in determining prognosis. Based on fusion gene, molecular stratification can be divided into three categories; high risk (BCR-ABL and MLL-AF4), intermediate risk (E2A-PBX1) and standard risk (TEL-AML1).
Reduction or clearance of peripheral blast after one week steroid administration is known as a significant prognostic factor to predict treatment outcome.13 Good response is defined as a blast count of <1,000 /µL and has 2–3 times better prognosis compared to poor response, defined as a blast count of ≥1,000 /µL.14 This assessment is easy, inexpensive, and can be used in centres in Indonesia. Moreover, it is significant in predicting prognosis and has yet to be routinely performed in Indonesia. The aim of this study was to evaluate if steroid response at day-eight has a significant correlation with molecular assessment as the gold standard.
METHODS
A comparative cross sectional study was performed at CMH from January 2013 to March 2014. A total of 73 patients were enrolled. Inclusion criteria were newly diagnosed ALL children (age 0-18 year old). Patients were excluded from this study if they had ALL L3 subtype and Down syndrome. Bone marrow aspiration was performed for molecular assessment. Patients were given steroid and the response was evaluated at day eight. The protocol for the present study was approved by the Ethics Committee of Faculty of Medicine Universitas Indonesia/Cipto Mangunkusumo Hospital (No. 594/H2.F1/ETIK/2013).
Clinical laboratory parametersHematology parameters, peripheral blast count, and immunophenotyping were examined in Clinical Pathology Department CMH, and Dharmais Cancer Hospital.
Molecular assessmentMolecular assessment was performed using nested-polymerase chain reaction (nested-PCR) method in Integrated Laboratory, Faculty of Medicine Universitas Indonesia (FMUI). The
http://mji.ui.ac.id

Andriastuti, et al.Steroid in childhood ALL
217
fusion genes examined were TEL-AML, BCR-ABL, E2A-PBX1, and MLL-AF4. Cell line for each
Characteristics Poor response (n=16) Good response (n=29) Total (n=45) pDemographic Age (mean 3.5 years) <0.001#
<1 year 3 1 41–< 10 years 6 26 32≥10 years 7 2 9
Gender 0.84*Male 10 19 29Female 6 10 16
ClinicalPallor 14 24 38 1.00#
Fever 12 19 31 0.74#
Bone pain 13 17 30 0.12*Bleeding 7 14 21 0.77*Limphadenopathy 7 14 21 0.77*Hepatomegaly 10 21 31 0.52#
Splenomegaly 7 14 21 0.77*Mediastinal mass 3 1 4 0.12#
LaboratoryHemoglobin (mean 8.4 g/dL) 0.58#
<7 8 12 207–11 5 12 17
>11 3 5 8
Leukocyte (mean 72,036 /µL) <0.001#
<50,000 9 27 3650,000–100,000 2 0 2
>100,000 5 2 7Platelet (mean 40,217 /µL) 0.79*
<20,000 6 12 1820,000–100,000 9 14 23>100,000 1 3 4
Morphology 0.33#
L1 13 27 40L2 3 2 5
Immunophenotyping 0.03#
T-cell 7 1 8B-cell 9 25 34Mixed 0 3 3
Molecular 0.19#
TEL-AML1 4 13 17E2A-PBX1 7 12 19BCR-ABL 4 1 5MLL-AF4 1 0 1
*Chi-square test #Fisher exact test
Table 1. Clinical and laboratories characteristics in steroid poor and good response patients
fusion gene was received from Department of Paediatrics, National University of Singapore.
Medical Journal of Indonesia
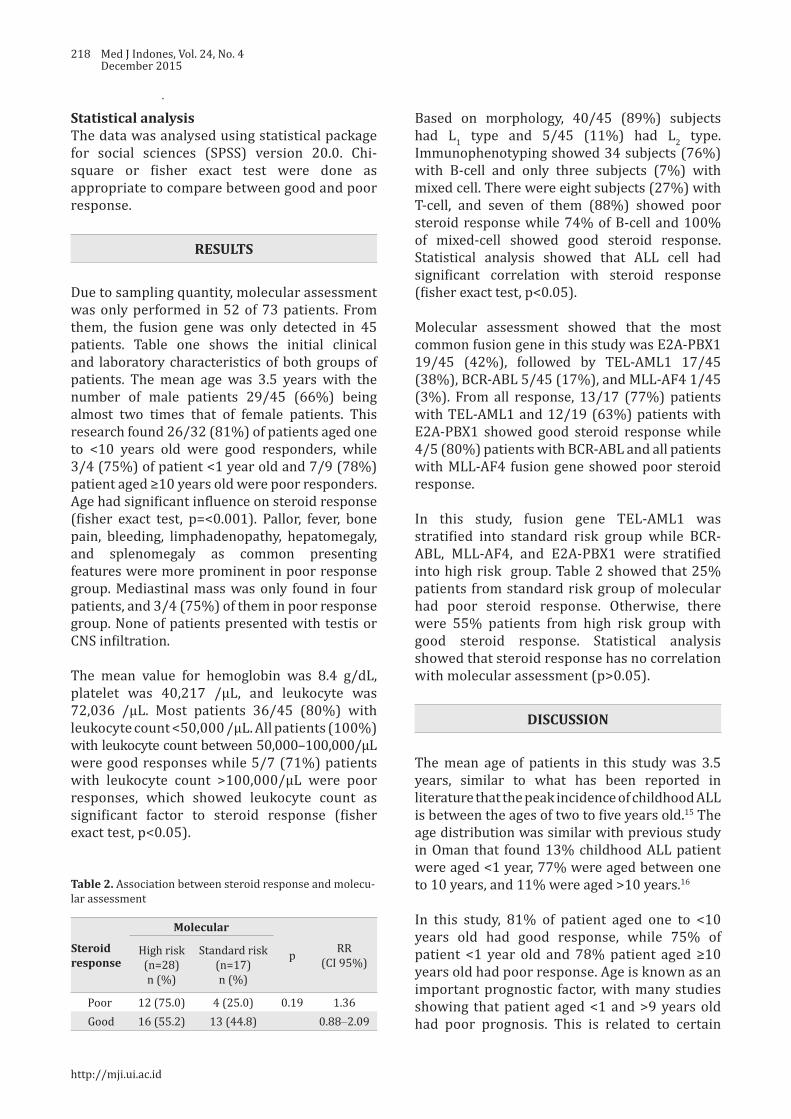
218 Med J Indones, Vol. 24, No. 4December 2015
Statistical analysisThe data was analysed using statistical package for social sciences (SPSS) version 20.0. Chi-square or fisher exact test were done as appropriate to compare between good and poor response.
RESULTS
Due to sampling quantity, molecular assessment was only performed in 52 of 73 patients. From them, the fusion gene was only detected in 45 patients. Table one shows the initial clinical and laboratory characteristics of both groups of patients. The mean age was 3.5 years with the number of male patients 29/45 (66%) being almost two times that of female patients. This research found 26/32 (81%) of patients aged one to <10 years old were good responders, while 3/4 (75%) of patient <1 year old and 7/9 (78%) patient aged ≥10 years old were poor responders. Age had significant influence on steroid response (fisher exact test, p=<0.001). Pallor, fever, bone pain, bleeding, limphadenopathy, hepatomegaly, and splenomegaly as common presenting features were more prominent in poor response group. Mediastinal mass was only found in four patients, and 3/4 (75%) of them in poor response group. None of patients presented with testis or CNS infiltration.
The mean value for hemoglobin was 8.4 g/dL, platelet was 40,217 /µL, and leukocyte was 72,036 /µL. Most patients 36/45 (80%) with leukocyte count <50,000 /µL. All patients (100%) with leukocyte count between 50,000–100,000/µL were good responses while 5/7 (71%) patients with leukocyte count >100,000/µL were poor responses, which showed leukocyte count as significant factor to steroid response (fisher exact test, p<0.05).
Based on morphology, 40/45 (89%) subjects had L1 type and 5/45 (11%) had L2 type. Immunophenotyping showed 34 subjects (76%) with B-cell and only three subjects (7%) with mixed cell. There were eight subjects (27%) with T-cell, and seven of them (88%) showed poor steroid response while 74% of B-cell and 100% of mixed-cell showed good steroid response. Statistical analysis showed that ALL cell had significant correlation with steroid response (fisher exact test, p<0.05).
Molecular assessment showed that the most common fusion gene in this study was E2A-PBX1 19/45 (42%), followed by TEL-AML1 17/45 (38%), BCR-ABL 5/45 (17%), and MLL-AF4 1/45 (3%). From all response, 13/17 (77%) patients with TEL-AML1 and 12/19 (63%) patients with E2A-PBX1 showed good steroid response while 4/5 (80%) patients with BCR-ABL and all patients with MLL-AF4 fusion gene showed poor steroid response.
In this study, fusion gene TEL-AML1 was stratified into standard risk group while BCR-ABL, MLL-AF4, and E2A-PBX1 were stratified into high risk group. Table 2 showed that 25% patients from standard risk group of molecular had poor steroid response. Otherwise, there were 55% patients from high risk group with good steroid response. Statistical analysis showed that steroid response has no correlation with molecular assessment (p>0.05).
DISCUSSION
The mean age of patients in this study was 3.5 years, similar to what has been reported in literature that the peak incidence of childhood ALL is between the ages of two to five years old.15 The age distribution was similar with previous study in Oman that found 13% childhood ALL patient were aged <1 year, 77% were aged between one to 10 years, and 11% were aged >10 years.16
In this study, 81% of patient aged one to <10 years old had good response, while 75% of patient <1 year old and 78% patient aged ≥10 years old had poor response. Age is known as an important prognostic factor, with many studies showing that patient aged <1 and >9 years old had poor prognosis. This is related to certain
Steroid response
Molecular
p RR (CI 95%)
High risk (n=28)n (%)
Standard risk (n=17)n (%)
Poor 12 (75.0) 4 (25.0) 0.19 1.36Good 16 (55.2) 13 (44.8) 0.88–2.09
Table 2. Association between steroid response and molecu-lar assessment
http://mji.ui.ac.id

Andriastuti, et al.Steroid in childhood ALL
219
genetic abnormalitites. MLL fusion gene is more common in patient aged <1 year old and BCR-ABL in patient aged >9 years old. TEL-AML1 is related with good prognosis and commonly found in ALL children aged between one to nine years.17,18
This study found that ALL incidence in male were almost two times higher than female (64% vs 36%), similar with many previous studies in Myanmar,17 Oman,16 Argentina,13 and Pakistan.18 Pallor, fever, bone pain, bleeding, lymphadenopathy, hepatomegaly, and splenomegaly as main clinical symptoms in ALL were more prominent in poor responders. Testicular and CNS infiltration as early clinical sign were very rare. Yasmeen and Ashraf18 found only 2% of ALL patients presented with testicular infiltration and 5% with CNS infiltration. Felice, et al found 1–3% patient with CNS infiltration and no testicular infiltration.13 In this study, there were no patients that presented with testicular or CNS infiltration.
There were four patients (13%) with mediastinal mass, Pui19 found 10%–18% of patient presented with mediastinal mass. Three of four patients (75%) were poor responders. Many studies found that mediastinal mass is a poor prognosis factor that related to thymus hyperplasia and resulter in T-cell. Clinically, T-cell was correlated with high leucocyte count and high incidence of relaps and CNS infiltration.20
This study found that most patient (75%) with leukocyte count <50,000 /µL and all patient (100%) with leukocyte count between 50,000-100,000 /µL were good responders, while 71.4% patient with leukocyte count >100,000 /µL were poor responders. High leukocyte count is related with poor prognosis and need more intensive therapy.21
Morphology examination from bone marrow aspiration showed that L1 type (88.9%) was more common than L2 type (11.1%). These results were similar with Mulatsih, et al6 who found 70% L1 and 30% L2 and also Onciu and Pui1 who found 82% L1 and 15% L2. Immunophenotyping assessment showed B-cell as most common ALL type (76%), followed by T-cell 27% and mixed cell 7%. This result was quite similiar with Supriyadi et al22 who found 63% patient with B-cell, 67% with T-cell and only 0.2% with mixed cell. From all eight patients with T-cell,
seven of them (88%) showed poor steroid response. Felice et al13 found 80% patient with T-cell were poor responders. Clinically, T-cell is correlated with age >9 years, leukocyte count >50,000 /µL, mediastinal mass, CNS infiltration, and more common in male, which all lead to poor prognosis.
Fusion gene detection showed that E2A-PBX1 was the highest percentage (42%), followed by TEL-AML1 (38%), BCR-ABL (17%), and MLL-AF4 (3%). This result is different with Mulatsih et al6 who found TEL-AML1 as the most common (23%), followed by BCR-ABL (11%), E2A-PBX1 (9%), no patient with MLL-AF4, and 57% patients without fusion gene. Pui19 also found that TEL-AML1 was the most common fusion gene both in white and black children (19% and 13%), followed by E2A-PBX1 (11%) in black children.
Many studies found that BCR-ABL and MLL-AF4 fusion gene are related to high leukocyte count and steroid resistence.12 In this study, 80% patient with BCR-ABL and 100% patient with MLL-AF4 fusion gene had poor steroid response. Meanwhile, 63% patient with E2A-PBX1 fusion gene showed good steroid response. Although E2A-PBX1 fusion gene was initially reported as poor prognostic factor, the cure rates is increasing with the use of more intensive chemotherapy such as high dose methotrexate.12 It is already known that TEL-AML1 fusion gene has good prognosis with high EFS rate of approximately 90%.12,23 Borkhardt et al24 found that this fusion gene were more common in female, aged one to five years, and without hyperleukocytosis. In this study, 77% patients with TEL-AML1 had good steroid response. Similar findings were found in a study by Uckun et al25 where 84.0% patients with TEL-AML1 showed good response, directly related to its sensitivity to steroid.25
In conclusion, age, leukocyte count, and immunophenotyping were all correlated with steroid response. Although some of fusion gene did show an implication in patient’s steroid response, but there is no significant correlation with molecular assessment statistically.
Conflicts of interestThe authors affirm there is no conflict of interest in this study.
Medical Journal of Indonesia
220 Med J Indones, Vol. 24, No. 4December 2015
REFERENCES
1. Onciu M, Pui CH. Diagnosis and classification. In: Pui CH, editor. Childhood leukemias. 2nd ed. New York: Cambridge University Press; 2006. p. 21–47.
2. Windiastuti E, Nency YM, Hagung P, Supriyadi E. Mulatsih S, Sjakti HA, et al. Five years evaluation of the Indonesian acute lymphoblastic leukemia: 2006 protocol of the Pediatric Hematology Oncology Working Group. In: Yeoh A, Blair S, Yen SS, editors. Malignancies in children. 7th St. Jude-Viva Forum; 2013. p. 186.
3. Gatot D, Windiastuti E. Treatment of childhood acute lymphoblastic leukemia in Jakarta: results of modified Indonesian National Protocol 94. Paediatr Indones. 2006;46:179–88.
4. Registered data of cancer patient Hematology Oncology Division Child Health Department Faculty of Medicine Universitas Indonesia/Cipto Mangunkusumo Hospital. Jakarta: 2014. Indonesian.
5. Hunger SP, Sung L, Howard SC. Treatment strategies and regimens of graduated intensity for childhood acute lymphoblastic leukemia in low-income countries: a proposal. Pediatr Blood Cancer. 2009;52:559–65.
6. Mulatsih S, Sumadiono, Sutaryo, Purwanto. The result of treating children’s acute lymphoblastic leukemia (LLA) in Dr. Sardjito Hospital with WK-LLA Protocol 1999–2002. Buletin Ilmu Kesehatan Anak FK UNAIR. 2005;17:808–19. Indonesian.
7. Windiastuti E. Childhood acute leukemia: Cipto Mangunkusumo Hospital experiences. Presented in Perhimpunan Hematologi dan Transfusi Darah Indonesia. Medan: 2011.
8. Donadieu J, Auclerc MF, Baruchel A, Leblanc T, Landman-Parker J, Perel Y, et al. Critical study of prognostic factors in childhood acute lymphoblastic leukaemia: differences in outcome are poorly explained by the most significant prognostic variables. Fralle group. Frech acute lymphoblactic leukaemia study group. Br J Haematol. 1998;102(3):729–39.
9. Okuda T, Fisher R, Downing JR. Molecular diagnostics in pediatric acute lymphoblastic leukemia. Mol Diagn. 1996;1(12):139–51.
10. Rubnitz JE, Downing JR, Pui CH, Shurtleff SA, Raimondi SC, Evans WE, et al. TEL gene rearrangement in acute lymphoblastic leukemia: a new genetic marker with prognostic significance. J Clin Oncol. 1997;15(3):1150–7.
11. Raimondi SC, Behm FG, Roberson PK, Williams DL, Pui CH, Crist WM, et al. Cytogenetics of pre-B-cell acute lymphoblastic leukemia with emphasis on prognostic implications of the t(1;19). J Clin Oncol. 1990;8(8):1380–8.
12. Gutierrez A, Armstrong SA, Look AT. Pathobiology of acute lymphoblastic leukemia. In: Hoffman R, Benz EJ, Silberstein LE, Heslop H, Weitz J, Anastasi, editors. Hematology: basic principles and practice. 6th ed. Elsevier; 2013. p. 935–50.
13. Felice MS, Zubizarreta PA, Alfaro EM, Sackmann-Muriel F. Childhood acute lymphoblastic leukemia: prognostic value of initial peripheral blast count in good responders to prednisone. J Pediatr Hematol Oncol. 2001;23(7):411–5.
14. Manabe A, Ohara A, Hasegawa D, Koh K, Saito T, Kiyokawa N, et al. Significance of the complete clearance of peripheral blasts after 7 days of prednisolone treatment in children with acute lymphoblastic leukemia: the Tokyo Children’s Cancer Study Grup Study L99-15. Haematologica. 2008;93(8):1155–60.
15. Spector LG, Ross JA, Robison LL, Bhatia S. Epidemiology and etiology. In: Pui CH, editor. Childhood leukemias. 2nd ed. New York: Cambridge University Press; 2006. p. 48–65.
16. Udayakumar AM, Bashir WA, Pathare AV, Wali YA, Zacharia M, Khan AA, et al. Cytogenetic profile of childhood acute lymphoblastic leukemia in Oman. Arch Med Res. 2007;38(3):305–12.
17. Ei E, Ko Y, Thet K, Pe K, Myint T, Sein WK, et al. Clinical profile of childhood leukemia in Mandalay. St Jude Viva Forum. 2011.
18. Yasmeen N, Ashraf S. Childhood acute lymphoblastic leukaemia; epidemiology and clinicopathological features. J Pak Med Assoc. 2009;59(3):150–3.
19. Pui CH, Howard S. Current management and challenges of malignant disease in the CNS in pediatric leukaemia. The Lancet Oncol. 2008;9:257–68.
20. Smith M, Arthur D, Camitta B, Carroll AJ, Crist W, Gaynon P et al. Uniform approach to risk classification and treatment assignment for children with acute lymphoblastic leukemia. J Clin Oncol. 1996;14:18–24.
21. Smith M, Arthur D, Camitta B, Carroll AJ, Crist W, Gaynon P, et al. Uniform approach to risk classification and treatment assignment for children with acute lymphoblastic leukemia. J Clin Oncol. 1996;14(1):18–24.
22. Supriyadi E, Widjajanto PH, Veerman AJ, Purwanto I, Nency YM, Gunawan S, et al. Immunophenotypic patterns of childhood acute leukemias in Indonesia. Asian Pac J Cancer Prev. 2011;12:3381–7.
23. Meijerink, JP, den Boer ML, Pieters R. New genetic abnormalities and treatment response in acute lymphoblastic leukemia. Semin Hematol. 2009;46(1):16–23.
24. Borkhardt A, Cazzaniga G, Viehmann S, Valsecchi MG, Ludwig WD, Burci L, et al. Incidence and clinical relevance of TEL/AML1 fusion genes in children with acute lymphoblastic leukemia enrolled in German and Italian multicenter therapy trials. Associazione Italiana Ematologia Oncologia Pediatrica and the Berlin-Frankfurt-Münster Study Group. Blood. 1997;90(2):571–7.
25. Uckun FM, Pallisgaard N, Hokland P, Navara C, Narla R, Gaynon PS, et al. Expression of TEL-AML1 fusion transcripts and response to induction therapy in standard risk acute lymphoblastic leukemia. Leuk Lymphoma. 2001;42(1–2):41–56.
http://mji.ui.ac.id
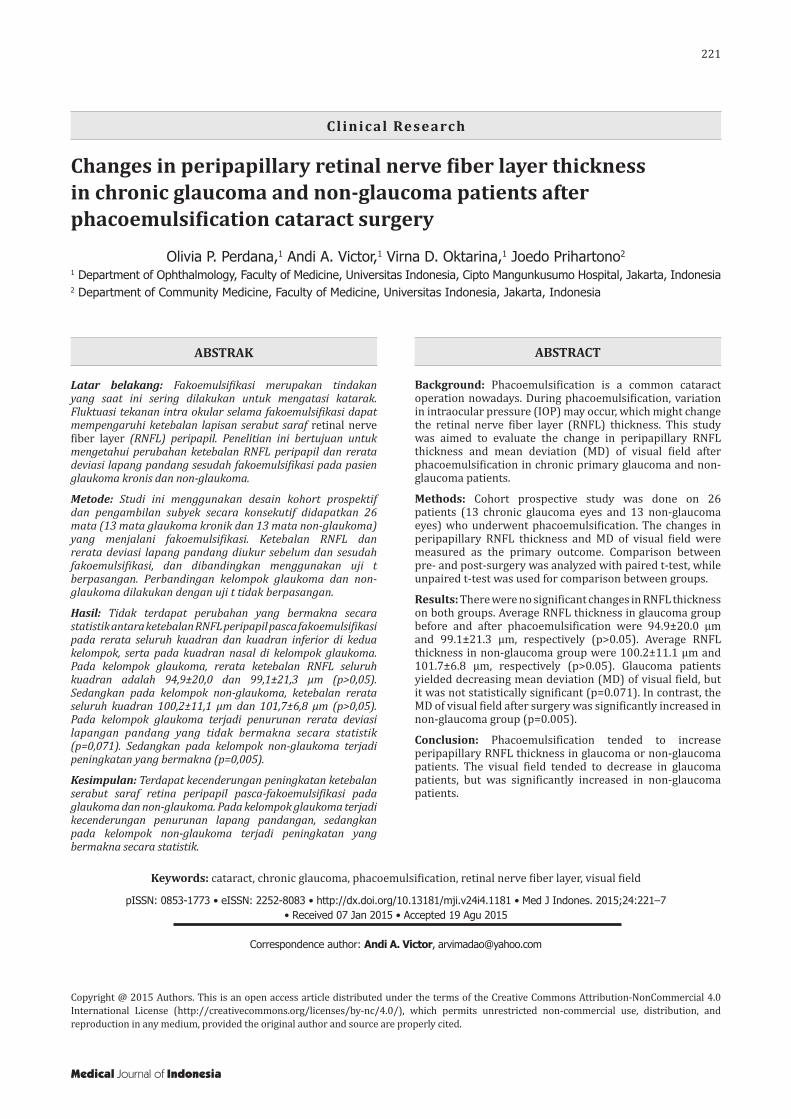
Perdana, et al.RNFL thickness after phacoemulsification
221
Changes in peripapillary retinal nerve fiber layer thickness in chronic glaucoma and non-glaucoma patients after phacoemulsification cataract surgery
Keywords: cataract, chronic glaucoma, phacoemulsification, retinal nerve fiber layer, visual field
pISSN: 0853-1773 • eISSN: 2252-8083 • http://dx.doi.org/10.13181/mji.v24i4.1181 • Med J Indones. 2015;24:221–7• Received 07 Jan 2015 • Accepted 19 Agu 2015
Correspondence author: Andi A. Victor, [email protected]
Copyright @ 2015 Authors. This is an open access article distributed under the terms of the Creative Commons Attribution-NonCommercial 4.0 International License (http://creativecommons.org/licenses/by-nc/4.0/), which permits unrestricted non-commercial use, distribution, and reproduction in any medium, provided the original author and source are properly cited.
Olivia P. Perdana,1 Andi A. Victor,1 Virna D. Oktarina,1 Joedo Prihartono2
1 Department of Ophthalmology, Faculty of Medicine, Universitas Indonesia, Cipto Mangunkusumo Hospital, Jakarta, Indonesia2 Department of Community Medicine, Faculty of Medicine, Universitas Indonesia, Jakarta, Indonesia
Clinical Research
Medical Journal of Indonesia
ABSTRAK
Latar belakang: Fakoemulsifikasi merupakan tindakan yang saat ini sering dilakukan untuk mengatasi katarak. Fluktuasi tekanan intra okular selama fakoemulsifikasi dapat mempengaruhi ketebalan lapisan serabut saraf retinal nerve fiber layer (RNFL) peripapil. Penelitian ini bertujuan untuk mengetahui perubahan ketebalan RNFL peripapil dan rerata deviasi lapang pandang sesudah fakoemulsifikasi pada pasien glaukoma kronis dan non-glaukoma.
Metode: Studi ini menggunakan desain kohort prospektif dan pengambilan subyek secara konsekutif didapatkan 26 mata (13 mata glaukoma kronik dan 13 mata non-glaukoma) yang menjalani fakoemulsifikasi. Ketebalan RNFL dan rerata deviasi lapang pandang diukur sebelum dan sesudah fakoemulsifikasi, dan dibandingkan menggunakan uji t berpasangan. Perbandingan kelompok glaukoma dan non-glaukoma dilakukan dengan uji t tidak berpasangan.
Hasil: Tidak terdapat perubahan yang bermakna secara statistik antara ketebalan RNFL peripapil pasca fakoemulsifikasi pada rerata seluruh kuadran dan kuadran inferior di kedua kelompok, serta pada kuadran nasal di kelompok glaukoma. Pada kelompok glaukoma, rerata ketebalan RNFL seluruh kuadran adalah 94,9±20,0 dan 99,1±21,3 μm (p>0,05). Sedangkan pada kelompok non-glaukoma, ketebalan rerata seluruh kuadran 100,2±11,1 μm dan 101,7±6,8 μm (p>0,05). Pada kelompok glaukoma terjadi penurunan rerata deviasi lapangan pandang yang tidak bermakna secara statistik (p=0,071). Sedangkan pada kelompok non-glaukoma terjadi peningkatan yang bermakna (p=0,005).
Kesimpulan: Terdapat kecenderungan peningkatan ketebalan serabut saraf retina peripapil pasca-fakoemulsifikasi pada glaukoma dan non-glaukoma. Pada kelompok glaukoma terjadi kecenderungan penurunan lapang pandangan, sedangkan pada kelompok non-glaukoma terjadi peningkatan yang bermakna secara statistik.
ABSTRACT
Background: Phacoemulsification is a common cataract operation nowadays. During phacoemulsification, variation in intraocular pressure (IOP) may occur, which might change the retinal nerve fiber layer (RNFL) thickness. This study was aimed to evaluate the change in peripapillary RNFL thickness and mean deviation (MD) of visual field after phacoemulsification in chronic primary glaucoma and non-glaucoma patients.
Methods: Cohort prospective study was done on 26 patients (13 chronic glaucoma eyes and 13 non-glaucoma eyes) who underwent phacoemulsification. The changes in peripapillary RNFL thickness and MD of visual field were measured as the primary outcome. Comparison between pre- and post-surgery was analyzed with paired t-test, while unpaired t-test was used for comparison between groups.
Results: There were no significant changes in RNFL thickness on both groups. Average RNFL thickness in glaucoma group before and after phacoemulsification were 94.9±20.0 μm and 99.1±21.3 μm, respectively (p>0.05). Average RNFL thickness in non-glaucoma group were 100.2±11.1 μm and 101.7±6.8 μm, respectively (p>0.05). Glaucoma patients yielded decreasing mean deviation (MD) of visual field, but it was not statistically significant (p=0.071). In contrast, the MD of visual field after surgery was significantly increased in non-glaucoma group (p=0.005).
Conclusion: Phacoemulsification tended to increase peripapillary RNFL thickness in glaucoma or non-glaucoma patients. The visual field tended to decrease in glaucoma patients, but was significantly increased in non-glaucoma patients.
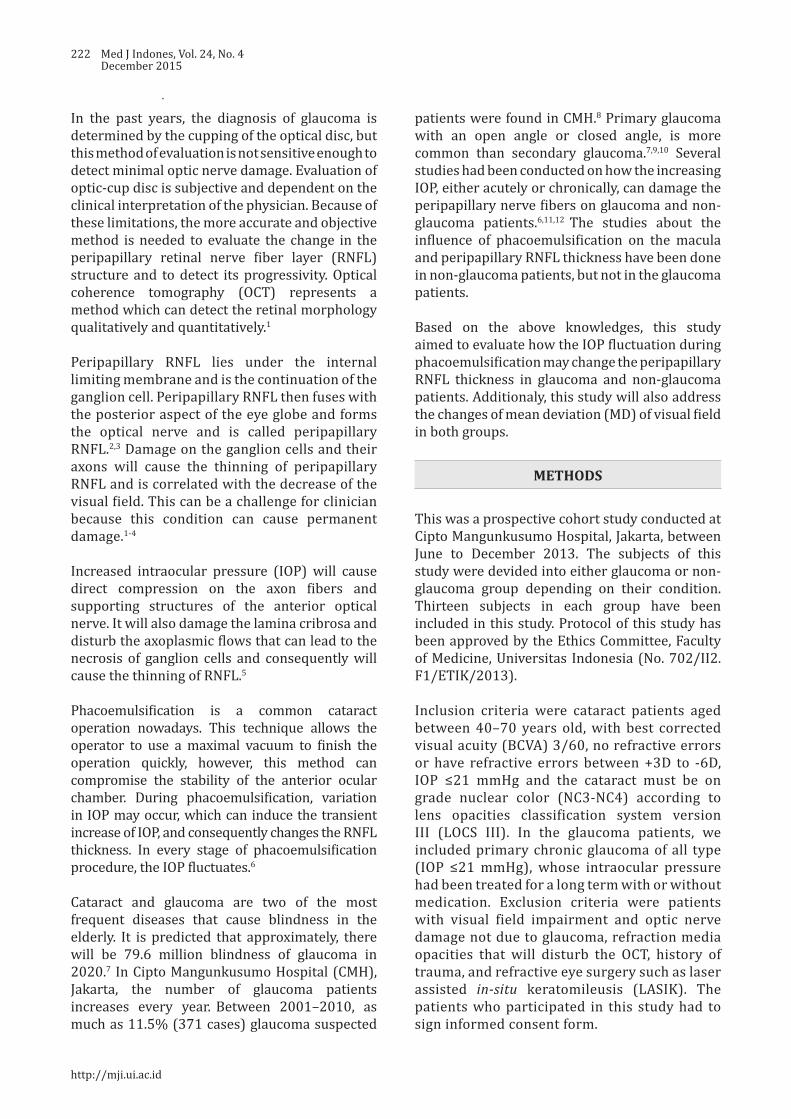
222 Med J Indones, Vol. 24, No. 4December 2015
In the past years, the diagnosis of glaucoma is determined by the cupping of the optical disc, but this method of evaluation is not sensitive enough to detect minimal optic nerve damage. Evaluation of optic-cup disc is subjective and dependent on the clinical interpretation of the physician. Because of these limitations, the more accurate and objective method is needed to evaluate the change in the peripapillary retinal nerve fiber layer (RNFL) structure and to detect its progressivity. Optical coherence tomography (OCT) represents a method which can detect the retinal morphology qualitatively and quantitatively.1
Peripapillary RNFL lies under the internal limiting membrane and is the continuation of the ganglion cell. Peripapillary RNFL then fuses with the posterior aspect of the eye globe and forms the optical nerve and is called peripapillary RNFL.2,3 Damage on the ganglion cells and their axons will cause the thinning of peripapillary RNFL and is correlated with the decrease of the visual field. This can be a challenge for clinician because this condition can cause permanent damage.1-4
Increased intraocular pressure (IOP) will cause direct compression on the axon fibers and supporting structures of the anterior optical nerve. It will also damage the lamina cribrosa and disturb the axoplasmic flows that can lead to the necrosis of ganglion cells and consequently will cause the thinning of RNFL.5
Phacoemulsification is a common cataract operation nowadays. This technique allows the operator to use a maximal vacuum to finish the operation quickly, however, this method can compromise the stability of the anterior ocular chamber. During phacoemulsification, variation in IOP may occur, which can induce the transient increase of IOP, and consequently changes the RNFL thickness. In every stage of phacoemulsification procedure, the IOP fluctuates.6
Cataract and glaucoma are two of the most frequent diseases that cause blindness in the elderly. It is predicted that approximately, there will be 79.6 million blindness of glaucoma in 2020.7 In Cipto Mangunkusumo Hospital (CMH), Jakarta, the number of glaucoma patients increases every year. Between 2001–2010, as much as 11.5% (371 cases) glaucoma suspected
patients were found in CMH.8 Primary glaucoma with an open angle or closed angle, is more common than secondary glaucoma.7,9,10 Several studies had been conducted on how the increasing IOP, either acutely or chronically, can damage the peripapillary nerve fibers on glaucoma and non-glaucoma patients.6,11,12 The studies about the influence of phacoemulsification on the macula and peripapillary RNFL thickness have been done in non-glaucoma patients, but not in the glaucoma patients.
Based on the above knowledges, this study aimed to evaluate how the IOP fluctuation during phacoemulsification may change the peripapillary RNFL thickness in glaucoma and non-glaucoma patients. Additionaly, this study will also address the changes of mean deviation (MD) of visual field in both groups.
METHODS
This was a prospective cohort study conducted at Cipto Mangunkusumo Hospital, Jakarta, between June to December 2013. The subjects of this study were devided into either glaucoma or non-glaucoma group depending on their condition. Thirteen subjects in each group have been included in this study. Protocol of this study has been approved by the Ethics Committee, Faculty of Medicine, Universitas Indonesia (No. 702/II2.F1/ETIK/2013).
Inclusion criteria were cataract patients aged between 40–70 years old, with best corrected visual acuity (BCVA) 3/60, no refractive errors or have refractive errors between +3D to -6D, IOP ≤21 mmHg and the cataract must be on grade nuclear color (NC3-NC4) according to lens opacities classification system version III (LOCS III). In the glaucoma patients, we included primary chronic glaucoma of all type (IOP ≤21 mmHg), whose intraocular pressure had been treated for a long term with or without medication. Exclusion criteria were patients with visual field impairment and optic nerve damage not due to glaucoma, refraction media opacities that will disturb the OCT, history of trauma, and refractive eye surgery such as laser assisted in-situ keratomileusis (LASIK). The patients who participated in this study had to sign informed consent form.
http://mji.ui.ac.id

Perdana, et al.RNFL thickness after phacoemulsification
223
The cataract surgery was done by single competence ophthalmologist (VDO) from Cipto Mangunkusumo Kirana Hospital using Alcon-Infiniti® phacoemulsification machine. Visual acuity and visual field were measured before and four weeks after phacoemulsification. The primary outcome of this study was the RNFL thickness in superior, inferior, temporal and nasal quadrants. Nerve fiber layer was measured by spectral-domain OCT (SD-OCT) using 3D-OCT 1000 (TOPCON, Paramus, New Jersey, USA) and the value was assessed by single ophthalmologist. Visual acuity was measured by using Snellen chart and visual field was measured by Humphrey field analyzer (HFA). An accurate HFA examination requires false positive response of 15%, false negative response >20-30%, and fixation loss >20%. We took the value of MD of visual field which is defined as the average difference between patient’s value with desirable values of the same group age.
The data collected were analyzed using computerized statistical program. Kolmogorov-Smirnov test was used to determine the homogeneity of data distribution. Unpaired t-test was used to compare the difference in peripapillary RNFL thickness pre- and post-surgery between both groups. Paired t-test was used to compare the peripapillary RNFL
Characteristics Glaucoma (n) Non-glaucoma (n)Gender
Male 9 9Female 4 4
Age ≤65 years old 7 7>65 years old 6 6
Table 1. Demographic characteristics of subjects in each group
Table 2. Baseline clinical characteristic of each group
Glaucoma Non-glaucoma p*BCVA (logMAR) 0.5 (0.0–1.0) 0.8 (0.3–1.3) 0.045UCVA (logMAR) 0.6 (0.3–1.0) 0.8 (0.3–1.8) 0.030IOP (mmHg) 18.0 (8.0–23.0) 10.3 (8.3–17.7) 0.007Cataract Grade
NC2 NO3 1 0NC3 NO3 7 8NC3 NO4 4 4NC4 NO4 1 1
Visual field mean deviation -6.9 (-20.9–0.5) -10.5 (-28.0–-4.2) 0.061Total RNFL 94.9±20.0 100.2±11.1 0.418Superior 115.5±25.2 123.9±12.2 0.287Inferior 110.9±32.4 124.8±20.2 0.555Temporal 75.3±20.8 79.0±16.9 0.624Nasal 77.1±20.2 74.1±15.2 0.672
thickness pre- and post-surgery within each group. The difference in visual field was analyzed using Mann-Whitney rank test. The differences are considered significant if p<0.05.
RESULTS
Twenty six eyes from 26 patients were involved in this study. The demographic characteristics among the subjects are shown on table 1. The average patients age were 64 years old in glaucoma group and 60 in non-glaucoma group. There were more males in this study than females.
As shown on table 2, the pre-operative BCVA in non-glaucoma group was better than the glaucoma group (0.8 vs 0.5). The IOP in the non-glaucoma group (10.3 mmHg) was better than the
UCVA: uncorrected visual acuity, BCVA: best corrected visual acuity, IOP: intra occular pressure, NC: nuclear color, NO: nuclear opalescence, *Mann Whitney test
Medical Journal of Indonesia
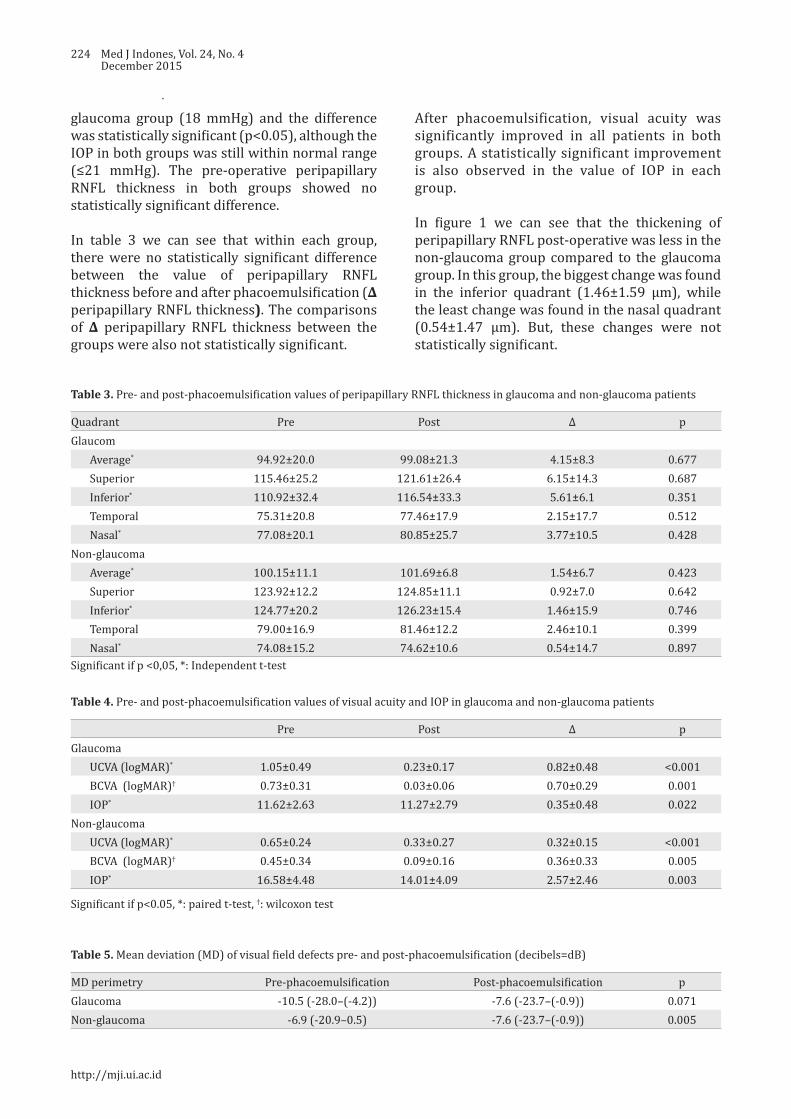
224 Med J Indones, Vol. 24, No. 4December 2015
glaucoma group (18 mmHg) and the difference was statistically significant (p<0.05), although the IOP in both groups was still within normal range (≤21 mmHg). The pre-operative peripapillary RNFL thickness in both groups showed no statistically significant difference.
In table 3 we can see that within each group, there were no statistically significant difference between the value of peripapillary RNFL thickness before and after phacoemulsification (∆ peripapillary RNFL thickness). The comparisons of ∆ peripapillary RNFL thickness between the groups were also not statistically significant.
Quadrant Pre Post ∆ pGlaucom
Average* 94.92±20.0 99.08±21.3 4.15±8.3 0.677Superior 115.46±25.2 121.61±26.4 6.15±14.3 0.687Inferior* 110.92±32.4 116.54±33.3 5.61±6.1 0.351Temporal 75.31±20.8 77.46±17.9 2.15±17.7 0.512Nasal* 77.08±20.1 80.85±25.7 3.77±10.5 0.428
Non-glaucomaAverage* 100.15±11.1 101.69±6.8 1.54±6.7 0.423Superior 123.92±12.2 124.85±11.1 0.92±7.0 0.642Inferior* 124.77±20.2 126.23±15.4 1.46±15.9 0.746Temporal 79.00±16.9 81.46±12.2 2.46±10.1 0.399Nasal* 74.08±15.2 74.62±10.6 0.54±14.7 0.897
Table 3. Pre- and post-phacoemulsification values of peripapillary RNFL thickness in glaucoma and non-glaucoma patients
Table 4. Pre- and post-phacoemulsification values of visual acuity and IOP in glaucoma and non-glaucoma patients
Table 5. Mean deviation (MD) of visual field defects pre- and post-phacoemulsification (decibels=dB)
Significant if p<0.05, *: paired t-test, †: wilcoxon test
Pre Post ∆ pGlaucoma
UCVA (logMAR)* 1.05±0.49 0.23±0.17 0.82±0.48 <0.001BCVA (logMAR)† 0.73±0.31 0.03±0.06 0.70±0.29 0.001IOP* 11.62±2.63 11.27±2.79 0.35±0.48 0.022
Non-glaucomaUCVA (logMAR)* 0.65±0.24 0.33±0.27 0.32±0.15 <0.001BCVA (logMAR)† 0.45±0.34 0.09±0.16 0.36±0.33 0.005IOP* 16.58±4.48 14.01±4.09 2.57±2.46 0.003
After phacoemulsification, visual acuity was significantly improved in all patients in both groups. A statistically significant improvement is also observed in the value of IOP in each group.
In figure 1 we can see that the thickening of peripapillary RNFL post-operative was less in the non-glaucoma group compared to the glaucoma group. In this group, the biggest change was found in the inferior quadrant (1.46±1.59 μm), while the least change was found in the nasal quadrant (0.54±1.47 μm). But, these changes were not statistically significant.
MD perimetry Pre-phacoemulsification Post-phacoemulsification pGlaucoma -10.5 (-28.0–(-4.2)) -7.6 (-23.7–(-0.9)) 0.071Non-glaucoma -6.9 (-20.9–0.5) -7.6 (-23.7–(-0.9)) 0.005
Significant if p <0,05, *: Independent t-test
http://mji.ui.ac.id

Perdana, et al.RNFL thickness after phacoemulsification
225
In the non-glaucoma group, the visual field was improved and statistically significant (p=0.005). However in the glaucoma group, the visual field was declined so we can say that the visual field was worsened. The worsening is not statistically significant (p=0.071).
There was a negative correlation between the changes in peripapillary RNFL thickness and visual field in the glaucoma group (r=-0.39, p=0.190). In the non-glaucoma group, in the contrary, the correlation was positive (r=0.89, p=0.571). Both of these correlations were not statistically significant.
DISCUSSION
This study found that the peripapillary thickness was clinically thinner in glaucoma group compared to the non-glaucoma group. The peripapillary thickness were measured using spectral domain optical coherence tomography (SD OCT), which according to Schuman13 this instrument was superior to time domain (TD)
Figure 1. The changes of peripapillary RNFL thickness pre-and post-phacoemulsification in glaucoma group (dot line) and in non-glaucoma group (continous line). No significant difference of both group in all quadrants (p>0.05)
OCT. SD-OCT produced the tomography if the eye with high resolution and the scanning process is faster. This device also gives better reproducibility in measuring peripapillary RNFL and macular thickness. SD-OCT is mainly used to measure the sectoral loss of retinal tissue rather than measuring the global loss as seen in the early phase of glaucoma in which the tissue loss occurred focally.
During phacoemulsification, a high vacuum was accompanied with high irrigation pressure. The increase in those pressures might cause the increase in IOP. Chen D et al6 found that the highest IOP during phacoemulsification occurred during the emulsification of the nucleus and cortex (68.4 mmHg in 132±15.1 seconds), approximately 74.4% from the total time of perfusion.
In our glaucoma clinic, the patients often complained that their visions were getting worse after phacoemulsification. However, nowadays, there was no study that clarify this statement. It has known that in chronic glaucoma the peripapillary RNFL were damaged because of the progressivity
Medical Journal of Indonesia

226 Med J Indones, Vol. 24, No. 4December 2015
of the disease. Studies that measured the changes in peripapillary RNFL thickness found that the changes occurred because of a sudden increase of IOP (>40 mmHg in less than 48 hours).11,12 Eyes with IOP increased of more than 40 mmHg, had thinner peripapillary RNFL and these thinning also occured continuously until six months follow-up. In patients who never had sudden increase of IOP, the peripapillary thinning did not occur.11,12
One of the mechanisms of the thinning of peripapillary RNFL in glaucoma is axon damage resulted from the mechanical and ischemic process. In ischemic process, there was intraneural ischemia due to the decrease of perfusion to the optical nerve from the damaged vessels autoregulation. Thereby, depriving perfusion and damaging the optical nerve, resulted in the thinning of peripapillary retinal nerve fiber layer. IOP elevation caused RNFL thinning because IOP elevation directly compressed axonal fiber and the supporting structure in the anterior optic nerve. In addition, damages lamina cribrosa plater, interfered axoplasmic stream that ended with ganglionic cells death and peripapillary RNFL thinning.
Yoles et al14 described about secondary degeneration mechanism. This mechanism explained why neuron damage continued to occur even with lowered IOP. In this event, a propagation of damage occurred at the normal neuron around the damaged one. Tsai et al12 reported that the thickening of retinal nerve fiber layer occurs in the first week after the acute attack, followed by the thinning of RNFL in the involved eye after the fourth and 12th week. Liu et al11 reported that since the increased the thickness of RNFL occurred in the first week after an acute attack, a progressive decreasing then occurred after the next six weeks. In phacoemulsification, the mechanical effects resulted from ultrasound energy and liquid regulation in that surgery due to compression reaction and hypoxia in the tissue.15
One week after phacoemulsification, the thickness of peripapillary RNFL increased in every quadrant (superior, inferior, temporal, and nasal) and in the mean of all quadrants, even though the differences were not statistically significant. The increase of peripapillary RNFL thickness was greater in
glaucoma group compared to non-glaucoma. In the glaucoma group, the peripapillary RNFL was thickened in every quadrant post-operatively, despite the variation of the thickening. The most visible change in the glaucoma group was found in the superior quadrant in which the thickening was 6.15±1.46 μm. The least change was found in the temporal quadrant (2.15±17.71 μm). We may found the difference between peripapillary RNFL in every quadrant before and after phacoemulsification in both groups clinically, but we found that the difference was not significant statistically.
Several previous studies reported a peripapillary RNFL examination post-cataract surgery with various RNFL measurement techniques. A significant increase of peripapillary RNFL post-surgery have been reported. In those studies, the increase of RNFL thickness was related with the power of OCT signal and lens opacity. A lower signal power before phacoemulsification that caused by lens opacity would be increased after surgery because of the subsequent clearer media.16,17
In this study, the mean of image quality in all subjects were nearly similar in both of the groups, so the possibility of difference results before and after surgery measurement could be ignored. A peripapillary RNFL thickness increased in this study was caused by the inflammatory factors post and a longer healing of retinal layer compared with the edema of cornea. In glaucoma with peripapillary nerve fiber and ganglion cells damage, and with inhibited perfusion, the inflammation process, the healing process was slower than normal condition. This could be observed in figure 1, a mean increase of RFNL group was about 4 μm and in non-glaucoma group was only 1 μm.
All of the subjects of this study did not have severe corneal edema so we could perform the OCT examination in one week after surgery, but in the first week of post-phacoemulsification there was RNFL edema period of healing compared with the improvement of corneal edema, so it was seen like RNFL thickness in OCT examination.
Visual field is one examinations to detect the presence of glaucoma or to find the damage in
http://mji.ui.ac.id
Perdana, et al.RNFL thickness after phacoemulsification
227
retinal nerve fiber. At the beginning of glaucoma process, there was a destruction of the structure such as the ganglion cells apoptosis, loses of the RNFL and alteration of optical papil. All of the continuing process provided no signs or symptoms, and could not be diagnosed until functional disorder could be detected as early scotoma in the visual field examination.18,19
In this study, we also found a decrease in the mean deviation of the visual field in glaucoma group, but it was not statistically significant. In contrast, post-cataract surgery sensitivity was improving, but the visual field narrowed. This indicates that a damage of RNFL occurred in glaucoma group post-phacoemulsification. In the contrary, we found a visual field improvement that was statistically significant in non-glaucoma group. This improvement of visual field was resulted from the improvement of contrast sensitivity after the removal of cataract.18,19
In conclusion, the peripapillary RNFL thickness in some quadrants were increased after phacoemulsification, however these changes were not statistically significant in both glaucoma and non-glaucoma patients. The differences between groups were also not statistically significant. In addition, glaucoma patients had decreased visual field after phacoemulsification, although the changes were not statistically significant. While in non-glaucoma patients the visual field were significantly improved.
Conflicts of interestThe authors affirm there is no conflict of interest in this study.
REFERENCES
1. Levin LA. Pathophysiology of the progressive optic neuropathy of glaucoma. Ophthalmol Clin North Am. 2005;18(3):355–64.
2. Rao HL, Babu JG, Addepalli UK, Senthil S, Garudadri CS. Retinal nerve fiber layer and macular inner retina measurements by spectral domain optical coherence tomograph in Indian eyes with early glaucoma. Eye (Lond). 2012;26(1),133–9.
3. Sung KR, Kim DY, Park SB, Kook MS. Comparison of retinal nerve fiber layer thickness measured by Cirrus HD and Stratus optical coherence tomography. Ophthalmology. 2009;116(7):1264–70.
4. Schuman JS, Hee MR, Puliafito CA, Wong C, Pedut-Kloizman T, Lin CP, et al. Quantification of nerve fiber layer thickness in normal and glaucomatous eyes using optical coherence tomography. Arch Ophthalmol. 1995;113(5):586–96.
5. American Academy of Ophthalmology. Fundamentals and principles of ophthalmology: basic and clinical science course. San Francisco: American Academy of Ophthalmology; 2006–2007.
6. Chen D, Zhu J, Li J, Ding XX, Lu F, Zhao YE. Effect of simulated dynamic intraocular pressure on retinal thickness measured by optical coherence tomography after cataract surgery. Int J Ophthalmol. 2012;5(6):687–93.
7. Quigley HA, Broman AT. The number of people with glaucoma worldwide in 2010 and 2020. Br J Ophthalmol. 2006;90(3):262-7.
8. Faiqoh M. Karakteristik pasien di divisi glaukoma poliklinik mata Rumah Sakit Cipto Mangunkusumo tahun 2001–2010 Jakarta: Indonesia; 2011. Indonesian
9. Wang YX, Xu L, Yang H, Jonas JB. Prevalence of glaucoma in North China: the Beijing eye study. Am J Ophthalmol. 2010;150(6):917–24.
10. Giangiacomo A, Coleman AL. The epidemiology of glaucoma In: Grehn F, Stamper R, editors. Glaucoma. Heidelberg: Springer; 2009. p. 13–21.
11. Liu X, Zhong YM, Xiao H, Huang JJ, Kong XY. The damage patterns of retinal nerve fiber layer in acute and chronic intraocular pressure elevation in primary angle closure glaucoma. Eye Sci. 2011;26(3):154–60.
12. Tsai JC, Lin PW, Teng MC, Lai IC. Longitudinal changes in retinal nerve fiber layer thickness after acute primary angle closure measured with optical coherence tomography. Invest Ophthalmol Vis Sci. 2007;48(4):1659–64.
13. Schuman JS. Spectral domain optical coherence tomography for glaucoma (An AOS Thesis). Trans Am Ophthalmol Soc. 2008;106:426–58.
14. Yoles E, Schwartz M. Potential neuroprotective therapy for glaucomatous optic neuropathy. Surv Ophthalmol. 1998;42(4):367–72.
15. Pardianto G, Moeloek N, Reveny J, Wage S, Satari I, Sembiring R, et al. Retinal thickness changes after phacoemulsification. Clin Ophthalmol. 2013;7:2207–14.
16. Lee DW, Kim JM, Park KH, Choi CY, Cho JG. Effect of media opacity on retinal nerve fiber layer thickness measurements by optical coherence tomography. J Ophthalmic Vis Res. 2010;5(3):151–7.
17. Dada T, Behera G, Agarwal A, Kumar S, Sihota R, Panda A. Effect of cataract surgery on retinal nerve fiber layer thickness parameters using scanning laser polarimetry (GDxVCC). Indian J Ophthalmol: 2010;58(5):389–94.
18. Gazzard G, Foster PJ, Devereux JG, Oen F, Chew P, Khaw PT, et al. Intraocular pressure and visual field loss in primary angle closure and primary open angle glaucomas. Br J Ophthalmol. 2003;87(6):720–5.
19. Cheung CY, Leung CK, Lin D, Pang CP, Lam DS. Relationship between retinal nerve fiber layer measurement and signal strength in optical coherence tomography. Ophthalmology. 2008;115(8):1347–51.
Medical Journal of Indonesia
228 Med J Indones, Vol. 24, No. 4December 2015
Sunlight–derived vitamin D affects interleukin-4 level, T helper 2 serum cytokines, in patients with Graves’ disease: a prospective cohort study
Keywords: Graves’ disease, IFN-γ, IL-4, sunlight exposure, Th1 and Th2 pathway, vitamin D
pISSN: 0853-1773 • eISSN: 2252-8083 • http://dx.doi.org/10.13181/mji.v24i4.1270 • Med J Indones. 2015;24:228–33• Received 20 Agu 2015 • Accepted 02 Dec 2015
Correspondence author: Dyah Purnamasari, [email protected]
Copyright @ 2015 Authors. This is an open access article distributed under the terms of the Creative Commons Attribution-NonCommercial 4.0 International License (http://creativecommons.org/licenses/by-nc/4.0/), which permits unrestricted non-commercial use, distribution, and reproduction in any medium, provided the original author and source are properly cited.
Dyah Purnamasari, Pradana Soewondo, Samsuridjal DjauziDepartment of Internal Medicine, Faculty of Medicine, Universitas Indonesia, Jakarta, Indonesia
Clinical Research
Medical Journal of Indonesia
ABSTRAK
Latar belakang: Penyakit Graves (GD) merupakan penyakit autoimun paling sering dijumpai yang menyebabkan hipertiroidisme. Peran keseimbangan jalur T helper 1 (Th1)/T helper 2 (Th2) pada GD masih diperdebatkan. Vitamin D dilaporkan memiliki efek terhadap kedua jalur tersebut. Studi ini bertujuan mengetahui efek pajanan sinar matahari terhadap kadar vitamin D 25(OH) dan kadar sitokin jalur Th1/Th2 pada pasien GD.
Metode: Studi ini menggunakan desain kohort prospektif untuk membandingkan efek pajanan matahari terhadap kadar vitamin D 25(OH) dan sitokin jalur Th1 serta Th2 pada 32 pasien GD yang belum pernah remisi, yang dibagi menjadi 2 kelompok: kelompok GD pajanan dan non-pajanan. Kelompok pajanan mendapatkan intervensi berupa pajanan sinar matahari 3 kali seminggu dengan durasi 30 menit/kali, pukul 09.00–11.00 WIB, selama satu bulan. Data laboratorium berupa kadar thyroid stimulating hormone (TSH), free thyroxin (fT4), vitamin D 25(OH), interferon-γ (IFN-γ), dan interleukin-4 (IL-4) dinilai sebelum dan sesudah pajanan. Analisis data menggunakan uji t berpasangan atau uji Mann Whitney.
Hasil: Pajanan sinar matahari selama satu bulan meningkatkan kadar vitamin D 25(OH) sebanyak 27,90% pada kelompok GD pajanan (15,34 ng/mL ke 19,62 ng/mL, p<0,001), sementara kadar vitamin D kelompok GD non-pajanan turun dari 20,48 ng/mL menjadi 18,86 ng/mL (p<0,001). Dari dua kelompok, kenaikan kadar vitamin D 25(OH) kelompok GD pajanan tidak diiringi dengan peningkatan kadar IL-4 setelah pajanan matahari.
Kesimpulan: Pajanan sinar matahari meningkatkan kadar vitamin D 25(OH) serum dan mempengaruhi kadar IL-4, sitokin jalur Th2, pada pasien GD. Peran vitamin D yang berasal dari pajanan sinar matahari pada kadar IFN-γ pasien GD tidak dapat disimpulkan dalam studi ini.
ABSTRACT
Background: Graves’ disease (GD) is the most common autoimmune disease leading to hyperthyroidism. The role of Th1/Th2 pathways balance in GD is still controversial. Vitamin D is reported to have an effect on those pathways. This study aims to examine the effect of sunlight exposure on vitamin D 25(OH) level and Th1 and Th2 pathway-derived cytokines in GD patients.
Methods: A prospective cohort study was conducted on 32 GD patients to compare the effect of sunlight exposure on vitamin D level and cytokines of Th1 and Th2 pathways between exposed and unexposed groups. Exposed group received sunlight exposure three times a week for 30 minutes each between 9–11 a.m for 1 month. Thyroid stimulating hormone (TSH), free thyroxin (fT4), vitamin D 25(OH), interferon-γ (IFN-γ) and interleukin-4 (IL-4) serum levels, were investigated before and after one month of sunlight exposure. Paired t-test or Mann Whitney test were used to analyze the difference between exposed and unexposed GD groups before and after sun exposure.
Results: One month of sunlight exposure increased vitamin D 25(OH) level by 27.90% among exposed GD group (15.34 ng/mL to 19.62 ng/mL, p<0.001). Meanwhile, unexposed GD group’s vitamin D 25(OH) level decreased from 20.48 ng/mL to 18.86 ng/mL (p<0.001). Increased vitamin D 25(OH) level in exposed group was not accompanied by the increase of IL-4 level after sunlight exposure.
Conclusion: Sunlight exposure increases vitamin D 25(OH) serum level and may affect the level of IL-4, Th2 pathway-derived cytokine, in patients with GD. However, the role of sunlight-derived vitamin D on IFN-γ in GD patients can not be concluded in this study.

Purnamasari, et al.Effect of sunlight on Graves’ disease
229
Graves’ disease (GD) is the most common cause of hyperthyroidism and is the second most prevalent endocrine diagnosis after diabetes mellitus. Its prevalence is higher among female than that of male (0.5–2% vs 0.2%).1 GD may affect upon all age groups, but the peak age is 20–49 years old. The incidence of GD is estimated to be 0.8/1,000 per year.2
Hyperthyroidism in GD was caused by autoantibody binding to thyroid stimulating hormone receptor (TSHR) on basolateral membrane of thyroid epithelium. When TSHR is stimulated, thyroid hormone will be secreted in excessive amount, causing hyperthyroidism.3 Until now, the pathogenesis of GD has not been fully defined. The combined effect of environmental factors and genetic predisposition is believed to disrupt the tolerance toward self-antigen, resulting in autoimmune reaction. The regulation of immune system involves balanced work of T helper 1 (Th1) and T helper 2 (Th2) pathways. Both Th1 and Th2 pathways secrete different kinds of cytokines which have significant roles in the pathogenesis of diseases, including autoimmune diseases. These two cell types directly affect immune response via different pathways. Th1 pathway cytokines, interferon-γ (IFN-γ), tumor necrosis factor-α (TNF-α), interleukin-2 (IL-2), contribute to cellular immunity responsible for fighting viruses and other intracellular pathogens, eliminating cancer cells and stimulating slow-type hypersensitivity reaction on the skin. Th2 pathway cytokines (IL-4, IL-5, IL-6, IL-9, IL-10, IL-13) are more dominant in humoral immunity, regulating the production of antibodies to fight organisms outside the cell. Excessive activity of either pathway may lead to disruption of the other.4
Cytokines are considered as environmental factors which may play important role in the natural history of GD. Cytokines of both Th1 and Th2 pathways in hyperthyroidism have been studied, both in animal model and human. Several studies in human showed that Th2 pathway is predominant in GD, although both of those pathways were said to have similar role in animal model. A study by Nagayama et al5 showed roles of Th1 pathway cytokine (IFN-γ) and Th2 pathway cytokine (IL-4) in hyperthyroidism in two different animal models (TSHR-adeno model vs. TSHR-M12 model). As opposed to Nagayama et al5 a study done by Phenekos, et al6 showed that GD patients had higher Th2 pathway cytokine (IL-4) level than IL-4 level in Hashimoto thyroiditis
patients. Several factors contribute to the activities of Th1/Th2, one of them is vitamin D.
Active form of vitamin D, calcitriol (1.25-dihydroxyvitamin D3), affects the action of T lymphocytes by inhibiting Th1 proliferation which leads to decrease on macrophage activation and IFN-γ and IL-2 production. Meanwhile, calcitriol increases the amount of Th2 cells by facilitating dendritic cells/antigen presenting cells (APCs) to produce cytokines (IL-4, IL-5, IL-10) that support T cell differentiation towards Th2.7,8
As immune regulator, low vitamin D level is related to a number of autoimmune diseases, one of them being GD.7 The study of Yamashita et al9 revealed that vitamin D 25(OH) level was lower in patients with GD compared to that of healthy subjects. Furthermore, vitamin D 25(OH) level in female patients with GD was lower than in male patients (31.8±13.3 vs 41.3±15.0 nmol/L, p<0.001). This finding was strengthened by the study of Yasuda et al10 which showed significantly lower vitamin D 25(OH) serum level in GD patients who did not have remission compared to those in patients with remission, or normal subjects (14.5±2.9 ng/mL in non-remission vs 18.2±5.1 ng/mL in remission p<0.005).10 Both studies suggest the role of vitamin D level in the pathogenesis of GD.
Eventhough, patients with GD are known to have lower vitamin D 25(OH) level than that of healthy subjects and vitamin D theoretically plays a role in the activity of Th1 and Th2 pathways, the benefit of vitamin D intervention in altering the action of Th1 and Th2 in GD has not been identified. This study was aimed to determine vitamin D 25(OH) serum level in patients with GD and examine the effect of sunlight exposure as natural vitamin D source on vitamin D 25(OH) serum level and Th1/Th2 pathway-derived cytokines (IFN-γ and IL-4) level.
METHODS
A prospective cohort was conducted from June to December 2013 (including study preparation, data sampling, and data analysis) in Endocrinology Metabolism and Diabetes Clinic, Dr. Cipto Mangunkusumo Hospital (CMH), a General Hospital in Jakarta, Indonesia. A total of 32 patients with GD were recruited. Diagnosis of GD was made based on clinical
Medical Journal of Indonesia
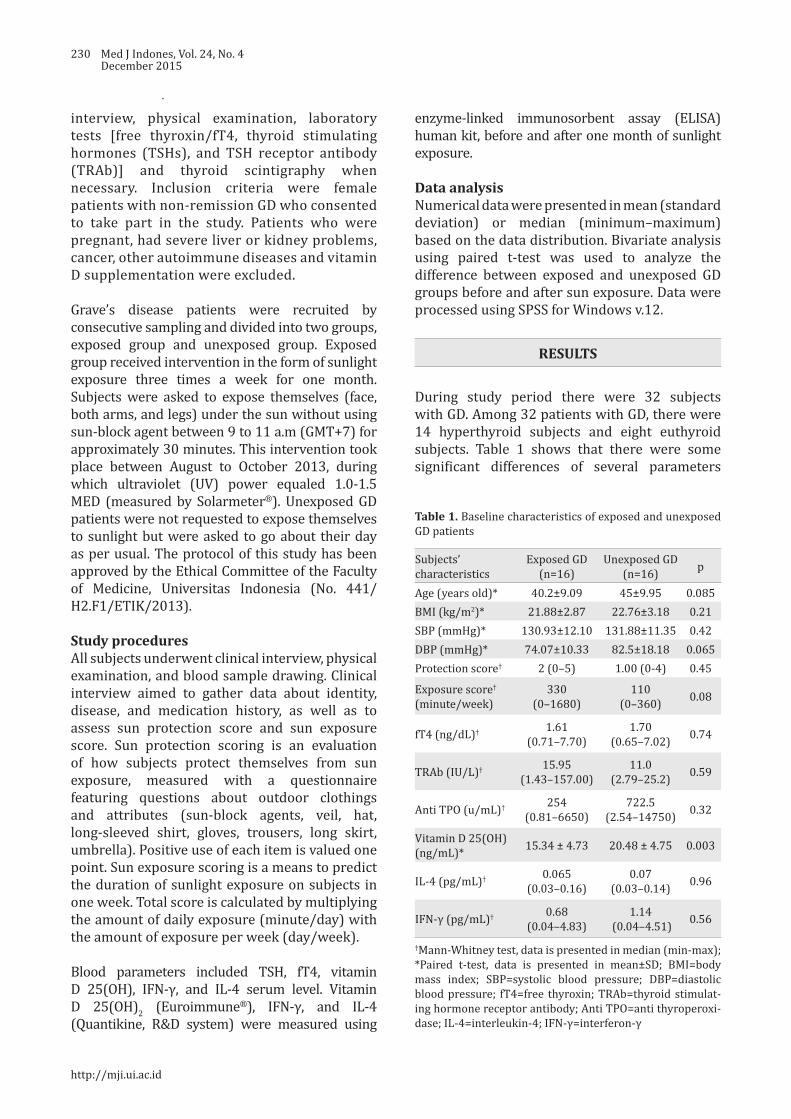
230 Med J Indones, Vol. 24, No. 4December 2015
interview, physical examination, laboratory tests [free thyroxin/fT4, thyroid stimulating hormones (TSHs), and TSH receptor antibody (TRAb)] and thyroid scintigraphy when necessary. Inclusion criteria were female patients with non-remission GD who consented to take part in the study. Patients who were pregnant, had severe liver or kidney problems, cancer, other autoimmune diseases and vitamin D supplementation were excluded.
Grave’s disease patients were recruited by consecutive sampling and divided into two groups, exposed group and unexposed group. Exposed group received intervention in the form of sunlight exposure three times a week for one month. Subjects were asked to expose themselves (face, both arms, and legs) under the sun without using sun-block agent between 9 to 11 a.m (GMT+7) for approximately 30 minutes. This intervention took place between August to October 2013, during which ultraviolet (UV) power equaled 1.0-1.5 MED (measured by Solarmeter®). Unexposed GD patients were not requested to expose themselves to sunlight but were asked to go about their day as per usual. The protocol of this study has been approved by the Ethical Committee of the Faculty of Medicine, Universitas Indonesia (No. 441/H2.F1/ETIK/2013).
Study proceduresAll subjects underwent clinical interview, physical examination, and blood sample drawing. Clinical interview aimed to gather data about identity, disease, and medication history, as well as to assess sun protection score and sun exposure score. Sun protection scoring is an evaluation of how subjects protect themselves from sun exposure, measured with a questionnaire featuring questions about outdoor clothings and attributes (sun-block agents, veil, hat, long-sleeved shirt, gloves, trousers, long skirt, umbrella). Positive use of each item is valued one point. Sun exposure scoring is a means to predict the duration of sunlight exposure on subjects in one week. Total score is calculated by multiplying the amount of daily exposure (minute/day) with the amount of exposure per week (day/week).
Blood parameters included TSH, fT4, vitamin D 25(OH), IFN-γ, and IL-4 serum level. Vitamin D 25(OH)2 (Euroimmune®), IFN-γ, and IL-4 (Quantikine, R&D system) were measured using
enzyme-linked immunosorbent assay (ELISA) human kit, before and after one month of sunlight exposure.
Data analysisNumerical data were presented in mean (standard deviation) or median (minimum–maximum) based on the data distribution. Bivariate analysis using paired t-test was used to analyze the difference between exposed and unexposed GD groups before and after sun exposure. Data were processed using SPSS for Windows v.12.
RESULTS
During study period there were 32 subjects with GD. Among 32 patients with GD, there were 14 hyperthyroid subjects and eight euthyroid subjects. Table 1 shows that there were some significant differences of several parameters
Subjects’ characteristics
Exposed GD(n=16)
Unexposed GD(n=16) p
Age (years old)* 40.2±9.09 45±9.95 0.085BMI (kg/m2)* 21.88±2.87 22.76±3.18 0.21SBP (mmHg)* 130.93±12.10 131.88±11.35 0.42DBP (mmHg)* 74.07±10.33 82.5±18.18 0.065Protection score† 2 (0–5) 1.00 (0-4) 0.45
Exposure score† (minute/week)
330 (0–1680)
110 (0–360) 0.08
fT4 (ng/dL)† 1.61 (0.71–7.70)
1.70 (0.65–7.02) 0.74
TRAb (IU/L)† 15.95 (1.43–157.00)
11.0 (2.79–25.2) 0.59
Anti TPO (u/mL)† 254 (0.81–6650)
722.5 (2.54–14750) 0.32
Vitamin D 25(OH) (ng/mL)* 15.34 ± 4.73 20.48 ± 4.75 0.003
IL-4 (pg/mL)† 0.065 (0.03–0.16)
0.07 (0.03–0.14) 0.96
IFN-γ (pg/mL)† 0.68 (0.04–4.83)
1.14 (0.04–4.51) 0.56
†Mann-Whitney test, data is presented in median (min-max); *Paired t-test, data is presented in mean±SD; BMI=body mass index; SBP=systolic blood pressure; DBP=diastolic blood pressure; fT4=free thyroxin; TRAb=thyroid stimulat-ing hormone receptor antibody; Anti TPO=anti thyroperoxi-dase; IL-4=interleukin-4; IFN-γ=interferon-γ
Table 1. Baseline characteristics of exposed and unexposed GD patients
http://mji.ui.ac.id

Purnamasari, et al.Effect of sunlight on Graves’ disease
231
between exposed GD group and unexposed GD groups before this study commenced. At the beginning of study, exposed GD group had higher sun exposure score, but lower vitamin D 25(OH) level compared to unexposed GD group.
Vitamin D, IL-4 and IFN-γ level before and after sun exposure in GD groupThough at the beginning of this study, the vitamin D 25(OH) level of exposed GD group was lower than unexposed GD group, it increased in GD group after one month of sun exposure, while it decreased in unexposed group (Figure 1).
At the end of the study, cytokine IL-4 significantly increased in unexposed GD group, but did not increase in exposed GD group. Both exposed GD and unexposed GD had significantly higher IFN-γ levels at the end of this study (Figures 2
Figure 1. Vitamin D 25(OH) level pre- and post- sun expo-sure in exposed and unexposed GD Groups
Figure 2. IL-4 level pre- and post- sun exposure in exposed and unexposed GD groups
Figure 3. IFN-γ level pre- and post- study period in exposed and unexposed GD groups. The IFN-γ level increased signifi-cantly in both groups after one month
and 3). DISCUSSION
Graves’ disease patients with normal hormone level were included as subjects to examine the effect of sunlight exposure to varying GD population in outpatients of CMH. Mean age of subjects with GD is around 42 years old. This finding is linear to Vanderpump2 data which showed peak age of GD incidence to be from 20 to 49 years old.2 In Japan, Yamashita et al9 and Yasuda et al10 study showed mean age of 37 to 39 years old.
In this study, vitamin D level of exposed and unexposed groups are 15.34±4.73 ng/mL and 20.48±4.75 ng/mL respectively. This finding is similar to the results of studies done in Japan. Yamashita et al9 showed that vitamin D level of male and female GD subjects are 16.54±6.00 and 12.74±5.33 ng/mL. Yasuda et al10 also showed that vitamin D level of new onset female GD patients of 14.4±4.9 ng/mL.
Vitamin D 25(OH) and Th1 and Th2 pathway-derived cytokines among GD groupExposed GD group had lower vitamin D 25(OH) level compared to unexposed GD group at the initiation of this study, but there were no differences found regarding IFN-γ and IL-4 levels between exposed and unexposed GD groups.
After one month of sunlight exposure, vitamin D 25(OH) level in exposed GD group increased from 15.34 ng/mL to 19.62 ng/mL, while it did not increase in unexposed GD group (20.48 ng/mL
Medical Journal of Indonesia

232 Med J Indones, Vol. 24, No. 4December 2015
to 18.86 ng/mL). Although both groups did not have similar range of vitamin D 25(OH), sunlight exposure to exposed GD group may elevate vitamin D 25(OH) level significantly while in unexposed GD group this vitamin D 25(OH) level diminished instead. This finding is in line with the study of Setiati et al11 on elderly population in Jakarta, which showed that three times weekly sunlight exposure for 30 minutes each at one MED might significantly increase vitamin D 25(OH) level by 42.37% among elderly people who live in institutionalized care. Our study showed that the same method of sunlight exposure was associated with an increase of vitamin D 25(OH) level in GD patients by 27.90%.
While Th1 and Th2-derived cytokines profiles have been reported several times, the effect of sunlight exposure on GD patients through vitamin D 25(OH) level has not been yet reported. After one month of sunlight exposure, IL-4 level did not increase in exposed GD group (0.07 pg/mL to 0.08 pg/mL, p=0.293), while it significantly increased in unexposed GD group (0.07 pg/mL to 0.32 pg/mL, p=0.001). Non-increase of IL-4 level in exposed GD patients may be related to elevated vitamin D 25(OH) level in response to sunlight exposure. Vitamin D promotes Th2 cytokines pathway, however several studies reported inconsistency. Based on our study, vitamin D tends to be an immune balancer, which will suppress the overactive pathways. Since there is predominance of Th2 cytokines pathway in GD, vitamin D will prevent the increment of Th2 cytokines pathway. Up until now, there is no study which reported the inverse relationship between vitamin D and IL-4 level. Nonetheless, a longer observasional cohort study using more sensitive tool is needed to evaluate the effect of vitamin D 25(OH) on IL-4 cytokine.
After one month of sunlight exposure, IFN-γ level elevated significantly, in both exposed GD and unexposed GD groups (Figure 3). The elevation of IFN-γ level can not be clearly explained in this study. Among exposed GD patients, the elevation of IFN-γ level could be due to the suppression effect of sunlight-derived vitamin D on Th2 pathway.
To the best of our knowledge, the study about the effect of sunlight exposure, on vitamin D 25(OH) and Th1/Th2 pathways-derived cytokines levels has not been yet reported. Although one month
intervention using sunlight exposure increased vitamin D 25(OH) level in GD group, this study could not show direct effect of sunlight to Th1 and Th2 pathway cytokines. Out of two groups, there was only in exposed GD group that increasing level of vitamin D 25(OH) not accompanied by IL-4 level increment after one month of sunlight exposure. This finding showed the likelihood of sunlight effect on Th2-derived cytokines through vitamin D 25(OH) level.
This study has some limitation in terms of study subjects and sampling technique. Inclusion of GD subjects with normal fT4 at the beginning of the study hinders optimal results to represent patients with active hyperthyroidism. Consecutive recruitment of study subjects has lead to non-balance distribution in the two groups. Patients who wanted to participate but could not follow the exposure program were allocated for unexposed group. Sampling strategy for cytokine testing (serum, monocyte isolates, or peripheral blood mononuclear cell/PBMC) also affects study results. Cytokine analysis on blood serum is inferior because Th1/Th2 cytokines are also produced by other immune cells (CD8+, B cells, macrophages), therefore rendered unspecific.
In conclusion, sunlight exposure increases vitamin D serum level and may affect the level of IL-4, Th2 pathway-derived cytokine, in patients with GD. The role of sunlight-derived vitamin D on IFN-γ, Th1 pathway-derived cytokine, in GD patients can not be concluded in this study.
AcknowledgmentsThis study is supported by research grant of Universitas Indonesia, 2013. The content is solely the responsibility of authors and does not necessarily represent general view of Universitas Indonesia.
Conflict of interestsThe authors affirm no conflict of interest in this study.
REFERENCES
1. Orgiazzi J. Thyroid autoimmunity. Presse Med. 2012;41(12P2):e611–25.
2. Vanderpump MP. The epidemiology of thyroid disease. Br Med Bull. 2011;99:39–51.
http://mji.ui.ac.id
Purnamasari, et al.Effect of sunlight on Graves’ disease
233
3. Prabhakar BS, Bahn RS, Smith TJ. Current perspective on the pathogenesis of Graves’ disease and ophthalmopathy. Endocr Rev. 2003;24(6):802–35.
4. Kidd P. Th1/Th2 balance: The hypothesis, its limitations, and implications for health and disease. Altern Med Rev. 2003;8(3):223–46.
5. Nagayama Y, Saitoh O, Mclachlan SM, Rapoport B, Kano H, Kumazawa Y. TSH receptor-adenovirus-induced Graves’ hyperthyroidism is attenuated in both interferon-gamma and interleukin-4 knockout mice; implication for the Th1/Th2 paradigm. Clin Exp Immunol. 2004;138(3):417–22.
6. Phenekos C, Vryonidou A, Gritzapis AD, Baxevanis CN, Goula M, Papamichail M. Th1 and Th2 serum cytokine profiles characterize patients with Hashimoto’s thyroiditis (Th1) and Graves’ disease (Th2). Neuroimmunomodulation. 2004;11(4):209–13.
7. Wahono CS, Rusmini H, Soelistyoningsih D, Hakim R, Handono K, Endharti AT, et al. Effects of 1,25(OH)2D3 in immune response regulation of systemic lupus
erithematosus (SLE) patient with hypovitamin D. Int J Clin Exp Med. 2014;7(1):22–31.
8. Antico A, Tampoia M, Tozzoli R, Bizzaro N. Can supplementation with vitamin D reduce the risk or modify the course of autoimmune disease? A systematic review of the literature. Autoimmun Rev. 2012;12(2):127–36.
9. Yamashita H, Noguchi S, Takatsu K, Koike E, Murakami T, Watanabe S, et al. High prevalence of vitamin D deficiency in Japanese female patients with Graves’ disease. Endocr J. 2001;48(1):63–9.
10. Yasuda T, Okamoto Y, Hamada N, Miyashita K, Takahara M, Sakamoto F, et al. Serum vitamin D levels are decreased in patients without remission of Graves’ disease. Endocrine. 2013;43(1):230–2.
11. Setiati S, Oemardi M, Sutrisna B, Supartondo. The role of ultraviolet-B from sun exposure on vitamin D3 and parathyroid hormone level in elderly women in Indonesia. Asian J Gerontol Geriatr. 2007;2:126–32.
Medical Journal of Indonesia
234 Med J Indones, Vol. 24, No. 4December 2015
Urinary stone characteristics of patients treated with extracorporeal shock wave lithotripsy in Cipto Mangunkusumo Hospital Jakarta, 2008–2014: a gender analysis
Keywords: ESWL, female, male, urinary stone, urolithiasis
pISSN: 0853-1773 • eISSN: 2252-8083 • http://dx.doi.org/10.13181/mji.v24i4.1258 • Med J Indones. 2015;24:234–8• Received 25 Jun 2015 • Accepted 30 Dec 2015
Correspondence author: Endrika Noviandrini, [email protected]
Copyright @ 2015 Authors. This is an open access article distributed under the terms of the Creative Commons Attribution-NonCommercial 4.0 International License (http://creativecommons.org/licenses/by-nc/4.0/), which permits unrestricted non-commercial use, distribution, and reproduction in any medium, provided the original author and source are properly cited.
Endrika Noviandrini, Ponco Birowo, Nur RasyidDepartment of Urology, Faculty of Medicine, Universitas Indonesia, Cipto Mangunkusumo Hospital, Jakarta, Indonesia
Clinical Research
Medical Journal of Indonesia
ABSTRAK
Latar belakang: Pasien dengan batu saluran kemih di Indonesia terus meningkat setiap tahunnya di kedua gender. Data menunjukkan insiden penyakit batu saluran kemih umumnya di temukan lebih tinggi pada pria dibandingkan wanita. Tujuan dari penelitian ini untuk mengetahui karakteristik dari Pasien dengan batu saluran kemih, baik pria maupun wanita yang menjalani extracorporeal shock wave lithotripsy (ESWL) di Rumah Sakit Cipto Mangunkusumo (RSCM), Jakarta tahun 2008–2014.
Metode: Penelitian ini menggunakan data dari rekam medis pasien ESWL tahun 2008–2014 di RSCM Jakarta. Kami mengambil 5.174 dari 6.020 data, dikarenakan ketidaklengkapan status. Data kemudian di sortir berdasarkan jenis kelamin, usia, lokasi batu, opasitas batu, ukuran batu, riwayat ESWL pada pasien dan dianalisis menggunakan SPSS v.20 untuk Mac.
Hasil: Dari 5.174 data, didapatkan insiden Pasien dengan batu saluran kemih pada pria dua kali lebih besar dibanding wanita (66,3%:33,6%) dan terjadi pada usia produktif (65,2% pria dan 65.9% wanita). Batu ginjal unilateral menjadi batu yang paling banyak ditemukan di kedua gender (50,2% pria dan 57,2% wanita) dengan lokasi yang terbanyak yaitu kaliks inferior (24,8% pria dan 28,9% wanita). Sebanyak 72,9% merupakan batu radioopak (73,7% pria dan 71,5% wanita). Rerata ukuran panjang batu pada pasien pria dan wanita adalah 11,34±7,15 mm dan 11,90±7,54 mm, secara berurutan. Penelitian ini juga menunjukkan bahwa 79,3% pasien datang untuk terapi ESWL pertama.
Kesimpulan: Batu saluran kemih ditemukan dua kali lebih tinggi pada pria dibandingkan wanita dan terjadi pada usia produktif. Batu ginjal unilateral yang berlokasi di kaliks inferior menjadi batu yang paling banyak di temukan di kedua gender. Sebagian besar batu merupakan batu radio opak.
ABSTRACT
Background: The incidence of urinary stone patient in Indonesia has increased every year in both genders. Data showed that urolithiasis was higher in male rather than female. The aimed of this study was to describe the characteristics of urinary stone found in patient who underwent extracorporeal shock wave lithotripsy (ESWL) at Cipto Mangunkusumo Hospital, Jakarta from 2008–2014.
Methods: Data obtained from ESWL medical record Cipto Mangunkusumo Hospital, Jakarta from 2008–2014. We obtained 5,174 out of 6,020 data due to incompleteness data record. We sorted data records by gender, age, stone location, stone opacity, size of the stone, and history of ESWL, and analyzed by statistic tools (SPSS v 20 for Mac).
Results: From 5,174 records, we found that the incidence of urinary stones was two times higher in male rather than female (66.3%:33.64%), occurred mostly in productive age (65.2% male, 65.9% female). Unilateral kidney stone was most common location found for both gender (50.2% male, 57.2% female), and most frequent site located in calyx inferior (24.8% male, 28.9% female). About 72.9% stone was radiopaque (73.7% male and 71.5% female). The mean size of the stone in male and female was 11.34±7.15 mm and 11.90±7.54 mm, respectively. This study also showed that 79.3% patients came for first ESWL.
Conclusion: Urinary stone founds two times higher in male than female, and mostly occurs on their productive ages. Unilateral kidney stone in calyx inferior become the most common stone found in both gender. Most of the stone has radiopaque opacity.
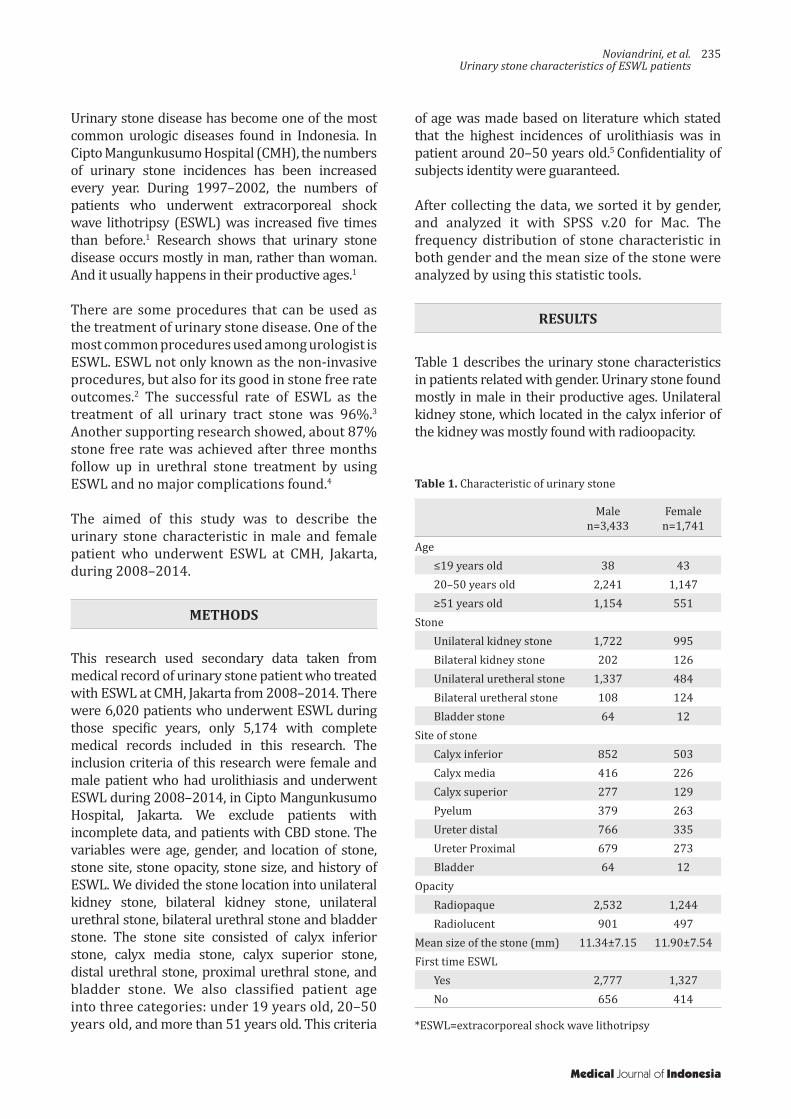
Noviandrini, et al.Urinary stone characteristics of ESWL patients
235
Urinary stone disease has become one of the most common urologic diseases found in Indonesia. In Cipto Mangunkusumo Hospital (CMH), the numbers of urinary stone incidences has been increased every year. During 1997–2002, the numbers of patients who underwent extracorporeal shock wave lithotripsy (ESWL) was increased five times than before.1 Research shows that urinary stone disease occurs mostly in man, rather than woman. And it usually happens in their productive ages.1
There are some procedures that can be used as the treatment of urinary stone disease. One of the most common procedures used among urologist is ESWL. ESWL not only known as the non-invasive procedures, but also for its good in stone free rate outcomes.2 The successful rate of ESWL as the treatment of all urinary tract stone was 96%.3
Another supporting research showed, about 87% stone free rate was achieved after three months follow up in urethral stone treatment by using ESWL and no major complications found.4
The aimed of this study was to describe the urinary stone characteristic in male and female patient who underwent ESWL at CMH, Jakarta, during 2008–2014.
METHODS
This research used secondary data taken from medical record of urinary stone patient who treated with ESWL at CMH, Jakarta from 2008–2014. There were 6,020 patients who underwent ESWL during those specific years, only 5,174 with complete medical records included in this research. The inclusion criteria of this research were female and male patient who had urolithiasis and underwent ESWL during 2008–2014, in Cipto Mangunkusumo Hospital, Jakarta. We exclude patients with incomplete data, and patients with CBD stone. The variables were age, gender, and location of stone, stone site, stone opacity, stone size, and history of ESWL. We divided the stone location into unilateral kidney stone, bilateral kidney stone, unilateral urethral stone, bilateral urethral stone and bladder stone. The stone site consisted of calyx inferior stone, calyx media stone, calyx superior stone, distal urethral stone, proximal urethral stone, and bladder stone. We also classified patient age into three categories: under 19 years old, 20–50 years old, and more than 51 years old. This criteria
of age was made based on literature which stated that the highest incidences of urolithiasis was in patient around 20–50 years old.5 Confidentiality of subjects identity were guaranteed.
After collecting the data, we sorted it by gender, and analyzed it with SPSS v.20 for Mac. The frequency distribution of stone characteristic in both gender and the mean size of the stone were analyzed by using this statistic tools.
RESULTS
Table 1 describes the urinary stone characteristics in patients related with gender. Urinary stone found mostly in male in their productive ages. Unilateral kidney stone, which located in the calyx inferior of the kidney was mostly found with radioopacity.
Malen=3,433
Femalen=1,741
Age≤19 years old 38 4320–50 years old 2,241 1,147≥51 years old 1,154 551
StoneUnilateral kidney stone 1,722 995Bilateral kidney stone 202 126Unilateral uretheral stone 1,337 484Bilateral uretheral stone 108 124Bladder stone 64 12
Site of stoneCalyx inferior 852 503Calyx media 416 226Calyx superior 277 129Pyelum 379 263Ureter distal 766 335Ureter Proximal 679 273Bladder 64 12
OpacityRadiopaque 2,532 1,244Radiolucent 901 497
Mean size of the stone (mm) 11.34±7.15 11.90±7.54First time ESWL
Yes 2,777 1,327No 656 414
Table 1. Characteristic of urinary stone
*ESWL=extracorporeal shock wave lithotripsy
Medical Journal of Indonesia

236 Med J Indones, Vol. 24, No. 4December 2015
DISCUSSION
There are many contributing factors for the risk of stone formation such as race, environment, gender, and age.2 Distribution of stone varies among races. Renal stones are more common in Caucasians and Asians than Native Americans and Afro Caribbeans.6 Incidences of urinary stone disease was higher in hot or dry climates.7
Gender is also related to the incidence of urinary tract stone. Our study results showed that the prevalence of urinary tract stone in Indonesia was higher in male rather than female, with the ratio 2:1. This finding was also supported by literature, which stated that urinary tract stone occurs mostly in male5. The same study has been done in Israel, China, and Taiwan for the past five years and came up with the similar result.7-9 In the other hand, a research conducted in Florida on 2010 found that nowadays the incidence of stone disease among woman might be increased. There is a changing pattern in urinary tract stone prevalence. Female also has the same risk of getting urinary tract stone like male.10
Anatomy of the urinary tract, obesity, dietary life, urine composition, and hormonal factors may be considered as the factors which can explaine why the incidences of urinary stone was higher in male. Male urinary tract has more narrow places than female. This narrow places are lead to the higher risk of stone formation due to urine precipitation.11 The most common locations for urinary stone formation are ureteropelvic junctions, mid ureter (ureter crosses over iliac bone), ureter crosses over the iliac blood vessels, ureter bladder junction, and when the ureter under the uterine artery passes (for female).5
Obesity, dietary life, and fluid consumption also play some role in stone formation process. Studies in United States in 2011 found that obese females were more likely to develop stones than non-obese females. But the correlation between obesity and stones was weaker in males rather than the female.12 Negri et al13 also found that in female with high body mass index (BMI) tend to have an increasing number of oxalate, uric acid, phosphorus, creatinine, and sodium excretion. The same result found in male subject but potassium, urea, magnesium, and citrate excretion was also
increased in this gender.13 Eating habit, like high animal protein consumption, low carbohydrate, high salt, and low calcium dietary habits, may contribute to the stone formation process in male.5 Eating vegetable and fiber, and limit animal protein consumption to 0.8-1.0 g/kg/day are recommended to inhibit stone formation.14 Fluid intake also related to the risk of kidney stone formation15. It was suggested in the guidelines to drink 2.5-3.0 L/day or to drink until the amount of diuresis reached 2.0-2.5 L/day, to prevent the stone recurrences. Beverages with neutral pH is recommend for this prevention tips.14 Coffee, tea, alcohol, and milk may decreased urinary concentration.16
Urine composition is related to calculogenesis process in human. A study about biochemical composition of urine was conducted in India, by using two hours urine collection. The result of that study found that male had higher risk in getting urinary stone due to higher excretion of calcium and oxalate, with low concentrations of citrate.17
Sex hormones also have some role in stone formation process. Estrogen inhibits excretion of calcium and oxalate, and increase citrate production.18 Study done by Sarada et al17 reported that testosterone decreased citrate excretion. Another study in animal also showed oxalate excretion was increased by the administration of testosteron.17 In addition protective effect of estrogen in premenopausal woman, could enhanced renal calcium absorption and reduced bone resorption.15
This might also explained why age was related with stone formation process. In this study, found that the highest incidence age of urinary stone, was between 20–50 years old. This result also supported by literature which stated that the highest incidence of urinary stone usually found in the fourth to sixth decades of life. And in female patients, the second peak reached during the menopausal era.15 Loss of estrogen effect and increased of calcium excretion in postmenopausal woman may explained this condition.17 The reason why urinary stone disease mostly found in productive ages still remains uncertain. However, social economic differences, cultures, and dietary life considered as the explanation.19
http://mji.ui.ac.id

Noviandrini, et al.Urinary stone characteristics of ESWL patients
237
In this study, unilateral kidney stone which located in the calyx inferior, was the most common stone found in both gender. The correlation between location and stone formation remain uncertain, but narrow places in human urinary tract increased the risk of urine precipitation.5 The incidence of bladder stone found higher in male because in elderly male, bladder stone might develop due to the growth of the prostate or due to benign prostatic hyperplasia.11
The data result also showed that most of the stone found in both gender was radioopaque, which usually related to calcium oxalate, calcium phosphate and struvite stones. Calcium oxalate stone found about 60% in all types of calculi stones.6 Study by Gault and Chafe20 stated that in the third decade, the highest number type of stone found in female was phosphate stone and oxalate stone in male.
The mean size of the stone found in the study was 11.34±7.15 mm for male patients and 11.90±7.54 mm for female patients. ESWL found to be the most suitable treatment for this size of stone.21
From the guidelines ESWL is the first treatment chosen for kidney stone with size 10–20 mm.22
There are many factors which correlate with successful rate of ESWL such as size, composition, consistency of the stone and elimination process after the treatment.23 In this research, most of the patients came for the first treatment (80.8% in male and 76.2% in female), but some patients had already done it before. This might be due to the size and the composition of the stone. But, further information about stone composition and stone hounsfield unit are needed. Recent studies have shown that stone made of calcium oxalate dihydrate are easier to break rather than uric acid stone.3 Studies made by Tarawneh stated that there were positive correlation between stone size and number of ESWL treatment.23 This study result also showed, that the number of male patients who come for continued treatment was higher than female patients. This result may be correlate with literature which stated that the recurrences of urinary stone occurs higher in male rather than female.5
The weakness of this study was incomplete data records which was found especially on the year of 2008. We solved this problem by increasing
the quality of medical record documentation with the result of better medical record during 2009–2014.
In conclusion, this research showed that in CMH, Jakarta, from 2008–2014, most of the patients who had urinary tract stone and underwent ESWL were male. The most common location found in both gender was unilateral kidney stone with calyx inferior as the specific site. Most of the patients had radioopaque imaging and calcium oxalate stone considered as the highest type of stone found in this study.
Conflict of interestThe authors affirm no conflict of interest in this study.
REFERENCES
1. Rahardjo D, Hamid R. Perkembangan penatalaksanaan batu ginjal di RSCM tahun 1997–2002. J I Bedah Indones. 2004;32(2):58–63. Indonesian.
2. Politis G, Griffith DP. ESWL: stone-free efficacy based upon stone size and location. World J Urol. 1987;5:255–8.
3. Junuzovic D, Prstojevic JK, Hasanbegovic M, Lepara Z. Evaluation of extracorporeal shock wave lithotripsy (ESWL): efficacy in treatment of urinary system stones. Acta Inform Med. 2014;22(5):309–14.
4. Elkholy MM, Ismail H, Abdelkhalek MA, Badr MM, Elfeky MM. Efficacy of extracorporeal shockwave lithotripsy using Dornier SII in different levels of ureteral stones. Urol Ann. 2014;6(4):346–51.
5. Menon M.Parulkar BG, Drach GW. Urinary lithiasis: etiology, diagnosis, and medical management. In: Walsh CP, Retik AB, Vaughan ED, Wein AJ, editors. Campbell’s urology. 7th ed. Philadelphia: WB Saunders; 1998. p. 2662–5.
6. Pal RP, Mellon JK. Renal Stone Disease. Foundation Years. 2008;4(5):199–203.
7. Kalbu DU, Golan S, Livne PM, Pode D, Duvdevani M, Lifshitz D. Urinary stone composition in Israel: current status and variation with age and gender-A bicenter study. J Endourol. 2013;27(12):1539–42.
8. Wu W, Yang B, Ou L, Liang Y, Wan S, Li S, et al. Urinary stone analysis on 12,846 patients: a report from a single center in China. Urolithiasis. 2014;42(1):39–43.
9. Huang WY, Chen YF, Carter S, Chang HC, Lan CF, Huang KH. Epidemiology of upper urinary tract stone disease in a Taiwanese population: a nationwide, population based study. J Urol. 2013;189(6):2158–63.
Medical Journal of Indonesia

238 Med J Indones, Vol. 24, No. 4December 2015
10. Strope SA, Wolf JS Jr, Hollenbeck BK. Changes in gender distribution of urinary stone disease. Urology. 2010;75(3):543–6.
11. Burnett AL, Rodriguez R, Jarrett TW. Genitourinary system: male anatomy and physiologi. In: Greenfield LJ, Mulholland MW, Oldham KT, Zelenock GB, Lilimoe KD, editors. Essentials of Surgery Scientific Principles and Practice. 2nd
ed. New York: Lippincott Williams &
Wilkins; 1997. p.1111–8.12. Nowfar S, Pallazi-Churas K, Chang DC, Sur RL. The
relationship of obesity and gender prevalence changes in United States inpatient nephrolithiasis. Urology. 2011;78(5):1029–33.
13. Negri AL, Spivacow FR, Del Valle EE, Forrester M, Rosende G, Pinduli I. Role of overweight and obesity on the urinary excretion of promoters and inhibitors of stone formation in stone formers. Urol Res. 2008;36(6):303–7.
14. Skolarikos A, Straub M, Knoll T, Sarica K, Seitz C, Petřík A, et al. Metabolic evaluation and recurrence prevention for urinary stone patients: EAU guidelines. Eur Urol. 2015;67(4):750–63.
15. Pearle MS, Lotan Y. Urinary lithiasis: etiology, epidemiology, and pathogenesis. In: Wein AJ, Kavoussi LR, editors. Campbell-Walsh Urology. Philadelphia: Elsevier Saunders; 2012. p.1257–60.
16. Taylor EN, Curhan GC. Diet and fluid prescription in stone disease. Kidney Int. 2006;70(5):835–9.
17. Sarada B, Satyanarayana U. Urinary composition in men and women and the risk of urolithiasis. Clin Biochem. 1991;24(6):487–90.
18. Kato Y, Yamaguchi S, Kakizaki H, Yachiku S. Influence of estrus status on urinary chemical parameters related to urolithiasis. Urol Res. 2005;33(6):476–80.
19. Eprints.undip.ac.id [Internet}. Semarang: Batu saluran kemih suatu problema gaya hidup dan pola makan serta analisis ekonomi pada pengobatannya. [update 2007 Mar 3; cited 2015 Jun 15]. Available from: http://eprints.undip.ac.id/340/1/rifki_muslim.pdf
20. Gault MH, Chafe L. Relationship of frequency, age, sex, stone weight and composition in 15,624 stones: comparison of results for 1980 to 1983 and 1995 to 1998. J Urol. 2000;164(2):302–7.
21. Renner C, Rassweiler J. Treatment of renal stones by extracorporeal shock wave lithotripsy. Nephron. 1999;81(suppl1):71–81.
22. Türk C, Knoll T, Petrik A, Sarica K, Seitz C, Straub M. Indication for active stone removal and selections of procedures. In: EAU Guidelines on Urolithiasis. 2014. p. 48. Available from: http://uroweb.org/wp-content/uploads/20-Urolithiasis.pdf
23. Tarawneh E, Awad Z, Hani A, Haroun AA, Hadidy A, Mahafza W, et al. Factors affecting urinary calculi treatment by extracorporeal shock wave lithotripsy. Saudi J Kidney Dis Transpl. 2010 Jul; 21(4):660–5.
http://mji.ui.ac.id

234 Med J Indones, Vol. 24, No. 4December 2015
Urinary stone characteristics of patients treated with extracorporeal shock wave lithotripsy in Cipto Mangunkusumo Hospital Jakarta, 2008–2014: a gender analysis
Keywords: ESWL, female, male, urinary stone, urolithiasis
pISSN: 0853-1773 • eISSN: 2252-8083 • http://dx.doi.org/10.13181/mji.v24i4.1258 • Med J Indones. 2015;24:234–8• Received 25 Jun 2015 • Accepted 30 Dec 2015
Correspondence author: Endrika Noviandrini, [email protected]
Copyright @ 2015 Authors. This is an open access article distributed under the terms of the Creative Commons Attribution-NonCommercial 4.0 International License (http://creativecommons.org/licenses/by-nc/4.0/), which permits unrestricted non-commercial use, distribution, and reproduction in any medium, provided the original author and source are properly cited.
Endrika Noviandrini, Ponco Birowo, Nur RasyidDepartment of Urology, Faculty of Medicine, Universitas Indonesia, Cipto Mangunkusumo Hospital, Jakarta, Indonesia
Clinical Research
Medical Journal of Indonesia
ABSTRAK
Latar belakang: Pasien dengan batu saluran kemih di Indonesia terus meningkat setiap tahunnya di kedua gender. Data menunjukkan insiden penyakit batu saluran kemih umumnya di temukan lebih tinggi pada pria dibandingkan wanita. Tujuan dari penelitian ini untuk mengetahui karakteristik dari Pasien dengan batu saluran kemih, baik pria maupun wanita yang menjalani extracorporeal shock wave lithotripsy (ESWL) di Rumah Sakit Cipto Mangunkusumo (RSCM), Jakarta tahun 2008–2014.
Metode: Penelitian ini menggunakan data dari rekam medis pasien ESWL tahun 2008–2014 di RSCM Jakarta. Kami mengambil 5.174 dari 6.020 data, dikarenakan ketidaklengkapan status. Data kemudian di sortir berdasarkan jenis kelamin, usia, lokasi batu, opasitas batu, ukuran batu, riwayat ESWL pada pasien dan dianalisis menggunakan SPSS v.20 untuk Mac.
Hasil: Dari 5.174 data, didapatkan insiden Pasien dengan batu saluran kemih pada pria dua kali lebih besar dibanding wanita (66,3%:33,6%) dan terjadi pada usia produktif (65,2% pria dan 65.9% wanita). Batu ginjal unilateral menjadi batu yang paling banyak ditemukan di kedua gender (50,2% pria dan 57,2% wanita) dengan lokasi yang terbanyak yaitu kaliks inferior (24,8% pria dan 28,9% wanita). Sebanyak 72,9% merupakan batu radioopak (73,7% pria dan 71,5% wanita). Rerata ukuran panjang batu pada pasien pria dan wanita adalah 11,34±7,15 mm dan 11,90±7,54 mm, secara berurutan. Penelitian ini juga menunjukkan bahwa 79,3% pasien datang untuk terapi ESWL pertama.
Kesimpulan: Batu saluran kemih ditemukan dua kali lebih tinggi pada pria dibandingkan wanita dan terjadi pada usia produktif. Batu ginjal unilateral yang berlokasi di kaliks inferior menjadi batu yang paling banyak di temukan di kedua gender. Sebagian besar batu merupakan batu radio opak.
ABSTRACT
Background: The incidence of urinary stone patient in Indonesia has increased every year in both genders. Data showed that urolithiasis was higher in male rather than female. The aimed of this study was to describe the characteristics of urinary stone found in patient who underwent extracorporeal shock wave lithotripsy (ESWL) at Cipto Mangunkusumo Hospital, Jakarta from 2008–2014.
Methods: Data obtained from ESWL medical record Cipto Mangunkusumo Hospital, Jakarta from 2008–2014. We obtained 5,174 out of 6,020 data due to incompleteness data record. We sorted data records by gender, age, stone location, stone opacity, size of the stone, and history of ESWL, and analyzed by statistic tools (SPSS v 20 for Mac).
Results: From 5,174 records, we found that the incidence of urinary stones was two times higher in male rather than female (66.3%:33.64%), occurred mostly in productive age (65.2% male, 65.9% female). Unilateral kidney stone was most common location found for both gender (50.2% male, 57.2% female), and most frequent site located in calyx inferior (24.8% male, 28.9% female). About 72.9% stone was radiopaque (73.7% male and 71.5% female). The mean size of the stone in male and female was 11.34±7.15 mm and 11.90±7.54 mm, respectively. This study also showed that 79.3% patients came for first ESWL.
Conclusion: Urinary stone founds two times higher in male than female, and mostly occurs on their productive ages. Unilateral kidney stone in calyx inferior become the most common stone found in both gender. Most of the stone has radiopaque opacity.

Noviandrini, et al.Urinary stone characteristics of ESWL patients
235
Urinary stone disease has become one of the most common urologic diseases found in Indonesia. In Cipto Mangunkusumo Hospital (CMH), the numbers of urinary stone incidences has been increased every year. During 1997–2002, the numbers of patients who underwent extracorporeal shock wave lithotripsy (ESWL) was increased five times than before.1 Research shows that urinary stone disease occurs mostly in man, rather than woman. And it usually happens in their productive ages.1
There are some procedures that can be used as the treatment of urinary stone disease. One of the most common procedures used among urologist is ESWL. ESWL not only known as the non-invasive procedures, but also for its good in stone free rate outcomes.2 The successful rate of ESWL as the treatment of all urinary tract stone was 96%.3
Another supporting research showed, about 87% stone free rate was achieved after three months follow up in urethral stone treatment by using ESWL and no major complications found.4
The aimed of this study was to describe the urinary stone characteristic in male and female patient who underwent ESWL at CMH, Jakarta, during 2008–2014.
METHODS
This research used secondary data taken from medical record of urinary stone patient who treated with ESWL at CMH, Jakarta from 2008–2014. There were 6,020 patients who underwent ESWL during those specific years, only 5,174 with complete medical records included in this research. The inclusion criteria of this research were female and male patient who had urolithiasis and underwent ESWL during 2008–2014, in Cipto Mangunkusumo Hospital, Jakarta. We exclude patients with incomplete data, and patients with CBD stone. The variables were age, gender, and location of stone, stone site, stone opacity, stone size, and history of ESWL. We divided the stone location into unilateral kidney stone, bilateral kidney stone, unilateral urethral stone, bilateral urethral stone and bladder stone. The stone site consisted of calyx inferior stone, calyx media stone, calyx superior stone, distal urethral stone, proximal urethral stone, and bladder stone. We also classified patient age into three categories: under 19 years old, 20–50 years old, and more than 51 years old. This criteria
of age was made based on literature which stated that the highest incidences of urolithiasis was in patient around 20–50 years old.5 Confidentiality of subjects identity were guaranteed.
After collecting the data, we sorted it by gender, and analyzed it with SPSS v.20 for Mac. The frequency distribution of stone characteristic in both gender and the mean size of the stone were analyzed by using this statistic tools.
RESULTS
Table 1 describes the urinary stone characteristics in patients related with gender. Urinary stone found mostly in male in their productive ages. Unilateral kidney stone, which located in the calyx inferior of the kidney was mostly found with radioopacity.
Malen=3,433
Femalen=1,741
Age≤19 years old 38 4320–50 years old 2,241 1,147≥51 years old 1,154 551
StoneUnilateral kidney stone 1,722 995Bilateral kidney stone 202 126Unilateral uretheral stone 1,337 484Bilateral uretheral stone 108 124Bladder stone 64 12
Site of stoneCalyx inferior 852 503Calyx media 416 226Calyx superior 277 129Pyelum 379 263Ureter distal 766 335Ureter Proximal 679 273Bladder 64 12
OpacityRadiopaque 2,532 1,244Radiolucent 901 497
Mean size of the stone (mm) 11.34±7.15 11.90±7.54First time ESWL
Yes 2,777 1,327No 656 414
Table 1. Characteristic of urinary stone
*ESWL=extracorporeal shock wave lithotripsy
Medical Journal of Indonesia
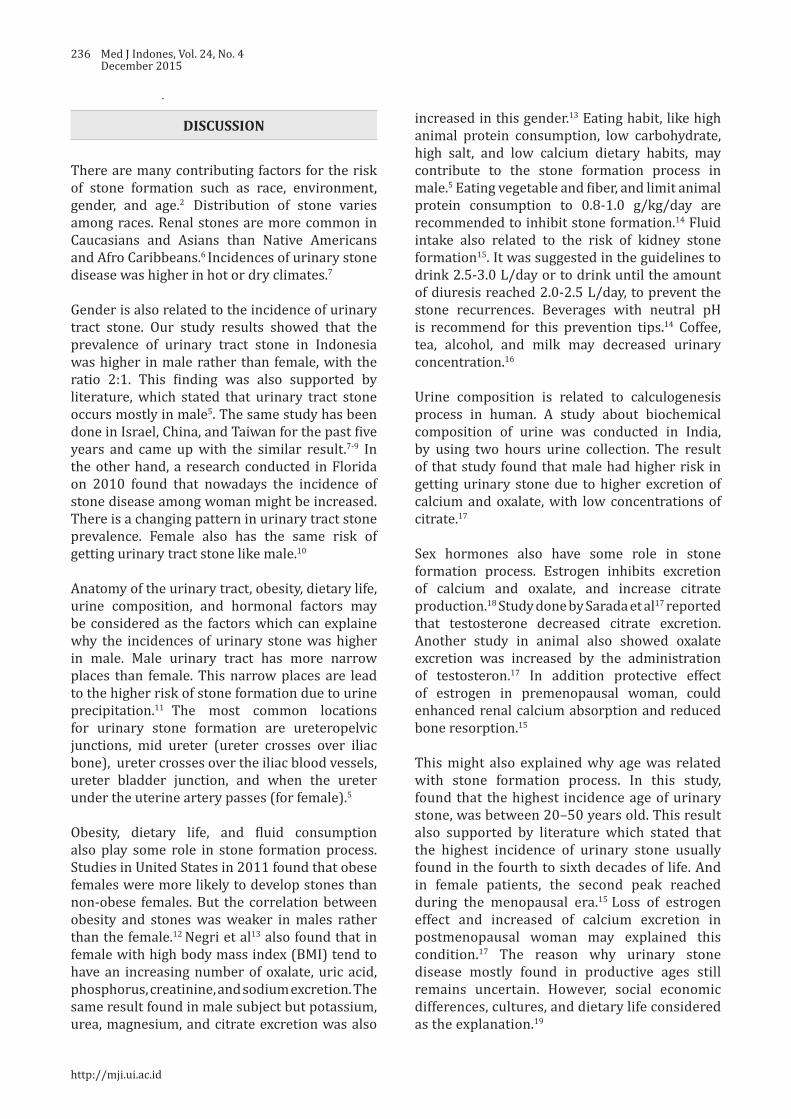
236 Med J Indones, Vol. 24, No. 4December 2015
DISCUSSION
There are many contributing factors for the risk of stone formation such as race, environment, gender, and age.2 Distribution of stone varies among races. Renal stones are more common in Caucasians and Asians than Native Americans and Afro Caribbeans.6 Incidences of urinary stone disease was higher in hot or dry climates.7
Gender is also related to the incidence of urinary tract stone. Our study results showed that the prevalence of urinary tract stone in Indonesia was higher in male rather than female, with the ratio 2:1. This finding was also supported by literature, which stated that urinary tract stone occurs mostly in male5. The same study has been done in Israel, China, and Taiwan for the past five years and came up with the similar result.7-9 In the other hand, a research conducted in Florida on 2010 found that nowadays the incidence of stone disease among woman might be increased. There is a changing pattern in urinary tract stone prevalence. Female also has the same risk of getting urinary tract stone like male.10
Anatomy of the urinary tract, obesity, dietary life, urine composition, and hormonal factors may be considered as the factors which can explaine why the incidences of urinary stone was higher in male. Male urinary tract has more narrow places than female. This narrow places are lead to the higher risk of stone formation due to urine precipitation.11 The most common locations for urinary stone formation are ureteropelvic junctions, mid ureter (ureter crosses over iliac bone), ureter crosses over the iliac blood vessels, ureter bladder junction, and when the ureter under the uterine artery passes (for female).5
Obesity, dietary life, and fluid consumption also play some role in stone formation process. Studies in United States in 2011 found that obese females were more likely to develop stones than non-obese females. But the correlation between obesity and stones was weaker in males rather than the female.12 Negri et al13 also found that in female with high body mass index (BMI) tend to have an increasing number of oxalate, uric acid, phosphorus, creatinine, and sodium excretion. The same result found in male subject but potassium, urea, magnesium, and citrate excretion was also
increased in this gender.13 Eating habit, like high animal protein consumption, low carbohydrate, high salt, and low calcium dietary habits, may contribute to the stone formation process in male.5 Eating vegetable and fiber, and limit animal protein consumption to 0.8-1.0 g/kg/day are recommended to inhibit stone formation.14 Fluid intake also related to the risk of kidney stone formation15. It was suggested in the guidelines to drink 2.5-3.0 L/day or to drink until the amount of diuresis reached 2.0-2.5 L/day, to prevent the stone recurrences. Beverages with neutral pH is recommend for this prevention tips.14 Coffee, tea, alcohol, and milk may decreased urinary concentration.16
Urine composition is related to calculogenesis process in human. A study about biochemical composition of urine was conducted in India, by using two hours urine collection. The result of that study found that male had higher risk in getting urinary stone due to higher excretion of calcium and oxalate, with low concentrations of citrate.17
Sex hormones also have some role in stone formation process. Estrogen inhibits excretion of calcium and oxalate, and increase citrate production.18 Study done by Sarada et al17 reported that testosterone decreased citrate excretion. Another study in animal also showed oxalate excretion was increased by the administration of testosteron.17 In addition protective effect of estrogen in premenopausal woman, could enhanced renal calcium absorption and reduced bone resorption.15
This might also explained why age was related with stone formation process. In this study, found that the highest incidence age of urinary stone, was between 20–50 years old. This result also supported by literature which stated that the highest incidence of urinary stone usually found in the fourth to sixth decades of life. And in female patients, the second peak reached during the menopausal era.15 Loss of estrogen effect and increased of calcium excretion in postmenopausal woman may explained this condition.17 The reason why urinary stone disease mostly found in productive ages still remains uncertain. However, social economic differences, cultures, and dietary life considered as the explanation.19
http://mji.ui.ac.id
Noviandrini, et al.Urinary stone characteristics of ESWL patients
237
In this study, unilateral kidney stone which located in the calyx inferior, was the most common stone found in both gender. The correlation between location and stone formation remain uncertain, but narrow places in human urinary tract increased the risk of urine precipitation.5 The incidence of bladder stone found higher in male because in elderly male, bladder stone might develop due to the growth of the prostate or due to benign prostatic hyperplasia.11
The data result also showed that most of the stone found in both gender was radioopaque, which usually related to calcium oxalate, calcium phosphate and struvite stones. Calcium oxalate stone found about 60% in all types of calculi stones.6 Study by Gault and Chafe20 stated that in the third decade, the highest number type of stone found in female was phosphate stone and oxalate stone in male.
The mean size of the stone found in the study was 11.34±7.15 mm for male patients and 11.90±7.54 mm for female patients. ESWL found to be the most suitable treatment for this size of stone.21
From the guidelines ESWL is the first treatment chosen for kidney stone with size 10–20 mm.22
There are many factors which correlate with successful rate of ESWL such as size, composition, consistency of the stone and elimination process after the treatment.23 In this research, most of the patients came for the first treatment (80.8% in male and 76.2% in female), but some patients had already done it before. This might be due to the size and the composition of the stone. But, further information about stone composition and stone hounsfield unit are needed. Recent studies have shown that stone made of calcium oxalate dihydrate are easier to break rather than uric acid stone.3 Studies made by Tarawneh stated that there were positive correlation between stone size and number of ESWL treatment.23 This study result also showed, that the number of male patients who come for continued treatment was higher than female patients. This result may be correlate with literature which stated that the recurrences of urinary stone occurs higher in male rather than female.5
The weakness of this study was incomplete data records which was found especially on the year of 2008. We solved this problem by increasing
the quality of medical record documentation with the result of better medical record during 2009–2014.
In conclusion, this research showed that in CMH, Jakarta, from 2008–2014, most of the patients who had urinary tract stone and underwent ESWL were male. The most common location found in both gender was unilateral kidney stone with calyx inferior as the specific site. Most of the patients had radioopaque imaging and calcium oxalate stone considered as the highest type of stone found in this study.
Conflict of interestThe authors affirm no conflict of interest in this study.
REFERENCES
1. Rahardjo D, Hamid R. Perkembangan penatalaksanaan batu ginjal di RSCM tahun 1997–2002. J I Bedah Indones. 2004;32(2):58–63. Indonesian.
2. Politis G, Griffith DP. ESWL: stone-free efficacy based upon stone size and location. World J Urol. 1987;5:255–8.
3. Junuzovic D, Prstojevic JK, Hasanbegovic M, Lepara Z. Evaluation of extracorporeal shock wave lithotripsy (ESWL): efficacy in treatment of urinary system stones. Acta Inform Med. 2014;22(5):309–14.
4. Elkholy MM, Ismail H, Abdelkhalek MA, Badr MM, Elfeky MM. Efficacy of extracorporeal shockwave lithotripsy using Dornier SII in different levels of ureteral stones. Urol Ann. 2014;6(4):346–51.
5. Menon M.Parulkar BG, Drach GW. Urinary lithiasis: etiology, diagnosis, and medical management. In: Walsh CP, Retik AB, Vaughan ED, Wein AJ, editors. Campbell’s urology. 7th ed. Philadelphia: WB Saunders; 1998. p. 2662–5.
6. Pal RP, Mellon JK. Renal Stone Disease. Foundation Years. 2008;4(5):199–203.
7. Kalbu DU, Golan S, Livne PM, Pode D, Duvdevani M, Lifshitz D. Urinary stone composition in Israel: current status and variation with age and gender-A bicenter study. J Endourol. 2013;27(12):1539–42.
8. Wu W, Yang B, Ou L, Liang Y, Wan S, Li S, et al. Urinary stone analysis on 12,846 patients: a report from a single center in China. Urolithiasis. 2014;42(1):39–43.
9. Huang WY, Chen YF, Carter S, Chang HC, Lan CF, Huang KH. Epidemiology of upper urinary tract stone disease in a Taiwanese population: a nationwide, population based study. J Urol. 2013;189(6):2158–63.
Medical Journal of Indonesia
238 Med J Indones, Vol. 24, No. 4December 2015
10. Strope SA, Wolf JS Jr, Hollenbeck BK. Changes in gender distribution of urinary stone disease. Urology. 2010;75(3):543–6.
11. Burnett AL, Rodriguez R, Jarrett TW. Genitourinary system: male anatomy and physiologi. In: Greenfield LJ, Mulholland MW, Oldham KT, Zelenock GB, Lilimoe KD, editors. Essentials of Surgery Scientific Principles and Practice. 2nd
ed. New York: Lippincott Williams &
Wilkins; 1997. p.1111–8.12. Nowfar S, Pallazi-Churas K, Chang DC, Sur RL. The
relationship of obesity and gender prevalence changes in United States inpatient nephrolithiasis. Urology. 2011;78(5):1029–33.
13. Negri AL, Spivacow FR, Del Valle EE, Forrester M, Rosende G, Pinduli I. Role of overweight and obesity on the urinary excretion of promoters and inhibitors of stone formation in stone formers. Urol Res. 2008;36(6):303–7.
14. Skolarikos A, Straub M, Knoll T, Sarica K, Seitz C, Petřík A, et al. Metabolic evaluation and recurrence prevention for urinary stone patients: EAU guidelines. Eur Urol. 2015;67(4):750–63.
15. Pearle MS, Lotan Y. Urinary lithiasis: etiology, epidemiology, and pathogenesis. In: Wein AJ, Kavoussi LR, editors. Campbell-Walsh Urology. Philadelphia: Elsevier Saunders; 2012. p.1257–60.
16. Taylor EN, Curhan GC. Diet and fluid prescription in stone disease. Kidney Int. 2006;70(5):835–9.
17. Sarada B, Satyanarayana U. Urinary composition in men and women and the risk of urolithiasis. Clin Biochem. 1991;24(6):487–90.
18. Kato Y, Yamaguchi S, Kakizaki H, Yachiku S. Influence of estrus status on urinary chemical parameters related to urolithiasis. Urol Res. 2005;33(6):476–80.
19. Eprints.undip.ac.id [Internet}. Semarang: Batu saluran kemih suatu problema gaya hidup dan pola makan serta analisis ekonomi pada pengobatannya. [update 2007 Mar 3; cited 2015 Jun 15]. Available from: http://eprints.undip.ac.id/340/1/rifki_muslim.pdf
20. Gault MH, Chafe L. Relationship of frequency, age, sex, stone weight and composition in 15,624 stones: comparison of results for 1980 to 1983 and 1995 to 1998. J Urol. 2000;164(2):302–7.
21. Renner C, Rassweiler J. Treatment of renal stones by extracorporeal shock wave lithotripsy. Nephron. 1999;81(suppl1):71–81.
22. Türk C, Knoll T, Petrik A, Sarica K, Seitz C, Straub M. Indication for active stone removal and selections of procedures. In: EAU Guidelines on Urolithiasis. 2014. p. 48. Available from: http://uroweb.org/wp-content/uploads/20-Urolithiasis.pdf
23. Tarawneh E, Awad Z, Hani A, Haroun AA, Hadidy A, Mahafza W, et al. Factors affecting urinary calculi treatment by extracorporeal shock wave lithotripsy. Saudi J Kidney Dis Transpl. 2010 Jul; 21(4):660–5.
http://mji.ui.ac.id
Habsyiyah, et al.Socioeconomic factors and quality of life
245
Relationship of socioeconomic factors with vision-related quality of life on severe low vision and blind population in Indonesia
Keywords: NEI VFQ 25, severe low vision and blind, socioeconomic, vision-related quality of life
pISSN: 0853-1773 • eISSN: 2252-8083 • http://dx.doi.org/10.13181/mji.v24i4.1245 • Med J Indones. 2015;24:245–51• Received 20 May 2015 • Accepted 17 Dec 2015
Correspondence author: Habsyiyah, [email protected]
Copyright @ 2015 Authors. This is an open access article distributed under the terms of the Creative Commons Attribution-NonCommercial 4.0 International License (http://creativecommons.org/licenses/by-nc/4.0/), which permits unrestricted non-commercial use, distribution, and reproduction in any medium, provided the original author and source are properly cited.
Habsyiyah,1 Yeni D. Lestari,1 Iwan Ariawan,2 Tjahjono D. Gondhowiardjo1
1 Department of Ophthalmology, Faculty of Medicine, Universitas Indonesia, Cipto Mangunkusumo Hospital, Jakarta, Indonesia2 Department of Biostatistics and Population, Faculty of Public Health, Universitas Indonesia, Depok, Indonesia
Community Research
Medical Journal of Indonesia
ABSTRAK
Latar belakang: Faktor sosioekonomi diketahui memiliki hubungan dengan terjadinya gangguan penglihatan, dan gangguan penglihatan dapat mempengaruhi kualitas hidup seseorang. Penelitian ini bertujuan untuk menilai adanya hubungan faktor sosioekonomi terhadap kualitas hidup pada populasi gangguan penglihatan berat dan buta di Indonesia.
Metode: Penelitian potong lintang berbasis populasi ini dilakukan di 5 provinsi di Indonesia. Wawancara menggunakan kuesioner sosioekonomi dan national eye institute visual function questionnaire 25 (NEI VFQ 25) dilakukan pada responden RISKESDAS 2013 yang berusia di atas 18 tahun dan memiliki gangguan penglihatan berat (Visus≥3/60 hingga 6/60) dan buta (visus<3/60). Skor total NEI VFQ 25 dibandingkan berdasarkan derajat gangguan penglihatan, tingkat pendidikan, status bekerja, status buta huruf, tingkat pendapatan dan tempat tinggal. Hasil dianalisis menggunakan uji T tidak berpasangan atau Mann-Whitney dan uji kai kuadrat.
Hasil: Sebanyak 134 subyek masuk dalam kriteria inklusi penelitian ini. Sebaran subyek paling banyak berjenis kelamin perempuan (68,2%), usia >64 tahun (64,9%), berpendidikan rendah (65,7%), buta huruf (52,2%), berpenghasilan rendah (71,6%), tidak bekerja (63,4%) dan tinggal di daerah urban (58,2%). Kelompok buta memiliki skor kualitas hidup yang lebih rendah dibandingkan dengan kelompok gangguan penglihatan berat (p=0,001). Responden yang bekerja memiliki kualitas hidup yang lebih tinggi daripada yang tidak bekerja (p=0,041) sementara tingkat pendidikan, penghasilan, kemampuan baca tulis, dan tempat tinggal tidak menunjukkan perbedaan bermakna pada kualitas hidup.
Kesimpulan: Kualitas hidup terkait penglihatan pada populasi dengan gangguan penglihatan berat dan buta berhubungan dengan status bekerja. Karena pengaruh budaya dan karakter masyarakat Indonesia, kualitas hidup pada populasi tersebut tidak dipengaruhi oleh tingkat pendidikan, tingkat penghasilan, status buta huruf, dan tempat tinggal.
ABSTRACT
Background: Socioeconomic factors are known to be associated with visual impairment. Being someone who is visually impaired could affect his quality of life. The aim of this study is to evaluate the quality of life (QOL) in severe low vision and blind population in Indonesia in relation to their socioeconomic status.
Methods: A cross sectional population-based study was performed in 5 provinces, in Indonesia. Respondents of validation study on blindness data of national basic health survey 2013 (RISKESDAS 2013), who were above 18 years old with severe low vision (BCVA≥3/60 to 6/60) and blind (BCVA<3/60), were included in this study. Questionnaires for socioeconomic status and a questionnaire from the national eye institute visual function questionnaire 25 (NEI VFQ 25) for visual function were administered. Total scores of NEI-VFQ25 were compared based on severity of visual impairment, educational level, occupation, literacy adequacy, income level, and residency. Data analysis was using independent T-test or Mann-Whitney test, and Chi square test.
Results: A total of 134 subjects were enrolled in this study, most of them are women (68.2%), aged >64 years old (64.9%) with low education (65.7%), illiterate (52.2%), low income (71.6%), non working (63.4%) and living in urban areas (58.2%). The blind population has lower VFQ scores than severe low vision (p=0.001). Different status of educational level, literacy adequacy, income level and residency did not show significant difference in VFQ scores, but those who have an occupation had better VFQ scores than those who do not (p=0.041).
Conclusion: Visual related quality of life (VRQOL) of severe low vision and blind population was associated significantly with occupational status. Because of culture and characteristics of Indonesian people, VRQOL of severe low vision and blind population in Indonesia was not affected by educational level, literacy, income level, and residency.
246 Med J Indones, Vol. 24, No. 4December 2015
World Health Organization stated that 39 million people were blind worldwide and approximately 90% of them were living in developing countries.1
Indonesian Ministry of Health survey in 1993–1996 had reported that the prevalence of blindness in Indonesia was 1.5%.2 It means that Indonesia has the second highest prevalence of blindness in the world after Ethiopia.
Socioeconomic status such as level of education and income might be one of main factors determining health status including visual impairment or blindness.3 Some studies showed that people with low level education or low income had worse vision compared to those with better socioeconomic status.4-6
The impact of visual impairment on vision-specific functioning may vary in population with different sociodemographic and economical characteristics especially when associated with level of education, literacy, occupation, etc.7
Therefore, identifying the sociodemographic characteristic(s) within a group that is at higher risk of being affected by vision impairment related to their quality of life will lead to more targeted interventions in public health programs and facilitate its implementation.7,8
Several methods have been used in measuring health related quality of life. In ophthalmology, there are establihed methods to measure visual function index such as the VF-14 and the national eye institute visual function questionnaire 25 (NEI VFQ 25).9 Till recent time, there have been no data regarding the relationship of socioeconomic factors with the quality of life in severe low vision and blind population in Indonesia. This study aimed to evaluate vision-related quality of life in severe low vision and blind population in Indonesia related to their socioeconomic status.
METHODS
This study was a population-based cross sectional study which was conducted in five provinces in Indonesia, namely DKI Jakarta, West Sumatera, South Sulawesi, East Java, and Yogyakarta. The location of study was choosen based on their level of blindness and visual impairment data reported by national basic health survey (RISKESDAS) 2013 study.10 This study had been approved by ethical
commitee of Health Research and Development Body of Ministry of Health (LB.02.01/5.2/KE.402/2013).
Respondents who were diagnosed of having blind or severe low vision (SVI) by RISKESDAS investigators were invited to primary health care or visited at their home by the study teams which consist of refractionists and residents of ophthalmology, supervised by ophthalmologists, to have a full eye examinations. After receiving explanation and signed the informed consent, all subjects underwent visual acuity (VA) examination including presenting VA and corrected VA, anterior segment, posterior segment of eyes, and intraocular pressure examination. Based on all the finding, the diagnosis and the main cause of visual impairment were determined.
Respondents that are older than 18 years, classified as blind (presenting VA<3/60 in the better eye) and SVI (presenting VA≥3/60 to 6/60 in the better eye) were included in this study. Purposive sampling methods were used based on those criteria. Any patient with difficulties in the interview process was excluded. Minimal sample size was counted based on criteria provided by NEI VFQ 25 using independent T-test formula. Point difference of 10 was considered significant and standard deviation was 20 point. Power of 20% was used.11
A validated modified NEI VFQ 25 was used to assess the vision related quality of life (VRQoL) on the respondents.12,13 This questionnaire has been translated into Indonesian language and back-translation was done by the registered translator. Socioeconomic questionnaire used in this study was based on criteria provided by Office of Statistics Centre (Biro Pusat Statistik). A validation of translated NEI VFQ 25 and socieconomic questionnaires were conducted before they were used in this study. Each respondent was interviewed by trained interviewer.
Data on gender, age, cause of blindness, socioeconomic status and NEI VFQ 25 scores were described and analyzed. Length of visual impairment and history of consultation with ophthalmologist were also recorded. Evaluation of VRQoL between the two groups were emphasized on their socioeconomic status such as level of education, area of living, literacy, income
http://mji.ui.ac.id

Habsyiyah, et al.Socioeconomic factors and quality of life
247
and working status. Comparison of demographic characteristics was made to evaluate the equality between socioeconomic groups.
Level of education was divided into three categories; low if respondents did not pass elementary school, moderate if only passed junior high or high school, and high if respondents passed academic school. Literacy was defined as the respondents not being able to read nor write adequately. Income status was classified into four categories; very high income was if respondents’ average income was above IDR 3,500,000, high was IDR 2,500,000–3,500,000, moderate was IDR 1,500,000–2,500,000, and low was under IDR 1,500,000 per month. Occupational status was divided into working and not working and area of living consists of urban and rural area. Non-productive age was defined if a person aged above 64 years old. We also analyzed correlation between socioeconomic factor and history of previous consultation with an ophthalmologist.
Statistic analysis was done using SPSS program v.16.0. Numeric data were calculated using unpaired T-test or Mann-Whitney test while categorical data were calculated by Chi square test.
RESULTS
A total of 134 respondents met the inclusion and exclusion criteria. The majority of the respondents were female (68.2%). The age range of the respondents were 28–95 years old, with most of the respondents (64.9%) were above 64 years old which considered as a non-productive age.
This study found that 46 (34.3%) respondents were severe low vision and 88 (65.7%) respondents were blind. Cataract (73.9%) was the main cause of visual impairment followed by optic neuropathy (5.2%), glaucoma (5.2%), and refractive error (4.5%). The average duration of visual impairment experienced by respondents was 6.38±10.32 years.
Respondents’ socioeconomic characteristics showed no significant difference between severe low vision group and blind group, as shown in table one. More respondents had lower level of education (65.7%), illiterate (52.2%), live in urban area (58.2%), lower income (71.6%), and not working (63.4%). We also recorded the length of unemployment from the not working group (26 respondents) and found that the mean of length unemployment was 9.88±6.50 years.
Variable Total number (%) (n=134)
Severe low vision (%)(n=46)
Blind (%)(n=88) p
Level of education 0.39Low 88 (65.7) 28 (60.9) 60 (68.2)Moderate-high 46 (34.3) 18 (39.2) 28 (31.8)
Literacy status 0.46Illiterate 70 (52.2) 22 (47.8) 48 (54.5)Non-illiterate 64 (47.8) 24 (52.2) 40 (45.4)
Area of living 0.93Urban 78 (58.2) 27 (58.7) 51 (58)Rural 56 (41.8) 19 (41.3) 37 (42)
Income status 0.46Very high/high 18 (13.5) 5 (10.8) 13 (14.8)Moderate 20 (14.9) 5 (10.9) 15 (17)Low 96 (71.6) 36 (78.3) 60 (68.2)
Occupational status 0.23Not working 85 (63.4) 26 (56.5) 59 (67)Working 49 (14.2) 20 (43.5) 28 (33)
Table 1. Socioeconomic characteristic between severe low vision and blind groups
Medical Journal of Indonesia

248 Med J Indones, Vol. 24, No. 4December 2015
We compared the demographic characteristics related to each socioeconomic level as seen in table two. There were significant differences of gender in relation to educational level (p=0.000), literacy status (p=0.000), and occupational status (p=0.000), but no difference on income status (p=0.902). There was also inequality of age on population with different income status (p=0.007) and occupational status (p=0.003). This table also shows that there was no correlation on length of visual impairment to various level of socioeconomic factors.
Comparison of vision related quality of life between severe low vision and blind group showed that the severe low vision group had better quality of life than blind group (p=0.001). In this study, there were only three subjects who had high educational level, therefore in VRQoL score analysis we regrouped the level of education into two groups; low educational level and moderate-high educational level. There was no significant difference on VRQoL total score between low educated and moderate-high educated groups (p=0.277), eventhough the group with higher educational level had higher total score, as shown in table three. On literacy status category, as classified into illiterate and adequate literacy, there was no significant difference between this group related to total score of VRQoL (p=0.148), but group with adequate literacy had higher VRQoL total
VariableGender Age
(year)Length of visual
impairment (year)
Male Female p Mean±SD p Median(min-max) pLevel of education 0.00 0.178 0.14
Low 22 66 68.43±12.05 3 (0.08–54)Moderate/high 26 20 65.41±12.62 3.5 (0.08–50)
Income status 0.90 0.007 0.82Low 34 62 65.57±12.7 3 (0.08–54)Moderate 8 12 69.1±10.27 2.25(0.08–15)High 6 12 75.22±7.9 3(16–20)
Occupational status 0.00 0.003 0.12Working 29 20 65(28–87) 3 (0.08–50)Non-working 19 66 71(32–95) 3 (0.08–54)
Literacy status 0.00 0.35 0.10Illiterate 14 56 68.34±12.73 3 (0.08–54)Non-illiterate 34 30 66.36±11.79 3 (0.08–54)
Table 2. Relationship of gender, age, length of visual impairment with level of socioeconomic status
score than the illiterate. On income variable, the category of very high and high income were merged because of small respondents number, so there were three groups of income variable being compared. It showed that there was no significant difference of VRQoL total score among those groups (p=0.774). Statistical analysis of VRQoL total score between the working and not working groups revealed significant differences (p=0.041). Working respondents had better QoL total score then those who not working respondents. There was no significant difference in VRQoL total score between respondents who live in urban area and rural area (p=0.265), though those who live in urban had higher total score.
There was a significant association between history of consultation with an ophthalmologist with the level of education (p=0.000) and literacy status (p=0.001), but not with area of living, income status or occupational (Table 4).
DISCUSSION
This study showed that 35.1% of respondents were at a productive age-range. Respondents’ dependency to other people gave significant influence to their psychological condition that affects their quality of life (QoL). In these groups of respondents, cataract was still the main cause of visual impairment (57.0%) followed by refractive
http://mji.ui.ac.id

Habsyiyah, et al.Socioeconomic factors and quality of life
249
Socioeconomic statusTotal QoL score
p*
Median (min–max)Level of education 0.277
Low (n=88) 39.66 (2.5–86.82)Moderate/high (n=46) 40.18 (10.41–89.40)
Literacy status 0.148Illiterate (n=70) 36.63 (2.5–86.82)Non-illiterate (n=64) 40.37 (10.41–89.4)
Income status 0.774Low (n=96) 39.66 (2.5–89.4)Moderate (n=20) 45.99 (16.75–74.70)High (n=18) 32.51 (9.5–79.07)
Occupational status 0.041Working (n=49) 45.61 (9.5–89.40)Non-working (n=85) 35.02 (2.5–79.83)
Area of livingRural (n=56) 37.54 (9.87–85.6) 0.265Urban (n=78) 40.62 (2.5–86.9)
Table 3. Comparison of VRQoL total score on visual impair-ment respondents to the level of socioeconomic status
*: Mann Whitney test
Variable History of consultation
No history of consultation p*
Educational level
0.000
Low 20 68
Moderate/ high
25 21
Literacy status 0.001Illiterate 15 55
Non-illiterate
30 34
Area of living 0.298Rural 16 40Urban 29 49
Income status 0.147High 9 9Moderate 7 13Low 29 67
Occupational status
0.084
Not working
24 61
Working 21 28Gender 0.063
Male 21 27Female 24 62
Table 4. Association of socioeconomic status with history of consultation to an ophthalmologist
*: Chi square test
errors (10.6%), which were preventable and treatable eye disorders. Immediate rehabilitation will directly increase productivity and respondents’ quality of life, that will reduce social burden.14 The proportion of respondents consisted of more women (64.2%). This finding was similar with WHO’ report from several surveys in African, Asian countries with lower gross domestic product (GDP) and many countries with high income, that showed 65,0% of blind population in the world is dominated by women.15
In this study, 65.7% of the respondents had low level of education and only 47.8% had adequate literacy. Singapore-Indian Eyes Study6 and Singapore-Malay Eyes Study16 mentioned that lower level of education was related to visual impairment, and it was a significant risk factor. Beijing Eyes Study17 also showed that the prevalence of visual impairment and blindness were related to level of education. Pakistan National Eyes Study18 showed that educational status was significantly related to severe low vision and blindness. That condition was similar to the results of this study, visual impairment was related to low level of education. However, we could not conclude that educational status was a risk factor from this study, since it had different method of study.
Zheng et al19 found that illiterate people were twice more vulnerable of having visual impairment compared to those literate people. Study in India, Nepal, and Bangladesh even showed that risk was three times higher.20-24 People with inadequate literacy have difficulties in understanding medical information which have relation with the adequacy of treatment. Health literacy is the ability to read, understand, and use the information related to health service in making decision and following treatment/therapy instruction.19 Similar to this study, educational status and literacy influence respondents in seeking treatment to the ophthalmologist. Health literacy is an important factor since it will influence the success of public health educational and rehabilitation program.
Financial problem inclined to contribute in causing blindness. As much as 71.6% of respondents had
Medical Journal of Indonesia

250 Med J Indones, Vol. 24, No. 4December 2015
family income less than IDR 1,500,000 per month, it means that most of the respondents had low income, but statistically the low income did not relate to visual impairment degree. Saw et al25 study showed that those with lower family income had higher prevalence of blindness compared to those who had higher income.
Different number of eye health centers, educational level, lifestyle, and economic status have different consequences to mortality and health status in urban and rural population. In this study, there was no difference in demographic and socioeconomic characteristic between respondents who live in urban and rural area. It was similar to Beijing Eye Study.17
Nutheti et al14 found that quality of life score in respondents with visual impairment were lower in respondents with low income and low level of education. The study by Nirmalan et al26 also showed that quality of life score and visual function were better in respondents who were employed and educated compared to those unemployed and uneducated respondents. Similar result was also stated by McClure et al,27 subjects with job and higher income had higher score.
In our study, the socioeconomic variable which significantly related to VRQoL score was occupational status (p=0.041). Meanwhile, level of education, literacy status, income level, and area of living were not related significantly. While, other studies found that better socioeconomic status results in better quality of life. The difference between our study and other countries’ studies was related to Indonesian culture and beliefs, in which many elderly live with other family members as a big family, thus they could help the persons with visual impairment. In addition, level of income was not statistically significant in affecting visual impairment that might be related to less sensitive parameter used in this study which might cause bias. While having a job indicates that they still can function and are still productive in their daily life regardless of their visual impairment condition.
Generally, respondents who live in urban area tend to have higher quality life score in all of subscales, but was not statisticaly significant. The different culture of urban and rural area in one to other provinces might also have influence in the quality of life.
The present study has some limitations that potentially bring to bias. This study used purposive sampling method which is highly prone to researcher bias. Another possible bias come from the interview method used in collecting respondents’ data. Data collecting was held at the same time within several areas by several teams. Although questionnaire filling was done by each interviewer team that had been trained before, local language variety in each province could also cause bias, even though in each interview, a translator was available.
Educational and literacy status were significantly associated with respondents’ history of consultation with ophthalmologists. This means that with better educational level and literacy status of a respondent, he/she was more aware with his/her eye health condition and seeking appropiate treatment for their eye conditions. The difference of socioeconomic status such as income level, occupational status, rural/urban area of respondents’ residence, and degree of visual impairment did not associate with the number of respondents who seek help to the ophthalmologist. Contrary to this, Wagner and Rein28 found that factors which relate to number of visit to eye care services were availability of health insurance and high level of income. This result has shown that most Indonesian lack of awareness in seeking help to eye health services. The delay to seek for help because they are not aware the availability of eye health services or treatment to improve their health condition. This condition shows that improvement of health education and awareness to public was necesssary. Cataract as the major cause of visual impairment group was actually treatable, thus blindness could be preventable. Based on our study, we could put sign of red spot on those areas where being needed for getting help for eye care. By improving education and giving counseling with new and high technology, eyes health information’s could better cover all parts of the country.
In conclusion, vision related quality of life of severe low vision and blind population in Indonesia were associated significantly with occupational status. Because of specific characteristic culture and beliefs of Indonesian people, educational level, literacy, income level, and living area did not affect vision related
http://mji.ui.ac.id
Habsyiyah, et al.Socioeconomic factors and quality of life
251
quality of life of severe low vision and blind population in Indonesia.
Conflicts of interestThe authors affirm there is no conflict of interest in this study.
AcknowledgementThe authors gratefully acknowledge the full support of DR. dr. Widya Artini, SpM(K), the head of Ophthalmology Department, Faculty of Medicine, Universitas Indonesia.
REFERENCES
1. www.who.int [Internet]. Visual impairment and
blindness [cited July 2014]. Available from: http://www.who.int/mediacentre/factsheets/fs282/en/
2. Departemen Kesehatan Republik Indonesia. Survey Kesehatan Indera Penglihatan Tahun 1993–1996. Jakarta: Departemen Kesehatan RI; 1998. Indonesian.
3. Zheng Y, Lamoureux E, Finkelstein E, Wu R, Lavanya R, Chua D. et al. Independent impact of area-level socioeconomic measures on visual impairment. Invest Ophthalmology Vis Sci. 2011;52(12):8799–805.
4. Dandona L, Dandona R, Srinivas M, Giridhar P, Vilas K, Prasad MN, et al. Blindness in the Indian state of Andhra Pradesh. Invest Ophthalmology Vis Sci. 2001;42(5):908–16.
5. Chong EW, Lamoureux EL, Jenkins MA, Aung T, Saw SM, Wong TY. Sociodemographic, lifestyle, and medical risk factors for visual impairment in an urban asian population: the singapore malay eye study. Arch Ophthalmol. 2009;127(12):1640–7.
6. Zheng Y, Lavanya R, Wu R, Wong WL, Wang JJ, Mitchell P, et al. Prevalence and causes of visual impairment and blindness in an urban Indian population: the Singapore Indian Eye Study. Ophthalmology. 2011;118(9):1798–804.
7. Chiang PP, Zheng Y, Wong TY, Lamoureux EL. Vision impairment and major causes of vision loss impacts on vision-specific functioning independent of socioeconomic factors. Ophthalmology. 2013;120(2):415–22.
8. Livingston P, McCarty C, Taylor HR. Visual impairment and socioeconomic factors. Br J Ophthalmol. 1997;81(7):574–7.
9. Pesudovs K. Patient-centred measurement in ophthalmolog--a paradigm shift. BMC Ophthalmol. 2006;6:25.
10. Kementerian Kesehatan Republik Indonesia. Riset kesehatan dasar 2013. Jakarta: Badan Litbangkes; 2013. Indonesian.
11. Mangione CM, Lee PP, Gutierrez PR, Spitzer K, Berry S, Hays RD, et al. Development of the 25-list-item national eye institute visual function questionnaire. Arch Ophthalmol. 2001;119(7):1050–8.
12. Massof RW, Fletcher DC. Evaluation of the NEI visual functioning questionnaire as an interval measure of visual ability in low vision. Vision Res. 2001;41(3):397–413.
13. Lamoureux EL, Pesudovs K, Thumboo J, Saw SM, Wong, TY. An evaluation of the reliability and validity of the visual functioning questionnaire (VF-11) using Rasch
analysis in an Asian population. Invest Ophthalmol Vis Sci. 2009;50(6):2607–13.
14. Nutheti R, Shamanna BR, Nirmalan PK, Keeffe JE, Krishnainah S, Rao GN, et al. Impact of impaired vision and eye disease on quality of life in Andhra Pradesh. Invest Ophthalmol Vis Sci. 2006;47(11):4742–8.
15. www.who.int [Internet]. Gender and Blindness, Gender and health information sheet. [update Aug 2014, cited Sept 2014]. Available from: http://www.who.int/gender-equity-rights/knowledge/a85574/en/
16. Wong TY, Chong EW, Wong WL, Rosman M, Aung T, Loo JL, et al. Prevalence and causes of low vision and blindness in an urban Malay population: the Singapore Malay Eye Study. Arch Ophthalmol.
17. Xu L, Wang Y, Li Y, Wang Y, Cui T, Li J, et al. Causes of blindness and visual impairment in urban and rural areas in Beijing: the Beijing Eye Study. Ophthalmology. 2006;113(7):1124.e1–11.
18. Jadoon MZ, Dineen B, Bourne RR, Shah SP, Khan MA, Johnson GJ, et al. Prevalence of blindness and visual impairment in Pakistan: the Pakistan National Blindness and Visual Impairment Survey. Invest Ophthalmol Vis Sci. 2006;47(11):4749–55.
19. Zheng Y, Lamoureux EL, Chiang PP, Cheng CY, Anuar AR, Saw SM, et al. Literacy is an independent risk factor for vision impairment and poor visual functioning. Invest Ophthalmol Vis Sci. 2011;52(10):7634–9.
20. Nirmalan PK, Thulasiraj RD, Maneksha V, Rahmathullah R, Ramakrishnan R, Padmawathi A, et al. A population based eye survey of older adults in Tirunelveli district of south India: blindness, cataract surgery, and visual outcomes. Br J Ophthalmol. 2002;86(5):505–12.
21. Vijaya L, George R, Arvind H, Baskaran M, Raju P, Ramesh SV, et al. Prevalence and causes of blindness in the rural population of the Chennai Glaucoma Study. Br J Ophthalmol. 2006;90(4):407–10.
22. Murthy GVS, Gupta SK, Bachani D, Jose R, John N. Current estimates of blindness in India. Br J Ophthalmol. 2005;89(3):257–60.
23. Sapkota YD, Pokharel GP, Nirmalan PK, Dulal S, Maharjan IM, Prakash K. Prevalence of blindness and cataract surgery in Gandaki Zone, Nepal. Br J Ophthalmol. 2006;90(4):411–6.
24. Dineen BP, Bourne RRA, Ali SM, Huq DMN, Johnson GJ. Prevalence and causes of blindness and visual impairment in Bangladeshi adults: results of the National Blindness and Low Vision Survey of Bangladesh. Br J Ophthalmol. 2003;87(7):820–8.
25. Saw SM, Husain R, Gazzard GM, Koh D, Widjaja D, Tan DTH. Causes of low vision and blindness in rural Indonesia. Br J Ophthalmol. 2003;87(9):1075–8.
26. Nirmalan PK, Tielsch JM, Katz J, Thulasiraj RD, Krishnadas R, Ramakrishnan R, et al. Relationship between vision impairment and eye disease to vision-specific quality of life and function in rural India: the Aravind Comprehensive Eye Survey. Invest Ophthalmol Vis Sci. 2005;46(7):2308–12.
27. McClure TM, Choi D, Becker T, Cioffi GA, Mansberger SL. The effect of visual impairment on vision-related quality of life in American Indian/Alaska Natives. Ophthalmic Epidemiol. 2009;16(2):128–35.
28. Wagner LD, Rein DB. Attributes associated with eye care use in the United States: a meta-analysis. Ophthalmology. 2013;120(7):1497–501.
Medical Journal of Indonesia

252 Med J Indones, Vol. 24, No. 4December 2015
Disseminated tuberculosis diagnosed first as leptospirosis in immunocompetent patient
Keywords: acute onset, disseminated tuberculosis, immunocompetent
pISSN: 0853-1773 • eISSN: 2252-8083 • http://dx.doi.org/10.13181/mji.v24i4.1266 • Med J Indones. 2015;24:252–6• Received 15 Jul 2015 • Accepted 29 Dec 2015
Correspondence author: Erni J. Nelwan, [email protected]
Copyright @ 2015 Authors. This is an open access article distributed under the terms of the Creative Commons Attribution-NonCommercial 4.0 International License (http://creativecommons.org/licenses/by-nc/4.0/), which permits unrestricted non-commercial use, distribution, and reproduction in any medium, provided the original author and source are properly cited.
Erni J. Nelwan,1 Juferdy Kuniawan,2 Mirna N. Praptini,3 Herdiman T. Pohan1
1 Division of Tropical and Infectious Disease, Department of Internal Medicine, Universitas Indonesia, Jakarta, Indonesia 2 Division of Hepatobilier, Department of Interna Medicine, Universitas Indonesia, Jakarta, Indonesia 3 Department of Internal Medicine, Faculty of Medicine, Universitas Indonesia, Jakarta, Indonesia
Case Report
Medical Journal of Indonesia
ABSTRAK
Tuberkulosis diseminata, lebih sering di diagnosis pada pasien dengan status imun yang lemah (immunocompromised). Manifestasi yang tidak khas menyebabkan penegakan diagnosis di klinik sering kali membutuhkan waktu. Studi ini melaporkan kasus tuberkulosis diseminata pada pasien imunokompeten; seorang wanita 42 tahun dengan tuberkulosis paru dan ekstraparu (tuberkulosis hati.) yang berhasil ditegakkan diagnosisnya melalui biopsi hati.
ABSTRACT
Disseminated tuberculosis, mostly seen in immunocompromised patient, can affect several organs. The diagnosis can be difficult due to various clinical manifestations. A case of disseminated tuberculosis of lung and liver that develops acutely is rare especially in immunocompetent patient. Here, we present a 42 year old immunocompetent woman with lung and hepatic tuberculosis which was confirmed by characteristics histopathological findings of the liver biopsy.
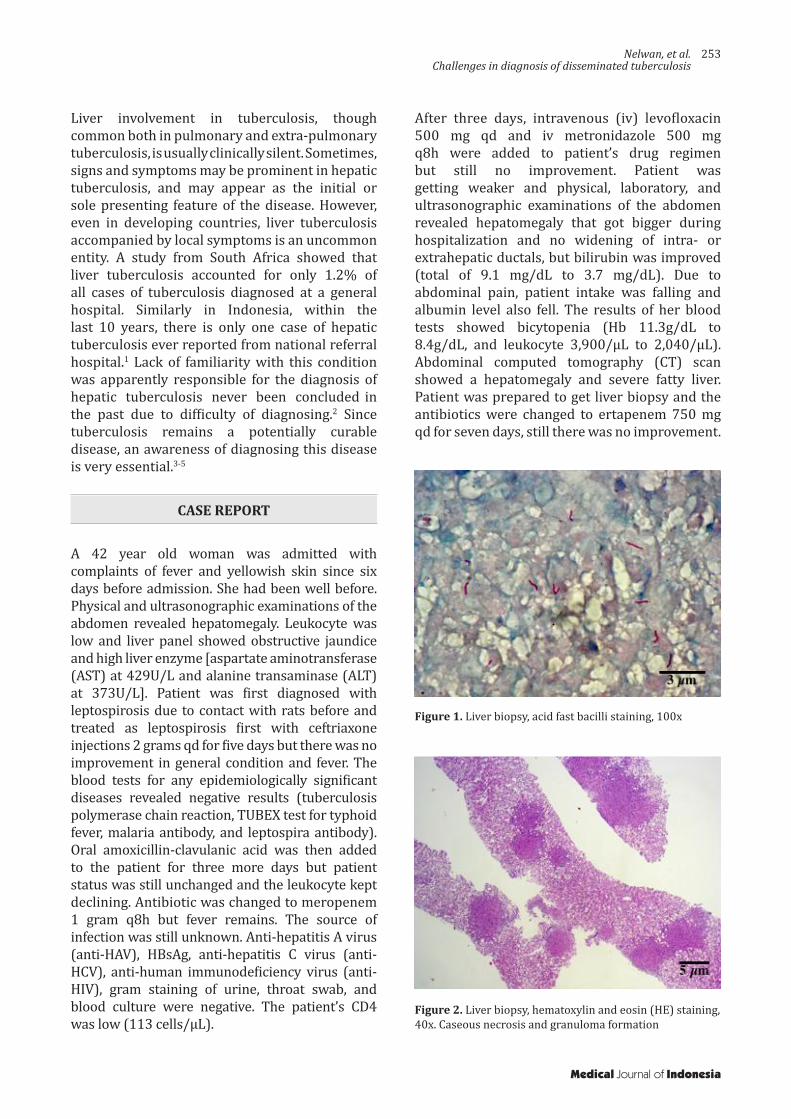
Nelwan, et al.Challenges in diagnosis of disseminated tuberculosis
253
Liver involvement in tuberculosis, though common both in pulmonary and extra-pulmonary tuberculosis, is usually clinically silent. Sometimes, signs and symptoms may be prominent in hepatic tuberculosis, and may appear as the initial or sole presenting feature of the disease. However, even in developing countries, liver tuberculosis accompanied by local symptoms is an uncommon entity. A study from South Africa showed that liver tuberculosis accounted for only 1.2% of all cases of tuberculosis diagnosed at a general hospital. Similarly in Indonesia, within the last 10 years, there is only one case of hepatic tuberculosis ever reported from national referral hospital.1 Lack of familiarity with this condition was apparently responsible for the diagnosis of hepatic tuberculosis never been concluded
in
the past due to difficulty of diagnosing.2 Since tuberculosis remains a potentially curable disease, an awareness of diagnosing this disease is very essential.3-5
CASE REPORT
A 42 year old woman was admitted with complaints of fever and yellowish skin since six days before admission. She had been well before. Physical and ultrasonographic examinations of the abdomen revealed hepatomegaly. Leukocyte was low and liver panel showed obstructive jaundice and high liver enzyme [aspartate aminotransferase (AST) at 429U/L and alanine transaminase (ALT) at 373U/L]. Patient was first diagnosed with leptospirosis due to contact with rats before and treated as leptospirosis first with ceftriaxone injections 2 grams qd for five days but there was no improvement in general condition and fever. The blood tests for any epidemiologically significant diseases revealed negative results (tuberculosis polymerase chain reaction, TUBEX test for typhoid fever, malaria antibody, and leptospira antibody). Oral amoxicillin-clavulanic acid was then added to the patient for three more days but patient status was still unchanged and the leukocyte kept declining. Antibiotic was changed to meropenem 1 gram q8h but fever remains. The source of infection was still unknown. Anti-hepatitis A virus (anti-HAV), HBsAg, anti-hepatitis C virus (anti-HCV), anti-human immunodeficiency virus (anti-HIV), gram staining of urine, throat swab, and blood culture were negative. The patient’s CD4 was low (113 cells/μL).
After three days, intravenous (iv) levofloxacin 500 mg qd and iv metronidazole 500 mg q8h were added to patient’s drug regimen but still no improvement. Patient was getting weaker and physical, laboratory, and ultrasonographic examinations of the abdomen revealed hepatomegaly that got bigger during hospitalization and no widening of intra- or extrahepatic ductals, but bilirubin was improved (total of 9.1 mg/dL to 3.7 mg/dL). Due to abdominal pain, patient intake was falling and albumin level also fell. The results of her blood tests showed bicytopenia (Hb 11.3g/dL to 8.4g/dL, and leukocyte 3,900/µL to 2,040/µL). Abdominal computed tomography (CT) scan showed a hepatomegaly and severe fatty liver. Patient was prepared to get liver biopsy and the antibiotics were changed to ertapenem 750 mg qd for seven days, still there was no improvement.
Figure 1. Liver biopsy, acid fast bacilli staining, 100x
Figure 2. Liver biopsy, hematoxylin and eosin (HE) staining, 40x. Caseous necrosis and granuloma formation
Medical Journal of Indonesia
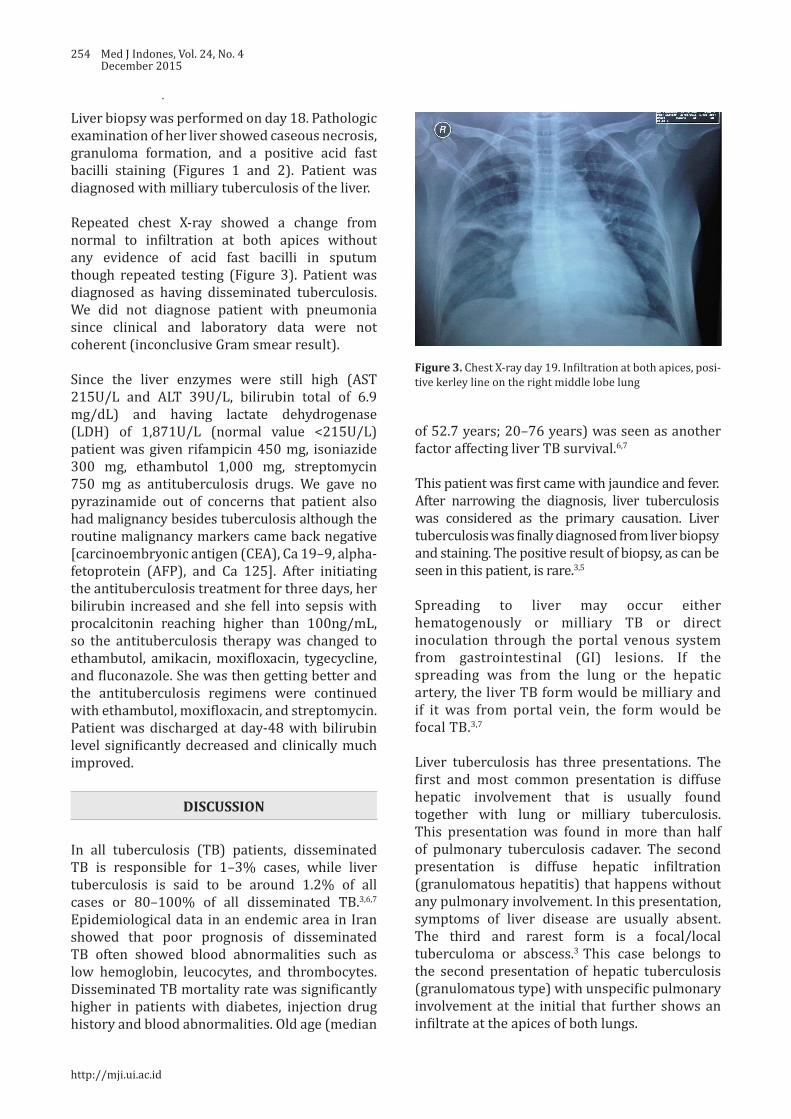
254 Med J Indones, Vol. 24, No. 4December 2015
Liver biopsy was performed on day 18. Pathologic examination of her liver showed caseous necrosis, granuloma formation, and a positive acid fast bacilli staining (Figures 1 and 2). Patient was diagnosed with milliary tuberculosis of the liver.
Repeated chest X-ray showed a change from normal to infiltration at both apices without any evidence of acid fast bacilli in sputum though repeated testing (Figure 3). Patient was diagnosed as having disseminated tuberculosis. We did not diagnose patient with pneumonia since clinical and laboratory data were not coherent (inconclusive Gram smear result).
Since the liver enzymes were still high (AST 215U/L and ALT 39U/L, bilirubin total of 6.9 mg/dL) and having lactate dehydrogenase (LDH) of 1,871U/L (normal value <215U/L) patient was given rifampicin 450 mg, isoniazide 300 mg, ethambutol 1,000 mg, streptomycin 750 mg as antituberculosis drugs. We gave no pyrazinamide out of concerns that patient also had malignancy besides tuberculosis although the routine malignancy markers came back negative [carcinoembryonic antigen (CEA), Ca 19–9, alpha-fetoprotein (AFP), and Ca 125]. After initiating the antituberculosis treatment for three days, her bilirubin increased and she fell into sepsis with procalcitonin reaching higher than 100ng/mL, so the antituberculosis therapy was changed to ethambutol, amikacin, moxifloxacin, tygecycline, and fluconazole. She was then getting better and the antituberculosis regimens were continued with ethambutol, moxifloxacin, and streptomycin. Patient was discharged at day-48 with bilirubin level significantly decreased and clinically much improved.
DISCUSSION
In all tuberculosis (TB) patients, disseminated TB is responsible for 1–3% cases, while liver tuberculosis is said to be around 1.2% of all cases or 80–100% of all disseminated TB.3,6,7 Epidemiological data in an endemic area in Iran showed that poor prognosis of disseminated TB often showed blood abnormalities such as low hemoglobin, leucocytes, and thrombocytes. Disseminated TB mortality rate was significantly higher in patients with diabetes, injection drug history and blood abnormalities. Old age (median
Figure 3. Chest X-ray day 19. Infiltration at both apices, posi-tive kerley line on the right middle lobe lung
of 52.7 years; 20–76 years) was seen as another factor affecting liver TB survival.6,7
This patient was first came with jaundice and fever. After narrowing the diagnosis, liver tuberculosis was considered as the primary causation. Liver tuberculosis was finally diagnosed from liver biopsy and staining. The positive result of biopsy, as can be seen in this patient, is rare.3,5
Spreading to liver may occur either hematogenously or milliary TB or direct inoculation through the portal venous system from gastrointestinal (GI) lesions. If the spreading was from the lung or the hepatic artery, the liver TB form would be milliary and if it was from portal vein, the form would be focal TB.3,7
Liver tuberculosis has three presentations. The first and most common presentation is diffuse hepatic involvement that is usually found together with lung or milliary tuberculosis. This presentation was found in more than half of pulmonary tuberculosis cadaver. The second presentation is diffuse hepatic infiltration (granulomatous hepatitis) that happens without any pulmonary involvement. In this presentation, symptoms of liver disease are usually absent. The third and rarest form is a focal/local tuberculoma or abscess.3 This case belongs to the second presentation of hepatic tuberculosis (granulomatous type) with unspecific pulmonary involvement at the initial that further shows an infiltrate at the apices of both lungs.
http://mji.ui.ac.id
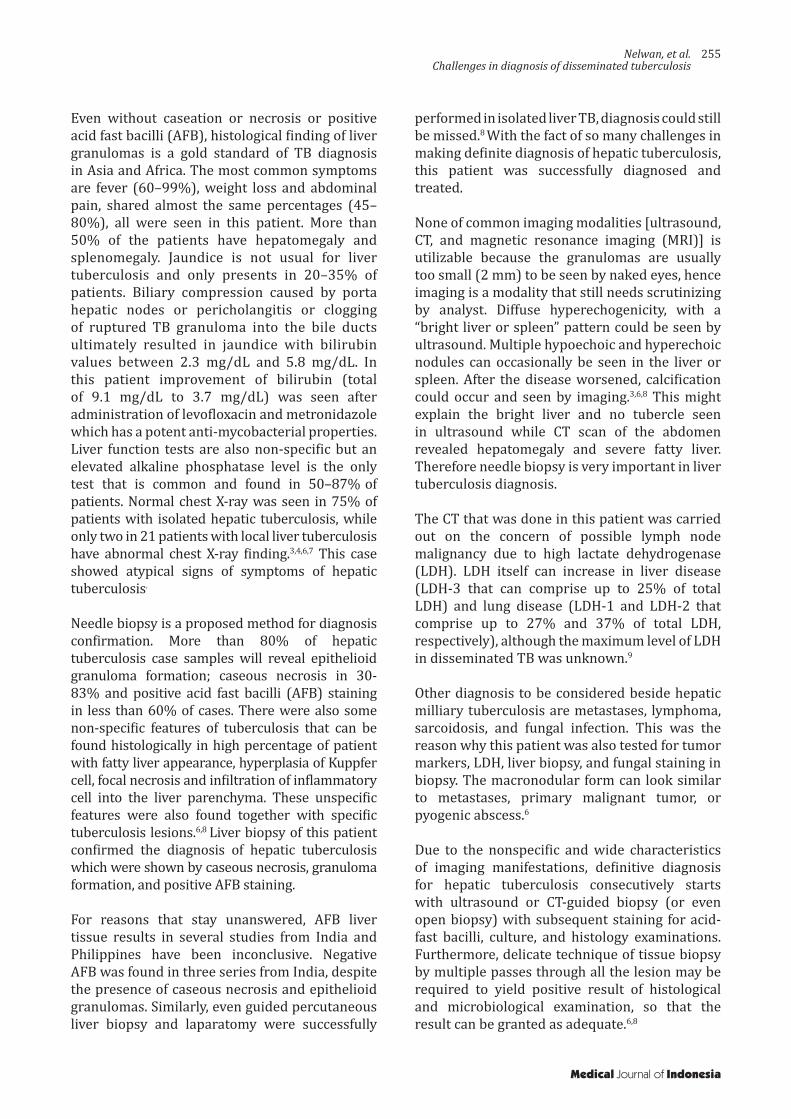
Nelwan, et al.Challenges in diagnosis of disseminated tuberculosis
255
Even without caseation or necrosis or positive acid fast bacilli (AFB), histological finding of liver granulomas is a gold standard of TB diagnosis in Asia and Africa. The most common symptoms are fever (60–99%), weight loss and abdominal pain, shared almost the same percentages (45–80%), all were seen in this patient. More than 50% of the patients have hepatomegaly and splenomegaly. Jaundice is not usual for liver tuberculosis and only presents in 20–35% of patients. Biliary compression caused by porta hepatic nodes or pericholangitis or clogging of ruptured TB granuloma into the bile ducts ultimately resulted in jaundice with bilirubin values between 2.3 mg/dL and 5.8 mg/dL. In this patient improvement of bilirubin (total of 9.1 mg/dL to 3.7 mg/dL) was seen after administration of levofloxacin and metronidazole which has a potent anti-mycobacterial properties. Liver function tests are also non-specific but an elevated alkaline phosphatase level is the only test that is common and found in 50–87%
of
patients. Normal chest X-ray was seen in 75% of patients with isolated hepatic tuberculosis, while only two in 21 patients with local liver tuberculosis have abnormal chest X-ray finding.3,4,6,7 This case showed atypical signs of symptoms of hepatic tuberculosis.
Needle biopsy is a proposed method for diagnosis confirmation. More than 80% of hepatic tuberculosis case samples will reveal epithelioid granuloma formation; caseous necrosis in 30-83% and positive acid fast bacilli (AFB) staining in less than 60% of cases. There were also some non-specific features of tuberculosis that can be found histologically in high percentage of patient with fatty liver appearance, hyperplasia of Kuppfer cell, focal necrosis and infiltration of inflammatory cell into the liver parenchyma. These unspecific features were also found together with specific tuberculosis lesions.6,8 Liver biopsy of this patient confirmed the diagnosis of hepatic tuberculosis which were shown by caseous necrosis, granuloma formation, and positive AFB staining.
For reasons that stay unanswered, AFB liver tissue results in several studies from India and Philippines have been inconclusive. Negative AFB was found in three series from India, despite the presence of caseous necrosis and epithelioid granulomas. Similarly, even guided percutaneous liver biopsy and laparatomy were successfully
performed in isolated liver TB, diagnosis could still be missed.8 With the fact of so many challenges in making definite diagnosis of hepatic tuberculosis, this patient was successfully diagnosed and treated.
None of common imaging modalities [ultrasound, CT, and magnetic resonance imaging (MRI)] is utilizable because the granulomas are usually too small (2 mm) to be seen by naked eyes, hence imaging is a modality that still needs scrutinizing by analyst. Diffuse hyperechogenicity, with a “bright liver or spleen” pattern could be seen by ultrasound. Multiple hypoechoic and hyperechoic nodules can occasionally be seen in the liver or spleen. After the disease worsened, calcification could occur and seen by imaging.3,6,8 This might explain the bright liver and no tubercle seen in ultrasound while CT scan of the abdomen revealed hepatomegaly and severe fatty liver. Therefore needle biopsy is very important in liver tuberculosis diagnosis.
The CT that was done in this patient was carried out on the concern of possible lymph node malignancy due to high lactate dehydrogenase (LDH). LDH itself can increase in liver disease (LDH-3 that can comprise up to 25% of total LDH) and lung disease (LDH-1 and LDH-2 that comprise up to 27% and 37% of total LDH, respectively), although the maximum level of LDH in disseminated TB was unknown.9
Other diagnosis to be considered beside hepatic milliary tuberculosis are metastases, lymphoma, sarcoidosis, and fungal infection. This was the reason why this patient was also tested for tumor markers, LDH, liver biopsy, and fungal staining in biopsy. The macronodular form can look similar to metastases, primary malignant tumor, or pyogenic abscess.6
Due to the nonspecific and wide characteristics of imaging manifestations, definitive diagnosis for hepatic tuberculosis consecutively starts with ultrasound or CT-guided biopsy (or even open biopsy) with subsequent staining for acid-fast bacilli, culture, and histology examinations. Furthermore, delicate technique of tissue biopsy by multiple passes through all the lesion may be required to yield positive result of histological and microbiological examination, so that the result can be granted as adequate.6,8
Medical Journal of Indonesia

256 Med J Indones, Vol. 24, No. 4December 2015
Disseminated tuberculosis is treated with standard antituberculosis drugs (intensive phase, two months including isoniazide (INH), rifampicin, streptomycin, and pyrazinamide; intermittent phase, seven months including INH and rifampicin) are required.3-6,10 This can be challenging for some physicians in giving antituberculosis drugs to people with liver disease, hence liver tuberculosis.
The study of Essop et al11 showed that when
both isoniazide and rifampicin are used, it can decrease favorably mortality rates compared to regimen not using rifampicin (0% vs 17–50%). But still we gave no rifampicin to this patient due to high basal liver enzyme and because this may be due to the small number of samples and still good prognosis in several studies. We will follow the patient liver condition. The antituberculosis will be continued for at least one year.
Fluconazole was given to this patient due to prolonged use of antibiotics although the prevalence of candidaemia was just 5%. Intravenous broad spectrum antibiotics (p<0.001), oral broad spectrum antibiotics (p<0.010), and indwelling catheters (p<0.010) were the three important risk factors of candidemia in TB patients.12
For patients that have obstructive jaundice, a magnetic resonance cholangiopacreatography (MRCP) order is first to determine problems in the biliary tract, knowing the site of obstruction to decompress then either by stent insertion during endoscopic retrograde cholangiopancreatography (ERCP) or by percutaneous transhepatic biliary drainage if stent insertion fails. Surgical decompression should be considered if needed.6 We did not decompress patient due to no visible obstruction in ultrasound or CT and when the bilirubin level rose, the patient condition got worsened. After assessing risk of infection due to MRCP/ERCP, we decided to do no decompression.
Mortality rate of liver tuberculosis was high (15–42%) and associated with young age, milliary TB, use of steroid, acquired immunodeficiency syndrome (AIDS), wasting, chronic end liver disease. About half of the patients with liver tuberculosis mortality in the Philippines study were due to respiratory failure and ruptured esophageal varices respectively.
AIDS is also the main cause of
death in patients with both AIDS and tuberculosis. Report on the drug induced hepatotoxicity is not
found in many studies of hepatic tuberculosis even with the use of rifampicin.6, 7
In conclusion, despite many challenges in diagnosing hepatic TB, the disease can be cured. Liver TB diagnosis can be a problem because there is no easy way to timely diagnose it since the gold standard is histological finding. Patient’s symptoms, signs, and imaging manifestations are not typical. This case illustration wants to emphasize the importance of considering the diagnosis of disseminated tuberculosis in prolonged fever even in otherwise healthy adults.
Conflicts of InterestThe authors affirm no conflict of interest in this study.
REFERENCES
1. Firmansyah I, Jong JB, Noorwati, Nainggolan L. Liver tuberculosis as an etiology in fever of unknown origin. Acta Med Indones. 2005;37(2):91–3.
2. Wu Z, Wang WL, Zhu Y, Cheng JW, Dong J, Li MX, et al. Diagnosis and treatment of hepatic tuberculosis: report of five cases and review of literature. Int J Clin Exp Med. 2013;6(9):845–50.
3. Purl A, Nayyar AK, Vij JC. Hepatic tuberculosis. Ind J Tub. 1994;41:131–4.
4. Tai W, Kuo C, Lee C, Chuah S, Huang C, Hu T, et al. Liver tuberculosis in Southern Taiwan: 15-years clinical experience. J Intern Med Taiwan. 2008;19:410–7.
5. Andres SC, Tan-Alora A. A case series on disseminated tuberculosis. Phil J Microbiol Infect Dis. 2001;30(1):29–35.
6. Alvarez S. Hepatobiliary tuberculosis. J Gastroenterol Hepatol. 1998;13(8):833–9.
7. Hasibi M, Rasoulinejad M, Hosseini SM, Davari P, Sahebian A, Khashayar P. Epidemiological, clinical, laboratory findings, and outcomes of disseminated tuberculosis in Tehran, Iran. South Med J. 2008;101(9):910–3.
8. Vanhoenacker FM, De Backer Al, Op de BB, Maes M, Van Altena R, Van Beckevoort D, et al. Imaging of gastrointestinal and abdominal tuberculosis. Eur Radiol. 2004;14(Suppl3):103–15.
9. Sharma PR, Jain S, Bamezai RN, Tiwari PK. Utility of serum LDH isoforms in the assessment of mycobacterium tuberculosis induced pathology in TB patients of Sahariya tribe. Indian J Clin Biochem. 2010;25(1):57–63.
10. Pandit V, Valsalan R, Seshadri S, Bahuleyan S. Disseminated tuberculosis presenting as mesenteric and cerebral abscess in HIV infection: case report. Braz J Infect Dis. 2009;13(5):383–6.
11. Essop AR, Posen JA, Hodkinson JH, Segal I. Tuberculous hepatitis: a clinical review of 96 cases. Q J Med. 1984;53(212):465–77.
12. Akhila JS, Prabbha A, Sartish R, John R, Shashidhar K, Ajee K. Candidaemia in disseminated TB. J Clin Diag Res. 2010;4:3465–7.
http://mji.ui.ac.id
July, et al.Isolated petrous apex craniopharyngioma
257
Isolated petrous apex ectopic craniopharyngioma
Keywords: petrous apex tumor, primary ectopic craniopharyngioma, transphenoid
pISSN: 0853-1773 • eISSN: 2252-8083 • http://dx.doi.org/10.13181/mji.v24i4.1261 • Med J Indones. 2015;24:257–61• Received 03 Jul 2015 • Accepted 12 Dec 2015
Correspondence author: Julius July, [email protected]
Copyright @ 2015 Authors. This is an open access article distributed under the terms of the Creative Commons Attribution-NonCommercial 4.0 International License (http://creativecommons.org/licenses/by-nc/4.0/), which permits unrestricted non-commercial use, distribution, and reproduction in any medium, provided the original author and source are properly cited.
Julius July,1 Eka J. Wahjoepramono,1 Sutisna Himawan,2 Alexander Cahyadi31 Department of Neurosurgery, Faculty of Medicine, Universitas Pelita Harapan, Neuroscience Center, Siloam Hospital Lippo
Village, Tangerang, Banten, Indonesia2 Department of Pathology Anatomic, Faculty of Medicine, Universitas Indonesia, Jakarta, Indonesia3 Division of Neurosurgery, Yos Sudarso Hospital, Padang, Indonesia
Case Report
Medical Journal of Indonesia
ABSTRAK
Kraniofaringioma ektopik primer jarang sekali dijumpai, dan hingga saat ini belum pernah ada laporan yang menyampaikan lokasinya yang ektopik di apeks tulang petrosus. Penelitian ini melaporkan satu kasus pria berusia 26 tahun yang mengeluhkan nyeri kepala dan pandangan ganda akibat kelemahan saraf kranialis VI (nervus abducent). Hasil pemeriksaan CT dan MRI memperlihatkan lesi kistik di dalam petrous apex kanan. Tidak terlihat tanda-tanda keterlibatan bagian sella maupun suprasella. Pasien menjalani operasi pengangkatan tumor via prosedur endoskopi endonasal transphenoid. Pemeriksaan histopatologi menunjukkan suatu kraniofaringioma adamantinomatosus. Sejauh ini, kasus ini merupakan laporan kasus pertama kraniofaringioma ektopik primer yang terisolasi pada apeks tulang petrosus. Kraniofaringioma ektopik primer terjadi karena proses multifaktor yang diawali oleh kesalahan embriologi saat migrasi sel, dan laporan kasus ini bisa menjadi fakta pendukung tehadap pemahaman tersebut.
ABSTRACT
Primary ectopic craniopharyngioma is a rare entity. Isolated petrous apex bone location has not been reported previously. This study reports a case of 26-year-old male with right abducent nerve palsy. CT and MRI imaging reveal right petrous apex cystic lesion. No sellar or suprasellar region involvement was found. Endoscopic endonasal transphenoid approach has been successfully performed. Histopathology examination confirms the diagnosis of adamantinomatous craniopharyngioma. So far, it’s probably the first case report of primary ectopic craniopharyngioma isolated in the petrous apex. This case report supports the premise that primary ectopic craniopharyngioma is a multifactorial process that starts with an error from migrated embryological cells.
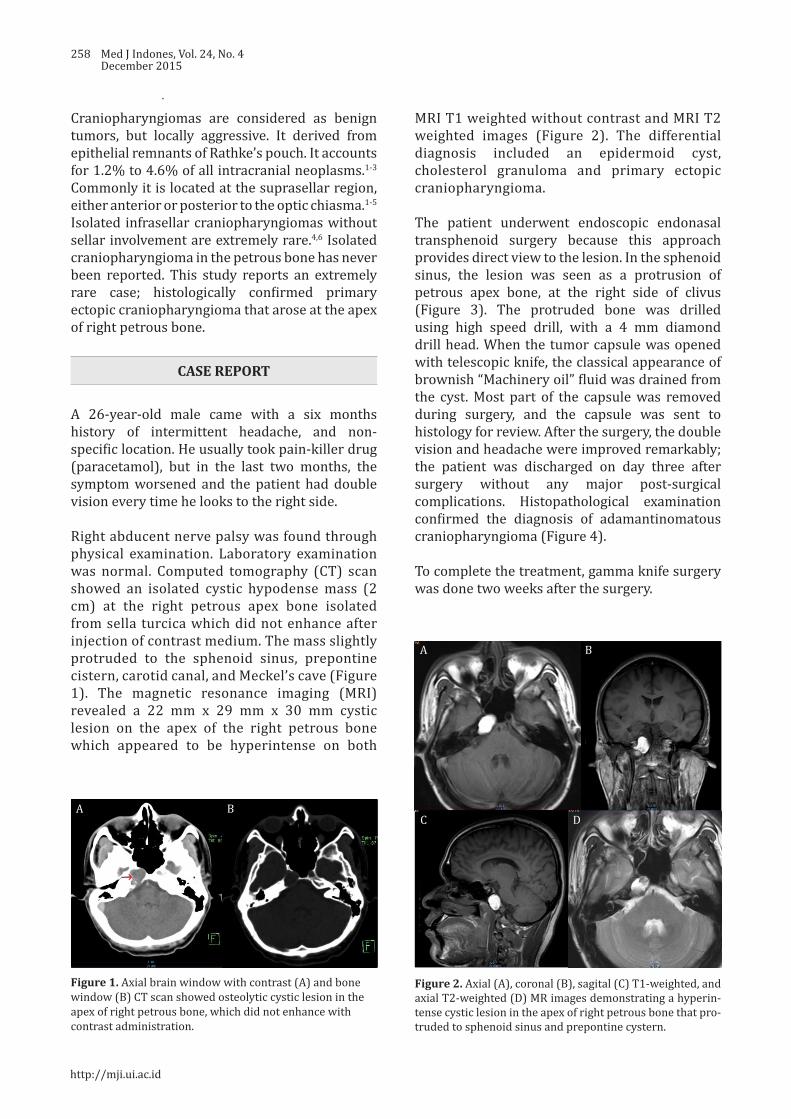
258 Med J Indones, Vol. 24, No. 4December 2015
Craniopharyngiomas are considered as benign tumors, but locally aggressive. It derived from epithelial remnants of Rathke’s pouch. It accounts for 1.2% to 4.6% of all intracranial neoplasms.1-3 Commonly it is located at the suprasellar region, either anterior or posterior to the optic chiasma.1-5
Isolated infrasellar craniopharyngiomas without sellar involvement are extremely rare.4,6 Isolated craniopharyngioma in the petrous bone has never been reported. This study reports an extremely rare case; histologically confirmed primary ectopic craniopharyngioma that arose at the apex of right petrous bone.
CASE REPORT
A 26-year-old male came with a six months history of intermittent headache, and non-specific location. He usually took pain-killer drug (paracetamol), but in the last two months, the symptom worsened and the patient had double vision every time he looks to the right side.
Right abducent nerve palsy was found through physical examination. Laboratory examination was normal. Computed tomography (CT) scan showed an isolated cystic hypodense mass (2 cm) at the right petrous apex bone isolated from sella turcica which did not enhance after injection of contrast medium. The mass slightly protruded to the sphenoid sinus, prepontine cistern, carotid canal, and Meckel’s cave (Figure 1). The magnetic resonance imaging (MRI) revealed a 22 mm x 29 mm x 30 mm cystic lesion on the apex of the right petrous bone which appeared to be hyperintense on both
Figure 1. Axial brain window with contrast (A) and bone window (B) CT scan showed osteolytic cystic lesion in the apex of right petrous bone, which did not enhance with contrast administration.
MRI T1 weighted without contrast and MRI T2 weighted images (Figure 2). The differential diagnosis included an epidermoid cyst, cholesterol granuloma and primary ectopic craniopharyngioma.
The patient underwent endoscopic endonasal transphenoid surgery because this approach provides direct view to the lesion. In the sphenoid sinus, the lesion was seen as a protrusion of petrous apex bone, at the right side of clivus (Figure 3). The protruded bone was drilled using high speed drill, with a 4 mm diamond drill head. When the tumor capsule was opened with telescopic knife, the classical appearance of brownish “Machinery oil” fluid was drained from the cyst. Most part of the capsule was removed during surgery, and the capsule was sent to histology for review. After the surgery, the double vision and headache were improved remarkably; the patient was discharged on day three after surgery without any major post-surgical complications. Histopathological examination confirmed the diagnosis of adamantinomatous craniopharyngioma (Figure 4).
To complete the treatment, gamma knife surgery was done two weeks after the surgery.
Figure 2. Axial (A), coronal (B), sagital (C) T1-weighted, and axial T2-weighted (D) MR images demonstrating a hyperin-tense cystic lesion in the apex of right petrous bone that pro-truded to sphenoid sinus and prepontine cystern.
A B
A B
C D
→
http://mji.ui.ac.id
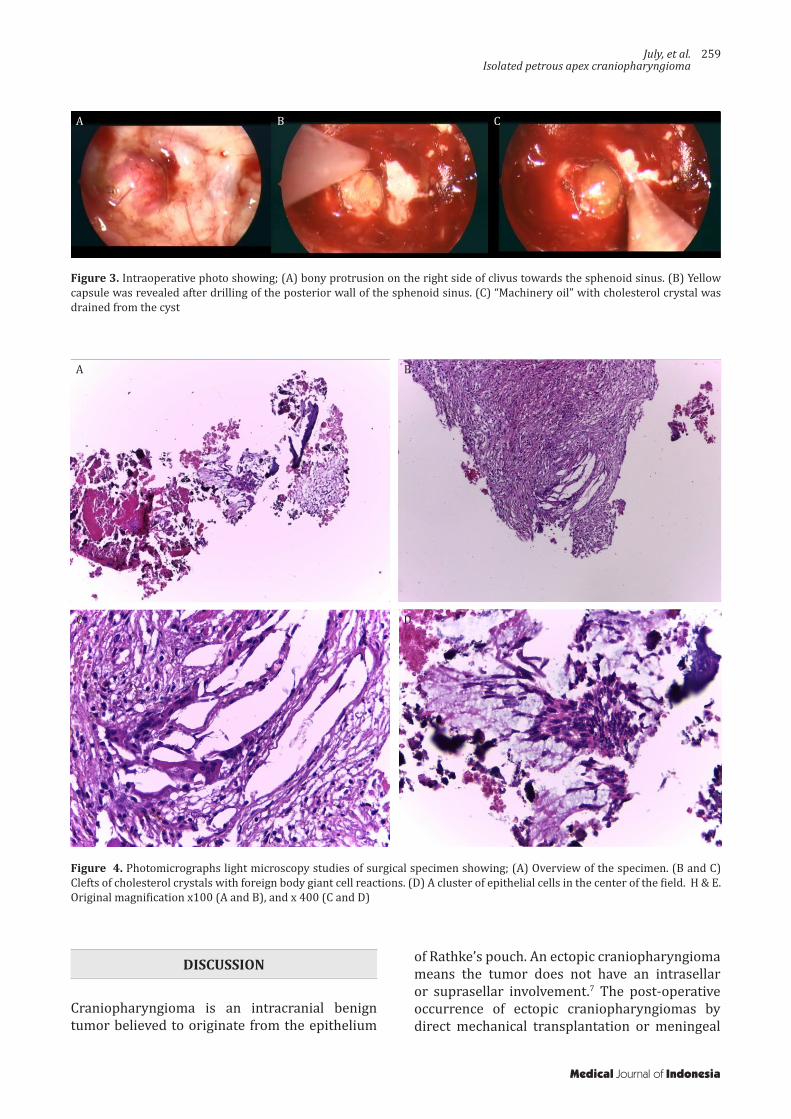
July, et al.Isolated petrous apex craniopharyngioma
259
Figure 3. Intraoperative photo showing; (A) bony protrusion on the right side of clivus towards the sphenoid sinus. (B) Yellow capsule was revealed after drilling of the posterior wall of the sphenoid sinus. (C) “Machinery oil” with cholesterol crystal was drained from the cyst
Figure 4. Photomicrographs light microscopy studies of surgical specimen showing; (A) Overview of the specimen. (B and C) Clefts of cholesterol crystals with foreign body giant cell reactions. (D) A cluster of epithelial cells in the center of the field. H & E. Original magnification x100 (A and B), and x 400 (C and D)
DISCUSSION
Craniopharyngioma is an intracranial benign tumor believed to originate from the epithelium
of Rathke’s pouch. An ectopic craniopharyngioma means the tumor does not have an intrasellar or suprasellar involvement.7 The post-operative occurrence of ectopic craniopharyngiomas by direct mechanical transplantation or meningeal
A B C
A B
C D
Medical Journal of Indonesia

260 Med J Indones, Vol. 24, No. 4December 2015
seeding is a recognized phenomenon.3,8
Nevertheless, histologically confirmed primary craniopharyngioma at an ectopic location is rare, although cases of epidural,5 frontotemporal,8 posterior fossa,2,6,9 and infrasellar craniopharyngiomas1,4,10,11 have been reported. On the other hand, primary isolated petrous apex craniopharyngioma has not been previously reported.
Two hypotheses have been proposed for the development of a craniopharyngioma. The first was proposed by Erdheim, in which they may arise from any location along the craniopharyngeal duct. The second supports the squamous cell nests that may derive from metaplastic change of adenohypophyseal cells.1,7 It has been accepted that aberrations in the sequence of origin during embryogenesis result in the formation of craniopharyngiomas and their variable location. In the beginning of embryogenesis processes, glandular part arises from the out pouching of the ectodermal epithelium covering the roof of stomadeum, called the Rathkes diverticulum. The Rathkes diverticulum then invaginates and penetrates the mesenchyme in the direction of the diencephalon and forms the Rathkes pouch. The cell of Rathkes pouch rapidly proliferates and follows the sphenoid bone development until it get to the sella turcica. The Rathkes pouch comes together with neuroectoderm of neurohypophysis, which descends from third ventricle of embryonic brain, and finally become adenohypophysis. The extracranial passage is extending from the junction between the posterior nasal septum and palatum to the anterior part of the sphenoidal hypophyseal fossa.1,4 In this case, the tumor was located in the right petrous apex with no connection to the craniopharyngeal duct. So far, there is no consensus for a primary ectopic craniopharyngioma. The cause for primary ectopic craniopharyngioma was believed as multifactorial and it starts with an error in mismigrated embryological cells in addition to mutations of oncogenes and tumor suppressor genes in which different endocrinological growth and vascular factors produce an ideal environment.7
The clinical manifestations are defined by the tumor’s location that compressing the surrounding neurovascular structures. Generally, the symptoms could consist of visual, endocrine, or cognitive disturbance, and all the symptoms related with high intracranial pressure.1-11 In
this case, the symptom was only double vision with esotropia (in-turning eye) on examination. We believed that it was caused by compression on the sixth nerve by tumor protrusion to the prepontine cistern and the direct compression to the Dorello’s canal. It’s supported by the fact that the patient’s symptoms were improved remarkably after surgery, the patient was sent home on the third day after surgery with almost no double vision and headache.
CT scan and MRI are preferred when diagnosing craniopharyngiomas.1,4,6 CT scans play an important role in identifying bony anatomy and calcifications. MRI will show tumor extension and its consistency, both solid or cystic part, enhanced scanning range and the relationship to adjacent neurovascular structures. Although CT scans are more specific to display calcified tissue, MRI can provide detail measurement of tumor range for the surgical approach. It is not difficult to diagnose typical craniopharyngioma, but for the non-typical location and imaging manifestations, the combination of both CT and MRI would be very helpful. The differential diagnosis would be epidermoid cyst, but usually the diffusion MR would be able to differentiate epidermoid from other lesion.
The direct surgical approach through spenoid sinus is very simple and provides direct view for the surgeon. When the tumor capsule was opened, “machinery oil” fluid with shimmering cholesterol crystals came out which suggested cranio-pharyngioma. It was confirmed adamantinomatous craniopharyngioma. Adamantinomatous type seen mainly in children with poor overall outcome and a squamous papillary type which is more common in adults with a better prognosis. The cystic components in adamantinomatous type are often described as having a characteristic “machinery oil” interior, containing desquamated squamous epithelium and comprised mainly of keratin and cholesterol.12
Although during surgery we believe that we had removed most part of the tumor capsule, we still feel it is necessary to apply radiation to the tumor bed to prevent recurrence.
Primary ectopic craniopharyngioma, especially isolated in the apex petrous bone is a very rare case.
http://mji.ui.ac.id

July, et al.Isolated petrous apex craniopharyngioma
261
In conclusion, to the best of author’s knowledge, it’s probably the first case report of primary ectopic craniopharyngioma isolated in the petrous apex. This case report supports the premise that primary ectopic craniopharyngioma is a multifactorial process that starts with an error from mismigrated embryological cells.
Conflicts of interestThe authors affirm no conflict of interest in this study.
REFERENCES
1. Yu X, Liu R, Wang Y, Wang H, Zhao H, Wu Z. Infrasellar craniopharyngioma. Clin Neurol Neurosurg. 2012;114(2):112–9.
2. Khalatbari MR, Borghei-Razavi H, Samadian M, Moharamzad Y, Schick U. Isolated primary craniopharyngioma in the cerebellopontine angle. J Clin Neurosci. 2012;19(11):1516–9.
3. Jakobs M, Orakcioglu B. Ectopic recurrent craniopharyngioma of the frontal bone. J Neurosurg. 2012;117(3):490–7.
4. Senthilvel HN, Krishnan SS, Vasudevan MC. Extracranial infrasellar craniopharyngioma. Neurol India. 2014;62(1):100–3.
5. Banczerowski P, Bálint K, Sipos L. Temporal extradural ectopic craniopharyngioma. Case report. J Neurosurg. 2007;107(1):178–80.
6. Yan Y, Tang WY, Yang G, Zhong D. Isolated cerebellopontine angle craniopharyngioma. J Clin Neurosci. 2009;16(12):1655–7.
7. Ortega-Porcayo LA, Ponce-Gómez JA, Martínez-Moreno M, Portocarrero-Ortíz L, Tena-Suck ML, Gómez-Amador JL. Primary ectopic frontotemporal craniopharyngioma. Int J Surg Case Rep. 2015;9:57–60.
8. Bianco Ade M, Madeira LV, Rosemberg S, Shibata MK. Cortical seeding of a craniopharyngioma after craniotomy: case report. Surg Neurol. 2006;66(4):437–40.
9. Bozbuga M1, Turan Suslu H, Hicdonmez T, Bayindir C. Primary cerebellopontine angle craniopharyngioma in a patient with Gardner syndrome. J Clin Neurosci. 2011;18(2):300–1.
10. Kawamata T, Kubo O, Kamikawa S, Hori T. Ectopic clival craniopharyngioma. Acta Neurochir (Wien). 2002;144(11):1221–4.
11. Lee YH, Kim SD, Lim DJ, Park JY, Chung YG, Kim YS. Isolated petroclival craniopharyngioma with aggressive skull base destruction. Yonsei Med J. 2009;50(5):729–31.
12. Zada G, Lin N, Ojerholm E, Ramkissoon S, Laws ER. Craniopharyngioma and other cystic epithelial lesions of the sellar region: a review of clinical, imaging, and histopathological relationships. Neurosurg Focus. 2010;28(4):E4.
Medical Journal of Indonesia
http://www.ncbi.nlm.nih.gov/pubmed/?term=Khalatbari MR%5BAuthor%5D&cauthor=true&cauthor_uid=22595351
http://www.ncbi.nlm.nih.gov/pubmed/?term=Senthilvel HN%5BAuthor%5D&cauthor=true&cauthor_uid=24608482