Ecosystem Principles and Objectives for Lake Superior ...
118
1 PART 1 of 2 LAKE SUPERIOR BINATIONAL PROGRAM __________________________________________________________________________ ECOSYSTEM PRINCIPLES AND OBJECTIVES FOR LAKE SUPERIOR (UPDATED AND REVISED) __________________________________________________________________________ prepared by the Lake Superior Work Group in partnership with The Lake Superior Binational Forum with consideration of comments obtained through public consultation in the Lake Superior Basin Suggested Citation: Lake Superior Binational Program. 1998. Ecosystem principles and objectives, indicators and targets for Lake Superior (revision date). Lake Superior Work Group of the Lake Superior Binational Program, Thunder Bay, Ontario. 110 p.
-
Upload
khangminh22 -
Category
Documents
-
view
1 -
download
0
Transcript of Ecosystem Principles and Objectives for Lake Superior ...
1
PART 1 of 2
LAKE SUPERIOR BINATIONAL PROGRAM
__________________________________________________________________________
ECOSYSTEM PRINCIPLES AND
OBJECTIVES
FOR LAKE SUPERIOR
(UPDATED AND REVISED)__________________________________________________________________________
prepared by the
Lake Superior Work Group
in partnership with
The Lake Superior Binational Forum
with consideration of comments obtained through public consultation in the Lake Superior Basin
Suggested Citation:
Lake Superior Binational Program. 1998. Ecosystem principles and objectives, indicatorsand targets for Lake Superior (revision date). Lake Superior Work Group of the LakeSuperior Binational Program, Thunder Bay, Ontario. 110 p.

2
Revision Date: May 4, 1998
3
PREFACE
A VISION FOR LAKE SUPERIOR
Endorsed by the Lake Superior Binational Forum on January 31, 1992as an expression of the hearts and minds of all of us.
As citizens of Lake Superior, we believe...
that water is life and the quality of water determines the quality of life.
We seek a Lake Superior watershed...
that is a clean, safe environment where diverse life forms exist in harmony; where the environment cansupport and sustain economic development and where citizens are committed to regional cooperation and apersonal philosophy of stewardship;
that is free of toxic substances at levels that threaten fish, wildlife and human health; where people candrink the water or eat the fish anywhere in the lake without restrictions;
where wild shorelines and islands are maintained and where development is well planned, visuallypleasing, biologically sound and conducted in an environmentally benign manner;
which recognizes that environmental integrity provides the foundation for a healthy economy and that theingenuity which results from clean, innovative and preventive management and technology can provide aneconomic transformation for the region;
where citizens accept the personal responsibility and challenge of pollution prevention in their own lives andlifestyles and are committed to moving from a consumer society to a conserver society; and
where there is greater cooperation, leadership and responsibility among citizens of the basin for defininglong-term policies and procedures which will protect the quality and supply of water in Lake Superior for futuregenerations.
We believe that by effectively addressing the issues of multiple resource management in Lake Superior, theworld's largest lake can serve as a worldwide model for resource management.
4
INTRODUCTION
In its fifth Biennial report on Great Lakes Water Quality (IJC 1989), the International Joint Commissionrecommended to Canada and the United States, as parties to the Great Lakes Water Quality Agreement(GLWQA), that Lake Superior receive designation as "a demonstration area where no point source of anypersistent, toxic substance will be permitted". The parties responded to this recommendation by establishingthe Binational Program to Restore and Protect the Lake Superior Basin. The Binational Program is committedto the zero discharge objective, and integrates this with a broader program to restore beneficial uses which havebeen lost, and to protect and restore ecosystem integrity in Lake Superior and its watershed. The Lake SuperiorWork Group (comprised of representatives from government environmental and natural resource agencies) andthe Lake Superior Binational Forum (comprised of representatives from public and industry groups) wereestablished to guide and implement the Binational Program.
A Vision for Lake Superior, which prefaces this document, expresses the commitment and desire of the LakeSuperior community to foster a healthy, clean, and safe Lake Superior ecosystem. It reflects the diversepathways and mechanisms by which humans and nature interact within land and water ecosystems, andchallenges the inhabitants of the Lake Superior watershed to accept personal responsibility for protecting theLake and the landscape that sustains it. The Vision Statement specifies broad, powerful objectives for the LakeSuperior ecosystem, in plain language.
PURPOSE
The Ecosystem Principles and Objectives for Lake Superior Discussion Draft is intended to:
1) expand the broad objectives of A Vision For Lake Superior into more specific ecosystemprinciples and objectives for key elements of the Lake Superior ecosystem, including aquaticcommunities, terrestrial wildlife, habitat, human health, and sustainability. This discussion document willundergo basin-wide public review to refine these ideas, and to help develop broad community consensusregarding ecosystem principles and objectives for Lake Superior. Ecosystem principles and objectivesdeveloped by consensus do not obviate or override regulations, laws and guidelines set by governments andresource regulatory agencies. Rather, the Lake Superior Ecosystem Principles and Objectives have beenprepared to encourage informed discussion of the vision and practice essential for proactive, sustainablemanagement of the Lake Superior ecosystem.
2) facilitate progress towards a set of informative ecosystem indicators, with quantitative targets, bywhich the health of the Lake Superior basin ecosystem, including its physical, biotic and cultural elements,can be measured. This next step is primarily a technical process based on expert consultation, whereindicators and targets will be identified through consideration of relevant ecological, economic and culturaldata. The ecosystem indicators and targets will address the Lake Superior ecosystem principles andobjectives, and will reflect practical constraints faced by agencies responsible for environmental monitoringin the Lake Superior basin.
3) provide guidance for land and water management in the Lake Superior ecosystem. EcosystemPrinciples and Objectives for Lake Superior are intended to assist regulators, managers and publics who areworking to sustain and rehabilitate this greatest of the Great Lakes. These principles and objectives willestablish Lake Superior as an ecological mirror not only for the region, but for the biosphere, by helping toanswer the question: "What must we do now to ensure the existence of an intact and healthy Lake Superiorecosystem 500 years from now?"
SCOPE AND BACKGROUND

5
Ecosystem principles and objectives must be formulated with reference to a spatial context for the term"ecosystem". Here, we adopt an ecosystem context that emphasizes land-water linkages in the Lake Superiorwatershed (also basin, catchment, or drainage), as specified in the 1978 Great Lakes Water Quality Agreement. For the purposes of this document, the Lake Superior ecosystem refers to the interacting components of air, land,water and living organisms, including humans, within the watershed of Lake Superior.
The IJC selected Lake Superior as a demonstration area because the lake and its watershed were in arelatively pristine state. Lake Superior's small, granitic watershed and deep lake basin make its waters clearand remarkably attractive. It's shores are sparsely populated in comparison with the other Great Lakes, and thephysical structure of the coastal zone is largely unaltered by humans. However, casual examination of thecrystal waters and scenic shorelines does not reveal important changes that have occurred in the lake and itswatershed over the last 150 years or so. The Lake Superior basin contains eight of the 43 Great Lakes sites thathave been identified by the International Joint Commission as environmental Areas of Concern. Althoughpollution control efforts over the last twenty years have improved environmental quality in these developedareas, they still fail to meet the environmental standards specified in the Great Lakes Water QualityAgreement. Control structures at the outflow of Lake Superior have affected wetland habitat in some shallowbays and the St. Marys River, by reducing water level fluctuations. Many of the largest and most productivebays and river mouths on Lake Superior have been degraded since the late 1800's by waste inputs, primarilyfrom sawmills, pulp and paper mill effluents, mine tailings, municipal sewage, and charcoal, coal gasificationand chemical plants (Ryder 1968; Lawrie and Rahrer 1973; Waters 1987; Botts, Krushelnicki et al. 1988). These effects resulted for the most part from resource extraction and associated land uses within the LakeSuperior watershed.
Unfortunately, airborne contaminants coming from outside the basin are causing impacts of their own. Through its physical characteristics, Lake Superior is tightly linked to regional and global air pollution. Thelarge surface area of the lake makes it a good collector and mobilizer of airborne contaminants through theorganic "surface film" at the air-water interface (Eisenreich 1982). This surface film may be the largest singlevector for contamination of Lake Superior. Once contaminants enter the lake, they tend to stay there for a longtime. Lake Superior has a large volume and relatively small discharge, making the average residence time fordissolved or suspended contaminants about 200 years (Quinn 1992).
Fish populations in Lake Superior have undergone profound changes, and continue to change today. Although some of these changes are believed to have been a result of overfishing and introductions of exoticspecies such as sea lamprey, rainbow smelt, rainbow trout, Pacific salmon, ruffe, zebra mussel and rustycrayfish, the mechanisms are poorly understood, even today (Lawrie and Rahrer 1973; MacCallum and Selgeby1987; Pratt et al. 1992; Hansen 1994). Some changes may become moderated over time, as native speciesexhibit population recovery. This is currently happening to varying degrees with lake trout, lake herring,siscowet and walleye.
There is a strong correlation between the intensity of industrial, agricultural, and urban land use, and theseverity of ecosystem degradation in the Great Lakes. The shoreline and watershed of Lake Superior currentlysupport a much lower density of human development and industry than the other Great Lakes. This accident ofgeography, climate, and land use, rather than any proactive planning, is the primary reason that the LakeSuperior ecosystem is as healthy as it is. Industrial development, urban development, and natural resourceexploitation are all likely to increase within the Lake Superior watershed. If the health of the Lake Superiorecosystem is to be protected and improved, the causal linkages between human activity and ecosystemdegradation must be modified or severed. This will occur in many ways, including the implementation of newand existing technologies for waste treatment, through abandonment of inappropriate or unnecessary industrialprocesses, through development of new land uses in some areas, through modification of existing land uses inother areas, and through active rehabilitation of degraded ecosystem features.

6
Present Ecosystem Objective for Lake Superior
The Great Lakes Water Quality Agreement of 1978, as amended in 1987, specifies an ecosystem objectivefor Lake Superior. This objective is based on an indicator species concept developed and documented in Ryderand Edwards (1985). The GLWQA ecosystem objective for Lake Superior reads as follows, in the Supplement toAnnex 1, item 3a:
"The Lake should be maintained as a balanced and stable oligotrophic ecosystem with lake trout as the top aquatic predator of a cold-
water community and the Pontoporeia hoyi as a key organism in the food chain"
The ecosystem health indicators and targets for this objective are also specified in the GLWQA, Annex 11, item4a:
"Lake Trout
Productivity greater than 0.38 kilograms/hectare;
Stable, self-producing stocks;
Free from contaminants at concentrations that adversely affect the trout themselves or the quality of the harvested products.
Pontoporeia hoyi (NOTE: now Diporeia hoyi)
The abundance of the crustacean Pontoporeia hoyi, maintained throughout the entire lake at present levels of 220 - 320/(metres)2
(depths less than 100 metres) and 30 - 160/(metres)2 (depths greater than 100 metres)"
The indicator species approach adopted in the GLWQA is explicitly based on a historical, pristinebenchmark (Ryder and Edwards 1985), and identifies a clear target and trajectory for rehabilitation of degradedecosystem elements. However, the current indicators are of limited value in assessing ecosystem health inhabitats other than the oligotrophic, open water portions of the lake, i.e. in nearshore areas such asembayments, river mouths and wetlands. In addition, an indicator species approach that focuses on only twospecies may not be reliably diagnostic of the cause of degradation. Ryder and Edwards (1985) anticipated theseconcerns, and recommended development of indicators representative of these other habitats, and representativeof specific degradative mechanisms, where that is possible.
The Great Lakes Fishery Commission has published fish community objectives for Lake Superior (Busiahn1990), with the following goal:
"To provide fish communities, based on foundations of stable, self-sustaining stocks, supplemented by judicious plantings of hatchery-
reared fish, and provide from these communities an optimum contribution of fish, fishing opportunities and associated benefits to
meet needs identified by society for: wholesome food, recreation, employment and income, and a healthy human environment"
Fish community objectives are specified for forage fish, predators, other species, sea lamprey, and habitat. Theyfocus on the importance of native, naturally reproducing fish communities, on the need to maintain sea lampreypopulations at low levels, and on protection and restoration of habitats supporting Lake Superior fisheries.
ECOSYSTEM PRINCIPLES AND OBJECTIVES FOR LAKE SUPERIOR
In drafting the following ecosystem principles and objectives for Lake Superior, we have followed the lead of theEcosystem Objectives Work Group developing ecosystem objectives and their environmental indicators for LakeOntario (Bertram and Reynoldson 1992). In most cases we have modified or expanded the Lake Ontario

7
objectives to address the extremely high standards of protection and rehabilitation that have emerged from theBinational Program to Restore and Protect the Lake Superior Basin. The ecosystem principles and objectivespresented in this document are intended to be compatible with, and complementary to the existing ecosystemobjectives adopted by the Great Lakes Water Quality Agreement and the Great Lakes Fishery Commission.
1) General Objective
Human activity in the Lake Superior basin should be consistent with A Vision For Lake Superior, whichprefaces this document. Future development of the basin should protect and restore the beneficial usesdescribed in Annex 2 of the Great Lakes Water Quality Agreement.
2) Chemical Contaminants Objective
Summary
Levels of persistent, bioaccumulative toxic chemicals should not impair beneficial uses of the natural resourcesof the Lake Superior basin. Levels of chemical contaminants which are persistent, bioaccumulative and toxicshould ultimately be virtually eliminated in the air, water and sediment in the Lake Superior basin.
Sub-Objectives: Sources
a) Per the Binational Program to Restore and Protect the Lake Superior Basin, the management goal for thenine designated persistent, bioaccumulative toxic chemicals is zero discharge and zero emission fromsources within the Lake Superior basin.
b) Per the Great Lakes Water Quality Agreement, atmospheric deposition of persistent, bioaccumulative toxicchemicals that have an anthropogenic origin should be virtually eliminated.
Sub-Objectives: Environmental Impacts*
c) Open lake concentrations of the chemicals in the zero discharge and zero emission category or the lakewideremediation category should not exceed the most sensitive yardstick of environmental quality (Smith andSmith, 1993).
d) Concentrations of zero discharge and lakewide remediation chemicals in sediment in nearshore areas(<80m.), and in harbors and bays, should not cause or contribute to impaired uses in the Lake Superiorecosystem. Concentrations of local remediation chemicals in sediment should not impair uses in Areas ofConcern in the Lake Superior basin.
e) Concentrations of the chemicals in the prevention/monitor category should not increase in air, water orsediment.
f) Initially, the presence of chemicals in the prevention/investigate category should be investigated in theambient environment, in the appropriate media and location(s). In addition, sources of the chemicals in theprevention/investigate category should be identified and the presence or absence of these sources in thebasin should be confirmed. Presence of a source should trigger continued monitoring of the media mostlikely to concentrate the chemical.
8
*note: see Sections 4.4.5 and 5.3 regarding concentrations of the nine designated zero discharge pollutants in fishand wildlife tissue
3) Aquatic Communities Objective
Summary
Lake Superior should sustain diverse, healthy, reproducing and self-regulating aquatic communities closelyrepresentative of historical conditions.
Sub-Objectives
a) Lake trout will continue to be recognized as a valuable integrators and indicators of the health of the LakeSuperior ecosystem. Other aquatic species may also prove useful as ecosystem health indicators for theLake Superior basin.
b) Native aquatic species associations will be recognized as key elements of a healthy Lake Superiorecosystem.
c) Aquatic biota living in the Lake Superior ecosystem should be free from contaminants of human origin.
d) Exotic fish species now present in Lake Superior (including rainbow trout, Pacific salmon and brown trout)should be managed in a way that is compatible with restoration and management goals established fornative fish species by the Lake Superior Committee.
e) New exotic or nuisance species must not be intentionally or unintentionally introduced to waters of the LakeSuperior ecosystem; accidental introductions of exotic species should be eliminated through effective use ofregulatory and technological preventative measures. The use of live bait by anglers must not contribute tothe dispersal of exotic species or genetic stocks.
4) Terrestrial Wildlife Objective
Summary
The Lake Superior ecosystem should support a diverse, healthy, reproducing and self-regulating wildlifecommunity closely representative of historical conditions.
Sub-Objectives
a) Bald eagle populations that nest within the Lake Superior ecosystem should be recognized as valuableintegrators and indicators of the health of the Lake Superior ecosystem. Other wildlife species may alsoprove useful as ecosystem health indicators for the Lake Superior basin; research addressing this possibilityshould be given high priority by agencies and institutions in the Lake Superior basin.
b) Native wildlife will be recognized as key elements of a healthy Lake Superior ecosystem.
c) Wildlife living in the Lake Superior ecosystem should be free from contaminants of human origin.

9
d) Management of game species and their habitat should not be detrimental to native and naturally occurringnon-game wildlife species.
5) Habitat Objective
Summary
Extensive natural environments such as forests, wetlands, lakes and watercourses, are necessary to sustainhealthy native animal and plant populations in the Lake Superior ecosystem, and have inherent spiritual,aesthetic and educational value. Land and water uses should be designed and located in harmony with theprotective and productive ecosystem functions provided by these natural landscape features. Degraded featuresshould be rehabilitated or restored where this is beneficial to the Lake Superior ecosystem.
Sub-Objectives
a) The ecological health of Lake Superior is determined in large part by the health of its tributary lakes andrivers. Land use planning and regulation in the Lake Superior ecosystem should eliminate or avoiddestructive land-water linkages (e.g. erosion of agricultural land, urban stormwater, point and non-pointsources of persistent contaminants), and foster healthy land-water linkages (e.g. continuous streamsidevegetation buffers, on-site treatment of runoff).
b) The long-term consequences of incremental or cumulative landscape change, habitat destruction, andhabitat fragmentation should be anticipated and avoided in the Lake Superior ecosystem, through researchand planning at appropriate spatial and temporal scales.
c) The crucial importance of nearshore, shoreline and wetland aquatic habitats in Lake Superior should beaddressed through continuing efforts to identify, protect and restore key sites for reproduction and rearing offish, water birds, mammals, other wildlife and plants.
6) Human Health Objective
Summary
The health of humans in the Lake Superior ecosystem should not be at risk from contaminants of human origin. The appearance, taste and odour of water and food supplied by the Lake Superior ecosystem should not bedegraded by human activity.
Sub-Objectives
a) Fish and wildlife in the Lake Superior ecosystem should be safe to eat; consumption should not be limitedby contaminants of human origin.
b) Water quality in the Lake Superior ecosystem should be protected where it is currently high, and improvedwhere it is degraded. Surface waters and groundwater should be safe to drink after treatment to removenatural impurities and microorganisms.
c) The waters of Lake Superior should be safe for total body contact activities, even adjacent to urban andindustrial areas.
10
d) Air quality in the Lake Superior ecosystem should be protected where it is currently high, and improvedwhere it is degraded. Communities, industries and regulators outside the Lake Superior ecosystem shouldbe informed of the consequences of long-range atmospheric transport of contaminants into the Lake Superiorbasin.
e) Soils in the Lake Superior ecosystem should not present a hazard to human health through direct contact,dust inhalation or ingestion, groundwater contamination, or crop contamination.
7) Developing Sustainability
Summary
Human use of the Lake Superior ecosystem should be consistent with the highest ethical and scientificstandards for sustainable use. Land, water and air use in the Lake Superior ecosystem should not degrade it,nor any adjacent ecosystems. Use of the basin's natural resources should not impair the natural capability ofthe basin ecosystem to sustain its natural identity and ecological functions, nor should it deny current and futuregenerations the benefits of a healthy, natural Lake Superior ecosystem. Technologies and development plansthat preserve natural ecosystems and their biodiversity should be encouraged.
Sub-Objectives
a) Public and private decisions will be right when they tend to preserve the integrity, stability, and beauty ofthe biotic community (Leopold 1966).
b) The Lake Superior ecosystem provides resources and services to humans. These include water, fibre,minerals, energy, waste transport and treatment, food, recreation, and spiritual sustenance. Theseresources and services should be valued as environmental capital, in the same way that other capital isassigned value.
c) Institutional capacity to integrate technology and sustainable design should be developed within the LakeSuperior ecosystem.
d) The basis for guiding sustainable development at the scale of the Lake Superior ecosystem should be thepattern of land, water and air use, as these affect ecological, social and economic processes.
These principles and objectives for developing sustainability are based on scientific, ethical and environmentalplanning concepts from a number of sources, including: Lee et al. 1992; Architects for Social Responsibility 1991;Ecological Society of America 1991; UNCED 1992; and Government of Canada 1990).

11
REFERENCES
Architects for Social Responsibility. 1991. A sourcebook for environmentally responsible design. Boston Society ofArchitects. 33p.
Bertram, P.E. and T.B. Reynoldson. 1992. Developing ecosystem objectives for the Great Lakes: policy, progress andpublic participation. Journal of Aquatic Ecosystem Health. 1:89-95.
Botts, L., B. Krushelnicki et al. 1988. The Great Lakes: an environmental atlas and resource book. EnvironmentCanada (Toronto, Ontario) and U.S. EPA (Chicago, Illinois). 44p.
Busiahn, T.R. (ed.). 1990. Fish community objectives for Lake Superior. Great Lakes Fishery Commission SpecialPublication 90-1. Great Lakes Fishery Commission, Ann Arbor, Michigan. 23p.
Ecological Society of America. 1991. A sustainable biosphere: the global imperative. International Association ofEcology, Ecology International. 1991:20.
Eisenreich, S.J. 1982. Overview of atmospheric inputs and losses from films. Journal of Great Lakes Research.8(2):241-242.
Government of Canada. 1990. Canada's Green Plan. Minister of Supply and Services, Canada. 174p.
Hansen, M.J. (ed.). 1994. The state of Lake Superior in 1992. Great Lakes Fishery Commission Special Publication 94-1. Great Lakes Fishery Commission, Ann Arbor, Michigan. 110p.
IJC. 1989. Fifth biennial report on Great Lakes water quality. International Joint Commission, Windsor, Ontario.20p.+ 59p.
Lawrie, A.H., and J.F. Rahrer. 1973. Lake Superior: a case history of the lake and its fisheries. Great Lakes FisheryCommission Technical Report No. 19. Great Lakes Fishery Commission, Ann Arbour, Michigan. 69p.
Lee, R.G., R. Flamm, M.G. Turner, C. Bledsoe, P. Chandler, C. DeFerrari, R. Gottfried, R.J. Naiman, N. Schumaker, andD. Wear. 1992. Integrating sustainable development and environmental vitality: a landscape ecology approach. p.499-521. In Naiman, R.J. (ed.) Watershed management: balancing sustainability and environmental change.Springer Verlag, New York, New York. 542p.
Leopold, A. 1966. A sand county almanac. Ballentine Books, New York, New York. 295p.
MacCallum, W.R., and J.H. Selgeby. 1987. Lake Superior revisited 1984. Canadian Journal of Fisheries and AquaticSciences. 44(Suppl. 2):23-36.
Pratt, D.M., W.H. Blust, and J.H. Selgeby. 1992. Ruffe, Gymnocephalus cernuus, newly introduced in North America.Canadian Journal of Fisheries and Aquatic Sciences. 49:1616-1618.
Quinn, F.H. 1992. Hydraulic residence times for the Laurentian Great Lakes. Journal of Great Lakes Research.18(1):22-28.
Ryder, R.A. 1968. Dynamics and exploitation of mature walleyes (Stizostedion vitreum vitreum) in the Nipigon Bayregion of Lake Superior. Journal of the Fisheries Research Board of Canada. 25:1347-1376.
Ryder, R.A., and C.J. Edwards (ed.) 1985. A conceptual approach for the application of biological indicators ofecosystem quality in the Great Lakes basin. Report to the Great Lakes Science Advisory Board of the InternationalJoint Commission, Windsor, Ontario. 169p.

12
UNCED. 1992. The global partnership for environment and development: a guide to Agenda 21. United NationsDevelopment Programme. 116p.
Waters, T.F. 1987. The Superior north shore. University of Minnesota Press, Minneapolis, Minnesota. 361p.
13
PART 2 of 2
CANDIDATE ECOSYSTEM INDICATORS AND TARGETS
as measurements of progress towards
Ecosystem Principles and Objectives for Lake Superior
DRAFT: May 4, 1998
Drafted in accordance with guidelines provided by the Binational Program to Restore and Protect Lake Superior.

14
TABLE OF CONTENTS
1.0 Introduction
2.0 Indicators and Targets for the General Objective2.1 Incorporation of Lake Superior Ecosystem Principles and Objectives into regional planning at the scale of the
Lake Superior basin.2.2 Data trends and participation levels in Superior Lakewatch, a program to monitor water clarity in Lake
Superior2.3 Attachments: 2.3.1 Excerpt from Annex 2, 1978 Great Lakes Water Quality Agreement
2.3.2 Grand Traverse Bay Watershed Initiative partnership agreement
3.0 Indicators And Targets For The Chemical Contaminants Objective3.1 Background3.2 Progress Towards Zero Discharge And Zero Emission3.3 Atmospheric Deposition Trends For Zero Discharge Chemicals3.4 Open Lake Concentrations Of Zero Discharge And Lakewide Remediation Chemicals3.5 Sediment Concentrations Of Zero Discharge, Lakewide Remediation And Local Remediation Chemicals3.6 Ambient Concentration Trends Of Prevention/Monitor Pollutants In Water, Sediment, Air/Precipitation
4.0 Aquatic Community Objectives and Indicators of Aquatic Community Health within the Lake Superior Basin4.1 Background4.2 Goal4.3 Aquatic Community Objectives4.4 Aquatic Community Objectives Indicators
4.4.1 Offshore Community (>80 m deep)4.4.2 Nearshore Community (<80 m deep)4.4.3 Harbor-Embayments-Estuaries Community4.4.4 Tributary Community4.4.5 Contaminants
5.0 Indicators and Targets for the Terrestrial Wildlife Objective5.1 Background5.2 Bald Eagle Abundance and Contamination5.3 Ungulate Range in the Lake Superior Basin5.4 North American Amphibian Monitoring Program5.5 Mink Contamination5.6 Neotropical Bird Abundance and Diversity
6.0 Indicators and Targets for the Habitat Objective6.1 Background6.2 Streamflow/Sedimentation6.3 Benthic Invertebrates6.4 Inland Lake Transparencies6.5 Forest Fragmentation6.6 Accessible Stream Length
7.0 Indicators and Targets for the Human Health Objective7.1 Background7.2 Monitoring Contaminant Levels in Fish7.3 Drinking Water Quality7.4 Recreational Water Quality7.5 Air Quality7.6 Radionuclides
15
7.7 Body Burden7.8 Health Effects7.9 Cohort Indicator of Exposure and Effect
8.0 Indicators and Targets for the Developing Sustainability Objective8.1 Background8.2 Theme: Sustaining Ecosystems
8.2.1 Status of basin Diversity8.2.2 Landscape Patterns8.2.3 Integrity of Biotic Communities8.2.4 Human Impacts
8.3 Theme: Sustaining Social Infrastructures8.3.1 Educational Achievement8.3.2 Net Migration by Age8.3.3 Employment Trends by Locality8.3.4 Home Ownership8.3.5 Regional Trade Balance8.3.6 Diversity of Community Economies8.3.7 Reinvestment in Natural Capital8.3.8 Citizen Involvement in Decision Making8.3.9 Demand on Social Services8.3.10 Per Capita Membership in Community Organization8.3.11 Energy Consumption8.3.12 Waste Stream Loadings
8.4 Theme: Sustaining Cultural Values8.4.1 Political Pressure to Protect and Remediate the Environment8.4.2 Diversity of Cultures8.4.3 Basin-Wide Sense of Identity8.4.4 General Participation in Environmental Programs.
9.0 References
10.0 Appendices
Appendix 1 Charge to the writing teams
Appendix 2 Persons affiliated with the Ecosystem Principles and Objectives, Indicators and Targetssubcommittee of the Lake Superior Work Group, 1992-1995

16
1.0 Introduction
This document was prepared to address Purpose 2) from the Lake Superior Ecosystem Principles and Objectives:
"facilitate progress towards a set of informative ecosystem indicators, with quantitative targets, by which thehealth of the Lake Superior basin ecosystem, including its physical, biotic and cultural elements, can be measured. This step is primarily a technical process based on expert consultation, where indicators and targets will beidentified through consideration of relevant ecological, economic and cultural information. The ecosystemindicators and targets will address the Lake Superior ecosystem principles and objectives, and will reflect practicalconstraints faced by agencies responsible for monitoring in Lake Superior basin. Concepts and products developedby the Ecosystem Objectives Work Group for Lake Ontario (Bertram and Reynoldson 1992), and other initiatives,will be used in this exercise"
In mid-1994, interested subgroups and partners of the Lake Superior Work Group were invited to draft ecosystemindicators and targets relevant to their areas of expertise. The writing teams were invited to consult with other expertsas required, and to focus on simple, easily communicated indicators of the complex ecological and cultural phenomenareferred to in the Lake Superior Ecosystem Principles and Objectives. The ecosystem indicators and targets wereintended to be:
- relevant to the ecosystem objectives established in the discussion paper Ecosystem Principles and Objectives forLake Superior;
- scientifically credible, and prepared in the context of the recent scientific literature on ecosystem monitoring;
- simple, yet reliable for their stated purpose;
- thoroughly documented with regard to purpose, technical characteristics, limitations, and interpretation;
- suitable for serious consideration by U.S. and Canadian agencies with a mandate for environmental monitoring;
The writing teams adopted the format used by the U.S. EPA's Chesapeake Bay Program. This format was developed tocommunicate environmental monitoring information to environmental managers and to the public through periodicnewsletters and press releases. Included is a display of the current data (or trend) in a graphical form, a clear display ofthe reference or target value (or range) to be achieved, some interpretive statements about the present status of theindicator and what it tells us about progress being made toward the ecosystem objectives, and a graphic to indicate atwhich level of the spectrum the indicator is located. See the Background sections for each Objective, and Appendix 1 formore information.
The reader should remember that the objective of this document was to make a good first attempt atspecifying ecosystem indicators and targets for the Lake Superior basin. Further development of theseindicators will require information and expertise of an increasingly technical nature. This document willhave been successful if the compilation of potential indicators and targets provides a reliable starting pointfor discussion and iterative refinement by the agencies and individuals responsible for ecosystemmonitoring in the Lake Superior basin. Through its subcommittees, the Superior Work Group will continueto provide a forum for the communication and integration of these activities.

17
2.0 Indicators and Targets for the General Objective
2.1 Incorporation of Lake Superior Ecosystem Principles and Objectives into regional planning at thescale of the Lake Superior basin.
A. Ecosystem objective addressed by this indicator:
General Objective "Human activity in the Lake Superior basin should be consistent with A Vision For Lake Superior,which prefaces this document. Future development of the basin should protect and restore beneficial uses as identified inAnnex 2 of the 1978 Great Lakes Water Quality Agreement."
B. Purpose or Nature of the indicator:
The very broad scope of the General Objective (e.g. "human activity in the Lake Superior Basin", and "Futuredevelopment of the basin") precludes direct measurement of its achievement. Targets and indicators for other LakeSuperior ecosystem objectives will address important individual components of the General Objective. Therefore,an "activity measure" that measures formal or informal incorporation of the General Objective into planningactivities in the basin is recommended as an indicator of progress under this objective.
C. Features of the indicator:
Through direct contact on behalf of the Lake Superior Binational Program, State, Provincial, First Nations andMunicipal governments in the Lake Superior basin would be requested to formally adopt the Lake SuperiorEcosystem Principles and Objectives, as an element of land use planning and regulation in the Lake Superiorbasin. "Adoption" would constitute a formal commitment by a government body to test plans and regulationsrelating to land use activities in the Lake Superior basin against the intent of the General Objective, includingrelevant elements of the Vision for Lake Superior, and Annex 2 of the 1978 Great Lakes Water Quality Agreement(appended below). The terms of the formal commitment would reflect a general intent to plan land use in the basinin a way that recognizes the objectives of the Binational Program. An example of this type of agreement, from theGrand Traverse Bay Watershed Initiative (an embayment and its watershed on the northeastern part of LakeMichigan) which has been signed by more than 130 partners, is also appended.
The indicator would be a count of the proportion of relevant agencies and bodies in the Lake Superior basin thathave agreed to participate in the restoration and protection of the Lake Superior ecosystem, as outlined above. Thetarget would be 100%. This approach could also be attempted with agencies outside of the basin, with regard tolong-range transport of pollutants.
An alternative or supplementary indicator could be generated in the form of a "report card" evaluating progresstowards the various elements of the Vision for Lake Superior. Input for the report card could be solicited frommembers of the Binational Forum or from independent observers of the Binational Program.
D. Illustration of the indicator:
Progress with acceptance of the General Objectives could be illustrated as a pie chart of "% acceptance"; as a simplegraph of "% acceptance" vs. time, or as a basin map showing jurisdictions who have agreed to accept the challenge ofthe General Objective.
E. Limitations and uncertainties:
1) It will require a substantial, coordinated effort to solicit this kind of participation at the scale of the wholebasin; 2) Municipalities and regulatory agencies may be unwilling to undertake any kind of formal agreementrelating to the General Objective; 3) even if the General Objective is adopted in principle by a municipality oragency, it will be difficult to measure the practical results at the scale of the Lake Superior basin.
F. Interpretation of the indicator:

18
This indicator will index the willingness of basin leaders to express their acceptance of the concepts and attitudesadvocated by the Binational Program.
2.2 Data trends and participation levels in Superior Lakewatch, a program to monitor water clarity inLake Superior
A. Ecosystem objectives addressed by this indicator:
General Objective, plus elements of Aquatic Communities Objective, Habitat Objective, and DevelopingSustainability Objective. The goals of Lakewatch, i.e., monitoring of Lake Superior waters by citizens, addressseveral elements of "A Vision For Lake Superior", particularly those relating to the pursuit of environmentalintegrity through the commitment and involvement of citizens of the Lake Superior Basin.
B. Purpose or nature of the indicator:
In 1990, Superior Lakewatch was organized with these major goals in mind:
1. To obtain long-term water quality data that is currently lacking from Lake Superior, and in the process...
2. Create a basin wide network of citizen volunteers, professionals and scientists of this region who are linked vianewsletters and,
3. Through use of educational programs enhance awareness of Lake Superior problems and challenges of thefuture.
C. Features of the indicator:
The secchi disk is an accurate, easily used, and widely accepted tool for measuring the transparency of lake water(See Megard & Berman, 1989, J. Limnol. Oceanogr, 3:1640-1655). Secchi disk data is robust in that it is very easyto collect, and errors in readings are rare. Secchi disk measurements integrate several aspects of a lake's waterquality, and have been used to establish lake basin development policy (Example, Lake Tahoe: see Goldman, 1993,Verh. Internat. Verein. Limnol. 25:388-391.)
Water transparency, as indexed by secchi disk data collected through the Lakewatch Program, are collected on abasin wide scale. The data reflect nearshore (eg. land erosion, stream turbidity) and offshore processes (eg. primaryproductivity levels, or current patterns). Superior Lakewatch, as a binational volunteer organization designed tocollect this information, fosters citizens' stewardship of Lake Superior, and provides a network system forstewardship activities.
Superior Lakewatch is organized around citizen volunteers, who collect secchi disk data from sites within LakeSuperior. Such volunteer programs have been highly successful in Wisconsin (DNR) and Minnesota (MPCA);Superior Lakewatch is the only program on any of the Great Lakes. This network provides a communication linkamong the states and Canada, which (in addition to providing valuable water quality data) can be exploited foreducational purposes. The program is unique for the Great Lakes in that it couples public education/participationto scientific goals.
The scope of Superior Lakewatch is broad; it has the support of 15 state and federal agencies including theCanadian Park Service, U. S. National Park Service, Environment Canada, Ontario Ministry of Natural Resources,Sea Grant Programs from Wisconsin, Michigan and Minnesota, and the DNR agencies from these states, and theGreat Lakes Indian Fisheries Commission. The program is run and administered through the Lake SuperiorCenter in Duluth by a project coordinator. The coordinator provides informational materials on the program,develops and prints the training manual, and provides a communication link among trainers and the citizens

19
conducting the monitoring. Regional coordinators from Sea Grant Agencies in Minnesota, Michigan, Wisconsin andthe Ontario Ministry of the Environment train, collect, and screen data from volunteers in their regions. A scientificadvisory group consisting of Mel Whiteside (University of Minnesota--Duluth), Mary Balcer (University ofWisconsin--Superior), and Charles Kerfoot (Michigan Tech) oversee the project.
The targets for this indicator could include:
1) establish a secchi disk data set for Lake Superior of at least 10 years duration;2) involve at least 75 volunteers in the Superior Lakewatch program each year;3) produce at least three newsletters annually summarizing Lakewatch activities.
D. Illustration of the indicator:
Secchi disk data can be illustrated in a variety of ways, including graphs of secchi depth with time, or ashistograms associated with maps of sample locations.
E. Limitations and uncertainties:
Secchi disk data is most useful in the form of long-term records. There are several "local" factors that can affectreadings on any particular date, but this variation is averaged out when long-term data sets are gathered. A dataset of less than 5 years has marginal usefulness; 10-15 years would constitute a valuable data set. Secchi diskdata gives no information regarding pollutants, unless they are reflected in water transparency.
F. Interpretation of the indicator:
Changes (decreases in water transparency) can be detected, but the cause of changes have to be identified by othermeans. Loss in transparency can indicate increased eutrophication, or turbidity increases due to erosionalprocesses. If we apply the stewardship objective to the program, then measures of volunteer activities could be anindicator of stewardship commitment in the basin.

20
2.3 Attachments
2.3.1 Excerpt from Annex 2, 1978 Great Lakes Water Quality Agreement
"Impairment of beneficial use(s)" means a change in the chemical, physical or biological integrity of the Great LakesSystem sufficient to cause any of the following:
i) Restrictions on fish and wildlife consumption;
ii) Tainting of fish and wildlife flavour;
iii) Degradation of fish and wildlife populations;
iv) Fish tumours and other deformities;
v) Bird or animal deformities or reproductive problems;
vi) Degradation of benthos;
vii) Restrictions on dredging activities;
viii) Eutrophication or undesirable algae;
ix) Restrictions on drinking water consumption, or taste and odour problems;
x) Beach closings;
xi) Degradation of aesthetics;
xii) Added costs to industry of agriculture;
xiii) Degradation of phytoplankton and zooplankton populations; and
xiv) Loss of fish and wildlife habitat.

21
2.3.2 Grand Traverse Bay Watershed Initiative partnership agreement
GRAND TRAVERSE BAY WATERSHED INITIATIVE3197 Logan Valley Road, Traverse City, MI 49684 USA, fax 616.946.4410, ph: 616.935.1514
Protecting Our Quality Resources for Future GenerationsPARTNERSHIP AGREEMENT
This document serves as a partnership agreement between various units of government, education, economicdevelopment groups, special interest groups and private sector organizations interested in the future of the GrandTraverse Bay Watershed region.
The parties committed to this partnership are united by a mutual concern for the protection of the integrity of theGrand Traverse Bay Watershed for quality use by future generations. The parties recognize that the region`s futurequality of life and economic health are dependent on the maintenance and sustainability of the natural resources of theGrand Traverse Bay Watershed.
Background
Grand Traverse Bay is a unique resource to the Great Lakes and to the State of Michigan. The Bay is unique becauseit is one of the few remaining Great Lakes bays which exist in a relatively unpolluted condition. The Bay has 132 milesof shoreline, is over 600 feet deep in the East Arm, and contains 39 species of fish. The Grand Traverse Bay Watershedencompasses approximately 973 square miles and includes parts of five counties (Grand Traverse, Antrim, Leelanau,Kalkaska & Charlevoix). The Bay can also be viewed as a model of the whole of Lake Michigan (having a populatedurban area at its southern end).
Vision
"The ecological integrity of the Grand Traverse Bay Watershed will be sustained or restored to ensure regional economic
viability and quality use by future generations."
Action
We the undersigned, considering the best interest of the water, natural resources, and the future development of theregion, mutually agree to fully cooperate and to provide technical and financial assistance, as available, to support themulti-year Grand Traverse Bay Watershed Initiative. Coordination of the initiative will be accomplished jointlythrough the Grand Traverse Bay Watershed Initiative Steering Committee, comprised of members signing thispartnership agreement.
22
3.0 INDICATORS AND TARGETS FOR THE CHEMICAL CONTAMINANTS OBJECTIVE
3.1 BACKGROUND
In 1987, the Great Lakes Water Quality Agreement (GLWQA) committed the US and Canada to virtuallyeliminate persistent toxic substances in the Great Lakes system. In response to a challenge to the Partiesfrom the IJC, the governments announced the Binational Program to Restore and Protect the Lake SuperiorBasin in 1991. The Lake Superior binational program includes a Zero Discharge Demonstration Project fornine designated chemicals1 and provides for a Lakewide Management Plan (LaMP) for critical chemicals inLake Superior.
In the Stage 1 LaMP, the Parties summarized information on the levels of contaminants in fish, water,sediment and wildlife. These levels were compared against the “yardsticks” that were compiled in Smith andSmith (1993). Beneficial use impairments at the Areas of Concern in Lake Superior were also summarized inthe Stage 1 LaMP (SWG, 1995). The Parties also compiled lists of high priority toxic chemicals from the USand Canada.
After analyzing this information, the Parties developed several categories based on the concentration andtoxicity of the persistent, bioaccumulative substances found in Lake Superior and the use impairments theycaused. A description of the chemical categorization process is included in the Stage 1 LaMP (SWG, 1995) andsummarized in the draft Stage 2 LaMP (SWG, 1996). The nine designated zero discharge and zero emissionchemicals have the highest priority for reduction in Lake Superior.
One characteristic of persistent, bioaccumulative toxic chemicals in Lake Superior is that most of them have alarge loading from atmospheric deposition. Since much of this deposition comes from sources outside the LakeSuperior basin, programs that cover a broader area than the LaMP are needed to virtually eliminate inputsper the GLWQA. This is the purpose of the Great Lakes Binational Toxics Strategy, which was signed by theUS and Canada in April 1997. In addition, U.S. states and Ontario are embarking on a variety of toxicsreduction strategies throughout their jurisdictions.
The following indicators for the chemical contaminants ecosystem objective are designed to track inputs ofpersistent, bioaccumulative chemicals to the air, water and sediment of the Lake Superior basin. There arealso indicators for sources of these chemicals in the basin. Indicators for levels of these chemicals in fish,wildlife and humans are included under the aquatic community, terrestrial wildlife and human healthobjectives.
1 The nine designated zero discharge chemicals include chlordane, DDT, dieldrin, dioxin, hexachlorobenzene, mercury,octachlorostyrene, PCBs, and toxaphene

23
3.2 PROGRESS TOWARDS ZERO DISCHARGE AND ZERO EMISSION
A. Ecosystem objective addressed by indicator:
Chemical Contaminants Objective Summary Objective and Sub-Objective a) “Per the Binational Program toRestore and Protect the Lake Superior Basin, the management goal for the nine designated persistent,bioaccumulative toxic chemicals2 is zero discharge and zero emission from sources within the Lake Superiorbasin.”
B. Purpose or nature of indicator:
The Lake Superior Binational Program includes a goal of “zero discharge and zero emission of certaindesignated persistent, bioaccumulative toxic chemicals which may degrade the ecosystem of the Lake Superiorbasin.” Nine chemicals have been designated for zero discharge in the agreement. This zero dischargedemonstration arises from the Great Lakes Water Quality Agreement, which notes that zero discharge is “thephilosophy adopted for the control of inputs of persistent toxic substances.” The indicator for progress towardszero discharge and zero emission is the trend in releases of the nine chemicals from sources within the basin.
C. Features of the indicator:
While the ultimate indicator of trends for the nine zero discharge chemicals will be the levels in water, fish,sediment and other compartments in the ecosystem, the indicators of progress towards zero discharge must belinked to sources. The effect of achieving zero discharge from sources in the basin will probably be masked bythe atmospheric loading from sources outside the basin, the persistent nature of these chemicals and naturalsources. Therefore, progress on the zero discharge demonstration cannot be tracked adequately byenvironmental indicators.
Instead, the zero discharge indicators will be a series of measurements and estimates of the release ofchemicals from sources in the basin. Many of the zero discharge chemicals are used or produced in variousways that can lead to eventual release to the environment through several pathways. Ideally, measurementsof releases from facilities that discharge to air or water could be used as indicators of progress towards thezero discharge/zero emission objective. However, these measurements are often lacking or inadequate. Inaddition, the focus of the Lake Superior zero discharge demonstration program is on human activities that useor generate these chemicals, not simply treatment at the end of a pipe or stack. If these chemicals and theirprecursors are not used in processes or products, they cannot be released to the environment. The baseline yearestablished in the LaMP Stage 2 load reduction schedules for these indicators is 1990 for mercury, PCBs,dioxin, hexachlorobenzene, designated pesticides and octachlorostyrene (SWG, 1998).
D. Illustration of the indicator:
A variety of zero discharge indicators are under discussion. The background and references for most of theseindicators are discussed in the load estimate documents that Canada and the US prepared for the Stage 2LaMP (Thompson, 1994 and Tetra Tech, 1995). This document presents a menu of possible indicators withwhich to judge progress of the zero discharge demonstration program for Lake Superior. More work andconsideration will be needed to further define the usefulness of these other potential indicators for sources ofzero discharge chemicals. Because direct measurement is often not possible, some indicators may besurrogates. Possible indicators (in no particular order) include the following:
• Concentrations and loads in discharges to water from permitted facilities.• Concentrations and loads in emissions to air from permitted facilities.• Concentrations and loads in biosolids (sludge) from permitted facilities.
2 chlordane, DDT, dieldrin, dioxin, hexachlorobenzene, mercury, octachlorostyrene, PCBs and toxaphene

24
• Quantity of mercury-bearing products such as thermometers, switches, thermostats and mercury-addedbatteries purchased in the basin.
• Quantity of mercury recovered in sweeps, including household hazardous waste, commercial hazardouswaste, and sweeps done within a facility.
• Quantity of mercury used and disposed by medical and dental facilities. • Use of mercury or dioxin contaminated feedstock chemicals. • Quantity of PCB-bearing equipment decommissioned in the basin.• Mass of PCBs, hexachlorobenzene, mercury and dioxin included in sediment remediation projects. • Quantity of chlordane, DDT, dieldrin, hexachlorobenzene, mercury, toxaphene and dioxin contaminated
pesticides gathered in agricultural waste pesticide collections in the basin.• Quantity of chlordane, DDT, dieldrin, hexachlorobenzene, mercury, toxaphene and dioxin contaminated
pesticides gathered in household hazardous waste collections.• Coal and oil fired electricity production and cogeneration of electricity within the basin to indicate trends
in potential release of mercury and dioxin.• Electricity consumption patterns of basin residents to track willingness to conserve electricity and reduce
release of mercury and dioxin.• Combustion of different fuels (e.g., wood, coal, gas, railroad ties or tires) for energy and the amounts of
dioxin and mercury released. • Mining production and the amount of mercury, dioxin and HCB released through refining processes. • Amount of solid waste produced by residents or small business and burned in incinerators or backyard
burn barrels• The amounts of dioxin, HCB and mercury released by residential and small business incinerators and
burn barrels. • Amount of solid waste and medical waste incinerated in the basin and the amounts of dioxin, HCB, OCS
and mercury released.
E. Limitations and uncertainties:
Some of the indicators listed above will be difficult to quantify or even to estimate. For example, burn barrelsmay generate a significant amount of dioxin, but direct measurements may not be possible. A surrogateindicator would be an estimate of the amount of household trash burned. Even if the amount of trash burnedcan be estimated, there is no emission factor for dioxin from burn barrels. So, even though we may not knowexactly how much dioxin is being released, we can say whether the trend is increasing or decreasing.
Some indicators will suffer from a lack of monitoring data. For example, very few facilities have monitoringrequirements for mercury, dioxin or the other zero discharge chemicals. In addition, discharges to water do notappear to be a major source of these chemicals. Stack testing for air emissions of these chemicals is expensive. Regulatory reporting is frequently done using emission factors, which are usually derived from other facilitiesand assumed to be broadly representative. Thresholds for reporting requirements are often too high foraccurate load calculations. Estimates can be made, especially if we believe that a study population (e.g., asubset of US power plants in a nationwide study) is representative of facilities in the basin. However, iffacilities in the basin are dissimilar to those used in nationwide studies, the estimates will not be applicableand basin specific information will be needed. Programs to collect this data may need to be developed if theydo not presently exist.
Some of the indicators do not directly measure the quantity of a particular contaminant actually released tothe environment. For example, tracking thermometer sales does not imply that the mercury in everythermometer will end up in Lake Superior. However, since the zero discharge chemicals are persistent, it isreasonable to assume that over time, there is potential for the mercury in the thermometers to be released toair, water or land in the basin.
F. Interpretation of the indicator:

25
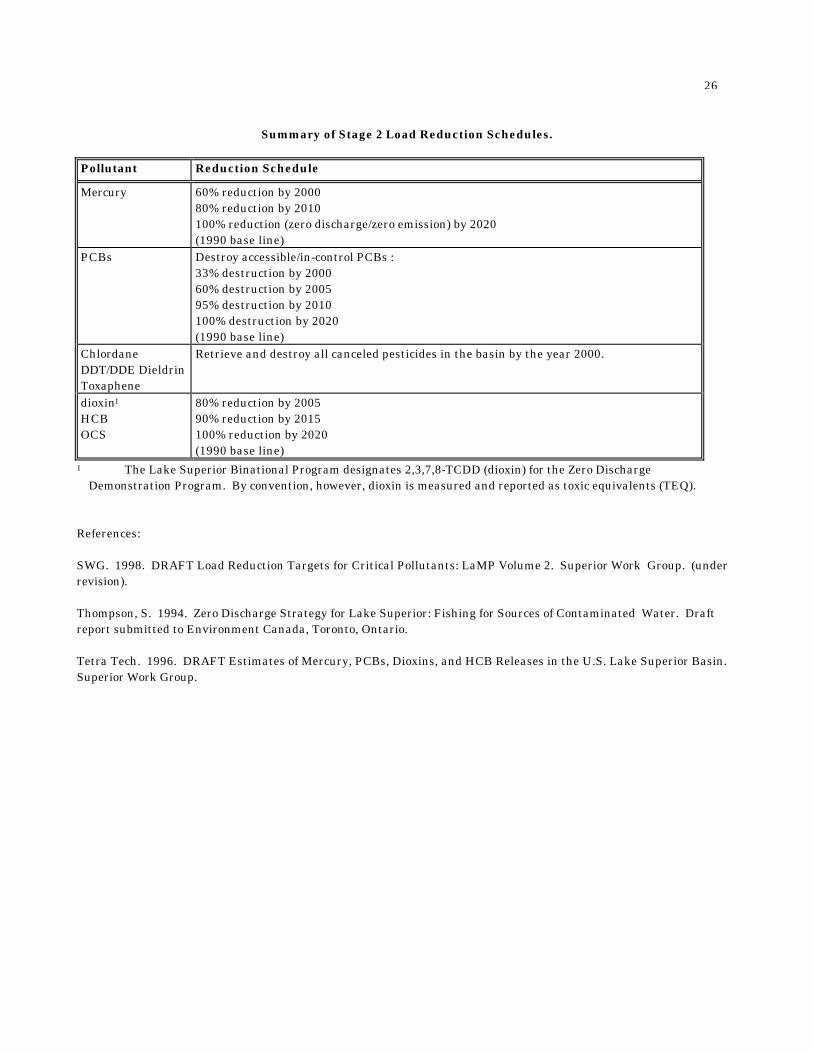
Whenever possible, the indicators will be expressed as kg/yr of mercury, PCBs, designated pesticides, dioxin,hexachlorobenzene or octachlorostyrene (e.g., kg/yr of mercury released to the air from taconite processing in thebasin). In some cases, the indicator will be reported as mass (e.g., kilograms of designated pesticides collectedfrom the basin). For the indicators that are surrogates for actual measurements of the zero dischargechemicals, the reported units will vary (e.g., number of mercury bearing devices purchased in the basin). For allthe indicators, the 1990 baseline will be compared to the milestones identified in the Lake Superior LakewideManagement Plan Stage 2 (SWG, 1998). The Stage 2 schedule of load reductions is summarized in thefollowing table.
26
Summary of Stage 2 Load Reduction Schedules.
Pollutant Reduction Schedule
Mercury 60% reduction by 200080% reduction by 2010100% reduction (zero discharge/zero emission) by 2020(1990 base line)
PCBs Destroy accessible/in-control PCBs :33% destruction by 200060% destruction by 200595% destruction by 2010100% destruction by 2020(1990 base line)
ChlordaneDDT/DDE DieldrinToxaphene
Retrieve and destroy all canceled pesticides in the basin by the year 2000.
dioxin1
HCBOCS
80% reduction by 200590% reduction by 2015100% reduction by 2020(1990 base line)
1 The Lake Superior Binational Program designates 2,3,7,8-TCDD (dioxin) for the Zero DischargeDemonstration Program. By convention, however, dioxin is measured and reported as toxic equivalents (TEQ).
References:
SWG. 1998. DRAFT Load Reduction Targets for Critical Pollutants: LaMP Volume 2. Superior Work Group. (underrevision).
Thompson, S. 1994. Zero Discharge Strategy for Lake Superior: Fishing for Sources of Contaminated Water. Draftreport submitted to Environment Canada, Toronto, Ontario.
Tetra Tech. 1996. DRAFT Estimates of Mercury, PCBs, Dioxins, and HCB Releases in the U.S. Lake Superior Basin. Superior Work Group.

27
3.3 ATMOSPHERIC DEPOSITION TRENDS FOR ZERO DISCHARGE CHEMICALS3
A. Ecosystem objective addressed by indicator:
Chemical Contaminants Objective Summary Objective and Sub-Objective b) “Per the Great Lakes WaterQuality Agreement, atmospheric deposition of persistent, bioaccumulative toxic chemicals that have ananthropogenic origin should be virtually eliminated.”
B. Purpose or nature of indicator:
The goal of the GLWQA is to virtually eliminate zero discharge chemicals from the environment. Thisindicator demonstrates progress towards that goal.
C. Features of the indicator:
Atmospheric deposition of the zero discharge chemicals is still a predominant source of these chemicals to theLake Superior system. This deposition consists of a small continuing source of these chemicals from withinthe basin plus a larger source of these chemicals arriving from out-of-basin sources. The primary routes ofdeposition to the lake consists of tributary inputs of the chemicals which have an atmospheric depositionsource (rain, snow and subsequent runoff), direct precipitation input to the lakes, dry deposition of particlesand gas-phase exchange between the lake surface and the atmosphere. This indicator tracks the change inthese components to atmospheric deposition with time with a 1992 baseline.
D. Illustration of the indicator:
Estimates of atmospheric deposition have been made since 1988 (Strachan and Eisenreich, 1988; Eisenreichand Strachan, 1992). More recently atmospheric deposition fluxes and loads have been measured by theIntegrated Atmospheric Deposition Network (IADN) (Hoff et al., 1996; IADN Steering Committee, 1997). Theindicator follows procedures set out in the IADN Quality Assurance Program Plan (1994). Several primaryindicators of progress towards virtual elimination are found in the estimation of loading to the lakes, L, whereL = W + D + G, below.
Wet deposition (W) is calculated as:
W ng m y C Rp p( )− − =2 1 1000
where Cp (ng/l) is the volume-weighted mean precipitation concentration averaged over a year period, Rp is theprecipitation rate in m y-1 (water equivalent for snow), and the factor of 1000 converts litres to cubic metres.The magnitude of W and its change with time is an indicator of progress towards virtual elimination. It shouldbe noted, however, that yearly variations in the rain rate (dry years versus wet years) will complication theinterpretation of the indicator. Therefore, the concentration of the chemical in precipitation should also beevaluated as an indicator.
Dry deposition of particles is calculated from:
D ng m y v Cd a part( ) ,− − =2 1
where vd (m y-1) is the dry deposition velocity of the species in question (a function of particle size andhygroscopic nature of the particles) and Ca,part (ng m-3) is the particulate phase concentration of the chemical inair. Since the dry deposition velocity of particles is not well known, it has been specified as 0.2 cm s -1 inprevious work (Eisenreich and Strachan, 1988; Hoff et al. 1996). Since the deposition velocity is not expected
3 chlordane, DDT, dieldrin, dioxin, hexachlorobenzene, mercury, octachlorostyrene, PCBs and toxaphene

28
to be a determining factor in the long-term trend of dry deposition (particle sizes will not change much withtime), the air concentration of chemicals on the particles will be a primary indicator which can be tracked fortrends.
Gas exchange is computed from the knowledge of both the gas phase species concentration in air(Ca,gas, ng m-3) and the concentration of the chemical in water (Cw , ng/l) through the formula:
G ng m y k CRTH
CoL a gas w( ) ( ),− − = −2 1 1000
where koL (m y-1) is the air-water mass transfer coefficient, H is the temperature dependent Henry’s Lawconstant, R is the gas constant and T is the surface water skin temperature (Schwarzenbach et al., 1993). Asexpressed above if G>0 then the lakes are being loaded from the atmosphere and if G<0 then the lakes are asource of the chemical to the atmosphere. There is uncertainty (see below) in some of the chemical andphysical properties which are part of the gas phase flux. A more precise indicator of trends in this flux are theair and water concentrations of the chemical themselves.
The rate of change of the loading, L = W + D + G, is dL/dt. Since it is known that the loads haveseasonality for some components, in order to properly determine the trend, the data should be statisticallydeseasonalized (i.e, using a Rank-Kendall statistic, standard temperature correction, or equivalent).
Even after deasonalizing the trend data, there may be considerable error in the magnitude of the gasphase exchange. In order not to overstate the loading indicator precision, a secondary measure of the indicatorwill be the sign of the change in L, in the above equation. If the indicator is positive, the trends in the loadingsare increasing and the objective is not being approached. If the indicator is negative, the loadings aredecreasing and the objective is being approached. It is likely that if the sign of W+D+G is negative, the changein the atmospheric contributions to the tributary loadings is likely to be of the same sign.
A third component of the indicator is the relative rate of change of the loading with time. The morenegative this indicator becomes the faster the goal of virtual elimination will be reached.
E. Limitations and uncertainties:
There are limited monitoring data sets which have a long enough basis and consistency to evaluate theseindicators. The time constants at which many virtual elimination chemicals are decreasing in the system (inwater, air and fish) are on the order of a few to tens of years. This requires a systematic measurement ofloadings to be made over time. IADN provides a nearly nine year record so far of a number of the zerodischarge chemicals (chlordane, DDT, dieldrin, hexachlorobenzene, PCBs) and has recently added mercury andtoxaphene to an evaluation agenda for inclusion in the program. Dioxin has been measured largely in urbanareas and few data exist over the open waters of Lake Superior.
There are significant uncertainties in the calculation of loadings to the lakes. The wet deposition loading tothe Lake is believed to be precise to about 50%, dry deposition is known to about 100-150%, and gas transferdepends on the relative difference of air and water concentrations. Typically, gas absorption is known to abouta factor of 2-3 and gas volatilization to a factor of 2. Systematic trends in these terms, however, will be knownmore precisely because the trend is largely due to the change in the air and water concentrations with time. For this reason, the precision in the primary component of the indicator, the sign of the term, will have higheraccuracy than the magnitude. There is a formal mechanism to determine the precision of the loading termsabove (Hoff, 1994). Using this formalism, estimates of the errors of each of the loading terms can bedetermined. The error in the indicator can be calculated using the statistical tests of the trend equation versusthe null hypothesis (i.e. is a negative slope statistically different at the 95% confidence level from zero slope, orno change?).
The atmospheric tributary loading has been estimated to be as small as 10% of the deposition of the chemicalto the entire basin (Dolan et al., 1993). More recently, however, there has been a suggestion that tributaryloadings due to atmospheric input can be higher than this. This load is poorly quantified at present and may

29
change with more scientific knowledge. There is currently insufficient information to include atmospheric-tributary contributions into the indicator.
F. Interpretation of the indicator:
For the indicators which are components of the loading equation (water concentration, gas phase airconcentration, particulate phase air concentration), the change in their magnitude with time (corrected forseasonal effects) determines the trend. The magnitude of the trend is an indication of whether virtualelimination from the Lake Superior environment (air and water) is being achieved.
If the sign of the indicator is negative, the goal of virtual elimination is being approached and progress is beingachieved. If the sign of the indicator is positive, there are residual inputs of these chemicals to the basin andsources for these chemicals must be decreased before virtual elimination can occur.
References:
Dolan, D., …. 1993
Hoff, R.,…1996.
IADN Quality Assurance Program Plan. 1994.
IADN Steering Committee. 1997.
Eisenreich, S.J. and W.J.M. Strachan. 1992.
Strachan, W.J.M., and S.J. Eisenreich. 1988.
Schwarzenbach,…. 1993.

30
3.4 OPEN LAKE CONCENTRATIONS OF ZERO DISCHARGE AND LAKEWIDE REMEDIATIONCHEMICALS
A. Ecosystem objective addressed by indicator:
Chemical Contaminants Objective Summary Objective and Sub-Objective c) “Open lake concentrations of thechemicals in the zero discharge4 and zero emission category or the lakewide remediation5 category should not exceedthe most sensitive yardstick of environmental quality (Smith and Smith, 1993).”
B. Purpose or nature of indicator:
Guidelines/ criteria/ objectives/ standards [henceforth, referred to as “standards”] have been established byvarious agencies to define acceptable water and sediment quality for specific uses. These standards applywithin the political jurisdiction of each agency, including the Areas of Concern. One of the tasks identified forthe Superior Work Group was to identify standards that could be used on a lakewide basis, to measure andreport on progress in reducing loadings of critical pollutants. To ensure that use impairments do not occur, itwas agreed that the most sensitive available standard (exclusive of drinking water standards) would be usedfor these evaluations, and would be called the “yardstick” (see Smith and Smith, 1993). For this indicator,water concentrations in the offshore waters of Lake Superior (>80m, as per definition on p.27) would becompared to the most sensitive yardstick (see Table xx, below) to ensure protection of the most susceptiblespecies/use.
Table xx. Water quality yardsticks for zero discharge and lakewide remediation chemicals as per Smith andSmith (1993).
Chemical Water QualityYardstick (ng/L)
chlordane 0.073DDT 0.024dieldrin 0.0065dioxin, 2,3,7,8-TCDD zerohexachlorobenzene 0.056mercury 0.18octachlorostyrene Not AvailablePCBs 0.005toxaphene 0.02PAHs, total 2.8alpha-BHC 9.2cadmium 100heptachlor + heptachlor epoxide 0.1
As new standards are adopted by the jurisdictions, it will be important to review the yardsticks. For example,recently Minnesota adopted new standards which are more sensitive than the yardsticks given in Table xx forchlordane (0.040 ng/L), DDT (0.011 ng/L), dieldrin (0.0012 ng/L), PCBs (0.0045 ng/L) and toxaphene (0.011ng/L). During each reporting cycle, the yardsticks would be updated to reflect the most sensitive guideline.
C. Features of the indicator:
Every 2 years, water concentrations of zero discharge and lakewide remediation chemicals should be monitoredthroughout the offshore waters of Lake Superior, for comparison with appropriate yardsticks. Sampling should
4 chlordane, DDT, dieldrin, dioxin, hexachlorobenzene, mercury, octachlorostyrene, PCBs and toxaphene5 PAHs, alpha-BHC, cadmium, heptachlor and heptachlor epoxide

31
be conducted during spring, isothermal conditions, as maximum concentrations have been reported during thistime.
The offshore region of Lake Superior has an extremely low rate of sediment accumulation; for example, thesedimentation rate at NOAA Site 3, in the Chefswet sub-basin of Lake Superior, is estimated to be 0.3 mm/yr. This extremely low rate of sediment accumulation hampers our ability to sample recent sediment deposits forcomparison to yardsticks. Comparison of sediment concentrations against standards will be limited to thenearshore region where sediment accumulation is greater (see Section 3.5).
D. Illustration of the indicator:
To comply with the methodology used by the Superior Work Group in defining critical pollutants, comparisonswith the yardsticks will be assessed against the 95th percentile – this is, pollutant concentrations will beconsidered as acceptable only if 95-100% of the available data indicate levels below the yardstick. Waterconcentrations of the zero discharge and lakewide remediation chemicals should be presented in a table whichprovides both the 95th percentile and the yardstick, for comparison. Spatial distribution maps, showing rawconcentration data, should also be provided to indicate spatial gradients and to discern any problem areas.
E. Limitations and uncertainties:
It is important to note that, for octachlorostyrene, it will not be possible to report against the yardstick, asthere is not one available (due to the lack of jurisdictional standards). Also, while there is a yardstick for“total PAHs”, there are also yardsticks for individual PAHs. Since “total PAHs” is not defined, the individualPAHs should be reported and compared against their respective yardsticks.
The yardstick for dioxin (2,3,7,7-TCDD) is “zero”; analytical chemists continually strive for lower detectionlimits (some currently operating in the part-per-quadrillion range), so the concept of “zero” does not exist. Thus, the target for dioxin should be “less than detection limit using the best available technology”. For allother chemicals, it is important that organizations responsible for carrying out this monitoring effort useanalytical detection limits that are sufficiently sensitive to allow for comparison with the yardsticks (cf Tablexx).
With each reporting cycle, as the yardsticks are updated to reflect the adoption of new, lower standards by thejurisdictions, there is the potential for a greater number of chemicals to exceed yardsticks. To the casualreader, this may imply that water quality conditions are deteriorating. It is, therefore, important to maintainthe reporting format that presents not only the 95% confidence limit, but also the yardstick that is being used.
As this document is being written, there is ongoing controversy concerning how standards for contaminants inthe environment are determined. Some standards are driven by the ability of scientists to actually detect and measure the compounds (or family of compounds) in environmental media; these standards are commonlyknown as chemical standards. Toxicity based standards prove more acceptable than the chemical standards,since the biological effect of a contaminant is used to determine a value for allowable levels in theenvironment. The controversy emerges with the fact that most toxicity based standards are determined usingsingle compound (or single compound families, i.e. PCBs, dioxins, toxaphene, etc.) assays, which may notadequately represent the actual environmental exposure for the species of concern. The actual environmentalexposure would include the entire suite of toxic contaminants present in the environmental media, and thesingle compound toxicity standards may not prove protective of the most sensitive species of concern. Theconcept of synergistic toxicity (the toxicity of a mixture of chemicals being greater than the additive toxicity ofthe individual chemicals) is well established in the field of toxicity, but current methodologies for determiningsynergistic toxicity are not readily available. Until multiple chemical exposure toxicity assays are developedand verified, the yardsticks based on single contaminant toxicity assays will be used to evaluate the indicatorsdiscussed above.

32
F. Interpretation of the indicator:
The indicator will be used to monitor achievement of lakewide targets, based on yardsticks. This indicator willalso provide useful information to assist in the interpretation of some of the biologically-based indicators, suchas bioassays, aquatic community health, etc.

33
References
Smith, J. and I.R. Smith. 1993. Yardsticks for assessing the water quality of Lake Superior. For the Superior WorkGroup.
3.5 SEDIMENT CONCENTRATIONS OF ZERO DISCHARGE, LAKEWIDE REMEDIATION AND LOCALREMEDIATION CHEMICALS
A. Ecosystem objective addressed by indicator:
Chemical Contaminants Objective Summary Objective and Sub-Objective d)“Concentrations of zero discharge1 and lakewide remediation2 chemicals in sediment in nearshore areas (<80m.),and in harbors and bays, should not cause or contribute to impaired uses in the Lake Superior ecosystem.Concentrations of local remediation3 chemicals in sediment should not impair uses in Areas of Concern in the LakeSuperior basin.”
B. Purpose or nature of indicator:
Sediments in biologically productive areas can serve as a sink for contaminants which can enter the food chain,contributing to impaired uses of the Lake Superior ecosystem. Index sampling of contaminant levels can tracktrends in sediment over time. For this indicator, concentrations of zero discharge and lakewide remediationchemicals in sediment of nearshore areas of Lake Superior, and in harbors and bays, including Areas ofConcern, will be compared to yardsticks, guidelines, or standards. Concentrations of local remediationchemicals will be compared to local standards in Areas of Concern. The nearshore habitat areas are defined inthe aquatic community objective and applied to the aquatic community indicators of this document.
The yardsticks of environmental quality, put forth in Smith and Smith (1993) provide a means to determinepotential for impairment. The yardsticks also enable temporal and geographic comparison in the context ofthe entire Lake Superior basin. Use of the yardsticks for this indicator is not intended to set clean upstandards for contaminated sediment sites.
Concentrations of critical chemicals in sediment should be assessed as follows:
Zero Discharge and Lakewide Remediation Chemicals: concentrations in sediments from thenearshore waters of Lake Superior would be compared to the most sensitive yardstick (see Table xx,below) to ensure protection of the most susceptible species/use. Concentrations in sediments fromharbors and bays, including Areas of Concern, would also be compared to the most sensitive yardstick. Monitoring locations would be selected in the near shore zone and in harbors and bays based onseveral factors, including correspondence to areas where other contaminant work had been done. In Areas of Concern, monitoring conducted for Remedial Action Plan purposes would be used, if possible,for the lakewide comparisons.
Table xx. Sediment yardsticks for zero discharge and lakewide remediation chemicals as per Smith and Smith(1993).
Chemical SedimentYardstick (ug/g)
aldrin/dieldrin 0.0006
DDT (total) 0.007
hexachlorobenzene 0.01
PCBs (total) 0.01

34
Local Remediation Chemicals: concentrations in sediments from Lake Superior’s Areas of Concernwould be compared to the applicable local standards to ensure restoration of impaired uses.
C. Features of the indicator:
In the nearshore areas and harbors and bays, cores would be collected every 10 years from sites selected forindex monitoring. Index sites should include areas where sediment sampling would provide added value tocontaminant investigations, for example, sites previously monitored for contaminants in sculpin (DeVault etal., 1998). Sites would also be chosen based on sediment type, expected sedimentation rates, and proximity topotential sources. Cores would be sectioned, dated and analyzed for the zero discharge1 and lakewideremediation2 chemicals. Concentrations for recent years (i.e., last 10 years) would be compared against theSmith and Smith (1993) yardsticks.
Certain estuaries, bays, and harbors on Lake Superior, are designated as Areas of Concern because of past oron-going pollution problems. Sediment contamination in these areas, taken together, represent cumulativeimpacts to productive habitat areas. In addition, Areas of Concern can serve as contaminant source areas tothe rest of the Lake. Application of the sediment indicator at Areas of Concern is intended to integrate theinformation gathered by RAP monitoring efforts to give a lakewide picture for these important habitat areas. In the Areas of Concern, sediment concentrations of zero discharge and lakewide remediation chemicals wouldbe compared to Smith and Smith yardsticks and evaluated on a lakewide basis. Data for local remediationchemicals would be compared to appropriate standards or guidelines used by the jurisdiction (i.e. " localstandards" ) Additional index sampling in these areas would be proposed if the RAP data are not adequatefor the lakewide tracking purposes of this indicator. Sites would be chosen based on Remedial Action Planinformation, including the nature of the use impairment, type of sediment and proximity to historical orongoing sources of local remediation chemicals3.
D. Illustration of the indicator:
The sediment concentrations would be depicted using the standard tables and figures showing the change inconcentration at different depths. Only the upper segment of the core would be compared to the yardstick orlocal standard. In addition, a set of maps showing the location and concentrations in the nearshore areas anda set of maps showing concentrations in the Area of Concern would serve to illustrate the indicator.
E. Limitations and uncertainties:
When comparing sediment concentrations against standards, it is important to consider the natural, localbackground concentrations of trace metals; these can be obtained by looking at the Ambrosia pollen horizonlevels in the cores, or by radionuclide dating of the sediments. Mudroch et al. (1988) conducted a literaturesurvey to summarize background concentrations of selected elements (As, Cd, Cu, Cr, Fe, Ni, Pb, Zn and Hg) insediments from different areas of the Great Lakes. For example, background concentrations of Cd indepositional basins of Lake Superior were found to be in the range of 0.4-0.7 ug/g, however, MOE’s lowest effectlevel for Cd is 0.6 ug/g. Persaud et al. (1991), in discussing MOE’s lowest effect level guidelines, states that“The Ministry recognizes that in areas where local background levels are above the lowest effect level, the localbackground level will form the practical lower limit for management action.”
Furthermore, it is important that analytical methods used for both the nearshore and Area of Concernmonitoring have detection limits low enough for comparison to the appropriate sediment yardsticks,guidelines, and standards.
35
The type of sampling proposed for this indicator is index sampling, where certain sampling sites would beselected and followed over time, as opposed to condition monitoring which would be designed to determineextent of sediment contamination in the Lake Superior ecosystem. Depending on how index sites are chosen,they may not give a representative picture of sediment contamination in the Lake. However, index sampling ismore economically feasible for the Lake Superior ecosystem. In the case of Areas of Concern, data acquired forRAPs would be used wherever possible, rather than proposing an additional sampling program for those areas.
F. Interpretation of the indicator:The indicator will be expressed as concentration (ug/g) at different depths in the sediment core. The trend overtime will indicate the change in the zero discharge1, lakewide remediation2 and local remediation3 chemicals. Concentrations that exceed the appropriate yardstick or cause use impairments will indicate a need for furtherreductions.
1 chlordane, DDT, dieldrin, dioxin, hexachlorobenzene, mercury, octachlorostyrene, PCBs and toxaphene2 PAHs, alpha-BHC, cadmium, heptachlor and heptachlor epoxide3 aluminum, arsenic, chromium, copper, iron, lead, manganese, nickel and zinc
References:
DeVault, D.S, D.D. Helwig, G. Flom, D.L. Swackhammer and P. McCann. 1998 (in print). Contaminant Concentrationsin Lake Trout and Sculpin from Lake Superior.
Mudroch, A., Sarazin, L., and T. Lomas. 1988. Summary of surface and background concentrations of selectedelements in the Great Lakes sediments. J Great Lakes Res. 14(2): 241-251.
Persuad, D., Jaagumagi, R. and A. Hayton. 1991. The Provincial Sediment Quality Guidelines. Water ResourcesBranch, Ontario Ministry of Environment. Toronto, Ontario.
Smith, J. and I.R. Smith. 1993. Yardsticks for assessing the water quality of Lake Superior. For the Superior WorkGroup.

36
3.6 AMBIENT CONCENTRATION TRENDS OF PREVENTION/MONITOR POLLUTANTS IN WATER,SEDIMENT, AIR/PRECIPITATION
A. Ecosystem objective addressed by indicator:
Chemical Contaminants Objective Summary Objective and Sub-Objective e) “Concentrations of the chemicals inthe prevention/monitor6 category should not increase in air, water or sediment.”
B. Purpose or nature of indicator:
Chemicals identified in the prevention/monitor category are those for which there is very little informationavailable regarding their distribution in the Lake Superior environment, although there is no evidence to dateto suggest that they are negatively impacting the ecosystem. Because these chemicals are bioaccumulative,persistent and toxic, continued monitoring of their status in the ecosystem is warranted to ensure maintenanceof, if not a decrease in, current levels.
C. Features of the indicator:
Building on the monitoring proposed for air (section 3.3) and water (section 3.4), concentrations of theprevention/monitor chemicals should also be tracked annually in air/precipitation, and every 2 years in water.
Bottom sediments in 6 major depositional basins of the open lake provide a mechanism for focusingcontaminant loadings in lake systems. Every 10 years, sediment cores should be taken in each of thesedepositional zones of the offshore, sectioned, dated, and analysed for prevention/monitor chemicals.
D. Illustration of the indicator:
Bar graphs showing changes in concentration of the prevention/monitor chemicals over time in air/precipitation(volume-weighted means for precipitation) and water, will be used to illustrate this indicator.
Dated sediment core profiles (adjusted for sediment focusing) will be used to depict trends in sedimentconcentrations and accumulation rates over time, to illustrate whether or not concentrations/accumulationrates are increasing or decreasing.
E. Limitations and uncertainties:
Air and water concentration data provide a snap shot of current conditions, however, their utility for reportinglong-term trends is limited by a lack of comparable historical information. Sediment cores, on the other hand,are not as definitive in delineating conditions in the short-term (e.g., sediment concentrations for a given year),however, they can provide a historical record of contaminant concentrations/loadings.
Water, sediment and/or air/precipitation concentrations may be below the analytical detection limit for thesechemicals, hence, it may be impossible to demonstrate changes over time. It is thus assumed that, as long asconcentrations are maintained below this limit, the ecosystem objective is being met.
Uncertainties exist in dating the sediment profiles, particularly in the surface layer due to vertical mixing, andin the derivation of accumulation rates, given that sedimentation rates are not necessarily uniform across thelake or with time.
F. Interpretation of the indicator:
6 1,4-dichlorobenzene, 1,2,3,4-tetrachlorobenzene, mirex/photo-mirex, pentachlorobenzene,pentachlorophenol, gamma-BHC

37
If concentrations of the prevention/monitor chemicals in air, water and sediment are not increasing with time,then it can be assumed that levels are not negatively impacting the Lake Superior ecosystem. Depending onthe results, these chemicals may be added to the lakewide remediation or local remediation categories.

38
3.7 PREVENTION - INVESTIGATE CHEMICALS
A. Ecosystem objective addressed by indicator:
Chemical contaminants Objective Summary Objective and Sub-Objective f) “Initially, the presence of chemicalsin the prevention/investigate category7 should be investigated in the ambient environment, in the appropriatemedia and location(s). In addition, sources of the chemicals in the prevention/investigate category should beidentified and the presence or absence of these sources in the basin should be confirmed. Presence of a source shouldtrigger continued monitoring of the media most likely to concentrate the chemical.”
B. Purpose or nature of indicator:
Chemicals identified in the LaMP as prevention/investigate are persistent, bioaccumulative and toxic but dataon their presence in the Lake Superior basin is lacking. Their presence in Lake Superior may be due tohistorical deposits, long-range transport, or current in-basin sources. As a first step, ambient monitoring(air/water/sediment) should be conducted to determine the presence/absence of these chemicals. Furthermore,in order to be proactive, potential source categories for these chemicals should be identified. Where possiblesources exist in the basin, source monitoring should be conducted. With this new information, the Parties candecide which category each of these chemicals should belong in.
C. Features of the indicator:
A literature search for each chemical must be carried out. Sources should be identified and their presence orabsence in the basin confirmed. The literature should also be searched for information on physical properties(HLC, octanol-water coefficient, etc), availability of analytical techniques, and the media that the chemicalsare likely to be detected in (e.g., is the chemical likely to be found in air, sediment, biota or water?). Based onthis information, these chemicals should initially be included, as appropriate, among the targeted list ofchemicals being measured in air, water, sediment and biota to investigate their presence in the Lake Superiorecosystem. For example, use of available monitoring facilities such as the IADN station at Eagle Harborwould allow investigation of the presence or absence of these chemicals in air (cf Section 3.3).
D. Illustration of the indicator:
Use trees should be completed for the chemicals. The sources identified in the use trees should be compared tothe facilities listed in the LaMP Stage 1. The results of ambient monitoring should be reported in theirentirety, as raw concentration data, so that the Parties can decide how to re-categorize these chemicals.
E. Limitations and uncertainties:
Possible sources of uncertainty include analytical methods and identification of potential sources in the basinusing existing data bases (e.g., SIC codes and other business registries).
F. Interpretation of the indicator:
Data collected from ambient and source monitoring in the basin will be used to determine whether continuedmonitoring is warranted. Depending on the results, these chemicals may be added to the lakewideremediation, local remediation or prevention/monitor categories.
7 1,2,4,5-tetrachlorobenzene, 3,3-dichlorobenzidine, 2-chloroaniline, tributyl tin, beta and deltaBHC and hexachlorobutadiene
39
4.0 Aquatic Community Objectives and Indicators of Aquatic Community Health within the Lake `SuperiorBasin
4.1 Background
This section was drafted by the Lake Superior Technical Committee (Mark P. Ebener, editor) of the Great LakesFishery Commission. The Committee adopted a slightly different format than that suggested by the BinationalProgram. Instead of being "indicator" driven as suggested in the charge to the writing teams, this section is more"objective" driven. This approach was taken to improve conceptual "flow" and readability.
The actual indicators in this draft section do not yet contain quantitative values. However, within the "Features of theIndicators" sections, we have provided rationale for the indicators along with discussion of which species should bepresent. If exact quantification of these key species is desired - as opposed to "trends" - further conceptual developmentis required. It is typically quite difficult to both determine "how much" of each species is desirable and/or possible, andto evaluate the relative seriousness of the situation should abundance fall below (or above) a specified value. Thus,exact quantification of an indicator can be a difficult process - especially within a changing ecosystem - but one whichcan be attempted at some time in the future.
4.2 Goal
The overall goal for this section is:
"To secure fish communities, based on foundations of stable self-sustaining stocks, supplemented by judiciousplantings of hatchery-reared fish, and provide from these communities an optimum contribution of fish, fishingopportunities and associated benefits to meet needs identified by society for: wholesome food, recreation,employment and income, and a healthy human environment."
The goal of the Aquatic Community Section of the Bi-national Program should relate to this goal, and to those alreadyagreed to and developed under the auspices of the Great Lakes Fishery Commission. All Great Lakes fisherymanagement agencies developed a common strategy to ensure that the agencies hold similar goals. From this strategy,the Joint Strategic Great Lakes Fishery Management Plan (GLFC 1980) was developed.
4.3 Aquatic Community Objectives
1. Diversity and self-sustainability
To restore and maintain diverse, healthy, reproducing, and self-regulating aquatic communities, comprised largely ofindigenous species, which are sustainable, and ecologically efficient.
2. Exotic species
Prevent the introduction of any “new” non-indigenous species, and exotic species currently inhabiting Lake Superiorshould be managed in a manner that is not detrimental to native species.
3. Habitat
Achieve no net loss of habitats that presently support Lake Superior fisheries; restore and maintain the productivecapacity of aquatic habitats that have suffered damage.
4. Contaminants

40
Levels of toxic contaminants in aquatic organisms should be below levels which are harmful to both human andaquatic community health
4.4 Aquatic Community Objectives Indicators
The aquatic community of Lake Superior contains species which are currently unique within the Great Lakes basin. Self-sustaining populations of indigenous fish species such as lean lake trout, siscowet lake trout, and lake herring arepresent throughout Lake Superior, although they are not yet at historical levels of abundance (Hansen 1994a;MacCallum and Selgeby 1987). Self-sustaining populations of these species are either not present at all, or, arepresent at very low levels of abundance in the other Great Lakes (Ebener et al. in press; Kerr and LeTendre 1991). Onthe other hand, Lake Superior also contains non-indigenous fishes such as ruffe, sea lamprey, Pacific salmon, rainbowsmelt, brown trout, and the non-indigenous cladoceran Bythotrephes cederstroemi (Pratt et al. 1992; Peck et al. 1994).Some of the indigenous fishes (lake trout) are long-lived and occupy the open lake and near shore areas, and mayrespond slowly to changes in the ecosystem and perturbations. Invertebrates and non-indigenous fishes are short-lived,occupy tributaries and estuaries for at least part of their life, and either induce or respond to ecosystem changes fasterthan the indigenous species. Therefore, we propose short-term action-required and long-term milestone indicators forthe aquatic community. For example, lean lake trout are a good long-term milestone indicator for judging the health ofthe open lake aquatic community (Marshall et al. 1987). However, because lake trout respond slowly to change, theyare not a good indicator of short-term stresses which will occur in harbors and tributaries to the lake. Changes in theaquatic invertebrate community of harbors and tributaries will provide indicators of short-term action-requiredstresses that may potentially alter the offshore aquatic community.
We propose to monitor aquatic ecosystem health in four habitat zones of Lake Superior: 1) offshore open waters of thelake >80 m deep; 2) nearshore open waters of the main lake 0-80 m deep; 3) harbor, estuaries, and embayments whichare separated from the open waters of the main lake, are subjected to seiche, and the fish community is dominated bypercids and minnows; and 4) tributaries which are not affected by lake seiche.
We developed three basic types of indicators that can be used in each habitat type to monitor health of the aquaticcommunity. These indicators are trends in abundance of both indigenous and non-indigenous species, the amount ofnatural reproduction, and levels of toxic contaminants in fish flesh. In developing indicators we attempted to insurethat indicator species are specific as possible to a habitat type, especially for contaminant monitoring.
Little of the information describing the status of indicators in offshore areas is being collected by federal, state,provincial, or tribal fishery agencies as part of their routine long-term research and assessment activities. Althoughsome sampling has been done in all zones, agencies are doing a comprehensive job only in the nearshore and harbors-estuaries-embayment habitats. Much of the offshore habitat has not been routinely sampled. The major harbors-estuaries-embayments have been sampled only in recent years in response to invasion of this habitat by non-indigenous species. Of the roughly 120 tributaries to Michigan waters of Lake Superior, only 3 to 5 have been routinelyassessed to determine fish abundance (J. Peck Mich. Dept. Nat. Res, Marquette, MI, per. comm.). Some informationcurrently being collected is based on short-term studies with definite time lines, so these studies will not provide long-term milestone indicators. It is very costly to gather the information necessary to evaluate health of the aquaticcommunity. In most instances the information will be collected annually unless rising administrative costs restrictactivities.
Most of the measures of abundance can vary tremendously from year to year. Therefore, short-term increases ordecreases in abundance of indigenous fish species should not be worrisome since indices of abundance are notorious forabrupt changes. Long-term trends in abundance should be the milestone for measuring progress toward achieving theobjectives since most the offshore fish community is made up of slow-growing, late maturing fish species. Whatbecomes important is to distinguish between observational variability and natural variability. In addition, abundancemay not be equal among geographic areas of Lake Superior because of differences in catchability of a species betweenareas. Weighting indices of abundance based on the amount of habitat will be used to make comparisons among areasbe more appropriate.
41
4.4.1 Offshore Community (>80 m deep)
INDICATORS: Monitor trends in abundance of key aquatic speciesMonitor for presence of non-indigenous species
A. Purpose or nature of the indicators:
The present offshore aquatic community of Lake Superior reflects historic conditions and is considered to behealthy, upon which deviations can be judged as unhealthy. The presence and relative abundance of lean laketrout, siscowet lake trout, and lake herring are measures of the degree of natural reproduction that is occurring inthis habitat. Self-sustainability of indigenous species is a method of measuring progress toward achieving theaquatic community objectives. We recognize that the presence of exotic species in the offshore habitat of LakeSuperior may prevent achievement of the aquatic community objective.
B. Features of the indicators:
1) The offshore fish community of Lake Superior should contain fishes such as pelagic, mature lean lake trout,siscowet lake trout, lake herring, burbot, deepwater ciscoes, and deepwater sculpins; particularly spoonheadsculpin. Historically, these fishes made up the structure of the offshore community. All these species arecurrently present in the offshore community, but probably not at historic levels of abundance, and probably notin the same structure as historically.
2) The zooplankton community should contain Cyclops bicuspidatus thomasi, Diaptomus sisilus, Diaptomusashlandi, Limnocalanus macrurus, Senecella calanoides, Mysis relicta, Diporeia hoyi, Kertella cochlearis,Killicottia longispina, Daphnia longispina, Bosmina longirostris, and Epishcura lacustris. These species wereall reported as common or abundant by various researchers during the 1940s through the 1970s in LakeSuperior (Lawrie and Rahrer 1973).
3) Benthic invertebrates such as amphipods, dipterans, heterodonta, chironomids, and oligochaetes should bepresent (Lawrie and Rahrer 1973).
4) The phytoplankton community should include a simple assemblage of diatoms such as; Cyclotella glomerata-stelligera, Cyclotella ocellata-kutzinginana, Fragilaria crotonensis, Rhizosolenia eriensis, Asterionella formosa,Synedra nana, Tabellaria fenestrata, Melosira granulata, and species of Stephanodiscus and Dinobryon asreported by Lawrie and Rahrer (1973).
5) The presence of non-indigenous species such as Pacific salmon, sea lampreys, and Bythotrephes cederstroemishould be viewed as stressors to the system. The impact of Bythotrephes and Pacific salmon on the offshorecommunity is unknown, but these species must be utilizing energy that otherwise would be used by indigenousspecies. Sea lampreys are known to be a stressor on lake trout stocks in Lake Superior (Pycha and King 1975).
Long-term trends in abundance of these species will be indexed as the catch of each species in a given unit ofsampling effort. Graded-mesh gill nets, bottom or midwater trawls, and long-line hooks will be used to samplefish. Long-term trends in abundance of plankton and zooplankton will be monitored annually during routineassessments using vertical hauls of a half-meter plankton net. Benthic invertebrates will be collected using Ponargrabs. The number and trends in abundance of indigenous fishes caught during surveys will be developedseparately for each component of the offshore habitat; pelagic fishes, pelagic zooplankton and plankton, andbenthic invertebrates. Survival, growth, amount of reproduction, and food habit information will also be collectedand reported as part of the sampling program in the offshore habitat.
Benthic (deepwater ciscoes) and pelagic (herring) coregonines should be the most abundant fish species present inthe offshore community. This assemblage of ciscoes should serve as the primary forage for pelagic lean lake trout,siscowet lake trout, and burbot as they did historically (Dryer et al. 1965). Deepwater sculpins should be the

42
tertiary prey species for all predatory fishes. Siscowet lake trout should be the top predator structuring prey fishabundance in the offshore habitat, and all forms of lake trout should constitute about 15% of the biomass of theprincipal forage species (Marshall et al. 1987). Burbot should be common in the offshore habitat and serve as botha predator on coregonines and sculpins, and as prey for siscowet lake trout. Standing stocks of burbot should beabout 10% greater than those of lake trout since lake trout prey upon burbot, and because low standing stocks ofburbot may reflect a benthic community under stress (Marshall et al. 1987).
Stable or increasing levels in abundance of indigenous species indicate that the offshore habitat is self-regulating,healthy, and not being impacted by the presence of non-indigenous species. However, indigenous species should bemuch more abundant than non-indigenous ones. Abundance of pelagic, mature lean lake trout is partly an inversemeasure of the survival rate for this species, therefore, survival of lean lake trout in the offshore habitat should be>55% (Healey 1978; LSLTTC 1986; Marshall et al. 1987; LSTC 1995).
C. Illustration of the index:
Relative abundance of indigenous and non-indigenous species over time will be used to illustrate changes in thepelagic and benthic fish community, plankton and zooplankton community, and benthic invertebrates. A pie chartwill be used to illustrate the percentage of the community made up of non-indigenous species. No historic dataexist to compare with the indices that will be developed.
D. Limitations and uncertainties:
Labor and equipment costs will limit establishment and maintenance of any of these indices. No agency currentlygathers much information concerning the offshore aquatic community. Agency commitments to increase datacollection in the offshore habitat of Lake Superior will undoubtedly mean a re-direction of efforts away from otherparts of the ecosystem. Information concerning abundance of plankton, zooplankton, and benthic invertebratesshould be collected annually since these are generally short-lived species and will respond quickly to environmentalchanges. Information describing abundance of lean lake trout, siscowet lake trout, chub, and lake herring may becollected less often because they grow slowly and respond to ecosystem changes slower than invertebrates. Effortsshould be made to sample the offshore habitat within each political jurisdiction; Michigan, Wisconsin, Minnesota,and Ontario.
E. Interpretation of the indicators:
Francis et al. (1979) list 18 human stresses on Great Lakes ecosystem, and of those, three impact the offshorecommunity of Lake Superior. These stressors include fishing and other harvesting of biota, introductions andinvasions of exotic species, and nutrients and eutrophication from sewage plants, agricultural and urban run-off. Long-term increases in abundance of planktonic plants and animals may suggest eutrophication is changingproductivity of Lake Superior and both educational and regulatory changes will be necessary to affect productivity. Increases in abundance of non-indigenous species suggest that educational, administrative, and regulatory changeswill be necessary to control their numbers and future introductions. Indicators of overfishing would be changes incomposition of the fish community from high-valued to low-valued species, reductions in size structure, declines inmean age, disappearance of distinct stocks, and continual declines in abundance through time (Francis et al. 1979). Regulatory solutions will be necessary to reduce the impact of harvesting and overfishing.
4.4.2 Nearshore Community (<80 m deep)
INDICATORS: Monitor trends in abundance of key aquatic speciesMonitor for presence of non-indigenous speciesMonitor and document habitat loss or restoration
A. Purpose or nature of the indicators:

43
The nearshore aquatic community of Lake Superior is reverting to historic conditions since many indigenousspecies are self-sustaining, but is still subject to the stressors which modified it away from historic conditions(Hansen 1994a). Native species assemblages are well represented in the nearshore habitat by lean lake trout,siscowet lake trout, lake herring, lake whitefish, longnose and white suckers, walleye, slimy sculpin, Diporeia spp.and Mysis relicta. A non-indigenous species like sea lamprey is also abundant in the nearshore area and is knownto exert detrimental and measurable influences on lean lake trout (Pycha and King 1975; Hansen et al. 1994). Weare less certain of the effects of non-indigenous species on the nearshore aquatic community. These indicators willprovide a measure with which to evaluate diversity and long-term sustainability of the aquatic community.
B. Features of the indicators:
1) Long-term trends in abundance of lean lake trout will be measured by annual monitoring and expressed as thenumber of fish caught with a given unit of effort during spring gill net surveys in specific management units(Hansen et al. 1994; Hansen 1994b).
2) Relative abundance estimates of non-indigenous fishes and zooplankton caught annually during routine agencyassessments will be developed.
3) Long-term trends in abundance of lake herring and rainbow smelt will be monitored annually and expressedas the number or weight of fish caught with a given unit of effort during spring trawl surveys and summer gillnet surveys.
4) Long-term trends in abundance of zooplankton will be monitored annually based on vertical plankton net towsmade at specific sites along the entire shoreline of Lake Superior.
Besides abundance, other population parameters such as survival, growth, reproduction, and food habits, at leastfor fishes, will be collected and analyzed concurrently to assist with interpretation of the indicator.
Mysis and Diporeia should be the dominate zooplanktors which serve as food for small lake trout and the principalforage species (Marshall et al. 1987). Size, abundance, and composition of zooplankton should be sufficient tosupport growth and sustain recruitment levels of pelagic and larval fishes (Kitchell 1985; Crowder et al. 1987;Kitchell et al. 1994). A healthy nearshore aquatic fish community should be dominated by lake herring with an ageand size structure suitable to serve as the primary food for nearshore predators. Self-sustaining populations oflean lake trout should be the dominant nearshore predator at levels of abundance approaching that found during1929-43 (Baldwin et al. 1979; LSLTTC 1986; LSTC 1995). All historic spawning areas should contain self-sustaining populations of lean lake trout that reflect the many known historic phenotypic forms once found in LakeSuperior (Marshall et al. 1987). Sea lamprey abundance should only be 10% of that currently found in nearshoreareas (Busiahn 1990). Non-indigenous salmonines should be present in the nearshore community at levels whichdo not interfere with lean lake trout growth and reproduction (LSLTTC 1986; LSTC 1995).
C. Illustration of the index:
Graphs illustrating trends in abundance of lean lake trout in each political jurisdiction will serve as one way tomeasure health of the nearshore aquatic community (Hansen 1994b). Annual estimates of abundance can becompared with both historical levels as far back as 1929 and to the average during 1929-43; a reference period fordescribing lake trout abundance in Lake Superior.
Graphs illustrating trends in abundance of non-indigenous species will be developed for the pelagic and benthiczones as Klar and Weise (1994) provided for sea lamprey.
Trends in relative abundance of lake herring, other coregonines, and non-indigenous fishes will be describedgraphically for each jurisdiction as by Peck et al. (1994), Selgeby et al. (1994), and MacCallum et al. (1994).
44
A twenty year time series describing abundance of zooplankton already exists at the Ashland Station of theNational Biological Service and this information will be updated annually in a table illustrating trends in relativeabundance of the principal species.
D. Limitations and uncertainties:
Much of agency efforts to gather information regarding Lake Superior fishes has been concentrated in the nearshorehabitat. Consequently, some of the information needed to evaluate this indicator already exists, or can beincorporated into existing surveys.
Estimates of relative abundance generated from gill net survey data are notorious for exhibiting wide annualvariations over short time frames. In addition, coregonine populations in Lake Superior produce large and smallyear-classes that easily vary 10 fold at any given level of adult abundance (Selgeby et al. 1994). The effects of theselarge and small year-classes can influence relative abundance estimates for many years, so long-term stabilityshould be the measure of community health.
Biological information necessary to evaluate this indicator should be collected annually throughout the nearshorehabitat. Our understanding of aquatic community dynamics in the nearshore habitat of Lake Superior isdeveloping only now; after 30-50 years of gathering information (Hansen 1994a; Hansen 1994b). Gaps ininformation produced from sampling programs which do not take place every year make interpretation of the dataeven more difficult. Indices of abundance for a species in an area will be weighted by the square kilometers ofhabitat to make comparisons across regions of Lake Superior more appropriate.
E. Interpretation of the indicators:
Of the 18 human stresses on the Great Lakes ecosystem listed by Francis et al. (1979), probably nine of them affectthe nearshore aquatic community. Major stressors to the nearshore aquatic community include the followinghuman perturbations: fishing and other harvesting of biota, introductions and invasions of exotic species, nutrientsand eutrophication from sewage plants, industry and agriculture, and shoreline destruction due to filling anddevelopment. Overfishing has been implicated in the demise of many fish stocks in Lake Superior (Lawrie andRahrer 1972; Selgeby 1982), but the collapse of many fish stocks has ultimately been due to a synergistic effect ofoverfishing coupled with introductions of exotic species and habitat destruction (Lawrie and Rahrer 1972).
As stated earlier, we do not fully understand the dynamics which allow non-indigenous species to thrive at theexpense of indigenous species (Crowder 1980; Selgeby et al. 1994), but they sometimes do. The introduction of non-indigenous species ultimately produces declines in abundance of preferred indigenous species (Pycha and King1975; Loftus and Hulsman 1986; Evans and Loftus 1987; Eck and Wells 1987). Proliferation of sea lamprey andBythotrephes in the nearshore habitat of Lake Superior is a problem because we have allowed industrial interestslike the Great Lakes shipping industry to control the flow of exotic species. Control of exotic species can beaccomplished through regulatory changes over industry, by educating the public to the dangers of exotic species inLake Superior, and finally by stocking of predators to control the exotic species.
Overfishing and shoreline destruction both cause declines in abundance by affecting the ability of the population tosustain itself, but these two stressors affect fish populations differently. Overfishing limits the number of adultsavailable for reproduction and subsequently reduces the number of progeny. Regulatory changes can be institutedto control fishing and increase adult abundance. Shoreline development decreases the amount of habitat availablefor reproduction which then also reduces the number of progeny. A species can not sustain itself without theappropriate habitat. Most habitat is lost through activities which are controlled by local units of government suchas townships and county boards. The basic solution to controlling shoreline development is education of local unitsof government, and building administrative linkages between local governments and resource managementagencies.

45
4.4.3 Harbor-Embayments-Estuaries Community
INDICATORS: Monitor trends in abundance of key aquatic speciesMonitor for presence of non-indigenous speciesMonitor and document habitat loss or restoration
A. Purpose or nature of the indicators:
Nearly all the Areas of Concern (AOC) identified by the International Joint Commission (IJC) on Lake Superiorare located in harbors, bays, or estuaries. Aquatic communities in these areas have born the brunt ofenvironmental damage throughout the basin. This indicator provides a direct measure of the health of the LakeSuperior ecosystem since the impact of remedial action plans to alleviate the environmental damage will be felthere first.
B. Features of the indicators:
1) Long-term trends in abundance of walleye, yellow perch, northern pike, and smallmouth bass will be monitoredannually in selected sites and expressed as the number of fish caught in a given unit of effort using fyke nets,gill nets, trawls, or electrofishing gear.
2) Trends in abundance of non-indigenous species will be monitored annually at selected sites and expressed asthe number of fish caught in a given unit of effort using fyke nets, gill nets, trawls, electrofishing, or hydroacoustics gear.
3) Trends in abundance of chironomid, oligochaete, and burrowing mayfly larvae in bottom sediments will bemonitored annually in selected sites and expressed as the number of animals per unit area collected withPonar grabs.
(1) The table will be subdivided into species indicative of a healthy benthic community and species whichinhabit degraded benthic habitats.
Abundance of aquatic species will be monitored in relatively healthy areas and compared to catches in unhealthyareas as a way to evaluate progress at achieving the aquatic community objectives. Fish catches in relativelyhealthy areas like Waiska Bay, Chequamegon Bay, Black Bay, and Cloud Bay should be compared with catchesmade in AOC's like the St. Louis Estuary, Thunder Bay, Nipigon Bay, and Jackfish Bay.
Abundance and composition of benthic invertebrates in the sediments of harbors, bays, and estuaries are valuableindicators of ecosystem health because these animals are sensitive to pollution, and respond quickly to changes inthe environment. These animals can provide the short-term action-required indicators necessary for measuringprogress toward achieving aquatic community objectives.
C. Illustration of the index:
Graphs will be developed to illustrate trends in abundance of yellow perch, walleye, and non-indigenous species inAOC and non-AOC sites.
A table will be developed to illustrate density of benthic invertebrates in AOC and non-AOC sites. D. Limitations and uncertainties:
The development of remedial action plans in AOC's should provide the impetus for creation of sampling programsto monitor health of harbors, bays, and estuaries. Current agency efforts in these areas of Lake Superior are oftenlimited in scope and duration, so that no consistent long-term information on abundance is being collected. Fishery

46
agencies from Minnesota, Wisconsin, and the U. S. federal government have begun an exhaustive program ofmonitoring fish abundance in the St. Louis estuary in response to invasion of the area by ruffe. The OntarioMinistry of Natural Resources also has an ongoing ruffe monitoring program in Thunder Bay. The monitoringprograms in Thunder Bay and the St. Louis Estuary are providing valuable information on trends in fishabundance, but neither program is intended to gather long-term milestones for evaluating aquatic communityhealth.
E. Interpretation of the indicators:
Fifteen of the eighteen human stresses on Great Lakes ecosystems listed by Francis et al. (1979) probably affectthe aquatic communities in harbors, bays, and estuaries on Lake Superior. These stressors include those listedpreviously for other indicators, but they also include water diversions, draining of wetlands, dredging, disposal ofdredge spoils, eutrophication from sewage plants, agricultural and urban runoff, thermal loading, and entrainmentand impingement in water intake structures. Short-term changes in fish abundance and species composition dueto improved water quality will be detected over a relatively short time period in this habitat type and provide ameasure of community health. However, this indicator may or may not diagnose a specific problem. Improvedwater quality in harbors and estuaries may increase survival and growth of a fish species, but increases in anglerexploitation because of improved water quality may reduce abundance. Because of the complexity of interactionsamong the stressors to harbors, bays and estuaries, solutions to the problems will involve educational,administrative, and regulatory actions.
4.4.4 Tributary Community
INDICATORS: Monitor trends in abundance of key aquatic speciesMonitor for presence of non-indigenous speciesMonitor and document habitat loss or restorationMonitor self-sustaining indigenous species
A. Purpose or nature of indicators:
Reproducing and self-regulating aquatic communities are the basis for judging the health of the Lake Superioraquatic community. Many Lake Superior fishes depend upon tributaries for growth, survival, or reproductionsometime during their life cycle. Walleye, lake sturgeon, suckers, minnow species, lake trout, and non-indigenoussalmonids move freely between tributaries and the lake. Unfortunately, construction of hydroelectric dams, logging,and saw mill operations during the early part of this century destroyed the usefulness of many tributaries for LakeSuperior fishes. As a result, abundance of many fish populations declined. Tributaries provide the linkage betweenthe terrestrial and aquatic habitats of Lake Superior and achievement of aquatic community objectives iscontingent upon restoration of tributary habitat.
B. Features of the indicators:
1) The presence of self-sustaining populations of brook trout, white suckers, walleye, sturgeon, burbot and otherindigenous fishes in selected coldwater and coolwater tributaries to Lake Superior will be monitored annually.
2) Trends in abundance of salmonines in selected tributaries will be monitored annually and expressed as theeither the absolute number per unit area, or as the number caught in a given unit of electrofishing.
3) Information on growth and abundance of larval sea lamprey will be used as indicators of water quality andstream productivity.
Healthy tributaries to Lake Superior will contain abundant populations of indigenous and non-indigenous fishspecies. Although non-indigenous fish species are considered as stressors to the aquatic community, they also areexcellent indicators of the health of the habitat in Lake Superior tributaries. In many instances, a non-indigenous
47
species is the only index we have to measure the health of tributary systems. Non-indigenous fishes such as cohosalmon, pink salmon, and sea lamprey require healthy tributary systems for survival of their species.
Relative abundance of walleye and lake sturgeon will be monitored periodically in the Bad River and SturgeonRivers within U. S. waters. Not all salmonine species will be present in each tributary sampled, but absolute andrelative abundance of rainbow trout, brown trout, brook trout, coho salmon, chinook salmon, and pink salmon willbe monitored annually in the following tributaries:
Minnesota - Knife River, Blackhoof River, Kimball Creek, and Devils Track River.Wisconsin - Little Souix and Big Souix River, Fish Creek, Little Brule, Brule River, east fork of the Flag River,
Pikes Creek, Cranberry River, Onion River.Michigan - Chocolay River, Little Garlic River, and Chinks Creek.Ontario - Nipigon River, Steel River, Michipicoten River, and Kaministikwia River.
The United States Fish and Wildlife Service and Canadian Department of Fisheries and Oceans maintain long-term data series describing growth and abundance of larval sea lamprey in many tributaries of Lake Superior. Larval sea lamprey require high quality habitat for growth and survival and the long-term data series will beuseful for evaluating changes in health of the habitat in tributaries.
C. Illustration of the index:
Absolute abundance of juvenile salmonine fish species in selected tributaries will be described in tables based onmark-recapture estimates made from electrofishing surveys.
The number of coho salmon, brown trout, rainbow trout, chinook salmon, and brook trout migrating up tributariesthat have monitoring or trapping facilities will be illustrated in a table.
A table will be developed which illustrates larval sea lamprey growth and survival in tributaries of varyingproductivity and health.
D. Limitations and uncertainties:
Most of the information concerning this indicator is currently being collected by the state and provincial agencies,but only in selected tributaries. Expansion of this indicator to tributaries throughout the Lake Superior would beideal, but will require additional monies that the agencies currently do not possess.
F. Interpretation of the indicators:
Human stressors to the aquatic community of Lake Superior tributaries include logging activities, road andpipeline stream crossings, sedimentation caused by poor land-use practices, industrial pollution, non-indigenousspecies, hydroelectric dams, and water diversion. These activities can only be controlled through a combination ofeducational, administrative, and regulatory solutions. Logging and land-use practices reduce the amount ofhabitat available for reproduction and survival of fishes which use tributaries, while industrial pollution reducesthe number of animals which survive the reproductive process. Dams prevent fish from reaching spawning groundsand kill fish which move downstream. Reductions in the influence of these stresses to aquatic communities shouldbe reflected by increased abundance and survival.
4.4.5 Contaminants
INDICATOR: Monitor toxic contaminants in aquatic organisms

48
A. Purpose or nature of the indicator:
The amount of human contaminants in fish flesh is a direct measure of the progress that is being made at reducinginputs of toxic contaminants to the Lake Superior ecosystem, and also help evaluate the potential of havingaquatic biota that are reasonably free of contaminants from human activities.
We chose to monitor contaminants in species which tend to spend all or most of their life within one of the fouraquatic habitat types of Lake Superior. This way, the level of contaminants in a particular species should reflectloadings into that habitat type, thus making it easier to identify sources of the contamination, and ultimatelyeasier to manage the issue.
B. Features of the indicator:
At a minimum, concentrations (mg/l) of PCB, DDT, chlordane, mercury, dioxin, DDE, dieldrin, and toxaphene shouldbe determined for one prey and one predator species of fish from each habitat type.
1) Offshore habitat
Trends in levels of toxic contaminants in siscowet lake trouts, deepwater ciscoes, and deepwater sculpins will bemonitored in each of the political jurisdictions of Lake Superior. Siscowet lake trout and deepwater ciscoes will becollected with bottom set gill nets during routine assessment surveys that are conducted by each of the fisheryagencies.
2) Nearshore habitat
Long-term trends in concentrations of contaminants in lean lake trout, walleye, lake whitefish, rainbow smelt,slimy sculpins, burbot, lake herring, coho salmon and chinook salmon should be monitored in each of the politicaljurisdictions. Each of these fish species will be collected with either bottom set gill nets or bottom trawls duringroutine assessment surveys that are conducted annually by each of the fishery agencies.
3) Harbors-embayments-estuaries
Trends in concentrations of contaminants in walleye, brown bullhead, yellow perch, channel catfish, and spottailshiners should be monitored annually in AOC’s and compared to non-AOC areas. There are four AOC's inCanadian waters and three in U. S. waters of Lake Superior. Potential non-AOC sites could include Kakagon andBad River Sloughs, Waiska Bay, Cloud Bay and Lac La Belle. Fish species will be collected with fyke nets, gillnets, trawls, and seines during routine fishery agency surveys. Trends in contaminants in this habitat should alsobe evaluated using a benthic invertebrate such as Hexagenia.
4) Tributaries
Monitor long-term trends in concentrations of contaminants in mottled sculpins, and non-anadromous species likewhite suckers, rainbow trout, brook trout and brown trout. These species will be collected from selected tributariesusing electrofishing gear. The Wisconsin Dept. of Natural Resources currently monitors long-term trends incontaminants in fish collected from the Brule River.
C. Illustration of the index:
IJC already possesses information regarding concentrations of contaminants in lean lake trout and rainbow smeltcollected from various areas of Lake Superior over the last 20 years. Concentrations of PCB's in lean lake troutand rainbow smelt collected from the nearshore habitat as part of the IJC monitoring program should be presentedgraphically over time at each of the major collection sites. Concentrations of contaminants in lake herring andsiscowet lake trout should also be monitored since both species are abundant in Lake Superior.

49
Concentrations of contaminants in the flesh of other species collected as part of the monitoring program should bepresented in a table which details levels of the major contaminants found annually in each fish species collectedfrom each habitat type.
D. Limitation and uncertainty:
Man-made contaminants are known to inhibit reproduction of Great Lakes fish, but the linkage between specificlevels of contaminants and reproduction have not been established on Lake Superior. Most indigenous and non-indigenous fishes living in Lake Superior are successfully reproducing. Where reproduction is limited, the belief isthat contaminants are not the cause. High levels of contaminants in Lake Superior fish are more an indicationthat the fish are unhealthy for human consumption rather than an indication of the health of the fish populations.
E. Interpretation of the indicator:
Unlike other indicators, the level of man-made contaminants found in fish flesh provide a direct measure of thehealth of the Lake Superior ecosystem. Typically, concentrations of contaminants in fish flesh do not vary as muchon an annual basis as do trends in abundance of a fish species. Because of this characteristic, trends in levels ofcontaminants in fish provide a direct feedback concerning our ability to reduce and control point and non-pointsources of man-made contaminants into the lake. Changes in the levels of contaminants found in fish species fromthe offshore habitat of Lake Superior measure the rate of atmospheric deposition. In most instances, atmosphericdeposition originates outside the Lake Superior basin. To reduce contaminants in offshore fish species will requirea change in our collective behavior as a society, and solutions to the problem will have to be addressed througheducational and regulatory actions. On the other hand, contaminants in fish from tributaries and harbors usuallyindicate a problem with a local industry that can be addressed through regulatory solutions.
50
5.0 Indicators and Targets for the Terrestrial Wildlife Objective
5.1 Background
The Habitat Committee of the Lake Superior Binational Program was asked to develop potential indicators for theHabitat Objective as well as the Terrestrial Wildlife Objective. This was accomplished through meetings held inDuluth, Minnesota (Dec.1-2,1994), and Sault Ste. Marie, Michigan (Jan. 11-13, 1995), and through the work ofindividual committee members. A review of other indicator development exercises and relevant literature preceded themeetings, the first of which took the form of a brainstorming session followed by review of the resulting ideas. Thoseideas which the committee judged to have merit as potential indicators were assigned to individuals to complete.
The core group responsible for this work was:
Pat Collins, Minnesota DNRRichard Hassinger, Minnesota DNRRich Klukas, US Parks ServiceKaren Kroll, Minnesota PCAJeri Graham, Lake Superior Programs OfficeEd Iwachewski, Ontario MNR/Environment Canada
Others who attended meetings and provided valuable contributions were:
John Kelso, DFO CanadaNancy Larson, Wisconsin DNRThomas Busiahn, US Fish and Wildlife ServiceStephen Schlobohm, USDA Forest ServiceBarbara Leuelling, USDA Forest ServiceDave Morton, USDA Forest ServiceRichard Greenwood, USFWS/USEPASonny Myers, 1854 Treaty AuthorityAnn McCammon-Soltis, GLIFWC
Within the area of the Basin, there are significant differences in climate, land use and cover, and aquatic andterrestrial communities. Some species or species assemblages which might have been excellent indicators in a portionof the Basin would have little or no value in assessing the remainder of the Basin. This narrowed the range of potentialindicators to those which could be used basinwide.
The components of the Terrestrial Wildlife Objective have been addressed using: eagles; ungulate range; mink; andneotropical birds as potential indicators.
Several potential indicators were discussed and rejected by the our committee, for a variety of reasons:
Otter - the rationale for use of the otter in monitoring contaminant levels is similar to that for the mink, and it wasdecided that this represented an unnecessary duplication.
Wolves- they are only common in the northern portion of the basin and thus would not have basinwide application.
Bears- because of their omnivorous diet, movement within large home ranges and widespread distribution, it wasthought that black bears might be an ideal indicator of habitat status in the Basin. It was determined howeverthat it was difficult to establish the linkage between habitat changes and either bear populations, reproductiveeffort or condition because of compounding factors (e.g. hunting mortality) and the lack of ongoing monitoring.

51
Amphibians - several recent studies have suggested a worldwide decline in amphibian populations. Despite someexisting efforts elsewhere (e.g. FrogWatch in some Canadian Areas of Concern) there was little or no experience orongoing application at present in the Basin.
Loons- it was not clear to the Committee how programs such as LoonWatch (in Minnesota) would be appliedbasinwide, nor what the best use of the information would tell us in comparison to other proposed indicators.
Peregrines- collecting contaminant information from the ongoing effort to restore peregrine falcons in the Basin wasthought to be a duplication of the eagle work, and that the low numbers of peregrines would represent aninadequate sample size.
5.2. Bald Eagle Abundance and Contamination
A. Ecosystem Objective addressed by this indicator:
Terrestrial Wildlife Summary Objective and Sub-Objective a) "Bald eagle populations that nest within the LakeSuperior Ecosystem should be recognized as valuable integrators and indicators of the health of the Lake Superiorecosystem"
B. Purpose or nature of the indicator:
The Bald Eagle Biosentinel Protocol is being developed by an Interagency Working Group to coordinate monitoringof Bald Eagle populations and contaminant loads in the Great Lakes. The Bald Eagle has been identified as asuitable indicator of ecosystem health and water quality because it is a fish eating species at the top of the foodchain, and is important to the general public.
C. Features of the indicator:
The protocol uses a multi-tier approach to accommodate the needs and resources within each state or province.
Tier 1 - Optimum Monitoring. This level of monitoring should be employed in regions where Bald Eaglepopulations experience elevated contaminant exposure and/or productivity rates below the long-term average for a3 year period or when productivity of a subunit averages less than 1.0 young/occupied territory over a five yearperiod.
Aerial Surveys: Conduct annual late winter/spring (dependent on regional laying date) aerial surveys to locate alloccupied Bald Eagle territories in Lake Superior watershed and reference area subpopulations. Conduct a secondproductivity flight to document the number of young produced per occupied territory when chicks are 5-7 weeks old. Additional flights may be required if greater knowledge of the stage of nest failure is required (i.e., incubating vs.post-hatch).
Nestling Banding/Blood Sampling/Egg Collections: Color band and collect blood samples from nestlings (5-7 weeksof age) at successful nests in the survey region annually. Examine nestlings for deformities and search failed nestsfor unhatched eggs. Nestling plasma and unhatched eggs will be archived and analyzed for organochlorine contentevery 3-5 years.
Adult Turnover Rates: Participate in research to evaluate the use of nestling DNA fingerprints to measure rates ofadult turnover at Lake Superior vs. reference area nest sites. Plasma should be collected at survey nest sitesannually for this analysis.
Nestling Biomarkers/Immune Function: Participate in research program to develop biomarkers/bioassays whichassess nestling health status and endocrine and immune function to quantify the physiological impact of
52
contaminant exposure. Nestling Bald Eagles with a range of contaminant exposure should be sampled for thisanalysis.
Necropsy/Mortality Data: Determine cause of death and archive tissues from all Bald Eagles found dead duringthe breeding season in Lake Superior watershed, utilizing the National Wildlife Health Laboratory of the U. S.Fish and Wildlife Service.
Tier 2 - Minimum monitoring. This is the minimum level of monitoring that an agency should employ to detectchanges in the population status or contaminant exposure of a Bald Eagle subpopulation exhibiting elevatedcontaminant exposure and/or reduced productivity:
Aerial Surveys: Conduct annual late winter/spring (dependent on regional laying date) aerial surveys to locate all(or a sample of) occupied Bald Eagle territories in Lake Superior watershed and reference area subpopulations. Conduct a second productivity flight to document the number of young produced per occupied territory when chicksare 5-7 weeks old.
Nestling Banding/Blood Sampling/Egg Collections: Color band and collect blood samples from nestlings (5-7 weeksof age) at successful nests in the survey region annually. Examine nestlings for deformities and search failed nestsfor unhatched eggs. Nestling plasma and unhatched eggs will be archived and analyzed for organochlorine contentevery 3-5 years.
Tier 3 - Healthy Population Monitoring. This level of monitoring will be recommended for Great Lakes Bald Eaglesubpopulations which achieve a five year productivity average of ≥ 1 young/occupied territory. Specific monitoringrequirements will be developed by the Interagency Bald Eagle Workgroup once this level of productivity is achievedin a Great Lakes Bald Eagle subpopulation. Monitoring will reflect a scaled-down version of Tier 1 and Tier 2.
For this indicator the target would be: greater than 1.0 young/occupied territory and zero organochlorinecontaminants in eggs and nestling serum.
D. Illustration of the indicator:
Using this protocol, presentation of the index could include graphical comparisons between productivity andcontaminant loads between subpopulations within the Lake Superior watershed, and with other Great Lakessubpopulations.
E. Limitations and uncertainties:
Bald Eagles do not spend their entire lives on one territory. While migration distances are not as great as those ofneotropical migrant birds, eagles do spend a significant part of the year off their nesting territories. Isolatingcontaminant exposure on breeding territories from potential exposure from other areas is difficult. However, thismonitoring protocol focuses on indices that are believed to be predominantly influenced by environmentalconditions of the breeding territory.
F. Interpretation of the indicator:
Using this monitoring protocol, interpretation of the indicator is based on deviations from reference regions whereBald Eagle populations are believed to be relatively healthy. Reference regions include Wisconsin's North CentralDistrict, Minnesota's Superior and Chippewa National Forests, and those inland upper and lower Michigan nestswhere eagles are not likely to forage on anadromous Great Lakes fish. These regions retained the core of the BaldEagle population during the "DDT-era", have been found to have the lowest levels of contaminants in eagle eggs andnestling serum, and have a stable, healthy rate of productivity (1.0-1.3 young/occupied territory).
53
5.3. Ungulate Range in the Lake Superior Basin
A. Ecosystem Objective addressed by this indicator:
Terrestrial Wildlife Summary Objective and Sub-Objective b) "Native wildlife will be recognized as key elements of ahealthy Lake Superior ecosystem"
B. Purpose or nature of the indicator:
Within the Lake Superior basin and surrounding area, the ranges occupied by large herbivores (woodland caribou(Rangifer tarandus caribou), moose (Alces alces), white-tailed deer (Odocoileus virginianus) and elk (Cervuselaphus)) have been substantially altered from conditions existing presettlement. Changes in ungulate range havebeen associated with changes in land use and landscape patterns, resultant changes in wildlife communitystructure, and other anthropogenic stressors such as hunting and poaching. Declining populations of woodlandcaribou and a reintroduced population of elk must be carefully managed and monitored if these species are toremain as components of a healthy Lake Superior ecosystem.
For this indicator, the ranges of the four ungulate species currently present in the basin would be mapped on aGeographic Information System database and any changes in range size or location would be monitored. The indexwould allow quantitative analyses of gains or losses in species range over time, and a comparison to knownhistorical range. This would indicate the health of native ungulate populations within the basin and, because ofthe requirements of each species for different forest types, also provide an impression of how forest managementactivities may be affecting wildlife communities in general. Since one or more of these ungulates is absent invarious parts of the basin, and because one species may be affected by the presence of another, assessing trends inonly one species of large herbivore, without considering relationships with other species, provides an incompletepicture for the Lake Superior watershed. In addition, the recreational (hunting) and aesthetic appeal of theseanimals to the general public increases the usefulness of this indicator as a communication tool about ecosystemhealth.
C. Features of the indicator:
I. Proportion of historical range occupied
Current and historical ranges of white-tailed deer, moose, woodland caribou and elk would be mapped as datalayers for GIS analysis. The range would be recorded as presence or absence in grid blocks, about 10x10 km2,
compiling data for a 5 year survey period. An index of proportion of historical range currently occupied (size ofcurrent range/size of historic range) would be the primary measure.
Monitoring of ungulate populations varies widely among the different jurisdictions within the Lake Superior basin. Nonetheless, it should be possible to incorporate much of the monitoring required for this range index from ongoinginventory programs and recorded observations:
Woodland caribou: Continuous caribou range is found only in the northernmost region of the basin, along withisolated populations on islands on the north shore of Lake Superior. Many of the island populations areintensively monitored for research purposes. Aerial flights to determine range occupancy of the boreal forestdwelling caribou, particularly for winter range, have been carried out on a irregular basis since the mid-1970’s asinformation for forest management plans and park expansion was required. Anecdotal information about decliningrange exists from 1880 onwards. Because of the ongoing decline of this species within the basin, it will beimportant to provide annual funding for aerial surveys to assess further changes in range.
Moose: Moose have been intensively monitored in Ontario and Minnesota, from about 1950-60 onwards, toestimate population and reproductive success for the purposes of establishing harvest quotas. Surveys are carriedout based on a 20% stratified random sample of moose management units every one to three years. Such surveysgive an indication of moose range although they do not sample it directly. Additional information may be obtained

54
during flights to determine caribou range occupancy or through an expansion of regular census coverage along theedges of range every 5-6 years. The introduced and migrant populations in Michigan will be surveyed using aerialtransects every few years (at least every 4 years). In Wisconsin, where only a remnant and unmonitored moosepopulation exists, moose presence is anecdotal. Information about historical distribution is also primarilyanecdotal although there is some written documentation in the form of old reports such as surveyor’s records.
Deer: Deer are currently widespread throughout Minnesota,Wisconsin and Michigan. Population estimates and
harvest quotas in the first two states are set using population models based primarily on hunter return data andhave been ongoing since the 1950’s. Information about kill location, and thus deer distribution, is included withhunter information provided to the responsible agency. A system of pellet counts along transects is ongoing inMichigan, also since the 1950’s to determine population and distribution. Deer in Ontario, which have beenestablished from animals moving north from the States, are no longer specifically inventoried as they were in the1970's, when aerial surveys were conducted and hunter return data collected. However, extensive aerial surveys formoose are conducted throughout the Ontario portion of the basin, during which the presence or absence of deer inthe survey blocks is noted. Historical information about deer distribution is anecdotal.
Elk: A reintroduction of elk is planned for 1995 in the Chequamegon National Forest in Wisconsin. There arecurrently no other elk populations within the basin. Historical information is mostly anecdotal and may be furtherdiscussed in agency feasibility assessments (in Michigan and Wisconsin) of reintroduction possibilities.
II. Range shifts
For the situation where a species is increasing its range in one part of the basin but decreasing its range in otherareas of the basin, a numerical index summarizing historical range occupancy may not indicate these changes. GISmaps of current range, range limits 5, 10 and 20 years previous and the historical boundaries could be used toillustrate trends.
An index to measure how far the geographic centre of the current range is from the centre of the historic range hasbeen proposed. This could be done using GIS technology to determine the central point of a polygon encompassingthe outer limits of the current range for all populations of a species to compare to the central point of a similarpolygon of historical range. Reintroductions and inclusion of widely dispersed, isolated populations would,however, greatly affect such an index.
For this indicator the target would be: the ranges occupied by native ungulate species (woodland caribou, moose,elk, and white-tailed deer) will remain at current levels or shift toward those ranges occupied during pre-settlement times.
D. Illustration of the indicator:
If historical range size is taken as 1, a bar graph can be used to illustrate changes in range size as compared tohistorical limits (Fig. 1), where values greater than 1 indicate an expanded range and values less than 1 reveal ashrinking range. A line graph may be used to show changes inthis index over time and illustrate whether or not the index is moving in the desired direction (Fig. 2). Changes inrange size for various populations around the basin can be illustrated on computer generated maps showingcurrent vs. historical ranges of the three species, highlighting the changes over time. Data should be mapped for atleast four historical periods from presettlement to current depending on existing information. Ongoing monitoringdata should be assessed on five year intervals.

55
Figure 1. An example, using hypothetical data, of a bar graph to represent the proportion of historical ungulate rangeas compared to current limits.
Figure 2. An example, using hypothetical data, of a line graph to illustrate changes in the ungulate range index overtime.
E. Limitations and uncertainties:
Although many of the necessary data for monitoring current range size are already being collected by resourcemanagement agencies in the various jurisdictions, additional aerial monitoring to refine ungulate range
Current range index
0.5
1.5
2.5
Deer Moose Caribou Elk
Species
Cur
rent
/his
tori
cal r
ange
Ungulate Range Index
0.5
1.5
2.5
1850
1860
1870
1880
1890
1900
1910
1920
1930
1940
1950
1960
1970
1980
1990
2000
Time (years)
curr
ent /
hist
oric
al r
ange
Caribou
Moose
Deer
Elk

56
descriptions will likely be required and will be expensive. Further costs would be associated with mapping thedata, digitizing, compilation of historical range information, and analysis.
For much of the historical data, range size must be estimated based on anecdotal information. Little, if any,information has been published from before 1900. This makes it difficult to establish a baseline year and astandard for historical range. As well, there is no way to confirm species identification from early records, forexample, whether the animals observed were moose or elk. Care must be taken when defining the range of aspecies, particulary for periods when little information is available. Reintroduced populations or small, isolatedpopulations should be identified and excluded from estimates of historical, contiguous range for that species.
There is some difficulty applying this indicator to the basin as a whole since the species which are present anddominant varies across the basin. Caribou, which are arguably the population most sensitive to ongoing land useactivities (ie. logging) and which fulfil many of the criteria for a good indicator species (Noss 1990), are present in arelatively limited portion of the watershed. Thus, this species is an indicator of ecosystem change in a very smallarea. Furthermore, the danger that this species will be extirpated from the Lake Superior basin is very real. Itsability to regain lost range is unknown and debatable which further decreases the usefulness of this species as anindicator. For white-tailed deer, which are fairly widespread throughout the basin, range size is a less sensitiveindicator than for caribou. Commonly, the harshness of the winter is one of the most important factors influencingdeer population and range.
Following from the last point, it is important to consider that future changes in the range size of ungulates in thebasin may indicate substantial changes in habitat structure but may also be influenced by hunting intensity,access for poachers, disease, the severity of winter conditions, or changing levels of predation. Thus, it is notnecessarily clear whether the stressors effecting changes in the index would be anthropogenic or part of a naturalprocess.
Finally, given the changing landscape structure which has resulted from resource extraction, agriculture andurbanization, it is not clear that a return to “historical” conditions is possible or even desirable. The alteredcommunity structure should be considered particularly when proposing reintroductions of species to areas of formerrange.
F. Interpretation of the indicator:
The target for this indicator is to maintain the ranges occupied by native ungulate species (woodland caribou,moose, elk, and white-tailed deer) at current levels (1995) or move toward those ranges occupied during pre-settlement times. As the range size index approaches one, the closer the species gets to occupying an area similarto its historic distribution. GIS maps for each species of historic, current and range 5, 10 and 20 years previouswill indicate whether or not the range is stable, expanding past historic limits, increasing towards historic ranges,or declining.
It is not realistic to state a desired future condition to be represented by a range size index of one and a full returnto historic range for all species. Current land use patterns, long-term changes to forest composition and structure,and even interactions between ungulate species themselves make this unlikely. Specific management activitieswhich address landscape issues will be necessary to maintain the current ranges for some species or to move themin the desired direction.
5.4 North American Amphibian Monitoring Program
A. Ecosystem objective addressed by this indicator:
Terrestrial Wildlife Summary Objective and Sub-Objective b) "Native wildlife will be recognized as key elements of ahealthy Lake Superior ecosystem"
57
B. Purpose of nature of the indicator:
Amphibian abundance, species richness and species composition is likely influenced by toxic contaminants,increased acidification, atmospheric changes, and habitat destruction. Assessment of population and communitytrends of amphibians in the Lake Superior region can provide information about both aquatic and terrestrialwildlife habitats.
The broad goal of the North American Amphibian Survey is to "Provide a statistically defensible program tomonitor the distributions and abundance of amphibians in North America, with applicability at the state,provincial, ecoregional, and continental scales" (September 11, 1994).
C. Features of the indicator:
Two monitoring techniques are likely to be most successful with current protocols and understanding in the LakeSuperior region. Professional and volunteer partnership based programs to survey calling amphibians and samplelarval amphibians are the most promising. Roadside call surveys using volunteers can provide good breeding-season data when observers are well trained and follow well defined protocols. A regional or continental scaleindicator for larval amphibians will also require significant training and protocol development, but could provideindex for salamanders and less vocal anurans.
D. Illustration of the indicator:
This index can provide information on the status and trends of conspicuous amphibian populations. It would alsoindicate status of some community-level measures (i.e., species composition, richness). As with most populationindices, the results can be illustrated by using population vs. time graphs. Additional comparisons, based ongeographic areas (e.g., Areas of Concern vs. Areas of Quality) could be made to illustrate regional or local effects.
E. Limitations and uncertainties:
Status and trend data for amphibian populations and communities are, at present, incomplete and inconsistent. Additionally, precision and bias estimates for calling surveys of amphibians are not well understood. Samplingmethodologies and training materials required for sampling larval amphibians have not, as yet, been developed. Validation of larval survey methodologies also needs to occur before a monitoring protocol can be developed.
Factors that might be responsible for regional or global changes in amphibian populations are not yet understood. Several potential anthropogenic causes have been suggested as important factor in the observed decline in differentamphibian species. Multiple interacting factors that may be difficult to isolate may be responsible for observedpopulation trends.
F. Interpretation of the indicator:
A large body of evidence, largely anecdotal until recently, suggests that amphibian populations are decliningglobally. Monitoring population trends of species native to the Lake Superior area will provide an important linkbetween wildlife health monitoring in the Lake Superior region and global wildlife health issues. Coordination onmonitoring and analysis at this scale could help to provide perspective to regional issues of concern.
5.5 Mink Contamination
A. Ecosystem Objective addressed by this indicator:
Terrestrial Wildlife Summary Objective and Sub-Objective c) "Wildlife living in the Lake Superior ecosystem shouldbe free from contaminants of human origin"

58
B. Purpose or nature of the indicator:
Mink are predatory mammals near the top of the food chain. They therefore have the potential to be concentratorsof chemical contaminants through bioaccumulation. Monitoring contaminant loads provides an indication of themovement of these chemicals through the food web in the basin. Monitoring population trends provides anindication of the effects of that chemical contamination in wildlife species. Exposure to contaminants and causeand effect relationships between toxic contaminants and mink population responses have been examined todetermine the appropriateness of mink as environmental indicators (Welch 1992, Ensor 1991, Addison, et al.,1991, Wren 1991). Results suggest that the species is sensitive to environmental contaminants and populationresponses may be measurable in the wild. (Giesy, et al., 1994, Welch 1992)
C. Features of the indicator:
Contaminant loads in mink will be monitored by collecting mink carcasses from known locations in cooperationwith trappers and resource management agencies. Body burdens of selected chemicals can then be tracked overtime and compared between geographic areas within the basin and outside the watershed.
Population trends in mink would be monitored basin wide through trapping data, and assessed on a watershedscale as well as a site specific basis. Comparing population trends between areas with demonstrated contaminantproblems and other areas will provide an index of population response to contaminants. Comparing populationtrends in the Lake Superior region with other North American mink populations will provide a broad-scale pictureof the status of mink in this region.
For this indicator the target would be: reduction of contaminant body burdens in mink to recommended levels.
D. Illustration of the indicator:
Contaminant loads can be compared between areas using bar graphs, changes in body burdens over time can bepresented as line graphs, population trends can be presented as line graphs. Relationships between contaminantconcentrations and population trends could be represented by regression lines.
E. Limitations and uncertainties:
Mink carcass availability depends on relationships with trappers and on trapping effort. There is likely arelationship between harvest data and fur prices, but this relationship has not been adequately examined (Welch1992). Mink are neither prey nor habitat specialists. They inhabit a wide variety of wetland habitats, and feed ona range of aquatic and terrestrial animal species (Hazard 1982). Cause and effect relationships betweenpopulation changes and habitat are, therefore, more difficult to establish than in specialist species. Likewise,because of the variety of prey species consumed, linkages between specific sources of environmental contaminationand observed body burdens are less clear.
F. Interpretation of the indicator:
The feasibility of using mink as an indicator of ecosystem health needs to be investigated more fully. Contaminantloads in mink carcasses from the Lake Superior watershed suggest that mink in some areas are being exposed toelevated levels of bioaccumulative toxics. Specific chemicals of concern can be identified using this indicator. Thereis potential for identifying 'hot spots' of contamination with proper experimental design, but additional work mustbe done on food habits, dispersal, and reproductive success of mink to more fully establish cause and effectrelationships between population trends and chemical contamination.
5.6 Neotropical Bird Abundance and Diversity

59
A. Ecosystem Objective addressed by this indicator:
Terrestrial Wildlife Summary Objective and Sub-Objective d) "Management of game species and their habitat shouldnot be detrimental to native and naturally occurring non-game wildlife species"
B. Purpose or nature of the indicator:
The Lake Superior basin supports a rich diversity of forest bird species. Long-term, comprehensive monitoring offorest bird population trends will allow land managers to determine the health of bird communities and forestenvironments. Because health of forest bird communities is closely linked with habitat conditions, this indicatorhas the potential to have cross application to other terrestrial wildlife taxa, and the Habitat Objective.
Birds make up about 70% of the terrestrial vertebrate species of Great Lakes forests. Understanding populationdynamics and habitat associations of forest birds will provide a good understanding of major elements ofecosystem health.
By following a consistent protocol of 10 minute point counts by highly trained professional bird censusers,stratifying points by habitat, and conducting surveys only on rain-free, calm days, compatible data can be collectedby many researchers and agency staff.
C. Features of the indicator:
Forest bird communities throughout the Lake Superior watershed will be monitored during the nesting season in avariety of habitats. Monitoring efforts ongoing in several National Forests (Superior, Chippewa, Chequamegon)and National Parks (Apostle Islands) can be used as models for developing monitoring programs in other areas. Ahighly refined basin-wide monitoring protocol for gathering habitat-specific information on birds, coordinated withsystematic landscape-scale vegetation data will allow basin-wide biodiversity mapping based on bird populations.
Forest bird monitoring is most efficient when survey data on all singing bird species are collected. Multiple indicesof ecosystem health can then be calculated based on the data gathered. An "index of biotic integrity" has beenused successfully for bird communities in other areas and should be examined as an easily communicated elementof this monitoring program. For this approach to be successful in the Lake Superior watershed, reference areaswith healthy bird communities would be identified and compared to other, potentially less healthy areas.
For this indicator the target would be: no decrease in populations of bird species beyond normal variability and nonet loss in biodiversity in the forest bird community within the Basin.
D. Illustration of the indicator:
Data from this approach would be presented in a variety of ways. Population trends of bird species of interestwould be presented in simple line graphs representing selected geographic areas or the whole basin. Commonlyused indices of diversity (e.g., species richness, Shannon-Weiner, Simpson's) would be used as other descriptiveattributes of the health of the bird community and would be tracked over time. Indices of biotic integrity for areassurveyed would be presented in bar graph form and compared to other areas for which the index has beencalculated.
Broader scaled biodiversity patterns across the Lake Superior Basin could be presented in map form that identifykey habitat areas and illustrate changes in bird population patterns over time.
E. Limitations and uncertainties:
Breeding bird survey data are applicable to the area for which data are collected. Extrapolation of site specifictrends in populations to other geographic areas is problematic. Confidence in using these data to express the

60
health of a large-scale, diverse ecosystem, would depend on having site specific data that adequately representedthe range of habitat conditions in the region. For example, relying only on bird monitoring activity in NationalParks, where disturbance and fragmentation of habitat is likely relatively low, could result in overly optimisticpictures of population trends or ecosystem health. Conversely, reliance on data from easily accessible areas suchas road-side counts, could lead to indices that suggest conditions that are worse than they really are. Datagathering for this indicator is personnel intensive during the short, early-summer breeding season. To adequatelysurvey the Lake Superior Watershed, very large numbers of trained staff, and substantial travel expenses arerequired. Expansion of ongoing monitoring and efforts to standardize data gathering and quality control would beone way to approach the development of this indicator with the funds that might realistically be expected.
F. Interpretation of the indicator:
This indicator allows interpretation at multiple scales. Population trends of an individual species within a limitedgeographic area provides useful information to a land manager, and may suggest specific management activitiesthat should be undertaken. Comparisons of indices of biotic integrity between sites would provide a way toevaluate the variety of management strategies employed in similar environmental settings. Analysis of broadpatterns, using biodiversity maps provide opportunities to identify landscape level activities that influenceecosystem health.

61
6.0 Indicators and Targets for the Habitat Objective
6.1 Background
The Habitat Committee of the Lake Superior Binational Program was asked to develop potential indicators for theHabitat Objective as well as the Terrestrial Wildlife Objective. This was accomplished through meetings held inDuluth, Minnesota (Dec.1-2,1994), and Sault Ste. Marie, Michigan (Jan. 11-13, 1995), and through the work ofindividual committee members. A review of other indicator development exercises and relevant literature preceded themeetings, the first of which took the form of a brainstorming session followed by review of the resulting ideas. Thoseideas which the committee judged to have merit as potential indicators were assigned to individuals to complete.
The core group responsible for this work was:
Pat Collins, Minnesota DNRRichard Hassinger, Minnesota DNRRich Klukas, US Parks ServiceKaren Kroll, Minnesota PCAJeri Graham, Lake Superior Programs OfficeEd Iwachewski, Ontario MNR/Environment Canada
Others who attended meetings and provided valuable contributions were:
John Kelso, DFO CanadaNancy Larson, Wisconsin DNRThomas Busiahn, US Fish and Wildlife ServiceStephen Schlobohm, USDA Forest ServiceBarbara Leuelling, USDA Forest ServiceDave Morton, USDA Forest ServiceRichard Greenwood, USFWS/USEPASonny Myers, 1854 Treaty AuthorityAnn McCammon-Soltis, GLIFWC
A difficulty in the development of Habitat indicators was that habitat is a major factor of ecosystem health for bothaquatic and terrestrial communities. There was concern about overlap with the Terrestrial Wildlife indicators and thework of the Aquatic Communities Objective group. It was decided to proceed by attempting to develop indicators whichaddressed each of the components of the objectives, and that, while duplication was not desired, some overlap was not abad thing. Final selection of indicators, after public and agency review, would focus on the best suite of indicators thatwill provide an integrated assessment for the status of ecosystem health in the Lake Superior Basin.
The components of the Habitat Objective have been addressed using: streamflow/sedimentation, benthic invertebrates,and inland lake transparencies; forest fragmentation; and wetland area/accessible stream length as potentialindicators.
6.2 Streamflow/Sedimentation
A. Ecosystem objective addressed by this indicator:
Habitat Summary Objective and Sub-Objective a) "The ecological health of Lake Superior is determined in large partby the health of its tributary lakes and rivers. Land use planning and regulation in the Lake Superior ecosystem shouldeliminate or avoid destructive land-water linkages (e.g., erosion of agricultural land, urban stormwater, point and non-point sources of persistent contaminants), and foster healthy land-water linkages (e.g., continuous streamside vegetationbuffers, on-site treatment of runoff)"

62
B. Purpose or nature of the indicator:
There is extensive evidence linking changes in land use or cover with changes in runoff and sediment regimes instreams and rivers (e.g. Borman and Likens, 1970; Scheuler, 1987; Hartman and Scrivener, 1990). Lawrie andRahrer (1973; p. 14) suggest damaging alterations to habitat have already occurred in the Lake Superior Basin asa result of historic forest harvest practices. Changes in runoff and sediment regimes can result from watershed orlandscape scale effects (e.g. clearcutting; agricultural conversion) or from local or instream effects (e.g. loss of bankstability; ditching). Impacts at the local or instream level have been greatly reduced because of the adoption ofguidelines and Best Management Practices (BMP). However, changes on the watershed or landscape scale havenot been fully assessed.
Fitzgibbon and Imhof (in press) identify geomorphology, climate, landuse and landscape features as four causalindicators which condition the inputs of water and sediment into fluvial systems. Changes in landuse for urbandevelopment, agriculture or forestry alter the runoff regime and sediment production from the watershed, whichalters flows and patterns of erosion and deposition, causing changes in channel characteristics that ultimatelyaffect the habitat available for macroinvertebrates, fish, aquatic mammals, waterfowl and other associatedspecies.
It is proposed that monitoring stream flows and sediment transport will provide a suitable indicator of thesewatershed scale changes.
C. Features of the indicator:
Bennett (1978) provides a description of the water budget for Lake Superior and noted that time-series dischargedata was available for 32 tributaries around Lake Superior. He divided the basin into eighteen drainage areas,and estimated the mean annual rate for and drainage to be 1709 m3 sec-1. Kemp et al. (1978) estimated that 2.41million metric tons of suspended materials were carried into the lake by rivers and streams. In Ontario,Environment Canada maintains 14 hydrological (stream-gauge) stations while the Ontario Ministry ofEnvironment and Energy has over thirty water quality sampling sites (OMOE, 1992). Similar stations to recorddischarge and water quality are located in Minnesota, Wisconsin and Michigan.
Many of these stations have been in operation for some time (30+ years) and provide a long-term basis forcomparison. These existing monitoring programs around the Basin provide a relatively inexpensive method forobtaining information on stream flow and sediment discharge (expressed as total particulates or through turbidity,total dissolved solids or conductivity).
For this indicator the target would be: through habitat restoration and protection, to maintain the pattern ofannual stream discharge and reduce the net loading of sediments into Lake Superior.
D. Illustration of the indicator:
The index would be presented through line graphs depicting mean discharge, stream base flow, peak-to-low ratioand sediment loading (or a surrogate) on an annual basis for the streams which maintain hydrological stations. Comparison with historical trends will allow a determination of change occurring within each monitoredwatershed. Johnston (1992) suggests GIS techniques could be combined with watershed models to simulate theeffects of land-use change on water quality.
E. Limitations and uncertainties:
Environment Canada is presently reviewing its national program for the hydrological stations it maintains, and upto half of them may be closed, although the exact number on Lake Superior is not yet known. A review of waterquality monitoring stations and stream-gage stations by provincial and state agencies may result in similar

63
reductions in monitoring. Tributary sediment monitoring is a difficult task, and the extent of historical data andpotential for future data collection is uncertain.
There is also some uncertainty in attributing changes in stream flow and sediment transport to watershed levelchanges in land use and cover. There is a high variability in climate (precipitation, temperature) from year to yearwhich affects flow and runoff regimes. Similarly local or short-term events (e.g. streambank collapse, roadconstruction) could cause impacts similar to those resulting from watershed changes.
F. Interpretation of the indicator:
Changes in stream flow such as increased annual streamflow, greater peak-to-low ratio, increased frequency ofpeaking and increased sediment transport could indicate significant degradation in the watershed had occurred.
6.3 Benthic Invertebrates
A. Ecosystem objective addressed by this indicator:
Habitat Summary Objective and Sub-Objective a) "The ecological health of Lake Superior is determined in large partby the health of its tributary lakes and rivers. Land use planning and regulation in the Lake Superior ecosystem shouldeliminate or avoid destructive land-water linkages (e.g., erosion of agricultural land, urban stormwater, point and non-point sources of persistent contaminants), and foster healthy land-water linkages (e.g., continuous streamside vegetationbuffers, on-site treatment of runoff)"
B. Purpose or nature of the indicator:
Aquatic macroinvertebrates in streams, inland lakes or estuaries of the Lake Superior Basin are in general quitesensitive to changes in water quality conditions resulting from human activities in adjacent terrestrial areas. Useof agricultural chemicals, discharges from urban and industrial areas, forest fires, floods and erosion from heavyrains are all often registered both over long and short time scales on aquatic communities and species.
Trends in aquatic species populations (density and richness) and community structure can serve as indicators ofimprovement or deterioration in terrestrial conditions. Monitoring of aquatic macroinvertebrates in streams,estuaries, and inland lakes is useful for understanding the nature and effects of habitat modifying physical-chemical elements, and mechanisms and processes associated with human activities in terrestrial areas withinthe basin. Moreover, such monitoring is critical to understanding, and if necessary, mitigating physical, chemical,and biological changes occurring within waters of Lake Superior.
C. Features of the indicator:
The macroinvertebrate monitoring system will involve collection of two major categories of data: physical-chemicalcharacteristics of the waters themselves; and selected species, groups, and communities of aquaticmacroinvertebrates. Determination of water characteristics and macroinvertebrates to be monitored would best beachieved by convening a workshop-type assemblage of subject experts.
Monitoring sites will be established in stream, estuary and inland lake locations. Locations will include pristineas well as human influenced settings. Some sites may be within parks and refuges that have already begunmonitoring programs. Sampling will occur two to three times annually for the first five years in order to establishbaseline conditions. Thereafter, monitoring intensity may be reduced but should continue as long as there is a needto assess trends in the health of the ecosystem. Protocols to be followed are those now used by U.S. Fish andWildlife Service, National Biological Service, and National Park Service units in the Great Lakes basin. Theremay be a need to rectify differences in approaches among these agencies in order to obtain comparative data.
64
For this indicator the target would be: to maintain healthy aquatic macroinvertebrate communities and restoredegraded communities back to an accepted baseline condition. The desired baseline community will be definedbased on conditions in “pristine” control areas or by using a model to simulate the expected community for a givenarea.
D. Illustration of the indicator:
The experts who determine physical and biological characteristics to be monitored, and specify sampling andmonitoring protocols, would likely define appropriate strategies for data analysis and exposition of results. Theirrecommendation may include use of bar and line graphs and tables to detail conditions at each monitoring site. These could be used to compare conditions between sites as well as changes occurring over time.
Important water quality characteristics that would likely be displayed in these illustrations would include pH, turbidity, total nitrogen, total phosphorus, and organic carbon. Anticipated illustrations of biotic parameters thatmight be covered include density, taxonomic richness, and diversity. Simpson’s D would provide an index tochanges in density of rare species while site by site portrayal of Shannon-Wiener H results would illustratechanges in density of more dominant species.
E. Limitations and uncertainties:
Analysis of water and invertebrate samples can be costly and time consuming. All parties involved in the LakeSuperior program would be required to devote considerable resources for development of this indicator.
There is a nationwide program in the United States to develop standardized approaches to gathering andinterpreting water quality and macroinvertebrate data. This may in time lead to changes in sampling andanalysis strategies. However, no universal strategy is foreseen. Instead it can be anticipated that variousstrategies will be recommended, reflecting inherent differences in habitats and biota over broad geographic areas. From the Canadian perspective, there is no regular monitoring program for aquatic macroinvertebrates andstandard procedures for sampling and analysis are similarly lacking.
Many of the current sampling strategies employed in the Great Lakes are based on a state-of-the-art systemdeveloped by the US Environmental Protection Agency (EPA). If current EPA water quality-macroinvertebratemonitoring strategies are used in Lake Superior sites, it seems unlikely that the program would be considerablycompromised by the release of new standards.
F. Interpretation of the Indicator:
Changes in human use patterns in the terrestrial environment, and their effects on aquatic ecosystems of the LakeSuperior Basin, will be detected by this proposed indicator. Site by site comparisons of changers in land use, alongwith changes in aquatic systems, would allow managers to develop strategies to mitigate detrimental activities. Data on water quality characteristics and status of macroinvertebrate species and communities can be developedat site, landscape, and regional levels to detect and define problem sources and develop appropriate mitigationstrategies. Correlation of changes in various characteristics of Lake Superior’s aquatic ecosystem, with changes ininland systems monitored through this indicator, is also likely.
6.4 Inland Lake Transparencies
A. Ecosystem objective addressed by this indicator:
Habitat Summary Objective and Sub-Objective a) "The ecological health of Lake Superior is determined in large partby the health of its tributary lakes and rivers. Land use planning and regulation in the Lake Superior ecosystem shouldeliminate or avoid destructive land-water linkages (e.g., erosion of agricultural land, urban stormwater, point and non-

65
point sources of persistent contaminants), and foster healthy land-water linkages (e.g., continuous streamside vegetationbuffers, on-site treatment of runoff)"
B. Purpose or nature of the indicator:
There are a large number of inland lakes within the Lake Superior Basin that are monitored by citizen programs. These data may be the only mechanism for determining changes over time in water quality. Some of these datagoes back as far as the early 70's, providing the only baseline information for some lakes. Understanding Secchitransparency as one measure to characterize the trophic status of lakes, is important in determining the status ofecosystem health for aquatic environments and habitat areas for aquatic communities, terrestrial wildlife, andterrestrial biota.
Secchi transparency (clarity) is an indicator of suspended material in water and provides an indirect measure ofalgal concentrations. This is important to measuring water quality trends and trophic status over time.
By collecting these data and continually monitoring inland lakes within the Basin, trends can be determined. Changes in these trends (positive, negative, no change) would be significant in determining overall ecosystemhealth.
C. Features of the indicator:
Transparency readings for inland lakes will be taken through the citizen monitoring programs. These data will becollected and compared, along with data from natural resource agencies, over time, and on a geographic basis, whilemonitoring continues. Minnesota, Wisconsin, and Michigan each have a program that involves citizens whovoluntarily monitor. Since historical data has dated back as far back as 1973, analysis can take place on the stateof the ecosystem and its changes. This type of monitoring will continue, and is a significant factor in allowingdetailed information on inland lakes.
Secchi transparency is an excellent tool for citizens to measure water quality. Detecting trends and trophic statusis the goal of this type of monitoring. Comprehensive data sets which require many years of data already existwithin the Basin. The summer-mean transparency for a lake may vary from year to year, based on biological andclimatic fluctuations and must be taken into consideration when making assessments based on these data.
For this indicator the target would be: to maintain or increase water transparencies for lakes within the LakeSuperior Basin, consistent with the management objectives for each lake.
D. Illustration of the indicator:
Data from monitoring will be presented in the form of map depicting the depth of Secchi readings for lakes that aremonitored, negative changes, positive changes, and lakes that have seen no significant changes. This approachmight lead to a better understanding of areas that might be seeing a decline in water quality.
E. Limitations and uncertainties:
The historical data will vary for the lakes involved in monitoring, so that comparisons will be skewed, to a certainextent. These data, however, can be compared by the amount of change, if any. Climatic and biological changes(e.g. the excessive precipitation in Minnesota for 1993) can greatly influence monitoring results. Excessiveprecipitation in a lake's watershed might result in high pollutant loading in the form of nutrients and sediments toa lake. Variation might result in the monitoring programs across agencies.
F. Interpretation of the indicator:
A Basin-wide understanding of variations in lake transparency, due to pollutants, trophic states, and changes ingeographic areas will provide a clear understanding of ecosystem health for inland lakes. These data can be
66
observed in a small-scale and a large-scale basis, with the potential to provide resource managers with a clearunderstanding of areas that are degraded. Evaluation of healthy areas may further aid resource managers as toopportunities to improve and protect on a basin level.
6.5 Forest Fragmentation
A. Ecosystem objective addressed by this indicator:
Habitat Summary Objective and Sub-Objective b) "The long-term consequences of incremental or cumulativelandscape change, habitat destruction, and habitat fragmentation should be anticipated and avoided in the LakeSuperior ecosystem, through research and planning at appropriate spatial and temporal scales"
B. Purpose or nature of the indicator:
Forest fragmentation is one of the most prevalent features of landscape change occurring within many forestedregions of the world and is recognized as a major cause of declining biodiversity (Whitcomb et al. 1981). Within theLake Superior basin, forest fragmentation is associated with the habitat fragmentation and resulting extirpationof several native species, including buffalo (Bison bison), elk (Cervus elaphus), cougar (Felis concolors), wolverine(Gulo gulo) and black bear (Ursus americanus), from some or all of their range (Matthiae and Stearns 1981). Measuring indices of forest fragmentation provides an indicator of terrestrial habitat condition in the LakeSuperior basin.
Harris (1984) describes forest fragmentation as a landscape-level process in which forested areas are sub-dividedinto smaller, geometrically more complex, and more isolated forest fragments as a result of both natural processesand human land use activities. Natural disturbances which alter forest structure include fire, wind, insects andclimate effects (Baker 1992). Human-related factors are part of the expansion and intensification of human landuse (Burgess and Sharpe 1981), including urbanization, and deforestation during timber extraction and clearing foragriculture. Additionally, humans may alter the patterns caused by natural disturbances, for example, throughfire suppression (Baker 1992).
Habitat fragmentation involves habitat loss, reduced patch size and a greater distance between patches in alandscape (Andren 1994). To measure forest fragmentation, several indices or metrics must be measured andassessed in relation to each other. Suggested metrics include: total forest area, mean patch size and variability,mean patch core area and variability, total forest edge and average distance between forest patches.
C. Features of the indicator:
I. Indices of fragmentation
A spatial pattern analysis program, FRAGSTATS, has been developed to measure a variety of indices forquantifying landscape structure (McGarigal and Marks 1993). This program could be used to analyze GIS imagesof the Lake Superior watershed at different periods of time. Landscape metrics would be calculated to determinethe degree of forest fragmentation and provide an indication of how landscape structure is changing.
As a starting point, mature, closed-canopy forest may be designated as the class or feature of interest. It must be aclass that is readily detectable using remote sensing techniques, but also be ecologically significant. Forests couldbe further broken down into conifer, hardwood forest (Bauer et al. 1994) and mixed-wood.
The most fundamental metric is probably 'class area', that is, how much of the watershed is comprised of the patchtype of interest (ie. closed-canopy forest). This, in essence, is a measure of habitat loss or gain (McGarigal andMarks 1993).
67
To determine the size of habitat patch generally available to wildlife, 'mean patch size' could be used, whereby adecreasing value would indicate an increase in fragmentation. A similar metric, but one which takes into accountpatch shape, is mean core area. This metric is more ecologically relevant for forest-interior species, since itassumes an edge effect within a certain distance of the patch boundary. Studies show, for example, increasedpredation and parasitism of bird nests along forest edges (Wilcove 1985). This metric will also differentiatebetween forest patches with similar overall area but different shapes. For example, it is possible that a long, thinstrip of forest may be comprised largely of edge habitat and will, therefore, not be as valuable to forest-interiorspecies a round patch of forest of similar area. An appropriate measure of edge width must be determined which ismeasurable and meaningful. If the satellite pixel size is 30 or 80 m, edge width cannot be defined as smaller thanthis level of detection.
It is also important to consider the 'patch size variability' or 'core area variability' in order to appreciate whetheronly a few very large patches are available together with many small patches, or whether patch size is more evenlydistributed across the landscape. This feature may be considered as a summary statistic or, perhaps preferably,as a distribution.
Forest edge effects, caused by the differences in wind and light intensity along the edge of a forest patch, affectvegetation in the edge zone and are considered of great importance to many wildlife species. The conditions alongforest edges has been the subject of much research and the basis for many wildlife management strategies (ie.increasing available edge for moose and deer). Total forest edge within the basin may be one of the most criticalmeasurements of forest fragmentation since many of the adverse effects of fragmentation are related to edgeeffects (McGarigal and Marks 1993).
The distance between forest patches, or nearest-neighbour distance, may greatly affect the population dynamics ofspatially subdivided populations and plays an important role in the conservation of endangered species (McGarigaland Marks 1993). Mean nearest-neighbour distance may be calculated as one index depicting changing landscapepatterns in the basin.
Besides the amount and spatial arrangement of “closed-canopy” forest, changing forest composition may beassessed as a second, more detailed aspect of this indicator. Forest species composition is steadily changing basedon natural successional patterns after various types of disturbance or due to planned reforestation activities. Abreakdown into various forest classes, and corresponding analysis of fragmentation of those forest types, couldfurther clarify patterns of forest change. Another possible index could be the change in area of each forest type overtime and relative to total forest area.
II. Data collection and analysis
To assess a landscape feature such as fragmentation on a basin-wide scale, satellite technology provides a cost-effective means of collecting landscape data on a frequent and regular basis, as compared to air photos (Bauer etal. 1994). A study has been carried out in Minnesota to relate Landsat TM data to the existing FIA (ForestInventory and Analysis) plot information (Bauer et al. 1994). There, it is proposed to analyze satellite data of thefour major inventory regions on a rotational basis (once every four years). Satellite images may be interpretedusing various software programs to produce GIS data files which can then be analyzed using a landscape analysisprogram such as FRAGSTATS. Annual field measurements will be used to check the accuracy of image processing,which classifies different reflectance values from the satellite data into landcover classes.
In the U.S., the Environmental Monitoring and Assessment Program (EMAP) is developing a Geographic ReferenceDatabase and a land-cover classification system. This is intended to standardize collection of landscape data andmake available a number of spatial data sets. Studies using Landsat TM data to classify landscape cover types byrelating satellite images to aerial photographs and ground plots have also been carried out in several parts of thebasin in Ontario.

68
For this indicator the target would be: no further increase in forest fragmentation in the Lake Superior basin asmeasured by several complementary indices of landscape composition and pattern. A decrease from the currentlevel of fragmentation is desirable.
D. Illustration of the indicator:
Each metric will be calculated for the entire basin, and bar or line graphs could be used to indicate increases ordecreases over time. Some related metrics, for example mean patch size and patch size variability, may becombined in a single chart to demonstrate their relationship more clearly. A summary statement will likely berequired relating the different metrics to the changes occurring in the landscape. To illustrate which areas of thebasin may be particular problem areas, or where improvements have been made, a GIS map of the basin may beused depicting colour-coded Landsat pixels as either showing an increase, decrease, or no change in forest canopy(see Bauer et al. 1994) as compared to the image taken 1-4 years previously. This information could be furthersummarized into a map illustrating, using colour codes, portions of the basin where fragmentation is considered aproblem (ie. red), a concern (ie. yellow) or not an immediate issue (ie. green).
E. Limitations and uncertainties:
The values of the landscape metrics will be greatly affected by the amount of resolution inherent in the satelliteimages (McGarigal and Marks 1993). This will be determined by the type of imaging chosen, for example LandsatTM (Thematic Mapper) provides information for a pixel size of 30x30m while the Landsat MSS (MultispectralScanner) interprets the landscape at a much broader scale, 80x80m. It is important that forest fragmentation indifferent parts of the basin be calculated based on the same degree of resolution. Given the large size of the LakeSuperior basin, technical considerations rather than purely ecological aspects will likely determine the scale andresolution at which this data is to be analyzed. Since the “optimum” patch size varies for different species orguilds of species, this provides a standard for an otherwise difficult issue.
The large area means there are additional confounding factors in land-cover gradients and in atmospheric andphenologic differences in different parts of the basin (see Bauer et al. 1994). This may require stratifying the basininto different regions, perhaps using ecoregions (U.S.E.P.A. and Environment Canada 1988) or by using anothermethod for analyzing remote sensing data (ie. guided clustering (Bauer et al. 1994)). There must be a basin-wideconsistency when defining the forest classes to be measured.
There are always some classification errors, that is, assigning a landcover type to a spectral class. Part of thisproblem comes from the difficulty of assigning a unique class to a pixel which may, in fact, be composed of severallandcover types. In particular, cutover/shrub-land/grassland classes may be easily confused with other classes(Bauer et al. 1994, Gluck and Rempel 1995).
Designating a boundary around the Lake Superior watershed, or setting a boundary around any analysis area,inherently creates problems when assessing patch distance. The distance to nearest neighbour may not be as greatas indicated by the metric; patches just outside the boundary may act as a source from species can disperse tosuitable habitat within the watershed.
Although a number of studies and programs are in place around the Lake Superior basin to relate satellite(Landsat) data to landscape cover types, coverage of the basin is not complete. Initial efforts could be focused onareas where fragmentation is already thought to be a problem. Initial investment in equipment is considerableand some staff time is required for ongoing data analysis and checking the classification using air photos andground plots.
F. Interpretation of the indicator:
The metrics describing forest fragmentation should be considered in the context of each other and what theyindicate about overall landscape structure. In general, the target is no net loss of forested area, no decrease inmean patch size/core area, no increase in distance between forest patches and no increase in patch edge. These
69
targets apply to the basin as a whole. A balance must be found between the overall goal for the basin and localland management goals which may be, for example, to increase agricultural land use.
6.6 Accessible Stream Length
A. Ecosystem objective addressed by this indicator:
Habitat Summary Objective and Sub-Objective c) "The crucial importance of nearshore, shoreline and wetlandaquatic habitats in Lake Superior should be addressed through continuing efforts to identify, protect and restore keysites for reproduction and rearing of fish, water, birds, mammals and other wildlife"
B. Purpose or nature of the indicator:
Steedman (1992) notes that of Lake Superior's 1127 km Canadian shoreline, only 17% is composed of embaymentsor estuaries that would provide the protected conditions suitable for establishment of wetlands and macrophytes. The U.S. side of the lake has approximately 17,400 hectares of coastal wetlands (Dodge and Kavetsky, 1994). Estimates of the loss of wetlands in sections of the other Great Lakes range from 11% to 100%, but thisinformation appears to be lacking for Lake Superior (Bedford, 1990). It is fair however, to assume that wetlandloss has occurred in Lake Superior, especially in developed sites such as the seven Areas of Concern, each of whichhas identified habitat loss as a beneficial use impairment (Hartig, 1993). The importance of coastal wetlands tothe biological productivity and diversity of Lake Superior is evident, as are the stresses acting to degrade or destroythem (The Nature Conservancy, 1994).
There are 840 tributaries to Lake Superior, and of those on the Canadian side, there are 1091 km of accessiblestream below the first barrier to migration (Steedman, 1992). Similar information is likely available on the U.S.side through stream surveys or lamprey control studies. A variety of natural and manmade barriers to migrationexist, however many of the manmade dams are no longer required to maintain water levels (e.g. for log drives,mills). Many structures are decaying and need to be removed or rebuilt. Other structures to be kept andmaintained (e.g. small hydropower) and natural barriers (e.g. rapids, waterfalls) are being examined for theaddition of fish passage devices. The combination of new fishways and removal of old barriers creates a potentialfor significant expansion of stream length accessible to migrating fish.
C. Features of the indicator:
Remote sensing technologies and GIS would provide a rapid method of mapping and estimating changes in wetlandarea or accessible stream length (based on field data input). Johnston (1992) cites the use of this technique forwetlands and streams in Minnesota. This could be updated on an annual basis, or longer, depending uponmanagement requirements.
For this indicator the target would be: through habitat restoration and protection, to increase the net area ofcoastal wetland (in hectares) on the Lake Superior shoreline and the net length of accessible stream (in kilometres)in its tributaries, in each of the states and the province bordering the lake.
D. Illustration of the indicator:
A GIS-based analysis system would be able to provide both graphical (i.e. map, graphs) and database (i.e.spreadsheets, charts) representation of changes in wetland area and accessible stream length.
E. Limitations and uncertainties:
Quantity is not necessarily a good indicator of quality. An increase in the area of wetland or in stream reachavailable to migrating fishes does not mean any increase in production will result. Ground truthing or alternativequality assessment techniques will still be required, as will assessment of any change in production.

70
F. Interpretation of the indicator:
An increase in the area of wetlands or in accessible stream length will provide simple indications of positive changein Lake Superior’s ability to produce fish and other aquatic life.

71
7.0 Indicators and Targets for the Human Health Objective
7.1 Background
In 1989, the Ecosystem Objectives Working Group (EOWG) was formed by the US and Canadian governments (partiesto the Great Lakes Water Quality Agreement) as the instrument for developing ecosystem objectives and theirindicators of progress for each of the Great Lakes. The EOWG was asked to focus first on Lake Ontario in order tocomplement the Lake Ontario Toxics Management Plan. In 1992, the EOWG outlined the objectives for human healthin Lake Ontario and derived indicators to measure progress in reaching the objectives:
Environmental Health Indicator: The followingmedia were proposed to be monitored for contaminantsand the levels compared to standards: food originatingin the Great Lakes basin (e.g. fish and wildlife),drinking water, recreational water, air and soil.
Body Burden Indicator: The concentration of toxiccontaminants in human tissues to serve as an indicatorfor exposure.
Health Effects Indicator: Traditional indicatorssuch as cancer and birth defects.
Public Perception Indicator: Indicator to gauge ifpeople are not using certain resources because ofperceived health risks.
In 1994, human health objectives were developed by the binational Lake Superior Work Group for Lake Superior and aset of human health indicators, essentially those identified above, were proposed by Health Canada to measureprogress.
The five objectives are outlined in the "Ecosystem Principles and Objectives" document for Lake Superior. Briefly theyare:
a. fish and wildlife should be safe to eat;b. water quality should be protected or improved;c. water should be safe for total body contact activities;d. air quality should be protected or improved; ande. soils should not present a hazard to human health.
The indicators proposed by Health Canada for the above objectives (status in parentheses) are:
1) Fish Contaminant Indicator (ongoing sportfish contaminant monitoring program)2) Drinking Water Quality Indicator (ongoing monitoring by DWSP)3) Recreational Water Quality Indicator (ongoing monitoring by regional health units)4) Air Quality Indicator (ongoing monitoring by AQUIS)5) Radionuclides Indicator (ongoing monitoring of radiation)6) Body Burden Indicator (ongoing monitoring by health agencies)7) Health Effects Indicator (ongoing studies by several agencies)8) Cohort Indicator of Exposure and Effects (ongoing studies by several agencies)
note: an indicator for soil was not presented since Health Canada is not currently doing work in this area.

72
This suite of indicators was sent out for comments to US federal and state agencies and other interested groups. Comments were received from the Michigan Department of Natural Resources and the US Environmental ProtectionAgency - Great Lakes National Programs Office, and incorporated into this document.
A Note of Caution: Description of these indicators presented in this document refers mainly to Ontario orCanadian standards. Often agencies, particularly those in the US, would have to use their own standards whendeveloping these indicators for their use.
Development of these indicators on a Great Lakes basin-wide basis would benefit from multi-partite involvement inand coordination of monitoring programs throughout the basin.
The following individuals from Health Canada have been involved in working on this document: Moe Hussain, JenniferRae, Rick Jeffery and Libbie Driscoll.
7.2 Monitoring Contaminant Levels in Fish
A. Ecosystem objective addressed by indicator:
Human Health Summary Objective and Sub-Objective a) "Fish and wildlife in the Lake Superior ecosystem should besafe to eat; consumption should not be limited by contaminants of human origin"
B. Purpose or nature of indicator:
Through the Ontario Sportfish Contaminant Monitoring Program, The Ministry of Environment and Energy(MOEE) monitors the concentration of an assortment of contaminants in sportfish. Monitoring levels ofcontaminants in fish is an important part of a comprehensive monitoring strategy since it can give a directmeasure of exposure to contaminants from the Great Lakes. Freshwater fish represent one of the main linksbetween contaminants in the aquatic environment and humans. The exposure by other sources is relatively small. This indicator will provide information on the exposure of humans to toxic chemicals through consumption ofsportfish.Subsistence fishing should also be monitored for contaminant levels.
C. Features of the indicator:
Concentration of contaminants in fish will be determined from a boneless, skinless fillet of dorsal muscle fleshremoved from the fish. This provides not only the most consistent test results, but is also the most edible portionof the fish. This tissue is analyzed for the following contaminants at the Ministry of Environment and Energy'slaboratories using a variety of analytical methods: mercury; PCBs (total); mirex (Lake Ontario only).
The state of Michigan monitors for many more contaminants. Fish consumption restrictions occur when triggerlevels for a number of chemicals are exceeded. A trigger level is a contaminant concentration at which a fishconsumption advisory is considered. A health protection value of 0.05 µg kg-1 day-1 is established for PCB residuein sport fish (average meal = 227 g uncooked fish) for a 70 Kg adult consumer. Choosing an appropriate indicatorspecies is crucial, and should be based on species popularity, species that tend to be the most contaminated, andavailability of data. The following four top predator species of sportfish have been chosen to represent theindicator: coho salmon, walleye, rainbow trout and perch.
D. Illustration of the indicator:
Results of raw data will be used to construct simple bar graphs showing the fluctuation of contaminants over timeand space in Lake Superior. The chosen contaminants will be summed to provide an overall indicator of fishcontamination. This indicator will be similar to the index used for the air indicator.
E. Limitations and uncertainties:

73
Data for use in developing indicators exist, but there are problems including:
a. differences in surveillance techniques for fish consumption; and
b. lack of coordination of data with regard to bacterial monitoring for recreational purposes. The OntarioMinistry of Natural Resources is responsible for the collection of fish. Thus, MOEE has no direct control overwhere fish are caught. Due to expense involved in the collection and analysis of fish samples, retestinglocations are divided into three groups:
i) areas where contaminant levels are elevated or fluctuate substantially are tested every one to three years;ii) areas with no substantial change in contaminant levels, but are popular angling sites are tested every five
years; andiii) all other areas, usually remote locations with little contamination are tested every 10 years, or as
resources permit.
This sporadic sampling protocol has resulted in a lack of direct cause and effect linkages and a lack of high qualitybaseline data.
Lack of knowledge concerning the migratory patterns of fish, combined with lack of knowledge of growth rates inand amongst lakes, confounds the ability to release fish advisories with high levels of confidence.
F. Interpretation of the indicator:
The indicator will be used to monitor fluctuations in the concentration of contaminants. The indicator will allowregulatory agencies to make suggestions regarding remedial plans as well as issuing advisories to the public onsafe consumption limits.
7.3 Drinking Water Quality
A. Objective addressed by indicator:
Human Health Summary Objective and Sub-Objective b) "Water quality in the Lake Superior ecosystem should beprotected where it is currently high, and improved where it is degraded. Surface waters and groundwater should be safeto drink after treatment to remove natural impurities and microorganisms"
B. Purpose or nature of indicator:
Through the Drinking Water Surveillance Program (DWSP), the Ontario Ministry of Environment and Energy(MOEE) monitors 15% of the water supplies in Ontario, representing 85% of the population. Since 1986, DWSPhas monitored approximately 180 parameters in water including microbiologicals, organics, inorganics and metals. Raw, treated and distributed water are analyzed. Results are compared against Ontario Drinking WaterObjectives, Canadian Drinking Water Guidelines (accepted guidelines for Ontario), and WHO objectives.
C. Features of the indicator:
The following proposed contaminants would be monitored pre- and post treatment: lead; trihalomethanes; nitrates;benzo[a]pyrene; and mercury. The state of Michigan monitors for several other contaminants such as arsenic,barium, cadmium, silver, selenium, fluoride, etc.
Exposure in Ontario is based on 1.5 L/day/70 Kg adult. However, for most contaminants, guidelines are adjustedfor more sensitive populations such as children and pregnant women. In the case of the Canadian Drinking WaterQuality Objectives, the following levels have been set for contaminants:

74
Maximum Acceptable Concentration (MAC) - established for certain substances known or suspected to causeadverse effects on health.
Interim Acceptable Concentration (IMAC) - recommended values where sufficient toxicological data wasunavailable for developing a MAC.
The state of Michigan sets maximum contaminant levels (MCLs) which are close to those of the EPA's maximumcontaminant level goals (MCLGs).
D. Illustration of the indicator:
Data from the DWSP program would be presented as simple bar graphs representing selected locations in LakeSuperior. Graphs would show the geometric average of the concentration of contaminants in raw, treated anddistributed water. There are two possible approaches:
i) A reference value is developed for selected contaminant parameters from which observed trends and variationscan be plotted as a baseline. Since most contaminants rarely exceed guidelines, reference values could bedeveloped which are a percentage or fraction of the MAC or IMAC. From this reference point, it would bepossible to report variations over time and assign a weighted value to the variations. These values shouldcorrelate with the condition of the environment in Lake Superior and could be used in early detection ofincreasing or decreasing exposure to contaminants and human health risk.
ii) Mean annual concentrations may be used as a pivotal reference point and plot increases or decreases overtime. Data would be averaged from a baseline date from locations around Lake Superior. Changes over timewould be indexed; for example, a 10% increase in annual concentration of certain contaminants could be scoredas -1, whereas a 10% decrease would be scored as +1.
E. Limitations and uncertainties:
Most contaminants in drinking water rarely exceed guidelines; many are in fact below the detection limit for thatcontaminant. Since the absolute concentration of some contaminants may not be determinable, it is difficult, if notimpossible, to show fluctuations in concentration levels. In cases where the contaminant level is below thedetection limit, the detection limit itself may be used as the reference value.
Contamination of the treated water as it passes through the distribution system is beyond the scope of thisindicator; lead pipes, lead solder and some types of metallic hardened plastic pipe may leach lead into thedomestic water supply.
Due to cutbacks in the DWSP program, drinking water data is not continuous. Monitoring is often conducted on abimonthly, or less, basis. Enhancement of the DWSP program would be one way to approach the continueddevelopment of this indicator.
F. Interpretation of the indicator:
This indicator would reveal trends in contaminant levels in raw and treated drinking water in various locationsthroughout Lake Superior.
7.4 Recreational Water Quality
A. Objective addressed by indicator:
Human Health Summary Objective and Sub-Objective c) "The waters of Lake Superior should be safe for total bodycontact activities, even adjacent to urban and industrial areas"

75
B. Purpose or nature of indicator:
One of the most important factors in recreational water is the microbiological quality. After a rainstorm,recreational waters become contaminated with animal and human faeces from surface run-off and poorly treatedsewage. This indicator will monitor beach postings and E. coli counts spatially and temporally throughout LakeSuperior to aid in beach management and prediction of episodes of poor water quality. This indicator could alsomonitor beaches for the "nine contaminants" in discharge effluents to identify chemical pollution of the beaches.
C. Features of the indicator:
The Ontario Ministry of the Environment and Energy (MOEE) and the Ontario Ministry of Health are currentlyreevaluating recreational water quality objectives. Prior to 1992, the quality of beach water was consideredimpaired when total coliform geometric means exceeded 1000 per 100 mL and/or faecal coliform geometric meanexceeded 100 per 100 mL. This was not, however, the ideal indicator since bacterial counts may have been causedby factors other than faeces. Industrial and commercial effluent may cause increases that would not realisticallyreflect human and animal intestinal fauna.
Since 1992, the most widely used organism for determination of water quality has been E. coli. The guidelines forCanadian Recreational Water Quality recommend that levels of E. coli not surpass 2000 per L of water.
In the state of Michigan, Rule 62 states that:
(1) All waters of the state of Michigan shall contain not more than 200 faecal coliform per 100 mL. Thisconcentration may be exceeded if such concentration is due to uncontrollable non-point sources.
(2) Compliance with the faecal coliform standards prescribed by subrule (1) of this rule shall be determined onthe basis of the geometric average of any series of 5 or more consecutive samples taken over not more than a 30day period. Three or more samples should be taken in this area.
It is proposed that total E. coli counts be made at each of 20 sites in Lake Superior based on recreational waterstandard sampling 5 times per year. It is also proposed that current data for "the nine contaminants" be assessedor that monitoring programs for these contaminants at selected beaches commence.
D. Illustration of the indicator:
Raw data for each selected site will be presented as a bar graph showing trends over several years for: (i) E. coli, (ii)beach closures, and (iii) contaminant levels. Graphs will show the geometric means of E. coli over a five monthperiod. Total arithmetic means may be used to examine the temporal and spatial trends in water quality amongstbeaches.
E. Limitations and uncertainties:
A survey of beach closures by Rang et al (1992) concluded that the information reviewed was so varied that a trendassessment was difficult. The type of data varied (e.g. annual geometric means, summary of postings and verbalstatements), and guidelines used by different health units were not consistent. The following are factorscontributing to the erratic patterns in data on beach closures:
1) in the majority of cases, local practice variations in monitoring recreational water account for theinconsistencies. (e.g. number of days water was monitored may vary);
(2) the relevant monitoring criteria may have been changed in certain municipalities due to fiscal economiccircumstances (e.g. the MAC may have been raised);

76
(3) water sampling done during the summer months, usually done weekly, may be done less often in someareas due to budget cutbacks;
(4) some beaches have a history of not closing often;
(5) poor reporting practices also contribute to the inconsistencies;
(6) episodic accidents may account for some of the leaps in beach closures from one year to the next.
Overall, the drastic changes from year to year indicated by data are not due to natural phenomena, but have moreto do with the process of monitoring and reporting. In addition, monitoring of beaches for chemical pollution may besparse.
F. Interpretation of indicator:
Analysis of data may show seasonal and local trends in recreational water. If episodes of poor recreational waterquality can be associated with events (e.g. storms, run-offs and seasons), then forecasting for episodes of poor waterquality may become more accurate.
7.5 Air Quality
A. Objective addressed by indicator:
Human Health Summary Objective and Sub-Objective d) "Air quality in the Lake Superior ecosystem should beprotected where it is currently high, and improved where it is degraded. Communities, industries and regulators outsidethe Lake Superior ecosystem should be informed of the consequences of long-range atmospheric transport ofcontaminants into the Lake Superior basin"
B. Purpose or nature of indicator:
This indicator will use information from the existing Ministry of Environment and Energy (MOEE) air monitoringdatabases. Data from state agencies could also be used if they are available. Through the Air Quality InformationSystem (AQUIS), MOEE monitors ambient concentrations of the following contaminant gases: SO2 (sulphurdioxide); CO (carbon monoxide); O3 (ozone); NO2 (nitrogen dioxide); NO (nitric oxide); NOx (oxides of nitrogen); THC(total hydrocarbons); RHC (reactive hydrocarbons); TRS (total reduced sulphur); and SP (suspended particulates -measured as a coefficient of haze (COH) to generate an estimate of SP).
The AQUIS network consists of ca. 262 continuous monitoring devices distributed at 99 sites to monitor up to ninedifferent gaseous contaminants. The AQUIS data are divided into three major categories: (i) continuous (1-hour)measurements, (ii) daily (24-hour) measurements, and (iii) monthly measurements (collected over a 30-day periodproducing 12-monthly measurements per year).
The Air Quality Index (AQI), initiated in 1988 by MOEE, is a composite of several pollutants, including SO2, O3,NO2, TRS, CO, and SP and provides the public with an indication of air quality at 34 sites in 27 major cities acrossOntario. Categories of air quality include:
very good: 0-15good: 16-31moderate: 32-49poor: 50-99very poor: 100 and over
77
Data are compiled as the number of hours of unacceptable air quality (including hours of moderate and poor airquality) at AQI sites in Ontario as well as the number of hours in ranges of very good, good, moderate, poor and verypoor.
The Air Pollution Index, a sub-index of the AQI, provides the public with 24-hour running averages of SO2 and SP. Data is reported on the number of occasions when adverse conditions are forecast for 6 hours or more and the API isgreater than 32 (air pollution advisory issued), 50 (first alert level), 75 (second alert level) or 100 (air pollutionepisode threshold level). Reporting frequency is increased to hourly releases when the index reaches 32. If theindex value reaches 50-99, the air quality may have adverse effects on the most sensitive of the human or animalpopulation.
The state of Michigan has established standards for seven pollutants: SO2, NO2, CO, O3 (photochemical oxidants),hydrocarbons and lead.
C. Features of the indicator:
The following contaminants are proposed to provide an overall air quality index: SO2, CO, O3, NOx, TRS and SP. The indicator may be presented as:
(a) the number of days in high quality to low quality categories; and
(b) the number of exceedances per year of the air pollution advisory (APA); for example, when APA exceeds 32and 50 (first alert level).
D. Illustration of the indicator:
Raw data will be presented as geometric means in simple bar graphs showing trends over several years for: (i)each pollutant in Lake Superior, and (ii) each pollutant expressed as a collective over the entire Great Lakes basin.
The data will also be presented in the form of an index which is a "summation" of all exceedances, expressedrelative to an arbitrary reference point for each pollutant, and presented as a simple line graph. The summationvalue is expressed as a percentage of the number of times per year that air quality levels were exceeded. The indexwill provide an indication of fluctuations in air quality for Lake Superior as well as overall air quality in the GreatLakes basin.
E. Limitations and uncertainties:
MOEE monitors air quality in major urban centres throughout the Great Lakes basin. The location of the majorityof the monitors is at or near the top of buildings where air currents eliminate sampling problems associated withstagnant air. However, since ground level air is more stationary, it may contain higher concentrations of pollutantsand toxic chemicals than air sampled at elevation. MOEE is currently remedying this with portable "nose level" airmonitoring stations. Outdoor air quality may not be the best indicator of human health since exposure to outdoorair is generally brief, usually in the morning and afternoon. Indoor air quality is often of lesser quality, andexposure times are longer. Resources to monitor indoor air quality across Ontario are needed.
F. Interpretation of the indicator:
The results of the indicator will be easy to interpret since a single line graph will show the overall air quality trendfor several years. This will allow regulatory agencies to suggest changes for improvement of air quality and/or showthat remedial plans are having a positive effect.
7.6 Radionuclides

78
A. Objective addressed by indicator:
Human Health Summary Objective "The health of humans in the Lake Superior ecosystem should not be at risk fromcontaminants of human origin"
B. Purpose or nature of indicator:
Natural background radiation provides an average dose of approximately 2.6 mSv a -1 to every resident in the basin. The total committed dose to the year 2000 to each individual in the basin from weapons tests conducted up to1980 has been estimated to be approximately 2.1 mSv (Ahier and Tracy, 1993). The Bureau of RadiationProtection of Health Canada, has a number of monitoring stations across Canada, several of which are in the GreatLakes basin. Samples of whole milk are collected monthly and analyzed for cesium-137 and strontium-90quarterly. Monthly samples are also taken in the vicinity of nuclear power stations.
The Michigan Department of Public Health in coordination with the Department of Agriculture will monitor milk,as required, for I-131, Cs-134, Cs-137, Sr-90 and Sr-89. The total intake level is 7 microcuries for Cs-137 and 2microcuries for Sr-90. The occupational level for Sr-90 is 3 x 101 microcuries for oral ingestion. The value for Cs-137 intake in water is 1 x 10⁻⁶ microcuries mL-1; for oral ingestion, the value is 1 x 10² microcuries.
C. Features of the indicator:
Radionuclides which are soluble and chemically analogous to essential nutrients follow similar pathways as theirnutrient analogues. Thus, strontium will compete with calcium, and cesium will compete with potassium. Totalmean annual levels of cesium-137 and strontium-90 in cow's milk from three sites in the Great Lakes basin(Thunder Bay, Toronto and London) are assessed.
The maximum acceptable concentrations (MAC) recommended by the ICRP are 50 Bq L-1 for cesium-137 and 10 BqL-1 for strontium-90.
D. Illustration of the indicator:
Results of almost 30 years of data will be presented as bar graphs showing the decline of cesium and strontiumsince cessation of atmospheric weapons testing. Simple bar and line graphs will show the total radiationexpressed as a percentage of the MAC.
E. Limitations and uncertainties:
The trends provided by this data illustrate the decline in radioactivity in Canada and the Great Lakes basin afterthe ban on above ground nuclear testing. A focus group organized for Environment Canada on indicators suggestedthat providing levels of radioactivity in air was misleading because human and ecological exposure to radiationcomes from a variety of sources (e.g. food, air and water). That exposure is down due to decreased weapons testingis not especially useful to policy makers and regulatory agencies.
Due to the cessation of atmospheric weapons testing, strontium and cesium have fallen to background levels. These radionuclides may not be the best indicators. Tritium and carbon-14 may be of greater interest since tritiumis produced during nuclear power generation in the fuel rods, moderator and coolant in heavy water reactors, andcarbon-14 since it is essential to all life forms and has a long half-life of 5730 years.
F. Interpretation of the indicator:
This indicator will show the trend in decline in concentration of cesium-137 and strontium-90 in cow's milk over a30 year period. This indicator provides a measure of the overall exposure of the population in the Great Lakesbasin from weapons fallout.

79
7.7 Body Burden
A. Objective addressed by indicator:
Human Health Summary Objective: "The health of humans in the Lake Superior ecosystem should not be at risk fromcontaminants of human origin" This indicator could also apply to sub-objective a) regarding monitoring ofcontaminant levels in fish, if it is assumed that tissue levels of contaminants are a reflection of consumption ofLake Superior fish.
B. Purpose or nature of indicator:
The concentration of toxic contaminants in human tissue can serve as an integrated indicator of exposure to toxicchemicals. Although exposure to chemicals does not necessarily imply expression of toxic effects, body burdeninformation is valuable to help delineate potential from actually delivered doses of chemicals. There is anassumption that if the body burden of toxics goes down, a decrease in health effects should also occur. A goodexample of a body burden indicator is monitoring of organochlorine levels in mothers' milk.
C. Features of the indicator:
Currently it is not possible to define the biologic media, the specific contaminants or the measure of thosecontaminants. Health effects experts, toxicologists, epidemiologists and other experts would have to determinetarget chemicals, target tissues and protocols for sampling and analysis. Until protocols are developed, indicesand/or reference points cannot be established.
D. Illustration of the indicator:
The method for presenting indices are dependent on how they are defined. Historical data may not exist or may notbe comparable because of advances in measurement technologies.
E. Limitations and uncertainties:
Typically, health effects or indicators of exposure are not specific to a particular contaminant. It may be necessaryto identify populations with known high exposures to a particular contaminant to establish whether and whichhealth effect is expressed. This effort can be expected to be very costly and would need to be supported by an entitywith institutional stability to assure funding and quality control.
F. Interpretation of the indicator:
For some measures, for example lead in blood, a great deal is known about both health and environmentalimplications. But, for the majority of contaminants, the exposure pathways are ill defined. In order for thisindicator to be useful, exposure pathways and pharmacokinetics of relevant xenobiotics will need to be specified.
7.8 Health Effects
A. Objective addressed by indicator:
Human Health Summary Objective: "The health of humans in the Lake Superior ecosystem should not be at risk fromcontaminants of human origin" The indicator could also apply to sub-objectives a) - e) regarding fish consumption,drinking and recreational water quality, air quality, and soils.
B. Purpose or nature of indicator:
80
The occurrence of or change in rate of an adverse health outcome directly linked to exposure to Great Lakes basincontaminants is an indicator of effect.
C. Features of the indicator:
This indicator is measured in a variety of ways depending on the specific endpoint of interest. The endpoint may berates of diseases such as cancer or birth defects, body burdens of xenobiotics such as lead or DDE, changes infunction such as pulmonary capacity or liver enzyme production or occurrence of biomarkers such as adducts. Calculation of indices are generally straightforward using established methods for rates and ratios. Interpretationmay be difficult in some instances because normative data for many endpoints do not exist.
D. Illustration of the indicator:
A 20-year retrospective ecologic study has been conducted by the New York State Department of Health thatexamined birth weight, gestational age and malformations of infants within and outside the Lake Ontario basin. A difference was found between infants born in and out of the basin 20 years ago, but since then an increase inbirth weight in both groups has occurred and the differences are no longer significant.
E. Limitations and uncertainties:
Defining effects that are revealing is a major question and most effects are not specific to a particular contaminanteven with good exposure assessment which is most often not possible; attributing particular effect to particularexposure can be inappropriate.
F. Interpretation of the indicator:
In addition to the limitations described above, it is often difficult to draw conclusions because factors in humanpopulations in addition to contaminants exist that may exacerbate or mitigate the effect of interest. For example,in the 20-year birth study, the quality and accountability of prenatal care including supplemental feeding programshave improved. These factors may greatly outweigh any effect, if there is one, on birth outcomes.
7.9 Cohort Indicator of Exposure and Effect
A. Objective addressed by indicator:
Human Health Summary Objective "The health of humans in the Lake Superior ecosystem should not be at risk fromcontaminants of human origin" The indicator could also apply to sub-objectives a) - e) regarding fish consumption,drinking and recreational water quality, air quality, and soils.
B. Purpose or nature of indicator:
This indicator combines the derived features of the exposure and the effects indicator by establishing a carefullydefined cohort of people within the Great Lakes basin, taking into account socio-economic factors, sex, life styles,etc. and repeatedly monitoring that cohort for exposure indicators (body burden and/or other biomarkers ofexposure) and for expression of health effects. Over time (years or decades) this cohort will act as representative ofthe Great Lakes population.
C. Features of the indicator:
This indicator measures both individuals' exposures and health outcomes as described in the Body BurdenIndicator and the Health Effects Indicator.
D. Illustration of the indicator:
81
The indicator can be illustrated using the full complement of techniques used in epidemiology. These includetables, graphs and equations. The 20-year retrospective reproductive outcomes study described in the HealthEffects Indicator section was illustrated using tables and graphs.
E. Limitations and uncertainties:
The completion of the project would require federal coordination and funding and extensive collaboration with theGreat Lakes states and provinces. The use of existing data bases is very limited for this purpose. A newmonitoring program designed for this purpose would best get the need to identify direct human health effects fromGreat Lakes exposures.
F. Interpretation of the indicator:
This indicator is most similar in design to a laboratory study that can be conducted using human subjects. Interpretation of this indicator is relatively straight forward if adequate exposure and outcome measures areidentified and if the cohort is selected appropriately.
82
8.0 Indicators and Targets for the Developing Sustainability Objective
8.1 Background
Conceptual Overview
There is no more important ecosystem objective than that which insures a sustainable human presence in the LakeSuperior basin for generations to come. The reason the Binational Program dedicates itself to each of the other fiveobjectives outlined in this document is, ultimately, because women and men have decided that this region is important,that humans and nature can coexist for the benefit of one another, and that a concerted effort to create a sustainablesociety will eliminate the false choice between jobs and the environment. Yet the fact we are all part of nature, that wecould respect the Earth for its intrinsic worth, or that we might profit immensely by considering the rest of the world ourequal is not the point. At the end of the day, it will be human society that has chosen between a healthy, vibrant, andsustainable future adjacent to Lake Superior or one which is bereft of the qualities which make this place so special inthe minds of citizens in Canada and the United States.
Despite differences of opinion, definitions of sustainability generally share a variety of attributes. Developingsustainability in the Lake Superior basin involves making decisions about where we want to be (e.g., the targets for theother five objectives in this document) in comparison with existing regional conditions. It is also something that canonly be seen over time; the true measure of a sustainable society is on the scale of generations rather than years(Pearce, 1993). Sustainability mandates that, at the very least, we conserve the existing resources in the basin so thatour descendants can enjoy the same quality of life of the present generation, if not a qualitatively better standard ofliving. We must cultivate and appreciate a diversity of social and natural resources as they are harnessed to trulyimprove the lives of most citizens in the watershed. Ecology, society, and culture must be given equal weight in thecalculus for promoting sustainability. To this end, we have divided the indicators of this section into three themesreferencing: sustainability of ecosystems, social infrastructures, and cultural values.
The ecosystems component of this objective focuses on the inter-relationship between the physiobiologicalcharacteristics of the Lake Superior basin and the ability of humans to sustain their use of those resources in anadaptive manner. This calculation assumes that natural systems are dynamic to the extent they reflect a diversity ofinputs into the regional resource base, that the natural dynamism of the ecosystem should be sustained, and that aninherent consequence of human action in the system will be a greater or lesser need for the remediation of deleteriousimpacts which, in turn, make humans an integral part of the ecosystem. These assumptions are supported by a varietystudies and commentary suggesting that we must focus on general biotic systems when assessing sustainability (e.g.Wilson, 1992).
Currently, the primary reason most people would even want to sustain biotic ecosystems is because the resourcescontained therein support the society in which they live. And, clearly, when we consider the broad sense ofsustainability, we are compelled to consider the extent to which social infrastructures can continue to flourish, providesuccor for those in need, and enable a quality of life that is valued by the general public. Too often, the debate oversustainability reduces to simply a matter of economics wherein "jobs" become a rallying cry in defense of one policy oranother (Hannon, 1992). While it is certainly the case that a stratified society resting on few economic bases is notgoing to be sustainable in the long run, or that a natural resource base under stress is likely to neither attract an influxof capital for further development nor retain a skilled workforce, there is more to sustaining social infrastructures thancan be captured in models of supply and demand. Other key components deal with the less tangible issues of ethnicity,tradition, local ownership of problems and their solutions, and the commitment to developing an enlightened citizenry.
In the drive toward a sustainable society, it is not enough to simply insure that the natural and social environment ispreserved so that people may continue to reap benefit from a region. The indispensable fact is that humans havevalues for the places in which they live and the things that they do in those environs. Such beliefs are shared incommunities and are historically transmitted from generation to generation; in the context of how people use languageto interact among themselves, engage in spiritual or political activities, and embrace world views associatingthemselves with the natural environment, communities reflect their cultural values (Geertz, 1973). Unfortunately, onthe North American continent, the dominant culture has historically been one of resource exploitation and the

83
devaluation of cultural diversity which has led us to the point where we must reassess what it is we believe in so thatwe may sustain ourselves in a society that even remotely resembles the one we have come to cherish. And theseconsiderations of culture also extend to the Lake Superior basin wherein people have come to carve-out valued lifestylesand environmental relationships, some of which contribute to the long-term viability of the region and some thatimplicitly undermine survivability. For example, consider the tension that may exist between what has been describedas a "hinterland mentality" advocating free access to resources in the basin versus the general resistance residentshave to the growth of urban areas or the purchase of land by outside interests. Here, what is valued by basin peoplesmay not be valuable for the maintenance of that basin and its riches. Therefore, when we consider the promotion of asustainability society around the largest body of fresh water in the world, we must sort though the competing visions ofculture that exist in the basin and nurture those which best fulfil the natural and social promise of the region.
Process
Fifteen experts drawn from the private and public sectors, and who generally live near the US and Canadian shores orLake Superior, were invited to draft statements reflecting their understandings and philosophies regarding the conceptof sustainability. These statements (representing knowledge in fields as diverse as sustainable development,environmental ethics, economics, forestry, cultural anthropology, and ecosystem management) were synthesized by aworkshop facilitator familiar with stakeholder decision making procedures; the combined ideas formed the basis for atwo day workshop held in January of 1995. At that meeting, participants generated a wide range of potentialsustainability indicators and, by consensus, selected the twenty indicators outlined in this document. Widespreadagreement was obtained concerning the fundamental nature of most of the indicators during the course of the workshop. In the six cases where time constraints prevented discussion of the key elements associated with chosen indicators(e.g., target values, limitations), the facilitator drafted preliminary estimates of the expert's thoughts concerning issuesand modified the draft based upon stakeholder feedback received after the meeting. Afterward, the participants hadthe chance to review the entire narrative for this document (written by the facilitator in light of an example andguidelines provided by the Binational Program) before it was submitted.
General Limitations
The experts who developed the following indicators, targets, and key considerations regarding the development ofsustainability in the Lake Superior basin expressed a number of significant concerns regarding the document andprocess, as well as the concept itself. There was a general sentiment that the other five objectives would overshadowthe importance of sustainability and that more time was devoted to the work of other groups examining biologicalindicators steeped in technical data than to the issue of how those natural features interwove with social needs in thebasin. Some participants voiced reservations at the over-reliance on quantitative indicators of sustainability whichmight obscure the true measurement of how well we are sustaining a viable and harmonious presence in the watershed;a couple were troubled by the elevation of human interest over that of nature. There also was the noticeable absence ofrepresentatives from some of the significant sectors of the basin's population (e.g., First Nations) whom declined aninvitation to participate. Finally, the members of the workshop insisted that the final report consider the full range ofissues they chose to include in this document; to do otherwise would be to give short shrift to the most importantobjective of the lot and the only one which considers the role of such important factors as the economic viability ofpolicies and the maintenance of valued lifestyles.
To gain a fuller appreciation of what the drive for sustainability means, readers of this document are urged to bear inmind a number of caveats. Unlike some other measures of objectives, there is no single best indicator of sustainability;it is a multifaceted determination which necessitates the simultaneous consideration of multiple indicators, groundedin a variety of disciplines. Such requires a substantial investment in time, effort, and finances especially for thecreation of new indexes to measure complex interactions; it also requires the development of periodic (e.g., every tenyears) reports that are easily understood by citizens and policy makers alike. Additionally, one should focus on thebasin as a whole, rather than become fixated on one or two components of the larger system. This sense of getting "thebig picture" is complicated by the need to appreciate the dynamism of the Lake Superior basin which steps to a cadencefar in excess of the time frames we are used to. Though it is a resilient system, humans can and have had a dramaticimpact on how it functions. Yet, because of its size, we often cannot see the harm or good we do in the short-term.

84
Nonetheless, seven generations from now, the steps we do or do not take today to develop sustainability at the turn ofthe century will be apparent.
8.2 Theme: Sustaining Ecosystems
8.2.1 Status of basin Diversity
A. Ecosystem objective addressed by this indicator:
Developing Sustainability Summary Objective and Sub-Objective a) "Public and private decisions will be right whenthey tend to preserve the integrity, stability, and beauty of the biotic community (Leopold, 1968)"
B. Purpose or nature of the indicator:
This indicator gives us an overview of the quality and quality of individual components in the ecosystemscomprising the Lake Superior drainage including surface, subsurface, and aquatic features of the living andphysical environment. In order to conclude if regional resources are being sustained for human use (e.g.,sustainable growth and yield of timber stands), we need to understand something of the independent contributionsmade by biotic, geologic, and hydrologic elements in the system.
C. Features of the indicator:
Beginning in the first year in which the Lakewide Management Plan is put into operation (i.e., LaMP year-one), acomprehensive baseline inventory of resources in the Lake Superior basin will be constructed by combining existingtaxonomies of ecosystem components (e.g., McNab & Avers, 1994) with those drawn from Geographic InformationSystem (GIS) data bases yet to be developed (Ripple, 1988). As time goes on, each previous iteration of theevolving inventory will be compared with both the previous overview as well as ongoing trends in the presence orrenewal (via remediation and restoration activities) of resources.
For this indicator the target would be: no net loss of basin resources.
D. Illustration of the indicator:
The inventory will be presented as a taxonomic listing indicating the quantity and quality of separate components(similar to what is currently presented in Ontario by the Forest Resource Inventory), in graphic illustrationsrevealing changes in feature qualities from iteration to iteration, and as statistical summaries demonstrating themagnitude and significance of changes in the basin given its LaMP year-one resource base.
E. Limitations and uncertainties:
Current base budget allocations for inventorying US and Canadian resources must be maintained andsubsequently increased as a function of state-of-the-art measurement techniques and the need to coordinateperhaps incompatible sources of information regarding components. Assuming a ten year cycle of data collectionand synthesis, interim decisions must be made as to what to include or exclude from the overall inventory giventime and money available for the project (e.g., the cost of the 1993-94 US Forest Service inventory for Michigan'sUpper Penninsula within the basin exceeded $1,000,000). By itself, the inventory lacks a spatial context in whichto make site-specific interpretations meaningful; as policy makers move away from the regional scope of theinventory, errors in accounting for why certain resource levels change are bound to occur.
F. Interpretation of the indicator:

85
In determining the ongoing status of basin diversity, we will be able to identify the net gains, loses, and cyclictrends in the separate resources of the Lake Superior basin as well as single out particular classes of resourcesthat may be reflecting nonsustainable practices or natural events (e.g., disease). However, in of itself, the inventorycannot suggest specific remedial or administrative policy.
8.2.2 Landscape Patterns
A. Ecosystem objective addressed by this indicator:
Developing Sustainability Summary Objective and Sub-Objectives a) "Public and private decisions will be rightwhen they tend to preserve the integrity, stability, and beauty of the biotic community (Leopold, 1968)", and d) "Thebasis for guiding sustainable development at the scale of the Lake Superior basin should be the pattern of land, water,and air use, as these affect ecological, social, and economic progress"
B. Purpose or nature of the indicator:
An analysis of landscape patterns tells us the extent to which the separate resources in the basin are eithernaturally configured, protected in close proximity to one another, or explicitly manipulated for human use. Regional patterns reveal important information regarding the state of the basin in areas as different as theexistence of wildlife migration corridors, the ratio of developed to undeveloped land, and the density of roads as afunction of recreational values, access to raw materials, or the need to insure safe havens for natural systems. Inshort, landscape patterns help illuminate the ebb and flow of dynamic connections which contribute to structuraldiversity in the watershed (Crow, Haney, & Waller, 1994).
C Features of the indicator:
Through the development and use of a comprehensive, region-wide GIS map, which overlays basin resources uponone another, we can measure the general shape of how the basin is or is not being transformed by human andnatural conditions (cf. Tomlin, 1990). Using LaMP year-one as a basis, the indicator associates clusters of bioticsystems with trends in human use, establishing the relative proportion of pressure being placed upon particularsubregions of the watershed. For example, if cyclical mapping shows the expansion of urban development intopreviously undisturbed quarters, the independent effects of concomitant habitat disruptions and resourceallocations (e.g., groundwater depletions) can similarly be charted (Falkenmark & Chapman, 1989).
For this indicator the target would be: a regional pattern of landscapes reflecting diverse and connectedecosystems, and containing protected areas (e.g., parks, preserves) representative of those ecosystems.
D. Illustration of the indicator:
Graphic and statistical indices of basin-wide and local alterations in landscape patterns will provide easilyunderstood representations of large scale changes in the basin. However, since most people have a difficult timeappreciating how broad changes in the face of the basin influence their specific niche in the ecosystem, thecapabilities of GIS to pictorially represent sustainable and unsustainable patterns of land use ought to beexploited at public forums, in on-line services, and the like.
E. Limitations and uncertainties:
Assuming a ten year cycle of mapping (sequenced with the emergence of the ecosystem inventory noted earlier), thecost of developing a regional GIS will be substantial; 1990 estimates by the Natural Resources Research Institutesuggest the initial US and Canadian costs will exceed $200,000 dollars. Furthermore, at least another $30,000will be needed to develop a GIS for lake ecosystems; currently, there is no accepted classification scheme for doingso. Even with economical advances in the state of remote sensing technologies, significant barriers must beovercome to produce a truly usable view of landscape patterns in the basin. Wide variabilities in land-use

86
objectives pursued by different public and private interests compound the problem of drawing causal relationshipsbetween land pattern fluctuations and overall sustainability. And, although much of the drainage is currentlyadministered by public agencies, various property rights on either side of the border may complicate the gatheringof data on the ground.
F. Interpretation of the indicator:
If financial and political barriers can be overcome, our ability to employ this indicator will be a great asset to theattainment and management of sustainable practices in the basin. Demonstrable trends in constellations ofresources will provide policy makers with more or less specific directions for planning, as well as give advocates apowerful tool for the sustainability of natural resources. A regional map of the landscape around Lake Superiorwill also help us to understand the web of diversity that unifies the watershed and which should be especiallyheeded in the creation and maintenance of protected areas.
8.2.3 Integrity of Biotic Communities
A. Ecosystem objective addressed by this indicator:
Developing Sustainability Summary Objective and Sub-Objective a) "Public and private decisions will be right whenthey tend to preserve the integrity, stability, and beauty of the biotic community (Leopold, 1968)"
B. Purpose or nature of the indicator:
The biotic ecosystems of the basin are best understood as more than mere collections of natural characteristics; ina very important sense, the interaction within and between these clusters of life, land, and water createcommunities of interdependence. A focus on the quality and quantity of biotic communities in the region canprovide an indicator of how well the system as a whole is responding to human and naturally caused disruptions. Furthermore, predicting the extent to which human communities can be sustained within an ecosystem depends, inpart, upon an understanding of how their biotic counterparts affect each other's internal relationships (Sargent,1991; cf. Katz, 1985).
For this indicator the target would be: various healthy and extensive biotic communities spread across the LakeSuperior basin.
C. Features of the indicator:
Well established analytic tools (e.g., Karr, 1991; Ludwig & Reynolds, 1988) will be used to measure interactionswithin biotic communities and to assess the extent to which changes in one community may predict changes inadjacent systems (e.g., Jeffers, 1978). Foundation characteristics for the indicator must be established on acommunity-by-community basis, some of which has already been accomplished for habitat groups by the UnitedStates Forest Service and the Ontario Ministry of Natural Resources. In general terms, the indicator examines theextent to which distinct communities of organisms remain integrated, stable, and capable of rejuvenation over time(i.e., sustainable) in the wake of directly introduced (e.g., wildfire) or nearby (e.g., timber sales) changes in existingconditions.
D. Illustration of the indicator:
Considering the complexity of understanding biotic communities through the lens of ecological modelling, andassociated probabilities for human sustainability in the Lake Superior catchment, we must exercise caution inreporting the status of this indicator. Whereas statistical projections may be most appropriate for resourcemanagers, most of the public should be provided with a narrative describing what the status within and betweenbiotic communities in the region means in terms of risks to or enrichment of human lives.
87
E. Limitations and uncertainties:
Although ecological science has made great advances in recent years, we still lack a full understanding of how toappropriately interpret many trans-community patterns of interaction, inconsistency, and causal relations. Similarly, we may not have some analytic tools given the size and complexity of the watershed; for example, it maybe very difficult to distinguish between healthy dynamism and dangerous instability. On the other hand, we canexpect that puzzles such as determining the sustainability of biotic communities in the basin will attract a goodmeasure of interest from the academic sector which, in conjunction with ongoing government initiatives, will reducethe cost of the research endeavor. Thus, the financial burden and cycle of data gathering will depend on the degreeto which we want more specificity about interactions between and within a greater number of communities. Certainly, those areas which have received the least scrutiny thus far (e.g., off-shore aquatic communities) will bethe most expensive areas for which to establish baseline data.
F. Interpretation of the indicator:
Richer understanding of the nature of biotic communities in the basin should provide essential informationregarding a host of interpretable patterns regarding sustainability. In particular, extensive research may suggestthe presence of community-specific "keystone" species of plants and animals, upon which the fate of the remainderof the community rests. Therefore, in addition to providing insight into the stability, diversity, and adaptability ofbasin ecosystems, a focus on communities may point to critical areas in need of restoration or remediation.
8.2.4 Human Impacts
A. Ecosystem objective addressed by this indicator:
Developing Sustainability Summary Objective and Sub-Objectives a) "Public and private decisions will be rightwhen they tend to preserve the integrity, stability, and beauty of the biotic community (Leopold, 1968)", c) "Institutionalcapacity to integrate technology and sustainable design should be developed within the Lake Superior basin", and d)"The basis for guiding sustainable development at the scale of the Lake Superior basin should be the pattern of land,water, and air use, as these affect ecological, social, and economic progress"
B. Purpose or nature of the indicator:
The major link between individual components, landscape patterns, and various biotic communities in the LakeSuperior region, and one that is at the core of sustainable use, involves the extent to which we change the naturalsystem of the basin. Yet, since change is an inherent part of a dynamic system, we must distinguish between whatis functional and what is dysfunctional vis a vis the basin's promise for diversity and renewal; some humanactivities (e.g., prescribed burns) encourage the natural order while others may destroy the ability of the ecosystemto sustain itself in a way that insures lasting benefits for humans. Hence, this indicator focuses on the extent ofecosystem degradation compared with the rate of our remediation of historic and likely to continue damage tovarious biotic and abiotic (e.g., soil erosion) systems.
C. Features of the indicator:
Given the variety of possible impacts we can have on our environment, we will measure our progress toward theindicator target in a number of ways. One measure of damage or remediation will be changes in the raw number of"Areas of Concern" as defined by the International Joint Commission, and as extended to terrestrial systems,following LaMP year-one; as near shore and land based pockets of ecological disaster are reduced, we can suggestthat humans are having less of a negative and more of a positive effect on the long term sustainability of the basin. Alternatively, Natural Resources Inventory data, collected by the United States Department of Agriculture andconceivably applied in Canada, can be used to assess impacts such as topsoil loss, salinity, and chemical loadingson land that is privately owned (including that found in urban areas) by way of built-in parameters and tolerances. Finally, some of the baseline data growing out of initial long-term forest-soil productivity estimates (Alban,
88
Tiarks, Powers, Page-Dumroese, Ponder, & Bufford, 1994) may be extrapolated to various public lands in theregion.
For this indicator the target would be: no long-term, human induced destruction of ecosystems in the basin.
D. Illustration of the indicator:
The easiest way to illustrate the indices for this general indicator would be to use graphs displaying changes inpositive and negative human impacts. More sophisticated multi-media presentations, similar to those used topredict larger trends such as for global warming, might be constructed for use in public forums.
E. Limitations and uncertainties:
Since much of the data needed for this indicator is already being amassed on a continual basis by governments andscholars, the measurement of human impacts on the biotic ecosystem does not involve much financialcommitment; there may be some cost involved with provisions for ongoing literature searches and the promotion ofsummaries in the popular press and trade journals. However, when one begins to speak of negative environmentalimpact, political hackles are raised, economies of scale are evoked envisioning dire tradeoffs, and the dogmatism ofgrowth at any cost is mobilized. Such socio-economic forces may not only limit the acceptance of scientific findings,thus mitigating movement toward the target; pressure may also be exerted to scale back the collection andanalysis of data itself in light of the threat it may represent. In this case, human nature and the natural orderresult in some uncertainty as to the interpretation of findings.
F. Interpretation of the indicator:
Setting aside the barriers of blame and politics, a discerned effort to comprehensively measure human impacts inthe basin would result in a reasonable understanding of how well we are working in concert with, instead ofagainst, basin ecosystems. It is an indirect test of an emerging ethic of sustainability and, by definition, points topotential sources of ecosystemic destruction. If we are to insure a long-term, compatible presence in the LakeSuperior basin, we must determine to what extent our activities mend or rend the ecological fabric of the region.
8.3 Theme: Sustaining Social Infrastructures
8.3.1 Educational Achievement
A. Ecosystem objective addressed by this indicator:
Developing Sustainability Summary Objective and Sub-Objectives a) "Public and private decisions will be rightwhen they tend to preserve the integrity, stability, and beauty of the biotic community (Leopold, 1968)", b) "The LakeSuperior ecosystem provides resources and services to humans. These include water, fiber, minerals, energy, wastetransport and treatment, food, recreation, and spiritual sustenance. These resources should be viewed as environmentalcapital, in the same way that other capital is assigned value", and c) "Institutional capacity to integrate technology andsustainable design should be developed within the Lake Superior basin"
B. Purpose or nature of the indicator:
Arguably, the single most potent element in the forging of sustainability in the Lake Superior basin is the level ofknowledge residents have about their ecosystem (cf. Orr, 1992). Numerous studies suggest a direct link betweenone's level of education and the extent to which they begin to comprehend the role and impact of humans in naturalsystems (e.g., Grieg, Pike, & Selby, 1987; cf. Cantrill, 1993). By focusing on the educational achievement ofindividuals across the lifespan, this indicator also provides direct measures of the number of ongoing students inthe basin, truancy and dropout rates, and the relative diversity of educational institutions in the region. Additionally, it provides an indirect examination of citizens' access to information, generally collected in on-line

89
services or held by colleges and universities, which is vital to their participation in developing a sustainablesociety.
C. Features of the indicator:
A number of tolls may be used to track the overall educational achievement of those living in the region. One broadmeasure employs census data, collected every five (Canada) or ten (US) years, revealing matriculation ratesthrough various levels of schooling. For instance, the 1990 US data can form a baseline to determine not onlygeneral grade advancement but also the dynamic age-related profile of those who come and go in the region. Alternatively, insofar as schools at various levels are now mandating the assessment of academic outcomes,standardized tests of achievement may be aggregated to produce a general index of knowledge. And, since animportant measure of how knowledge gets used and appreciated in society is reflected in popular opinion regardingthe worth of students, we will want to poll community attitudes in and subsequent to LaMP year-one. In each ofthese three measures, results can be compared with national norms to determine if those in the basin are more orless capable of sustaining action in a complex environment.
For this indicator the target would be: educational achievement will reflect appropriate adaptations to changingeconomic and environmental needs.
D. Illustration of the indicator:
Findings regarding educational achievement may be reported in a relatively straight forward manner with generaltrends and intra-regional differences represented by simple graphics. Nonetheless, such reports will have to beaccompanied by a narrative placing the data into a regional context and explaining what the pattern portends forlong-term sustainability.
E. Limitations and uncertainties:
Unfortunately, the collection, synthesis, and interpretation of educational achievement data is fraught with costsand dangers. Assuming information is gathered in conjunction with ongoing census efforts, to extract and crossreference the right parcels of data will cost between $10,000 and $20,000 every five to ten years; whereas thepolling of local communities may be relatively inexpensive if local agencies assist in the effort, at least $20,000 willhave to be expended each time we try to entice school administrators in the basin to share achievement measuressimply because of the need to purchase comparable instruments. And care must be exercised in approachingpeople with the intent of assessing knowledge. For some, it will be viewed as a judgmental threat from outsideforces and, for others, the results may be confounded by various impression management needs (e.g., peoplereporting they know more about nature or act more in line with ecological principles than they really do). As well,some findings may be contaminated by the influence of informal educational opportunities found on televisionwhich only some basin residents may be inclined to take advantage of.
F. Interpretation of the indicator:
If we can account for various threats to validity, this indicator can provide a longitudinal measure of emergingconsciousness and intellectual ability dealing with sustainability. It can demonstrate the over abundance ofoutdated skills in comparison to the growing needs for adapting to a changing natural and social environment. And, at least to some extent, measures of educational achievement can pinpoint information deficits in the generalpopulation base of the catchment and suggest further focus on creating more viable educational opportunities.
8.3.2 Net Migration by Age
A. Ecosystem objective addressed by this indicator:

90
Developing Sustainability Summary Objective and Sub-Objectives b) "The Lake Superior ecosystem providesresources and services to humans. These include water, fiber, minerals, energy, waste transport and treatment, food,recreation, and spiritual sustenance. These resources should be viewed as environmental capital, in the same way thatother capital is assigned value", and c) "Institutional capacity to integrate technology and sustainable design should bedeveloped within the Lake Superior basin"
B. Purpose or nature of the indicator:
As with natural ecosystems, human populations tend to sustain themselves in regions that support their physicaland social needs and generally migrate out of or into an area as a function of available resources (Smith & Reeves,1988). In particular, we would expect that the age distribution of people within a region would approximatenational demographic norms if, indeed, such things as fertility rates and population size or density were adapted tothe resource base. Thus, one indicator of sustainability would be the extent to which people of different ages "votewith their feet" by migrating to or from the Lake Superior basin. If there were disparities in migration patterns,reflected in differential ages of those moving in or staying or leaving the basin, it would indicate something aboutthe social infrastructure and its ability to resemble a diverse and stable system. More importantly, a net loss inthe basin's overall population could result in a variety of unwanted effects including a shrinking tax base, loss ofintellectual and creative potential, and fewer economic opportunities in service industries.
C. Features of the indicator:
By again turning to census data or information generated by the Population Reference Bureau (e.g., Goldberg,1993), a metric can be constructed which compares age related migrations in and out of the basin with long-termtrends to and from various regions in the United States and Canada. Using LaMP year-one, we can chart relativeand absolute changes in population density and stratification.
For this indicator the target would be: human populations in the Lake Superior basin will remain stable andreflect national norms for age stratification.
D. Illustration of the indicator:
Standardized graphs and those indexed to particular subregions of the basin would reveal time-series trends andtypical population pyramids could demonstrate differences between ages and sites (e.g., urban versus ruralcommunities) of projected migratory impacts.
E. Limitations and uncertainties:
An assumption underlying this index is that national demographic norms reflect a sustainable society which, as ofyet, has not stood the test of time. Furthermore, any interpretations would have to be qualified in terms of localeconomic conditions which may not be representative of the entire basin. For example, because of an abundance ofnatural resources in some areas, employment opportunities might promote less pressure on social systems thanfound in other areas where even small increases or decreases in population may disrupt sustainablity. It is alsoimportant to recognize the limits of census data; in Canada, for example, First Nations have refused to participateand intra-basin migration by native peoples can be seen as an indicator of environmental stresses. And, althoughongoing work by the US Department of Commerce may result in a very cost effective method for obtaininginformation in Michigan, Minnesota, and Wisconsin, the extraction and compilation of StatsCan data for Ontariois estimated to cost roughly $50,000. In this case, it may be more difficult to maintain a ten year cycle of datagathering and information reporting.
F. Interpretation of the indicator:
Although such a net migration by age indicator can suggest such factors as economic conditions, ecological strains,and the gentrification of Lake Superior cities, the data alone does not suggest possible solutions to the problem of,say, young adults fleeing from the region to find a growing economic base.

91
8.3.3 Employment Trends by Locality
A. Ecosystem objective addressed by this indicator:
Developing Sustainability Summary Objective and Sub-Objectives b) "The Lake Superior ecosystem providesresources and services to humans. These include water, fiber, minerals, energy, waste transport and treatment, food,recreation, and spiritual sustenance. These resources should be viewed as environmental capital, in the same way thatother capital is assigned value", c) "Institutional capacity to integrate technology and sustainable design should bedeveloped within the Lake Superior basin", and d) "The basis for guiding sustainable development at the scale of theLake Superior basin should be the pattern of land, water, and air use, as these affect ecological, social, and economicprogress"
B. Purpose or nature of the indicator:
A region-wide comparison of employment trends within various communities provides another estimate ofmicroeconomic health to the extent it indexes sustainable levels of unemployment for existing social services,reveals patterns of underemployment, and may suggest aggregate levels of personal debt when cross-referencedwith other indicators such as home ownership and national norms. Indeed, satisfactory levels of employment aregenerally regarded as a sign that a system of sustainable environmental practices will be able to withstand socialand political pressures to further degrade the environment (Renner, 1993).
C. Features of the indicator:
Beginning in LaMP year-one, data generated by the appropriate Canadian and United States agencies (e.g., USDepartment of Commerce figures for employment classifications and capacities in the basin) will be analyzed toinspect regional employment trends in comparison with national averages. In combination with census data andchamber of commerce information generated on the local level, ratios of employment to population bases can beconstructed with greater magnitudes indicating a greater likelihood of a community being able to sustain itself. Aspecial index of employment trends in environmentally benign industries and professions can also be comparedwith local needs for employment.
For this indicator the target would be: a diversified base of employment opportunities that approximates nationalnorms for employment sector and wage rates, especially regarding environmentally benign businesses.
D. Illustration of the indicator:
Obviously, one could produce a series of charts or graphs showing employment trends in the basin but it is likelythat those skilled in technical and professional writing will have to explain the relationship between variouseconomic forces (e.g., how much energy is consumed travelling to work in various localities, the relative economicstability of different types jobs). And, though most people are comfortable with national wage and employmentcomparisons, additional narrative will have to explain the role that different kinds of jobs play in determiningeconomic sustainability.
E. Limitations and uncertainties:
The added costs of gathering and compiling the data for this indicator will be minimal since much is already beingaccomplished on an annual basis. However, for the indicator to be of the greatest value, resources will periodicallyhave to be devoted to carefully interpreting the pattern of data in light of some relatively intangible socialcharacteristics such as the perceived quality of life in the basin. It will also be difficult to track some sectors ofemployment that do not show up on regular reports (e.g., the self-employed or those who migrate into and out of theLake Superior region on a seasonal basis). And an analysis of such factors as spin-off employment opportunities inspecific communities will have to await the refinement of broader econometric models, such as that currently beingpiloted by the Ontario Ministry of Natural Resources (i.e., Inter-Disciplinary Sustainability Indicators).

92
F. Interpretation of the indicator:
Employment across the watershed can be interpreted as a one measure of how well local lifestyles remain viable ina changing social environment. It can reveal which communities are more at risk and which are more likely tosurvive as the region moves toward sustainability. Importantly, an indication of employment opportunityshortfalls and surpluses will empower citizens to make more informed decisions about where and how to live in thebasin.
8.3.4 Home Ownership
A. Ecosystem objective addressed by this indicator:
Developing Sustainability Summary Objective and Sub-Objectives b) "The Lake Superior ecosystem providesresources and services to humans. These include water, fiber, minerals, energy, waste transport and treatment, food,recreation, and spiritual sustenance. These resources should be viewed as environmental capital, in the same way thatother capital is assigned value", and d) "The basis for guiding sustainable development at the scale of the Lake Superiorbasin should be the pattern of land, water, and air use, as these affect ecological, social, and economic progress"
B. Purpose or nature of the indicator:
Another way to measure the economic viability of society in the basin is to examine the extent of home ownership. Insofar as there are generally powerful incentives for people to purchase homes, and doing so more or less indicatesa desire and ability to remain in a community, this indicator of the sustainability of social infrastructures indexesa wide variety of economic trends and social conditions.
C. Features of the indicator:
It is a relatively simple task to take periodic census data (segmented by districts) to determine the ratio of homeownership to population in the Lake Superior basin. Furthermore, federal (quarterly) and local (variabledepending on agency preference) agencies estimate the average cost of housing in a region, which can then becompared to national norms. By cross-referencing employment statistics, this indicator shows the general extentto which basin residents can afford a home now or in the future (adjusted for inflation, changes in median income,and demand driven increases in real estate), trends in the actual supply and purchase of homes, and patterns ofexpanded development throughout the watershed. A relatively stable housing market is partially indicative ofboth a sustainable economic base and social system; declining home prices, decreases in available housing, orincreases in ownership can signal potential problems regarding sustainablity.
For this indicator the target would be: a range of affordable housing opportunities within reach of basin residents.
D. Illustration of the indicator:
A series graphs focusing on the cost of basin homes, home ownership rates, and the relative availability of homescan be used since most people intuitively understand the relationship between such factors.
E. Limitations and uncertainties:
Although this indicator may not capture all communities in the basin and, by definition, excludes those who chooseto rent or lease housing, there should not be many problems with its use. Various agencies are already collectingthe data and the only costs will involve packaging the information for public consumption and integrating it withother measures of sustainability (e.g., wage rates).
F. Interpretation of the indicator:

93
A stable rate of home purchases and sales indexed to the availability of housing suggests that people have positiveperceptions of opportunities (e.g., economic, social, recreational) in the basin and its economic outlook. It alsoreveals, in a small way, the degree of private sector confidence. And, even though deviations from a stable housingbase will not automatically tell citizens and policy makers how to change the system, we can take the indicator asevidence of a healthy or decaying social infrastructure.
8.3.5 Regional Trade Balance
A. Ecosystem objective addressed by this indicator:
Developing Sustainability Summary Objective and Sub-Objectives a) "Public and private decisions will be rightwhen they tend to preserve the integrity, stability, and beauty of the biotic community (Leopold, 1968)", b) "The LakeSuperior ecosystem provides resources and services to humans. These include water, fiber, minerals, energy, wastetransport and treatment, food, recreation, and spiritual sustenance. These resources should be viewed as environmentalcapital, in the same way that other capital is assigned value", and d) "The basis for guiding sustainable development atthe scale of the Lake Superior basin should be the pattern of land, water, and air use, as these affect ecological, social,and economic progress"
B. Purpose or nature of the indicator:
A positive balance of trade between the Lake Superior basin and the rest of Canada or the United States is animportant consideration when estimating the region's ability to maintain both a sound resource base as well asprovide for the needs of its residents. Even accounting for some degree of value-added development of rawmaterials prior to export, if we are taking in less quantities and qualities of resources than we are shipping out, theeconomic and social foundation of the basin will likely change in largely unsustainable ways. In turn, greater andgreater pressures would be placed upon the human and natural wealth that remains. Thus, this indicatorexplicitly recognizes the need to manage the "ecological footprints" non-basin forces leave when drawing upon theresources in the watershed (Pearce, 1993).
C. Features of the indicator:
This indicators requires the development of a new model which attends to the gross inputs and outputs cyclingthrough the Lake Superior basin. By and large, data regarding basin imports and exports is already being collectedby private industry and is generally reported to state and federal agencies. However, the index we would want tobegin using in LaMP year-one on an annual basis will have to segment out basin characteristics from suchaggregate measures and combine the inputs with enough specificity to track both the regional and local effects oftrade imbalances as well as the independent contributions of various sectors (e.g., industrial, educational, service).
For this indicator the target would be: a net trade balance for the region with import capital and products at leastequal to what is exported.
D. Illustration of the indicator:
As the index is being constructed, care should be exercised to insure that the measurement can be reduced to a fewsimple graphs and ratios, or even a single number, representing local and regional effect-size metrics for tradeimbalances. Complicated econometric analyses will be too complex for public consumption and it is the citizens ofthe region who must use the information in maintaining a sustainable system.
E. Limitations and uncertainties:
This indicator is limited in that all it provides is an estimate of trade equity, generally measured in the context ofabsolute value for capital exchanges. As such, the index can be misleading in terms of the context of regionaleconomies and national economic policy (cf. Pearce, Markandya, & Barbier, 1989). For example, nuclear waste hasvalue and can be traded (e.g., payment for repository) but the mere dollar value hardly compensates for the

94
potential risks involved in transport and storage; it would not contribute to the sustainability of trade. By thesame token, the indicator must not be interpreted through the lens of short-term political gain wherein imbalancesin trade are maintained despite their effect on the potential for natural and social sustainability. Finally,substantial funds must be diverted for the development and testing of the measurement tool itself though,arguably, once the model is created it would be more cost effective to subsequently employ.
F. Interpretation of the indicator:
This is a good, general measure of the basin's economic strength and its potential liabilities to compete in anational or international arena. The collected data and trajectories may target some commodities for specialattention. For example, as the demand for veneer-quality hardwood increases, the regional balance of trade may bebetter safeguarded by selective forestry techniques designed to protect and develop the resource therebycontributing to both diversity in the basin and the economic basis for various communities.
8.3.6 Diversity of Community Economies
A. Ecosystem objective addressed by this indicator:
Developing Sustainability Summary Objective and Sub-Objectives b) "The Lake Superior ecosystem providesresources and services to humans. These include water, fiber, minerals, energy, waste transport and treatment, food,recreation, and spiritual sustenance. These resources should be viewed as environmental capital, in the same way thatother capital is assigned value", c) "Institutional capacity to integrate technology and sustainable design should bedeveloped within the Lake Superior basin", and d) "The basis for guiding sustainable development at the scale of theLake Superior basin should be the pattern of land, water, and air use, as these affect ecological, social, and economicprogress"
B. Purpose or nature of the indicator:
In most cases, a key to the survival of any community (and, by extension, a region) is the ability of its residents tofind suitable sources of employment in companies and industries that, as a whole, can withstand changes inmarket forces or the depletion of resources. Therefore, this indicator deals with the diversity of employmentoptions available to citizens rather than focusing on whether or not someone merely has a job. Pointedly, a socialinfrastructure is not sustainable if the economic base that supports it is vulnerable and a diverse employmentbase is least at risk. As the basin's range of different employment opportunities increases, and does so in areasadjacent to existing communities, it is more likely that those communities will be able to sustain themselves inthe future.
D. Features of the indicator:
US Census and StatsCan data, in conjunction with what may be gleaned from local and regional developmentboards, can be used to estimate the rate at which new employment venues are being added to the basin as well asplot where these opportunities are being created. Data generated in LaMP year-one will serve as a basis fromwhich to plot differences between sampling years regarding the diversification of basin employment opportunities. If mapped onto other regional data bases (e.g., GIS), the indicator can also reveal gross patterns of economicdevelopment.
For this indicator the target would be: a range of available employment opportunities within reasonable distanceto most communities in the basin.
D. Illustration of the indicator:
Periodic tables and graphics can be used to chart the relative numbers of jobs being created in communities overtime and a GIS-like map would demonstrate clusters of economic opportunities in relation to resources in thebasin.

95
E. Limitations and uncertainties:
In addition to the qualifications and limitations noted earlier when addressing employment trends, an indicator ofgrowth in different employment opportunities is even more sensitive to variations between communities. Forexample, some towns in the Lake Superior basin, by virtue of location, have become totally dependent upon touristrevenues and the introduction of additional employment opportunities could seriously jeopardize the tourism-driven values of those areas to visitors. Additionally, beyond the cost of producing a report every five years basedupon annual updates, the expansion of the existing GIS platform to include employment data is likely to involve asubstantial financial investment.
F. Interpretation of the indicator:
This indicator reveals which economies in the basin are most vulnerable to calamities such as resource depletions,natural catastrophe, or economic cooption by those industries not concerned with social sustainability. It alsodemonstrates the dynamism of the region and its ability to offer innovative opportunities and possibilities forthose who migrate into the watershed. Although policy makers and people will have to go beyond the crude index ofhow much the employment base is expanding in order to suggest solutions to emerging problems, the indicatorprovides a clear picture of economic diversity and adaptation abilities.
8.3.7 Reinvestment in Natural Capital
A. Ecosystem objective addressed by this indicator:
Developing Sustainability Summary Objective and Sub-Objectives a) "Public and private decisions will be rightwhen they tend to preserve the integrity, stability, and beauty of the biotic community (Leopold, 1968)", b) "The LakeSuperior ecosystem provides resources and services to humans. These include water, fiber, minerals, energy, wastetransport and treatment, food, recreation, and spiritual sustenance. These resources should be viewed as environmentalcapital, in the same way that other capital is assigned value", and d) "The basis for guiding sustainable development atthe scale of the Lake Superior basin should be the pattern of land, water, and air use, as these affect ecological, social,and economic progress"
B. Purpose or nature of the indicator:
Perhaps the most significant indicator of social sustainability in the Lake Superior basin, and one which comes fullcircle back to fact that we must maintain the biotic ecosystem in order to flourish as a society, is measured by theextent to which we use our social resources to maintain natural resources (Repetto, 1992). As we withdraw rawmaterials and consume resources of the air, land, and lake we must reinvest in those sources of shared wealth at arate which matches or exceeds depletion. This means we must not only learn to value natural resources as capital,and compensate for the costs incurred by their use, but also to accept that the reinvestment itself should beconsidered a capital asset rather than a debilitating loss incurred by industry. A rough measure of how well we arelearning this lesson can be found in the amount of resources (especially financial) government and industry arecommitting to replace in kind what has been taken away from the watershed. In an open market, if a resource isdepleted or if agencies and companies have no incentive for reinvestment, sustainability of economies andecosystems is seriously compromised.
C. Features of the indicator:
In the past two decades, a variety of tools (e.g., the "Green" Gross National Product, the Index of SustainableEconomic Welfare) and accounting methods (e.g., Daly & Cobb, 1989; Pearce, 1993; cf. Hannon, Costanza, &Herendeen, 1986; Lutz, 1993) have been developed which could be applied on a regional basis. In essence, we wouldadapt measures such as these to calculate the rate of natural capital depletion not compensated by reinvestmentin remedial (e.g., rehabilitating Areas of Concern) or regeneration (e.g., tree farms, tertiary waste treatmentfacilities) projects. Subsequent to LaMP year-one, we can track investment changes, factoring in the loss of those

96
resources (generally mineral-based) which cannot be regenerated or renewed and for which in kind returns, such ascontributions the Remedial Action Plans (RAPs), would be expected.
For this indicator the target would be: no net loss of natural capital due to the development or use of regionalresources.
D. Illustration of the indicator:
Although the calculations for natural capital reinvestment are complex, changes in the existing value of naturalcapital can be graphically displayed in terms of regional and local totals, the type of reinvestment occurring, andthe relative loss or gain from year to year. More problematic will be the explanation of why this is such a vitalindex of sustainability.
E. Limitations and uncertainties:
As would be expected, something as important as assessing reinvestment in natural capital confronts a family ofrelated problems which may mitigate the utility of the index. Beyond the fact that the theory and methods ofcalculation have not been extensively tested in the marketplace, it will often be difficult to assess equitablereplacement values for some resources or to collect sufficient measures of depletion for others (especially those thatare influenced by forces beyond the basin, such as the atmosphere). Also, insofar as the existing regulatoryenvironment often does not consider compensation for natural resource loss as capital investment, we may have towait for the generation of wide-spread political will to change what is arguably a self-defeating system. On theother hand, however, the significant costs of developing models and collecting data (at best, accomplished yearlythough extended for longer periods to establish lengthier trends) could be offset by entering into a partnership withprivate industry to promote proprietary development and public assessment.
F. Interpretation of the indicator:
Understanding the rate at which natural capital in the Lake Superior basin is being depleted potentially tells usmuch of what we need to know regarding economic sustainability in a natural and social environment. It helpsilluminate the tradeoffs people make in daily commerce, some of which we may be unaware of or even considerlikely. As reinvestment increases, we can also assume that society is moving away from a coercive regulatoryenvironment (which does little more than repel capital investment) and toward one in which industry and theenvironment are partners in sustaining human activity. And, though only succeeding generations may be able todetermine just how much our current investments in the basin have appreciated, short-term trends can beinterpreted in light of the principles of sustainability and the goals of the Binational Program to restore andprotect Lake Superior for those future residents.
8.3.8 Citizen Involvement in Decision Making
A. Ecosystem objective addressed by this indicator:
Developing Sustainability Summary Objective and Sub-Objectives a) "Public and private decisions will be rightwhen they tend to preserve the integrity, stability, and beauty of the biotic community (Leopold, 1968)", c) "Institutionalcapacity to integrate technology and sustainable design should be developed within the Lake Superior basin", and d)"The basis for guiding sustainable development at the scale of the Lake Superior basin should be the pattern of land,water, and air use, as these affect ecological, social, and economic progress"
B. Purpose or nature of the indicator:
This is a measure of the political empowerment enjoyed by basin residents which represents our ability to forge forourselves a sustainable society. Almost every element that affects the social infrastructure of the region, from ouraccess to information to municipal tax-bases to the involvement of sovereign aboriginal peoples, depends on the
97
extent to which citizens are isolated from the decision making that rules our lives (Heskin, 1991). And the purposehere is not merely to measure civic participation; it is to indicate ownership in the process of maintaining LakeSuperior as an example of sustainability.
C. Features of the indicator:
Subsequent to LaMP year-one, we can employ three simple benchmarks as indicative of progress toward the target. First, as more and more local governments discuss and endorse Objective Six of the LaMP we can assume thatinvolvement is increasing. Second, we can gauge public commitment by tallying the numbers of residents who wishto participate in ongoing stakeholder discussions or speak out at public forums which deal with sustainabilityissues (e.g., those sponsored by the Binational Program). And finally, the traditional method of participatorydecision making in a democracy, voting behavior, will be used as a barometer of public commitment; as more peoplevote, more people participate.
For this indicator the target would be: 100% of residents are involved in decisions which affect the sustainability ofthe Lake Superior basin.
D. Illustration of the indicator:
A narrative will be produced which examines trends in participation as well as offering examples of how citizens inthe basin are empowering themselves while providing for future generations.
E. Limitations and uncertainties:
This indicator is qualified by the need for time to bring in previously disenfranchised populations (e.g., FirstNations), to improve upon the quality of information citizens have at their disposal, and demonstrate to allresidents that they are not so busy or alienated that they cannot participate at least to a minimum degree. Thiswill cost each of us a good deal of time, effort, and money since the burden of citizenship cannot be shouldered byonly government agents or grassroots activists. However, the more often we can demonstrate that more people aredeciding for themselves how best to sustain the systems of Lake Superior, the more likely communities will befacilitated to maximize participation.
F. Interpretation of the indicator:
This indicator only shows the level of citizen involvement within the basin and does not suggest specific solutionsto the general problem of securing commitments to developing sustainability in the region. That is for us to decidein the process of community.
8.3.9 Demand on Social Services
A. Ecosystem objective addressed by this indicator:
Developing Sustainability Summary Objective and Sub-Objectives b) "The Lake Superior ecosystem providesresources and services to humans. These include water, fiber, minerals, energy, waste transport and treatment, food,recreation, and spiritual sustenance. These resources should be viewed as environmental capital, in the same way thatother capital is assigned value", c) "Institutional capacity to integrate technology and sustainable design should bedeveloped within the Lake Superior basin", and d) "The basis for guiding sustainable development at the scale of theLake Superior basin should be the pattern of land, water, and air use, as these affect ecological, social, and economicprogress"
B. Purpose or nature of the indicator:
An implicit assumption regarding sustainable societies is that most of those living in them will experience lowlevels of stress in comparison with nonsustainable societies (Milbrath, 1989). Also, sustainable societies have

98
integrated systems of support for those individuals who do exhibit the symptoms of stress such as crime, substanceabuse, and suicide. Consequently, this indicator is meant to give a quick reading of personal wellness byexamining the relative need for and availability of the social "safety nets" in the region.
D. Features of the indicator:
The measure of sustainability will be to compare the relative availability of social service resources (e.g., doctorsper capita by age strata, mental health counsellors, police officers) to county/district wide population bases. Localand regional indexes will have to be constructed; a likely prototype (i.e., the Comprehensive Human NeedsAssessment Index) is currently being developed for Alger and Marquette counties in Michigan's UP whichdifferentially weights increases or decreases in provision and demand for a range of social services. By LaMP year-one, such an index should be available to determine the configuration of basin-wide demand/availability ratios forselect social services.
For this indicator the target would be: medical, protective (e.g., fire and police), and welfare services meet theneeds of basin residents and there is a decreasing call for such assistance.
D. Illustration of the indicator:
This indicator can be illustrated in ratio form with graphs charting yearly trends. Some report should also bemade concerning the historical backdrop for uses of various services; in many rural areas, for example, medicalattention often is not sought until health conditions become critical.
E. Limitations and uncertainties:
One limitation of quantitatively assessing demand on social services is that it may obscure the determination ofhow much general stress in being placed on communities; the data itself does not indicate for the quality ofservices. Also, rural areas may not be adequately represented in the index and different standards of inter-agencycooperation may skew regional variations in reported demand. And consideration must be given to the fact thatdemands may vary with the general age of a population or the ethnic structure of particular communities. In termsof financing the gathering of data, until such time as a basin-wide system of reporting services is in place, laborintensiveness of polling separate communities and agencies will result in relatively high costs. Even ifaccomplished every five years at a county/district level via mail survey with one follow-up mailing (estimated 280agency contacts), costs will approximate $8000 per survey.
F. Interpretation of the indicator:
If demand exceeds social service availability we can expect a population to exhibit greater degrees of environmentaland social stress (e.g., crime rates, substance abuse) indicating a lessening of "wellness" as well as placing agreater drain on resources decreasing the quality of life in the basin. Furthermore, since the index also measuresthe absolute number of persons requesting assistance, we can assess the overall level of social stress even ifservices meet demand levels. In either case, we can pinpoint which types of services are experiencing the greatestpressures, identify overall trends reflecting movement toward the target, and provide information to localcommunities so that they may consider various remedial options.
8.3.10 Per Capita Membership in Community Organizations
A. Ecosystem objective addressed by this indicator:
Developing Sustainability Summary Objective and Sub-Objectives a) "Public and private decisions will be rightwhen they tend to preserve the integrity, stability, and beauty of the biotic community (Leopold, 1968)", and d) "Thebasis for guiding sustainable development at the scale of the Lake Superior basin should be the pattern of land, water,and air use, as these affect ecological, social, and economic progress"

99
B. Purpose or nature of the indicator:
It is in the nature of communities for individuals to form smaller secondary-groups which mirror the diversity ofinterests and commitments of those who live in the area. Such local organizations range from civic groups andreligious organizations vested with a sense of voluntarism to recreation and social affiliations which contribute to aquality of life; they do not include membership in national organizations unless there is a chapter or affiliate in theimmediate vicinity. In this sense, one very significant measure of community involvement is the extent to whichpeople join in the activities of such local organizations (cf. Rothenbuhler, 1991). Thus, this indicator serves thepurpose of identifying levels of community involvement which may contribute to sustainable practices.
C. Features of the indicator:
A community-by-community census of organizations in the basin will have to be conducted since, currently, nosingle index is available. Using standard techniques for measuring and extrapolating patterns fromorganizational membership (e.g., Tsai & Sigelman, 1982), this information can be cross-referenced with populationdata to provide an estimate of voluntarism and commitment within the larger communities in the region. Thepercentage of the population participating in civic, social, and voluntary service organizations in LaMP year-onewill serve as the baseline for determining the average number of organizations residents belong to, those that cutacross demographic boundaries (e.g., consist of different age groups or religious denominations), and ones which arededicated to the preservation of particular ethnic traditions.
For this indicator the target would be: increasing numbers of residents joining local organizations until at least80% of the population in the basin is participating in some form or the other.
D. Illustration of the indicator:
A representation of the diversity of organizations in the basin could be mapped onto the counties and districts inthe region and general trends over time can be profiled using local percentages. Pie charts representing relativemembership in types of organizations (e.g., civic, social, governmental,etc.) can be indexed to both communities andthe basin as a whole.
E. Limitations and uncertainties:
The greatest limitation of this indicator is that it may fail to include a significant percentage of the catchment'spopulation; few such organizations, if any, are found in rural areas which contain a sizable percentage of those wholive in the region. Additionally, careful attention must be paid to the extent of active (versus passive) membershipand the possibility that membership in multiple organizations may artificially inflate participation rates.Notably,some types of organizations may be relatively informal and difficult to identify in the census while others (e.g.,anarchistic militias) are clearly not conducive to the stability and sustainability of society as a whole. There is aprice to pay for the data as well. Since most communities only retain records of which organizations are found in alocality and do not indicate membership parameters, each organization will have to be contacted (at least onceevery ten years) on an individual basis. The cost of locating organizations in communities over 500 citizens andcompiling information is estimated at $15,000 per survey (i.e., 200 hours to call roughly 2000 organizationalcontacts, perhaps twice, and query for three minutes each).
F. Interpretation of the indicator:
Organization membership is a measure of community "wellness" in that vibrant localities have populations thatparticipate in the possibility of civic pride and voluntarism. Further, since some of these groups reflect heritageand life-outlook, the indicator also reveals something about cultural diversity and the desire of citizens to sustainvalued lifestyles. In general, the larger the number of organizations, the greater their range, and the more uniqueneeds they serve for a population, the more we can conclude that the social infrastructure is being sustained.

100
Alternatively, declining trends in either number or membership-to-population ratios indirectly suggests alessening of civic participation in basin communities.
8.3.11 Energy Consumption
A. Ecosystem objective addressed by this indicator:
Developing Sustainability Summary Objective and Sub-Objectives a) "Public and private decisions will be rightwhen they tend to preserve the integrity, stability, and beauty of the biotic community (Leopold, 1968)", b) "The LakeSuperior ecosystem provides resources and services to humans. These include water, fiber, minerals, energy, wastetransport and treatment, food, recreation, and spiritual sustenance. These resources should be viewed as environmentalcapital, in the same way that other capital is assigned value", c) "Institutional capacity to integrate technology andsustainable design should be developed within the Lake Superior basin", and d) "The basis for guiding sustainabledevelopment at the scale of the Lake Superior basin should be the pattern of land, water, and air use, as these affectecological, social, and economic progress"
B. Purpose or nature of the indicator:
CO2 levels are the best omnibus estimate we currently have for the consumption of fossil fuels, which comprise thebulk of energy demands in the Lake Superior basin (cf. Pearce, 1993). Furthermore, we know that there is abalance between the production of CO2 (accounting for that which results from natural decomposition and wildfire)and the ability of a regional biomass to capture and retain this gas, which significantly contributes to globalwarming (Bucholz, 1993). This indicator measures or estimates those loadings of CO2 which are the direct resultof energy use by industry and municipalities and factors in other measures of consumption (e.g., electricity use incommunities) to determine the overall trend in basin energy.
C. Features of the indicator:
This indicator of energy consumption requires fairly sophisticated measuring tools and analysis. Current andfuture enhanced monitoring of general and site-specific CO2 discharges, conducted as part of existing federalinitiatives, will be compared with the estimated capability of basin biomass to mitigate overall production. Theanalysis of loadings, measured at representative basin sites, will begin in LaMP year-one. Appropriate analytictools have yet to be refined, but can be anticipated on the basis of what we currently know about atmosphericmonitoring and analysis (e.g., Spreng, 1988). Alternatively, state and federal reports of energy production (e.g.,kilowatts) and sales (e.g., gasoline) will also be used, especially in the case of an upsurge in the use of non-CO2
producing energy sources such as nuclear power.
For this indicator the target would be: a downward trend in the net production of CO2 from point sources in thebasin until stable levels of organic absorption matching discharge levels are achieved as well as an overall patternof energy savings.
D. Illustration of the indicator:
The indicator will be reported by way of a graph representing both average loadings of CO2 in the basin as well asregional biomass accumulations. Tables may also be constructed to reflect per capita energy consumption insofaras state, provincial, and federal estimates of energy production and sales can be pinned down to the level of actualuse in the basin.
E. Limitations and uncertainties:
Most sophisticated measurements involve some level of uncertainty and error. In this case, CO2 emissions fromoutside the basin may influence local and regional estimates and adequate atmospheric measuring instrumentshave yet to be calibrated on a basin-wide scale accounting for the separate contributors to CO2 loads (including theprevalent burning of wood as a means of heat). Importantly, since the science of estimating the balance between

101
CO2 emissions and organic uptake is still emerging, for the interim we may want to place greater stock in the crudemeasures of energy consumption drawn from agency reports and rely on best-estimates of the balance between useand reabsorption. Eventually, since federal agencies are already including the cost of CO2 monitoring in theirbudgets and since biomass will be calculated based on the inventories established above in the section dealingwith biotic ecosystems, we will be able to attain more precise measurements at minimal additional cost. Finally,since monitoring of CO2 will be ongoing, the analysis and updating of this indicator will be largely determined bythe gathering of biomass data (i.e., a 10 year cycle).
F. Interpretation of the indicator:
End-of-pipe monitoring may reveal CO2 increases from point sources in the Lake Superior basin which should alertus to a continuing trend toward a nonsustainable society. However, if local and general levels of CO2 show adecrease, we may reasonably infer that either energy consumption is also going down, basin residents are relying onmore benign sources of energy (e.g., solar or wind power), the natural capacity of the ecosystem to absorb CO2 isincreasing, or end-of-pipe measures are being taken to prevent emissions. In any case, humans are acting in moresustainable ways (Uusitalo, 1983). In addition, an analysis of the different types of energy being used in the basincan be modeled in terms of factors which influence consumption within communities (Stern & Aronsen, 1984). Thus, although the indicator cannot specify general solutions to the problem of managing energy consumption, it isa tool policy makers, regulators, and individuals can use in the production of wise decisions.
8.3.12 Waste Stream Loadings
A. Ecosystem objective addressed by this indicator:
Developing Sustainability Summary Objective and Sub-Objectives a) "Public and private decisions will be rightwhen they tend to preserve the integrity, stability, and beauty of the biotic community (Leopold, 1968)", b) "The LakeSuperior ecosystem provides resources and services to humans. These include water, fiber, minerals, energy, wastetransport and treatment, food, recreation, and spiritual sustenance. These resources should be viewed as environmentalcapital, in the same way that other capital is assigned value", c) "Institutional capacity to integrate technology andsustainable design should be developed within the Lake Superior basin", and d) "The basis for guiding sustainabledevelopment at the scale of the Lake Superior basin should be the pattern of land, water, and air use, as these affectecological, social, and economic progress"
B. Purpose or nature of the indicator:
Although the production of waste is an attribute of life in general, only human activity results in unwanted by-products which threaten the ability of the Lake Superior basin to further sustain a human presence and thecontinued use of its resources. This indicator is designed to evaluate residents' movement toward establishedgovernmental targets for two key types of waste. First, at the level of local communities, the major indicator ofsustainability is "the trash crisis" (Connett, 1991), wherein the availability of usable landfill space is outstrippingthe conservation and recycling levels of consumers, despite the fact that reasonably high levels in reduction of MSWand household refuse are technically feasible (Platt, Doherty, Broughton, & Morris, 1990). Both the EnvironmentalProtection Agency and Environment Canada have recommended these reduction levels be achieved within ten years(Pearce, 1993). Second, the International Joint Commission has designated Lake Superior as a "zero toxicdischarge" demonstration project for at least nine bioaccumulative substances shown to pose direct threats to theecosystems of the lake and those who draw upon Lake Superior for sustenance and which are sometimes found inthe waste streams of basin communities or industries.
C. Features of the indicator:
Impacts on the waste stream in the basin will be measured by way of reviewing state and provincial records oflandfill and incinerator capacity, trends in the amount of materials being recycled through public and privatemechanisms, and EPA/EC or private industry monitoring of effluent for toxins. Existing methods for assessing and
102
forecasting regional and local load configurations (based on LaMP year-one data), such as those developed by theSeattle Solid Waste Facility in the late 1980s, will be used to measure progress toward the target (cf. Brisson,1993).
For this indicator the target would be: reduce municipal solid waste (MSW) by at least 25% (US) to 50% (Canada);increasing trends in the recycling of organic and inorganic household waste; zero measurable discharge ofdesignated toxins from all point sources located in the basin.
D. Illustration of the indicator:
Graphic trend lines and pie chart conversions reflecting changes in loadings and percentage accumulations overtime may be used to report to the public and government agencies the status of this indicator.
E. Limitations and uncertainties:
Experience has shown that the political backdrop of the basin may be slow in responding to the need to reducewaste and emissions and some interest groups may actively oppose either an incremental or absolutist regulatoryclimate regarding reductions in waste, mandatory recycling, or the release of human-produced toxins into the air,water, or terrestrial systems of the region. Furthermore, though access to and analysis of public record is relativelyinexpensive to accomplish, obtaining data from the private sector may require extensive and costly personalcontacts to annually obtain proprietary data so as to produce five-year reports. Also, our current inability to tracklarge portions of raw material inputs into the basin resource cycle my skew comparative results until substantialtime has passed.
F. Interpretation of the indicator:
The reduction in private citizens' contributions to the waste stream reveals significant commitments to sustainingsocial and physical resources and measures of toxic discharge reductions indicates the effectiveness of regulatedsustainability efforts and/or the willingness of corporations to engage in sustainable economic practices. Yet, asidefrom being able to isolate particular industries, the indicator only gives clues to the general emergence ofsustainable activity in the watershed. Its ability to reveal which elements of the waste stream require particularattention for either educational or regulatory action depends on the specificity of measurement and the politicalwill of basin residents.
8.4 Theme: Sustaining Cultural Values
8.4.1 Political Pressure to Protect and Remediate the Environment
A. Ecosystem objective addressed by this indicator:
Developing Sustainability Summary Objective and Sub-Objectives a) "Public and private decisions will be rightwhen they tend to preserve the integrity, stability, and beauty of the biotic community (Leopold, 1968)", and b) "TheLake Superior ecosystem provides resources and services to humans. These include water, fiber, minerals, energy, wastetransport and treatment, food, recreation, and spiritual sustenance. These resources should be viewed as environmentalcapital, in the same way that other capital is assigned value"
B. Purpose or nature of the indicator:
Without question, the primary way in which citizens actively promote the sustainability of their values indemocratic society is through the political process and actions of local governments can be seen as the clearestmeasure of what the cultures in the basin wish to perpetuate (cf. Ehrlich & Ehrlich, 1991). If a culture of trulysustainable values is to emerge in the basin, it will be reflected in endorsement by elected officials which, in turn,

103
should result in widespread commitments to restore and protect the biotic foundation for life in the region and topromote sensible environmentalism. Demonstrable political pressure measures such cultural allegiances.
C. Features of the indicator:
Actual endorsement of the Objective Six mandate to develop sustainability in the Lake Superior basin will be seenin the proportion of communities which pass resolutions to that effect, as well as in their ongoing requests fortechnical or logistical advice and their willingness to commit their generally limited resources to the initiative. This will be predicated upon large numbers of people having read the LaMP document, understanding what itmeans for themselves and future generations in terms of commitment, sacrifice, and perseverance.
For this indicator the target would be: all community governments in the basin endorse the objective, indicators,and targets for developing sustainability as outlined in this document.
D. Illustration of the indicator:
The political will of basin residents, as partially indicative of their cultural commitments, can be seen in year-to-year changes in the ratio of communities which have endorsed the spirit and substance of Objective Six. It will beuseful to augment this quantitative measure with examples drawn from actual resolutions in order to provideguidance for communities yet to declare their support for a sustainable society.
E. Limitations and uncertainties:
This indicator is limited insofar as verbal commitments may be vague or not result in actual behavioral changes onthe part of municipalities and individuals. Some communities may currently lack the resources to demonstratelifestyle changes in the short-term or may not be aware of who to turn to in order to allay fears, counteract thoseself-serving interests opposed to the initiative, or gain needed information. And, as noted elsewhere, somecommunities are only loosely organized and many individuals live in a "hinterland" without formal ties to politicalstructures. But these are not intractable problems. With a minimal initial financial investment to promote thevalue of the LaMP, and continuing efforts on the part of grassroots organizations, yearly tallies of endorsementsshould grow till the target is met.
F. Interpretation of the indicator:
Granting that political endorsements must be backed by public resolve and action in order to be meaningful, theexplicit acceptance of what sustainability is and entails tells us much about the will of people in the Lake Superiorbasin as well as the extent to which they are even aware of the Binational Program. By charting the regionaldistribution of endorsements, we can identify and adapt campaigns to those areas resisting change or thosecommunities that have yet to act upon their words.
8.4.2 Diversity of Cultures
A. Ecosystem objective addressed by this indicator:
Developing Sustainability Summary Objective and Sub-Objectives b) "The Lake Superior ecosystem providesresources and services to humans. These include water, fiber, minerals, energy, waste transport and treatment, food,recreation, and spiritual sustenance. These resources should be viewed as environmental capital, in the same way thatother capital is assigned value", and d) "The basis for guiding sustainable development at the scale of the Lake Superiorbasin should be the pattern of land, water, and air use, as these affect ecological, social, and economic progress"
B. Purpose or nature of the indicator:
It is generally accepted in pluralistic societies such as the United States and Canada that the presence of multiplecultures, each of which has the potential to provide positive contributions to solving problems, is something to be
104
valued (Herskovits, 1973). In terms of sustainability in the Lake Superior basin, different cultures bring withthem different traditions based upon ethnicity or world view, the combinations of which will more likely allow therange of people in the basin to meet emerging challenges. Conversely, as cultures become assimilated or die off forlack of interest, the basin becomes that much the less. And the impoverishment of cultural diversity is verydifficult to reverse; all subsequent generations will not find ready access to traditions and folkways that may bebest suited to those future times and places (cf. Barry, 1983). Thus, this indicator is a bellwether for futureadaptability and sustainability.
C Features of the indicator:
Several measures of cultural diversity and sustainability are available. For example, the United States ForestService has been able to use census data to construct a distribution of ethnic enclaves south of the Canadian borderand the same could be applied for the entire basin after the LaMP is released. So too have sociologists constructedan array of surveys identifying distinct language communities and accompanying trends in attitudes (e.g., Bourhis& Sachdev, 1984). We also would want to develop new protocols to specifically be used in the watershed measuringsuch factors as mutual respect among various cultures in the region or the extent to which the environmental worldviews of groups were compatible with one another.
For this indicator the target would be: no lessening of basin-wide cultural diversity.
D. Illustration of the indicator:
The best way to relay the findings of this indicator to interested parties would be through a narrative describingchanges in the cultural composition of the basin, perhaps augmented by multi-media presentations to be exhibitedin schools and public forums.
E. Limitations and uncertainties:
Although the cost of extracting data from US and Canadian census materials is only tied to the hours one mustdevote to the project every five to ten years, the construction and distribution of survey instruments can be quitecostly (i.e., upwards of $20,000 for each wave of data gathering). Even assuming the financing is available, culturaldata are so inclusive that interpreting the data may be a daunting task, especially since the analyst would have toavoid value judgments and ethnocentric biases. And, similar to a problem encountered in another indicator, wecannot assume that all cultures contribute positively to sustainability and will have to go beyond mere numbers toassess the true worth of cultural diversity.
F. Interpretation of the indicator:
The interpretation of this indicator is directly parallel to that which accompanies the role diversity plays in non-human ecosystems: as the range and variety of cultures increase to the social carrying capacity of a region, so todoes the ability of that society to discover innovative solutions and adapt to emerging needs. However, though wemay conclude that a lessening of distinct cultures in the basin is indicative of a problem, this information does notsuggest specific solutions per se.
8.4.3 Basin-Wide Sense of Identity
A. Ecosystem objective addressed by this indicator:
Developing Sustainability Summary Objective and Sub-Objective d) "The basis for guiding sustainable developmentat the scale of the Lake Superior basin should be the pattern of land, water, and air use, as these affect ecological, social,and economic progress"
105
B. Purpose or nature of the indicator:
An inherent part of developing sustainability in the Lake Superior basin will be the emergence of a unified sense ofcommunity which spans the border between the US and Canada and stretches from east to west. Applying theinfluential Brundtland report (World Commission on Environment and Development, 1987) to the region suggeststhat "our common future" will be largely dependent upon the agreement basin residents have regarding what thisplace means and how they should act toward it. Again, this world view is the product of culture and residents'attitudes may either be positive, neutral, or negative in regard to sustaining the lake and its environs. It is thenature of this indicator to provide snapshots of how unified people are in their identity as basin shareholdersinstead of individual dwellers on the land.
C. Features of the indicator:
A representative sample of residents in the Lake Superior catchment will complete yet to be designed surveysmeasuring their attitudes toward the basin as a bioregion and revealing the extent to which they exhibit a unified,implicit adoption of the "Vision Statement" for the lake environment. These surveys, distributed in LaMP year-one and periodically thereafter, will consist of updated protocols measuring the integration of environmental values(e.g., Van Liere & Dunlap, 1983), the valuation people attach to spiritual or aesthetic characteristics of the region(e.g., Brookshire, Ives, & Schultze, 1976), and other measures of shared outlook (e.g., content analysis of local mediastories) regarding the vision for the basin adopted by the Binational Forum (e.g., Poyatos, 1976).
For this indicator the target would be: basin residents recognize the cultural and economic connectedness of thebioregion and their shared destiny in its future.
D. Illustration of the indicator:
Descriptive statistics generated from survey responses will be indexed to changes in attitudes over time and reflective of components in the "Vision Statement" with special attention paid to the distribution of differentvalues across the basin. These findings will be combined with representative extracts from open ended responsesby basin residents and interpreted in narrative form for the benefit of readers of periodic reports.
E. Limitations and uncertainties:
It obviously will be difficult to gain a true measure of a basin-wide identity. Expressed attitudes must be carefullyconsidered in context of actual conduct; surveys must be general enough to capture the range of values embraced bybasin residents yet specific enough to isolate commitments to a basin-wide identity; existing differences in thevalues of individualism between nations and urban versus rural communities must be taken into account. Also,expecting no more than a 60% return rate on mailed surveys, we will need two samples (one panel and one random)of roughly 1800 each to attain sufficient power to adequately interpret the data (assuming a relatively weaksurvey-to-survey difference in changes in group identity). The survey should be administered every five years (toreduce panel respondent attrition due to natural migration) and will entail the normal cost for collecting andanalyzing such data.
F. Interpretation of the indicator:
People can only work in concert for a sustainable society to the extent they share an understanding for who they areas stakeholders in region and the coalescing of a group identity in the basin will indicate greater chances forsustainability. A lack of movement toward a shared identity over time will suggest the need for greater efforts ateducating people and encouraging joint projects which enfranchise various publics in the Lake Superior watershed.
8.4.4 General Participation in Environmental Programs

106
A. Ecosystem objective addressed by this indicator:
Developing Sustainability Summary Objective and Sub-Objectives a) "Public and private decisions will be rightwhen they tend to preserve the integrity, stability, and beauty of the biotic community (Leopold, 1968)", and d) "Thebasis for guiding sustainable development at the scale of the Lake Superior basin should be the pattern of land, water,and air use, as these affect ecological, social, and economic progress"
B. Purpose or nature of the indicator:
For one reason or another, most people choose not to join formal environmental organizations yet committhemselves to a sustainable lifestyle just the same. In this vein, we would expect such individuals to gravitatetoward programs reflecting their interests and one extremely useful index of the extent of environmentalconsciousness in society is to be found in a publics' participation in such events (Braden & Kolstad, 1991). Thissort of passive endorsement of sustainable directions reflects deep seated allegiances and further serves totransform individuals into environmental activists (Cable & Degutis, 1991; Van der Ryn & Calthorpe, 1986). Thus, participation in environmental programs by the general public is a good indicator of how well the "right"kinds of cultural values are being sustained.
C. Features of the indicator:
Counts of people attending a representative sample of forums (e.g., those sponsored by the Binational Program) orparticipating in recurring activities (e.g., shoreline clean-up days, Earth Day) will be established in LaMP year-oneand will serve as a baseline for subsequent tallies. An appropriate number of short interviews with residentsattending those events will be used to distinguish those in specific environmental organizations from the generalpublic. By returning time and again to the same sites, we can chart participation rates over a period of years.
For this indicator the target would be: increasing numbers of citizens take part in formal gatherings, programs,and projects related to environmentalism.
D. Illustration of the indicator:
Graphics and charts will provide the public with a view of how citizen participation is changing over time,especially in relative proportion to membership in environmental organizations.
E. Limitations and uncertainties:
Forums, programs, and activities may not be readily available to those living in rural portions of the basin.Another qualification of this indicator is that opportunities often depend upon the resources and inclination ofcommunity organizers; even if someone wanted to participate, they might not have the chance to act on theirdesires. Also, not all types of environmental program participation reveal emerging cultural values and somealternative venues, more indicative of sustainability, may be ignored. Thus, as always, analysts must be cautiousin reading too much into a pattern of findings. If community or grassroots personnel can be mobilized to count andinterview participants, costs will be minimal. Otherwise, we can expect to pay upwards of $10,000 for obtainingthis sort of data for any given set of observations (even if we limit the sample of activities to 20 programs or events,that occur on a yearly basis, scattered around the basin).
F. Interpretation of the indicator:
Part of a people's culture is reflected in the community activities they choose to join as willing participants. If weassume that environmental programs largely reflect a commitment to a sustainable environment, we can concludethat voluntary attendance at such events indicates at least a partial allegiance to an environmental world view. Yet, as straightforward as this interpretation may be, the indicator cannot diagnose specific problems or suggestspecific solutions.

107
REFERENCES
Aquatic Communities
Bailey, R. M., and G. R. Smith. 1981. Origin and geography of the fish fauna of the Laurentian Great Lakes basin. Can. J. Fish. Aquat. Sci. 38:1539-1561.
Baldwin, N. S., R. W. Saalfield, M. A. Ross, and H. J. Buettner. 1979. Commercial fish production in the Great Lakes,1867-1977. Great Lakes Fish. Comm. Tech. Rep. No. 3. 187 p.
Busiahn, T. R. 1990. Fish community objectives for Lake Superior. Great Lakes Fish. Comm. Spec. Pub. 90-1. 23 p.
Crowder, L. B. 1980. Alewife, rainbow smelt and native fishers in Lake Michigan: competition or predation. Env. Biol.Fish. 5:225-233.
Dyer, W. R, L. F. Erkkila, and C. L. Tetzloff. 1965. Food of lake trout in Lake Superior. Trans. Amer. Fish. Soc. 94:169-176.
Ebener, M. P., J. E. Johnson, D. M. Reid, N. P. Payne, R. L. Argyle, G. M. Wright, K. Krueger, J. P. Baker, T. Morse, andJ. Weise. In press. Status and future of Lake Huron fish communities. In M. Munawar, T. Edsall, and J. Leach[ed.] The Lake Huron ecosystem: ecology, fisheries and management. Ecovision World Monograph Series, S. P. B.Academic Publishing, The Netherlands.
Eck, G. W., and L. Wells. 1987. Recent changes in Lake Michigan’s fish community and their probable causes, withemphasis on the role of alewife (Alosa pseudoharengus). Can. J. Fish. Aquat. Sci. 44:(Suppl. 2):53-60.
Evans, D. O., and D. H. Loftus. 1987. Colonization of inland lakes in the Great Lakes region by rainbow smelt, Osmerusmordax: their freshwater niche and effects on indigenous fishes. Can. J. Fish. Aquat. Sci. 44:(Suppl. 2):249-266.
Francis, G. R., J. J. Magnuson, H. A. Regier, and D. R. Talhelm. 1979. Rehabilitating Great Lakes ecosystems. GreatLakes Fish. Comm. Tech. Rep. No. 37. 99 p.
GLFC (Great Lakes Fishery Commission).. 1980. A Joint strategic Plan for Management of Great Lakes Fisheries.Great Lakes Fish. Comm., Ann Arbor, MI. 20 p.
Hansen, M. J. [ED.]. 1994a. The state of Lake Superior in 1992. Great Lakes Fish. Comm. Spec. Pub. 94-1. 110 p.
Hansen, M. J. 1994b. Dynamics of the recovery of lake trout (Salvelinus namaycush) in U. S. waters of Lake Superior. Doctoral dissertation, University of Michigan, Lansing. 114p.
Hansen, M. J., M. P. Ebener, J. Dale Shively, and B. L. Swanson. 1994. Lake trout, p. 13-34. In M. J. Hansen [ed.] Thestate of Lake Superior in 1992. Great Lakes Fish. Comm. Spec. Pub. 94-1.
Healey, M. C. 1978. The dynamics of exploited lake trout populations and implications for management. J. Wild.Manag. 42:307-328.
Klar, G. T., and J. G. Weise. 1994. Sea lamprey, p. 77-86. In M. J. Hansen [ed.] The state of Lake Superior in 1992. Great Lakes Fish. Comm. Spec. Pub. 94-1.
Lawrie, A. H., and J. F. Rahrer. 1972. Lake Superior: effects of exploitation and introductions on the salmonidcommunity. J. Fish. Res. Bd. Canada 29:765-776.
Lawrie, A. H., and J. F. Rahrer. 1973. Lake Superior: A case history of the lake and its fisheries. Great Lakes Fish.Comm. Tech. Rep. No. 19. 69 p.

108
Loftus, D. H., and P. F. Hulsman. 1986. Predation on larval lake whitefish (Coregonus clupeaformis) and lake herring(C. artedii) by adult rainbow smelt (Osmerus mordax). Can. J. Fish. Aquat. Sci. 43:812-818.
Kerr, S. J., and G. C. LeTendre. 1991. The state of the Lake Ontario fish community in 1989. Great Lakes Fish.Comm. Spec. Pub. 91-3. 38 p.
Kitchell, J. F. 1985. An ecological rationale for managing predator-prey systems in the Great Lakes, p. 85-98. In R. L.Eshenroder [ed.] Presented papers from the Council of Lake Committees plenary session on Great Lakes predator-prey issues, March 20, 1985. Great Lakes Fish. Comm. Tech. Rep. 85-3. 134 p.
Kitchell, J. F., L. A. Eby, X. He, D. E. Schindler, and R. A. Wright. 1994. Predator-prey dynamics in an ecosystemcontext. J. Fish. Biol. 45(Supple. A):209-226.
LSLTTC (Lake Superior Lake Trout Technical Committee). 1986. A lake trout rehabilitation plan for Lake Superior. Lake Superior Committee, Great Lakes Fish. Comm. 18 p.
LSTC (Lake Superior Technical Committee). 1995. A lake trout restoration plan for Lake Superior. Lake SuperiorCommittee, Great Lakes Fish. Comm.
MacCallum, W. R., and J. H. Selgeby. 1987. Lake Superior revisited. Can. J. Fish. Aquat. Sci. 44(Suppl. 2):53-60.
MacCallum, W. R., S. T. Schram, and R. G. Schorfhaar. 1994. Other species, p. 63-76. In M. J. Hansen [ed.] The stateof Lake Superior in 1992. Great Lakes Fish. Comm. Spec. Pub. 94-1.
Marshall, T. R., R. A. Ryder, C. J. Edwards, and G. R. Spangler. 1987. Using the lake trout as an indicator ofecosystem health- application of the dichotomous key. Great Lakes Fish. Comm. Tech. Rep. No. 49. 35 p.
Peck, J. W., W. R. MacCallum, S. T. Schram, D. R. Schreiner, and J. Dale Shively. 1994. Other salmonids, p. 35-51. InM. J. Hansen [ed.] The state of Lake Superior in 1992. Great Lakes Fish. Comm. Spec. Pub. 94-1.
Pratt, D. M., W. H. Blust, and J. H. Selgeby. 1992. Ruffe, Gymnocephalus cernuus: newly introduced in North America. Can. J. Fish. Aquat. Sci. 49:1616-1618.
Pycha, R. L., and G. R. King. 1975. Changes in the lake trout population of southern Lake Superior in relation to thefishery, the sea lamprey, and stocking, 1950-70. Great Lakes Fish. Comm. Tech. Rep. No. 28. 34 p.
Selgeby, J. H. 1982. Decline of lake herring (Coregonus artedii) in Lake Superior: analysis of the Wisconsin herringfishery, 1936-78. Can. J. Fish. Aquat. Sci. 39:554-563.
Selgeby, J. H., C. R. Bronte, and J. W. Slade. 1994. Forage species, p. 53-62. In M. J. Hansen [ed.] The state of LakeSuperior in 1992. Great Lakes Fish. Comm. Spec. Pub. 94-1.
Selgeby, J. H., W. R. MacCallum, and M. H. Hoff. 1994. Rainbow smelt - larval lake herring interactions: competitorsor casual acquaintances? Nat. Biol. Surv., Tech. Rep. Ser., Biol. Rep. 25. 9 p.
Terrestrial Wildlife
Addison, E. M., G. Fox, and M. Gilbertson, eds. 1991. Proceedings of the expert consultation meeting on mink and otter,Windsor, Ontario, March 5-6, 1991.
Armstrong, Ted. Ontario MNR. Personal communication.

109
Carmean, William. Professor of Forestry, Lakehead University. Personal communication.
Cumming, H.G. and D.B. Beange. 1993. Survival of woodland caribou in commercial forests of northern Ontario. Forestry Chronicle 69(5): 579-588.
Darby, W.R., H.R. Timmermann, J.B. Snider, K.F. Abraham, R.A. Stephanski, and C.A. Johnson. 1989. Woodlandcaribou in Ontario: Background to a policy. Ont. Min. Nat. Resour. , Wildl. Br., Toronto. 38 pp.
Ensor, K. L. W. C. Pitt, and D. D. Helwig. 1993. Contaminants in Minnesota Wildlife: 1989-1991. Minnesota PollutionControl Agency. St. Paul, Minnesota.
Giesy, J. P. et al., 1994. Contaminants in fishes from Great Lakes-influenced sections and above dams of threeMichigan rivers II: Implications for health of mink.
Gollat, Rick. Ontario MNR. Personal communication.
Hazard, E. B. 1982. The Mammals of Minnesota. University of Minnesota Press, Minneapolis, Minnesota.
Hyer, Bruce. Personal communication.
Langenau, Ed.Michigan DNR. Personal communication.
Noss, R.F. 1990. Indicators for monitoring biodiversity: a hierarchical approach. Conserv. Biol. 4(4): 355-364.
Racey, G. D., K. Abraham, W.R. Darby, H.R. Timmerman and Q. Day. 1991. Can woodland caribou and the forestindustry coexist: The Ontario scene. Proc. 5th N. Am. Caribou Workshop.
Shad, Dave. Minnesota DNR. Personal communication.
Strand, Fred. Wisconsin DNR. Personal communication.
Welch, D. A. 1992. Mink along the shoreline of the lower Great Lakes. A report submitted to the Ontario Ministry ofNatural Resources.
Wren, C. D. 1991. Cause-effect linkages between chemicals and populations of mink (Mustela vison) and otter (Lutracanadensis) in the Great Lakes Basin. J. Toxicol. Environ. Health 33:549-585.
Habitat
Andren, H. 1994. Effects of habitat fragmentation on birds and mammals in landscapes with different proportions ofsuitable habitat: a review.
Baker, W.L. 1992. Effects of settlement and fire suppression on landscape structure. Ecology. 73(5): 1879-1887.
Bauer, M.E., T.E. Burk, A.E. Ek, P.R. Coppin, S.D. Lime, T.A. Walsh, D.K. Walters, W. Befort, and D.F. Heinzen. 1994. Satellite inventory of Minnesota forest resources. Photogramm. Eng. Remote Sensing. 60(3): 287-298.
Bedford, B.L. 1990. Increasing the Scale of Analysis: The Challenge of Cumulative Impact Assessment for GreatLakes Wetlands. Wetlands of the Great Lakes. The Association of State Wetland Managers Inc. (pp. 186-195)
Bennett, E.B. 1978. Water Budgets for Lake Superior and Whitefish Bay. Journal of Great Lakes Research 4:331-342
Borman, F.H. and G.E. Likens. 1970. The nutrient cycles of an ecosystem. Sci. Amer. 223: 92-101.

110
Burgess, R.L. and D.M. Sharpe. 1981. Summary and conclusions. In: Forest island dynamics in man-dominatedlandscapes. R.L. Burgess and D.M. Sharpe (Eds.) Springer-Verlag. New York. pp. 267-272.
Dodge, D. and R. Kavetsky. 1994. Aquatic Habitat and Wetlands of the Great Lakes. SOLEC Working Paper. State ofthe Lakes Ecosystem Conference; Dearborn, Michigan.
Fitzgibbon, J. and J. Imhof. (In press). Managing for Natural Channel/Valley Systems Within an Ecosystem Context: A Hierarchical Indicator Model for Stream Ecosystems. Can. J. Fish. Aquatic. Sci.
Gluck, M. and Rempel R. In press. Structural characteristics of post-wildfire and clearcut landscapes.
Harris, L.D. 1984. The fragmented forest: island biogeographic theory and the preservation of biotic diversity. University of Chicago Press, Chicago. 211 pp.
Hartig, J. 1993. A Survey of Fish Community and Habitat Goals/ Objectives/Targets and Status in Great Lakes Areasof Concern.
Hartman, G.F. and J.C. Scrivener. 1990. Impacts of Forestry Practices on a Coastal Stream Ecosystem, CarnationCreek, British Columbia. Can. Bull. Fish. Aquat. Sci. 223: 148 p.
Johnston, C.A. 1992. Land Use Activities and Western Lake Superior Water Quality. Making a Great Lake Superior. Lakehead University. (pp. 145-162)
Kemp, A.L.W., C.I. Dell, and N.S. Harper. 1978. Sedimentation Rates and a Sediment Budget for Lake Superior. Journal of Great Lakes Research 4:276-287.
Lawrie, A.H. and J.F. Rahrer. 1973. Lake Superior: A Case History of the Lake and its Fishes. Great Lakes Fish.Comm. Tech Report No. 19.
Matthiae, P.E. and F. Stearns. 1981. Mammals in forest islands in southeastern Wisconsin. In: Forest islanddynamics in man-dominated landscapes. R.L. Burgess and D.M. Sharpe (Eds.) Springer-Verlag. New York. pp. 59-66.
McGarigal, K. and B. Marks. 1994. Fragstats: Spatial pattern analysis program for quantifying landscape structure. Forest Science Department, Oregon State University, Corvallis, Oregon. 67 pp.
Ontario Ministry of Environment. 1992. The Provincial Water Quality Monitoring Network in Northwestern Ontario:Data Summary 1968 to 1990. Queen’s Printer for Ontario. 272 p. + App.
Schueler, T.R. 1987. Controlling Urban Runoff. Metropolitan Washington Council of Governments.
Steedman, R.J. 1992. Centres of Ecosystem Function in the Lake Superior Coastal Zone. Making a Great LakeSuperior. Lakehead University. (pp. 66-89)
The Nature Conservancy. 1994. The Conservation of Biological Diversity in the Great Lakes Ecosystem: Issues andOpportunities. The Nature Conservancy Great Lakes Program. 117p.
United States Environmental Protection Agency (USEPA) and Environment Canada. 1988. The Great Lakes: anenvironmental atlas and resource book. Toronto. 44 pp.
Whitcomb, R.F., C.S. Robbins, J.F. Lynch, B.L. Whitcomb, M.D. Dlimkiewicz, and D. Bystrak. 1981. Effects of forestfragmentation on avifauna of the eastern deciduous forest. In: Forest island dynamics in man-dominatedlandscapes. R.L. Burgess and D.M. Sharpe (Eds.) Springer-Verlag, New York. pp. 125-205.

111
Wilcove, D.S. 1985. Nest predation in forest tracts and the decline of migratory songbirds. Ecology 66: 1211-1214.
Human Health
Ahier, B.A. & Tracy B.L. (1993). SOLEC Paper on: Radionuclides in the Great Lakes. Environmental RadiationHazards Division, Bureau of Radiation and Medical Devices, Health Protection Branch, Health Canada.
Great Lakes Science Advisory Board. 1993. Report to the International Joint Commission (general reference)
Rang, S., Holmes, J., Slota, S., Bryant, D., Nieboer E., & Reiger, H. (1992). The impairment of beneficial uses in LakeOntario. In: Final report submitted to the Great Lakes. Environment Office, Environment Canada.
United States Environmental Protection Agency. 1992. Interim Report of the Ecosystems Objectives Work Group onEcosystem Objectives and the Environmental Indicators for Lake Ontario (general reference)
Developing Sustainability
Alban, D.H., Tiarks, A.E., Powers, R.F., Page-Dumroese, B.S., Ponder, F, & Bufford, M.A. (1994). Forest managementimpacts on long-term productivity: early results from a US research program. Abstracted in: Proceedings: International Energy Association/Bio-energy T9/A4 workshop. May 16-23, Fredericton, New Brunswick.
Barry, B. (1983). Intergenerational justice in energy policy. In D. MacLean & P.G. Brown (Eds.), Energy and the future(pp. 15-30). Lanham, MD: Rowman & Littlefield.
Bourhis, R., & Sachdev, I. (1984). Subjective vitality perceptions and language attitudes: some Canadian data. Journal of Language and Social Psychology, 3, 97-126.
Braden, J.B., & Kolstad, C.D. (1991). Measuring the demand for environmental quality. Amsterdam: North-Holland.
Brisson, I. (1993). Packaging waste and the environment, economics, and policy. Resource, Conservation and Recycling,17, 197-214.
Brookshire, D.S., Ives, B.C., & Schulze, W.D. (1976). The valuation of aesthetic preferences. Journal of EnvironmentalEconomics and Management, 3, 325-346.
Cable, S., & Degutis, B. (1991). The transformation of community consciousness: the effects of citizens' organizationson host communities. International Journal of Mass Emergencies and Disasters, 9, 383-399.
Cantrill, J. G. (1993). Communication and our environment: categorizing research in environmental advocacy. Journalof Applied Communication Research, 21, 66-95.
Connett, P.H. (1991). The disposable society. In F.H. Bormann & S.R. Kellert (Eds.), Ecology, economics, ethics: thebroken circle (pp. 99-122). New Haven: Yale University Press.
Crow, T.R., Haney, A., & Waller, D.M. (1994). Report on the scientific roundtable on biological diversity convened by theChequamogon and Nicolet National Forests. General Technical Report (NC-166). St. Paul, MN: USDA ForestService.
Daly, H.E., & Cobb, J.B. (1989). For the common good: redirecting the economy toward community, the environment,and a sustainable future. Boston: Beacon Press.

112
Ehrlich, P.R., & Ehrlich, A.H. (1991). Healing the planet. Reading, MA: Addison-Wesley.
Geertz, C. (1973). The interpretation of cultures: collected essays. New York: Basic Books.
Goldberg, P. (1993). Americans on the move. Population Bulletin, 48 (3), 1 - 30.
Grieg, S., Pike, G., & Selby, D. (1987). Earthrights: education as if the planet really mattered. San Francisco: KoganPage.
Hannon, B. (1992). Measures of economic and ecological health. In R. Costanza, B.G. Norton, & B.D. Haskell (Eds.),Ecosystem health: new goals for environmental management (pp. 207-222). Washington, DC: Island Press.
Hannon, B., Costanza, R., & Herendeen, R. (1986). Measures of cost and value in ecosystems. Journal ofEnvironmental Economics and Management, 13, 391-401.
Heskin, A.D. (1991). The struggle for community. Boulder, CO: Westview Press.
Herskovitz, M.J. (1973). Cultural relativism. New York: Random House.
Kalkenmark, M., & Chapman, T. (1989). Comparative hydrology. New York: UNESCO.
Jeffers, J.N. (1978). An introduction to systems analysis with ecological applications. University Park, PA: UniversityPark Press.
Karr, J. (1991). Biological integrity: a long-neglected aspect of water resource management. Ecological Applications, 1(1), 66-84.
Katz, E. (1985). Organism, community, and the "substitution problem." Environmental Ethics, 7, 241-256.
Leopold, A. (1968). A Sand County almanac. Cary, NC: Oxford University Press.
Ludwig, J.A., & Reynolds, J.F. (1988). Statistical ecology: a primer on methods and computing. New York: Wiley.
Lutz, E. (1993). Toward improved accounting for the environment. Washington, DC: World Bank Publications.
McNab, W.H., & Avers, P.E. (1994). Ecological subregions of the United States. Washington, DC: United StatesDepartment of Agriculture.
Milbrath, L.W. (1982). Envisioning a sustainable society:learning our way out. Boulder, CO: Westview Press.
Mitchell, P.C., & Carson, R.T. (1989). Using surveys to value public goods: the contingent valuation method. Washington, DC: Resources for the Future.
Orr, D.W. (1992). Ecological literacy. Albany: State University of New York Press.
Pearce, D. (1993). Blueprint 3: measuring sustainable development. London: Earthscan.
Pearce, D. Markandya, A., & Barbier, E.B. (1989). Blueprint for a green economy. London: Earthscan.
Platt, B., Doherty, C., Broughton, A., & Morris, D. (1990). Beyond 40%: record setting recycling and compostingprograms. Washington, DC: Institute of Local Self Reliance.
Poyatos, F. (1976). Analysis of culture through its culturemes: theory and method. In A. Rapoport (Ed.), The mutualinteraction of people and their built environment (pp. 265-274). The Hague: Mouton.

113
Renner, M. (1993). Jobs in a sustainable economy. Worldwatch Institute paper no. 104. Washington, DC.
Repetto, R. (1992). Earth in the balance sheet. Environment, 34 (7), 13-18, 43-45.
Ripple, W.J. (1987). Geographic information systems for resource management: a compendium. New York: AmericanSociety of Photogrammetry and Remote Sensing.
Rothenbuhler, E.W. (1991). The process of community involvement. Communication Monographs, 58, 63-78.
Sargent, F.O. (1991). Rural environmental planning for sustainable communities. Covelo, CA: Island Press.
Smith, S., & Reeves, J. (1988). Human systems ecology: studies in the integration of political economy, adaptation,and socionatural regions. Boulder, CO: Westview Press.
Spreng, D.T. (1988). Net energy analysis and the energy requirements of energy systems. New York: Praeger.
Stern, P.C., & Aronson, E. (1984). Energy use: the human dimension. Salt Lake City, UT: Freeman.
Tomlin, D.C. Geographic information systems and cartographic modelling. Englewood Cliffs, NJ: Prentice-Hall.
Tsai, Y., & Sigelman, L. (1982). The community question: a perspective from national survey data--the case of theUSA. British Journal of Sociology, 33, 579-588.
Uusitalo, L. (1983). Consumer behavior and environmental quality: trends and prospects in the ways of life. New York: St. Martin's Press.
Van der Ryn, S., & Calthorpe, P. (1986). Sustainable communities: a new design synthesis for cities, suburbs andtowns. San Francisco: Sierra Club Books.
Van Liere, K.D., & Dunlap, R.E. (1983). Cognitive integration of social and environmental beliefs. Sociological Inquiry,53, 333-341.
Wilson, E.O. (1992). The diversity of life. Cambridge, MA: Harvard University Press.
World Commission on Environment and Development (1987). Our common future. Cary, NC: Oxford University Press.
114
Appendix 1. Charge to the writing teams
Centre for Northern Forest Ecosystem ResearchLakehead University Campus955 Oliver RoadThunder Bay, OntarioCANADA P7B 5E1
TEL: (807)343-4008/FAX: 4001/INTERNET: [email protected]
July 5, 1994
TO: Writing Team Leaders, Ecosystem Indicators and Targets for the Lake Superior Basin
Per your recent discussion with Amy Owen, please find enclosed the "information package for writing teams", andvarious reference materials. Please review the information package carefully for details about the context and formatfor the ecosystem targets and indicators relating to your subject area. The reference materials provide examples andbackground that you may find useful.
Your expertise and networking abilities are essential to the drafting of practical ecosystem indicators and targets forthe Lake Superior Basin. The challenge for us all is to draft technically feasible indicators that are demonstrablyrelevant to the Lake Superior Ecosystem Principles and Objectives. On behalf of the Lake Superior EcosystemPrinciples and Objectives workgroup, we would like to thank you in advance for your efforts. Please contact us if youwould like to discuss any aspect of this project.
Sincerely,
Rob SteedmanResearch CoordinatorOMNR/CNFER
Bob KavetskyFish and Wildlife BiologistU.S. Fish and Wildlife Service302 Manly Miles Building1405 South HarrisonEast Lansing, MichiganUSA 48823Ph. 517-337-6650
Co-chairs, Lake Superior Ecosystem Principles and Objectives workgroup
cc. Jake Vander WalChuck Ledin

115
DRAFT ECOSYSTEM INDICATORS AND TARGETS FOR THE LAKE SUPERIOR BASIN
INFORMATION PACKAGE FOR WRITING TEAMS
July 6, 1994
1. TERMS OF REFERENCE FOR THIS EXERCISE
PURPOSE:
To address Purpose 2) from the Lake Superior Ecosystem Principles and Objectives, November 17, 1993 version:
facilitate progress towards a set of informative ecosystem indicators, with quantitative targets, by which the health ofthe Lake Superior basin ecosystem, including its physical, biotic and cultural elements, can be measured. This step isprimarily a technical process based on expert consultation, where indicators and targets will be identified throughconsideration of relevant ecological, economic and cultural information. The ecosystem indicators and targets willaddress the Lake Superior ecosystem principles and objectives, and will reflect practical constraints faced by agenciesresponsible for monitoring in Lake Superior basin. Concepts and products developed by the Ecosystem Objectives WorkGroup for Lake Ontario (Bertram and Reynoldson 1992), and other initiatives, will be used in this exercise.
PROCESS:
Interested subgroups and partners of the Lake Superior Work Group will be provided with this information package,and invited to draft ecosystem indicators and targets relevant to their areas of expertise. This process will rely on thegood judgement of each writing team in obtaining additional expert advice where necessary. The process also relies onthe commitment of the writing teams to deliver their products by the dates outlined below.
CONSTRAINTS:
The writing teams must be willing and able to focus on simple, easily communicated indicators of complex ecologicaland cultural phenomena; this simplification may be accomplished through various means, including conceptualconstructs (i.e. identification of hierarchies, key processes or structures), methodology (i.e. use of highly integrativemeasures), or statistical interpretation (i.e. integrative indices based on large sample sizes or multiple data sources). The information package provides a number of examples from the Lake Ontario process.
The ecosystem indicators and targets must be:
- prepared in the format specified in the information package
- relevant to the ecosystem objectives established in the discussion paper Ecosystem Principles and Objectives for Lake Superior;
- scientifically credible, and prepared in the context of the recent scientific literature on ecosystem monitoring;
- simple, yet reliable for their stated purpose;
116
- thoroughly documented with regard to purpose, technical characteristics, limitations, and interpretation;
- suitable for serious consideration by U.S. and Canadian agencies with a mandate for environmental monitoring;
PRODUCT:
By December 1, 1994, each writing team will forward their targets and indicators as WordPerfect 5.1 DOS documentfiles to:
Amy Owen,Inter-Tribal Fisheries186 East Three-Mile RoadSault Ste. Marie, MichiganUSA 49783
Phone: 906-632-0072 FAX: -1141
Amy will compile the various indicators and targets, and prepare a brief description of the process used to draft them.
2. BACKGROUND MATERIALS
Included in this package are:
1. draft reports from one or more of the April, 1993 Lake Ontario pelagic, benthic, habitat, wildlife, human health, orstewardship working groups;
2. a copy of GLFC Technical Report No. 49, "Using the lake trout as an indicator of ecosystem health - application ofthe dichotomous key", by Terry Marshall, et al., 1987;
3. a copy of Lake Superior Ecosystem Principles and Objectives, November 17, 1993 version;
4. a few pages describing the format of the Chesapeake Bay environmental indicators cited in #3, above.
These provide many good examples of the type of product that we are trying to produce.
3. TEMPLATE
The U.S. EPA's Chesapeake Bay Program developed a format to communicate monitoring information toenvironmental managers and to the public through periodic newsletters and press releases. Included is a display of thecurrent data (or trend) in a graphical form, a clear display of the reference or target value (or range) to be achieved, someinterpretive statements about the present status of the indicator and what it tells us about progress being madetoward the ecosystem objectives, and a graphic to indicate at which level of the spectrum the indicator is located.
Persons drafting indicators and targets for the Lake Superior basin should address the following types ofinformation:
A. Ecosystem objective addressed by this indicator. Refer to the Lake Superior Ecosystem Principles and Objectives,November 17, 1993 version, for descriptions of the objectives, and examples of potential indicators.
B. Purpose or nature of the indicator. What component of the ecosystem objective is being monitored? Why?
117
C. Features of the indicator. What, precisely, is to be measured? If an index is used, how is it calculated? What is thecalibration for the index? Why are high or low levels of the index related to high or low levels of ecosystem health in theLake Superior basin? What "logic trail" exists from the indicator itself to the interpretation?
D. Illustration of the index. How is the indicator to be presented (as graphs, tables, pie charts, etc.)? What do historicdata show when presented in the format of the proposed indicator?
E. Limitation and uncertainties. What issues may limit the usefulness of the index? How costly is it to gatherrequired data? How often should data be gathered? What qualifiers should be applied? What about geographic andtemporal scales of relevance?
F. Interpretation of the indicator. How do the magnitude, variability and trend of the indicator inform us aboutenvironmental conditions and ecosystem health? Does the indicator diagnose specific problems related to individual,collective or industrial behaviour? Does it suggest educational, administrative or regulatory solutions?
REMEMBER THAT OUR MAIN OBJECTIVE IS TO MAKE A GOOD FIRST ATTEMPT AT SPECIFYING THESEINDICATORS AND TARGETS, GIVEN THE INFORMATION AVAILABLE TO US FROM THE LAKE ONTARIOINITIATIVE AND OTHER SOURCES. THE COMPILATION OF OUR INDICATORS AND TARGETS WILL PROVIDEA SIGNIFICANT STARTING POINT FOR DISCUSSION AND ITERATIVE REFINEMENT OF THESE CONCEPTSFOR THE LAKE SUPERIOR BASIN.
4. DEADLINES
December 1, 1994 for completion of subgroup assignments
February 1, 1995 for compilation of indicators into a stand-alone document

118
Appendix 2. Partial List of Persons affiliated with the Ecosystem Principles and Objectives, Indicatorsand Targets activities of the Lake Superior Work Group, 1992-1997.
The following list includes persons who attended one or more of the subcommittee's working sessions, or who otherwiseexpressed active interest in the activities of the subcommittee. On behalf of the Lake Superior Work Group, thesubcommittee co-chairs would like to thank these persons, and any others who have been inadvertently omitted fromthis list, for their expertise and commitment to this project. Note that many other individuals who contributed toEcosystem Indicators and Targets as Measurements of Progress Towards Ecosystem Principles and Objectives for LakeSuperior as workshop members, writers, or advisors, are acknowledged in the introductions to various sections of thatdocument.
Dan Bauer, U.S. Geological Survey, Madison, WisconsinPaul Bertram, United States Environmental Protection Agency, Chicago, IllinoisBob Brander, U.S. National Park Service, Washburn, WisconsinJim Cantrill, Northern Michigan UniversityPat Collins, Minnesota DNRBob Day, Michigan Department of Natural Resources, LansingMark Ebener, Inter-Tribal Fisheries, Sault Ste. Marie, MichiganScott Hanshoe, Michigan Department of Natural Resources, LansingMoe Hussain, Health Canada, Ottawa, OntarioEd Iwachewski, Ontario Ministry of Natural Resources, Thunder BayBob Kavetsky, U.S. Fish and Wildlife Service, East Lansing, Michigan (U.S. co-chair, 1992-1995)John Kelso, Canada Department of Fisheries and Oceans, Sault Ste. Marie, OntarioCharles Kerfoot, Michigan Technological Univesity, HoughtonGary Kohlhepp, United State Environmental Protection Agency, Chicago, IllinoisNancy Larson, Wisconsin Department of Natural Resources, SpoonerCarri Lohse-Hanson, Minnesota PCAMelanie Neilson, Canada Centre for Inland WatersJoyce Mortimer, Health CanadaAmy Owen, Inter-Tribal Fisheries, Sault Ste. Marie, MichiganDarrell Piekarz, Environment CanadaJennifer Rae, Health Canada, Ottawa, OntarioRob Steedman, Ontario Ministry of Natural Resources, Thunder Bay (Canadian co-chair, 1992-1995)Bob Thomson, Ontario Ministry of Natural Resources, Thunder BayDanielle Valvassori, Wisconsin Department of Natural Resources, MadisonMel Whiteside, University of Minnesota, DuluthRobert Young, Canada Department of Fisheries and Oceans, Sault Ste. Marie, Ontario (Chair, 1991-1992)