
Economic Survey (2021-2022) of India - CA Club
442
Government of India
-
Upload
khangminh22 -
Category
Documents
-
view
1 -
download
0
Transcript of Economic Survey (2021-2022) of India - CA Club
Government of India
Government of India


EconomicSurvey 2021-22
Government of IndiaMinistry of Finance
Department of Economic AffairsEconomic Division
North BlockNew Delhi-110001
E-mail: [email protected], 2022


CONTENTS
Chapter No. Page No. Name of the Chapter
1 State of the Economy 3 Introduction 4 Sectoral Trends 9 Demand Trends 14 Barbell Strategy, Safety Nets and Agile Response 24 Vaccination 26 Macroeconomic Stability 33 Supply Side Reforms 38 Growth Outlook
2 Fiscal Developments 44 Introductions 45 Fiscal Policy Strategy in the Aftermath of the Pandemic Outbreak 48 Performance of Fiscal Indicators during 2021-22 54 Long-Term Trends in Government Finances: Centre, States & General Government 72 PolicyMeasurestoenhancetheEfficiencyofGovernmentSpending
3 External Sector 86 Global Economic Environment 88 Developments in India’s Merchandise Trade 98 Trade in Services 100 Private Transfers 100 Invisibles 101 Current Account Balance 102 Capital Account/ Financial Account 104 BOP Balance and Foreign Exchange Reserves 105 Movement in Exchange rate 107 Net International Investment Position 107 External Debt
4 Monetary Management and Financial Intermediation 118 Monetary Developments 122 Liquidity Conditions and its Management 124 Developments in G-Sec Market 125 Banking Sector 129 Monetary Transmission – Bank Lending and Deposit Rates 132 Bank Credit Growth 135 Non-Banking Financial Companies (NBFCs) Sector 138 Development in Capital Markets
142 Investment by Foreign Portfolio Investors (FPIs) 143 Indian Benchmark Indices 144 Insurance Sector 147 Pension Sector 150 Insolvency and Bankruptcy Code
5 PricesandInflation 160 GlobalInflation 161 DomesticInflation 162 CurrentTrendsinInflationanditsDrivers 188 Housing Prices 193 Pharmaceutical Pricing 194 Long Term Perspective for Management of Supply Side Factors
6 Sustainable Development and Climate Change 197 India’s Progress on Sustainable Development Goals 203 State of the Environment 220 Climate Change 229 Finance for Sustainable Development 231 India’s Initiatives at the International Stage 232 Conclusion
7 Agriculture and Food Management 235 Introduction 236 Gross Value Added (GVA) in Agriculture 248 Situation Assessment Survey 250 Allied Sectors: Animal Husbandry, Dairying and Fisheries 253 Fisheries 254 Agricultural Research & Education 255 Food Processing Sector 258 Food Management 262 Fertilizers 263 Conlusion
8 Industry and Infrastructure 265 Introduction 267 Index of Industrial Production (IIP) 270 Eight Core Index (IC) 273 Gross Fixed Capital formation 274 Credit in Industry 275 FDI in Industries 277 Performance of Central Public Sector Enterprises 278 Corporate performance 279 Sector Wise Performance and Issues in Industry

288 Infrastructure 311 Conclusion
9 Services 314 Introduction 314 Impact of COVID-19 and Sequential Recovery 316 Trends in High Frequency Indicators 319 Services Sector share at the State and UT level 321 FDIInflowsintoServicesSector 322 Trade in Services Sector 324 Major Services: Sub-Sector Wise Performance and Recent Policies
10 Social Infrastructure and Employment 344 Introduction 344 India’s Health Sector Response to the COVID-19 351 Trends in Social Sector Expenditure 353 Education 361 Skill Development 365 Trends of Employment 376 Health 382 Drinking Water and Sanitation 386 Rural Development
11 Tracking Development through Satellite Images and Cartography


vii
Acknowledgment
TheEconomicSurvey2021-22istheresultofateameffort.TheSurveyhasbenefittedfromthecommentsandinsightsof theHon’bleFinanceMinisterSmt.NirmalaSitharaman.Thesurveysincerelyacknowledges thesupport fromtheHon’bleMinistersofStateforFinanceShriPankajChaudharyandDr.BhagwatKishanraoKarad,FinanceSecretaryDr.T.V.Somanathan,SecretaryDEAShriAjaySethandRevenueSecretaryShriTarunBajaj.
ThecontributorstotheSurveyfromtheEconomicDivisionandOfficeofthePEAinclude:RajivMishra,ChandniRaina,ManishaSensarma,SajuK.Surendran,AbhishekAcharya,JitenderSingh,T.Gopinath,SunilKumarGupta,PrernaJoshi,DharmendraKumar,AakankshaArora,M.Rahul,HarishKumarKallega,TulsipriyaRajkumari,GurvinderKaur,DeepikaSrivastava,NehaSingh,AmitSheoran,ShreyaBajaj,ManojKumarMishra,DeekshaSupyaalBisht,AnshumanKamila,RitikaBansal,VijayKumarMann,Md.AftabAlam,PradyutKumarPyne,NarendraJena,MritunjayKumar,RajeshSharma,AmitKumarKesarwani,ManishSinghPanwar,VishalGori,Mahima,NaveenBali,LavishaArora,SonaliChowdhry,AbhishekMalhotra,SurabhiSeth,YashRawat,BharadwajAdiraju,DipimaSengupta.
The Survey has benefitted from the comments and inputs from several officials and experts, specifically B.V.RSubrahmanyam,AmritLalMeena,AmitYadav,AnantSwarup,AmitabhaPradhan,Dr.M.Angamuthu,GauravMasaldan,DrC.Vanlalramsanga,IshtiyaqueAhmed,RenuLata,RishikaChoraria,Dr.MridulSaggar,RajivJain,SoumasreeTewari,DeepikaRawat,SukhbirSingh,YashwantSigh,J.P.Singh,JitenderSokal,Ranjeev,SamirKumar,DhrijeshKumarTiwari,SumanPatel,DrVeenaDhawan,DrSuhasDhandore,VDhanya,SakshamSood,BhanuPratapSingh,SanjayKumarSingh,DalipKumar,DineshKapila,AmitShreeansh,JasvinderSingh,NareshPalGangwar,NeeleshKumarSah,ArunKumar,RajasreeRay,SonamaniHaobam,Dr.UnmanaSarangi,Dr.SubrataBose,PritiSingh,SanyuktaSamaddar,ShishirSeth,KamalKishore,MonaChhabraAnand,AshokKumar,AbhayBakre,RajivRanjanMishra,BinodKumar,SharmiPalit,R.K.Sinha,DrNandakumaranP,KamalPandey,BrijRaj,AmitKumar,IshitaSharma,PawanChowdhary,VishalPratapSingh,KusumMishra,AdityaKumarGhosh,RupaDutta,SudhansuSekharDas,AparnaS.Sharma,AwadheshKumarChoudhary,AnimeshBharti,AjithKumarN,SanjoyRoy,SujoyMitra,J.RajeshKumar,PadmakumarSankaranNair,JitheshJohn,GorityalaVeerMahendar,AlokChandra,PreetiNath,ArvindChaudhary,GauravKumar,ShakilAlam,RajibKumarSen,NanditaMishra,AshwiniKumar,AnshumanMohanty,UshaSuresh,PiyushSrivastava,SimmiChaudhary,ArunKumar,KuntalSensarma,VishalKapadia,SunilKumarGarg,G.S.Panwar,H.KHajong,MedhaShekar,SushantaKumarDas,KuldipNarayan,PeeyushKumar,BaldeoPurushartha,AjitRatnakarJoshi,N.K.Santoshi,DeepakSingh,KalpanaDhawan,SubhashChand,NaveenSirohi,ArpitBhargava,ArzooArora,RohanVerma,RamSingh.
Apart from the above, various ministries, departments and organisations of the Government of India contributed in their respective sectors. We also received help from several industry bodies, public institutions and private sectorentities such as MapmyIndia, NASSCOM, ISRO, FSI, NSO, RBI, SEBI, National Housing Bank, Central Electricity Authority, IBBI, IRDA, PFRDA, NPPA, ISA, NMDA, CDRI, BEE, NMCG.Able administrative support was givenbyMeera Swarup,Anu P.Mathai, RavinderKumar, Jasbir Singh,Amit Srivastava, SureshArora, Sushil Sharma andother staff members of the Economic Division. Hindi translation of the survey was done by Niharika Singh, PuranSingh from Hindi Section, DEA and Gautam Sharma, Manish Bhatnagar, Ajay Kumar Chaudhary, Dhruv NarayanAzad, Binod Kumar Sah from Central Translation Bureau. Hindi version of the survey was typed by Roopa Gupta,Meena Pant, Sashipal Singh Rawat,Yatender Kumar from Directorate of Printing, Minto Road. The cover page forthe Survey was designed by India Brand Equity Foundation. Izzur Rahman, DeepakAggarwal, SamirAhemed and GoutamHalderfromSignaturePrinters(P)Ltd.didpagesettingoftheEnglishandHindiversionsoftheSurvey.
Last but not the least, the Economic Survey owes deep gratitude to the families of all those involved in its preparation for theirpatienceandsupport.Thisisalwaysimportant,butwasespeciallytruethisyearastheEconomicSurvey2021-22waspreparedunderthecloudoftheOmicronwave.
Sanjeev Sanyal(Principal Economic Adviser)
Ministry of Finance Government of India

viii

ix
Preface
For secondyear running, theEconomicSurveywaswrittenunder thecloudof theCovid-19pandemic.Thesehavebeendifficult timesfor theworldeconomy.It isnot justabout the immediatedisruptionsanduncertaintycaused by repeated waves of the pandemic, but also the longer-term uncertainty about the post-Covid world due to accelerated shifts in technology, consumer behaviour, supply-chains, geo-politics, climate change and a host of other factors.Not only are these individual factors difficult to forecast, the impact of their interactions arefundamentallyunpredictable.ThethemeofthisEconomicSurvey,therefore,relatestotheartandscienceofpolicy-makingunderconditionsofextremeuncertainty.
The default mode of policy-making in India and most of the world has traditionally been to rely on a pre-determined “Waterfall”approach–anupfrontanalysisoftheissue,detailedplanningandfinallymeticulousimplementation.Thisis theframeworkthatunderpinsfive-yearplansandrigidurbanmaster-plans.Theproblemisthat therealworldisacomplexandunpredictableplacebuffetedbyallkindsofrandomshocksandunintendedconsequences.The response of traditional economics was to create ever more detailed plans/regulations, and elaborate forecasting modelsdespitemorethanadequateevidencethatthisdidnotimproveoutcomes.InhisNobelPrizeacceptancespeech,economistFriedrichHayekdubbedthis“ThePretenceofKnowledge”.
This Economic Survey sets out to explain the alternative “Agile” approach that informed India’s economic response to theCovid-19shock.This framework isbasedon feed-back loops, real-timemonitoringofactualoutcomes,flexible responses, safety-net buffers and so on. Planningmatters in this framework but mostly for scenario-analysis, identifying vulnerable sections, and understanding policy options rather than as a deterministic prediction oftheflowofevents.ThelastEconomicSurveydidbrieflydiscussthisapproach,butthistimeitisacentraltheme.
Some form of feedback loop based policy-making was arguably always possible, but the Agile framework is particularlyrelevanttodaybecauseoftheexplosionofreal-timedatathatallowsforconstantmonitoring.Suchinformation includes GST collections, digital payments, satellite photographs, electricity production, cargo movements, internal/external trade, infrastructure roll-out, delivery of various schemes, mobility indicators, to namejustafew.Someofthemareavailablefrompublicplatformsbutmanyinnovativeformsofdataarenowbeinggeneratedbytheprivatesector.Short-termpolicyresponses,therefore,canbetailoredtoanevolvingsituationratherthanwhatamodelmayhavepredicted.
The same recognition of uncertainty informs the longer-term supply-side strategy: the combination of policies that encourage economic flexibility through innovation, entrepreneurship and risk-taking on one hand, andsimultaneouslyinvestsinresilientinfrastructure,socialsafety-netsandmacro-economicbuffersontheother.Thus,it is hoped that readers will be able to see the links between seemingly disparate policies ranging from deregulation, process simplification, privatization, foreign exchange reserves accumulation, inflation-targeting, housing-for-all, green technology, the Insolvency andBankruptcyCode, health insurance for the poor, financial inclusion,infrastructurespending,directbenefittransfersandsoon.Theyareallaboutprotectionfromortakingadvantageofanuncertainfuture.
As readers would have noticed, this Economic Survey has shifted from the two-volume format of recent years toasinglevolumeplusaseparatevolumeforstatisticaltables.Inthiscontextitisworthwhilelookingatabriefhistoryofthedocument.TheSurveywasfirstpublishedin1950-51andwasinitiallypartoftheBudgetdocuments.The document was less than 50 pages in the 1950s and contained a brief outline of economic developments of the previousyear.Forexample,theSurveyof1957-58hadjust38pages.Itwasprimarilydescriptiveandcontainedlittleinthewayofanalysisandpolicyprescriptions.
From1958-59,thelengthofthesurveystartedincreasingwiththeintroductionofmorechartsandtables.AHinditranslationalsoseemstohavebeeninitiatedaroundthistime.Theambitionofthedocumentincreasedsignificantlyinthesixties.TheSurveyof1962-63wasdividedintotwopartswherethefirstpartfocusedonbroadereconomic

x
developmentswhilethesecondpartgaveabasicanalysisofdifferentsectors.Thefollowingyear,theEconomicSurveywasseparatedfromthebudgetandwaspresentedadayearlierasastand-alonedocument.ThiswasthefirstSurveythatsawtheintroductionofastatisticalappendix.Thesixtiesalsosawseveralexperimentswiththeformat.Insomeyears,thesectionsweredonebythemessuchRecessionandMeasuresofRevival,Controlofinflation,andFoodShortage.Inotheryears,itwasdonebysectoralsectionssuchasIndustry,AgricultureandPrices.
By1970,thelengthoftheEconomicSurveyhadalreadycrossed150pageswithadetailedlistoftables.Theformatwasfurtherrefinedintheseventiesandeightieswithsectionsbeingtransformedintochapters.Thisisthephasethatdevelopedtheformatthatisbroadlyrecognizabletoday.The1980ssawaconsistentriseinthelengthofthedocumentwiththeintroductionofnewchapters.By1990,thelengthoftheEconomicSurveyhadreachedcloseto250pagesincludingthestatisticalappendix.
The Indian economy went through a major crisis and subsequent reforms in 1991, and the Economic Survey of 1991-92waseagerlyawaited.Thiswas thefirstsurvey thatwasbroughtout in twovolumesalthough thefirstvolume was a short booklet of 27 pages that highlighted the macroeconomic problems facing the country while the secondvolumereviewedthevarioussectorsindetail.Insubsequentyears,thesurveyrevertedtoonevolumewithafewmodificationsinthenumberofchapters.Thebeginningofthe21stcenturysawanothertransformationoftheEconomicSurveywithintroductionofbettergraphicsandbrightercolors.Thelengthofthesurvey,meanwhile,crossed380pagesbytheearly2000s.
In 2007-08 and 2008-09, in themiddle of a global financial crisis, an analytical chapterwas added about thecountry’smedium-termchallengesandmacro-economicprospects.Fromhereonwards,morethematicchapterswere includedeachyear. In2011-12,documentwas485pagesspreadover thirteenchaptersand thestatisticalappendix. In 2013-14, the statistical appendix was separated out and published as a separate volume. In thefollowing year, the Survey was presented as two volumes: Volume 1 had a number of chapters addressing topical policyconcerns,whileVolume2carriedthetraditionalEconomicSurveyalongwiththestatisticalappendix.Thisformatwascontinuedtilllastyearwiththelengthofdocumentsteadilygoingup.Moreover,anattemptwasmadein the last three Surveys to ensure that the Volume 1 chapters adhered to a broad theme rather than appeared as stand-alonepapers.TheEconomicSurvey2020-21consistedof335pagesinVolume1,368pagesinVolume2anda statistical appendix of 174 pages - a total of 877 pages!
Asonecansee,theEconomicSurveyhasgonethroughagreatdealofevolutionoverthedecades.Thetwovolumeformat did allow space for bringing in new ideas and themes but, at almost 900 pages, it was also becoming unwieldy.ItwasalsofeltthatthethematicchaptersofVolume1werenotadequatelylinkedtothesectoralchaptersofVolume2.Therefore,thisyear’sSurveyrevertstoasinglevolumeplusaseparatevolumefortheStatisticalAppendix.Alongwiththesectoralchapters,anewchapterhasbeenaddedthatdemonstratestheuseofsatelliteandgeo-spatial images to gauge various economic phenomenon – urbanization, infrastructure, environmental impact, farmingpracticesandsoon.Theideaofhavingaseparatevolumeforthestatisticalappendixistogiveitadistinctidentityastheone-stopsourceofauthenticdata.Itishopedthatitwillevolveinthenextfewyearstoincludenewkindsofsocio-economicdatainlinewiththeemphasisonafeedbackloopapproach.
ThepublicationoftheEconomicSurveyisateameffort.ItisonlypossiblebecauseofinputsfromMinistriesandinstitutionsacrosstheGovernmentofIndia,industrybodies,think-tanksandindividualexperts.TheofficersandconsultantsoftheEconomicDivision,DepartmentofEconomicAffairs,putinmonthsofefforttowrite,compile,andedit thedocument.Doing it in themiddleof apandemicadded special constraints.Nonetheless,wehopethatthereaderswillfindthisyear’sdocumenttobealucidandinsightfulassessmentofthecountry’seconomictrajectory.
Sanjeev SanyalPrincipal Economic Adviser
Ministry of FinanceGovernment of India

xi
Cover Pages of previous Economic Surveys

xii
ABBREVIATIONS
AAI Airports Authority of India+A2:A24 ABDM Ayushman Bharat Digital Mission (erstwhile NDHMAB-HWCs Ayushman Bharat Health and Wellness CentresAB-PMJAY Ayushman Bharat Pradhan Mantri Jan Arogya YojanaABRY Atmanirbhar Bharat Rojgar YojanaACC Advance Chemistry Cell AE Advance Estimates AEOs Authorized Economic OperatorsAGR Adjusted Gross Revenue AIPA Apex Committee for the Implementation of Paris AgreementAISAM Air India Specific Alternative Mechanism AISATS Air India SATS (Singapore Airport Terminal Services) Airport Services Private LimitedAIXL Air India Express Ltd. AMI Agricultural Marketing InfrastructureANB Atma Nirbhar BharatAPEDA Agricultural & Processed Food Products Export Development AuthorityAPI Active Pharma Ingredients APMC Agricultural Produce Market CommitteeARHC Affordable Rental Housing ComplexesASEEM Aatmanirbhar Skilled Employees Employer MappingASER Annual Status of Education ReportASHA Accredited Social Health ActivistATMP Assembly, Testing, Marking and Packaging AUM Assets Under ManagementAWC Anganwadi CentreAWW Anganwadi WorkerAYUSH Ayurveda, Yoga and Naturopathy, Unani, Siddha and HomeopathyB&R Bridge and Roof Co. (India) LimitedB2B Business to BusinessBBBP Beti Bachao Beti PadhaoBCD Basic Custom DutyBCM Billion Cubic Meters BE Budget EstimateBEI Business Expectation Index BEML Bharat Earth Movers LimitedBFSI Banking Financial Services and InsuranceBG Bank Guarantees BISAG Bhaskaracharya National Institute of Space Applications and Geo Informatics, Gujarat BiSAG-N Bhaskaracharya National Institute for Space Applications and GeoinformaticsBoP Balance of PaymentsBPCL Bharat Petroleum Corporation LimitedBPKP Bharatiya Prakritik Krishi Paddhati ProgrammeBps basis points
xiii
BRR Business Responsibility ReportBRSR Business Responsibility and Sustainability ReportBS Bharat StageBSE Bombay Stock ExchangeBSNL Bharat Sanchar Nigam LimitedBUR Biennial Update ReportsCAAQMS Continuous Ambient Air Quality Monitoring StationsCAD Current Account Deficit CAF Customer Acquisition Forms CAP Cover and PlinthCAPEX Capital Expenditure CBIC Central Board of Indirect Taxes & CustomsCCAP Climate Change Action ProgramCCEA Cabinet Committee on Economic Affairs CDP Crop Diversification ProgrammeCDSL Central Depository Services LimitedCDRI Coalition for Disaster Resilient InfrastructureCECA Comprehensive Economic Cooperation Agreement CEL Central Electronics LimitedCEPA Comprehensive Economic Partnership AgreementCFPI Consumer Food Price IndexCGA Controller General of AccountsCGD City Gas Distribution Network CGF Clean Ganga FundCGST Central Goods and Service TaxCHC Custom Hiring CentreCIP Central Issue PriceCIP Compliance Information PortalCIS Competitiveness Incentive Support ckm circuit kilometer CNG Compressed Natural GasCO2 Carbon DioxideCoO Certificate of OriginCOP Conference of the PartiesCOVID 19 Coronavirus diseaseCoWIN Covid Vaccine Intelligence WorkCPHC Comprehensive Primary Health CareCPI-AL Consumer Price Index-Agricultural LabourersCPI-C Consumer Price Index-CombinedCPI-IW Consumer Price Index-Industrial WorkersCPI-RL Consumer Price Index-Rural LabourersCPO Crude Palm OilCPSE Central Public Sector EnterpriseCPSEs Central Public Sector Enterprises CRAR Capital to Risk-weighted Asset Ratio

xiv
CRR Cash Reserve RatioCSO Central Statistics OfficeCTDP Comprehensive Telecom Development PlanCTS Craftsman Training SchemeCU Capacity utilization CWC Central Warehousing CorporationDAC&FW Department of Agriculture Cooperation and Farmers WelfareDAISY Digitally Accessible Information SystemDAP Di-ammonium PhosphateDARE Department of Agricultural Research and EducationDAY-NRLM Deendayal Antyodaya Yojana – National Rural Livelihoods MissionDBT Direct Benefit TransferDBTL Direct Benefit Transfer for LPG consumersDCIL Dredging Corporation of India LimitedDCP: Decentralized ProcurementDDU- GKY Deen Dayal Upadhyaya Grameen Kaushalya YojanaDEPCs District Export Promotion Committees DFI Development Finance InstitutionDFI Doubling Farmers’ IncomeDFPD Department of Food & Public DistributionDIPAM Department of Investment and Public Asset ManagementDMI&SP Domestically Manufactured Iron and Steel Products DoP Department of PharmaceuticalsDPCO Drug Price Control OrderDPD Direct Port DeliveryDPIIT Department for Promotion of Industry and Internal TradeDTH Direct To HomeEBR Extra Budgetary ResourcesECB External Commercial BorrowingsECBs External Commercial Borrowings ECCE Early Childhood Care and EducationECGC Export Credit Guarantee Corporation of India Ltd. ECLGS Emergency Credit Line Guarantee SchemeECTS Electronic Cargo Tracking SystemEIC Export Inspection CouncilEMC Electronics Manufacturing Clusters EMDEs Emerging Markets and Developing EconomiesEME Emerging market economiese-NAM Electronic National Agriculture MarketENT Ear, Nose and ThroatEOUs Export Oriented UnitsEPABX Electronic Private Automatic Branch ExchangeEPCG Export Promotion Capital GoodsEPF Employees Provident FundEPFO Employees Provident Fund Organisation

xv
e-scrip Electronic ScripESDM Electronics System Design and Manufacturing ESG Environmental, Social and GovernanceESIC Employees’ State Insurance CorporationETC Electronic Toll CollectionEU European Union e-VIN Electronic Vaccine Intelligence NetworkEXIM Bank Export-Import Bank of India FAME Faster Adoption and Manufacturing of Hybrid and Electric vehicleFAO Food and Agriculture OrganisationFAR Floor area ratioFCI Food Corporation of IndiaFD Fiscal DeficitFDI Foreign Direct Investment FFS Fund of funds for StartupsFHTC Functional Household Tap ConnectionFIDF Fisheries and Aquaculture Infrastructure Development FundFIIs Foreign Investment InflowsFMD Foot and Mouth DiseaseFPI Foreign Portfolio Investment FPOs Farmers Producers OrganizationsFRL Fiscal Responsibility LegislationFRP Fair and Remunerative PriceFSI Floor Space IndexFTA Free Trade AgreementGB gigabyte GCA Gross Cropped AreaGCF Gross Capital FormationGDP Gross Domestic ProductGEC Green Energy Corridor GeM Government e-MarketplaceGER Gross Enrolment RatioGFR General Financial RulesGFCF Gross Fixed Capital FormationGGI –OSOWOG Green Grids Initiative-One Sun One World One GridGI Geographical IndicationGIM National Mission for a Green IndiaGIS Geographic Information System GNPA Gross Non Performing AssetsGP Gram PanchayatsGPIs Grossly Polluting IndustriesGSA Gram Swaraj AbhiyaanGSDP Gross State Domestic ProductG-Sec Government SecuritiesGSR General Statutory Rules

xvi
GST Goods and Services TaxGSTN Goods and Services Tax NetworkGSTR Goods and Services Tax ReturnGSVA Gross State Value AddedGT Gross tonnage GTR Gross Tax RevenueGVA Gross Value AddedGVC Global Value ChainGW Ground Water / GigawattHFIs High Frequency IndicatorsHFR Health Facility RegistryHMT Hindustan Machine ToolsHPCL Hindustan Petroleum Corporation LimitedHPI Housing Price IndexHPR Healthcare Professionals RegistryHSCC Hospital Services Consultancy Corporation LimitedHUDCO Housing and Urban Development Corporation LimitedHYVs High Yielding VarietiesIBC Insolvency and Bankruptcy CodeIBP Indo-Bangladesh Protocol ICAR Indian Council of Agricultural ResearchICDS Integrated Child Development ServicesICEDASH Indian Customs EDI DashboardICETRAK Indian Customs Enquiry for Trade Assistance and KnowledgeICI Index of Eight Core Industries ICMR Indian Council of Medical ResearchICP Integrated Check PostICU Intensive Care UnitICWF Indian Community Welfare FundIDBI Industrial Development Bank of IndiaIFS Integrated Farming SystemIFSC Indian Financial System CodeIGGL Indradhanush Gas Grid Limited IHMCL Indian Highways Management Company LimitedIIP Index of Industrial Production IIP International Investment PositionIISC India International Skill CentreIIT Indian Institutes of TechnologyIMC Inter-Ministerial Committee IMF International Monetary FundIMPS Immediate Payment ServiceIMR Infant Mortality RateINSPACe Indian National Space Promotion and Authorization CentreInvIT Infrastructure Investment trustIPA Indian Ports Association

xvii
IPOs Initial Public OfferingIPR Intellectual Property RightsIR Indian railways IRCTC Indian Railway Catering and Tourism CorporationIRIS Infrastructure for Resilient Island StatesISA International Solar AllianceIT/BPO Information Technology/Business Process OutsourcingITA International Tourist ArrivalsITAT Income Tax Appellate TribunalITBPM Information Technology- Business Process ManagementJHBDPL Jagdishpur-Haldia -Bokaro-Dhamra Gas Pipeline JSS Jan Shikshan SansthanKCC Kisan Credit CardKMS Kharif Marketing SeasonKRCL Konkan Railway Corporation Ltd. KSM Key Starting Materials KVK Krishi Vigyan KendraKW KilowattKYC Know Your Customers LAF Liquidity Adjustment FacilityLCS Land Customs StationsLDCs Least-Developed CountriesLeadIT Leadership Group for Industry TransitionLED Light Emitting DiodeLF License Fee LFPR Labour Force Participation RateLIC Life Insurance CorporationLIFE Lifestyle For EnvironmentLMT Lakh Metric TonneLMT Lakh Metric TonnesLPG Liquefied Petroleum GasLPG Liquified Petroleum GasLSA Licensed Service Areas LSB Long Span BridgesLTEO Long Term Ecological ObservationsMAI Market Access InitiativesMBS Mortgage-Backed SecuritiesMCF Million-Plus Cities Challenge FundMCLR Marginal Cost of Funds based Lending Rate MDGs Millennium Development GoalsMEIS Merchandise Exports from India schemeMFN Most Favoured NationMGNREGA/S Mahatma Gandhi National Rural Employment Guarantee Act / SchemeMIDH Mission for Integrated Development of HorticultureMIF Micro Irrigation Fund

xviii
MITEA Mega Integrated Textiles region and apparel park MIV2030 Maritime India Vision 2030 MLD Millions of liters per dayMMF Man Made Fiber MMT Million Metric TonneMoPNG Ministry of Petroleum and Natural GasMoSPI Ministry of Statistics and Programme ImplementationMoU Memorandum of UnderstandingMPC Monetary Policy CommitteeMPI Multidimensional Poverty IndexMoRTH Ministry of Road Transport and Highways of IndiaMRO Maintenance, Repair and Overhaul MRP Maximum Retail PriceMSE-CDP Micro Small Enterprises- Cluster Development Programme MSMEs Micro, Small and Medium Enterprises MSMEsMSP Minimum Support PriceMT Metric TonneMTFP Medium Term Fiscal PolicyMTNL Mahanagar Telephone Nigam LimitedMTOE Million Tonne of Oil EquivalentMTPA Million Tonnes Per AnnumMVA mega volt ampere MW MegawattNABARD National Bank for Agriculture and Rural DevelopmentNAFCC National Adaptation Fund on Climate ChangeNAPCC National Action Plan on Climate ChangeNAPS National Apprenticeship Promotion SchemeNARS National Agricultural Research SystemNASSCOM National Association of Software and Services CompaniesNBB National Bee BoardNBC Net Borrowing CeilingNBE National Board of ExaminationNBHM National Beekeeping and Honey MissionNBS Nutrient Based SubsidyNCAP National Carbonaceous Aerosols ProgrammeNCAP National Clean Air ProgrammeNCDEX National Commodity and Derivatives ExchangeNCERT National Council of Educational Research and TrainingNCEUS National Commission for Enterprises in Unorganized SectorNCIVE National Committee for the Integration of Vocational EducationNCLT National Company Law TribunalNCR National Capital RegionNDC Nationally Determined ContributionNDEAR National Digital Education ArchitectureNDRF National Disaster Response Fund

xix
NDS OM Negotiated Dealing System-Order MatchingNEER Nominal Effective Exchange Rate NEGVAC National Expert Group on Vaccine Administration for COVID-19NEIA National Export Insurance AccountNEP National Education PolicyNER North-Eastern RegionNERAMAC North Eastern Regional Agricultural Marketing Corporation Ltd.NFHS National Family Health SurveyNFSA National Food Security ActNFSM National Food Security MissionNGFS Network for Greening the Financial SystemNGO Non-Government OrganisationNGPEs Non-government/private entitiesNH National Highways NHA National Health AuthorityNHB National Housing BankNIF National Indicator FrameworkNIP National Infrastructure Pipeline NITI National Institution for Transforming IndiaNLMC National Land Monetisation CorporationNMCG National Mission for Clean GangaNMEEE National Mission for Enhanced Energy EfficiencyNMEO-OP National Mission on Edible Oils - Oil PalmNMP National Master PlanNMP National Monetisation PipelineNMP National Monetization Plan NMR Neonatal Mortality RateNMSH National Mission on Sustainable HabitatNMSKCC National Mission on Strategic Knowledge for Climate ChangeNNPA Net Non-Performing AssetsNOC No Objection CertificateNPCC National Projects Construction Corporation LimitedNPCL National Payments Corporation of IndiaNPE National Policy on Electronics NPPA National Pharmaceutical Pricing AuthorityNPS National Pension SchemeNPV Net Present Value NRI Non-Resident IndianNRI Non-Resident IndianNRM Natural Resource ManagementNRP National Rail Plan NSDC National Skill Development CorporationNSE National Stock Exchange of India LtdNSIL New Space India LimitedNSM National Solar Mission

xx
NSO National Statistical OfficeNSSF National Small Savings FundNSSO National Sample Survey OfficeNW National WaterwayNWM National Water MissionODF Open Defecation FreeODL Open Distance LearningODOP One District One ProductOEA Office of the Economic AdviserOECD Organisation for Economic Cooperation and DevelopmentOFC Optical Fiber Cable OFS Offer For SaleOMSS(D) Open Market Sale Scheme-DomesticOMSS Open Market Sale SchemeONORC One Nation One Ration CardOPD Out Patient DepartmentOPEC+ Organization of the Petroleum Exporting Countries and its alliesOSH & WC Occupational Safety, Health and Working ConditionsOSP Other Services ProvidersPA Provisional ActualsPAT Perform Achieve and TradePBBY Pravasi Bharatiya Bima YojanaPD Primary DeficitPDM Potash Derived from MolassesPDS Public Distribution SystemPE Provisional EstimatesPEG Private Entrepreneurs GuaranteePFMS Public Finance Management SystemPIB Press Information BureauPIBO Producer, Importer and Brand OwnerPIO Person of Indian OriginPKVY Paramparagat Krishi Vikas YojanaPLFS Periodic Labour Force SurveyPLI Production-Linked IncentivePM CARES Prime Minister’s Citizen Assistance and Relief in Emergency SituationsPM DAKSH Pradhan Mantri Dakshta Aur Kushalta Sampann Hitgrahi YojanaPM POSHAN Pradhan Mantri Poshan Shakti NirmanPM Particulate MatterPM-GKRA Pradhan Mantri Garib Kalyan Rojgar AbhiyaanPM-ABHIM PM-Ayushman Bharat Health Infrastructure MissionPM-ASBY Pradhan Mantri Atma Nirbhar Swasth Bharat YojanaPMAY Pradhan Mantri Awas YojanaPMEGP Prime Minister Employment Generation Programme PMFBY Pradhan Mantri Fasal Bima YojanaPM-FME Prime Minister-Formalisation of Micro Food Processing Enterprises

xxi
PMGKY Pradhan Mantri Garib Kalyan YojanaPMGSY Pradhan Mantri Gram Sadak YojanaPMI Purchasing Manager’s IndexPM-KISAN Pradhan Mantri Kisan Samman NidhiPMKK Pradhan Mantri Kaushal KendrasPMKSY Pradhan Mantri Kisan SAMPADA YojanaPMKSY-PDMC Pradhan Mantri Krishi Sinchayee Yojana – Per Drop More CropPM-KUSUM Pradhan Mantri Kisan Urja Suraksha evam Utthaan MahabhiyanPMKVY Pradhan Mantri Kaushal Vikas YojanaPMMSY Pradhan Mantri Matsya Sampad YojanaPMP Phase Manufacturing PlanPMRUs Price Monitoring and Resource UnitsPMSSY Pradhan Mantri Swasthya Suraksha YojanaPM-SYM Pradhan Mantri Shram Yogi Maan-DhanPMUY Pradhan Mantri Ujjwala YojanaPNGRB Petroleum and Natural Gas Regulatory Board POL Petroleum, Oil and LubricantsPoS Point of SalePOSHAN Prime Minister’s Overarching Scheme for Holistic NutritionPPE Personal Protective EquipmentPPP Public Private PartnershipPPPAC Public Private Partnership Appraisal Committee PPPs Public Private Partnerships PSE Public Sector Enterprise POSOCO Power System Operation Corporation Limited PSU Public Sector Undertaking PTA Preferential Trade AgreementPTD Price to DistributorPV PhotovoltaicQCBS Quality-cum-Cost Based SelectionQCO Quality Control Order QE Quantitative EasingQRR Quarterly Revenue Recovery R&D Research and DevelopmentRBA Reserve Bank of AustraliaRBI Reserve Bank of IndiaRCH Reproductive & Child HealthRCPLWEA Road Connectivity Project for Left Wing Extremism Affected AreasRD Revenue DeficitRDG Retail Direct GiltRE Revised EstimateREC Rural Electrification Corporation LimitedREER Real Effective Exchange RateRES renewable energy resource RFID Radio Frequency Identification

xxii
RKVY Rashtriya Krishi Vikas YojanaRMS Risk Management SystemROA Return on AssetsRoC Registrar of CompaniesRoDTEP Remission of Duties and Taxes on Exported ProductsROE Return on EquityRPL Recognition of Prior LearningRSETIs Rural Self Employment Training InstitutesRTE Right To EducationS&DT Special and Differential Treatment SACFA Standing Advisory Committee on Radio Frequency AllocationSAGY Sansad Adarsh Gram YojanaSAP State Advised PriceSAPCC State Action Plan on Climate ChangeSAS Situation Assessment SurveySATS Air India (AI) Singapore Airport Terminal Services SAUBHAGYA Pradhan Mantri Sahaj Bijli Har Ghar YojanaSBSTA Subsidiary Body for Scientific and Technological AdviceSCAMHP Standing Committee on Affordable Medicines and Health ProductsSDG Sustainable Development GoalsSDGs Sustainable Development GoalsSDMF State Disaster Mitigation FundSDR Special Drawing RightsSDRF State Disaster Response FundSDRMF State Disaster Risk Management FundSEZ Special Economic ZonesSFURTI Scheme of Fund for Regeneration of Traditional Industries SH State-Highways SHGs Self Help GroupsSIAM Society of Indian Automobile ManufacturersSIDS Small Island Developing StatesSISFS Startup India Seed Fund SchemeSLDE Secured Logistics Document ExchangeSoP Standard Operating ProcedureSPECS Scheme for Promotion of Manufacturing of Electronic Components and Semiconductors SPSE State Public Sector EnterpriseSPV Special Purpose VehicleSRS Sample Registration Based SystemSSAP State Specific Action PlanSTL Seasonal-Trend Decomposition Procedure based on LoessSTT Securities Transaction TaxSTT Short Term TrainingSUC Spectrum Usage Charge SWC State-Warehousing CorporationTCS Tax Collected at Source

xxiii
TDS Tax Deducted at SourceTFR Total Fertility RateTHDC Tehri Hydro Development Corporation LimitedTIES Trade Infrastructure for Export SchemeTLTRO Targeted Long Term Repo OperationsTMA Transport and Marketing AssistanceTMA Tractor and Mechanization AssociationTOP Tomato, Onion and PotatoTPDS Targeted Public Distribution SystemTRIPS Trade-Related Aspects of Intellectual Property RightsTRT Turnaround TimeTSP Telecom Service Providers U5MR Under five Mortality RateUAN Universal Account NumberUDISE Unified District Information System for EducationUED Union Excise DutiesUK United KingdomUPI Unified Payments InterfaceULB Urban Local BodiesUNCITRAL United Nations Commission on International Trade LawUNESCAP United Nations Economic and Social Commission for Asia PacificUNFCCC United Nations Framework Convention on Climate ChangeUR Udyam Registration UR Unemployment RateUSA United States of AmericaUSD United States DollarUT Union TerritoryUW Unorganised WorkersVAP Village Action PlanVAT Value Added TaxVGF Viability Gap Funding VIX Volatility IndexVRRR Variable Rate Reverse RepoVWSC Village Water & Sanitation CommitteeWACR Weighted Average Call rateWALR Weighted Average Lending RateWATDR Weighted Average Domestic Term Deposit RateWEO World Economic OutlookWHO World Health OrganisationWPI Wholesale Price IndexWPR Worker Population RatioWSA World Steel Association WTO World Trade OrganizationXV-FC Fifteenth Finance CommissionYoY Year on Year


CHAPTER
01
The last two years have been difficult for the world economy on account of the COVID-19 pandemic. Repeated waves of infection, supply-chain disruptions and, more recently, inflation have created particularly challenging times for policy-making. Faced with these challenges, the Government of India’s immediate response was a bouquet of safety-nets to cushion the impact on vulnerable sections of society and the business sector. It next pushed through a significant increase in capital expenditure on infrastructure to build back medium-term demand as well as aggressively implemented supply-side measures to prepare the economy for a sustained long-term expansion. This chapter explains how this flexible and multi-layered approach is partly based on an “Agile” framework that uses feedback-loops, and the monitoring of real-time data.
Advance estimates suggest that the Indian economy is expected to witness real GDP expansion of 9.2 per cent in 2021-22 after contracting in 2020-21. This implies that overall economic activity has recovered past the pre-pandemic levels. Almost all indicators show that the economic impact of the “second wave” in Q1 was much smaller than that experienced during the full lockdown phase in 2020-21 even though the health impact was more severe.
Agriculture and allied sectors have been the least impacted by the pandemic and the sector is expected to grow by 3.9 per cent in 2021-22 after growing 3.6 per cent in the previous year. Advance estimates suggest that the GVA of Industry (including mining and construction) will rise by 11.8 per cent in 2021-22 after contracting by 7 per cent in 2020-21. The Services sector has been the hardest hit by the pandemic, especially segments that involve human contact. This sector is estimated to grow by 8.2 per cent this financial year following last year’s 8.4 per cent contraction.
Total Consumption is estimated to have grown by 7.0 per cent in 2021-22 with significant contributions from government spending. Similarly, Gross Fixed Capital Formation exceeded pre-pandemic levels on the back of ramped up public expenditure on infrastructure. Exports of both goods and services have been exceptionally strong so far in 2021-22, but imports also recovered strongly with recovery in domestic demand as well as higher international commodity prices.
State of the Economy

2 Economic Survey 2021-22
With the vaccination programme having covered the bulk of the population, economic momentum building back and the likely long-term benefits of supply-side reforms in the pipeline, the Indian economy is in a good position to witness GDP growth of 8.0-8.5 per cent in 2022-23.
Nonetheless, the global environment still remains uncertain. At the time of writing, a new wave in the form of the Omicron variant was sweeping across the world, inflation had jumped up in most countries, and the cycle of liquidity withdrawal was being initiated by major central banks. This is why it is especially important to look at India’s macro-economic stability indicators and their ability to provide a buffer against the above stresses.
Despite all the disruptions caused by the global pandemic, India’s balance of payments remained in surplus throughout the last two years. This allowed the Reserve Bank of India to keep accumulating foreign exchange reserves (they stood at US$ 634 billion on 31st December 2021). This is equivalent to 13.2 months of merchandise imports and is higher than the country’s external debt. The combination of high foreign exchange reserves, sustained foreign direct investment, and rising export earnings will provide an adequate buffer against possible global liquidity tapering in 2022-23.
The fiscal support given to the economy as well as to the health response caused the fiscal deficit and government debt to rise in 2020-21. However, a strong rebound in government revenues in 2021-22 has meant that the Government will comfortably meet its targets for the year while maintaining the support, and ramping up capital expenditure. The strong revival in revenues (revenue receipts were up over 67 per cent YoY in April-November 2021) means that the Government has fiscal space to provide additional support if necessary.
The financial system is always a possible area of stress during turbulent times. However, India’s capital markets, like many global markets, have done exceptionally well and have allowed record mobilization of risk capital for Indian companies. More significantly, the banking system is well capitalized and the overhang of Non-Performing Assets seem to have structurally declined even allowing for some lagged impact of the pandemic.
Vaccination is not merely a health response but is critical for opening up the economy, particularly contact-intensive services. Therefore, it should be treated for now as a macro-economic indicator. Over the course of a year, India delivered 157 crore doses that covered 91 crore people with at least one dose and 66 crore with both doses. The vaccination process for boosters and for the 15-18 year age group was also gathering pace at the time of writing.
Inflation has reappeared as a global issue in both advanced and emerging economies. India’s Consumer Price Index inflation stood at 5.6 per cent YoY in December 2021 which is within the targeted tolerance band. Wholesale price inflation, however, has been running in double-digits. Although this is partly due to base effects that will even out,

3State of the Economy
India does need to be wary of imported inflation, especially from elevated global energy prices.
Overall, macro-economic stability indicators suggest that the Indian economy is well placed to take on the challenges of 2022-23. One of the reasons that the Indian economy is in a good position is its unique response strategy. Rather than pre-commit to a rigid response, Government of India opted to use safety-nets for vulnerable sections on one hand while responding iteratively based on Bayesian-updating of information. This “barbell strategy” was discussed in last year’s Economic Survey. A key enabler of this flexible, iterative “Agile” approach is the use of eighty High Frequency Indicators (HFIs) in an environment of extreme uncertainty.
Another distinguishing feature of India’s response has been an emphasis on supply-side reforms rather than a total reliance on demand management. These supply-side reforms include deregulation of numerous sectors, simplification of processes, removal of legacy issues like ‘retrospective tax’, privatisation, production-linked incentives and so on. These have been discussed in detail in the respective chapters. Even the sharp increase in capital spending by the Government can be seen both as demand and supply enhancing response as it creates infrastructure capacity for future growth. This year’s Survey particularly highlights the importance of process reforms in a number of sectors while Chapter 11 provides a brief demonstration of the use of satellite images and geo-spatial data, both recently deregulated sectors, for gauging economic development.
INTRODUCTION1.1 Two years into the COVID-19 pandemic, the global economy continues to be plagued by uncertainty, with resurgent waves of mutant variants, supply-chain disruptions, and a return of inflation in both advanced and emerging economies. Moreover, the likely withdrawal of liquidity by major central banks over the next year may also make global capital flows more volatile. In this context, it is important to evaluate both the pace of growth revival in India as well as the strength of macro-economic stability indicators. It is also essential to look at progress in vaccination as this is not just a health response but also a buffer against economic disruptions caused by repeated waves of the pandemic.
Economy recovers past Pre-Pandemic levels1.2 The Indian economy, as seen in quarterly estimates of GDP, has been staging a sustained recovery since the second half of 2020-21. Although the second wave of the pandemic in April-June 2021 was more severe from a health perspective, the economic impact was muted compared to the national lockdown of the previous year (see Figures 1 & 2). Advance estimates suggest that GDP will record an expansion of 9.2 per cent in 2021-22. This implies that the level of real economic output will surpass the pre-COVID level of 2019-20.

4 Economic Survey 2021-22
Figure 1: Gross Domestic Output (Constant Prices, Base Year:2011-12)
25
28
31
34
37
40
Q1 Q2 Q3 Q4 Q1 Q2 Q3 Q4 Q1 Q2
2019-20 2020-21 2021-22
₹ L
akh
Cro
re
GDP GVA
1st L
ockd
own
2nd
Wav
e
110
115
120
125
130
135
140
145
150
2018-19 2019-20 2020-21(PE)
2021-22(AE)
₹ L
akh
Cro
re
GDP GVAGDP Pre-Pandemic Level
GVA Pre-Pandemic Level
Source: National Accounts Statistics (NSO), MoSPI
Figure 2: Waves of COVID-19
0%
5%
10%
15%
20%
25%
0
1
2
3
4
5
15/04/20
25/05/20
04/07/20
13/08/20
22/09/20
01/11/20
11/12/20
20/01/21
01/03/21
10/04/21
20/05/21
29/06/21
08/08/21
17/09/21
27/10/21
06/12/21
15/01/22
Lakh
Daily New CasesPositivity rate (7 DMA, RHS)
Second Wave
4x
First Wave
Source: Data accessed from Ministry of Health and Family Welfare (MoH&FW) Note: DMA stands for Daily Moving Average
SECTORAL TRENDS1.3 Not surprisingly, the agricultural sector was the least impacted by the pandemic-related disruptions (Figure 3). It is estimated to grow 3.9 per cent in 2021-22 on top of 3.6 per cent and 4.3 per cent respectively in the previous two years (Table 1). This sector now accounts for 18.8 per cent of GVA.
Table 1: Annual Growth of GVA at constant (2011-12) prices (per cent)
Sectors 2019-20 (1st RE)
2020-21 (PE)
2021-22 (1st AE)
Recovery over 2019-20
Agriculture & Allied Sectors 4.3 3.6 3.9 107.7
Industry -1.2 -7.0 11.8 104.1
Mining & quarrying -2.5 -8.5 14.3 104.6

5State of the Economy
Manufacturing -2.4 -7.2 12.5 104.4
Electricity, gas, water supply & other utility services
2.1 1.9 8.5 110.5
Construction 1.0 -8.6 10.7 101.2
Services 7.2 -8.4 8.2 99.2
Trade, hotels, transport, communication and services related to broadcasting
6.4 -18.2 11.9 91.5
Financial, real estate & professional services
7.3 -1.5 4.0 102.5
Public administration, defence and Other Services
8.3 -4.6 10.7 105.6
GVA at basic price 4.1 -6.2 8.6 101.9Source: NSO Note: RE - Revised Estimates, PE - Provisional Estimates, AE - Advance Estimates
1.4 As shown in Figures 5 and 6 below, the area sown under Kharif and Rabi crops, and the production of wheat and rice has been steadily increasing over the years. In line with the longer term trend, the area sown in the Kharif cycle of 2021-22 was again higher than in the previous year (the Rabi cycle data was incomplete at the time of writing). In the current year, food grains production for the Kharif season is estimated to post a record level of 150.5 million tonnes. Procurement of food grains under the central pool accordingly maintained its rising trend in 2021-22 along with minimum support prices, which augur well for national food security and farmers’ incomes. Importantly, the strong performance of the sector was supported by Government policies that ensured timely supplies of seed and fertilizers despite pandemic related disruptions. It was also helped by good monsoon rains as reflected in reservoir levels being higher than the 10-year average (Figure 4).
Figure 3: Real GVA of Agriculture & Allied Sectors
Figure 4: Reservoir Levels
0
20
40
60
80
100
Jan/
19
Jun/
19
Nov
/19
Apr
/20
Sep/
20
Feb/
21
Jul/2
1
Dec
/21
Per
cent
of F
RL
Current live storage Last 10 years average
Source: NSO, Central Water CommissionNote: FRL stands for Full Reservoir Level

6 Economic Survey 2021-22
Figure 5: Area Sown under Foodgrains Figure 6: Production of Wheat and Rice
537
586601
538
700 700732 743
2018-19
2019-20
2020-21
2021-22*
2018-19
2019-20
2020-21
2021-22
Rabi Kharif
Lak
h H
ecta
res
800
900
1000
1100
1200
1300
2014
-15
2015
-16
2016
-17
2017
-18
2018
-19
2019
-20
2020
-21
Lak
h H
ecta
re
Wheat Production Paddy Production
Source: M/o Agriculture & Farmers Welfare; *till 31st December 2021
1.5 In contrast to the steady performance of the primary sector, the industrial sector went through a big swing by first contracting by 7 per cent in 2020-21 and then expanding by 11.8 per cent in this financial year. The manufacturing, construction and mining sub-sectors went through the same swing although the utilities segment experienced a more muted cycle as basic services such as electricity and water supply were maintained even at the height of the national lockdown. The share of industry in GVA is now estimated at 28.2 per cent (Table 2).
Table 2: Share of Sectors in Nominal GVA (per cent)
Sectors 2019-20 (1st RE)
2020-21 (PE)
2021-22 (1st AE)
Agriculture & Allied Sectors 18.4 20.2 18.8
Industry 26.7 25.9 28.2
Mining & quarrying 1.9 1.6 2.3
Manufacturing 14.7 14.4 15.4
Electricity, gas, water supply & other utility services
2.6 2.7 2.5
Construction 7.4 7.2 8.0
Services 55.0 53.9 53.0
Trade, hotels, transport, communication and services related to broadcasting
18.9 16.4 16.9
Financial, real estate & professional services
21.2 22.1 20.9
Public administration, defence and Other Services
14.9 15.4 15.2
GVA at basic price 100.0 100.0 100.0Source: NSONote: RE: Revised Estimates, PE: Provisional Estimates, AE: Advance Estimates

7State of the Economy
1.6 Since January 2021, the widely used Purchasing Managers’ Index-Manufacturing has remained in the expansionary zone (i.e. over 50) except for one month when the second wave had slowed down economic activity (Figure 8). The Index of Industrial Production (IIP) and Core Industry indices have both followed a similar pattern and, in November 2021, went past their pre-pandemic level for the corresponding month in 2019 (Figure 7).
Figure 7: Industrial Output Figure 8: PMI Manufacturing
50
70
90
110
130
150
170
Feb/
19
May
/19
Aug
/19
Nov
/19
Feb/
20
May
/20
Aug
/20
Nov
/20
Feb/
21
May
/21
Aug
/21
Nov
/21
Inde
x
8-Core Industries IIP General Index1s
t Loc
kdow
n
2nd
Wav
e
25
35
45
55
65
Jan/19
Jun/19
Nov/19
Apr/20
Sep/20
Feb/21
Jul/21
Dec/21
Inde
x 1stL
ockd
own
2nd
Wav
e
Source: MoSPI, DPIIT Source: IHS Markit
1.7 Rising capital expenditure by the government on infrastructure and an uptick in the housing cycle have been responsible for reviving the construction sector. This has allowed the consumption and production of steel and cement consumption to revert to pre-COVID levels (Figure 9). Statistics provided by RBI and leading real estate companies’ show significant revival in the Indian residential real market in 2021 in terms of growth in sales, prices and new launches (Figure 10 and 11).
Figure 9: Construction Sector Indicators
0
20
40
60
80
100
120
140
Feb/
20
Apr
/20
Jun/
20
Aug
/20
Oct
/20
Dec
/20
Feb/
21
Apr
/21
Jun/
21
Aug
/21
Oct
/21
Dec
/21
Inde
x (F
eb 2
020
= 10
0)
Cement Production Steel Consumption
Source: Joint Plant Committee; and O/o Economic Advisor, DPIIT

8 Economic Survey 2021-22
Figure 10: Housing Sales and New Launches in Top 8 Cities
Figure 11: RBI Housing Price Index: All India
0
20
40
60
80
100
Q2 Q3 Q4 Q1 Q2 Q3 Q4 Q1 Q2 Q3
2019-20 2020-21 2021-22
Thousand
Sales Launches
260
265
270
275
280
285
290
Q1.2018-19
Q2.2018-19
Q3.2018-19
Q4.2018-19
Q1.2019-20
Q2.2019-20
Q3.2019-20
Q4.2019-20
Q1.2020-21
Q2.2020-21
Q3.2020-21
Q4.2020-21
Q1.2021-22
Q2.2021-22(P)
Index
Source: Anarock, Proptiger, RBI*Top 8 cities include: Ahmedabad, Benguluru, Chennai, Delhi NCR, Hyderabad, Kolkata, Mumbai, Pune
1.8 Services account for more than half of the Indian economy and was the most impacted by the COVID-19 related restrictions, especially for activities that need human contact. Although the overall sector first contracted by 8.4 per cent in 2020-21 and then is estimated to grow by 8.2 per cent in 2021-22, it should be noted that there is a wide dispersion of performance by different sub-sectors. Both the Finance/Real Estate and the Public Administration segments are now well above pre-COVID levels. However, segments like Travel, Trade and Hotels are yet to fully recover. It should be added that the stop-start nature of repeated pandemic waves makes it especially difficult for these sub-sectors to gather momentum.
1.9 Despite contact-sensitive services still being impacted by COVID, there has been a strong recovery of the Purchasing Managers’ Index-Services since August 2021 (Figure 13). In this context, it is important to note the role of new forms of High Frequency Indicators to gauge real-time trends. For example, the Google mobility indicators for retail and recreation (i.e., restaurants, cafes, shopping centres, etc.) and transit stations (public transport hubs such as subway, bus, and train stations), measuring percentage deviation from pre-pandemic levels of mobility, has exceeded pre-pandemic levels in December 2021 before the Omicron wave again led to restrictions (Figure 12). Similarly, the hotel occupancy rate has recovered substantially, reaching 56-58 per cent in October 2021, from 30-32 per cent in April 2021 (Figure 14).
Figure 12: Trends in Mobility
-90
-70
-50
-30
-10
10
Feb/
20
Mar
/20
Apr
/20
May
/20
Jun/
20
Jul/2
0
Aug
/20
Sep/
20
Oct
/20
Nov
/20
Dec
/20
Jan/
21
Feb/
21
Mar
/21
Apr
/21
May
/21
Jun/
21
Jul/2
1
Aug
/21
Sep/
21
Oct
/21
Nov
/21
Dec
/21
% D
evia
tion
from
bas
elin
e
Retail and Recreation Transit Stations
1st L
ockd
own
2nd
Wav
e
Source: Google Mobility Note: Baseline corresponds to Jan-Feb 2020 Level

9State of the Economy
Figure 13: PMI Services Figure 14: Hotel Occupancy Rate
0
10
20
30
40
50
60Jan/19
Jun/19
Nov/19
Apr/20
Sep/20
Feb/21
Jul/21
Dec/21
Inde
x
1st L
ockd
own
2nd
Wav
e0
20
40
60
80
Jan/20
Apr/20
Jul/20
Oct/20
Jan/21
Apr/21
Jul/21
Oct/21
Per
cent 1st L
ockd
own
2nd
Wav
e
Source: IHS Markit, Anarock
1.10 In contrast to contact-based services, distance-enabled services have increased their share with the growing preference for remote interfaces for office work, education and even medical services. Indeed, there has been a boom in software and IT-enabled services exports even as earnings from tourism have declined sharply (see Figures 15 & 16).
Figure 15: Quarterly Trend in Services Exports
Figure 16: Real GVA of Distance Enabled services
0
10
20
30
40
50
60
70
Mar
/19
Jun/
19
Sep/
19
Dec
/19
Mar
/20
Jun/
20
Sep/
20
Dec
/20
Mar
/21
Jun/
21
Sep/
21
US$
Bill
ion
Total Services ExportsTravelTelecom, Computer, & Information Services
6.2 6.3
7.6 7.8
6.6 6.6
7.98.5
Q3 Q4 Q1 Q2 Q3 Q4 Q1 Q2
2019-20 2020-21 2021-22
₹ La
kh C
rore
Financial, real estate & professional services
Source: RBI, NSO
DEMAND TRENDS1.11 Latest advance estimates suggest full recovery of all components on the demand side in 2021-22 except for private consumption. When compared to pre-pandemic levels, recovery is most significant in exports followed by government consumption and gross fixed capital formation. However, an equally strong recovery was seen in imports (Table 3 and Table 4).

10 Economic Survey 2021-22
Table 3: Annual Real growth in demand side of GDP and its components (per cent)
Components 2019-20 (1st RE)
2020-21 (PE)
2021-22 (1st AE)
Recovery over 2019-20
Total Consumption 5.9 -7.3 7.0 99.2
Government Consumption 7.9 2.9 7.6 110.7
Private Consumption 5.5 -9.1 6.9 97.1
Gross Fixed Capital Formation 5.4 -10.8 15.0 102.6
Exports -3.3 -4.7 16.5 111.1
Imports -0.8 -13.6 29.4 111.8
GDP 4.0 -7.3 9.2 101.3Source: NSONote: RE - Revised Estimates, PE - Provisional Estimates, AE - Advance Estimates
Table 4: Share of Sectors in Nominal GDP (per cent)
Sectors 2019-20 (1st RE)
2020-21 (PE)
2021-22 (1st AE)
Total Consumption 71.7 71.1 69.7
Government Consumption 11.2 12.5 12.2
Private Consumption 60.5 58.6 57.5
Gross Fixed Capital Formation 28.8 27.1 29.6
Net Export -2.5 -0.5 -3.0
Exports 18.4 18.7 20.1
Imports 21.0 19.2 23.1
GDP 100.0 100.0 100.0Source: NSONote: RE: Revised Estimates, PE: Provisional Estimates, AE: Advance Estimates
Consumption 1.12 Total consumption is estimated to have grown by 7.0 per cent in 2021-22 with government consumption remaining the biggest contributor as in the previous year (Table 3). Government consumption is estimated to grow by a strong 7.6 per cent surpassing pre-pandemic levels. Private consumption is also estimated to have improved significantly to recover 97 per cent of corresponding pre-pandemic output level. This is supported by a sharp rebound in HFIs like IIP Consumer Durables (Figure 17). However, the recent dip in vehicle registrations reflects persistent supply-side constraints owing to the shortage of semi-conductor chips rather than lack of consumption demand. This is illustrated in Box 2 on global supply-side disruptions. Further, RBI’s consumer confidence survey results on both the present situation and future expectations suggest sustained uptick in consumer sentiments (Figure 18). Also indicative of uptick in consumer sentiments is the steep rise in digital transactions, notably in UPI payments owing to the pandemic induced shift to contactless payments. Private consumption is poised to see stronger recovery with rapid coverage in vaccination and faster normalisation of economic activity.

11State of the Economy
Figure 17: IIP Consumer Durables Index Figure 18: RBI’s Consumer Confidence Index
0
20
40
60
80
100
120
140
160
Jan Feb Mar Apr May Jun Jul Aug Sep Oct Nov
2019 2020 2021
40
60
80
100
120
140
Jan/
20
Mar
/20
May
/20
Jul/2
0
Sep/
20
Nov
/20
Jan/
21
Mar
/21
May
/21
Jul/2
1
Sep/
21
Nov
/21
Current Situation Future Expectations
Source: O/o Economic Advisor, DPIIT Source: RBI
Investment1.13 Investment, as measured by Gross Fixed Capital Formation (GFCF) is expected to see strong growth of 15 per cent in 2021-22 and achieve full recovery of pre-pandemic level. Government’s policy thrust on quickening virtuous cycle of growth via capex and infrastructure spending has increased capital formation in the economy lifting the investment to GDP ratio to about 29.6 per cent in 2021-22, the highest in seven years (Figure 19).
Figure 19: Gross Fixed Capital Formation (GFCF)
0
5
10
15
20
25
30
35
0
2
4
6
8
10
12
14
16
Q1 Q2 Q3 Q4 Q1 Q2 Q3 Q4 Q1 Q2
2019-20 2020-21 2021-22
per c
ent
₹ la
kh c
rore
GFCF GFCF share in GDP (RHS)
Source: NSO, MoSPI Note: Absolute figures at constant (2011-12) prices, shares as per current prices
1.14 While private investment recovery is still at a nascent stage, there are many signals which indicate that India is poised for stronger investment. The number of private investment projects under implementation in manufacturing sector has been rising over the years (Figure 20). Companies hitting record profits in recent quarters and mobilization of risk capital bode well for acceleration in private investment (Figure 21). A sturdy and cleaned-up banking sector stands ready to support private investment adequately. Expected increase in private consumption levels will propel capacity utilisation, thereby fuelling private investment activity. RBI’s latest Industrial Outlook Survey results indicate rising optimism of investors and expansion in production in the upcoming quarters.

12 Economic Survey 2021-22
Figure 20: Investor Sentiment in Manufacturing
Figure 21: Non-Financial Sector Profitability Ratios
0
10
20
30
40
50
60
70
80
10
12
14
16
18
20
22
Mar
/19
Jun/
19
Sep/
19
Dec
/19
Mar
/20
Jun/
20
Sep/
20
Dec
/20
Mar
/21
Jun/
21
Sep/
21
Dec
/21
Per
cen
t
Hun
dred
s
Investment Projects Under-ImplementationNet Response Next Quarter (RHS)
0
1
2
3
4
5
6
5
7
9
11
13
15
17
19
21
Mar
/19
Jun/
19
Sep/
19
Dec
/19
Mar
/20
Jun/
20
Sep/
20
Dec
/20
Mar
/21
Jun/
21
Sep/
21
Per
cen
t
Per
cen
t
Operating Profit RatioInterest Cover (RHS)
Source: CMIE Capex Database, RBI Industrial Outlook Survey, Prowess Database
Exports and Imports1.15 India’s exports of both goods and services have been exceptionally strong so far in 2021-22. Merchandise exports have been above US$ 30 billion for eight consecutive months in 2021-22, despite a rise in trade costs arising from global supply constraints such as fewer operational shipping vessels, exogenous events such as blockage of Suez Canal and COVID-19 outbreak in port city of China etc. (Figure 22). Concurrently, net services exports have also risen sharply, driven by professional and management consulting services, audio visual and related services, freight transport services, telecommunications, computer and information services (Figure 23). From a demand perspective, India’s total exports are expected to grow by 16.5 per cent in 2021-22 surpassing pre-pandemic levels. Imports also recovered strongly with revival of domestic demand and continuous rise in price of imported crude and metals. Imports are expected to grow by 29.4 per cent in 2021-22 surpassing corresponding pre-pandemic levels.
1.16 Resultantly, India’s net exports have turned negative in the first half of 2021-22, compared to a surplus in the corresponding period of 2020-21 with current account recording a modest deficit of 0.2 per cent of GDP in the first half (Figure 24). However, robust capital flows in the form of continued inflow of foreign investment were sufficient to finance the modest current account deficit. Elevated global commodity prices, revival in real economic activity driving higher domestic demand and growing uncertainty surrounding capital inflows may widen current account deficit further during the second half of the year. However, it is expected to be within manageable limits.

13State of the Economy
Figure 22: Merchandise Trade
-30
-10
10
30
50
70
Apr
/19
Jun/
19
Aug
/19
Oct
/19
Dec
/19
Feb/
20
Apr
/20
Jun/
20
Aug
/20
Oct
/20
Dec
/20
Feb/
21
Apr
/21
Jun/
21
Aug
/21
Oct
/21
Dec
/21
US$
Bill
ion
Merchandise trade balance (RHS) Exports Imports
Source: M/o Commerce and Industry
Figure 23: India's International Trade in Services, Net
6
7
8
9
10
Jan-19 Jun-19 Nov-19 Apr-20 Sep-20 Feb-21 Jul-21 Dec-21
US$
Bill
ion
Source: RBI
Figure 24: India's Current Account Balance
-4-3-2-1012345
-25-20-15-10-505
10152025
Q1 Q2 Q3 Q4 Q1 Q2 Q3 Q4 Q1 Q2 Q3 Q4 Q1 Q2
2018-19 2019-20 2020-21 2021-22
per c
ent
USD
bill
ion
Current Account Balance(CAB)
CAB as % of GDP (RHS)
Source: RBI

14 Economic Survey 2021-22
BARBELL STRATEGY, SAFTEY NETS & AGILE RESPONSE1.17 The last two years have been particularly challenging for policy-making around the world with repeated waves from a mutating virus, travel restrictions, supply-chain disruptions and, more recently, global inflation. Faced with all this uncertainty, the Government of India opted for a “Barbell Strategy” that combined a bouquet of safety-nets to cushion the impact on vulnerable sections of society/business, with a flexible policy response based on a Bayesian updating of information. As explained in last year’s Economic Survey, this is a common strategy used in financial markets to deal with extreme uncertainty by combining two seemingly disparate legs. As some readers will have guessed, the iterative leg of this strategy is the same as the “Agile” approach that uses feedback-loops, and real-time adjustment.
1.18 The Agile approach is a well-established intellectual framework that is increasingly used in fields like project management and technology development. In an uncertain environment, the Agile framework responds by assessing outcomes in short iterations and constantly adjusting incrementally. It is important here to distinguish Agile from the “Waterfall” framework which has been the conventional method for framing policy in India and most of the world. The Waterfall approach entails a detailed, initial assessment of the problem followed by a rigid up-front plan for implementation. This methodology works on the premise that all requirements can be understood at the beginning and therefore pre-commits to a certain path of action. This is the thinking reflected in five-year economic plans, and rigid urban master-plans.
1.19 While some form of feedback-loop based policy-making was always possible, it is particularly effective at a time when we have wealth of real-time data. Over the last two years, Government leveraged a host of High Frequency Indicators (HFIs) both from government departments/agencies as well as private institutions that enabled constant monitoring and iterative adaptations. Such information includes GST collections, power consumption, mobility indicators, digital payments, satellite photographs, cargo movements, highway toll collections, and so on. These HFIs helped policy makers tailor their responses to an evolving situation rather than rely on pre-defined responses of a Waterfall framework.
1.20 Notice that the flexibility of Agile improves responsiveness and aids evolution, but it does not attempt to predict future outcomes. This is why the other leg of the Barbell strategy is also needed. It cushions for unpredictable negative outcomes by providing safety nets. This explains why the Government’s initial measures in 2020-21 were mostly about making food available to the poor, providing emergency liquidity support for MSMEs and holding the Insolvency and Bankruptcy Code in abeyance. Once these were in place, the Government made its way forward by regularly announcing packages targeted at specific challenges. Contrast this with the approach adopted by many other countries pre-committing to a particular response path. The following discussion provides an overview of the safety-net measures used to cushion the economy, while Chapter 2 provides a detailed analysis of how the fiscal mix changed over time towards supporting demand through capital expenditure and the supply-side through measures like production linked incentives. In line with Agile approach, this mix can be changed again as per the requirements of an evolving situation.
Safety Nets used to Cushion Vulnerable Sections1.21 The recognition of extreme uncertainty associated with a ‘once-in-a-century’ pandemic meant that the Government opted for a careful mix of emergency support and economic policy

15State of the Economy
actions to provide a cushion against pandemic induced shocks while flexibly adapting to an evolving situation.
1.22 In early 2020, when the first wave of the pandemic was making its way around the world, the Government focused on saving lives through emergency policy actions. The first among these actions was the imposition of a stringent lockdown in March 2020 when cases were still few. This provided the necessary time to ramp up testing infrastructure, create quarantine facilities and so on. Most importantly, it gave time to understand the COVID-19 virus, its symptoms and how it spread.
1.23 The government recognised that lockdowns and quarantines disrupt economic activity. Therefore, it quickly put in place economic safety nets comprised of world’s largest free food program, direct cash transfers and relief measures for small businesses (details in Table 5). The Reserve Bank of India simultaneously provided monetary support to the economy. Many of these safety net provisions continued during the second wave and have been extended further as appropriate. This was combined with a rapid ramp-up of the vaccination programme as discussed later in the chapter.
Table 5: Key Safety Net Measures to Prevent Distress during COVID-19
Cash Transfers
`500/month for 3 months to women Jan Dhan Account holders
l `30,944 crore released to 20.64 crore women beneficiaries
`1000 to vulnerable sections (widows, Divyangs, elderly)
l `2814 crore released covering 2.82 crore beneficiaries
Pradhan Mantri Kisan Samman Nidhi (PM-KISAN)- `6000/- per year in three instalments
l ` 1.8 lakh crore transferred to more than 10 crore farmer families as on 1.1.2022, since Feb 2019, i.e., 6 instalments since COVID-19
Food Security
Pradhan Mantri Garib Kalyan Anna Yojana - Additional free-of-cost food grains to 80 Crore National Food Security Act (NFSA) beneficiaries @ 5 Kg per person per month, over and above the regular monthly NFSA foodgrains
l
l
Launched in March 2020, extended till March 2022 under Phase-VFrom Mar-2020 to Nov-2021, 600 LMT foodgrains allocated to States/UTs equivalent to ` 2.07 Lakh Crore in food subsidy
One Nation One Ration Card to ensure PDS benefit for people in transit, especially migrant workers.
l Enabled in 34 States/UTs by August 2021 covering 94.3 per cent National Food Security Act population
l 24.32 crore portability transactions carried out between 1.4.2020 and 30.9.2021
Cooking gas cylinders under Ujjawala
l 3 free cylinders to 8 crore beneficiaries for April to June 2020.
l First refill and hotplate free under Ujjwala 2.0 (launched 10.8.2021) with simpler procedures

16 Economic Survey 2021-22
Employment
Pradhan Mantri Garib Kalyan Rojgar Abhiyaan (PM-GKRA) for immediate employment & livelihood opportunities to returnee migrant workers across 6 States of Bihar, Jharkhand, Madhya Pradesh, Odisha, Rajasthan and Uttar Pradesh
l Generated 50.8 crore man-days employment as on 27.07.21 with expenditure of ` 39,293 crore
Mahatma Gandhi National Rural Employment Guarantee Scheme (MGNREGS)
l
l
2020-21 employment provided to 11.2 crore persons generating 389.2 crore person days. Funds of `1,11,171 crore released2021-22 (as on 25.11.2021): employment provided to 8.85 crore persons generating 240.4 crore person days. Funds of 68,233 crore released.
MGNREGS wage increased by `20 over the wage rate of 2019-20
l Wage rate revised w.e.f. 1.4.2020 to benefit nearly 13.62 crore families
Contribution of 12 per cent employer and 12 per cent employee’s share under Employees Provident Fund (EPF) for 6 months for establishments with upto 100 employees with 90 per cent earning less than ` 15000/-
l Protected employment in EPFO registered establishments post-COVID
Aatmanirbhar Bharat Rojgar Yojana (ABRY) to reduce the financial burden of the employers and encourages them to hire more workers, implemented by EPFO
l As on 20.11.2021, benefit provided to 39.43 lakh beneficiaries through 1.15 lakh establishments
HousingPradhan Mantri Awas Yojana – Gramin (PMAY-G)
l
l
2020- 21: 33.99 lakh houses completed2021-22 (as on 25.11.21): 26.20 lakh houses completed
Pradhan Mantri Awas Yojana – Urban (PMAY-U)
l
l
2020-21: 14.56 lakh houses completed 2021-22: 4.49 lakh houses completed (upto Dec-21)
Skill Development
Deen Dayal Upadhyaya Grameen Kaushalya Yojana (DDU-GKY) and Rural Self Employment Training Institutes (RSETIs) - skill development programmes for rural poor youth
l
l
DDU-GKY2020-21: 38,289 candidates trained and 49,563 candidates placed in jobs2021-22 (till Oct’21): 14,568 candidates trained and 21,369 candidates placed in jobs
l
RSETI2020-21: 207712 candidates trained and 138537 candidates settled

17State of the Economy
l 2021-22 (as on 30.10.2021): 114640 candidates trained and 61546 candidates settled
Fresh skilling and upskilling of the returnee migrant workers under Pradhan Mantri Kaushal Vikas Yojana (PMKVY) covering 6 states
l 1.24 lakh migrant workers trained as on 21.11.2021
MSMEs
6-month moratorium and deferment of interest for 1.3.2020 to 31.8.2020 for all term loans by RBI
l Availed by 77.2 per cent of MSME borrowers and 43.7 per cent of individual borrowers of SCBs, as on 31.08.2020
Restructuring of MSME default loans – Aug 2020 and May 2021 Schemes of RBI
l
l
Aggregate restructured portfolio of `78,591 crore as on 12.11.2021 by SCBsResolution/restructuring by PSBs in 9.8 lakh MSME accounts amounting to `58,524 crore
Emergency Credit Line Guarantee Scheme – 100 per cent guarantee for additional funding of up to ` 4.5 lakh crore to businesses (esp. MSMEs) for COVID affected sectors
l
l
l
` 2.28 lakh crore disbursed to 95.2 lakh borrowers, impacting 5.45 crore employees as on 19.11.2021
66 per cent of guarantee amount disbursed to MSMEs
Extended till 31.03.2022Credit Guarantee Scheme (CGS) for MSMEs l
l
Credit / Margin Money provided
2020-21: ` 36,899 crore
2021-22: `22,959 crore (as on 30.11.2021)
Credit
Suspension of initiation of corporate insolvency process under Insolvency and Bankruptcy Code for 1 year, and increasing minimum threshold from ` 1 lakh to 1 crore
l Defaults during 25.3.2020 to 24.3.2021 remained as non-est
Term Liquidity Facility of `50,000 crore for Emergency Health Services by RBI up to 31.3.2022
l Announced on 31.04.2021
Credit Guarantee Scheme to Micro Finance Institutions (MFIs) for on-lending
l Fully utilized in 75 days of launch (28.6.2021), ` 7500 crore sanctioned
` 45,000 crore Partial Credit Guarantee Scheme 2.0 for NBFCs, HFCs and MFIs for fresh lending to MSMEs & individuals
l
l
As on 25.9.2020, portfolio of ` 25,505 crore approved by banks.
PSBs: portfolio of `27,794 crore purchased as on 4.12.2020

18 Economic Survey 2021-22
Special Long Term Repo Operations for Small Finance Banks available till 31.10.2021
l Announced on 31.04.2021
Credit
Lending by Small Finance Banks (SFBs) to MFIs for on-lending to be classified as priority sector lending up to 31.3.2022
l Announced on 31.04.2021
`30,000 crore Additional Emergency Working Capital Funding for farmers through NABARD
l
l
`25,000 crore disbursed as on 25.9.2020
Balance `5,000 crore allocated to NABARD by RBI for smaller NBFCs and NBFC-MFIs.
Nationwide Credit Outreach Programme launched on 16.10.2021
l ` 96,063 crore loans sanctioned as on 26.11.2021
Kisan Credit Cards Special Drive- `2 lakh crore Concessional credit boost to 2.5 crore farmers
l More than 1.5 crore KCCs issued with credit limit of `1.35 lakh crore
PM SVANidhi Scheme to provide working capital loan to urban street vendors to resume their businesses
l Credit worth `3,054 crore to 30.2 lakh street vendors as on 30.11.2021
Self-Help groups (SHGs) l Collateral free lending limit increased from `10 lakhs to `20 lakhs for 63 lakh women SHGs, who supported 6.85 crore households.
Deendayal Antyodaya Yojana - National Rural Livelihoods Mission (DAY-NRLM) to reduce poverty by organizing the rural poor women into Self Help Groups (SHGs)
l
l
2020-21: loans worth ` 84,143 crores disbursed to SHGs.
2021-22 (till September 2021): 21.6 lakh SHGs credit linked with ` 43093 crores.
` 30,000 crore Special Liquidity Scheme for NBFCs/HFCs/MFIs
l As on 30.9.2020, 39 proposals approved involving `11,120 crore - `7,227 crore disbursed. Scheme closed.
`1.1 lakh crore loan guarantee scheme for COVID affected sectors – health infrastructure, tourism, etc.
l
l
Cabinet approval on 30.06.2021
Applicable till 31.03.2022, or till `50,000 crore is sanctioned, whichever is earlier
Source: Various PIB releases and Parliament questions

19State of the Economy
Monetary and Financial Support1.24 Monetary policy since the outbreak of the pandemic was calibrated to provide a cushion and support growth, but carefully controlled in order to avoid the medium term dislocations of excess liquidity. The Monetary Policy Committee (MPC) cut the policy repo rate by 115 basis points (bps) during February to May 2020, on top of a reduction of 135 bps in the preceding twelve months. Since then, the MPC has maintained status quo on the policy repo rate keeping it unchanged at 4 per cent. The Marginal Standing Facility rate and the bank rate have also remained unchanged at 4.25 per cent and so has the reverse repo rate at 3.35 per cent. RBI in its latest MPC statement has further decided to continue with this accommodative stance as long as necessary to revive growth on a durable basis. A number of additional steps were taken throughout the period to ensure that there was adequate liquidity in the system to allow the central and state governments to finance themselves at lower rates.
1.25 An important aspect of the safety-net was the use of Government guarantees to provide access to financial support to the economy in general and MSMEs in particular (see Table 5). Combined with a moratorium on insolvency proceedings, the Government was able to avoid a payments logjam that could have caused a cascade of defaults. Much of the support was extended into 2021-22 where needed, but RBI and the Government have allowed some of liquidity support to roll-off and the insolvency process to resume as the economy has recovered. It is important to do this as excess liquidity and a stalled insolvency process bring longer-term risks. This is discussed in detail in Chapter 4.
High Frequency Indicators1.26 As mentioned above, in the last two years, Government leveraged an array of eighty HFIs representing industry, services, global trends, macro-stability indicators and several other activities, from both public and private sources to gauge the underlying state of the economy on a real-time basis. These include electricity generation, scheduled domestic flights, volume/value of financial transactions, capital flows, mobility indices, and so on. It also covers employment demanded under MGNREGA to gauge rural employment conditions, especially in the context of migrant workers. These indicators are regularly published in the Monthly Economic Report of Ministry of Finance and a full list is given in the Annex at the end of this chapter.
1.27 While HFIs have the advantage of being real-time and frequent, they need to be used with care. Each indicator provides, at best, a partial view of developments. Moreover, the noise-to-signal ratio can be higher than for national accounts and other slower moving data. In a rapidly evolving situation, policy-makers can pick up useful signals that allow for faster response and better targeting. Thus, using HFIs for gauging trends in the economy is as much an art as a science. The following charts provide a flavour of the HFIs being used (Figure 25). The specific interpretations and policy response are discussed in the relevant chapters.
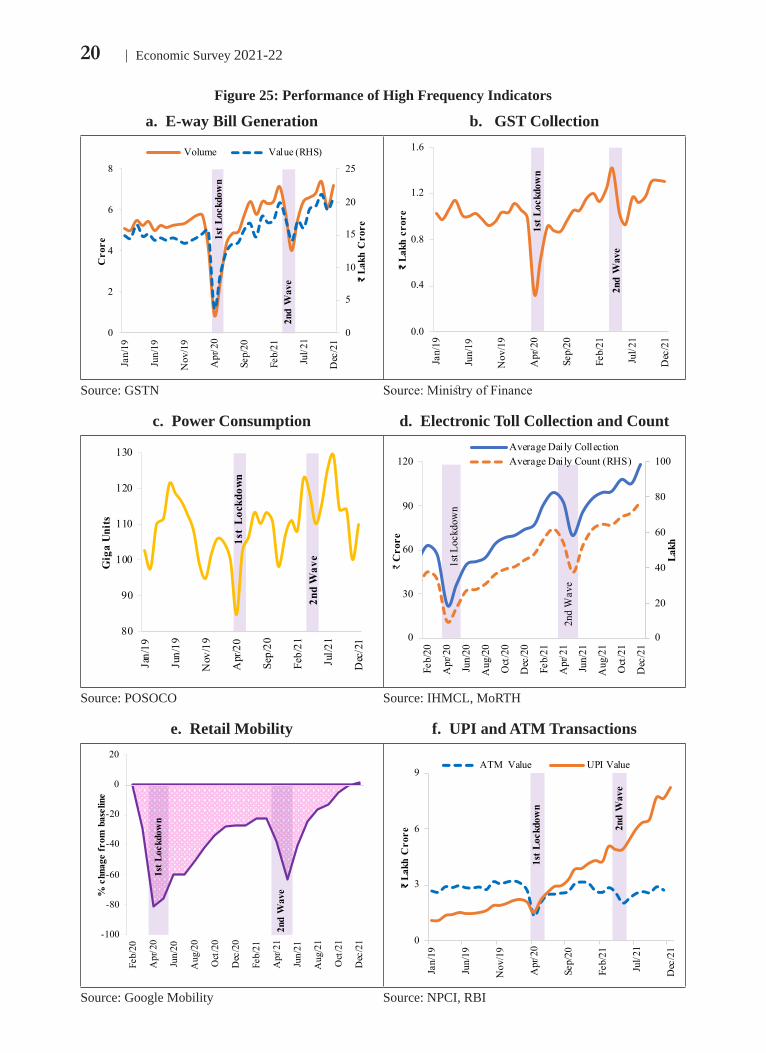
20 Economic Survey 2021-22
Figure 25: Performance of High Frequency Indicators
a. E-way Bill Generation b. GST Collection
0
5
10
15
20
25
0
2
4
6
8
Jan/
19
Jun/
19
Nov
/19
Apr
/20
Sep/
20
Feb/
21
Jul/2
1
Dec
/21
₹La
kh C
rore
Cro
re
Volume Value (RHS)
1st L
ockd
own
2nd
Wav
e
0.0
0.4
0.8
1.2
1.6
Jan/19
Jun/19
Nov/19
Apr/20
Sep/20
Feb/21
Jul/21
Dec/21
₹La
kh c
rore
1st L
ockd
own
2nd
Wav
e
Source: GSTN Source: Ministry of Finance
c. Power Consumption d. Electronic Toll Collection and Count
80
90
100
110
120
130
Jan/19
Jun/19
Nov/19
Apr/20
Sep/20
Feb/21
Jul/21
Dec/21
Gig
a U
nits
1st
Loc
kdow
n
2nd
Wav
e
0
20
40
60
80
100
0
30
60
90
120
Feb/
20
Apr
/20
Jun/
20
Aug
/20
Oct
/20
Dec
/20
Feb/
21
Apr
/21
Jun/
21
Aug
/21
Oct
/21
Dec
/21
Lakh
₹Crore
Average Daily CollectionAverage Daily Count (RHS)
1st L
ockd
own
2nd
Wav
e
Source: POSOCO Source: IHMCL, MoRTH
e. Retail Mobility f. UPI and ATM Transactions
-100
-80
-60
-40
-20
0
20
Feb/20
Apr/20
Jun/20
Aug/20
Oct/20
Dec/20
Feb/21
Apr/21
Jun/21
Aug/21
Oct/21
Dec/21
% c
hnag
e fr
om b
asel
ine
1st L
ockd
own
2nd
Wav
e
0
3
6
9
Jan/
19
Jun/
19
Nov
/19
Apr
/20
Sep/
20
Feb/
21
Jul/2
1
Dec
/21
₹La
kh C
rore
ATM Value UPI Value
1st L
ockd
own
2nd
Wav
e
Source: Google Mobility Source: NPCI, RBI

21State of the Economy
g. Freight and Cargo Traffic
0
1
2
3
4
300
500
700
900
1100
1300Ja
n-19
Jun-
19
Nov
-19
Apr
-20
Sep-
20
Feb-
21
Jul-2
1
Dec
-21
Lakh
Ton
nes
Lakh
Ton
nes
Port Cargo Traffic Rail Freight Traffic Domestic Air Traffic (RHS)
1st L
ockd
own
2nd
Wav
e
Source: IPA, AAI, Ministry of Railways
h. Domestic Tractor Sales i. Two and Three Vehicle Sales
0
20
40
60
80
100
120
Jan/19
Jun/19
Nov/19
Apr/20
Sep/20
Feb/21
Jul/21
Dec/21
Thou
sand
2nd
Wav
e
1st L
ockd
own
0
5
10
15
20
25Jan/19
Jun/19
Nov/19
Apr/20
Sep/20
Feb/21
Jul/21
Dec/21
Lakh 1s
t Loc
kdow
n
2nd
Wav
e
Source: TMA Source: SIAM
j. MNREGA work generated and demanded
0
1
2
3
4
5
6
0
10
20
30
40
50
60
Jan/19 Jun/19 Nov/19 Apr/20 Sep/20 Feb/21 Jul/21 Dec/21
Pers
on (C
rore
)
Pers
onda
ys (C
rore
)
MGNREGA work created MGNREGA work demanded (RHS)
1st L
ockd
own
2nd
Wav
e
Source: NREGASoft

22 Economic Survey 2021-22
k. Fuel Consumption l. Passenger Vehicle Sales
90
125
160
195Jan/19
Jun/19
Nov/19
Apr/20
Sep/20
Feb/21
Jul/21
Dec/21
Lakh
MT 1s
t Loc
kdow
n
2nd
Wav
e0
1
2
3
4
Jan/19
Jun/19
Nov/19
Apr/20
Sep/20
Feb/21
Jul/21
Dec/21
Lakh
1st
Lock
dow
n
2nd
Wav
e
Source: PPAC, MoPNG Source: SIAM
m. Railway Passenger Earnings n. Air Passenger Traffic
-1000
0
1000
2000
3000
4000
5000
Jan/19
Jun/19
Nov/19
Apr/20
Sep/20
Feb/21
Jul/21
Dec/21
₹C
rore
1st L
ockd
own
2nd
Wav
e
0
40
80
120
160
200
240Jan/19
Jun/19
Nov/19
Apr/20
Sep/20
Feb/21
Jul/21
Dec/21
Lakh
1st L
ockd
own
2nd
Wav
e
Source: Ministry of Railways Source: AAI
o. Crude Oil Price p. Currency in Circulation and Money Supply
15
25
35
45
55
65
75
85
Jan/
19
Jun/
19
Nov
/19
Apr
/20
Sep/
20
Feb/
21
Jul/2
1
Dec
/21
US$
/Bar
rel
Average Crude Oil Price (Brent_Dubai_WTI)Indian Crude Oil Basket Price
1st L
ockd
own
2nd
Wav
e
140
150
160
170
180
190
200
20
22
24
26
28
30
32
Jan/
19
Jun/
19
Nov
/19
Apr
/20
Sep/
20
Feb/
21
Jul/2
1
Dec
/21
₹La
kh C
rore
₹La
kh C
rore
Currency in Circulation M3 (RHS)
1st L
ockd
own
2nd
Wav
e
Source: PPAC, World Bank Source: RBI

23State of the Economy
q. Equity Markets r. Bond Yields
0
10
20
30
40
50
60
70
80
20000
30000
40000
50000
60000Ja
n/19
Jun/
19
Nov
/19
Apr
/20
Sep/
20
Feb/
21
Jul/2
1
Dec
/21
Inde
x
Inde
x
Sensex Nifty VIX (RHS)
1st L
ockd
own
2nd
Wav
e
5
6
7
8
9
Jan/
19
Jun/
19
Nov
/19
Apr
/20
Sep/
20
Feb/
21
Jul/2
1
Dec
/21
Per
cent
10 year G-Sec yield10 year AAA Corporate Bond yield
1st L
ockd
own
2nd
Wav
e
Source: NSE,BSE Source: CCIL
s. Mandi Arrivals t. Retail Prices
0
1
2
3
4
5
2
6
10
14
Jan/
19
Jun/
19
Nov
/19
Apr
/20
Sep/
20
Feb/
21
Jul/2
1
Dec
/21
Lakh
Ton
nes
Lakh
Ton
nes
Onions Tomato (RHS)
1st L
ockd
own
2nd
Wav
e
0
20
40
60
80
100
0
20
40
60
Jan/
19
Jun/
19
Nov
/19
Apr
/20
Sep/
20
Feb/
21
Jul/2
1
Dec
/21
₹/K
g
₹/K
g
Tomato Onion (RHS)
1st L
ockd
own
2nd
Wav
e
Source: Dept. of Consumer Affairs Source: Dept. of Consumer Affairs
u. FDI and FPI v. Non-Oil Import and Export
-20
-10
0
10
20
Jan/
19
Jun/
19
Nov
/19
Apr
/20
Sep/
20
Feb/
21
Jul/2
1
Dec
/21
US$
Bill
ion
Net FDI Net FPI
1st L
ockd
own
2nd
Wav
e
10
20
30
40
5
15
25
35
Jan/
19
Jun/
19
Nov
/19
Apr
/20
Sep/
20
Feb/
21
Jul/2
1
Dec
/21
US$
Bill
ion
US$
Bill
ion
Non-oil exportsNon-oil & non-gold imports (RHS)
1st L
ockd
own
2nd
Wav
e
Source: CDSL, RBI Source: Ministry of Commerce and Industry

24 Economic Survey 2021-22
w. Foreign Trade x. Baltic Dry Index
5
15
25
35
45
55
Jan/19
Jun/19
Nov/19
Apr/20
Sep/20
Feb/21
Jul/21
Dec/21
US$
Bill
ion
Exports Imports
1st L
ockd
own
2nd
Wav
e0
1000
2000
3000
4000
5000
Jan/19
Jun/19
Nov/19
Apr/20
Sep/20
Feb/21
Jul/21
Dec/21
1st L
ockd
own
2nd
Wav
e
Source: Ministry of Commerce Source: The Great Eastern Shipping Co. Ltd.
y. Net Sale/Purchase of Dollar and Exchange Rate
z. Foreign Exchange Reserves
-10
-5
0
5
10
15
20
65
67
69
71
73
75
77
Jan/
19
Jun/
19
Nov
/19
Apr
/20
Sep/
20
Feb/
21
Jul/2
1
Dec
/21
US$
Bill
ion
₹/U
S$
Net purchase (+)/sale (-) of US dollar (RHS)
Exchange Rate
1st L
ockd
own 2n
d W
ave
350
400
450
500
550
600
650
Jan/19
Jun/19
Nov/19
Apr/20
Sep/20
Feb/21
Jul/21
Dec/21
US$
Bill
ion
1st
Lock
dow
n
2nd
Wav
e
Source: RBI Source: RBI
VACCINATION1.28 Vaccination has played a critical role (Box 1) in minimizing loss of lives, boosting confidence in the economy towards resumption of activity and containing the sequential decline in output due to second wave. As India completed one year of its COVID-19 vaccination drive on 16th January, 2022, it crossed the historic milestone of administrating more than 156 crore doses of vaccine (Figure 26). More than 88 crore people (93 per cent of the adult population) have received at least one dose of which around 66 crore people (70 per cent of the adult population) stands fully vaccinated. With vaccination drive further extended to the age group of 15-18 years starting 3rd January, 2022, more than 50 per cent of India’s population in this age group have received their first dose of the vaccine as on 19th January. These measures have been discussed in detail in chapter 10.

25State of the Economy
Figure 26: Vaccination Coverage
0
20
40
60
80
100
120
0
20
40
60
80
100
120
140
160
180
1-17
-21
1-31
-21
2-14
-21
2-28
-21
3-14
-21
3-28
-21
4-11
-21
4-25
-21
5-9-
215-
23-2
16-
6-21
6-20
-21
7-4-
217-
18-2
18-
1-21
8-15
-21
8-29
-21
9-12
-21
9-26
-21
10-1
0-21
10-2
4-21
11-7
-21
11-2
1-21
12-5
-21
12-1
9-21
1-2-
221-
16-2
2
Lakh
Cro
re
month-day-year
Daily doses (7 days MA, RHS) Total Doses (7 DMA)
Phas
e -I
(Hea
lthca
re &
Fro
ntlin
e W
orke
rs)
Phas
e -II
(Abo
ve 6
0 Y
ears
)
Phas
e -II
(45-
59 Y
ears
)
Phas
e -II
I (1
8-44
Yea
rs)
Uni
vers
aliza
tion
of v
acci
natio
n
Phas
e-IV
(15-
18 Y
ears
)B
oost
erD
ose
Source: Survey Calculations using data from MoHFW
1.29 With India witnessing a resurgence in daily new cases since end-December 2021, marking the onset of Omicron variant induced third wave, rapid progress in vaccination coverage and further strengthening of testing and health infrastructure assume critical importance in protecting lives and containing the spread of the infection.
Box 1: India’s vaccination drive
Vaccination has been an integral pillar of the comprehensive strategy of Government of India for containment and management of the pandemic. On 16th January 2021, India commenced the world’s largest vaccination program with an ambitious target to inoculate its entire eligible population by 31st December 2021, with at least the first dose. In the first phase, the vaccination drive was sequentially expanded to cover Health Care Workers and Front Line Workers. The second phase started on 1st March (for above 60 years) and 1st April 2021 (from 45-59 years) making all persons aged 45 years and above eligible for vaccination. This cohort had accounted for more than 80 per cent of the COVID-19 mortality in the country. The third phase began on 1st May 2021 to vaccinate people in the age group of 18-45 years. From 3rd January 2022, the vaccination drive has been further extended to include those in the age group of 15-18 years. Taking cognisance of the recent global surge of the Omicron variant, the Variant of Concern declared by WHO on 26th November 2021, booster doses to healthcare and frontline workers as well as senior citizens above 60 years of age with co-morbidities have been allowed by Government from 10th January 2022. Vaccination access and pricing have been deregulated to quicken the pace of vaccination across states and all age groups.
The latest available data at the time of writing shows that 99 per cent of the registered Health Care Workers and 100 per cent of the Front-Line Workers, 87 per cent of the population aged between 18-44 years, 95 per cent of the population aged between 45-60 years and 89 per cent of the population above 60 years have been covered under the first dose. Vaccination drive continues to gather speed and breadth with the number of days taken to achieve an additional 10 crore doses reducing significantly from 86 days during the initial phase to 15 days now (Figure 1A). The average daily vaccination rate has increased four-fold from 19.3 lakh in May 2021 to 75.4 lakh as of 16th January 2021. As on 16th January 2022, eligible population (18 year and above) vaccinated in India with first dose was 93 per cent and with second dose 69.8 per cent (Figure 1C).

26 Economic Survey 2021-22
Figure 1A: Days to Reach Next 10 Crore Doses in India
Figure 1B: Total Doses Administered across Countries
86
150 20 40 60 80 100
102030405060708090
100110120130140150
No of Days
Cro
re
157
5334 30
16 16 15 14 143
India
US
Brazil
Indonesia
Germany
Mexico
Russia
Turkey
UK
South
Africa
Crore
Source: Survey Calculations using data from MoHFW and WHONote: Figure 1B data as of 16th January 2022.
Figure 1C: Cumulative Percent of Adult Population with COVID-19 Vaccine (in per cent)
93.0
69.8
0
10
20
30
40
50
60
70
80
90
100
Jan-
21
Feb-
21
Mar
-21
Apr
-21
May
-21
Jun-
21
Jul-2
1
Aug
-21
Sep-
21
Oct
-21
Nov
-21
Dec
-21
Jan-
22
COVI
D-1
9 va
ccin
e cov
erag
e (in
per
cent
) Percentage of adult population with First dose
Percentage of adult population with Second dose
Source: Survey Calculations using data from MoHFWNote: Data as of 16th January 2022.
MACROECONOMIC STABILITY1.30 At the time of writing, a new wave in the form of the Omicron variant was sweeping across the world, inflation had jumped up in most countries, and the cycle of liquidity withdrawal was being initiated by major central banks. This is why it is especially important to look at India’s macro-economic stability indicators and their ability to provide a buffer against the above stresses. Table 6 provides a quick comparison of various macroeconomic stability indicators in 2008-09 (Global Financial Crisis), 2012-13 (pre Taper Tantrum) and 2021-22 (second year of Covid-19 pandemic). This section analyses macroeconomic stability indicators on all fronts- external sector, fiscal indicators, financial sector and inflation.

27State of the Economy
Table 6: Comparison of Macroeconomic Indicators during Global Financial Crisis, Taper Tantrum and COVID-19
Global Financial Crisis
Taper Tantrum
COVID-19 Pandemic
Macroeconomic Indica-tors
2008-09 2012-13 2021-22
CPI inflation 9.1 9.4 5.2 Apr-Dec 2021
India’s Gross Fiscal Deficit as % of GDP
8.3 6.9 10.2 2021-22 (BE)
Fiscal Deficit of EMDEs (Asia) as % of GDP
1.6 1.7 7.8 2021
Current Account Balance as % of GDP
-2.3 -4.8 -0.2 Apr-Sept 2021
External Debt as % of GDP 20.7 22.4 20.2 June 2021
Forex Reserves (US$ billion)
252 292 634 31st Dec 2021
Govt Bond Yields 10-year 7.3 8.0 6.4 11th Jan 2022
Total FDI inflows (US$ billion)
8.3 34.0 48.4 Apr-Oct 2021
SCBs Capital to Risk Weighted Assets Ratio (CRAR)
13.2 13.9 16.5 Sept 2021
SCBs Provision Coverage Ratio
- 47.6 68.1 Sept 2021
Source: NSO, MoSPI, RBI, CGA, CDSL, Ministry of Finance, IMF.Note: The taper tantrum happened in 2013. In the table above, 2012-13 is used to show the position just prior to taper tantrum as this is analogous to the present situation prior to withdrawal of liquidity in financial markets.
External sector1.31 Despite all the disruptions caused by the global pandemic, India’s balance of payments remained in surplus throughout the last two years (Figure 27). This allowed the Reserve Bank of India to keep accumulating foreign exchange reserves, which stands at US$634 billion on 31st December 2021). This is equivalent to 13.2 months of imports (Figure 28) and higher than the country’s external debt. As of end-November 2021, India was the fourth largest foreign exchange reserves holder in the world after China, Japan, and Switzerland. A sizeable accretion in reserves led to an improvement in external vulnerability indicators such as foreign exchange reserves to total external debt, short-term debt to foreign exchange reserves, etc.

28 Economic Survey 2021-22
Figure 27: Surplus in BoP Figure 28: Forex reserves and Import Cover
0
1
2
3
4
5
6
Q1 Q2 Q3 Q4 Q1 Q2 Q3 Q4 Q1 Q2
2019-20 2020-21 2021-22 (P)
US$
BIl
lion
0
4
8
12
16
20
300
400
500
600
700
Q1 Q2 Q3 Q4 Q1 Q2 Q3 Q4 Q1 Q2 Q3
2019-20 2020-21 2021-22 (P)
No.
of m
onth
s
US$
Bil
lion
FER Import Cover-RHS
Source: RBI
1.32 India’s salient external sector sustainability indicators are strong and much improved as compared to what they were during the global financial crisis or taper episode of 2013 (Table). For instance, the import cover and foreign exchange reserves are more than double now. The combination of high foreign exchange reserves, sustained foreign direct investment, and rising export earnings will provide a good buffer against any liquidity tapering/monetary policy normalisation in 2022-23 (details in Chapter 3).
Fiscal Balance1.33 The fiscal support given to the economy as well as the health response caused the fiscal deficit and government debt to rise in 2020-21. However, there has been a strong rebound in government revenues in 2021-22 so far. The revenue receipts of the central government during April- November 2021 have gone up by 67.2 per cent (YoY), as against an estimated growth of 9.6 per cent in the 2021-22 Budget Estimates. The tax collections have been buoyant for both direct and indirect taxes (Figure 29. The gross monthly GST collections have crossed ` 1 lakh crore consistently since July 2021 (details in Chapter 2).
Figure 29: Direct and indirect tax revenue Figure 30: Fiscal and Primary deficit
0
1
2
3
4
5
CorporationTax
Taxes onIncome
(other thanCorporate
tax)
Customs Union exciseduties
Gross GSTto the Centre
Direc tTaxes Indirect ta xes
₹La
kh C
rore
Apr-Nov 2019 Apr-Nov 2020 Apr-Nov 2021
8.1
4.7
10.8
6.97.0
2.4
Fiscal Deficit Primary Deficit
₹la
kh c
rore
Apr-Nov 2019 Apr-Nov 2020 Apr-Nov 2021
Source: Office of CGA Source: Office of CGA

29State of the Economy
1.34 On account of a sustained revenue collection and a targeted expenditure policy by the Government of India, the fiscal deficit for April-November 2021 has been contained at 46.2 per cent of Budget Estimates (BE) which is nearly one third of the proportion reached during the same period of the previous two years (135.1% of BE in April-November 2020 and 114.8% of BE in April-November 2019). The primary deficit during the period April to November 2021 turned up at nearly half of the level it had reached during April to November 2019 (Figure 30) This implies that the Government has the fiscal capacity to maintain the support, and ramp up capital expenditure when required. The strong revival in revenues also provides Government with fiscal space to provide additional support as well, if necessary.
Financial Sector1.35 The financial system is always a possible area of stress during turbulent times. However, India’s capital markets, have done exceptionally well and have allowed record mobilization of risk capital for Indian companies. The Sensex and Nifty scaled up to touch its peak at 61,766 and 18,477 on October 18, 2021. Among major emerging market economies, Indian markets outperformed its peers in April-December 2021. The year 2021-22 so far has been an exceptional year for the primary markets with a boom in fundraising through IPOs by many new age companies/tech start-ups/unicorns. ` 89,066 crore was raised via 75 IPO issues in April-November 2021, much higher than in any year in the last decade (details in Chapter 4).
1.36 More significantly, the banking system is well capitalized and the overhang of Non-Performing Assets seems to have structurally declined even allowing for some lagged impact of the pandemic. The Gross Non-Performing Advances (GNPA) ratio (i.e. GNPAs as a percentage of Gross Advances) and Net Non-Preforming (NNPA) ratio of Scheduled Commercial Banks (SCBs) continued to decline since 2018-19. GNPA ratio of SCBs decreased from 7.5 per cent at end-September 2020 to 6.9 per cent at end-September 2021. NNPA ratio of SCBs also declined from 6 per cent at end of 2017-18 to 2.2 per cent at end-September 2021 (Figure 31). Simultaneously, the Capital Adequacy Ratio has continued to improve since 2015-16. The Capital to risk-weighted asset ratio (CRAR) of SCBs increased from 15.84 per cent at end-September 2020 to 16.54 per cent at end-September 2021 on account of improvement for both public and private sector banks (Figure 32).
Figure 31: GNPA and NNPA ratio of SCBs Figure 32: Capital Adequacy Ratio (per cent)
0
2
4
6
8
10
12
2008
-09
2009
-10
2010
-11
2011
-12
2012
-13
2013
-14
2014
-15
2015
-16
2016
-17
2017
-18
2018
-19
2019
-20
2020
-21
Sep-
21Perc
enta
ge of
Gro
ss A
dvan
ces
GNPA ratioNNPA ratio
10
11
12
13
14
15
16
17
2003
-04
2004
-05
2005
-06
2006
-07
2007
-08
2008
-09
2009
-10
2010
-11
2011
-12
2012
-13
2013
-14
2014
-15
2015
-16
2016
-17
2017
-18
2018
-19
2019
-20
2020
-21
Sep-
21
per c
ent
Source: RBI Source: RBI

30 Economic Survey 2021-22
Inflation1.37 Inflation has reappeared as a global issue in both advanced and emerging economies (Figure 33). The surge in energy prices, non-food commodities, input prices, disruption of global supply chains, and rising freight costs stoked global inflation during the year. In India, Consumer Price Index (CPI) inflation moderated to 5.2 per cent in 2021-22 (April-December) from 6.6 per cent in the corresponding period of 2020-21. It was 5.6 per cent (YoY) in December 2021, which is within the targeted tolerance band (Figure 34). The decline in retail inflation in 2021-22 was led by easing of food inflation (details in Chapter 5). Wholesale Price Inflation (WPI), however, has been running in double-digits. The inflation in ‘fuel and power’ group of WPI was above 20 per cent reflecting higher international petroleum prices. Although the high WPI inflation is partly due to base effects that will even out, India does need to be wary of imported inflation, especially from elevated global energy prices.
Figure 33: Consumer Price Inflation Rates Figure 34: CPI and WPI Inflation
0
2
4
6
8
2010
2011
2012
2013
2014
2015
2016
2017
2018
2019
2020
2021
Per c
ent
AEs EMDEs
-8%
-4%
0%
4%
8%
12%
16%
Apr-20
Jun-20
Aug-20
Oct-20
Dec-20
Feb-21
Apr-21
Jun-21
Aug-21
Oct-21
Dec-21
CPI WPI
Source: World Economic Outlook, January 2022 Update, IMFNote: Figures are annual averages; Figures for 2021 are projections. Advanced Economies include 40 economies and Emerging Markets and Developing Economies (EMDEs) include 156 economies as per IMF classification
Source: MoSPI, DPIIT
1.38 Overall, macro-economic stability indicators suggest that the Indian economy is well-placed to take on the challenges of 2022-23.
Box 2: Global Supply-Side Disruption
As the world economy recovered in 2021, it is faced with serious supply-side constraints ranging from delivery delays, container shortages and semiconductor chip shortages. According to the United Nations Conference on Trade and Development, “…The COVID-19 pandemic led to a sudden dip in international seaborne trade. But by late 2020 there had been a swift rebound mainly in a container and dry bulk shipping. The recovery in container trade flows, which was mainly on East-West containerized trade lanes, created a series of logistical challenges and hurdles, pushed up rates and prices, increased delays and dwell times, and undermined service reliability.”1 As shown by the IHS Markit suppliers’ delivery times index (Figure 2A), delivery times in the US and the European Union (EU) have hit their worst ever performance since 20102.
1UNCTAD, Review of Maritime Transport 2021. Pg 57.2https://m.rbi.org.in//Scripts/BS_ViewBulletin.aspx?Id=20628

31State of the Economy
Figure 2A: Purchasing Manager’s Sub-Index for Delivery Time Index
10
20
30
40
50
60
Apr-10 Dec-11 Aug-13 Apr-15 Dec-16 Aug-18 Apr-20 Dec-21
Eurozone US
Source: IHS Markit. Note: Readings above 50 indicate faster delivery times, readings at 50 signal no change, and below 50 indicate slower.
Shipping Container Shortage and Rising Trade CostsThe stress in the container shortages can be captured in the Drewry’s3 Composite World Container Index4. The Index stands at US$ 9,698.33 per 40ft container as of 20th January 2022 (Figure 2B). This is US$ 6,656 higher than the five-year average and remains 82 per cent higher than a year earlier. Such a significant rise in price for a prolonged period indicates that the disruptions in the global container market are not yet over and will continue to impact the global sea trade.
Figure 2B: World Container Index ( US$ per 40ft container)
$666 $1,351 $1,270 $1,324 $1,525
$5,191
$10,310
$9,698
01-M
ar-1
6
01-A
ug-1
6
01-J
an-1
7
01-J
un-1
7
01-N
ov-1
7
01-A
pr-1
8
01-S
ep-1
8
01-F
eb-1
9
01-J
ul-1
9
01-D
ec-1
9
01-M
ay-2
0
01-O
ct-2
0
01-M
ar-2
1
01-A
ug-2
1
01-J
an-2
2
Frei
ght r
ate
(US
$ 40
ft C
onta
iner
s)
Source: Drewry Supply Chain Advisors (2022)
3Independent think tank on Maritime Transport4https://www.drewry.co.uk/supply-chain-advisors/supply-chain-expertise/world-container-index-assessed- by-drewry

32 Economic Survey 2021-22
Also, the freight prices on major global sea routes have observed an upward trend during the same period. Table 2A below shows the prices and percentage change (YoY) from last year for major routes.
Table 2A: Spot freight rates by major route
Route As on 20th January 2022 (US$)
YoY change ( per cent)
Composite Index 9,698 82Shanghai - Rotterdam 14,053 55Rotterdam - Shanghai 1,452 3Shanghai - Genoa 12,794 46Shanghai - Los Angeles 11,197 168Los Angeles - Shanghai 1,262 138Shanghai - New York 13,987 115New York - Rotterdam 1,245 93Rotterdam - New York 6,292 176
Source: Drewry, 2022
The shortage of containers has also impacted the Indian sea trade. According to the Federation of Indian Export Organisation set up under the Ministry of Commerce and Industry, the lack of containers has resulted in rising sea freight rates in the range of 300 per cent to 350 per cent5.
Further, the production of the new containers has slowed since 2019 (Figure 2C). Simultaneously, a rise in the disposal of containers has also been observed for the same period. Thus, the overall growth in the containers has fallen from 11 per cent in 2019 to 5 per cent in 2021. Unless the production is ramped up significantly across the globe, this will remain a persistent problem.
Figure 2C: Manufacturing and Disposal of Containers
48 44 45 4960 55
36
52
5 57 7
2
11
7
9 9
11
8
5
0
2
4
6
8
10
12
0
10
20
30
40
50
60
70
2015 2016 2017 2018 2019 2020 2021
per c
ent
in th
ousa
nds
Containers manufactured Containers disposed Global Container Growth (%) (RHS)
Source: 2021 Global Tank Container Fleet Survey, International Tank Container Organisation
5A Speech of FIEO President, Sept 2021. https://www.fieo.org/view_detail.php?lang=0&id=0,21&dcd=7452&did=16321181898hbfjpo6pvshqpu4f2sib0v776

33State of the Economy
Semiconductors industry spillover in the automobile industryA report by investment bank Goldman Sachs 2021 states that the supply chain disruptions in the semiconductor industry have spillovers in over 169 industries. The manufacturing of semiconductors requires large amount of capital and has an average gestation period of 6-9 months. Moreover, it has a fairly long production cycle of about 18-20 weeks. Hence, any recovery from the supply chain disruptions will be a slow and costly affair.
The report further stated that microchips and semiconductors account for about 4.7 per cent of value added by the automotive industry6. With the delay in supply, the average lead time7 in the automobile industry for 2021 has been around 14 weeks globally8. India has also experienced similar trends in the automobile sector. As per data from the Society of Indian Automobile Manufacturers (SIAM), carmakers sold 219,421 passenger vehicles in the domestic market in December 2021, down 13 per cent (YoY). This is not a demand problem but a supply-side issue. The information from various car manufacturer’s websites reveals a cumulative pendency of over 7 lakh orders9 , as of December 2021.
SUPPLY SIDE REFORMS1.39 Another distinguishing feature of India’s economic response has been an emphasis on supply-side reforms rather than a total reliance on demand management. These supply-side reforms include deregulation of numerous sectors, simplification of processes, removal of legacy issues like ‘retrospective tax’, privatisation, production-linked incentives and so on. Some of these have been listed in Table 7, and have been discussed in detail in the respective chapters. Even the sharp increase in capital spending by the Government can be seen as both demand and supply response as it creates infrastructure capacity for future growth.
1.40 An important theme that has been discussed through the course of the Economic Survey is that of ‘process reforms’. It is important to distinguish between deregulation and process reforms. The former relates to reducing or removing the role of government from a particular activity. In contrast, the latter broadly relates to simplification and smoothening of the process for activities where the government’s presence as a facilitator or regulator is necessary. Chapter 2 discusses the reforms undertaken in the public procurement policy- launch of Government e- Marketplace (GeM) in 2016 for standard routine use items and the new procurement guidelines issued in October 2021 for non-standard items and projects. Chapter 4 discusses for the need for simplification of voluntary liquidation process for corporates and for institutionalising a standard process for Cross Border Insolvency Process. Similarly, chapter 9 discusses the simplification of Drone rules and reforms in telecom sector, and the need for reforms in the patent application regime.
1.41 The emphasis given to the supply-side in India’s COVID-19 response is driven by two important considerations. First, Indian policy-makers saw the disruptions caused by travel-
6https://www.msn.com/en-us/news/crime/global-chip-shortage-hit-these-169-industries-gs/vi-BB-1g4hv87Lead time: The difference between the date of order and actually receiving8https://www.goldmansachs.com/insights/pages/the-daily-check-in/the-semiconductor-short-age-of-2021/transcript.pdf9Various company websites.

34 Economic Survey 2021-22
restrictions, lockdowns and supply-chain breakdowns as an interruption of the economy’s supply-side. Although this also squeezed demand, it is not correct to see the pandemic related economic slowdown as just a demand problem as happens with most economic cycles. Second, the post-Covid world will be impacted by a wide variety of factors – changes in technology, consumer behaviour, geo-politics, supply-chains, climate change and so on. All of these factors will also interact in unpredictable ways with each other. Therefore, the post-Covid economy will not be merely a re-inflation of the pre-Covid economy. Simply building it back with demand measures is not a solution.
1.42 There are two common themes in India’s supply-side strategy: (i) Reforms that improve flexibility and innovation in order to deal with the long-term unpredictability of the post-Covid world. This includes factor market reforms; deregulation of sectors like space, drones, geo-spatial mapping, trade finance factoring; process reforms like those in government procurement and in telecommunications sector; removal of legacy issues like retrospective tax; privatization and monetization, creation of physical infrastructure, and so on. (ii) Reforms aimed at improving the resilience of the Indian economy. These range from climate/environment related policies; social infrastructure such as public provision of tap water, toilets, basic housing, insurance for the poor, and so on; support for key industries under Atmanirbhar Bharat; a strong emphasis on reciprocity in foreign trade agreements, and so on. Some commentators have likened the Atmanirbhar Bharat approach to a return to old school protectionism. Far from it, the focus on economic resilience is a pragmatic recognition of the vagaries of international supply-chains (see discussion in Box 2).
1.43 As the reader may have guessed, the two pronged approach of “flexibility” and “resilience” is analogous to the Barbell strategy used for the short-term response to the pandemic. This should not be surprising as they are both attempting to deal with the same issue – uncertainty about the future flow of events.
Table 7: Key supply side measures/reforms
Sectors Measures/Reforms
Industry l
l
Production Linked Incentive Scheme approved for 13 sectors including (i) Automobiles and auto components, (ii) Pharmaceuticals drugs, (iii) Specialty steel, (iv) Telecom & Networking Products, (v) Electronic/Technology Products, (vi) White Goods (ACs and LEDs), (vii) Food products, (viii) Textile products: MMF segment and technical textiles, (ix) High efficiency solar PV modules, (x) Advanced Chemistry Cell battery, (xi) Manufacturing of medical devices, (xii) Mobile manufacturing & specified electronic components and (xiii) Critical key starting materials/Drug intermediaries & Active Pharmaceutical IngredientsRetrospective tax repealed to promote tax certainty and foreign investment.

35State of the Economy
Business Process Outsourcing (BPO) sector
Liberalized guidelines for Other Service Providers (OSPs)
Clear definition of OSP: The applicability of new guidelines is limited to entities that provide ‘Voice based BPO services’ to its customers. Voice based BPO services are defined to mean call centre services.
Removal of registration requirement for OSP centres in India. No bank guarantee required for any facility or dispensation under these
guidelines. Distinction between Domestic and International OSPs removed. Work from home and remote locations allowed: The agents at home/
anywhere shall be treated as remote agents of the OSP centre. The interconnection between remote agents is permitted using any technology including broadband over wireline/wireless. The remote agent can now directly connect to customer Electronic Private Automatic Branch Exchange (EPABX) /centralised EPABX without the need to connect with the OSP centre.
Interconnection between two or more OSP centres of the same or unrelated company is now permitted.
Infrastructure sharing among OSPs is now allowed. The guidelines allow the use of EPABX at foreign locations.
Telecom l
l
Structural reforms
Rationalization of Adjusted Gross Revenue: Non-telecom revenue will be excluded from the definition of Adjusted Gross Revenue.
Bank Guarantees rationalized: Huge reduction in Bank Guarantee requirements against License Fee and other similar levies. For auctions held henceforth, no Bank Guarantees will be required to secure instalment payments.
Interest rates rationalized and penalties from delayed payments of License Fee or Spectrum Usage Charge (SUC) removed.
100 per cent FDI under automatic route permitted in telecom sector. No Spectrum Usage Charge (SUC) for spectrum acquired in future
spectrum auctions. Spectrum sharing encouraged: The additional SUC of 0.5 per cent for
spectrum sharing removed.Process Reforms
Requirement of customs clearance for import of wireless equipment removed and replaced with self-declaration to improve the ease of doing business.
Standing Advisory Committee on Radio Frequency Allocation clearance process for installing towers shall be through self-declaration/ automated time-bound approvals on SaralSanchar portal of Department of Telecom.
Self-KYC permitted now through an app/web- based process. Paper Customer Acquisition Forms will be replaced by digital storage
of data.

36 Economic Survey 2021-22
Auction calendar fixed: Spectrum auctions to be normally held in the last quarter of every financial year.
l Along with this, various measures were undertaken to address liquidity requirement of telecom service providers including moratorium/deferment on payments of dues arising out of the adjusted gross revenue judgement or due payments of spectrum purchased in past auctions (excluding the auction of 2021).
Public procurement policy
New guidelines for procurement and project management were announced in October 2021
Quality-cum-Cost Based Selection for the selection of bidders for works and non-consultancy services allowed as well.
Stringent deadlines for making payments: The new guidelines stipulate timely release of payments of 75 per cent or more of bills raised within 10 working days of the submission of the bill. The remaining bill payment is to be made after final checking within 28 working days.
Arbitration and dispute resolution: Procuring authorities to set a special board/committee to review the case before filing an appeal against any order. Government has allowed for the release of 75 per cent of the amount to contractors against a bank guarantee in cases where a procuring agency has challenged an arbitral award.
Aviation Drone Rules (announced in August 2021)
Extended applicability of rules: Drones up to 500 kg are now subject to regulations, compared to the earlier limit of 300 kg.
Several approvals abolished with the total forms to be filled reduced from 25 to 5.
Types of fees reduced from 72 to 4. Quantum of fees to be paid considerably reduced and delinked with the
size of drone. Removal of requirement of prior security clearance. Earlier restrictions on all foreign entities owning, manufacturing or
dealing with drones in India has been done away with. No remote pilot licence required for micro drones (for non-commercial
use) and nano drones. Expanded area of drone operations: An interactive map on the Digital
Sky platform specifies colour-coded zones on the map i.e. green, yellow and red, indicating free zones, those which require prior permission, and no-fly zones, respectively. The perimeters of these zones have also been liberalised to increase freely accessible airspace under the green category.
Financial sector l Banking: Reforms in Deposit Insurance
Increase in deposit insurance from ` 1 lakh to ` 5 lakh per depositor per bank. This led to 98.1 per cent of the total number of accounts being fully protected and 50.9 per cent of total deposits being insured at end-March 2021.

37State of the Economy
l
Introduced interim payments: Interim payment will be made by Deposit Insurance and Credit Guarantee Corporation (DICGC) to depositors of those banks for whom any restrictions/ moratorium have been imposed by RBI under the Banking Regulation Act resulting in restrictions on depositors from accessing their own savings.
Timeline of maximum of 90 days has been fixed for providing interim payment to depositors.
Expansion in the factoring ecosystem: The earlier condition of NBFCs whose principal business was factoring has been removed and now all NBFCs are permitted to undertake factoring business.
Micro Small & Medium Enterprises (MSMEs)
l Revised definition of MSMEs: Removal of distinction between manufacturing and service MSMEs. Upward revised definition of MSMEs in industry and service sector.
The upper limit as per new definition is as follows:
Investment in Plant and Machinery or Equipment
Annual Turnover
Micro < `1 crore < ` 5 croreSmall < ` 10 crore < ` 50 croreMedium < ` 50 crore < ` 250 crore
l
l
Simplified registration process for MSMEs.Increasing market access to micro and small industries (MSEs) under public procurement policy: All Central Ministries, Government Departments and CPSEs are required to procure 25 per cent of their annual requirements of goods and services from MSEs. Further, no global tenders for procurement up to ` 200 crores.
Space & Geospatial sector
l
l
Liberalizing the traditional Satellite Communication and Remote Sensing sectors for increased private sector participation.Guidelines for the creation, acquisition and use of geospatial data, including maps: Geospatial data was previously heavily regulated and required licenses to be obtained for the use of such data. Now the guidelines have been liberalised: Introduction of self-certification regime: All entities are now required
to follow a self-certification process to show adherence to the guidelines, as opposed to obtaining prior approval or licenses for the use of geospatial data and maps.
Relaxation of restricted areas: Mapping activities are prohibited only for specific attributes of highly sensitive locations, as opposed to restricted areas under the previous regime.
Relaxation on export restrictions: The guidelines permit the export of maps with resolutions up to a 1:100 resolution thereby relaxing the previous threshold of 1:250000.
Open access to publicly funded data: The guidelines require all geospatial data produced using public funds, including data produced by the Survey of India, to be freely accessible to all Indian entities.
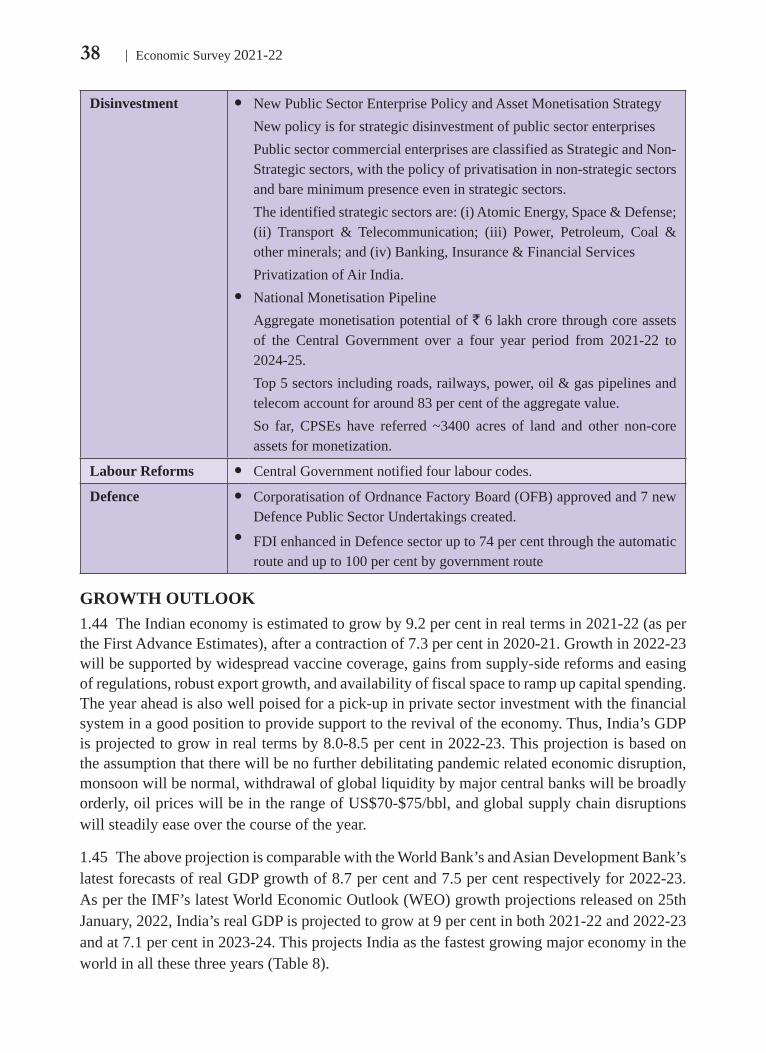
38 Economic Survey 2021-22
Disinvestment l
l
New Public Sector Enterprise Policy and Asset Monetisation StrategyNew policy is for strategic disinvestment of public sector enterprisesPublic sector commercial enterprises are classified as Strategic and Non-Strategic sectors, with the policy of privatisation in non-strategic sectors and bare minimum presence even in strategic sectors.The identified strategic sectors are: (i) Atomic Energy, Space & Defense; (ii) Transport & Telecommunication; (iii) Power, Petroleum, Coal & other minerals; and (iv) Banking, Insurance & Financial ServicesPrivatization of Air India.National Monetisation PipelineAggregate monetisation potential of ` 6 lakh crore through core assets of the Central Government over a four year period from 2021-22 to 2024-25.Top 5 sectors including roads, railways, power, oil & gas pipelines and telecom account for around 83 per cent of the aggregate value.So far, CPSEs have referred ~3400 acres of land and other non-core assets for monetization.
Labour Reforms l Central Government notified four labour codes.
Defence l
l
Corporatisation of Ordnance Factory Board (OFB) approved and 7 new Defence Public Sector Undertakings created.
FDI enhanced in Defence sector up to 74 per cent through the automatic route and up to 100 per cent by government route
GROWTH OUTLOOK1.44 The Indian economy is estimated to grow by 9.2 per cent in real terms in 2021-22 (as per the First Advance Estimates), after a contraction of 7.3 per cent in 2020-21. Growth in 2022-23 will be supported by widespread vaccine coverage, gains from supply-side reforms and easing of regulations, robust export growth, and availability of fiscal space to ramp up capital spending. The year ahead is also well poised for a pick-up in private sector investment with the financial system in a good position to provide support to the revival of the economy. Thus, India’s GDP is projected to grow in real terms by 8.0-8.5 per cent in 2022-23. This projection is based on the assumption that there will be no further debilitating pandemic related economic disruption, monsoon will be normal, withdrawal of global liquidity by major central banks will be broadly orderly, oil prices will be in the range of US$70-$75/bbl, and global supply chain disruptions will steadily ease over the course of the year.
1.45 The above projection is comparable with the World Bank’s and Asian Development Bank’s latest forecasts of real GDP growth of 8.7 per cent and 7.5 per cent respectively for 2022-23. As per the IMF’s latest World Economic Outlook (WEO) growth projections released on 25th January, 2022, India’s real GDP is projected to grow at 9 per cent in both 2021-22 and 2022-23 and at 7.1 per cent in 2023-24. This projects India as the fastest growing major economy in the world in all these three years (Table 8).

39State of the Economy
Table 8: Overview of the World Economic Outlook Projections
Year over Year (Percent change, unless noted otherwise)
Country/Country groups Estimate Projections2020 2021 2022 2023
World Output –3.1 5.9 4.4 3.8Advanced Economies –4.5 5.0 3.9 2.6United States –3.4 5.6 4.0 2.6Euro Area –6.4 5.2 3.9 2.5 Germany –4.6 2.7 3.8 2.5 France –8.0 6.7 3.5 1.8 Italy –8.9 6.2 3.8 2.2 Spain –10.8 4.9 5.8 3.8Japan –4.5 1.6 3.3 1.8United Kingdom –9.4 7.2 4.7 2.3Canada –5.2 4.7 4.1 2.8Other Advanced Economies* –1.9 4.7 3.6 2.9Emerging Market and Developing Economies
–2.0 6.5 4.8 4.7
Emerging and Developing Asia –0.9 7.2 5.9 5.8 China 2.3 8.1 4.8 5.2 India** –7.3 9.0 9.0 7.1 ASEAN*** –3.4 3.1 5.6 6.0Emerging and Developing Europe
–1.8 6.5 3.5 2.9
Russia –2.7 4.5 2.8 2.1Latin America and the Caribbean –6.9 6.8 2.4 2.6 Brazil –3.9 4.7 0.3 1.6 Mexico –8.2 5.3 2.8 2.7Middle East and Central Asia –2.8 4.2 4.3 3.6 Saudi Arabia –4.1 2.9 4.8 2.8Sub-Saharan Africa –1.7 4.0 3.7 4.0 Nigeria –1.8 3.0 2.7 2.7 South Africa –6.4 4.6 1.9 1.4
Source: IMF WEO, January 2022 Update* Excludes the Group of Seven (Canada, France, Germany, Italy, Japan, United Kingdom, United States) and euro area countries.** For India, data and forecasts are presented on a fiscal year basis, with FY 2021/2022 starting in April 2021. For the January 2022 WEO Update, India's growth projections are 8.7 per cent in 2022 and 6.6 percent in 2023 based on calendar year. The impact of the Omicron variant is captured in the column for 2021 in the table.*** Indonesia, Malaysia, Philippines, Thailand, Vietnam.

40 Economic Survey 2021-22
ANNEX
List of 80 High Frequency Indicators (HFIs)
1 10 year AAA Corporate Bond yield2 10 year G-Sec yield3 8-Core Industries Index4 Aadhar-enabled payment system (AePS) transactions5 ATM withdrawals6 Average Daily Electronic Toll Collection (ETC)7 Average Retail price (Wheat, Rice, Tur, Sugar, Potato, Onions, Tomato, Groundnuts,
Palm Oil, Eggs, Milk)8 Baltic Dry Index9 Bank credit
10 Capacity Utilisation11 Capital Expenditure12 Cement production13 Commercial Papers (CP)14 Corporate sector profits15 Consumer Price Index16 Consumer Price Index Core17 Consumer Price Index Food18 Crude oil Indian basket19 Crudeprice Brent, Dubai, West Texas Intermediate20 Currency in circulation21 Demat accounts22 Domestic Auto sales23 Domestic Passenger vehicles sales24 Domestic Tractor sales25 Domestic air passenger traffic26 Employees' Provident Fund Organisation Net Subscribers outstanding27 E-way bills generated28 Exchange Rate29 External Commercial Borrowings30 Fertilisers sales31 Forex reserves

41State of the Economy
32 Fuel consumption33 Government Market Borrowings34 Global PMI Composite35 Gross Foreign Direct Investment36 Gross tax revenue (Central Govt)37 Goods and Services Tax collections38 Housing Launches39 Housing sales40 Index of Industrial Production General Index, Consumer Durables, Consumer Non-
Durables41 Merchandise Exports/Imports42 MGNREGA work created43 MGNREGA work demanded44 Money supply45 Natural gas production46 Net FDI47 Net Foreign Portfolio Investment48 Net Liquidity injections49 Net purchase (+)/sale (-) of US dollar50 Nifty/Sensex51 Nominal Effective Exchange Rate (NEER)52 Non food credit53 Non oil exports54 Non oil non gold imports55 Number of Telecom subscribers56 Purchasing Managers' Index Manufacturing57 Purchasing Managers' Index Services58 Port Cargo Traffic59 Power Consumption60 Primary Issuances61 Private placement of Corporate Bonds62 Rail Freight Traffic63 Rail Passenger Earnings
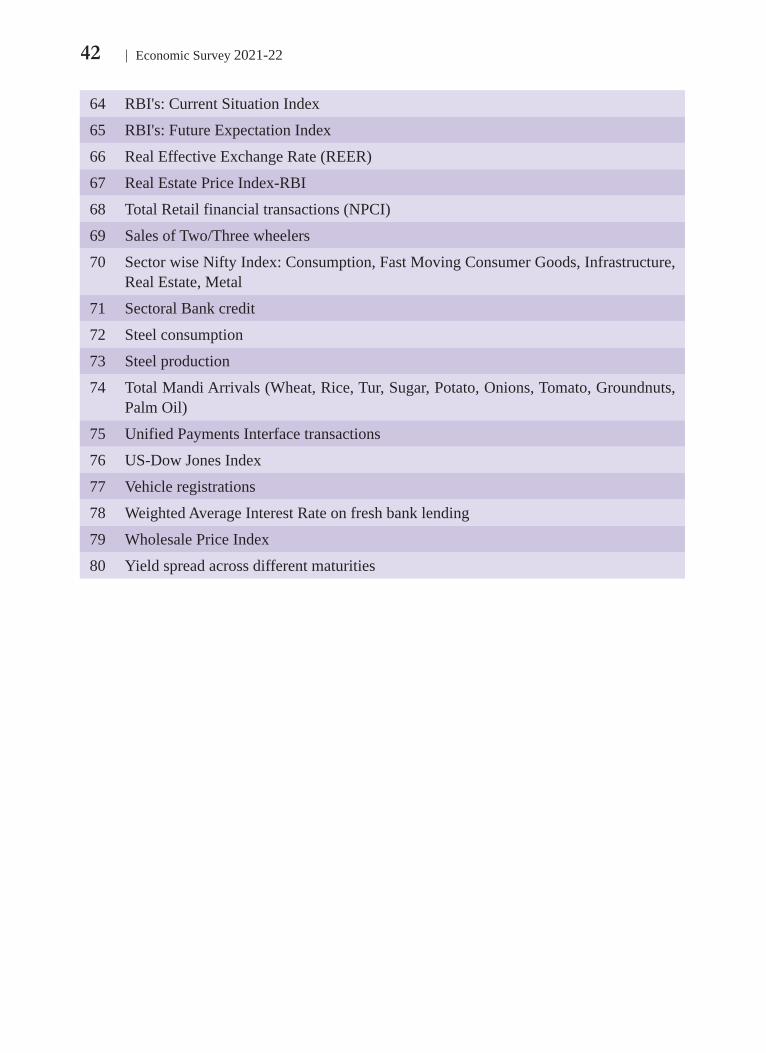
42 Economic Survey 2021-22
64 RBI's: Current Situation Index65 RBI's: Future Expectation Index66 Real Effective Exchange Rate (REER)67 Real Estate Price Index-RBI68 Total Retail financial transactions (NPCI)69 Sales of Two/Three wheelers70 Sector wise Nifty Index: Consumption, Fast Moving Consumer Goods, Infrastructure,
Real Estate, Metal71 Sectoral Bank credit72 Steel consumption73 Steel production74 Total Mandi Arrivals (Wheat, Rice, Tur, Sugar, Potato, Onions, Tomato, Groundnuts,
Palm Oil)75 Unified Payments Interface transactions76 US-Dow Jones Index77 Vehicle registrations78 Weighted Average Interest Rate on fresh bank lending79 Wholesale Price Index80 Yield spread across different maturities

CHAPTER
02
In the backdrop of an evolving pandemic situation, Government of India’s agile policy response differed from the waterfall strategy of introducing front-loaded stimulus packages, adopted by most other countries in 2020. Immediately after the COVID-19 outbreak, Government of India chose to first create safety-nets for the vulnerable sections of the society/ small businesses before going on to introduce stimulus packages to boost economic recovery in the second half of 2020-21. On the fiscal front, capital expenditure was restrained during Q1 and Q2 of 2020-21 owing to movement restrictions in containment zones, and unavailability of contractors/workers to carry out capital works. However, with the easing of movement and health-related restrictions, capital spending was pushed up in Q3 of 2020-21. Thus, the change in the mix of stimulus effected in 2020-21 towards a larger share of capital spending, has continued in the current year as well. The stimulus measures announced so far during the year 2021-22 include liquidity enhancing and investment boosting measures such as the Production Linked Incentives scheme, credit guarantee schemes and export boosting initiatives.
With the bouncing back of the economy in the current financial year, the revenue receipts of the central government during April to November 2021 have gone up by 67.2 per cent (YoY), as against an expected growth of 9.6 per cent in the 2021-22 Budget Estimates (over 2020-21 Provisional Actuals). The buoyant tax collections of both direct and indirect taxes, along with the non-tax revenue boosted by RBI’s surplus transfer to the Government, have contributed to the increase in the revenue pool. The gross tax revenue during this period has registered a growth of over 50 per cent in YoY terms. This performance is strong not only over the corresponding period of the previous year but also when compared to the pre-pandemic levels of 2019-20. The gross monthly GST collections have crossed the ` 1 lakh crore mark consistently since July 2021, after quickly recovering from a dip in June 2021 following the second wave of COVID-19. The impact of the second wave of COVID-19 on GST collections was much more muted as compared to the first wave. The ongoing improvement in revenue performance during the current year can also be attributed to increased tax compliance enabled by various tax administration and policy reforms implemented by the Government in the past few years.
The New Public Sector Enterprise Policy and Asset Monetisation Strategy introduced by the Government reaffirm its commitment towards privatization and strategic disinvestment
Fiscal Developments

44 Economic Survey 2021-22
INTRODUCTION2.1 Over the lasttwoyears,fiscalpolicyhasremainedasignificant toolforaddressingtheeconomicfalloutofthepandemic.GovernmentofIndiahasadoptedacalibratedfiscalpolicyapproachtothepandemic,whichhadtheflexibilityofadaptingtoanevolvingsituationinordertosupportthevulnerablesectionsofsociety/firmsandenablearesilientrecovery.India’suniqueagilepolicyresponsedifferedfromthewaterfallstrategy1ofintroducingfront-loadedstimuluspackages,adoptedbymostothercountriesin2020.Suchanadaptiveapproachhasnowbeenwidelyacceptedinthepolicycircles(IMFFiscalMonitorOctober2021).
2.2 Thischapterreviewsthefiscaldevelopments inIndiaintheaftermathof thepandemicoutbreak.Itbeginswithfiscalpolicystrategyandperformanceofthefiscalparametersinthecurrentyear2021-22, followedby adetailed analysisof themedium to long-term trends inCentral,StateandGeneralGovernmentfinances.ThechapterconcludeswithadiscussiononpolicymeasurestoenhanceefficiencyofGovernmentspending.
of Public Sector Enterprises. The privatisation of Air India has been particularly important, not only in terms of garnering disinvestment proceeds but also for boosting the privatisation drive.
The expenditure policy of the central government during 2021-22 has a strong emphasis on capital expenditure. The Budget 2021-22 had not only enhanced the expenditure estimates but also directed them towards more productive capital expenditure. The capital expenditure shows an increasing trend over the first three quarters of 2021-22. During April- November 2021, the capital expenditure has grown by 13.5 per cent (YoY), with focus in infrastructure-intensive sectors like roads and highways, railways, and housing and urban affairs. This increase is particularly substantial given the high YoY growth in capital expenditure registered during the corresponding period of the previous year as well. In addition, the Centre has also put in place several incentives to boost the capital expenditure by the States.
On account of a sustained revenue collection and a targeted expenditure policy by the Government of India, the fiscal deficit for April to November 2021 has been contained at 46.2 per cent of BE which is nearly one third of the proportion reached during the same period of the previous two years (135.1 per cent of BE in April-November 2020 and 114.8 per cent of BE in April-November 2019). The fiscal deficit budgeted in the current year was more realistic as it brought in several off-budget items to within the budget allocation such as the food subsidy requirements of FCI. With the enhanced borrowings on account of COVID-19, the Central Government debt has gone up from 49.1 per cent of GDP in 2019-20 to 59.3 per cent of GDP in 2020-21, but is expected to follow a declining trajectory with the recovery of the economy. The General Government finances are also expected to witness a consolidation during 2021-22, after the uptick in deficit and debt indicators during the pandemic year 2020-21.
1Waterfallstrategyasexplainedinchapter1oftheSurvey

45Fiscal Developments
FISCAL POLICY STRATEGY IN THE AFTERMATH OF THE PANDEMIC OUTBREAK2.3 TheagilefiscalpolicyresponseadoptedbyGovernmentofIndiaencompassedachangeinmixofthestimulusmeasuresamidstanuncertainevolutionofthepandemicsituation.Intheinitialphaseofthepandemic,thefiscalpolicyfocusedonbuildingsafety-netsforthepoorandvulnerablesectionsofsocietytohedgeagainsttheworst-caseoutcomes.Stimulusmeasuressuchasdirectbenefittransferstothevulnerablesections,emergencycredittothesmallbusinesses,and theworld’s largest food subsidy programme targeting 80.96 crore beneficiaries enabledthecreationofsafety-nets,byensuringthattheessentialsaretakencareof.Thiswasfollowedby a series ofstimuluspackages spread throughout theyear2020-21, drivenby aBayesianupdatingofinformationasthesituationevolved.Withtherestorationofeconomicactivities,thefiscalresponsefocusedonstimulatingdemandintheeconomy.Duringthisphaseofeconomicrecovery, the stimulus mix included investment boosting measures like Production LinkedIncentives(PLI),stepstoencourageinvestmentininfrastructuresectorandenhancingcapitalexpenditurebytheCentralandstateGovernments(Figure 2 A to 2 D).
2.4 Thisenhancedfocusoncapitalexpenditureinthesecondhalfoftheyear2020-21isreflectiveof theresponsivefiscalpolicywhichGovernmentofIndiahasadoptedagainstCOVID-19.Duetomovementrestrictionsincontainmentzones,andunwillingnessor inabilityofcontractorsandworkers tocarryoutworks, thequarterlycapitalexpenditurewas restrainedduring thefirst twoquartersof2020-21.Withtheeasingofmovementandhealth-relatedrestrictionsinQ3of2020-21,thecapitalspendingwaspushedforencouragingexpenditureinsectorswiththemostpositiveeffectontheeconomy.Thefocusoncapitalspendinghasbeensustainedduringthecurrentfiscal,asthecapitalexpenditureshowsanincreasingtrendduringthefirstthreequartersof2021-22(Figure 1).
Figure 1: Trends in quarterly capital expenditure
Lockdown
Post first wave ramp-up
Sustained capital spending
40
60
80
100
120
140
160
Q1-
FY20
19
Q2-
FY20
19
Q3-
FY20
19
Q4-
FY20
19
Q1-
FY20
20
Q2-
FY20
20
Q3-
FY20
20
Q4-
FY20
20
Q1-
FY20
21
Q2-
FY20
21
Q3-
FY20
21
Q4-
FY20
21
Q1-
FY20
22
Q2-
FY20
22
Q3-
FY20
22 (E
st)
₹ Th
ousa
nd cr
ore
Source:CGAMonthlyAccountsNote:TheestimateforQ3FY2021-22usesflashfiguresforDec2021.

46 Economic Survey 2021-22
2.5 Building on the same approach, the Union Budget 2021-22 had enhanced the budgetoutlays for the more productive capital expenditure. The Government budgeted for a 34.5percentgrowthincapitalexpenditureover2020-21BE–withemphasisonrailways,roads,urban transport, power, telecom, textiles and affordable housing amid continued focus on theNationalInfrastructurePipeline.TheNationalInfrastructurePipelinecovering6835projectswasexpanded to7400projects inBudget2021-22. Inorder tounlock thedomesticmanufacturingpotentialacrosssectors,suchasrenewableenergy,heavyindustry,agriculture,automotiveandtextiles,Budget2021-22launchedPLIschemesfor13sectors,withanoutlayof`1.97lakhcrore,foraperiodof5yearsstartingfrom2021-22.All these initiativesareexpected tocollectivelygenerateemploymentandboostoutputinthemediumtolongtermthroughmultiplier-effects.Thestimulusmeasuresannouncedduringtheyear2021-22havecontinuedtheemphasisonliquidityenhancingandinvestmentboostingmeasuressuchasthePLIScheme,creditguaranteeschemesandexportboostinginitiativestosupporttherevivingeconomy,apartfromprovidingfreefoodgrainstothepoor(Figure 2E).ThedetailsmaybeseenatBox 1.Inlinewiththeagileapproach,thismixcanbechangedagainaspertherequirementoftheevolvingsituation.
Figure 2: Changing mix of stimulus announcements in 2020-21 and 2021-22
2C. October 2020 (`73,000 crore) 2D. November 2020 (`2,65,080 crore)
2B. May - June 2020 (`11,85,561 crore)2A. March 2020 (`1,92,800 crore)

47Fiscal Developments
Agriculture2%
Food21%
Health4%
Investment boosting
17%
Export boosting17%
Liquidity enhancing
39%
2E. June to December 2021 (`6,97,338 crore)
Source:PIBNote:DetailsofstimulusannouncementsfromJunetoDecember2021maybeseenatBox1.
Box 1: STIMULUS ANNOUNCEMENTS DURING 2021-22
InordertoreducetheimpactoftheshockcausedbytheCOVID-19secondwaveandsupporttherecoveringeconomy,GovernmentofIndiaannouncedadditionalreliefmeasuresin2021-22whichhavebeenlistedinthetablebelow.Thesemeasuresweretargetedtowardsprovidingeconomicreliefto the vulnerable people and sectors, strengthening the health system, and providing impetus togrowthandemployment.
Details of the measures Amount (` Crore)
June 2021 (`6.29 lakh crore)
Stimulus package for COVID-19 relief 6,28,993
LoanGuaranteeSchemeforCOVID-19affectedsectors 1,10,000
EmergencyCreditLineGuaranteeScheme(ECLGS) 1,50,000
CreditGuaranteeSchemeforMicroFinanceinstitutions 7,500
Schemefortouristguides/stakeholders -
Freeonemonthtouristvisato5lakhtourists 100
ExtensionofAtmaNirbharBharatRozgarYojana -
AdditionalsubsidyforDAP&P&Kfertilizers 14,775
FreefoodgrainsunderPMGKY(MaytoNovember,2021) 93,869
Newschemeforpublichealth 15,000
Releaseofclimateresilientspecialtraitsvarieties -

48 Economic Survey 2021-22
RevivalofNorthEasternRegionalAgriculturalMarketing Corporation(NERAMAC) 77
BoostforprojectexportsthroughNEIA 33,000
Boosttoexportinsurancecover 88,000BroadbandtoeachvillagethroughBharatNetPPPModel 19,041ExtensionoftenureofPLIschemeforlargescaleelectronicman-ufacturingReformbasedresultlinkedpowerdistributionscheme (Budgetannouncement) 97,631
July 2021 (`23,123 crore)
IndiaCOVID-19EmergencyResponse&HealthSystem preparednesspackage:Phase-II
23,123(Centre Share-`15,000 cr;
State Share-`8,123 cr)
December 2021(`53,344 crore)ExtensionofPMGaribKalyanAnnYojana (December2021-March2022) 53344.5
Source:PIB
PERFORMANCE OF FISCAL INDICATORS DURING 2021-222.6 ThissectionanalysestheperformanceoffiscalindicatorsandtheircomponentsfortheperiodApriltoNovember2021.ThedataonGovernmentaccountsforApriltoNovember2021,releasedbytheControllerGeneralofAccounts,showthatthefiscaldeficitoftheCentralGovernmentatendNovember2021stoodat46.2percentoftheBEcomparedto135.1percentduringthesameperiodin2020-21and114.8percentduringthesameperiodin2019-20(Figure 4).Duringthisperiodbothfiscaldeficitandprimarydeficitstoodatlevelsmuchbelowthecorrespondinglevelsintheprevioustwoyears.TheprimarydeficitduringtheperiodApriltoNovember2021turnedupatnearlyhalfofthelevelithadreachedduringApriltoNovember2019(Figure 3).
8.1
4.7
10.8
6.97.0
2.4
02468
1012
Fiscal Deficit Primary Deficit
₹la
kh c
rore
Apr-Nov 2019 Apr-Nov 2020 Apr-Nov 2021
114.8 135.1
46.20
20406080
100120140160
Apr
- Nov
2019
Apr
- Nov
2020
Apr
- Nov
2021
As a
per
cen
t of B
E
Figure 3: Trends in Fiscal deficit and primary deficit
Figure 4: Fiscal deficit as a per cent of Budget estimate
Source:CGAMonthlyAccounts

49Fiscal Developments
Table 1: Provisional Outcome for 2021-22 (April to November 2021)
2021-22 BE
In ` lakh crore
Percentage of respective BE YoY Growth (per cent)
2020-21
2021-22
2020-21
2021-22
FY21 over FY20
FY22 over FY21
FY22 over FY20
1 RevenueReceipts 17.88 8.13 13.59 40.2 76.0 -17.3 67.2 38.2
2 Grosstaxrevenue 22.17 10.26 15.42 42.3 69.5 -12.6 50.3 31.3
3 AssignmenttoStates 6.66 3.34 4.03 42.6 60.5 -20.7 20.4 -4.5
4 TaxRevenue(nettoCentre) 15.45 6.88 11.35 42.1 73.5 -8.3 64.9 51.2
5 NonTaxRevenue 2.43 1.24 2.23 32.3 91.8 -46.6 79.5 -4.1
6 NonDebtCapitalReceipts 1.88 0.18 0.21 8.1 11.0 -37.5 14.1 -28.6
7 NonDebtreceipts 19.76 8.31 13.79 37.0 69.8 -17.9 66.0 36.2
8 TotalExpenditure 34.83 19.06 20.75 62.7 59.6 4.7 8.8 14.0
9 RevenueExpenditure 29.29 16.65 18.01 63.3 61.5 3.7 8.2 12.1
10 CapitalExpenditure 5.54 2.41 2.74 58.5 49.4 12.8 13.5 28.0
11 RevenueDeficit 11.41 8.52 4.43 139.9 38.8 36.8 -48.1 -28.9
12 FiscalDeficit 15.07 10.76 6.96 135.1 46.2 33.1 -35.3 -13.9
13 PrimaryDeficit 6.97 6.92 2.35 785.3 33.8 48.5 -66.0 -49.5
Source:CGAMonthlyAccounts;BE:BudgetEstimates
Revenue collection
2.7 TheperiodApril toNovember2021witnessedastrengtheningoffiscalpositionbytheCentralGovernment,whichwasledbybuoyantrevenuecollectionandexpenditureallocationstargetedtowardscapitalexpenditure.Revenuereceiptshavegrownatamuchhigherpaceduringthecurrentfinancialyear (April toNovember2021) compared to thecorrespondingperiodsduringthelasttwoyears(Table 1).Thisperformanceisattributabletoconsiderablegrowthinbothtaxandnon-taxrevenue.
2.8 NettaxrevenuetotheCentre,whichwasenvisagedtogrowat8.5percentin2021-22BErelativeto2020-21PA,grewat64.9percentduringApriltoNovember2021overApriltoNovember2020andat51.2percentoverApriltoNovember2019(Table 1).Thisimprovedperformanceintaxrevenuesisduetohighgrowthshownbyallmajordirectandindirecttaxeswithrespecttothesameperiodofthelasttwoyears.Withindirecttaxes,personalincometaxhasgrownat47.2percentoverApril-November2020andat29.2percentovertheApril-November
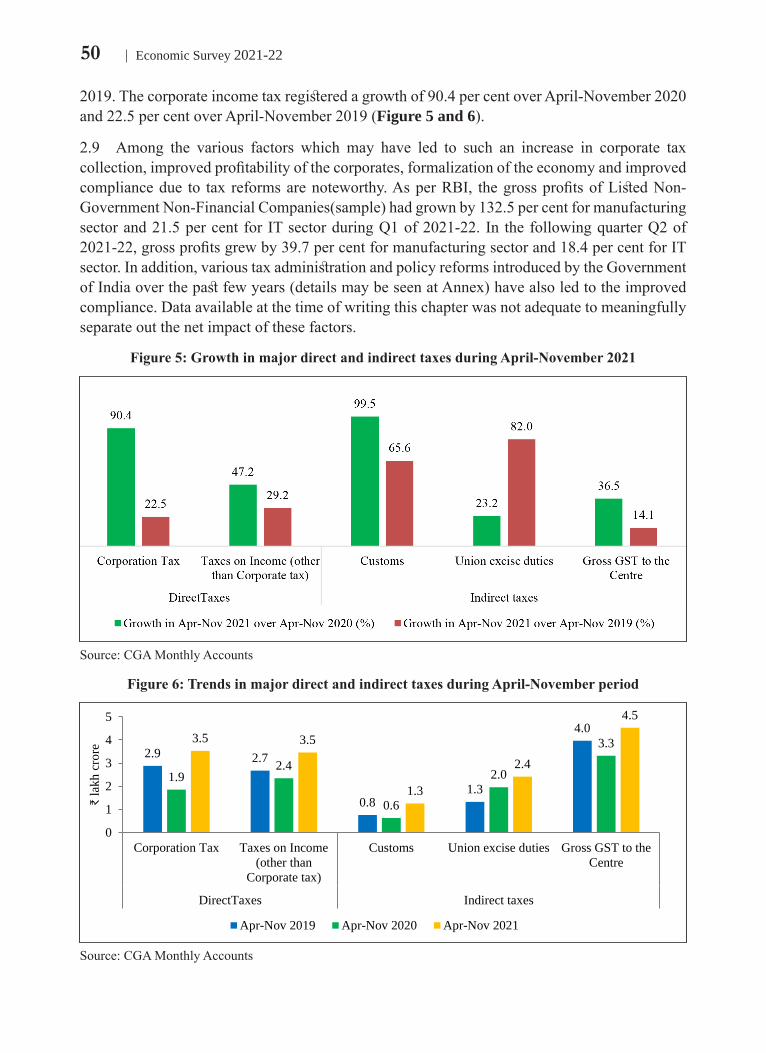
50 Economic Survey 2021-22
2019.Thecorporateincometaxregisteredagrowthof90.4percentoverApril-November2020and22.5percentoverApril-November2019(Figure 5 and 6).
2.9 Among the various factors which may have led to such an increase in corporate taxcollection,improvedprofitabilityofthecorporates,formalizationoftheeconomyandimprovedcompliancedue to tax reformsarenoteworthy.AsperRBI, thegrossprofitsofListedNon-GovernmentNon-FinancialCompanies(sample)hadgrownby132.5percentformanufacturingsectorand21.5percent for ITsectorduringQ1of2021-22. In thefollowingquarterQ2of2021-22,grossprofitsgrewby39.7percentformanufacturingsectorand18.4percentforITsector.Inaddition,varioustaxadministrationandpolicyreformsintroducedbytheGovernmentofIndiaoverthepastfewyears(detailsmaybeseenatAnnex)havealsoledtotheimprovedcompliance.Dataavailableatthetimeofwritingthischapterwasnotadequatetomeaningfullyseparateoutthenetimpactofthesefactors.
Figure 5: Growth in major direct and indirect taxes during April-November 2021
Source:CGAMonthlyAccounts
Figure 6: Trends in major direct and indirect taxes during April-November period
2.9 2.7
0.81.3
4.0
1.92.4
0.6
2.0
3.33.5 3.5
1.3
2.4
4.5
0
1
2
3
4
5
Corporation Tax Taxes on Income(other than
Corporate tax)
Customs Union excise duties Gross GST to theCentre
DirectTaxes Indirect taxes
₹la
kh c
rore
Apr-Nov 2019 Apr-Nov 2020 Apr-Nov 2021
Source:CGAMonthlyAccounts

51Fiscal Developments
2.10 TheindirecttaxreceiptshaveregisteredaYoYgrowthof38.6percentinthefirsteightmonthsofthisfiscalyear.Theriseinimportsofgoodsandservicesensuedduetotherecoveryinbothmanufacturingsectorandconsumptiondemand,haveledtoariseincustomscollection.TherevenuecollectionfromcustomsduringApriltoNovember2021hasregisteredagrowthofalmost100percentoverApriltoNovember2020andover65percentcomparedtoApriltoNovember2019.
2.11 TherevenuefromexcisedutieshasregisteredaYoYgrowthof23.2percentduringApril-November2021.TheGovernmenthad raised the excisedutyonpetrol anddiesel togarnerrevenuesduringtheyear2020-21,whenthecollectionofotherdirectandindirecttaxeswasadverselyimpactedbyCOVID-19andlowglobalpetroleumpricescreatedsomeelbow-roomforraisingtaxesonpetroleum.TherevenuefromexcisedutyregisteredanYoYgrowthofmorethan60percentin2020-21PA.HoweverbytheendofNovember2021,whentheglobaloilpriceshadincreased,othertaxrevenuesourceshadrecoveredandinflationarypressureswerebuildingupintheeconomy,thegovernmentchangedits’policyaspertherequirementofthesituation,andtheCentralexcisedutyonpetrolanddieselwasreduced.Sucharesponsivefeedback-basedpolicymakingbytheGovernmentisimperativeforensuringefficientmanagementoflimitedfiscalresourcesintheeconomy.TheRevisedEstimateswouldgivemoreclarityontheimpactofexcisedutycutonthetaxrevenueduringthecurrentyear.
2.12 Withtherevivaloftheeconomy,theGoodsandServicesTaxhasemergedasabuoyantsourceofrevenueforboththeCentreandtheStates.TheGSTcollectionsfortheCentrewere61.4percentofBEduringApriltoNovember2021.GrossGSTcollections,CentreandStatestakentogether,were`10.74lakhcroreduringApril toDecember2021,whichisanincreaseof61.5percentoverApriltoDecember2020and33.7percentoverApriltoDecember2019.Notably,theaveragemonthlygrossGSTcollectionforthethirdquarterofthecurrentyearwas ` 1.30 lakh crore, higher than the average monthly collection of ` 1.10 lakh crore and `1.15lakhcroreinthefirstandsecondquartersrespectively.
2.13 Afterfallingduringthephaseofnationwidelockdownin2020-21andduringthesecondCOVID-19waveinIndia, therewasaquickrecoveryinmonthlyGSTcollections.Figure 7 showsthattheimpactofthesecondwaveofCOVID-19onGSTcollectionswasmuchmoremutedthantheimpactofnationwidelockdownduringthefirstwave.Overthelast4years,GSTrevenueshavesteadilygrownandtheyear-averageofmonthlyGSTcollectionhasincreasedfrom0.9lakhcrorein2017-18to1.19lakhcrorein2021-22(uptoDecember)(Figure 8).Theimprovement inGSTcollectionshasbeendue to thecombinedeffectof therapideconomicrecoverypostpandemic,thenation-widedriveagainstGSTevadersandfakebillsalongwithmanysystemicchangesintroducedrecently,andvariousraterationalizationmeasuresundertakenbytheGSTCounciltocorrectinverteddutystructure.

52 Economic Survey 2021-22
Nationwide lockdown
Second COVID
wave
0
0.2
0.4
0.6
0.8
1
1.2
1.4
1.6D
ec-1
9
Feb-
20
Apr
-20
Jun-
20
Aug
-20
Oct
-20
Dec
-20
Feb-
21
Apr
-21
Jun-
21
Aug
-21
Oct
-21
Dec
-21
₹la
kh c
rore
Figure 7: Buoyant GST collections during 2021-22
0.90
0.98 1.011.08
1.19
0.6
0.7
0.8
0.9
1.0
1.1
1.2
1.3
2017-18 2018-19 2019-20 2020-21 2021-22(uptoDec)
₹la
kh c
rore
Figure 8: Rising year-average of monthly Gross GST collections
Source:DepartmentofRevenue
2.14 The non-tax revenue collections up to November 2021 registered anYoY increase of 79.5percent.Thisincreasewasdrivenbydividendsandprofits,whichstoodat`1.28lakhcroreagainstBEof`1.04lakhcrore.Thekeycomponentofdividendsandprofitsduringthisperiodwas`0.99lakhcroresurplustransferfromRBItotheCentralGovernment.
2.15 Thenon-debtcapitalreceiptsincluderecoveryofloansanddisinvestmentreceipts.TheBudget 2021-22 had envisaged to mobilise ` 1.75 lakh crore from disinvestment proceedsthisyear.Sofar,thegovernmenthasbeenabletoraise`9330crore(ason24January2022)fromdisinvestment.The recently introducedNewPublicSectorEnterprisePolicyandAssetMonetisationStrategybytheGovernmentreaffirmitscommitmenttowardsprivatizationandstrategicdisinvestmentofPublicSectorEnterprises.TheprivatisationofAir Indiahasbeenparticularly important, not only in terms of garnering disinvestment proceeds but also forboostingtheprivatisationdrive.Thedetailsofdisinvestmentduring2021-22andnewinitiativesbeingundertakenbyDepartmentof InvestmentandPublicAssetManagement (DIPAM)aregiveninBox 2.
Expenditure
2.16 The expenditure policy of the government during 2021-22 has been characterized byrestructuringandprioritizationofspendinginsectorswhichhavealong-termimpactonoutput.ThetotalexpenditureoftheGovernmentincreasedby8.8percentduringApriltoNovember2021andstoodat59.6percentofBudgetEstimate.Whiletherevenueexpenditurehasgrownby8.2percentduringthefirsteightmonthsof2021-22overthesameperiodin2020-21,thenon-interestrevenueexpendituregrewby4.6percentoverApriltoNovember2020(Figure 9).

53Fiscal Developments
Figure 9: Growth in expenditure components during April to November 2021
Source:CGAMonthlyAccounts
2.17 During April to November 2021, the expenditure on major subsidies stood at ` 2.31 lakh crore. The components of expenditure on major subsidies may be seen in Figure 10.FoodsubsidybeingthemajorcomponentoftotalsubsidieswasattwothirdofitsBEi.e. `1.64lakhcroreduringthefirsteightmonthsof2021-22.TheimplementationofPradhanMantriGaribKalyanAnnYojana–PhaseIII(MaytoJune2021),PhaseIV(JulytoNovember2021)andPhaseV(December toMarch2022),announcedduring2021-22,wouldentailanestimatedfoodsubsidyrequirementof`1.47lakhcrore.ThisschemeprovidesfreefoodgrainstobeneficiariesoverandabovetheregularmonthlyNFSAfood-grains.
Figure 10: Expenditure on Subsidies during April to November 2021
₹ 2.31 lakh cr ₹ 1.64 lakh cr
₹ 0.65 lakh cr
₹ 1342 cr
Total MajorSubsidies
Food Subsidy FertilizerSubsidy
PetroleumSubsidy
Source:CGAMonthlyAccounts
2.18Emphasisoncapitalexpenditurehasbeenthehighlightofexpenditurepolicyduringthecurrent fiscal. DuringApril to November 2021, capital expenditure registered a growth of 13.5 per cent over April to November 2020 and 28 per cent over April to November 2019 (Figure 9).AsdepictedinFigure 11, thisgrowthishigher thantheYoYcapitalexpendituregrowthrecordedinthelastfewyearsduringthesameperiod.ItisnoteworthytomentionthatthereisastrongseasonalityincapitalexpenditurebytheGovernment.Alargeproportionof

54 Economic Survey 2021-22
capitalspendingtakesplaceinthesecondhalfoftheyear,whichisnotbeingcapturedwiththeavailabledata.ThefocusofcapitalexpenditurefromApriltoNovember2021hasbeendirectedtowards infrastructure-intensive sectors like roads and highways, railways, and housing andurbanaffairs(Figure 12).Inaddition,theCentrehasalsoputinplaceseveralincentivestoboostthecapitalexpenditurebytheStates(discussedinBox 3).
4.0
11.712.8 13.5
02468
10121416
Apr-Nov2018
Apr-Nov2019
Apr-Nov2020
Apr-Nov2021
Perc
enta
ge
Figure 11: YoY growth in Capital Expenditure during April to November over the years
16891
65157
73907
Housing & Urbanaffairs
Railways
Road transport andhighways
Figure 12: Emphasis sectors for Capital expenditure (April to November 2021) (In ` crore)
Source:CGAMonthlyAccountsSource:CGAMonthlyAccounts
2.19 Basedontheaboveanalysis,itmaybeseenthattheagilefiscalpolicyapproachadoptedbytheGovernment,coupledwiththebuoyantrevenuecollectionreceivedsofarthisyear,hascreatedheadroomfortakingupadditionalfiscalpolicyinterventionsbasedontheneedoftheevolvingsituation.Thetargetedfocusoncapitalexpenditure,withitsresultingmultipliereffects,willbevital in sustaining theeconomicgrowth.As theeconomygrows further, the revenuecollectionfromallthesourcesisexpectedtobemorerobust,whichwillhelptostrengthenthefiscalpositionononehand,andcreatefiscalspaceontheother.Thus,itisexpectedthatreachingthe budget estimate for fiscal deficit during 2021-22 will not be a concern for the CentralGovernment.Arobusteconomicgrowthpathandvarioustaxpolicyandadministrationreformsundertakenoverthelastfewyearswillbefundamentalinsustainingthebuoyantrevenuesinthemediumterm,andthus,beontrackwiththefiscalpathoutlinedbytheMedium-TermFiscalPolicyStatement.
LONG-TERM TRENDS IN GOVERNMENT FINANCES: CENTRE, STATES AND GENERAL GOVERNMENT Central Government Finances
2.20 Duringtheyear2020-21,theshortfallinrevenuecollectionowingtotheinterruptionineconomic activity and the additional expenditure requirements tomitigate the fallout of thepandemiconvulnerablepeople,smallbusinesses,andtheeconomyingeneral,createdimmensepressureon the available limitedfiscal resources.As a result, thebudgetedfiscal deficit for2020-21wasrevisedfrom3.5percentinBEto9.5percentinRE.Thefiscaldeficitfor2020-21ProvisionalActualsstoodat9.2percentofGDPi.e.lowerthanRE(Figure 13).TheMedium-TermFiscalPolicy(MTFP)StatementpresentedwithBudget2021-22envisagedafiscaldeficit

55Fiscal Developments
targetof6.8percentofGDPfor2021-22.Thisreductionindeficitduringthecurrentyearwasbudgetedonaccountofreductioninexpenditurefrom17.7percentofGDPin2020-21REto15.6percentin2021-22BE;andabudgetedmarginalincreaseingrosstaxrevenuestothetuneof0.1percentofGDP.ThedataonGovernmentaccountsforApriltoNovember2021,releasedbytheControllerGeneralofAccounts,showsthattheGovernmentiswellontrackforachievingthebudgetestimateforfiscaldeficitin2021-22.
Figure 13: Trends in Deficits
1.4
2.4
7.4
4.1
1.6
5.8
3.1
3.93.5 3.5 3.4
4.6
9.2
6.8
0
1
2
3
4
5
6
7
8
9
10
0
1
2
3
4
5
6
7
8
2015-16 2016-17 2017-18 2018-19 2019-20 2020-21 PA 2021-22 BE
Perc
ent o
f GD
P
Perc
ent o
f GD
P
Effective RD PD FD (RHS)
Source:UnionBudgetDocuments&CGABE:BudgetEstimate,PA:ProvisionalActualsFD:FiscalDeficit;RD:RevenueDeficit;PD:PrimaryDeficit
2.21 Thelong-termtrendsinmajorfiscalindicatorsoftheCentralGovernmentandtheirgrowthratesarepresentedinTable 2andTable 3,respectively.Thissectionanalysesthesetrendsindetail.
Table 2: Central Government’s Fiscal Indicators
2015-16 2016-17 2017-18 2018-19 2019-20 2020-21PA
2021-22BE
(in ` lakh crore; Figures in parenthesis are as a per cent of GDP)
Revenuereceipts11.95 13.74 14.35 15.53 16.84 16.32 17.88
(8.7) (8.9) (8.4) (8.2) (8.3) (8.3) (8.0)
Grosstaxrevenue14.56 17.16 19.19 20.8 20.1 20.25 22.17
(10.6) (11.2) (11.2) (11.0) (9.9) (10.3) (9.9)
Nettaxrevenue9.44 11.01 12.42 13.17 13.57 14.24 15.45
(6.9) (7.2) (7.3) (6.9) (6.7) (7.2) (6.9)
Non-taxrevenue2.51 2.73 1.93 2.36 3.27 2.08 2.43
(1.8) (1.8) (1.1) (1.2) (1.6) (1.1) (1.1)

56 Economic Survey 2021-22
Non-debtcapitalreceipts* 0.63 0.65 1.16 1.13 0.69 0.58 1.88(0.5) (0.4) (0.7) (0.6) (0.3) (0.3) (0.8)
Non-debtreceipts 12.58 14.40 15.51 16.66 17.53 16.90 19.76(9.1) (9.4) (9.1) (8.8) (8.6) (8.6) (8.9)
Totalexpenditure17.91 19.75 21.42 23.15 26.86 35.11 34.83
(13.0) (12.9) (12.5) (12.2) (13.2) (17.8) (15.6)
Revenueexpenditure15.38 16.91 18.79 20.07 23.51 30.86 29.29
(11.2) (11.0) (11.0) (10.6) (11.6) (15.6) (13.1)
Capitalexpenditure2.53 2.85 2.63 3.08 3.35 4.25 5.54
(1.8) (1.9) (1.5) (1.6) (1.6) (2.2) (2.5)
Fiscaldeficit5.33 5.36 5.91 6.49 9.34 18.21 15.07
(3.9) (3.5) (3.5) (3.4) (4.6) (9.2) (6.8)
Revenuedeficit 3.43 3.16 4.44 4.54 6.67 14.54 11.41(2.5) (2.1) (2.6) (2.4) (3.3) (7.4) (5.1)
Primarydeficit0.91 0.55 0.62 0.67 3.22 11.39 6.97
(0.7) (0.4) (0.4) (0.4) (1.6) (5.8) (3.1)Memo Item GDPatMarketPrice 137.72 153.62 170.95 189.71 203.51 197.46 222.87
Source:UnionBudgetDocuments&CGABE:BudgetEstimate,PA:ProvisionalActuals*includesdisinvestmentproceeds
Table 3: Growth rate of Central Government’s Fiscal Indicators ( in per cent)
ITEMS 2016-17 2017-18 2018-19 2019-20 2020-21 PA* 2021-22 BE^
Revenuereceipts 15.0 4.4 8.2 8.4 -3.1 9.6
Grosstaxrevenue 17.9 11.8 8.4 -3.4 0.7 9.5
Nettaxrevenue 16.7 12.8 6.0 3.0 4.9 8.5
Non-taxrevenue 8.6 -29.4 22.3 38.8 -36.4 16.8
Non-debtcapitalreceipts 3.8 77.0 -2.5 -39.2 -16.0 226.2
Totalnon-debtreceipt 14.4 7.7 7.4 5.2 -3.6 17.0
Totalexpenditure 10.3 8.4 8.1 16.0 30.7 -0.8
Revenueexpenditure 9.9 11.1 6.8 17.1 31.3 -5.1
Capitalexpenditure 12.5 -7.5 16.9 9.1 26.5 30.5Source:UnionBudgetDocuments&CGABE:BudgetEstimate,PA:ProvisionalActuals*Rateofgrowthvis-à-vis2019-20actual;^Rateofgrowthvis-à-vis2020-21PA

57Fiscal Developments
Trends in Receipts
2.22 CentralGovernmentreceiptscanbroadlybedividedintonon-debtanddebtreceipts.Thenon-debtreceiptscompriseoftaxrevenue,non-taxrevenue,recoveryofloans,anddisinvestmentreceipts. Debt receiptsmostly consist ofmarket borrowings and other liabilities,which thegovernmentisobligedtorepayinthefuture.TheBudget2021-22targetedsignificantlyhighgrowthinnon-debtreceiptsoftheCentralGovernment,whichwasdrivenbyrobustgrowthinallits’components(refertoTable 3).
Tax Revenue
2.23 The Provisional Actual figures released by the Controller General of Accounts for 2020-21 show that the gross tax revenue grew by 0.7 per cent (YoY) during 2020-21.Themutedtaxcollectionsweredrivenby11.7percent(YoY)declineindirecttaxes,whichwasoffsetby12.6percent(YoY)growthinindirecttaxes.However,Budget2021-22envisagedagrowthof16.7percentingrosstaxrevenue(GTR)overtherevisedestimates(RE)of2020-21.GTRwasestimatedat`22.17lakhcrorefor2021-22BE,whichwas9.9percentoftheGDP.ThebudgetedgrowthinGTRwasestimatedtobeledby22.4percentgrowthindirecttaxesand11.4percentgrowthinindirecttaxesovertherevisedestimatesof2020-21.Broadly, 50percentofGTRwasestimatedtoaccruefromdirecttaxesandtheremaining50percentfromindirecttaxes.ThecontributionofdifferenttaxesinGTRfor2021-22BEisshowninFigure 14.
Figure 14: Composition of taxes in Gross Tax Revenue in 2021 -22 BE
25%
25%6%
15%
29%
Corporation Tax
Taxes on income otherthan Corporation taxCustom
Union Excise Duties
GST
Source:UnionBudgetDocuments
2.24 ThetrendinmajortaxesinrelationtoGDP,depictedinFigure 15,clearlyshowthemutedcollectionsfromdirecttaxreceipts,particularlythecorporatetaxsince2019-20.Thisisduetothemoderationingrowthoftheeconomyduringthisperiodandimplementationofstructuralreformslikecorporatetaxratecut.Duringthecurrentfiscalyear,thecorporatetaxcollectionshavebeenbuoyant,registeringanabove90percentgrowthduringApril toNovember2021overApriltoNovember2020.

58 Economic Survey 2021-22
Figure 15: Taxes as a per cent of GDP
3.3 3.52.7 2.3 2.5
2.5 2.52.4
2.4 2.5
0.8 0.60.5 0.7 0.6
1.5 1.2
1.2 2.0 1.5
2.6 3.1
2.92.8 2.8
0
2
4
6
8
10
12
2017-18 2018-19 2019-20 2020-21 PA 2021-22 BE
Per c
ent o
f GD
P GST
UED
Custom
ToI
CIT
Source:UnionBudgetDocuments&CGABE:BudgetEstimate,PA:ProvisionalActual,CIT:CorporationTax,ToI:TaxesonIncomeotherthanCorporationTax(includesSTT),UED:UnionExciseDuties,GST:GoodsandServicesTax
Non-Tax Revenue
2.25Non-taxrevenueconsistsmainlyofinterestreceiptsonloanstoStatesandUnionTerritories,dividendsandprofitsfromPublicSectorEnterprisesincludingsurplusofReserveBankofIndiatransferredtoGovernmentofIndia,andexternalgrantsandreceiptsforservicesprovidedbytheCentralGovernment.Theseservicesincludefiscalserviceslikecurrency,coinageandmint,generalservicessuchasPublicServiceCommissionandpolice,socialserviceslikeeducationandhealth,andeconomicserviceslikeirrigation,transportationandcommunication.TheBudgetfor2021-22envisagedgenerationof`2.43lakhcroreofnon-taxrevenue,16.8percenthigherthan2020-21PA.(referTable 4).
Table 4- Trends in Non-tax Revenue of Central Government
2015-16 2016-17 2017-18 2018-19 2019-20 2020-21 PA
2021-22 BE
(in ` lakh crore)
Interestreceipts 0.25 0.16 0.14 0.12 0.12 0.17 0.12
Dividends&Profits 1.12 1.23 0.91 1.13 1.86 0.97 1.04
ExternalGrants 0.02 0.01 0.04 0.01 0.00 0.02 0.01
Others 1.12 1.32 0.84 1.07 1.27 0.92 1.25
Non-taxRevenue 2.51 2.73 1.93 2.36 3.27 2.08 2.43
Source:UnionBudgetDocuments&CGA

59Fiscal Developments
Non-Debt Capital Receipts
2.26Non-debtcapitalreceiptsmainlyconsistofrecoveryofloansandadvances,anddisinvestmentreceipts.TheshareofrecoveryofloanshasdeclinedovertheyearsfollowingdisintermediationofloanportionofCentralassistancetoStatesconsequenttotherecommendationoftheTwelfthFinanceCommission,andStatesallowedtoborrowdirectlyfromthemarket.TheBudgetfor2021-22hasenvisagedgenerationof`1.88lakhcroreofnon-debtcapitalreceipts,comprising `1.75lakhcroreofdisinvestmentreceipts.InordertominimizethepresenceoftheGovernmentinthePSEsacrossallsectorsoftheeconomy,theGovernmenthasadoptedanewdisinvestmentpolicyforAtmanirbharBharatinFebruary2021.TheevolutionofthedisinvestmentpolicyoftheGovernmentmaybeseenatBox 2.
Box 2: Evolution of the Disinvestment Policy of the Government of India
WiththepassingoftheConstitution(FirstAmendment)Act,1951,nationalisationofprivatefirmsbecameastandardpolicytoolbytheGovernment.TheActstatedthat‘thecitizen’srighttopractiseanyprofessionortocarryonanyoccupation,tradeorbusinessconferredbyarticle19(1)(g)issubjecttoreasonablerestrictionswhichthelawsoftheStatemayimpose“intheinterestsofgeneralpublic”’.TheActallowedfornationalisationortradingbythestateinanybusiness.
SoonundertheAirCorporationsAct,1953,theGovernmentnationalisednineairlines—AirIndia,AirServicesofIndia,Airways(India),BharatAirways,DeccanAirways,HimalayanAviation,IndianNationalAirways,KalingaAirlines,andAirIndiaInternational—andbroughtthemundertwoPSEs,IndianAirlines,andAirIndiaInternational.Thiswasfollowedbynationalisationoflifeinsurancein1956throughtheLifeInsuranceCorporationAct1956,whereby154Indianinsurers,16non-Indianinsurers,and75providentsocietieswerenationalisedintoLifeInsuranceCorporationofIndia(LIC).ThroughtheGeneralInsuranceBusiness(Nationalisation)Act,1972,thegeneralinsurancebusinessof55Indiancompaniesandthe52foreigninsurerswasnationalised.Furtherinthebankingsystem,thegovernmentnationalised14banks in1969 through theBankingCompanies (AcquisitionandTransferofUndertakings)Act,1970,followedupbyasecondroundofbanknationalisationin1980,throughwhichanothersixbankswerenationalised.Coalmineswerealsonationalisedduringtheperiod1971-1975.Nevertheless,theissueofnationalisationhasalwaysbeenahighlydebatedissue,totheextentthatintheyear1958,thethenFinanceMinister,Mr.TTKrishnamachari,hadtoresignowingtocontroversiesaroundnationalisationofLIC(MundhraScandal,1958).
Afterthe1991reforms,therewasatransitioninthinkingaboutpublicandprivatesector.Theterm‘disinvestment’wasusedfirsttimeinInterimBudget1991.However,thepolicyondisinvestmentgatheredsteamundertheGovernmentofPMVajpayee,whenanewDepartmentofDisinvestmentwascreatedin1999,whichbecameafullMinistryin2001.Itwasduringthisperiodthattheconceptofstrategicsalesofstate-ownedcompaniesbecameapartofpolicydebate.Thisgovernmentstakesweresold inasmanyas12publicsectorcompaniesduring this tenure, includingMarutiUdyog,HindustanZinc,BharatAluminumandVideshSancharNigamLimited.Theprocessofdisinvestmentcontinuedintermittentlyoverthenextdecade2004-2014,untiltherecentemphasisinthisdirectionoverthelastfiveyears.

60 Economic Survey 2021-22
After2014,thedisinvestmentpolicywasrenewedwithstakesalesinPSEssuchasHindustanPetroleum Corporation Limited (HPCL), Rural Electrification Corporation Limited (REC),Dredging Corporation of India Limited (DCIL), Hospital Services Consultancy CorporationLimited (HSCC), National Projects Construction Corporation Limited (NPCC), THDC IndiaLimited and North Eastern Electric Power Corporation Limited; and successful listing ofPSEslikeIRCTC,HUDCO,CochinShipyardLtd.,GeneralInsuranceCorporation,NewIndiaAssuranceCompanyLtd.,MazagonDockShipbuildersLtd. (MDL) andRailTel on thestockmarket.InordertorealizethemissionofNew,Self-reliantIndia,therewasaneedtoredefinepublicsectorparticipationinbusinessenterprisesandtoencourageprivatesectorparticipationinallsectors.
Againstthisbackdrop,NewPublicSectorEnterprise(“PSE”)PolicyforAtmanirbharBharatwasnotifiedon4thFebruary2021.ThepolicyintendstominimizethepresenceoftheGovernmentinthePSEsacrossallsectorsoftheeconomy.UndertheNewPSEPolicy,publicsectorcommercialenterpriseshavebeenclassifiedasStrategic andNon-Strategic sectors.Following fourbroadstrategicsectorshavebeendelineatedbasedonthecriteriaofnationalsecurity,energysecurity,critical infrastructure, provision of financial services and availability of important minerals-(i) Atomic Energy, Space and Defense; (ii) Transport and Telecommunication; (iii) Power,Petroleum,Coalandotherminerals;and(iv)Banking,InsuranceandFinancialServices.
The B.E for disinvestment proceeds for the year 2021-22 was fixed at `1,75,000 crore. So far,Government has received` 9,330 crores (as on 24 January 2022) fromdisinvestment ofCPSEsthroughOffer forSale (OFS) route and sale of shares through thestock exchange.CPSEstockshavegainedtractionamongtheinvestors,asreflectedintheBSECPSEindex,whichhasrisenby 40.02percentsinceJanuary2021todate(24January2022),incomparisontothebenchmarkindex,which roseby23.33percent.Totaldividend receipts fromCPSEs in2020-21stoodat` 39,607crore,whichexceedstheRevisedEstimate(RE)of `34,717crore,andismorethanactualdividendreceipts(`35,543crore)duringthepreviousfinancialyear.Totaldividendreceipts in thecurrentfinancialyear(asof24.01.2022)standat`40,201.47crore.
Since 2016, the government has given ‘in-principle’ approval for strategic disinvestment of 35CPSEsand/orSubsidiaries/Units/JointVenturesofCPSEsandIDBIBank.Duringthepresentyear,withprogressonprivatizationofAirIndia,thegovernmenthascrossedasignificantmilestonewithM/sTalace Pvt Ltd, awholly-owned subsidiary ofM/sTata Sons Pvt Ltd emerging as thesuccessfulbidderforsaleof100percentequityshareholdingofGoIinAirIndiaalongwithequityshareholding ofAir India inAIXL andAISATS. Share PurchaseAgreement was signed amongM/sTalacePrivateLtd,AirIndiaandMinistryofCivilAviationon25.10.2021.Thisprogressonprivatization ofAir India is particularly important, not only in terms of garnering disinvestmentproceedsbutalsoforboostingtheprivatisationdrive.

61Fiscal Developments
Asset Monetization
The National Infrastructure Pipeline (NIP) envisaged a projectd infrastructure investment of `111lakhcroresduringFY2020toFY2025.TheNIPtaskforcereporthasestimatedthatabout15-17 per cent of this outlay is to bemet through innovative and alternative initiatives such asassetmonetisation,fundingthroughanewDevelopmentFinanceInstitution(DFI)etc2.TheUnionBudget2021-22alsoemphasizedmonetizationofassetsasoneofthethreepillarsforenhancedandsustainableinfrastructurefinancinginthecountry.
Based on the mandate for Asset Monetisation under Union Budget 2021-22, the NationalMonetisationPipeline(NMP)hasbeendevelopedbyNITIAayoginconsultationwithinfrastructurelineministries.Itisenvisagedtoserveasanessentialroadmapfortheassetmonetisationofvariousbrownfieldinfrastructureassetsacrossroads,railways,shipping,aviation,power,telecom,oil&gas,andwarehousingsectors. TheNMPwillalsoformabaselinefor theassetowningministriesformonitoringandtrackingperformanceofthepotentialassets.
TheNMPestimatesaggregatemonetisationpotentialof`6.0lakhcroresthroughcoreassetsoftheCentralGovernment,overafour-yearperiod,fromFY2022toFY2025.Thetop5sectorswhichcapturearound83percentoftheaggregatepipelinevalueinclude:Roads(27percent)followedbyRailways(25percent),Power(15percent),oil&gaspipelines(8percent)andTelecom(6percent).Around15percentofassetswithanindicativevalueof`0.88lakhcroreareenvisagedtoberolledoutinthecurrentfinancialyear(FY2021-22).
TheassetsandtransactionsidentifiedundertheNMPareexpectedtoberolledoutthrougharangeof instruments. These include direct contractual instruments such as public private partnershipconcessions and capital market instruments such as Infrastructure Investment Trusts (InvIT)amongothers.Thechoiceofinstrumentwillbedeterminedbythesector,natureofasset,timingoftransactions(includingmarketconsiderations), targetinvestorprofileandthelevelofoperational/investmentcontrolenvisagedtoberetainedbytheassetowneretc.
WhilethemonetizationofcoreassetsissteeredbyNITIAayog,theinitiativeformonetizationofnon-coreassetshasbeenhithertosteeredbytheDepartmentofInvestmentandPublicAssetManagement(DIPAM).Monetizationofnon-coreassetsenvisagesunlockingofvalueofthesethusfarunutilizedorunderutilizedassetsandgeneratereturnsontheequitythattheGovernmenthasinvestedinthem.So far, CPSEs have referred ~3400 acres of land and other non-core assets toDIPAM/MoF formonetization.Monetizationofnon-coreassetsofdifferentCPSEsi.e.,MTNL,BSNL,BPCL,B&R,BEML,HMTLtd,InstrumentationLtdetc.isatpresentundervariousstagesofthetransaction.
Since,atpresent,thedesiredskillsettotakeontheresponsibilityofmanagementandmonetizationofnon-coreassetsinGovernmentislimited.Hon’bleFinanceMinisterinherBudgetspeech2021-22announcedsettingupofaSpecialPurposeVehicle(SPV),withcapacityandexpertise,tocarryoutthemonetizationofthelandandothernon-coreassetsinanefficientandprudentmanner,inlinewithinternationalbestpractices.InpursuanceoftheBudgetannouncement,‘NationalLandMonetisationCorporation’(NLMC)isbeingincorporatedasa100percentGovtofIndiaownedentitywithaninitialauthorizedsharecapitalof`5000croresandsubscribedsharecapitalof`150crores.
2MonetisationGuidebookVolume1,NationalMonetisationPipeline,NITIAayog.

62 Economic Survey 2021-22
Trends in Expenditure
2.27 Theexpenditurepolicyduringthepandemicyear2020-21wasfocusedonprioritisationofexpenditureaccordingtoevolvingsituation.Intheinitialphaseofthepandemic,theGovernmentensuredthatfundsweremadeavailableforessentialactivitiesandthatscarceresourceswereconservedforre-prioritisation.Withtheeasingofmovementandhealth-relatedrestrictionslaterintheyear,expenditurewasfocusedinsectorswiththemostpositiveeffectontheeconomy,eitherintermsofre-kindlinggrowthormeetingwelfareneeds.Secondtopandemicrelief,theGovernmentplacedmaximumpriorityonproductivedomesticcapitalexpenditurewhichhasahighmultipliereffectontheeconomy.
2.28 Inthewakeofthepandemic,theadditionalexpenditurerequirementsledtoaYoYgrowthofmorethan30percentintherevenueexpenditureoftheGovernmentin2020-21PA(Table 5).Expendituresonsalaries,pensionsandinterestpaymentsare,byandlarge,committedinnatureandhavelimitedheadroomforcreationofadditionalfiscalspace.Thedeclineinsalariesduring2020-21PAwaslargelyduetofreezingoftheadditionalinstallmentofDearnessAllowancetoGovernmentemployeesanddisruptionsinhiring.Nearly60percentoftheincreaseinrevenueexpenditureduring2020-21PAwasduetoincreaseinmajorsubsidies.Themajorsubsidiesregisteredagrowthofover200percentin2020-21PAover2019-20.Thisincreasewasdrivenbyalmost400percentgrowthinfoodsubsidiesfrom`1.09lakhcrorein2019-20to`5.25lakhcrorein2020-21PA.ThesteepriseinfoodsubsidybillwasonaccountofPradhanMantriGaribKalyanAnnYojanaintroducedaspartoftheEconomicResponsetoCOVID-19,andthepre-paymentofaround`1.5lakhcroreofoutstandingfoodsubsidyrelatedloansoftheFoodCorporationofIndia.
Table 5: Major Items of Revenue Expenditure
Items 2016-17 2017-18 2018-19 2019-20 2020-21 PA
2021-22 BE
(in ` lakh crore)
RevenueExpenditureofwhich16.91 18.79 20.07 23.51 30.86 29.29(9.9) (11.1) (6.8) (17.1) (31.3) (-5.1)
a.Salaries(pay&allowances)1.77 1.94 2.11 2.28 2.05 2.52
(22.6) (9.3) (9.0) (7.8) (-10.0) (22.9)
b.Pensions1.31 1.46 1.60 1.84 2.09 1.90
(35.8) (10.9) (9.9) (14.8) (13.7) (-9.0)
c.Interestpayment4.81 5.29 5.83 6.12 6.82 8.10(8.8) (10.0) (10.2) (5.0) (11.4) (18.7)
d.Majorsubsidies2.04 1.91 1.97 2.28 6.90 3.35
(-15.6) (-6.3) (2.9) (16.0) (202.0) (-51.4)
e.DefenceServices1.65 1.86 1.96 2.08 2.06 2.12
(13.3) (12.5) (5.1) (6.1) (-0.9) (3.1)Source:UnionBudgetDocuments&CGABE:BudgetEstimate,PA:ProvisionalActualsNumbersinparenthesisaregrowthrates*ThefigureforSalaries(Pay&allowances)for2020-21isRevisedEstimate(RE).

63Fiscal Developments
2.29 Governmenthas focusedon improving thequalityofexpenditure inboth2020-21and2021-22BE.Capital expenditure registered aYoY growth of 26.5 per cent in 2020-21 PA,as it increasedfrom1.6percentofGDPin2019-20to2.2percentofGDPin2020-21PA.The emphasis on capital expenditure was envisaged to continue in 2021-22 BE to reach abudgetestimateof`5.54lakhcrorei.e.2.5percentofGDP.Thistranslatesintoagrowthof 34.5percentand30.5percentover2020-21BEand2020-21PA,respectively.Asaproportionoftotalexpenditure,capitalexpenditurehasbeenestimatedtoincreasefrom12.1percentin2020-21PAto15.9percentin2021-22BE(Figure 16).Thehighercapitalexpenditurewithafocusoninfrastructurespendingin2021-22BEwillhaveamultipliereffectontheongoingeconomicrecovery.
Figure 16: Share of Revenue and Capital Expenditure in Total Expenditure
82
83
84
85
86
87
88
89
10
11
12
13
14
15
16
17
2014
-15
2015
-16
2016
-17
2017
-18
2018
-19
2019
-20
2020
-21
PA
2021
-22
BE
Per c
ent
Per c
ent
Capital Expenditure/Total Expenditure (%)
Revenue Expenditure/ Total Expenditure (%) (RHS)
Source:UnionBudgetDocuments&O/oCGABE:BudgetEstimate,PA:ProvisionalActuals,
2.30 Apart from budgetary spending, Extra Budgetary Resources (EBR) have also beenmobilisedtofinanceinfrastructureinvestmentsince2016-17.GovernmenthasraisedEBRsof `6.04lakhcrorefrom2016-17to2020-21,ofwhich 1.43lakhcrorehavebeenmobilisedfromtheissueofGovt.fullyservicedbondsand`4.61lakhcrorehavebeenraisedthroughfinancialsupportextendedthroughloansfromNSSF.TheBudget2021-22focussesonimprovingfiscaltransparency, as the EBRs for 2021-22 have been estimated at ` 30,000 crore. Further, in2020-21RE,theGovernmenthasestimatedtopre-payaround`1.5lakhcroreofoutstandingfoodsubsidyrelatedloansoftheFoodCorporationofIndia.In2021-22BE,thefoodsubsidyrequirementsofFCIhasbeenprovidedintheBudget.
Transfer to States
2.31TheUnionGovernmenthasacceptedtherecommendationsmadebytheFifteenthFinanceCommission(XV-FC)initsReportfortheawardperiod2021-22to2025-26relatingtothegrants-in-aidamountingto`2,33,233croretotheStatesduring2021-22forPostDevolutionRevenueDeficitgrant,grantstoLocalBodies,HealthsectorgrantandDisasterManagementgrants.

64 Economic Survey 2021-22
2.32The PostDevolution RevenueDeficit Grants are provided to the States underArticle275oftheConstitution.ThegrantsarereleasedtotheStatesaspertherecommendationsofthe Fifteenth FinanceCommission tomeet the gap inRevenueAccounts of the States postdevolution. The Fifteenth Finance Commission has recommended a total Post DevolutionRevenueDeficitgrantof`1.18lakhcroreto17Statesinthefinancialyear2021-22,ofwhichanamountof`98,710crorehasalreadybeenreleased,ason6thJanuary2022.
2.33WithregardtothegrantstoLocalBodies, theXV-FChadrecommendedthaturbanareas are grouped into two broad categories for recommending grants to urban localbodies: (a) Category-I cities: urban agglomerations/cities with more than one millionpopulation and (b) Category-II cities: other than million-plus cities. The Commissionhas recommended that for cities with million plus population (Million-Plus cities), 100percentofthegrantsareperformance-linkedthroughtheMillion-PlusCitiesChallengeFund(MCF).TheCommissionhasrecommendedthat60percentofthegrantstorurallocalbodiesandforurbanlocalbodiesinnon-Million-Pluscitiesshouldbetiedtosupportingandstrengtheningthedeliveryoftwocategoriesofbasicservices:(a)sanitation,maintenanceof 'OpenDefecation Free' status (forRural LocalBodies), solidwastemanagement andattainmentofstarratingsasdevelopedbyMinistryofHousingandUrbanAffairs(fornon-millionpluscities /Category-IICities /Towns;(b)drinkingwater,rainwaterharvestingandwaterrecycling(bothforRuralLocalBodiesandUrbanLocalBodies).
2.34 The XV-FC has recommended grants for Health to be channelised through LocalGovernmentsamounting to`13,192crore for theyear2021-22.Tostrengthenandplug thecriticalgapsinthehealthcaresystemattheprimaryhealthcarelevel,XV-FChasalsoidentifiedinterventions that will directly lead to strengthening the primary health infrastructure andfacilitiesinbothruralandurbanareas.
2.35 WithregardtotheDisasterManagementgrants,theCommissionhasrecommendedthatthetotalStatesallocationforStateDisasterRiskManagementFund(SDRMF)shouldbesub-divided into fundingwindows thatencompass the fulldisastermanagementcycle.Thus, theSDRF(StateDisasterResponseFund)shouldget80percentofthetotalallocationandtheSDMF(StateDisasterMitigation Fund) 20 per cent. Similarly, the Commission has recommendedthatNDRF(NationalDisasterResponseFund)shouldget80percentof the totalallocationoftheNationalDisasterRiskManagementFundandbalance20percentforNationalDisasterMitigationFund.
2.36 ThecomponentwisegrantsrecommendedbyXV-FCfortheyear2020-21andfortheyear2021-22areasunder:
S. No. Components Allocation for 2020-21
Allocation for 2021-22
(in ` crore)1. PostDevolutionRevenueDeficitgrant 74,340 1,18,4522. LocalBodiesgrantsincludinggrantforhealthsector 90,000 80,2073. DisasterManagementgrant(UnionShare) 34,574 34,574
Grand Total 1,98,914 2,33,233

65Fiscal Developments
Central Government Debt
2.37 During the year, a major challenge in the aftermath of COVID-19 pandemic was themanagementofdebt,bothfortheCentralandStateGovernments.Inthismilieu,conventionalandunconventionalmeasuresweretakeninordertomaintaintheorderlymarketconditionstoensurethattheincreasedfinancialneedsoftheGovernmentsaremetsmoothly,whilekeepinginmind themajorobjectivesofcostminimization, riskmitigationandmarketdevelopment.Supportedbythesemeasures,theweightedaveragecostoftheGovernmentondatedsecuritiesduring2020-21wasat17-yearlowof5.79percent,despitea141.2percentjumpinnetmarketborrowings(Figure 17).
Figure 17: Weighted average interest rate on Central Government Securities (Per cent)
4.0
5.0
6.0
7.0
8.0
9.0
10.0
11.0
12.0
2000
-01
2001
-02
2002
-03
2003
-04
2004
-05
2005
-06
2006
-07
2007
-08
2008
-09
2009
-10
2010
-11
2011
-12
2012
-13
2013
-14
2014
-15
2015
-16
2016
-17
2017
-18
2018
-19
2019
-20
2020
-21
Source:RBI
2.38 Total liabilities of the Central Government include debt contracted against theConsolidatedFundofIndia, technicallydefinedasPublicDebt,aswellasliabilitiesinthePublicAccount.Theseliabilitiesincludeexternaldebt(end-of-thefinancialyear)atcurrentexchange rate but exclude part of NSSF liabilities to the extent of States’ borrowingsfrom theNSSFand investments inpublicagenciesoutof theNSSF,whichdonotfinanceCentral Government deficit. Central Government’s total outstanding liabilities were at `117.04 lakh crore at end-March 2021. Public Debt accounted for 89.9 per cent of totalliabilities,whilePublicAccountLiabilities,whichincludeNationalSmallSavingsFund,StateProvidentFunds,ReserveFundsandDepositsandotherAccounts,constitutedtheremaining10.1percent.AbriefdescriptionofthemajorcomponentsoftotalliabilitiesoftheCentralGovernmentmaybeseenatTable 6.

66 Economic Survey 2021-22
Table 6: Debt Position of the Central Government (in ` lakh crore)
Components 2014-15 2015-16 2016-17 2017-18 2018-19 2019-20 2020-21 PA
1 2 3 4 5 6 7 8A. Public Debt (A1+A2) 51.05 57.11 61.50 68.45 75.49 85.65 105.24A1. Internal Debt (a+b) 47.38 53.05 57.42 64.01 70.75 80.20 99.09a.MarketableSecurities 43.08 47.28 50.49 55.10 59.69 65.60 78.60
b.Non-marketable Securities 4.29 5.77 6.93 8.91 11.06 14.60 20.50
A2. External Debt 3.66 4.07 4.08 4.45 4.74 5.44 6.15
B. Public Account - Other Liabilities 7.62 8.16 8.57 9.15 9.96 13.70 12.74
C. Extra-Budgetary Resources (EBRs) - - 0.09 0.24 0.99 1.12 1.43
D. Total Liabilities (A+B+C) 58.66 65.27 70.16 77.85 86.35 99.91 117.04
Source:UnionBudgetandFinanceAccounts(VariousIssues);ProvisionalAccounts,CGA.
2.39 Figure 18 shows that total liabilities of the Central Government, as a ratio of GDP,whichwererelativelystableoverthepastdecadehaverisensharplyin2020-21.Thisincreaseisonaccountofhigherborrowing resorted todue toCOVID-19pandemicaswell as sharpcontractionintheGDP.TheDebt-GDPishoweverexpectedtofollowadownwardtrajectoryintheupcomingyears.
Figure 18: Trend in Centre’s Debt-GDP ratio
45.7
49.1
59.3
40
45
50
55
60
65
2004
-05
2005
-06
2006
-07
2007
-08
2008
-09
2009
-10
2010
-11
2011
-12
2012
-13
2013
-14
2014
-15
2015
-16
2016
-17
2017
-18
2018
-19
2019
-20
2020
-21
Per c
ent o
f GD
P
Source:VariousissuesofStatusPaperonGovernmentDebtNote:Thefiguresfor2020-21areProvisional

67Fiscal Developments
2.40Publicdebtportfolioexhibitslowcurrencyandinterestrateriskowingtolowrelianceonexternalborrowingandissuanceofmajorityofsecuritiesatfixedcoupon.Further,mostoftheexternalborrowingarefromofficialsourceswhichareoflongtermandconcessionalinnature.Therolloverriskisalsolowowingtolowissuanceofshort-termbondswithaviewtoelongatethematurityprofile.Theproportionofdatedsecuritiesmaturinginlessthanfiveyearshasseenconsistentdeclineinrecentyears.TheweightedaveragematurityofoutstandingstockofdatedsecuritiesofGovernmenthasincreasedfrom9.7yearsatendMarch2010to11.31yearsattheendMarch2021,thusreducingtherolloverrisk(Figure 19).
Figure 19: Maturity Profile of Outstanding Dated Central Government Securities
30.9 35.0
22.9
11.2
29.3 29.0 22.5 19.2
0.0
5.0
10.0
15.0
20.0
25.0
30.0
35.0
40.0
0 to 5 years 5-10 years 10-20 years 20 years andabove
Per c
ent o
f tot
al
2012-13 2020-21 (P)
Source: Status Paper on Government Debt; Quarterly Report onPublicDebtManagement;Note:P:Provisional
2.41 Publicdebtislargelyownedbyinstitutionalsegmentslikebanks,insurancecompanies,providentfundsetc.Theshareofcommercialbanksstoodat37.77percentatend-March2021,lowerthan40.4percentatend-March2020.Shareofinsurancecompaniesandprovidentfundsatend-March2021stoodat25.3percentand4.44percent,respectively.Shareofmutualfundsincreased from 1.4 per cent at end-March 2020 to 2.94 per cent at end-March 2021. ShareofRBIwentup to16.2percentatendMarch-2021from15.1percentatend-March2020.Issuanceofdatedsecuritiesisplannedandconducted,keepinginviewthedebtmanagementobjectiveofkeepingthecostofdebtlow,whileassumingprudentlevelsofriskandpromotingmarketdevelopment.Allthesefactorsmakethepublicdebtportfoliostableandalsosustainable.
2.42 Avibrantsecondarymarketprovidesopportunitytotheinvestorstobalancetheirportfolioasdesired.Availabilityofgovernmentsecuritiesupto40yearsprovidesawidechoicetotheinvestors.Trading thoughcurrentlyconcentrated in fewsecurities, is showingsignsofmoreevenspread.Moreover,therecentlylaunchedRetailDirectSchemebyRBIwillbeinstrumentalinchannelizingthesavingsofmiddleclass,smallbusinessmenandseniorcitizensdirectlyintoriskfreegovernmentsecurities.Withanobjectivetofacilitateefficientdirectaccessofretailindividual investor to theG-Secmarket,whichwas earlier directly being accessed only bylargeinstitutionalinvestors,thisschemewillgiveaboosttofinancialinclusionandbroadentheinvestorbase.

68 Economic Survey 2021-22
2.43 Underthescheme,retailinvestorswillbeabletoopenaRetailDirectGilt(RDG)accountusinganonlineportalthroughwhichitcandirectlyinvestminimumof`10,000andmaximumof 2crorepersecurity.Theretailinvestorscannotonlyplaceanon-competitivebidinprimaryissuanceofallCentral&StateGovernmentsecuritiessuchasTreasuryBillsandbondsbutalsoaccessSecondarymarket throughNegotiatedDealingSystem-OrderMatching (NDSOM) -RBI’stradingsystem,whichwaspreviouslyaccessibleonlytoselectfinancialinstitutions.Asofnow,bulkoftheG-Secisheldbyfewinstitutionalinvestorslikecommercialbanks,insurancecompaniesandmutualfunds.DiversifiedinvestorbaseprovidesflexibilitytotheGovernmentinitsborrowingprogram.Also,itwouldenablestabledemandforG-secfromdifferentinvestorcategories.
State Finances
2.44 TheGrossFiscalDeficitofStatesisestimatedtocrosstheFiscalResponsibilityLegislation(FRL)thresholdof3percentofGDPduring2020-21REand2021-22BE.TheRevenueDeficitof the States also increased from0.1 per cent ofGDP in 2018-19 to 2 per cent ofGDP in2020-21(RE)(Figure 20).ThisrelaxationinborrowinglimitswasallowedonaccountoftheadditionalexpenditureneedsandconstrainedrevenuesoftheStatesduetoCOVID-19.ThenetborrowingceilingsoftheStateswereenhancedto5percentofGSDPoftheStatesfortheyear2020-21and4percentofGSDPoftheStatesfor2021-22.ThedetailsmaybeseeninBox 3. BothGrossFiscalDeficitandRevenueDeficitfortheStatesarebudgetedtodeclinein2021-22fromthehighlevelstheyreachedin2020-21.
Figure 20: Major deficit and debt indicators of States
2.2 2.6 3.1 3.5 2.42.5
2.6
4.6
3.7
22.3 22.0 23.7 25.1 25.1 25.3 26.3
31.1 31.2
0.0
7.0
14.0
21.0
28.0
35.0
0.0
1.0
2.0
3.0
4.0
5.0
2013
-14
2014
-15
2015
-16
2016
-17
2017
-18
2018
-19
2019
-20
2020
-21
(RE)
2021
-22
(BE)
Per cent of GD
PPer c
ent o
f GD
P
Gross Fiscal Deficit Revenue Deficit Debt-GDP (RHS)
Source:RBIStateFinances:AStudyofBudget;RE:RevisedEstimates;BE:BudgetEstimatesNote:Statesinclude29statesand2UnionTerritorieswithlegislatures.
2.45 InadditiontothenetborrowingceilingsfixedfortheStates,XV-FChadrecommendedperformancebasedadditionalborrowingspaceof0.50percentofGrossStateDomesticProduct

69Fiscal Developments
(GSDP) toStates in thepower sector.Theobjectiveof theadditionalborrowingspace is toimprovetheoperationalandeconomicefficiencyofthesector,andpromoteasustainedincreaseinpaidelectricityconsumption.Thisspecialdispensationhasbeenrecommendedforeachyearforafour-yearperiodfrom2021-22to2024-25.
2.46 As per 2021-22 Budget Estimates of the State Governments, the States’ combinedownTaxrevenueandownNon-Taxrevenuewereanticipatedtogrowat28.5percentand 36percentrespectivelyover2020-21RE,asagainstthelowgrowthdisplayedin2020-21RE.On theexpenditureside, revenueexpenditureandcapitalexpenditure in2021-22BEwereenvisagedtogrowat12.1percentand30.5percentrespectivelyover2020-21RE(refertoTable 7).
2.47 TheRBIStudyonStateFinanceshighlights that theStateshavebudgetedforahighercapitaloutlayin2021-22BEvis-à-vis2020-21RE.TheincreasedCapexoutlaysbytheStatesareinsectorssuchasmedicalandpublichealth,urbandevelopment,watersupplyandsanitation,irrigationandtransport.InordertoemphasizetheimportanceoftheStates’fiscalpolicytowardscapitalexpenditure,CentralGovernmenthascontinuedtheSchemeforSpecialAssistancetoStates for Capital Expenditure for 2021-22. The steps taken by the Central Government tosupport the State Governments towards a faster economic recovery amidst the COVID-19pandemicmaybeseeninBox 3.
Table 7: Fiscal Indicators of States
Items 2016-17 2017-18 2018-19 2019-20 2020-21(RE) 2021-22 BE
(in`lakhcrore;Numbersinparenthesisaregrowthrates)
OwnTaxRevenue9.46 11.3 12.15 12.24 12.41 15.95
(11.3) (19.5) (7.5) (0.7) (1.4) (28.5)
OwnNon-TaxRevenue1.7 1.8 2.19 2.61 2.11 2.87
(14.0) (5.3) (21.7) (19.2) (-19.2) (36.0)
RevenueExpenditure21.22 23.4 26.38 27.92 31.86 35.72
(15.3) (10.3) (12.7) (5.8) (14.1) (12.1)
CapitalExpenditure5.17 4.31 4.87 4.6 5.54 7.23
(23.1) (-16.6) (13.0) (-5.5) (20.4) (30.5)
Source:Source:RBIStateFinances:AStudyofBudgetfor2020-21,RE:RevisedEstimates;BE:BudgetEstimates;Note:Statesalsoincludes2UTs(DelhiandPuducherry)from2017-18

70 Economic Survey 2021-22
Box 3: Measures taken by the Centre to support the States during 2021-22
TheCentralGovernmenthastakenconsistentstepstoimpartunflinchingsupporttotheStatesinthechallengingtimesofthepandemic.Thesemeasuresareasfollows:
1. Enhanced limit of borrowing for the States
FY 2020-21: Under theAtma Nirbhar Bharat package, additional borrowing limit of up to 2percentofGrossStateDomesticProduct(GSDP)wasallowedtotheStatesforFY2020-21,whichwasequivalentto`4.27lakhcrore.Oftheadditional2percentborrowingallowedtotheStates,thefirstinstalmentof0.5percentborrowingwasuntiedforallthestates.Thesecondpartamountingto1percentofGSDPwassubjecttoimplementationoffollowingfourspecificStatelevelreforms,whereweightageofeachreformis0.25percentofGSDP:-
a) ImplementationofOneNationOneRationCardSystem; b) Easeofdoingbusinessreform; c) UrbanLocalbody/utilityreforms;and d) PowerSectorreforms
Another,0.5percentofGSDP,whichwasearlierlinkedtothecompletionofatleast3outof4abovementionedreforms,wasmadeuntiedforStateschoosingOption1tomeettheshortfallarisingoutofGST implementation.17States implemented theOneNationOneRationCardSystem,20StatescompletedthestipulatedreformsintheEaseofDoingBusiness,11Stateshaddonelocalbodyreformsand17Statescarriedoutfully/partlyPowerSectorReforms.Thus,fortheyear2020-21totalborrowingpermissionof`3,19,939crorewasissuedtoStatesoutoftheadditionalborrowingceilingof2percentallowedtoStates.
FY 2021-22: The net borrowing of the States for the year 2021-22 has been fixed at `8,46,922croreat4percentofGSDPoftheStates.Outofthenetborrowingceiling(NBC)of4percentofGSDPfortheStatesfor2021-22,0.50percentofGSDPwasearmarkedfortheincrementalcapitalexpendituretobeincurredbytheStatesduring2021-22.Forthis,atargetforcapitalexpenditurewasfixedforeachState.Tobecomeeligibleforincrementalborrowing,Stateswererequiredtoachieveatleast15percentofthetargetsetfor2021-22bytheendoffirstquarterof2021-22,45percentby theendof secondquarter,70percentby theendofthirdquarterand100percentby31stMarch2022.Ason15November2021,atotaladditionalborrowingpermissionof` 32,412crorehadbeen issued to theStates for fulfillingquarterlycapitalexpendituretargets,ofwhich`15,721croreisenabledfor11statesformeetingtheQ1targetand`16,691crorehasbeengivento7statesforachievingtheQ2target.
2. Loan to States in lieu of GST Compensation shortfall
In order tomeet the shortfall inGoods andServicesTax (GST) compensation to be paid toStates, theGovernmentofIndiahadsetupaspecialborrowingwindowin theyear2020-21.Anamountof`1,10,208crorewasborrowedthroughthiswindowbytheGovernmentofIndiaduring2020-21onbehalfoftheStatesandUTswithlegislativeassembly,andwaspassedontotheStates/UTsasloanonbacktobackbasistohelptheStates/UTstomeettheresourcegap

71Fiscal Developments
duetonon-releaseofcompensation(owingtoinadequatebalanceinGSTcompensationfund).Theaforesaidborrowingarrangementwasextended for thecurrentfinancialyear2021-22 toraise theirendeavour,MinistryofFinancehas frontloaded the releaseofassistanceunder theback-to-backloanfacilityduringFY2021-22of`1.59lakhcrore.
3. Scheme for Special Assistance to States for Capital Expenditure
ConsideringthefiscalenvironmentfacedbytheStateGovernmentsduring2020-21duetotheshortfallintaxrevenuesarisingfromtheCOVID-19pandemic,‘SchemeforSpecialAssistancetoStates forCapitalExpenditure’,was approvedwherein special assistanceof` 11,830wasprovidedtotheStateGovernmentsintheformof50-yearinterestfreeloanduring2020-21.ThisSchemeofSpecialAssistancetoStatesforCapitalExpenditurehasbeenextendedfortheyear2021-22withanallocationof`10,000crore.TheSchemeforthefinancialyear2021-22hasthreeparts:
Part-I is for the 8 north eastern States i.e.Assam,Arunachal Pradesh,Meghalaya,Manipur,Mizoram,Nagaland,SikkimandTripura,andforthehillStatesofUttarakhandandHimachalPradesh.The sumallocated for this part is` 2,600 crore.Out of this amount,` 1,400 croreisdividedequallyamong7northeasternStateswhile`1,200crore isearmarkedforAssam,UttarakhandandHimachalPradeshinequalshares(`400croreeach).
Part-IIisforallotherStatesnotincludedinPart-I.Anamountof`7,400croreisearmarkedforthispart.ThisamounthasbeenallocatedamongsttheseStates inproportionto theirshareofCentralTaxesaspertheawardofthe15thFinanceCommissionfortheyear2021-22.
Part-III is for providing incentives to States Governments for privatization/disinvestment oftheStatePublicSectorEnterprises (SPSEs) andmonetization/recycling of assets.Under thispart,Stateswillbeprovidedadditionalfundsas50yearsinterestfreeloanoverandabovetheirallocationunderPart-I/Part-IIoftheScheme.Anamountof`5,000croreisallocatedforthispartoftheScheme.
General Government Finances
2.48TheGeneralGovernmentfinancesgiveanoverviewoffiscalpositionoftheGovernmentsectorasawhole.Figure 21showsthetrendsinGeneralGovernmentdebtanddeficitsoverthepastfewyears.TheGeneralGovernmentliabilitiesasaproportionofGDPincreasedsteeplyduring2020-21onaccountoftheadditionalborrowingsmadebyCentreandStatesduetotheshortfallinrevenueandhigherexpenditurerequirementsarisingoutofCOVID-19pandemic.However,in2021-22BE,thefiscalindicatorsareexpectedtoreboundwiththerecoveryintheeconomyandtheGeneralGovernmentisexpectedtofollowthepathoffiscalconsolidation.DetaileddiscussiononthedynamicsofdebtsustainabilitymaybeseeninChapter2ofVolume1(EconomicSurvey2020-21).

72 Economic Survey 2021-22
Figure 21: Trends in General Government Debt and Deficits (as a per cent of GDP)
5.8 5.8
7.1
13.3
10.2
2.7 2.5
3.9
9.4
5.6
69.8 70.8
74.6
89.7 89.3
0
10
20
30
40
50
60
70
80
90
100
0
2
4
6
8
10
12
14
16
18
2013-14 2014-15 2015-16 2016-17 2017-18 2018-19 2019-20 2020-21RE
2021-22BE
Per cent of GD
PPer c
ent o
f GD
P
Gross Fiscal Deficit Gross Revenue Deficit Outstanding liabilities of General Government (RHS)
Source:RBIHandbookofStatisticsforIndianEconomy;BE:BudgetEstimates;RE:RevisedEstimates
POLICY MEASURES TO ENHANCE THE EFFICIENCY OF GOVERNMENT SPENDING2.49 While restructuring expenditure is a significant aspect of fiscal policy, enhancing theefficiency of Government spending is also important. Public procurement, which involvespurchaseofgoodsandservicesbytheGovernmentwithanaimtonotonlycarryday-to-daytasksbuttoalsocreatesocialandeconomicinfrastructure,isanimportantcomponentoftheGovernmentexpenditure.Governmenthasundertakenconsistenteffortstoboosttheefficiencyofpublicprocurementpolicy.Twoofsuchreformsviz.Governmente-MarketplaceforroutineprocurementandnewguidelinesforreformsinPublicProcurementandProjectManagementhavebeendiscussedinthissection.
Government e-Marketplace (GeM)
2.50 The Government in 2016 had set up a dedicated e-market known as Government e-Marketplace(GeM)forpurchaseofcertainstandarddaytodayusegoods.Thisisasimple,transparentandcompletelydigitalprocessforprocurement.TheGeneralFinancialRules2017mandatesallMinistriesandDepartmentstoprocureGoodsandServicesavailableonGeMfromGeM.Theproceduralchanges in theprocurementmethodafter the introductionofGeMaregivenbelow(Table 8).

73Fiscal Developments
Table 8: Procedure for public procurement before and after GeM
Category BeforeGeM AfterGeM
Processofinvitationofbids
Manual process for the invitation ofbids, bid evaluation and finalizationofthewinningbid.
Completelyonline,norequirementforphysicaldocumentation.
Publicprocurementpolicy
Multiple agencies with multipleprocurement guidelines andprocedures.
Single, unified, fully online publicprocurement portal with clearguidelines.
Methodofprocurement
Paper-based procurement procedurewithphysicalinteraction.
Contactless, paperless and cashlesswith time-bound payments and real-timemonitoring.
Methodofnegotiationanddeliberation
Manual negotiation and fixing rateswith the bidder and arriving at onerateapplicabletoallbidders.
Automatic,digitizationandtransparentprocesses.
Processofregistrationofvendors
Registrationofvendorswasamanualprocessinvolvingvisitbyofficialstothevendorpremisesandwasatime-consumingprocess.
AuthenticationofusersisdonethroughAPIintegrationwithrespectivedomaindatabases.
Eligiblearticipantstothebid
Limited bidding & only registeredvendorscouldparticipate.
Any vendor of the platform canparticipate in the bid as long theproductmatchesthebid.
Monitoringofproductdeliveredorserviceprovided
Huge delay in delivery of productsanddelayinpayment.
Real-time monitoring to ensure on-schedule delivery of products andservices.
Source:MinistryofCommerce,PIB
2.51 Anecdotal evidence suggests that prior toGeM, government procurement pricesweremuch higher than the prices prevailing in the market and there were constant complaintsaboutinefficiencyandrentseeking.Theuseofthise-marketplacehasresultedinasubstantialreductioninpricesincomparisontotheratesusedearlier,withaveragepricesfallingbyatleast 15-20percent,upto56percent3. Box 5depictsacomparisonofpricesontheGeMportalandotheronlinemarketplacesforaselectedsampleofgoods.
Box 5: Prices of various commodities on the GeM portal vis-a-vis other online platforms
AcomparisonofpricesofvariouscommoditiesontheGeMportalwiththoseofcompanywebsitesorotheronlineplatformssuchasAmazon,Flipkart,etc.isgiveninthetablebelow.AsimilaranalysiswasincludedinChapter6ofEconomicSurvey2020-21.Foraclosecomparison,sampleofsamecommoditiesasselectedlastyear,isusedtotheextentpossible.Incaseswheretheexactcommoditywasnotavailable,thenewlyavailablemodelswerechosen.Whileinthelastyear’sanalysis,GeMpriceswereonanaverage3percentlowerwhencomparedwithotherplatforms,thistimeitisaround9.5percentlowerforthechosensample.10outof22commoditiesinthesamplewerecheaperontheGeMportalascomparedtootherplatforms.
3GeMBooklet,MinistryofCommerce,January2021

74 Economic Survey 2021-22
Table: GeM Portal Prices Comparison (as on 6th January 2022)
Name and Description(Model, features)
Price on GeM portal(in `)
Price at Amazon/ Flipkart/company Website etc. (in `)
% Variation in Offer Price
(GEM prices over market
prices)
ParkerJotterStandardBallPenMRP:250;OfferPrice(OP):200
Amazon;MRP:250;OP:207 -3.50
RoritoGreetzGelPenMaxtronGoldRoboticFluidInkSystemPen-Blue
MRP:99;OP:51
Amazon;MRP:NotMentioned;OP:119 -133.33
SamsungBasicTelevisionTV43InchLEDBacklitLCD Model:SAMSUNGDC43J
MRP:49,069 OP:40,000;Warranty-5Year
Amazon.in-MRP:69,000 OP:43,900
-9.75
OmronWhiteHEM7156APBloodPressureMonitor
MRP:3,860;OP:3,100; Warranty-2years
Industryowl.com MRP:2749;OP:2,749 Warranty-3years
11.32
HPLaserJetEnterpriseM507dnMRP:81,780OP:69,005Warranty-3Years
Amazon;MRP:82,450;OP:69,005Warranty-1Year
0.00
KoresEasyCut871PaperShred-der
MRP:25,490,OP:22,940
Amazon;MRP:23,990,OP:20,130
12.25
HERO CYCLES Jet Gold 28TUnisexRoadCycle(SingleSpeed,Black)
MRP:8,900;OP:5,599
Amazon;MRP:6,250;OP:5,500 1.77
Milton1500mlthermos MRP:1,560,OP:1,101
Amazon:MRP:1,875;OP:1,499 -36.15
NilkamalDustbin60Litres MRP:2,150,OP:840
Amazon-MRP:1,599;OP:1,350 -60.71
NilkamalPinnacleHighBackChair
MRP:23,500,OP:21,150
Nilkamalfurniture.com MRP:17,000;OP:16,674
21.16
BajajPulsar220F MRP:1,18,250 OP:1,18,250
Bikewale.com-MRP:1,30,827(Ex-show-roompriceinNewDelhi)
-10.64
GodrejInterioEliteMidBackChair
MRP:15,020,OP:13,150
GodrejInteriowebsite-MRP:15,020 -14.22
GodrejInterioSteelAlmirah2400mm(SlideNStoreCompactPlusWardrobe)
MRP:34,374, OP:32,239
GodrejInteriowebsite-MRP:34,374 -6.62
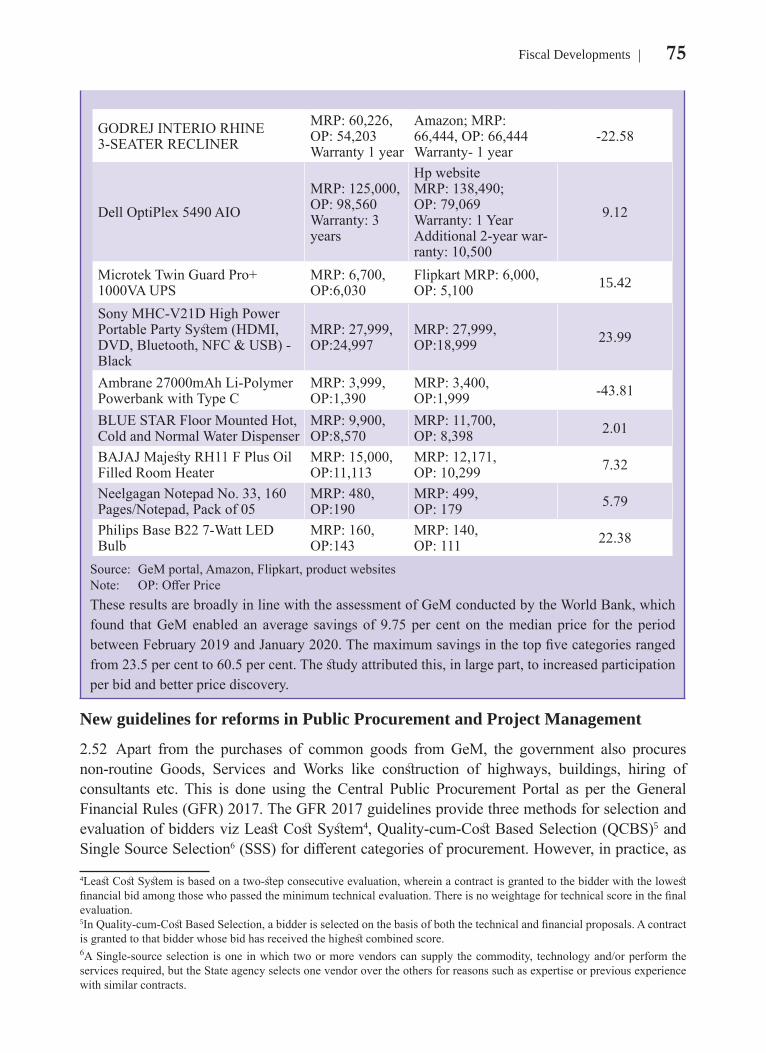
75Fiscal Developments
GODREJINTERIORHINE3-SEATERRECLINER
MRP:60,226,OP:54,203Warranty1year
Amazon;MRP:66,444,OP:66,444 Warranty-1year
-22.58
DellOptiPlex5490AIOMRP:125,000, OP:98,560 Warranty:3years
Hpwebsite MRP:138,490;OP:79,069 Warranty:1Year Additional2-yearwar-ranty:10,500
9.12
MicrotekTwinGuardPro+1000VAUPS
MRP:6,700, OP:6,030
FlipkartMRP:6,000, OP:5,100 15.42
SonyMHC-V21DHighPowerPortablePartySystem(HDMI,DVD,Bluetooth,NFC&USB)-Black
MRP:27,999, OP:24,997
MRP:27,999, OP:18,999 23.99
Ambrane27000mAhLi-PolymerPowerbankwithTypeC
MRP:3,999, OP:1,390
MRP:3,400, OP:1,999 -43.81
BLUESTARFloorMountedHot,ColdandNormalWaterDispenser
MRP:9,900, OP:8,570
MRP:11,700, OP:8,398 2.01
BAJAJMajestyRH11FPlusOilFilledRoomHeater
MRP:15,000, OP:11,113
MRP:12,171, OP:10,299 7.32
NeelgaganNotepadNo.33,160Pages/Notepad,Packof05
MRP:480, OP:190
MRP:499, OP:179 5.79
PhilipsBaseB227-WattLEDBulb
MRP:160, OP:143
MRP:140, OP:111 22.38
Source: GeMportal,Amazon,Flipkart,productwebsites Note: OP:OfferPriceTheseresultsarebroadlyinlinewiththeassessmentofGeMconductedbytheWorldBank,whichfound thatGeMenabled an average savingsof 9.75per cent on themedianprice for theperiodbetweenFebruary2019andJanuary2020.Themaximumsavingsinthetopfivecategoriesrangedfrom23.5percentto60.5percent.Thestudyattributedthis,inlargepart,toincreasedparticipationperbidandbetterpricediscovery.
New guidelines for reforms in Public Procurement and Project Management
2.52 Apart from the purchases of common goods fromGeM, the government also procuresnon-routine Goods, Services and Works like construction of highways, buildings, hiring ofconsultants etc.This is done using theCentral Public Procurement Portal as per theGeneralFinancialRules(GFR)2017.TheGFR2017guidelinesprovidethreemethodsforselectionandevaluationofbiddersvizLeastCostSystem4,Quality-cum-CostBasedSelection(QCBS)5andSingleSourceSelection6(SSS)fordifferentcategoriesofprocurement.However,inpractice,as
4LeastCostSystemisbasedonatwo-stepconsecutiveevaluation,whereinacontractisgrantedtothebidderwiththelowestfinancialbidamongthosewhopassedtheminimumtechnicalevaluation.Thereisnoweightagefortechnicalscoreinthefinalevaluation.5InQuality-cum-CostBasedSelection,abidderisselectedonthebasisofboththetechnicalandfinancialproposals.Acontractisgrantedtothatbidderwhosebidhasreceivedthehighestcombinedscore.6ASingle-sourceselection isone inwhich twoormorevendorscansupply thecommodity, technologyand/orperformtheservicesrequired,buttheStateagencyselectsonevendorovertheothersforreasonssuchasexpertiseorpreviousexperiencewithsimilarcontracts.

76 Economic Survey 2021-22
adefault,inmostcases,theprincipleofLeastCostSystem,commonlyknownas‘L1’isthemost prevalent.
2.53 WhiletheL1systemmaybegoodforprocurementofroutineworksandnon-consultingservices, thismethodmaynotbeable tocater to theneedfor innovation,quality,speedandfunctionality for high impact, complex and technology-intensive procurements. Variousorganisations includingCentralVigilanceCommission andNITIAayog have advocated theneedforreformingthecurrentprocurementsystemoverthelastmanyyears.TheyarguedthatsolelyrelyingonL1doesnotworkwellandthere isaneedtomovefrom‘onesizefitsall’to‘fittopurpose’approachandvariousalternativessuchasValueforMoney,RatedCriteriatoconsidernon-priceattributesshouldbeincludedintheprocurementmethods.Chapter6inEconomicSurvey2020-21(Volume1)alsoarguedfortheneedofgoingbeyondL1forpublicprocurement.
2.54 AlternativemethodsofprocurementotherthanL1,whichconsidernon-priceattributesaswell,allowforchoosingthecontractorbasedonacertainamountoftechnicalskills,previousexperience etc. This puts an indirect pressure on the contractors to performwell for beingeligibleforfuturecontracts,thusensuringthatcontractorshave‘Skininthegame’.Evidencesuggeststhatcontractorswhohave‘SkinintheGame’aremorelikelytomakeoptimallong-termdecisions.Singh (2019)7 pointsout that thenationalhighwayprojects executedbyL1combinedwithbundlingcontracts(commonlycalledPPPs)havelowerprojectdelaysandbetterquality,comparedtotheprojectsexecutedthroughtraditionalunbundlingcontracts,i.e.,withthestandardL1process,despitesameenvironmentalandregulatoryconditionsbeingfacedbybothkindsofprojects.
2.55 Keeping in mind the limitations of the earlier procurement strategy, the GovernmentissuednewguidelinesforprocurementandprojectmanagementinOctober2021,whichhaveexpandedtheambitofselectingbiddersforexecutinggovernmentprojectsandprocuringgoodsandservices.Thekeychangesintheprocurementprocessareasfollows:
¾ QCBS for Works and Non-consultancy Services: Aspertheearlierprocurementguidelines,QCBSwasallowedforonlyConsultancyServices.TherevisedguidelinesnowallowQCBSfortheselectionofbiddersforworksandnon-consultancyservicesaswell(whereestimatedvalueofprocurementdoesnotexceed`10crore).Thebidderswouldbescoredbothoncostandtechnicalparametersandonewiththehighestweightedcombinedscore(qualityandcost)wouldbeselected.Themaximumweightfornon-financialparametersis30percent.
¾ Fixing of Evaluation/ Qualification and Scoring Criteria under QCBS for Works and Non-consultancy Services: Inordertoensurequality,theprocuringentitiesnowhavethefreedomtoamendthespecificationsbasedontheirrequirementsandmakeanycriteriausedinevaluationasmandatory.Anybidthatdoesnotmeetthepre-requisitecriterianeednotbeevaluatedfurther.Moreover,weightagemayalsobegivenfortimelycompletionofpastprojectsofsimilarnaturebythebidder.Inthescoringcriteria,marksforqualitycompliancehavealsobeenincluded.
7Singh,Ram,DoPublicPrivatePartnershipsDeliverBetterOutcomes?DelaysandCostOverrunsinHighwaysProjectsinIndia(December5,2021)

77Fiscal Developments
¾ Stringent deadlines for making payments: Delay in payments to contractors results inprolonged project execution, cost overruns and disputes. The new guidelines stipulatetimelyreleaseofpaymentsof75percentormoreofbillsraisedwithin10workingdaysofthesubmissionofthebill.Theremainingbillpaymentistobemadeafterfinalcheckingwithin28workingdays.Theprocuringentityisalsoliabletopayinterestifthepaymentofbillsisdelayedbyover30workingdays.
¾ Single bid rejection: Thenewrulesstipulatepublicauthorities toconsidersinglebidasvalidprovidedthattheprocurementwassatisfactorilyadvertised,sufficienttimewasgivenforsubmissionofbids,thequalitativecriterionwerenotundulyrestrictiveandpricesarereasonableincomparisontomarketvalues.
¾ Fixed Budget based Selection for Consultancy Services: An additional method, fixedbudget-based Selection has been added for consultancy services wherein the type ofconsultingservicerequiredissimpleand/orrepetitiveandcanbepreciselydefined.Underthismethod,thecostofconsultingservicesshallbespecifiedasaffixedbudgetinthetenderdocument itself.Becauseof thebasic and repetitivenatureof the consultancywork, itsbudgetcanbereasonablyapproximated.
Table 9: Alternative Methods of Public Procurement
Alternatives Goods Works Services (Consultancy)
Services (Non-Consultancy)
LeastCostSystem(LCS) √ √ √ √
Quality-cum-CostBasedSelection X √√ √ √√
SingleSourceSelection √ √ √ √
FixedBudgetBasedSelection X X √√ X
Source:GeneralFinancialRulesNote:√-AlreadyavailableinGFR2017;√√-Allowedin2021notification;X-Notallowed

78 Economic Survey 2021-22
ANNEX
Annex 1: Direct Tax measures by CBDT during 2021-22
Improvements in tax administration
¾ IncontinuationwiththeGovernment’semphasisonprovidingamoretransparent,efficientand tax-payer friendly tax administration and improving taxpayer convenience, severalinitiativeshavebeen launchedby theGovernment.Thesewill alsoensurepromotionofinvestmentandemploymentgeneration.
Ease of compliance for taxpayers
¾ MostoftheprocessesandcompliancerequirementshavebeenshiftedtoonlineplatformsandtheneedforthetaxpayerstophysicallyvisittheIncomeTaxOfficeshasbeeneliminatedorminimized.Interactionwithtaxpayersischaracterizedbyaspiritoftrustandrespect,relyingmoreonvoluntarycompliance.
¾ Anewe-filingportalwaslaunchedin2021withimprovedfeaturessuchasanewtaxpayer-friendlyportalintegratedwithimmediateprocessingofITRreturn,pre-filledreturns,freeofcostITRpreparationsoftware,newcallcentrefortaxpayerassistanceincludingchatbot/liveagentandmobileappfunction.
¾ Toeaseburdenofseniorcitizensabovetheageof75years,theyhavebeengivenexemptionfromfilingincometaxreturns if theyonlyhavepensionincomeandinterestincome.Intheircasethespecifiedbankwillberesponsibleforcomputingtheirincomeanddeductionoftax.
¾ Thetimelimitforre-openingofassessmenthasalsobeenreducedfromsixyearstothreeyears.Beyondtheperiodofthreeyears,onlywheretherearebooksofaccount/documents/evidenceofconcealmentofincomeofRs50lakhormoreinayearrepresentedintheformofanasset,cantheassessmentbere-openeduptoaperiodof10yearswiththeapprovalofthePrincipalChiefCommissionerofIncomeTax.
¾ Certainnon-residentpersonshavealsobeenexemptedfromtherequirementoffurnishingofincometaxreturns,subjecttofulfilmentofprescribedconditions.ThebenefitofexemptionisavailablefromAssessmentYear2021-22onwards.ReliefhasalsobeenprovidedtoNRIsregardingissuesbeingfacedonaccruedincomesintheirforeignretirementaccounts.
¾ To reduce the compliance on small charitable trusts running educational institutions andhospitals,reliefbywayoftaxexemptiontosuchtrustshasbeenprovidedbytheFinanceAct2021byincreasingtheexistingthresholdofannualreceiptsfromRs1crorestoRs5crores.CertainimprovementshavealsobeenintroducedintheregistrationprocessforcharitabletrustswiththeDepartmentincludingonlineprocessforfilingofapplication,on-lineprocessingoftheapplicationsandpassingoftheregistrationorders,onlinefilingofdonationstatementsbydoneeetc.
¾ To reduce litigation, FinanceAct 2021 has introduced a specialmechanism for disputeresolution to reduce the disputes particularly for small and medium taxpayers having
79Fiscal Developments
taxableincomeofuptoRs50lakhsandanydisputedincomeofRs10lakhscanapproachthiscommittee.Itwillpreventnewdisputesandsettletheissueattheinitialstage.
Faceless procedures to promote transparency
¾ The Faceless Assessment Scheme was launched in 2020 which abolishes the earliersystemof taxadministrationandassessmentbasedon territorial jurisdiction. Itprovidesfor assessment by randomly chosen virtual teamswith dynamic jurisdiction.More thantwolakhcaseshavebeenallocatedoutofwhich1.99lacshavebeencompletedwithoutany interactionwith the taxpayer.Sofararound11.20 lacnoticeshavebeen issued inafacelessmanneroutofwhichresponseshavebeenreceivedinmorethan6.93laccases(ason16.11.2021).
¾ FacelessAppeals Scheme has also been launched which allows taxpayers to file theirdocuments in an electronicmode and saves them thehassle of visiting the IncomeTaxDepartment.About 88 per cent of the appeals are handled under the FacelessAppealsmechanism. To ease compliance, it has been clarified that e-verification and digitalsignatureisnotneededifdocumentsarefiledthroughe-filingaccountinfacelessassessmentproceedings.
¾ FacelessPenaltyscheme2021wasalsolaunchedtoimpartgreaterefficiency,transparencyandaccountabilitytotheprocedureforimpositionofpenalty.TheSchememakesitpossiblefortaxpayerstosubmitrepliesandparticipateintheproceedingsattheirconvenience.Italsoprovides forpeer reviewoforderswhichwill result inorders thatarequalitativelybetter,reasonableandfair.
¾ TheFinanceAct2021hasalsoempowered theCentralGovernment tonotifya schemefor disposal of appeals by the IncomeTaxAppellateTribunal (ITAT) to impart greaterefficiency, transparency and accountability by eliminating the interface between theAppellateTribunalandpartiestotheappealinthecourseofappellateproceedingstotheextent technologically feasible, optimizing utilization of resources through economiesofscaleandfunctionalspecializationand introducinganappellatesystemwithdynamicjurisdiction.AllcommunicationbetweentheTribunalandtheappellantshallbeelectronic.Incasewherepersonalhearingisneeded,itshallbedonethroughvideo-conferencing.
Reduction in compliance requirement
¾ AcomprehensivestudyoftheIncomeTaxActandruleshadbeenundertakentoidentifythose compliancewhichcanbe reduced.Outof total 271complianceswhichbelong toIncome-taxAct,74complianceshavealreadybeenreduced.However,outoftheremaining197 compliances, 152 are already online and 45 are offline. Out of these 45 offlinecompliances,42complianceswillbemadeonline.3complianceswillneedtobemanualduetonon-availabilityofPANincertaincases.Furthereffortsarecontinuouslybeingmadetoprovideonlinefacilitiestothetaxpayersforeaseofcompliance.In2021,autilitywasreleasedwheretaxpayerscancheckinquicktimefromPANoftheirclients,iftheclienthasfiledreturnofincomeandthereforenoextrataxtobededucted.

80 Economic Survey 2021-22
Measures to boost investment
¾ Topromoteforeigninvestmentandtaxcertainty,theretrospectivepartoftheamendmentmadebyFinanceAct2012regardingtaxationofoffshoreindirecttransferofassetslocatedinIndiahasbeennullifiedbytheTaxationLaws(Amendment)Act2021soastoprovidethatnotaxdemandshallberaisedinfutureonthebasisofthesaidretrospectiveamendmentforanyoffshoreindirecttransferofIndianassetsifthetransactionwasundertakenbefore28th May 2012. A framework has been notified specifying conditions under whichexisting litigationon this issuecanbe settled.Theamountpaid/collected in thesecasesshallberefunded,withoutanyinterest,onfulfilmentofcertainconditions.RemovaloftheretrospectivetaxationonoffshoreindirecttransferofIndianassetssignalstheGovernment’sresolvetoensureanon-adversarialtaxenvironment.
¾ IncentiveshavebeenprovidedbyFinanceAct2020toencourageforeigninvestmentsofSovereignWealthFundsandPensionFundsintotheinfrastructuresectorofIndia.FinanceAct2021relaxedsomeoftheconditions.SinceJanuary2021,nineSovereignWealthFundsand14PensionFundshavebeennotifiedtoclaimexemption.
¾ Inordertoincentivizestart-ups,theeligibilityforclaimingtaxholidayhasbeenextendedforstart-upsincorporatedtill31stMarch2022bytheFinanceAct2021.Thecapitalgainsexemptionforinvestmentinstart-upshasalsobeenextendedforonemoreyeartill31stMarch2022.
¾ Various tax incentives have been provided for units located in International FinancialServicesCentre(IFSC)inordertomakeitahubforfinancialservicesintheworld.IFSCsprovide Indian corporates easier access to global financialmarkets and promote furtherdevelopmentoffinancialmarkets in India.Further incentiveshavebeenprovided in theFinanceAct 2021 like tax holiday on capital gains for aircraft leasing companies, taxexemption for aircraft lease rentals paid to foreign lessor, tax incentives for relocatingforeignfundsintoIFSCandallowingtaxexemptionfortheinvestmentdivisionofforeignbankslocatedinIFSC.
Promoting digital transactions
¾ It is the declared policy of theGovernment to encourage digital transactions andmovetowardscashlesseconomy.Infurtheranceofthisobjective,throughtheFinanceAct2021,themonetarythresholdofgettingbooksofaccountsauditedhasbeenincreasedtoRs10croresincaseofbusinesseswhosetotalturnoverorgrossreceiptsmadeincashdoesnotexceed5percentofthetotalturnoverorgrossreceiptsandthetotalexpenditureincludingpurchasesmade in cash does not exceed 5 per cent of the total expenditure during thepreviousyear.
Measures undertaken to curb Tax Evasion and promote the widening of tax-base
¾ ForwideningthetaxnetofTaxDeductionatSource(TDS)andTaxCollectionatSource(TCS) several new transactionswere brought into its ambit.These transactions includehugecashwithdrawal,foreignremittance,purchaseofluxurycar,e-commerceparticipants,saleofgoods,acquisitionofimmovableproperty,etc.

81Fiscal Developments
¾ In order to promote the furnishing of income-tax returns, a special provision has beeninsertedtotheActtodeduct/collecttaxathigherratesincaseofcertainpersonswhohavenotfiledtheirincometaxreturnforbothoftheprecedingtwopreviousyearsandthetaxdeducted/collectedwasgreaterthanRs50,000ineachofthetwoyears.Further,TDSattherateof0.1percentonpaymentmadeforpurchaseofgoodsbyabuyer(havingsales/turnoverofRs10croresormoreinthefinancialyearprecedingtheyearinwhichthesaleismade)toapersonduringthefinancialyearexceedingRs50lakhhasalsobeenintroducedintheFinanceAct2021.
CBDT’s response to COVID-19 pandemic during 2021-22
¾ TheCentralGovernment,incontinuationofitscommitmenttoaddressthehardshipbeingfaced by various stakeholders on account of the COVID-19 pandemic instituted manypoliciestohelpcopewiththeimpactofCOVID-19.
¾ Unfortunately,certaintaxpayershavelosttheirlifeduetoCOVID-19.Employersandwell-wishersofsuchtaxpayershadextendedfinancialassistancetotheirfamilymemberssothattheycouldcopewiththedifficultiesarisenduetothesuddenlossoftheearningmemberof their family. Inorder toprovide relief to the familymembersofsuch taxpayer ithasbeenannounced that income-taxexemptionwillbegiven toex-gratiapayment receivedby familymembersof a person from the employer in the event of deathon account ofCOVID-19during2019-20andsubsequentyears.Theexemptionisproposedtobeallowedwithoutanylimitfortheamountreceivedfromtheemployerandtobelimitedto`10lakhinaggregatefortheamountreceivedfromanyotherpersons.
¾ Itwasrecognizedthatmanytaxpayershavereceivedfinancialhelpfromtheiremployersandwell-wishersformeetingtheirexpensesincurredfortreatmentofCOVID-19.Inordertoensure thatno income tax liabilityariseson thisaccount, ithasbeenannounced thatincome-taxexemptionwillbeprovidedtotheamountreceivedbyataxpayerformedicaltreatmentfortreatmentofCOVID-19during2019-20andsubsequentyears.
¾ TheCentralGovernmentalsoextended timelines for compliancesunder the Income-taxAct,1961suchasfurnishingofstatements,filingofincometaxreturnsetc.ThetimelimitsforpassingvariousordersundervarioussectionsofIncomeTaxActwerealsoextendedduetoCOVID-19pandemic.
¾ ThelastdateoflinkageofAadhaarwithPANhasbeenextendedto31stMarch2022.
Annex 2: Indirect tax measures by CBIC during 2021-22
A. Customs
TheCustomsdutyratestructurehasbeenguidedbyaconsciouspolicyofthegovernmenttoincentivizedomesticvalueadditionunderMakeinIndiaandAtma Nirbhar Bharatinitiative,whichinteraliaenvisagesimpositionoflowerdutyonrawmaterialsandprovidingreasonabletariff support to goods being manufactured in India. The customs duty structure has beencalibrated in suchway that incentivizes investment in key areas likepetroleumexploration,electronic manufacturing etc. In accordance with this policy, theMFN rates of BCD have

82 Economic Survey 2021-22
beenincreasedinrecentyearsonsuchitemswhicharebeingmanufacturedinIndiaorwhichdomesticindustryaspirestomanufacture.Accordingly,duringthelast6years,about4000tarifflines(approximately1/3rdoftotaltarifflines)haveseenupwardcalibrationofBCD.Suchitemsinclude,metals,metalproducts, autoparts, footwear, fabrics,garments, specifiedchemicals,toys,certainmachinery,medicalequipment,anumberofMSMEitemslikebells,gongs,ceramicwares,tableware,utensils,hardwareetc,consumerelectronicsandhomeappliancesincludingmobile,TV, refrigerators,washingmachine,AC, fans,heaters,hairdryers, shavers, toasters,ovensetc.Atthesametime,dutiesofinputsandrawmaterialshavebeenrationalized.
Under the PhasedManufacturing Plan (PMP) in respect of significant products likemobilephones,otherelectronicgoodslikeTVs,electricvehicles,batteries,solarpaneletc,theBCDratesinrespectofdifferentstagesofthevaluechainoftheseproductsarecalibratedinamannerthatencouragesgradualdeepeningofdomesticvalueaddition.Forexample,inrespectofmobilephones, initially the partswere placed under nilBCDwhile dutywas imposed onmobiles.Gradually,dutyhasbeenraisedonpartsinphasedmannerastheirproductionbeganinIndia.
Changes in Customs Law and Procedure:
¾ Inorder toensure swift andsecuremovementofdutiablegoods fromportof import tocustoms warehouse, CBIC has launched the use of ECTS (Electronic Cargo TrackingSystem) inOct 2021.This concept is borrowed from transhipment procedure for cargomeantforneighbouringcountries.
¾ CBIC has launched version 2 of online application for filing, real timemonitoring anddigital certification foronboardingAuthorizedEconomicOperators (AEOs)Tier2 andTier3.
¾ Inaddition,CBIChastakenmajordecisionswhichwouldleadtosignificantreductionofdwelltimeandfasterCustomsclearancesonimport.Thefacilitationpercentagehasbeenincreased to90per centw.e.f. 15th July2021.Linked to this enhanced facilitation, theschemeofDirectPortDelivery(DPD)hasbeenrevampedtoaCustomsdocumentbasedDPDfromthepreviousclientbasedDPD.
¾ CBIC has introduced Risk Management System (RMS) to facilitate faster drawbackdisbursalforgenuineexportersandtohelpinbettercheckingoffraudulentdrawbackclaimsonexports.
¾ CBIChaslaunchedtheIndianCustomsComplianceInformationPortal(CIP)forprovidingfreeaccesstoinformationonallCustomsproceduresandregulatorycompliancefornearly12,000CustomsTariffItems.
¾ ToaddresstheshortageofcontainersacrosstheCountry,CBICissuedinstructionstoenablemoreavailabilityofcontainersforexports.
¾ RemissionofDutiesandTaxesonExportedProductsSchemeenablesissueofExportRebateintheformofatransferabledutycredit/electronicscrip(e-scrip)whichwillbemaintainedinanelectronicledgerbytheCBIC.Thisrevampedend-to-endautomatedschemeaimstoprovideaboosttoIndianexportsbyprovidingalevelplayingfieldtodomesticindustryabroad.

83Fiscal Developments
¾ Variousagreements/MoUsweresignedbyIndianCustomswithcountrieslikeMaldives,USA,BRICSetconvariousCustoms relatedmatters formutualco-operation.Thiswillfacilitatemovementofgoodsacrossthecountries
B. Union Excise Duties
RetailSellingPriceofpetrolanddiesel inthecountryarelinkedtothepricesofcrude.Thecrudepriceshavebeenfallinginthisyear.Thecrudepriceshavebeenincreasinginlastfewmonths.Indianbasketismovingupwardsandreachedbeyond$84perbarrelinOctober,2021.TheDollarexchangeratewasalsoontheupwardtrendandishoveringaround`75perUSDwhichwasalsoimpactingthepricesofPetrolandDiesel.Inthisbackground,ExciseDutyonpetrolanddieselwasrationalizedbyRs5perlitreonPetroland`10perlitreonDiesel.Afterthismove,manystatesandUnionTerritorieshavealsoreducedVATonPetrolandDieseltogiverelieftotheconsumers.
C. Goods and Services Tax
GSTconsolidatedamyriadandcomplexratestructurewithmultitudeofrates,varyingwithstates,localbodiesetc.,andwithhugecascadingintoonetaxandasimplifiedproceduralregime.Thescaleofreformwasgiganticandthelawandregimeevolvedinaninclusiveway.Therehasbeenextensiveparticipationofallstakeholders.ContinuousimprovementsarebeingmadeinanextremelyresponsivewayinGST,withtheGSTCouncilrespondingswiftly,glitchesbeingaddressedquickly,andtimelynecessarychangesbeingmade.AmassiveexerciseofcalibrationofGSTrateshasalsobeendonesoastofixtheratesandmaintainrevenueneutrality.FollowingaresomeofthechangesmadetoGSTratesongoodsandservicesduring2021:
¾ In the 45th and 46thGSTCouncil, the recommendation of the Fitment Committee forcalibrating theGST rate structure to correct the inverted duty structure on textiles andfootwearwerediscussed.Accordingly,itwasdecidedtocorrectdutyinversionintextilesbyprescribing12percentGSTforfootwearofsalevaleexceedingRs1000perpair.
¾ Brickkilnswouldbebroughtunder specialcompositionschemewith threshold limitof `20lakhs,witheffectfrom1.4.2022.BrickswouldattractGSTattherateof6percentwithoutITCunderthescheme.GSTrateof12percentwithITCwouldotherwiseapplytobricks.
¾ Servicessupplied toaneducational institution includinganganwadi (whichprovidepre-school education also), bywayof servingof food includingmid- daymeals under anymiddaymealsscheme,sponsoredbyGovernmentisexemptfromlevyofGSTirrespectiveoffundingofsuchsuppliesfromgovernmentgrantsorcorporatedonations.
¾ Services provided bywayof examination including entrance examination,where fee ischargedforsuchexaminations,byNationalBoardofExamination(NBE),orsimilarCentralorStateEducationalBoards,andinputservicesrelatingtheretoareexemptfromGST.
¾ InordertoextendthesamedispensationasprovidedtoMROunitsofaviationsectortoMROunitsofships/vessels,soastoprovidelevelplayingfieldtodomesticshippingMROsvisavisforeignMROs,theGSTonMROservicesinrespectofships/vesselswasreducedto5percent(from18percent).ThePoSofB2BsupplyofMROServicesinrespectofships/vesselsshallbethelocationofrecipientofservice.

84 Economic Survey 2021-22
Changes in GST Law and Procedure:The followingmeasureswere undertaken for tradefacilitationandeaseofdoingbusinessunderGSTin2021-22:
¾ ToproviderelieftothetaxpayersfromhighamountoflatefeeaccumulatedonpendingGSTR-3Breturns,alatefeeamnestyschemehasbeenbroughtoutinrespectofpendingreturnsinFORMGSTR-3BforthetaxperiodsfromJuly,2017toApril,2021.
¾ Toreduceburdenoflatefeeonsmallertaxpayers,latefeestructure(undersection47oftheCGSTAct)hasbeenrationalizedforprospectivetaxperiodsfromJune2021onwardsbyaligningtheuppercapoflatefeewithtaxliability/turnoverofthetaxpayers.
¾ Retrospectiveamendmentofsection50ofCGSTAct,2017wasdonetoprovideinterestpaymentonnetcashbasiswitheffectfrom01.07.2017tofacilitatethetaxpayersandtohelpinremovingambiguityanddisputesregardingpaymentofinterestongrosstaxbasisornetcashbasis.
¾ Insteadofquarterlyrequirement tofileFORMGSTITC-04return,containingdetailsofallgoodssent to jobworkerand received from jobworker, ithasbeenmadeanannualrequirementfortaxpayershavingannualaggregateturnoverinprecedingfinancialyearisupto`5croresandonceinsixmonthsfortaxpayershavingannualaggregateturnoverinprecedingfinancialyearabove`5crores.
COVID Related Relief Measures
SeveralmeasuresweretakenbyCBICforfacilitatingCustomsclearancesofallmaterialsrelatedtoCOVID-19during2021-22.
¾ CBIChadissuednotificationstoexemptcustomsdutyonimportofRemdesivirinjection,RemdesivirAPIandBetaCyclodextrin(SBEBCD)usedinthemanufactureofRemdesivir(up to 31stOctober, 2021), and also on import of various items related toOxygen andOxygenrelatedequipment(foraperiodofthreemonths).
¾ DuringthesecondwaveofCOVID-19pandemic,theCustomshasfacilitatedtheimportofapprox.7.5LakhOxygenConcentratorsintothecountry.Morethan75IAFlandingswerefacilitatedforimportof97CryogenicISOtanksforcarryingofliquidoxygenacrossthecountry.OtherproductsfacilitatedonhighpriorityincludesOxygengeneratingplants,equipments,ventilators,RemdesivirInjectionanditsrawmaterials,diagnosticskitsmarkersetc.
¾ In view of the challenges faced by taxpayers in meeting the statutory and regulatorycompliancesunderGST lawdue to theoutbreakof thesecondwaveofCOVID-19, theGovernmenthasissuednotificationsprovidingvariousreliefmeasuresfortaxpayers.Someof thesemeasures are reduction in rate of interest for delayed tax payments,waiver oflatefee,extensionofduedateforfilingofreturn,extensionofstatutorytimelimitsundersection168AoftheCGSTAct.Adedicatedhelpdeskwassetuptohandholdthetradeandhandlegrievancesofthetradeacrossthecountry.

CHAPTER
03
External trade recovered strongly in 2021-22 after the pandemic-induced slump of the previous year, with strong capital flows into India, leading to a rapid accumulation of foreign exchange reserves. The resilience of India’s external sector during the current year augurs well for growth revival in the economy. However, the downside risks of global liquidity tightening and continued volatility of global commodity prices, high freight costs, coupled with the fresh resurgence of COVID-19 with new variants may pose a challenge for India during 2022-23.
Owing to the recovery of global demand coupled with revival in domestic activity, India’s merchandise exports and imports rebounded strongly and surpassed pre-COVID levels during the current financial year. The revival in exports was also helped by timely initiatives taken by Government. USA followed by UAE and China remained the top export destinations in April-November, 2021, while China, UAE and USA were the largest import sources for India. Despite weak tourism revenues, there was significant pickup in net services receipts during April-December, 2021 on account of robust software and business earnings, with both receipts and payments crossing the pre-pandemic levels.
India’s current account balance turned into deficit of 0.2 percent of GDP in the first half (H1) of 2021-22, largely led by deficit in trade account. Net capital flows were higher at US$ 65.6 billion in H1: 2021-22, on account of continued inflow of foreign investment, revival in net external commercial borrowings (ECBs), higher banking capital and additional special drawing rights (SDR) allocation. India’s external debt rose to US$ 593.1 billion as at end-September 2021, from US$ 556.8 billion a year earlier, reflecting additional SDR allocation by IMF, coupled with higher commercial borrowings.
The robust capital flows were sufficient to finance the modest current account deficit, resulting in an overall balance of payments (BoP) surplus of US$ 63.1 billion in H1 of 2021-22, that led to an augmented foreign exchange reserves crossing the milestone of US$ 600 billion and touched US$ 633.6 billion as of December 31, 2021. As of end-November 2021, India was the fourth largest forex reserves holder in the world after China, Japan, and Switzerland.
A sizeable accretion in reserves led to an improvement in external vulnerability indicators such as foreign exchange reserves to total external debt, short-term debt to foreign exchange reserves, etc. India’s external sector is resilient to face any unwinding of the global liquidity arising out of the likelihood of faster normalisation of monetary policy by systemically important central banks, including the Fed, in response to elevated inflationary pressures.
External Sector

86 Economic Survey 2021-22
GLOBAL ECONOMIC ENVIRONMENT3.1 The COVID-19 pandemic continued to impact the global economic environment during 2021. The first half (H1) of the calendar 2021 witnessed an acceleration in the global economic activity, that lifted the merchandise trade above its pre-pandemic peak. Reflecting this, International Monetary Fund (IMF) in its World Economic Outlook (WEO) October 2021 edition projected higher growth of global trade volume in goods and services of 9.7 percent in 2021, moderating to 6.7 percent in 2022, in line with the projected global recovery. World Trade Organization (WTO) in its October 2021 release, also upgraded its forecast for global merchandise trade volume growth to 10.8 percent in 2021, followed by a 4.7 percent rise in 2022 (Figure 1).
Figure 1: Projection for World Trade Volume Growth
5.63.9
0.9
-8.2
9.7
6.710.8
4.7
-12
-8
-4
0
4
8
12
-12
-8
-4
0
4
8
12
2017 2018 2019 2020 2021 (P) 2022 (P)
Ann
ual P
er c
ent C
hang
e
Ann
ual P
er c
ent C
hang
e
World Trade Volume in Goods and Services (IMF)World Merchandise Trade Volume (WTO)-RHS
Source: IMF and WTONote: Projections. The shaded area represents projected growth.
3.2 Apart from revival in global economic activity, the high growth rate for global merchandise trade volume in H1 of 2021 is also aided by the previous year’s slump, which bottomed out in the second quarter of 2020. The pick-up in momentum witnessed during the first two quarters of 2021 weakened again by the third quarter (Q3) due to rapid spread of Delta variant and the threat of new variants. It led to breakage in critical links of global supply chains resulting in longer than expected supply disruptions, taking its toll on the global recovery. The world trade in nominal value terms (US dollar) during 2021 tracked that in terms of volume: deceleration in Q3, following an acceleration in first quarter (Q1) and second quarter (Q2) (Figure 2).
3.3 Nonetheless, WTO’s prediction of merchandise trade volume growth of 10.8 per cent for whole of 2021 could still be realized if fourth quarter data could show a pick-up. This is possible even though the WTO’s Goods Trade Barometer has signalled a cooling of trade growth in the closing months of 2021 (index dropped to 99.5 in September 2021– close to the baseline value of 100), but it still remains on trend.1
1WTO's goods trade barometer index is a leading indicator that signals changes in world trade growth two to three months ahead of merchan-dise trade volume statistics. Its baseline value is 100, a value greater than 100 suggests above -trend growth while a value below 100 indicates below-trend growth.

87External Sector
Figure 2: Moderation in World Trade Volume and Value in Q3 of 2021
-30
-20
-10
0
10
20
30
40
50
Q1 Q2 Q3 Q4 Q1 Q2 Q3 Q4 Q1 Q2 Q3 Q4 Q1 Q2 Q3
2018 2019 2020 2021 (P)
Gro
wth
rat
e (y
-o-y
), Pe
rcen
tWorld Trade Volume World Trade Value
Source: UNCTAD and WTO Note: The growth rate is calculated on the basis of index with 2019Q1= 100.
3.4 The trade performance of major economies in volume and value terms during 2021 broadly reflects the generic trajectory of world trade outlined above. These major economies witnessed deceleration in Q3 on the back of a pick-up in Q1 and Q2, barring Russia in the case of exports and Indonesia for imports (Figure 3).
Figure 3: Merchandise trade performance of major economies
-40
-20
020406080
100
Bra
zil
Chi
na
Indi
a
Indo
nesi
a
Rus
sia
S. A
fric
a
USA
2020Q1 2020Q2 2020Q3 2020Q42021Q1 2021Q2 2021Q3
-60
-40
-20
0
20
40
60
Bra
zil
Chi
na
Indi
a
Indo
nesi
a
Rus
sia
S. A
fric
a
USA
2020Q1 2020Q2 2020Q3 2020Q42021Q1 2021Q2 2021Q3
a. Growth in Export Volume(y-o-y, Per cent)
b. Growth in Import Volume(y-o-y, Per cent)
Source: WTONote: The growth rate is calculated on the basis of index with 2019Q1= 100.
3.5 The impact on trade in value terms varied significantly across different types of goods. Trade of manufacture goods, agricultural products and fuels & mining products witnessed positive and higher year-over-year (y-o-y) growth during Q2 of 2021 than in Q1, before moderating in Q3. The trade value of fuels and mining products was boosted by a four-fold rise in natural gas prices. Among manufactured goods, some sectors showed strong y-o-y increase, including iron and steel, electronic components and pharmaceuticals while others such as automotive products

88 Economic Survey 2021-22
and telecommunications equipment showed stagnation or decline, reflecting the recent shortage of semiconductors.
3.6 As regards global financial conditions, in 2021, inflation picked up globally as economic activity revived with opening up of economies. Inflation in US touched 6.8 per cent in November 2021, the highest since 1982, driven largely by energy and food prices. As inflation worries are mounting, a distinct shift towards the unwinding of pandemic-led stimulus is taking hold. This may result in tightening of financial conditions, adversely affecting capital flows, putting pressure on exchange rate and slowing down growth in emerging economies. Therefore, the revival in inflation across the world now poses risks from both a tighter global liquidity condition and exchange rate volatility in global currency.
3.7 Overall, the balance of risks for global trade is tilted to the downside. The biggest downside risk emanates from the pandemic itself, particularly with resurgence of new variants such as Omicron. Further, in addition to the surge in global inflation, as outlined above, longer port delays, higher freight rates, shortage of shipping containers, shortage of inputs such as semiconductors, with supply-side disruptions being exacerbated by recovery in demand, pose significant risks, inter alia, for global trade.
3.8 Against this backdrop, India’s external sector has shown immense resilience during the year, which augurs well for growth revival in the economy.
DEVELOPMENTS IN INDIA’S MERCHANDISE TRADEMerchandise Exports
3.9 Following the global trend, India’s merchandise exports recovered strongly from the pandemic-induced collapse and registered positive growth in the current financial year. During 2021-22 (April-December), the merchandise exports recorded growth of 49.7 per cent to US$ 301.4 billion, compared to corresponding period of last year and 26.5 per cent over 2019-20 (April-December), exceeding the pre-pandemic levels.
3.10 Out of an ambitious export target of US$ 400 billion set for 2021-22, India has already attained more than 75 per cent of it by exporting goods worth US$ 301.4 billion, which is actually higher than the export target of US$ 300 billion set for the April-December period of 2021-22. This shows that India is well on track as far as attaining the export target is concerned. Sharp recovery in key markets; increased consumer spending; pent up savings and disposable income due to announcement of fiscal stimulus by major economies; global commodity price rise and an aggressive export push by the government have bolstered exports in 2021-22.
3.11 After bottoming out in Q1: FY 21, there was an impressive rebound in merchandise exports, with strong y-o-y and sequential growth, crossing a milestone of US$ 100 billion in Q2 and Q3 of 2021-22 (Figure 4a). This is remarkable in view of moderation in global trade growth, elevated shipping rates and persistent problem of container shortages.

89External Sector
Figure 4: India’s Merchandise Exports
020406080
100120
Q1 Q2 Q3 Q4 Q1 Q2 Q3 Q4 Q1 Q2 Q3
2019-20 2020-21 2021-22 (P)
US$
Bill
ion
POL Exports Non POL Exports
-40-20020406080100
-40-20
020406080
100
Q1 Q2 Q3 Q4 Q1 Q2 Q3 Q4 Q1 Q2 Q3
2019-20 2020-21 2021-22 (P)
Gro
wth
rat
e (y
-o-y
), P
er c
ent
Per
cen
tage
Poi
nts
POL Exports Non POL Exports Exports growth (RHS)
a. Accelerating exports in 2021-22 b. Relative Contribution in Exports growth(Driven by both POL & non-POL exports)
Source: Department of Commerce Note: P: Provisional
3.12 The rise in exports is contributed by high growth in petroleum, oil and lubricants (POL) exports (constituting about 15 per cent of total exports) as well as non-POL exports, indicating the broad-based nature of expansion (Figure 4b). This is reflected in the fact that more than 85 per cent of major export commodity groups recorded positive growth during April-December, 2021 over April-December, 2020. Driven by robust demand for engineering goods, gems & jewellery, and chemicals, the non-POL exports stood at US$ 257.5 billion during 2021-22 (April-December), registering a growth of 40.1 per cent over corresponding period of last year and 24.9 percent over 2019-20 (April-December).
3.13 Owing to rise in global crude oil prices, petroleum products continued to be the most exported commodity in April-November 2021, whose exports have more than doubled and their share rose to 14.9 percent from 8.8 per cent in corresponding period a year earlier (Table 1). Exports of pearls, precious, semi-precious stones and gold & other precious metal jewellery have shown substantial growth of 88 per cent in April-November, 2021 compared to last year owing to various measures undertaken by Government such as reduction in import duty of precious metals, resolution of procedural issues to enhance ease of doing business along with revival in demand in major export markets. The exports of aluminium and its products is a newly added commodity in the list of top ten exported commodities during April-November, 2021.
Table 1: Top 10 Export Commodities
Rank Commodity
(US$ Billion) Share (in Per cent)
2019-20
2020-21
2020-21
2021-22 (P) 2019-
202020-
212020-21 2021-22
(P)(Apr-Nov) (Apr-Nov)
1 Petroleum Products 41.3 25.8 15.3 39.5 13.2 8.8 8.8 14.9
2
Pearl, Precious, Semiprecious Stones
20.7 18.1 9.8 18.1 6.6 6.2 5.6 6.8
3 Iron and Steel 9.3 12.1 7.7 15.9 3.0 4.2 4.4 6.0

90 Economic Survey 2021-22
4Drug Formulations, Biologicals
15.9 19.0 12.4 12.4 5.1 6.5 7.1 4.7
5
Gold and other precious metal jewellery
13.7 6.6 3.8 7.6 4.4 2.3 2.2 2.8
6 Organic Chemicals 8.3 7.6 4.8 7.4 2.7 2.6 2.8 2.8
7
Electric Machinery and equipment
9.0 8.1 5.1 6.4 2.9 2.8 2.9 2.4
8Aluminium, Products of Aluminium
5.1 5.8 3.6 6.1 1.6 2.0 2.1 2.3
9 Products of Iron and Steel 7.0 6.6 3.9 5.4 2.2 2.2 2.2 2.0
10 Marine Products 6.7 6.0 4.0 5.4 2.1 2.0 2.3 2.0
Total of above 10 commodities 137.1 115.8 70.3 124.1 43.8 39.7 40.4 46.7
India’s Total Exports 313.4 291.8 174.2 265.7 100 100 100 100
Source: Department of CommerceNote: P: Provisional
3.14 Taking advantage of the increased demand for staples during the COVID-19 pandemic, India’s agricultural exports continue to do well in 2021-22, backed by an effective agriculture export policy. The export of agriculture and allied products (including marine and plantation products) grew by 23.2 per cent to US$ 31.0 billion during April-November, 2021 over the corresponding period of 2020-21 and by 35.0 per cent over April-November, 2019, surpassing the pre-pandemic levels (Figure 5). The list of top 10 agricultural export commodities during 2021-22 (April-November) is indicated at Annexure I.
3.15 Pro-active support of export promotion agencies including Export Inspection Council (EIC), Agricultural & Processed Food Products Export Development Authority (APEDA) and export facilitating measures like online issuance of certificates required for exports, aided growth of agricultural exports during the pandemic. Under Transport and Marketing Assistance (TMA) for specified agriculture products scheme, the rates of assistance were increased for the exports effected on or after 01.04.2021. Ministry of Civil Aviation launched the Krishi UDAN (Ude Desh ka Aam Nagarik) scheme in August 2020 to assist farmers in transporting agricultural products on international and national routes to improve their value realisation.

91External Sector
Figure 5: Agricultural Exports (US$ Billion)
39.1
32.8 33.7
38.9 39.235.6
41.9
25.2
31.0
2014-15 2015-16 2016-17 2017-18 2018-19 2019-20 2020-21 Apr-Nov2020
Apr-Nov2021(P)
Growth of 17.7%
Growth of 23.2%
Source: Department of Commerce Note: P: Provisional
3.16 It is observed that even the segments like marine products, buffalo meat, tea, coffee and dairy products, which had not performed well during 2020-21, have registered substantial growth during the current year. This augurs well for further diversification and strengthening of agricultural exports in the coming years.
3.17 United States of America (USA) remained the top export destination in April-November, 2021 followed by United Arab Emirates (UAE) and China (Figure 6). Belgium has replaced Malaysia and entered into the top ten leading export destinations during April-November 2021, with more than a billion dollars’ worth of pearls, precious and semi-precious stones, and iron and steel shipped to the country.
Figure 6: Top ten Export Destinations in 2021-22 (April- November) [By Share in Per cent]
18.4
6.65.93.5
2.82.82.6
2.6 2.4 2.3 USAUAEChinaBangladeshHong KongSingaporeNetherlandU KBelgiumGermany
Source: Department of Commerce
3.18 India has diversified its export destinations in last 25 years, yet more than 40 per cent of India’s exports is still accounted by only seven countries. India has been negotiating free trade

92 Economic Survey 2021-22
agreements (FTAs) with several partners – both bilateral and regional – over the past many years with a view to promote India’s exports. A further push in this direction would help provide the institutional arrangements to, inter alia, diversify both products and destinations.
Progress on Trade Agreements
3.19 During last few years, India has initiated its trade agreement negotiations and reviewed existing agreements with many countries. This inter alia includes negotiations for (i) Comprehensive Economic Cooperation Agreement (CECA) between India and Australia (ii) FTA with European Union (EU) (iii) Comprehensive Economic Partnership Agreement (CEPA) with Canada and (iv) CEPA with UAE. In addition, India is reviewing its existing trade agreements such as the CECA with Singapore and ASEAN-India Trade in Goods Agreement (AITIGA) with ASEAN, among others. Negotiations are complete for agreement with UAE and at advance stage with Australia.
3.20 Further, India launched the FTA negotiations with the UK on 13th January, 2022, which is expected to facilitate the target of doubling bilateral trade by 2030, set by the Prime Ministers of both the nations in May 2021. Under India-US Trade Policy Forum (Ministerial), discussions were held with the US delegation on 6th October 2021 regarding Social Security Agreement, Mutual Recognition Agreements (MRAs) in nursing services and accountancy services, and mobility issues concerning Indian professionals.
Major Schemes & Initiatives to boost exports
3.21 The impressive performance of India’s exports may be attributed to various schemes and initiatives taken by the Government to boost exports and to reduce the adverse impact of COVID-19. Some of these schemes are as under:
i. Remission of Duties and Taxes on Exported Products (RoDTEP): In order to boost Indian exports, a WTO compliant RoDTEP scheme is brought into effect from 01.01.2021. Based on the globally accepted principle that taxes and duties should not be exported, this scheme is an improvement over Merchandise Exports from India Scheme (MEIS). This new scheme reimburses currently un-refunded Central, State, and Local taxes and duties incurred in the process of manufacture and distribution of exported products and thereby provides a level playing field to domestic industry abroad. Major components of taxes covered are electricity duty, value-added tax (VAT) on fuels used in transportation/distribution, mandi tax, stamp duty, etc.
ii. Developing District as Export Hub: Under this initiative, the focus is to make districts active stakeholders in the promotion of exports of goods/services produced/manufactured in the district. District Export Promotion Committees (DEPCs) have been set up in each district. Products with export potential (including agricultural, geographical indication (GI) & toy clusters) have been identified in all 739 districts across the country. This scheme would help in diversifying the portfolio of export commodities.
iii. Production-Linked Incentive (PLI) scheme: An outlay of `1.97 lakh crore (US$ 26 billion) was announced in Union Budget 2021-22 for Production-Linked Incentive (PLI)

93External Sector
scheme for 14 key sectors starting from 2021-22. The scheme provides incentives to companies on incremental sales for products manufactured in domestic units, which is expected to create minimum production of over US$ 500 billion in 5 years. Automobiles and auto components, pharmaceutical drugs, telecom & networking products, electronic/ technology products, etc., are some of the sectors covered under PLI scheme. The scheme is expected to give a push to both domestic manufacturing capabilities and exports. (Refer to Industry and Infrastructure Chapter for details)
iv. Electronic Platform for Preferential Certificate of Origin (CoO): In view of the COVID-19 crisis, on-boarding of FTAs/ preferential trade agreements (PTAs) was quickly done to allow electronic issuance to avoid physical movement. Around 4.6 lakh CoOs have been issued from the e-platform till date.2 Issuance of Non-Preferential CoOs was also started from 15.04.2021.
v. Infusion of capital in EXIM Bank: Government of India infused capital of `750 crore in Export-Import Bank of India (EXIM Bank) during the current financial year 2021-22 through subscription to its share capital.
vi. Export Credit Guarantee Corporation of India Ltd. (ECGC) provides insurance cover to banks against risks in export credit lending to the exporter borrowers. Government approved capital infusion of `4,400 crore to ECGC Ltd. over a period of five years, i.e. from 2021-2022 to 2025-2026. This will increase the capacity of ECGC to underwrite risks up to `88,000 crore, that will support additional exports of `5.28 lakh crore over the five-year period.
vii. Export Promotion Capital Goods (EPCG) Scheme is an ongoing scheme under the foreign trade policy. In order to increase procurement of capital goods from indigenous manufacturers under the EPCG scheme, the government has reduced specific export obligations from 90 per cent to 75 per cent of the normal export obligation.
viii. The export promotion schemes such as Trade Infrastructure for Export Scheme (TIES), Market Access Initiatives (MAI), Special Economic Zone (SEZ) scheme, Emergency Credit Line Guarantee Scheme (ECLGS) and Advance Authorization Scheme continue to provide support to trade infrastructure and marketing.
Box 1: Enabling an efficient Logistics eco-system to boost exports
An efficient, competitive and resilient logistics ecosystem is pivotal to boost exports. Despite multiple challenges, India has made substantial progress in trade-related logistics, reflected in leading global indices. India scored 90.3 per cent in 2021 in United Nations Economic and Social Commission for Asia Pacific’s (UNESCAP) latest Global Survey on Digital and Sustainable Trade Facilitation, a remarkable jump from its score of 78.5 per cent in 2019, on account of improvement in scores of five key indicators. The Survey notes that India is the best performing country when compared to South and South West Asia region (63.1 per cent) and Asia Pacific region (65.9 per cent).
India witnessed consistent and significant increase in its overall trade facilitation score since 2015, supported by continuous improvement in each of the five indicators (Figure B1.1). Transparency index got 100 per cent score in 2021, while paperless trade and formalities got 96 per cent.
2A non-preferential COO certifies the origin of the goods but does not grant any preferential tariff rights to the exporter.

94 Economic Survey 2021-22
Figure B1.1: Performance of India in Global Survey on Digital and Sustainable Trade Facilitation
63.4 67.778.5
90.3
2015 2017 2019 202180
71
44
78
28
93
71
67
78
28
93
88
67
81
56
100
96
89
96
67
Transparency
Formalities
Institutional Arrangement andCooperation
Paperless Trade
Cross-Border Paperless Trade
2015 2017 2019 2021
a. Overall Trade facilitation score b. Scores on key indicators
Source: UNESCAP
Pradhan Mantri Gati Shakti National Master Plan (NMP)
Approved in October 2021, PM Gati Shakti NMP aims to provide multimodal connectivity to various economic zones and integrate the infrastructure linkages holistically for seamless movement of people, goods & services to improve logistics efficiency. Gati Shakti will bring 16 Ministries together for integrated planning and coordinated implementation of infrastructure connectivity projects like Bharatmala, Sagarmala, inland waterways, UDAN etc. It will also leverage technology extensively including spatial planning tools with ISRO imagery developed by BiSAG-N (Bhaskaracharya National Institute for Space Applications and Geoinformatics). Economic zones like textile clusters, pharmaceutical clusters, electronic parks, etc. will be covered to make Indian businesses more competitive globally by cutting down the logistics costs and ensure proper linkages for local industry & consumers. This will boost economic growth, attract foreign investment and create multiple employment opportunities. (Refer Box 7 in Industry and Infrastructure chapter)
Other Initiatives to improve logistics ecosystem
Government has taken various steps in last few years to improve logistics efficiency through infrastructure enhancement and process reforms. Some of them include introduction of FASTag, Turant Customs, mandatory RFID (Radio Frequency Identification) tagging at all EXIM bound containers, E-San chit, Indian Customs Enquiry for Trade Assistance and Knowledge (ICETRAK), ICEDASH (Indian Customs EDI Dashboard), Secured Logistics Document Exchange (SLDE), Import Clearance System, GHG Calculator etc. In order to ease maritime trade, efforts are being undertaken on development of port-specific master plans and a coordination mechanism for implementation of the same, upgradation of select Land Customs Stations (LCS) to Integrated Check Posts (ICPs), promoting Free Trade Warehousing Zones, etc.
Merchandise Imports
3.22 As the pandemic ebbed, India witnessed revival in domestic demand resulting in strong import growth. The merchandise imports grew at the rate of 68.9 per cent to US$ 443.8 billion in April-December, 2021 over the corresponding period of last year and 21.9 per cent over April-December, 2019, crossing the pre-pandemic levels. Like in the case of merchandise exports,

95External Sector
imports also showed secular rise since Q1: FY 21 and reached about US$ 166 billion in Q3: FY 22, crossing the pre-COVID levels (Figure 7a).
Figure 7: India’s Merchandise Imports
0
40
80
120
160
200
Q1 Q2 Q3 Q4 Q1 Q2 Q3 Q4 Q1 Q2 Q3
2019-20 2020-21 2021-22 (P)
US$
Bill
ion
Non-POL & Non Gold & Silver ImportsGold & Silver ImportsPOL Imports
-80
-40
0
40
80
120
-80
-40
0
40
80
120
Q1 Q2 Q3 Q4 Q1 Q2 Q3 Q4 Q1 Q2 Q3
2019-20 2020-21 2021-22 (P)
Gro
wth
rat
e (y
-o-y
), P
er c
ent
Per
cent
age
Poi
nts
Non-POL & Non Gold & Silver ImportsGold & Silver ImportsPOL Imports
a. Rising imports in 2021-22b. Relative Contribution in Imports Growth
(Non-POL, non-Gold & silver imports contributing maximum)
Source: Department of Commerce Note: P: Provisional
3.23 The expansion recorded in merchandise imports in April-December, 2021 is accounted by the positive growth in all the three components i.e. gold & silver imports (accounting for 9.1 per cent share in total imports), POL imports (26.6 per cent share) and non-POL, non-Gold & silver imports (64.3 per cent share), with latter contributing the maximum indicating acceleration in domestic activity (Figure 7b). It is observed that more than 93 per cent of major import commodities have registered positive growth in April-December, 2021 compared to last year, indicating a broad-based recovery in the economy.
3.24 Owing to significant rise in crude oil prices, POL imports rose by 119.2 percent to US$ 118.3 billion in April-December, 2021 over corresponding a year earlier and by 22.3 per cent compared to April-December, 2019. The crude oil price (Indian basket) surpassed the pre-COVID level and was as high as US$ 82.1 per barrel in October 2021. On the other hand, the volume of POL imports rose higher than last year, but remained below the pre-pandemic levels. Gold and silver imports more than doubled to US$ 40.0 billion, as against US$ 17.5 billion in corresponding period a year earlier and surpassed the pre-pandemic level of US$ 25.4 billion recorded in April-December, 2019.
3.25 Non-POL, non-gold & silver imports were US$ 285.5 billion in April-December, 2021, witnessing a positive growth of 49.3 percent compared to corresponding period of last year and 17.9 percent over April-December, 2019. Electronic goods; pearls, precious & semi-precious stones; and coal, coke & briquettes, etc., contributed maximum in the non-POL, non-gold & silver import growth in the said period.
3.26 Among major import commodities, crude petroleum imports more than doubled to US$ 73.3 billion in April-November, 2021 compared to last year and continues to be the highest imported commodity. Gold imports registered sharp rise to US$ 33.2 billion (8.7 per cent share), from US$ 12.3

96 Economic Survey 2021-22
billion (5.6 per cent share) in corresponding period a year earlier, returning to second position (Table 2). This is due to significant increase in volume of gold imports that have more than tripled compared to last year and surpassed the pre-pandemic levels, on account of strong festive and export demand, favoured by drop in international gold prices. Industrial machinery for dairy and Iron & Steel do not figure in the list of top ten import commodities in current year, unlike in April-November, 2019.
Table 2: Top 10 Import Commodities
Rank Commodity
(US$ Billion) Share (in Per cent)
2019-20 2020-212020-21 2021-22
(P) 2019-20 2020-212020-21 2021-22 (P)
(Apr-Nov) (Apr-Nov)
1 Petroleum: Crude 102.7 59.5 31.3 73.3 21.6 15.1 14.2 19.2
2 Gold 28.2 34.6 12.3 33.2 5.9 8.8 5.6 8.7
3 Petroleum Products 27.8 23.2 13.1 24.1 5.9 5.9 5.9 6.3
4
Pearl, Precious, Semiprecious Stones
22.5 18.9 9.3 19.2 4.7 4.8 4.2 5.0
5
Coal, Coke and Briquittes, etc.
22.5 16.3 9.7 18.9 4.7 4.1 4.4 4.9
6 Electronics Components 16.3 15.3 8.7 14.5 3.4 3.9 4.0 3.8
7 Vegetable Oils 9.7 11.1 6.8 12.2 2.0 2.8 3.1 3.2
8 Organic Chemicals 12.2 11.1 6.3 11.2 2.6 2.8 2.9 2.9
9Computer Hardware, Peripherals
9.0 10.4 6.6 9.7 1.9 2.6 3.0 2.6
10 Plastic Raw Materials 10.4 9.7 5.2 9.5 2.2 2.5 2.4 2.5
Total of above 10 commodities 261.3 210.1 109.3 225.9 55.0 53.3 49.7 59.2
India’s Total Imports 474.7 394.4 219.8 381.4 100 100 100 100
Source: Department of Commerce Note: P: Provisional
3.27 Among the top ten countries for import origin, China, UAE and USA were the top import sources for India in April-November, 2021, with China's share reducing to 15.5 per cent from 17.7 per cent in corresponding period a year earlier – reflecting increased diversification of India's import sources. Switzerland, which was ousted last year from top ten sources of India’s import, bounced back at sixth position with a share of 4.7 percent in April-November, 2021. Indonesia – second biggest source of crude palm oil – remains to be one of top ten suppliers of India, with a share of 2.9 percent in total imports during same period (Figure 8).

97External Sector
Figure 8: Top ten Import Sources in 2021-22 (April-November) [By Share in Per cent]
Source: Department of Commerce
Merchandise Trade Balance
3.28 As enumerated above, owing to the recovery of global demand with a revival in domestic activity as well as in many trading partners, both the merchandise exports as well as imports rebounded strongly and surpassed pre-pandemic levels leading to an increase in merchandise trade deficit. It stood at US$ 142.4 billion in April-December, 2021 compared to deficit of US$ 61.4 billion in corresponding period of last year and US$ 125.9 billion in April-December, 2019. The merchandise trade deficit widened after bottoming out in Q1: FY 21 (Figure 9).
Figure 9: Increasing Merchandise Trade Balance due to high growth in exports and imports
39.0
49.7
-80
-40
0
40
80
120
-80
-60
-40
-20
0
20
40
Q1 Q2 Q3 Q4 Q1 Q2 Q3 Q4 Q1 Q2 Q3
2019-20 2020-21 2021-22 (P)
Gro
wth
rat
e (y
-o-y
), Pe
r ce
nt
US$
Bill
ion
Trade Balance Exports (RHS) Imports (RHS)
Source: Department of Commerce Note: P: Provisional.
3.29 Table 3 shows India’s merchandise trade balance with major countries during 2021-22 (April-November) compared to 2020-21 (April-November). India had the most favourable trade balance with USA followed by Bangladesh and Nepal.

98 Economic Survey 2021-22
Table 3: India’s Merchandise Trade Balance with Major Countries
(US$ Billion) Exports Imports Trade Balance
S. Country Apr-Nov 20
Apr-Nov 21 (P)
Apr-Nov 20
Apr-Nov 21 (P) Apr-Nov 20 Apr-Nov
21 (P)No1 U S A 31.3 49.0 16.3 27.4 15.0 21.62 Bangladesh 5.1 9.2 0.6 1.3 4.4 7.93 Nepal 3.5 6.0 0.4 1.0 3.1 5.04 Turkey 2.3 5.1 0.9 1.3 1.4 3.85 Netherland 3.8 6.9 1.9 2.8 1.9 4.16 U K 4.6 6.8 2.6 4.3 2.0 2.57 Italy 2.6 5.4 2.2 3.2 0.4 2.18 Korea 2.9 4.8 7.1 11.1 -4.2 -6.39 Qatar 0.8 1.2 4.6 7.7 -3.8 -6.510 U A E 9.7 17.5 13.1 27.9 -3.4 -10.411 Saudi Arab 3.6 5.8 9.2 19.2 -5.6 -13.412 Iraq 1.0 1.3 7.6 18.5 -6.6 -17.213 Switzerland 0.9 0.9 5.8 17.8 -4.9 -16.914 China 13.6 15.6 38.8 59.0 -25.2 -43.4
Source: Department of CommerceNote: P: Provisional
TRADE IN SERVICES Services Exports
3.30 India has maintained its impressive performance in world services trade in the post COVID-19 period. Despite pandemic induced global restrictions and weak tourism revenues, India’s services exports recorded growth of 18.4 per cent to US$ 177.7 billion during 2021-22 (April-December), over corresponding period a year earlier (Table 4) and 11.0 per cent growth over 2019-20 (April-December), surpassing the pre-pandemic levels.3 This is mainly on account of top three computer, business and transportation services that constitute more than 80 per cent of total services exports. After registering a slump in Q1: FY 21, services exports remained resilient since Q2: FY 21 onwards and rose consistently to reach to US$ 60 billion in Q3: FY 22 (Figure 10).
Table 4: Services Trade Performance
(US$ Billion)
2019-20 2020-21 2020-21(Apr-Dec)
2021-22(Apr-Dec)* (P)
Services Exports 213.2 206.1 150.1 177.7Services Imports 128.3 117.5 85.0 103.3
Source: Reserve Bank of India and Department of CommerceNote: *: The data for December 2021 is an estimation; P: Provisional3The data for December 2021 is an estimation, which will be revised based on RBI's subsequent release. The latest data for services sector released by RBI is till November 2021.

99External Sector
Figure 10: Rising Services Exports and Imports
52 53 55 5347
5053 56 56
61 60
32 32 33 3126 29 30 33 30
36 37
0
10
20
30
40
50
60
70
Q1 Q2 Q3 Q4 Q1 Q2 Q3 Q4 Q1 Q2 Q3*
2019-20 2020-21 2021-22 (P)
US$
Bill
ion
Services Exports Services Imports
Source: Reserve Bank of India and Department of Commerce Note: *: Based on estimates; P: Provisional
3.31 Computer services exports continue to be the largest exported service in H1: FY 22, constituting about 49 per cent of total services exports. They exhibited positive sequential growth since Q2: FY 21 on account of increasing demand for digital support, cloud services and infrastructure modernisation owing to new pandemic challenges. Exports of business services – the second major segment – also showed recovery underpinned by improvement in professional, management and consultancy services. The transportation services exports grew by 40.7 per cent in H1: FY 22 to US$ 14.3 billion due to increase in cross-border trade activity and the shortage in shipping containers impacting transport costs. The quarterly component-wise services exports data is presented in Annexure II.
3.32 The strong growth witnessed in services exports may also be attributed to key reforms undertaken by Government, which inter alia include liberalizing the Other Service Providers (OSPs) in November 2020 and further in June 2021 announcing reform package for Telecom sector to infuse liquidity, encourage investment and reduce regulatory burden on the telecom service providers. (Refer Box in Chapter on Services)
Services Imports
3.33 Services imports rose by 21.5 per cent to US$ 103.3 billion in 2021-22 (April-December) from the corresponding period a year earlier (Table 4) and 6.2 per cent over 2019-20 (April-December), crossing the pre-pandemic levels.4 The surge in services imports is mainly on account of payments for business, transport, travel and computer services, which together constitute more than 75 per cent of services imports. Like in the case of services exports, India’s imports of services also reported slowdown in Q1: FY 21 due to pandemic induced lockdown. However, they improved subsequently and touched US$ 37 billion in Q3: FY 22 (Figure 10). 4The data for December 2021 is an estimation, which will be revised based on RBI’s subsequent release. The latest data for services sector released by RBI is till November 2021.

100 Economic Survey 2021-22
3.34 Business services with the largest share in services imports grew by 0.9 per cent on y-o-y basis in H1: FY 22. Amid resumption in global activity coupled with international shortage in shipping vessels, transportation costs escalated, resulting in large increase in transport payments that grew by 64.9 per cent on y-o-y basis to US$ 14.8 billion in H1: FY 22. Outward travel also resumed in H1: FY 22 with travel payments reporting growth of 23.1 per cent compared to H1: FY 21. The quarterly component-wise services imports data is presented in Annexure III.
PRIVATE TRANSFERS3.35 In H1: FY 22, the net private transfers – mainly representing remittances by Indians employed overseas – grew by 7.2 per cent to US$ 38.4 billion, over corresponding period a year earlier and by modest 0.1 per cent over H1: FY 20, exceeding the pre-pandemic levels. As per the Migration and Development Brief 35, World Bank (November 2021), India continues to be the largest remittance recipient country in the world in 2021 (in current US dollar terms) and has been so since 2008. After bottoming out in Q1: FY 21, net private transfers registered positive growth and amounted to US$ 19.2 billion in Q2: FY 22 (Figure 11).
Figure 11: Remittances
18.2
20.2
19.118.7
17.2
18.619.5
19.119.2
19.2
-10
-5
0
5
10
15
20
15
16
17
18
19
20
21
Q1 Q2 Q3 Q4 Q1 Q2 Q3 Q4 Q1 Q2
2019-20 2020-21 2021-22 (P)
Gro
wth
rat
e (y
-o-y
), P
er c
ent
US
$ B
illi
on
Net Remittances Growth in Remittances (RHS) 87
53 53
36 33 3327 23 20 18
0
20
40
60
80
100
Indi
a
Chi
na
Mex
ico
Phi
lipp
ines
Egy
pt
Pak
ista
n
Fra
nce
Ban
glad
esh
Ger
man
y
Vie
tnam
US
$ B
illi
on
a. Net Remittances in India b. Remittance Inflows in 2021*
Source: Reserve Bank of India and World BankNote: *: Estimates
INVISIBLES3.36 On account of higher net services receipts and private transfers, net invisibles were higher at US$ 72.1 billion in H1: FY 22, compared to US$ 60.1 billion last year (Table 5) and US$ 63.7 billion in H1: FY 20, surpassing the pre-COVID levels. Following the trend of services and transfers, net invisibles also experienced increase beyond Q1: FY 21. However, there is sequential decline in Q2: FY 22 due to higher net outgo from the primary income account, mainly reflecting net overseas investment income payments (Figure 12).
Table 5: Net Invisibles and its components
(US$ Billion)
Year / Item (Net) 2019-20 2020-21 2020-21 H1 2021-22 H1 (P)
Invisibles 132.8 126.1 60.1 72.1
Services 84.9 88.6 41.8 51.4
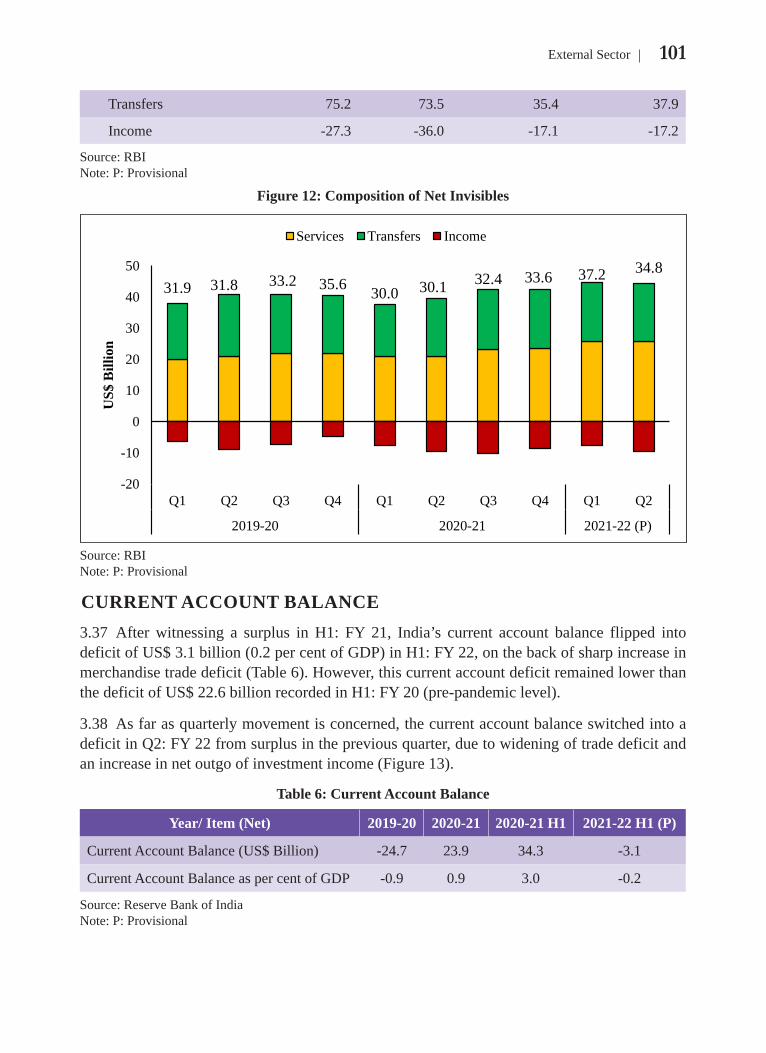
101External Sector
Transfers 75.2 73.5 35.4 37.9
Income -27.3 -36.0 -17.1 -17.2
Source: RBINote: P: Provisional
Figure 12: Composition of Net Invisibles
31.9 31.8 33.2 35.6 30.0 30.1 32.4 33.6 37.2 34.8
-20
-10
0
10
20
30
40
50
Q1 Q2 Q3 Q4 Q1 Q2 Q3 Q4 Q1 Q2
2019-20 2020-21 2021-22 (P)
US$
Bill
ion
Services Transfers Income
Source: RBINote: P: Provisional
CURRENT ACCOUNT BALANCE3.37 After witnessing a surplus in H1: FY 21, India’s current account balance flipped into deficit of US$ 3.1 billion (0.2 per cent of GDP) in H1: FY 22, on the back of sharp increase in merchandise trade deficit (Table 6). However, this current account deficit remained lower than the deficit of US$ 22.6 billion recorded in H1: FY 20 (pre-pandemic level).
3.38 As far as quarterly movement is concerned, the current account balance switched into a deficit in Q2: FY 22 from surplus in the previous quarter, due to widening of trade deficit and an increase in net outgo of investment income (Figure 13).
Table 6: Current Account Balance
Year/ Item (Net) 2019-20 2020-21 2020-21 H1 2021-22 H1 (P)
Current Account Balance (US$ Billion) -24.7 23.9 34.3 -3.1
Current Account Balance as per cent of GDP -0.9 0.9 3.0 -0.2
Source: Reserve Bank of IndiaNote: P: Provisional

102 Economic Survey 2021-22
Figure 13: Current Account Balance (CAB)
-4
-2
0
2
4
6
-20
-10
0
10
20
30
Q1 Q2 Q3 Q4 Q1 Q2 Q3 Q4 Q1 Q2
2019-20 2020-21 2021-22 (P)
Per
cen
t of
GD
P
US$
Bil
lion
CAB CAB to GDP ratio (RHS)
-15.0 -7.6 -2.6 0.6 19.1 15.3 -2.2 -8.2 6.5 -9.6
-60
-40
-20
0
20
40
60
Q1 Q2 Q3 Q4 Q1 Q2 Q3 Q4 Q1 Q2
2019-20 2020-21 2021-22 (P)
US$
Bill
ion
Net Merch. Trade Bal Net ServicesNet Transfers Net Income
a. CAB and as percent of GDP b. Composition of CAB
Source: RBINote: P: Provisional
CAPITAL ACCOUNT/ FINANCIAL ACCOUNT3.39 In H1: FY 22, net capital flows more than tripled to US$ 65.6 billion (4.5 per cent of GDP) over those in H1: FY 21, on the back of continued inflow of foreign investment, rise in loans mainly external commercial borrowings (ECBs), banking capital and other capital (inclusive of SDR allocation of US$ 17.9 billion by the IMF) (Table 7). These were also higher than the corresponding period of pre-pandemic level (H1: FY 20).
3.40 Net capital flows remained volatile yet witnessed y-o-y and sequential growth in both quarters of 2021-22. While the capital flows rose in Q1: FY 22 mainly on account of robust foreign direct investment on y-o-y basis, it increased further in Q2: FY 22 mainly due to the increase in FPI, ECBs and allocation of special drawing rights (SDR) by IMF, reflected in notable rise in net other capital (Figure 14).
Table 7: Capital Account Balance
(US$ Billion, unless otherwise indicated)
S.No. Year / Item (Net) 2019-20 2020-21 2020-21 H1 2021-22 H1 (P)A. Capital Account (A1 to A5) 83.2 63.7 17.3 65.6A1. Foreign Investment 44.4 80.1 31.5 25.4A1.1 Foreign Direct Investment (FDI) 43.0 44.0 23.9 21.2A1.2 Foreign Portfolio Investment (FPI) 1.4 36.1 7.6 4.3A2. Loans 25.7 6.9 -1.1 10.4A3. Banking Capital -5.3 -21.1 -9.0 4.4A4. Rupee Debt Service -0.1 -0.1 -0.1 -0.1A5. Other Capital 18.5 -2.1 -4.0 25.4
B. Capital Account Balance to GDP ratio (Percent) 2.9 2.4 1.5 4.5
Source: Reserve Bank of IndiaNote: P: Provisional

103External Sector
Figure 14: Capital Account Balance and its ratio to GDP
0
1
2
3
4
5
6
0
10
20
30
40
50
Q1 Q2 Q3 Q4 Q1 Q2 Q3 Q4 Q1 Q2
2019-20 2020-21 2021-22 (P)
Per
cen
t of
GD
P
US
$ B
illi
on
Net Capital A/c Bal Capital A/c to GDP -RHS
28.6
13.6
23.6 17.4
1.4
15.9
34.1
12.325.5
40.1
-20-10
01020304050
Q1 Q2 Q3 Q4 Q1 Q2 Q3 Q4 Q1 Q2
2019-20 2020-21 2021-22 (P)
US
$ B
illi
on
Net Foreign Investment Net LoansNet Banking Capital Net Other Capital (including RDS)
a. Capital Account Balance and as percent of GDP b. Composition of Capital Account Balance
Source: RBI Note: RDS: Rupee Debt Service; P: Provisional
3.41 Foreign Investment, consisting of foreign direct investment (FDI) and foreign portfolio investment (FPI), is the largest component of the capital account. Falling short of the pre-pandemic level, the net foreign investment inflows (FIIs) – primarily driven by FDI – moderated to US$ 25.4 billion in H1: FY 22 compared to corresponding period of FY 21.
3.42 The latest aggregate data on FDI is available till November 2021. While net FDI recorded a lower inflow of US$ 24.7 billion, the gross FDI inflows moderated at US$ 54.1 billion during April-November, 2021 compared to corresponding period last year, largely due to lower equity investment. The quarterly movement may be seen at Figure 15.
Figure 15: Foreign Direct Investment
14.0
7.3 9.712.0
-0.5
24.4
17.4
2.7
11.79.5
-1
0
1
2
3
4
5
-5
0
5
10
15
20
25
30
Q1 Q2 Q3 Q4 Q1 Q2 Q3 Q4 Q1 Q2
2019-20 2020-21 2021-22 (P)
Per
cent
of G
DP
US$
Bill
ion
Net FDI Net FDI to GDP (RHS)
Source: RBI Note: P: Provisional
3.43 As far as sector-wise FDI inflows are concerned, computer software and hardware attracted the highest FDI equity inflows of US$ 7.1 billion in April-September, 2021. Singapore continues

104 Economic Survey 2021-22
to be the top investing country in terms of FDI equity inflow while USA occupies the second position. The list of top five FDI sectors and investing countries is given in Annexure IV.
3.44 The latest aggregate data on FPI is available till December 2021. As depicted in Figure 16, FPI flows remained volatile due to global uncertainties relating to US monetary policy normalisation, rising global energy prices, fear of new variants of COVID-19 and strong inflationary pressures. While the debt market witnessed net purchases during April-December, 2021, valuation concerns and profit booking by portfolio investors led to outflows from the Indian equity market, leading to net FPI outflow of 0.6 billion, vis-à-vis net FPI inflow of US$ 28.5 billion in corresponding period a year earlier.
Figure 16: Foreign Portfolio Investment remained volatile
5.90.5
5.9
-14.5
0.5
7.0
21.1
7.6
0.35.0
-5.9
-20
-10
0
10
20
30
Q1 Q2 Q3 Q4 Q1 Q2 Q3 Q4 Q1 Q2 Q3
2019-20 2020-21 2021-22 (P)
US$
Bill
ion
Debt Equity Total FPI
Source: National Securities Depository Limited (NSDL).Note: (i) Total net FPI is summation of debt, equity, hybrid and voluntary retention route (VRR), however, only debt and equity are depicted in above chart as they together account for more than 90 per cents of the total net FPI. Balance is hybrid and VRR.(ii) P: Provisional
3.45 Among other forms of capital flows, banking capital recorded net inflow of US$ 4.4 billion in H1: FY 22 as compared with a net outflow of US$ 9.0 billion in corresponding period a year earlier, notwithstanding lower net inflows under Non-Resident Indian (NRI) deposit accounts. With fresh disbursals exceeding repayments, net disbursement of ECBs (i.e., adjusted for inter-corporate borrowing) was at US$ 4.7 billion in H1: FY 22.
BOP BALANCE AND FOREIGN EXCHANGE RESERVES3.46 As elaborated earlier, India’s current account balance switched into a deficit in H1: FY 22 on the back of widening of trade deficit, reflecting amongst other reasons, a broad-based revival of aggregate demand. However, this current account deficit (CAD) was adequately cushioned by robust capital flows, resulting into an overall balance of payments (BoP) surplus of US$ 63.1 billion in H1: FY 22. This led to an augmented foreign exchange reserves crossing the milestone of US$ 600 billion and touching US$ 635.4 billion as at end-September 2021.

105External Sector
The quarterly trends in major components of India’s balance of payments is depicted in Annexure V. While the BoP surplus in Q1: FY 22 was on account of surplus in current as well as capital account, BoP surplus in Q2: FY 22 was on the back of larger surplus on capital account more than compensating the deficit on the current account (Figure 17a).
Figure 17: Overall BoP Balance and Forex Reserves
14.0
5.121.6
18.8 19.831.6
32.5
3.4
31.931.2
0
1
2
3
4
5
6
-20
0
20
40
60
Q1 Q2 Q3 Q4 Q1 Q2 Q3 Q4 Q1 Q2
2019-20 2020-21 2021-22 (P)
Per
cen
t of
GD
P
US
$ B
Illi
on
Capital A/c Current A/c BoP balance to GDP (RHS)
430 434460 478
506545
586 577611 635 634
0
4
8
12
16
20
300
400
500
600
700
Q1 Q2 Q3 Q4 Q1 Q2 Q3 Q4 Q1 Q2 Q3
2019-20 2020-21 2021-22 (P)
No.
of
mon
ths
US
$ B
illi
on
FER Import Cover (RHS)
a. Surplus in BoP balance b. Augmented forex reserves and Import Cover
Source: RBINote: (i) The forex reserves indicated above are as at end date of the quarter.(ii) The reserve cover of imports for Q3 2021-22 is provisional and will change once quarterly BoP is released.(iii) P: Provisional
3.47 There was a massive increase in India’s foreign exchange reserves during 2021-22. The forex reserves stood higher at US$ 633.6 billion as at end-December 2021, than US$ 577.0 billion as at end-March 2021. However, the import cover of India’s foreign exchange reserves declined to 13.2 months at end-December 2021 from 17.4 months at end-March 2021 as merchandise imports increased with pick-up in domestic economic activity (Figure 17b).5 As at end-November 2021, India was the fourth largest foreign exchange reserves holder in the world after China, Japan and Switzerland.
3.48 The current account deficit in the BoP determines how much of net capital inflows into the country can be absorbed or used for growth. It is expected to be within the manageable limits during 2021-22. From a historical perspective, India can sustain a current account deficit of 2.5-3.0 per cent of GDP without getting into an external sector crisis.6
MOVEMENT IN EXCHANGE RATE3.49 Indian rupee depreciated by 4.5 per cent (y-o-y basis) against US dollar in 2020-21. Although the rupee exhibited movements in both directions against US dollar during April-December, 2021, it depreciated by 3.4 per cent in December 2021 over March 2021. The depreciation of the rupee, however, was modest as compared with its emerging market peers, such as Turkish lira, Argentine Peso, Thai baht, and Philippine peso (Figure 18). The rupee appreciated against euro, Japanese yen and pound sterling by 1.8 per cent, 1.3 per cent and 0.6 per cent, respectively, in December 2021 over March 2021.
5Import cover is calculated based on import data (BoP basis) for latest four quarters. For Oct-Dec 2021, provisional import data as provided by DGCIS is used.6Patra, M D (2021): Growth and Development in the BRICS Economies, RBI, Bulletin, December
to be the top investing country in terms of FDI equity inflow while USA occupies the second position. The list of top five FDI sectors and investing countries is given in Annexure IV.
3.44 The latest aggregate data on FPI is available till December 2021. As depicted in Figure 16, FPI flows remained volatile due to global uncertainties relating to US monetary policy normalisation, rising global energy prices, fear of new variants of COVID-19 and strong inflationary pressures. While the debt market witnessed net purchases during April-December, 2021, valuation concerns and profit booking by portfolio investors led to outflows from the Indian equity market, leading to net FPI outflow of 0.6 billion, vis-à-vis net FPI inflow of US$ 28.5 billion in corresponding period a year earlier.
Figure 16: Foreign Portfolio Investment remained volatile
5.90.5
5.9
-14.5
0.5
7.0
21.1
7.6
0.35.0
-5.9
-20
-10
0
10
20
30
Q1 Q2 Q3 Q4 Q1 Q2 Q3 Q4 Q1 Q2 Q3
2019-20 2020-21 2021-22 (P)
US$
Bill
ion
Debt Equity Total FPI
Source: National Securities Depository Limited (NSDL).Note: (i) Total net FPI is summation of debt, equity, hybrid and voluntary retention route (VRR), however, only debt and equity are depicted in above chart as they together account for more than 90 per cents of the total net FPI. Balance is hybrid and VRR.(ii) P: Provisional
3.45 Among other forms of capital flows, banking capital recorded net inflow of US$ 4.4 billion in H1: FY 22 as compared with a net outflow of US$ 9.0 billion in corresponding period a year earlier, notwithstanding lower net inflows under Non-Resident Indian (NRI) deposit accounts. With fresh disbursals exceeding repayments, net disbursement of ECBs (i.e., adjusted for inter-corporate borrowing) was at US$ 4.7 billion in H1: FY 22.
BOP BALANCE AND FOREIGN EXCHANGE RESERVES3.46 As elaborated earlier, India’s current account balance switched into a deficit in H1: FY 22 on the back of widening of trade deficit, reflecting amongst other reasons, a broad-based revival of aggregate demand. However, this current account deficit (CAD) was adequately cushioned by robust capital flows, resulting into an overall balance of payments (BoP) surplus of US$ 63.1 billion in H1: FY 22. This led to an augmented foreign exchange reserves crossing the milestone of US$ 600 billion and touching US$ 635.4 billion as at end-September 2021.

106 Economic Survey 2021-22
3.50 In terms of 6-currency nominal effective exchange rate (NEER) (trade-weighted), the rupee depreciated by 2.1 per cent in December 2021 over March 2021, while it appreciated by 0.9 per cent in terms of real effective exchange rate (i.e. REER) terms (Figure 19a). Similarly, the rupee depreciated by 1.6 per cent in terms of 40-currency NEER (trade-weighted) in December 2021 over March 2021, while it appreciated by 0.4 per cent in terms of 40-currency REER, reflecting widening inflation differential with trading partners (Figure 19b).
Figure 18: Movement of exchange rate against US dollar of major EME* currencies (Nov 2021 over Nov 2020)
5.3
3.2
0.2
-0.3
-0.5
-1.6
-2.2
-2.3
-4.3
-6.5
-7.2
-8.7
-8.9
-25.5
-34.4
-40 -30 -20 -10 0 10
RussiaChina
South AfricaIndia
IndonesiaMalaysia
MexicoBrazil
PhilippinesChile
PolandThailand
Sri LankaArgentina
Turkey
Percentage Change
D Depreciation
Appreciation
Source: Bank for International Settlements (BIS)Note: *: EME: Emerging market economies
Figure 19: Index of 6-Currency and 40-Currency NEER and REER (Trade Based Weight) (Base Year: 2015-16 =100)
96
98
100
102
104
106
80
84
88
92
96
Jan
2020
Mar
202
0
May
202
0
Jul 2
020
Sep
2020
Nov
202
0
Jan
2021
Mar
202
1
May
202
1
Jul 2
021
Sep
2021
Nov
202
1
Inde
x
NEER REER (RHS)
96
98
100
102
104
106
108
90
92
94
96
98
Jan
2020
Mar
202
0
May
202
0
Jul 2
020
Sep
2020
Nov
202
0
Jan
2021
Mar
202
1
May
202
1
Jul 2
021
Sep
2021
Nov
202
1
Inde
x
NEER REER (RHS)
a. 6-Currency b. 40-Currency
Source: RBI

107External Sector
NET INTERNATIONAL INVESTMENT POSITION3.51 One way to gauge country’s resilience is to look at its net international investment position. Net International Investment Position (IIP) is the difference between the value of financial assets of residents of an economy that are claims on non-residents and the liabilities of residents of an economy to non-residents at a point in time. It represents either a net claim on or a net liability to the rest of the world.
3.52 India’s net IIP stood at (-) 11.3 per cent of GDP (US$ -332 billion) as at end-September 2021 – a sustained improvement since end-March 2019 – led by a higher asset-liability ratio, which improved to 73.6 per cent as at end-September 2021 from end-March 2021 (Figure 20). The improvement in asset- liability ratio is due to significant build-up of reserve assets (US$ 58.4 billion between Q4: FY21 and Q2: FY22), which more than compensated for build-up in liabilities on account of FDI, FPI and other investments.
Figure 20: Net International Investment Position (IIP)
-265-332
-15.3
-11.3
-20
-16
-12
-8
-4
0
-500
-400
-300
-200
-100
0
2012
2013
2014
2015
2016
2017
2018
2019
2020
2021
end-March end-Sept.2021P
Per
cen
t of
GD
P
US
$ B
illi
on
Net IIP Net IIP to GDP- RHS
62.3
57.8
58.7
58.9
60.6
59.5
60.2
59.5
65.6
71.073.6
50
55
60
65
70
7520
12
2013
2014
2015
2016
2017
2018
2019
2020
2021
end-March end-Sept.2021P
Per
cen
ta. Declining Net IIP and ratio to GDP b. Due to higher Asset Liabilities Ratio
Source: RBI Note: P: Provisional
EXTERNAL DEBT3.53 India’s external debt as at end-September 2021, estimated at US$ 593.1 billion, grew by US$ 22.3 billion (3.9 per cent) over the level as at end-June 2021. Excluding the valuation gains due to the appreciation of the US dollar, the increase in external debt would have been US$ 23.7 billion, instead of US$ 22.3 billion. Commercial borrowings, the largest component of external debt, at US$ 218.8 billion, recorded a quarter-over-quarter (q-o-q) positive growth of 2.5 percent over the level a quarter ago. The NRI deposits, the second largest component, at US$ 141.6 billion were at the same level as at end of the previous quarter. The short-term trade credit, the third largest component, at US$ 97.4 billion continued to contract. Together, these three components constitute 77.2 percent of total external debt as at end-September, 2021. IMF (SDRs) at US$ 23.3 billion rose by as much as US$ 17.6 billion (310.8 per cent) over the level as at end-June 2021, primarily reflecting additional SDR allocation on August 23, 2021.
3.54 India’s external debt, which crossed the pre-crisis level as at end-March 2021, consolidated further as at end-September 2021, aided by revival in NRI deposits and the afore-mentioned
3.50 In terms of 6-currency nominal effective exchange rate (NEER) (trade-weighted), the rupee depreciated by 2.1 per cent in December 2021 over March 2021, while it appreciated by 0.9 per cent in terms of real effective exchange rate (i.e. REER) terms (Figure 19a). Similarly, the rupee depreciated by 1.6 per cent in terms of 40-currency NEER (trade-weighted) in December 2021 over March 2021, while it appreciated by 0.4 per cent in terms of 40-currency REER, reflecting widening inflation differential with trading partners (Figure 19b).
Figure 18: Movement of exchange rate against US dollar of major EME* currencies (Nov 2021 over Nov 2020)
5.3
3.2
0.2
-0.3
-0.5
-1.6
-2.2
-2.3
-4.3
-6.5
-7.2
-8.7
-8.9
-25.5
-34.4
-40 -30 -20 -10 0 10
RussiaChina
South AfricaIndia
IndonesiaMalaysia
MexicoBrazil
PhilippinesChile
PolandThailand
Sri LankaArgentina
Turkey
Percentage Change
D Depreciation
Appreciation
Source: Bank for International Settlements (BIS)Note: *: EME: Emerging market economies
Figure 19: Index of 6-Currency and 40-Currency NEER and REER (Trade Based Weight) (Base Year: 2015-16 =100)
96
98
100
102
104
106
80
84
88
92
96
Jan
2020
Mar
202
0
May
202
0
Jul 2
020
Sep
2020
Nov
202
0
Jan
2021
Mar
202
1
May
202
1
Jul 2
021
Sep
2021
Nov
202
1
Inde
x
NEER REER (RHS)
96
98
100
102
104
106
108
90
92
94
96
98
Jan
2020
Mar
202
0
May
202
0
Jul 2
020
Sep
2020
Nov
202
0
Jan
2021
Mar
202
1
May
202
1
Jul 2
021
Sep
2021
Nov
202
1
Inde
x
NEER REER (RHS)
a. 6-Currency b. 40-Currency
Source: RBI

108 Economic Survey 2021-22
one-off additional SDR allocation by the IMF. Commercial borrowings and the short-term trade credit, on the other hand, which are growth-sensitive, still continued to be below the pre-pandemic levels (Table 8).
Table 8: External Debt Outstanding
(US$ billion)
Dec-19 Mar-20 Jun-20 Sep-20
PRDec-20 PR
Mar-21 PR
Jun-21 PR
Sep-21 P
1. Multilateral 60.2 59.9(-0.4)
64.7(8.0)
67.0(3.6)
68.1(1.6)
69.7(2.5)
70.2(0.6)
71.4(1.7)
2. Bilateral 27.3 28.1(2.9)
28.5(1.6)
29.3(2.7)
30.5(4.3)
30.9(1.3)
30.8(-0.5)
30.9(0.5)
3. International Monetary Fund 5.5 5.4
(-1.3)5.5
(0.8)5.6
(2.3)5.7
(2.3)5.6
(-1.6)5.7
(0.6)23.3
(310.8)
4. Trade Credit 6.9 7.0(1.9)
6.8(-2.6)
7.0(2.8)
6.5(-7.5)
6.3(-3.1)
5.7(-8.8)
5.6(-1.7)
5. Commercial Borrowings 223.1 219.5
(-1.6)211.0(-3.9)
206.8(-2.0)
207.9(0.5)
213.1(2.5)
213.4(0.2)
218.8(2.5)
6. NRI Deposits (above one-year) 133.1 130.6
(-1.9)132.7(1.6)
137.3(3.4)
140.5(2.3)
141.9(1.0)
141.5(-0.3)
141.6(0.0)
7. Rupee Debt 1.1 1.0(-5.2)
1.0(-5.2)
1.0(2.0)
1.0(0.9)
1.0(-2.2)
1.0(-0.8)
1.0(-1.6)
8. Total Long-Term Debt (1 to 7) 457.2 451.6
(-1.2)450.2(-0.3)
454.0(0.8)
460.2(1.4)
468.5(1.8)
468.3(-0.1)
492.5(5.2)
9. Short-term Debt 106.8 106.9(0.1)
105.0(-1.7)
102.8(-2.1)
103.5(0.7)
101.1(-2.4)
102.5(1.4)
100.6(-1.9)
9a. Trade Related Credits 102.4 101.4
(-1.0)101.2(-0.2)
99.4(-1.8)
99.6(0.2)
97.3(-2.4)
99.2(2.0)
97.4(-1.8)
Total ( 8+9) 564.0 558.4(-1.0)
555.2(-0.6)
556.8(0.3)
563.8(1.3)
569.6(1.0)
570.8(0.2)
593.1(3.9)
Source: RBI, Ministry of Finance, Staff calculationsNote: (i) Data for end of the quarter(ii) Figures in brackets are quarter-over-quarter (q-o-q) growth rates(iii) End-December 2019 is the pre-pandemic quarter(iv) PR: Partially Revised; P: Provisional
3.55 As far as currency composition of external debt is concerned, US dollar denominated debt remained the largest component of India’s external debt, with a share of 51 per cent at end-September 2021, followed by the Indian rupee. External debt denominated in Indian rupee witnessed impressive increase over the years owing, inter alia, to a calibrated encouragement of FPI investment into the Indian debt market, apart from continued large accretion to Non-Resident External Rupee Account (See Appendix 8.4 in Volume 2). Accordingly, being the second largest component, Indian rupee denominated debt provides significant insulation from exchange rate fluctuations.
3.56 Leveraging on the robust trends outlined above, the set of salient external sector vulnerability indicators improved. Debt service (i.e., principal repayments and interest payments) declined to 4.7 per cent of current receipts at end-September 2021, as compared with 8.2 per cent at

109External Sector
end-March 2021, reflecting lower repayments and higher current receipts. The share of short-term debt in total external debt fell marginally to 17.0 per cent at end-September 2021 from 17.7 per cent at end-March 2021. Further, a sizeable accretion in reserves, however, led to an improvement in other external vulnerability indicators such as forex reserves to total external debt, short term debt to foreign exchange reserves, etc. The foreign exchange reserves as a ratio to external debt crossed 100 percent after 11 years since 2010, and stood at 107.1 per cent as at end-September 2021. The ratio of short-term debt (original maturity) to foreign exchange reserves declined to 15.8 per cent at end-September 2021 from 17.5 per cent at end-March 2021.
3.57 As documented in the previous edition of the Economic Survey, from a medium-term perspective, India’s external debt continues to be below what is estimated to be optimal for an emerging market economy, while various external sector vulnerability indicators improved over the recent years, pointing towards the resilience of India’s external sector.
3.58 In recent months, scaling back of pandemic-related stimulus programme amidst persistent inflationary pressures in advanced economies, particularly the US, have reignited some fears of taper tantrum. However, India’s external sector – well supported by strong exports, capital inflows, low CAD and external financing requirements and high foreign exchange reserves, with various external vulnerability indicators well within manageable limits – is far better prepared this time to face any external shocks arising out of tightening of the monetary policy stance by the advanced economies in coming months (Box 2).
Box 2: Taper without Tantrums: India’s external sector resilience
The Federal Reserve embarked on a programme of asset purchases under the Quantitative Easing (QE), as part of a broader policy response to the Global Financial Crisis in 2007-08. As the US economy gained traction, in an attempt to unwind the QE, on May 22, 2013, the Fed announced the intent to start tapering asset purchases at a future date, which triggered a tantrum in the form of spike in bond yields and resulted in disruptions on the external front for India as well.
In response to the pandemic, since June 2020, the Fed had been buying US$ 80 billion of Treasury securities and US$ 40 billion of agency mortgage-backed securities (MBS) each month. In late July 2021, the Fed signalled that it would start reducing the volume of its bond purchases later in the year. On November 3, 2021, the Federal Open Market Committee unanimously voted to scale back its asset purchases. In line with this, the Reserve Bank of Australia (RBA) has also abandoned its yield curve target. As yields on government debt climbed, the RBA chose not to intervene to defend its target of 10 basis points for debt maturing in April 2024. Bank of Canada has gradually tapered its asset purchases in recent months. Thus, the long-awaited taper process has commenced by the systemically important central banks, renewing thereby an element of interest - within the academia and policy circles - in the potentially destabilising spill-over impact on the emerging market and developing economies as also for India. There is evidence that, inter alia, these emerging markets, including India, have succeeded in strengthening their external economic and financial position since 2013 and the ramifications of the taper on the Indian external sector would be limited (Barry Eichengreen et al (2021)).

110 Economic Survey 2021-22
India’s Improved Resilience
Since the taper episode of 2013, India’s salient external sector sustainability indicators improved (Table B2.1). Illustratively, the conventional metric of import cover in terms of number of months of imports is more than double since the episode of taper tantrum.
Table B2.1: External Vulnerability Indicators for India
(Per cent, unless otherwise indicated)
Indicator Global Financial Crisis (FY 2009)
Taper-Tantrum (FY 2014) H1: FY 2022
External Debt (US$ Billion) 224.5 446.2 593.1
Foreign Exchange Reserves (US$ Billion) 252 304.2 633.6*
External Debt to GDP ratio 20.7 23.9 20.1
Short-term debt (RM) to Total Debt 38.8 39.7 43.2
Concessional Debt to Total Debt 18.7 10.4 8.6
Reserves to Total Debt 112.2 68.2 107.1
Reserves to Short-term Debt (RM) 270.2 171.9 248.2
Reserves Cover of Imports (in months) 9.8 7.8 14.6
Debt Service Ratio 4.4 5.9 4.7
Net IIP/ GDP ratio -5.8 -18.2 -11.3
Source: Based on data of RBINote: (i) *: Forex reserves as on 31st Dec, 2021 (ii) RM: Residual Maturity
Due to accretion of large foreign exchange reserves in recent months, vulnerability indicators relating to reserves such as reserves to total external debt, reserves to short-term debt (residual maturity), reserve cover of imports, etc., have shown marked improvement in H1: FY 2022, vis-à-vis FY 2014, the taper-tantrum year. Another key vulnerability indicator i.e. net IIP to GDP ratio has declined to (-) 11.3 percent, as against (-) 18.2 percent in the said period. The external debt to GDP ratio has also declined since the said episode. Besides, India witnessed a current account surplus of 0.9 per cent Q1 of 2021-22 on top of similar surplus in 2020-21 after a gap of 17 years. On the other hand, India experienced the highest ever current account deficit of 4.8 per cent of GDP in 2012-13 on the back of an equally large deficit of 4.3 per cent during the previous year (2011-12).

111External Sector
Evidently, the Indian economy has exhibited greater resilience so far to the current episode of taper. In the immediate aftermath of the taper tantrum in 2013, India experienced portfolio outflows aggregating to ₹79,375 crore from capital markets, including ₹19,165 crore from equity markets and ₹60,210 crore from debt markets during May 23-August 30, 2013. The latest announcement of reduction in asset purchases on November 3, 2021 by the Fed had relatively muted impact on portfolio flows. The total portfolio outflows amounted to ₹34,178 crore, comprising ₹29,168 crore from equity markets and ₹5,010 crore from debt markets during the period November-January 20, 2022.
While acknowledging India’s transformation from being among the Fragile Five countries in the wake of the earlier episode to the 4th largest forex reserve holder during the current episode, Indian economy stands guard with an added advantage of plenty of policy room for manoeuvring as the process of normalisation of monetary policy by systematically important central banks takes hold.7
ReferenceBarry Eichengreen, Poonam Gupta and Rishabh Choudhary (2021): The Taper This Time; NCAER Working Paper, November.
7Fragile Five countries (Indonesia, South Africa, Brazil, Turkey and India) were identified to be most at risk when tapering began in 2013.

112 Economic Survey 2021-22
Annexure ITable 1: Top 10 Agricultural Export Products
(US$ Billion)
Rank Commodity 2019-20 2020-21 2020-21 (Apr-Nov)
2021-22 (Apr-Nov)
(P)1 Marine Products 6.7 6.0 4.0 5.42 Rice(Other Than Basmoti) 2.0 4.8 2.7 3.93 Spices 3.6 4.0 2.6 2.74 Sugar 2.0 2.8 1.6 2.35 Buffalo Meat 3.2 3.2 2.1 2.26 Rice -Basmoti 4.4 4.0 2.7 2.17 Cotton Raw Incld. Waste 1.1 1.9 0.8 1.58 Wheat 0.1 0.6 0.2 1.29 Castor Oil 0.9 0.9 0.6 0.810 Misc Processed Items 0.6 0.9 0.5 0.7
Total Agricultural Exports 35.6 41.9 25.2 31.0Source: Department of Commerce.Note: P: Provisional.

113External Sector
(US$ Million)
S.No. Sector
2019-20 2020-21 2021-22 (P)
Q1 Q2 Q3 Q4 Q1 Q2 Q3 Q4 Q1 Q2
1
Manufacturing services on physical inputs owned by others
33 58 76 66 77 68 49 102 83 75
2 Maintenance and repair services n.i.e. 45 44 64 41 32 35 38 54 58 74
3 Transport 5343 5181 5448 5016 4805 5368 5602 6080 6733 7584
4 Travel 6950 7643 8545 6860 1868 2138 2170 2308 1597 2147
5 Construction 754 677 734 931 659 589 619 752 583 716
6 Insurance and pension services 588 602 617 623 564 590 575 647 772 796
7 Financial services 1287 1239 1183 1024 1009 1003 1068 1258 1201 1303
8Charges for the use of intellectual property n.i.e.
319 248 184 182 399 313 359 238 191 202
9
Telecommunications, computer, and information services Of which:computer services
23604
22811
23947
23247
24592
23760
23967
23285
23396
22623
25515
24791
26593
25782
27574
26802
28489
27602
30823
29965
10 Other business services 11475 10878 11889 11474 11282 11624 12930 13324 12962 13858
11Personal, cultural, and recreational services
532 551 535 588 500 530 579 727 647 713
12 Government goods and services n.i.e. 151 169 157 182 148 144 179 159 203 217
13 Others n.i.e. 1114 1539 1134 2105 2212 1875 2579 2781 2698 2915 Total 52196 52777 55158 53060 46953 49793 53339 56004 56217 61421
Source: Reserve Bank of IndiaNote: (i) As per the latest IMF Manual on BoP (BPM6), “other business services” are classified under three broad heads: Research and development services, Professional and management consultancy services and Technical, trade-related and other business services.(ii) P: Provisional
Annexure IITable 2: India’s Exports of Services

114 Economic Survey 2021-22
Annexure III
(US$ Million)
S. No. Sector
2019-20 2020-21 2021-22
Q1 Q2 Q3 Q4 Q1 Q2 Q3 Q4 Q1 Q2
1Manufacturing services on physical inputs owned by others
18 33 9 8 6 11 5 6 9 16
2 Maintenance and repair services n.i.e. 413 253 207 309 128 204 291 211 127 418
3 Transport 6104 6009 6411 5761 4216 4759 5147 5633 6616 8181
4 Travel 6203 6031 5569 4208 2766 2764 2836 3141 2885 3919
5 Construction 754 714 570 708 625 563 705 713 892 715
6 Insurance and pension services 409 354 549 426 378 537 577 566 428 575
7 Financial services 519 594 550 1256 1062 1107 1192 1402 1118 1463
8Charges for the use of intellectual property n.i.e.
2091 1776 2197 1641 1847 1456 2297 2107 1972 2189
9
Telecommunications, computer, and information services Of which:Computer services
2207
1812
2654
2182
2712
2305
2638
2159
2269
1849
3290
2769
2810
2312
3909
3327
3017
2466
3651
3184
10 Other business services 11715 11211 12027 11928 11514 12354 12807 12847 11635 12457
11 Personal, cultural, and recreational services 631 923 757 819 347 817 768 878 804 1243
12 Government goods and services n.i.e. 307 298 218 284 330 190 260 241 236 198
13 Others n.i.e. 750 984 1503 1046 705 655 408 865 667 811
Total 32120 31836 33280 31033 26195 28707 30103 32520 30406 35836
Source: Reserve Bank of IndiaNote: (i) As per the latest IMF Manual on BoP (BPM6), “other business services” are classified under three broad heads: Research and development services, Professional and management consultancy services and Technical, trade-related and other business services.(ii) P: Provisional
Table 3: India’s Imports of Services

115External Sector
Table 4: Sectors attracting highest FDI Equity Inflows
Rank Sector(US$ Billion) Share (in Per cent)
2019-20 2020-21 2020-21 H1
2021-22 H1 2019-20 2020-21 2020-21
H12021-22
H1
1 Computer Software & Hardware 7.7 26.1 17.6 7.1 15.4 43.8 58.5 22.9
2 Automobile Industry 2.8 1.6 0.4 4.9 5.7 2.7 1.4 15.8
3 Services Sector** 7.9 5.1 2.3 3.2 15.7 8.5 7.5 10.1
4 Trading 4.6 2.6 0.9 2.1 9.2 4.4 3.2 6.6
5 Telecommunications 4.4 0.4 0.0 0.4 8.9 0.7 0.0 1.2
Total Of Above 27.4 35.8 21.2 17.6 54.8 60.1 70.6 56.6
Total FDI 50.0 59.6 30.0 31.2 100 100 100 100
Source: Department for Promotion of Industry and Internal Trade (DPIIT) Note: (i)** Services sector includes Financial, Banking, Insurance, Non-Financial / Business, Outsourcing, R&D, Courier, Tech.(ii) Figures are provisional.
Annexure IV
Table 5: Top Investing Countries FDI Equity Inflows
Rank Country
US$ Billion Share (in Per cent)
2019-20 2020-21 2020-21 H1
2021-22 H1 2019-20 2020-21 2020-21
H12021-22
H1
1 Singapore 14.7 17.4 8.3 8.1 29.4 29.2 27.7 25.9
2 U.S.A. 4.2 13.8 7.1 4.6 8.4 23.2 23.7 14.9
3 Mauritius 8.2 5.6 2.0 4.3 16.5 9.5 6.7 13.9
4 Netherlands 6.5 2.8 1.5 2.1 13.0 4.7 5.0 6.9
5 Japan 3.2 2.0 0.7 0.8 6.5 3.3 2.2 2.6
Sum of Above 36.9 41.6 19.6 20.0 73.8 69.8 65.3 64.1
All Countries * 50.0 59.6 30.0 31.2 100.0 100.0 100.0 100.0
Source: Department for Promotion of Industry and Internal Trade (DPIIT)Note: (i) *Includes inflows under NRI Schemes of RBI.(ii) Figures are provisional.

116 Economic Survey 2021-22
Table 6: Major Components of India's Balance of Payments
(US$ Billion)
Year / Item (Net)2019-20 2020-21 2021-22 (P)
Q1 Q2 Q3 Q4 Q1 Q2 Q3 Q4 Q1 Q2
A. Current Account -15.0 -7.6 -2.6 0.6 19.1 15.3 -2.2 -8.2 6.5 -9.6
A 1 Merchandise Trade Balance -46.8 -39.6 -36.0 -35.0 -11.0 -14.8 -34.6 -41.7 -30.7 -44.4
A 1 a Merchandise Exports 82.7 80.0 81.2 76.5 52.2 75.6 77.2 91.3 97.4 104.8
A 1b Merchandise Imports 129.5 119.6 117.3 111.6 63.2 90.4 111.8 133.0 128.2 149.3
A 2. Invisibles 31.8 32.1 33.4 35.6 30.0 30.1 32.4 33.6 37.2 34.8
A 2.a) Services 20.1 20.9 21.9 22.0 20.8 21.1 23.2 23.5 25.8 25.6
A 2.b) Transfers 18.0 20.0 18.9 18.4 17.0 18.4 19.3 18.8 18.9 18.9
A 2.c) Income -6.3 -8.8 -7.4 -4.8 -7.7 -9.4 -10.1 -8.7 -7.5 -9.7
B) Capital Account 28.6 13.6 23.6 17.4 1.4 15.9 34.1 12.3 25.5 40.1
B.1) Foreign Investment 18.8 9.8 17.6 -1.8 0.1 31.4 38.6 10.0 12.1 13.3
B.1.a) Foreign Direct Investment 14.0 7.3 9.7 12.0 -0.5 24.4 17.4 2.7 11.7 9.5
B.1.b Foreign Portfolio Investment 4.8 2.5 7.8 -13.7 0.6 7.0 21.2 7.3 0.4 3.9
B.2) Loans 9.6 3.1 3.1 9.9 2.8 -3.9 0.3 7.7 2.8 7.6
B.2.a) External Assistance 1.5 0.4 1.3 0.6 4.1 1.9 1.2 4.0 0.3 1.1B.2.b) Commercial Borrowings (MT & LT) 6.1 3.3 3.2 10.3 -1.2 -4.0 -1.1 6.1 0.6 4.1
B.2.c) Short Term Credit to India 2.0 -0.6 -1.4 -1.0 -0.2 -1.8 0.2 -2.3 1.9 2.4
B.3) Banking Capital 3.4 -1.8 -2.3 -4.6 2.2 -11.3 -7.6 -4.4 4.1 0.4
B.4) Rupee Debt Service -0.1 0.0 0.0 0.0 -0.1 0.0 0.0 0.0 -0.1 0.0
B.5) Other Capital -3.1 2.5 5.2 13.8 -3.7 -0.3 2.8 -1.0 6.6 18.8
C) Errors and Omissions 0.4 -0.9 0.6 0.9 -0.6 0.4 0.6 -0.7 -0.2 0.7
D) Overall Balance 14.0 5.1 21.6 18.8 19.8 31.6 32.5 3.4 31.9 31.2
E) Foreign Exchange Reserves (Increase - / Decrease +) -14.0 -5.1 -21.6 -18.8 -19.8 -31.6 -32.5 -3.4 -31.9 -31.2
Source: RBINote: P: Provisional
Annexure V

CHAPTER
04
Monetary policy and liquidity operations since the beginning of the COVID-19 pandemic have geared towards mitigating its adverse impact on economy. Accommodative monetary policy along with other regulatory dispensations, asset classification standstill, temporary moratorium and provision of adequate liquidity were put in place in order to provide a safety net to the system. In 2021-22, some of the measures undertaken by RBI like CRR reduction reached pre-set sunset dates, liquidity has been wound down partly but remains in surplus mode and regulatory measures have been realigned.
After several rate cuts in 2019-20 and 2020-21, the repo rate was maintained at 4 per cent in 2021-22. The liquidity in the system remained in surplus throughout. RBI undertook various measures, including secondary market G-sec acquisition programme, special Long-Term Repo operations, on tap targeted Long-Term Repo Operations, etc. to provide further liquidity in the system. Thereafter, RBI used Variable Rate Reverse Repo, reverse repo auctions to rebalance liquidity conditions.
Reserve money and broad money supply growth in 2021-22 so far was lower than in the previous year. The reserve money growth did not fully translate into commensurate broad money supply growth due to the smaller (adjusted) money multiplier reflecting large deposits by banks with RBI under reverse repo window. Bank credit growth accelerated gradually in 2021-22 up from 5.3 per cent in the beginning of April 2021. The very latest data shows that the bank credit growth stands at 9.2 per cent as on 31st December 2021. At the sectoral level, credit to agriculture sector continued to register robust growth and showed signs of improvement in the industry sector. Services sector credit growth, however, is yet to recover.
Gross Non-Performing advances ratio of Scheduled Commercial Banks (SCBs) continued to decline from 11.2 per cent at end of 2017-18 to 6.9 per cent at end-September 2021. Similarly, Net Non-Performing advances ratio declined from 6 per cent to 2.2 per cent during the same period. Capital to risk-weighted asset ratio of SCBs continued to increase from 13 per cent in 2013-14 to 16.54 per cent at end-September 2021. The Return on Assets and Return on Equity for Public Sector Banks became positive in June 2020 and continued to be positive for the period ending September 2021, after recording negative profitability ratios from March 2016 to March 2020. The economic shock of the pandemic has been weathered well by the commercial banking system so far, even if some lagged impact is still in pipeline.
Monetary Management and Financial Intermediation

118 Economic Survey 2021-22
MONETARY DEVELOPMENTS
4.1 TheMonetaryPolicyCommittee (MPC)maintainedstatusquoon thepolicy repo rateduringApriltoDecember2021afterasubstantialcutof115basispoints(bps)duringFebruary-May2020andacumulative250basispointscutsinceFebruary2019(Figure1andTable1).Thereporatewhichcurrentlystandsat4percentislowestinthelastdecade(Figure1).SinceMay2020,thepolicyrateshavebeenonholdalongwithanaccommodativemonetarypolicystancewithforwardguidancethatthisstancewillcontinueaslongasnecessarytorevivegrowthondurablebasiswhileensuringthatinflationremainswithinthetarget(ConsumerPriceIndexinflationof4percentwithinabandof+/-2percent).
Figure 1: Repo and reverse repo rate (per cent)
1
2
3
4
5
6
7
8
9
Apr
, 201
1A
ug, 2
011
Dec
, 201
1A
pr, 2
012
Aug
, 201
2D
ec, 2
012
Apr
, 201
3A
ug, 2
013
Dec
, 201
3A
pr, 2
014
Aug
, 201
4D
ec, 2
014
Apr
, 201
5A
ug, 2
015
Dec
, 201
5A
pr, 2
016
Aug
, 201
6D
ec, 2
016
Apr
, 201
7A
ug, 2
017
Dec
, 201
7A
pr, 2
018
Aug
, 201
8D
ec, 2
018
Apr
, 201
9A
ug, 2
019
Dec
, 201
9A
pr, 2
020
Aug
, 202
0D
ec, 2
020
Apr
, 202
1A
ug, 2
021
Dec
, 202
1
per c
ent
Policy Repo Rate Reverse Repo Rate
Source:RBI
The year 2021-22 so far has been an exceptional year for the capital markets. There was a boom in fundraising through IPOs by many new age companies/tech start-ups/unicorns. In April-November 2021, ` 89,066 crore were raised via 75 IPO issues, much higher than in any year in last decade.
The Sensex and Nifty scaled up to touch its peak at 61,766 and 18,477 on October 18, 2021. Among major emerging market economies, Indian markets outperformed the peers in April-December 2021. The process of insolvency which was suspended in view of pandemic, started again in end-March 2021. A pre-packaged insolvency resolution process was provided under IBC as an alternative insolvency resolution process for corporate Micro, Small and Medium Enterprises in April 2021.

119 Monetary Management and Financial Intermediation
Table 1: Revision in Key Rates set by RBI
Effective Date Repo Rate (per cent)
Reverse Repo Rate (per cent)
Cash Reserve Ratio
(per cent of NDTL)
Statutory Liquidity Ratio
(per cent of NDTL)
MSF Rate/Bank Rate (per cent)
06-02-2020 5.15 4.90 4.0 18.25 5.40
27-03-2020 4.40 4.00 4.0 18.25 4.65
28-03-2020 4.40 4.00 3.0 18.25 4.65
17-04-2020 4.40 3.75 3.0 18.00 4.65
22-05-2020 4.00 3.35 3.0 18.00 4.25
27-03-2021 4.00 3.35 3.5 18.00 4.25
22-05-2021 4.00 3.35 4.0 18.00 4.25
06-08-2021 4.00 3.35 4.0 18.00 4.25
08-10-2021 4.00 3.35 4.0 18.00 4.25
08-12-2021 4.00 3.35 4.0 18.00 4.25
Source:RBINote:NDTL:NetDemandandTimeLiabilities
4.2 Intheinitialmeetingsof2021-22,MPCnotedthatwhiletheinflationhashoveredabovetheuppertolerancebandforsomemonths,itwaslargelydrivenbyadversesupplyshockswhichwereexpectedtobetransitory.Theoutlookforaggregatedemandwasprogressivelyimprovingbutcapacityutilisationrateswerelow.Thecontactintensiveserviceswerelaggingbehindandtherecoverywasunevenandrequiredpolicysupport.InthelatestMPCmeetinginDecember2021, the committee pointed out that the outlookwas uncertain owing to global spillovers,potential resurgence inCOVID-19 infections and divergences in policy actions andstancesacrosstheworldwithinflationarypressuresincreasingacrosseconomies.Accordingly,theMPCdecidedtocontinuemonitoringtheinflationarypressures,keepthepolicyreporateunchangedat4percentandpersistwiththeaccommodativestance.
4.3 In2021-22sofar,theoverallmonetaryandcreditconditionsremainedaccommodative.However, thegrowth ratesofmonetaryaggregates- includingReservemoney,Broadmoneywerelowerascomparedtothelastyear.Reservemoney(M0)recordedayear-on-year(YoY)growthof13percentason7thJanuary2022,ascomparedto14.3percentayearago.However,M0adjustedforthefirst-roundimpactofchangesintheCashReserveRatio(CRR)recordedalowergrowth(YoY)of7.7percent,ascomparedwith18.3percentayearago(Figure2).
4.4 Expansion inM0during2021-22so farwasdrivenbybankers’depositswith theRBIfromthecomponentside,withCRRrestorationinphases,effective27thMarch2021and22nd
May2021.CurrencyinCirculation(CIC)grewby7.8percentason7thJanuary2022,lowerascomparedtothepreviousyearasprecautionarydemandforcashsubsided(Table2).

120 Economic Survey 2021-22
Table 2: Growth (YoY) in Monetary Aggregates (end-March) (per cent)
Item 2015-16 2016-17^ 2017-18 2018-19 2019-20 2020-21 2021-22*
CurrencyinCirculation(CIC) 14.9 -19.7 37.0 16.8 14.5 16.6 7.8#
CashwithBanks 6.6 4.2 -2.1 21.4 15.4 4.5 10.7
CurrencywiththePublic 15.2 -20.8 39.2 16.6 14.5 17.1 7.7
Bankers’DepositswiththeRBI 7.8 8.4 3.9 6.4 -9.6 28.5 42.0#
DemandDeposits 11.0 18.4 6.2 9.6 6.8 14.8 26.2
TimeDeposits 9.2 10.2 5.8 9.6 8.1 10.9 8.2
Reserve Money (M0) 13.1 -12.9 27.3 14.5 9.4 18.8 13.0#
Broad Money (M3) 10.1 6.9 9.2 10.5 8.9 12.2 9.9Source:RBINote:^:March31,2017overApril1,2016barringReserveMoney (M0),Currency inCirculation (CIC)andBankers’DepositswiththeRBI(BD),*:AsonDecember31,2021,#:AsonJanuary7,2022.
Figure 2: M0, CRR Adjusted M0 and CiC Growth (YoY)
Source:RBINote:CIC:CurrencyinCirculation,CRR:CashReserveRatio
4.5 In 2021-22 so far, theYoY growth of broadmoney (M3)stood at 9.9 per cent as on31stDecember,ascomparedto12.5percentayearago(Figure3).Fromthecomponentside,aggregatedepositswhichisthelargestcomponent-hascontributedmosttotheexpansionofM3duringtheyearsofar(Figure4).Amongstsources,bankcredittothegovernmentwasamajorcontributortotheincreaseinbroadmoney.Banks’higherinvestmentsinliquidandrisk-freeassetssuchasSLRsecuritiesandG-secs,resultedinhighernetbankcredittothegovernment.BankcredittothecommercialsectoralsosupplementedM3expansionfromthesourcesside.TheYoYcreditgrowthforScheduledCommercialBankswas9.2percentason31stDecember2021ascomparedto6.6percentayearago,reflectingpick-upincredit.

121 Monetary Management and Financial Intermediation
8
9
10
11
12
13
14A
pr 1
0,20
Jun
10,2
0
Aug
10,
20
Oct
10,
20
Dec
10,
20
Feb
10,2
1
Apr
10,
21
Jun
10,2
1
Aug
10,
21
Oct
10,
21
Dec
10,
21
per c
ent
4
5
6
7
8
9
10
11
12
13
Apr
10,
20
Jun
10,2
0
Aug
10,
20
Oct
10,
20
Dec
10,
20
Feb
10,2
1
Apr
10,
21
Jun
10,2
1
Aug
10,
21
Oct
10,
21
Dec
10,
21
per
cent
Figure 3: Broad Money Growth (YoY) Figure 4: Aggregate Deposits Growth (YoY)
Source:RBI
4.6 Moneymultiplier-measuredasaratioofM3toM0hasbeenonthedeclinesince2017-18(Figure5(a)).Ason31stMarch2021,moneymultiplier(MM)stoodat5.2from5.6ayearago.However,moneymultiplieradjustedforreverserepo-analyticallyakintobanks’depositswiththecentralbank-turnedouttobelowerat4.6byend-March2021.ThegapbetweenMMandadjustedMMreflectsparkingoffundsbybanksunderthereverserepowindowoftheRBIandtosomeextentaweakcreditcreationprocess.Moneymultiplier,however,improvedslightlyto5.3ason31stDecember2021,whileadjustedMMstandsat4.4(Figure5(b)).
Figure 5: Money Multiplier
-
1
2
3
4
5
6
7
8
1951
-52
1956
-57
1961
-62
1966
-67
1971
-72
1976
-77
1981
-82
1986
-87
1991
-92
1996
-97
2001
-02
2006
-07
2011
-12
2016
-17
2021
-22*
ratio
(5a) (5b)
Source:RBINote:Moneymultiplieradjustedforreverserepoisbasedonreservemoneyadjustedforcommercialbanks’reverserepodepositswithRBI,*Numberfor2021-22isasof31stDecember2021inFigure5(a)

122 Economic Survey 2021-22
LIQUIDITY CONDITIONS AND ITS MANAGEMENT4.7 Liquidityhasremainedinsurplusinthesystemsincemid-2019insyncwiththeeasingofmonetaryconditions(Figure6).Theliquidityconditionswerefurthereasedduringtheyear2020-21afterthecovidpandemic,andRBIhassincethenmaintainedamplesurplusliquidityinthebankingsystemtosupportgrowth.In2021-22sofar,theRBIresumednormalliquidityoperationsinaphasedmannerandengagedinrebalancingliquidityfrompassiveabsorptionunderfixedratereverserepounderitsLiquidityAdjustmentFacility(LAF)tomarketbasedreverserepoauctions(likeVariableRateReverseRepo(VRRR)).Atthesametimeitalsoensuredadequateliquidityinthesysteminconsonancewiththeaccommodativemonetarypolicystancetosupportgrowth.Theliquidityconditionsremainedinsurplusin2021-22.
Figure 6: Liquidity Conditions
-10
-8
-6
-4
-2
0
2
1-Ja
n-19
1-M
ar-1
9
1-M
ay-1
9
1-Ju
l-19
1-Se
p-19
1-N
ov-1
9
1-Ja
n-20
1-M
ar-2
0
1-M
ay-2
0
1-Ju
l-20
1-Se
p-20
1-N
ov-2
0
1-Ja
n-21
1-M
ar-2
1
1-M
ay-2
1
1-Ju
l-21
1-Se
p-21
1-N
ov-2
1
1-Ja
n-22
₹ la
kh c
rore
Source:RBINote: Negative sign indicates surplus liquidity. Surplus liquidity in the banking system isindicatedby the total netLAFabsortion.Hence, an increase in total absorbation implies anincreaseinsurplusliquidity.
4.8 ThemeasurestakenbyRBItoprovidetargetedliquiditysupporttothesystemin2021-22included:
a. Special refinancefacilitiesof`66,000crore toall-Indiafinancial institutions,comprising`25,000croretotheNationalBankforAgricultureandRuralDevelopment(NABARD);`10,000 crore to the National Housing Bank (NHB); and `31,000 crore to the SmallIndustriesDevelopmentBankofIndia(SIDBI).

123 Monetary Management and Financial Intermediation
b. Termliquidityfacilityof`50,000croretorampupCOVID-relatedhealthcareinfrastructureandservicesinthecountry;
c. SpecialLong-TermRepoOperations (SLTRO) for smallfinancebanksof`10,000 croretosupportsmallbusinessunits,microandsmall industries,andotherunorganisedsectorentitiesadverselyaffectedduringthesecondwaveof thepandemic.SLTROschemewassubsequentlymadeon-tapandwasextendedtillDecember31,2021.
d. On-tapliquiditywindowof`15,000croreforcontact-intensivesectors.
e. Extension of On tap Targeted Long-Term Repo Operations (On tap-TLTRO) till 31st December2021.
4.9 A secondarymarket G-sec acquisition programme (G-SAP) - whichwas announcedduring the year added to the surplus liquidity during the period.G-SAP involves upfrontcommitmenttopurchaseaspecificquantumofgovernmentsecuritieswithaviewtoenablinga stable and orderly evolution of the yield curve. RBI purchased G-secs (including statedevelopmentloans)amountingto`1lakhcroreunderG-SAP1.0and`1.2lakhcroreunderG-SAP2.0.
4.10 Thegradualnormalisationofliquiditymanagementoperationsinsyncwiththerevisedliquiditymanagementframeworkwasthekeyfeatureofliquiditymanagementin2021-22.The14-dayVariableRateReverseRepo (VRRR) auctionswere deployed as themain operationunder theLiquidityAdjustmentFacility (LAF).Further, thecash reserve ratio (CRR)whichwasreducedby100basispoints(bps)inMarch2020,wasgraduallyraisedtoitspre-pandemiclevel of 4 per cent byMay 2021.Tomanage the liquidity conditions, variable rate reverserepoauctionsofvaryingmaturitieswereconductedapartfromtheVRRRoperationsconductedeveryfortnight.Thesizeof14dayVRRRwasgraduallyenhancedto`7.5lakhcrorebyend-December2021.During2021-22sofar,averagedailynetabsorptionsunderLAFamountedto`6.7lakhcrore.
4.11 During2021-22sofar,duetothesurplusliquidityconditions,callmoneyrategenerallytradedbelow the reverse repo rate - the lowerboundof the liquidity adjustment facility(LAF)corridorduring theyear(Figure7).Theweightedaveragecall rate(WACR)- theoperatingtargetofmonetarypolicy- traded13bpsbelowthefloorof thecorridoronanaverageduringtheyearsofar.ItwasonlyinNovember2021,thattheWACRdriftedbackslightlywithinthecorridor.
4.12WithRBIbecomingthemajorcounterpartyforbanks,therewasashrinkageininter-banktradingactivity-averagedailyvolumeinthecallmoneymarketdeclinedto`9,077croreinDecember2021from`10,126croreinMarch2021.Interestratesonlonger-termmoney market instruments like 91-day Treasury Bills (T-Bills), 3-month Certificates ofDeposit(CDs)andCommercialPapers(CPs)generallytradedabovethereversereporateduringtheyear.

124 Economic Survey 2021-22
Figure 7: Policy Corridor and WACR
1.5
2.0
2.5
3.0
3.5
4.0
4.5
5.0
Mar
30,
20
Apr
30,
20
May
31,
20
Jun
30, 2
0
Jul 3
1, 2
0
Aug
31,
20
Sep
30, 2
0
Oct
31,
20
Nov
30,
20
Dec
31,
20
Jan
31, 2
1
Feb
28, 2
1
Mar
31,
21
Apr
30,
21
May
31,
21
Jun
30, 2
1
Jul 3
1, 2
1
Aug
31,
21
Sep
30, 2
1
Oct
31,
21
Nov
30,
21
Dec
31,
21
per c
ent
WACR Repo Rate Reverse Repo Rate MSF Rate
Source:RBIandCCIL
DEVELOPMENTS IN G-SEC MARKET 4.13 The yields on 10-yearG secwhich had reached 8.2 per cent on 26th September 2018reducedsubstantiallytoreach5.75percentinJune2020.Ithassincethenincreasedtostandat6.45percentason31stDecember2021.
Figure 8: India 10-Year Generic G-Sec Yield
5.0
5.5
6.0
6.5
7.0
7.5
8.0
8.5
1/1/
2017
3/1/
2017
5/1/
2017
7/1/
2017
9/1/
2017
11/1
/201
71/
1/20
183/
1/20
185/
1/20
187/
1/20
189/
1/20
1811
/1/2
018
1/1/
2019
3/1/
2019
5/1/
2019
7/1/
2019
9/1/
2019
11/1
/201
91/
1/20
203/
1/20
205/
1/20
207/
1/20
209/
1/20
2011
/1/2
020
1/1/
2021
3/1/
2021
5/1/
2021
7/1/
2021
9/1/
2021
11/1
/202
11/
1/20
22
per c
ent
Source:Bloomberg
4.14 Tradinginthe10-yearG-secstartedonapositivenoteinthefinancialyear2021-22(Figure8),supportedbytheReserveBank’sG-SAP,continuedaccommodativestancedomesticallyanddovishmonetarypolicystanceadoptedbymajoreconomiesaroundtheworld.Inthebeginningoffirstquarter(Q1)of2021-22,yieldon10-yearG-Secsstoodataround6.26percent.The10-yearyieldreachedalowof5.96percent(intraday)inMay2021.TheannouncementofG-SAP2.0amountingto`1.2lakhcroreon4thJune2021andtheUSfederalopenmarketcommittee’s

125 Monetary Management and Financial Intermediation
decisionon15thJune2021tocontinuewiththeeasymonetarypolicystancekepttheyieldsnearthe6percentmark.
4.15 Inthebeginningofsecondquarter(Q2)of2021-22,yieldsstartedtorise.TheannouncementofphasedincreaseinthequantumofVRRRoperationson6thAugust2021andshiftinmarketsentiments toprice inpossibilityofchange in interestratecyclesometimeaheadalso led tosomehardeningofyieldsup to6.26percent.Thesuccessively lowerconsumerprice index(CPI)prints,inclusionofthe10-yearbenchmarkpaperintheG-SAPauctionsandnoadditionalborrowingbygovernmentforthesecondhalfof2021-22helpedkeepyieldsincheck.Theyieldonbenchmarksecuritystoodat6.22percentattheendofsecondquarter.Inthethirdquarter(Q3)of2021-22,riseinUStreasuryyieldsandrisingcrudepricesledtheyieldstoinchhigherto6.45percentatend-December2021.
4.16 Thetermspread(measuredasthegapbetween10yearand1-yearGsecyield)hadwidenedsharplyin2020,buthasnarroweddownslightlyin2021-22(Figure9).However,itisstillwiderascomparedtothepre-pandemicyears.
Figure 9: Yields on 1-year and 10-year G sec (per cent)
0
1
2
3
4
5
6
7
8
9
1/1/
2018
3/1/
2018
5/1/
2018
7/1/
2018
9/1/
2018
11/1
/201
8
1/1/
2019
3/1/
2019
5/1/
2019
7/1/
2019
9/1/
2019
11/1
/201
9
1/1/
2020
3/1/
2020
5/1/
2020
7/1/
2020
9/1/
2020
11/1
/202
0
1/1/
2021
3/1/
2021
5/1/
2021
7/1/
2021
9/1/
2021
11/1
/202
1
per c
ent
1 year yield 10 year yield
Source:Bloomberg
BANKING SECTOR 4.17 TheGrossNon-Performingadvances(GNPA)ratio(i.e.GNPAsasapercentageofGrossAdvances) andNetNon-Preforming (NNPA) ratioofScheduledCommercialBanks (SCBs)continuedtodeclinesince2018-19.GNPAratioofSCBsdecreasedfrom7.5percentatend-September2020to6.9percentatend-September2021.NNPAratioofSCBswas2.2percentatend-September2021(Figure10).

126 Economic Survey 2021-22
Figure 10: GNPA and NNPA ratio
11.2
6.96.0
2.2
0
2
4
6
8
10
12
2008
-09
2009
-10
2010
-11
2011
-12
2012
-13
2013
-14
2014
-15
2015
-16
2016
-17
2017
-18
2018
-19
2019
-20
2020
-21
Sep
-21
rati
o
GNPA ratio NNPA ratio
Source:RBINote:NumberforSeptember2021isbasedonoffsitereturnsdata
4.18 RestructuredStandardAdvances(RSA)ratioofSCBsincreasedfrom0.4percentto1.5percentduringthesameperiod.Overall,theStressedAdvancesratioofSCBsincreasedfrom7.9percentatend-September2020to8.5percentatend-September2021.VariousCOVID-19 related dispensations/moratoriums provided with respect to asset qualitycontributedtowardsincreaseinrestructuredassetsandasaresult,stressedadvancesratiofor the banking system increased at end-September 2021. Overall, the banking systemappears tohaveweathered thepandemicshockwelleven if there issome lagged impactstillinthepipeline.
4.19 GNPAratioofPublicSectorBanks(PSBs)decreasedfrom9.4percentatend-September2020to8.6percentatend-September2021.TheStressedAdvancesratioofPSBsincreasedmarginally from10.0percent to10.1percentduring thesameperiodonaccountof rise inrestructuredadvances.
4.20 TheCapitalAdequacyRatiohascontinued to improvesince2015-16.Capital toRisk-weightedAssetRatio(CRAR)ofSCBsincreasedfrom15.84percentatend-September2020to16.54percentatend-September2021onaccountof its improvementforbothpublicandprivatesectorbanks(Table3).TheimprovementinCRARlevelsofPSBswasduetocapitalinfusionbythegovernmentalongsidefundraisingfromthemarkets,whileprivatesectorbankstappedcapitalfrommarketsources(Figure11).BasedonthecapitalpositionasonSeptember30,2021,allPublicSectorandPrivateSectorbanksmaintainedtheCapitalConservationBuffer(CCB)wellover2.5percent.

127 Monetary Management and Financial Intermediation
Figure 11: Capital Adequacy Ratio (per cent)
10
11
12
13
14
15
16
17
2003
-04
2004
-05
2005
-06
2006
-07
2007
-08
2008
-09
2009
-10
2010
-11
2011
-12
2012
-13
2013
-14
2014
-15
2015
-16
2016
-17
2017
-18
2018
-19
2019
-20
2020
-21
Sep-
21
per
cent
Source:RBINote:NumberforSeptember2021isbasedonoffsitereturns
4.21 SCBs’annualisedreturnonassets(RoA)improvedfrom0.6percentatend-September2020 to 0.8 per cent at end-September 2021,while their annualised return on equity (RoE)improvedfrom7.7percentto9.0percentduringthesameperiod.TheRoAandRoEforPSBsbecamepositive inJune2020andcontinued tobepositive for theperiodendingSeptember2021,afterrecordingnegativeprofitabilityratiosduringMarch2016toMarch2020.
Table 3: NPAs, CRAR, RoE and RoA – SCBs, PSBs and Private Sector Banks (per cent)
Period
Scheduled Commercial Banks Public Sector Banks Private Sector Banks
GNPA Ratio CRAR RoE RoA GNPA
Ratio CRAR RoE RoA GNPA Ratio CRAR RoE RoA
Mar-19 9.07 14.32 -1.82 -0.15 11.59 12.2 -10.97 -0.66 5.25 16.07 5.49 0.60
Mar-20 8.21 14.78 0.78 0.07 10.25 12.85 -3.92 -0.25 5.45 16.55 3.20 0.35
Sep-20 7.49 15.84 7.68 0.64 9.39 13.51 4.33 0.26 4.93 18.21 10.04 1.10
Mar-21 7.33 16.30 7.64 0.65 9.11 14.04 4.63 0.28 4.94 18.42 10.01 1.14
Sep-21 6.93 16.50 9.04 0.79 8.57 14.4 8.47 0.52 4.73 18.65 10.01 1.17
Source:OffsiteReturns,GlobalOperation,RBI
4.22 Thenetprofit(profitaftertax)forPSBsincreasedfrom`14,688croreduringfirsthalfof2020-21to`31,144croreduringfirsthalfof2021-22.Similarly,thenetprofitforprivatesectorbanksincreasedfrom`32,762croreto`38,234croreduringthesameperiod.Overall,forSCBs,thenetprofitincreasedfrom`59,426croreatend-September2020to`78,729croreatend-September2021.

128 Economic Survey 2021-22
Box 1: NATIONAL ASSET RECONSTRUCTION COMPANY LIMITED
Various available resolution mechanisms, including Insolvency and Bankruptcy Code (IBC),SARFAESIAct,DebtRecoveryTribunals,etc.haveprovedtobeusefultocertainextent,howeveralargestockoflegacyNPAsareyettoberesolved.Inadditiontothis,whilethereare28ARCsexistinginIndia,duetolimitedcapitalisationandlowrecoveriesfromexistingportfolio,theyarebetterplacedforacquiringonlysmallervalueloans.InordertoresolvethelegacyNPAsandcleanupthebankingsystem,theUnionbudget2021-22announced,“ThehighlevelofprovisioningbyPublicSectorBanksoftheirstressedassetscallsformeasurestocleanupthebankbooks.AnAssetReconstructionCompany(ARC)LimitedandAssetManagementCompany(AMC)wouldbesetuptoconsolidateandtakeovertheexistingstresseddebtandthenmanageanddisposeoftheassetstoAlternateInvestmentFundsandotherpotentialinvestorsforeventualvaluerealization.”Inlinewiththisvision,twoentitiesviz.NationalAssetReconstructionCompanyLimited(NARCL),andIndiaDebtResolutionCompanyLimited(IDRCL)havebeenformed.
NARCLwasincorporatedon7thJuly2021andhasreceivedacertificateofregistrationfromtheRBItocommencethebusinessofanAssetReconstructionCompanyon4thOctober2021.NARCLwillmajorlybeownedbyPublicSectorBanks.CanarabankistheSponsorwithshareholdingofupto12percent.NARCLwouldbecapitalized throughacombinationofequityanddebt fromvariousBanks andwill haveafinite lifeof5years. Itmayacquirestressedassetsof about`2lakhcroreappoxinmultiplephaseswithin theextantregulationsofRBIunder15:85structure,implying that the consideration for acquisitionwill be 15 per cent inCash and 85 per cent inSecurityReceipts.IDRCLwasincorporatedon3rdSeptember2021andwillhaveminimumof51percentownershipofPrivatesectorBanksandbalancewillbeheldbyPublicSectorBanks.
NARCLandIDRCL’srelationshipwillbedefinedthroughadebtmanagementagreementwhereinNARCLwillaggregateandacquirethestressedassetsandIDRCL,inturn,willprovidestressedassetsmanagementandresolutionservicestoNARCLonanexclusivebasis.ThetermofIDRCLshallbeco-terminuswiththatofNARCL.NARCLwillacquireassetsbymakinganoffertotheleadbankandtheleadbankwithanofferinhand(ofNARCL)willruna‘SwissChallenge’processwhereinotherinterestedARCs/BidderswillbeinvitedtobettertheanchoroffermadebyNARCL.OnceNARCLisdeclaredasapreferredbidder,NARCLshallinitiateassetacquisitionprocessandacquire theassets in theunderlyingTrusts.Afteracquiringtheassets, IDRCLshallprepareandsuggest the proposed restructuring / resolution plan, strategies, etc. for each Underlying TrustAssets.PosttheapprovalofresolutionfromNARCL,IDRCLshallalsoassistinimplementationofresolution.TheassetsacquiredshallberesolvedusingexistingresolutiontoolswithintheRBIframeworkforARCs.
ResolutionmechanismsofthisnaturetypicallyrequireabackstopfromGovernmentasitimpartscredibility and provides for contingency buffers. Globally, bad banks have been set up withGovernment participation in the form of equity along with other regulatory dispensations, forinstance,DanahartaNasionalBerhad(Danaharta) inMalaysiaorAssetResolutionLtd(UKAR)inUK.Thereforetakingtheprecedencefrominternationalpractices,inIndia,thegovernmenthasprovidedaguaranteeofupto`30,600crore,whichwillbackSecurityReceipts(SRs)issuedby

129 Monetary Management and Financial Intermediation
NARCL.Thegovernmentguaranteewillbevalidfor5years.GuaranteeavailablefortheseSRsmaybeinvokedoncompletionofresolutionorliquidationasthecasemaybetocovertheshortfallbetweenactualrealizationandfacevalueoftheasset.Theguaranteeamountwillbeissuedbasedonactual assets acquiredbyNARCL.This arrangementwill notonly safeguard the facevalueofSecurityReceiptsbutitwillalsotakeawaytheneedfor100percentupfrontcapitalizationofNARCL.Thegovernmentwillchargeaguaranteefeeontheamountwhichitguarantees,whichwillincreaseannuallytoincentivizetheearlyandtimelyresolution.
MONETARY TRANSMISSION – BANK LENDING AND DEPOSIT RATES4.23 RBIhasreducedreporateby250bpssinceFebruary2019(thecurrenteasingcycle).TheWeightedAverageLendingRate(WALR)onfreshrupeeloansdeclinedby197basispointsandby133bpsonoutstanding loansduring theperiodFebruary2019 toNovember2021 (Figure12).Largesurplussystemicliquidity,forwardguidanceofcontinuingwiththeaccommodativestanceandtheexternalbenchmarksystemforpricingofloansinselectsectorsaidedmonetarytransmission.
Figure 12: Weighted Average Lending Rates of SCBs
6.0
6.5
7.0
7.5
8.0
8.5
9.0
9.5
10.0
10.5
Jan-
2019
Mar
-201
9
May
-201
9
July
-201
9
Sep-
2019
Nov
-201
9
Jan-
2020
Mar
-202
0
May
-202
0
July
-202
0
Sep-
2020
Nov
-202
0
Jan-
2021
Mar
-202
1
May
-202
1
July
-202
1
Sep-
2021
Nov
-202
1
per c
ent
WALR- Fresh WALR- Outstanding
Source:RBI
4.24 During April-November 2021, the 1-year median Marginal Cost of funds-basedLending Rate (MCLR) declined by 10 bps;WeightedAverage Lending Rates (WALR)onoutstanding loansmoderatedby19bps, though it increasedby6 bps on fresh loans.TheWeightedAverageDomesticTermDepositRate(WADTDR)onoutstandingdepositsmoderatedby24bps(Table4).

130 Economic Survey 2021-22
Table 4: Transmission from Repo Rate to Deposit and Lending Rates of SCBs(Variation in basis points)
Period Repo rate
Term Deposit Rates Lending Rates
Median TDR–Freshdeposits
WADTDR–Outstandingdeposits
1-YearMedian MCLR
WALR–Outstandingrupeeloans
WALR–Freshrupee
loans
April2021- November2021 0 -1 -24 -10 -19 6
February2019- November2021 -250 -213 -187 -155 -133 -197
Source:RBINote:WALR:WeightedAverage Lending Rate.WADTDR:WeightedAverage Domestic Term Deposit Rate;MCLR:MarginalCostofFundsbasedLendingRate.TDR:TermDepositRate.
4.25 Thetransmissionhasbeenslightlyhigherinpublicsectorbanksthanprivatesectorbanksintheoverallcurrentmonetaryeasingcycle,thoughitwashigherforprivatebanksinApril-November2021.TheWALRonoutstandingrupeeloansfellby135bpsforpublicsectorbanksand123bpsforprivatebanks,whiletheWALRonfreshrupeeloansfellby210bpsforpublicsectorbanksand177bpsforprivatesectorbanksduringFebruary2019-November2021(Table5).DuringApril-November2021,WALRonoutstanding rupee loans reducedby12bps forpublicsectorbanksand31bpsforprivatebanks,whereastheWALRonfreshloansincreasedby8bpsforpublicsectorbanks.
Table 5: Transmission across Bank Groups (Variation in basis points)February2019-November2021 April2021-November2021
WALR–Outstand-ingrupeeloans
WALR–Fresh
rupeeloans
WADTDR–Outstandingdeposits
WALR–Outstandingrupeeloans
WALR–Freshrupee
loans
WADTDR–Outstand-ingdeposits
Publicsectorbanks -135 -210 -168 -12 8 -21
Privatebanks -123 -177 -203 -31 -15 -32
SCBs# -133 -197 -187 -19 6 -24Source:RBI#SCBsincludepublic,privateandforeignbanks
Box 2: DEPOSIT INSURANCE IN INDIA
The Deposit Insurance and Credit Guarantee Corporation (Amendment) Act, passed by theParliament in 2021, made significant changes in the landscape of deposit insurance in India. Thefunctions of the Deposit Insurance and Credit Guarantee Corporation (DICGC) are governedby the provisions of the DICGC Act, 1961 and the DICGC General Regulations, 1961. Underthe Act, the Corporation is liable to pay the insured deposit amount to depositors of an

131 Monetary Management and Financial Intermediation
insuredbank.Suchliabilitymayarisewhenaninsuredbankundergoes:(i)liquidation(saleofallassetsonclosingdownofthebank)(ii)reconstructionoranyotherarrangementunderascheme,or (iii)merger or acquisitionby another bank.Deposit insuranceprovidedbyDICGCcovers allcommercialbanks,includingPaymentBanks,SmallFinanceBanks,RegionalRuralBanks,ForeignBankbranchesinIndia,LocalAreaBanksandCo-operativeBanksinallStatesandUnionTerritories.DICGCregistersabankasinsuredimmediatelyandautomaticallywhenabankinglicenseisissuedto it.Thedeposit insurancepremiumiscompulsoryforall insuredbanksandispaidbybankstoDICGCandisnotrecoveredfromthedepositors.
Thedepositinsurancecoveragethatbeganwith`1500in1961hasbeenraisedgraduallyto`1lakhin1993buthadbeenstaticthereaftertill2020.AftertheannouncementintheUnionbudget2020-21,thedepositinsurancecoverwasincreasedfrom`1lakhto`5lakhperdepositorperbank.Withdepositinsurancecoverageof`5lakhperdepositorperbank,thenumberoffullyprotectedaccounts(247.8crore)atend-March2021constituted98.1percentof thetotalnumberofaccounts(252.6crore),asagainsttheinternationalbenchmarkof80percent.Intermsofamount,thetotalinsureddeposits(`76.2lakhcrore)asatend-March2021constituted50.9percent(upfromabout30percentunder`1lakhcover)ofthetotalassessabledeposits(`149.7lakhcrore)asagainsttheinternationalbenchmarkof20-30percent.Bank-groupwise, thepercentageof insureddepositsvis-à-vis totaldepositsis84percentforRRBs,70percentforcooperativebanks,59percentforSBI,55percentforPSBs,40percentforprivatesectorbanksand9percentforforeignbanks.Upto31stMarch2021,acumulativeamountof`5,763croreshasbeenpaid towardsclaimssince the inceptionofdepositinsurance(`296croreinrespectof27commercialbanksand`5,467croresinrespectof365co-operativebanks).
However,onecontinuingconcernevenaftertheincreaseininsuredamountannouncedinFebruary2020intheUnionBudget2020-21wasthatwhenvariousrestrictions,suchasmoratorium,etcareimposedonabankbyRBI,genuinedepositorscontinuedtofaceseriousdifficulties,andwereunabletoaccesstheirownmoneyeventotheextentoftheinsuredvalue,despitedepositinsurancebeinginplace.Therefore,theDepositInsuranceAndCreditGuaranteeCorporation(Amendment)Act,2021wasenacted.ThefollowingarethekeyfeaturesoftheAmendmentAct:
● Introduced interim payments: InterimpaymentwillnowbemadebyDICGCtodepositorsofthosebanksforwhomanyrestrictions/moratoriumhavebeenimposedbyRBIundertheBankingRegulationActresultinginrestrictionsondepositorsfromaccessingtheirownsavings.
● Timeline for interim payments:Clear-cut timelineofmaximumof90dayshasbeenfixedforprovidinginterimpaymenttodepositors.Withinthefirst45days,theinsuredbankmustfurnishthedetailsofalloutstandingdepositstotheCorporation.Within30daysofthereceiptofdetails,theCorporationwillverifytheauthenticityoftheclaimsandwithin15daysoftheverification,theCorporationmustmakethepaymenttosuchdepositors.
● Repayment by banks to DICGC
Deferment of repayments:DICGCmaydeferrepaymentsduetoitfromaninsuredbankafterinsurancepayout,ontermsdecidedbyDICGC’sBoard.Itisinspiritwiththerationaleofinterimpayments,i.e.,tohelpdepositorswhilealsoenablingrescueeffortsforthebank.

132 Economic Survey 2021-22
Timely repayment by the bank to DICGC:ToestablishthepriorityofrepaymenttoDICGC(bothinterestandprincipalamount),aprovisionforpenalinterestincaseofdelayhasbeenputintheact.
No ceiling on premium:Theearlieractearlierhadaceilingof15paiseonpremium,whichhasbeenremoved.Now,theceilingonpremiumwillbenotifiedbyDICGC,withthepriorapprovalofRBI.
SincetheActcameintoforce,over 1500crorehasbeenpaidtoover1.2lakhdepositorsagainsttheirclaims,asofearlyJanuary2022.
BANK CREDIT GROWTH4.26 The credit growth had been declining since 2019.The credit growthwas 5.3 per cent atbeginningofApril2021andstartedtoincreasesincethen,butwasstillmodestandstoodat7.3percentason17thDecember2021.However,thecreditgrowthhaspickedupsharplyinDecemberto9.2percentason31stDecember2021.In2021-22,theriskcapital(i.e.moneyraisedfromcapitalmarkets)hassofarbeenmoreimportantthanthebanksinprovidingfinancetotherevival(Figure13).
Figure 13: Bank Credit growth (YoY)
4
6
8
10
12
14
16
5-Ja
n-18
16-F
eb-1
830
-Mar
-18
25-M
ay-1
820
-Jul
-18
31-A
ug-1
826
-Oct
-18
4-Ja
n-19
15-F
eb-1
929
-Mar
-19
24-M
ay-1
919
-Jul
-19
13-S
ep-1
98-
Nov
-19
3-Ja
n-20
28-F
eb-2
024
-Apr
-20
19-J
un-2
014
-Aug
-20
9-O
ct-2
04-
Dec
-20
29-J
an-2
126
-Mar
-21
21-M
ay-2
116
-Jul
-21
10-S
ep-2
119
-Nov
-21
per c
ent
Source:RBI
4.27 Non-foodbankcredit1growththatremainedmutedduringmuchofthepandemicperiodandstayedatsub-6percentthroughQ1of2021-22,hasgraduallyimprovedandstoodat9.3percentason31stDecember2021,asagainst6.6percentayearago.Thisgrowthwasdrivenbypersonal loansandagriculturesector.Deceleration increditgrowth in theservicessectorcontinuedthoughcredittoindustryshowedsignsofimprovement.
4.28 Credittoagriculturecontinuedtoregisterrobustgrowth,andwasat10.4percent(YoY)inNovember2021,ascomparedwith7percentinNovember2020.CreditgrowthtoindustrywhichcontractedfromOctobertoDecember2020enteredpositiveterritoryinJanuary2021.Itis 1Non-foodcreditgrowthcalculatedbasedonSection-42returndata,whichcoversallscheduledcommercialbanks(SCBs),whilesectoralcreditgrowthisbasedonsector-wiseandindustry-wisebankcredit(SIBC)return,whichcoversselectbanksaccountingforabout90percentoftotalnon-foodcreditextendedbyallSCBs.

133 Monetary Management and Financial Intermediation
improvingsteadilysinceJuly2021andacceleratedto3.8percentinNovember2021.Mediumindustries,particularly,havewitnessedhighdouble-digitgrowthforoverayearandcreditgrowthtothesegmentwasat48.7percentinNovember2021,ascomparedwith25.7percentinNovember2020.Creditgrowthtomicro&smallindustriesacceleratedto12.7percentinNovember2021from0.6percentayearago,reflectingeffectivenessofvariousmeasurestakenbytheGovernmentand theRBI toboostcreditflow to themicro, smallandmediumenterprises (MSME)sector.Credittolargeindustriesbroadlyremainedatthesamelevelasoflastyear.
Figure 14: Growth (YoY) in Sectoral Credit
-5
0
5
10
15
20
25
30
35
Jun-
18
Aug
-18
Oct
-18
Dec
-18
Feb-
19
Apr
-19
Jun-
19
Aug
-19
Oct
-19
Dec
-19
Feb-
20
Apr
-20
Jun-
20
Aug
-20
Oct
-20
Dec
-20
Feb-
21
Apr
-21
Jun-
21
Aug
-21
Oct
-21
per c
ent
Agriculture & Allied Activities Industry Services Personal Loans
Source:RBI
4.29 Servicessectorcreditgrowth,however,isyettorecover.Thesubduedcreditgrowthinthesectorwasduetosluggishgrowthinalmostallsegments.ThegrowthinbankcredittoNBFCswas5.2percentinNovember2021.Inthecurrentfinancialyear,NBFCsdirectlyraisedfinancefrommoneyanddebtmarketsgiventheeasyfinancialconditions.Thebankcreditgrowthtocommercialrealestatesectorwas0.4percentinNovember2021.
4.30 Growthinpersonalloansimprovedtodoubledigitsat11.6percentinNovember2021ascomparedwith9.2percentinthepreviousyear.Housingloans,thelargestconstituentofpersonalloans,registeredgrowthof8percentinNovember2021.Thegrowthofvehicleloans,thesecondlargestconstituentofpersonal loans improved to7.7percent inNovember2021from6.9percentinNovember2020(Table6).
Table 6: Growth (YoY) in Bank Credit by Major Sectors (per cent)Sector Mar-18 Mar-19 Mar-20 Mar-21 Nov-20 Nov-21Agriculture & allied activities 3.8 8.5 4.0 9.4 7.0 10.4Industry 0.7 5.8 0.9 0.5 0.7 3.8Micro&Small 0.9 0.7 -0.6 2.8 0.6 12.7Medium -1.1 -2.0 -0.2 34.1 25.7 48.7Large 0.8 7.1 1.1 -1.3 -0.4 0Services 13.8 15.3 9.0 2.7 8.2 3.6

134 Economic Survey 2021-22
Trade 9.1 6.6 5.3 12.7 15.2 8.7CommercialRealEstate 0.1 22.4 14.7 1.3 3.5 0.4
Non-BankingFinancialCom-panies(NBFCs) 26.9 48.2 27.3 0.2 4.7 5.2
Personal Loans 17.8 20.0 13.0 9.9 9.2 11.6
Housing(IncludingPrioritySectorHousing) 13.3 21.1 13.3 9.1 8.4 8.0
VehicleLoans 11.3 23.7 7.2 6.2 6.9 7.7Source:RBINote:Dataisprovisionalandrelatestoselectbankswhichcoverabout90percentoftotalnon-foodcreditextendedbyallscheduledcommercialbanks.
Box 3: DIGITAL PAYMENTS
Financialtransactionshavebeenseeinghighgrowthoverthelastfewyearswithmultipleavenuesformakingdigitalpaymentswhicharegrowingovertime.
UnifiedPaymentsInterface(UPI)iscurrentlythesinglelargestretailpaymentsysteminthecountryintermsofvolumeoftransactions,indicatingitswideacceptance(Figure3A&3B).InDecember2021, 4.6billion transactionsworth `8.26 lakh crorewere carriedout byUPI.Oneof the initialobjectivesofUPIwastoreplacecashforlowvaluetransactions.AsperdetailedtransactiondataofNPCI,50percentoftransactionsthroughUPIwerebelow`200.On1stNovember2018,‘UPIasapaymentoptioninIPO’wasintroducedasanewpaymentchanneltotheretailinvestorsbySEBI.InApril-November2021,UPIprocessedmorethan24.26millionOneTimeMandatecreatetransactionofvalue`44,381crore.ThetransactionlimitforsuchtransactionswhichwasincreasedbyRBIfrom`1lakhto`2lakhinMarch2020wasfurtherincreasedto`5lakhinDecember2021.RBIandtheMonetaryAuthorityofSingaporeannouncedaprojecttolinkUPIandPayNow,whichistargetedforoperationalizationbyJuly2022.BhutanrecentlybecamethefirstcountrytoadoptUPIstandardsforitsQRcode.ItisalsothesecondcountryafterSingaporetohaveBHIM-UPIacceptanceatmerchantlocations.
-
10,000
20,000
30,000
40,000
50,000
60,000
-
5,000
10,000
15,000
20,000
25,000
30,000
35,000
2016-17 2017-18 2018-19 2019-20 2020-21 2021-22(Apr-Dec)
Val
ue (i
n R
s bill
ion)
Vol
ume
(inill
ion)
Value (in billion) RHS Volume (in Million)
44
91
142 148
216
274
0
50
100
150
200
250
300
Mar'17 Mar'18 Mar'19 Mar'20 Mar'21 Nov'21
Figure 3A: UPI Payments Figure 3B: Number of banks in UPI
Source:NPCI Source:NPCI

135 Monetary Management and Financial Intermediation
Anotherreal-timefundtransferplatformavailable24x7x365isImmediatePaymentService(IMPS).InApril-December2021,transactionsworth`29,349billionhavebeenprocessedonIMPS.On8th October21,RBIincreasedthedailylimitofIMPStransactionsfrom`2lakhto`5lakhwhichshouldfurtherhelpinboostingdigitalpayments.
AnotherdigitalpaymentsolutionlaunchedinAugust2021,e-RUPIisaperson-specific,andpurpose-specificdigitalvoucherwhereitisnotrequiredforthecustomertohaveabankaccountandisoperableonbasicphones,eveninareaswhichlackaninternetconnection.Thefirstusecaseofe-RUPIwasimplementedforCOVID-19vaccinationprogramwhichsawmorethan2.2lakhbeneficiariesbeingissuedthevoucher.
TheDigitalPaymentsIndexofRBI,capturestheextentofdigitizationofpaymentsacrossthecountry.Theindexcaptures(i)PaymentEnablers(weight25%),(ii)PaymentInfrastructure–Demand-sidefactors(10%),(iii)PaymentInfrastructure–Supply-sidefactors(15%),(iv)PaymentPerformance(45%)and(v)ConsumerCentricity(5%).TheDigitalPaymentsIndexincreasedfrom100inMarch2018(baseperiod)to304.06inSeptember2021.
NON-BANKING FINANCIAL COMPANIES (NBFCs) SECTOR 4.31 CreditgrowthofNBFCscontinuedtoremainsluggishin2021-22sofar(Figure15).Thetotal creditofNBFCsector2 increasedmarginally from`27.53 lakhcrore inMarch2021 to`28.03lakhcroreinSeptember2021.ThecreditintensityofNBFCs,measuredbyNBFCcreditasaratioofGDPhasbeenrisingconsistentlyandstoodat13.7atendMarch2021(Figure16).
0
5
10
15
20
25
30
35
2013
-14
2014
-15
2015
-16
2016
-17
2017
-18
2018
-19
2019
-20
2020
-21
Sep-
21
per c
ent
8.6 8.8 8.99.6 9.6
11.512.2 12.1
13.7
0
2
4
6
8
10
12
14
2013 2014 2015 2016 2017 2018 2019 2020 2021
per c
ent
Figure 15: Credit growth (YoY) from NBFCs Figure 16: NBFC’s Credit to GDP Ratio
Source:RBINote:DataforSeptember2021pertainsonlytoDeposittaking NBFC and non-deposit taking systemicallyimportantNBFCsbasedonoffsitereturnsdata
Source:TrendsandProgressofBanking in India,RBINote:Dataisatend-March;GDPdatausedisGDPatcurrentmarketprices(base:2011-12
4.32 IndustryremainedthelargestrecipientofcreditextendedbytheNBFCsector,followedbyretailloansandservices(Figure17).TheshareoflargeindustryinthetotalcredittoindustrybyNBFCsector increased fromabout82percentatendMarch2019 to90percentatendSeptember2021.2Thesectorrepresentstop300NBFCsbasedontheirassetsizeasofSeptember2021

136 Economic Survey 2021-22
Figure 17: Sectoral distribution of NBFC Credit
39.3
39.3
40.0
28.6
29.1
28.6
14.5
12.2
12.3
15.7
17.9
17.7
2.0
1.4
1.4
0% 10% 20% 30% 40% 50% 60% 70% 80% 90% 100%
2020
2021
Sep-21
Industry Retail Loans Services Other Non-food credit Agriculture and allied activities
Source:SupervisoryReturns,RBI.Note:Numberfor2020and2021indicateend-Marchfigures.NumbersforSeptember2021aresurveycalculationsfromtheReportonTrendandProgressofBankinginIndia2020-21
4.33 TotalassetsofNBFCsincreasedfrom`36.37lakhcroreinSeptember2020to 42.05lakhcroreinSeptember2021,resultinginYoYgrowthof15.61percent.Banks’exposuretoNBFCsincreased(intheformofbanklendingandinvestmentinNon-ConvertibleDebenture(NCDs)andCommercialPaper(CPs))from`8.44lakhcroreinSeptember2020to`9.16lakhcroreinSeptember2021,recordingYoYgrowthof8.5percent.
4.34 TheexternalliabilitiesofNBFCsintheformofsecuredandunsecuredborrowingsandpublicdepositsincreasedby7.95percent(onaYoYbasis)inSeptember2021.Whileborrowingsfromother financial institutionsmarginally increased from`58,650 crore inMarch 2021 to`59,525croreinSeptember2021(4.34percentYoYgrowth),marketborrowings-NCDsandCPs-increasedfrom`10.56lakhcroreinSeptember2020to`11.41lakhcroreinSeptember2021(8.09percentYoYgrowth).
4.35 GNPAratioofNBFCswashigherat6.55percentatend-September2021,ascomparedto6.06percentatend-March2021.However,theirnetNPAratioremainedat2.93percentatend-September2021sameasinMarch2021.Asagainsttheregulatoryrequirementof15percent,CRARfortheNBFCsectorstoodat26.64percentatend-September2021.
Box 4: FACTORING IN INDIA
Factoring is an important source of liquidity worldwide, especially for MSMEs. Factoring is atransactionwhereanentitysellsitsreceivables(duesfromacustomer)toathirdparty(a‘factor’likeabankorNBFC)forimmediatefunds.Allorpartofinvoicecanbesoldtoafactorforgettingmoneyimmediatelyatcompetitiveinterestrate.Thefactorthencollectspaymentsfromthebuyerofgoodsandearnsacommissionintheformofsomeinterest.This isdifferentfrombilldiscounting.Inbilldiscounting,abankorNBFCgivesacertainpercentageofthetotaloutstandingvalueofinvoicestosellerandinmostcasesthesellerhastotakeontheresponsibilityforpaymentofinvoicesbythebuyerto the factor.However, incaseof factoring, the factor takeson the responsibility for thecollectionof invoices. There are different types of factoring: ‘with recourse’ factoring where seller has to

137 Monetary Management and Financial Intermediation
payback the advanceobtained from the factor if buyerofgoods fails topayand ‘without recourse’factoringwherefactorbearstheriskofdefaultincaseofnon-paymentbybuyerofgoods.
Tosolve the liquidity issuesofMSMEsand laydown thebasic legal framework for factoring inIndia,theFactoringRegulationAct2011wasenacted.AspertheFactoringAct2011,fourtypesofentitieswereallowedtoengageinfactoringbusiness:Banks,StatutoryCorporations(whichwereexemptedfromregistrationunderSection5),NBFCs(whichhavetoobtainregistrationfromRBI)andcompanies(whichhavetoobtainspecificregistrationfromRBIunderSection3). AspertheFactoringAct2011,RBIgrantsregistrationtoonlythoseNBFCswhichdofactoringas“principalbusiness”,i.e.whosefinancialassetsinthefactoringbusinessconstituteatleast50percentofitstotalassetsandincomederivedfromfactoringbusinessisnotlessthan50percentofitsgrossincome.Under theseprovisions,only7NBFCscalled ‘NBFC-Factors’were in factoringbusiness (due to“principalbusiness”condition)–CanbankFactors,IndiaFactoringandFinance,SBIGlobalFactors,Siemens Factoring, Bibby Financial Services, IFCI Factors and PinnacleCapital Solutions.This‘principalbusiness’restrictiononNBFCsintheActhadlimitedthescopeoffactoring.
Meanwhile,RBI constituted anExpertCommitteeonMSMEsunder theChairmanshipofShriU.K.SinhainJanuary2019tosuggestlong–termmeasuresfortheeconomicandfinancialsustainabilityoftheMSMESector.AmongvariousothersuggestionsrelatedtotheMSMEsectorasawhole,thecommitteerecommendedthatNBFCsotherthanthosewhoseprincipalbusinessisfactoringshouldalsobepermittedtocarryoutfactoringbusiness.Hence,theFactoringRegulation(Amendment)Act,2021wasenactedwiththeamendmentsinlinewiththerecommendationsofUKSinhaCommittee.Thekeychangesbroughtaboutare:
• RemovalofprincipalbusinesscriteriahassignificantlyincreasedthenumberofeligibleNBFCsthatcanundertakefactoringbusiness.
• ThetimeperiodforregistrationofinvoiceandsatisfactionofchargeuponitmaybespecifiedbytheGovernmentbyrulestostreamlinetheprocessandpreventfraudsthroughdualfinancing.
• Atpresent,factoringisdoneeithermanuallyoronTradeReceivableDiscountingSystem(TReDS)3. Now,theamendedActandnewRulesandRegulationsallowtheconcernedTReDSplatformtoregisterchargedirectlywithCentralRegistryofSecuritizationAssetReconstructionandSecurityInterest(CERSAI)onbehalfofthefactorsusingtheplatform,soastomaketheprocessoperationallyefficient,promotetheuseofTReDSandreduceproceduralburdenonfactors.
• Definitionsof“assignment”,“factoringbusiness”and“receivables”havebeenamendedtobringtheminconsonancewithinternationaldefinitions.
• RegulationmakingpowerwasgiventoRBIforthemannerofgrantingcertificateofregistrationunderSection3,andthemanneroffilingofparticularsoftransactionswiththeCentralRegistrybyTReDSentitiesonbehalfoffactorsunderSection19.RBIhasnotifiedtheseRegulationsinJanuary2022.
TheamendmentshaveliberalizedtherestrictiveprovisionsintheActandatthesametimeensurethatastrongregulatory/oversightmechanismisinplaceunderRBI.Overall,thischangewouldleadtowideningoffactoringecosysteminthecountryandhelpMSMEssignificantly,byprovidingaddedavenuesforavailingcreditfacility.
3ItisanelectronicexchangethatallowstransparentandonlinesellingofreceivablesbyMSMEs.InTReDS,thesellergetsmultiplefinancierstochoosefrom,optionofvariousinterestrates,andwithoutanycollateralhelpingthesellertogetthebestdealintransparentmanner.Govern-menthastakenmeasurestopromoteTReDSbymandatingbigcorporates/CPSEstoregisteronTReDS.

138 Economic Survey 2021-22
DEVELOPMENT IN CAPITAL MARKETS1. PRIMARY MARKET A. Equity
4.36 InApril-November 2021, IPOs of 75 companies have listed, garnering `89,066 crore, ascomparedto29companiesraising 14,733croreduringApril-November2020,indicatingstupendousriseof504.5percentinfundmobilization.ThemoneyraisedbyIPOshasbeengreaterthanwhathasbeenraisedinanyyearinlastdecadebyalargemargin.Amountraisedthroughrightsissueshoweverdeclinedby62.6percentto`22,659croreinApril-November2021,ascomparedto`60,608croreduringcorrespondingperiodofpreviousyear.ThoughamountraisedthroughQualifiedInstitutionalPlacements(QIP)declinedby52.9percent,amountraisedbywayofpreferentialallotmentincreasedby67.3percentduringApril-November2021,ascomparedtosameperiodpreviousyear.Overall,duringApril-November 2021,`1.81 lakh crore have been raised through equity issues throughdiversemodesviz.,publicofferings,rights,QIPandpreferentialissues(Table7).
Table 7: Primary Market Resource Mobilisation through Public and Rights Issues (Equity)
Period
Public (IPO+FPO) Rights QIPs Preferential issues Total
No. of issues
Amount (` crore)
No. of issues
Amount (` crore)
No. of issues
Amount (` crore)
No. of issues
Amount (` crore)
No. of issues
Amount (` crore)
2016-17 106 29,210 12 3,274 20 8,464 409 44,235 547 85,1832017-18 189 78,497 23 21,268 54 71,033 420 59,527 686 2,30,3252018-19 136 21,720 9 2,001 14 8,678 402 2,10,159 561 2,42,5592019-20 62 21,382 17 55,667 14 54,389 284 1,74,886 377 3,06,3252020-21 57 46,060 21 64,059 31 78,738 234 40,940 343 2,29,797April-Nov2020 30 29,733 15 60,608 16 56,725 145 25701 206 1,72,768April-Nov2021 75 89,066 18 22,659 23 26,704 233 43,004 349 1,81,433
Source:SEBI
4.37 The year 2021-22 so far has been an exceptional year for the primarymarketswith aboominfundraising throughIPOsbymanynewagecompanies/techstart-ups/unicorns.Theexuberanceassociatedwiththelistingsmanifestedinhugeoversubscriptionsbyretail,HighNetworthIndividuals(HNIs)andinstitutionalinvestorsandstellarlistinggainshavepushedmoreandmorecompaniestotapthemarkets(Table8).ThetremendousresponsebyallcategoriesofinvestorsinIPOsofcompanieswasreflectiveofnotonlytheconfidenceinmarkets,butalsothatincorporatesectorperformanceandprospectsoftheeconomyinthelongrun.
Table 8: IPO Oversubscription trendsOversubscription Range (No. of times
oversubscribed)No. of IPOs listed
(April-November 2021)>100 8≥51≤100 11≥21≤50 6≥11≤20 11≥1≤10 39< 1 NilTotal 75Source:SEBI

139 Monetary Management and Financial Intermediation
B. Debt
4.38 Onthedebtside,thefundsraisedthroughcorporatebondswasaround`3.7lakhcroreinApril-November2021.Theamountraisedthroughpublicissuesindebtdoubledas20publicissuesraised`9,132croreduringApril-November2021,ascomparedto10issueswhichraised`3,871croreduringthecorrespondingperiodofpreviousyear.However,numberofissuesandamountmobilized throughprivateplacementdeclinedas`3.6 lakhcrorewasraised through851 issuesduringApril-November2021, as compared to`4.9 lakh croremobilized through1,299issuesduringApril-November2020(Table9).Overall,debtmobilizationslowed,andthiscontrastwithequitymarketsuggestanincreasedappetiteforriskamonginvestors.
Table 9: Resource Mobilization in Corporate Bond Market
Year
Public Issues Private Placement
No. of issues Amount (` crore) No. of issues Amount
(` crore)
2016-17 14 29,093 3,377 6,40,716
2017-18 8 5,173 2,706 5,99,147
2018-19 25 36,679 2,358 6,10,318
2019-20 34 14,984 1,787 6,74,703
2020-21 18 10,588 1,995 7,71,840
April-Nov2020 10 3,871 1,299 4,88,071
April-Nov2021 20 9,132 851 3,62,458
Source:SEBI
4.39 In addition to equity anddebt, corporates are alsodiversifying into a largenumberofnew instruments such as hybrids & convertibles, Real Estate Investment Trusts (REITs),InfrastructureInvestmentTrusts(InvITs)etc.(Table10).ResourcemobilizationbyInvITswas`15,506croreinApril-November2021.
Table 10: Fund Raising by REITs/InvITs
Mode of Fund raising
2019-20 2020-21 Apr 2021-Nov 2021
No. Amount(` crore) No. Amount
(` crore) No. Amount (` crore)
Total funds mobilised by REITs 0 0 3 14,300 0 0
ListedREITs 0 0 3 14,300 0 0
Total funds mobilised by InvITs 4 11,496 2 40,432 6 15,506
ListedInvITs 3 7,744 1 25,215 5 15,125
UnlistedInvITs 1 3,753 1 15,217 1 382
Source:SEBI

140 Economic Survey 2021-22
Box 5: MSCI Emerging Markets Index and India’s weight
AkeyaspectofForeignPortfolioInvestments(FPI)areglobalindicessuchasMSCIwithoverUS$16.3trillion(equity)assetsbenchmarkedagainstthem(asofJune30,2021).OneofthemostpopularMSCIindicesistheMSCIEmergingMarket(EM)indexwhichtracksequityperformancecapturinglargeandmid-capcompaniesacross25emergingmarketcountriesincludingIndia.Launchedin2001,theMSCIEMindextodaycovers1420listedentitiesacrossemergingmarketeconomies.Companiesmustsatisfycertainminimumcriteriarelatingtofullmarketcapitalisation,free-floatmarketcapitalisation,stockliquidityandforeigninclusionfactor,amongotherstobeincludedintheindex.ManyglobalinstitutionalinvestorsuseMSCI’sEMIndexandseveralsuchindicescoveringothermarketsandthemesaspartoftheirpassiveinvestmentstrategyallocatingcapitalinlinewiththebenchmarkindices.India’sweightintheMSCIEMIndexplaysanimportantroleinattractingFPIinvestmentsinitsequitymarket(Figure5A).
In June 2017, MSCI had announced that beginning June 2018, China A-shares4 would be includedinMSCI-EMindexinaphasedmanner.Thismeantagradualreductioninweightsofallother countries. Consequently, India’sweight inMSCI-EM index reduced from 9.32 per cent inAugust2018to8.3percentinAugust2020.
Lateron,Government relaxed theFPI limit for Indiancompanies to theapplicableForeignDirectInvestment (FDI) sectoral limit (which is higher) with effect fromApril 1, 2020. Consequently,India’s Foreign Ownership Limits5 (FOL) in its Global indices increased effective December 1,2020.Resultantly,MSCIIndia’sForeignInclusionFactor6(FIF)roseby7percentfrom0.39to0.42.Accordingly,India’sweightinMSCIEMindeximmediatelyincreasedto9.2percentfrom8percent.Remarkably,theincreaseinFPIlimittothesectoralcaphasactedasacatalystforincreasingweightageofIndiansecuritiesinothermajorequityindicesaswellsuchasMSCIAPxJ(100bps),MSCIACWorldIndex(16bps).AsofDecember2021,India’sweightintheMSCIEMindexis12.45percentand106listedIndianentitieshavingAUMofUS$2,379billionareapartofMSCIEMindex(Figure5B).
TheforeigninterestinIndiancapitalmarketshasgoneupasreflectedinthelargeinflows.Asperdata available fromNSDL,2020-21witnessedFPI inflowsofoverRs. 2.74 lakh crore into the Indianequitymarkets.
Figure 5A: India weight at MSCI EM Index
Source:RIMES,MSCI,MorganStanleyResearch
4AsharesrepresentpubliclylistedMainlandChinesecompaniesthattradeoneitherShanghaistockexchangeorShenzenstockexchange. 5Theextenttowhichforeigninvestorscaninvestinalistedsecurityofacountry.AnincreaseinFPIlimits,increasestheroomavailableforforeigninvestment. 6Foreigninclusionfactorofasecurityisdefinedastheproportionofsharesoutstandingthataredeemedtobeavailableforpurchaseinthepublicequitymarketsbyinternationalinvestors.
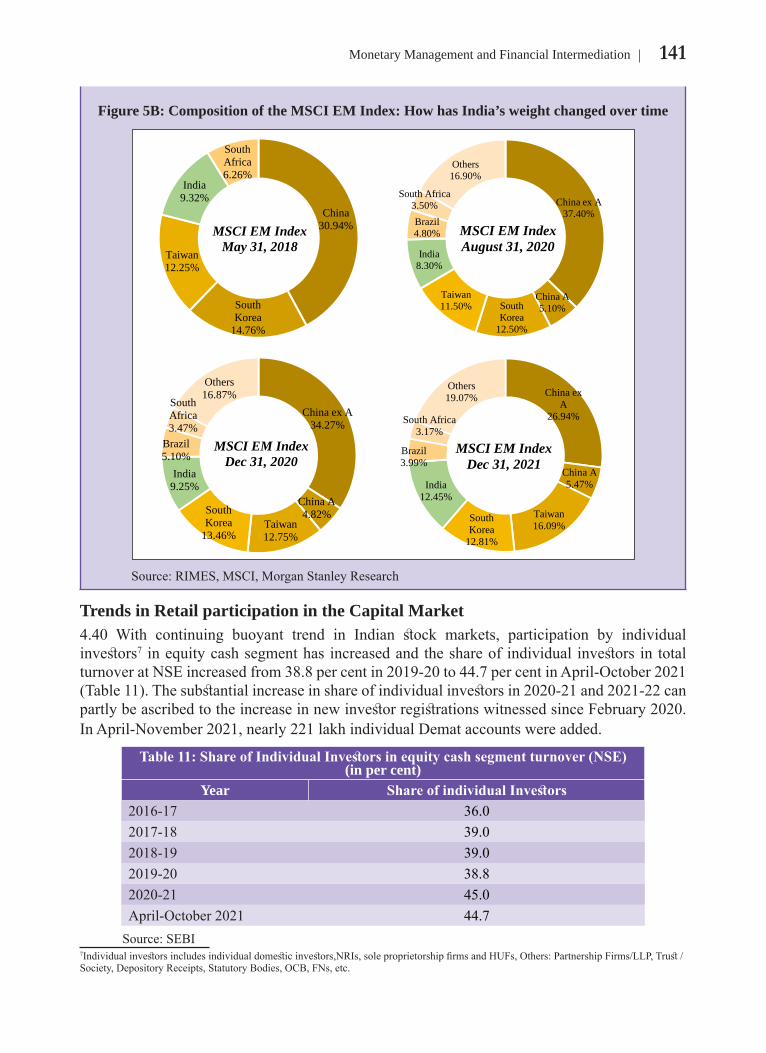
141 Monetary Management and Financial Intermediation
Figure 5B: Composition of the MSCI EM Index: How has India’s weight changed over time
China ex A37.40%
China A5.10%South
Korea12.50%
Taiwan11.50%
India8.30%
Brazil4.80%
South Africa3.50%
Others16.90%
MSCI EM IndexAugust 31, 2020
China ex A
26.94%
China A5.47%
Taiwan16.09%
South Korea
12.81%
India12.45%
Brazil3.99%
South Africa3.17%
Others19.07%
MSCI EM IndexDec 31, 2021
China30.94%
South Korea
14.76%
Taiwan12.25%
India9.32%
South Africa6.26%
MSCI EM IndexMay 31, 2018
China ex A34.27%
China A4.82%
Taiwan12.75%
South Korea
13.46%
India9.25%
Brazil5.10%
South Africa3.47%
Others16.87%
MSCI EM IndexDec 31, 2020
Source:RIMES,MSCI,MorganStanleyResearch
Trends in Retail participation in the Capital Market4.40 With continuing buoyant trend in Indian stock markets, participation by individualinvestors7 inequitycashsegmenthas increasedandtheshareof individual investors in totalturnoveratNSEincreasedfrom38.8percentin2019-20to44.7percentinApril-October2021(Table11).Thesubstantialincreaseinshareofindividualinvestorsin2020-21and2021-22canpartlybeascribedtotheincreaseinnewinvestorregistrationswitnessedsinceFebruary2020.InApril-November2021,nearly221lakhindividualDemataccountswereadded.
Table 11: Share of Individual Investors in equity cash segment turnover (NSE) (in per cent)
Year Share of individual Investors2016-17 36.02017-18 39.02018-19 39.02019-20 38.82020-21 45.0April-October2021 44.7Source:SEBI
7Individualinvestorsincludesindividualdomesticinvestors,NRIs,soleproprietorshipfirmsandHUFs,Others:PartnershipFirms/LLP,Trust/Society,DepositoryReceipts,StatutoryBodies,OCB,FNs,etc.
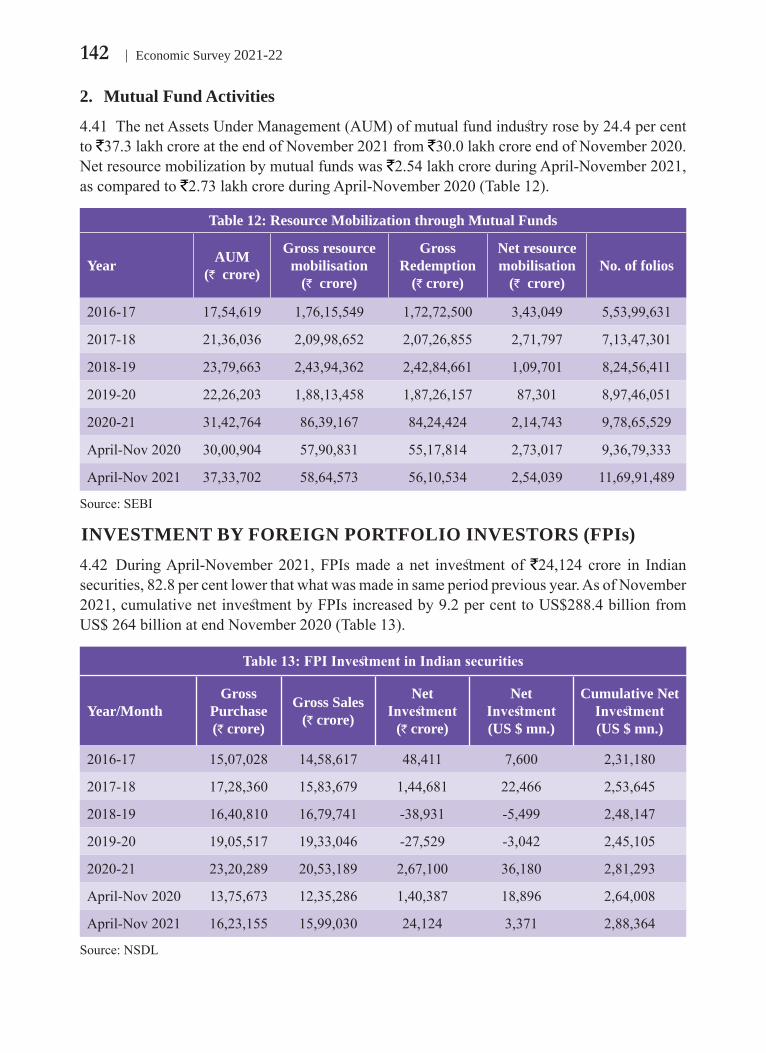
142 Economic Survey 2021-22
2. Mutual Fund Activities
4.41 ThenetAssetsUnderManagement(AUM)ofmutualfundindustryroseby24.4percentto `37.3lakhcroreattheendofNovember2021from`30.0lakhcroreendofNovember2020.Netresourcemobilizationbymutualfundswas`2.54lakhcroreduringApril-November2021,ascomparedto`2.73lakhcroreduringApril-November2020(Table12).
Table 12: Resource Mobilization through Mutual Funds
Year AUM (` crore)
Gross resource mobilisation
(` crore)
Gross Redemption
(` crore)
Net resource mobilisation
(` crore)No. of folios
2016-17 17,54,619 1,76,15,549 1,72,72,500 3,43,049 5,53,99,631
2017-18 21,36,036 2,09,98,652 2,07,26,855 2,71,797 7,13,47,301
2018-19 23,79,663 2,43,94,362 2,42,84,661 1,09,701 8,24,56,411
2019-20 22,26,203 1,88,13,458 1,87,26,157 87,301 8,97,46,051
2020-21 31,42,764 86,39,167 84,24,424 2,14,743 9,78,65,529
April-Nov2020 30,00,904 57,90,831 55,17,814 2,73,017 9,36,79,333
April-Nov2021 37,33,702 58,64,573 56,10,534 2,54,039 11,69,91,489
Source:SEBI
INVESTMENT BY FOREIGN PORTFOLIO INVESTORS (FPIs)4.42 DuringApril-November 2021,FPIsmade a net investment of`24,124 crore in Indiansecurities,82.8percentlowerthatwhatwasmadeinsameperiodpreviousyear.AsofNovember2021,cumulativenetinvestmentbyFPIsincreasedby9.2percenttoUS$288.4billionfromUS$264billionatendNovember2020(Table13).
Table 13: FPI Investment in Indian securities
Year/MonthGross
Purchase (` crore)
Gross Sales (` crore)
Net Investment
(` crore)
Net Investment (US $ mn.)
Cumulative Net Investment (US $ mn.)
2016-17 15,07,028 14,58,617 48,411 7,600 2,31,180
2017-18 17,28,360 15,83,679 1,44,681 22,466 2,53,645
2018-19 16,40,810 16,79,741 -38,931 -5,499 2,48,147
2019-20 19,05,517 19,33,046 -27,529 -3,042 2,45,105
2020-21 23,20,289 20,53,189 2,67,100 36,180 2,81,293
April-Nov2020 13,75,673 12,35,286 1,40,387 18,896 2,64,008
April-Nov2021 16,23,155 15,99,030 24,124 3,371 2,88,364
Source:NSDL

143 Monetary Management and Financial Intermediation
INDIAN BENCHMARK INDICES4.43 ThebenchmarkstockmarketindicesinIndia-SensexandNifty50, increasedby17.7percentand18.1percent,respectivelyduringApril-December2021.Drivenbygoodcorporateearnings,sharpriseinCOVID-19vaccinationandopeningupofbusinessestablishmentacrossthecountry,SensexandNiftyscaledup to touch itspeakat61,766and18,477 respectivelyon 18thOctober2021(Figure18).TheSensexandNiftybenchmarkindicesfellafterthat,butstartedtoriseagainandstandat61,223and18,256respectivelyason14thJanuary2022.
Figure 18: Movement of Indian Benchmark Indices
Source:BSE,NSE
4.44 Amongmajoremergingmarketeconomies,IndianmarketsoutperformeditspeersduringApril-December2021.Among theselectdevelopedmarkets,S&P500 indexandNASDAQ Compositeindex,recordedstronggainsandroseby20.0percentand18.1percent,respectively(Table 14).
Table 14: Performance of major stock market indices in 2021-22 across the World
Index As on 31/03/2021
As on 31/12/2021
% change in Apr-Dec 2020
% change in Apr-Dec 2021
Indian MarketsNifty50 14,691 17,354 62.6 18.1S&PBSESensex 49,509 58,254 62.0 17.7Emerging MarketsTaiwanTAIEX 16,431 18,219 51.8 10.9FTSE/JSEAllShareIndex,S.Africa 66,485 73,709 33.5 10.9
MOEXRussiaIndex 3,542 3,787 31.1 6.9ShanghaiComposite,China 3,442 3,640 26.3 5.7KOSPI,S.Korea 3,061 2,978 63.8 -2.7BrazilIbovespa 1,16,634 1,04,822 63.0 -10.1

144 Economic Survey 2021-22
Developed MarketS&P500,US 3,973 4,766 45.3 20.0NasdaqComposite,US 13,247 15,645 67.4 18.1CAC40,France 6,067 7,153 26.3 17.9DowJonesIndustrialAverage,US 32,982 36,338 39.6 10.2FTSE100,UK 6,714 7,385 13.9 10.0DAX,Germany 15,008 15,885 38.1 5.8StraitsTimes,Singapore 3,165 3,124 14.6 -1.3Nikkei225,japan 29,179 28,792 45.1 -1.3HangSeng,HongKong 28,378 23,398 15.4 -17.6Source:RefinitivDatastream
4.45 During April-December 2021, India VIX, which indicates market’s expectation ofvolatilityinneartermi.e.next30calendardays,peakedto23.7on3rdMay2021andstartedreducingsubsequently.ItpickedupbrieflyinNovember2021beforereducingagain.Overall,VIXdecreased21.4percentduringApril-December2021.
Figure 19: India VIX
5
10
15
20
25
Apr-21 May-21 May-21 Jun-21 Jul-21 Aug-21 Sep-21 Oct-21 Nov-21 Dec-21
Source:NSE
INSURANCE SECTOR4.46 Internationally,thepotentialandperformanceoftheinsurancesectoraregenerallyassessedon the basis of two parameters, viz., insurance penetration and insurance density. InsurancepenetrationismeasuredasthepercentageofinsurancepremiumtoGDPandinsurancedensityis calculated as the ratio of premium to population (measured in US$ for convenience ofinternationalcomparison).
4.47 InIndia,insurancepenetrationwas2.71percentin2001andhassteadilyincreasedto4.2percentin2020.Asof2020,thepenetrationforlifeinsuranceinIndiais3.2percentandnon-lifeinsurancepenetrationis1percent(Table15and16).WhileIndiaisatparwithinternationalaverageintermsofinsurancepenetrationforlifeinsurance,welagbehindintermsofnon-life

145 Monetary Management and Financial Intermediation
insurance.Globally,insurancepenetrationwas3.3percentforthelifesegmentand4.1percentforthenon-lifesegmentin2020.
Table 15: Penetration and Density in Life Insurance in India
Particulars 2011 2012 2013 2014 2015 2016 2017 2018 2019 2020Insurance Penetration 3.40 3.17 3.10 2.60 2.72 2.72 2.76 2.74 2.82 3.20
InsuranceDensity 49.0 42.7 41.0 44.0 43.2 46.5 55.0 55.0 58.0 59.0
Source:SwissRe,SigmavariousissuesNote:InsurancePenetrationinpercentandInsuranceDensityinUS$
Table 16: Penetration and Density in Non-Life Insurance in India
Particulars 2011 2012 2013 2014 2015 2016 2017 2018 2019 2020
Insurance Penetration 0.70 0.78 0.80 0.70 0.72 0.77 0.93 0.97 0.94 1.00
InsuranceDensity 10.0 10.5 11.0 11.0 12.0 13.2 18.0 19.0 20.0 19.0
Source:SwissRe,SigmavariousissuesNote:InsurancePenetrationinpercentandInsuranceDensityinUS$
4.48 The insurancedensity in India increased from$11.5 in2001 to$78 in2020. In2020,densityforLifeinsuranceinIndiais$59andNon-Lifeinsuranceis$19,muchlowerthanglobalstandards.Globally,insurancedensitywas$360forthelifesegmentand$449forthenon-lifesegmentrespectivelyin2020(Table17and18).
Table 17: International Comparison of Insurance Penetration (in per cent)
S.No. Country*2019 2020
Life Non-Life Total Life Non-Life Total
America1 USA 2.9 8.5 11.4 3.0 9.0 12.02 Canada 3.1 4.6 7.7 3.5 5.2 8.73 Brazil 2.3 1.8 4.0 2.3 1.8 4.14 Mexico 1.1 1.3 2.4 1.2 1.4 2.6
Europe-Middle East-Africa5 France 6.0 3.2 9.2 5.1 3.5 8.66 Germany 2.6 3.7 6.3 2.8 4.0 6.87 Italy 6.2 2.2 8.3 6.3 2.3 8.68 Netherlands 1.6 7.6 9.2 1.5 8.1 9.69 Spain 2.2 2.9 5.1 1.9 3.2 5.210 Sweden 5.4 1.8 7.2 5.8 1.8 7.611 Switzerland 4.3 4.1 8.4 4.3 4.1 8.412 UK 8.0 2.3 10.3 8.8 2.3 11.1
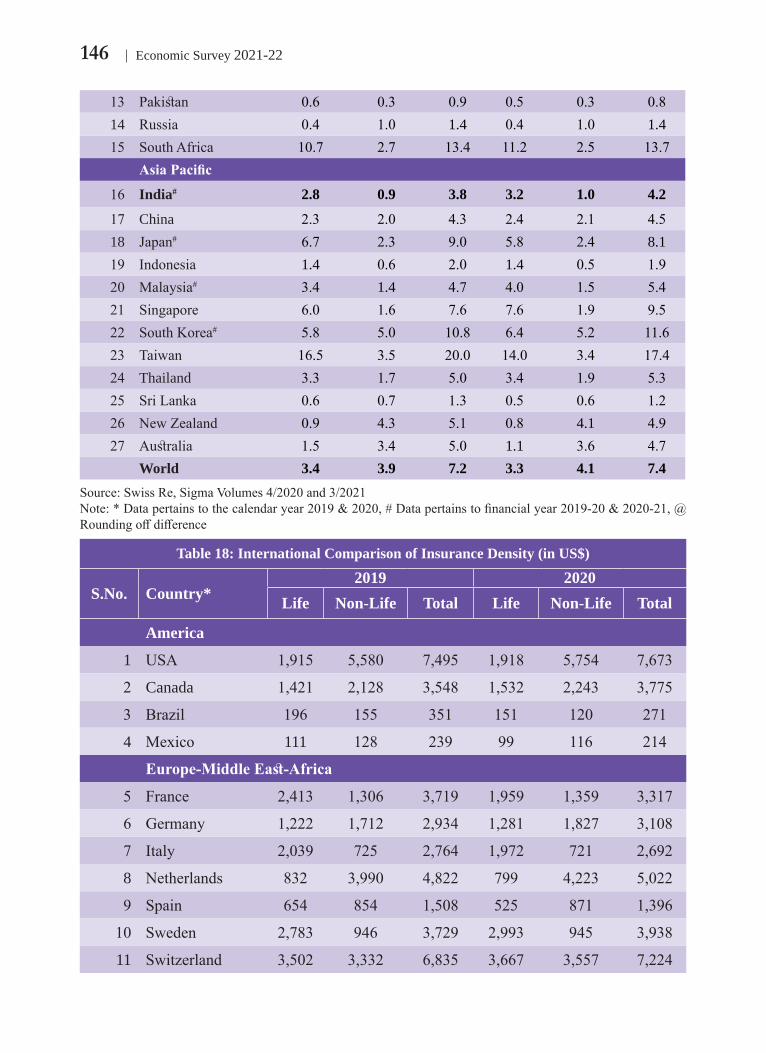
146 Economic Survey 2021-22
13 Pakistan 0.6 0.3 0.9 0.5 0.3 0.814 Russia 0.4 1.0 1.4 0.4 1.0 1.415 SouthAfrica 10.7 2.7 13.4 11.2 2.5 13.7
Asia Pacific
16 India# 2.8 0.9 3.8 3.2 1.0 4.2
17 China 2.3 2.0 4.3 2.4 2.1 4.518 Japan# 6.7 2.3 9.0 5.8 2.4 8.119 Indonesia 1.4 0.6 2.0 1.4 0.5 1.920 Malaysia# 3.4 1.4 4.7 4.0 1.5 5.421 Singapore 6.0 1.6 7.6 7.6 1.9 9.522 SouthKorea# 5.8 5.0 10.8 6.4 5.2 11.623 Taiwan 16.5 3.5 20.0 14.0 3.4 17.424 Thailand 3.3 1.7 5.0 3.4 1.9 5.325 SriLanka 0.6 0.7 1.3 0.5 0.6 1.226 NewZealand 0.9 4.3 5.1 0.8 4.1 4.927 Australia 1.5 3.4 5.0 1.1 3.6 4.7
World 3.4 3.9 7.2 3.3 4.1 7.4Source:SwissRe,SigmaVolumes4/2020and3/2021Note:*Datapertainstothecalendaryear2019&2020,#Datapertainstofinancialyear2019-20&2020-21,@Roundingoffdifference
Table 18: International Comparison of Insurance Density (in US$)
S.No. Country*2019 2020
Life Non-Life Total Life Non-Life Total
America
1 USA 1,915 5,580 7,495 1,918 5,754 7,673
2 Canada 1,421 2,128 3,548 1,532 2,243 3,775
3 Brazil 196 155 351 151 120 271
4 Mexico 111 128 239 99 116 214
Europe-Middle East-Africa
5 France 2,413 1,306 3,719 1,959 1,359 3,317
6 Germany 1,222 1,712 2,934 1,281 1,827 3,108
7 Italy 2,039 725 2,764 1,972 721 2,692
8 Netherlands 832 3,990 4,822 799 4,223 5,022
9 Spain 654 854 1,508 525 871 1,396
10 Sweden 2,783 946 3,729 2,993 945 3,938
11 Switzerland 3,502 3,332 6,835 3,667 3,557 7,224

147 Monetary Management and Financial Intermediation
12 UK 3,383 978 4,362 3,574 949 4,523
13 Pakistan 8 4 12 6 3 10
14 Russia 43 113 157 41 105 146
15 SouthAfrica 643 160 803 560 124 684
Asia Pacific
16 India# 58 20 78@ 59 19 78
17 China 230 201 430 241 214 455
18 Japan# 2,691 930 3,621 2,329 951 3,280
19 Indonesia 58 24 82 54 21 75
20 Malaysia# 380 156 536 415 153 568
21 Singapore 3,844 1,028 4,872 4,528 1,110 5,638
22 SouthKorea# 1,822 1,544 3,366 2,050 1,691 3,741
23 Taiwan 4,129 865 4,993 3,861 938 4,800
24 Thailand 256 134 389 244 139 383
25 SriLanka 23 29 51 21 24 45
26 NewZealand 354 1,790 2,144 349 1,678 2,027
27 Australia 827 1,875 2,702 568 1,880 2,448
World 379 439 818 360 449 809Source:SwissRe,SigmaVolumes4/2020and4/2021Note:*Datapertainstothecalendaryear2019&2020,#Datapertainstofinancialyear2019-20&2020-21,@Roundingoffdifference
4.49 During2020-21,thegrossdirectpremium(withinandoutsideIndia)ofNon-Lifeinsurerswas`2,02,082crore, as against`1,92,193 crore in2019-20, registering agrowthof5.2percent.Motorandhealthsegmentscontributedasignificantportionofthegrowth.Lifeinsuranceindustryrecordedapremiumincomeof`6,28,731croreduring2020-21,asagainst`5,72,910croreinthepreviousfinancialyear,registeringagrowthof9.74percent.Whilerenewalpremiumaccountedfor55.7percentof the totalpremiumreceivedby the life insurers,newbusinesscontributedtheremaining44.3percent.
PENSION SECTOR4.50 The total numberofsubscribers under New Pension Scheme (NPS) andAtal PensionYojana(APY)increasedfrom374.32lakhasonSeptember2020to463lakhasonSeptember2021,recordingagrowthof23.7percentovertheyear.TheoverallcontributionunderNPSgrewbymorethan29percentduringtheperiodSeptember2020-September2021.Maximumgrowth incontributionwas registeredunderAllCitizenmodel (51.29percent) followedbyCorporateSector(42.13percent),APY(38.78percent),StateGovernmentSector(28.9percent),andCentralGovernmentSector(22.04percent).TheAssetsunderManagement(AUM)

148 Economic Survey 2021-22
ofNPSandAPYstandat`6.67lakhcroreatendSeptember2021,ascomparedto`4.95lakhcroreattheendofSeptember2020,therebyrecordinganoverallgrowth(YoY)of34.8percent (Table19).
Table 19: Status of NPS and APY
No. of Subscribers(in Lakh) YoY Contribution
(` Crore) YoY AUM(` Crore) YoY
Sep-20 Sep-21 % Sep-20 Sep-21 % Sep-20 Sep-21 %
NPS
Central Govt 21.3 22.3 4.5 1,11,293 1,35,820 22.0 1,60,606 2,04,227 27.2
StateGovt 49.0 53.9 10.1 1,88,000 2,42,330 28.9 2,50,260 3,35,749 34.2
Corporate 10.5 12.7 21.0 37,788 53,707 42.1 50,730 77,041 51.9
UoS 13.6 18.4 35.3 17,282 26,145 51.3 16,224 27,089 67.0
NPSLite 43.2 42.9 -0.7 2,776 2,931 5.6 4,068 4,624 13.7
APY
APY 236.9 312.9 32.1 11,585 16,078 38.8 13,042 18,649 43.0
Total 374.3 463 23.7 3,68,725 4,77,011 29.4 4,94,930 6,67,379 34.8
Source:PFRDANote-UoS-AllCitizenModel,APY-AtalpensionYojana
4.51 Ason12thOctober2021,contributionof`16,109crorewascollectedintheAtalPensionYojana (APY) scheme from more than 3.45 crore enrolments. TheAPY scheme is beingdistributedthroughmorethan250activeAPYserviceprovidersincludingallbanksandpostoffices(Table20).
Table 20: Number of enrolments (category-wise) under the APY Scheme
Category of Banks Mar-17 Mar-18 Mar-19 Mar-20 Mar-21 12th Oct
2021
PublicSectorBanks 3,047,273 6,553,397 10,719,758 1,56,75,442 2,12,52,435 2,43,90,974
PrivateBanks 497,323 873,901 1,145,289 15,62,997 19,86,467 21,21,377SmallFinanceBank - - 9,190 15,760 35,114 56,012
PaymentBank - - 48,182 3,44,001 8,18,800 10,93,602RegionalRuralBanks 1,115,257 1,987,176 3,171,152 43,30,190 57,10,770 64,15,150
DistrictCo-opBanks 29,791 33,880 38,863 48,581 54,628 58,775
StateCo-opBanks 680 805 1,053 4,620 5,350 5,604

149 Monetary Management and Financial Intermediation
UrbanCo-opBanks 3,507 10,936 14,469 17,355 20,095 21,881
DOP 189,998 245,366 270,329 3,02,712 3,32,141 3,44,132
Total 48,83,829 97,05,461 1,54,18,285 2,23,01,658 3,02,15,800 3,45,07,507
Source:PFRDA
4.52 TheageprofileofthesubscribersintheAPYschemesuggestsincreasingenrolmentsatyoungerage.AsonSeptember2021,morethan43percentsubscriberswerebetween18and25years,ascomparedto29percentasonMarch2016.Further,morepeoplearenowoptingforapensionamountof 1000permonth.AsonSeptember2021,around78percentsubscribershaveoptedfor`1000permonthpensionamount,ascomparedto38percentsubscribersasonMarch2016.Further,asonSeptember2021theshareofsubscribersoptingfor 2000/`3000/`4000permonthpensionis8percent,while14percentoptfor`5000permonthpension.
4.53 ThegendergapinenrolmentsunderAPYhasnarroweddownwithincreasedparticipationoffemalesubscribers,whichhasincreasedfrom37percentasofMarch2016;to44percentasofSeptember2021.TheTable21belowliststhestateswhichhaveAPYaccountenrolmentof10lakhsandmore.
Table 21: Number of APY accounts (as on 12th October 2021)
Sr. No. State Name Number of APY Accounts (in Lakh)
1 UttarPradesh 51.92 Bihar 32.73 WestBengal 27.64 Maharashtra 26.85 TamilNadu 25.56 AndhraPradesh 20.57 Karnataka 20.58 MadhyaPradesh 20.29 Rajasthan 17.210 Gujarat 14.311 Orissa 13.1
Source:PFRDA
4.54 ThelimitofaggregateholdingofequitysharesbyaforeigncompanyinPensionFundshasbeenrevisedupfrom49percentto74percent.ThelimitsforallowingexitfromNPSwithoutrequirementofannuitisation(completelump-sum)wasrevisedupwardincaseofsuperannuationordeathofsubscriberfrom`2lakhto`5lakh,aswellasincaseofprematureexitfromNPSfrom 1lakhto 2.5lakhacrossthesectorforallNPSsubscribers.Thesubscribers,joiningafterageof60years,canremaininvested/subscribedtotheNationalPensionSystemtilltheageof75yearswhichwasearlier70years.Inordertoenableitsemployeesbuildasufficientpensioncorpus,theCentralGovernmenthasincreasedtheGovernmentco-contributionfrom10percent

150 Economic Survey 2021-22
to14percentforitsemployees.ItisextendedtoBankemployees,StateGovtemployeesandCentralAutonomousBodies(CABs).TheGovernmenthasalsoprovidedtheoptiontoCentralGovernmentemployeestochangetheirpatternofinvestmentalongwithoptingforanyotherpensionfundapartfromthepresentdefaultscheme.
INSOLVENCY AND BANKRUPTCY CODE4.55 TheInsolvencyandBankruptcyCode(IBC)hascreatedacohesiveandcomprehensiveinsolvencyecosystem.WiththeenactmentofIBC,Indiahaswitnessedthebirthoftwoprofessions,namely, the insolvency profession and the valuation profession that have professionalisedinsolvency services. The Code has opened possibilities of the resolution, includingmerger,amalgamation and restructuring of any kind, which often requires professional help. Thishas createdmarkets for servicesof InsolvencyProfessionals,RegisteredValuers,InsolvencyProfessionalEntitiesandexpandedthescopeofservicesofAdvocates,Accountantsandotherprofessionals(Table22).
Table 22: Ecosystem under the Code
AppellateAuthority TwoBenchesofNationalCompanyLawAppellateTribunalAdjudicatingAuthority 15BenchesofNationalCompanyLawTribunalRegulator InsolvencyandBankruptcyBoardofIndia
Service Providers As on
Mar2017 Mar2018 Mar2019 Mar2020 Mar2021 Sep2021InformationUtilities 00 01 01 01 01 01
InsolvencyProfessionalAgencies 03 03 03 03 03 03
InsolvencyProfessionals 977*+96 1812 2456 3004 3504 3816InsolvencyProfessionalEntities 03 75 48 69 83 86
RegisteredValuer Organisations NA NA 11 12 16 16
RegisteredValuers NA NA 1186 3030 3967 4366RegisteredValuerEntities NA NA 0 20 40 52Source:IBBINote:*Theseregistrationshadavalidityofsixmonthsandexpiredby30thJune2017
Outcomes under the Code
4.56 In view of the COVID-19 pandemic, the Insolvency and Bankruptcy (Amendment)Ordinance,2020waspromulgatedon5thJune2020,whichsuspendedinitiationof theCIRPof a corporatedebtor (CD) for anydefault arisingonor after25thMarch2020.Further, thesuspensionof theCodewasextended twice for3monthseachon24thSeptember2020and22ndDecember2020,toproviderelieftothefirmsundergoingstressduetothepandemic.Therelaxationcombinedwithcontinuedresolutionsledthenumberofcasestodeclineduring2020-21,whichhasslightlyincreasedto1640asofSeptember2021(Figure20).

151 Monetary Management and Financial Intermediation
Figure 20: Corporate Insolvency Resolution Process (CIRPs) accumulation (as of September 30, 2021)
Source:Compilation from thewebsiteof theNationCompanyLawTribunal(NCLT)andfilingbyIPs.Note:TheseCIRPsareinrespectof4,593CorporateDebtors(CDs),Thisexcludes1CDwhichhasmoveddirectlyfromBIFRtoresolution,ThisIncludesDewanHousing Finance Corporation Limited data, the application filed by RBI wasadmittedu/s227readwithFinancialServiceProviders(FSPs)rules,ofthecode.
(a) Rescue of distressed assets
4.57 TheprimaryobjectiveoftheCodeisresolvingtheCorporateDebtors(CDs)indistress.AsonSeptember2021,theCodehasrescued421CDsthroughresolutionplansandreferred1419CDsforliquidation.TheCDsrescuedhadassetsvaluedat 1.48lakhcrore,whiletheCDsreferredforliquidationhadassetsvaluedat 0.52lakhcrorewhentheywereadmittedtoCorporateInsolvencyResolutionProcess(CIRP).Invalueterms,around74percentofdistressedassetswererescued.OftheCDssentforliquidation,three-fourthwereeithersickordefunctandofthefirmsrescued,one-thirdwereeithersickordefunct.Nearly 65percentofthetotaladmittedcaseshavebeenclosed,eitherbyresolution,withdrawalorliquidation.Outofthe1640ongoingCIRPs,nearly75percentofthecaseshasbeenongoingforover270days (Table23).
Table 23: Status of CIRPs as of September 30, 2021
Status of CIRPs No. of CIRPsAdmitted 4708ClosedonAppeal/Review/Settled 701ClosedbyWithdrawalundersection12A 527ClosedbyResolution 421ClosedbyLiquidation 1419OngoingCIRP 1640>270days 1201>180days≤270days 186>90days≤180days 120≤90days 133Source:IBBI2021

152 Economic Survey 2021-22
4.58 Therealisablevalueoftheassetsavailablewiththe421CDsrescuedwhentheyenteredthe CIRP,was only `1.48 lakh crore, though they owed `7.94 lakh crore to creditors. Theresolutionplans realised`2.55 lakhcrore,which ismore than172percentof the realisablevalueoftheseCDs.ThoughrecoveryisincidentalundertheCode,theFinancialCreditors(FCs)recovered32.11percentoftheirclaims,whichreflectstheextentofvalueerosionbythetimetheCDsenteredCIRP,yetitisthehighestamongalloptionsavailabletocreditorsforrecovery (Table24).
Table 24: Status of distressed assets as of September 30, 2021(Amount in ` Crore)
Description Companies Rescued
Companies Ordered for Liquidation Total
No.ofCompanies 421 1419 1840
AggregateClaims 794168 738631 1532799
LiquidationValue 147886 52036 199922
Assetsavailable%ofAggregateClaims 18.62 7.04 13.04
ResolutionValue 254983 NA 254983
ResolutionValueas%ofLiquidationValue 172.42 NA NA
ResolutionValueas%ofAggregateClaimsadmitted 32.11 NA NA
Averagetimetaken 495days 375days 435days
Cost%ofResolutionValue 0.54 NA NA
Source:IBBI2021
(b) Liquidations
4.59 The1419CDsendingupwithordersforliquidationhadanaggregateclaimof`7.38lakhcrore.However,theyhadassets,ontheground,valuedonlyat`0.52lakhcrore.TillSeptember2021,264CDshavebeencompletelyliquidatedwhichhadoutstandingclaimsof 45,790crore,buttheassetswerevaluedat`2,025crore.`1,983crorewasrealisedthroughtheliquidationofthesecompanies(Table25).
Table 25: Status of Liquidation Process as of September 30, 2021
Status of Liquidation Number
Initiated 1419*
FinalReportsubmitted# 264
ClosedbyDissolution 151
ClosedbyGoingConcernSale 6
Compromise/Arrangement 7
Ongoing** 1155
>Twoyears 456
>Oneyear≤Twoyears 333

153 Monetary Management and Financial Intermediation
>270days≤1year 80
>180days≤270days 156
>90days≤180days 74
≤90days 56
Source:IBBI2021Note: *This excludes12 caseswhere liquidationorderhasbeen set asidebyNCLT /NationalCompanyLawAppellateTribunal(NCLAT)/HC/SC;#ThisincludescaseswhereanapplicationforearlydissolutionhasbeenfiledwiththeNCLT;**Thisincludes3caseswhereCDhasbeensoldasagoingconcern,however,submissionofFinalReportisawaited.
(c) Time and cost
4.60 The421CIRPs,whichhaveyieldedresolutionplansbytheendofSeptember2021tookonaverage428days(afterexcludingthetimeexcludedbytheAdjucatingAuthority)fortheconclusionoftheprocess.Outofthis,thecostdetailsareavailableinrespectof388CIRPs.Thecostworksoutonaverageto0.98percentofliquidationvalueandto0.54percentofresolutionvalue.4.61 The1419CIRPs,whichendedup inorders for liquidation, tookonaverage375days.Further,264liquidationprocesses,whichhaveclosedbysubmissionoffinalreportstookonaverage427daysforclosure.
(d) Behavioural Change
4.62 Distressedassetshavealifecycleandtheirvaluegraduallydeclineswithtime.ThefactthataCDmaychangehandshaschangedthebehaviourofdebtors.Thousandsofdebtorsareresolvingdistressintheearlystagesofdistress,eitherwhenthedefaultisimminent,onreceiptofanoticeforrepaymentbutbeforefilinganapplication,afterfilingtheapplicationbutbeforeits admission, and even after admission of the application, andmaking best effort to avoidconsequencesoftheresolutionprocess.TillSeptember2021,18,629applicationsforinitiationofCIRPs ofCDs having underlying default of`5,89,516 croreswere resolved before theiradmission.Further,atotalof527CIRPshavebeenwithdrawnundersection12AoftheCodeuntilSeptember2021.AlmostthreefourthoftheseCIRPshadclaimsoflessthan 10croresand701CIRPcaseshavebeenclosedonappeal/review/settled.IBC and pre-packaged insolvency resolution process for corporate MSMEs
4.63 Theprovisionofmultiplecompetingoptionsfortheresolutionofstressmakesaneconomyagreatplacetodobusiness.Inlinewiththis thought, theInsolvencyandBankruptcyCode,2016was amended through anOrdinance onApril 4, 2021, to provide for a Pre-PackagedInsolvencyResolutionProcess(PPIRP)forcorporateMicro,SmallandMediumEnterprisesasanalternativeinsolvencyresolutionprocesstoensurequickeroutcomes.
4.64 PPIRPhastherigouranddisciplineoftheCIRP.Itisinformaluptoapointandformalthereafter.Itblendsdebtor-in-possessionwithcreditor-in-control.Itisneitherafullyprivatenorafullypublicprocess-itallowsthecompany,ifeligibleundersection29A,tosubmitthebaseresolutionplanwhichisexposedtochallengeforvaluemaximisation.ItsafeguardstherightsofstakeholdersasmuchasinCIRPandhasadequatechecksandbalancestopreventanypotentialmisuse.Thisprocessentailsalimitedroleofthecourtsandinsolvencyprofessionals(IPs).

154 Economic Survey 2021-22
4.65 The informalityat thepre-initiationstageoffersflexibility for theCDand itscreditorstoswiftlyexploreandnegotiatethebestwaytoresolvestressinthebusiness,whilethepost-initiation stage drives value maximisation and bestows the resolution plan with statutoryprotection.Theprocessisrequiredtobecompletedwithinatimeframeof120daysfromthecommencementdate.DuringthePPIRP,themanagementoftheaffairsoftheCDshallcontinuetovestintheBoardofDirectors/partnersoftheCDandtheresolutionprofessionalconductstheprocessundertheguidanceandoversightofthecreditors.
Box 6: VOLUNTARY LIQUIDATION OF CORPORATES
Liquidationcanbeinvoluntaryasinthecaseofinsolvencyorbankruptcy;orvoluntarywhichcouldbeduetopersonalreasons,subsidiariesbeingmergedetc.Acompanymaydecidetovoluntarilycloseitsoperationevenwhenit’sviable.Therehasbeenanoverhaulintheprocessofwinding-upduetotheinsolvency/bankruptcywiththeintroductionoftheInsolvencyandBankruptcyCode,2016(IBC).However,theprocedureofvoluntaryexitofbusinessstillneedstobesimplifiedsignificantly,ontopofrecentprogress.
Currently, there are two main methods of voluntary liquidation, one is through the Registrar ofCompanies (RoC)under section248of theCompaniesAct, 2013andother isunder the IBC.Theformeriscurrentlythemorepopularroutebyfar.
i. Section 248(2) of Companies Act 2013
UnderSection248(2)oftheCompaniesAct,acompanymay,afterextinguishingallitsliabilities,byaspecialresolutionorconsentof75percentmembersintermsofpaid-upsharecapital,mayfileanapplicationinaprescribedmannertotheRegistrarofCompanies(RoC).Theremustnotbeanypendinglitigationsagainstthecompany.Thefollowingisthestep-by-stepprocedure:
Step 1:Companyhastoconveneaboardmeetingtoapprovetheclosureofthebankaccount,payoffallthependingliabilities,andpreparethelatestfinancialstatementoftheCompanyaftertheclosureofthebankaccount.
Step 2:CompanyfilesaSTK-2formwiththerespectiveRoC.
Step 3:Directorshallfurnishadeclarationinthee-formstatingthatthecompanydoesnothaveanyduestowardsanygovernmentdepartment(Centre,State,Statutoryorlocalauthorities).ThishastobecertifiedbyaChartedAccountant,CostAccountorCompanySecretary.
Step 4:RoCissuesapublicnoticeinaprescribedmanneronMinistryofCorporateAffairs(MCA)website;OfficialGazetteand the largestcirculatingnewspaper,one inEnglishand theotherone invernacularlanguage.A30days’noticetimeisprovidedforanyclaimsandobjectionstoberaised.IfthecompanyapplyingforwindingupisregulatedunderSpecialAct(undersection8),approvaloftheconcernedRegulatorybodyisrequired,otherwiseitisnotrequired8.
Step 5:Afterexpiryofnoticeperiod,RoCmaystrikeoffcompaniesnameandpublishdissolutionnoticeinOfficialGazette.
8Companieswhichhavebeenincorporatedforcarryingonbusinessobjectslike,NBFC,AssetManagementCompanies,Insuranceetc.havetoobtainNOCfromtheirRegulatoryauthoritylikeRBI,SEBI,IRDArespectively.

155 Monetary Management and Financial Intermediation
This is considered to be a faster winding process; however, it was observed that there were huge pendencies. As of 13th June 2021, out of the 28,536 pending cases, nearly 10 per cent were pending from more than 1000 days and 54 per cent cases (15,310) were pending for more than one year. Thereafter, efforts were made by government to clear the backlog of applications. Consequently, the number of pending cases has come down drastically to 9,768 as on 10th January 2022, out of which only about 16.3 per cent are pending for more than a year. Yet this process can be simplified further.
ii. Insolvency and Bankruptcy Code
Section 59 of Insolvency and Bankruptcy Code (IBC), 2016 together with the IBBI (VoluntaryLiquidationProcess)Regulations,2017(VoluntaryLiquidationRegulations)providethemechanismfor voluntary liquidation of a corporate person. Section 59 of IBCstates that ‘A corporate personwhointendstoliquidateitselfvoluntarilyandhasnotcommittedanydefaultmayinitiatevoluntaryliquidationproceedingsunderthischapter’.AsonSeptember2021,1042caseshavebeenfiledunderthisschemesofarandoutofthem,finalreportshavebeenreceivedfor483cases,andthefinalorderofdissolutionhasbeenpassedin257cases.Outoftheongoingcases,nearly32percentofthecasesarependingover2yearsand19percentforbetween1and2years(Table6A).
Table 6A: Status of Voluntary Liquidations as of September 30, 2021Status No. of Liquidations
Initiated 1042
Closedbywithdrawal 10
FinalReportSubmitted 483
ClosedbyDissolution 257
Ongoing 549
>Twoyears 177
>Oneyear≤Twoyears 104
>270days≤1year 61
>180days≤270days 107
>90days≤180days 35
≤90days 65
Source:IBBI
Thestep-by-stepprocedureofthevoluntaryliquidationprocessunderIBCisasfollows:
Step 1:Aboardmeeting is held approving thevoluntary liquidation.Section59(3)(a) of theCodeprovidesthatthemajorityofthedirectorsofthecompanyshallpassadeclarationregardingsolvencyandthecompanynotbeingliquidatedtodefraudanyperson.Thisdeclarationhastobesupplementedwith2things:
(a) Auditedfinancialstatementsandrecordofbusinessoperationsofthecompanyfortheprevioustwoyearsorsinceitsincorporation,whicheverislater.
(b) Areportofthevaluationofassetsofthecompany,ifany,preparedbyaRegisteredValuer.

156 Economic Survey 2021-22
Step 2: Passingofshareholder’sresolutionandappointingaliquidator.Thereshallbearesolution(orspecialresolution)ofthemembersofthecompanyinageneralmeetingrequiringthecompanytobeliquidatedvoluntarilyandappointinganinsolvencyprofessionaltoactastheliquidator.Thecreditorsrepresentingtwo-thirdsinvalueofthedebtofthecompanyshallapprovethesaidresolutionwithinsevendaysofsuchresolution.
Step 3: LiquidatorfilestheresolutiontoInsolvencyandBankruptcyBoardofIndia(IBBI)andRoCwithin seven days as per section 59(4) of theCode and regulation 3 (2) ofVoluntary LiquidationRegulations.Regulation14ofVoluntaryLiquidationRegulationsrequiresmakingpublicannouncement(inEnglishandRegionalNewspapers)within5dayscallingstakeholderstosubmitclaimswithin30days(Section38(1)oftheCode).
Step 4: Openingadesignatedbankaccount forcashand liquid fundsandclosureofexistingbankaccount(s)andtransferoffundstoadesignatedbankaccount.
Step 5: ApplyforNoObjectionCertificate(NOC)inCentralBoardofDirectTaxes,CentralBoardofIndirectTaxesandCustom,EmployeeProvidentFundOrganisationandsectoralregulators(TheseNOCsarenotexplicitlymentionedinIBCbutareimpliedtobetaken).
Step 6: Liquidator gives final remittance to shareholders. Also, the liquidator deposits applicablewithholdingtaxesandthenclosesthebankaccountopenedforliquidation.
Step 7: Liquidatorthensubmitsafinalreporttoshareholders,RoC,IBBIandNationalCompanyLawTribunal(NCLT).
Step 8: OrderispassedbyNCLT.
Step 9: FilecopyoftheorderfordissolutionofcorporatedebtorwithRoCvideFormINC28andRoCtostrike-offthenameofCorporateDebtorfromRoC.
ThefirstkeyissueintheprocessisdelaysinobtainingNoObjectionCertificates(NOCs)fromdepartmentsincludingCentralBoardofDirectTaxes,CentralBoardofIndirectTaxesandCustom,EmployeeProvidentFundOrganisationandothersectoralregulators.TheNOCsareimpliedtobetakenalthoughnotspecificallymentionedintheCode.Thisleadstoconfusionregardingtheproceduretobefollowedamongthedepartments,liquidatorsetc.withregardtotheexactproceduretobefollowed.Anotherissueintheprocessisthattherearenowell-definedStandardOperatingProcedures(SoPs)inthedepartmentsforgrantingNOC.Asperthecurrentpractice,theliquidatorswritealettertotheheadofthedepartmentsaskingforanyclaimsthatthedepartmenthasonthecompanyandtograntNOC.Thedepartmentthenassessestheapplicationandresponds.SincetherearenoSoPs,theclaimsraisedbythedepartmentscomewithalagandarenotwithinthestipulatedperiod.Further,anotherproblemleadingtodelaysincertaincasesisthattherearenostandardguidelinesonrequirementsbyNCLTbench,creatinglagsintheprocessesasthecompanyhastocontactvariousdepartmentstotakethespecifiedclearancesasrequiredbyNCLT.Anotherissueisthehesitancyinthebanksforclosureofexistingbankaccountsandalsofortheopeningofthenewliquidationbankaccountbytheliquidator,whichisamandatorystepintheliquidationproceedings.
Tosumup,thereisacaseforsimplifyingtheproblemsintheVoluntaryLiquidationprocess,toimproveeaseofexitforbusiness.Apartfromsimplifyingtheissuesinthevariousstepsintheprocesses,thereis aneed for thecreationof a singlewindow for theentireprocess.Aportal that combinesall thestepsoftheliquidationprocessaltogether,startingfromapplicationbycompaniestoprocessingbyalldepartmentswillprovetobeveryuseful.

157 Monetary Management and Financial Intermediation
Cross Border Insolvency4.66 Crossborderinsolvencysignifiescircumstancesinwhichaninsolventdebtorhasassetsand/orcreditorsinmorethanonecountry.Typically,domesticlawsprescribeprocedures,foridentifyingand locating thedebtors’ assets; calling in theassets andconverting them intoamonetary form;makingdistributions tocreditors inaccordancewith theappropriatepriorityetc. for domestic creditors/debtors. However, there are various insolvency cases in whichcorporationsowesassetsandliabilitiesinmorethanonecountry.
4.67 At present, Insolvency and Bankruptcy Code, 2016 (IBC) provides for the domesticlawsforthehandlingofaninsolvententerprise.IBCatpresenthasnostandardinstrumenttorestructure thefirms involvingcrossborder jurisdictions.TheproblemofnothavingacrossborderframeworkproblemwasalsoexpressedbytheNationalCompanyLawTribunal(NCLT)inMumbaiinacross-borderinsolvencycaseinvolvinganIndianentity9.NCLTstatedthatwhileinsolvencyproceedingsagainstthecorporatedebtorhavealreadybeeninitiatedbeforeaDistrictCourt inNetherlands, “there is no provision and mechanism in the IBC, at this moment, to recognize the judgment of an insolvency court of any Foreign Nation. Thus, even if the judgment of Foreign Court is verified and found to be true, still, sans the relevant provision in the IBC, we cannot take this order on record.”The absence ofstandardized cross border insolvencyframeworkcreatescomplexitiesandraisesvariousissuessuchas:
• Theextenttowhichaninsolvencyadministratormayobtainaccesstoassetsheldinaforeigncountry.
• Priorityofpayments-Whetherlocalcreditorsmayhaveaccesstolocalassetsbeforefundsgototheforeignadministrationornot.
• Recognitionoftheclaimsoflocalcreditorsinaforeignadministration.
• Recognitionandenforcementoflocalsecurities,taxationsystemoverlocalassetswhereaforeignadministratorisappointedetc.
4.68 Presently,whileforeigncreditorscanmakeclaimsagainstadomesticcompany,theIBCcurrently does not allow for automatic recognition of any insolvency proceedings in othercountries.Crossborder insolvencyisregulatedbySection234and235ofIBC.Section234empowers theCentralGovernment toenter intobilateralagreementswithothercountries toresolvesituationsaboutcross-borderinsolvency.Further,theAdjudicatingAuthoritycanissuealetterofrequesttoacourtoranauthority(underSection235)competenttodealwitharequestforevidenceoractioninconnectionwithinsolvencyproceedingsundertheCodeincountrieswiththeagreement(underSection234).
4.69 Ascanbeseen,thecurrentprovisionsunderIBCaread-hocinnatureandaresusceptibleto delay. Entering into mutual (reciprocal) agreements require individual long-drawn-outnegotiationswitheachcountry.Thisleadstouncertaintyofoutcomesofclaimsforcreditors,debtorsandotherstakeholdersaswell.
9StateBankofIndiav.JetAirways(India)Ltd.,CP2205(IB)/MB/2019,CP1968(IB)/MB/2019,CP1938(IB)/MB/2019,Orderdated20June2019

158 Economic Survey 2021-22
4.70 Therefore,thereisaneedforastandardizedframeworkforCross-Borderinsolvency.Thisissueisnotnewandinfact,theproposaltoframearobustcrossborderinsolvencyframeworkhasalreadybeenhighlightedinthereportoftheInsolvencyLawCommittee(ILC)10(October2018).TheCommitteehadrecommendedtheadoptionoftheUnitedNationsCommissiononInternationalTradeLaw (UNCITRAL)with certainmodifications tomake it suitable to theIndiancontext.Infact,UNCITRALonCross-BorderInsolvency,1997hasemergedasthemostwidely accepted legal framework to dealwith cross-border insolvency issues. It provides alegislativeframeworkthatcanbeadoptedbycountrieswithmodificationstosuitthedomesticcontext of the enacting jurisdiction. It has been adopted by 49 countries until now, such asSingapore,UK,US,SouthAfrica,Korea,etc.Thislawaddressesthecoreissuesofcrossborderinsolvencycaseswiththehelpoffourmainprinciples:
• Access: Itallowsforeignprofessionalsandcreditorsdirectaccesstodomesticcourtsandenables them toparticipate inandcommencedomestic insolvencyproceedingsagainstadebtor.
• Recognition:Itallowsrecognitionofforeignproceedingsandenablescourtstodeterminereliefaccordingly.
• Cooperation:Itprovidesaframeworkforcooperationbetweeninsolvencyprofessionalsandcourtsofcountries.
• Coordination:Itallowsforcoordinationintheconductofconcurrentproceedingsindifferentjurisdictions.
10Governmenthadinvitedsuggestions/commentsontheILCreport(DraftZ)fromstakeholders.

CHAPTER
05
As economic activity started showing signs of picking-up in the second year of the pandemic, the global economy faced the fresh challenge of rising global inflation. COVID-19 related stimulus spending in major economies along with pent-up demand boosting consumer spending pushed inflation up in many advanced and emerging economies. The surge in energy, food, non-food commodities, and input prices, supply constraints, disruption of global supply chains, and rising freight costs across the globe stoked global inflation during the year. Crude oil prices also witnessed an upswing during the year on the back of increased demand from recovering economies and supply restrictions by the Organization of the Petroleum Exporting Countries and its allies (OPEC+).
On the domestic front, the average headline Consumer Price Index-Combined (CPI-C) inflation in India moderated to 5.2 per cent in 2021-22 (April-December) from 6.6 per cent in the corresponding period of 2020-21 and was recorded at 5.6 per cent in December 2021. The Consumer Price Index inflation remained range bound as food prices eased considerably due to the supply management response by the Government. Food inflation remained benign during the year at 2.9 per cent (April-December) as against 9.1 per cent in the corresponding period last year. In the case of vegetables, prices of onions and potatoes remained under control, though retail prices of tomatoes witnessed an uptick during September to November 2021 due to untimely rains in major producing states. However, with fresh arrivals in the market in December, retail prices of tomatoes too, are showing signs of easing. While seasonality plays a significant role in the case of vegetables, random shocks like untimely rains also have an impact on their availability and prices. A strong network of cold storage chains well supported by effective transport infrastructure is needed to stabilize the prices of such perishable commodities. Effective supply-side management kept prices of most essential commodities under control during the year. Proactive measures were taken to contain the price rise in pulses and edible oils that reported high inflation reflecting the impact of imported inflation in these commodities. Reduction in central excise and subsequent cuts in VAT by most States has also helped ease petrol and diesel prices.
Wholesale inflation based on Wholesale Price Index (WPI), after remaining very benign during the previous financial year on account of pandemic induced weakening of economic activity, record low global crude oil prices and weak demand, witnessed a sharp uptick, rising to 12.5 per cent during 2021-22 (April-December). This was attributable to the pick-up in economic activity, sharp increase in international prices of crude oil and other imported inputs, and high freight costs. The consequent divergence between
Prices and Inflation

160 Economic Survey 2021-22
GLOBAL INFLATION5.1 In 2021, inflation picked up globally as economic activity revived with opening-up of economies. COVID-19 related stimulus spending, mainly in the form of discretionary handouts to households in major economies, along with pent up demand fueling consumer spending, pushed inflation up in both advanced and emerging economies. In the advanced economies, inflation has increased from 0.7 per cent in 2020 to around 3.1 per cent in 2021 (Figure 1) (IMF, 2022). The surge in energy, food, non-food commodities, and input prices, supply constraints, disruption of global supply chains, and rising freight costs across the globe stoked global inflation during the year. Crude oil prices also witnessed an upswing during the year on the back of increased demand from recovering economies and supply cuts by the Organization of the Petroleum Exporting Countries and its allies (OPEC+).
Figure 1: Consumer Price Inflation Rates
3.1
5.7
0.0
1.0
2.0
3.0
4.0
5.0
6.0
7.0
8.0
2010
2011
2012
2013
2014
2015
2016
2017
2018
2019
2020
2021
Infla
tion
rate
(per
cen
t)
Advanced economies EMDEs
Source: World Economic Outlook, January 2022 Update, IMFNote: The figure are annual averages.Advanced Economies include 40 economies and Emerging Markets and Developing Economies (EMDEs) include 156 economies as per IMF classification
CPI-C and WPI inflation during the year remained a subject of debate. This divergence can be explained by factors such as variations due to base effect, difference in scope and coverage of the two indices, their price collections, items covered and difference in commodity weights. Further, WPI is more sensitive to cost-push inflation led by imported inputs. With the gradual waning of base effect in WPI, the divergence in CPI-C inflation and WPI inflation is also expected to narrow down.

161Prices and Inflation
5.2 However, in comparison to many Emerging Markets and Developing Economies (EMDEs) and advanced economies, consumer price inflation in India remained range bound in the recent months, touching 4.9 per cent in November 2021 and 5.6 per cent in December 2021, owing to the proactive steps taken by the Government for effective supply management. As against this, inflation in USA touched 7.0 per cent in December 2021, the highest since 1982, driven largely by second hand vehicles and energy. While in the UK it hit a nearly 30 years high of 5.4 per cent in December 2021 mainly on account of rising food prices. Among emerging markets, Brazil witnessed high and rising inflation during 2021 which touched 10.1 per cent in December 2021(Figure 2). Inflation in Turkey has been in double digits, reaching 36.1 per cent in December 2021. Argentina has witnessed inflation rates above 50 per cent during the last six months.
Figure 2: Consumer Price Inflation in select countries
7.0
10.1
5.65.4
0
2
4
6
8
10
12
Jan-21 Feb-21 Mar-21 Apr-21 May-21 Jun-21 Jul-21 Aug-21 Sep-21 Oct-21 Nov-21 Dec-21
Infla
tion
rate
(yoy
) (pe
r cen
t)
US Brazil India UK
Source: Organisation for Economic Co-operation and Development; Office for National Statistics, UK
DOMESTIC INFLATION5.3 Retail inflation, as measured by Consumer Price Index-Combined (CPI-C) inflation, in India, which was slightly above 6 per cent in 2020-21 owing to supply chain disruptions caused by COVID-19 restrictions, lockdowns, and night curfews, moderated during the current financial year. Retail inflation during 2021-22 (April-December) stood at 5.2 per cent (Table 1). Wholesale inflation, based on Wholesale Price Index (WPI), after remaining benign during the previous financial years, saw a sharp uptick during 2021-22 (April-December). A part of the observed rise in wholesale inflation could be attributed to the low base in the previous year. However, rising input costs and global commodity prices also contributed to the rise in wholesale prices.

162 Economic Survey 2021-22
Table 1. General inflation based on different price indices (in per cent)
Indices 2015-16
2016-17
2017-18
2018-19
2019-20
2020-21
2020-21^
2021 -22*
WPI -3.7 1.7 3.0 4.3 1.7 1.3 0.0 12.5
CPI - C (Headline Inflation)
4.9 4.5 3.6 3.4 4.8 6.2 6.6 5.2
CPI – IW# 5.6 4.2 2.9 5.6 7.3 5.2 5.2 5.0
CPI - AL 4.4 4.2 2.2 2.1 8.0 5.5 7.0 3.2
CPI - RL 4.6 4.2 2.3 2.2 7.7 5.5 6.8 3.5
Source: Office of the Economic Adviser, Department for Promotion of Industry, and Internal Trade (DPIIT) for WPI, National Statistical Office (NSO) for CPI-C and Labour Bureau for CPI-IW, CPI-AL and CPI-RL. Notes: #CPI-IW inflation for 2020-21 onwards is based on new series 2016=100; (P) - Provisional; C stands for Combined, IW stands for Industrial Workers, AL stands for Agricultural Labourers and RL stands for Rural Labourers. *2021-22 (April to December) and CPI-IW, CPI-AL, RL (April to November)^2020-21 (April to December) and CPI-IW, CPI-AL, RL (April to November)
CURRENT TRENDS IN INFLATION AND ITS DRIVERSRecent Trends in Retail Inflation
5.4 The average retail inflation which was 4.8 per cent in 2019-20, inched up to 6.2 per cent in 2020-21, on account of COVID-19 related supply chain disruptions and stalled economic activity due to lockdown. Since July 2021, retail inflation is well within the tolerance band of targeted limit of 4 per cent +/- 2 percentage points set by the Government for the period April 1, 2021- March 31, 2026 (Table 2). Average retail inflation in 2021-22 (April-December) has declined to 5.2 per cent as against 6.6 per cent during April-December 2020-21.
5.5 In 2021-22, the decline in retail inflation was led by easing of food inflation. Food inflation, as measured by the Consumer Food Price Index (CFPI), averaged at a low of 2.9 per cent in 2021-22 (April to December), as against 9.1 per cent in the corresponding period last year. Food inflation declined between July and September 2021. Though edging up, it increased to 4.0 per cent in December 2021.
5.6 During the current financial year, retail core inflation (inflation excluding ‘food and beverages’ and ‘fuel and light’ – the transitory components of the index) has shown a rising trend. Average core inflation for the period April-December 2021 stood at 5.9 per cent as against 5.4 per cent in corresponding period last year, and remained below 6 per cent during most months. (Figure 3).

163Prices and Inflation
Table 2: Inflation in selected groups of CPI-Base 2012 (in per cent)
Description Weights 2019-20
2020-21
2020-21^
2021-22#
Apr-21
May-21
Jun-21
Jul-21
Aug-21
Sep-21
Oct-21
Nov-21
Dec-21(P)
All Groups 100 4.8 6.2 6.6 5.2 4.2 6.3 6.3 5.6 5.3 4.3 4.5 4.9 5.6
CFPI* 39.1 6.7 7.7 9.1 2.9 2.0 5.0 5.1 4.0 3.1 0.7 0.8 1.9 4.0
Food & beverages
45.9 6.0 7.3 8.4 3.5 2.6 5.2 5.6 4.5 3.7 1.6 1.8 2.6 4.5
Cereals & products
9.7 2.8 3.8 5.2 -0.6 -3.0 -1.4 -1.9 -1.7 -1.4 -0.6 0.4 1.5 2.6
Meat & fish 3.6 9.3 15.4 16.3 8.0 16.7 9.1 4.8 8.3 9.2 8.0 7.1 5.5 4.6
Egg 0.4 4.5 12.9 13.3 9.3 10.6 15.2 19.4 20.8 16.3 7.1 -1.4 -1.3 1.5
Milk & products
6.6 2.9 5.4 6.4 2.4 -0.1 0.6 1.9 2.7 2.9 3.1 3.2 3.4 3.8
Oils & fats 3.6 2.9 16.0 14.0 30.9 25.9 30.9 34.8 32.5 33.1 34.2 33.6 29.7 24.3
Fruits 2.9 0.7 2.6 1.4 7.4 9.7 11.8 11.8 9.0 6.7 3.6 4.9 6.0 3.5
Vegetables 6.0 21.3 5.8 11.0 -11.3 -14.5 -1.9 -0.7 -7.8 -11.7 -22.4 -19.4 -13.6 -3.0
Pulses & products
2.4 9.9 16.4 17.6 7.1 7.5 9.4 10.0 9.0 8.8 8.7 5.4 3.2 2.4
Sugar & confectionery
1.4 0.8 2.5 3.5 1.3 -6.0 -1.5 0.8 -0.5 -0.6 3.0 5.4 6.2 5.6
Fuel & Light 6.8 1.3 2.7 2.3 12.2 8.0 11.9 12.6 12.4 12.9 13.6 14.3 13.3 11.0
CPI excl. food and fuel group (Core)
47.3 4.0 5.5 5.4 5.9 5.3 6.6 6.1 5.8 5.8 5.9 5.9 6.2 6.0
Source: NSO P: Provisional * Consumer Food Price Index ^April to December 2020 # April to December 2021
Figure 3: Trends in CPI-C Headline, Core and Food inflation
-4-202468
101214
Jun-
14
Dec
-14
Jun-
15
Dec
-15
Jun-
16
Dec
-16
Jun-
17
Dec
-17
Jun-
18
Dec
-18
Jun-
19
Dec
-19
Jun-
20
Dec
-20
Jun-
21
Dec
-21
Infla
tion
rate
(yoy
) (pe
r cen
t)
Headline Core Food
Source: NSO, MoSPI
5.7 Conventionally, core inflation is calculated by excluding ‘food and beverages’ and ‘fuel and light’1 groups from overall inflation. While in CPI-C, major fuel items such as ‘petrol for
1. ‘Fuel and light’ consist mainly of items used by households to meet their domestic fuel needs excluding that for conveyance such as electricity, LPG, Kerosene and other fuels used for cooking. On the other hand, petrol and diesel used for vehicles is included in the ‘transport and communication’ sub-group of the miscellaneous group.

164 Economic Survey 2021-22
vehicle’ and ‘diesel for vehicle’, which have relatively large weights, are not included in ‘fuel and light’. These fuel items are included in ‘transport and communication’, a subgroup under the miscellaneous group. Therefore, conventional way of calculating retail core inflation, instead of excluding the volatile fuel items from core inflation, continue to include volatile fuel items in core inflation. As a result, the fuel price rise continues to impact core inflation.
5.8 A ‘refined’ core inflation was constructed to address this anomaly by excluding main fuel items viz., ‘petrol for vehicle’, ‘diesel for vehicle’ and ‘lubricants and other fuels for vehicles’, in addition to ‘food and beverages’ and ‘fuel and light’ from the headline retail inflation. Both the conventional core inflation and refined core inflation are presented in figure 4. Since June 2020, refined core inflation has been much below the conventional core inflation, indicating the impact of inflation in fuel items in the conventional core inflation measure.
Figure 4: Retail Core and ‘Refined Core’ inflation
3.0
3.5
4.0
4.5
5.0
5.5
6.0
6.5
7.0
Feb-
18
Apr
-18
Jun-
18
Aug
-18
Oct
-18
Dec
-18
Feb-
19
Apr
-19
Jun-
19
Aug
-19
Oct
-19
Dec
-19
Feb-
20
Apr
-20
Jun-
20
Aug
-20
Oct
-20
Dec
-20
Feb-
21
Apr
-21
Jun-
21
Aug
-21
Oct
-21
Dec
-21
Infla
tion
rate
(yoy
) (pe
r cen
t)
Retail Core inflation Refined core inflation
Source: NSO, MoSPINote: Item level indices for ‘petrol for vehicle’, ‘diesel for vehicle’ and ‘lubricants and other fuels for vehicles’ were not available for March-May 2020.
What has driven retail inflation and why?
5.9 Unlike 2020-21 (April-December) when ‘food and beverage’ drove inflation, during 2021-22 (April to December) the major drivers of retail inflation have been miscellaneous and ‘fuel and light’ group. Contribution of miscellaneous group has increased from 26.8 per cent in 2020-21 (April-December) to 35 per cent in 2021-22 (April-December) and contribution of ‘fuel and light’ increased from 2.3 per cent to 14.9 per cent (Figure 5). On the other hand, during the same period, contribution of ‘food and beverages’ declined from 59 per cent to 31.9 per cent. Within ‘miscellaneous group’, sub-group ‘transport and communication’ contributed the most, followed by health.

165Prices and Inflation
Figure 5: Contribution of groups to overall CPI-C inflation in 2020-21 (April-December) and 2021-22 (April-December) in per cent
45.9
2.4 6.5 10.16.8
28.3
010203040506070
Food
& b
ever
ages
Pan,
toba
cco
&in
toxi
cant
s
Clo
thin
g &
foot
wea
r
Hou
sing
Fuel
and
ligh
t
Misc
ella
neou
s
per c
ent
2020-21 (Apr-Dec) 2021-22 (Apr-Dec) Weights
Source: NSO, MoSPI
5.10 ‘Fuel and light’ and ‘Transport and communication’: In 2021-22 (April-December), inflation in ‘fuel and light’ and ‘transport and communication’ was mostly driven by high international crude oil, petroleum product prices, and higher taxes (Figure 6). In April 2020, in response to subdued global demand because of COVID-19 induced restrictions, the price of Indian basket of crude oil dipped to $19.9/bbl. However, thereafter, the prices have been on an uptrend (Figure 7). The upward trend was on account of unprecedented cuts in crude oil supply by OPEC and other oil producing countries. The upward trend continued in 2021 as well, as demand picked up with easing of COVID-19 restriction in most regions of the world. Besides, the unwinding of production cuts made last year by OPEC+ countries has been gradual and has not kept pace with the recovery in demand. However, since second half of October 2021 crude oil prices had softened, due to factors including rising COVID-19 cases in Europe, and possibility of release of crude oil from strategic reserves by the USA and other countries. Further, cut in central excise duty on petrol and diesel followed by reduction in VAT by majority of the State Governments, led to moderation of retail selling price of petrol and diesel in India in 2021 (Figure 8). However, crude oil price again witnessed an uptick in January 2022 with tight supply amid concerns about rising geopolitical uncertainties in Eastern Europe and the Middle East.

166 Economic Survey 2021-22
Figure 6: ‘Fuel and light’ and ‘transport and communication’ inflation
-4
-2
0
2
4
6
8
10
12
14
16
Apr
-18
Jun-
18
Aug
-18
Oct
-18
Dec
-18
Feb-
19
Apr
-19
Jun-
19
Aug
-19
Oct
-19
Dec
-19
Feb-
20
Apr
-20
Jun-
20
Aug
-20
Oct
-20
Dec
-20
Feb-
21
Apr
-21
Jun-
21
Aug
-21
Oct
-21
Dec
-21
Infla
tion
Rat
e (y
oy) (
per c
ent)
Fuel and light Transport and communication
Source: NSO, MoSPI
Figure 7: International Crude Oil Price (Indian Basket)
21st Jan 2022, 86.28
0102030405060708090
100
Apr
-18
Jun-
18A
ug-1
8O
ct-1
8D
ec-1
8Fe
b-19
Apr
-19
Jun-
19A
ug-1
9O
ct-1
9D
ec-1
9Fe
b-20
Apr
-20
Jun-
20A
ug-2
0O
ct-2
0D
ec-2
0Fe
b-21
Apr
-21
Jun-
21A
ug-2
1O
ct-2
1D
ec-2
1
($/b
bl)
Source: PPAC, MoPNG

167Prices and Inflation
Figure 8: Retail Selling Price (RSP) of Petrol and Diesel in four Metros
60
70
80
90
100
110
1201-
Jan-
201-
Mar
-20
1-M
ay-2
01-
Jul-2
01-
Sep-
201-
Nov
-20
1-Ja
n-21
1-M
ar-2
11-
May
-21
1-Ju
l-21
1-Se
p-21
1-N
ov-2
1
Rs/
ltDelhi
Petrol Diesel
60
70
80
90
100
110
120
1-Ja
n-20
1-A
pr-2
0
1-Ju
l-20
1-O
ct-2
0
1-Ja
n-21
1-A
pr-2
1
1-Ju
l-21
1-O
ct-2
1
Rs/
lt
Mumbai
Petrol Diesel
6065707580859095
100105110
1-Ja
n-20
1-M
ar-2
01-
May
-20
1-Ju
l-20
1-Se
p-20
1-N
ov-2
01-
Jan-
211-
Mar
-21
1-M
ay-2
11-
Jul-2
11-
Sep-
211-
Nov
-21
Rs/
lt
Chennai
Petrol Diesel
60
70
80
90
100
110
1201-
Jan-
201-
Mar
-20
1-M
ay-2
01-
Jul-2
01-
Sep-
201-
Nov
-20
1-Ja
n-21
1-M
ar-2
11-
May
-21
1-Ju
l-21
1-Se
p-21
1-N
ov-2
1
Rs/
ltKolkata
Petrol Diesel
Source: PPAC, MoPNG
5.11 Miscellaneous: During 2021-22 (April-December), the ‘miscellaneous’ group by accounting for around 35 per cent of overall inflation has been important driver of retail inflation. Within this group, high inflation in subgroup ‘transport and communication’ driven mainly by inflation in petrol and diesel for vehicle, have been contributing significantly. ‘Clothing and footwear’ inflation also saw a rising trend during the current financial year possibly indicating higher production and input costs (including imported inputs) as well as due to revival of consumer demand.
5.12 ‘Food and beverages’: Retail food inflation remained above 8 per cent from November 2019 to November 2020, but declined thereafter, recording inflation of 2.9 per cent in 2021-22 (April-December). Inflation in cereals and products remained negative during April to September 2021 and remained low in October-December 2021, indicating sufficient supply of cereals, well supported by an effective Public Distribution System providing subsidized food

168 Economic Survey 2021-22
grains to the bottom 67 per cent of the population as per 2011 census under the National Food Security Act, 2013.
5.13 During 2021-22 (April to December), inflation in ‘vegetables’ remained negative at (-)11.3 per cent; contributing negatively to the overall retail inflation. Though, tomato prices spiked after end of September 2021 owing to crop damage and delay in arrival of produce in mandi because of unseasonal heavy rains in producing states of Punjab, Uttar Pradesh, Haryana, and Himachal Pradesh. Pressure on tomato prices was further exacerbated due to disruption of tomato supply by heavy rains in in producing states of Tamil Nadu, Andhra Pradesh, Telangana and Karnataka. In December 2021, tomato prices have moderated with arrival of fresh supplies. Inflation of onion and potato remained negative throughout the year. Both seasonality and exogenous shocks impact retail prices of tomato and onion (Box 1).
5.14 Inflation in protein-based items like ‘meat and fish’ remained considerably elevated during 2021-22 (April to December), due to COVID-19 related supply disruptions and high poultry feed prices owing to high prices of soybean meal. While the average inflation of ‘meat and fish’ has been lower during 2021-22 (April to December) at 8.0 per cent compared to 15.4 per cent in 2020-21. Inflation in ‘meat and fish’ declined since September 2021, and was 4.6 per cent in December 2021, the lowest during the current financial year. Inflation in egg has shown steady decline since July 2021, and remained negative in October 2021 and November 2021. Inflation in ‘pulses and products’ remained high in the previous financial year, however, declined steadily since July 2021 due to proactive supply management efforts by the Government.
Box 1: Seasonality and irregularity in the retail prices of tomato and onion
Seasonality in production and irregular shocks are two important components contributing to the variations in prices of agriculture commodities, more so in prices of perishable commodities such as tomato and onion. Seasonality in prices is a result of the varying pattern of production of these commodities during different months of a year. On the other hand, shocks often originate from uncertain weather conditions and other unpredictable events. Distinguishing between these two, however, is important as policy can be oriented at least towards addressing the more certain seasonal pattern of price rise.
A time series often has four components: Trend, Cycle, Seasonal and Irregular. Trend indicates a long-term rise or fall in prices. A cycle represents a rise or fall in prices that are not of a fixed frequency such as representing business cycles. Seasonality is of fixed frequency and occurs at particular points of time during the year. Seasonality in prices could occur due to the seasonal pattern of production of agricultural commodities or seasonality in demand such as major festivals. Irregular component is the remainder in a time series after removing the trend, cycle and seasonal components. Its magnitude, impact and duration are unpredictable a priori.
For the current analysis, the seasonal component of the prices is extracted to identify the seasonality in these commodities in different months of the year. On the other hand, the irregular component can be used to identify points of time when various exogenous shocks have caused spikes in the prices of commodities. The Seasonal-Trend Decomposition Procedure based on Loess (STL) (Cleveland et

169Prices and Inflation
al., 1990) was used for the decomposition. The monthly retail price data at the All-India level have been taken from Department of Consumer Affairs. The figure 1A shows the trend of the retail prices of tomato and onion.
Figure 1A: Retail prices of tomato and onion
0
10
20
30
40
50
60
70
80
90
100Apr-16
Jun-16
Aug-16
Oct-16
Dec-16
Feb-17
Apr-17
Jun-17
Aug-17
Oct-17
Dec-17
Feb-18
Apr-18
Jun-18
Aug-18
Oct-18
Dec-18
Feb-19
Apr-19
Jun-19
Aug-19
Oct-19
Dec-19
Feb-20
Apr-20
Jun-20
Aug-20
Oct-20
Dec-20
Feb-21
Apr-21
Jun-21
Aug-21
Oct-21
Dec-21
Rs.
Onion Tomato
Source: Department of Consumer Affairs
1. Tomato:Seasonality in tomato:The seasonal components tend to put an upward pressure on prices of tomato during July to November every year; upward pressure remain highest in July (Figure 1B). On the other hand, seasonal factor puts largest downward pressure on prices in March. This seasonality in prices results from the seasonal pattern of production of tomato, as about 70 per cent of production of tomato takes place during Rabi season: transplantation during October-February and harvest during December-June. Kharif production during July-November usually contributes less than 30 per cent of total production of tomato in a year. This variation in supply puts upward pressure on tomato prices every year during July-November. If there were no irregular shocks, then seasonality would have caused tomato prices to be around Rs. 15 higher in July 2021 over March 2021 compared to the long-term trend.
Figure 1B: Seasonality in the retail prices of tomato
-10
-5
0
5
10
January
February
March
April
May
June
July
August
Septem
ber
October
Novem
ber
Decem
ber
Rs.
2019 2020 2021
Source: Survey calculations

170 Economic Survey 2021-22
Price shocks in tomato:Figure 1C presents the irregular component in the retail price series of tomato during the last 5 years. The large jumps in the chart can be used to identify incidents of price shocks. Six instances have been identified when the irregular component has displayed a large spike (close to or greater than Rs. 10) in the case of the retail price of tomato. Possible reasons for the spikes are given in the Table 1A.
Figure 1C: Irregular component in the retail prices of tomato
-10
-5
0
5
10
15
20
25
30
35
40
Apr
-16
Jun-
16A
ug-1
6O
ct-1
6D
ec-1
6Fe
b-17
Apr
-17
Jun-
17A
ug-1
7O
ct-1
7D
ec-1
7Fe
b-18
Apr
-18
Jun-
18A
ug-1
8O
ct-1
8D
ec-1
8Fe
b-19
Apr
-19
Jun-
19A
ug-1
9O
ct-1
9D
ec-1
9Fe
b-20
Apr
-20
Jun-
20A
ug-2
0O
ct-2
0D
ec-2
0Fe
b-21
Apr
-21
Jun-
21A
ug-2
1O
ct-2
1D
ec-2
1
Rs.
Source: Survey calculations
Table 1A: Incidents of price shocks in tomato during the last five years
Incidents identified Reasons
June 2016 Short supply of tomato, as the Rabi crop of 2016 got damaged by severe drought conditions in the southern states.
July-August 2017 Rains in Madhya Pradesh and Rajasthan caused some damage to the crop. In addition, issues with transportation with trucks taking more than the normal time due to the rains leading to reduction in arrivals. Stocks stored got spoiled due to the rain.
November-December 2017
Unseasonal rains in growing regions such as Karnataka and Madhya Pradesh.
May 2019 Delayed harvesting in Maharashtra as well as fungus damaged crops in Karnataka triggered the initial uptick in prices, which was exacerbated by supply disruptions due to incessant rains and flood like situations in key supplier states – Karnataka, Maharashtra and Himachal Pradesh.
September 2020 Lower arrival of the new crop from key growing states due to heavy rains.
November 2021 Unseasonal rains in Punjab, Uttar Pradesh, Haryana and Himachal Pradesh which led to crop damage and delay in arrival from these states. Delayed arrivals from the northern states were followed by heavy rains in Tamil Nadu, Andhra Pradesh, Telangana and Karnataka which further disrupted the supply.

171Prices and Inflation
2. Onion:
Seasonality in onion:Rabi season: transplantation in December-January and harvest in end March to May - accounts for about 70 per cent of total onion production in a year. The seasonal component is found to put downward pressure (negative values in Figure 1D) on prices coinciding with the Rabi harvest period, and upward pressure (positive values) in other months, reaching peak in December. The other two production seasons viz., Kharif - transplantation in July-August and harvesting in October-December -, and late Kharif - transplantation in October-November and harvest in January-March, face supply deficit.
Figure 1D: Seasonality in the retail prices of onion
-10
-5
0
5
10
January
February
March
April
May
June
July
August
Septem
ber
October
Novem
ber
Decem
ber
Rs.
2019 2020 2021
Source: Survey calculations
Price shocks in onion:Four incidents of price shocks have been identified based on the inspection of the plot of irregular component in the retail price of onion (Figure 1E). Possible reasons of the incidents are listed in Table 1B.
Figure 1E: Irregular component in the retail prices of onion
-10
0
10
20
30
40
Apr
-16
Jun-
16A
ug-1
6O
ct-1
6D
ec-1
6Fe
b-17
Apr
-17
Jun-
17A
ug-1
7O
ct-1
7D
ec-1
7Fe
b-18
Apr
-18
Jun-
18A
ug-1
8O
ct-1
8D
ec-1
8Fe
b-19
Apr
-19
Jun-
19A
ug-1
9O
ct-1
9D
ec-1
9Fe
b-20
Apr
-20
Jun-
20A
ug-2
0O
ct-2
0D
ec-2
0Fe
b-21
Apr
-21
Jun-
21A
ug-2
1O
ct-2
1D
ec-2
1
Rs.
Source: Survey calculations

172 Economic Survey 2021-22
Table 1B: Incidents of price shocks in onion during the last five years
Incidents identified Reason
January 2018 Fall in production in 2017-18 as against the previous year. Weather conditions in Maharashtra including cyclones and low pressures forming along the west coast, production of onion was adversely affected in areas like Sholapur, Nasik, Ahmednagar and Lasalgaon.
November 2019-January 2020
Untimely and prolonged rains during month of September and October 2019 caused damage to Kharif onion crop leading to short supply and increase in its prices.
October-November 2020 Heavy rainfall in September in Karnataka - responsible for a bulk supply ahead of the kharif crop from Maharashtra towards the end of October - has upset the calculations. September rains, according to reports, have hit not only the supply from Karnataka, but Maharashtra too where heavy rainfall in onion belt comprising Ahmednagar, Nashik and Pune affected the storage with water seepage.
February 2021 Delay in arrivals of the late kharif crop as the growing regions experienced rains in January 2021.
Conclusion
Both seasonal as well as shock components contribute in the spikes of the tomato and onion prices. Seasonality in prices resulting from seasonal production patterns require policy attention. Strategies to incentivize production during lean season should be designed. Investments in processing of surplus production of tomato, and processing and storage infrastructure of onion must be promoted. Cutting wastage of the production, better supply chain management will also help in meeting the demand.
Government is implementing various measures to overcome these challenges. The Mission for Integrated Development of Horticulture (MIDH) envisages holistic development of horticulture and provides assistance at 50 per cent of total cost of Rs. 1.75 lakh per unit for low-cost onion storage structure having a capacity of 25 tonne each. Government also procures onions directly from farmers at farm gate prices for the buffer. Schemes such as Agricultural Marketing Infrastructure (AMI) for rural godowns enables small farmers to enhance their holding capacity to sell their produce at remunerative prices and avoid distress sale. “Operation Greens” for integrated development of Tomato, Onion and Potato (TOP) value chain. It provides 50 per cent subsidy for the transportation and storage from surplus producing areas to consuming centres. Kisan Rail service, was launched on 7th August 2020 to enable speedy movement of perishables including fruits, vegetables, meat, poultry, fishery and dairy products from production or surplus regions to consumption or deficient regions.
5.15 ‘Oils and fats’ contributed around 60 per cent of ‘food and beverages’ inflation despite having a weight of only 7.8 per cent in the group. Inflation of the sub-group has risen sharply since mid-2019; remained in double digits since April 2020 and witnessed further uptrend in

173Prices and Inflation
2021-22 (Figure 9). In 2021-22 (April - December), its inflation has been 30.9 per cent, and stood at 24.3 per cent in December 2021.
Figure 9: Inflation in 'Oils and fats' subgroup
0
5
10
15
20
25
30
35
40
Apr
-17
Sep-
17
Feb-
18
Jul-1
8
Dec
-18
May
-19
Oct
-19
Mar
-20
Aug
-20
Jan-
21
Jun-
21
Nov
-21
Infla
tion
Rat
e (y
oy)
(per
cen
t) Oils and fats
-20
-10
0
10
20
30
40
50
Apr
-17
Aug
-17
Dec
-17
Apr
-18
Aug
-18
Dec
-18
Apr
-19
Aug
-19
Dec
-19
Apr
-20
Aug
-20
Dec
-20
Apr
-21
Aug
-21
Dec
-21
Infla
tion
Rat
e (y
oy)
(per
cen
t)
Oils and fats
Mustard oil
Groundnut oil
Refined oil [sunflower;soyabean; saffola; etc.]
Ghee
Source: NSO, MoSPINote: Item level indices for ‘mustard oil’, ‘groundnut oil’ ‘refined oil’ and ‘ghee’ were not available for March-May 2020.
5.16 India imports around 60 per cent of its consumption of edible oils’, and Palm oils (Crude + Refined) constitutes around 60 per cent of the imports of edible oils (PIB, 2021). As a result, fluctuation in imports and international prices transmit to domestic prices of edible oil. The current spike in prices of edible oils is mainly on account of high and increasing international prices of edible oils. The rise in oils component of Food and Agriculture Organisation’s (FAO) food price index from May 2020 onwards has been steep, and reached a 10-year high due to robust global import demand amidst the shortages over migrant labour impacting production in Malaysia (Figure 10; FAO, 2021).
Figure 10: FAO Food Price Index: Edible oils component
60
80
100
120
140
160
180
200
Jan/20
20Feb/20
20Mar/202
0Apr/202
0May/202
0Jun/20
20Jul/2
020
Aug
/202
0Sep/20
20Oct/202
0Nov
/202
0Dec/202
0Jan/20
21Feb/20
21Mar/202
1Apr/202
1May/202
1Jun/20
21Jul/2
021
Aug
/202
1Sep/20
21Oct/202
1Nov
/202
1Dec/202
1
Index
Source: FAO
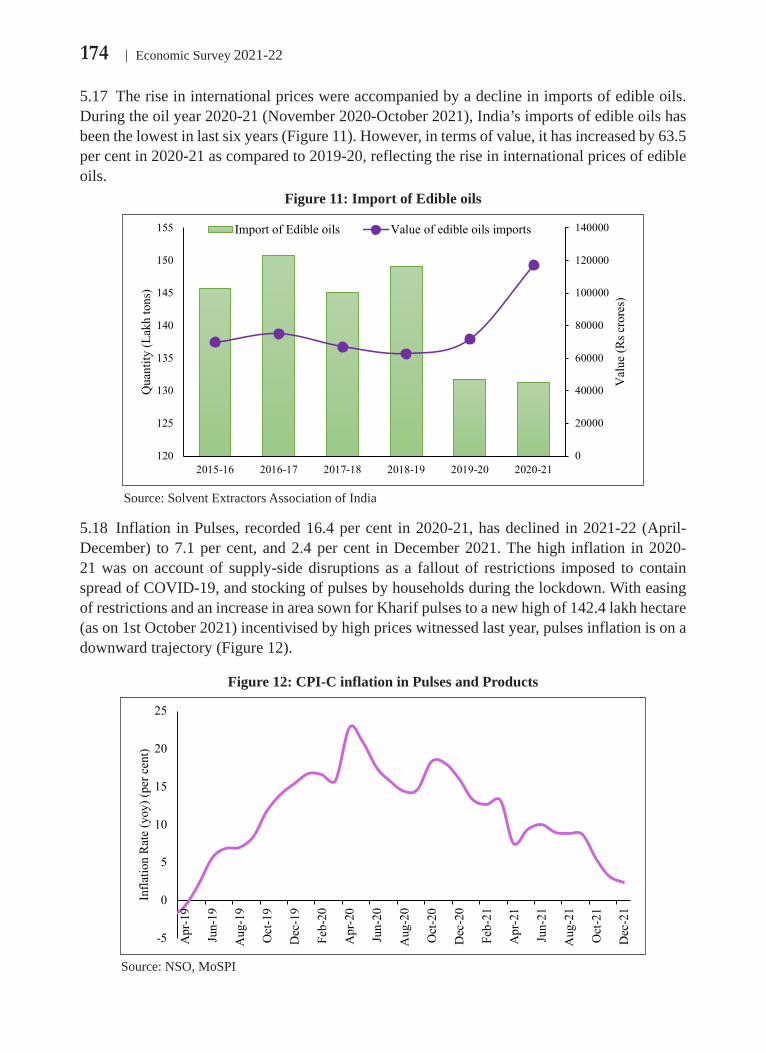
174 Economic Survey 2021-22
5.17 The rise in international prices were accompanied by a decline in imports of edible oils. During the oil year 2020-21 (November 2020-October 2021), India’s imports of edible oils has been the lowest in last six years (Figure 11). However, in terms of value, it has increased by 63.5 per cent in 2020-21 as compared to 2019-20, reflecting the rise in international prices of edible oils.
Figure 11: Import of Edible oils
0
20000
40000
60000
80000
100000
120000
140000
120
125
130
135
140
145
150
155
2015-16 2016-17 2017-18 2018-19 2019-20 2020-21
Val
ue (R
s cro
res)
Qua
ntity
(Lak
h to
ns)
Import of Edible oils Value of edible oils imports
Source: Solvent Extractors Association of India
5.18 Inflation in Pulses, recorded 16.4 per cent in 2020-21, has declined in 2021-22 (April-December) to 7.1 per cent, and 2.4 per cent in December 2021. The high inflation in 2020-21 was on account of supply-side disruptions as a fallout of restrictions imposed to contain spread of COVID-19, and stocking of pulses by households during the lockdown. With easing of restrictions and an increase in area sown for Kharif pulses to a new high of 142.4 lakh hectare (as on 1st October 2021) incentivised by high prices witnessed last year, pulses inflation is on a downward trajectory (Figure 12).
Figure 12: CPI-C inflation in Pulses and Products
-5
0
5
10
15
20
25
Apr
-19
Jun-
19
Aug
-19
Oct
-19
Dec
-19
Feb-
20
Apr
-20
Jun-
20
Aug
-20
Oct
-20
Dec
-20
Feb-
21
Apr
-21
Jun-
21
Aug
-21
Oct
-21
Dec
-21
Infla
tion
Rat
e (y
oy) (
per c
ent)
Source: NSO, MoSPI

175Prices and Inflation
Box 2: Steps taken by the Government to augment the supply of essential commodities
The government has undertaken several measures to mitigate rise in prices of essential commodities:
Pulses and onion
Creating a buffer
l To ensure effective intervention during price rise through utilisation of buffer stocks, the Government has procured pulses in 2020-21 and 2021-22 from farmers/farmers’ producers organisations (FPOs). The target for pulses buffer in 2021-22 is at 23 LMT. onion buffer of 2.08 LMT has been created in 2021-22 and released in a calibrated and targeted manner to contain price rise.
Import policy
l To augment domestic availability of pulses, Tur and Urad are kept under ‘free’ import category till 31st March, 2022.
l Basic import duty and Agriculture Infrastructure and Development Cess on Masur have been brought down to zero and 10 per cent respectively.
l 5-year MoUs have been signed with Myanmar for annual import of 2.5 LMT of Urad and 1 LMT of Tur, and with Malawi for annual import of 0.50 LMT of Tur. The MoU with Mozambique has been extended for another 5 years for annual import of 2 LMT Tur.
Edible Oilsl To soften the prices of edible oils, the duty on edibles oil has been reduced with effect from 14th
October 2021.
l To soften the prices of edible oils, the basic duty on Refined palm oil/Palmolein, Refined Soyabean oil and Refined Sunflower oil has been reduced to 17.5 per cent from 32.5 per cent with effect from 14th October 2021.
Speculation and hoarding
l Futures trading in mustard oil on NCDEX has been suspended and stock limits have been imposed.
l The Department of Food and Public Distribution has imposed stock limits on Edible Oils and Oilseeds for a period up to 31st March, 2022. The Removal of Licensing Requirements, Stock Limits and Movement Restrictions on Specified Foodstuffs (Amendment) Order, 2021 has been issued w.e.f. 8th October, 2021. It has also been directed to ensure that Edible Oils and Edible Oilseeds stock is regularly declared and updated on the portal of the Department of Food & Public Distribution.
Production and alternates
l The government is taking steps to improve the production of secondary edible oils, especially rice bran oil to reduce the import dependence.
Soyameal included as essential commodity
l In a bid to cool down the domestic prices of Soya Meal, Government has notified an Order under

176 Economic Survey 2021-22
the Essential Commodities Act to declare ‘Soya Meal’ as an Essential Commodities up to 30th June, 2022 by amending the Schedule of the Essential Commodities Act, 1955. Stock limit on Soya Meal has been imposed for a period from 23rd December, 2021 upto 30th June, 2022.
Perishable essential commoditiesl For perishables, Operations Green scheme was launched in November 2018. The scheme has later
been expanded from TOP (Tomato, Onion, Potato) to TOTAL (41 perishables). Expansion of the scheme has resulted in widening the impact in terms of the production clusters and beneficiaries covered. Currently, 41 perishables from 52 production clusters are being covered. Since beginning till 15.12.2021, Rs.65.79 crore has been provided so far as subsidy towards transportation/storage of 3.05 lakh MT of TOP crops, the expansion of scheme has resulted in additional transportation/storage of 2.82 lakh MT of crops other than TOP with additional subsidy of Rs.51.55 crore.
l Kisan Rail trains introduced to enable speedy movement of perishables from production or surplus regions to consumption or deficient regions. Since the launch of first Kisan Rail service on 7th August 2020 and up to 14th January 2022, Indian Railways have operated 1,900 Kisan Rail services, transporting approximately 6.23 lakh tons of perishables including fruits and vegetables.
Box 3: Liquified Petroleum Gas (LPG) and Kerosene price trend
LPG
The prices of petroleum products in the country are linked to the price of respective products in the international market. Prices of LPG in the country are based on Saudi Contract Price (CP), the benchmark for international prices of LPG. Saudi CP has risen approximately 258 per cent from April, 2020 to November, 2021 (236 USD to 846 USD).
LPG subsidy is governed under Direct Benefit Transfer for LPG consumers (DBTL) scheme, wherein the subsidy on domestic LPG is regulated based on direction of price trends in international market. Since May, 2020, there is no subsidy to the consumers on Domestic LPG (at Delhi Market). However, in far-flung areas and some other markets, there is some subsidy that varies from market to market mainly due to higher inland freight from port to bottling plant.
In order to provide clean cooking fuel to poor households, in May 2016 the Government launched “Pradhan Mantri Ujjwala Yojana” (PMUY) scheme to provide 5 crore deposit-free LPG connections, subsequently increased to 8 crore. The target of Scheme was achieved in September, 2019, 7 months ahead of the target. Implementation of PMUY majorly contributed to increase in national LPG coverage to from 61.9 per cent as on 01.04.2016 to 99.8 per cent as on 01.04.2021. Further, in budget speech made on 1st February, 2021, announcement was made to cover additional 1 crore beneficiaries under Ujjwala scheme. In its revised version, Pradhan Mantri Ujjwala Yojana was launched as Ujjwala 2.0, by Hon. Prime Minister in August 2021. While it covers all existing eligible categories of beneficiaries, Ujjwala 2.0 makes specific relaxations for migrants who can submit a simple self-declaration as an address-proof, arranging which used to be a major hassle for migrant. Also, free first refill and stove is being provided to all Ujjwala 2.0 beneficiaries. As on 31.12.2021, a total of 96 lakh deposit-free LPG connections have been released under Ujjwala 2.0 scheme, including 2.2 lakh for migrants.

177Prices and Inflation
KeroseneKerosene has traditionally been used to meet the lighting and cooking needs, especially in rural areas. Government has decided to phase out use of kerosene for cooking and lighting in view of the increasing coverage of electricity for lighting needs and LPG as a clean cooking fuel. Post Saubhagya (Pradhan Mantri Sahaj bijli har ghar yojana) and Pradhan Mantri Ujjwala Yojana the use of kerosene is steadily going down.
Out of 37 states/UTs, 11 states/UTs2 are kerosene free i.e no PDS Kerosene is allocated to these states/UTs by Ministry of Petroleum and Natural Gas (MOP&NG). The balance states/UTs are allocated PDS Kerosene by MOP&NG on a quarterly basis. Kerosene is distributed through PDS and is sold at market price with zero central subsidy. The allocation varies from State to State depending on factors like LPG penetration, non-lifting of PDS Kerosene, voluntary requests for surrender/reduction. State Government of Tamil Nadu is still subsidizing kerosene through state subsidy.
Effective from 1st March, 2020, the retail selling price of PDS Kerosene is being maintained at NIL under-recovery level on pan India basis and is made available to the states at market prices.
Figure 3A: PDS Kerosene Prices
0
10
20
30
40
50
60
01-Apr-19
01-May-19
01-Jun-19
01-Jul-19
01-Aug-19
01-Sep-19
01-Oct-19
01-Nov-19
01-Dec-19
01-Jan-20
01-Feb-20
01-Mar-20
01-Apr-20
01-May-20
01-Jun-20
01-Jul-20
01-Aug-20
01-Sep-20
01-Oct-20
01-Nov-20
01-Dec-20
01-Jan-21
01-Feb-21
01-Mar-21
01-Apr-21
01-May-21
01-Jun-21
01-Jul-21
01-Aug-21
01-Sep-21
01-Oct-21
01-Nov-21
Rs/Ltr
Kolkata Mumbai Chennai
Source: MoPNG
Rural -- Urban inflation differential
5.19 The large gap witnessed between rural and urban CPI inflation from July 2018 to December 2019 was largely on account of differential rates of food inflation. The gap, however, declined in 2020 (Figure 13). In 2020, CPI-Urban inflation moved closely with CPI-Rural inflation.
5.20 We observe two main divergence points- November 2020 to March 2021, and in September 2021 onwards. The dominant factor in divergence pattern turns out to be ‘food and beverages’ group. This is mainly on account of large weights that have been assigned to ‘food and beverages’ group in both CPI rural and urban (Figure 14). Inflation of ‘fuel and light’ in rural areas has been different from urban areas mainly because of different fuel consumption patterns in the two sectors. However, it doesn’t emerge as the dominant factor in diverging patterns of CPI-Rural and CPI-Urban mainly because of low weights assigned in the overall index.
2Andhra Pradesh, Arunachal Pradesh, Chandigarh, Dadra & Nagar Haveli, Daman and Diu, Delhi, Haryana, Pudu-cherry, Punjab, Rajasthan and Uttar Pradesh

178 Economic Survey 2021-22
Figure 13: CPI Rural and Urban Inflation
0
1
2
3
4
5
6
7
8
9
Feb-18
Apr-18
Jun-18
Aug-18
Oct-18
Dec-18
Feb-19
Apr-19
Jun-19
Aug-19
Oct-19
Dec-19
Feb-20
Apr-20
Jun-20
Aug-20
Oct-20
Dec-20
Feb-21
Apr-21
Jun-21
Aug-21
Oct-21
Dec-21
Infla
tion
rate
(yoy
) (pe
r cen
t)Rural Urban
Source: NSO, MoSPI
Figure 14: ‘Food & Beverages’ Inflation in Rural and Urban
0
2
4
6
8
10
12
Apr
-20
May
-20
Jun-
20
Jul-2
0
Aug
-20
Sep-
20
Oct
-20
Nov
-20
Dec
-20
Jan-
21
Feb-
21
Mar
-21
Apr
-21
May
-21
Jun-
21
Jul-2
1
Aug
-21
Sep-
21
Oct
-21
Nov
-21
Dec
-21
Infla
tion
rate
(yoy
) (pe
r cen
t)
Food and beverages-Rural Food and beverages-Urban
Source: NSO, MoSPI
Trends in Wholesale Price Index based Inflation
5.21 WPI inflation during the current financial year, in contrast to the trends observed in CPI-C inflation, has shown an increasing trend, and remained high (Figure 15). WPI inflation has been benign during 2020-21 and 2019-20 while being moderate or low in the preceding years. Therefore, part of the high inflation in WPI being witnessed currently could be because of a low base in the previous year.
5.22 While WPI inflation has been higher in the current financial year compared to the previous year in all the three major groups, it was above 20 per cent in ‘fuel and power’ group reflecting the high international petroleum prices as mentioned earlier (Table 3). Within the primary articles group, ‘crude petroleum & natural gas’ sub-group has witnessed very high inflation and stood at 55.7 per cent in December 2021. Similarly, minerals has witnessed high inflation throughout the year. Impact of rising international prices in WPI manufacturing was clearly visible, especially in manufacture of basic metals (Box 4). Manufacture of basic metals saw

179Prices and Inflation
inflation of 27.3 per cent in 2021-22 (April-December). Within manufactured food products, edible oils were a major contributor. During 2021-22 (April to December), edible oils inflation in WPI was 36.4 per cent. As mentioned earlier, the high import dependence on edible oils has meant that high international prices in these products are also reflected in the domestic prices. Inflation in manufacture of textiles also remained high at 15.3 per cent during this period pushed up by the rise in the prices of textile fibres.
Figure 15: Trend in WPI – All commodities, Food and Non-food manufactured products inflation
-10
-5
0
5
10
15
20
Apr
-14
Aug
-14
Dec
-14
Apr
-15
Aug
-15
Dec
-15
Apr
-16
Aug
-16
Dec
-16
Apr
-17
Aug
-17
Dec
-17
Apr
-18
Aug
-18
Dec
-18
Apr
-19
Aug
-19
Dec
-19
Apr
-20
Aug
-20
Dec
-20
Apr
-21
Aug
-21
Dec
-21
Infla
tion
Rat
e (y
oy) (
per c
ent)
All commodities Food Non-food manufactured
Source: Office of Economic Adviser, DPIIT
Table 3: Inflation in selected groups of WPI- Base 2011-12 (in per cent) Weight 2019-
202020-
212020-21^
2021-22#
Apr-21
May-21
Jun- 21
Jul- 21
Aug- 21
Sep-21
Oct-21
Nov-21(P)
Dec-21(P)
All Commodities
100 1.7 1.3 0.0 12.5 10.7 13.1 12.1 11.6 11.6 11.8 13.8 14.2 13.6
Primary Articles 22.6 6.8 1.7 1.3 8.6 9.9 9.4 8.6 6.3 5.9 6.0 7.4 10.3 13.4
Food articles 15.3 8.4 3.2 4.0 2.5 4.6 4.2 3.3 0.1 -0.8 -2.6 1.0 4.9 9.6
Cereals 2.8 7.5 -2.6 -1.4 0.1 -3.1 -2.6 -2.8 -2.9 -1.1 1.3 3.2 4.0 5.1
Pulses 0.6 15.9 11.6 12.1 8.1 10.7 12.1 11.6 8.4 9.5 9.3 5.0 2.9 3.9
Vegetables 1.9 31.1 3.4 7.6 -6.6 -9.0 -7.2 -0.8 -8.3 -12.6 -32.3 -17.4 3.9 31.6
Non-Food Articles
4.1 4.6 1.3 -0.4 20.4 15.6 18.4 18.6 22.9 28.7 29.5 18.4 13.8 19.0
Minerals 0.8 13.2 6.8 3.5 15.3 20.6 13.3 15.3 12.6 7.2 30.8 16.6 20.9 3.8
Crude Petroleum & Natural Gas
2.4 -7.6 -17.4 -25.2 57.9 80.8 59.5 47.0 42.3 34.5 49.0 86.4 76.6 55.7
Fuel & power 13.2 -1.8 -8.0 -11.6 31.4 21.3 36.7 29.3 27.0 28.2 29.5 38.6 39.8 32.3
Manufactured Products
64.2 0.3 2.8 1.5 11.3 9.4 11.3 11.0 11.5 11.6 11.6 12.9 11.9 10.6
Food products 9.1 4.1 5.6 5.0 12.5 13.1 15.6 13.3 13.1 12.7 12.9 12.8 10.3 8.7
Edible oils 2.6 1.5 20.3 17.5 36.4 44.5 51.9 43.6 42.7 40.7 37.4 33.2 23.2 16.8
Food Index 24.4 6.9 4.0 4.3 5.9 7.5 8.2 6.7 4.5 3.8 2.6 4.3 6.7 9.2
Non-Food manufactured products (Core)
55.1 -0.4 2.2 0.8 11.1 8.7 10.4 10.5 11.1 11.3 11.3 12.9 12.3 11.0
Source: Office of the Economic Adviser, DPIIT P: Provisional ^April to December 2020; #April to December 2021

180 Economic Survey 2021-22
Divergence between WPI and CPI based Inflation rates
5.23 The year-on-year inflation rate based on the WPI and the CPI-C has recorded a divergence since June 2019. Between June 2019 and February 2021, wholesale inflation was lower than retail inflation, while between March 2021 and December 2021, wholesale inflation remained above the retail inflation. WPI inflation during the current year was higher than the CPI but there was also a significant widening of the divergence (Figure 16). In December 2021, WPI based inflation rate was 8 percentage points higher than the retail inflation. This trend raises the potential question: Why is CPI inflation diverging from WPI inflation with WPI inflation being higher than CPI inflation?
5.24 Consequent to the impact of the COVID-19 pandemic, production activity remained muted in 2020-21 and global crude oil prices reached record lows due to lack of demand. Therefore, the WPI based inflation rate touched a low of 1.3 per cent in 2020-21. With economic activity picking up in 2021-22 and edging up of global crude oil prices, the low base of 2020-21 led to WPI inflation reaching a peak of 14.2 per cent in November 2021 and 12.5 per cent during April-December 2021 (as against 0.04 per cent during April-December 2020-21). Therefore, the high WPI based inflation rate in 2021, is largely attributable to the low base of the preceding year. On the other hand, retail inflation that had remained high during 2020-21 due to supply chain disruptions and high food inflation, moderated in 2021-22 on account of effective supply side management, resulting in a divergence between WPI and CPI based inflation.
Figure 16: Divergence between YoY inflation in CPI and WPI
-6
-4
-2
0
2
4
6
8
10
12
14
16
Feb-
19
Apr
-19
Jun-
19
Aug
-19
Oct
-19
Dec
-19
Feb-
20
Apr
-20
Jun-
20
Aug
-20
Oct
-20
Dec
-20
Feb-
21
Apr
-21
Jun-
21
Aug
-21
Oct
-21
Dec
-21
Infla
tion
Rat
e (y
oy)
(per
cen
t)
CPI(YoY) WPI(YoY)
Source: NSO, MoSPI and OEA, DPIIT
5.25 While the base effect could be one of the reasons for the divergence in the WPI and CPI, the current divergence in the two indices can also be explained through the conceptual difference in their purpose and design and the price behavior of the different components of the two indices. CPI reflects the buying behaviour of consumers, derived based on the household consumption patterns using NSS Household Consumer Expenditure Survey, and reflects price movements at the retail level. On the other hand, WPI based inflation rate is based on the share of the respective items in total wholesale transactions in the economy at the first point of sale. Therefore, while the weights of items in CPI-C are based on the consumption pattern

181Prices and Inflation
of consumers and households, in case of WPI series, weights of the item basket are derived by calculating the net traded value to the domestic production by adding net imports to domestic production.
5.26 The weights and the importance of specific commodity groups vary significantly in the CPI and WPI. While in CPI, food and beverages have the highest weight (45.9), in WPI, the manufactured group has the highest weight (64.2). The weight of fuel group is much lower in CPI (6.8) as compared to WPI (13.2). Fuel in CPI is also partially reflected under miscellaneous group under ‘transport and communication’. The miscellaneous group in CPI, which makes up about a fourth of the index (28.3), includes services like education, health, recreation, and goods such as gold jewellery. Services are not included in WPI.
5.27 Retail food inflation rose sharply during 2020 due to supply chain disruptions. As supply-side bottlenecks eased and effective supply side measures were taken particularly for items like pulses and edible oils for which imports have been high, food inflation witnessed a decline in 2021 and was 4.0 per cent in December 2021. Average food inflation is at a low of 2.9 per cent in 2021-22 (April-December) as against 9.1 per cent in the corresponding period last year. As against a weight of 45.9 in CPI, food articles have a weight of only 24.4 in the WPI (Food articles in primary group plus those in manufactured group). The high weight of food in the CPI makes CPI more responsive to changes in food prices over WPI.
5.28 As stated above, WPI assigns a large weight to manufactured products and ‘fuel and power’ group. With the near shutdown of industrial activity across nations for long periods on account of the pandemic, energy and inputs demand witnessed a sharp decline and led to a dip in manufactured products inflation. However, with reopening up of the economies worldwide, unanticipated increase in energy prices and emergence of industrial input cost pressure and high freight costs led to a sharp spike in WPI inflation in 2021. This was reflected in high WPI inflation in the fuel group and manufactured sector during the year. Thus, while on the one hand, low food inflation pulled down CPI, on the other hand high energy and input prices pulled up WPI based inflation rate (Figure 17).
Figure 17: YoY Inflation cycles in retail food and wholesale energy prices
-30.0
-20.0
-10.0
0.0
10.0
20.0
30.0
40.0
50.0
Feb-
19
Apr
-19
Jun-
19
Aug
-19
Oct
-19
Dec
-19
Feb-
20
Apr
-20
Jun-
20
Aug
-20
Oct
-20
Dec
-20
Feb-
21
Apr
-21
Jun-
21
Aug
-21
Oct
-21
Dec
-21
Infla
tion
rate
(yoy
) (p
er c
ent)
CPI_Food & beverages(YoY) WPI_Fuel and Power(YoY)
Source: NSO, MoSPI and OEA, DPIIT

182 Economic Survey 2021-22
5.29 The manufactured sector not only uses crude oil but also several other imported items as inputs such as iron ore, aluminium, other metals and cotton. The intermediate and inputs items of WPI, not part of CPI, play a role in its divergence from CPI. The spike in global prices of various input items which have a high import share, would significantly impact WPI (Box 4), and not CPI.
5.30 While inflation in CPI subgroup ‘transport and communication’, which includes the petrol and diesel for vehicle, steadily inched up, WPI’s sub-group ‘fuel and power’, which includes petrol and diesel, remained very volatile (Figure 18). The contribution of fuel group in WPI inflation was higher on account of their higher weight in the index as compared to that of subgroup ‘transport and communication’ in the CPI. (Figure 18)
Figure 18: Diversion between retail and wholesale energy inflation rates
-30
-20
-10
0
10
20
30
40
50
Feb-
19
Apr
-19
Jun-
19
Aug
-19
Oct
-19
Dec
-19
Feb-
20
Apr
-20
Jun-
20
Aug
-20
Oct
-20
Dec
-20
Feb-
21
Apr
-21
Jun-
21
Aug
-21
Oct
-21
Dec
-21
Infla
tion
Rat
e (y
oy)
(per
cen
t)
CPI_Transport and communication(YoY) WPI_Fuel and Power(YoY)
Source: NSO, MoSPI and OEA, DPIIT
5.31 The decline in wholesale prices of petrol and diesel in 2020 (it excludes taxes and levies), due to the decline of crude oil demand, created the low base for wholesale inflation during 2021, while, retail inflation of petrol and diesel was impacted by the higher excise duties that were levied as revenues from other sources dried up due to disruption of economic activity. With the revival of economic activity in 2021-22, crude oil prices started inching up. In November 2021, a reduction in central excise duty was announced for diesel and petrol. While this cut in central excise duties and subsequent reduction in VAT by majority of the states had a dampening effect on retail prices of diesel and petrol, wholesale prices continued to reign high resulting in the widening of the divergence (Figure 19 & 20).

183Prices and Inflation
Figure 19: Retail and wholesale inflation rate of Petrol
-40
-20
0
20
40
60
80
100
Apr
-19
Jun-
19
Aug
-19
Oct
-19
Dec
-19
Feb-
20
Apr
-20
Jun-
20
Aug
-20
Oct
-20
Dec
-20
Feb-
21
Apr
-21
Jun-
21
Aug
-21
Oct
-21
Dec
-21
Infla
tion
rate
(yoy
) (pe
r cen
t) WPI Petrol CPI petrol for vehicle
Source: NSO, MoSPI and OEA, DPIIT Note: Item level index for CPI petrol for vehicle was not available for March-May 2020.
Table 20: Retail and wholesale inflation rate of Diesel
-60
-40
-20
0
20
40
60
80
100
Apr
-19
Jun-
19
Aug
-19
Oct
-19
Dec
-19
Feb-
20
Apr
-20
Jun-
20
Aug
-20
Oct
-20
Dec
-20
Feb-
21
Apr
-21
Jun-
21
Aug
-21
Oct
-21
Dec
-21
Infla
tion
Rat
e (y
oy) (
per c
ent)
WPI HSD CPI diesel for vehicle
Source: NSO, MoSPI and OEA, DPIIT Note: Item level index for CPI diesel for vehicle was not available for March-May 2020.
5.32 Another reason for divergence is the lagging demand pick up. While production has gradually picked up in 2021-22 to reach the pre-pandemic levels, consumption demand is yet to normalise fully. With weak pass on, the divergence between WPI and CPI is increasing but is expected to wane gradually with the weakening of the base effect.

184 Economic Survey 2021-22
Box 4: Global commodity prices and domestic inflation
International commodity prices rose sharply during the second half of 2020 and 2021. Fluctuations have been more in energy prices. After registering negative growth during the COVID-19 period, the energy index has recorded triple digit growth in 5 out of 12 months since January 2021 (Figure 4A). Food and metals and mineral prices have shown double digit growth during the current year.
Figure 4A: Year on year growth in international commodity price indices
-66
-40
-14
12
38
64
90
116
142
168
Feb-
19
Apr
-19
Jun-
19
Aug
-19
Oct
-19
Dec
-19
Feb-
20
Apr
-20
Jun-
20
Aug
-20
Oct
-20
Dec
-20
Feb-
21
Apr
-21
Jun-
21
Aug
-21
Oct
-21
Dec
-21
(yoy
) (pe
r cen
t)
EnergyFoodMetals & Minerals
Source: World Bank commodity price indices
While inflation in food items in India remained under control because of supply-side management, high global prices of manufacturing items have had an impact on the domestic prices, especially basic metals. The rise in demand for vehicles, manufactured goods, and pickup in construction activities have led to the rise of global aluminium prices. Due to environmental concerns, China, a major exporter of aluminium, has curtailed its production.
Copper prices have increased through the initial months of 2021. The increase in prices is also because of extraordinary global uptake in consumer goods and demand from China due to its enhanced investment in infrastructure and construction. Falling inventories and threats of strikes in Chile and Peru has elevated production risks and created pressure on copper prices (World Bank, 2021).
The initial surge of iron ore prices largely reflected the robust demand for steel production in China, leading to higher iron ore imports. However, recently decline in prices has been observed. Iron ore supplies have improved in recent months after the earlier weather disruptions in top exporter Australia and coronavirus outbreaks in number two shipper Brazil.3
3https://www.reuters.com/world/americas/iron-ore-makes-unruly-retreat-more-normal-price-levels-russell-2021-09-20/

185Prices and Inflation
Tin prices surged by more than 33 per cent in the first quarter, reaching a 10-year high in March 2021. Prices were lifted by buoyant demand for tin solder in consumer electronics, as well as supply disruptions due to lockdowns in Bolivia, Peru, and Malaysia, voluntary production cuts in Brazil and Indonesia, and political turmoil in Myanmar (World Bank, 2021a).
International cotton prices have been showing an upward trend since May 2020 and have reached levels higher than those witnessed in the last ten years. Cotton Index price which stood at $1.40/kg in April 2020, has sharply risen to $2.79/kg in November 2021, though it has reduced to $2.65/kg in December 2021. The strengthening of prices of cotton is owing to the improvement in demand for cotton after COVID-19 related contraction witnessed in 2020 (World Bank, 2021b).
Domestic inflation as measured through WPI of related items have been highly correlated with growth in the international prices of these commodities. The inflation in domestic aluminium and copper prices is positively and highly correlated with international prices (Figure 4B).
Figure 4B: International inflation in Aluminium, Copper and WPI inflation in related items (January 2018-December 2021)
-100
10203040506070
-50 0 50 100WPI
infla
tion
in A
lum
iniu
m m
etal
(y
oy)
(per
cen
t)
Growth in international Aluminium price (yoy) (per cent)
Aluminium
Correlation: 0.8
-10-505
101520253035
-50 0 50 100
WPI
infla
tion
in C
oppe
r met
al/C
oppe
r R
ings
(yoy
) (p
er c
ent)
Growth in international Copper price (per cent)
Copper
Correlation: 0.9
Source: World Bank and OEA, DPIIT
India imports most of its consumption of crude oil. As expected, domestic crude oil prices are exclusively related to Indian crude basket prices (Figure 4C). WPI inflation in crude petroleum has a correlation of 0.98 with the YoY growth in price of Indian basket of crude oil.

186 Economic Survey 2021-22
Figure 4C: International inflation in Crude oil and WPI inflation in crude petroleum (January 2018-December 2021)
-100
-50
0
50
100
150
200
250
-100 -50 0 50 100 150 200 250
WPI
infla
tion
in c
rude
pet
role
um (y
oy)(
per c
ent)
YoY growth in Crude Indian basket (per cent)
Correlation: 0.98
Source: PPAC and OEA, DPIIT
India also imports substantial share its consumption of edible oils. Any change in international prices of palm oil gets transmitted into domestic prices as their correlation is around 0.9. (Figure 4D).
Figure 4D: WPI inflation and international inflation in Palm oil (January 2018 – December 2021)
-20.0
-10.0
0.0
10.0
20.0
30.0
40.0
50.0
60.0
70.0
-40.0 -20.0 0.0 20.0 40.0 60.0 80.0 100.0
WPI
infla
tion
in p
alm
oil
(yoy
)(pe
r cen
t)
YoY growth in international Palm oil price (per cent)
Correlation: 0.9
Source: World Bank and OEA, DPIIT
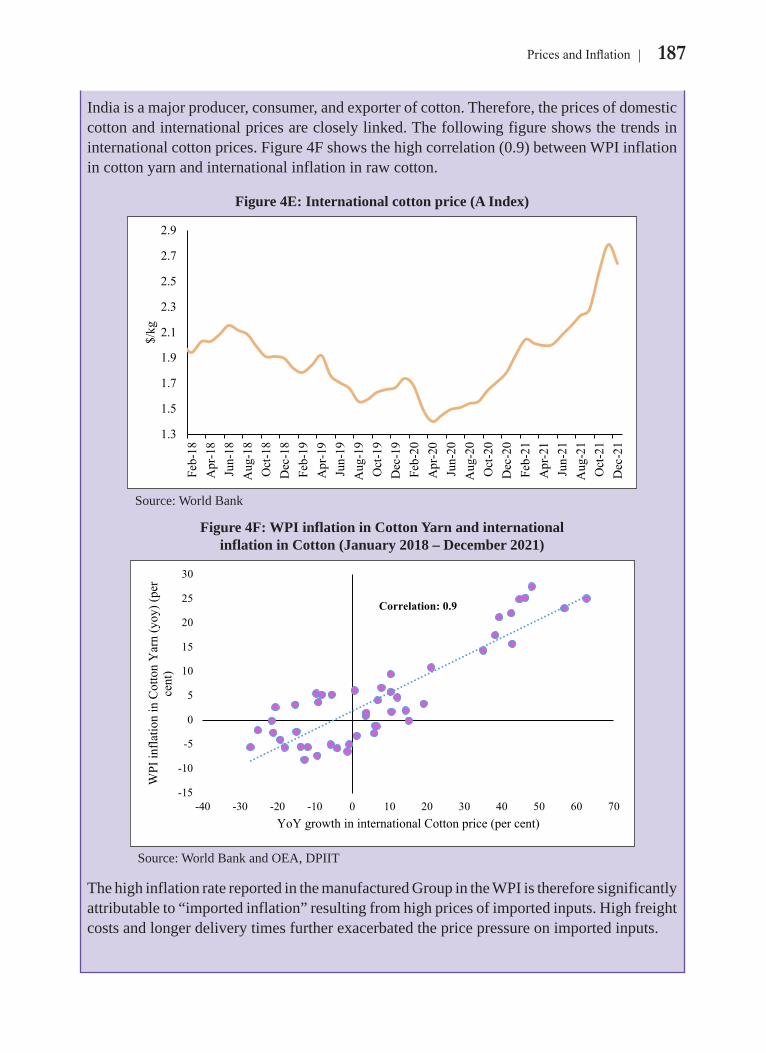
187Prices and Inflation
India is a major producer, consumer, and exporter of cotton. Therefore, the prices of domestic cotton and international prices are closely linked. The following figure shows the trends in international cotton prices. Figure 4F shows the high correlation (0.9) between WPI inflation in cotton yarn and international inflation in raw cotton.
Figure 4E: International cotton price (A Index)
1.3
1.5
1.7
1.9
2.1
2.3
2.5
2.7
2.9
Feb-18
Apr-18
Jun-18
Aug-18
Oct-18
Dec-18
Feb-19
Apr-19
Jun-19
Aug-19
Oct-19
Dec-19
Feb-20
Apr-20
Jun-20
Aug-20
Oct-20
Dec-20
Feb-21
Apr-21
Jun-21
Aug-21
Oct-21
Dec-21
$/kg
Source: World Bank
Figure 4F: WPI inflation in Cotton Yarn and international inflation in Cotton (January 2018 – December 2021)
-15
-10
-5
0
5
10
15
20
25
30
-40 -30 -20 -10 0 10 20 30 40 50 60 70
WPI
infla
tion
in C
otto
n Y
arn
(yoy
) (pe
r ce
nt)
YoY growth in international Cotton price (per cent)
Correlation: 0.9
Source: World Bank and OEA, DPIIT
The high inflation rate reported in the manufactured Group in the WPI is therefore significantly attributable to “imported inflation” resulting from high prices of imported inputs. High freight costs and longer delivery times further exacerbated the price pressure on imported inputs.

188 Economic Survey 2021-22
HOUSING PRICES5.33 The residential housing sector was also affected by COVID-19 induced restrictions through both supply and demand channels. Amidst initial COVID-19 restrictions, not only construction of new houses slowed down, but launch of new housing projects also got delayed. With the loss of income, uncertainty about future income, and stay at home orders, home buyers delayed their housing purchases. After the initial COVID-19 induced restrictions were removed, transactions in housing properties increased significantly, possibly because of pent up demand and improvement in affordability in response to measures taken by government during the pandemic, such as lower interest rates, reduction in circle rates, and cut in stamp duties, that made houses affordable to buyers (Box 5). Besides, several major banks, mortgage companies, and housing finance companies have significantly reduced their interest rates on home loans, that fueled the revival in housing demand. During second COVID-19 wave (April-June, 2021), transactions of housing properties were once again impacted adversely, but not as much as it was seen during first COVID-19 wave (April-June, 2020).
5.34 National Housing Bank (NHB) RESIDEX HPI@Assessment Prices index (Base 2017-18) captures4 the prices of residential housing properties for the transactions through primary lending institutions. Data on composite index for prices and transaction records from NHB have been used to analyze the impact of first and second COVID-19 wave on the housing transactions and prices across a sample of 12 cities.
Box 5: Recent measures taken by government to enhance housing affordability
l Reduction in circle rates and stamp duties by various state governments like Delhi, West Bengal, Maharashtra to boost housing sales.
Tax benefitsl Tax holiday to affordable housing projects until March 31, 2022.
l Eligibility for tax deductions for affordable housing announced in the 2019-20 budget has been extended till March 2022. This tax deduction can be of up to 1.5 lakh rupees and will be provided on interest paid on loans for self-occupied house owners (Budget 2021-22).
Schemes
Pradhan Mantri Awas Yojana – Urban (PMAY-U)l PMAY-U aims to address urban housing shortage among the Economically Weaker Section (EWS)/
4NHB RESIDEX tracks the movement in prices of residential properties in select cities on quarterly basis. From the April-June, 2018 quarter the base year has been shifted to FY 2017-18. The revamped NHB RESIDEX is wider in its geographic coverage and captures two Housing Price Index (HPIs) viz. HPI @ Assessment Prices and HPI @ Market Prices for Under Construction Properties, both for 50 cities. The current data sources are valuation data of Banks and HFCs for HPI @ Assessment Prices and primary & secondary market data for HPI @ Market Prices for Under Construction Properties. The coverage is spread across 21 states in India, including 18 State/UT capitals and 33 smart cities. The housing prices are classified on the basis of carpet area size at city level (INR/sq.ft.) for units under three product category levels namely <=60 sq.m., >60 & <=110 sq.m., and >110 sq.m. The indices are computed using Laspeyres Methodology, followed by calculation of a four Quarter Weighted Moving Average with application of dynamic weights at product category level and static base year weights on the weighted moving average product category level prices, across all the quarters starting from the new base year.

189Prices and Inflation
Low Income Group (LIG) and Middle Income Group (MIG) categories including the slum dwellers by ensuring a pucca house to all eligible urban households by the year 2022.
l Affordable Rental Housing Complexes (AHRCs) for urban migrants/ poor as a sub-scheme under Pradhan Mantri Awas Yojana – Urban (PMAY–U). Existing vacant government funded housing complexes will be converted in ARHCs through Concession Agreements for 25 years. Concessionaire will make the complexes livable by repair/retrofit and maintenance of rooms and filling up infrastructure gaps like water, sewer/ septage, sanitation, road etc. States/UTs will select concessionaire through transparent bidding. Complexes will revert to urban local bodies after 25 years to restart next cycle like the earlier one or run on their own. In addition, special incentives like use permission, 50 per cent additional Floor Area Ratio (FAR)/Floor Space Index (FSI), concessional loan at priority sector lending rate, tax reliefs at par with affordable housing etc. will be offered to private/ public entities to develop ARHCs on their own available vacant land for 25 years.
Credit Linked Subsidy Scheme for Middle Income Groupl The Credit Linked Subsidy Scheme for Middle Income Group (annual Income between Rs 6
- 18 lakhs) being implemented since January 2017, was extended up to March 2021 to benefit 2.5 lakhs middle income families with targeted investment of over Rs 70,000 crore in housing sector under the Atma Nirbhar Programme announced in May 2020. This was also expected to stimulate demand for steel, cement, transport and other construction materials.
5.35 It can be broadly observed from Figure 21 A and 21 B that the response of housing transactions to COVID-19 shock is much higher than the response of housing prices. This implies that shocks to housing sector adjust more through changes in transactions than prices. As price response remains relatively lower than the response of transactions therefore transactions are better indicator to gauge sentiments in the housing market. While house transactions mostly declined during the COVID-19 shocks, their prices did not fall in most of the selected cities, some even increased.
5.36 Further, decline in housing transactions have also been much less during second COVID-19 wave than the decline during first COVID-19 wave. Figure 21 A compares the change in transactions in first COVID-19 wave and during the second-COVID-19 wave from the pre-pandemic levels (April-June, 2019). During first COVID-19 wave housing transactions declined in almost all selected cities. However, during second wave of COVID-19, the housing transactions in many cities such as Mumbai, Thane, Pune, Noida, Hyderabad, and Bengaluru increased relative to the pre-pandemic levels. In cities such as Gandhinagar, Ahmedabad, Chennai, Ranchi, Delhi & Kolkata the housing transactions declined during second COVID-19 wave over the pre-pandemic levels. However, this decline has been much less than the decline during the first COVID-19 wave.
5.37 Unlike the decline in quarterly housing transactions during first and second COVID-19 waves, the impact of the COVID-19 shock on the prices of residential properties was not uniform across the cities. Figure 21B compares the change in price index during the first COVID-19 wave and during the second-COVID-19 wave over the pre-pandemic level. During the first COVID-19 wave, the housing prices increased in cities such as Gandhinagar, Ahmedabad,

190 Economic Survey 2021-22
Hyderabad, Thane, Mumbai, Kolkata, Pune and Bengaluru over the pre-pandemic level, and the housing prices decreased in Delhi, Noida and Ranchi. Similar trends were also visible during the second COVID-19 wave over the pre-pandemic level. The housing prices in cities such as Ahmedabad, Hyderabad, Gandhinagar and Ranchi continued to increase despite the COVID-19 shocks.
Figure 21A: Change in housing transactions in Q1 FY21 (First COVID-19 wave) and
Q1 FY22 (Second COVID-19 wave) over the pre-pandemic levels of Q1 FY20
Figure 21B: Change in housing prices index in Q1 FY21 (First COVID-19 wave) and
Q1 FY22 (Second COVID-19 wave) over the pre-pandemic levels of Q1 FY20
1.4
-37.6
-38.1
-64.5
-66.9
-72.0
-72.2
-72.4
-74.4
-79.8
-82.8
-83.6
40.2
37.9
8.0
-0.9
29.5
23.3
-14.2
-26.0
-62.0
-0.3
-29.7
17.0
-100 -50 0 50
Bengaluru
Hyderabad
Noida
Kolkata
Pune
Thane
Chennai
Delhi
Ranchi
Ahmedabad
Gandhinagar
Mumbai
Transaction change from April-June, 2019 (in per cent)
Second Wave (April-June, 2021)First Wave (April-June, 2020)
-8.5
-4.2
-0.8
0.0
2.7
5.6
6.5
6.7
8.3
12.3
16.5
18.3
-6.0
-3.1
5.9
0.0
5.3
3.7
7.5
0.0
4.6
21.3
28.9
25.8
-20 -10 0 10 20 30 40
Noida
Delhi
Ranchi
Chennai
Bengaluru
Pune
Kolkata
Mumbai
Thane
Hyderabad
Ahmedabad
Gandhinagar
Price change from April-June, 2019 (in per cent)
Second Wave (April-June, 2021)First Wave (April-June, 2020)
Source: NHB
5.38 Between two COVID-19 waves, from June 2020 to April 2021, housing transactions recovered swiftly, as quarterly purchases crossed even the pre-pandemic levels for all the selected cities (Figure 22). This boost in housing demand is possibly because of pent up demand and measures taken by the government to increase affordability. The number of unsold residential units have also witnessed significant drops during the second wave of the pandemic.Figure 23 shows carpet area prices by size of residential properties in selected cities.
Figure 22: Recovery between COVID-19 waves reflected in record count for 12 major cities
02,0004,0006,0008,000
9092949698
100
Jun-
18Se
p-18
Dec
-18
Mar
-19
Jun-
19Se
p-19
Dec
-19
Mar
-20
Jun-
20Se
p-20
Dec
-20
Mar
-21
Jun-
21
Delhi
Composite Index Record Count (RHS)
0
5,000
10,000
15,000
9095
100105110115
Jun-
18Se
p-18
Dec
-18
Mar
-19
Jun-
19Se
p-19
Dec
-19
Mar
-20
Jun-
20Se
p-20
Dec
-20
Mar
-21
Jun-
21
Mumbai
Composite Index Record Count (RHS)

191Prices and Inflation
02,0004,0006,0008,00010,000
90
100
110
120Ju
n-18
Sep-
18D
ec-1
8M
ar-1
9Ju
n-19
Sep-
19D
ec-1
9M
ar-2
0Ju
n-20
Sep-
20D
ec-2
0M
ar-2
1Ju
n-21
Pune
Composite Index Record Count (RHS)
05001,0001,5002,0002,500
90
100
110
120
Jun-
18Se
p-18
Dec
-18
Mar
-19
Jun-
19Se
p-19
Dec
-19
Mar
-20
Jun-
20Se
p-20
Dec
-20
Mar
-21
Jun-
21
Kolkata
Composite Index Record Count (RHS)
0
5,000
10,000
15,000
90110130150170
Jun-
18Se
p-18
Dec
-18
Mar
-19
Jun-
19Se
p-19
Dec
-19
Mar
-20
Jun-
20Se
p-20
Dec
-20
Mar
-21
Jun-
21Ahmedabad
Composite Index Record Count (RHS)
0
5,000
10,000
15,000
90100110120130
Jun-
18Se
p-18
Dec
-18
Mar
-19
Jun-
19Se
p-19
Dec
-19
Mar
-20
Jun-
20Se
p-20
Dec
-20
Mar
-21
Jun-
21
Bengaluru
Composite Index Record Count (RHS)
05001,0001,5002,0002,5003,0003,500
9092949698
100102104106
Jun-
18Se
p-18
Dec
-18
Mar
-19
Jun-
19Se
p-19
Dec
-19
Mar
-20
Jun-
20Se
p-20
Dec
-20
Mar
-21
Jun-
21
Chennai
Composite Index Record Count (RHS)
02,0004,0006,0008,00010,00012,00014,000
90100110120130140150160
Jun-
18Se
p-18
Dec
-18
Mar
-19
Jun-
19Se
p-19
Dec
-19
Mar
-20
Jun-
20Se
p-20
Dec
-20
Mar
-21
Jun-
21
Hyderabad
Composite Index Record Count (RHS)
0
50
100
150
200
250
100
105
110
115
120
125
130
Jun-
18Se
p-18
Dec
-18
Mar
-19
Jun-
19Se
p-19
Dec
-19
Mar
-20
Jun-
20Se
p-20
Dec
-20
Mar
-21
Jun-
21
Ranchi
Composite Index Record Count (RHS)
0200400600800100012001400160018002000
90
95
100
105
110
115
120
125
Jun-
18Se
p-18
Dec
-18
Mar
-19
Jun-
19Se
p-19
Dec
-19
Mar
-20
Jun-
20Se
p-20
Dec
-20
Mar
-21
Jun-
21
Noida
Composite Index Record Count (RHS)

192 Economic Survey 2021-22
0
100
200
300
400
500
600
100
110
120
130
140
150
160Ju
n-18
Sep-
18D
ec-1
8M
ar-1
9Ju
n-19
Sep-
19D
ec-1
9M
ar-2
0Ju
n-20
Sep-
20D
ec-2
0M
ar-2
1Ju
n-21
Gandhinagar
Composite Index Record Count (RHS)
0
1,000
2,000
3,000
4,000
5,000
90
95
100
105
110
115
120
Jun-
18Se
p-18
Dec
-18
Mar
-19
Jun-
19Se
p-19
Dec
-19
Mar
-20
Jun-
20Se
p-20
Dec
-20
Mar
-21
Jun-
21
Thane
Composite Index Record Count (RHS)
Source: NHB
Figure 23: Carpet Area Prices by Size of Residential Properties
3,000
3,500
4,000
4,500
5,000
5,500
6,000
Jun-
18Se
p-18
Dec
-18
Mar
-19
Jun-
19Se
p-19
Dec
-19
Mar
-20
Jun-
20Se
p-20
Dec
-20
Mar
-21
Jun-
21
Rs p
er S
q Ft
Rise in prices of Small Residential Properties
Ranchi Gandhinagar Noida
13,00015,00017,00019,00021,00023,00025,000
3,000
4,000
5,000
6,000
7,000
8,000Ju
n-18
Sep-
18D
ec-1
8M
ar-1
9Ju
n-19
Sep-
19D
ec-1
9M
ar-2
0Ju
n-20
Sep-
20D
ec-2
0M
ar-2
1Ju
n-21
Rs p
er S
q Ft
Rs p
er S
q Ft
Decline in prices Small Residential Properties
Delhi Thane (RHS) Mumbai (RHS)
2,0004,0006,0008,000
10,00012,00014,000
Jun-
18Se
p-18
Dec
-18
Mar
-19
Jun-
19Se
p-19
Dec
-19
Mar
-20
Jun-
20Se
p-20
Dec
-20
Mar
-21
Jun-
21
Rs P
er S
q Ft
Rise in prices of Medium Residential properties
Ranchi Gandhinagar
Delhi
14,00016,00018,00020,00022,00024,00026,00028,000
2,000
3,000
4,000
5,000
6,000
7,000
Jun-
18Se
p-18
Dec
-18
Mar
-19
Jun-
19Se
p-19
Dec
-19
Mar
-20
Jun-
20Se
p-20
Dec
-20
Mar
-21
Jun-
21
Rs P
er S
q Ft
Rs P
er S
q Ft
Decline in prices of Medium Residential properties
Noida Thane (RHS) Mumbai (RHS)

193Prices and Inflation
1,5003,5005,5007,5009,500
11,50013,50015,50017,500
Jun-
18Se
p-18
Dec
-18
Mar
-19
Jun-
19Se
p-19
Dec
-19
Mar
-20
Jun-
20Se
p-20
Dec
-20
Mar
-21
Jun-
21
Rs P
er S
q Ft
Rise in prices of Large Residential Properties
Ranchi Gandhinagar
Delhi Noida
1,5006,500
11,50016,50021,50026,50031,50036,500
Jun-
18Se
p-18
Dec
-18
Mar
-19
Jun-
19Se
p-19
Dec
-19
Mar
-20
Jun-
20Se
p-20
Dec
-20
Mar
-21
Jun-
21
Rs P
er S
q Ft
Decline in prices of Large Residential properties
Thane Mumbai
Source: NHBNote: Small size = [<=60 sq.mt.(646 sq.ft)]; Medium= [>60 sq.mt.(646 sq.ft) and <=110 sq.mt.(1184 sq.ft)]; Large properties (>110 sq.mt.(1184 sq.ft)).
PHARMACEUTICAL PRICING5.39 Government regulates pricing of drugs to ensure availability and accessibility of medicines at affordable prices. National Pharmaceutical Pricing Authority (NPPA), an attached office of the Department of Pharmaceuticals (DoP), is mandated to regulate the prices of drugs.
5.40 Several steps have been taken to ensure the affordability of drugs and medical devices. Ceiling prices for 355 medicines and 886 formulations were fixed for medicines under National List of Essential Medicines, 2015 (Schedule-I of Drug Price Control Order (DPCO), 2013) until 31 December 2021. Retail prices for approximately 1798 formulations were fixed under DPCO, 2013 till 31 December 2021. During the recent years, exercising extraordinary powers under DPCO, 2013 in public interest, prices of coronary stents and knee implants have also been fixed. NPPA also capped the trade margin up to 30 per cent on selected 42 anti-cancer non-schedule medicine on pilot basis in February, 2019.
COVID-19 Initiatives:l Based on recommendations of Standing Committee on Affordable Medicines and Health
Products (SCAMHP), NITI Aayog, NPPA capped the trade margin for Oxygen Concentrators at 70 per cent on Price to Distributor (PTD) level on 3rd June 2021.
l Trade margins on Pulse Oximeter, Glucometer, Blood Pressure Monitor, Nebulizer and Digital Thermometer were also capped on July 13, 2021. As a result, most of the brands of these devices have dropped prices up to 89 per cent.
l Most of drugs used for COVID management are scheduled drugs for which ceiling price has been given by NPPA. Even in the case of a few non-scheduled medicines like Remdesivir,

194 Economic Survey 2021-22
which are part of COVID-19 protocol, on Government intervention, MRPs of various brands of Remdesivir have been reduced voluntarily by the major manufacturers/marketers.
l Multi-pronged approach is followed to monitor and coordinate equitable distribution of Remdesivir, Tocilizumab and Amphotericin.
l The availability of key medicines is also being monitored through regular surveys being conducted at chemist shops at various locations across the country by DCG(I). The same is also being supplemented w.e.f. May 2021 through weekly availability surveys of COVID-19 management drugs conducted by the Price Monitoring and Resource Units (PMRUs).
LONG TERM PERSPECTIVE FOR MANAGEMENT OF SUPPLY SIDE FACTORSGiven the importance of supply-side factors in having a predominance in determination of inflation in India, long-term policies are likely to help. 1. Changing Production Patterns: Encouraging farmers to shift from cultivation of rice and
wheat to pulses and oilseeds would help ensure that the country is self-reliant in pulses and oilseeds and also assist in reducing import dependence. Shift in cultivation towards pulses would also enable the government to maintain realistic buffer stocks of rice and wheat. Recently, government has been prioritizing increasing production of pulses and oilseeds through area expansion, productivity through HYVs, MSP support and procurement.
2. Calibrated Import Policy: Knee jerk reactions to price rise of essential commodities like pulses and edible oils through frequent import duty/tariff revisions though providing immediate relief to the consumers in the way of lower prices, send wrong signals to domestic producers and create an environment of uncertainty. A long-term consistent approach is mandated. A step in this direction has been taken by the government where five year MoUs have been signed with Myanmar for annual import of 2.5 LMT of Urad and 1 LMT of Tur, with Malawi for annual import of 1 LMT of Tur, and MoU with Mozambique for annual import of 2 LMT Tur has been extended by another five years. These MoUs will ensure predictability in the quantity of pulses being produced abroad and exported to India, thus benefiting both India and the pulse exporting country.
3. Focus on transportation and storage infrastructure for perishable commodities: Better storage and supply chain management is required to ensure availability in lean season and reduced wastages of horticulture and other perishable essential commodities to reduce the seasonal spikes in prices for consumers, glut for the farmers in times of good harvests due to lack of marketing infrastructure, resulting in distress sales. Effective utilisation of Agriculture Infrastructure Fund for investment in viable projects for post-harvest management infrastructure for perishable commodities can help improve agriculture infrastructure in the country. Schemes like Operation Green and Kisan Rail need to be exploited further to protect the interests of the farmers as well as the consumers .

195Prices and Inflation
REFERENCES1. FAO. 2021. “FAO Food Price Index rises further in September”. Food and Agriculture
Organisation of the United Nations. Accessed from: https://www.fao.org/newsroom/detail/fao-food-price-index-rises-further-07-10-2021/en
2. IMF. 2022. “World Economic Outlook, January 2022”. International Monetary Fund. 3. PIB. 2021. “In order to reduce the edible oil prices, Center reduces the duty on Crude Palm
Oil (CPO) by 5%. Press Information Bureau, Government of India”. Accessed from: https://pib.gov.in/PressReleasePage.aspx?PRID=1731715
4. World Bank. 2021a. “Commodity Markets Outlook, April 2021”5. World Bank. 2021b. “Commodity Markets Outlook, October 2021”6. Cleveland, R. B., Cleveland, W. S., McRae, J. E., & Terpenning, I. J. (1990). “STL: A
seasonal-trend decomposition procedure based on loess.”, Journal of Official Statistics, 6(1), 3–33.
7. Reserve Bank of India. Monthly Bulletins

CHAPTER
06
In 2020-21, India progressed further on achieving the Sustainable Development Goals (SDGs). India’s overall score on the NITI Aayog SDG India Index & Dashboard 2020-21 improved to 66 from 60 in 2019-20 and 57 in 2018-19. The number of Front Runners (scoring 65-99) increased to 22 states and UTs in 2020-21 from 10 in 2019-20. Kerala and Chandigarh were the top state and UT respectively on SDG performance in 2020-21. In North East India, 64 districts were Front Runners and 39 districts were Performers in the NITI Aayog North-Eastern Region District SDG Index 2021-22.
India has the tenth largest forest area in the world. In 2020, India ranked third globally in increasing its forest area during 2010 to 2020. The forests covered 24 per cent of India’s total geographical, accounting for two per cent of the world’s total forest area in 2020. India’s forest cover has increased by more than three per cent during 2011 to 2021. This is mainly attributed to increase in very dense forest, which grew by 20 per cent during the period.
In August 2021, the Plastic Waste Management Amendment Rules, 2021 was notified which is aimed at phasing-out single use plastic by 2022. The draft regulation on the Extended Producer Responsibility for plastic packaging has been notified. The regulation seeks to strengthen the circular economy of plastic packaging waste, promote development of new alternatives to plastics and sustainable plastic packaging.
The chapter discusses ground water resource management and the findings indicate that states/UTs need to manage its ground water resources carefully, including recharge, and to stem over-exploitation. The compliance status of Grossly Polluting Industries (GPIs) located in the Ganga main stem and its tributaries improved from 39 per cent in 2017 to 81 per cent in 2020. The consequent reduction in effluent discharge has been from 349.13 milllions of liters per day (MLD) in 2017 to 280.20 MLD in 2020.
India had announced its first Nationally Determined Contribution (NDC) under the Paris Agreement in 2015. The Hon’ble Prime Minister of India, as a part of the national statement delivered at the 26th Conference of the Parties (COP 26) in Glasgow in November 2021, announced ambitious targets to be achieved by 2030 to enable further reduction in emissions. The need to start the one-word movement ‘LIFE’ which means Lifestyle For Environment urging mindful and deliberate utilization instead of mindless and destructive consumption was underlined.
Sustainable Development and Climate Change

197Sustainable Development and Climate Change
INDIA’S PROGRESS ON SUSTAINABLE DEVELOPMENT GOALS6.1 In September 2015, 193 countries including India committed to the Sustainable Development Goals (SDGs) as detailed in the UN resolution, “Transforming our world: the 2030 Agenda for Sustainable Development”. The SDGs comprehensively cover social, economic and environmental dimensions and build on the Millennium Development Goals (MDGs), which covered the earlier fifteen-year period from 2000 to 2015.
6.2 India has been making strides towards achieving the social, economic and environmental goals covered under SDGs. This achievement gains further significance in the face of the considerable human and economic costs imposed by the COVID-19 pandemic, which has set countries back on their developmental goals and created serious impediments to the attainment of the SDGs, the world over.
Goal wise performance of India as a whole: NITI Aayog SDG India Index Report and Dashboard 2020-216.3 India’s overall score on the NITI Aayog SDG India Index & Dashboard improved to 66 in 2020-21 from 60 in 2019-20 and 57 in 2018-19, showing progress in India’s journey towards achieving the SDGs (see Box 1 for details about the NITI Aayog SDG India Index). Despite 2020-21 being a pandemic year, India performed well on eight of the 15 SDGs measured by the NITI Aayog SDG India Index. These included – goal 3 (good health and well-being), goal 6 (clean water and sanitation), goal 7 (affordable and clean energy), goal 10 (reduced inequalities), goal 11 (sustainable cities and communities), goal 12 (responsible consumption and production), goal 15 (life on land) and goal 16 (peace, justice, and strong institutions).
Box 1: NITI Aayog SDG India Index and Dashboard 2020-21
India’s federal structure implies that states must take charge to enable progress on achieving the country’s SDGs. The NITI Aayog SDG India Index is the world’s first government-led sub-national measure of SDG progress. It has been developed to capture the progress of all states and union territories (UTs) in their journey towards achieving the SDGs. This index recognizes that action is required at all levels, and it is therefore based on the approach of cooperative and competitive federalism.
In 2021, India continued exercising significant climate leadership at the international stage under the International Solar Alliance (ISA), Coalition for Disaster Resilient Infrastructure (CDRI) and Leadership Group for Industry Transition (LeadIT Group). The chapter also discusses several initiatives taken in the area of sustainable finance by the Ministry of Finance, RBI and SEBI.

198 Economic Survey 2021-22
NITI Aayog has been publishing the SDG India Index annually since 2018. The third edition of the NITI Aayog SDG India Index (2020-21) computes goal-wise scores on the 16 SDGs for each state and UT, and a qualitative assessment on Goal 17, covering:
SDG 1: No Poverty SDG 9: Industry, Innovation and InfrastructureSDG 2: Zero Hunger SDG 10: Reduced InequalitySDG 3: Good Health and Well-Being SDG 11: Sustainable Cities and CommunitiesSDG 4: Quality Education SDG 12: Responsible Consumption and ProductionSDG 5: Gender Equality SDG 13: Climate ActionSDG 6: Clean Water and Sanitation SDG 14: Life Below Water (calculated only for
the nine coastal states – Gujarat, Maharashtra, Goa, Karnataka, Kerala, Tamil Nadu, Andhra Pradesh, Odisha and West Bengal)
SDG 7: Affordable and Clean Energy SDG 15: Life on LandSDG 8: Decent Work and Economic Growth SDG 16: Peace, Justice and Strong Institutions
SDG 17: Global Partnerships
Overall state and UT scores are generated from goal-wise scores to measure aggregate performance of the sub-national unit based on its performance across the 16 SDGs. These scores range between 0–100, with states/UTs being categorised as Aspirant (score 0-49), Performer (score 50-64), Front Runner (65-99) and Achiever (score 100) based on their score.
The figure below depicts the evolution of the NITI Aayog SDG India Index since its first baseline report in 2018. The 2018 baseline assessment is not strictly comparable with later assessments due to its lower coverage of targets and indicators.
Evolution of the NITI Aayog SDG India Index
Source: NITI AayogNote: Ministry of Statistics and Programme Implementation (MoSPI) has developed the National Indicator Framework (NIF) comprising 306 statistical indicators for monitoring of SDGs at the national level

199Sustainable Development and Climate Change
Performance of States and UTs on the NITI Aayog SDG India Index, 2021 6.4 Figure 1 shows that the number of Front Runners (scoring 65-99) increased to 22 states and UTs in 2020-21 from 10 in 2019-20. All remaining states and UTs were Performers (scoring 50-64). Amongst states, additions to the Front Runner category in 2020-21 included Uttarakhand, Gujarat, Maharashtra, Mizoram, Punjab, Haryana and Tripura. Amongst UTs, additions to the Front Runner category included Andaman and Nicobar Islands, Delhi, Jammu and Kashmir, Ladakh and Lakshadweep.
Figure 1: Performance of States/UTs on the NITI Aayog SDG India Index (2019 and 2020)
Source: NITI AayogNote: Yellow indicates Performer (Score 50-64), Green indicates Front Runner (Score 65-99)
6.5 Figure 2 shows the scores achieved by states on the NITI Aayog SDG India Index 2020-21, and change in score from 2019-20. In 2020-21, states achieved scores between 52-75 and UTs scored between 62-79, as against scores of 50-70 for states and 59-70 for UTs in 2019-20. All states have improved their overall scores by 1-12 points. Kerala (score of 75) retained its top rank amongst states in 2020-21. Tamil Nadu and Himachal Pradesh ranked second while Goa, Uttarakhand, Karnataka and Andhra Pradesh ranked fourth. Mizoram, Haryana, and Uttarakhand are the top gainers in 2020-21, in terms of improvement in score from 2019, with an increase of 12, 10 and 8 points respectively.
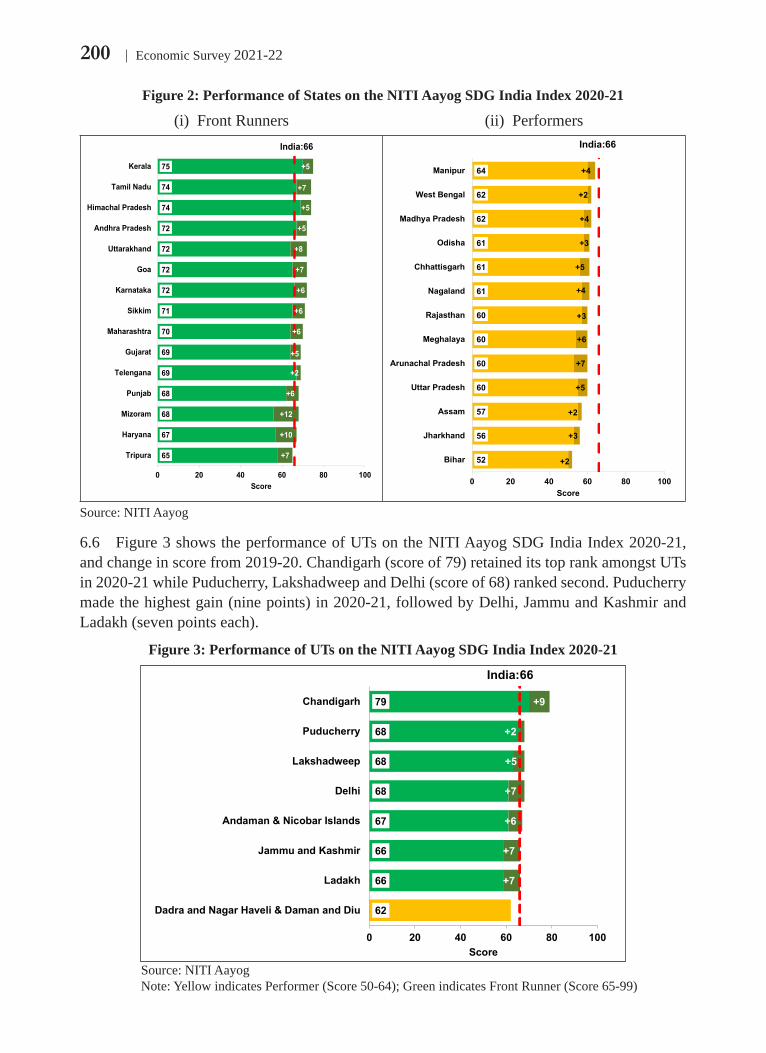
200 Economic Survey 2021-22
Figure 2: Performance of States on the NITI Aayog SDG India Index 2020-21
(i) Front Runners (ii) Performers
65
67
68
68
69
69
70
71
72
72
72
72
74
74
75
+7
+10
+12
+6
+2
+5
+6
+6
+6
+7
+8
+5
+5
+7
+5
0 20 40 60 80 100
Tripura
Haryana
Mizoram
Punjab
Telengana
Gujarat
Maharashtra
Sikkim
Karnataka
Goa
Uttarakhand
Andhra Pradesh
Himachal Pradesh
Tamil Nadu
Kerala
Score
India:66
52
56
57
60
60
60
60
61
61
61
62
62
64
+2
+3
+2
+5
+7
+6
+3
+4
+5
+3
+4
+2
+4
0 20 40 60 80 100
Bihar
Jharkhand
Assam
Uttar Pradesh
Arunachal Pradesh
Meghalaya
Rajasthan
Nagaland
Chhattisgarh
Odisha
Madhya Pradesh
West Bengal
Manipur
Score
India:66
Source: NITI Aayog
6.6 Figure 3 shows the performance of UTs on the NITI Aayog SDG India Index 2020-21, and change in score from 2019-20. Chandigarh (score of 79) retained its top rank amongst UTs in 2020-21 while Puducherry, Lakshadweep and Delhi (score of 68) ranked second. Puducherry made the highest gain (nine points) in 2020-21, followed by Delhi, Jammu and Kashmir and Ladakh (seven points each).
Figure 3: Performance of UTs on the NITI Aayog SDG India Index 2020-21
62
66
66
67
68
68
68
79
+7
+7
+6
+7
+5
+2
+9
0 20 40 60 80 100
Dadra and Nagar Haveli & Daman and Diu
Ladakh
Jammu and Kashmir
Andaman & Nicobar Islands
Delhi
Lakshadweep
Puducherry
Chandigarh
Score
India:66
Source: NITI AayogNote: Yellow indicates Performer (Score 50-64); Green indicates Front Runner (Score 65-99)

201Sustainable Development and Climate Change
Table 1: Goal-wise Performance of States/UTs on the NITI Aayog SDG India Index 2020-21PERFORMANCE OF STATES AND UTs ON SDGs GOAL-WISE RESULTS: INDIA
FASTEST MOVER FROM 2019-20 TO 2020-21: MIZORAM (+12)
Aspirant (0-49) Performer (50-64) Front Runner (65-99) Achiever (100)
The heatmap displays the performance of each State/UT on each of the Goals. The States/UTs are arranged in a descending order according to their composite scores. The State/UT with the highest composite score is in the top of their respective list while the one with the lowest score is at the bottom of the list. The columns are arranged according to the average performance of all States/UTs in a certain Goal, with the Goal where all States/UTs have on an average performed well (i.e. Goal 7) being in the left-most column and the Goal where all States/UTs have on an average performed relatively poorly (i.e. Goal 9) being in the right-most column (before the composite score).
States SDG7 SDG6 SDG12 SDG16 SDG11 SDG3 SDG10 SDG1 SDG15 SDG8 SDG4 SDG2 SDG13 SDG5 SDG9 Composite SDG
Kerala 100 89 65 80 75 72 69 83 77 62 80 80 69 63 60 75
Himachal Pradesh 100 85 77 73 79 78 78 80 68 78 74 52 62 62 61 74
Tamil Nadu 100 87 78 71 79 81 74 86 63 71 69 66 61 59 71 74
Andhra Pradesh 100 92 84 77 78 77 74 81 69 67 50 52 63 58 52 72
Goa 100 100 47 63 89 72 75 83 59 76 71 78 44 55 68 72
Karnataka 100 85 89 76 78 78 67 68 67 66 64 53 62 57 64 72
Uttarakhand 100 85 82 86 76 77 77 74 64 63 70 61 60 46 56 72
Sikkim 100 89 76 72 85 62 61 80 73 71 58 69 65 58 52 71
Maharashtra 100 90 82 69 87 83 71 66 52 62 64 44 58 51 66 70
Gujarat 94 93 50 82 87 86 64 66 61 64 52 46 67 49 72 69
Telangana 100 96 73 71 76 67 67 68 81 73 63 50 43 41 59 69
Mizoram 100 85 87 81 61 79 64 80 48 51 60 72 66 54 32 68
Punjab 100 66 71 76 91 77 68 69 48 57 60 73 51 45 69 68
Haryana 100 80 77 71 81 72 68 69 48 59 64 58 51 43 66 67
Tripura 83 82 99 80 67 67 85 82 69 57 42 52 41 39 35 65
Manipur 96 87 89 69 65 68 70 60 60 36 63 64 57 41 35 64
Madhya Pradesh 86 88 78 66 81 62 51 44 84 60 45 43 49 55 37 62
West Bengal 98 81 79 81 45 76 71 59 53 57 54 46 39 41 53 62
Chhattisgarh 78 89 64 71 78 60 72 49 65 64 55 37 38 64 36 61
Nagaland 69 87 91 79 48 61 46 73 63 48 39 64 69 48 30 61
Odisha 80 86 73 59 70 67 66 41 83 48 45 42 70 46 46 61
Arunachal Pradesh 85 67 77 64 39 64 69 54 93 50 41 66 58 37 31 60
Meghalaya 50 75 73 72 51 70 88 77 64 63 48 37 62 51 25 60
Rajasthan 100 54 74 73 81 70 45 63 43 57 60 53 49 39 45 60
Uttar Pradesh 100 83 79 79 77 60 41 44 61 53 51 41 39 50 42 60
Assam 98 64 66 62 55 59 65 51 78 50 43 41 53 25 39 57
Jharkhand 77 83 55 70 71 74 65 36 71 54 45 19 25 51 37 56
Bihar 78 91 59 73 67 66 48 32 62 50 29 31 16 48 24 52
UNION TERRITORIES SDG7 SDG6 SDG12 SDG16 SDG11 SDG3 SDG10 SDG1 SDG15 SDG8 SDG4 SDG2 SDG13 SDG5 SDG9 Composite SDG
Chandigarh 100 99 78 73 98 74 100 75 85 70 79 97 61 58 45 79
Delhi 100 61 50 62 65 90 72 81 81 65 75 63 55 33 66 68
Lakshadweep 83 100 63 77 56 78 75 61 67 62 62 74 68 58 40 68
Puducherry 98 91 66 86 76 70 62 75 50 68 70 59 23 66 59 68
Andaman and Nicobar Islands 100 87 73 46 85 68 67 71 72 59 57 45 77 68 23 67
Jammu and Kashmir 100 88 95 74 57 70 65 69 52 47 49 71 63 46 42 66
Ladakh 100 84 95 74 57 70 65 79 27 59 49 71 66 46 48 66
Dadra and Nagar Haveli &Daman and Diu
71 95 62 75 89 80 66 65 62 57 56 27 18 53 47 62
India 92 83 74 74 79 74 67 60 66 61 57 47 54 48 55 66
Target 100 100 100 100 100 100 100 100 100 100 100 100 100 100 100 100
6766
SDG INDIA INDEX: METHODOLOGY & RESULTS2020-21SDG INDIA INDEX 3.0
Source: NITI Aayog SDG India Index and Dashboard 2020-21Note: SDG 1: No Poverty; SDG 2: Zero Hunger; SDG 3: Good Health and Well-Being; SDG 4: Quality Education; SDG 5: Gender Equality; SDG 6: Clean Water and Sanitation; SDG 7: Affordable and Clean Energy; SDG 8: Decent Work and Economic Growth; SDG 9: Industry, Innovation and Infrastructure; SDG 10: Reduced Inequality; SDG 11: Sustainable Cities and Communities; SDG 12: Responsible Consumption and Production; SDG 13: Climate Action; SDG 15: Life on Land; SDG 16: Peace, Justice and Strong Institutions.

202 Economic Survey 2021-22
6.7 Table 1 shows the performance of states and UTs on 15 SDGs in the NITI Aayog SDG India Index 2020-21. Within goals, goal 7 has been achieved (score: 100) by 15 states and 5 UTs, goal 6 has been achieved by one state (Goa) and one UT (Lakshadweep), and goal 10 has been achieved by one UT (Chandigarh). Amongst states, goal 6 has the highest number of Front Runners (25 states), goal 8 has the highest number of Performers (18 states), and goal 5 and goal 9 have the highest number of Aspirants (14 states each). All UTs are Front Runners in goal 3, goal 8 has the highest number of Performers and goal 9 has the highest number of Aspirants.
6.8 Figure 4 shows the performance of nine coastal states on SDG 14 (life below water) on the NITI Aayog SDG India Index 2020-21. Odisha and Andhra Pradesh are Front Runners, followed by six Performers – Karnataka, Gujarat, Maharashtra, Kerala, Goa and West Bengal. Tamil Nadu is an Aspirant, and has the lowest score on SDG 14 amongst coastal states.
Figure 4: Performance of Coastal States on SDG 14 on NITI Aayog SDG India Index 2020-21
11
50
50
53
57
57
60
79
82
0 20 40 60 80 100
Tamil Nadu
West Bengal
Goa
Kerala
Maharashtra
Gujarat
Karnataka
Andhra Pradesh
Odisha
Score
Source: NITI Aayog SDG India Index and Dashboard 2020-21Note: SDG 14: Life Below Water. Red indicates Aspirant (Score 0-49), Yellow indicates Performer (Score 50-64), Green indicates Front Runner (Score 65-99);
6.9 Special attention is being paid to achievement of SDGs in the North-East region, with a North-Eastern Region (NER) District SDG Index 2021-22 developed by NITI Aayog. The index is constructed from 84 indicators and covers 15 global goals, 50 SDG targets and 103 districts in the eight states of the North Eastern Region. The index will facilitate in identifying crucial gaps and inform interventions to fast-track progress towards achieving the SDGs in the region. Figure 5 shows the district-wise overall performance in the NITI Aayog NER District SDG Index 2021-22. The score for the 103 districts range from 75.87 in East Sikkim (Sikkim) to 53.00 in Kiphire (Nagaland). There are 64 districts in the Front Runner category and 39 districts in the Performer category. All districts of Sikkim and Tripura fall in the Front Runner category.

203Sustainable Development and Climate Change
Figure 5: District-wise overall performance on the NITI Aayog NER District SDG Index 2021-22
Source: NITI AayogNote: Yellow indicates Performer (Score 50-64), Green indicates Front Runner (Score 65-99). Uncoloured areas are districts that have not been covered.
STATE OF THE ENVIRONMENT6.10 Sustainable development requires balancing of rapid economic growth with conservation, ecological security and environmental sustainability. This section explores state of the environment across land, water and air.
Land Forests 6.11 Forest Area refers to area recorded as forest in government records and is also called “recorded forest area”. Figure 6 shows that Russia, Brazil, Canada, USA and China were the top five largest countries by forest area in 2020, while India was the tenth largest country by forest area.

204 Economic Survey 2021-22
Figure 6: Top Ten Countries by Forest Area in 2020
815,312
496,620
346,928309,795
219,978
134,005 126,15592,133 72,330 72,160
0
100000
200000
300000
400000
500000
600000
700000
800000
900000
Russia Brazil Canada USA China Australia DRC Indonesia Peru India
Fore
st A
rea
('000
Ha)
Source: India State of Forest Report 2021Note: DRC: Democratic Republic of the Congo
6.12 Forests covered 24 per cent of India’s total geographical area accounting for two per cent of the world’s total forest area in 2020. Figure 7 shows the top ten countries by forest area as per cent of the total geographical area of the country and per cent of world forest area. The top 10 countries account for 66 per cent of the world’s forest area. Of these countries, Brazil (59 per cent), Peru (57 per cent), Democratic Republic of Congo (56 per cent) and Russia (50 per cent) have half or more of their total geographical area under forests.
Figure 7: Top Ten Countries by Forest Area in 2020 w.r.t Country and World Forest Area
5957 56
50 49
3934
24 2317
12
2 3
20
2
9 82
5 3
0
10
20
30
40
50
60
70
Brazil Peru DRC Russia Indonesia Canada USA India China Australia
Fore
st a
s %
of A
rea
% of Country Area
% of World Forest Area
Source: India State of Forest Report 2021Note: DRC: Democratic Republic of the Congo
6.13 India has increased its forest area significantly over the past decade. It ranks third globally in average annual net gain in forest area between 2010 to 2020, adding an average 2,66,000 ha of additional forest area every year during the period, or adding approximately 0.38 per cent of the 2010 forest area every year between 2010 to 2020 (Figure 8).

205Sustainable Development and Climate Change
Figure 8: Top Ten Countries by Average Annual Net Gain in Forest Area (2010-20)
1937
446266
149 126 114 108 83 54 41
0.93
0.340.38
0.85 0.9
0.53
0.03
0.5
0.580.62
0
500
1000
1500
2000
2500
China Australia India Chile Vietnam Turkey USA France Italy Romania0
0.1
0.2
0.3
0.4
0.5
0.6
0.7
0.8
0.9
1Ar
ea ('
000
Ha)
% o
f 201
0 Fo
rest
Are
a
Avg Annual Forest Area Net Gain 2010-20 ('000 Ha) Avg Annual Net Gain as % of 2010 Forest Area
Source: India State of Forest Report 2021
6.14 Forest cover comprises all lands, more than one hectare in area, with a tree canopy density of more than 10 per cent, irrespective of ownership and legal status. Such lands may not necessarily be a recorded forest area, and also include orchards, bamboo and palm plantations. Figure 9 shows that India’s total forest cover was 7,13,789 sq km in 2021 reflecting an increase of 3.14 per cent in the forest cover over 2011, from 21.05 per cent of the country’s geographical area in 2011 to 21.71 per cent in 2021. This increase in total forest cover is mainly attributed to increase in very dense forest (all lands with tree canopy density of 70 per cent and above), which rose by 19.54 per cent between 2011 and 2021. Open forest (all lands with tree canopy density between 10-40 per cent) also improved by 6.71 per cent, while moderately dense forest (all lands with tree canopy density between 40-70 per cent) declined by 4.32 per cent between 2011 and 2021.
Figure 9: Forest Cover of India (2011 and 2021)
83,471
320,736
287,820
692,027
99,779
306,890
307,120
713,78920
-4
7
3
-10
-5
0
5
10
15
20
25
0
100000
200000
300000
400000
500000
600000
700000
800000
Very Dense Forest Moderately Dense Forest Open Forest Total Forest Cover
% C
hang
e (2
011-
2021
)
Fore
st C
over
(sq.
Km
)
Forest Cover 2011 Forest Cover 2021 % Change (2011-21)
Source: India State of Forest Report 2021 and 2011Note: Very dense forest: All lands with tree canopy density of 70 per cent and above); Moderately dense forest: All lands with tree canopy density between 40-70 per cent; and Open forest: All lands with tree canopy density between 10-40 per cent

206 Economic Survey 2021-22
6.15 Amongst states, Madhya Pradesh (11 per cent of India’s total forest cover) had the largest forest cover in India in 2021, followed by Arunachal Pradesh (9 per cent), Chhattisgarh (8 per cent), Odisha (7 per cent) and Maharashtra (7 per cent). Figure 10 shows the composition of very dense forest, moderately dense forest and open forest in these five states as well as the per cent of states’ geographical area under forest cover in 2021.
Figure 10: Top Five States in India by Forest Cover, 2021
7
21
7 7 9
3430 32
21 21
37
15 1624 21
77
6656 52 51
25
79
4134
170
10
20
30
40
50
60
70
80
90
0
10
20
30
40
50
60
70
80
90
Madhya Pradesh Arunachal Pradesh Chhattisgarh Odisha Maharashtra
% o
f Geo
grap
hica
l Are
a
Fore
st C
over
('00
0 sq
Km
)
Very Dense Forest Moderately Dense ForestOpen Forest Total Forest CoverTotal Forest Cover as % of State's Geographical Area
Source: India State of Forest Report 2021Note: Very dense forest: All lands with tree canopy density of 70 per cent and above); Moderately dense forest: All lands with tree canopy density between 40-70 per cent; and Open forest: All lands with tree canopy density between 10-40 per cent
6.16 Mizoram (85 per cent), Arunachal Pradesh (79 per cent), Meghalaya (76 per cent), Manipur (74 per cent) and Nagaland (74 per cent) were the top five states in terms of highest per cent of forest cover w.r.t. total geographical area of the state in 2021 (Figure 11).
Figure 11: Top Five States by per cent of State Geographical Area under Forest Cover, 2021
84.53
79.33
76.0074.34 73.90
68707274767880828486
Mizoram ArunachalPradesh
Meghalaya Manipur Nagaland
Fore
st C
over
as
% o
f Sta
te's
G
eogr
aphi
cal
Area
Source: India State of Forest Report 2021
6.17 Figure 12 shows the top five states in terms of very dense forest in 2021. Arunachal Pradesh accounted for 21 per cent of India’s very dense forest in 2021, followed by Maharashtra (9 per cent), Odisha (7 per cent), Chhatisgarh (7 per cent) and Madhya Pradesh (7 per cent).

207Sustainable Development and Climate Change
Figure 12: Top Five States by Very Dense Forest, 2021
21,058
8,7347,213 7,068 6,665
0
5000
10000
15000
20000
25000
Arunachal Pradesh Maharashtra Odisha Chhattisgarh Madhya Pradesh
Fore
st C
over
(sq.
km
)
Source: India State of Forest Report 2021
6.18 Figure 13 shows the top five states in terms of moderately dense forest in 2021. Madhya Pradesh and Chhattisgarh accounted for 11 per cent of India’s moderately dense forest in 2021, followed by Arunachal Pradesh (10 per cent), Odisha (7 per cent) and Karnataka (7 per cent).
Figure 13: Top Five States by Moderately Dense Forest, 2021
34,20932,279
30,176
20,995 20,985
0
5000
10000
15000
20000
25000
30000
35000
40000
Madhya Pradesh Chhattisgarh Arunachal Pradesh Odisha Karnataka
Fore
st C
over
(sq.
km
)
Source: India State of Forest Report 2021
6.19 Figure 14 shows the top five states in terms of open forest in 2021. Madhya Pradesh accounted for 12 per cent of India’s moderately dense forest in 2021, followed by Odisha (8 per cent), Maharashtra (7 per cent), Chhattisgarh (5 per cent) and Assam (5 per cent).
Figure 14: Top Five States by Open Forest Cover, 2021
36,619
23,94821,475
16,370 15,304
0
5000
10000
15000
20000
25000
30000
35000
40000
Madhya Pradesh Odisha Maharashtra Chhattisgarh Assam
Fore
st C
over
(sq.
km
)
Source: India State of Forest Report 2021

208 Economic Survey 2021-22
6.20 Figure 15 shows the forest cover in seven major cities – Ahmedabad, Bengaluru, Chennai, Delhi, Hyderabad, Kolkata and Mumbai, in 2011 and 2021. Figure 16 shows the composition of forest cover in seven major cities – Ahmedabad, Bengaluru, Chennai, Delhi, Hyderabad, Kolkata and Mumbai, in 2021.The total forest cover in these seven major cities in 2021 was 509.72 sq km, which was 10.21 per cent of the total geographical area of these cities, and 0.07 per cent of India’s forest area.
Figure 15: Forest Cover in Seven Major Cities (2011 and 2021)
18.0
94.0
18.0
174.3
33.2
2.5
101.7
9.4
89.0
22.7
194.2
81.8
1.8
110.8
-47.6 -5.3
26.0
11.4
146.8
-29.8
8.9
-100.0
-50.0
0.0
50.0
100.0
150.0
200.0
0
50
100
150
200
250
Ahmedabad Bengaluru Chennai Delhi Hyderabad Kolkata Mumbai
% C
hang
e (2
011-
2021
)
Fore
st C
over
(Sq
Km)
2011 2021 % Change (2011-2021)
Source: India State of Forest Report 2021
Figure 16: Composition of Forest Cover in Seven Major Cities, 2021
0 0 0 7 0 0 0213 8
56
180
51
8
76
15
131
64
2
60
9
89
23
194
82
2
111
2
7 5
13 13
1
25
0
5
10
15
20
25
30
0
50
100
150
200
250
Ahmedabad Bengaluru Chennai Delhi Hyderabad Kolkata Mumbai
Fore
st C
over
as
% o
f Are
a
Fore
st C
over
(Sq
Km
)
VDF MDF OF Total Forest Cover % Total Forest Cover w.r.t Area of Digitised Boundary
Source: India State of Forest Report 2021Note: VDF: Very Dense Forest; MDF: Moderately Dense Forest; OF: Open Forest
Plastic Waste Management and Elimination of Identified Single Use Plastics6.21 India is committed to mitigate pollution caused by littered single use plastics. In 2018, the Hon’ble Prime Minister announced that India would phase-out single use plastic by 2022. The Hazardous and Other Wastes (Management and Transboundary Movement) Rules, 2016 as amended regulate the import of identified plastic waste into the country by SEZ and EOUs. The regulation of import of plastic waste prevents dumping of plastic waste by other countries in the country and allows for recycling of plastic waste generated in the country.

209Sustainable Development and Climate Change
6.22 India piloted a resolution on ''Addressing Single Use Plastic Product Pollution'' which was adopted by the Fourth United Nations Environment Assembly held in 2019. The resolution recognizes the need for the global community to act on the single use plastic products pollution. The adoption of this resolution was a significant step.
6.23 The following domestic regulatory actions have been taken in 2021: i. In August 2021, the Ministry of Environment, Forest and Climate Change, Government
of India, notified the Plastic Waste Management Amendment Rules, 2021 prohibiting identified single use plastic items, which have low utility and high littering potential, by 2022. The manufacture, import, stocking, distribution, sale and use of identified single-use plastic, including polystyrene and expanded polystyrene, commodities shall be prohibited with effect from the July 1, 2022.
ii. In order to stop littering due to light-weight plastic carry bags, the thickness of plastic carry bags has been increased from fifty microns to seventy five microns with effect from September 30, 2021 and to one hundred and twenty microns with effect from December 31, 2022. Increased thickness of plastic bags will also allow reuse.
iii. The plastic packaging waste, which is not covered under the phase out of identified single use plastic items, shall be collected and managed in an environmentally sustainable way through the Extended Producer Responsibility of the Producer, Importer and Brand Owner (PIBO), as per Plastic Waste Management Rules, 2016.
iv. For effective implementation of Extended Producer Responsibility the Guidelines for Extended Producer Responsibility being brought out have been given legal force through Plastic Waste Management Amendment Rules, 2021.
v. In October 2021, the Ministry of Environment, Forest and Climate Change notified the draft Regulations on the Extended Producer Responsibility for plastic packaging under Plastic Waste Management Rules, 2016, as amended from time to time, in the Gazette of India vide GSR No. 722 (E) for public consultation. The regulation proposes to mandate reuse, minimum level of recycling of plastic packaging waste, use of recycled plastic content, and environmentally sound management of plastic waste. It also seeks to strengthen the circular economy of plastic packaging waste, promote development of new alternatives to plastics and sustainable plastic packaging.
6.24 The waste management infrastructure in the States/UTs is also being strengthened through the Swachh Bharat Mission. All States/UTs have been requested to constitute a Special Task Force for elimination of single use plastics and effective implementation of Plastic Waste Management Rules, 2016. In addition, State /UT Governments and concerned Central Ministries/Departments have also been requested to develop a comprehensive action plan for elimination of single use plastics and effective implementation of Plastic Waste Management Rules, 2016, and its implementation in a time bound manner. A National Level Taskforce has been constituted by the Ministry of Environment, Forest and Climate Change for taking coordinated efforts to eliminate identified single use plastic items and effective implementation of Plastic Waste

210 Economic Survey 2021-22
Management Rules, 2016. All States/UTs and concerned central ministries are members of the National Task Force. The first meeting of the National Task Force was held on 31st August 2021. The Government has also been taking measures for awareness generation towards elimination of single use plastics and effective implementation of Plastic Waste Management Rules, 2016.
WaterGround Water
6.25 Ground water is a crucial resource for India’s agriculture, industry and drinking water security. However, unsustainable extraction, i.e. extraction in excess of, or close to, annual recharge, can severely compromise ground water resources.
Figure 17: Ground Water Resource Assessments (2004-2020)
58
61
62 62
63
62
55
56
57
58
59
60
61
62
63
64
050
100150200250300350400450500
2004 2009 2011 2013 2017 2020
Gro
und
Wat
er E
xtra
ctio
n (%
)
Gro
und
Wat
er (b
cm)
Annual GW Recharge Annual Extractable GWAnnual GW Extraction GW Extraction (%)
Source: National Compilation on Dynamic Ground Water Resources of India, 2020
6.26 Ground Water Resources Assessment of states/UTs is carried out jointly by state groundwater/ nodal departments and Central Ground Water Board at periodic intervals, and the Dynamic Ground Water Resources of India is published by compiling the state/UT wise ground water resources assessed. Such ground water assessments have been undertaken in 2004, 2009, 2011, 2013, 2017 and 2020. Figure 17 shows the annual ground water recharge, annual extractable ground water resources, annual ground water extraction and the stage of total ground water extraction (ratio of annual ground water extraction and annual extractable resources i.e. utilization vs availability expressed in per cent) of India during 2004-2020. It may be seen that the annual ground water recharge has remained similar during 2004-2020 (except in 2013). Overall, the annual ground water extraction has been in the range of 58-63 per cent during this period.

211Sustainable Development and Climate Change
Figure 18: Categorization of Ground Water Resource Assessment Units (2004-2020)
71 73 68 69 63 64
10 911 10
14 15
4 3 3 4 5 4
15 14 16 16 17 16
1 1 1 1 1 1
0%
10%
20%
30%
40%
50%
60%
70%
80%
90%
100%
2004 2009 2011 2013 2017 2020
Perc
ent o
f Ass
essm
ent U
nits
Safe Semi-critical Critical Over-Exploited Saline
Source: National Compilation on Dynamic Ground Water Resources of India, 2020
6.27 The extent of ground water extraction varies across the country. The ground water assessment units (blocks/ taluks/ mandals/ tehsil/ firkas etc.) are categorized based on the Stage of Extraction (SoE) as ‘Safe’ if SoE < 70 per cent; ‘Semi-critical’ if SoE > 70 per cent and <= 90 per cent; ‘Critical’ if SoE >90 per cent and <=100 per cent and ‘Over-exploited’ if SoE> 100 per cent. Assessment unit in which the ground water resources are entirely saline, have been categorised as ‘Saline’. Figure 18 shows the per cent of number of assessment units of India under different categories (Safe, Semi-critical, Critical, Over-exploited and Saline) during 2004-2020. During this period, units categorized as “safe”, have declined from 2009 (73 per cent) to 2020 (64 per cent). “Semi-critical” units have increased from 9 per cent in 2009 to 15 per cent in 2020. The share of “Critical” units has remained in the range of 3-5 per cent during 2004-2020. The share of “Over-exploited” units, accounted for 14-17 per cent of total assessment units during 2004-20. In addition, approximately one per cent of assessment units have been categorized as “saline”.
6.28 Figure 19 presents the categorization of ground water resource assessment units across India in 2020. It can be seen that over-exploitation of ground water resources, i.e. extraction exceeding the annually replenishable ground water recharge is concentrated in north-west and parts of southern India.

212 Economic Survey 2021-22
Figure 19: Categorization of Ground Water Resource Assessment units across India, 2020
Source: National Compilation on Dynamic Ground Water Resources of India, 2020
Reservoirs6.29 Reservoirs are an important source of water resources for the country. However, they are particularly prone to seasonality, and are greatly impacted by rainfall and temperature patterns.
Figure 20: Reservoir capacity and live storage (bcm)
020406080
100120140160180
Jun Jul Aug Sep Oct Nov Dec Jan Feb Mar Apr May
Stor
age
(BC
M)
Current Year (2021-22) Last Year (2020-21)Last 10 years average Capacity at Full Reservoir Level
Capacity at Full Reservoir Level
Last 10 years average
Previous year (2020-21)
Current year 2021-22
Source: India Water Resources Information System, Ministry of Jal Shakti
SafeGW extraction < 70%
Semi CriticalGW extration 70-90%
CriticalGW extration 90-100%
Over ExploitedGW extraction > Annually replenishable
Saline
Hilly Areas
No Data

213Sustainable Development and Climate Change
6.30 Figure 20 shows the capacity at full reservoir levels in 138 monitored reservoirs of India along with the live storage during June-December 2021, June 2020–May 2021, and the ten year average during the months of June – May. It may be seen that reservoir live storage is at its peak during monsoon months and lowest in summer months, requiring careful planning and coordination of storage, release and utilization of reservoirs. This is also reflected in Figure 21.
Figure 21: Reservoir fill (per cent of total capacity), 2021
20th June 2021 22nd August 2021
24th October 2021 19th December 2021
Reservoir fill (%)
> 90% 70% - 90% 50% - 70% < 50%
Source: India Water Resources Information System, Ministry of Jal Shakti
Rivers6.31 India has several perennial and seasonal rivers. The Ganga River Basin is the largest river basin in India, covering more than a quarter of country’s land area, hosting about 43 per cent of its population and contributing 28 per cent of India’s water resources. In recognition of River Ganga’s significant economic, environmental, cultural and religious value, the Government of

214 Economic Survey 2021-22
India declared River Ganga as the National River in 2008. Further, the Government of India launched the Namami Gange Mission in 2014 as an integrated and multi-sectoral mission for conservation of Ganga and its tributaries.
Namami Gange Mission6.32 The Namami Gange Mission aims to protect, conserve and rejuvenate the Ganga River Basin. In 2015, the Cabinet approved the Mission for a period of five years (2015-2020) with a budget outlay of ` 20,000 crores. Subsequently, on 7th October 2016, under the Environment (Protection) Act, 1986 (29 of 1986), the National Mission for Clean Ganga (NMCG) was notified as an authority under Environment Protection Act, which is also the nodal agency responsible for monitoring and implementing the Namami Gange Mission. The activities undertaken as part of the Mission rest upon four pillars –Nirmal Ganga (Unpolluted Flow), Aviral Flow (Continuous Flow), Jan Ganga (People-River Connect) and Gyan Ganga (Research and Knowledge Management). As of December 2021, a total of 363 projects worth ` 30,841.53 crores have been sanctioned under the mission.
6.33 Figure 22 shows the total expenditure incurred under the Namami Gange Mission since 2014-15 to December 2021. Lower expenditure incurred in 2020-21 and 2021-22 needs to be viewed in the context of the COVID pandemic and recent changes in accounting norms.
Figure 22: Expenditure incurred under the Namami Gange Mission during 2014-22 (` Crores) as of December 2021
171
603
1,063
1,625
2,627 2,673
1,340
898
0
500
1000
1500
2000
2500
3000
2014-15 2015-16 2016-17 2017-18 2018-19 2019-20 2020-21* 2021-22**
Expe
nditu
re in
curr
ed (R
s. C
rore
s)
*Due to COVID 19 Pandemic ** The data in the graph is till December 2021Source: National Mission for Clean Ganga (NMCG)
6.34 In addition, the Clean Ganga Fund (CGF) was established in 2014 with the objective of contributing to the national effort of improving the cleanliness of river Ganga with the contributions received from the residents of the country, NRIs/ PIO, corporates and organizations. As of 31st December 2021, a total of ` 561.58 crore has been received under the CGF.
6.35 Under the Nirmal Ganga (Unpolluted Flow) component of the mission, 160 sewerage projects have been sanctioned at a cost of ` 24,568 crores as of December 31, 2021 to create a cumulative treatment capacity of 5,024 MLD, reflecting a ten-fold increase from 463 MLD through 28 projects in 2014. Figure 23 shows the state-wise distribution of the sewerage

215Sustainable Development and Climate Change
infrastructure projects created under the Namami Gange Mission since its inception, with the highest number of projects undertaken in Uttar Pradesh (43), followed by Bihar (29) and Uttarakhand (26).
Figure 23: Sewerage Infrastructure Projects created under the Namami Gange Mission as of December 31, 2021
10
1
10
40 1 0 0
2
43
2926
20
10
2 1 1 0
53
30
36
24
10
31 1 2
0
10
20
30
40
50
60
UttarPradesh
Bihar Uttarakhand WestBengal
Delhi Jharkhand HimachalPradesh
Rajasthan Haryana
Num
ber o
f Sew
erag
e Pr
ojec
ts c
reat
ed
Before 2014
Under Namami Gange Mission
Total
Source: National Mission for Clean Ganga (NMCG)
6.36 Further, Grossly Polluting Industries (GPIs) along River Ganga have been inventoried. Since 2015, sector specific charters for implementation of cleaner technology, upgradation of treatment facility and adaptation of waste minimization practices have been implemented in the major industrial sectors like pulp & paper, distilleries, sugar and textile by involving different stakeholders. These actions have resulted in significant reduction in wastewater discharge and pollution load. Figure 24 shows the improvement in compliance status of GPIs located in the Ganga main stem and its tributaries from 39 per cent in 2017 to 81 per cent in 2020 due to regular monitoring of these industries through annual inspections by independent technical institutes. Figure 25 shows the consequent reduction in effluent discharge from 349.13 MLD in 2017 to 280.20 MLD in 2020.
Figure 24: Compliance Status of Grossly Polluting Industries along Ganga (2017-20)
39
69
82 81
0
20
40
60
80
100
2017 2018 2019 2020
Com
plai
nce
Stat
us (%
)
Source: National Mission for Clean Ganga (NMCG)

216 Economic Survey 2021-22
Figure 25: Change in Effluent Discharge along Ganga main stem and tributaries (2017-20)
349.13314.86 302.00
280.20
-10
-4-7
-12
-10
-8
-6
-4
-2
0
0
50
100
150
200
250
300
350
400
2017 2018 2019 2020
Cha
nge
in D
isch
arge
(%)
Efflu
ent D
isch
arge
(MLD
)
Effluent discharge (MLD) Change over previous year (%)
Source: National Mission for Clean Ganga (NMCG)
6.37 To ensure Aviral Flow (Continuous Flow) of the Ganga, a historical ecological flow notification mandating the minimum flow of river Ganga was released in 2016, recognizing the right of the river over its own water. Other steps in this direction include afforestation of 29,000 Ha; first of its kind river bio-diversity assessment for the main stem Ganga river covering over 2,200 km; identification of 279 wetlands for conservation; and preparation of integrated management plan for 118 wetlands.
6.38 The Jan Ganga (People-River Connect) component acknowledges the critical importance of strengthening the people-river connection in achieving the mission objectives. Ganga Quest 2021 got an enthusiastic response of over 1 million participants from 113 countries. Ganga Utsav 2021 was celebrated for the first time as a river festival extending beyond Ganga basin cities. The River City Alliance was launched in November 2021, as a platform for river cities in India to ideate, discuss, and exchange information for the sustainable management of urban rivers.
6.39 Finally, under the Gyan Ganga (Research and Knowledge Management) component, the Ganga Knowledge Centre was set up to create a state-of-the-art center to support the NMCG and create a comprehensive knowledge base on Ganga. In addition, the Centre for Ganga Management & Study was set up at IIT Kanpur for long term basin studies and technology development.
Air 6.40 Air pollution is one of the biggest global environmental challenges. The Government of India launched the National Clean Air Programme (NCAP) in 2019 to tackle the air pollution problem in a comprehensive manner, with a target to achieve 20-30 per cent reduction in particulate matter (PM) concentrations by 2024 across the country keeping 2017 as the base year for the comparison of concentration. The NCAP is implemented in 132 cities, of which 124 cities have been identified based on non-conformity with national ambient air quality standards for five consecutive years. This includes 34 million plus cities / urban agglomerations identified

217Sustainable Development and Climate Change
by the Fifteenth Finance Commission (XV-FC). In addition, NCAP also covers eight other million plus cities, which fall under XV-FC grant for receiving performance based grant for air quality improvement. Figure 26 shows the funds released under the NCAP in 2019-20 and 2020-21. In 2019-20, the highest funds were released to Uttar Pradesh, followed by Maharashtra and Madhya Pradesh while in 2020-21, the highest funds were released to Andhra Pradesh, Punjab and West Bengal.
Figure 26: Funds released under the National Clean Air Programme (` Crores)
48
40
2118
12 12 12 11 108
6 6 6 6 6
0 0 0 0 0 0 0
12 11
24
15
1 03
75
17
2
6
0
13 1210
86
11
3 3
0.00
10.00
20.00
30.00
40.00
50.00
Utta
r Pra
desh
Mah
aras
htra
Mad
hya
Prad
esh
Raj
asth
an
Punj
ab
Chha
ttisg
arh
Guj
arat
Tela
ngan
a
Biha
r
Chan
diga
rh
And
hra
Prad
esh
Karn
atak
a
Odi
sha
Jhar
khan
d
Wes
t Ben
gal
Ass
am
Him
acha
lPr
ades
h
Jam
mu
&Ka
shm
ir
Nag
alan
d
Utta
rakh
and
Tam
il N
adu
Meg
hala
ya
Fund
s re
leas
ed u
nder
NCA
P (R
s. C
rore
s)
2019-20 2020-21
Source: Ministry of Environment, Forest and Climate Change
6.41 Several steps are being taken to control and minimize air pollution from various sources in the country, which inter alia include: i. Vehicular Emission: India has leap frogged from BS-IV to BS-VI norms for fuel and
vehicles since April, 2020. Metro rail networks for public transport have been enhanced and more cities have been covered. Cleaner/alternate fuels like CNG, LPG and ethanol blending in petrol have been introduced. Government has approved Phase-II of FAME Scheme with an outlay of ` 10,000 Crore for a period of five years commencing from 1st April 2019. Out of total budgetary support, about 86 per cent of fund has been allocated for demand incentive so as to create demand for electric vehicles in the country. This phase aims to generate demand by way of supporting 7,090 e-buses, 5 lakh e-3 wheelers, 55,000 e-4 wheeler passenger cars (including strong hybrid) and 10 lakh e-2 wheelers. Permit requirement for electric vehicles has been removed.
ii. Industrial Emission: Stringent emission norms for coal based thermal power plants have been introduced. There is ban on use of imported pet coke in the country since July 2018, with exception for permitted processes. Online continuous emission monitoring devices have been installed in highly polluting industries. Brick kilns have been shifted to zig-zag technology to reduce pollution.
iii. Air Pollution due to dust and burning of waste: Six waste management rules covering solid waste, plastic waste, e-waste, bio-medical waste, construction and demolition

218 Economic Survey 2021-22
waste and hazardous waste have been notified. Waste processing plants have been set up. Extended producer responsibility for plastic and e-waste management has been introduced. Burning of biomass/garbage has been banned.
iv. Monitoring of Ambient Air Quality: Air quality monitoring network of manual as well as continuous monitoring stations, under programmes such as National Air Monitoring Programme, have been expanded. Pilot projects have been initiated to assess alternate ambient monitoring technologies such as low-cost sensors and satellite-based monitoring. Air Quality Early Warning System, which provides alerts for taking timely actions, is being implemented in Delhi, Kanpur and Lucknow.
6.42 As a result of these initiatives, 96 cities showed a decreasing trend of PM10 concentration in 2020-21 as compared to 2019-20. The number of cities within the prescribed National Ambient Air Quality Standard (PM10 less than 60 µg/m3) also increased from 18 in 2019-20 to 27 in 2020-21. However, air pollution remains a major concern, with 36 cities showing an increasing trend in PM10 concentration in 2020-2021 as compared to 2019-2020.
6.43 In addition to the above measures, some key measures being taken for reducing air pollution in Delhi / NCR are as follows: i. A Commission on Air Quality Management in NCR and Adjoining Areas was
promulgated vide ordinance dated 13th July 2021 for better co-ordination, research, identification and resolution of problems surrounding the air quality index.
ii. To control emissions from stubble burning, under Central Government Scheme on ‘Promotion of Agricultural Mechanization for in-situ management of Crop Residue in the States of Punjab, Haryana, Uttar Pradesh and NCT of Delhi’, agricultural machines and equipment for in-situ crop residue management are promoted with 50 per cent subsidy to the individual farmers and 80 per cent subsidy for establishment of custom hiring centres.
iii. All diesel vehicles older than 10 years and all petrol vehicles older than 15 years have been banned in Delhi and NCR.
iv. Expressways & Highways have been operationalized to divert non-destined traffic away from Delhi.
v. Shifting industries to clean fuel and installation of Online Monitoring of Industrial Emission & Effluent systems in red category industries in Delhi-NCR is in progress.
6.44 As a result of these interventions, there has been an improvement in air quality index for Delhi since 2016 as seen in Table 2. The number of ‘Good’, ‘Satisfactory’ and ‘Moderate’ days increased to 197 in 2021 as against 108 in 2016, and number of ‘Poor’, ‘Very Poor’ and ‘Severe’ days decreased to 168 in 2021 against 246 in 2016. The lower number of ‘Good’, ‘Satisfactory’ and ‘Moderate’ days and higher number of ‘Poor’, ‘Very Poor’ and ‘Severe’ days in 2021 as compared to 2020 must be viewed in the context of the 2020 COVID-19 lockdowns.

219Sustainable Development and Climate Change
Table 2: Average Annual Air Quality Index, Delhi (2016-2021)
Year (no. of days)
Category
2016 (354)
2017(365)
2018(365)
2019(365)
2020(366)
2021(365) 20
16
2017
2018
2019
2020
2021
Good (0–50) 0 2 0 2 5 1
108 152 159 182 227 197Satisfactory (51–100) 25 45 53 59 95 72
Moderate (101–200) 83 105 106 121 127 124
Poor (201–300) 120 115 113 103 75 80
246 213 206 183 139 168Very Poor (301–400) 101 89 73 56 49 64
Severe (>401) 25 9 20 24 15 24
Source: Ministry of Environment, Forest and Climate Change
6.45 In addition, Continuous Ambient Air Quality Monitoring Stations (CAAQMS) data for Delhi reveals that annual concentration of PM has decreased gradually since 2016. Delhi achieved approximately 22 per cent reduction in PM2.5 and 27 per cent reduction in PM10 in 2021 as compared to 2016.
6.46 Figure 27 shows the average monthly air quality (PM2.5) for Delhi during 2017-21. In 2021, nine months registered an improvement over 2017, with the largest improvements seen in October (54 per cent), May (50 per cent) and September (48 per cent). In 2021, average monthly air quality in Delhi declined in January (17 per cent), February (15 per cent) and March (one per cent) as compared to corresponding months in 2017, indicating an area of concern.
Figure 27: Average Monthly CAAQMs of Delhi (2017-2021) (PM2.5 in µg/m3)
0
50
100
150
200
250
300
Jan Feb Mar Apr May Jun Jul Aug Sep Oct Nov Dec
Aver
age
Mon
thly
Air
Qua
lity
(PM
2.5
µg/m
3) 2017 2021
Source: Ministry of Environment, Forest and Climate Change
6.47 Figure 28 shows the average monthly air quality (PM10) for Delhi during 2017-21. In 2021, nine months registered an improvement over 2017, with the largest improvements seen in September (66 per cent), October (49 per cent) and May (48 per cent). In 2021, average monthly air quality in Delhi declined in January (five per cent), February (seven per cent) and March (four per cent) as compared to corresponding months in 2017, indicating an area of concern.

220 Economic Survey 2021-22
Figure 28: Average Monthly CAAQMs of Delhi (2017-2021) (PM10 in µg/m3)
0
50
100
150
200
250
300
350
400
450
Jan Feb Mar Apr May Jun Jul Aug Sep Oct Nov Dec
Aver
age
Mon
thly
Air
Qua
lity
(PM
10 µ
g/m
3)2017 2021
Source: Ministry of Environment, Forest and Climate Change
CLIMATE CHANGE6.48 India launched the National Action Plan on Climate Change (NAPCC) in 2008, establishing eight National Missions to advance action on the country’s climate priorities. The major developments under the NAPCC are presented in Table 3.
Table 3: National Missions under NAPCC
Missions Major Objectives/ Target Progress
1. National Solar Mission (NSM)
Achieve 100 GW of solar power in seven years starting from 2014-15
As of 31st December 2021, solar power capacity of 49.35 GW has been installed in the country.
2. National Mission for Enhanced Energy Efficiency (NMEEE)
- To achieve growth with ecological sustainability
The Perform Achieve and Trade (PAT) Scheme was initiated in March 2012
- Mandating reduction in energy consumption in large energy consuming industries
- Financing for PPP to reduce energy consumption through demand-side management programs in the municipal, buildings and agricultural sectors
- Energy incentives, including reduced taxes on energy-efficient appliances
- Implementation of PAT Cycle I (2012-2015) resulted in annual energy savings of 8.67 Million Tonne of Oil Equivalent (MTOE) from 8 sectors. Emission reduction of 31 million tonnes of CO2 was achieved.
- Under PAT Cycle II (2016-17 to 2018-19), annual energy savings of 14.08 MTOE was achieved from 11 sectors. Emission

221Sustainable Development and Climate Change
reduction of 66.01 million tonnes of CO2 was achieved.
- PAT Cycle III (2017-18 to 2019-20) concluded on 31st March 2020. Results of this cycle are awaited.
- Currently, PAT Cycle IV is under implementation. Energy savings of approximately 26 MTOE are expected to be achieved.
3. National Mission for a Green India (GIM)
Improved ecosystem services by increasing forest/tree cover by 5 m ha and improving quality of forest cover on another 5 m ha (a total of 10 m ha).
- A sum of ` 455.75 crore has been released to 14 states and one UT during 2015-16 to 2020-21.
- Afforestation activities were taken up over an area of 1,17,757 ha.
- Alternative fuel energy devices have been distributed to 33,099 households.
4. National Mission on Sustainable Habitat (NMSH)
- Development of sustainable habitat standards.
- Promoting energy efficiency as a core component of urban planning by extending the existing Energy Conservation Building Code
- Strengthening enforcement of automotive fuel economy standards
- Using pricing measures to encourage the purchase of efficient vehicles and incentives for the use of public transportation
- NMSH is being implemented through three programmes: Atal Mission on Rejuvenation and Urban Transformation, Swachh Bharat Mission, and Smart Cities Mission
- Energy Conservation Building Rules 2018 has been made mandatory for commercial buildings having connected load of 100 KW or above.
- 702 km of conventional metro is operational in the country. Additional 1,016 km of metro and regional rapid transit system is under construction in 27 cities.

222 Economic Survey 2021-22
- Under Smart Cities Mission, Climate Smart Cities Assessment Framework 2019 has been launched to provide clear roadmap to combat climate change through mitigation and adaptation measures.
- Urban Swachh Bharat Mission 2.0 will be implemented with a total financial allocation of ` 1,41,678 crores over a period of 5 years from 2021-2026.
5. National Water Mission (NWM)
- Focuses on monitoring of ground water, aquifer mapping, capacity building, water quality monitoring and other baseline studies.
- Promoting citizen and state action for water conservation, augmentation, and preservation.
- Focusing attention on overexploited areas.
- Promoting basin-level integrated water resources management.
- The National Institute of Hydrology is the nodal agency to get the State Specific Action Plan (SSAP) for the water sector for 19 selected states. Five States have completed the first phase of SSAP.
- 15640 ground water observation wells are being monitored by Central Ground Water Board.
6. National Mission for Sustainable Agriculture
Enhancing food security by making agriculture more productive, sustainable, remunerative, and climate resilient
- The mission has resulted in the formation of National Innovations on Climate Resilient Agriculture, a network project of the Indian Council of Agricultural Research.
- Key targets for FY 2021-2025 include covering 20 lakh hectare of area under organic farming, 87 lakh hectare under precision irrigation, 2.10 lakh hectare

223Sustainable Development and Climate Change
under System for Rice Intensification, 6 lakh hectare under diversification to less water consuming crop, 1.19 lakh hectare additional area under plantation in arable land.
7. National Mission for Sustaining Himalayan Ecosystems
- To continuously assess the health status of the Himalayan Ecosystem
- Enable policy bodies in their policy formulation functions
- Establish new centres relevant to climate change in existing institutions in Himalayan States
- Regional cooperation with neighbouring countries in Glaciology
- Centre for Glaciology has been established at Wadia Institute of Himalayan Geology
- State climate change centres have been set up in 12 Himalayan states
- State climate change cells have been established in 11 out of 12 Himalayan states
- 40 capacity building training programmes have been conducted and 40,000 people have been trained. Glaciologists have been trained under Indo-Swiss Capacity Building Programme in glaciology
- an Inter-University Consortium of 4 universities on Himalayan Cryosphere and Climate Change has been formed
- Glacial lake outburst floods R&D studies for vulnerability assessment have been conducted for Sikkim
8. National Mission on Strategic Knowledge for Climate Change (NMSKCC)
- To gain better understanding of climate science and formation of knowledge networks among existing knowledge institutions engaged in research and development (R&D)
- The mission has created and strengthened 11 Centres of Excellence for climate change.
- State Climate Change Cells have been established
224 Economic Survey 2021-22
- Development of national capacity for modelling the regional impact of climate change on different ecological zones within the country.
in 11 out of 12 Himalayan States and in 11 non-Himalayan States.
- 6 lead institutions now conduct training on climate change science, impacts and adaptation under its human capacity building programme.
- Revised mission document aims to establish 20 centres of excellence, state climate change cells in all states/UTs, develop major R&D programmes, human capacity building programmes, national level network programmes and international cooperation
Source: Ministry of Environment, Forest and Climate Change and Ministry of Power
6.49 Climate Change Action program (CCAP) is a central sector scheme, initially launched in 2014, with a total outlay of ` 290 crores for duration of five years. The scheme has now been extended upto 2025-26, and consists of eight broad sub-components including the National Action Plan on Climate Change (NAPCC) coordination, State Action Plan on Climate Change (SAPCC), National Institute on Climate Change Studies & Actions, National Carbonaceous Aerosols Programme (NCAP), Long Term Ecological Observations (LTEO), International negotiations and capacity building.
6.50 India’s climate actions, especially the adaptation efforts are largely financed domestically. The National Adaptation Fund on Climate Change (NAFCC) was launched in 2015, and 30 projects with a total allocation of 847.5 crores have been sanctioned from 2015-19 (Figure 29). The projects focus on climate sensitive sectors such as agriculture, water, forestry as well as the coastal and Himalayan ecosystem, and are being implemented to enhance the adaptive capacity of the most vulnerable sections of our population and ecosystems.
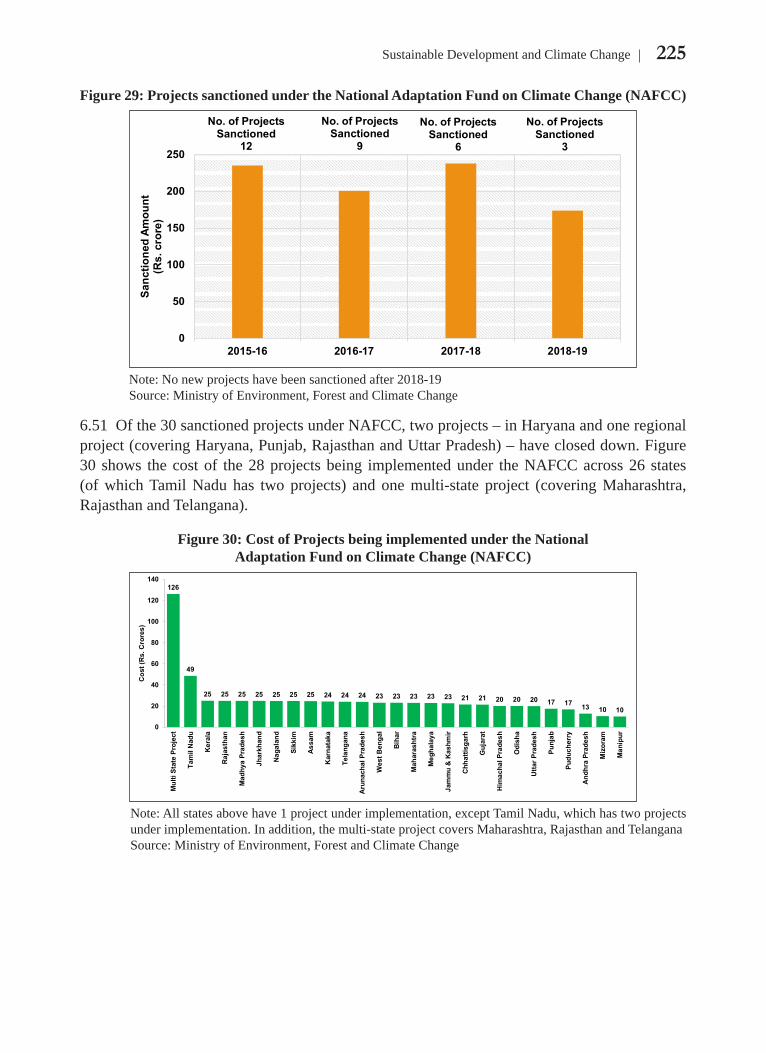
225Sustainable Development and Climate Change
Figure 29: Projects sanctioned under the National Adaptation Fund on Climate Change (NAFCC)
No. of Projects Sanctioned
12
No. of Projects Sanctioned
9
No. of Projects Sanctioned
6
No. of Projects Sanctioned
3
0
50
100
150
200
250
2015-16 2016-17 2017-18 2018-19
Sanc
tione
d Am
ount
(R
s. c
rore
)
Note: No new projects have been sanctioned after 2018-19Source: Ministry of Environment, Forest and Climate Change
6.51 Of the 30 sanctioned projects under NAFCC, two projects – in Haryana and one regional project (covering Haryana, Punjab, Rajasthan and Uttar Pradesh) – have closed down. Figure 30 shows the cost of the 28 projects being implemented under the NAFCC across 26 states (of which Tamil Nadu has two projects) and one multi-state project (covering Maharashtra, Rajasthan and Telangana).
Figure 30: Cost of Projects being implemented under the National Adaptation Fund on Climate Change (NAFCC)
126
49
25 25 25 25 25 25 25 24 24 24 23 23 23 23 23 21 21 20 20 20 17 17 13 10 10
0
20
40
60
80
100
120
140
Mul
ti St
ate
Proj
ect
Tam
il N
adu
Ker
ala
Raja
stha
n
Mad
hya
Prad
esh
Jhar
khan
d
Naga
land
Sikk
im
Assa
m
Kar
nata
ka
Tela
ngan
a
Aru
nach
al P
rade
sh
Wes
t Ben
gal
Biha
r
Mah
aras
htra
Meg
hala
ya
Jam
mu
& K
ashm
ir
Chh
attis
garh
Guj
arat
Him
acha
l Pra
desh
Odi
sha
Utta
r Pra
desh
Punj
ab
Pudu
cher
ry
Andh
ra P
rade
sh
Miz
oram
Man
ipur
Cos
t (R
s. C
rore
s)
Note: All states above have 1 project under implementation, except Tamil Nadu, which has two projects under implementation. In addition, the multi-state project covers Maharashtra, Rajasthan and TelanganaSource: Ministry of Environment, Forest and Climate Change

226 Economic Survey 2021-22
Box 2: Major Initiatives and Achievements
India has announced the National Hydrogen Mission for generating hydrogen from green energy sources. Through technological advancements, hydrogen is being blended with CNG for use as transportation fuel as well as an industrial input to refineries.
On June 5, 2021, the Hon’ble Prime Minister announced 20 per cent ethanol blending in petrol by 2025. The ambitious target, which brings forward the blending target from 2030 to 2025, is a key element of the economy-wide energy transformation. As of September 2021, the country has already reached 8.5 per cent ethanol blending and is on track to achieve the 20 per cent target by 2025. Considerable benefits can accrue to the country by ethanol blending, such as saving USD 4 billion foreign exchange per year in imports, enhancing energy security, lowering carbon emissions, improving air quality, promoting productive use of damaged food grains and waste, increasing farmers’ incomes, creating employment and investment opportunities. The Government is expecting an investment of up to USD 5,541 million to help India achieve its ethanol blending target of 10 per cent by 2022 and 20 per cent by 2025.
Indian Railways has set a target of Net Zero Carbon Emission by 2030, primarily through sourcing its energy requirements through renewable energy sources. Major initiatives undertaken for reduction of carbon emissions include 100 per cent electrification of its network by December 2023, use of three phase technology for regenerative braking, “head on generation” technology eliminating the need for separate diesel fuelled power cars, use of renewable energy source (133.26 MW solar and 103 MW wind installed capacity), provisioning of LED lights at all railway installations, and creation of additional carbon sink by afforestation. Figure below shows the expected CO2 emission reduction by Indian Railways through use of renewable energy.
Expected CO2 emissions reduction by Indian Railways through use of renewable energy
23 25 25 2630
3642
4955
60
23 24 24 21 1914 11 11
6 60
10
20
30
40
50
60
70
2019
-20
2021
-22
2022
-23
2023
-24
2024
-25
2025
-26
2026
-27
2027
-28
2028
-29
2029
-30
CO
2 em
issi
on in
mill
ion
tonn
es
Baseline CO2 emissions
Post implementation CO2 emissions
CO2 emissions reduction
Source: Ministry of Railways
India has launched the Pradhan Mantri Kisan Urja Suraksha evam Utthaan Mahabhiyan (PM-KUSUM) Scheme to provide energy and water security, de-dieselise the farm sector and generate additional income for farmers by producing solar power. The scheme aims to add 30.8 GW of solar capacity with central financial support of over ` 34,000 Crore. It has three components – (a) installation of

227Sustainable Development and Climate Change
10,000 MW of decentralized grid connected solar power plants each of capacity up to 2 MW, (b) setting up of 20 lakh standalone solar powered agriculture pumps, and (c) solarisation of 15 Lakh existing grid-connected agriculture pumps. RBI has included these components under Priority Sector Lending Guidelines for easing availability of finance. As of 31st December, 2021 over 77000 stand-alone solar pumps, 25.25 MW capacity solar power plants and over 1026 pumps were solarised under individual pump solarisation variant. Implementation of feeder level solarisation variant under component C which was introduced in December 2020 has also started in a number of states.
To facilitate large scale grid connected solar power projects, a scheme for “Development of Solar Parks and Ultra Mega Solar Power Projects” is under implementation with a target capacity of 40 GW capacity by March 2024. So far, 50 solar parks have been sanctioned with a combined capacity of 33.82 GW in 14 states. Solar power projects of an aggregate capacity of around 9.2 GW have already been commissioned in these parks.
Roof Top Solar programme Phase-II for accelerated deployment of solar roof top systems, with a target of 40 GW installed capacity by December 2022, is also under implementation. The scheme provides for financial assistance for upto 4 GW of solar roof top capacity to residential sector and there is a provision to incentivise the distribution companies for incremental achievement over the previous year. So far, a cumulative 5.87 GW solar roof top projects have been set up in the country.
A scheme for setting up 12 GW Grid-Connected Solar PV Power Projects by government entities (including Central Public Sector Undertakings) is under implementation. Viability Gap Funding support is provided under this scheme. Under this scheme, Government has so far sanctioned around 8.2 GW of projects.
Phase-III of the Off-Grid Solar PV Applications Programme for Solar Street Lights, Solar Study Lamps and Solar Power Packs was available till 31.03.2021. Till December 2021 over 1.45 lakh solar street lights were installed, 9.14 lakh solar study lamps were distributed and about 2.5 MW solar power packs were set-up as reported by State Nodal agencies.
Government of India has notified the offshore Wind Energy Policy to harness the potential of offshore wind energy along India’s coastline. Ministry of New and Renewable Energy is developing strategy and roadmap for installation of offshore wind projects off the coast of Gujarat and Tamil Nadu. The Ministry has notified the wind solar hybrid policy, providing a framework for promotion of large grid connected wind-solar PV hybrid projects for optimal and efficient utilization of transmission infrastructure and land, reducing the variability in renewable power generation and achieving better grid stability. As of 31st December 2021, capacity of around 4.25 GW of wind-solar hybrid have been awarded, out of which 0.2 GW is already commissioned and additional capacity of 1.2 GW wind-solar hybrid projects are at various stages of bidding.
Major decisions at the COP26 Climate Summit, Glasgow6.52 The 26th Session of the Conference of the Parties (COP 26) to the UNFCCC was held under the UK Presidency in Glasgow from 31st October – 13th November 2021. The 16th Session of the Conference of Parties serving as the meeting of the Parties to the Kyoto Protocol (CMP16), 3rd Session of Conference of the Parties serving as the Meeting of Parties to Paris Agreement (CMA3), Sessions 52-55 of the Subsidiary Body for Scientific and Technological Advice (SBSTA) and the Subsidiary Body for Implementation (SBI) were also held in conjunction

228 Economic Survey 2021-22
with COP26. These sessions were held after a hiatus of one year in 2020 in view of the global COVID-19 pandemic.
6.53 The COP26 adopted outcomes on all pending issues of the “Paris Rule Book”, which is the procedures for implementation of the Paris Agreement, including market mechanisms, transparency, and common timeframes for NDCs. India sought for the just transition for the developing countries with adequate time frame so that the green economy benefits are shared with all.
6.54 The “Glasgow Climate Pact” emphasizes adaptation, mitigation, finance, technology transfer, capacity-building, loss and damage. The decision urges the developed country Parties to fully deliver on the USD 100 billion mobilization goal urgently and through till 2025, and emphasizes the importance of transparency in the implementation of their pledges. It urges developed countries to at least double adaptation finance to developing countries from 2019 levels by 2025. Further, it emphasises the need to significantly increase financial support to developing countries, welcomed initiation of structured deliberations on a new collective quantified goal on climate finance, and looked forward to the ad-hoc work program established under the Paris Agreement from 2022 to 2024 towards this goal. In addition, the Standing Committee on Finance (which is a technical committee under UNFCCC) has now been mandated to work towards arriving at definitions of climate finance.
6.55 COP26 also welcomed the launch of a comprehensive two-year Glasgow–Sharm el-Sheikh work programme on the global goal on adaptation. The Glasgow Dialogue between Parties, relevant organisations and stakeholders on loss and damage was established to explore the ways to fund loss and damage due to climate change. It also decided to convene an annual high-level ministerial round table on pre-2030 ambition, beginning at the fourth session of the Conference of the Parties serving as the meeting of the Parties to the Paris Agreement.
India’s NDC and its voluntary commitment on enhanced climate action.6.56 India’s commitments made under the United Nations Framework Convention on Climate Change (UNFCCC) and its Paris Agreement, reflect the principles of equity, common but differentiated responsibilities and respective capabilities in the light of national circumstances. India’s climate vision is also integrally linked to India’s vision of development that foregrounds the goals of poverty eradication and guaranteeing basic well-being as an immediate necessity to meet the challenge of global warming.
6.57 India submitted its Nationally Determined Contribution (NDC) under the Paris Agreement on a “best effort basis” keeping its developmental imperatives in mind. India committed to (i) reduce the emission intensity of GDP by 33 to 35 per cent by 2030 as compared to 2005 level; (ii) create an additional carbon sink of 2.5 to 3 billion tonnes of CO2 equivalent through additional forest and tree cover by 2030; and (iii) achieve about 40 per cent cumulative electric power installed capacity from non-fossil fuel energy resources by 2030. Against these targets, India’s third Biennial Update Reports (BUR) submitted to the UNFCCC in 2021 reports that during 2005-2016, the country had reduced emission intensity of its GDP by 24 per cent. According to the India State of Forest Report 2021 released in January 2022, the total carbon stock in the country’s forests is estimated to be 7,204 million tonnes, and the carbon stock in forest has

229Sustainable Development and Climate Change
increased by 79.4 million tonnes as compared to the last assessment of 2019. According to the Central Electricity Authority, as on 31st December 2021, the share of non-fossil sources in installed capacity of electricity generation was 40.20 per cent.
6.58 The Hon’ble Prime Minister of India, as a part of the national statement delivered at the 26th Conference of the Parties (COP 26) in Glasgow in November 2021, announced ambitious targets to be achieved by 2030 to enable further reduction in emissions.
6.59 In order to coordinate India’s response on climate change, an institutional framework of a high-level inter-ministerial Apex Committee for the Implementation of Paris Agreement (AIPA) has been created. The Committee reflects India’s whole-of-government approach towards climate action. The purpose of AIPA is to generate a coordinated response on climate change and ensure that India is on track towards meeting its obligations under the Paris Agreement. Year 2021 marks the beginning of the implementation phase of the Paris Agreement and constitution of AIPA is central to strengthening the institutional arrangements for implementation and monitoring of climate actions.
FINANCE FOR SUSTAINABLE DEVELOPMENT Dealing with Financial Risks associated with Climate Change6.60 Climate change-related financial risks pose both micro and macro prudential concerns. In May 2021, the Reserve Bank of India (RBI) set up a new unit–‘Sustainable Finance Group’ (SFG) within its Department of Regulation to effectively counter these risks, and for leading the regulatory initiatives in the areas of sustainable finance and climate risk. The SFG is co-ordinating with, and participating in issues relating to sustainable finance or climate risk, with the international standard setting / co-operation bodies, other central banks, other financial sector regulators and the Government of India. The group would also be instrumental in suggesting strategies and evolving a regulatory framework, including appropriate climate-related disclosures, which could be prescribed for banks and other regulated entities to propagate sustainable practices and mitigate climate-related risks in the Indian context.
6.61 To assess the progress of its regulated entities in managing climate risk, RBI is preparing a consultative discussion paper covering, inter alia, (i) governance, (ii) strategy, (iii) risk management, and (iv) disclosure. The discussion paper will sensitize regulated entities to incorporate climate-related and environmental risks in their business strategies, governance and risk management frameworks. In line with the international best practices, banks will be guided to adopt a forward-looking, comprehensive, and strategic approach to climate-related risks.
Augmenting Finance for Sustainable Development6.62 In January 2021, a Task Force on Sustainable Finance has been set up by the Department of Economic Affairs, Ministry of Finance, Government of India. The Terms of Reference of the Task Force include defining the framework for sustainable finance in India, establishing the pillars for a sustainable finance roadmap, suggesting draft taxonomy of sustainable activities and a framework of risk assessment by the financial sector.

230 Economic Survey 2021-22
6.63 India is actively contributing to the global efforts towards green finance. RBI joined the Central Banks and Supervisors Network for Greening the Financial System (NGFS) as a member on April 23rd, 2021 and has begun participating in the work streams of the NGFS. On November 3, 2021, RBI published a ‘Statement of Commitment to Support Greening India’s Financial System - NGFS’ and committed to: i. Exploring how climate scenario exercises can be used to identify vulnerabilities in RBI
supervised entities' balance sheets, business models and gaps in their capabilities for measuring and managing climate-related financial risks
ii. lntegrating climate-related risks into financial stability monitoring iii. Building awareness about climate-related risks among regulated financial institutions
and spreading knowledge about issues relating to climate change and methods to deal with them accordingly.
6.64 The liberalised External Commercial Borrowings (ECB) norms of RBI have enabled the Indian renewable energy companies and other firms to tap the ECB route for raising finance through green bonds and sustainable bonds, reflecting the growing attractiveness of this route for raising finance.
6.65 India is also a part of several bilateral and global sustainable finance initiatives. RBI is a member of a Task Force on Climate-related Financial Risks set up by the Basel Committee on Banking Supervision, and the International Platform on Sustainable Finance. The latter is a forum of public authorities from 17 countries, which is working on Environmental, Social and Governance (ESG) Disclosures and a Sustainable Finance Taxonomy. In October 2021, RBI has also been featured in the first Annual Report on Sustainable Financial Regulations and Central Bank Activities published by the World Wide Fund for Nature.
Investing in Resilience for Sustainable Development6.66 There has been an increasing recognition that ESG issues can put the performance of companies at risk. In this regard, SEBI has been one of the early adopters of sustainability reporting for listed entities and requires mandatory ESG related disclosures as part of the Business Responsibility Report (BRR), for the top 100 listed entities (by market capitalisation) since 2012. The above requirement of filing BRR was progressively extended to the top 500 entities (from financial year 2016-17) and later to the top 1000 listed entities (from the financial year 2019-20). SEBI in February 2017, had encouraged the top 500 listed entities to adopt the framework of Integrated Reporting, issued by the International Integrated Reporting Council, on a voluntary basis.
6.67 In May 2021, SEBI issued new sustainability reporting requirements as per the Business Responsibility and Sustainability Report (BRSR) which shall replace the existing BRR to bring in greater transparency through disclosure of ESG-related information and by enabling market participants to identify and assess sustainability-related risks and opportunities. The BRSR is more outcome oriented and is focussed on having granular and quantifiable metrics, seeking disclosures from listed entities on their performance against the nine principles of the ‘National Guidelines on Responsible Business Conduct’. The disclosures under each of these principles

231Sustainable Development and Climate Change
are segregated into essential (mandatory) and leadership (voluntary) indicators. The BRSR shall be applicable to the top 1000 listed entities (by market capitalisation) on a mandatory basis from FY 2022–23; however, entities can choose to adopt it on a voluntary basis from FY 2021–22.
INDIA’S INITIATIVES AT THE INTERNATIONAL STAGE Lifestyle for Environment (LIFE)
6.68 In November 2021, the Hon’ble Prime Minister proposed a One-Word Movement in the context of climate: LIFE - Lifestyle for Environment, at the COP 26 in Glasgow. This movement calls for coming together with collective participation, to take lifestyle for environment forward as a campaign and as a mass movement for environmentally conscious life style in a manner that revolutionizes many sectors and diverse areas such as fishing, agriculture, wellness, dietary choices, packaging, housing, hospitality, tourism, clothing, fashion, water management and energy.
International Solar Alliance (ISA)6.69 In November 2021, the Hon’ble Prime Minister launched the joint Green Grids Initiative-One Sun One World One Grid (GGI –OSOWOG) at the World Leaders’ Summit in Glasgow. It aims to create a globally inter-connected green grid, building upon existing regional grid infrastructure, which will enable solar energy generation in regions with high potential and its evacuation to demand centres. A joint GGI-OSOWOG Secretariat is being planned to be established at the ISA Secretariat to mobilize political support and render technical support for the initiative.
6.70 ISA has attained a Permanent Observer Status at the UN General Assembly. It has signed a Memorandum of Understanding with UNFCCC at COP 26 to support ISA membership in developing a roadmap for, and implementing, their respective NDCs under the Paris Agreement.
6.71 ISA is mandated to facilitate mobilization of USD 1 trillion in solar investments by 2030 for massive scale-up of solar energy deployment. The Strategic Plan of the ISA for 2021-2026 identifies three key global issues – Energy Access, Energy Security, and Energy Transition. In this regard, ISA has launched eight thematic programmes to address the above issues and an overarching programme to facilitate mobilization of affordable finance for large-scale deployment of solar energy across ISA membership. ISA supports its membership across four pillars encompassing programmatic support, capacity building and ecosystem readiness, risk mitigation instruments, and analytics and advocacy.
Coalition for Disaster Resilient Infrastructure6.72 India’s call for promoting disaster resilience of infrastructure through the Coalition for Disaster Resilient Infrastructure (CDRI) has been receiving global attention. Since CDRI’s launch in September 2019, its membership has expanded to 28 countries and seven multilateral organizations, with several member countries committing to provide technical assistance and financial resources. In addition to India’s seed funding of USD 70 million, the United Kingdom, United States and the Netherlands have pledged GBP 1 million, USD 9.2 million and 100,000 Euro respectively for CDRI’s programmes and projects.

232 Economic Survey 2021-22
6.73 In March 2021, the Hon’ble Prime Ministers of India, UK, Italy and Fiji launched the third International Conference on Disaster Resilient Infrastructure (ICDRI), which discussed key global issues around resilience of critical infrastructure sectors such as power, telecommunications and health as well as urban infrastructure systems and disaster risk financing.
6.74 In November 2021, the Hon’ble Prime Ministers of India, UK, Australia, Fiji, Jamaica and Mauritius launched the Infrastructure for Resilient Island States (IRIS). This is a dedicated initiative for Small Island Developing States (SIDS) that provides quality technical and financial services to make SIDS infrastructure resilient to climate change and disaster events. India has pledged USD 10 million, while Australia and the UK have pledged AUD 10 million GBP 7.3 million respectively for the IRIS initiative.
6.75 Further, CDRI has launched two other initiatives. CDRI’s Global Flagship Report on Disaster and Climate Resilient Infrastructure aims to engage and focus global attention on the critical and multi-faceted challenges posed to disaster and climate-resilient infrastructure. DRI Connect is a "network of networks" enabling stakeholder access to knowledge resources and collaborative opportunities with their peers and other actors. These initiatives are in addition to CDRI’s ongoing programmes on enhancing the power sector's resilience in Odisha and the global study on disaster resilience of airports.
Leadership Group for Industry Transition (LeadIT Group)6.76 LeadIT was launched by India and Sweden, with the support of the World Economic Forum at the UN Climate Action Summit in New York in September 2019, as one of the nine action tracks identified by the UN Secretary-General to boost climate ambitions and actions to implement the Paris Agreement. In November 2021, the Joint Ministerial Statement released at the Leadership Summit called countries and companies to come out with roadmaps for deep reductions in emissions across all heavy industries and value chains in the coming decade.
CONCLUSION6.77 India’s performance on the NITI Aayog SDG India Index has improved from an overall score of 60 in 2019-20 to 66 in 2020-21. India has also been making significant strides in increasing its forest area, ranking third globally in net gain in forest area during the decade (2010-20). Much of India’s increase in forest cover during 2011-21 is attributed to enhancement in very dense forest cover, which rose by approximately 20 per cent during the period. Open forest cover also improved by seven per cent during the period. Going forward, there is need to further improve forest and tree cover. Social forestry could also play a significant role in this regard.
6.78 States/UTs need to improve management of its ground water resources through improving its recharge and by stemming its over-exploitation, and to prevent the critical and semi-critical assessment units from further worsening.
6.79 There is a greater thrust on climate action following the announcement of India’s target of becoming Net Zero by 2070. Climate finance will remain critical to successful climate action by developing countries, including India.

233Sustainable Development and Climate Change
REFERENCESForest Survey of India. 2021. India State of Forest Report 2021. https://fsi.nic.in/forest-report-2021-detailsForest Survey of India. 2011. India State of Forest Report 2011. https://fsi.nic.in/forest-report-2011Ministry of Jal Shakti. 2021. National Compilation on Dynamic Ground Water Resources of India, 2020.http://cgwb.gov.in/documents/2021-08-02-GWRA_India_2020.pdfNITI Aayog. 2021. North Eastern Region District SDG Index & Dashboard Baseline Report 2021-22. https://www.niti.gov.in/sites/default/files/2021-08/NER_SDG_Index_NITI_26082021.pdfNITI Aayog. 2021. SDG India Index & Dashboard 2020-21 Partnerships in the Decade of Action.https://www.niti.gov.in/writereaddata/files/SDG_3.0_Final_04.03.2021_Web_Spreads.pdfNITI Aayog. 2019. SDG India Index & Dashboard 2019-20.https://www.niti.gov.in/sites/default/files/SDG-India-Index-2.0_27-Dec.pdf

CHAPTER
07
The agriculture sector has experienced buoyant growth in the past two years. The sector, which is the largest employer of workforce, accounted for a sizeable 18.8 per cent (2021-22) in Gross Value Added (GVA) of the country registering a growth of 3.6 per cent in 2020-21 and 3.9 per cent in 2021-22. Growth in allied sectors including livestock, dairying and fisheries has been the major drivers of overall growth in the sector.
The measures taken by the Government to augment production and domestic supply of oilseeds and edible oils, interventions made in the sugar sector and promotion of crop diversification are examined. The need for sustainable agriculture through water conservation in irrigation and natural farming and need to promote research and development to improve crop productivity, mechanization, etc. is highlighted. It also discusses how Minimum Support Price (MSP) policy is being used to promote crop diversification. In addition to this, some important findings of the latest Situation Assessment Survey (SAS) have also been discussed. The net receipts from crop production alone have increased by 22.6 per cent as compared to the previous SAS Report of 2014 although there is a visible diversification in the sources of income of the farmers.
Allied sectors including animal husbandry, dairying and fishing are steadily emerging to be high growth sectors. The livestock sector has grown at a CAGR of 8.15 per cent over the last five years ending 2019-20. As revealed by the latest SAS, the sector has been a stable source of income across groups of agricultural households accounting for about 15 per cent of their average monthly income. This improvement in the contribution of allied sectors is in line with the recommendations of the Committee on Doubling Farmers’ Income which has suggested a greater focus on allied sectors to improve farmers’ income. A review of the allied sectors along with the recent programmes and initiatives to harness its potential has also been presented.
The Government has placed focus on the food processing sector, which is not only a major market of agriculture produce but is also a significant employer of the surplus workforce engaged in agriculture. Government therefore facilitates food processing through various measures of infrastructure development, subsidised transportation and support for formalization of micro food enterprises.
India runs one of the largest food management programmes in the world. The Government has further extended the coverage of food security network through additional provisions
Agriculture & Food Management

235Agriculture & Food Management
INTRODUCTION7.1 The agriculture and allied sectors grew at a positive growth rate of 3.6 per cent during 2020-21. This became possible due to good monsoon and various government measures to enhance credit availability, improve investments, create market facilities, promote infrastructure development in the agriculture sector and increase provision of quality inputs to the sector. The timely intervention in the form of Atma Nirbhar Bharat (ANB) Abhiyan coupled with other growth promoting schemes (ANB and other schemes are discussed under respective sections) have further helped agriculture to achieve an improved growth of 3.9 per cent in 2021-22. Figure 1 presents the performance of the agriculture and allied sectors for the last five and half years.
Figure 1: Growth of Agriculture and Allied Sectors (per cent)
Source: First Advance Estimates of National Income, 2021-22
7.2 The growth of agriculture & allied sectors as shown in the Figure 1 should be read with Figure 2 depicting the growth in the four constituents of agriculture & allied sectors namely crops, livestock, forestry & logging and fishing & aquaculture. It is observed that livestock and fisheries have been experiencing buoyant growth and has helped the sector perform well. For instance in 2018-19 the growth in the agriculture was buoyed by the performance of livestock and fisheries even though the growth of GVA for crops was -1.6 per cent.
of foodgrains through the schemes like PM Gareeb Kalyan Yojana (PMGKY). A review of India’s food management programme including food procurement, allocation, storage and the issue of food subsidy along with various Government measures for effective food and nutritional security is also presented at length in the chapter. The chapter ends with a review of the performance of fertilizer sector.

236 Economic Survey 2021-22
Figure 2: Growth of GVA of Agriculture & Allied Sector (at 2011-12 prices)
Source: Based on data received from Department of Agriculture & Farmers Welfare (DAFW).*Third revised estimate, #second revised estimate, @ First Revised Estimates released on 29th January, 2021.
GROSS VALUE ADDED (GVA) IN AGRICULTURE7.3 A trend in the percentage share of agriculture and allied sectors to total GVA of the economy at current prices for the last ten years is presented in Figure 3. The share of the sector in total GVA of the economy has a long-term trend of around 18 per cent. The share of the agriculture & allied sector in total GVA, however, improved to 20.2 per cent in the year 2020-21 and 18.8 per cent in 2021-22.
Figure 3: Percentage Share of GVA of Agriculture & Allied Sector to Total GVA (at current prices)
Source: Based on data of DAFW. *As per 1st Advance Estimates of National Income, 2021-22.
7.4 A trend in the distribution of share of GVA of agriculture among its constituents is presented in Figure 4. Higher growth in allied sectors as compared to crop sector has obvious implications in terms of increasing importance of the former in total agricultural GVA vis-a-vis the later. It may be observed that the share of the livestock and fishing & aquaculture in total agricultural GVA has been improving during the period. Recognising the increasing importance of allied sectors, the Committee on Doubling Farmers’ Income (DFI, 2018) considers dairying, livestock, poultry, fisheries and horticulture as engines of high growth and has recommended a focussed policy with a concomitant support system.

237Agriculture & Food Management
Figure 4: Percentage Share of GVA of Crop & Allied Sectors in Total Agriculture GVA (at current prices)
Source: Based on data of DAFW.
Investment in Agriculture and Allied Sectors
7.5 Investment is critical to the growth of a sector. The Gross Capital Formation (GCF) in agriculture and allied sectors relative to GVA in the sector has been showing a fluctuating trend as shown in Figure 5. Fluctuation in the GCF in the sector arises mainly because of wide fluctuations in private investment in agriculture and allied sectors. As may be observed in the Figure 5, while public investment has remained stable between 2-3 per cent over the years, the private investment has fluctuated and the total agricultural GCF has moved in sync with variation in private investment.
7.6 Recognising that there exists a direct correlation between capital investments in agriculture and its growth rate, there should be a focused and targeted approach to ensure higher public and private investment in the sector. Higher access to concessional institutional credit to farmers and greater participation of private corporate sector, whose investment rates are currently as low as 2 to 3 per cent in agriculture1, may help in improving private investment in agriculture. Private corporate investments need to be crowded in by offering an appropriate policy framework and increase in public investment along the entire agricultural value system.
1. Report of the Doubling Farmers’ Income, 2018.

238 Economic Survey 2021-22
Figure 5: Percentage Share of GCF in Agriculture and Allied Sectors Relative to Its GVA (at 2011-12 basic prices)
Source: Based on data of DAFW and Agricultural Statistics at a Glance, 2020.
Agricultural Production
7.7 As per Fourth Advance Estimates for 2020-21, total foodgrain production in the country is estimated at a record 308.65 million tonnes which is 11.15 million tonnes higher than that during 2019-20. The production of rice, wheat and coarse cereals has increased at compound annual growth rates (CAGR) of 2.7, 2.9 and 4.8 per cent respectively during last six years i.e. 2015-16 to 2020-21. The CAGR for pulses, oilseeds and cotton has been 7.9, 6.1 and 2.8 per cent, respectively during the same period. Figure 6 depicts the trend in agricultural production over the past six years.
Figure 6: Trend in Agricultural Production (Million Tonnes)
Source: Based on data received from DAFW.# Million bales of 170 kg each.
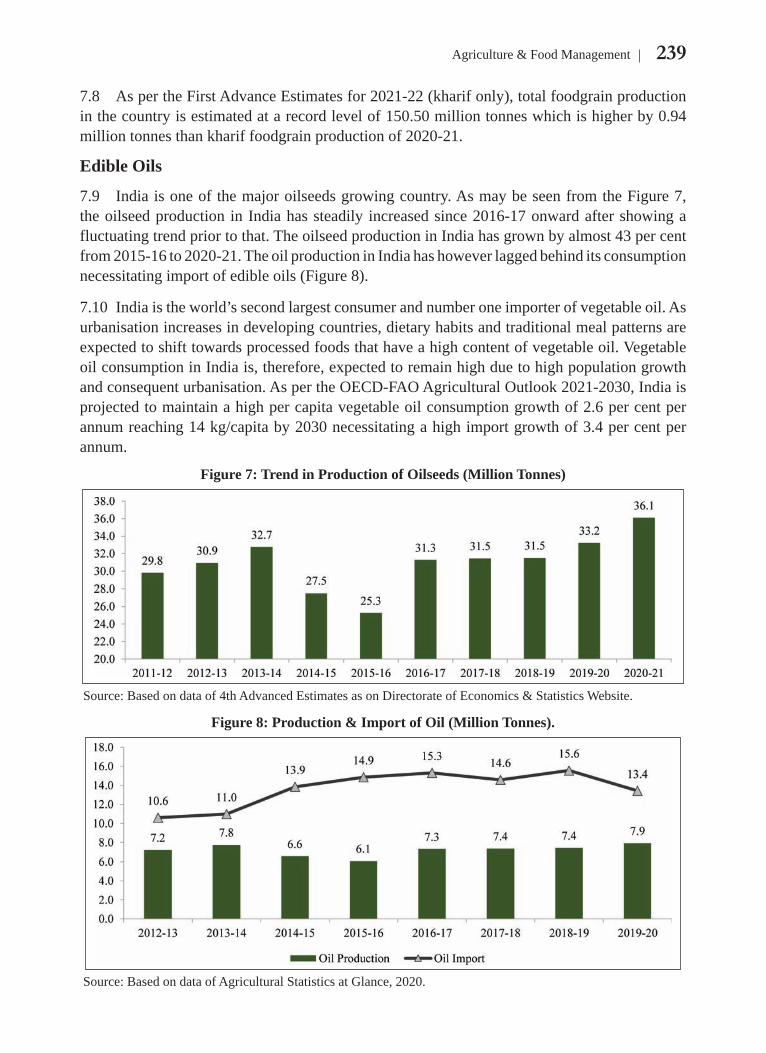
239Agriculture & Food Management
7.8 As per the First Advance Estimates for 2021-22 (kharif only), total foodgrain production in the country is estimated at a record level of 150.50 million tonnes which is higher by 0.94 million tonnes than kharif foodgrain production of 2020-21.
Edible Oils
7.9 India is one of the major oilseeds growing country. As may be seen from the Figure 7, the oilseed production in India has steadily increased since 2016-17 onward after showing a fluctuating trend prior to that. The oilseed production in India has grown by almost 43 per cent from 2015-16 to 2020-21. The oil production in India has however lagged behind its consumption necessitating import of edible oils (Figure 8).
7.10 India is the world’s second largest consumer and number one importer of vegetable oil. As urbanisation increases in developing countries, dietary habits and traditional meal patterns are expected to shift towards processed foods that have a high content of vegetable oil. Vegetable oil consumption in India is, therefore, expected to remain high due to high population growth and consequent urbanisation. As per the OECD-FAO Agricultural Outlook 2021-2030, India is projected to maintain a high per capita vegetable oil consumption growth of 2.6 per cent per annum reaching 14 kg/capita by 2030 necessitating a high import growth of 3.4 per cent per annum.
Figure 7: Trend in Production of Oilseeds (Million Tonnes)
Source: Based on data of 4th Advanced Estimates as on Directorate of Economics & Statistics Website.
Figure 8: Production & Import of Oil (Million Tonnes).
Source: Based on data of Agricultural Statistics at Glance, 2020.

240 Economic Survey 2021-22
7.11 In view of the persistently high import of edible oil, increase in oil production has been a priority for the Government. The Government is promoting the production and productivity of oilseeds through the centrally sponsored scheme of National Food Security Mission: Oilseeds (NFSM-Oilseeds) from 2018-19 onwards in all districts of India. Under this scheme, interventions such as production of foundation and certified seed and distribution of certified seeds and seed minikits of latest high yielding varieties are undertaken. Under the NFSM (Oilseeds), Government of India has set up 36 oilseeds seed hubs during 2018-19 and 2019-20 with an objective to increase the availability of high yielding quality seed. For Kharif 2021, a total of 9.25 lakh number of oilseed mini kits of high yielding varieties have been allocated for distribution in all the major oilseed growing states. Also, Government has through MSP regime been providing price signal for crop diversification towards production of oil seed (discussed later in the chapter).
7.12 Further, in August, 2021, National Mission on Edible Oils - Oil Palm (NMEO-OP) has been launched to augment the availability of edible oil in the country by harnessing area expansion and through price incentives. Under the scheme, for the first time, Government will give a price assurance to the oil palm farmers for the Fresh Fruit Bunches (FFBs). This will be known as the Viability Price (VP) which will protect the farmers from the fluctuations of the international crude palm oil (CPO) prices.
7.13 India has enormous potential for cultivation of oil palm and production of CPO. At present only 3.70 lakh hectares is under oil palm cultivation. Oil palm produces 10 to 46 times more oil per hectare compared to other oilseed crops and has yield of around 4 tons oil per ha. Given the fact that that even today around 98 per cent of CPO is being imported (production and import of palm oil are shown in Figure 9); the NMEO-OP may be considered a major initiative of the Government. The scheme aims to cover an additional area of 6.5 lakh hectares for oil palm till 2025-26 and thereby reach the target of 10 lakh hectares ultimately. Also, the scheme targets the production of CPO to go up to 11.20 lakh tonnes by 2025-26 and up to 28 lakh tonnes by 2029-30.
Figure 9: Production and Import of Palm Oil (Lakh Ton)
Source: Based on data of Agriculture Statistics at Glance, 2020 and DAFW.

241Agriculture & Food Management
Sugar Sector
7.14 Significance of sugarcane and sugar industry for India’s economy can be gauged from the fact that it is the country’s second largest agro-based industry, next to cotton. It impacts the livelihood of over 5 crore farmers and their dependents. India is the largest consumer and the second-largest producer of sugar in the world. Average annual production of sugarcane is around 35.5 crore tonnes which is used to produce around 3 crore tonnes of sugar. The domestic consumption is estimated to be around 2.6 crore tonnes in 2020-21. Over the years, India has become a sugar surplus nation as reflected from the trend of sugar production and consumption in Figure 10. Since 2010-11, production has outstripped consumption except in 2016-17.
7.15 This has been possible because of various measures undertaken by Government. For example, the interest of the farmers is protected by Fair and Remunerative Price (FRP)2 which has doubled in a span of ten years (Figure 11). In addition, some state governments announce State Advised Price (SAP) at levels higher than FRP. Additionally, sugar mills that buy sugarcane are mandated to purchase crops from farmers within a specified radius known as the Cane Reservation Area. In this way, sugarcane farmers are insured and protected against price risk.
Figure 10: Production and Consumption Levels of Sugar (Million Tonnes)
Source: Based on data of CACP Report on Sugarcane.
7.16 Moreover, in order to handle the surplus production and enhance liquidity of mills, the Government has taken various steps such as incentivising sugar mills to divert excess sugar cane/sugar to ethanol production, providing financial assistance for transport to sugar mills to facilitate export of sugar, etc. About 70 LMT of sugar has been exported in sugar season 2020-21 in comparison to 59.60 LMT of sugar export in sugar season 2019-20. Further, contracts of about 30 LMT for export of sugar have already been signed in the sugar season 2021-22. Moreover, in the past four sugar seasons ending 2020-21, revenue of about ₹ 35000 crore has been generated by sugar mills/distilleries from sale of ethanol to Oil Marketing Companies which has helped in clearing cane price arrears of farmers..
2. FRP is the minimum price at which sugarcane is to be purchased by sugar mills from farmers.

242 Economic Survey 2021-22
Figure 11: Trend in Fair & Remunerative Price (₹ /quintal)
Source: Based on data of CACP website.
Price Policy: Minimum Support Price (MSP)
7.17 The Government’s price policy for major agricultural commodities seeks to ensure remunerative prices to the growers for their produce with a view to encourage higher investment and production and thereby to safeguard the interest of consumers by making available supplies at reasonable prices. The Government fixes MSP of 22 mandated agricultural crops on the basis of the recommendations of Commission for Agricultural Costs & Prices (CACP) and after due consideration of the views of State Governments and the concerned Central Ministries/Departments. The 22 mandated crops include 14 Kharif crops viz. paddy, jowar, bajra, maize, ragi, tur (arhar), moong, urad, groundnut, soybean (yellow), sunflower seed, sesamum, nigerseed, cotton and 6 Rabi crops viz. wheat, barley, gram, masur (lentil), rapeseed and mustard, safflower and 2 commercial crops viz. jute and copra. In addition to that, MSP for toria and de-husked coconut are also fixed on the basis of MSPs of rapeseed & mustard and copra respectively.
7.18 While recommending MSPs, CACP considers important factors like cost of production, overall demand-supply conditions, domestic and international prices, inter-crop price parity, terms of trade between agricultural and non-agricultural sectors, the likely effect on the rest of the economy, besides ensuring rational utilization of land, water and other production resources and a minimum of 50 per cent as the margin over cost of production.
7.19 The Union Budget for 2018-19 had announced the pre-determined principle to keep MSP at the level of one and half times of the cost of production. Accordingly, Government had increased the MSP for all mandated Kharif, Rabi and other commercial crops with a return of at least 50 per cent over all India weighted average cost of production from the agricultural year 2018-19 onwards.
7.20 In line with the same principle, Government has announced the increase in MSP for all mandated kharif crops of year 2021-22. The highest absolute increase in MSP over the previous year has been recommended for sesamum (₹ 452 per quintal) followed by tur and urad (₹ 300 per quintal each). In case of groundnut and nigerseed, there has been an increase of ₹ 275 per quintal and ₹ 235 per quintal respectively in comparison to last year. The expected returns to farmers over cost of production is estimated to be highest in case of bajra (85 per cent). For urad and tur, return to farmers over cost of production is estimated at 65 per cent and 62 per cent respectively. For the rest of the crops, return to farmers is estimated to be at least 50 per cent (Figure 12).

243Agriculture & Food Management
Figure 12: Cost, MSP & Returns of Kharif Crops for the year 2021-22.
Source: DAFW
7.21 Government also announced the MSPs for all mandated Rabi crops for Rabi Marketing Season 2021-22. In view of nutritional requirements, changing dietary pattern and to achieve self-sufficiency in pulses and oilseeds production, the Government has fixed relatively higher MSP for these crops (Figure 13). The highest increase in MSP has been recommended for lentil (masur) and rapeseed & mustard at ₹ 400 per quintal each followed by gram at ₹ 130 per quintal and safflower at ₹ 114 per quintal. The expected returns to farmers over their cost of production are estimated to be highest in case of wheat and rapeseed & mustard at 100 per cent each. For masur (lentil) and gram, return to farmers over cost of production is estimated at 79 per cent and 74 per cent respectively and for barley and safflower, it is 60 per cent and 50 per cent respectively. The differential remuneration is aimed at encouraging crop diversification.
Figure 13: Cost, MSP & Returns of Rabi Crops of year 2021-22
Source: DAFW
Crop Diversification
7.22 Crop diversification can be used as a tool to promote sustainable agriculture, reduction in import dependence and higher incomes for the farmers. The report of the DFI Committee suggests that shifting some area from staple cereals to high value produce can lead to a sizable increase in the returns for farmers. The Report further states that this would also bring in water

244 Economic Survey 2021-22
use efficiency and sustainability of soil health. The existing cropping pattern is skewed towards cultivation of sugarcane, paddy and wheat which has led to depletion of fresh ground water resources at an alarming rate in many parts of our country. Map 1 shows baseline water stress3 for different regions of India. It shows that the regions where the crops like paddy, wheat and sugarcane are grown have high to extremely high stress levels.
Map 1: Baseline Water Stress in Various Parts of India in 2015
Source: World Resources Institute
7.23 In view of the above, Crops Diversification Programme (CDP) is being implemented in the original green revolution states viz. Punjab, Haryana and Western UP as a sub scheme of Rashtriya Krishi Vikas Yojana (RKVY) since 2013-14 to shift area under paddy cultivation towards less water requiring crops such as oilseeds, pulses, coarse cereals, nutri cereals, cotton, etc. The CDP also focuses on shifting of areas under tobacco farming to alternative crops/cropping system in tobacco growing States, namely, Andhra Pradesh, Bihar, Gujarat, Karnataka, 3. Baseline water stress implies the ratio of total annual water withdrawals to total available annual
renewable supply

245Agriculture & Food Management
Maharashtra, Odisha, Tamil Nadu, Telangana, Uttar Pradesh and West Bengal with effect from 2015-16. An amount of ₹ 120 crore as Central Share (₹ 110 crore to CDP in Original Green Revolution States and ₹ 10 crore to CDP for replacing tobacco farming) have been earmarked for implementation of the programme during 2021-22.
7.24 Crop diversification in India has been targeted through price policy also. Incentive structure provided under MSP regime leading to variation in return over cost across crops has bearing on crop diversification as well. Figures 14 and 15 show an inter-temporal variation in return in selected crops for both Kharif and Rabi seasons.
Figure 14: Variation in Return over Cost (per cent) for crops across Kharif Marketing Seasons
Figure 15: Variation in Return over Cost (per cent) for crops across Rabi Marketing Seasons
Source: Based on data from CACP.
Agricultural Credit
7.25 The agriculture credit flow for the year 2020-21 was ₹ 15,75,398 crore against the target of ₹ 15,00,000 crore for the year. The agriculture credit flow target for 2021-22 has been fixed at ₹ 16,50,000 crore and till 30th September, 2021 against this target a sum of ₹ 7,36,589.05 crore has been disbursed. Moreover, as a part of the ANB announcement, Government announced ₹ 2 lakh crore concessional credit boost to 2.5 crore farmers through Kisan Credit Cards (KCCs). In pursuance of this, as on 17th January 2022, banks have issued KCC to 2.70 crore eligible farmers. Apart from this, to address the credit needs of animal husbandry and fish farmers, the Government of India in 2018-19 extended the facility of KCC to fisheries and animal husbandry farmers to help them meet their working capital needs. In pursuance to this, a total of 67,581 KCCs have been issued to fishers and fish farmers by 17th December, 2021 and over 14 lakh fresh KCCs were sanctioned for animal husbandry and dairying farmers by 10th of December, 2021.
Water and Irrigation
7.26 Water is a critical input for agriculture which accounts for about 80 per cent of the current water use in the country. The share of net irrigated area accounts for about 49 per cent of the total net sown area in the country and out of the net irrigated area, about 40 per cent is irrigated through canal systems and 60 per cent through groundwater.

246 Economic Survey 2021-22
7.27 The overall stage of ground water development (ratio of annual ground water draft and net annual ground water availability) in the country is 63 per cent4. This ratio which signifies the rate of extraction of ground water, is very high (more than 100 per cent) in the states of Delhi, Haryana, Punjab and Rajasthan. Himachal Pradesh, Tamil Nadu, Uttar Pradesh and UTs of Chandigarh and Puducherry falls in the medium category with the ratio ranging between 70-100 per cent (Map 2). These States may need to focus on both medium and long term ground water recharge and conservation plans.
Map 2: State of groundwater extraction in 2020 (in per cent)*
Source: Ground water yearbook, 2019-20* Assessment as on 2013 has been considered for the state of West Bengal and data for erstwhile state of J&K is used for UTs of J&K and Ladakh.
7.28 Increased coverage under micro irrigation can be the most effective mode of water conservation. With the objective of facilitating the States in mobilising resources for expanding coverage of micro irrigation, a Micro Irrigation Fund (MIF) with corpus of ₹ 5000 crore was created with National Bank for Agriculture and Rural Development (NABARD) during 2018-
4. Ground water yearbook, 2019-20

247Agriculture & Food Management
19. As on 01.12.2021, projects with loans under MIF amounting to ₹ 3970.17 crore have been approved for 12.81 lakh ha of Micro Irrigation area. Moreover, the Government of India is promoting micro irrigation viz. Drip and Sprinkler Systems in the Country for enhancing water use efficiency at farm level under the Per Drop More Crop component of Pradhan Mantri Krishi Sinchayee Yojana (PMKSY-PDMC) from 2015-16. Under PMKSY-PDMC, as on 14.12.2021, total area of 59.37 lakh ha has been covered under micro irrigation in the country from 2015-16.
Agricultural Marketing
7.29 Wholesale agricultural marketing is undertaken by the network of 6946 regulated wholesale markets, set up under the provision of respective State Agricultural Produce Market Committee (APMC) Act. The Government of India has been working continuously and has taken several concrete steps to link the farmers with markets in order to help the farmers in trading and realising competitive and remunerative prices for their produce. For example, APMCs, have been recognized as one of the eligible entities under Agriculture Infrastructure Fund (AIF) to further strengthen the infrastructure in APMC mandis. All loans under the AIF have interest subvention of 3 per cent per annum up to a limit of ₹ 2 crores. This subvention is available for a maximum period of 7 years. APMCs are eligible for multiple projects (of different infrastructure types) within their designated market area. In such cases, interest subvention for a loan up to ₹ 2 crores will be provided for each project of different infrastructure types e.g. cold storage, sorting, grading and assaying units, silos, etc. within the designated market area of the APMC.
7.30 Further, Government of India launched National Agriculture Market (e-NAM) Scheme in 2016 with the objective of creating online transparent competitive bidding system to facilitate farmers with remunerative prices for their produce. Under the e-NAM Scheme, Government is providing free software and assistance of ₹ 75 Lakh per APMC mandi for related hardware including quality assaying equipment and creation of infrastructure like cleaning, grading, sorting, packaging and compost unit etc. As on 1st of December, 2021, 1000 mandis of 18 States and 3 UTs have been integrated with e-NAM platform.
7.31 The Government of India has launched a Central Sector Scheme of “Formation and Promotion of 10,000 Farmer Producer Organizations (FPOs)” to form and promote 10,000 new FPOs till 2027-28. Under the scheme, the formation and promotion of FPO is based on Produce Cluster Area approach and specialized commodity-based approach. While adopting cluster-based approach, formation of FPOs focuses on “One District One Product” to enable product specialization. One of the objectives of the Scheme is to enhance productivity through efficient, cost-effective and sustainable resource use and realize higher returns through better liquidity and market linkages for their produce and to become sustainable through collective action. As of January 2022, a total of 1963 FPOs have been registered under the scheme. The Government has established a full-fledged Ministry of Cooperation in July, 2021 with a view to provide greater focus to the cooperative sector.
Box 1: Sweet Revolution
Keeping in view the importance of beekeeping as part of the Integrated Farming System (IFS) in the country, government approved the allocation of ₹ 500 crore for National Beekeeping & Honey Mission (NBHM) for three years (2020-21 to 2022-23). The mission was announced as a part of the

248 Economic Survey 2021-22
ANB scheme. NBHM aims for the overall promotion & development of scientific beekeeping in the country to achieve the goal of ‘Sweet Revolution’ which is being implemented through National Bee Board (NBB). Total 45 projects for assistance of ₹ 88.87 crores have been approved/sanctioned for funding under NBHM as on 17.12.2021.
Beekeeping is an agro-based activity which is being undertaken by farmers/ landless labourers in rural area as a part of the IFS. Beekeeping has been useful in pollination of crops, thereby, increasing income of the farmers/beekeepers by way of increasing crop yield and providing honey and other high value beehive products, viz.; bee wax, bee pollen, propolis, royal jelly, bee venom, etc. Diversified agro climatic conditions of India provide great potential and opportunities for beekeeping/honey production and export of honey. India’s export of honey has increased by about 110 per cent between 2013-14 to 2019-20.
SITUATION ASSESSMENT SURVEY7.32 National Statistical Office (NSO) in its 77th round of survey, conducted during the period 1st January 2019 to 31st December 2019, carried out a survey on “Land and Livestock Holdings of Households and Situation Assessment of Agricultural Households” (henceforth referred as SAS in this Chapter) in the rural areas of India. The Report was released in September, 2021. The last SAS was published in 2014.
7.33 The SAS reports, apart from various other socio-economic aspects of agricultural households, they also reveal insights on their income and its sources. The SAS, 2021 reveals that the average monthly income per agricultural household, as per paid out expenses approach, works out to be ₹ 10218. The average monthly income per agricultural household was ₹ 6426 as per the last SAS Report of 2014 estimated by the same approach. The sources of the incomes as per the two SAS Reports are presented in Figure 16.
Figure 16: Composition of Average Monthly Income of Agricultural Households
Source: Based on data of SAS, 2014 and SAS, 2021.
7.34 The SAS Report, 2021 also shows class-wise distribution of sources of incomes (Figure 17) among the agricultural households. The net receipts from the crop production alone has

249Agriculture & Food Management
increased by 22.6 per cent as compared to the previous SAS Report of 2014. The net receipts from other sources increased by 92.6 per cent with increase in overall net receipts at 59 per cent. The crop income with a share of 37 per cent continues to be an important source of farmer’s income although there is a visible diversification in the sources of income of the farmers.
Figure 17: Sources of Average Monthly Income Class-wise (per cent)
Source: Based on data of SAS, 2021.
7.35 The SAS Report, 2021 also shows increasing fragmentation of holdings as is evident from the increasing share of small farmers in Figure 18. The average size of household ownership holdings has declined from 0.725 hectare in 2003 to 0.592 hectare in 2013 and further to 0.512 hectare in 2019. Increasing number of small farmers and increasing importance of livestock sector requires increased focus on the measures like development of small farm technology, boosting non-farm businesses and development of allied activities including animal husbandry, dairying and fisheries.
Figure 18: Distribution of Households by Size Category of Ownership Holdings (per cent)
Source: Based on data of SAS, 2021.

250 Economic Survey 2021-22
Natural Farming
7.36 The main aim for promotion of Natural Farming is elimination of chemical fertilisers and pesticides usage and promotion of good agronomic practices. Natural Farming also aims to sustain agriculture production with eco-friendly processes in tune with nature to produce agricultural produce free of chemicals. Soil fertility & soil organic matter is restored by natural farming practices. Natural farming systems require less water and are climate friendly.
7.37 Natural farming in India is being promoted through a dedicated scheme of Bharatiya Prakritik Krishi Paddhati Programme (BPKP). The scheme promotes on-farm biomass recycling with major stress on biomass mulching, use of on-farm cow dung-urine formulations, periodic soil aeration and exclusion of all synthetic chemical inputs. Under BPKP, financial assistance of Rs 12200/ha for 3 years is provided for cluster formation, capacity building and continuous handholding by trained personnel, certification and residue analysis. State-wise area covered under the scheme is shown in Figure 19.
Figure 19: Area Covered under BPKP as on 07.12.2021 (in ‘000 ha).
Source: Based on data of the Ministry of Agriculture and Farmers Welfare
ALLIED SECTORS: ANIMAL HUSBANDRY & DAIRYING 7.38 Livestock Sector is an important subsector of agriculture in the Indian economy. It grew at a CAGR of 8.15 per cent during 2014-15 to 2019-20 (at constant prices). As per the estimates of National Accounts Statistics (NAS) 2020 for sector wise GVA of agriculture and allied sectors, the contribution of livestock in total agriculture and allied sector GVA (at constant prices) has increased from 24.32 per cent (2014-15) to 29.35 per cent (2019-20). Livestock sector contributed 4.35 per cent of total GVA in 2019-20. Development of livestock sector has led to improvement in per capita availability of milk, eggs and meat (Figure 20).

251Agriculture & Food Management
Figure 20: Per Capita Availability of Milk (gram per day), Meat (kg per year) and Eggs (number per annum)
Source: Based on data received from Department of Animal Husbandry & Dairying
Dairy Sector
7.39 Dairy is the single largest agricultural commodity contributing 5 per cent of the national economy and employing more than 8 crore farmers directly. India is ranked 1st in milk production contributing 23 per cent of global milk production. Milk production in the country has grown at a compound annual growth rate of about 6.2 per cent to reach 209.96 million tonnes in 2020-21 from 146.31 million tonnes in 2014-15 (Figure 21).
Figure 21: Trend of Milk Production in India (Million Tonnes)
Source: Based on data taken from the National Dairy Development Board and DAHD.*Data is provisional
7.40 The all India per capita availability of milk is 427 grams per day in 2020-21 (provisional). Inter-state variability in milk production and per capita availability of milk during the year 2020-21 is shown in Figure 22.
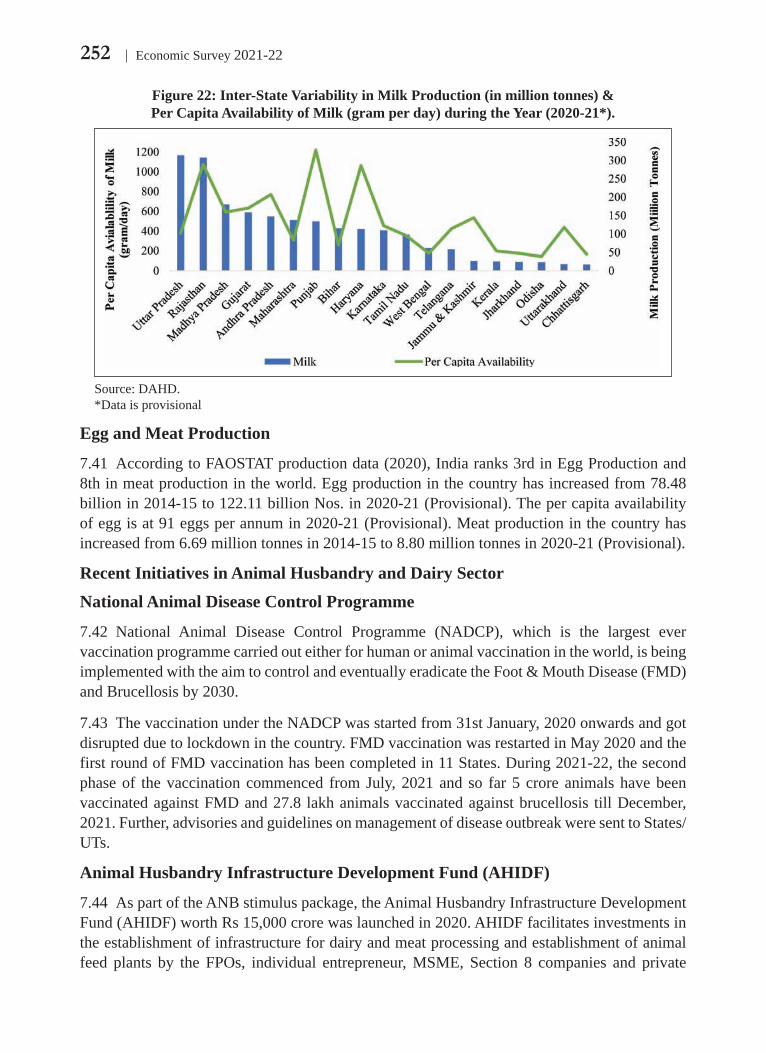
252 Economic Survey 2021-22
Figure 22: Inter-State Variability in Milk Production (in million tonnes) & Per Capita Availability of Milk (gram per day) during the Year (2020-21*).
Source: DAHD. *Data is provisional
Egg and Meat Production
7.41 According to FAOSTAT production data (2020), India ranks 3rd in Egg Production and 8th in meat production in the world. Egg production in the country has increased from 78.48 billion in 2014-15 to 122.11 billion Nos. in 2020-21 (Provisional). The per capita availability of egg is at 91 eggs per annum in 2020-21 (Provisional). Meat production in the country has increased from 6.69 million tonnes in 2014-15 to 8.80 million tonnes in 2020-21 (Provisional).
Recent Initiatives in Animal Husbandry and Dairy SectorNational Animal Disease Control Programme
7.42 National Animal Disease Control Programme (NADCP), which is the largest ever vaccination programme carried out either for human or animal vaccination in the world, is being implemented with the aim to control and eventually eradicate the Foot & Mouth Disease (FMD) and Brucellosis by 2030.
7.43 The vaccination under the NADCP was started from 31st January, 2020 onwards and got disrupted due to lockdown in the country. FMD vaccination was restarted in May 2020 and the first round of FMD vaccination has been completed in 11 States. During 2021-22, the second phase of the vaccination commenced from July, 2021 and so far 5 crore animals have been vaccinated against FMD and 27.8 lakh animals vaccinated against brucellosis till December, 2021. Further, advisories and guidelines on management of disease outbreak were sent to States/UTs.
Animal Husbandry Infrastructure Development Fund (AHIDF)
7.44 As part of the ANB stimulus package, the Animal Husbandry Infrastructure Development Fund (AHIDF) worth Rs 15,000 crore was launched in 2020. AHIDF facilitates investments in the establishment of infrastructure for dairy and meat processing and establishment of animal feed plants by the FPOs, individual entrepreneur, MSME, Section 8 companies and private

253Agriculture & Food Management
companies. Under this scheme the Central Government provides 3 per cent interest subvention to the borrower and credit guarantee up to 25 per cent of total borrowing. As on 17.12.2021, a total of 76 projects have been approved under the scheme involving a project cost of ₹ 1802.28 crore. The amount of interest subvention released under the scheme was ₹ 12.74 crore during 2020-21 and ₹ 6.40 crore (as on 17.1.2022) during 2021-22.
FISHERIES
7.45 India is the second largest fish producing country in the world accounting for 7.56 per cent of global production. It contributes about 1.24 per cent to the country’s GVA and over 7.28 per cent to the agricultural GVA. Fisheries sector has demonstrated an outstanding double-digit average annual growth of 10.87 per cent since 2014-15 with record fish production of 145 lakh tons in FY 2020-21 (provisional). In terms of employment, the sector supports the livelihood of over 28 million people in India especially the marginalized and vulnerable communities. Export earnings from the fisheries sector was ₹ 46,662.85 crore during 2019-20.
7.46 Recognizing the significance of the fisheries sector, the Government has taken several initiatives over the years to unlock its full potential. To address the credit needs of fish farmers, the Government of India in 2018-19 extended the facility of KCC also to fisheries in addition to animal husbandry farmers to help them meet their working capital needs. For fishers and fish farmers, the working capital includes the cost of fuel, ice, labour charges, mooring/landing charges, etc. The credit limit for the existing KCC holders is ₹ 3 lakhs, whereas the limit for new KCC holders for fisheries is only ₹ 2 lakhs. As on 31st December 2021, a total of 1,04,157 KCCs have been issued to fishers and fish farmers and an additional 5.04 lakh applications from fishers and fish farmers are with the banks at various stages of issuance.
7.47 Further, the Government launched a new flagship scheme of ₹ 20,050 crores called Pradhan Mantri Matsya Sampada Yojana (PMMSY) in May 2020 as a part of the ANB Package. Under PMMSY, key interventions include enhancing fish production and productivity, modernizing and strengthening the value chain, creating fisheries and post-harvest infrastructure and developing robust fisheries management and regulatory frameworks. Moreover, emphasis is laid on addressing critical gaps in the value chain through technology infusion, optimal water management to achieve ‘more crop per drop’, improved quality and hygiene of fish and fish products, insurance, value addition, demand-based branding and marketing and promotion of initiatives bringing economic returns for stakeholders. Additionally, the scheme prioritizes sustainability and traceability from ‘catch to consumer’ for augmenting fisheries exports and maintaining competitiveness in the global markets. The scheme aims to create a conducive environment for private sector participation and promotes the dynamic development of innovative entrepreneurial ventures and viable business models in the fisheries sector. By December, 2021, under PMMSY, proposals with an outlay of ₹ 11295.12 crores have been received from various States/UTs against which the project proposals with total outlay of ₹ 5584.74 crores have already been approved with ₹ 1975.63 crore as the share of the Centre.

254 Economic Survey 2021-22
AGRICULTURAL RESEARCH AND EDUCATION
7.48 Agricultural research and education has a key role in the development of an environmentally sustainable global food system, ensuring food and nutritional security and increasing farm income by cost minimization and yield maximization. Recognising these objectives, the National Agricultural Research System of India has produced significant results in terms of mechanisation of agriculture and development of climate resilient technologies and high yielding varieties (HYVs) of seeds, etc. For example, the Indian Council of Agricultural Research (ICAR) during 2020 and 2021 notified/released a total of 731 new varieties/ hybrids of field crops and 98 of horticultural crops. To ensure nutritional security through the natural food system and facing the climate change, the Department of Agricultural Research & Education (DARE) has developed 35 special trait varieties including biofortified and stress tolerant varieties of field and horticulture crops during 2021-22, taking the tally of biofortified varieties to 87. ICAR has also designed and developed an Agri-voltaic system of 105 kW for crop production and electricity generation from a single land use system with an average photovoltaic (PV) generation of 1,29,266 kWh annual power output and a total revenue of about ₹ 6 lakh. Agri-voltaic system also reduces Green House Gas (GHG) emission (598 tons of CO2 savings/year/ha).
Mechanization
7.49 Farm mechanization reduces the cost of cultivation and increases productivity through efficient use of other inputs and natural resources. The penetration of powered machines in various farm activities is assessed in the range of 40 to 45 per cent (NABARD, 2018). Mechanization in farm operations for major crops in India in 2019-20 has been 70, 38, 31 and 32 percent in seed bed preparation, sowing/planting/transplanting, weeding- interculture & plant protection and harvesting & threshing, respectively. To promote an inclusive growth of farm mechanization in the country, a Sub Mission on Agricultural Mechanization (SMAM) was launched in the year 2014-15. Under the scheme, assistance is given to State Governments for providing training and demonstration of agricultural machinery and assist farmers in procurement of various agricultural machinery and equipments as also for setting up of Custom Hiring Centre (CHC). During 2014-15 to 2020-21, a total of 27828 CHC and during 2020-21 alone, 9432 CHC were established under the SMAM scheme. The Government has also developed and launched Multi lingual Mobile App called Farm Machinery Solutions (FARMS) which helps the farmers in getting rented farm machinery and implements through CHC in their area.
7.50 Sale of tractors and power tillers may be used as an indicator of farm mechanisation (Figure 23). Indian tractor industry is the largest in the world accounting for one-third of the total global production. The farm equipment market in India is estimated at USD 8.8 billion in 2017 and it is expected to reach USD 12.5 billion by 2022. The tractor market is expected to grow at a CAGR of 7 per cent by 2022.

255Agriculture & Food Management
Figure 23: Sale of Tractors and Power Tillers in India (in thousand number)
Source: Based on data received from DAFW.
Crop Residue Management
7.51 Air pollution due to stubble burning in the states of Haryana, Punjab, Uttar Pradesh and the NCT of Delhi has been a major concern. Hence, to support the efforts of the Governments to address air pollution and to subsidize machinery for the farmers for in-situ management of crop residue, a new Central Sector Scheme on ‘Promotion of Agricultural Mechanization for In-Situ Management of Crop Residue in the States of Punjab, Haryana, Uttar Pradesh and NCT of Delhi’ (CRM) for the period from 2018-19 to 2020-21 had been launched with a total outlay of ₹ 1791.80 crore. Under this scheme, during 2020-21, 51988 numbers of various agricultural machinery were distributed and 15106 numbers of Custom Hiring Centres were established.
Role of R&D in Agriculture
7.52 Research and development and its application in agriculture & allied sectors can play a major role in realisation of sustainable agriculture practice that efficiently meets the objectives of nutritional security and improvement in farm income. World’s food system contributes to about one-fifth of global greenhouse gas (GHG) emissions. According to a report of the International Food Policy Research Institute, agriculture is key to meeting half of the 17 Sustainable Development Goal (SDG) targets which, inter alia, include the targets of eliminating poverty and hunger and reducing inequalities. Climate-resilient varieties with resistant to multiple pests and diseases and abiotic stress is a significant area of work in the context of climate change and food security.
7.53 Research5 shows that every rupee spent on agricultural research and development, yields much better returns (11.2), compared to returns on every rupee spent on fertiliser subsidy (0.88), power subsidy (0.79), education (0.97) or on roads (1.10). Increasing R&D spending on agriculture is, therefore, not only a vital necessity for ensuring food security, but also important from the socio-economic point of view.
FOOD PROCESSING SECTOR7.54 During the last five years ending 2019-20, Food Processing Industries (FPI) sector has been
5 Gulati, A., Zhou, Y. and Ferroni M. (2018), “Supporting Indian Farms: The Smart Way”, Academic Foundation in association with ICRIER.

256 Economic Survey 2021-22
growing at an average annual growth rate of around 11.18 per cent. The sector constituted as much as 9.87 per cent of GVA in manufacturing in 2019-20 at 2011-12 prices. Food Processing Industry is one of the major employment intensive segments having a share of 12.38 per cent (at 3-digit of NIC classification) in the employment generated in all Registered Factory sector in 2017-18. According to the latest Annual Survey of Industries (ASI) for 2017-18, the total number of persons engaged in registered food processing sector was 19.33 lakh. Unregistered food processing sector supports employment to 51.11 lakh worker as per the NSSO 73rd Round, 2015-16 and thus 14.18 per cent of employment in the unregistered manufacturing sector. The share of FPI in manufacturing and the growth in the GVA of FPI (GVA-FPI) may be seen in Figure 24.
Figure 24: Share of FPI in Manufacturing GVA (in per cent)
Source: Based on data received from Ministry of Food Processing Industries (MoFPI).
FDI in Food Processing Sector
7.55 In FPI, 100 per cent FDI is permitted under the automatic route. However, in case of trading in respect of food products manufactured and/or produced in India including through e-commerce, 100 per cent FDI is allowed under the Government approval route. The sector has witnessed FDI equity inflow of US$ 4.99 billion during the period April 2014 to September 2021. The FDI equity inflow in FPI sector during April to September 2021 was US$ 410.62 million in comparison to US$ 220.42 million in the corresponding period last year. Year-wise FDI inflows in FPI may be seen in Figure 25.
Figure 25: FDI Inflows in Food Processing Sector (in US $ million)
Source: Based on data received from Ministry of Food Processing Industries (MoFPI).

257Agriculture & Food Management
Prime Minister-Formalization of Micro Food Processing Enterprises (PM-FME)
7.56 Under the ANB Mission, Ministry of Food Processing Industries (MoFPI) has launched a new Centrally Sponsored Scheme, PM-FME with a total outlay of ₹ 10,000 crore over the period 2020-2025. Under the scheme, One District One Product (ODOP) status for 137 unique products in 710 districts of 35 States/ UTs has been approved by the Ministry. 75 proposals for incubation with an outlay of ₹ 200.30 crore have been sanctioned/approved out of which 52 proposals were approved in 2020-21 and 23 in 2021-22.
Pradhan Mantri Kisan SAMPADA Yojana (PMKSY)
7.57 Under the umbrella central sector scheme PMKSY, the Ministry is implementing various component schemes, inter-alia, including (i) Mega Food Parks, (ii) Integrated Cold Chain and Value Addition Infrastructure, (iii) Infrastructure for Agro-processing Clusters, (iv) Creation of Backward and Forward Linkages (v) Creation / Expansion of Food Processing & Preservation Capacities, (vi) Operation Greens and (vii) Food Testing Laboratories. The status of projects sanctioned and completed /operational as on 28.12.2021 may be seen in Figure 26.
Figure 26: Status of projects sanctioned and completed/operational under PMKSY
Source: Based on data received from MoFPI.
TOP Scheme
7.58 Operation Greens Scheme was announced in the Union Budget for 2018-19 to promote Farmer Producer Organisations (FPOs), agri-logistics, processing facilities and professional management for Tomato, Onion and Potato (TOP) crops. The Scheme was launched with two components:
(i) Long term: Value Chain Development Projects - Under this, support is provided to capital investment projects for TOP crops. In pursuance of Budget announcement 2021-22, the scope of this scheme has been expanded from TOP to Twenty-Two Perishable products.
(ii) Short term: Price Stabilization Measures - Under this, subsidy is provided at the rate of 50 per cent on transportation and storage at the time of harvest for evacuation of surplus production of TOP crops from the producing area to the consumption centres. Transportation subsidy under the scheme was also extended to Kisan Rail Scheme w.e.f. 12.10.2020. The scope of short-term measures under the scheme was extended from TOP to TOTAL (41 notified fruits and vegetables) w.e.f. 11.06.2020 as a part of ANB announcement. Transport subsidy of ₹ 115.01

258 Economic Survey 2021-22
crore has been released till 15.12.2021 by Indian Railways against the transportation of approx. 5.68 Lakh MT of Fruits & Vegetables.
FOOD MANAGEMENT 7.59 The major objectives of food management are procurement of foodgrains from farmers at remunerative prices, distribution of foodgrains to consumers, particularly the vulnerable sections of society at affordable prices and maintenance of food buffer stock for food security and price stability. The instruments used are procurement at MSP from farmers and sale at Central Issue Price (CIP) under the Targeted Public Distribution System (TPDS). The nodal agency which undertakes procurement, distribution and storage of foodgrains is the Food Corporation of India (FCI). The distribution of foodgrains is undertaken primarily under the National Food Security Act, 2013 (NFSA) and other welfare schemes of the Government of India.
Procurement of Foodgrains
7.60 During Kharif Marketing Season (KMS) 2020-21, 601.85 lakh metric tons (LMT) of rice has been procured against an estimated target of 642.58 LMT. In the KMS 2021-22, a total of 566.58 LMT of paddy (equivalent to 379.98 LMT rice) was procured as on 16.01.2022. During RMS 2021-22, 433.44 LMT of wheat was procured against 389.92 LMT procured during RMS 2020-21. Also, during the Kharif & Rabi Marketing Season 2020-21, approx. 11.87 LMT of coarse grains has been procured which is highest in the last five years.
Allocation of Foodgrains
7.61 To ameliorate the hardships faced by the poor due to economic disruption caused by COVID-19 Pandemic, the Government launched Pradhan Mantri Garib Kalyan Anna Yojana (PMGKAY) initially for the period from April to June 2020. However, keeping in view the need for continuous support to the poor and the needy, the scheme has been extended and implemented in various phases. Currently Phase V of PMGKAY is in operation covering December, 2021 to March 2022. Under the scheme, 5 kg of additional foodgrains per person per month has been/is being provided free of cost to NFSA beneficiaries in all the phases. During the year 2020-21, about 322 LMT of food-grains and during the year 2021-22, about 437.37 LMT of foodgrains have been allocated free of cost under PMGKAY scheme to around 80 crore NFSA beneficiaries.
7.62 During the year 2021-22, the Government had allocated 1052.77 lakh tons of food grains to States/UTs under NFSA and other welfare schemes as compared to 948.48 lakh tons in 2020-21.
Fortification of Rice and its Distribution
7.63 The Government of India approved the Centrally Sponsored Pilot Scheme ‘Fortification of Rice and its Distribution under Public Distribution System’ on 14.02.2019 for a period of 3 years beginning 2019-20. The Pilot Scheme is being implemented in 15 Districts (1 District per State). Eleven States including Andhra Pradesh, Gujarat, Maharashtra, Tamil Nadu, Chhattisgarh, Uttar Pradesh, Odisha, Telangana, Madhya Pradesh Uttarakhand and Jharkhand have started distributing the fortified rice in their identified districts under the pilot scheme. Nearly 3.38 LMT of fortified rice has been distributed till December, 2021 under the Pilot Scheme.

259Agriculture & Food Management
7.64 The Government has started distributing fortified rice under Integrated Child Development Scheme and PM Poshan schemes across the country during 2021-22 in an effort to scale up the distribution of fortified rice in the country to fight malnutrition and micronutrient deficiencies among pregnant women, lactating mothers, children etc. Nearly 19.79 LMT (as on 04.01.2022) of fortified rice has been procured by FCI and Decentralized Procuring States for distribution under ICDS and PM Poshan across the country.
One Nation One Ration Card
7.65 Under the scheme “Integrated Management of Public Distribution System" which was started during 2018-19 and 2019-20, One Nation One Ration Card (ONORC) System has been launched. The validity of the scheme has been extended to 31.03.2023 from the existing 31.03.2022. Through this system migratory beneficiaries shall be able to access their food security entitlements from any fair price shop (FPS) of their choice by using their same ration card after biometric/Aadhaar authentication on electronic Point of Sale (ePoS) devices at the FPS. Presently, the facility of national/inter-State portability is enabled in 34 States/UT covering nearly 75 crore beneficiaries (94.3 per cent of total NFSA population). Constant efforts are being made to expand the reach of national portability to the beneficiaries of remaining two States also.
Open Market Sale Scheme
7.66 In addition to maintaining buffer stocks and for making a provision for meeting the requirement of the Targeted Public Distribution System (TPDS) and other welfare schemes, FCI on the instructions from the Government sells excess stocks out of Central Pool through Open Market Sale Scheme (Domestic) [OMSS (D)] in the open market from time to time at predetermined prices called reserve prices. A target of 75 LMT of wheat has been set for sale by FCI including retail sale out of Central Pool in the open market under OMSS (D) during 2021-22. Also, a target of 50 LMT of rice has been set for sale by FCI out of Central Pool in the open market under OMSS (D) during 2021-22.
7.67 Under the OMSS (D) 2020-21 policy, a special dispensation for supply of foodgrains to all the charitable or non-governmental organizations etc. engaged in relief or running community kitchens for migrant labourers/vulnerable groups due to the present lock down condition was introduced since 08.04.2020. Under this scheme, wheat at the uniform rate of ₹ 21 per kilogram and rice at the uniform rate of ₹ 22 per kilogram are issued to charitable institutions/NGO. There is no upper limit of allocation of foodgrains to each of such organizations from any FCI depot. This special dispensation was initially till June, 2020 which was extended for rest of the year 2020-21 at the same rate, terms and conditions. In view of resurgence of COVID pandemic, the said special dispensation was further extended till 31st March 2022 or till further order, whichever is later, at the same rate, terms and conditions. Under this scheme, 1126 organizations had lifted 10422 MT of rice and 230 organizations had lifted 1,246 MT of wheat till 25.03.2021. Further, in the year 2021-22, 34 organizations have lifted 847 MT of rice and 6 organizations have lifted 10 MT of wheat till 13.01.2022. The quantities of wheat and rice sold under the OMSS (D) during the last five years and FY 2021-22 is given in Figure 27.

260 Economic Survey 2021-22
Figure 27: Sale of Wheat and Rice Sold under OMSS (D) during the Last Five Years (Quantity in LMT)
Source: Based on data received from DFPD. * upto 3rd weekly e-auction of January, 2022
Food Subsidy
7.68 The difference between the per quintal economic cost and the per quintal Central Issue Price (CIP) gives the quantum of per quintal food subsidy. The economic cost of wheat has increased from Rs 1908.32 per quintal in 2013-14 to ₹ 2993.80 per quintal in 2021-22. Similarly, the economic cost of rice has increased from Rs 2615.51 per quintal in 2013-14 to ₹ 4293.79 per quintal in 2021-22. However, as a pro-poor measure, the CIPs for NFSA beneficiaries have not been revised since the commencement of the NFSA. Measures are being taken by the Government to improve the efficiency of food management to reduce the gap between economic cost and CIP. A trend in food subsidy bill may be seen in Figure 28.
Figure 28: Food Subsidy (in ₹ thousand crore) and Annual Growth in Food Subsidy (in per cent)
Source: Based on data received from DFPD.
*Includes NSSF loan of ₹ 25000 crore to FCI. ** Includes National Small Savings Fund (NSSF) loan of ₹ 40000 crore to FCI. ***Includes NSSF loan of ₹ 70000 crore to FCI. # ₹ 11436 crore has been reimbursed to DCP State from unutilized NSSF Loan sanctioned to FCI as per instruction of MoF in the FY 2019-20. Out of ₹ 11436 crore, ₹ 10000 crore has been repaid to FCI. & As on 18.01.2022.

261Agriculture & Food Management
Ethanol Blended with Petrol (EBP) Programme
7.69 The Government has now set 20 per cent ethanol blending target for mixing ethanol with petrol to be achieved by 2025. It is estimated that the blending target at 10 per cent would be achieved during 2022. With a view to achieve these targets, Government has allowed production of ethanol from different feed stocks viz B-Hy & C-Hy molasses, cane juice, sugar syrup, sugar and damaged food grains including surplus FCI rice, maize, etc. by the distilleries either attached with sugar mills or standalone. Financial assistance in the form of interest subvention are also provided to eligible distilleries for augmentation of ethanol production capacity in the country. The ethanol supply under the EBP program, which was only 38 crore liters in Ethanol Supply Year (ESY) 2013-14, has increased to 173.3 crore liters during ESY 2019-20 and is expected to be more than 302 crore liters by the end of ESY 2020-21 to achieve approx. 8.1 per cent blending. Ethanol blending target for ESY 2021-22 is 10 per cent which is to progressively increase to 20 per cent by year 2025.
Storage
7.70 The storage capacity available with FCI, a part of warehousing capacity available with Central Warehousing Corporation (CWC) and State Warehousing Corporations (SWCs) and capacity hired from private sector is used for storage of foodgrains procured for central pool by the Government Agencies. The total storage capacity available with FCI and State Agencies for storage of foodgrains as on 31.12.2021 was 961.73 LMT, comprising covered godowns of 792.81 LMT and Covered and Plinth (CAP) facilities of 168.92 LMT. Out of the total available storage capacity of 961.73 LMT, the capacity of 463.24 LMT was with FCI and 498.49 LMT with State Agencies. Moreover, as on 31.12.2021, a capacity of 144.34 LMT has been created under the Private Entrepreneurs Guarantee Scheme in which construction of godowns are undertaken in PPP mode.
7.71 Government is implementing a Central Sector Scheme for construction of godowns with focus on augmenting storage capacity in the States of North Eastern (NE) Region and a few other States. Under this Scheme, funds are released directly to FCI in the form of equity for land acquisition and construction of storage godowns and infrastructure like railway sidings, electrification, installation of weighbridge, etc. Funds are also released as grants-in-aid to the Governments of the North-Eastern States including Jammu & Kashmir for construction of intermediate storage godowns considering the storage gaps as well as difficult geographical & climatic conditions in these States. During 12th Five Year Plan (2012-17), a total capacity of 1,84,175 MT had been created in NE States and other than NE States. This scheme has further been extended for five years upto 31.03.2022. A total capacity of 82,760 MT (65,870 MT by FCI and 16,890 MT by State Governments) has been created from 01.04.2017 to 31.12.2021.
7.72 Government of India has also approved an action plan/road map for construction of steel silos in the country in Public Private Partnership (PPP) mode for modernizing storage infrastructure and improving shelf life of stored foodgrains. Under the plan for silo development, upto 31.12.2021, 29.25 LMT capacity in various locations throughout the country have been awarded. Out of which, a capacity of 11.125 LMT is completed and remaining are under various stages of development.

262 Economic Survey 2021-22
FERTILIZERS
7.73 Government is making available fertilizers, namely Urea and 24 grades of P&K fertilizers to farmers at subsidized prices through fertilizer manufacturers/importers. Urea is being provided to the farmers at a statutorily notified Maximum Retail Price (MRP). As far as Phosphatic and Potassic (P&K) fertilizers are concerned, Government is implementing Nutrient Based Subsidy (NBS) Scheme w.e.f 01.04.2010. Under the said scheme, subsidy is provided on each grade of subsidized Phosphatic and Potassic (P&K) fertilizers depending upon its nutrient content. Figure 29 shows fertilizer subsidy provided by the Government over years in order to keep the fertilizers available at affordable prices. Figures 30 and 31 show production and import of various categories of fertilizers.
Figure 29: Fertilizer Subsidy (in ₹ thousand crore)
Source: Based on data received from the Department of Fertilizers.
Figure 30: Production of Fertilizers (LMT)
Source: Based on data received from the Department of Fertilizers.

263Agriculture & Food Management
Figure 31: Imports of fertilizers (LMT)
Source: Based on data received from the Department of Fertilizers.
7.74 In order to tackle the import dependency and make the subsidy regime more efficient and transparent, the Government has taken several steps. For example, New Urea Policy-2015 has been notified with the objectives of maximizing indigenous production, promoting energy efficiency in production, and rationalizing subsidy burden on the government. Government has made it mandatory for all the domestic producers of urea to produce only neem coated urea. Government has brought Potash Derived from Molasses (PDM) under Nutrient Based Subsidy (NBS) scheme for the first time since its inception in 2010 to give a push to its manufacturing by Sugar Mills as a by-product and reduce its import dependence. Latest technologies such as coal gasification; implementation of Direct Benefit Transfer for providing benefits to farmers through Point of Sale machines, etc. are being promoted.
CONCLUSION
7.75 The performance of the agriculture and the allied sector has been resilient to the COVID 19 shock. The sector grew at 3.6 per cent in 2020-21 and improved to 3.9 per cent in 2021-22. However, as shown by the latest SAS report, the fragmentation of landholdings has led to alternate sources such as livestock, fishery and wage labour becoming significantly important for an agricultural household. Increasing importance of allied sectors including animal husbandry, dairying and fisheries in growth and income of the farmers indicates that focus needs to shift more towards harnessing the potential of allied activities. There is also a need to improve productivity of small and marginal farmers through development and implementation of small holding farm technologies.
7.76 Crop diversification towards oilseeds, pulses and horticulture needs to be given priority by addressing the core issues of irrigation, investment, credit and markets in their cultivation. While the Government has adopted the use of MSP as signal to encourage crop diversification, there is also a need for coordinated action from the State Governments to facilitate the shift to high value and less water consuming crops to enable realization of the objective of doubling farmers’ income in a sustainable way.

264 Economic Survey 2021-22
7.77 Research and development in agriculture & allied sectors can play a major role in realisation of sustainable agriculture practice that efficiently meets the objectives of nutritional security and improvement in farm income. Research shows that every rupee spent on agricultural research and development, yields better returns compared to returns on money spent on subsidies or other expenditures on inputs. The increase in agriculture R & D therefore may improve productivity in the crop and allied sectors.
7.78 There is a need to explore options and promote use of alternative fertilizers such as Nano Urea and organic fertiliser which protect the soil, are more productive and contribute to higher nutrient use efficiency. Focus should be on use of new technology including drones and AI-based decision support systems, reduction in use of chemical fertilizers and use of low-cost organic inputs and supporting start-ups for innovations.

CHAPTER
08
Global Industrial activity continued to be affected by the disruptions caused by the COVID-19 pandemic. While the Indian industry was no exception to these disruptions ,its performance has improved in 2021-22. Gradual unlocking of the economy, record vaccinations, improvement in consumer demand, continued policy support towards industries by the government in the form of AtmaNirbhar Bharat Abhiyan and further reinforcements in 2021-22 have led to an upturn in the performance of the industrial sector. The growth of the industrial sector, in the first half of 2021-22, was 22.9 percent vis a vis the corresponding period of 2020-21and is expected to grow by 11.8 percent in this financial year. The industrial performance has shown improvement as reflected in the cumulative growth of the IIP. During April-November 2021-22 the IIP grew at 17.4 percent as compared to (-)15.3 percent in April-November 2020-21. According to RBI- Studies on Corporate Performance, which is based on the results of select listed companies in the private corporate sector, the net profit to sales ratio of large corporates reached an all-time high despite the pandemic. Buoyant FDI inflows amid improvements in overall business sentiments, foretells a positive outlook for the industry.
The introduction of the production linked incentive scheme (PLI) to encourage scaling up of industries and major boost provided to infrastructure-both physical as well as digital–combined with continued measures to reduce transaction costs and improve ease of doing business, would support the pace of recovery. Several initiatives such as the National Infrastructure Pipeline (NIP), National Monetization Plan (NMP), amongst others, have been taken to propel the infrastructure investment. Capital expenditure for the Indian Railways has been substantially increased from an average annual of Rs. 45,980 crores during 2009-14 to Rs. 155,181 crores in 2020-21 and it has been budgeted to further increase to Rs. 215,058 crores in 2021-22. This implies five times increase in comparison to the 2014 level. In addition, the extent of road construction per day increased substantially in 2020-21 to 36.5 kms per day from 28 kms per day in 2019-20, a rise by 30.4 percent as compared to the previous year. The Government has also heralded a major boost to the electronics hardware sector and brought in structural and procedural reforms in the telecom sector.
Industry and Infrastructure
INTRODUCTION8.1 COVID-19 pandemic led to disruptions in global economic activity impacting not only the lives but also livelihoods. The Indian industry experienced interlude in business activity leading to slowdown in its performance. With the gradual unlocking of the country coupled

266 Economic Survey 2021-22
with supportive policy initiatives which included easing of supply side bottlenecks through easier access to credit especially, emergency credit line guarantee scheme to MSMEs, relief to the real estate sector, production-linked incentives for 14 champion sectors and other direct tax measures, the industrial growth started to recover. In the past few months, record vaccinations as well as improvement in consumer demand and business confidence have had a positive impact on the performance of the industrial sector. This period also saw a boost to digital infrastructure, structural reforms in telecommunications and big-ticket disinvestment in Air India. The pace of this recovery and further growth is likely to continue due to consistent efforts of the government to bring in various structural, fiscal and infrastructural reforms in addition to a slew of measures/schemes like the production linked incentive scheme (PLI) to support industries .
8.2 The gross value addition at constant prices (GVA) in the industrial sector grew at thecompoundannualgrowthrate (CAGR)of4.53percentbetween2011-12and2019-20whiletotalGVAgrewbyCAGRof5.63percent over the sameperiod.The shareof the industrialsectorinthenominalGVA(atcurrentprices)was25.9percentin2020-21.Withtheindustrialsectorrecoveringandexpectedtogrowat11.8percent,asperadvanceestimatesfor2021-22byNationalStatisticalOffice,industry’sshareisexpectedtoincreaseto28.2percent.(Figure1).
8.3 Manufacturing,withanaverageshareof16.3percentinnominalGVAoverthelastdecade,hasadominantpresencewithintheindustrialsector.In2020-21,theshareofmanufacturingfellto14.4percentbutisexpectedtoimproveto15.3percentin2021-22.Theshareofelectricityhasbeenshowinganincreasingtrendsince2012-13andwas2.7percent2020-21.Figures1and2showvalueaddedintheindustrialsectorandgrowthrespectively.In2020-21,electricity,gas,water supply and other utility services was the only sub sector that had experienced a positive growthof1.9percent(table1).In2021-22,themanufacturingsectorisexpectedtogrowby12.5percent,miningandquarryingby14.3percent,constructionby10.7percentandelectricity,gasandwatersupplyby8.5percent.Thisimprovementisonthebackofindustrialcontractioninthecorrespondingperiodofthelastfinancialyear.
Figure 1: Share of Industry and its components in Gross value added
0.00%
5.00%
10.00%
15.00%
20.00%
25.00%
30.00%
35.00%
3rd RE 2nd RE 1st RE PE 1st AE
2011-12 2012-13 2013-14 2014-15 2015-16 2016-17 2017-18 2018-19 2019-20 2020-21 2021-22
Shar
e in
GV
A
Mining & quarrying ManufacturingElectricity, gas, water supply & other utility services ConstructionIndustry
Source: Survey calculations based on MoSPI data. Data at current prices.

267Industry and Infrastructure
Table 1: Growth in Gross Value Added in Industry
Sectors
Year2012-
132013-
142014-
152015-
162016-
172017-
182018-
192019-
202020-
212021-
223rdRE 2ndRE 1stRE PE 1stAE
Mining&quar-rying 0.6 0.2 9.7 10.1 9.8 -5.6 0.3 -2.5 -8.5 14.3
Manufacturing 5.5 5.0 7.9 13.1 7.9 7.5 5.3 -2.4 -7.2 12.5
Electricity, gas, water supply
& other utility services
2.7 4.2 7.2 4.7 10.0 10.6 8.0 2.1 1.9 8.5
Construction 0.3 2.7 4.3 3.6 5.9 5.2 6.3 1.0 -8.6 10.7Industry 3.3 3.8 7.0 9.6 7.7 5.9 5.3 -1.2 -7.0 11.8
Source: Survey calculations based on MoSPI data.
Figure 2: Growth trends in Industry’s Value Addition and its components
-10.0
-5.0
0.0
5.0
10.0
15.0
2012-13
2013-14
2014-15
2015-16
2016-17
2017-18
2018-19
Gro
wth
Y-o
-Y in
per
cent
-10.0
0.0
10.0
20.0
AE
2019-20 2020-21 2021-22
Source: Survey calculations based on MoSPI data.
Index of Industrial Production (IIP)
8.4 The impact of the pandemic on the industrial sector is reflected in the negative growth of 8.4percentin2020-21.InApril-November2021-22theIIPgrewby17.4percentascomparedto(-15.3)percentinthecorrespondingperiodofthepreviousyear.The supply side measures as also steps to bolster demand, taken to address the contraction, are responsible for the significantly improvedperformanceoftheindustrialsectorin2021-22.InNovember2021theIIPindexgrewby1.4percentwiththeminingsectorrecordedagrowthof5.0percentfollowedbyelectricityat2.1percentandmanufacturingat0.9percent.Intermsofuse-basedclassificationalso,the

268 Economic Survey 2021-22
index reflects broad-based recovery across all sectors (Table 2).Primarygoodsat3.5percent,infrastructuregoodswith3.8percent,consumernon-durableswith0.8andintermediategoodsat2.5percentledtherecoveryundertheusedbasedclassification.
Figure 3: Value of Index of Industrial Production
0.0020.0040.0060.0080.00
100.00120.00140.00160.00
Nov
-19
Dec
-19
Jan-
20Fe
b-20
Mar
-20
Apr
-20
May
-20
Jun-
20Ju
l-20
Aug
-20
Sep-
20O
ct-2
0N
ov-2
0D
ec-2
0Ja
n-21
Feb-
21M
ar-2
1A
pr-2
1M
ay-2
1Ju
n-21
Jul-2
1A
ug-2
1Se
p-21
Oct
-21
Nov
-21
Val
ue o
f Ind
ex
Actual Seasonally Adjusted
Source: Survey calculations based on MOSPI data
Table 2: Sector wise IIP - Growth in percent
Weight Nov-20
Dec-20
Jan-21
Feb-21
Mar-21
Apr-21
May-21
Jun-21
Jul-21
Aug-21
Sep-21
Oct-21
Nov-21
By Sector
Mining 14.4 -5.4 -3 -2.4 -4.4 6.1 # 23.6 23.1 19.5 23.3 8.6 11.5 5
Manufacturing 77.6 -1.6 2.7 -0.9 -3.4 28.4 # 32.1 13.2 10.5 11.1 3 3.1 0.9
Electricity 8 3.5 5.1 5.5 0.1 22.5 # 7.5 8.3 11.1 16 0.9 3.1 2.1
General 100 -1.6 2.2 -0.6 -3.2 24.2 # 27.6 13.8 11.5 13 3.3 4 1.4
Primary goods 34 -1.8 0.4 0.7 -4.6 7.9 # 15.8 12 12.4 16.9 4.6 9 3.5
Capital goods 8.2 -7.5 2.2 -9 -4.2 50.4 # 74.9 27.3 30.3 20 2.4 -1.5 -3.7
Intermediate goods 17.2 -1.8 2.3 2 -5.3 22.4 # 54.2 22.6 14.6 11.8 5 3.8 2.5
Infrastructure/construction 12.3 2.1 3.1 2.3 -3.5 35.1 # 46.5 20 12.3 13.5 7.8 6.6 3.8
Consumer durables 12.8 -3.2 6.5 -0.1 6.6 59.9 # 80.4 28 19.4 11.1 -1.9 -3.6 -5.6
Consumer non-durables 15.3 -0.7 1.9 -5.4 -3.8 29.2 # 0.2 -3.9 -2.3 5.9 0.2 0.9 0.8
Red-Negativegrowth,Yellow-Growthratepositivebutlessthan5percent,Green-Positiveandmorethan5percent Source:SurveycalculationsbasedonMOSPIdata.#InviewofthecircumstancesmentionedinthePressReleaseforIIPdated11thJune2021,theindicesforApril2021arenotcomparablewiththoseofApril2020-MOSPI

269Industry and Infrastructure
Figure 4: Indices for Broad Sectors in IIP
0.0020.0040.0060.0080.00
100.00120.00140.00160.00180.00
Nov
-19
Dec
-19
Jan-
20Fe
b-20
Mar
-20
Apr
-20
May
-20
Jun-
20Ju
l-20
Aug
-20
Sep-
20O
ct-2
0N
ov-2
0D
ec-2
0Ja
n-21
Feb-
21M
ar-2
1A
pr-2
1M
ay-2
1Ju
n-21
Jul-2
1A
ug-2
1Se
p-21
Oct
-21
Nov
-21
Val
ue o
f Ind
ex
Manufacturing Capital goods Consumer non-durables
Source: Survey calculations based on MOSPI data
8.5 TheIIPalsoprovidesdatafor23subgroupsofthemanufacturingsector.Intheperiod,April-November2021-22,allthe23sectorsrecordedapositivegrowth.Themajorindustrialgroups like textiles, wearing apparel, electrical equipment, motor vehicles staged a strongrecovery(Figure5).Improvementintheperformanceofthetextilesandwearingapparelwhichis a labour-intensive industry has significant implications for employment creation.
Figure 5: Contributions of product groups to manufacturing growth - percent
Source: Survey calculations based on MOSPI data
Table 3: Growth in Manufacturing sectors in percent
Group Weights Nov-20
Dec-20
Jan-21
Feb-21
Mar-21
Apr-21
May-21
Jun-21
Jul-21
Aug-21
Sep-21
Oct-21
Nov-21
FoodProducts 5.3 7.6 -1.7 -1.8 -0.3 17.1 # 13.7 8.4 4.7 9.5 0.5 4.8 -1.3
Beverages 1.0 -15.3 -7.7 -7.6 -12.9 26.5 # -0.2 -2.3 14.3 12.4 2 5.6 0.8

270 Economic Survey 2021-22
Tobacco Products 0.8 -7.5 -2.1 -4.3 -7.8 24.6 # 77.9 -19.2 -22.2 3.2 7.5 8.9 2.5
Textiles 3.3 -9 -7 -5.6 -2.7 19.2 # 161.9 76.4 25.5 24.4 13.5 11.2 8
Wearing Apparel 1.3 -26.9 -18 -20.3 -14.9 24.4 # 33.9 3.9 3.8 26.6 -0.6 36.7 33.4
LeatherAndRelatedProducts 0.5 -8.7 -5.6 -4.4 -7.5 22.4 # 28.1 -5.6 3.6 0.5 -11.1 -11 -8.4
Wood And Products of Wood and Cork, 0.2 3.6 -4.2 7.5 -6.4 46.1 # 85.4 32.3 24.2 28.9 -5.8 -2.4 -4.3
Paper And Paper Products 0.9 -22.2 -17 -12.6 -10.9 29.6 # 56.5 -8 27 4.8 19.9 21.6 11.9
PrintingAndRepro-ductionofRecordedMedia
0.7 -17.4 -19.9 -25.4 -28.5 2.2 # 17.7 -2.1 -0.1 5.7 2.2 7.1 3
CokeAndRefinedPetroleum Products 11.8 -3.3 -0.7 -0.5 -9.4 -1.1 # 18.7 5.4 7.8 11.4 5.1 13.3 3.3
Chemicals Products 7.9 0.2 7.2 5.4 -2.2 26.5 # 13.8 -0.9 4.7 5 -1.8 -2.4 -1.9
Pharmaceuticals, Medicinal Chem-ical and Botanical Products
5.0 -1 6.7 -8.8 -5 36.8 # -7.3 -4.3 -6 5.4 1.1 -1.1 2.7
RubberAndPlasticsProducts 2.4 6.4 8.9 6 2.3 47.4 # 39.1 8.5 8 9.9 0.3 -7.1 -5.5
Other Non-Metallic Mineral Products 4.1 -3.8 -4.8 -6.1 -6.8 30.9 # 20.7 8 20.4 27 11.6 10.4 -2.8
Basic Metals 12.8 3.1 6.3 6.6 -3.5 29.2 # 54.8 24.3 11.8 9.8 6.2 7 7.3
FabricatedMetalProducts, Except Machinery and Equipment
2.7 -6.6 3.3 -1 -2.3 39.5 # 45.7 18.4 10.1 12 -3.6 -8 -2.1
Computer, Electronic and Optical Products 1.6 -15.3 21.4 -1.7 20.9 105 # 47.6 9.4 -4.5 -4.6 -2.2 0.1 8.5
ElectricalEquipment 3.0 -0.3 9.6 -2.9 3.4 54.2 # 94.9 36.5 43.3 36.3 13.9 -4.2 -6.6
Machinery And EquipmentN.E.C. 4.8 -2.7 9.6 -7.2 -1.6 50.2 # 71.1 20.1 27.5 17.6 3.4 -6.8 -13.9
Motor Vehicles, Trailers and Semi-Trailers
4.9 0 6.8 -0.6 5.6 79 # 186 63.5 37.7 10 -9.1 -11.7 -9.2
Other Transport Equipment 1.8 -0.1 -8 6 2.7 34.8 # 128.9 43 18.3 -6.3 -17.1 -15.7 -22.4
Furniture 0.1 -26.8 -10.1 -19.3 -19.4 1.4 # 95.9 9.1 2.5 -8.5 2.6 9.4 23.1
Other manufacturing 0.9 0.2 -3.2 -3.3 4.1 50.8 # 135 46.4 69.4 69.6 57.9 38 4.7
Red-Negativegrowth,Yellow-Growthratepositivebutlessthan5percent,Green-Positiveandmorethan5percentSource: Survey calculations based on DPIIT data#InviewofthecircumstancesmentionedinthePressReleaseforIIPdated11thJune2021,theindicesforApril2021arenotcomparablewiththoseofApril2020
Eight Core Index (ICI)
8.6 Themonthly Index of Eight Core Industries (ICI) measures collective and individual performanceofproductioninselectedeightcoreindustrieslikeCoal,CrudeOil,NaturalGas,RefineryProducts,Fertilizers,Steel,CementandElectricity.ThisisanindexoftheeightmostfundamentalindustrialsectorsoftheIndianeconomyandcomprises40.27percentoftheweightin IIP.

271Industry and Infrastructure
Figure 6: Index of Eight core industries and IIP
0.0
20.0
40.0
60.0
80.0
100.0
120.0
140.0
160.0
Nov
-19
Dec
-19
Jan-
20Fe
b-20
Mar
-20
Apr
-20
May
-20
Jun-
20Ju
l-20
Aug
-20
Sep-
20O
ct-2
0N
ov-2
0D
ec-2
0Ja
n-21
Feb-
21M
ar-2
1A
pr-2
1M
ay-2
1Ju
n-21
Jul-2
1A
ug-2
1Se
p-21
Oct
-21
Nov
-21
valu
e of
inde
x
Core IIP
Source: Survey calculation based on data from MOSPI and DPIIT
8.7 The growth rate of the ICI index during the period of April-November2021-22was13.7percentascomparedto(-)11.1percentinthecorrespondingperiodoflastfinancialyear.This acceleration in ICI is mainly driven by improved performance in the steel, cement, natural gas,coalandelectricity.Fertilizersandcrudeoilregisteredanegativegrowthof0.6percentand2.7percentrespectively.
Figure 7: Index of Eight core industries and IIP
Source: Survey calculation based on data from DPIIT
8.8 The Index of eight core industries has shown a pickup in growth in almost all its components barring crude oil and fertilizers in 2021-22(April-November) as compared to2019-20(April-November)(Figure7).Figure8showstherecoveryofcoreindustriesinNovember2021asapercentageofthevaluesinFebruary2020andNovember2019.Thesteel,crudeoil,fertilizers,electricityandnaturalgashaverecoveredascomparedtoFebruary2020level.Inaddition,thevalueofindexforsteel,fertilizers,electricity,naturalgasandcoalisalsohigherthantheprelockdownlevel(November2019).

272 Economic Survey 2021-22
Figure 8: Eight Core Index in Oct-21 as percent of February-20 and November-19
Survey calculation based on data from DPIIT
8.9 Capacity utilization (CU) is an important economic indicator to assess demand andinvestmentprospectsoftheeconomy.CUratesarelargelyabletotrackthepaceofmanufacturingactivitiesintheeconomy.ThegrowthrateoftheIIP-manufacturingindexandcapacityutilization(Figure9)providesasnapshotofthedemandconditionsforIndia’smanufacturingsector.ItisclearthattheextentofCUhaddecreasedsubstantiallyduringthefirstquarterof2020-21dueto the COVID-19 pandemic as severe restrictions were imposed in the country. It was, however, lesssevereduringthesecondwaveofCOVID-19(Q1:2021-22)mainlybecausethelockdownwas not imposed as a country wide measure, allowing states the flexibility to decide. At the aggregatelevel,CUforthemanufacturingsectordeclinedto40percentinQ1:FY21andthenroseto69.4inQ4:FY21,howeveritfellto60.0inQ1:FY22.
Figure 9: Capacity Utilization and IIP (manufacturing)
Source:SurveycalculationsbasedondatafromMOSPIandRBI

273Industry and Infrastructure
8.10 Anotherindicationofoptimismabouttheeconomicperformanceis theRBI’sBusinessExpectation Index (BEI). This index gives a glimpse of the demand conditions in the manufacturing sector by combining parameters which include overall business situation, production, order books, inventory of raw material and finished goods, profit margin, employment, exports and capacity utilization.BEI remained stablewith only a slight downturn in the second quarterof 2020-21 owing to the onset of the pandemic in the first quarter of that year (figure 10).Since then, ithasbeenonanupswing. It increased to124.1 in theQ2:FY22and to135.7 intheQ3:FY22ascomparedto119.6inthefirstquarterofthesameyear.Theuptickinthedatasuggests that the manufacturers perceive further improvement in overall business situation in Q3:FY22;andexhibitoptimismforQ4:FY22.Capacityutilizationandemploymentconditionsare expected to improve.
Figure 10: Manufacturing Index and Business Expectation Index
70.080.090.0
100.0110.0120.0130.0140.0150.0
Q1 Q2 Q3 Q4 Q1 Q2 Q3 Q4 Q1 Q2 Q3
2019-20 2020-21 2021-22
Val
ue o
f Ind
ices
BEI Manufacturing index
Source:SurveycalculationsbasedondatafromMOSPIandRBI
GROSS FIXED CAPITAL FORMATION8.11 Grossfixedcapitalformation(GFCF)isthegrossadditiontofixedassetslikemachineryandequipment,intangibleassetsandindicatesthestateofinvestmentsintheeconomy.During2019-20, theshareof industrialsector in totalGFCFin theeconomy(atcurrentprices)wasrecordedat30.1percent,whichisslightlylowerthan31percentinthepreviousfinancialyear(Figure11).Withintheindustrialsector,theshareofmanufacturinginGFCFwas51percent,followedbyelectricityat23percent,constructionat21percent,andminingwith5percent.While aggregateGFCF (at constantprices)grewby9.9per cent and industrialGFCFgrewby12.4percentin2018-19,itgrewby5.4percentand3.7percentrespectivelyin2019-20 (Figure12).During2019-20,GFCFintheminingandelectricitysectorsregisteredanegativegrowthof12.9percentand6percentrespectively,buttheGFCFgrewby10.2and4.4percentin the manufacturing and construction sector respectively on y-o-y basis.

274 Economic Survey 2021-22
Figure 11: GFCF in Industrial sectors
0.0
5.0
10.0
15.0
20.0
25.0
30.0
35.0
40.0
0.0
200.0
400.0
600.0
800.0
1,000.0
1,200.0
1,400.0
1,600.0
1,800.0
2,000.0
2011-12 2012-13 2013-14 2014-15 2015-16 2016-17 2017-18 2018-19 2019-20 Shar
e of
indu
stry
in to
tal G
FCF
(per
cent
)
GFC
F in
Rs.
'000
cro
re
Construction Electricity, gas, water supply & other utility servicesManufacturing Mining and quarryingIndustry (RHS)
Source:SurveycalculationsbasedonMoSPIdata,basedonGFCFatconstantprices.
Figure 12: Total and Industrial GFCF - Growth in percent
Source:SurveycalculationsbasedonMoSPIdata,basedonGFCFatconstantprices.
Credit in Industry
8.12 Grossbankcredit to the industrial sector, recordedagrowthof4.1percent inOctober2021(Y-o-Ybasis)comparedtoanegativegrowthof0.7growthinOctober2020.Theshareofindustryinnon-foodcreditstoodat26percentinOctober2021.Certainindustriessuchasmining, textiles, petroleum, coal products and nuclear fuels, rubber, plastic and infrastructure have shown consistent improvement in credit growth.

275Industry and Infrastructure
Table 4: Industry wise Deployment of Gross Bank credit - Variation in prevent (Year-on-Year)
Industry Oct-20 Mar-21 Oct-21
Mining and Quarrying (incl. Coal) 4.2 4.9 16.5FoodProcessing 5.1 7.8 6.5Beverage and Tobacco 2.5 -3.6 0.5Textiles -0.2 4.7 7.0Leather and Leather Products 6.3 1.8 -3.3Wood and Wood Products 7.0 8.6 6.1Paper and Paper Products 10.2 14.7 9.9Petroleum,CoalProductsandNuclearFuels 14.9 -8.1 13.1Chemicals and Chemical Products -2.3 -6.5 7.1Rubber,PlasticandtheirProducts 5.4 6.2 23.8GlassandGlassware 1.4 -5.1 -15.8Cement and Cement Products -4.6 -10.1 -21.5Basic Metal and Metal Product -4.7 -6.1 -16.3All Engineering -16.8 -6.3 6.6Vehicles,VehiclePartsandTransportEquipment 7.1 1.3 -6.1GemsandJewellery -3.4 -1.6 9.2Construction 4.1 -8.2 -6.0Infrastructure 0.1 3.7 8.9OtherIndustries 0.6 4.5 10.9Industries -0.7 0.5 4.1
Source:SurveycalculationsbasedonRBIdata.
Figure 13: Credit to Industry and its share in Total Non-food credit (percent)
0.0
5.0
10.0
15.0
20.0
25.0
30.0
0
500
1000
1500
2000
2500
3000
Jan-21 Feb-21 Mar-21 Apr-21 May-21 Jun-21 Jul-21 Aug-21 Sep-21 Oct-21
Sahr
e in
per
cent
Cre
dit t
o in
dust
ries
in R
S. T
hous
ands
cro
re
Micro and Small Medium Large Share of Industry (RHS)
Source:SurveycalculationsbasedonRBIdata.
FDI in Industries
8.13 MeasurestakenbytheGovernmenttoputinplaceanenablinginvestorfriendlyFDIPolicyhasresultedinincreasedFDIinflowssettingupnewrecords.FDIinflowsinIndiastoodatUS$

276 Economic Survey 2021-22
45.14billion in2014-15andhavecontinuously increasedsince then. India registered itshighesteverannualFDIinflowofUS$81.97billion(provisional)inthe2020-21reflectingagrowthof10percentascomparedtothepreviousyear.Theincreasehasbeenonthebackofgrowthof20percentin2019-20.Intheyear2021-22,FDIinflowgrewby4percentinthefirstsixmonthstoreachUS$42.86billionascomparedtoUS$41.37billionforthesameperiodoflastyear.
8.14 Overthelastsevenfinancialyears(2014-21),IndiareceivedFDIinflowworthUS$440.27billionwhichisnearly58percentoftheFDIreceivedbythecountryinthelast21years(US$763.83billion).
8.15 Severalinitiatives(Box1)havebeentakenbytheGovernmentsinceApril2020tofurtherreform theFDIpolicy framework toensureagainstopportunistic takeoversandacquisitionswhile also facilitating an increased flow of long-term capital, global technology, processes and international best practices to support the growth of these sectors.
Figure 14: Total FDI Inflows
Source:SurveycalculationbasedondatafromDPIIT.#ApriltoSept2021
Figure 15: FDI Equity Inflows in Manufacturing & Non-Manufacturing Sector
Source:SurveycalculationbasedondatafromDPIIT.#ApriltoSept2021

277Industry and Infrastructure
Box 1: FDI Policy reforms and Other Measures during the Covid-19 Pandemic period
ThechangesintheFDIpolicycanbebroadlycategorizedintomeasurestakentoimproveforeignparticipationwhileprotectingIndianindustryfromopportunistictakeovers,toenhancetransparencyandrationalizationofprocessesandstepstomonitorandexpediteimplementation.
a. Measures taken to allow greater foreign participation
(i) Defence Sector:TheFDIpolicyamendments,notifiedvidePressNote4(2020series)dated17.09.2020,havebeencarriedouttorealizethevisionofanAtmaNirbharBharat.Now,FDIindefencesectorisallowedupto74percentthroughautomaticroute(fromearlier49percent)forcompaniesseekingnewindustriallicenses.FDIbeyond74percentand up to 100 per cent will be permitted under Government route. For existing FDIapprovedholders/defencelicensees,infusionoffreshforeigninvestmentupto49percentresulting inchange inequity/ shareholdingpatterncanbedonebymakingdeclarationwithin30days.
(ii) Insurance Sector:GovernmentissuedPressNote2(2021)dated14.06.2021toraisethepermissible FDI limit from 49percent to 74percent in Insurance Companies under theautomatic route and allow foreign ownership and control with safeguards.
(ii) Petroleum & Natural Gas sector:PressNote3(2021)dated29.07.2021hasbeenissuedtopermitforeigninvestmentupto100percentundertheautomaticrouteincaseswheretheGovernmenthasaccordedan‘in-principle’approvalforstrategicdisinvestmentofaPublicSectorUndertaking(PSU)engagedinthePetroleumandNaturalGasSector.
(iv) Telecom sector:PressNote4(2021)dated06.10.2021hasbeenissuedtopermitforeigninvestmentupto100percentunderautomaticrouteinTelecomservicessector.
b. Curbing opportunistic acquisitions/takeovers:videPressNote3 (2020)dated17.04.2020,GovernmentamendedtheFDIpolicyaccordingtowhichanentityofacountry,whichshareslandborderwithIndiaorwherethebeneficialownerofaninvestmentintoIndiaissituatedinorisacitizenofanysuchcountry,caninvestonlyundertheGovernmentroute.Further,intheeventofthetransferofownershipofanyexistingorfutureFDIinanentityinIndia,directlyorindirectly,resultinginthebeneficialownershipfallingwithintherestriction/purviewofthesaidpolicyamendment,suchsubsequentchangeinbeneficialownershipwillalsorequireGovern-ment approval.
c. Measures to improve transparency and to rationalize processes include amendment of the Standard Operating Procedure (SOP)toimproveeaseofprocessingFDIproposals.
d. ‘FDI Monitoring Cell’hasbeenformedwhichfollowsupwithapplicant/investor,toexpediteFDIproposalswithaviewidentifyandhurdlesifany.AnInter-MinisterialCommittee(IMC)hasbeenconstitutedundertheChairpersonshipofSecretary,DepartmentforPromotionofIn-dustriesandInternalTradetotakeappropriatedecisionondelayedproposalsandthoseescalatedbyAdministrativeMinistries/Departments.
Performance of Central Public Sector Enterprises
8.16 CPSEs are an important constituent of the Indian industry. As on 31.03.2020, 256CPSEswereoperational.TheoverallnetprofitofoperatingCPSEsduring2019-20stoodat

278 Economic Survey 2021-22
Rs.93,295croreContributionofallCPSEstocentralexchequerbywayofexciseduty,GST,corporatetax,dividend,etc.stoodatRs.3,76,425crore.TheCPSEsacrosssectorsemployed14,73,810persons,ofwhich9,21,876wereregularemployees.Therewere58listedCPSEsason31.03.2020withmarketcapitalizationofRs.8.2lakhcrore.In2021-22till31stOct,2021,2021-22CPSEsincurredcapitalexpenditureofRs.1,06,749croresagainsttheannualtargetofRs.2,69,742crore.During2020-21,atotalexpenditureofRs.2,04,243crorewasincurredasCAPEXagainstaprojectedexpenditureofRs2,20,249cr.
8.17 In accordance with Union Budget 2021-22 announcement, the government hasapproved a policy of strategic disinvestment of public sector enterprises that will provide a clear roadmap for disinvestment in all non-strategic and strategic sectors. The guideline for implementation of new public sector enterprise policy for CPSEs have been notified on 13thDecember,2021.Thiswillhelpthegovernmenttomakeuseofdisinvestmentproceedsto finance various social sector and developmental programmes while disinvestment shall infuse private capital, technology and best management practices in the disinvested CPSEs. The GovernmentnotifiedthenewPublicSectorEnterprise(PSE)Policyon4February2021.The new PSE Policy envisages classification of CPSEs into Strategic and Non-Strategic Sectors and exempts certain CPSEs such as those setup as not-for-profit companies under the CompaniesAct,2013orthosesupportingvulnerableandweakersectionsofsociety,fromthescopeofthePolicy.Thestrategicsectorsasperthepolicyareasunder:atomicenergy;spaceanddefense; transportand telecommunication;power;petroleum;coalandotherminerals;banking,insurance,andfinancialservices.Underthe4broadbasketsinwhichthestrategicsectors are classified-i.e., national security, critical infrastructure, energy and minerals and financial services- only a bare minimum presence of CPSEs in the aforesaid strategic sectors istobemaintained.Thenon-strategicCPSEswillbeprivatizedorotherwiseshallbeclosed.Thus, the policy on public sector enterprises provides a clear path for disinvestment in all non-strategicandstrategicsectorsandstrengthenstheideaofMinimumGovernment-MaximumGovernance
Corporate performance
8.18 With economic recovery, concomitant improvement in demand and improved business sentiments have had a positive effect on the performance of corporate sector. Further, in response to favourable base effect, sales of 1,687 listed manufacturingcompanies recorded steady and broad-based growth of 34.0 percent inQ2:FY22 ascomparedto(-)4.3percentgrowthinQ2:FY21,onanannual(y-o-y)basis.Expenditureinthesecompaniesalsoincreasedby38.3percentinQ2:FY22ascomparedtoadecreaseof7.7percentinQ2:FY21.Thenetprofittosalesratioofthesecompanieswasincreasingdespite thepandemicshocktoreacha levelof10.6percent inQ2:F22reflectingbetterprofit prospects for these companies in the current financial year. The improvement in profitability of large corporates on the whole indicates that the companies withstood the pandemic shock well and many have rebounded.

279Industry and Infrastructure
Figure 16: Listed Manufacturing Companies in the Private Corporate Sector - Growth (Y-o-Y)
Source:SurveyCalculationsbasedondatafromRBI
Figure 17: Net Profit to Sales ratio of Listed Manufacturing Private Companies
Source:SurveyCalculationsbasedondatafromRBI
SECTOR WISE PERFORMANCE AND ISSUES IN INDUSTRYSteel
8.19 Theperformanceofthesteelindustryispivotalforthegrowthoftheeconomy.DespitebeinghitbyCOVID-19, thesteel industryhasbouncedbackwithcumulativeproductionofcrude andfinishedsteel in 2021-22(April-October) at 66.91MTand62.37MT, an increaseof25.0percentand28.9percent respectively(Figure18),overcorrespondingperiod lastyearwhileconsumptionoffinishedsteelat57.39MTincreasedby25.0percentoverthesameperiod(Figure19).

280 Economic Survey 2021-22
Figure 18: Production and capacity utilization
455055606570758085
020406080
100120
2013
2014
2015
2016
2017
2018
2019
2020
Apr
il-O
ctob
er 2
1 capa
city
util
isatio
n(%
)
Prod
uctio
n in
mill
ion
tonn
es
Crude steel finished steel Capcity Utilisation(%)(RHS)
Source:SurveycalculationsbasedondatafromMinistryofSteel*indicatesprovisionalfigure
Figure 19: Production and Consumption - Steel
Source: Survey calculations based on data from M/o Steel. P-provisional
8.20 Itisimportanttopointoutthatglobalsteelproductionhassloweddown.Thereductionin world output of steel is because of reduced global production. According to press release byWorldSteelAssociation(November,2021)worldcrudesteelproductionwas143.3milliontonnes (Mt) inNovember 2021, a 9.9 percent decrease compared toNovember 2020.Witheconomic recovery, the global demand for steel is slated to increase this year and the next. The steel industry is expected to face increase in demand in the next financial year also. This is mainlyonaccountoftheGovernmentofIndia’sfocusoninfrastructuredevelopmentincludingroads, railways and defence production. The PLI Scheme for specialty steel is well timed to provide the necessary incentive towards investment in value added steel -a step in the direction to increase its production for internal consumption as well as exports. Additional measures such as Domestically Manufactured Iron and Steel Products (DMI&SP) Policy, Quality Control Order (QCO) covering carbon steel, alloy steel, tin plate, tin free steel and stainless steel and aR&Dschemeviz.“PromotionofR&DinIron&SteelSector”toaddressthetechnological

281Industry and Infrastructure
issues faced by the sector also aim to strengthen the industry and to ensure that increase in production of steel is achieved in a sustainable manner.
Coal
8.21 CoalisthemostimportantandabundantfossilfuelinIndiaandaccountsfor55percentofthecountry’senergyneed.Coalproductionincreasedby12.24percentinApril-October2021ascomparedto(-)3.91percentinApril-October2020.OverallproductionofrawcoalinIndiaduringtheyear2020-21was716.08milliontonnes(provisional)ascomparedto730.87milliontonnesachievedinthepreviousyear2019-20(figure20).
Figure 20: Coal - Production, Demand and imports of Coal
Source: Survey calculations based on data from M/o Coal
8.22 Despite the push for renewables, as per the Draft National Energy Policy of Niti Aayog, the demand for coal is expected to remain in the range of 1.3-1.5BillionTonnes by 2030.Nonetheless,severalinitiativesarebeingtakenbythecoalligniteproducingPSUstoreducetheircarbonfootprints.By2020-21,thePSUshadbrought56000Halandundergreencovercreatingacarbonsinkofabout5.0LakhTonofCO2equivalent/Year. It isenvisaged tobringabout30000Haofadditionland(inandaroundcoalminingareas)undergreencoverbyplantationofaround75milliontreesby2030.Further,ason31.03.2021,thePSUshaveinstalledrenewablecapacityof1496Megawattsandduringthenext5yearsitisplannedtoinstalladditional5560Megawatts of renewable capacity with substantial carbon offset potential.
8.23 Openingupofcoalminingforprivatesector is themostambitiouscoalsectorreform.This will bring efficiency & competition in coal production, attract investments & best-in-classtechnology,andhelpcreatemorejobsinthecoalsector.Sofar,28coalmineshavebeensuccessfullyauctioned.Outofthese,27coalmineshavebeenauctionedtoprivatecompanies.Auction process for 88 coal mines is underway.

282 Economic Survey 2021-22
Micro Small Medium Enterprise
8.24 Micro,Small&MediumEnterprises(MSMEs)contributesignificantlytotheeconomicandsocialdevelopmentofthecountrybyfosteringentrepreneurshipandbygeneratingemploymentopportunities. The relative importance of MSMEs can be gauged from the fact that the share of MSMEGVAintotalGVA(currentprices)for2019-20was33.08percent.
8.25 TheThegovernmenthastakenseveralinitiativestonurtureandpromotetheMSMEs.TherevisioninthedefinitionofMSMEsbroughtinw.e.f.1stJuly,2020aspartoftheAtmaNirbharBharat package introduced a composite-criteria of investment and annual turnover- and identical limits for manufacturing and services sector (Table 5). The modified definition of MSMEswill facilitate expansion and growth of these enterprises. The resulting economies of scale can enhance productivity without the MSMEs losing out on several government incentives including market support, export promotion, preferential procurement in the public sector and incentives through the Micro Small Enterprises- Cluster Development Programme (MSE-CDP), Prime MinisterEmploymentGenerationProgramme(PMEGP)andSchemeofFundforRegenerationofTraditional Industries (SFURTI)andenablingof ITecosystems.Thisenablingenvironmentwill promote competition and avoid dwarfism among MSMEs. The recent measures taken by theGovernmenttoimprovetheeaseofdoingbusinessfortheMSMEsincludethelaunchofthenewUdyamRegistrationPortalinJuly2020.Theregistrationprocessunderthisisfullyonline,digital, paperless and is based on self-declaration.No documents or proof are required to beuploadedforregisteringasamicro,smallandmediumenterprise.AadhaarandPANarerequiredfor registration and details on investment and turnover of enterprises are taken automatically from relevantGovernmentdatabases.NewregistrationprocesshasboostedtheeaseofdoingbusinessforMSMEsbyreducingtransactiontimeandcosts.Ason17.01.2022,66,34,006enterpriseshaveregisteredontheUdyamportal,outofwhich62,79,858aremicro;3,19,793aresmall;and34,355aremediumenterprises.Further,amongthenewmeasures,theretailandwholesaletradeswereincludedasMSMEsandtheyareallowedtoberegisteredonUdyamRegistrationPortal.However,the benefits to retail and wholesale trade MSMEs are to be restricted to Priority Sector Lending only.Inthisregard,now,streetvendorscanalsoregisterasretailtradersonUdyamRegistration(UR)portalandavailthebenefitofprioritysectorlending.
Table 5: Definition of MSMEs - Old and New
Old Definition New Definition
Manufacturing Services Manufacturing Services
Micro
InvestmentinPlant and Ma-chinery: Does not exceedRs.25Lakh.
InvestmentinEquipment:DoesnotexceedRs.10Lakh.
InvestmentinPlantandMachineryorEquip-mentand turnover:
TheinvestmentinplantandmachineryorequipmentdoesnotexceedRs.1CroreandturnoverdoesnotexceedRs.5crores.
Small
InvestmentinPlant and Machin-ery: More than Rs.25lakhbutdoes not exceed Rs.5crore
InvestmentinEquipment:MorethanRs.10Lakhbut does not ex-ceedRs.2crore
InvestmentinPlantandMachineryorEquip-mentandturnover:TheinvestmentinplantandmachineryorequipmentdoesnotexceedRs.10croreandturnoverdoesnotexceedRs.50crore.

283Industry and Infrastructure
Medium
InvestmentinPlant and Machin-ery: More than Rs.5crorebutdoes not exceed Rs.10crore
InvestmentinEquipment:MorethanRs.2crorebutdoesnotRs.5crore.
InvestmentinPlantandMachineryorEquip-mentandturnover:TheinvestmentinplantandmachineryorequipmentdoesnotexceedRs.50croreandturnoverdoesnotexceedRs.250crore.
8.26.TheCHAMPIONS portal (www.champion.gov.in) is an ICT based technology systemfor making the smaller units big by helping and handholding them. A network of control rooms is created in aHub&SpokeModelwhere hub is situated in theMinistry ofMSME,NewDelhiwhereas68spokesare locatedacross thecountry invariousofficesand institutionsofMinistry.Ason16.01.2022,42,304grievanceshavebeenreceived,outofwhich41,965(99.1%)grievances have been replied.
The key features of the portal include:
¾ Informationdissemination:RegularupdatesonrecentdevelopmentinMSMEsector.
¾ Withaviewtoresolvethegrievancesinafasttrackmanner,allNationalisedBanks,agoodnumberofPrivate/RegionalRuralBanks,StateFinancialCorporations,CentralGovernmentMinistries/Departments,StateGovernmentsandCPSEshavebeenonboardedontheportal.
¾ Scheme/ProgrammewisemappingofofficialsoftheMinistryforfasttrackresponsesofgrievances.
¾ IntegrationwithvariousportalssuchasMSMESamadhaan,UdyamRegistration,CPGRAMetc.
Textiles
8.27 Textileindustryisthesecondlargestemploymentgeneratorinthecountry,nextonlytoagriculture.Inthelastdecade,closetoRs.203,000croreshavebeeninvestedinthisindustrywith direct and indirect employment of about 105million people, amajor part ofwhich iswomen. Despitetheindustrybeingdeeplyaffectedbythelockdown,ithasshownaremarkablerecoverywithpositivecontributiontogrowth,asreflectedbyIIP,of3.6percentduringApril-October2020.
8.28 Production-Linked Incentive (PLI) Scheme forManMade Fiber (MMF) segment andtechnicaltextiles,notifiedinSeptember2021,forenhancingIndia’smanufacturingcapabilitiesandenhancingexportswillfocusonpromotionof40MMFappareland10Technicaltextileslines and create global champions. It is estimated that over the period of five years, the PLI Scheme forTextileswill lead to fresh investmentofmore thanRs.19,000crore, cumulativeturnoverofoverRs.3lakhcrorewillbeachievedunderthisschemeand,willcreateadditionalemploymentopportunitiesofmorethan7.5lakhjobsinthissector.
8.29 Furtherinamajorsupporttoenhancethecompetitivenessofthesector,thegovernmentnotifiedthesettingupof7PMMEGAINTEGRATEDTEXTILESREGIONANDAPPARELPARK (MITRA) in October 2021 with a total outlay of Rs. 4,445 crores. The scheme isexpected to further the vision of AtmaNirbhar Bharat and to position India strongly on the

284 Economic Survey 2021-22
globaltextilesmap.PMMITRAinspiredfrom5F’s-farm to fibre; fibre to factory; factory to fashion; fashion to foreign -will strengthen the textile sector by developing integrated large scale and modern industrial infrastructure facility for entire value-chain of the textile industry. It is expected to reduce the logistics cost and will help India in attracting investments, and boosting employment generation. Competitiveness Incentive Support (CIS) of `300CrorewillalsobeprovidedtoeachPMMITRAParkforearlyestablishmentoftextilesmanufacturingunitsinPMMITRAPark.Suchsupportiscrucialforanewprojectwhichhasnotbeenabletobreakevenand needs support till it is able to scale up production and be able to establish its viability. PM MITRAParkwillbedeveloped,byaSpecialPurposeVehiclewhichwillbeownedbytheStateGovernmentandGovernmentofIndia,inaPublicPrivatePartnership(PPP)Mode.
Electronics Industry
8.30 World over, electronics is recognised as a ‘meta-resource’. Electronics industry is theworld’slargestandfastestgrowingindustryandisincreasinglyfindingapplicationsinallsectorsof the economy. With its impact in developing infrastructure, raising productivity, increasing efficiency in delivery of services, and enabling social transformation, it is accepted as a key enablerinthecountry’seconomicdevelopment.
8.31 Government accords high priority to electronics hardware manufacturing. Thegovernmenthas thereforenotified theNationalPolicyonElectronics2019(NPE2019)on25.02.2019topositionIndiaasaglobalhubforElectronicsSystemDesignandManufacturing(ESDM) by encouraging and driving capabilities in the country for developing core components,includingchipsets.Additionally,NPE2019attemptstocatalyzethegrowthofIndian electronics ecosystem through the (i)Production Linked Incentive (PLI) Schemes for LargeScaleElectronicsManufacturing,(ii)PLISchemeforITHardware;(iii)SchemeforPromotionofManufacturingofElectronicComponentsandSemiconductors(SPECS);and(iv)ModifiedElectronicsManufacturingClusters2.0(EMC2.0).PLIforLargeScaleElectronicsManufacturinghasbeennotifiedonApril 01, 2020whichprovides an incentiveof 4 to6percent on incremental sales (over base year)to eligible companies involved in mobile phone manufacturing and manufacturing of specified electronic components, including Assembly, Testing,Marking and Packaging(ATMP) units (See box 3 for details on PLI scheme).AsperJune2021QuarterlyRevenueRecover(QRR)theschemehasresultedininvestmentof Rs.2,595croreandproductionworthRs.67,275croreofwhich,31percentorRs.20,568crorewas exported. PLI scheme for ITHardwarewas notified onMarch 03, 2021whichextends an incentive in the range of 1 to 4 percent on net incremental sales (over base year) of goods manufactured in India and covered under the target segment, to eligible companies, for a period of four years. The target segment under PLI Scheme includes (i) Laptops (ii) Tablets (iii)All-in-OnePCsand(iv)Servers.AsperQ2:FY21-22QRR,totalsalesofmanufacturedgoods in target segment stoodatRs. 503croreswithRs. 16.50crore investment.Further,the government has through the SPECS scheme and the EMC 2.0 provided an enablingenvironment in the form of financial incentive for capital expenditure and by creating plug andplayfacilitieswiththeviewofattractingmajorelectronicsmanufacturers.

285Industry and Infrastructure
8.32Recently, the government has approved an outlay of Rs. 76,000Crore (>US$ 10Bn) for the development of Semiconductors and Display Manufacturing Ecosystem. Government’s intervention to boost this industry has come at a time when the globaleconomy is facing an acute shortage of semiconductors due to severe disruptions in supply chains. Several companies from diverse industries have been forced to either shut or curtail production in response to breakdown of supply chains. The PLI and other schemes to boost semiconductors will not only help domestic companies to overcome the challenges posed by COVID 19 but also assist them to become globally competitive especially in chip making. Semiconductors are integral part of modern technology used in automobiles and its components, electronic and medical devices. The comprehensive interventions being introduced by the government will aid in the establishment of an ecosystem that boosts semiconductor production in India.
Box 2: PARAKH - A Unified Laboratory Network
RecognizingthattestingandcertificationarecrucialforenhancingthecompetitivenessofIndiangoods and services, a portal called “PARAKH” has been set up in June 2021,wherein all theaccredited,certifiedandrecognisedlaboratoriesinthecountrywouldbemappedonaGeographicInformationSystem(GIS).ThisunitedlaboratorynetworkhasbeendevelopedwiththesupportofMinistryofElectronicsandInformationTechnology(MEITY),BhaskaracharyaNationalInstituteofSpaceApplicationsandGeoInformatics,Gujarat(BISAG)andtheconcernedlineministries/departmentsoftheGovernmentofIndia.Over6,580laboratorieshavealreadybeenmappedontheportal includingNABLaccreditedlaboratories. Thesealsoinclude477BISempaneledandrecognized laboratories. Laboratories recognized by FSSAI, EIC,APEDA andCSIR have alsobeen mapped on the portal. The portal makes it possible to search labs for a particular product, standard, testmethod in astate or a city and also find nearby labs. It also enables finding thescopeofaccreditationandtestmethodsofalaboratory.Theportalallowsforaddingnewprivatelaboratoriesandbookingatestthroughit.
Box 3: Production Linked Incentives Schemes
PLISchemeslaunchedinMarch2020,areacornerstoneoftheGovernment’spushforachievinganAtmaNirbhar Bharat. The idea is to provide support to the sectors, regain dominance in global trade and bemorepreparedforthevolatilitiesandshocksinglobalsupplychainsasopposedtotheprotectionistapproachof thepre-1991era.Theobjectiveof theschemeis toboostdomesticmanufacturing insunrise and strategic sectors, improvecost competitivenessof domestically manufactured goods,enhancedomesticcapacityandeconomiesofscale.Theschemeisspecificallydesignedtoattractinvestmentsinsectorsofcorecompetencyandcutting-edgetechnology.Theselectionofsectorshasbeendonebasedonthesectors’abilitiestointroducelatesttechnology,generatedirectandindirectemployment by reaching global scales while increasing competitiveness to ensure penetration of Indian companies in the global value chains.

286 Economic Survey 2021-22
This scheme is expected to make domestic manufacturing globally competitive and will create globalchampions inmanufacturing.TheGovernmenthasalreadycommittedRs.1.97 lakhcrores,over 5 years starting from 2021-22 in 13 sectors. Recently, PLI in the 14th sector - drones anddrone components has been includedwith an additional layout ofRs. 120 crores.The initial 13sectors are Electronic/Technology Products, Medical devices, Drug intermediaries and APIs, Mobile Manufacturing and Specified Electronic Components, Pharmaceuticals drugs, Telecom &NetworkingProducts,Telecommunications,FoodProducts,WhiteGoods (ACs&LED),HighEfficiency Solar PV Modules, Automobiles & Auto Components, Advance Chemistry Cell (ACC) Battery,Textile Products:ManMadeFabrics segment and technical textiles and Specialty Steel.
Sofar,the13initialschemeshavebeennotifiedandguidelineshavebeenissuedwhererequired.Thefirst three schemes notified were for mobile phones and specified electronic components, APIs/Drug intermediates and medical devices. In case of mobile phones and specified electronic components, inthefirstround,16applicationsworthRs.36440croreswereapprovedandinthesecondround,18applicationsworthRs.483croreswereapprovedbythecompetentauthority.IncaseofAPIs/drugintermediatesandmedicaldevices,42applicationsworthRs.4347.26croreand13applicationswithacommittedinvestmentofRs.798.93croreshavebeenapprovedsofarbythecompetentauthority,respectively.
Pharmaceuticals
8.33 IndianPharmaceuticalindustryranksthirdintheworldinpharmaceuticalproductionbyvolume.During2020-21,totalpharmaexportUS$24.4BnagainstthetotalpharmaimportofUS$7.0Bn(Figure21), therebygeneratingtradesurplusofUS$17.5Bn. India is the largestsupplierofgenericmedicineswitha20percentshareintheglobalsupply.PricecompetitivenessandgoodqualityhasenabledIndianmedicinesproducerstobedominantplayersintheworldmarket, thereby making the country the “Pharmacy of the world”.FDIinthepharmaceuticalsectorhasseenasuddenspurt in2020-21visavis thepreviousyearshowinga200percentincrease. In 2021-22 (April-September) the FDI inflows continued to be buoyant at Rs.4413crore,growingattherateof53percentoverthesameperiodin2020-21.Theextraordinarygrowth of foreign investments in pharma sector is mainly on account of investments to meet COVID-19 related demands for therapeutics and vaccines.
8.34 Althoughaprominentplayerinformulations, thecountryissignificantlydependentonthe import of bulk drugs that are used in the formulation of medicine. In certain cases, import dependencevariesbetween80-100percent.ThisissueofimportdependenceforcriticalbulkdrugswasexaminedbyaHigh-LevelCommitteeandacompositesetofactionstoincentivizebulk drug production have been initiated.
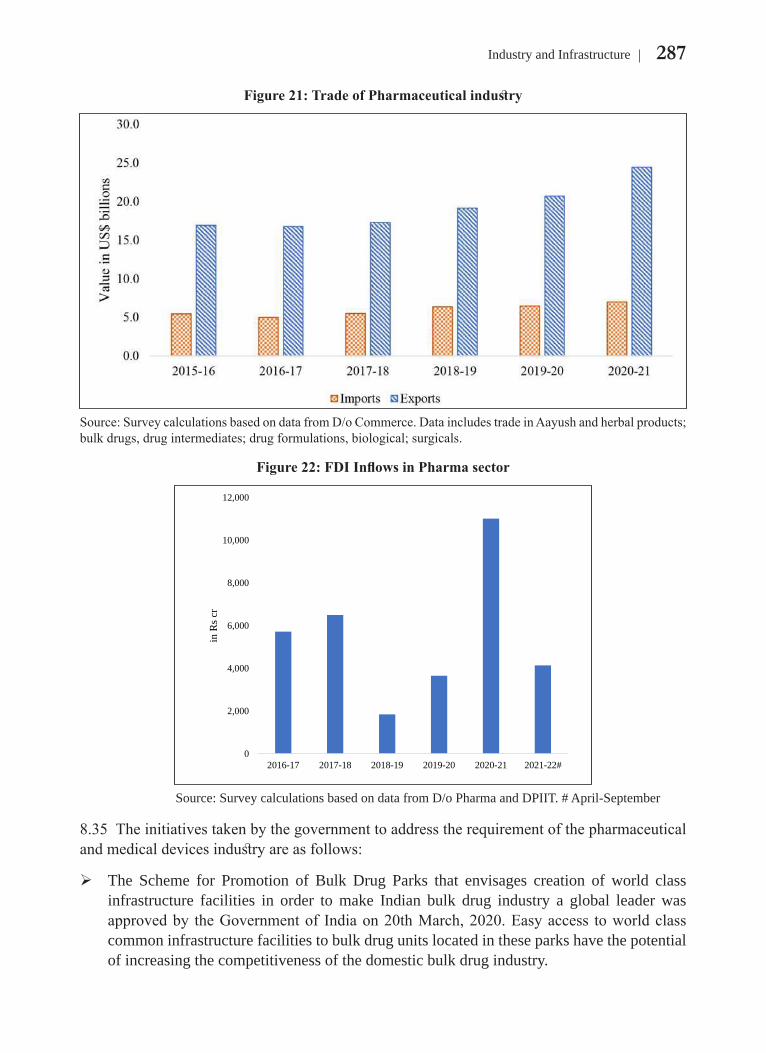
287Industry and Infrastructure
Figure 21: Trade of Pharmaceutical industry
Source:SurveycalculationsbasedondatafromD/oCommerce.DataincludestradeinAayushandherbalproducts;bulkdrugs,drugintermediates;drugformulations,biological;surgicals.
Figure 22: FDI Inflows in Pharma sector
0
2,000
4,000
6,000
8,000
10,000
12,000
2016-17 2017-18 2018-19 2019-20 2020-21 2021-22#
in R
s cr
Source: Survey calculations based on data from D/o Pharma and DPIIT. # April-September
8.35 Theinitiativestakenbythegovernmenttoaddresstherequirementofthepharmaceuticalandmedicaldevicesindustryareasfollows:
¾ The Scheme for Promotion of Bulk Drug Parks that envisages creation of world class infrastructure facilities in order to make Indian bulk drug industry a global leader was approvedby theGovernmentof Indiaon20thMarch,2020.Easyaccess toworldclasscommon infrastructure facilities to bulk drug units located in these parks have the potential of increasing the competitiveness of the domestic bulk drug industry.

288 Economic Survey 2021-22
¾ Production linked incentive (PLI) scheme for Bulk drugs has been approved for promotion ofdomesticmanufacturingof53criticalAPIsinthecountrywithabudgetofINR6,940crore for the next eight years.
¾ Production linked incentive (PLI) scheme for Pharmaceuticals has been approved by the GovernmentofIndiaon24thMarch,2021withatotalfinancialoutlayofRs.15,000croreand three categories (biopharmaceuticals, API/KSM/drug intermediates, and drugs notcoveredunderCategory1andCategory2)ofpharmaceuticalgoodswillbeincentivizedundertheschemebasedontheirincrementalsalesfor6years.Amongthethreeidentifiedproduct categories under the scheme as noted above, this scheme excludes the 41 bulk drugs covered under the PLI for Bulk drugs.
¾ Production Linked Incentive (PLI) Scheme for Promoting Domestic Manufacturing of MedicalDeviceswasapprovedon20thMarch,2020.ThetotalfinancialoutlayoftheSchemeisRs.3,420crore.TheSchemeisapplicableonlytothegreenfieldprojectsandintendstoattract large investments in the medical devices sector. The four target segments of medical devicesarecancercare/radiotherapymedicaldevices;radiology&imagingmedicaldevicesandnuclearimagingdevices;anesthetics&cardio-respiratorymedicaldevices;renalcaremedical devices and all implants including implantable electronic devices.
INFRASTUCTURE8.36 Infrastructureisthebackboneforanyeconomy.Theextentandqualityofinfrastructuredetermines the ability of the country to utilize its comparative advantage and enables costcompetitiveness.Giventhestrongbackwardandforwardlinkagesandthepositiveexternalitiesthat infrastructure generates, it can be a vehicle for social and economic transformation.
National Infrastructure Pipeline (NIP)
8.37 PublicPrivatePartnershipininfrastructurehasbeenanimportantsourceofinvestmentinthe sector. As per the database of the World Bank on private participation in infrastructure, India isrankedsecondamongdevelopingcountriesbothbythenumberofPPPProjectsaswellasthe associated investments. Much of the Indian success in PPPs is attributed to development of robustinstitutionalstructure,financialsupport,anduseofstandardizeddocuments,bothprocessdocuments likeModelRequest forQualificationandModelRequest forProposalaswellassubstantive documents like the Model Concession Agreements across infrastructure sectors.
8.38 ThePublicPrivatePartnershipAppraisalCommittee(PPPAC)whichisresponsiblefortheappraisalofPPPprojectshascleared66projectswithatotalprojectcostofRs.137218croresfrom2014-15to2020-21.ThegovernmentlaunchedtheViabilityGapFunding(VGF)schemefor providing financial assistance to financially unviable but socially/ economically desirable PPPprojects.Upto20percentoftheprojectcostisfundedunderthisschemeasagrant.Basedon the above, the totalVGFamountdisbursedbetween2014-15 to2020-21byDEA isRs.2943crores.Further,theGovernmentofIndiahasinNovember2020approvedcontinuationofandrevampingoftheSchemeforFinancialSupporttoPublicPrivatePartnerships(PPPs)inInfrastructureViabilityGapFunding(VGF)Schemetill2024-25.TherevampedVFGscheme

289Industry and Infrastructure
isexpectedtoattractmorePPPprojectsandfacilitateprivateinvestmentinsocialsectorssuchas health, education, waste water, solid waste management, water supply etc.
8.39 InordertoachievetheGDPof$5trillionby2024-25,Indianeedstospendabout$1.4trillionovertheseyearsoninfrastructure.DuringFYs2008-17,IndiainvestedaboutUS$1.1trilliononinfrastructure.However,thechallengeistostepupinfrastructureinvestmentsubstantially.Keeping this objective in view, National Infrastructure Pipeline (NIP) was launched withprojectedinfrastructureinvestmentofaroundRs.111lakhcrore(US$1.5trillions)duringFY2020-2025 toprovideworld-class infrastructure across the country, and improve thequalityoflifeforallcitizens.Italsoenvisagestoimproveprojectpreparationandattractinvestment,bothdomesticandforeignininfrastructure.NIPwaslaunchedwith6,835projects,whichhasexpandedtoover9,000projectscovering34infrastructuresub-sectors.Duringthefiscals2020to2025,sectorssuchasenergy(24percent),roads(19percent),urban(16percent),andrailways(13percent)amounttoaround70percentoftheprojectedcapitalexpenditureininfrastructureinIndia.Sectorwisebreak-upofthepipelinefortheperiod2019-20to2024-25isgiveninfigure23.NIPhasinvolvedallthestakeholdersforacoordinatedapproachtoinfrastructurecreationinIndiatoboostshort-termaswellasthepotentialGDPgrowth.
Figure 23: Industry wise breakup of pipeline
0.00
5.00
10.00
15.00
20.00
25.00
Ener
gy
Roa
ds
Urb
an
Rai
lway
s
Rur
al In
fras
truct
ure
Irrig
atio
n
Soci
al In
fras
truct
ure
Tele
com
mun
icat
ions
Indu
stria
l Inf
rast
ruct
ure
Airp
orts
Ports
Agr
icul
ture
and
Foo
dPr
oces
sing
Infr
astru
ctur
e
in R
s lak
h cr
ore
Source:SurveycalculationsbasedondatafromtheReportoftheTaskForceonNationalInfrastructurePipelinefor2019-2025
National Monetisation Pipeline (NMP)
8.40 NITIAayoghasdevelopedthe‘NationalMonetisationPipeline(NMPVolumes1&2)’in consultation with infrastructure line ministries. Asset monetisation, entails a limited period license/ lease of an asset, owned by the government or a public authority, to a private sector entity for an upfront or periodic consideration. The private sector entity is expected to operate and maintain the asset based on the terms of the contract/concession, generating returns through higheroperatingefficienciesandenhanceduserexperience.Funds,soreceivedbythepublicauthority, are reinvested in new infrastructure, or deployed for other public purposes. Such contracts include provision for transfer of asset back to the authority at the end of the period.

290 Economic Survey 2021-22
8.41 A robust asset pipeline has been prepared to provide a comprehensive view to investors and developers of the investment avenues in infrastructure. The pipeline includes selection of de-risked and brownfield assets with stable revenue generation profile (or long rights) which will make for an attractive investment option. Total indicative value of NMP for core assets of theCentralGovernmenthasbeenestimatedatRs6.0lakhcroreover4-yearperiod(5.4percentof total infrastructure investment envisaged under NIP).
Road Transport
8.42 RoadtransportisoneofthemostcosteffectiveandconvenientmodesoftransportationinIndia both for freight and passengers as it has high penetration level with door-to-door delivery. Importanceof road infrastructure iswidelyrecognizedasapotentmeansofsocio-economicintegration and is vital for the economic development of the country. The road network of the countryconsistsofNationalHighways(NH),State-Highways(SH),DistrictRoads,RuralRoads,UrbanRoadsandProjectRoadsofover63.71(Provisional)lakhkmofroadsason31March2019,whichisthesecond-largestintheworld,aftertheUnitedStateswith66.45lakhkmsofroads.There has been a consistent increase in the construction ofNationalHighways/roadssince2013-14with13,327kmsofroadsconstructedin2020-21ascomparedto10,237kmsin2019-20,indicatinganincreaseof30.2percentoverthepreviousyear.Inthe2021-22(tillSeptember),3,824kmsofroadnetworkwereconstructed.Theextentofroadconstructionperdayincreasedsubstantiallyin2020-21to36.5kmsperdayfrom28kmsperdayin2019-20,ariseby30.4percentascomparedtothepreviousyear(Figure24).Thesignificantupturninroadconstruction in2020-21 isdue to the increase inpublicexpenditureby29.5percentascomparedtothepreviousyear-areflectionoftheimpetusgivenbytheGovernmentofIndiatoa critical sector that generates employment and supports infrastructure during a pandemic year. In addition to action taken to increase the network of national highways, the govt has taken measurestoaddressvillagelevelroadnetworkthroughtheGramSadakYojanadiscussedinchapter9.AcomparisonofNationalHighwaynetworkinthecountryin2011and2021maybeseeninchapter10.
Figure 24: Road Construction
0
5
10
15
20
25
30
35
40
0
2,000
4,000
6,000
8,000
10,000
12,000
14,000
2014-15 2015-16 2016-17 2017-18 2018- 19 2019-20 2020-21 2021-22*
Roa
d co
nstr
uctio
n in
KM
per
day
Con
stru
ctio
n of
NH
s/ R
oads
(km
)
Construction of NHs/ Roads (km) Road construction in KM per day (RHS)
Source:SurveycalculationsbasedondatafromM/oRTH.Foryear2021-22-Ason30.9.2021

291Industry and Infrastructure
Figure 25: Investments in Roads sector
Source:SurveycalculationsbasedondatafromM/oRTH.Foryear2021-22-Ason30.9.2021
Railways
8.43Despite facing the unprecedentedCOVID related challenges Indian railways (IR)has not only been able to move millions of people but also able to keep national supply chain running. Being the third largest network in the world under single management and withover68,102routekmsIRstrivestoprovidesafe,efficient,competitiveandworldclass transport system.An average of 1835 track kmper year of new track length has beenaddedthroughnew-lineandmulti-trackingprojectsduring2014-2021ascomparedtotheaverageof720trackkmsperdayduring2009-14.IRisalsoadoptingindigenousnewtechnologysuchasKAVACH,VandeBharattrainsandredevelopmentofstationstohavesafeandbetterjourneyexperience.DuringFY21,IRcarried1.23billiontonnesoffreight and1.25billionpassengers. In addition,despiteCOVID -19pandemic revenueearningfreightloading(excludingloadingbyKonkanRailwayCorporationLtd.(KRCL)was 1230.9 million tonnes in 2020-21 as compared to 1208.4 million tonnes during2019-20(Figure26).Passengersoriginatingwere1250millionin2020-21ascomparedto8086millionin2019-20(Figure27)
Figure 26: Revenue earning freight loading originating traffic (million tonnes)
Source:MinistryofRailways.ExcludesloadingbyKonkanRailwayCorporationLtd.(KRCL).P-provisional

292 Economic Survey 2021-22
Figure 27: Passengers originating (in millions) and passengers earnings (Rs crores)
0
10000
20000
30000
40000
50000
60000
0100020003000400050006000700080009000
FY13 FY14 FY15 FY16 FY17 FY18 FY19 FY20 FY21(P)
Pass
enge
rs e
arni
ngs(
rs. c
rore
s)
Pass
enge
rs o
rigi
natin
g(in
mill
ions
)
Passengers Originating (in million)
Passengers Earnings (Rs. Crores) RHS
Source:MinistryofRailways.IncludesmetrorailwayKolkata
8.44 SafetyofthepassengersandsafeupkeepofrailwaysassetsisthetopmostpriorityofIR.Withacontinuingfocusonsafetyofpassengers thenumberofconsequential trainaccidentshas come down from 59 in 2018-19 to 55 in 2019-20 (pre-Covid) and further to 22 in thelastin2020-21.Inaddition,inordertostrengthentheagriculturesector,ason31stDecember2021,IRhasoperated1,841KisanRailservices,transportingapproximately6.0lakhtonnesofperishables including fruits and vegetables.
Figure 28: Major Capital Expenditure in IR
Source:Ministryofrailways

293Industry and Infrastructure
8.45 CAPEXhasbeenincreasedsubstantiallyforIRfromanaverageannualCAPEXduring2009-14ofRs.45,980crorestoRs.2,15,058croresduring2021-22(BE)Figure(28).
IRistargetingfor100%electrificationofitsnetworkbyDecember2023(figure29)
Figure 29: Electrified Route km as a percent of total route km
0
10000
20000
30000
40000
50000
60000
70000
2000-01 2010-11 2020-21 (P) 2023-24*
Electrified Route Kilometer Total Route Kilometer (BG)
Projected Electrified Route Kilometer* Projected Total Route Kilometer (BG)*
Source:MinistryofRailways.*Projections
8.46 InordertoprovidebetteramenitiesIRhasembarkedonprovidingWi-Fiinternetservicesatallstations(excludinghaltstations).Ason5thDecember2021,total6,087RailwayStationshavebeenequippedwithWi-Fifacility(figure30).
Figure 30: No. of Stations equipped with Wi-Fi
Source:MinistryofRailways
8.47 In addition to the above, projects connecting difficult terrain such as Rishikesh -Karnaprayaglineasalsotherailnetworktoconnectallcapitalsofnortheaststatesareongoing.Further,anumberofinfrastructuredevelopmentinitiativesareenvisagedintheNationalRailPlan(NRP)beingpreparedbyIndianRailways(Box5)

294 Economic Survey 2021-22
Box 5: National Railway Plan
TheNationalRailPlanlaysdowntheroadmapforcapacityexpansionoftherailwaynetworkby2030tocatertogrowthupto2050.Itenvisagesthecreationofafuturereadyrailwaysystemthatis able to not only meet the passenger demand but also increase the modal share of railways in freightto40-45%fromthepresentlevelof26-27%.Thetargetof40-45%modalshareforrailwaysisnecessaryfromtheperspectiveofsustainabilityandalsofromthenationalcommitmentsmadeglobally for reducing emission levels.(see chapter 6 on sustainable development and climatechange).
Unlike growth, which is linear, capacity grows in surges (sawtooth curve) depending onprojectcompletion timelines.Asper theNationalRailPlan, the freightecosystemisexpectedtogrowfromthepresentlevelof4700MTto8200by2030.Atpresenttherailwaycapacityisbarelyabletocarry1220MTwhichisaround26-27%ofthemodalshare.ThePlanprovidesa pipeline of projects,which on completionwill increase railway capacity to capture 45% offreight traffic.Sincetherailwaysisalreadyhavinga largenumberofsanctionedprojects thatneed to be completedbefore takingupnewprojects, it has beenplanned to increase railwaycapacityintwosurges.ThefirstsurgeistobeprovidedbytheVision2024plantoprioritizeandcompletesanctionedprojectssothatrailwaycapacitydoesnotfallfarbehindthetargetedmodalsharesuchthatbythetimecapacityisfinallycreated,thetrafficwouldhaveshiftedtoanothermode.Toprevent furtherbleedingawayofmodal share, railwaycapacity enhancingprojectshavebeencategorizedasSuperCriticalandCritical.58projectshavebeenidentifiedasSuperCritical and are targeted for completion byDecember2022. 68 projects have been identifiedasCriticalandhavebeentargetedforcompletionbyMarch2024.Theseprojectsarefocussedatincreasingcapacityonroutesthatservemajormineral,industrialhubsalongwithportsandmajorconsumptioncentres.
Inadditiontothesecriticalprojects,theMinistryofRailwayhasalsotargeted100%electrificationofitsnetworkbyDecember2023upgradingDelhi-Mumbai&Delhi-Kolkatacorridorsto160kmphand also elimination of level crossings on theGoldenQuadrilateral/GoldenDiagonal routes.OncompletionofVision2024projects,inthesecondhalfofthedecade,theaimistocommissionnewDedicatedFreightCorridorsandalsoHighSpeedPassengerCorridors,besidesmultitrackingandsignalingupgradationofcongestedroutes
Thenext10yearswillseeaveryhighlevelofCAPEXintherailwaysectorascapacitygrowthhastobeacceleratedsuchthatby2030itisaheadofdemand.Upto2014,CAPEXonrailwaywasbarelyRs45,980croreperannumandconsequentlytherailwaywascharecterizedbyhighlevelsof inefficiency and highly congested routes unable tomeet the growing demand. Post 2014, aconsciouseffortwasmadetoimprovetherailwaysectorbysubstantiallyincreasingtheCAPEX.TheCAPEXoutlayfor2021-22isRs2,15,000crswhichismorethanfivetimesthe2014level.Asmoreprojectsaretakenonhandandseveralsourcesofcapitalfundingaredeveloped,theCAPEXwillincreasefurtherincomingyearsandtherailwaysystemwillactuallyemergeasanengineofnational growth.

295Industry and Infrastructure
Civil Aviation
8.48 Indiahasemergedasoneofthefastestgrowingaviationmarketsintheworld.ThedomestictrafficinIndiahasmorethandoubledfromaround61millionin2013-14toaround137millionin2019-20,registeringagrowthofover14percentperannum.
8.49 GovernmentofIndiatookvariousinitiativestoboosttheaviationsectorwhichincludedcalibrated opening of the domestic sector as the first wave of the pandemic ebbed, introduction of air transport bubbles or air travel arrangements with specific countries, disinvestment of AirIndia(Box6),privatizationandmodernization/expansionofairports,boosttotheregionalconnectivity scheme -UDAN, incentivization ofmaintenance, repair and overhaul (MROs)operations etc.
8.50 UDANisaregionalairportdevelopmentprogramoftheGovernmentofIndiaandpartoftheRegionalConnectivityScheme(RCS)ofupgradingunderservicedairroutes.TilllaunchingofUDANin2016,Indiahad74airportshavingscheduledoperations.But,within4yearsunderUDAN, four rounds of bidding underRCS-UDAN have taken place and 153RCS airportsincluding12wateraerodromes&36HelipadshavebeenidentifiedforoperationofRCSflights.During the last four years after commencement of the scheme, 948 valid awarded routes have beenallottedtovariousairlinesandoutofwhich389RCSroutesconnecting62unservedandunderservedairports(including6heliports&02wateraerodromes)havebeenoperationalizedso far.
8.51 Withthehelpofthesesupportivemeasures,India'saviationsectorisonthepathofgradualrecoveryfromtheturbulencecausedbytheCOVID-19pandemic.Inaddition,UnmannedAircraftSystems(UAS),alsoknownasdrones,offertremendousbenefitstoalmostallsectorsoftheeconomy and can become an important propeller for growth due to their reach, versatility, and easeofuse,especiallyinIndia’sremoteandinaccessibleareas.Thus,governmenthasliberalizeddronerules2021onAugust2021andreleasedPLIschemefordroneson15September2021.Thepolicyreformswillthereforecatalyzesuper-normalgrowthintheupcomingdronesector.A resurgence of the sector is foreseen as a result of swift measures adopted by the government and industry.
8.52 With theacceleratedpaceofvaccine roll-outandeasingof travel restrictionsglobally,Indian aviation sector has started to rebound. Despite the travel restrictions, the total passengers carriedinOctober,2021reached99.58lakhswhichwasnear68percentofthepre-Covidlevel(146.25lakh)(figure31).

296 Economic Survey 2021-22
Figure 31: Month-wise Total Passengers Carried (in Lakh)
Source:MinistryofCivilAviation.*Pre-COVIDaverageiscalculatedfor11monthsof2019-20startingfromApril,2019toFebruary,2020.
8.53 Besidesgrowingmonth-on-month,aircargooperationsarealreadyperformingstronglywiththeresurrectionof theeconomy,supportedbyarobustreboundinbusinessconfidence,andboostedbyresilientdomesticdemand,includingthroughe-commerce.ThetotalaircargotonnagecarriedinOctober,2021reached2.88lakhMTwhichsurpassedthepreCovidlevel(2.81lakhMT)(figure32).
Figure 32: Month-wise Total air cargo tonnage (in Lakh MT)
Source:MinistryofCivilAviation.*Pre-COVIDaverageiscalculatedfor11monthsof2019-20startingfromApril,2019toFebruary,2020

297Industry and Infrastructure
Box 6: Privatization in the Aviation sector
Disinvestment of Air India:TheprocessfordisinvestmentofAirIndiaanditssubsidiariescommencedinJune2017withthe‘in-principle’approvalofCabinetCommitteeonEconomicAffairs(CCEA).CCEAalsoapprovedcreationofanAirIndiaSpecificAlternativeMechanism(AISAM)forthedisinvestmentprocess.TheAISAMdecidedthestrategicdisinvestmentof100percentstakeofGovernmentofIndiainAirIndiaalongwith100percentstakeinAirIndiaExpressLtdand50percentstakeinAirIndiaSATS(jointventurebetweenAirIndia(AI)andSingaporeAirportTerminalServices(SATS).
Subsequently,M/sTalacePvtLtd,awhollyownedsubsidiaryofM/sTataSonsPvt.Ltdwhichwasthehighestbidderwasawarded100percentequityshareholdinginAirIndiaalongwithequityshareholding of Air India in Air India Express Ltd. (AIXL) and AISATS. The winning bid was for Rs18,000croreasEnterpriseValue(EV)considerationforAI(100percentsharesofAIalongwithAI’sshareholdinginAIXLandAISATS).Share-PurchaseAgreementhasbeenexecutedon25thOctober,2021andthetransactionislikelytobecompletedbyDecember2021-January2022.
Privatization of Airports: Inorder to improveefficiencyandperformance,servicequality,encouragegreaterinvestmentandtoreducegovernmentinfluence,AirportsAuthorityofIndia(AAI)hasawardedsixairportsnamely,Ahmedabad,Jaipur,Lucknow,Guwahati,ThiruvananthapuramandMangaluruforOperations,Management andDevelopment to thehighestbidder i.e.,M/sAdaniEnterprisesLimited(AEL)underPublicPrivatePartnership(PPP)modeforaleaseperiodof50years.Besides,AAIhadleasedoutDelhiandMumbaiAirportsin2006toM/sDelhiInternationalAirportLimitedandM/sMumbaiInternational Airport Limited respectively for Operations, Management and Development under PPP modeforaperiodof30years.AsperNationalMonetizationPipeline(NMP),25AAIairportshavebeenearmarkedforassetmonetizationovertheyears2022to2025namelyBhubaneshwar,Varanasi,Amritsar,Trichy,Indore,Raipur,Calicut,Coimbatore,Nagpur,Patna,Madurai,Surat,Ranchi,Jodhpur,Chennai,Vijayawada,Vadodara,Bhopal,Tirupati,Hubli,Imphal,Agartala,Udaipur,DehradunandRajahmundry.
ThecriteriaadoptedforMonetizationofairportassetsunderNMPisasfollowing: (i)Airportshavingannualtrafficabovethethresholdof0.4millionpassengers(in2019and2020); (ii) Airportswithasizeableongoing/proposedcapexplanaspertheNationalInfrastructurePipeline(NIP).
Ports
8.54 Port performance in an economy is crucial for trade competitivenessof that economy.ExpansionofportcapacityhasbeenaccordedthehighestprioritybytheGovernmentthroughimplementationofwell-conceivedinfrastructuredevelopmentprojects.Thecapacityof13majorportswhichwas 871.52million tonnes per annum (MTPA) at the end ofMarch 2014, hasincreasedby79percentto1,560.61MTPAbytheendofMarch2021.Traffichandledattheseportswas to the tuneof672.68MTduring2020-21,whichwas4.6percent lower than thatin the previous year on account of the worldwide disruptions in international trade due to the pandemic.Theaverageturnroundtimeat thesemajorportshasreducedfrom62.11hoursin2019-20to55.99hoursin2020-21(Figure33)duetothevariousmeasurestakenbygovernmentto improve the ease of doing business.

298 Economic Survey 2021-22
8.55 As on 31stDecember 2021, India had a fleet strength of 1463 vessels with Grosstonnage(GT)of13,011thousandcomparedto1429vesselsand12,746thousandofGTattheendof2019.However,Indianfleetisjust1.2percentofworld’sfleetintermsofcapacityandcarriesonly7.8percent(for2018-19)ofIndia’sEXIMtrade.With thecostofusingservices of foreign shipping company is less than that of a local shipping company, most freight moves in foreign ships leading to aa huge foreign exchange outflows. In order to addressthecostdisadvantagesufferedbyIndianflagships,inJuly2021theUnioncabinethas approved a scheme providing subsidy support of Rs.1,624 crore to Indian shippingcompanies in global tenders floated by Ministries and CPSEs over five years to promote flagging of merchant ships in India.
8.56 Manyinitiativeshavebeentakenbythegovernmenttoimproveportgovernance,augmentcapacityutilization,enhanceportefficiencyandconnectivity.Themeasuresincludethefollowingamong others:
¾ Sagarmala which is a National Programme aimed at accelerating economic development in the country by harnessing the potential of India’s 7,500 km longcoastlineand14,500kmofpotentiallynavigablewaterways.TheSagarmalaprojectsincludeportmodernization&newportdevelopment,connectivityenhancement,port-led industrialization, coastal community development, coastal shipping and Inlandwater transport.Currently, thereare802projectsworth investmentofRs.5.54lakhcroreforimplementationundertheSagarmalaProgrammeby2035.Outofwhich,181projectsworthRs.94,712crorehavebeencompletedand223projectsworthRs.2.11lakhcroreareunderimplementation.Further,398projectsworthRs.2.48Lakhcroreare under various stages of development.
¾ TheMajorPortAuthoritiesAct2021wasnotifiedon18.2.2021.Thisactprovidesforinteraliaregulation,operationandplanningofmajorportsinIndiaandveststheadministration,controlandmanagementofsuchportsupontheBoardsofMajorPortAuthorities.
¾ A new Captive Policy for Port Dependent Industries has been prepared to address the challenges of renewal of concession period, scope of expansion, and dynamic business environment.
8.57 With the objective of propelling India to the forefront of the Global MaritimeSector,theMaritimeIndiaVision2030(MIV2030),ablueprinttoensurecoordinatedandacceleratedgrowthofIndia’smaritimesectorinthenextdecadewasreleasedonMarch2021.Theobjectiveistodevelopworld-classmegaports,transshipmenthubsandensureinfrastructuremodernization.MIV2030estimatesthatdevelopmentofIndianportswilldrive cost savings of Rs. 6,000-7,000 crore per annum for EXIM clients. Further, theaugmentedoperationsareestimated tocreateanadditional~700,000-1,000,000 jobs inthe sector.MIV 2030 estimates the investment requirement for capacity augmentationand development of world class infrastructure at Indian Ports to be to the tune of Rs.1,00,000–1,25,000crore.

299Industry and Infrastructure
Figure 33: Performance of Major ports
0
20
40
60
80
100
120
0
200
400
600
800
1000
1200
1400
1600
1800
2011-12 2012-13 2013-14 2014-15 2015-16 2016-17 2017-18 2018-19 2019-20 2020-21
Ave
rage
turn
roun
d tim
e in
hou
rs
in M
illio
n To
nnes
Traffic (Million tonnes) Capacity (Million tonnes per annum) Average TRT (RHS)
Source:SurveycalculationsbasedondatafromMinistryofPorts,ShippingandWaterways.AverageTRTduring2020-21isbasedonPilotboardingtillde-boarding.PortCapacitywasre-ratedbasedonBerthingPolicy asper internationalnorms. MajorPorts re-rated capacityduring2016-17was1359MTPA.
Figure 34: Growth of Indian Shipping
0
200
400
600
800
1000
1200
1400
1600
0
2000
4000
6000
8000
10000
12000
14000
2010 2011 2012 2013 2014 2015 2016 2017 2018 2019 2020
No.
of V
esse
ls
Gro
ss T
onna
ge '0
00G
T
GT No. of vessels (RHS)
Source:SurveycalculationsbasedondatafromMinistryofPorts,ShippingandWaterways.
Inland waterways
8.58 RegulatoryamendmentthroughtheInlandVesselsAct,2021,replacedtheover100yearsoldInlandVesselsAct,1917(1of1917)andusheredinaneweraintheinlandwatertransportsector.TheobjectiveoftheActistopromoteeconomical,safetransportationandtradethroughinland waters. It will ensure transparency and accountability in the administration of inland water transportation and promote the ease of doing business.

300 Economic Survey 2021-22
8.59 Augmentation in navigation capacity of National Waterway-1 (NW-1) is beingimplementedsince2018throughtheJalMargVikasProjectfromVaranasitoHaldiastretchofGanga-Bhagirathi-HooghlyRiverSystemtoenablelargebargemovements.Constructionofmulti-modal terminalsatVaranasiandSahibGanjhavebeencompletedand thatof themultimodalterminalatHaldiaandtheNavigationalLockatFarakkahaveachievedsubstantialprogress.TheotherprojectssuchascomprehensivedevelopmentofNW-2andNW-16&Indo-Bangladesh Protocol (IBP)routeareproposedtobeundertakenforaperiodof5yearsatacostofRs.461croresandRs.145.29croresrespectively,from2020-21to2024-25.
8.60 Therehasbeenacontinuedincreaseintrafficandaugmentationofcapacityofmajorports(figure33).InthebackdropofCOVID-19thetrafficatmajorportshassuffered,decliningby4.57percentbetween2019-20and2020-21,butcapacityofmajorportshasbeenrising,thoughat slower pace in recent years.
Box 7: Connecting PILLARS OF INDIA PM-GATI SHAKTI
Another milestone achieved which has heralded a new chapter in governance is the PMGatiShakti an integrated plan ensuring multi-modal and seamless connectivity for people, goods and services. It covers16 ministries and infrastructure like Bharatmala, Sagarmala, inlandwaterways, dry/land ports, UDAN etc. It is also expected to include social infrastructure likehospitals and universities. With continuous improvement in digital infrastructure along withdevelopmentofeconomiczonesliketextileclusters,pharmaceuticalclusters,defencecorridors,electronic parks, industrial corridors, fishing clusters, agri zones,GATI-SHAKTIwill improveconnectivity and make Indian businesses more competitive. It will also leverage technology extensively including spatial planning toolswith ISRO imagery developed by BhaskaracharyaNational Institute for SpaceApplications and Geoinformatics. This is a constant endeavor tobuildnextgenerationinfrastructuretoimproveeaseoflivingaswellaseaseofdoingbusiness.
Telecom
8.61 India is theworld’ssecond-largest telecommunicationsmarket.The telecommunicationsector is one of the most powerful sectors impacting social and economic development of a country. A strong and a responsive regulatory framework has kept the service access at reasonable prices.TheGovernmenthastakenfurthermeasurestoensurefaircompetitionamongserviceproviders with the view to benefit the consumers (BOX 8).
8.62 The relevance of telecom sector has increased immensely. This can be gauged fromthe fact that the total telephone subscriber base in India has increased from 933.02millioninMarch2014 to1200.88million inMarch2021.InMarch2021,45percentof subscriberswerebasedinruralIndiaand55percentinurbanareas(figure35).Internetpenetrationinthecountryisincreasingsteadilywithinternetsubscribersincreasingfrom302.33millioninmarch2015to833.71millioninJune2021.While67.2percentofinternetsubscribershadnarrow-bandconnectionsand32.8percenthadbroadbandconnectionsin2015, thecompositionhadreversedbyJune2021withonly4percentofsubscribershavingnarrowbandand96percentwithbroadbandconnections(Figure36).

301Industry and Infrastructure
Figure 35: Number and Composition of Telephone Subscribers (in millions)
0
200
400
600
800
1000
1200
1400
2014 2015 2016 2017 2018 2019 2020 2021 Oct-21
in m
illio
ns
Urban Rural
Source: DoT. As in March month of each year
Figure 36: Number and Composition of Internet Subscribers
0
100
200
300
400
500
600
700
800
900
2015 2016 2017 2018 2019 2020 2021 Jun-21
in m
illio
ns
Broadband Narrowband
Source:TRAIAsinMarchmonthofeachyear

302 Economic Survey 2021-22
Figure 37: Total and Average Wireless Data usage
0
2
4
6
8
10
12
14
16
0
5000
10000
15000
20000
25000
30000
35000
Ave
rage
Wire
less
Dat
a U
sage
(in
GB
) per
da
ta u
ser p
er m
onth
Tota
l Wire
less
Dat
a U
sage
(in
Peta
byte
)
Total Wireless Data Usage (in Petabyte)
Average Wireless Data Usage (in GB) per data user per month - RHS
Source:TRAI
8.63 Overthelastfewyears,telecomsectorinIndiahasbecomedatadrivenandreducingcostsof data due to the fierce competition in the sector. This has boosted data usage even further. Total volumeofwirelessdatausageincreasedbymorethan7foldsfrom4206petabyteinQ1:FY18to32397petabytesinQ1:FY22.Averagewirelessdatausageingigabyte(GB)perdatauserpermonthhasalsoincreasedtremendouslyfromjust1.24GBpermonthinQ1:FY18toawhooping14.1GBpermonthinQ1:FY22(Figure37).
8.64 Thenumberofmobiletowershasalsoincreasedsubstantially(Figure38)reaching6.93lakhs towers inDecember2021, reflecting that the telecomoperatorshavewell realized thepotential in the sector and seized the opportunity to build up an infrastructure that will befundamentalinboostingtheGovernment’sDigitalIndiacampaign.
Figure 38: Number of mobile towers (lakhs)
Source: DoT. As in March month of each year.

303Industry and Infrastructure
8.65 UndertheflagshipBharatNetproject,ason27.09.2021,5.46lakhkmOpticalFiberCablehasbeenlaid,atotalof1.73lakhGramPanchayats(GP)havebeenconnectedbyOpticalFiberCable(OFC)and1.59lakhGramPanchayatsareservicereadyonOFC.Inaddition,4173GPshavebeenconnectedoversatellitemedia.Wi-Fihotspotshavebeeninstalledat1.04lakhGramPanchayatsofwhichservicesarebeingprovidedat0.64lakhGramPanchayats,cateringtomorethan16.17lakhsubscriberswithadatausagetothetuneof5670.42TBpermonth.ThescopeofBharatNethasnowbeenextendedtocoverallinhabitedvillagesbeyondGramPanchayats.On30.06.2021,Governmentaccordedapproval fora revised strategy for implementationofBharatNetthroughPublic-PrivatePartnership(PPP)modelin16Statesofthecountrycoveringabout3.61lakhvillages(including1.37lakhGPs).Otherprojectsincludeimprovingconnectivityin354villages in theborder areasof Jammu&Kashmir,Ladakh,HimachalPradesh,UttarPradesh,Bihar,Rajasthan,GujaratandUttarakhand.Ason27.9.2021,around161villagesoutof354villageshavebeencoveredwithmobileservice.Aboosttothetelecominfrastructureisalso being given under the aspirational district scheme.
8.66 TheGovernmentof India is implementingaComprehensiveTelecomDevelopmentPlan(CTDP)fortheNorth-EasternRegionandComprehensiveTelecomDevelopmentPlanforIslandstoprovidemobile connectivity in theuncoveredvillages andalongNationalHighways in theNorth-east.Ason30.08.2021,towersat1,358siteshavebeeninstalledandareprovidingservices.Theundersea2,313-kmopticfiber-basedtelecomconnectivitybetweenChennaiandAndaman&NicobarIslandswasinauguratedinAugust2020.Governmenthasapprovedtheproposalforprovisionof submarineOpticalFiberCableConnectivityby layingapproximately1891kmofcablebetweenKochiandLakshadweepIslands.Withtheimplementationofthisproject,thehigh-speed internet/ broadband connectivity will be available in Lakshadweep Islands.
8.67 Inadditiontotheexpansioninthetelecominfrastructure,anumberofmeasureshavebeentaken to bring about structural and procedural reforms (see Box 8 for details). In the backdrop of the outstanding performance of the telecom sector in meeting COVID-19 challenges and with huge surge in data consumption due to online education, work from home, interpersonal connect through social media, virtual meetings etc., the reform measures will further boost the proliferation and penetration of broadband and telecom connectivity. The reforms are also expected to boost 4G proliferation, infuse liquidity and create an enabling environment forinvestmentin5Gnetworks.
Box 8: Reforms in the Telecom Sector
Structural Reforms
1. Rationalization of Adjusted Gross Revenue: Non-telecom revenue will be excluded onprospectivebasisfromthedefinitionofAGR
2. BankGuarantees(BGs)againstLicenseFee(LF)havebeenrationalized.OneBGsindifferentLicensed Service Areas (LSAs) regions in the country has been allowed.
3. Interest rates rationalized/ Penalties removed: From 1stOctober, 2021, delayed payments ofLicenseFee(LF)/SpectrumUsageCharge(SUC)willattractinterestrateofSBI’sMCLRplus

304 Economic Survey 2021-22
2percent instead ofMCLRplus 4percent; interest compounded annually instead ofmonthly;penalty and interest on penalty removed.
4. ForAuctionsheldhenceforth,noBGswillberequiredtosecureinstalmentpayments.
5. SpectrumTenure:Infutureauctions,tenureofspectrumincreasedfrom20to30years.
6. Surrender of spectrum will be permitted after 10 years for spectrum acquired in the futureauctions.
7. NoSpectrumUsageCharge(SUC)forspectrumacquiredinfuturespectrumauctions.
8. Spectrumsharingencouraged-additionalSUCof0.5percentforspectrumsharingremoved.
9. Toencourageinvestment,100percentForeignDirectInvestment(FDI)underautomaticroutehas been permitted in Telecom Sector with all safeguards applying.
Procedural Reforms
10.Auctioncalendarfixed-Spectrumauctions tobenormallyheld in the lastquarterofeveryfinancial year.
11. Ease of doing business promoted - cumbersome requirement of licenses under CustomsNotificationforwirelessequipmenthasbeenremoved.Thisisreplacedwithself-declaration.
12.KnowYourCustomers(KYC)reforms:Self-KYC(Appbased)permitted.E-KYCraterevisedtoonlyone rupee.Shifting fromprepaid topost-paidandvice-versadoesnot require freshKYC.
13.CustomerAcquisitionForms (CAF) inphysical formwill be replacedbydigital storageofdata. This is a cost saving measure as it would allow the Telecom Service Providers (TSPs) to release severalwarehouses thatwas being required to store 300-400 crore paperCAFs.Further,withthismeasure,warehouseauditofCAFwouldalsonotberequired.
14.StandingAdvisoryCommitteeonRadioFrequencyAllocation(SACFA)clearancefortelecomtowers eased. Department of Telecommunication will accept data on a portal, based on self-declaration basis which is to be linked to portals of other Agencies (such as Civil Aviation).
Addressing Liquidity requirements of TSPs: The Government approved the following for all the TSPs:
15.Moratorium/DefermentofuptofouryearsinannualpaymentsofduesarisingoutoftheAGRjudgement,whileprotectingtheNetPresentValue(NPV)ofthedueamounts.
16.Moratorium/Defermentonduepaymentsofspectrumpurchasedinpastauctions(excludingtheauctionof2021)foruptofouryearswithNPVprotectedattheinterestratestipulatedinthe respective auctions.
17.Option to the TSPs to pay the principal and the interest amount arising due to the saidmoratorium/defermentofpaymentbywayofequity.

305Industry and Infrastructure
Petroleum, Crude and Natural gas
8.68 Crudeoilandcondensateproductionduringtheyear2020-21was30.49millionmetrictonnes(MMT),lowerthantheproductionlevelof32.17MMTin2019-20and94.3percentofthetargetof32.32MMTfor2020-21(figure39).Indiadependsonimportstomeetmorethan80percentofitsrequirements.
Figure 39: Production of Crude oil
Source:M/oPNG
8.69 NaturalGasproductionduringtheyear2020-21was28.67billioncubicmeters(BCM)asagainstproductionof31.18BCMin2019-20and85.4percentagainstthetargetof33.57BCMfor2020-21.Thereasonsforlowerdomesticoilandgasproductionin2020-21include,inter-alia,decliningproductionfromoldandmarginalfields,unplannedshutdownandoperationallossesfromfewproducingwells(figure40).
Figure 40: Production of natural gas
Source:M/oPNG
8.70 CrudeOilProcessedduringtheyear2020-21was221.77MMTasagainst254.39MMTin2019-20,showingachievementof88.1percentof the targetof251.66MMTfor2020-21 (figure 41). The shortfall in crude oil processing was mainly due to lower demand of petroleum productsduetoCOVID-19during2020-21.

306 Economic Survey 2021-22
Figure 41: Production of Crude Processed oil
Source:M/oPNG
8.71 Theproductionofpetroleumproductswas233.51MMT in2020-21asagainst258.18MMTin2019-20,showingachievementof90.2percentofthetargetof259.02MMTfor2020-21.Duringtheyear2020-21,theconsumptionofpetroleumproductsinIndiawas194.30MMT,lowerby9.3percentascomparedtoconsumptionof214.13MMTduring2019-20.(figure42).
Figure 42: Production of Petroleum, crude and natural gas
Source:M/oPNG
8.72 TheGovernmenthasintroducedseveralmeasurestobringtransparencybyensuringthatprojected requirements of the industry are duly uploaded, reduce transaction costs throughinvestment in building infrastructure required for this sector and extend benefits to theweaker sections.The ”LakshyaBharat Portal” launched in September, 2021 requires all oilandgasorganizationstouploaddetailsofvariousitemsprocuredbythemincludingthefuture

307Industry and Infrastructure
requirements.TheportalisplannedtomatureintoacentralinformationpoolforsourcingofcapitalgoodsandMRO(maintenance,repairandoverhaul)ofitemsoftheoilandgascompanieswhichinturnisexpectedtoprovidecleardemandprojectionstoenablethemanufacturerstoenhance their capacity and scope. This portal, which is accessible to all stakeholders is an important step towards AtmaNirbhar Bharat. The measures taken to enhance theinvestments on gas grid are encapsulated in Box 9.
8.73 ThepetroleumsectorplayedacriticalrolethroughouttheCOVID19lockdownperiodby maintaining fuel supplies across the country, without any interruption. The scheme of three free cylinders toUjjwala beneficiaries providedmuch-needed relief to the poor householdsduringCovid times.Thesecondphaseof thePradhanMantriUjjwalaYojana,Ujjawala2.0,was launched on 10thAugust, 2021 on pan India basis to provide additional one crore LPGconnectionsalongwithfreefirstrefillandstove.Ason25.10.2021,whilemorethan1croreapplicationshavebeenreceivedinthisphase,atotalof54.01lakhLPGconnectionshavebeenreleased.Ujjwala2.0focusesonmigrantsandpoorwomenfromlowLPGcoverageareas.
Box 9: Measures taken to develop the national gas grid and city gas distribution network
National Gas Grid:With the aim to create nationwide gas grid, Petroleum and Natural GasRegulatoryBoard(PNGRB)hasauthorizedapproximately33,764kmnaturalgaspipelinenetworkacrossthecountry,ason31.03.2021.TheNationalGasGridwouldconnectallmajordemandandsupply centres in India. This would ensure easy availability of natural gas across all regions and alsopotentiallyhelp toachieveuniformeconomicandsocialprogress. Ason31March2021,19,998 kmof natural gas pipelines are operational and 15,369 km are under various stages ofconstruction.
Pradhan Mantri Urja Ganga (2016):Inordertodevelopthenationalgasgrid,theGovernmenthastakenadecisiontoprovideacapitalgrantofRs.5176crore(i.e.,40percentoftheestimatedcapital cost ofRs.12,940Cr) for development of a 2655Km long Jagdishpur-Haldia -Bokaro-DhamraGas Pipeline (JHBDPL) project. Itwill pass through 50 districts in the State ofUttarPradesh, Bihar, Jharkhand, Odisha & West Bengal
North East Gas Grid (2020): Government has approved the North East Gas Grid project ofIndradhanushGasGrid Limited (IGGL)withViabilityGap Funding (VGF) / CapitalGrant at60percent(Rs.5,559crore)oftheestimatedcostofRs.9,265crore.The1,656kmlongNorthEastGasGridwillconnecteightNorth-Easternstates.
City Gas Distribution Network (CGD):PNGRBhasauthorized232geographicalareas(GAs)for development of CGD network across the country covering more than 400 districts in 27States/UTswhichcovers around71percentof India’spopulationand53percentof area.Ason31.07.2021,atotalofapprox.79.47lakhPNGDomesticconnectionsand3323CNGstationshavebeen commissioned in the country.
Electricity
8.74 India has witnessed a significant transformation from being an acutely power deficitcountry to a situation of demand being fully met. India has also made remarkable strides to

308 Economic Survey 2021-22
ensure universal access to electricity for every household. The total installed power capacity andcaptivepowerplant(industrieshavingdemandof1MWandabove)was459.15GWon31.03.2021ascompared to446.35GWon31.03.2020 registeringagrowthof2.87percent.Installedcapacityinutilitieswas382.15GWon31.03.2021ascomparedto370.11GWason31.03.2020–increasingby3.25percent.Thermalsourcesofenergymakethelargest–61.42percentshareoftotalinstalledcapacityinutilitiesfollowedbyrenewableenergyresource(RES)with24.7percentandhydroby12.09percent.DetailsofallIndiainstalledcapacitymodewiseandsourcewiseisgivenintable6.
8.75 Thetotalelectricitygeneratedincludingthatfromcaptiveplantsduringtheyear2020-21was15.73lakhGWhascomparedto16.23lakhGWhduringtheyear2019-20,ofwhich13.73lakhGWhwasgeneratedbyutilitiesand2lakhGWhincaptiveplants.Between2020-21and2019-20,maximumriseinelectricitygenerationwasrecordedindieselbasedthermalenergyforutilitiesandRESforcaptiveplants.Overall,duetopandemicleddisruptionsineconomicactivity,electricitygenerationwaslowerintheyear2020-21whichisnowexpectedtoincreasewith the recovery of the economy. Details of mode wise source wise electricity generation are givenintable7.Figure44givescompositionoftotalinstalledcapacityandelectricitygenerationfortheyear2020-21.
Renewable energy – Solar, Wind, Biomass and small hydro energy
8.76 India has witnessed the fastest rate of growth in renewable energy capacity additionamongalllargeeconomies,duringthelast7.5yearswithrenewableenergycapacitygrowingby2.9timesandsolarenergyexpandingbyover18times.Renewableenergy(excludinglargehydro)constitutesover24.71percentofthecountry’sinstalledpowercapacityandaround10.7percentof theelectricalenergygenerationforyear2020-21.Asof31October2021, India’stotalrenewableenergyinstalledcapacity(excludinghydropowerabove25MW)hasreachedover103.05GW.Duringthelast7.5years,iflargehydroisincluded,theshareofrenewableenergyinelectricinstalledcapacityisestimatedtobeabout38.27percent(asofOctober2021)anditsshareinelectricenergygenerationisestimatedtobeabout26.96percent(forthemonthofAugust 2021).The difference in the share of renewable energy in installed capacity andelectricity generation is because of the variability in thesunshine hours or extent of wind which inturnwilldeterminetheutilizationoftheinstalledcapacity.
8.77 In order to facilitate renewable power evacuation and reshaping the grid for futurerequirements,theGreenEnergyCorridor(GEC)projectshavebeeninitiated.TheGECProjectaimsat synchronizingelectricityproduced from renewable sources, suchas solar andwind,with conventional power stations in the grid. The first component of the scheme, Inter-state GECwithtargetcapacityof3200circuitkilometer(ckm)transmissionlinesand17,000MVAcapacitysub-stations,wascompletedinMarch2020.Thesecondcomponent-Intra-stateGECwithatargetcapacityof9700ckmtransmissionlinesand22,600MVAcapacitysub-stationsisexpectedtobecompletedbyJune2022(BOX10onTransitiontocleanenergy).

309Industry and Infrastructure
Table 6: All India Installed Capacity Mode-Wise
Year Thermal
Total (2+3+7+8)in GW Hydro Steam Diesel Gas
Total Thermal (3+4+5)
Nuclear RES
1 2 3 4 5 6 7 8 9
(1) Utilities
2019-20 45.70 205.13 0.51 24.96 230.60 6.78 87.03 370.11
2020-21 46.21 209.30 0.51 24.92 234.73 6.78 94.43 382.15
% change 1.12 2.03 0.00 -0.13 1.79 0.00 8.51 3.25
(2) Non-Utilities (Industries having demand of 1 MW & above)
2019-20 0.13 51.54 12.77 7.32 71.63 0.00 4.48 76.24
2020-21@ 0.13 52.06 12.90 7.39 72.35 0.00 4.52 77.00
% change 1.00 1.00 1.00 1.00 1.00 0 1.00 1.00
(3) Installed Capacity : (1+2)
2019-20 45.83 256.68 13.28 32.27 302.23 6.78 91.50 446.35
2020-21 46.34 261.35 13.41 32.31 307.08 6.78 98.95 459.15
% change 1.12 1.82 0.96 0.13 1.60 0.00 8.14 2.87
Source:SurveyCalculationsbasedondatafromCentralElectricityAuthority.@Estimated
Table 7: All India Gross Electricity Generation Mode-Wise
Year Thermal
Total (2+6+7+8)
(LakhsGWh) Hydro Steam Diesel GasTotal
Thermal) (3+4+5)
Nuclear RES
1 2 3 4 5 6 7 8 9
(1) Utilities Gross Electrical Energy Generation
2019-20 1.56 9.94 0.00199 0.48 10.43 0.46 1.38 13.83
2020-21 1.50 9.81 0.00216* 0.51 10.33 0.43 1.47 13.73
% change -3.5 -1.3 9.0 5.2 -1.0 -7.4 6.4 -0.7
(2) Non-Utilities Gross Electrical Energy Generation (Industries having capacity 1 MW & Above)
2019-20 0.00 2.06 0.02 0.25 2.33 0.00 0.06 2.40
2020-21 @ 0.00 1.69 0.02 0.21 1.92 0.00 0.07 2.00
% change 0.7 -17.7 4.3 -16.5 -17.4 0.0 15.2 -16.5
(3) Total Gross Electrical Energy Generation (1+2)
2019-20 1.56 12.00 0.02 0.74 12.76 0.46 1.45 16.23
2020-21 1.51 11.51 0.02 0.72 12.25 0.43 1.55 15.73
% change -3.5 -4.1 4.8 -2.3 -4.0 -7.4 6.8 -3.1
Source:SurveyCalculationsbasedondatafromCentralElectricityAuthority.*-provisional,@Estimated

310 Economic Survey 2021-22
Figure 44: Source of Installed Capacity and electricity generation 2020-21
Source:SurveyCalculationsbasedondatafromCentralElectricityAuthority.IncludesbothUtilitiesandcaptiveplants.Thermalincludesgas,steamanddiesel.
Figure 45: Energy loss in transformation, transmission and distribution and unaccounted for as a percentage of Net energy available for supply
Source: Central Electricity Authority
8.78 Theenergylossesintransformation,transmissionanddistributionduringtheyear2019-20wasat20.46percentforallIndiawhichwashighestfortheNortheastregion-29.98percent(figure45).Inordertopreventsuchlossesthegovernmenthasmandatedelectricitydistributioncompaniestoundertakequarterlyenergyaccountingthroughacertifiedenergymanagerwhich

311Industry and Infrastructure
willgivedetailedinformationaboutelectricityconsumptionbydifferentcategoriesofconsumers&thetransmissionanddistributionlossesinvariousareasandenablecorrectiveactions.
Box 9: Transitioning to clean energy
Thetwomainpillarsformitigationactiontoachievenet-zerocarbonambitionare transitiontoclean and renewable sources of energy and storage of this energy. The World bank in its report Minerals for Climate Action has in its report mentioned that this transition from conventional fossil fuel-based energy to clean energy as well as battery storage will be more mineral intensive. Minerals and metals like copper, aluminum, iron, manganese, nickel etc are critical for developing clean energy sources like solar PV, wind, nuclear while minerals like lithium and graphite are important for energy storage. Therefore, on the policy front, it is pertinent to prepare for this. In thisregard,thefollowingisessential–
¾ Pace at which shift from conventional fossil-fuel based sources is made. The pace will determine the extent and mix of investment in renewable sources of energy.
¾ With the developed countries as frontrunners of net-zero emission plans, it is important toavoid the risk of being a late comer. The inelastic supply of minerals is already in increasing the prices of minerals which is likely to shoot up even further in the future.
¾ EncourageR&D to ensure effortless switch to renewable sourcesof energy.Thismay alsoinclude focus on developing technology that recycles, reuses and repurposes minerals.
The recent surge in prices of natural gas in Europe on account of higher energy demand coupled with cold spells across the region and slower winds to run wind turbines has resulted in lower electricity output. The energy crisis being experienced by Europe brings to the fore the need for having a diversified mix of sources of energy of which fossil fuels are an important part. Simultaneously focus should be laid on building storage for intermittent electricity generation from solar PV and wind farms to ensure on-demand energy supply.
CONCLUSION8.79 InitiativesunderAtmaNirbharBharatincludingintroductionofstructuralandproceduralreforms, record vaccinations, various PLI scheme designed to attract investments in sectors of core competency and cutting edge technology, Make-in-India programme to boost domestic manufacturing capacity, reduction of corporate tax rate, etc and steps to improve operational efficiency have helped the industrial sector to keep up its ante. The sector has started to recover steadily and according to the National Statistical Office, is expected to grow at 11.8 percent in 2021-22.The performance of the Index of Industrial Productionwhile a little subdued at1.4percentinNovember2021visavisthesamemonthinthepreviousyearmustbeviewedalongwithgrowthof17.4percentinApril-November2021ascomparedto-15.3percentinthecorresponding period of last year. Most components of IIP have recovered to the pre-lockdown level.

312 Economic Survey 2021-22
8.80 TheGovernmenthaschartedoutacomprehensiveprogrammeforindustrialtransformation.With emphasis on supply side measures, the reforms address long known bottlenecks of insufficient infrastructure, tardy business processes and labour market reforms. Introduction of the production linked incentive schemes intends to encourage the scaling up of industries that arestrategicinnatureoraretechnologyintensive.Theobjectivebeingtocreatethecapacitytointegrate with the global value chains. Several measures have been taken to reduce transaction costs especially for the small and medium enterprises as well as facilitate inflow of capital, technology and international best practices into the industries. The new CPSE policy provides a roadmap for disinvestment, opening up avenues for their further growth and improvement in efficiency while enabling the government to focus its resources on developmental needs of the country.
8.81 The recovery of the industrial sector, positive business expectations propelled by extensive reforms and improved consumer demand, suggests that further improvements in the industrial performance can be expected.

CHAPTER
09
The services sector as a whole has mostly recovered from the impact of the nationwide lockdown imposed during March-May 2020 and localised lockdowns during the second covid wave in April-May 2021, although some of the sub-sectors continue to be impacted. During the first half of 2021-22, the Services sector grew by 10.8 per cent. The recovery is more pronounced given the Gross Value Added (GVA) of Services crossed the pre-pandemic level in Q2 2021-22. However, being a contact intensive sub-sector, GVA of ‘Trade, hotels, transport, communication & services related to broadcasting’ still remains below its pre-pandemic level. The overall Services sector GVA is expected to grow by 8.2 per cent in 2021-22, although the spread of Omicron variant brings in a degree of uncertainty for near term, especially in segments that require human contact.
High frequency indicators such as services purchasing managers’ index, air freight and rail freight bottomed out in 2020. The impact of second covid wave in April-May 2021 on these indicators was much more muted as compared to during the full lockdown in March-May 2020. During April-December 2021, rail freight crossed its pre-pandemic level while air freight and port traffic almost reached their pre-pandemic level. Domestic air and rail passenger traffic is also increasing gradually. The global issue of container shortage is impacting port traffic.
Services exports, after the initial slump during the first three quarters of 2020-21, surpassed its pre-pandemic level in Q4 2020-21. During H1 2021-22, services exports grew by 21.6 per cent, deriving strength from global demand for software and IT services exports. India’s share in world commercial services exports increased to 4.1 per cent in 2020. Moreover, the IT-BPM services revenue reached US$ 194 billion in 2020-21, adding 1.38 lakh employees during the same period. The Government undertook a major reform of removing telecom regulations in the IT-BPO sector. As per a survey conducted by NASSCOM, these reforms have reduced compliance burden, enhanced productivity, increased global competitiveness and lowered the cost of doing business in India. Similarly, the Government has opened up space sector to private players, which will enhance the socio-economic use of space assets and activities. During the first half of 2021-22, the Services sector received over US$ 16.7 billion FDI accounting for almost 54 per cent of the total FDI inflows into India.
Services

314 Economic Survey 2021-22
INTRODUCTION9.1 Services sector contributes over 50 per cent to India’s GDP. While Covid-19 pandemic has had an adverse impact on most sectors of the economy, the services sector has been the worst affected as its’ share in India’s GVA declined from 55 per cent in 2019-20 to 53 per cent in 2021-22.1 Within the services sector, the effect of Covid-19 has been varied. While non-contact services such as information, communication, financial, professional and business services have remained resilient, the impact has been much severe on contact based services such as tourism, retail trade, hotel, entertainment and recreation, etc.
IMPACT OF COVID-19 AND SEQUENTIAL RECOVERY9.2 The services sector contracted by 8.4 per cent Year on Year (YoY) in 2020-21 (Table 1). This decline was driven by a sharp contraction of 18.2 per cent YoY in the sub-sector ‘Trade, hotels, transport, communication & services related to broadcasting’. Owing to its contact intensive nature, the services included in this sub-sector had to bear the maximum brunt of the disruptions caused by the prevailing pandemic. The sub-sector ‘Public administration, defence & other services’ which includes expenditure by the government on one hand and services such as health, education, recreation etc, on the other, contracted by 4.6 per cent YoY in 2020-21. The relatively less contact intensive sub-sector ‘Financial, real estate & professional services’ was the least impacted, with a marginal decline of 1.5 per cent YoY in its GVA during 2020-21 (Table 1).
9.3 During the first half of the current fiscal year, the services sector has registered a steady recovery. Overall, the services sector grew by 10.8 per cent YoY in first half (H1) 2021-22 (Table 1). A closer look at the quarterly estimates shows that Gross Value Added (GVA) in services sector (excluding construction) crossed its pre-pandemic level2 in Q2 2021-22 (Table 2, which compares the performance of quarterly GVA over the GVA in Q3 2019-20). The sub-sector ‘Trade, hotels, transport, communication & services related to broadcasting’, which was the worst hit last year, grew by 18.4 per cent YoY in H1 2021-22. However, the quarterly GVA of this sub-sector is still below its pre-pandemic level (Table 2). On the other hand, GVA of ‘Public administration, defence & other services’ sub-sector witnessed a robust recovery. During H1 2021-22, the sub-sector grew by 12 per cent YoY, surpassing its pre pandemic level in Q2 2021-22 (Table 2). The ramping up of government expenditure in the wake of Covid-19 has contributed to the recovery of this sub-sector. Further, the sub-sector ‘Financial, real estate & professional services’ expanded by 5.8 per cent YoY in H1 2021-22, its GVA remained resilient throughout (Table 2).
1As per the Advance Estimates of 2021-22.2Pre-pandemic level denotes Q3 2019-20 GVA
Startups in India have grown remarkably over the last six years. The number of new recognised starups have increased to over 14,000 in 2021-22 from only 733 in 2016-17. As a result, India has become the third largest startup ecosystem in the world after the US and China. Further, a record 44 Indian startups have achieved unicorn status in 2021 taking the overall tally of unicorns in India to 83, most of these are in the services sector.

315Services
Table 1: Services Sector Performance
Share in GVA (per cent) Growth (YoY) (per cent)
Sector 2021-22 (AE)
2018-19 (2nd RE)
2019-20 (1st RE)
2020-21 (PE)
2021-22 (AE)
2021-22
Q1 Q2 H1
Total Services (Excluding construction)
53 7.2 7.2 -8.4 8.2 11.4 10.2 10.8
Trade, hotels, transport, communication & services related to broadcasting
16.9 7.1 6.4 -18.2 11.9 34.3 8.2 18.4
Financial, real estate & professional services
20.9 7.2 7.3 -1.5 4.0 3.7 7.8 5.8
Public administration, defence & other services*
15.2 7.4 8.3 -4.6 10.7 5.8 17.4 12.0
Source: Ministry of Statistics and Programme Implementation. Note: Share in GVA is in current prices and growth in GVA is at constant 2011-12 prices; *: Other services include Education, Health, Recreation, and other personal servicesRE: Revised Estimates. PE: Provisional Estimates. AE: Advance Estimates
Table 2: Gross Value Added in Services sub-sectors Relative To Pre-Pandemic Levels (Q3 2019-20 GVA= 100)
Sector 2020-21 Q1
2020-21 Q2
2020-21 Q3
2020-21 Q4
2021-22 Q1
2021-22 Q2
Trade, hotels, transport, communication & services related to broadcasting
52 81 92 108 70 87
Financial, real estate & professional services
123 126 107 107 127 136
Public administration, defence & other services
78 88 98 103 83 104
Total Services 84 99 99 106 94 109
Total GVA 78 92 101 106 92 100Source: Ministry of Statistics and Programme Implementation.
9.4 As per the first advance estimates, Gross Value Added (GVA) of services sector is estimated to grow by 8.2 per cent in 2021-22. Sub-sectors ‘Trade, hotels, transport, communication & broadcasting services’, ‘Financial, real estate & professional services’, and ‘Public administration, defence & other services’ are estimated to expand by 11.9 per cent, 4 per cent and 10.7 per cent respectively in 2021-22. A part of this growth is attributable to the low base in 2020-21. It is, however, pertinent to note that at the time of writing the Economic survey, new restrictions were being introduced within the country and worldwide due to the Omicron variant, posing fresh risk to the ongoing recovery, especially in contact intensive segments.

316 Economic Survey 2021-22
TRENDS IN HIGH FREQUENCY INDICATORS9.5 The upturn in Services GVA, when seen with the trend in high frequency indicators such as Purchasing Managers Index (PMI) Services Index, freight and passenger traffic point to a pickup in economic momentum.
Services PMI9.6 India’s services sector activity, gauged by PMI services, which had contracted for five consecutive months since March 2020, recovered sharply in October 2020. It dropped again for three consecutive months (May, June and July 2021) as a consequence of the second Covid-19 wave. Notably, the contraction during May-July 2021 was not as sharp as seen during the first lockdown.
9.7 With the easing of restrictions, PMI Services started to grow once again from August 2021 recording strongest jump in over 10 years to 58.4 in October 20213 (Figure 1(a)). PMI index moderated to 55.5 in December 2021.
Freight traffic9.8 The freight traffic (rail, air and port) had fallen sharply as a consequence of the complete lockdown in March 2020 (Figure 1(b, c and d)). As the economy gradually opened up from June 2020, freight traffic also started to improve. Freight traffic registered strong growth in during April- June 2021, partly reflecting the rebound from the low base during the same period last year. The impact of second covid wave in April-May 2021 on these indicators was much more muted as compared to during the full lockodwn in March-May 2020.
9.9 In 2021-22 (till December), total freight loading by Indian railways was 1,029.94 Million Tonnes (MT) which is 18.37 per cent higher than 870.08 MT during the same period in 2020-21. Infact, Indian railways recorded almost 16 per cent increase in freight loading as compared to the corresponding period during the pre-pandemic year (2019-20), where the freight loading was 888.88 MT.
9.10 Indian airports handled 20.97 lakh tonnes of freight in 2021-22 (till November) as compared to 14.44 lakh tonnes during the same period last year recording a growth of 45.25 per cent. This is slightly lower than the air freight loading of 22.88 lakh tonnes during the pre-pandemic period of April-November 2019.
9.11 Between April- November 2021, Indian ports handled total traffic of 857.3 MT as compared to 779.1 MT handled during the same period in 2020, registering a growth of over 10 per cent. The cargo traffic recorded so far in 2021 has almost reached the pre-pandemic level of 864.3 MT during April- November 2019.
3A reading above 50 indicates expansion in economic activity.
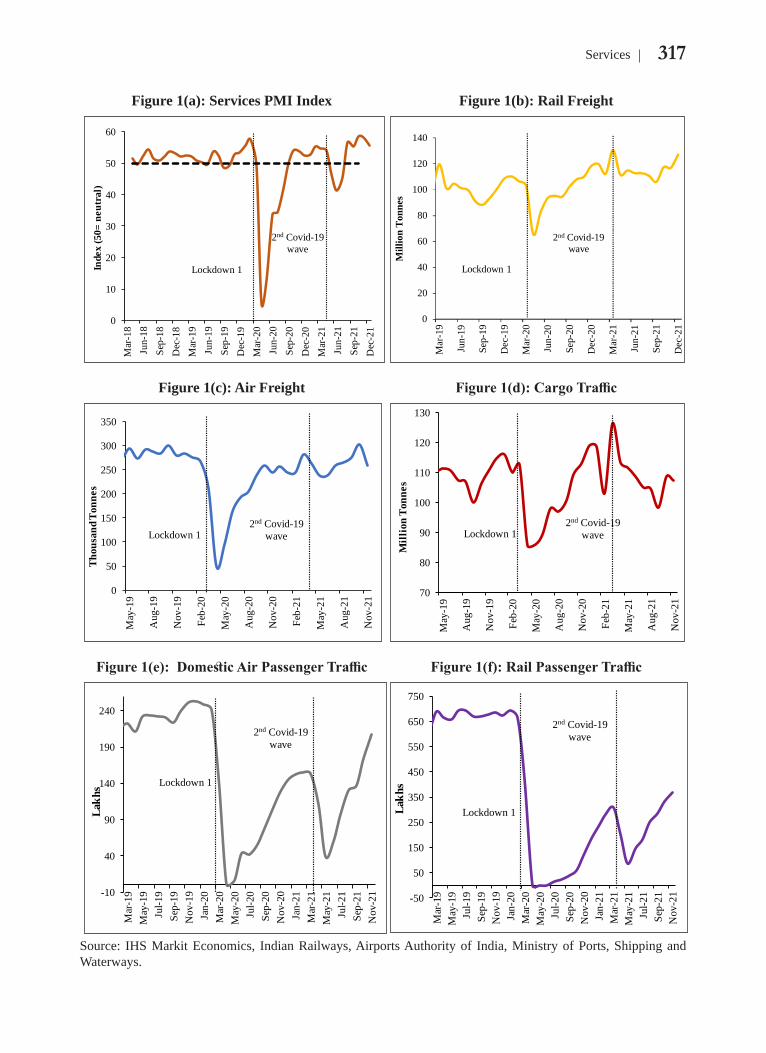
317Services
Figure 1(a): Services PMI Index Figure 1(b): Rail Freight
0
10
20
30
40
50
60M
ar-1
8Ju
n-18
Sep-
18D
ec-1
8M
ar-1
9Ju
n-19
Sep-
19D
ec-1
9M
ar-2
0Ju
n-20
Sep-
20D
ec-2
0M
ar-2
1Ju
n-21
Sep-
21D
ec-2
1
Inde
x (5
0= n
eutr
al)
Lockdown 1
2nd Covid-19 wave
0
20
40
60
80
100
120
140
Mar
-19
Jun-
19
Sep-
19
Dec
-19
Mar
-20
Jun-
20
Sep-
20
Dec
-20
Mar
-21
Jun-
21
Sep-
21
Dec
-21
Mill
ion
Ton
nes
Lockdown 1
2nd Covid-19wave
Figure 1(c): Air Freight Figure 1(d): Cargo Traffic
0
50
100
150
200
250
300
350
May
-19
Aug
-19
Nov
-19
Feb-
20
May
-20
Aug
-20
Nov
-20
Feb-
21
May
-21
Aug
-21
Nov
-21
Tho
usan
d T
onne
s
Lockdown 12nd Covid-19
wave
70
80
90
100
110
120
130
May
-19
Aug
-19
Nov
-19
Feb-
20
May
-20
Aug
-20
Nov
-20
Feb-
21
May
-21
Aug
-21
Nov
-21
Mill
ion
Ton
nes
Lockdown 12nd Covid-19
wave
Figure 1(e): Domestic Air Passenger Traffic Figure 1(f): Rail Passenger Traffic
-10
40
90
140
190
240
Mar
-19
May
-19
Jul-1
9Se
p-19
Nov
-19
Jan-
20M
ar-2
0M
ay-2
0Ju
l-20
Sep-
20N
ov-2
0Ja
n-21
Mar
-21
May
-21
Jul-2
1Se
p-21
Nov
-21
Lakh
s Lockdown 1
2nd Covid-19 wave
-50
50
150
250
350
450
550
650
750
Mar
-19
May
-19
Jul-1
9Se
p-19
Nov
-19
Jan-
20M
ar-2
0M
ay-2
0Ju
l-20
Sep-
20N
ov-2
0Ja
n-21
Mar
-21
May
-21
Jul-2
1Se
p-21
Nov
-21
Lakh
s
Lockdown 1
2nd Covid-19 wave
Source: IHS Markit Economics, Indian Railways, Airports Authority of India, Ministry of Ports, Shipping and Waterways.

318 Economic Survey 2021-22
Passenger traffic9.12 Travel restrictions in the early half of 2020-21 had halted the movement of Indian airlines and railways leading to a sharp fall in air and rail passenger traffic (Figure 1(e and f)). Domestic passenger traffic (both air and rail) had then started to recover gradually from August 2020 on a monthly basis but fell again in April-May 2021 due to the disruptions caused by second wave of Covid-19. It has picked up since then. During April- November 2021, airlines carried over 9.56 crore domestic passengers. Monthly data suggests that air passenger traffic is gradually reaching the pre-pandemic levels. Railway passenger traffic, on the other hand, is still much below the pre-pandemic levels. During April-November 2021, Indian railways carried over 185.1 crore domestic passengers. The emergence of the Omicron variant and the consequential travel restrictions pose a threat to the domestic passenger traffic in the near term.
Bank credit to Services Sector9.13 Bank credit growth to services sector which had moderated significantly in 2019, started picking up in 2020, increasing to 8.8 per cent (YoY) at the end December 2020, as compared to 6.2 per cent in December 2019 (Figure 2). This momentum has lost its pace in 2021-22. Bank credit growth decelerated to 3.6 per cent YoY at the end of November 2021 as compared to 8.2 per cent a year ago. However, it is important to note that corporates have raised more money through capital markets than banking capital in 2021-22 so far (See Chapter 4 Monetary Management and Financial Intermediation for details).
Figure 2: Growth in Bank Credit to Services Sector
0
5
10
15
20
25
Jan-
19
Mar
-19
May
-19
Jul-1
9
Sep-
19
Nov
-19
Jan-
20
Mar
-20
May
-20
Jul-2
0
Sep-
20
Nov
-20
Jan-
21
Mar
-21
May
-21
Jul-2
1
Sep-
21
Nov
-21
Per
cent
Source: RBI.

319Services
Figure 3: Growth in Bank Credit to Services Sub-Sectors (YoY)Figure 3: Growth in Bank Credit to Services Sub-Sectors (YoY)
-40
-30
-20
-10
0
10
20
30
40
50
Serv
ices
Tran
spor
t Ope
rato
rs
Com
pute
r Sof
twar
e
Tour
ism
, Hot
els
and
Res
taur
ants
Ship
ping
Prof
essi
onal
Ser
vice
s
Who
lesa
le T
rade
(oth
er th
an fo
odpr
ocur
emen
t) Ret
ail T
rade
Com
mer
cial
Rea
l Est
ate
NB
FCs
Oth
er S
ervi
ces
Per
cent
Nov-20 Nov-21
Source: RBI. Note: Data denotes Credit outstanding as on November 2020 and 2021.
9.14 Bank credit to services sector registered a growth (YoY) of 3.6 per cent in November 2021, as compared to the 8.2 per cent a year ago (Figure 3). The slowdown in growth is largely on account of the lower growth in credit to ‘Tourism, Hotel & Restaurants’, ‘Transport Operators’ and Trade- Retail as well as Wholesale. On the other hand, growth in bank credit picked up in ‘Computer Software’, ‘Shipping’, and ‘Non-Banking Financial Companies (NBFCs).
SERVICES SECTOR SHARE AT THE STATE AND UT LEVEL9.15 The services sector accounts for more than 50 per cent of the Gross State Value Added (GSVA) in 12 out of the 33 states and UTs (Table 3). Chandigarh stands out with a particularly high share of services in GSVA at 74 per cent while Sikkim’s share remains the lowest at 24.25 per cent. Notably, Services share in Sikkim’s GSVA has increased from over 18 per cent in 2018-19 to over 24 per cent in 2020-21. Similarly, over the last three years, share of services in GSVA has increased by over 4 per cent for Himachal Pradesh and Odisha. Maharashtra and Karnataka are the top two contributors to services GSVA, with Rs 15.1 lakh crore and Rs 9.71 lakh crore gross value added by services sector in 2020-21 respectively.
9.16 Due to the Covid-19 pandemic and restrictions in movement, GSVA in services sector declined in 2020-21 relative to the pre-pandemic year 2019-20. This is true for 13 out of 20 states for which data is available. During 2020-21, services GSVA contracted by almost 11 per cent in Rajasthan, and by almost 10 per cent in Jharkhand and Punjab. On the other hand, Sikkim achieved the highest growth of 11.71 per cent in services GSVA during 2020-21.

320 Economic Survey 2021-22
Table 3: Services Sector Performance at the State and UT Level
StateServices Share in GVA (per cent) Growth in Services GVA (per cent, YoY)
2018-19 2019-20 2020-21 2018-19 2019-20 2020-21
A and N Islands 64.09 64.82 64.82 5.05 5.66 -
Andhra Pradesh 42.25 41.86 41.64 8.24 6.20 -6.71
Arunachal Pradesh 47.84 46.82 - -1.19 12.22 -
Assam 39.20 42.37 - -1.64 8.08 -
Bihar 54.78 56.20 57.14 13.94 7.30 -0.11
Chandigarh 73.47 74.00 - 2.66 5.50 -
Chhattisgarh 30.02 30.64 31.18 8.32 7.71 0.75
Delhi 67.84 68.22 68.58 6.20 7.30 -5.48
Goa 26.54 28.69 - 2.15 6.43 -
Gujarat 25.18 25.73 - 11.03 8.01 -
Haryana 40.74 41.98 42.83 7.36 9.02 -5.67
Himachal Pradesh 30.68 32.62 35.45 5.68 7.75 0.50
Jammu and Kashmir 53.39 54.66 57.15 10.58 3.04 2.08
Jharkhand 34.50 37.28 36.19 9.51 8.23 -9.99
Karnataka 52.83 54.83 56.08 8.72 6.73 -3.05
Kerala 52.24 53.29 - 7.78 4.09 -
Madhya Pradesh 33.30 32.94 31.14 9.96 8.70 -8.94
Maharashtra 45.19 47.10 - 7.24 8.29 -
Manipur 60.31 59.77 - 6.62 5.53 -
Meghalaya 56.55 58.33 59.62 10.89 8.19 -8.67
Mizoram 49.61 50.82 - 6.63 16.49 -
Nagaland 57.56 57.45 - 8.59 7.92 -
Odisha 30.27 32.70 34.37 2.24 8.43 -1.01
Puducherry 33.91 34.57 - 6.68 7.95 -
Punjab 40.43 42.34 41.83 6.95 5.60 -9.40
Rajasthan 43.43 44.01 43.07 11.18 4.43 -10.95
Sikkim 18.20 21.82 24.25 11.54 20.92 11.71
Tamil Nadu 40.80 41.21 41.81 5.65 5.40 1.11
Telangana 53.89 54.90 54.53 7.91 5.69 -3.94
Tripura 45.45 45.87 47.95 8.98 13.78 1.78
Uttar Pradesh 40.77 42.32 42.35 7.64 7.72 -8.50
Uttarakhand 27.99 28.58 - 6.41 6.03 -
West Bengal 46.15 47.81 49.77 5.87 7.74 0.59
Source: Handbook of Statistics on Indian States, RBI.Note: - Data not available at the time of writing the Survey

321Services
FDI INFLOWS INTO SERVICES SECTOR9.17 Services sector is the largest recipient of FDI inflows in India. According to the World Investment Report 2021 by the UN Conference on Trade and Development (UNCTAD), India was the fifth-largest recipient of Foreign Direct Investment (FDI) in 2020 improving its rank by four places, from ninth position in 2019. In 2020-21, India registered highest ever annual FDI inflows of US$ 81.97 billion. The country has received US$ 43.12 billion FDI inflows in the first six months of 2021-22. FDI equity inflows, i.e., FDI inflows minus re-invested earnings, were US$ 31.15 billion during April-September 2021, growing by 3.8 per cent over the corresponding period last year.
9.18 During H1 2021-22, services sector received US$ 16.73 billion FDI equity inflows. This is over 29 per cent lower than the FDI equity inflows into services in the corresponding period last year. This fall was driven by Computer Software & Hardware sub-sector. In H1 2020-21, FDI equity inflows into ‘Computer Software & Hardware’ sub-sector was US$ 17.55 billion. It has declined by US$ 10 billion to reach US$ 7.12 billion in H1 2021-22. However, this is still 77 per cent higher than the FDI equity inflows into this sub-sector during H1 2019-20. On the other hand, ‘Financial, Business, Outsourcing, R&D, Courier, Tech Testing & Analysis’, ‘Education’ sub-sector witnessed strong inflows amounting to US$ 3.16 billion and US$ 2.25 billion respectively in April-September 2021. Nonetheless, the services sector still accounts for over 50 per cent of the total FDI equity inflows into India during this period (Table 4).
Table 4: Gross FDI Equity Inflows into Services Sector
Services Sub-Sectors
Share in Gross FDI Equity Inflows into Services Sector in 2021-22 (per cent)*
(US$ Million)
2018-19 2019-20 2020-21 April-Sep 2019
April-Sep 2020
April-Sep 2021
Financial, Business, Outsourcing, R&D, Courier, Tech Testing & Analysis
18.84 9,158 7,854 5,060 4,455 2,252 3,152
Computer Software & Hardware
42.59 6,415 7,673 26,145 4,025 17,554 7,124
Trading 12.27 4,462 4,574 2,608 2,143 949 2,052
Telecommunications 2.25 2,668 4,445 392 4,280 7 376
Information & Broadcasting
0.54 1,252 823 314 196 161 91
Hotel & Tourism 2.21 1,076 2,938 369 859 283 370
Hospitals & Diagnostic Centers
1.97 1,045 635 501 376 163 329
Education 13.44 777 3,245 1,250 216 604 2,248
Retail Trading 1.38 443 472 1,338 243 1,230 231
Consultancy Services
0.91 411 1,047 938 473 110 153
Sea Transport 2.22 279 199 294 173 144 372
Air Transport 1.14 191 918 204 114 97 190

322 Economic Survey 2021-22
Agriculture Services 0.25 88 46 124 23 60 42
Gross FDI Equity Inflows into Services Sector (US$ million)
28,265 34,868 39,539 17,577 23,612 16,727
Change from Previous Year (per cent)
-2.4 23.4 13.4 33.1 34.3 -29.2
Gross FDI Equity Inflows into India (US$ million)
44,366 49,977 59,636 26,096 30,004 31,153
Share of Services Sector in Gross FDI Equity Inflows (per cent)
63.7 69.8 66.3 67.4 78.7 53.7
Source: Department for Promotion of Industry and Internal Trade (DPIIT). Note: *: Up to September 2021
TRADE IN SERVICES SECTOR9.19 World trade in commercial services plummeted in 2020 following the Covid-19 pandemic. The slowdown in global services was predominately due to restrictions on travel and tourism and reduction in transportation services, largely in the passenger segment (WTO, 2021). In 2021 so far, world trade in services has shown signs of recovery as a result of world-wide extensive inoculation and resumption in global economic activity. According to WTO, global services trade returned to positive growth territory in April-June 2021, rising 26 per cent yoy largely reflecting the rebound from same period last year, the quarter in which the strongest impact due to Covid-19 was felt. Bolstered by increased demand for goods, shipping under-capacity and higher freight costs, transport services improved on YoY basis. However, travel services remain below pre-pandemic levels. Despite signs of recovery, the WTO expects global services trade to grow at a slower pace than goods trade in 2021, particularly in sectors related to travel and leisure.
Services exports9.20 India has a dominant presence in global services exports (Figure 4). It remained among the top ten services exporter countries in 2020, with its share in world commercial services exports increasing from 3.4 per cent in 2019 to 4.1 per cent in 2020.
Figure 4: India's share in World Commercial Service ExportsFigure 4: India's share in World Commercial Service Exports
0.00.51.01.52.02.53.03.54.04.5
1991
1992
1993
1994
1995
1996
1997
1998
1999
2000
2001
2002
2003
2004
2005
2006
2007
2008
2009
2010
2011
2012
2013
2014
2015
2016
2017
2018
2019
2020
Per c
ent
Source: World Bank Note: Commercial service exports are total service exports minus exports of government services not
included elsewhere. International transactions in services are defined by the IMF's Balance of Payments Manual (1993) as the economic output of intangible commodities that may be produced, transferred, and consumed at the same time.

323Services
9.21 The impact of Covid-19 induced global lockdown on India’s services exports was less severe as compared to merchandise exports. During 2020-21, India’s goods exports (BoP basis) declined by 7.5 per cent (YoY), while services exports declined by only 3.3 per cent (YoY). The impact was much severe in travel exports, which fell almost 72 per cent in 2020-21. During H1 2021-22, with vast inoculation drive and pickup in global demand, India’s services exports increased by 21.6 per cent as against a fall of 7.8 per cent during the same period a year ago (Table 5). The improvement in exports was seen in almost all services sub-sectors, barring travel services which remained in contractionary mode due to persisting restrictions on international travel and tourism (Table 5).
Table 5: Services Trade Performance by sub-sector
Commodity Group
Share (per cent) Value (US$ Billion) Growth (per cent YoY)
2010-11
2020-21
2019 -20
2020 -21
2020-21 (Apr-Sept)
2021-22 (Apr- Sept)
2019- 20
2020- 21
2020-21 (Apr- Sept)
2021-22 (Apr- Sept)
Total Services Exports
100 100 213.2 206.1 96.8 117.6 2.5 -3.3 -7.8 21.6
Travel 12.7 4.1 30.0 8.5 4.0 3.7 5.5 -71.7 -72.5 -6.6
Transportation 11.4 10.6 21.0 21.9 10.2 14.3 7.8 4.1 -3.3 40.7
Insurance 1.6 1.2 2.4 2.4 1.2 1.6 -8.7 -2.2 -3 35.9
GNIE* 0.4 0.3 0.7 0.6 0.3 0.4 8.0 -4.5 -8.8 43.7
Software Services
42.6 48.5 93.1 100 47.4 57.6 11.5 8.6 2.9 21.4
Business Services
19.3 23.9 45.7 49.2 22.9 26.8 16.9 7.5 2.5 17.1
Financial Services
5.2 2.1 4.7 4.3 2.0 2.5 -2.6 -8.3 -20.3 24.4
Communication 1.3 1.4 2.7 2.8 1.4 1.6 6.3 2.9 2.4 15.0
Total Services Imports
100 100 128.3 117.5 54.9 66.2 1.8 -8.4 -14.2 20.7
Travel 13.7 9.8 22.0 11.5 5.5 6.8 1.4 -47.7 -54.8 23.1
Transportation 17.2 16.8 24.3 19.8 9.0 14.8 18.3 -18.7 -25.9 64.9
Insurance 1.7 1.8 1.7 2.1 0.9 1.0 -2.9 18.4 19.9 9.6
GNIE* 1.0 0.9 1.1 1.0 0.5 0.4 -0.7 -7.7 -14 -16.6
Software Services
2.7 8.7 8.5 10.3 4.6 5.7 45.5 21.2 15.6 22.4
Business Services
34.4 42.1 46.9 49.5 23.9 24.1 16.0 5.6 4.1 0.9
Financial Services
9.3 4.1 2.9 4.8 2.2 2.6 -16.3 63.2 94.8 19.0
Communication 1.4 1.2 1.3 1.4 0.7 0.6 14.7 11.0 3.2 -11.3
Services Trade Balance
100 100 84.9 88.6 41.8 51.4
Goods Trade Balance
-157.5 -102.2 -25.8 -75.1
Source: RBI.Note: *: Government not included elsewhere

324 Economic Survey 2021-22
9.22 India’s software exports, with a share of 48.5 per cent in total services exports, remained relatively resilient during Covid-19 period with higher demand for digital support, cloud services and infrastructure modernisation catering to the new pandemic challenges. The top software companies have reported average revenue growth rate of above 21 per cent (in $ terms) in H1 2021-22 on account of the increased revenue from their manufacturing, financial, banking and insurance, communication, retail, life sciences and health care segments.
9.23 Until 2019-20, India was net exporter of travel services. However, amid drop in foreign tourist arrivals owing to the mobility restrictions imposed worldwide, travel receipts remained below the pre-pandemic level. In April-September 2021, travel exports were US$ 3.7 billion, which is slightly lower than US$ 4 billion in April-September 2020 and far modest than US$ 14.6 billion during the same period in 2019 (i.e., pre-pandemic period). Growth in receipts from exports of transportation services had moderated to 4.1 per cent due to slowdown in trade activity and supply chain disruptions in 2020-21. However, with resumption in cross-border trade activity and shortage in shipping containers impacting transport costs, the transportation receipts posted growth of 40.7 per cent in H1 2021-22 on a YoY basis (Table 5).
9.24 Among other segments, business services exports increased by 17.1 per cent in H1 2021-22, even surpassing the pre-pandemic levels, mainly on account of rise in receipts relating to professional and management consultancy.
Services imports9.25 India’s services imports exhibited sharper decline of 8.4 per cent in 2020-21 in comparison with services exports primarily on account of fall in travel and transportation payments.
9.26 During H1 2021-22, growth of services imports was 20.7 per cent on account of relaxation in lockdown restrictions and resumption in domestic economic activity. Among the major sectors, payments for overseas travel rose by over 23 per cent in H1 2021-22 on YoY basis; however, it still remained far below its pre-pandemic level. International shortage in shipping vessels has increased the transportation cost, which is evident in escalation of 64.9 per cent in outgo on account of transportation services during April-September 2021. Business services, the largest category in India’s import of services, increased by 0.9 per cent in H1 2021-22. The increase in business services payments was due to technical, trade-related, other business services, higher outward remittances for maintenance of offices abroad.
9.27 Despite Covid-19 impacting travel and transport services exports in 2020-21, double digit growth in gross exports of services, aided by exports of software, business and transportation services, resulted in an increase of 22.8 per cent in net exports of services in H1 2021-22.
MAJOR SERVICES: SUB-SECTOR WISE PERFORMANCE AND RECENT POLICIES9.28 Most sub-sectors of the services sector, particularly, aviation, tourism and port traffic slumped in 2020-21 with the onset of Covid-19 related global shutdown and restrictions in movements. In 2021-22 so far, these sub-sectors have shown signs of recovery, largely reflecting the rebound from same period last year.

325Services
9.29 All commercial international flights have been banned since March 2020. This has affected foreign tourist travel and consequently foreign exchange earnings from tourism. Domestic passenger traffic, on the other hand, has seen some signs of recovery. During April-November 2021, 95.6 million passengers travelled, up from 45.2 million during the same period last year. Cargo traffic at ports rose by approximately 10 per cent to 857.3 Million Tonnes (MT) during April-November period of the current fiscal year as compared to 779.2 MT during April-November 2020 (Table 6). This section discusses developments in some key sub-sectors of the services sector in detail.
Table 6: Performance of Key Sub-Sectors in India’s Services Sector
Sub-Sector Indicator UnitYear
2017-18 2018-19 2019-20 2020-21 2021-22
IT –BPM (excluding e-commerce and Hardware)
IT-BPM revenues
US$ billion
151.4 161.8 174.3 177.9 (E) -
Exports US$ billion
125.1 135.5 146.6 149.1 (E) -
Domestic US$ billion
26.3 26.3 28 28.9 (E) -
Aviation Airline passengers
million 344.7 340.9 115.7 106.5#
Domestic million 275.2 274.4 105.6 95.6#
International million 69.4 66.5 10.1 10.9#
Telecom Wireless phone subscriptionsa
million 1,183.4 1,161.8 1157.8 1181 1,180.8##
Wireless internet subscriptionsa
million 472.7 582.8 720.8 799.3 810.1##
Tourism Foreign tourist arrivalsb
million 10.0 10.6 10.9 2.74### -
Foreign exchange earnings from tourismb
US$ billion
27.3 28.6 30.1 6.96### -
Shipping Gross tonnage of shippinga
million tonnes
12.6 12.8 12.7 13 12.96^
Number of shipsa number 1,382 1,405 1,431 1,463 1,488^
Ports Port traffic million tonnes
1,208.6 1,277.3 1317.7 1246.1 (P) 857.3#
Cargo capacity (Major Ports)
million tonnes
1,451.2 1,514.1 1,514.9 1,510.6 -
Sources: Telecom Regulatory Authority of India (TRAI), Department of Telecom, Ministry of Tourism, Ministry of Shipping, Airports Authority of India, Ministry of Electronics and Information Technology, NASSCOM. Note: a: As of March of ensuing financial year; b: On calendar year basis; #For Apr-Nov 2021 ; ##: As of June 2021; ###: Jan-June 2020; @: As of June 2021; ^As of August 2021. P=Provisional. E= NASSCOM provisional estimates

326 Economic Survey 2021-22
Tourism Sector9.30 In normal times, tourism sector is a major contributor to GDP growth, foreign exchange earnings and employment. However, the Covid-19 pandemic has had a debilitating impact on world travel and tourism everywhere, including India.
9.31 According to the World Tourism Barometer of the United Nation’s World Tourism Organization (January 2021), International Tourist Arrivals (ITA) declined by 74 per cent globally in 2020 over the previous year, with restrictions on travel, low consumer confidence and a global struggle to contain the Covid-19 spread. ITA had reached a total of 1.5 billion in 2019, and reduced to381 million in 2020, leading to an estimated loss of US$ 1.3 trillion in export revenues. This weakness in international tourism has continued in 2021. During January-September 2021, ITA worldwide was 20 per cent lower than the same period in 2020 and 64 per cent below 2019 levels.
9.32 The resumption of international tourism will continue to depend largely on a coordinated response among countries in terms of travel restrictions, harmonized safety and hygiene protocols and effective communication to help restore consumer confidence. This is particularly critical at a moment when cases are surging in some regions and new Covid-19 variants are emerging in different parts of the world.
9.33 To contain the spread of virus, the Indian airspace regulator, Director General of Civil Aviation (DGCA), had suspended all commercial international flights in March 2020. This restriction has been extended till February 28, 2022. However, special international flights have been operating under the Vande Bharat Mission to help expats fly back home under special diplomatic arrangements (air travel arrangements)4 with various countries since May 2020. At present, India has transport bubbles with 35 nations5. Under this Mission, which is currently in its 15th phase, over 47,000 inbound and outbound flights have been operated as on December 31, 2021, carrying over 63.55 lakh passengers.
9.34 At the time of writing, new restrictions were being introduced worldwide due to the spread Omicron variant of the Covid-19. Thus, the trajectory of tourism sector, especially international tourism remains uncertain.
IT BPM Services9.34 The Information Technology-Business Process Management (IT-BPM) sector is a major segment of India’s services. During 2020-21, according to NASSCOM’s provisional estimates, IT-BPM revenues (excluding e-commerce) reached US$ 194 billion, growing by 2.26 per cent YoY, adding 1.38 lakh employees.
4“Transport Bubbles” or “Air Travel Arrangements” are temporary arrangements between two countries aimed at restarting commercial passenger services when regular international flights are suspended as a result of the Covid-19 pandemic. They are reciprocal in nature, meaning airlines from both countries enjoy similar benefits.5Afghanistan, Australia, Bahrain, Bangladesh, Bhutan, Canada, Ethiopia, Finland, France, Germany, Iraq, Japan, Kazakhstan, Kenya, Kuwait, Maldives, Mauritius, Nepal, Netherlands, Nigeria, Oman, Qatar, Russia, Rwanda, Saudi Arabia, Seychelles, Singapore, Sri Lanka, Switzerland, Tanzania, Ukraine, UAE, UK, USA, Uzbekistan.

327Services
Share of IT-BPM Sub-sectors
9.36 Within the IT-BPM sector, IT services constitutes the majority share (> 51 per cent) (Figure 5). Its share has been consistent over the last many years. The share of Software & Engineering services in the IT-BPM sector, which was consistently growing each year, saw a slight decline to 20.78 per cent in 2020-21. BPM services share remained same at 19.8 per cent, while that of Hardware services slightly improved to 8.3 per cent. In 2020-21, IT services, Software & Engineering services, BPM services, and Hardware services earned revenues of US$ 99.1 billion, US$ 40.3 billion, US$ 38.5 billion, and US$ 16.1 billion, respectively.
Figure 5: Sub-sectors share in IT-BPM Revenue (excluding hardware & e-commerce)
52.0% 51.6% 51.2% 50.9% 51.1%
19.5% 19.5% 19.7% 19.8% 19.8%
19.1% 19.8% 20.6% 21.1% 20.8%
9.3% 9.1% 8.5% 8.2% 8.3%
2016-17 2017-18 2018-19 2019-20 2020-21 E
IT services BPM Software Products & Engineering services Hardware
Source: NASSCOM. Note: E: Estimate.
Share of Exports in IT-BPM Sector
9.37 During 2020-21, the total revenue in IT-BPM sector (excluding hardware and e-commerce) grew at 2.1 per cent (YoY). A significant portion of this revenue comes from exports. During 2020-21, exports revenues grew by 1.93 per cent to reach US$ 149.1 billion (Table 7).
Table 7: Exports and Domestic Market Size of Indian IT-BPM Industry (excluding hardware & e-commerce)
Year Revenue (US$ billion) Percentage growth (YoY)
Domestic Exports Total Domestic Exports Total
2016-17 23.8 116.1 139.9 10.45 7.64 8.11
2017-18 26.3 125.1 151.4 10.44 7.77 8.22
2018-19 26.3 135.5 161.8 -0.27 8.34 6.84
2019-20 28.0 146.3 174.3 6.70 7.93 7.73
2020-21E 28.9 149.1 177.9 3.01 1.93 2.11Source: NASSCOM. Note: E: Estimate.

328 Economic Survey 2021-22
9.38 Out of the total US$ 149.1 billion in exports of the IT-BPM sector (excluding hardware and e-commerce) in 2020-21, Banking, Financial services and Insurance (BFSI) contributed US$ 61.4 billion, accounting for over 41 per cent of the exports. Hi-tech/Telecom and Manufacturing services contributed US$ 26.3 billion and US$ 24.3 billion, accounting for a share of 17.65 and 16.28 per cent respectively (Figure 6). All the three sub-sectors witnessed a marginal increase in export revenues in 2020-21 YoY, with BFSI growing by 3 per cent, Hi-tech/Telecom services by 2 per cent and Manufacturing services by 1 per cent.
Figure 6: Sector wise break up of Indian IT BPM Export Revenues (excluding hardware & e-commerce) (US$ billion)
47.3 51.0 55.3 59.6 61.4
20.5 22.1 24.0 25.9 26.319.020.6
22.224.0 24.329.2
31.434.0
36.8 37.2
2016-17 2017-18 2018-19 2019-20 2020-21 E
BFSI Hi-tech/Telecom Manufacturing Others
Source: NASSCOM. Note: E: Estimate.Note: Others include emerging sectors like Retail, Healthcare, Media etc.
Distribution of export revenues
9.39 United States remained the biggest source of exports revenues amounting US$ 92.1 billion in 2020-21(Figure 7). This accounts for about 62 per cent of total IT-BPM exports (excluding hardware and e-commerce). This is followed by UK, which is second largest export market for IT-BPM services with a share of around 17 per cent. The revenue from exports to UK amounted to US$ 25.2 billion in 2020-21. Europe (excluding UK) and Asia-Pacific account for 11.5 per cent and 7.7 per cent respectively of the export earnings of India.
Figure 7: Geographic Break-up of India’s IT-BPM Exports (excluding hardware & e-commerce) (US $ billion)
71.9 77.5 84.0 90.7 92.1
19.721.2
22.924.7 25.2
13.214.2
15.416.6 17.2
8.89.4
10.211.1 11.4
2.5 2.7
2.93.2
3.3
2016-17 2017-18 2018-19 2019-20 2020-21 E
US UK Europe (Excluding UK) APAC RoW
Source: NASSCOM. Note: E: Estimate.

329Services
9.40 Over the last year, a number of policy initiatives have been undertaken to drive innovation and technology adoption in the sector, including relaxation of Other Service Provider regulations (See Box 1), Telecom Sector Reforms and Consumer Protection (e-commerce) Rules, 2020. This would significantly expand access to talent, increase job creation, and catapult the sector to the next level of growth and innovation.
Box 1: Removal of Telecom Regulations in IT-BPO Sector
Last year, the Government undertook a major reform of liberalizing the Telecom regulations in the IT-BPO sector. In legal parlance, these are called Other Service Providers (OSPs). New revised and simplified OSP guidelines were first issued in November 2020 and further in June 2021. Prior to this, the OSPs were regulated under the Revised Terms and Conditions- Other Service Provider 2008.
IT and IT enabled service companies carrying out services like tele-medicine, e-commerce, call centre, network operation centre and other IT Enabled Services, by using Telecom Resources provided by Authorised Telecom Service Providers were required to be registered as Other Service Provider (OSP) and comply with the onerous obligations of the OSP Regulations. The application and approval processes were cumbersome and compliance obligations such as in relation to the sharing of infrastructure, work from home arrangements, use of EPABX and internet connectivity, etc. were tedious and made compliance challenging.
The revised guidelines which resolve these issues are as follows:
l Clear definition of OSP: The applicability of new guidelines is limited to entities that provide "Voice based BPO services" to its customers. Voice based BPO services is defined to mean call center services. The new guidelines have explicitly clarified that non-voice-based entities will not be governed by the OSP regime.
l Removal of registration requirement No registration certificate will be required for OSP centres in India.
l Removal of requirement of bank guarantee: No bank guarantee whatsoever will be required for any facility or dispensation under these guidelines.
l Removal of distinction between domestic and international OSPs: The categorization of OSPs has been done away with and one single OSP category has been introduced regardless of their domestic/ international business operations.
l Work from home and remote locations allowed: The agents at home/anywhere shall be treated as remote agents of the OSP centre. The interconnection between remote agents is permitted using any technology including broadband over wireline/wireless. The remote agent can now directly connect to customer Electronic Private Automatic Branch Exchange (EPABX) /centralised EPABX without the need to connect with the OSP centre.
l Interconnectivity between OSPs allowed: Interconnection between two or more OSP centres of the same or unrelated company is now permitted.
l Sharing the infrastructure: Infrastructure sharing among OSPs is now allowed. The guidelines allow the use of EPABX at foreign locations.
This reform will provide a big stimulus for growth of IT-BPO industry in India and help in creating more income and employment.

330 Economic Survey 2021-22
NASSCOM undertook a survey between October to November 2021 to assess the impact of OSP reforms on IT-BPM Sector. Its findings are as follows:
l 92 per cent of the participants stated that the OSP reforms have helped reduce compliance burden. While 28 per cent of the participants responded that their compliance burden reduced by more than 50 per cent, 20 per cent of participants acknowledged compliance reduced by 40-50 per cent. 15 per cent of participants responded that compliance reduction by 30-40 per cent (Figure 1A).
l 24 per cent of the respondents expect that OSP reforms will help in generating new employment opportunities, 10 per cent expect that it will reduce the cost of doing business in India, whereas 64 per cent expect all these benefits to accrue (Figure 1B).
l Further, 83 per cent of the participants responded that these reforms will help in reducing the financial burden; 24 per cent of the respondents stated that these reforms have significantly enhanced productivity of their organization; and 94 per cent said that these reforms will increase competitiveness globally.
Figure 1A: Reduction in compliance burden?
Figure 1B: OSP Reforms: Positive impact on the industry
l Almost all participants were satisfied with the work from home/work from anywhere relaxations’. l Over 62 per cent of the respondents indicate that they will increase their employment by 5-10
per cent annually over the next 5 years; and around 50 per cent of the respondents indicated expanding into new locations.
Ports, Shipping and Waterways Services9.41 Development of ports is crucial for the economy. Ports handle around 90 per cent of export-import cargo by volume and 70 per cent by value in India. The total cargo capacity of all the ports has increased to 1,246.86 Million Tonnes Per Annum (MTPA) as of March 2021 from 1,052.23 MTPA as of March 2014.
9.42 Hit by disruptions caused by Covid-19, cargo traffic at India’s ports decreased by 5.4 per cent during 2020-21, to 1,246.86 MT from 1,317.73 MT during 2019-20. Port traffic has picked up in 2021-22 so far, registering a growth of 10.16 per cent during April-November 2021 over the same period last year (Figure 8). During the first eight months of 2021-22, ports handled total traffic of around 858.3 MT, as compared to 779.2 MT in the corresponding period of previous year.
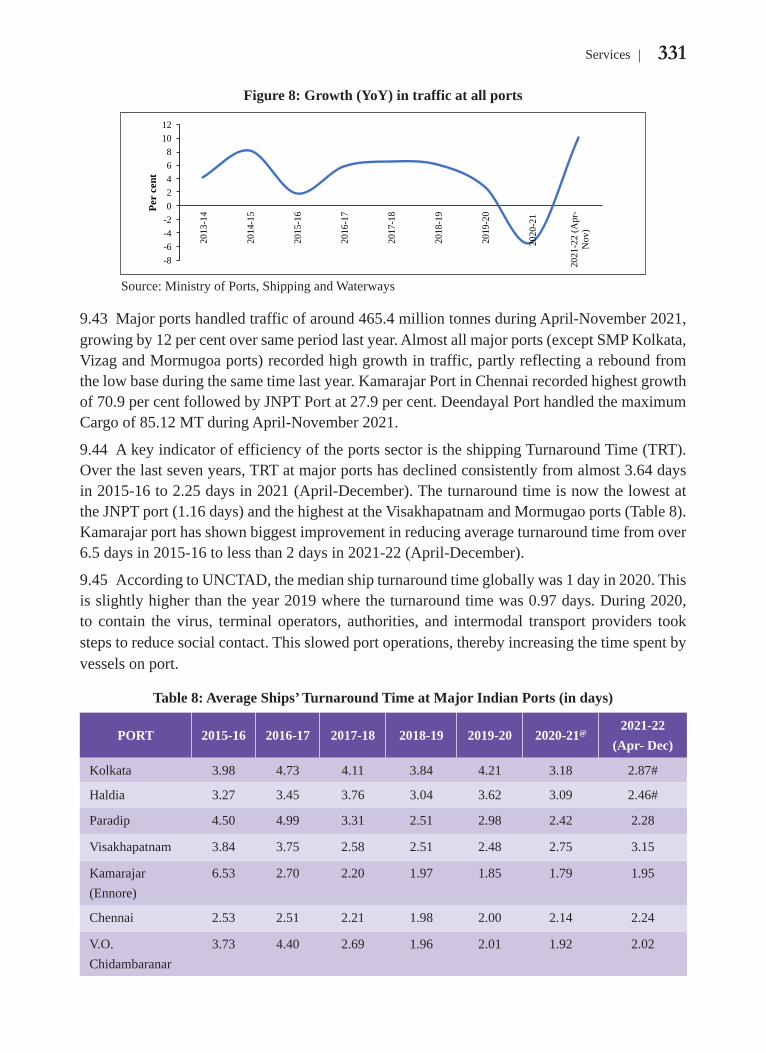
331Services
Figure 8: Growth (YoY) in traffic at all ports
-8-6-4-202468
1012
2013
-14
2014
-15
2015
-16
2016
-17
2017
-18
2018
-19
2019
-20
2020
-21
2021
-22
(Apr
-N
ov)
Per
cent
Source: Ministry of Ports, Shipping and Waterways
9.43 Major ports handled traffic of around 465.4 million tonnes during April-November 2021, growing by 12 per cent over same period last year. Almost all major ports (except SMP Kolkata, Vizag and Mormugoa ports) recorded high growth in traffic, partly reflecting a rebound from the low base during the same time last year. Kamarajar Port in Chennai recorded highest growth of 70.9 per cent followed by JNPT Port at 27.9 per cent. Deendayal Port handled the maximum Cargo of 85.12 MT during April-November 2021.
9.44 A key indicator of efficiency of the ports sector is the shipping Turnaround Time (TRT). Over the last seven years, TRT at major ports has declined consistently from almost 3.64 days in 2015-16 to 2.25 days in 2021 (April-December). The turnaround time is now the lowest at the JNPT port (1.16 days) and the highest at the Visakhapatnam and Mormugao ports (Table 8). Kamarajar port has shown biggest improvement in reducing average turnaround time from over 6.5 days in 2015-16 to less than 2 days in 2021-22 (April-December).
9.45 According to UNCTAD, the median ship turnaround time globally was 1 day in 2020. This is slightly higher than the year 2019 where the turnaround time was 0.97 days. During 2020, to contain the virus, terminal operators, authorities, and intermodal transport providers took steps to reduce social contact. This slowed port operations, thereby increasing the time spent by vessels on port.
Table 8: Average Ships’ Turnaround Time at Major Indian Ports (in days)
PORT 2015-16 2016-17 2017-18 2018-19 2019-20 2020-21@2021-22
(Apr- Dec)
Kolkata 3.98 4.73 4.11 3.84 4.21 3.18 2.87#
Haldia 3.27 3.45 3.76 3.04 3.62 3.09 2.46#
Paradip 4.50 4.99 3.31 2.51 2.98 2.42 2.28
Visakhapatnam 3.84 3.75 2.58 2.51 2.48 2.75 3.15
Kamarajar (Ennore)
6.53 2.70 2.20 1.97 1.85 1.79 1.95
Chennai 2.53 2.51 2.21 1.98 2.00 2.14 2.24
V.O. Chidambaranar
3.73 4.40 2.69 1.96 2.01 1.92 2.02
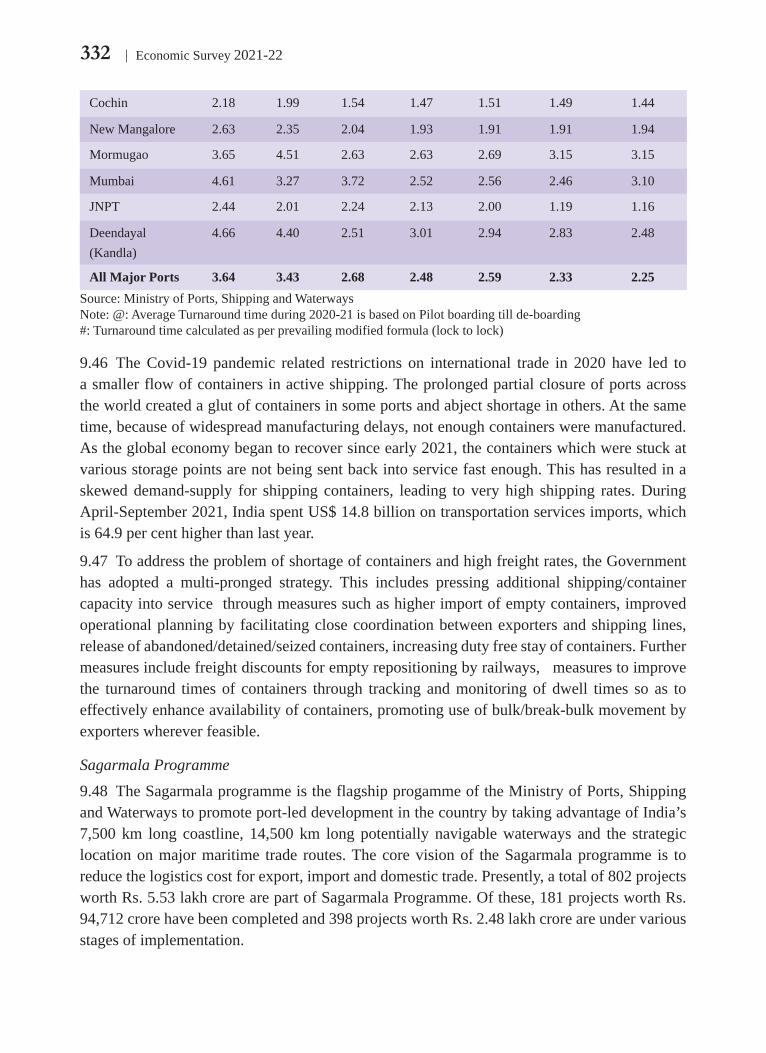
332 Economic Survey 2021-22
Cochin 2.18 1.99 1.54 1.47 1.51 1.49 1.44
New Mangalore 2.63 2.35 2.04 1.93 1.91 1.91 1.94
Mormugao 3.65 4.51 2.63 2.63 2.69 3.15 3.15
Mumbai 4.61 3.27 3.72 2.52 2.56 2.46 3.10
JNPT 2.44 2.01 2.24 2.13 2.00 1.19 1.16
Deendayal (Kandla)
4.66 4.40 2.51 3.01 2.94 2.83 2.48
All Major Ports 3.64 3.43 2.68 2.48 2.59 2.33 2.25Source: Ministry of Ports, Shipping and WaterwaysNote: @: Average Turnaround time during 2020-21 is based on Pilot boarding till de-boarding#: Turnaround time calculated as per prevailing modified formula (lock to lock)
9.46 The Covid-19 pandemic related restrictions on international trade in 2020 have led to a smaller flow of containers in active shipping. The prolonged partial closure of ports across the world created a glut of containers in some ports and abject shortage in others. At the same time, because of widespread manufacturing delays, not enough containers were manufactured. As the global economy began to recover since early 2021, the containers which were stuck at various storage points are not being sent back into service fast enough. This has resulted in a skewed demand-supply for shipping containers, leading to very high shipping rates. During April-September 2021, India spent US$ 14.8 billion on transportation services imports, which is 64.9 per cent higher than last year.
9.47 To address the problem of shortage of containers and high freight rates, the Government has adopted a multi-pronged strategy. This includes pressing additional shipping/container capacity into service through measures such as higher import of empty containers, improved operational planning by facilitating close coordination between exporters and shipping lines, release of abandoned/detained/seized containers, increasing duty free stay of containers. Further measures include freight discounts for empty repositioning by railways, measures to improve the turnaround times of containers through tracking and monitoring of dwell times so as to effectively enhance availability of containers, promoting use of bulk/break-bulk movement by exporters wherever feasible.
Sagarmala Programme
9.48 The Sagarmala programme is the flagship progamme of the Ministry of Ports, Shipping and Waterways to promote port-led development in the country by taking advantage of India’s 7,500 km long coastline, 14,500 km long potentially navigable waterways and the strategic location on major maritime trade routes. The core vision of the Sagarmala programme is to reduce the logistics cost for export, import and domestic trade. Presently, a total of 802 projects worth Rs. 5.53 lakh crore are part of Sagarmala Programme. Of these, 181 projects worth Rs. 94,712 crore have been completed and 398 projects worth Rs. 2.48 lakh crore are under various stages of implementation.

333Services
Space Sector9.49 Since its inception in the 1960s, the Indian space program has grown drastically. Administered by the Department of Space (DOS) and primarily executed by its R&D arm, the Indian Space Research Organization (ISRO), capabilities have been developed in the space sector across all domains. This includes indigenous space transportation systems; space assets comprising of fleet of satellites catering to the needs of earth observation, satellite communication, meteorology, space science & navigation; ground infrastructure and a host of operational programs related to the applications of space technology to the common uses of the society.
9.50 Across the globe, the trend of space activities is in a state of transition. From being primarily a government driven activity, the sector has been witnessing increasing participation of private sector – not only in the traditional vendor role but also in taking up end-to-end space activities. With this in mind, Government undertook reforms in space sector in 2020, which envisage the private sector to act as a co-traveler in the exploration of outer space and also in providing space-based services.
9.51 As a part of these reforms, the first step taken was empowering New Space India Limited (NSIL)-the Public Sector Undertaking (PSU) in this sector –to “own” the operational launch vehicles and space assets of ISRO. Further, the present supply-based model was changed to demand-driven model, wherein NSIL shall act as aggregator of user requirements and obtain commitments. The first outcome in this regard came recently to the fore with Tata Sky signing an MoU with NSIL for utilizing the capacity on board the upcoming communication satellite GSAT-24, to be built by ISRO and launched by Arianespace.
9.52 The second important step was the creation of an independent nodal agency under the Department of Space, Indian National Space Promotion and Authorization Centre (IN-SPACe), which shall act as the promotor and regulator of space activities in India by NGPEs (Non-government/private entities). This body has been tasked with prioritising the launch manifest as per the requirements of NSIL, ISRO and NGPEs. It shall also allow utilization of capital intensive DOS-owned facilities at reasonable cost by the private sector. In a little over a year since the agency was announced, the interim IN-SPACe board has received close to 40 proposals from large industries, MSMEs, start-ups and academia covering broad range of activities in space domain – cutting across both upstream (launch vehicle/satellite manufacturing) as well as downstream (Earth Observation applications, communications, etc.)
9.53 The third vital step has been in providing a predictable, forward-looking, well defined and enabling regulatory regime for space activities in the country. The first to be updated were the SpaceCom and SpaceRS policies, further liberalizing the traditional Satellite Communication and Remote Sensing sectors, respectively, thus enabling entrepreneurs/industries to take up end-to-end activities in these domains.
9.54 These initiatives have been received with much zeal and vigor by the entrepreneurs. Five private satellites have been tested at ISRO facilities, four student satellites were launched aboard the PSLV C-51. The national registration mechanism for space objects has been implemented, with five satellites registered. A total of six MoUs have been signed with private/academic entities for sharing technical expertise and facilities.

334 Economic Survey 2021-22
9.55 Trends in the number of start-ups engaged in the space sector also show the pace of growth of space sector in India (Table 9). Just in the last three years number of startups in the space sector has increased from 11 in 2019 to 47 in 2021.
Table 9: Number of Start-ups in Space Sector
Year No of start-ups
2012 12013 12014 12015 32016 12017 82018 72019 112020 212021 47Total 101
Source: ISRONote: ISRO/DOS doesn't register any start-ups. However, start-ups are registered with startupindia under DPIIT. Around 75 start-ups are shown under space technology category in the startupindia portal. But these numbers are not exhaustive, as some of the start-ups registered under other categories are also involved in the space domain.
9.56 With these recently undertaken policy initiatives and private sector participations, the Indian space sector is expected to capture a larger share of the global space economy, which was close to US$ 447 billion in 2020. At present, India accounts for only about 2 per cent of the space economy, much behind the major players – USA and China.
Box 2: Drone Rules, 2021
In March 2021, the Ministry of Civil Aviation (MoCA) published the UAS Rules, 2021. These Rules were considered too stringent and restrictive as they involved considerable paperwork, required permissions for every drone flight and very few “free to fly” green zones were available. Based on the feedback, the Government decided to repeal the Unmanned Aircraft Systems (UAS) Rules, 2021 and replace the same with the liberalised Drone Rules, 2021, which was notified on 25th August 2021. Key features of Drone Rules 2021 include:l Several approvals abolished; with the total forms to be filled reduced from 25 to 5: Various
approvals such as unique authorisation number, unique prototype identification number, certificate of manufacturing, and operator permit etc. have been done away with. Certain exemptions have also been introduced for nano/micro drones.

335Services
Figure 3A: Approvals abolished under the new Drone Rules 2021
Source: PIB
l Type of fees reduced from 72 to 4; further the quantum of fees to be paid reduced considerably and delinked with the size of drone. For instance, the fee for a remote pilot license fee has been reduced from Rs 3000 (for large drone) to Rs 100 for all categories of drones.
l Extended applicability of rules: Drones up to 500 kg are now subject to regulations, compared to the earlier limit of 300 kg. This brings drone taxis and heavy payload-carrying drones within the ambit of the rules. For drones with weight more than 500 kg, the provisions of the Aircraft Rules 1937 shall apply.
l Simplified and accessible certification process: A Digital Sky platform is being developed as a single-window platform for one-step and one-time clearances for drone ownership and operation. Manufacturers and importers may generate their drones’ unique identification number on the digital sky platform through self-certification.
l Prior security clearance removedl Expanded area of drone operations: An interactive map on the Digital Sky platform specifies
colour-coded zones on the map i.e. green, yellow and red, indicating free zones, those which require prior permission, and no-fly zones, respectively. The perimeters of these zones have also been liberalised to increase freely accessible airspace under the green category. This map will be made accessible through a machine-readable Application Programming Interface.
l Relaxations on foreign companies: Foreign-owned and controlled Indian companies can conduct drone operations in India. Import of drones will be regulated by Directorate General of Foreign Trade (DGFT).
l No remote pilot licence required for micro drones (for non-commercial use) and nano drones. Remote pilot licence will be issued by Director General of Civil Aviation (DGCA) within 15 days of pilot receiving the remote pilot certificate from the authorised drone school through the digital sky platform.
l Relaxations for Research and Development (R&D): Requirements such as type certification have been removed for drone manufacturers conducting R&D in premises located in green zone.
l Reduced penalties: The maximum penalty under new rules has been reduced from Rs 5 lakhs to Rs 1 lakh.

336 Economic Survey 2021-22
Box 3: Revised Guidelines for Acquiring and Producing Geospatial Data
On 15th February 2021 the Department of Science and Technology released guidelines for the creation, acquisition and use of geospatial data, including maps. Being critical to mapping activities in India, geospatial data was previously heavily regulated and required licenses to be obtained for the use of such data. Given the increase in freely and publicly available geospatial data and services, the erstwhile restrictions had become redundant and severely hampered technological innovation in the sector, which specifically affected domestic players. The newly released guidelines aim to build a more permissive regime which opens up the industry to collaboration and progress, while supporting Indian companies operating in this sector.
Some key changes under the guidelines are as follows: l Introduction of a self-certification regime: All entities are now required to follow a self-
certification process to show adherence to the guidelines, as opposed to obtaining prior approval or licenses for the use of geospatial data and maps.
l Relaxation of restricted areas: Mapping activities are prohibited only for specific attributes of highly sensitive locations, as opposed to restricted areas under the previous regime.
l Specific permissibility for Indian Entities: Only Indian owned and controlled entities are permitted to (i) use geospatial data above a certain special accuracy; (ii) use specific technologies such as ground truthing and verification; and (iii) conduct activities such as street view surveying and surveying in Indian territorial waters. While non-Indian companies are not permitted to undertake any of the above, they can license this data from Indian entities through the use of APIs, only for the purposes of serving their Indian customers,
l Relaxation on export restrictions: The guidelines permit the export of maps with resolutions up to a 1:100 resolution thereby relaxing the previous threshold of 1:250000. Maps which are finer than the specified resolution threshold must be localised, and are only permitted to be stored and processed on servers located within India.
l Open access to publicly funded data: The guidelines require all geospatial data produced using public funds, including data produced by the Survey of India, to be freely accessible to all Indian entities, for scientific, economic and developmental purposes. Certain categories of classified geospatial data will been exempted from this requirement.
Startups9.57 Startups in India have grown remarkably over the last six years, most of these belong to the services sector. During 2021, the Government recognised over 14,000 new startups as compared to only, only 733 new startups during 2016-17. As a result, more than 61,400 startups have been recognised in India as of January 10, 2022. Figure 9 &Figure 10 show the spread of startups in Indian districts. During 2021, 555 districts had atleast one new startup. On the other hand, only 121 districts had atleast 1 new startup in 2016-17.

337Services
Figure 9: New Startups recognised in 2016-17
Source: DPIIT

338 Economic Survey 2021-22
Figure 10: New Startups recognised in 2021-22*
Source: DPIIT*As on 22nd December 2021

339Services
9.58 Over the recent years, Delhi has replaced Bangalore as the startup capital of India. Over 5,000 recognised startups were added in Delhi while 4,514 startups were added in Bangalore between April 2019 to December 2021. With a total of 11,308 startups, Maharashtra has the highest number of recognised startups. 9.59 India had a record number of start-ups (44) reach unicorn status in 2021. It overtook UK to emerge as the third highest country in number of unicorns after US and China which added 487 and 301 unicorns respectively in 2021. As of January 14, 2022, India has 83 unicorns with a total valuation of US$ 277.77 billion.
Patents 9.60 Most of India’s startups are in the IT/ knowledge-based sector. Intellectual property, specifically patents are key to this knowledge-based economy. There has been gradual increase in the filing and granting of patents in India. The number of patents filed in India has gone up from 39,400 in 2010-11 to 45,444 in 2016-17 to 58,502 in 2020-21 and the patents granted in India has gone up from 7,509 to 9,847 to 28,391 during the same time period. Further, the number of patents application are increasingly coming from Indian residents rather than MNCs. The share of Indian residents in total applications has increased from 20 per cent in 2010-11 to around 30 per cent in 2016-17 and 40 per cent in 2020-21. Consequently, India’s ranking in Global Innovation Index has climbed 35 ranks, from 81st in 2015-16 to 46th in 2021. 9.61 This is a remarkable progress, but the number of patents granted in India is still a fraction compared to patents granted in China, USA, Japan, and Korea. According to World Intellectual Property Organization (WIPO), the number of patents granted in China, USA, Japan, Korea stood at 5.30 lakh, 3.52 lakh, 1.79 lakh, 1.35 lakh respectively for 2020. 9.62 One of the key reasons for relatively low patents in India vis a vis USA, China, etc is India’s low expenditure on Research and Development (R&D) activities, which was 0.7 per cent of its GDP in 2020. However, this is not the only reason. The procedural delays and complexity of the process is another cause for low patents in India. The average pendency for final decision in acquiring patents in India is 42 months as of 2020. This is much higher than 20.8, 20, 15.8 and 15 months respectively for USA, China, Korea and Japan (Figure 11). Note that average pendency for final decision in acquiring patents has reduced in India from 64 months in 2017 to 52 months in 2019 and further to 42 months in 2020. Box 4 shows the step-by-step procedure followed in patent application and compares the prescribed time limit with actual time taken.
Figure 11: Average Pendency times for final decision in 2020
41.4
18.025.0
3.0
15.4 14.4 11.1 9.2 7.7 10.23.1
62.3
42.037.0 36.0
20.8 20.015.8 15.6 15.4 15.0
4.1
Brazil India UK Mexico US China Korea NewZealand
Australia Japan Russia
Ave
rage
pen
denc
y tim
e (m
onth
s)
First office action Final decision
Source: World Intellectual Property Indicators, 2021

340 Economic Survey 2021-22
Box 4: Patent application procedure in India
Application stages Prescribed time limit Actual time taken
and issue
Once the patent application is filed, a request for examination can be filed anytime within 48 months from the date of filing, although it is usually filed along with the application.
1. Publication: Once the application has been filed, it is published by the Controller.
18 months
The reason for granting this amount of time is to allow the applicant time to withdraw it.
18 months from the date of filing.
2. Reference to an Examiner: Examiners are officers appointed by the Controller to conduct a formal as well as a substantive examination of the invention.
1 month from the date of publication.
The entire process usually takes 12 months.
Delays occur at the stage of appointment of the examiner. This is primarily due to the lack of examiners qualified to examine patents in different sectors, thereby creating a backlog.
3. First Examination Report: The examiner must submit an examination report to the Controller, after which the First Examination Report (FER) is issued by the Controller to the applicant.
3-5 months
The Examiner must submit the FER to the Controller within 1-3 months from the date of receipt. The Controller must then issue the FER to the applicant within 2 months.
After the FER has been issued, the applicant has 6 months to provide its responses.to the Controller.
4. Hearing: Controller must notify and conduct a hearing to determine the validity of responses to the FER and any outstanding objections which may not have been adequately addressed by the applicant.
No time limit has been prescribed for the completion of this step
The hearing is usually completed within 6-9 months from the date of receiving responses to the FER.
After the hearing, the applicant must submit written submissions and the relevant documents (including any additional information, explanations, evidence and amendments required pursuant to the hearing) within fifteen days from the date of hearing.

341Services
5. Pre-grant Opposition: The Controller notifies the applicant of any oppositions received in relation to the application
No time limit has been prescribed for the completion of this step.
To allow for objections, a minimum of 6 months is provided subsequent to publication before a patent is granted.
Notification is typically provided immediately.
After details of the pre-grant opposition have been notified, the applicant is required to submit a reply statement accompanied by appropriate evidence within three months from the date of notice. After submission of the reply the Patent Office needs to take the following steps.
6. Opposition Hearing: The Controller after hearing the parties (if requested) considers the evidence and takes a decision as to the validity of the opposition
1 month from the completion of proceedings
Typically, this takes around 3-4 months.
7. Grant: The patent is granted and published once (i) all FER responses are accepted and (ii) no pre-grant oppositions are pending
No time limit prescribed for the completion of this step
4-6 months from the completion of all proceedings.
Where there is no hearing, grants are typically issued within 12 months from the date of submission of responses to the FER
Source: Survey Estimates
9.63 Box 4 and Figure 11 show that the time taken for the first step, i.e. publishing the application by the controller is currently 18 months in India, as compared to 15.4, 14.4, 11.1, 10.2 months respectively in US, China, Korea and Japan. In order to reduce the time taken in the application process of patents, prescribed time limits for the first stelp may be reduced to 14-15 months bringing it in line with US and China.
9.64 Secondly, delay in India’s patent application is also due to the low number of patent examiners in India. The number of patent examiners in India in 2020 were 615 as opposed to 13,704 in China, 8,132 in United States and 1,666 in Japan (Figure 12). This leads to huge delay in receiving First Examination Report (FER) delaying the whole process. This was also noted by the Parliamentary Standing Committee on Commerce’s Review of Intellectual Property Rights Regime in India (2021). Hence, there is an urgent need to increase the number of patent examiners.

342 Economic Survey 2021-22
Figure 12: Number of patent examiners in 2020
13704
8132
1666932 815 615 410 402 368 335 312
Chi
na US
Japa
n
Kor
ea
Ger
man
y
Indi
a
Aus
tralia
Rus
sia
Can
ada
UK
Bra
zil
No
of P
aten
t Exa
min
ers
Source: World Intellectual Property Indicators, 2021
9.65 Another issue which leads to delays in the process is that there is no time limit prescribed in the statute for controller to conduct a hearing to determine the validity of responses to the FER and any outstanding objections which may not have been adequately addressed by the applicant. It was found that this usually takes about 6-9 months. Additionally, the decision after the opposition hearing by the controller which should usually happen in 1 month typically takes about 3-4 months. Therefore, a fixed timeline for grant after the opposition hearing should be put in place.

CHAPTER
10
During the last two years, as India along with rest of the world faced the onslaught of the pandemic, Government’s key focus in India remained on providing a safety-net to the vulnerable segments of society as well as providing a coherent response to the health consequences of the pandemic. India having already faced two COVID-19 waves, with the first peak in September 2020 and the second peak in May 2021, is currently facing the third wave led by the Omicron variant. Indian National COVID Vaccination Program, one of the world’s largest vaccination programs, has not only supported production of COVID-vaccines domestically, but it has also ensured free vaccines to its population - world’s second largest population. Union Budget for 2021-22 allocated ` 35,000 crore for procurement of vaccines under COVID-19 Vaccination Program. From 16th January, 2021, as on 16th January 2022, a total of 156.76 crore doses of COVID-19 vaccines, have been administered: 90.75 crore first dose and 65.58 crore second dose. With these, 93 percent of 18 year and above aged persons have been vaccinated with first dose and about 70 percent with second dose. Vaccination at this scale and speed has enabled swift revival of livelihoods.
As per quarterly Periodic Labour Force Survey (PLFS) data, up to March 2021, employment in urban sector affected by the pandemic has recovered almost to the pre-pandemic levels. Employees Provident Fund Organisation (EPFO) data suggests, that not only formalisation of jobs continued during second-COVID-19-wave, but its adverse impact by far on formalization of jobs was also much lower than during the first-COVID-wave. To provide the necessary buffer for the unorganized labour in rural areas during the pandemic, allocation of funds to Mahatma Gandhi National Rural Employment Guarantee Scheme (MGNREGS) has been increased.
As per the latest available data, school infrastructure – both in terms of number of recognized schools & colleges and basic facilities in schools – and teachers' availability reflected in Pupil Teacher Ratio, showed an improvement in 2019-20 over earlier years. Year 2019-20, also witnessed improvement in enrolments rates across upper-primary, secondary, and higher secondary and improvement in dropout rates at all levels. Gross enrolment ratio in higher education recorded at 27.1 percent in 2019-20, was slightly higher from 26.3 percent in 2018-19. Government has undertaken multiple initiatives aimed at revolutionizing the higher education ecosystem by (i) enabling higher vocationalisation, (ii) greater multi-disciplinary research, (iii) providing multiple entry
Social Infrastructure and Employment

344 Economic Survey 2021-22
INTRODUCTION10.1 The need for a strong and resilient social infrastructure became evenmore importantduringtheongoingCOVID-19pandemicthatbrought intofocus thevulnerabilities insocialinfrastructure across countries. Specifically, pandemic posed the challenge of balancinglivelihoodswhilesavinglives.TosavelivesandlivelihoodsamidsttheCOVID-crises,countrieshaveadoptedvariousstrategies.India,thecountrywiththesecondlargestpopulationandalargeelderlypopulation,adoptedamulti-prongedapproach.Giventhenatureofpandemic,thehealthresponse includingvaccinationstrategyremainedcritical. India,oneof theyoungnations intheworld,alsofacedthechallengetosustainthelearningoutcomesinschools,buildingskillsandreskillingpopulation,employmentandlivelihoodtooneofthelargestlabourforcesintheworld.Government’s response through ‘AatmaNirbharBharatAbhiyan’packagesandothersectorspecificinitiativeshaveprovidedthenecessarysupporttomitigatetheadverseimpactofpandemic.
10.2 ThischaptergivesabriefaccountofIndia’shealthresponsetothepandemic,statesthefactsonsocialservicesexpenditure,reviewseducationinfrastructureandoutcomes,listseffortofskilldevelopment,examinestrendsinemployment,takesstockofeffortsmadetoincreasehealth services, andexamines longer termhealth trendsusing latestNationalFamilyHealthSurvey(NFHS)-52019-21data,whilealsoreviewingdrinkingwaterandsanitationaccess,andgivesstatusofruralhousingaccessinthecountry.
INDIA’S HEALTH RESPONSE TO THE COVID-1910.3 Like most other countries, India also faced two COVID-19 waves: first in 2020 andsecondin2021(Figure1).Duringthefirst-wave,thecumulativenumberofCOVID-19casesstartedrisingprogressivelyfromthemonthofMay2020,andpeakedinmid-September2020.Thereafter,thecountryfacedamassivesurgeinCOVID-19casesstartingMarch2021,withapeakofmorethanfourlakhdailycases1inMay2021andmorethan4400dailydeathsinend
and exit points, (iv) promoting globalisation of education, (v) leveraging the potential of Information and Communication Technology (ICT) in teaching and learning process for all learners.
The latest National Family Health Survey-5 showed encouraging outcomes of Government programmes in the health and other social sectors. Total fertility rate (TFR) has come down from 2.2 in 2015-16 to 2 in 2019-21. Significant improvement is seen in the health infrastructure and services reaching the public. Under the Jal Jeevan Mission (JJM), 83 districts in the country have already become ‘Har Ghar Jal’ districts. Government addressed the unprecedented challenges posed by the pandemic, by not only intensifying the delivery and outreach of existing programmes, but also supplementing these by various well targeted and timely new interventions. Consequently, Government spending on social services increased significantly during the pandemic, recording an increase of 9.8 percent over 2020-21.
1TWCIndiaEditTeam.(2020,December19).AsDataShowsClearTrendsofRecovery,IndiaRecordsOneCroreCOVID-19Casesin323Days.

345Social Infrastructure and Employment
ofMay2021.AfreshsurgeofcasesandanewvariantOmicronhadsurfacedinDecember2021andwasspreadingatthetimeofwriting.
Figure 1: Daily COVID-19 Cases and Deaths in India
1
Figure 1: Daily COVID-19 Cases and Deaths in India
Source: World Health Organisation
0
1000
2000
3000
4000
5000
6000
7000
-50000
0
50000
100000
150000
200000
250000
300000
350000
400000
450000
1/14
/202
0
2/14
/202
0
3/14
/202
0
4/14
/202
0
5/14
/202
0
6/14
/202
0
7/14
/202
0
8/14
/202
0
9/14
/202
0
10/1
4/20
20
11/1
4/20
20
12/1
4/20
20
1/14
/202
1
2/14
/202
1
3/14
/202
1
4/14
/202
1
5/14
/202
1
6/14
/202
1
7/14
/202
1
8/14
/202
1
9/14
/202
1
10/1
4/20
21
11/1
4/20
21
12/1
4/20
21
1/14
/202
2
Number of Daily COVID cases
Cases Deaths
Source:WorldHealthOrganisation
10.4 Tosavelives,Governmentadoptedamulti-prongedapproachviz.,(i)restrictions/partiallockdowns,(ii)buildingcapacityinhealthinfrastructure,(iii)COVID-19appropriatebehaviour,testing,tracing,treatment,and(iv)vaccinationdrive.Measuresweretakentobreakthechainof transmissionintermsofcontainmentandbufferzones;perimetercontrol;contact tracing;isolationandtestingofsuspectcasesandhigh-riskcontacts,andcreationofquarantinefacilities.Preventivestrategychangedinresponsetothechangingsituationobservedbasedonreal-timedataandevidence.Testingcapacityinthecountryincreasedexponentially.TestsforCOVID-19werealsomadefreeinallgovernmentcenters.RapidAntigenTestkitsforfasterscreeningwereintroduced.ManufacturingcapacityofN-95masks,ventilators,personalprotectiveequipmentkits, sanitizers were ramped up in a mission mode.Massive infrastructure was created forisolationbeds,dedicatedintensivecareunitbeds,andsupplyofmedicaloxygen.TomeettheexponentialriseinmedicaloxygendemandduringsecondCOVIDwave,governmentengagedevenrailways,AirForce,Navyandindustry.Inthefightagainstcoronavirus,COVIDvaccinesemergedbestshieldagainstthediseasetosavelivesandsustainlivelihood.
COVID Vaccination Strategy
10.5 Guidedbyscientificandepidemiologicalevidence,WorldHealthOrganisation (WHO)guidelinesandglobalbestpractices,India’sNationalCOVIDVaccinationProgramhasbeenoneoftheworld’slargestvaccinationprograms2.NationalExpertGrouponVaccineAdministrationforCOVID-19(NEGVAC)onthebasisofconcurrentscientificevidenceguidedtheprogram.Theprogramwasenvisionedtovaccinatealleligiblebeneficiariesaged18yearsandaboveintheshortestpossibletime.
10.6 “TheLiberalizedPricingandAcceleratedNationalCOVID-19VaccinationStrategy”,wasimplementedfrom1stMayto20thJune2021.Underthestrategy,States/UnionTerritories(UTs)
2GuidelinesforCOVID-19vaccinationofchildrenbetween15-18yearsandprecautiondosetohealthcareworkers(HCWs),Frontlineworkers(FLWs)&60+populationwithcomorbidities

346 Economic Survey 2021-22
andprivatehospitalswereallowedtoprocureCOVID-19vaccinedirectlyfrommanufacturers.Government of India procured 50 percent of monthly vaccine production by the domesticmanufacturers,whiletheStateGovernmentsandprivatehospitalsprocuredremaining50percentdoses.However,basedonreal-timefeedback,itwaschangedto“TheRevisedGuidelinesforImplementationofNationalCOVIDVaccinationProgram”implementedfrom21stJune2021,whereby,GovernmentofIndiaprocured75percentofmonthlyvaccineproductionandprovidedfreetoStatesandUTs,whilerestcouldbeprocuredbyprivatehospitals.
10.7 Availability of Vaccine:IndiaisamongfewcountriesproducingCOVIDvaccines.Thecountrystartedwith twoMade in IndiaCOVID vaccines. India’s first domesticCOVID-19vaccine,Whole Virion Inactivated Corona Virus Vaccine (COVAXIN), was developed andmanufacturedbyBharatBiotechInternationalLimitedincollaborationwithNationalInstituteofVirologyof IndianCouncil ofMedicalResearch (ICMR).The ICMRfunded the clinicaltrials of theCOVISHIELD vaccine developed in collaborationwithOxford –AstraZeneca.COVISHIELDandCOVAXINhavebeenwidelyusedvaccinesinIndia.Everymonthabout250-275milliondosesofCOVISHIELDand50-60milliondosesofCOVAXINhavebeenproduced3. COVISHIELD, COVAXIN and COVOVAX have also received emergency authorizationapproval from WHO. Besides, manufacturing of COVID-19 vaccines viz., Sputnik-V,ZyCoV-D,recombinant(Ad26.COV2-S)havealsobeengivenemergencyuseauthorizationbytheregulatoryauthority.Moreover,importofCOVID-19Vaccinesviz.,Sputnik-V,Moderna,andrecombinant(Ad26.COV2-S)havealsobeenpermitted.
10.8 Pricing and equity:AtallGovernmentCOVID-19VaccinationCentres(CVCs),COVID-19vaccinewasmadeavailablefreeofcostforalleligiblecitizens.Exceptforabout4-5percentoftotaldosesadministeredinthecountry,resthavebeenadministeredatGovernmentCOVID-19VaccinationCentres.UnionBudgetfor2021-22allocated`35,000croreforprocurementunderCOVID-19VaccinationProgram.DistributionofCOVIDvaccinetoallwithoutdiscriminationhasalsobeenimportantfeatureofthevaccinationprogram.OutoftotaladministereddosesofCOVID-19vaccines,49percenthavebeenadministeredtofemales;morethan70percentofvaccinedoseshavebeenadministeredatCVCslocatedinruralareas.
10.9 Coverage:Inthefirstphase(from16thJanuaryto1stMarch2021)COVID-19vaccinesweregiventoHealthCareWorkersandFrontlineworkers.Insecondphase(from1stMarchonward),COVIDvaccineswereextendedtopersonsover45yearsofagewithspecifiedco-morbiditiesandthoseaged60yearsandabove.From1stApril,2021,coveragewasfurtherextendedtoallcitizensaged45yearsandabove.From1stMay2021,all94crorepersonsofage18yearsandabove,weremadeeligibleforCOVIDvaccination.From3rdJanuary2022,COVID-19vaccinecoveragehasbeen extended to age-groupof15-18years.Till 19th January2022,3.73 croreyoungstersbetween15-18agegrouphavebeenvaccinatedwith1stdoseofCOVID-19vaccinecoveringmore than50percentofyoungsters.Further, from10th January,2022,HealthCareWorkers,FrontLineWorkers andpersonsagemore than60yearswith co-morbiditieshavebeenmade eligible to receive a precaution dose ofCOVID-19vaccine, on completion of 9monthsor39weeksfromthedateofadministrationof2nddose.AsonJanuary19,2022,56.66lakhprecautionarydoseshavebeenadministeredtohealthcareworkers,frontlineworkersandpersonsover60yearsofage.3UpdateonCOVID-19VaccineManufacturingCapacity(PIB:14December2021),Accessedinhttps://pib.gov.in/PressReleaseIframePage.aspx-?PRID=1781267)

347Social Infrastructure and Employment
10.10 Vaccine hesitancy: MisconceptionsabouttheCOVID-19vaccinemakepeoplehesitantto take vaccines. To reduce vaccine hesitancy, Government made efforts which includeawarenessthroughmediachannels,radiojockeys,op-edsandarticlesbyidentifiedexpertsanddisseminationoffact-checkvideosbykeyexpertstoprovidecorrect&factualinformation.From3rdNovember2021,acampaign,‘HarGharDastak’,hasbeeninitiatedtoidentifyandvaccinatethosewhomissed1stdoseandduefor2nddosethroughhouse-to-housemobilisationactivity.Vaccinealsoadministeredtobeneficiariesattheirhomesthroughmobileteamsviz.,‘vaccinationtoli’alongwith‘prachartoli’.Interstatecompetitionforcoverage,conductingvaccinationcampatBazaarHaats,utilizationofsocialmediatocounteranti-vaccinerumours,messagingthroughinfluentialpersonsandotherinnovativeapproacheshavehelpedinvaccination.
10.11 Technology driven:ArogyaSetumobileappwas launched toenablepeople toassessthemselvestheriskoftheircatchingtheCOVID-19infection.Itcalculatestheriskofinfectionbasedonaperson'sinteractionwithothers,usingBluetoothtechnology,algorithmsandartificialintelligence.
10.12 Co-WIN 2.0 (along with e-VIN), a unique digital platform, supported the real-timevaccinationactivitiesviz.,registrationforvaccine,trackingCOVID-19vaccinestatusofeverybeneficiary, stocks of vaccine, storage, actual vaccination process, and generation of digitalcertificates.
10.13 Vaccination Progress: As on 16th January 2022, a total of 156.76 crore doses ofCOVID-19 vaccines have been administered: 90.75 crore first dose and 65.58 crore seconddose.Vaccinationspeedincreasedsignificantlyoncethepopulationbetweenages18to45yearswaspermitted(Figure2).Outoftotaldosesadministered,largest60percentareintheagegroup18-45,followedby25percenttoagegroup45-59yearand15percenttoaged60years&above(Figure3).
Figure 2: Weekly COVID-19 vaccine doses by age in India
1
Figure 2: Weekly COVID-19 vaccine doses by age in India
Source: Ministry of Health & Family Welfare
050
100150200250300350400450500
16 Ja
n-22
Jan
23 Ja
n-29
Jan
30 Ja
n-05
Feb
06 F
eb-1
2 Fe
b13
Feb
-19
Feb
20 F
eb-2
6 Fe
b27
Feb
-05
Mar
06 M
ar-1
2 M
ar13
Mar
-19
Mar
20 M
ar-2
6 M
ar27
Mar
-02
Apr
03 A
pr-0
9 Ap
r10
Apr
-16
Apr
17 A
pr-2
3 Ap
r24
Apr
-30
Apr
01 M
ay-0
7 M
ay08
May
-14
May
15 M
ay-2
1 M
ay22
May
-28
May
29 M
ay-0
4 Ju
n05
Jun-
11 Ju
n12
Jun-
18 Ju
n19
Jun-
25 Ju
n26
Jun-
02 Ju
l03
Jul-0
9 Ju
l10
Jul-1
6 Ju
l17
Jul-2
3 Ju
l24
Jul-3
0 Ju
l31
Jul-0
6 Au
g07
Aug
-13
Aug
14 A
ug-2
0 Au
g21
Aug
-27
Aug
28 A
ug-0
3 Se
p04
Sep
-10
Sep
11 S
ep-1
7 Se
p18
Sep
-24
Sep
25 S
ep-0
1 Oc
t02
Oct
-08
Oct
09 O
ct-1
5 Oc
t16
Oct
-22
Oct
23 O
ct-2
9 Oc
t30
Oct
-05
Nov
06 N
ov-1
2 No
v13
Nov
-19
Nov
20 N
ov-2
6 No
v27
Nov
-03
Dec
04 D
ec-1
0 De
c11
Dec
-17
Dec
18 D
ec-2
4 De
c25
Dec
-31
Dec
01 Ja
n-07
Jan
08 Ja
n-14
Jan
COVI
D Va
ccin
e Do
ses (
in L
akh)
15-17 18-45 45-60 Above 60Phase-I:Health Care Workers& Front-Line Workers
Phase-II:age 45 years & above with comorbodities
and 60 +
1st May 2021 all citizens aged 18 years and above
From 3 January, 22 Age-group of 15-18 years
Source:MinistryofHealth&FamilyWelfare

348 Economic Survey 2021-22
Figure 3: Distribution of vaccines by age group (as on 16th January, 2022)
1
Figure 3: Distribution of vaccines by age group (as on 16th January, 2022)
Source: Ministry of Health & Family Welfare: https://dashboard.cowin.gov.in/
Age 18-45 years (60 %)
Age 46-60 years (25 %)
Age above 60 years (15 %)
Source:MinistryofHealth&FamilyWelfare:https://dashboard.cowin.gov.in/
Map 1: Percent of adult population who have been administered the first Dose of COVID-19 vaccine (as on 31st December 2021)
Source:MinistryofHealth&FamilyWelfare,Govt.ofIndia Note: These are number of doses administered in the states and not the number of persons residinginthestatetowhomthedoseshavebeenadministered.

349Social Infrastructure and Employment
Map 2: Percent of Adult population who have been administered the Second Dose of COVID-19 vaccine (as on 31st December 2021)
Source:MinistryofHealth&FamilyWelfare,Govt.ofIndiaNote:Thesearenumberofdosesadministeredinthestatesandnotthenumberofpersonsresidinginthestatetowhomthedoseshavebeenadministered.
10.14 State’s vaccination coverage of adult population as on 31stDecember 2021 is giveninMap-1(firstdose)andMap-2(seconddose).Indiaisamongfewlargecountrieswhohavevaccinated large part of their population againstCOVID-19 virus.As on 16 January 2022,eligiblepopulation(18yearandabove)vaccinatedinIndiawithfirstdosewas93percentandwithseconddose69.8percent(Figure4).AsperWHOdata,ason2ndweekofJanuary2022,66.3percentand48.3percentofthetotalpopulationinIndiaisvaccinatedwithfirstandseconddosesrespectively.InIndonesia,populationvaccinatedwithfirstdoseis64.9percentandwithseconddose44.3percent,whileinChina,populationvaccinatedwithfirstdoseis86percentandwithseconddose83.3percent(Figure5).

350 Economic Survey 2021-22
Figure 4: Cumulative Percent of Adult Population with COVID-19 Vaccine
1
Figure 4: Cumulative Percent of Adult Population with COVID-19 Vaccine
Source: Ministry of Health and Family Welfare, Government of India (as on 16 January, 2022) Note: Target as per Registrar General of India estimates: 93,90,39,000.
0.4 1.35.9
13.518.2
29.4
39.1
53.6
69.2
78.084.0
90.0 93.0
3.0 4.8 6.311.0
16.1
25.6
35.2
48.1
64.669.8
0
10
20
30
40
50
60
70
80
90
100
Jan, 21 Feb March April May June July August Sept Octo Nov Dec, 21 Jan, 22
COVI
D-19
Vac
cine C
over
age
(in %
)
% of adult population with First dose % of adult population with Second dose
Source:MinistryofHealthandFamilyWelfare,GovernmentofIndia(ason16January,2022) Note:TargetasperRegistrarGeneralofIndiaestimates:93,90,39,000.
Figure 5: Population vaccinated by country (in percent)
1
Figure 5: Population vaccinated by country (in percent)
Source: World Health Organization Note: Status is as on first 2 weeks of January 2022.
86.0
85.4
80.0
76.4
76.1
74.9
74.6
66.3
64.9
32.8
83.3
73.4 78
.7
70.1
68.1
61.5
71.9
48.3
44.3
27.7
C H I N A A R G E N T I N A J A P A N U K B R A Z I L U S A G E R M A N Y I N D I A I N D O N E S I A S O U T H A F R I C A
% vaccinated with First Dose % Fully Vaccinated
Source:WorldHealthOrganization Note:Statusisasonfirst2weeksofJanuary2022.
Box 1: Some initiatives taken to fight against COVID-19
Laboratory network:Asof24thNovember2021,atotalof1346governmentlaboratoriesand1701Private Laboratories (3047 laboratories in total) are conductingCOVID-19 testing. So far as on20.01.2022,Indiaconducted70.93croretotalCOVIDtests;On20.01.2022,Indiaconducted19.35lakhCOVIDtests.
Medical Oxygen Plants:DefenceResearchandDevelopmentOrganisation(DRDO)wasentrustedwith installingandcommissioning931MedicalOxygenPlants in869hospitalsacross thenationwithin sixmonths, funded throughPM-CARESfund.Theseplantsweredesignedanddevelopedbased on the spin-off technology of Onboard Oxygen Generation System (OBOGS) of India’sindigenousfighteraircraftTejas.
Oxy-Care System: DRDO developed SPO2 basedOxygen Cylinder Controller (SPOCC) basedMedicalOxygenCylinderstooptimallyusetheavailablemedicaloxygenforCOVID-19patients.Thissystemsuppliesquantityofoxygenbasedonindividual’sSPO2levels.Thistechnologywas
351Social Infrastructure and Employment
transferredtoM/sBharatForgeLtdandM/sUFLOWautomation.Theyhavesupplied1.5lakhssuchsystemstoGovernmenthospitalsacrossthecountry.
Anti-COVID Drug:Ananti-COVID-19therapeuticapplicationofthedrug2-deoxy-D-glucose(2-DG)incollaborationwithDr.Reddy’sLaboratories,Hyderabadwasformulated.BasedonresultsofPhase-IIandPhase-IIIclinicaltrials,DrugControllerGeneralofIndia(DCGI)grantedpermissionforEmergencyUseof2-DGasadjuncttherapyinmoderatetosevereCOVID-19patients.Thedrugcomesinpowderforminsachet,whichistakenorallybydissolvingitinwater.DRDOhastransferreditspatentedprocesstechnologyto13majorPharmaindustries.
TRENDS IN SOCIAL SECTOR EXPENDITURE 10.15 Government’sspendingonsocialservicesincreasedsignificantlyduringthepandemic.In2021-22 (BE),Centre andStategovernments earmarkedanaggregateof` 71.61 lakhcrore forspendingonsocialservicesector[Table1];anincreaseof9.8percentover2020-21.Lastyear’s(2020-21) revised expenditure has also gone up by ` 54,000 crore from the budgeted amount.In2021-22(BE),fundstothesectorincreasedto8.6percentofGrossDomesticProduct(GDP)(8.3percentin2020-21).Duringthelastfiveyears,socialservicesaccountedforabout25percentofthetotalGovernmentexpenditure(CentreandStatestakentogether).In2021-22(BE), itwas 26.6percent.
10.16 Although, the pandemic has affected almost all social services, yet the health sectorwastheworsthit.Expenditureonhealthsector increasedfrom`2.73lakhcrore in2019-20(pre-COVID-19)to`4.72lakhcrorein2021-22(BE),anincreaseofnearly73percent.Fortheeducationsector,theincreaseduringsameperiodwas20percent.
10.17 InadditiontotheNationalHealthMission,UnionBudget2021-22,announcedAyushmanBharatHealth InfrastructureMission,anewCentrallySponsoredScheme,withanoutlayofabout`64,180croreinnextfiveyearstodevelopcapacitiesofprimary,secondary,andtertiarycareHealthSystems,strengthen existing national institutions, and create new institutions tocater to detection and cure of new and emerging diseases. Besides,UnionBudget 2021-22providedanoutlayofRs35,000croretowardsCOVID-19vaccination.
10.18 TheNationalHealthPolicy,2017envisagedtoincreasegovernment’shealthexpenditureto2.5percentofGDPby2025.Inkeepingwiththisobjective,CentralandStateGovernments’budgetedexpenditureonhealthsectorreached2.1percentofGDPin2021-22,against1.3percentin2019-20.

352 Economic Survey 2021-22
Table 1: Trends in Social Service Sector Expenditure by General Government (Combined Centre and States)
Item 2014-15 2015-16 2016-17
2017-18
2018-19
2019-20
2020-21
(RE)
2021-22
(BE)
(` in lakh crore)
TotalBudgetaryExpenditure
32.85 37.61 42.66 45.16 50.41 54.11 65.24 71.61
Expenditure onSocialServices:
7.68 9.16 10.41 11.40 12.78 13.65 16.34 19.06
i)Education 3.54 3.92 4.35 4.83 5.26 5.80 6.21 6.97
ii)Health 1.49 1.75 2.13 2.43 2.66 2.73 3.50 4.72
iii)Others 2.65 3.48 3.93 4.13 4.86 5.13 6.63 7.37
(As percentage to GDP)
Expenditure onSocialServices:
6.2 6.6 6.8 6.7 6.8 6.7 8.3 8.6
i)Education 2.8 2.8 2.8 2.8 2.8 2.8 3.1 3.1
ii)Health 1.2 1.3 1.4 1.4 1.4 1.3 1.8 2.1
iii)Others 2.1 2.5 2.6 2.4 2.6 2.5 3.4 3.3
(As percentage to total expenditure)
Expenditure onSocialServices:
23.4 24.3 24.4 25.2 25.4 25.2 25.0 26.6
i)Education 10.8 10.4 10.2 10.7 10.4 10.7 9.5 9.7
ii)Health 4.5 4.7 5.0 5.4 5.3 5.0 5.4 6.6
iii)Others 8.1 9.3 9.2 9.1 9.6 9.5 10.2 10.3
(As percentage to social services)
i)Education 46.1 42.8 41.8 42.4 41.2 42.5 38.0 36.6
ii)Health 19.4 19.1 20.5 21.4 20.8 20.0 21.4 24.7
iii)Others 34.6 38.0 37.7 36.2 38.0 37.6 40.6 38.7
Source:ReserveBankofIndia,BudgetDocumentsofUnionandStateGovernmentsNote:• BudgetEstimate(BE)&RevisedEstimate(RE).• Social services include, education, sports, art and culture;medical andpublic health, familywelfare;water supplyandsanitation;housing;urbandevelopment;welfareofSCs,STsandOBCs,labourandlabourwelfare; socialsecurityandwelfare,nutrition,reliefonaccountofnaturalcalamitiesetc.• Expenditureon‘Education’pertainstoexpenditureon‘Education,Sports,ArtsandCulture’.• Expenditureon ‘Health’ includesexpenditureon ‘MedicalandPublicHealth’, ‘FamilyWelfare’and ‘Water SupplyandSanitation’.• TheratiostoGrossDomesticProduct(GDP)atcurrentmarketpricesarebasedon2011-12base.• ProjectedGDPforBE2021-2022isRs222,87,379crore.

353Social Infrastructure and Employment
EDUCATION 10.19 Itisdifficulttogaugetherealtimeimpactofrepeatedlockdownsoneducationsectorbecausethelatestavailablecomprehensiveofficialdatadatesbackto2019-20.Thisprovidesthelongertimepre-COVIDtrendsbutdoesnottellushowthetrendmayhavebeenimpactedbyCOVID-19inducedrestrictions.
10.20 DuringinitialCOVID-19restrictions,asaprecautionarymeasuretoprotectthestudentsfromCOVID-19,schoolsandcollegeswereclosedacrossIndia4.ThisposedanewchallengefortheGovernmentintermsofcontinuityofeducation.
School Infrastructure
10.21 Anassessmentforthepre-pandemicyearof2019-20forwhichdataisavailablerevealsthatthenumberofrecognizedschools&collegescontinuedtoincreasebetween2018-19and2019-20,exceptforprimary&upperprimaryschools5(Table2).
Table 2: Total number of schools, colleges, and universities in India
Particulars 2018-19 2019-20
Primary&UpperPrimaryschools(inlakhs) 12.37 12.22
SecondaryandSr.SecondarySchools(inlakhs) 2.76 2.85
Colleges(numbers) 39931 42343
Universities(numbers) 993 1043
Source:MinistryofEducation
10.22 Basicfacilitiesinschoolsalsoimprovedin2019-20overearlieryears(Figure6).Toilets(girlsorboys),drinkingwater,andhand-washingfacilitiesarenowavailableinmostofGovernmentschools(10.32lakh)6.PrioritytodrinkingwaterandsanitationinschoolsunderJalJeevanMission,Swachh BharatMission as well as under Samagra Shiksha Scheme have been instrumental inprovidingrequiredresourcesandcreatingtheseassetsinschools.Ason19.01.2022,underJalJeevanMission 8,39,443 schools were provided tap water supply. Computers and digital connectivity,however,remainedlow.UndertheInformation&CommunicationTechnology(ICT)componentoftheSamagraShikshaScheme,Governmentsupportstheestablishmentofsmartclassrooms,andICTlabsinschools,includingsupportforhardware,educationalsoftwareande-contentforteaching.
10.23 Further, availability of teachers, measured by Pupil Teacher Ratio, an indicator whosedecreasesignalsimprovementinqualityofeducation,hasimprovedatalllevelscontinuouslyfrom2012-13to2019-20:from34to26atprimary,23to18atupperprimary,30to18atsecondary,and39to26athighersecondarylevel.Theimprovementinthenumberofschools,teachers’availability,andfacilitiesinschoolsisexpectedtohelpimproveenrolmentandreducedropoutrates.
4After15October2020,State/UTGovernmentsweregiventheflexibilityforre-openingofschoolsandcoachinginstitutionsinagradedmanner.515000Primary&UpperPrimaryschoolsdeclined.6UDISE+datacomeswithmorethanone-yearlag;sodataisavailableupto2019-20.

354 Economic Survey 2021-22
Figure 6: Schools with Basic Facilities (in percent)
1
Figure 6: Schools with Basic Facilities (in per cent)
Source: Ministry of Education (Unified District Information System for Education plus (UDISE+), 2019-20)
88.7
67.8
36.3
69.2
54.661.1
22.2
6.2
96.9 95.990.2
84.1 83.4 82.3
38.5
22.3
Girl's toilet Boy's toilet Hand washfacility
Library/reading room/reading corner
Electriicty Medicalcheckup inschools in a
year
Computer Internet
2012-13 2019-20
Source:MinistryofEducation(UnifiedDistrictInformationSystemforEducationplus(UDISE+,2019-20)
School Enrolment
10.24 In2019-20,26.45crorechildrenwereenrolledinschools.Duringtheyear,schoolsenrolledabout42lakhadditionalchildren,outofwhich26lakhwereinprimarytohighersecondary levels and 16 lakhwere in pre-primary as per UnifiedDistrict InformationSystem for Education plus (UDISE+) database7. The enrolments increased across alllevels8viz.,upper-primary,secondary,andhighersecondary,exceptforprimarylevel.Atprimarylevel,enrolmentreducedfrom13.5crorein2012-13to12.2crore2019-20.Thisdeclineinenrolmentwasbecauseofdeclineintotalnumberofchildrenintheagegroup6-10years9.
10.25 Year 2019-20 saw improvement in gross enrolment ratios (GER)10 at all levels andimprovementingenderparity.GERinprimary–enrolmentinclass1stto5thasapercentageofpopulationinage6to10years-forgirlsaswellasboyshaveimprovedin2019-20.Thisimprovementhasreversedthedecliningtrendsbetween2016-17and2018-19(Figure7.a).GERinupper-primary(enrolmentinclass6to8asapercentofpopulationinage11-13years),whichwasstagnantbetween2016-17and2018-19,improvedin2019-20(Figure7.b).GERforboysandgirlsinSecondary(9th&10th)havealsoimprovedin2019-20(Figure8).Incorrespondingagegroups inPrimaryandUpper-primary levels,girls'GERarebetter thanboys' (UDISE+,2019-20).
7TheUnifiedDistrictInformationSystemforEducationplus(U-DISE+)collectsdataonvariousindicatorsonschooleducation.ForthepurposeofthisreportschoolswithPrimaryorUpperPrimaryclasseshavebeenreferredtoas‘ElementarySchools’8Levelsofeducation:Primary(1-5thStd),Upperprimary(6-8thStd),Secondary(9&10thStd),Highersecondary(11&12thStd).9ReportonUDISE+,2019-2010GERisdefinedastotalenrolmentinaparticularlevelofschooleducation,regardlessofage,expressedasapercentageofthepopulationoftheofficialage-groupwhichcorrespondstothegivenlevelofschooleducationinagivenschoolyear.

355Social Infrastructure and Employment
Figure 7: School Gross Enrolment Ratios in India (in percent)
(a) Primary level (b) Upper Primary level
1
Figure 7: School Gross Enrolment Ratios in India (in percent)
Source: Ministry of Education (UDISE+) Note: GER greater than 100 percent might represent presence of over or under age children in a particular level of education.
108
107
107
104
103
102
104
107
106
107
104
103
101 10
2
107
107
107
104
103
101 10
3
2 0 1 3 -1 4
2 0 1 4 -1 5
2 0 1 5 -1 6
2 0 1 6 -1 7
2 0 1 7 -1 8
2 0 1 8 -1 9
2 0 1 9 -2 0
( a ) P r ima r y le ve l
Girls Boys Overall
89
90
91
89 89
89
90
85
87
88
87 87 87
89
87
88
89
88 88 88
90
2 0 1 3 -1 4
2 0 1 4 -1 5
2 0 1 5 -1 6
2 0 1 6 -1 7
2 0 1 7 -1 8
2 0 1 8 -1 9
2 0 1 9 -2 0
(b ) U p p e r P r i m a r y l e v e l
Girls Boys Overall
Source:MinistryofEducation(UDISE+)Note:GERgreaterthan100percentmightrepresentpresenceofoverorunderagechildreninaparticularlevelofeducation.
Figure 8: School Gross Enrolment Ratios in India: Secondary level (in percent)
1
Figure 8: School Gross Enrolment Ratios in India: Secondary level (in percent)
Source: Ministry of Education (UDISE+)
73
76
77
76 76
77
78
74
76
77
77 77 77
78
74
76
77
76 76
77
78
2 0 1 3 -14 2014 -15 2015 -16 2016 -17 2 0 1 7-18 2 0 1 8-19 2019 -20
Girls Boys Overall
Source:MinistryofEducation(UDISE+)
School Drop-out
10.26 Year2019-20sawdeclineindropoutrates11atprimary,upper-primary,andsecondarylevels. In 2019-20, school dropout rate at primary level declined to 1.45 percent from4.45percent in2018-19.Thedecline is forbothgirlsandboys (Figure9a).Thedeclinehasalsoreversedthetrendsofincreasingdropoutratesduringprevioustwoyears:2017-18&2018-19.Inupper-primary,drop-outratesforgirlsandboyshavecontinuouslydeclinedsince2017-18(Figure9b).Similarly,insecondaryalso,declineindropoutratesiscontinuoussince2016-17,bothforgirlsandboys(Figure10)12.
11Dropoutrateisdefinedasproportionofpupilfromacohortenrolledinagivenlevelatagivenschoolyearwhoarenolongerenrolledatanygradeinthefollowingschoolyear.12TheschemessuchasSarvaShikshaAbhiyan,RTEAct,improvementinschoolinfrastructureandfacilities,residentialhostelbuildings,availabilityofteachers,regulartrainingofteachers,freetextbooks,uniformstochildren,KasturbaGandhiBalikaVidyalayaSchemeandtheMidDayMealSchemeplayimportantroleinenhancingenrolmentandretentionofchildreninschools.

356 Economic Survey 2021-22
Figure 9: School Dropout Rates in India (in percent)
(a) Primary level (b) Upper Primary level
1
Figure 9: School Dropout Rates in India (in percent)
Source: Ministry of Education (UDISE+)
2.66 2.7 2.
89
2.07
3.33
4.3
1.22
3.27
3.14 3.
31
2.56
3.68
4.59
1.67
2.98
2.93 3.
1
2.32
3.51
4.45
1.45
2 0 1 3 -1 4
2 0 1 4 -1 5
2 0 1 5 -1 6
2 0 1 6 -1 7
2 0 1 7 -1 8
2 0 1 8 -1 9
2 0 1 9 -2 0
(a )P r im ar y l e ve l
Girls Boys Overall
6.02
5.43
5.21
4.09
5.57
5.14
2.96
4.78
4.14
4.1
2.97
4.49
4.26
2.22
5.38
4.77
4.64
3.51
5.02
4.68
2.58
2 0 1 3 -1 4
2 0 1 4 -1 5
2 0 1 5 -1 6
2 0 1 6 -1 7
2 0 1 7 -1 8
2 0 1 8 -1 9
2 0 1 9 -2 0
( b ) U p p e r P r ima r y le ve l
Girls Boys Overall
1
Figure 9: School Dropout Rates in India (in percent)
Source: Ministry of Education (UDISE+)
2.66 2.7 2.
89
2.07
3.33
4.3
1.22
3.27
3.14 3.
31
2.56
3.68
4.59
1.67
2.98
2.93 3.
1
2.32
3.51
4.45
1.45
2 0 1 3 -1 4
2 0 1 4 -1 5
2 0 1 5 -1 6
2 0 1 6 -1 7
2 0 1 7 -1 8
2 0 1 8 -1 9
2 0 1 9 -2 0
(a )P r im ar y l e ve l
Girls Boys Overall
6.02
5.43
5.21
4.09
5.57
5.14
2.96
4.78
4.14
4.1
2.97
4.49
4.26
2.22
5.38
4.77
4.64
3.51
5.02
4.68
2.58
2 0 1 3 -1 4
2 0 1 4 -1 5
2 0 1 5 -1 6
2 0 1 6 -1 7
2 0 1 7 -1 8
2 0 1 8 -1 9
2 0 1 9 -2 0
( b ) U p p e r P r ima r y le ve l
Girls Boys Overall
Source:MinistryofEducation(UDISE+)
Figure 10: Drop Out Rate: Secondary level (in percent)
1
Figure 10: Drop Out Rate: Secondary level (in percent)
Source: Ministry of Education (UDISE+)
20.9
3
20.2
3
18.7
5 21.5
18.6
6
17.0
5
15.0
5
20.3
5
19.8
2
18.9
3 21.4
7
19.1
6
18.6
8
17.0
1
20.6
3
20.0
2
18.8
4 21.4
9
18.9
3
17.9
16.0
7
2 0 1 3 - 1 4 2 0 1 4 - 1 5 2 0 1 5 - 1 6 2 0 1 6 - 1 7 2 0 1 7 - 1 8 2 0 1 8 - 1 9 2 0 1 9 - 2 0
Girls Boys Overall
Source:MinistryofEducation(UDISE+)
10.27 ThepandemichashadasignificantimpactontheeducationsystemaffectinglakhsofschoolsandcollegesacrossIndia.SincethedatafromMinistryofEducationisonlyavailableupto2019-20,theimpactofpandemiconenrolmentanddropoutratesduringpandemicyears,2020and2021,couldnotbeassessedthroughcomprehensiveofficialdata.Thus,policymakershavetakenintoaccountalternatesources.VarioussmallersurveysbytheGovernment,andbycitizen-lednon-governmentagencies,suchastheAnnualStatusofEducationReport(ASER)2021,haveassessedtheimpactduringpandemicfortheeducationsectorinruralareas.Weareawarethatsuchdatahaslimitationbutininterestofbeinguptodatethisdatahasbeenincludedbelow.
10.28 ASERfoundthatdespitethepandemic,enrolmentinagecohortof15-16yearscontinuedtoimproveasnumberofnotenrolledchildreninthisagegroupdeclinedfrom12.1percentin2018to6.6percentin2021(Table3).

357Social Infrastructure and Employment
10.29 However,ASER (Rural) report also found that during pandemic, children (age 6-14years)‘notcurrentlyenrolledinschools’increasedfrom2.5percentin2018to4.6percentin202113.The enrolment declinewas relatively large among theyounger agegroup (age7-10year); decline of enrolment for younger boyswas higher than girls.The drop in enrolmenthappenedin2020,althoughithasremainedstablein2021.Toidentifyoutofschoolchildren,theirmainstreaming, and resource sharing,Government sharedCOVID-19 action planwithStatesandUTsoutliningtheroleoflocalbodies,formationofnodalgroupatvillage/townlevel,conductingdoor-to-door/helpdesk-based/app-basedsurvey.
10.30 ASERreportalsofoundthatduringpandemic,childreninruralareashavemovedoutofprivatetogovernmentschoolsinallthreeagegroups(Table3).Possiblereasonssuggestedfortheshiftare:shutdownoflow-costprivateschools14,financialdistressofparents,freefacilitiesingovernmentschools,andfamiliesmigratingbacktovillages15.Disproportionatelyhighfeeinprivateschoolscouldalsobestimulatingthisshift.Ifthetrendholds,publicschoolsneedtobeequippedwithadditionalsupport,intermsofteacher-pupilratio,classroomspace,andteaching/learningmaterials,toabsorbstudentsmigratingfromprivateschoolsandfromurbantoruralareas.InJuly2020,governmenthasissuedguidelinesformainstreamingofchildrenofmigrantlabourers,allowingfortheirsmoothadmissionsintoschoolswithoutaskingforanydocumentsotherthanidentity.
Table 3: Children enrolled in schools by age group and school type in Rural areas (in percent)
Age (years)
Annual Status of Education Report 2018 Annual Status of Education Report 2021
Govt. Private Others Not Enrolled
Govt. Private Others Not Enrolled
6-14All 64.3 32.5 0.7 2.5 70.3 24.4 0.7 4.6
7-10All 64.4 33.5 0.7 1.4 70.3 24.8 0.6 4.4
7-10Boys 60.6 37.4 0.7 1.4 67.9 26.9 0.5 4.7
7-10Girls 68.4 29.5 0.7 1.4 72.8 22.3 0.7 4.1
11-14All 64.1 32 0.8 3.2 70.5 24.5 0.8 4.1
11-14Boys 60.5 35.9 0.7 2.9 67.5 27.3 0.9 4.3
11-14Girls 67.6 28 0.8 3.6 73.9 21.5 0.7 3.9
15-16All 57.4 29.9 0.6 12.1 67.4 25.2 0.9 6.6
15-16Boys 55.9 32.2 0.5 11.5 66.7 26.3 0.9 6.1
15-16Girls 58.9 27.8 0.7 12.6 68.1 24 0.8 7.1
Source:AnnualStatusofEducationReport2021(Non-governmentsource)Note: ‘Other’ includeschildrengoing toMadarsaandEducationGuaranteedSchemes, ‘Not enrolled’ includeschildrenwhoneverenrolledorarenotcurrentlyenrolled.
13AnnualStatusofEducationReport(ASER)2021studied76,706householdsandreached75,234children(age5-16)inallruraldistrictsofIndiaduringSeptemberandOctober2021.ThesurveywasalsoconductedduringSeptember2020.14AlamAndaleebandPriyamvadaTiwari(2021),“ImplicationsofCOVID-19forLow-costPrivateSchools”,UNICEF:https://www.unicef.org/globalinsight/reports/implications-COVID-19-low-cost-private-schools15BanerjiRukmini&WadhwaWilima(2021),“TheCOVIDeffect:ChangingpatternsinpublicandprivateinputsintoschoolinginruralIndia”,ASER2021

358 Economic Survey 2021-22
10.31 The access to education, school drop outs, learning gaps especially for children frommarginalizedcommunitieshavealwaysremainedmajorchallengesineducation.Whenschoolswere closed during pandemic, online learning became themost safe and prominentmode oflearning.AspertheASERstudy,existingdigitaldivide,however,exacerbatedtheequityinaccesstoeducation.Although,theavailabilityofsmartphoneshasincreasedfrom36.5percentin2018to67.6percentin2021,studentsinlowergradefounditdifficulttodoonlineactivitiescomparedtohigher-gradestudents.Non-availabilityofsmartphones,non-availabilityofphoneforchildtouse,andnetworkorconnectivityissueswerethechallengesfacedbychildren(ASERstudy).
10.32 Though Government data to corroborate these observations is not available, stepshavebeentakenbytheGovernment tominimise theadverse impactof thepandemicontheeducation system to address the concerns raised through private studies undertaken duringthe pandemic period. Almost all enrolled children have textbooks for their current grade (91.9percent).Thisproportionhasincreasedoverthelastyear,forchildrenenrolledinbothgovernment and private schools.Also, 46.4 percent children in reopened schools receivedlearning materials/activities as compared to 39.8 percent children whose schools had notreopened.Further,toovercomethechallengeofdigitaldivideandtocontinuelearningduringpandemic,Governmenttookmeasuressuchasdistributionoftextbooksathomes,telephonicguidance by teachers, online and digital content through TV and radio, TARA interactiveChatbot,activity-basedlearningthroughtheAlternateAcademicCalendarreleasedbyNationalCouncilofEducationalResearchandTraining(NCERT)(Box2).
Box 2: Major Initiatives for Students during COVID-19 pandemic
l PM e-VIDYA: LaunchedinMay2020,PMe-Vidyaunifiesalleffortsrelatedtodigital/online/on-aireducationtoenablecoherentmulti-modeaccesstoeducation.ThefourcomponentsofPMe-VIDYAforschooleducationare:l OneNation,OneDigitalEducation(DIKSHA)Platform;l OneClass,OneTVchannelthroughSwayamPrabhaTVChannels;l ExtensiveuseofRadio,CommunityRadioandPodcasts;and
For the differently-abled:OneDTHchannelisbeingoperatedspecificallyforhearingimpairedstudentsinsignlanguage.Forvisuallyandhearing-impairedstudents,studymaterialhasbeendevelopedinDigitallyAccessibleInformationSystem(DAISY)andinSignLanguage;bothareavailableontheNIOSwebsite/YouTube.About3,029audiobookchaptershavebeendevelopedanduploadedonDIKSHA.Oftheproduced/recorded602videos,490textbook-basedISLvideoshavebeenuploadedonDIKSHA.All10,000wordsof ISLdictionaryhavebeenuploadedonDIKSHA,andisbeingupdatedwithadditionalaudioandtextfacilities.
l National Digital Education Architecture (NDEAR): The blueprint of NDEAR, a digitalinfrastructureforEducation,waslaunchedon29thJuly,2021.Itwillbesetupwithinthecontextof aDigital-FirstMindsetwhere theDigitalArchitecturewill not only support teaching andlearning activities but also educational planning, governance administrative activities of theCentreandtheStatesUnionTerritories.Itwillprovidediverseeducationeco-systemarchitecturefordevelopmentofdigitalinfrastructure,afederatedbutinter-operablesystemthatwillensureautonomyofallstakeholders,especiallyStatesandUTs.

359Social Infrastructure and Employment
l Vidyanjali:ToconnecttheGovernmentandGovernmentaidedschoolsthroughacommunity/volunteermanagement program, the government has launchedVidyanjali on 7th September,2021,Vidyanjaliportalenablesthecommunity/volunteerstointeractandconnectdirectlywithschoolsoftheirchoicetosharetheirknowledgeandskillsaswellascontributeintheformofassets/material/equipment.
Major Schemes for School Education during 2021-22NationalEducationPolicy(NEP),2020aimstopavethewayfortransformationalreformsinschoolandhighereducationsystemsinthecountry.Itaimstoprovideallstudents,irrespectiveoftheirplaceof residence,qualityeducationsystemwithspecial focuson themarginalised,disadvantagedandunderrepresentedgroups.Thestepstakentoprovidequalityeducationingovernmentschoolsandinstitutionsinaffordableandcompetitivemannerareasfollows:
l Samagra Shiksha Scheme has been continued for a period of five years, from 2021-22 to2025-26,withatotalfinancialoutlayof`2,94,283.04crore.Asanintegratedschemeforschooleducation,itcoverstheentiregamutfrompre-schooltoclassXII.Ittreatsschooleducationasacontinuum,andisinaccordancewithSustainableDevelopmentGoalforEducation(SDG-4).TheschemenotonlyprovidessupportfortheimplementationoftheRighttoEducation(RTE)Act,butisalsoalignedwiththerecommendationsofNEP,2020:toensurethatallchildrenhaveaccesstoqualityeducationwithanequitableandinclusiveclassroomenvironment,totakecareof their diverse background,multilingual needs, different academic abilities, andmake themactiveparticipantsinthelearningprocess.
Themajorinterventions,acrossalllevelsofschooleducation,proposedundertheschemeare: (i) Universal Access including Infrastructure Development and Retention, (ii) FoundationalLiteracy and Numeracy, (iii) Gender and Equity, (iv) Inclusive Education, (v) Quality andInnovation, (vi) Financial support for Teacher Salary, (vii) Digital initiatives, (viii) RTEEntitlementsincludinguniforms,textbooks,(ix)SupportforEarlyChildhoodCareandEducation(ECCE), (x) Vocational Education, (xi) Sports and Physical Education, (xii) Strengtheningof Teacher Education and Training, (xiii) Monitoring, (xiv) Programme Management, and (xv)NationalComponent..
l NIPUN Bharat Mission: On 5th July 2021, government launched a National Mission onFoundationalLiteracyandNumeracycalled“NationalInitiativeforProficiencyinReadingwithUnderstandingandNumeracy(NIPUNBharat)”.TheNationalMissionlaysdownprioritiesandactionableagendaforStates/UTstoachievethegoalofproficiencyinfoundationalliteracyandnumeracyforeverychildbygrade3.TheMissionhasbeensetupundertheaegisofthecentrallysponsoredschemeofSamagraShiksha.NIPUNBharat laysdowntheLakshyaorTargets forFoundationalLiteracyandNumeracystartingfromtheBalvatikauptoagegroup9basedonthelearningoutcomesanddevelopmentalgoalscoveringvariousaspects,conceptsandskills.
lPradhan Mantri Poshan Shakti Nirman (PM POSHAN) Scheme:TheScheme,earlierknownas‘NationalProgrammeforMid-DayMealinSchools”,coversallschoolchildrenstudyinginBalvatika(justbeforeclassI)andClassesI-VIIIinGovernmentandGovernment-AidedSchools.During2020-21,about11.80crorechildrenstudyingin11.20lakhinstitutionsbenefitedundertheScheme.PMPOSHANSchemeinschoolshasbeenapprovedforimplementationoverthefive-yearperiod2021-22to2025-26withafinancialoutlayof`54061.73crorefromtheCentralGovernmentand`31733.17crorefromtheStateGovernmentsandUTAdministrations.

360 Economic Survey 2021-22
Higher Education
10.33 Grossenrolmentratioinhighereducationrecordedat27.1percentin2019-20,slightlyhigher from26.3 percent in 2018-19. Formales, it has also increased from26.3 percent in2018-19to26.9percentin2019-20whileforfemalesithasincreasedfrom26.4percentto27.3percentrespectively(Figure11).
Figure 11: Gross Enrolment Ratios in Higher Education for age 18-23 years (in percent)
1
Figure 11: Gross Enrolment Ratios in Higher Education for age 18-23 years (in percent)
Source: All India Survey on Higher Education (AISHE) report 2019-20, Ministry of Education
23.9 25
.3
25.4 26.0
26.3
26.3 26.9
22.0 23
.2
23.5 24
.5 25.4 26
.4 27.3
23.0 24
.3
24.5 25.2 25.8
26.3 27
.1
2013 -14 2014 -15 2015 -16 2016 -17 2017-18 2018 -19 2019 -20
Male Female Overall
Source:AllIndiaSurveyonHigherEducation(AISHE)report2019-20,MinistryofEducation
Recent Initiatives in Higher Education
10.34 Government has takenmultiple initiatives aimed at revolutionizing the higher educationecosystem by (i) enabling higher vocationalisation, (ii) greater multi-disciplinary research, (iii)providingmultipleentryandexitpoints,(iv)promotingglobalisationofeducation,(v)leveragingthepotentialofInformationandCommunicationTechnology(ICT)inteachingandlearningprocessforalllearners.Forintegrationofvocationaleducationintothehighereducationsystem,UniversityGrantCommission(InstitutionsDeemedtobeUniversity)Regulation2019hasbeenamended;andguidelineshavebeenissuedbyUGCandAllIndiaCouncilforTechnicalEducationtoenableHigherEducationInstitutions(HEIs)toofferApprenticeship/Internshipembeddeddegreeprogramme.
10.35 National Apprenticeship Training Scheme(NATS)hasbeenextendedforthenextfiveyearswithanoutlayof`3054crorewhichwillmake,throughapprenticeship,around9lakhstudentsemployable.Undertheschemestudentswillbegivenapprenticeshipintheemergingand frontier technology such asArtificial Intelligence, drone technology, new evolving andemergentareasincludingexpertiserequiredforProductionLinkedIncentiveScheme,andPMGatiShaktiProgrammeoftheGovernment.ThescopeoftheNATShasbeenbroadenedtogiveapprenticestostudentsfromhumanities,commerceandsciencebesidesengineeringstream.
10.36 Academic Bank of Credit,launchedon29.07.2021,woulddigitallystoretheacademiccreditsearnedfromvariousrecognizedHigherEducationalInstitutions(HEI)suchthatcreditssoearnedcanbeaccountedforawardofdegreebyanygivenHEI.AppropriateamendmentsinregulationsbyUniversityGrantsCommission(UGC)havebeenaffectedtofacilitatemultipleentry/exitinacademicprogrammesatHEIsandofferingofoffshorecoursesbyInstitutionsofEminence(IOE).

361Social Infrastructure and Employment
10.37 e-PGPathshala : 154UniversitieshavecomeonboardforacceptingcredittransferforcoursesofferedthroughSWAYAMplatformtillnow,therebyboostingmainstreamingofMassiveOnlineOpenCourses(MOOCs).Inthisregard,thee-PGPathshalahasbeenofferedasanOnlineGatewayofPostGraduateCourses;778papers,with23000pluse-modulesin67Subjectshavebeendeveloped,outofwhich23subjectscovertheentiresyllabus/curriculum.DuetoCOVID-19induced lockdown and restrictions, ePGPathshala website has been used widely across allUniversitiesandseveralUniversitieshaveusedePGPathshalacontentasaflipclassroom.
10.38 Unnat Bharat Abhiyanhasbeenlaunchedtocatertherurallocalneedsbyleveraginghighereducation.Theobjectiveoftheschemeistoengagereputedhighereducationalinstitutions(centralandstate;publicandprivate)tounderstandandworkinruralareas.Asofnow2897institutionsareparticipatingandtheyhaveadoptedcloseto14500villages.
10.39 Scholarships for weaker sections:Toaddresstheissueofaccesstohighereducationby students fromweaker sections, scholarship schemes (such as Central Sector Scheme ofScholarshipforCollegeandUniversityStudentswhichhasbenefitedover1.5lakhstudentsin2021-22asofNovember,SpecialScholarshipSchemeforJ&Kwhichhasbenefitedcloseto15000studentsin2021-22asofNovember)havebeenoperationalised.
SKILL DEVELOPMENT 10.40 To unlock the demographic dividend, several steps have been taken to increase theskill levels inpopulation.PeriodicLabourForceSurvey (PLFS)2019-20 shows that formalvocational / technical training amongyouth (age 15-29 years) andworking population (age15-59years)haveimprovedin2019-20over2018-19.Theimprovementinskillshasalsobeenformalesandfemales,bothinruralandurbansectors.However,formaltrainingformalesandfemalesislowerinruralthaninurbanareas(Table4).
Table 4: Distribution of Persons received formal vocational/technical training (in percent)
Age group Rural Urban All India
Male Female Total Male Female Total Male Female Total
2017-18
15-29years 2.0 1.3 1.7 4.6 4.2 4.4 2.8 2.2 2.5
15-59years 1.5 0.9 1.2 4.0 3.3 3.7 2.3 1.7 2.0
2018-19
15-29years 2.4 1.5 2.0 4.8 4.6 4.7 3.2 2.5 2.8
15-59years 1.8 1.1 1.5 4.9 3.9 4.4 2.8 2.0 2.4
2019-20
15-29years 3.1 2.7 2.9 7.0 6.5 6.8 4.3 3.8 4.1
15-59years 2.2 1.7 2.0 6.3 5.4 5.8 3.5 2.9 3.2
Source:AnnualPLFSReports,2017-18to2019-20

362 Economic Survey 2021-22
10.41 As per the report of first quarter (April-June, 2021) ofQuarterlyEmployment Survey(QES) in respect of establishments employing at least10workers inmajor nine sectors, 17.9percentofestimatedestablishmentswereimpartingformalskilltraining.SectorssuchasIT/BPOimparted skill training in 29.8 percent of estimated establishments, followed by 22.6 percentfinancialservicesand21.1percenteducationsector’sestablishments.Further,about24.3percentestimatedestablishmentswerefoundtobeimparting‘On-the-Job’training,whichishigherinIT/BPOsector(36.1percentofestablishments)andfinancialservicessector(34.8percent)(Table5).
Table 5: Sector-wise Percentage Distribution of Estimated Establishments imparting Formal Skill Development Training and On the Job Training (in percent)
Sectors Skill Training On-the-Job TrainingIT/BPOsFinancialServicesEducationHealthManufacturingConstructionTransportTradeAccommodation&RestaurantsTotal
29.822.621.120.217.415.513.011.27.117.9
36.138.822.124.028.326.020.617.413.424.3
Source:QuarterlyEmploymentSurveyReport,2ndQuarter2021,LabourBureau.
10.42 SkilldevelopmenteffortsoftheGovernmentaimattheremovalofdisconnectbetweendemand and supply of skilled manpower, building the vocational and technical trainingframework, skill up-gradation, building of new skills and innovative thinking not only forexistingjobsbutalsojobsthataretobecreated.
Box 3: National Education Policy 2020: Re-imagining vocational education
Initiatives/targets
l Atleast50percentofschoollearnerstogetexposuretovocationaleducationby2025.l ConsideringstudentsinvocationaleducationwhilearrivingattheGrossEnrolmentRatio
(GER)targets.l SecondaryschoolstocollaboratewithITIs,polytechnics,localindustry.l SettingupofSkilllabsandcreatinghub&spokemodelintheschoolstoallowother
schoolstousethefacility.l To offer vocational education by higher education institutions or in partnershipwith
industryandNGOs.l Offering vocational courses to students enrolled in all other Bachelor’s degree
programmes,includingthe4-yearmultidisciplinaryBachelor’sprogrammes.

363Social Infrastructure and Employment
l Highereducationalinstitutionstoconductshort-termcertificatecoursesinvariousskillsincludingsoftskills.
l Makingvocationalknowledgedeveloped-‘LokVidya’tostudentsthroughintegrationintovocationaleducationcourses.
l VocationalcoursesthroughOpenDistanceLearning(ODL)mode.l Integratingvocational education intoall school andhigher education institutions in a
phasedmanneroverthenextdecade.l MinistryofEducationtoconstituteaNationalCommitteefortheIntegrationofVocational
Education(NCIVE),consistingofexperts invocationaleducationandrepresentativesfromacrossMinistries,incollaborationwithindustry,tooverseethiseffort.
l Setting up incubation centres in higher education institutions in partnership withindustries.
l NationalSkillsQualificationsFrameworkforeachdisciplinevocationandprofession.l Aligning Indianstandards to the InternationalStandardClassificationofOccupations
maintainedbytheInternationalLabourOrganization.
Skill India Mission
10.43 Launchedin2015,SkillIndiaMissionfocusesonre-skillingandup-skillinginprominenttrades. Under the Mission government implements Pradhan Mantri Kaushal Vikas Yojana(PMKVY), Jan Shikshan Sansthan (JSS) Scheme and National Apprenticeship PromotionScheme(NAPS),forprovidingshorttermSkillDevelopmenttrainingandCraftsmanTrainingScheme(CTS),forlongtermtraining,totheyouth.
l Pradhan Mantri Kaushal Vikas Yojana (PMKVY) PMKVYhastwotrainingcomponents,viz.,ShortTermTraining(STT)andRecognition
ofPriorLearning(RPL).Between2016-17and2021-22(ason15January2022),underPMKVY2.0about1.10crorepersonsweretrained(inclusiveoftheplacement-linkedandnon-placement-linkedcomponentsofthePMKVY):83percentcertifiedandabout21lakhsplaced.In2021-22,underPMKVY3.0,3.48lakhpersonshavebeentrained:50percentcertifiedand16,321placed.UnderPradhanMantriKaushalKendras(PMKKs),from2016-17to2021-22,16.35lakhpersonsweretrainedandover78percentofthemwerecertified.
PMKVYalsoprovided training toShramiks (migrant labourers)affectedbyCOVID-19.This component covered 116 districts of 6 States, viz.,Assam,Bihar,MadhyaPradesh,Odisha, Rajasthan andUttar Pradesh.As on 15.01.2022, 1.26 lakhmigrants have beentrained/oriented(0.88lakhinSTTand0.38lakhinRPL).
Severalmicro-programmesunderPMKVYhavealsobeenformulatedfortargetingartisans’clustersinpartnershipwithprivatesector,alsotoensureemploymenttoallartisans.SpecialprojecthasbeenlaunchedtorevivethetraditionalNamdacraftofJammu&KashmirandupskillingofWeavers&ArtisansoftraditionalcraftsofNagalandandJammuandKashmir.
Recognition of Prior Learning (RPL):RPL’sobjectivesare(i)toalignthecompetenciesoftheunorganizedworkforceofthecountrywiththestandardizedNationalSkillQualification

364 Economic Survey 2021-22
Framework;(ii)toenhancetheopportunitiesforemploymentandprovidealternativemeansforhighereducation;(iii)toprovideopportunitiesforreducinginequalities.Ason15thJanuary2022,morethan63lakhbeneficiarieshavebeencertifiedacross37differentsectors.
l Jan Shikshan Sansthan (JSS) Scheme JSSaimstoprovidevocationalskillstonon-literate,neo-literates,personswithrudimentary
level of education up to 8th and school dropouts up to 12th standard in the age groupof15-45years.Theprioritygroupsarewomen,SC,ST,minorities,divyangjanandotherbackwardsectionsofthesociety.TheJanShikshanSansthansworkatthedoorstepofthebeneficiarieswithminimuminfrastructureandresources.UndertheschemegrantisreleasedtoJanShikshanSansthans(NGOs)forSkillDevelopment.
l National Apprenticeship Promotion Scheme (NAPS) This Scheme promotes apprenticeship training and the engagement of apprentices by
providingfinancialsupporttoindustrialestablishmentsundertakingapprenticeshipprogramunderTheApprenticesAct,1961.Ason31October2021,4.3 lakhapprenticesengagedunderthescheme.
l Craftsmen Training Scheme (CTS) CTSisforprovidinglong-termtrainingin137tradesthrough14,604IndustrialTraining
Institutes(ITIs)acrossthecountry.Forsession2020,13.36lakhtraineeswereenrolled.
Aatmanirbhar Skilled Employees Employer Mapping (ASEEM) portal
10.44 ASEEM,adigitalplatform,createdtomatchsupplyofskilledworkforcewiththemarketdemand,actsasadirectoryofskilledworkforce.Ason31.12.2021,1.38crorecandidateshavebeen registered on the portal including candidates registered onSkill IndiaPortal (SIP).Ason31.12.2021, around26.7 lakhmigrant’s data/profile are also available on the portal.ThePortal consists of three IT basedAI (artificial intelligence) driven interfaces forstakeholderinteractions:l Ajobapplicationforindividualswithaccesstohyperlocaljobsusingmachinelearningand
automatedmatchbasedonpersona.l Ademand and campaignmanagement system for employers to forecast the current and
futuredemand.l Amanagement dashboard for analytics and insights.This could also be used for future
decisionmaking.
India International Skill Centre (IISC) Network
10.45 IISCNetworkiscateringtotheneedsofforeigncountrieswhereIndianmanpowerisindemand.TheIISCNetworkisafee-basedmarketdrivenmodel;basedonglobalworkforcesupplyanddemanddynamics.Itprovidesincrementalskilltrainingoninternationalstandardsandassessmentofskillsforoverseasemployment.IndiahasagreementswithGermany,Belarus,UnitedKingdom,France,Australia,JapanandQatarinthefieldofapprentices/training.
Pradhan Mantri Dakshta Aur Kushalta Sampann Hitgrahi Yojana (PM-DAKSH)
10.46 PM-DAKSHYojanaisanationalactionplanforskillingofmarginalizedpersonsincludingscheduledcastes,backwardclassesandsafaikaramcharis.Theeligibletargetgrouparebeing

365Social Infrastructure and Employment
provided skill development trainingprogrammeson (i) up-skilling/re-skilling (ii) short termtrainingprogramme(iii)longtermtrainingprogrammeand(iv)entrepreneurshipdevelopmentprogram.Duringtheyear2021-22,atargethasbeensettoprovideskilldevelopmenttrainingtoapproximately50,000personsofthetargetgroups.
TRENDS OF EMPLOYMENT10.47 The COVID-19 pandemic and the restrictions on the movement of individuals andeconomicactivitiestocurbitsspreadsignificantlyimpactedlivelihoodsacrosstheglobe.ThissectionanalysestrendsinlabourmarketandtheimpactofCOVID-19onemploymentusingannualandquarterlydatabyPeriodicLabourForceSurvey(PLFS).PLFSisthecomprehensiveGovernmentdatasetusedtoanalysethetrendsinlabourmarket.However,thisdataisavailablewithalargelag16.ThelatestupdateofquarterlyPLFSurbansectorisavailableuptoMarch202117andannualPLFSdataavailableupto2019-20.Intheabsenceofhighfrequencydataonlabourmarketindicators,otherproxiessuchassubscriptionsofEPFOschemeanddemandforworkunderMGNREGA,havebeenusedtoanalysethemorerecenttrendsinemploymentinurbanandruralsectors.
Trends in Urban employment using Quarterly PLFS data
10.48 Before the outbreak of COVID-19, the urban labour market had shown signs ofimprovement in terms of labour force participation rate (LFPR), Worker population ratio(WPR)andUnemploymentrates(UR).However,thenation-widelockdownimposedinlate-March,2020adverselyimpactedtheurbanlabourmarket.Inthefirstquarterof2020-21,theunemploymentrateforurbansectorroseto20.8percent.TheLFPRandWPRinurbansectoralsodeclinedsignificantlyduringthisquarter(Table6).
Table 6: Labour market indicators for Urban sector (age: 15 & above) at CWS (in percent)
Survey Year Quarters LFPR WPR UR
2019-20
July-Sept,2019 47.3 43.4 8.3
Oct-Dec,2019 47.8 44.1 7.8
Jan-March,2020 48.1 43.7 9.1
April-June,2020 45.9 36.4 20.8
2020-21
July-Sept,2020 47.2 40.9 13.2
Oct-Dec,2020 47.3 42.4 10.3
Jan-March,2021 47.5 43.1 9.3
Source:QuarterlyPLFSreportsNote:LFPRisdefinedasthepercentageofpopulationinthelabourforce.Labourforcecomprisesofpersonswhowereeitherworking(employed)orseekingwork(unemployed).WPRisdefinedasthepercentageofemployedpersonsinthetotalpopulation.URisdefinedasthepercentageofunemployedpersonsinthelabourforce.
16QuarterlyPLFSforurbansectorhasalagofabout9monthsanddonotcovertheruralsector.Othercountriesviz.,Japan,Australia,UnitedKing-domandUSA,publishtheirquarterlylabourforcesurveysinlessthantwomonthsoftimeandmonthlydatawithinamonthfromreferenceperiod.17Theactivitystatusdeterminedonthebasisofareferenceperiodoflast7daysprecedingthedateofsurveyisknownasthecurrentweeklystatus(CWS)oftheperson

366 Economic Survey 2021-22
10.49 With the revival of economy in the subsequent quarters of 2020-21, all three labourmarketindicatorsshowedaswiftrecovery(Figure11).TheURgraduallydeclinedduringthisperiodtoreach9.3percentinQ4of2020-21.TheURformalesaswellasfemales,aged15&above,recoveredtothepre-pandemiclevels.BoththeLFPRandWPRformalesaswellasfemales,aged15&above,almostreachedtheirpre-pandemiclevels18duringthelastquarterof2020-21.(Figure12).
Figure 12: Urban Labour Market Recovery from pre-pandemic levels
1
Figure 12: Urban Labour Market Recovery from pre-pandemic levels
Source: Quarterly PLFS reports, MoSPI
77.5
90.6
94.295.9
84.8
89.2 90.0
95.9
75
80
85
90
95
100
Apr
il-Ju
ne, 2
0
July
-Sep
t, 20
Oct
-Dec
, 20
Jan-
Mar
ch, 2
1
% Recovery
A. Recovery in worker population ratio for Youth (age 15-29)
Male Female
84.0
94.9
98.5 99.2
84.0
92.7
97.0
101.4
75
80
85
90
95
100
105
Apr
il-Ju
ne, 2
0
July
-Sep
t, 20
Oct
-Dec
, 20
Jan-
Mar
ch, 2
1
% Recovery
B. Recovery in worker population ratio for age 15 & above
Male Female
97.6
101.3 100.7 100.4
98.5100.1 100.1
101.2
75
80
85
90
95
100
105
April
-June
, 20
July
-Sep
t, 20
Oct-D
ec, 2
0
Jan-
Mar
ch, 2
1
% Recovery
C. Recovery in labour force participation rate for Youth (age 15-29)
Male Female
98.1100.6 100.7 100.6
96.099.4 100.9
103.8
75
80
85
90
95
100
105
110
April
-June
, 20
July
-Sep
t, 20
Oct-D
ec, 2
0
Jan-
Mar
ch, 2
1
% Recovery
D. Recovery in labour force participation rate for Working age (15 & above)
Male Female
177
133
116108
145136 132
119
75
95
115
135
155
175
195
April
-June
, 20
July
-Sep
t, 20
Oct-D
ec, 2
0
Jan-
Mar
ch, 2
1
% Recovery
E. Recovery in unemployment rates for Youth (age 15-29)
Male Female
258
157
118107
204
153127
114
7595
115135155175195215235255275
April
-June
, 20
July
-Sep
t, 20
Oct-D
ec, 2
0
Jan-
Mar
ch, 2
1
% Recovery
F. Recovery in unempoyment rates for age 15 & above
Male Female
1
Figure 12: Urban Labour Market Recovery from pre-pandemic levels
Source: Quarterly PLFS reports, MoSPI
77.5
90.6
94.295.9
84.8
89.2 90.0
95.9
75
80
85
90
95
100
Apr
il-Ju
ne, 2
0
July
-Sep
t, 20
Oct
-Dec
, 20
Jan-
Mar
ch, 2
1
% Recovery
A. Recovery in worker population ratio for Youth (age 15-29)
Male Female
84.0
94.9
98.5 99.2
84.0
92.7
97.0
101.4
75
80
85
90
95
100
105
Apr
il-Ju
ne, 2
0
July
-Sep
t, 20
Oct
-Dec
, 20
Jan-
Mar
ch, 2
1
% Recovery
B. Recovery in worker population ratio for age 15 & above
Male Female
97.6
101.3 100.7 100.4
98.5100.1 100.1
101.2
75
80
85
90
95
100
105
April
-June
, 20
July
-Sep
t, 20
Oct-D
ec, 2
0
Jan-
Mar
ch, 2
1
% Recovery
C. Recovery in labour force participation rate for Youth (age 15-29)
Male Female
98.1100.6 100.7 100.6
96.099.4 100.9
103.8
75
80
85
90
95
100
105
110
April
-June
, 20
July
-Sep
t, 20
Oct-D
ec, 2
0
Jan-
Mar
ch, 2
1
% Recovery
D. Recovery in labour force participation rate for Working age (15 & above)
Male Female
177
133
116108
145136 132
119
75
95
115
135
155
175
195
April
-June
, 20
July
-Sep
t, 20
Oct-D
ec, 2
0
Jan-
Mar
ch, 2
1
% Recovery
E. Recovery in unemployment rates for Youth (age 15-29)
Male Female
258
157
118107
204
153127
114
7595
115135155175195215235255275
April
-June
, 20
July
-Sep
t, 20
Oct-D
ec, 2
0
Jan-
Mar
ch, 2
1
% Recovery
F. Recovery in unempoyment rates for age 15 & above
Male Female
18Pre-pandemiclevelsaretakenasthequarterlyaverageofallthequartersduringFY2019-20

367Social Infrastructure and Employment
1
Figure 12: Urban Labour Market Recovery from pre-pandemic levels
Source: Quarterly PLFS reports, MoSPI
77.5
90.6
94.295.9
84.8
89.2 90.0
95.9
75
80
85
90
95
100
Apr
il-Ju
ne, 2
0
July
-Sep
t, 20
Oct
-Dec
, 20
Jan-
Mar
ch, 2
1
% Recovery
A. Recovery in worker population ratio for Youth (age 15-29)
Male Female
84.0
94.9
98.5 99.2
84.0
92.7
97.0
101.4
75
80
85
90
95
100
105
Apr
il-Ju
ne, 2
0
July
-Sep
t, 20
Oct
-Dec
, 20
Jan-
Mar
ch, 2
1
% Recovery
B. Recovery in worker population ratio for age 15 & above
Male Female
97.6
101.3 100.7 100.4
98.5100.1 100.1
101.2
75
80
85
90
95
100
105
April
-June
, 20
July
-Sep
t, 20
Oct-D
ec, 2
0
Jan-
Mar
ch, 2
1
% Recovery
C. Recovery in labour force participation rate for Youth (age 15-29)
Male Female
98.1100.6 100.7 100.6
96.099.4 100.9
103.8
75
80
85
90
95
100
105
110
April
-June
, 20
July
-Sep
t, 20
Oct-D
ec, 2
0
Jan-
Mar
ch, 2
1
% Recovery
D. Recovery in labour force participation rate for Working age (15 & above)
Male Female
177
133
116108
145136 132
119
75
95
115
135
155
175
195Ap
ril-Ju
ne, 2
0
July
-Sep
t, 20
Oct-D
ec, 2
0
Jan-
Mar
ch, 2
1
% Recovery
E. Recovery in unemployment rates for Youth (age 15-29)
Male Female
258
157
118107
204
153127
114
7595
115135155175195215235255275
April
-June
, 20
July
-Sep
t, 20
Oct-D
ec, 2
0
Jan-
Mar
ch, 2
1
% Recovery
F. Recovery in unempoyment rates for age 15 & above
Male Female
1
Figure 12: Urban Labour Market Recovery from pre-pandemic levels
Source: Quarterly PLFS reports, MoSPI
77.5
90.6
94.295.9
84.8
89.2 90.0
95.9
75
80
85
90
95
100
Apr
il-Ju
ne, 2
0
July
-Sep
t, 20
Oct
-Dec
, 20
Jan-
Mar
ch, 2
1
% Recovery
A. Recovery in worker population ratio for Youth (age 15-29)
Male Female
84.0
94.9
98.5 99.2
84.0
92.7
97.0
101.4
75
80
85
90
95
100
105
Apr
il-Ju
ne, 2
0
July
-Sep
t, 20
Oct
-Dec
, 20
Jan-
Mar
ch, 2
1
% Recovery
B. Recovery in worker population ratio for age 15 & above
Male Female
97.6
101.3 100.7 100.4
98.5100.1 100.1
101.2
75
80
85
90
95
100
105
April
-June
, 20
July
-Sep
t, 20
Oct-D
ec, 2
0
Jan-
Mar
ch, 2
1
% Recovery
C. Recovery in labour force participation rate for Youth (age 15-29)
Male Female
98.1100.6 100.7 100.6
96.099.4 100.9
103.8
75
80
85
90
95
100
105
110
April
-June
, 20
July
-Sep
t, 20
Oct-D
ec, 2
0
Jan-
Mar
ch, 2
1
% Recovery
D. Recovery in labour force participation rate for Working age (15 & above)
Male Female
177
133
116108
145136 132
119
75
95
115
135
155
175
195Ap
ril-Ju
ne, 2
0
July
-Sep
t, 20
Oct-D
ec, 2
0
Jan-
Mar
ch, 2
1
% Recovery
E. Recovery in unemployment rates for Youth (age 15-29)
Male Female
258
157
118107
204
153127
114
7595
115135155175195215235255275
April
-June
, 20
July
-Sep
t, 20
Oct-D
ec, 2
0
Jan-
Mar
ch, 2
1
% Recovery
F. Recovery in unempoyment rates for age 15 & above
Male Female
Source:QuarterlyPLFSreports,MoSPI
10.50 Notethat,thelatestquarterlyurbansectorPLFSdatareportstheimpactoffirstCOVID-19wave and the following recovery tillQ4 of 2020-21. In order to gauge the performance ofthe labourmarketduring2021-22,proxymeasureshavetobebeenused(thoughthesehavelimitations).The following sub-sections use the data on subscriptions ofEPFO scheme anddemandforworkunderMGNREGAasproxyindicatorstoanalysetheserecenttrendsinurbanandruralareasrespectively.
Trends in Urban Employment using Employees’ Provident Fund Organisation (EPFO) Payroll Data
10.51 Broadly,theEPFOdatacoversthelowpaidworkersinmediumandlargeestablishmentsof formal sector19. The net addition in EPFO subscriptions is an indicator of the extent offormalisationofthejobmarket,andthecoverageofsocialsecuritybenefitstotheorganized/semi-organized sector workforce.An analysis of the latest EPFO data suggests significantaccelerationinformalisationofthejobmarket,drivenbybothnewformaljobsandformalisationofexisting jobs,during2021,with13.95 lakhnetaddition toEPFsubscribers inNovember2021.
10.52 Owingtothelargeimpactwitnessedduringthenation-widelockdown,thenetadditiontoEPFOsubscriptionsdeclinedandturnednegativeinApril-May2020,thatimpliesanetexitwasregisteredfromthescheme.Withtheunlockingoftheeconomyandeasingofrestrictions,theEPFOsubscriptionsbouncedbackswiftly,reaching12.2lakhinSeptember2020.ThenetadditionalsubscriptionwitnessedadeclineagaininNovember2020andalsoduringthesecond
19EPFOpublishessubscriptionsdataeverymonth,withalagoftwomonths,however,ithaslimitations:(i)Thedatadoesnotcoverestablishmentsemployinglessthan20persons,withfewexceptions.CertainestablishmentsnotifiedbytheCentralGovernmenteveniftheyemploylessthan20personseach.MostoftheestablishmentsinIndiaaresmallerinsize,EPFOpayrollrepresentsonlyasmallfraction.Thoughold,yettheonlylatestavailableSixthEconomicCensus(EC),2013suggeststhatonly0.52percent(about3lakhestablishmentsoutoftotal58.5million)establishmentswereemploying20ormoreworkers.(ii)Thedataalsodonotcoverworkersgettingpaymorethan`15000permonth,exceptthosepermittedorpayingtheircontributiononvoluntarybasis.It,thus,excludesmostofthebetterpaidskilledworkers.(iii)WorkersgettingjobsininformalsectorarenotreflectedinEPFOsubscriptions.In2019-20,closeto90percentofadditionalworkersjoinedworkforcewereintheinformalnatureofemployment.

368 Economic Survey 2021-22
waveofCovid-19(April-June2021).However,themagnitudeofdeclineinboththecaseswasless compared to that duringApril-May2020.Themonthlynet additionalEPF subscriptionduringMay2021was5lakhasagainst-2.9lakhinMay2020.InNovember2021,netadditioninsubscriptionpeakedwith13.9lakhnewsubscribers, thehighestinanygivenmonthsince2017.ThelatestpayrolldataofEPFOshowsthatthenetadditioninEPFsubscribersreached13.95lakhduringthemonthofNovember2021,whichtranslatesintogrowthof109.21percentfromNovember2020,andagrowthof25.65percentfromOctober,2021.
10.53 Thus,themonthlynetadditioninsubscriptionsduring2021hasnotonlybeenhigherthanthecorrespondingmonthlyvaluesin2020,buttheyhavealsosurpassedthelevelsofthecorrespondingmonthsduringpre-pandemicyear2019.Thispointstotheformalisationofthejobmarketsaswellasnewhiring(Figure13).
Figure 13: Net addition in EPF Subscribers (in lakhs)
1
8.3
3.1
10.2
-2.9
12.211.2
5.0
12.913.9
-4.0
-2.0
0.0
2.0
4.0
6.0
8.0
10.0
12.0
14.0
16.0
in la
khs
Lockdown Second -wave
Source:EPFONote:1. Dataisprovisionalasupdationofemployees’recordsisacontinuousprocessandgetsupdatedin subsequentmonth/s. 2. NetsubscriptionsequalsnewEPFsubscribersaddedtoexitedmemberswhorejoinedandre-subscribed netofmembersexited
10.54 AswiftreboundofsubscriptionscontinuedinExpertServicesandTradingestablishmentsuntilSeptember2021,andinEngineeringuntilAugust,2021.Subscriptions,however,sloweddowninAugust2021inBuilding&Construction.InNovember202120,EPFOsubscriptionshaveincreasedinthesesectors(Figure14).
20EstablishmentsunderEPFarehighlyconcentratedinfewservices.In2021-22,expertservice(43percent)hadhighestshare,followedbytrading–commercialestablishments(6.9percent),engineers–engineeringcontractors(5.1percent),andbuildingandconstructionindustry(4.8percent).Shareof‘Trading–commercialestablishments’innetpayrollsubscribershasincreasedin2020-21from2019-20,howeverithasdeclinedforotherthreeindustries.

369Social Infrastructure and Employment
Figure 14: Net New EPF Subscribers (thousands) in Selected Sectors
1
-200-100
0100200300400500600700
(thou
sand
s)
Expert ServicesLockdown Second wave
1
-30-20-10
01020304050607080
(thou
sand
s)
Building & Construction Industry
LockdownSecond wave
1
-60-40-20
020406080
100120
Apr-1
8M
ay-1
8Ju
n-18
Jul-1
8Au
g-18
Sep-
18Oc
t-18
Nov
-18
Dec-
18Ja
n-19
Feb-
19M
ar-1
9Ap
r-19
May
-19
Jun-
19Ju
l-19
Aug-
19Se
p-19
Oct-1
9N
ov-1
9De
c-19
Jan-
20Fe
b-20
Mar
-20
Apr-2
0M
ay-2
0Ju
n-20
Jul-2
0Au
g-20
Sep-
20Oc
t-20
Nov
-20
Dec-
20Ja
n-21
Feb-
21M
ar-2
1Ap
r-21
May
-21
Jun-
21Ju
l-21
Aug-
21Se
p-21
Oct-2
1N
ov-2
1
(thou
sand
s)
Trading - Commercial Establishments
LockdownSecond wave
1
-20-10
0102030405060708090
(thou
sand
s)
Engineers - Engineering ContractorsSecond wave
Lockdown
Source:EPFO

370 Economic Survey 2021-22
Trends in data on demand for work under MGNREGS
10.55 ThedemandforworkunderMahatmaGandhiNationalRuralEmploymentGuaranteeScheme(MGNREGS)isanindicatorofrurallabourmarkets.AnanalysisofthelatestdataondemandforworkunderMGNREGSsuggeststhefollowingtrendsintherurallabourmarket:(i)MGNREGSemploymentpeakedduringthenation-widelockdownin2020(ii)thedemandforMGNREGSworkhasstabilizedafterthesecondCOVIDwave;(iii)aggregateMGNREGSemploymentisstillhigherthanpre-pandemiclevel(Figure15).
10.56 Duringthenationwidelockdown,theaggregatedemandforMGNREGSworkpeakedin June 2020, and has thereafter stabilized. During the second-COVID-wave, demand forMGNREGS employment reached the maximum level of 4.59 crore persons in June 2021.Nonetheless,afteraccountingforseasonality,thedemandatanaggregatelevelstillseemstobeabovethepre-pandemiclevelsof2019(Figure15).ForsomestateslikeAndhraPradeshandBihar,thedemandforworkunderMGNREGShasreducedtobelowthepre-pandemiclevelsduringthelastfewmonths.
Figure 15: Persons demanded work under MGNREGS (in Crores)
1
Figure 15: Persons demanded work under MGNREGS (in Crores)
Source: MGNREGA portal, D/o Rural Development
0
1
2
3
4
5
6
7
Jan Feb Mar Apr May Jun Jul Aug Sep Oct Nov Dec
Cro
re p
erso
ns
2019 2020 2021
Source:MGNREGAportal,D/oRuralDevelopment
10.57 Intuitively,onemayexpectthathigherMGNREGSdemandmaybedirectlyrelatedtothemovementofmigrantlabouri.e.sourcestateswouldbemoreimpacted.Nevertheless,state-levelanalysisshowsthatformanymigrantsourcestateslikeWestBengal,MadhyaPradesh,Odisha, Bihar, the MGNREGS employment in most months of 2021 has been lower thanthe corresponding levels in 2020. In contrast, the demand forMGNREGS employment hasbeenhigherformigrantrecipientstateslikePunjab,Maharashtra,KarnatakaandTamilNaduformostmonthsin2021over2020.Therearestillotherstatesthatdonotneatlyfitintothiscategorization.Therefore,therelationshipbetweenMGNREGSemploymentandmovementofmigrantlabourduringthelasttwoyearscannotbeconclusivelydetermined,andrequiresfurtherresearch.

371Social Infrastructure and Employment
Long-term trends in employment using annual PLFS data
10.58 DuringPeriodicLabourForceSurvey(PLFS)2019-20(surveyperiodfromJuly2019toJune2020),employmentatusualstatus21continuedtoexpand.Between2018-19and2019-20,about4.75croreadditionalpersonsjoinedtheworkforce.Thisisaboutthreetimesmorethantheemploymentcreatedbetween2017-18and2018-19.Theruralsectorcontributedmuchmoretothisexpansionrelativetotheurbansector(3.45croreinruralsectorand1.30croreinurbansector).Further,amongsttheadditionalworkers,2.99crorewerefemales(63percent).About65percentoftheadditionalworkersjoinedin2019-20wereself-employed.About75percentofthefemaleworkerswhojoinedasself-employedwere‘unpaidfamilylabour.’About18percentof theadditionalworkerswereCasual labourerand17percentwere‘RegularWage/SalariedEmployee’.Further,thenumberofunemployedpersonsin2019-20hasalsodecreasedby23lakhs,constitutedlargelybymalesfromtheruralsector(Table7).
Table 7: Estimates of Labour Force, Employment, and Unemployment for the years 2017-18 to 2019-20 (all ages; principal status+ subsidiary status , in crore)
DescriptionRural Urban Total
Male Female Total Male Female Total Male Female Total
2017-18
LabourForce 25.48 8.67 34.15 13.25 3.57 16.82 38.73 12.24 50.97
Employment 23.91 7.70 31.61 12.39 3.15 15.53 36.29 10.85 47.14
Unemployment 1.57 0.97 2.54 0.86 0.42 1.29 2.44 1.39 3.83
2018-19
LabourForce 25.77 8.77 34.54 13.60 3.68 17.28 39.37 12.45 51.82
Employment 24.37 8.46 32.83 12.64 3.31 15.96 37.01 11.77 48.78
Unemployment 1.40 0.31 1.71 0.96 0.37 1.33 2.36 0.68 3.04
2019-20
LabourForce 26.64 11.12 37.76 14.23 4.35 18.58 40.87 15.47 56.34
Employment 25.45 10.81 36.26 13.32 3.95 17.27 38.77 14.76 53.53
Unemployment 1.18 0.32 1.50 0.91 0.40 1.31 2.09 0.72 2.81
Source:SurveyEstimatesusingPLFS2017-18,2018-19and2019-20Surveys.Theestimatesareapproximate.Note1:Projectedpopulationason1stJanuary,2018was135crore,ason1stJanuary2019was137crore;andason1stJanuary,2020was140.48crore.TheformulaforprojectionisA=A1*[1+R/100](n/k),whereA1isthecensuspopulationason1stMarch2011,Risthepercentagedecadalchangeinpopulationbetweencensus2001and2011,nisthemonthofprojection,andkisnumberofmonthsbetweenMarch2011andMarch2021.Note2:Principalstatus (ps)measures theactivity inwhichan individualhas spent relatively longer timeofareferenceyear(majortimecriterion)whilesubsidiarystatus(ss)measurestheactivitystatusofanindividualwhohasspentmajorityofdaysoutofworkforcebuthaveworkedforshortperiodoftime(morethan30days).
21Usualstatusistheactivitystatusofapersonduringthereferenceperiodof365daysprecedingthedateofsurvey.

372 Economic Survey 2021-22
10.59 Formal-informalemployment(ps+ss)acrossorganizedandunorganizedsectorisgivenintable8.Oftheadditionalworkersjoinedin2019-20,closeto90percentwereintheinformalnatureofemploymentandmorethan98percentwereinunorganisedsector.About91percentof additional workers were in unorganised-informal sector. Table 8 gives estimates of totalemploymentinformalandinformalacrossorganizedandunorganizedsector.
Table 8: Formal-Informal Employment (ps+ss) across Organized and Unorganized Sector (in Crores)
Type of Employment Organized Unorganized Total
2017-18
Formal 4.43 0.28 4.70
Informal 4.62 37.79 42.43
Total 9.05 38.07 47.13
2018-19
Formal 4.91 0.45 5.35
Informal 4.55 38.87 43.43
Total 9.46 39.32 48.78
2019-20
Formal 5.09 0.80 5.89
Informal 4.46 43.19 47.64
Total 9.55 43.99 53.53
Source:EstimatedusingPLFS2017-18,2018-19and2019-20Surveys.Note:AsperNationalCommissionforEnterprisesinUnorganizedSector(NCEUS)classification,“Theunorganisedsectorconsistsofallunincorporatedprivateenterprisesownedbyindividualsorhouseholdsengagedinthesaleandproductionofgoodsandservicesoperatedonaproprietaryorpartnershipbasisandwithlessthantentotalworkers.”However, “informalworkers consistof thoseworking in theunorganised enterprisesor households, excludingregularworkerswithsocialsecuritybenefits,andtheworkersintheformalsectorwithoutanyemploymentbenefits/socialsecurityprovidedbytheemployers.”(NCEUS,2007a,p.3).
10.60 Industrywiseemployment (ps+ss) in India isgiven inTable9.Ofworkersadded in2019-20showsthatmorethan71percentwereintheagriculturesector.Amongthenewworkersintheagriculturesector,femalesaccountforabout65percent.Trade,hotelandrestaurantsectoraccountedforalittleover22percentofthenewworkers,inlinewithpreviousyear’strendwherethesectorrepresentedmorethan28percentofthenewworkers.Theshareofmanufacturinghasdeclinedfrom5.65percentofnewworkersaddedin2018-19toabout2.41percentofnewworkersaddedin2019-20,andsohasthatofconstructionfrom26.26percentto7.36percent.

373Social Infrastructure and Employment
Table 9: Industry wise Employment (ps+ss) in India (in Crores)
Year/SectorRural Urban Total
Male Female Total Male Female Total Male Female Total
2018-19
Agriculture 12.97 6.01 18.98 0.62 0.26 0.88 13.58 6.27 19.86
Mining&quarrying 0.10 0.02 0.11 0.08 0.01 0.08 0.17 0.02 0.20
Manufacturing 1.78 0.76 2.54 2.77 0.81 3.58 4.55 1.57 6.12
Electricity,water,etc 0.10 0.02 0.11 0.15 0.02 0.17 0.25 0.03 0.28
Construction 3.75 0.51 4.26 1.47 0.14 1.60 5.22 0.64 5.86
Trade,hotel&restaurant
2.39 0.36 2.75 3.19 0.46 3.64 5.57 0.82 6.39
Transport,storage&communication
1.32 0.02 1.33 1.54 0.12 1.66 2.86 0.14 2.99
Otherservices 1.95 0.77 2.72 2.82 1.51 4.33 4.77 2.28 7.05
Total 36.97 11.78 48.76
2019-20
Agriculture 14.10 8.18 22.28 0.67 0.32 0.99 14.77 8.51 23.27
Mining&quarrying 0.08 0.00 0.08 0.07 0.00 0.07 0.14 0.01 0.15
Manufacturing 1.86 0.79 2.65 2.70 0.88 3.59 4.56 1.67 6.24
Electricity,water,etc 0.13 0.01 0.14 0.19 0.02 0.21 0.31 0.03 0.35
Construction 3.82 0.61 4.42 1.60 0.19 1.79 5.42 0.80 6.22
Trade,hotel&restaurant
2.34 0.40 2.74 3.85 0.88 4.73 6.19 1.28 7.47
Transport,storage&communication
1.37 0.02 1.40 1.61 0.14 1.75 2.99 0.16 3.15
Otherservices 1.78 0.79 2.57 2.64 1.50 4.13 4.42 2.29 6.71
Total 38.80 14.75 53.55
Source:EstimatedusingPLFS2018-19and2019-20Surveys
Policy responses to boost rural livelihood Incentives for job creation
10.61 AatmanirbharBharatRojgarYojana(ABRY)wasannouncedasapartofAatmanirbharBharat3.0packagetoboosttheeconomy,increasetheemploymentgenerationinpostCOVIDrecovery phase and to incentivize creation of new employment along with social securitybenefitsandrestorationoflossofemploymentduringCOVID-19pandemic.UnderABRY,theGovernmentofIndiaiscreditingforaperiodoftwoyearsboththeemployees’share(12percent

374 Economic Survey 2021-22
of wages) and employers’ share (12 percent of wages) of contribution payable or only theemployees’share,dependingonemploymentstrengthoftheEPFOregisteredestablishments.UnderABRY,benefitsareprovidedtoeveryestablishmentregisteredwithEPFOandtheirnewemployees(earningwagelessthan 15,000permonth)iftheestablishmentstakenewemployeesonorafter1.10.2020andupto31stMarch,2022orthosewholostjobsbetween01.03.2020to30.09.2020.Ason6thJanuary2022benefitshavebeengivento43,21,837beneficiariesthrough1,22,228Establishments.
Wage employment
10.62 AllocationtoMGNREGSinFY2021-22increasedto`73,000crore,from`61,500croreinFY2020-21.AllocationforFY2021-22hasbeenenhancedtoRs98000croresofar.InFY2021-22over8.70croreindividualsand6.10crorehouseholdswereprovidedworksofar.
10.63 Toboostemploymentandlivelihoodopportunitiesforreturneemigrantworkers,GaribKalyanRojgarAbhiyaanwaslaunchedinJune2020.Itfocusedon25target-drivenworkstoprovideemploymentandcreateinfrastructureintheruralareasof116districtsof6StateswitharesourceenvelopeofRs50,000crore.
Boosting Self-employment
10.64 TheDeendayalAntyodayaYojana–NationalRuralLivelihoodsMission(DAY-NRLM),launchedin2011,isanotherinterventionthatseekstoalleviateruralpovertythroughbuildingsustainablecommunityinstitutionsforthepoor.Theprogrammetargetstomobiliseabout9-10crorehouseholds intoSelfHelpGroups(SHGs). It is to link themtosustainable livelihoodsopportunitiesbybuilding their skillsandenabling themtoaccess formalsourcesoffinance,entitlements and services from both public and private sectors. Till December, 2021, 8.07crorehouseholdsaremobilizedintoSHGs.ThenumberofSHGhouseholdsengagedinfarmlivelihoodsin2021-22(tillDecember,2021)stoodat1.47croreasagainst1.16crorein2020-21and0.86crorein2019-20.ThenumberofSHGmembersinvolvedinnon-farmlivelihoodsin2021-22increasedto1.82lakhs(tillDecember,2021)membersfrom1.55lakhsin2020-21and0.98lakhsin2019-20.
Social protection
10.65 Pradhan Mantri Shram Yogi Maan-Dhan (PM-SYM) Yojana, launched on05.03.2019,isavoluntaryandcontributorypensionschemeforprovidingmonthlyminimumassuredpensionof`3000onattainingtheageof60years.Theworkersintheagegroupof18-40yearshavingmonthlyincomeof`15000orlessandnotamemberofEPFO/Employees’StateInsuranceCorporation(ESIC)/NationalPensionScheme(NPS)(Govt.funded)canjointhescheme.Underthescheme,50percentmonthlycontributionispayablebythebeneficiaryandequalmatchingcontributionispaidbytheCentralGovernment.EnrolmenttotheschemeisdonethroughtheCommonServiceCentres.Inaddition,eligiblepersonscanalsoself-enrollthroughvisitingtheportalwww.maandhan.in.Ason17.01.2022,theenrolmentunderthePM-SYMschemeis46.09lakhpersons,outofwhichfemaleenrolmentwas23.89lakhandmaleenrolmentwas22.20lakh.

375Social Infrastructure and Employment
10.66 National Pension Scheme for Traders, Shopkeepers and Self-Employed Persons,launchedon12.09.2019,isavoluntaryandcontributorypensionschemeforprovidingmonthlyminimumassuredpensionof 3000afterattainingtheageof60years.Thetraders,shopkeepersandself-employedpersonsintheagegroupof18-40yearswithanannualturnovernotexceeding`1.5croreandarenotmembersofEPFO/ESIC/NPS(Govt.funded)/PM-SYMornotanincometaxpayer,canjointhescheme.Underthescheme,50percentmonthlycontributionispayablebythebeneficiaryandequalmatchingcontributionispaidbytheCentralGovernment.EnrolmenttotheschemeisdonethroughtheCommonServiceCentres,withitsnetworkofabout4lakhCentresacrossthecountry.Inaddition,eligiblepersonscanalsoself-enrollthroughvisitingtheportalwww.maandhan.in.Ason17.01.2022,over48thousandbeneficiarieshavebeenenrolledunderthescheme.
Box 4: e-SHRAM Portal
e-SHRAMportalhasbeenlaunchedtocreateaNationalDatabaseofUnorganizedWorkers(UWs).OneofthemainobjectivesofthisportalistofacilitatedeliveryofSocialSecuritySchemestotheworkers.ThisdatabaseisseededwithAadhaarandforagegroupbetween16-59years.It includesconstructionworkers,migrantworkers,gigworkers,platformworkers,agriculturalworkers,MGNREGA workers, fishermen, milkmen, ASHA workers, Anganwadi workers, streetvendors, domesticworkers, rickshawpullers and otherworkers engaged in similar otheroccupationsintheunorganisedsector.The data aims at delivery of social security benefits as implemented byCentral&StateMinistries.Itwillalsoensureportabilityof thesocialsecurityandwelfarebenefits tothemigrantandconstructionworkersattheirworkingplaces.Alleligibleregisteredunorganizedworkersareentitledtogetbenefitofanaccidentalinsurancecoverof 2.00Lakhsforayear,freeofcostthroughunderPradhanMantriSurakshaBimaYojana(PMSBY).Itmayalsobeusedforprovidingassistancetotheeligibleworkersduringanynationalcrisisorpandemic-likesituations.Ason18January2022,over22.85croreworkershavebeenregisteredonthee-SHRAMportal.TheStatesleadingthenumberofregistrations–indecreasingorderofshareinnumberofregistrations–areUttarPradesh(34.9percent),WestBengal(10.7percent),Bihar(10.7percent),Odisha(5.7percent),MadhyaPradesh(3.5percent)andJharkhand(3.5percent).Whileagricultureaccountsfor11.53croreregistrations,domesticworkersandconstructionworkerstrailwith2.45croreand2.2croreregistrationsrespectively.
Status of Labour Reforms
10.67 In2019and2020,29CentralLabourlawswereamalgamated,rationalizedandsimplifiedintofourlabourcodes,viz.,theCodeonWages,2019(August,2019),theIndustrialRelationsCode,2020,theCodeonSocialSecurity,2020,andtheOccupationalSafety,Health&WorkingConditionsCode,2020(September,2020).Thenewlawswereintunewiththechanginglabourmarkettrendsandatthesametimeaccommodatingtheminimumwagerequirementandwelfareneeds of the unorganized sectorworkers, including the self-employed andmigrantworkers,

376 Economic Survey 2021-22
withintheframeworkoflegislation.TheGovernmenthasalsopre-publishedthedraftRulesforallfourCodes.
10.68 Ason11.01.2022,26States/UTshavealsopre-publishedthedraftrulesundertheCodeonWages,22States/UTsunderIndustrialRelationsCode,20States/UTsunderCodeonSocialSecurity,and17States/UTsunderOSH&WCCode.(Table10)
Table 10: Status of Rules by States/UTs under 4 labour Codes (status as on 11.01.2022)
Name of Codes Name of States which have pre-published the draft rules
TheCodeonWages,2019
Arunachal Pradesh, Assam, Bihar, Goa, Gujarat, Haryana, HimachalPradesh,Karnataka,MadhyaPradesh,Tripura,Uttarakhand,UttarPradesh,Odisha,Manipur,Telangana,Chhattisgarh,Jharkhand,Kerala,Maharashtra,Mizoram, Punjab, Rajasthan, UTs of Jammu & Kashmir, Puducherry,ChandigarhandGovernmentofNCTofDelhi(26)
IndustrialRelationsCode,2020
Arunachal Pradesh, Assam, Bihar, Goa, Gujarat, Haryana, HimachalPradesh,Karnataka,MadhyaPradesh,Tripura,Uttarakhand,UttarPradesh,Odisha,Manipur,Telangana,Chhattisgarh,Jharkhand,Maharashtra,Punjab,UTsofJammu&Kashmir,ChandigarhandPuducherry(22)
CodeonSocialSecurity,2020
Arunachal Pradesh, Assam, Bihar, Goa, Gujarat, Haryana, HimachalPradesh, Madhya Pradesh, Tripura, Uttarakhand, Uttar Pradesh, Odisha,Manipur, Chhattisgarh, Jharkhand, Maharashtra, Kerala, Punjab, UTs ofJammu&KashmirandChandigarh(20)
OSH&WCCode,2020
Arunachal Pradesh, Bihar, Goa, Haryana, Himachal Pradesh MadhyaPradesh, Uttarakhand, Uttar Pradesh, Odisha, Manipur, Chhattisgarh,Jharkhand,Kerala,Punjab,Gujarat,UTsofJammu&Kashmir,Chandigarh(17)
Source:MinistryLabour&Employment
HEALTHProgrammes and Schemes for Health Sector
10.69 Ayushman Bharat Health and Wellness Centres (AB-HWCs): VisionofAyushmanBharat is to achieve the universal health coverage. It adopts a continuumof care approach,comprisingoftwointer-relatedcomponents.Thefirstcomponentiscreationof1,50,000HealthandWellnessCentres(HWCs)whichcoverboth,maternalandchildhealthservicesandnon-communicable diseases, including free essential drugs and diagnostic services. TheseAB-HWCsprovideComprehensivePrimaryHealthCare(CPHC),byexpandingandstrengtheningtheexistingReproductive&ChildHealth(RCH)servicesandCommunicableDiseasesservicesand by including services related to Non-Communicable Diseases. It is also envisaged toincrementally add primary healthcare services formental health, ENT, Opthalmology, Oralhealth,GeriatricandPalliativehealthcareandTraumacareaswellasHealthpromotionandwellnessactivitieslikeYoga.Ason19.01.2022,atotalnumberof221.99lakhsTele-consultationshavebeenprovidedundere-Sanjeevanitele-consultationplatformthroughfunctionalHWCsof

377Social Infrastructure and Employment
3017Hubs&33,819Spokesacrossthecountry.About96.27lakhWellnessSessions,includingYogahasbeenconductedatAB-HWCsason19.01.2022.
10.70 Ayushman Bharat Pradhan Mantri Jan Arogya Yojana (AB-PMJAY): ThesecondcomponentofAyushmanBharat is PM-JAY; it isbeing implementedby theNationalHealthAuthority(NHA)inpartnershipwithstategovernments.Theschemeprovidesahealthcoverof `5lakhsperfamilyperyearforsecondaryandtertiarycarehospitalizationtoover10.74crorespoorandvulnerablefamiliesinthebottom40percentoftheIndianpopulation.Ason19thJanuary2022,totalof17.5croreAyushmanCardshavebeenissuedunderABPM-JAY.Atotalof 2.73croreauthorizedhospitaladmissionsworth`30673crorehavebeenprovidedthroughanetworkofapproximately25000hospitals(approximately10800Privateand14300Publichospitals).Amassive information,educationandcommunicationdrive“AapkeDwarAyushman”wascarriedoutin2021withthesupportofgrassrootresourcessuchasfrontlineworkers,healthcareworkersandPanchayatiRajInstitutions.Thisledtotheidentificationandverificationofmorethan4crorepeopleunderthescheme.
10.71 PM-Ayushman Bharat Health Infrastructure Mission (PM-ABHIM) is amissiontodevelop the capacitiesof primary, secondary, and tertiary carehealth systems,strengthenexistingnationalinstitutions,andcreatenewinstitutions,tocatertodetectionandcureofnewandemergingdiseases.Itisthelargestpan-Indiaschemeforpublichealthinfrastructuresince2005.
10.72 Pradhan Mantri Swasthya Suraksha Yojana (PMSSY) is being implementedtocorrectregionalimbalancesintheavailabilityofaffordablereliabletertiaryhealthcareservices and to augment facilities for quality medical education in the country. UnderPMSSY,constructionof22newAllIndiaInstitutesforMedicalScience(AIIMS)and75GovernmentMedicalCollegeup-gradationProjects has been approved and takenup forimplementation.Outofthis,six(6)AIIMSatBhopal,Bhubaneswar,Jodhpur,Patna,Raipurand Rishikesh are already fully functional.Another Sixteen (16)AIIMS under variousphaseshavebeensanctioned.
10.73 Ayushman Bharat Digital Mission (ABDM), erstwhile National Digital HealthMission(NDHM),announcedon27thSeptember,2021withtheaimtodevelopthebackbonenecessary tosupport the integrateddigitalhealth infrastructureof thecountry. It is tobridgethe existing gap amongst different stakeholders of the healthcare ecosystem through digitalhighways.ServicesliketheissueofHealthID,HealthcareProfessionalsRegistry(HPR),HealthFacilityRegistry(HFR)andHealthRecords(PHR)havebeeninitiated.
10.74 e-Sanjeevani:InwakeofCOVID-19pandemic,MinistryofHealthandFamilyWelfareupgraded eSanjeevani application to enable patient-to-doctor tele-consultation to ensurecontinuumofcareandfacilitatehealthservicestoallcitizensintheconfineoftheirhomesfreeofcost.Telemedicineserviceshavebeenrolledoutin36States/UTs.Toincreasetheoutreachofhealthservicesvirtually,e-SanjeevaniOPDapplicationhasbeenintegratedwith3.74lakhCommon Service Centres (CSCs) thereby facilitating access to equitable health care in theremotestareasofthecountry.

378 Economic Survey 2021-22
Health Outcome Indicators
10.75 Indiahasmadesignificantprogressinimprovingitshealthoutcomesoverthelasttwodecadesbyeliminatingpolio,guineawormdisease,yawsandmaternalandneonataltetanus22. AsperlatestNationalFamilyHealthSurvey(NFHS)-5,socialindicatorssuchastotalfertilityrate,sexratioandhealthoutcomeindicatorsviz.,infantmortalityrate,under-fivemortalityrate,institutionalbirthrateshaveimprovedoveryear2015-16(Table11).
Table 11: Progress on Social and Health Indicators
ParticularsNFHS-1(1992-93)
NFHS-2(1998-99)
NFHS-3(2005-06)
NFHS-4(2015-16)
NFHS-5(2019-21)
TotalFertilityRate(Childrenperwomen) 3.4 2.9 2.7 2.2 2
Sexratioatbirthforchildrenborninthelastfiveyears(fe-malesper1,000males) - - 914 919 929
InfantMortalityRate(per1000livebirths) 78.5 67.6 57 40.7 35.2
Under-fiveMortalityRate(per1000livebirths) 109.3 94.9 74.3 49.7 41.9
InstitutionalBirth(%) 26.1 33.6 40.8 78.9 88.6
Pregnantwomenage15-49whoareanaemic(%) - 51.8 57.9 50.4 52.2
Populationlivinginhouseholdsthatuseanimprovedsanitationfacility(%)
- 17.6 29.1 48.5 70.2
Householdsusingcleanfuelforcooking(%) - - 25.6 43.8 58.6
Source:ReportsofvariousNFHSrounds.Note:ThefiguresforinstitutionalbirthreportedintheNFHS-3factsheetwerebasedonthelast2birthsinthe3yearsbeforethesurveytoever-marriedwomen.Whereas,sinceNFHS-4thefiguresarebeingprovidedforallthebirthsinthe5yearsbeforethesurvey.So,thefiguresforNFHS-1toNFHS-3arenotcomparablewithNFHS-4and5.
Child Health Indicators
10.76 Governmenthasmadeeffortstoaddressnutritiondeficiencyamongchildren.POSHANAbhiyaanwaslaunchedinMarch2018toachieveimprovementinnutritionalstatusofChildrenfrom0-6years,adolescentgirls,pregnantwomenandlactatingmothers.Thevisionistoachievereduction instuntingandwasting inchildren (0-6years) aswell as reduction inanaemia inwomen, children and adolescent girls. Besides, Swachh Bharat Mission (SBM) createdsanitationinfrastructureandawarenessacrossthecountry.Moreover,specialvaccinationdriveslikeMissionIndradhanush,IntensifiedMissionIndradhanush,GramSwarajAbhiyaan(GSA),ExtendedGSAreachedtheleftoutanddropoutchildrenfromvaccination.22HealthSystemforANewIndia:BuildingBlocks.NITIAayog.2019

379Social Infrastructure and Employment
10.77 NFHS-5alsoshowsthatnotonlyservicesarereachingtothepublicbuttheintendedoutcomeshave also improved.All childnutrition indicators have also improved at all Indialevel.UnderFiveMortalityRate(U5MR)hasdeclinedfrom49.7in2015-16to41.9in2019-21.InfantMortalityRate(IMR)hasdeclinedfrom40.7per1000livebirthsin2015-16to35.2per1000livebirthsin2019-21.Stuntinghasdeclinedfrom38percentin2015-16to36percentin2019-21.Wastinghasalsodeclinedfrom21percentin2015-16to19percentin2019-21.And,underweightdeclinedfrom36percentin2015-16to32percentin2019-21.StatewiseU5MR,IMRandneonatalmortalityratesareshowninTable12.
Table 12: State wise Child Mortality Indicators
States/UTs
Infant Mortality Rate (per 1000 live-
births)
Under Five Mortal-ity Rate (per 1000
livebirths)
Neo-natal Mortality Rate (deaths per 1000
live births)
NFHS-4 (2015-16)
NFHS-5 (2019-
21)NFHS-4 (2015-16)
NFHS-5 (2019-
21)NFHS-4 (2015-16)
NFHS-5 (2019-21)
AllIndia 40.7 35.2 49.7 41.9 29.5 24.9AndhraPradesh 34.9 30.3 40.8 35.2 19.9 23.6ArunachalPradesh 22.9 12.9 32.9 18.8 7.7 11.8Assam 47.6 31.9 56.5 39.1 22.5 32.8Bihar 48.1 46.8 58.1 56.4 34.5 36.7Delhi 31.2 24.5 42.2 30.6 17.8 17.5Goa 12.9 5.6 12.9 10.6 5.6 12.9Gujarat 34.2 31.2 43.5 37.6 21.8 26.8Haryana 32.8 33.3 41.1 38.7 21.6 22.1HimachalPradesh 34.3 25.6 37.6 28.9 20.5 25.5JammuandKashmir 32.4 16.3 37.6 18.5 9.8 23.1Karnataka 26.9 25.4 31.5 29.5 15.8 18.5Kerala 5.6 4.4 7.1 5.2 3.4 4.4MadhyaPradesh 51.2 41.3 64.6 49.2 29.0 36.9Maharashtra 23.7 23.2 28.7 28.0 16.5 16.2Manipur 21.7 25.0 25.9 30.0 17.2 15.6Meghalaya 29.9 32.3 39.6 40.0 19.8 18.3Mizoram 40.1 21.3 46.0 24.0 11.4 11.2Nagaland 29.5 23.4 37.5 33.0 10.2 16.5Odisha 39.6 36.3 48.1 41.1 27.0 28.2Punjab 29.2 28.0 33.2 32.7 21.8 21.2Rajasthan 41.3 30.3 50.7 37.6 20.2 29.8Sikkim 29.5 11.2 32.2 11.2 5.0 20.8TamilNadu 20.2 18.6 26.8 22.3 12.7 14.0Tripura 26.7 37.6 32.7 43.3 22.9 13.2UttarPradesh 63.5 50.4 78.1 59.8 35.7 45.1WestBengal 27.5 22.0 31.8 25.4 15.5 22.0Chhattisgarh 54.0 44.3 64.3 50.4 32.4 42.1Jharkhand 43.8 37.9 54.3 45.4 28.2 33.0

380 Economic Survey 2021-22
Uttarakhand 39.7 39.1 46.5 45.6 32.4 27.9Telangana 27.7 26.4 31.7 29.4 16.8 20.0AndamanandNicobar(UT) 9.8 20.6 13.0 24.5 7.3 12.3DadraandNagarHaveli&DamanDiu(UT) 33.4 31.8 39.9 37.0 13.9 21.4
Lakshadweep(UT) 27.0 0.0 30.2 0.0 0.0 23.3Puducherry(UT) 15.7 2.9 16.2 3.9 5.8 2.3Ladakh(UT) 20.0 29.5 29.5
Source:NFHS-5,MinistryofHealthandFamilyWelfareNote:InNFHS-5,Jammu&KashmirisUnionTerritoryexcludingLadakh
Life Expectancy
10.78 Report on ‘Sample Registration based System (SRS) based Abridged Life Tables2014-18’provides estimatesof average longevity atvariousagegroups23LatestestimatesofExpectationoflifeatbirthforIndiaareavailablefor2014-18.Lifeexpectancyatbirthwas69.4yearsfortheperiod2014-18;ithasincreasedby0.4yearsfrom2013-17.Itvarieswidelyacrossstates; ranging from the lowestof65.2years inChhattisgarh to thehighestat75.3years inKeralaandDelhi.Itishigherinurbanareas(72.6years)thaninruralareas(68.0years).Increasefrom2013-17ishigherforrural(of0.3years)thanincreaseinurbanareas(0.2years).Thegapbetweentheruralandurbanlifeexpectancyhasalsonarroweddownsignificantlyfrom1970-75to2014-18.Femalesareexpectedtolivelonger(70.7years)comparedtomales(68.2years).In2014-18whencomparedto2013-17,femalesareexpectedtolivelongerinmostStates/UTsbothacrosstheruralandurbanareas,exceptforBiharandJharkhand.
Total Fertility rate
10.79 LatestNFHS-5showsthatTotalFertilityRate(TFR),anaveragenumberofchildrenperwomen,hasfurthercomedownto2in2019-21from2.2in2015-16(Table13).Thetotalfertility rate has even come down below the replacement level of fertility (2.1 children perwoman) in thecountry.Further, inall theStates/UTsexcept forManipur,Meghalaya,Bihar,JharkhandandUttarPradesh thereplacement leveloffertilityhasbeenachieved.Increasinguseofcontraceptivesespeciallythemodernmethods,betterfamilyplanning,andgirleducationpossiblyhavecontributedtothedeclineinthefertilityrates.Useoffamilyplanningmethodshasincreasedfrom53.5percentin2015-16to66.7percentin2019-21.Accesstobetterhealthinfrastructurecouldbeanotherfactor.Significantimprovementisseenintheinfrastructureandservicesreachingtothepublic,suchasinstitutionaldelivery.Institutionaldeliveryhasincreasedto88.6percentin2019-21comparedto78.9percentin2015-16.
Sex Ratio
10.80 Sexratio,numberoffemalesper1000males,inthetotalpopulationhasrisenfrom991females in2015-16 (NFHS-4) to1020 in2019-21 (NFHS-5).More importantly, sex ratioatbirth,femalechildrenper1000malechildrenborninthelastfiveyears,hasgrownfrom919in2015-16 to929 in2019-21.Topreventgenderbiasedsexselectiveelimination, toensure
23OfficeofTheRegistrarGeneral&CensusCommissioner,IndiaMinistryofHomeAffairsGovernmentOfIndia:https://censusindia.gov.in/Vital_Statistics/SRS_Life_Table/SRS%20based%20Abridged%20Life%20Tables%202014-18.pdf

381Social Infrastructure and Employment
survivalandprotectionofthegirlchild,andtoensureeducationandparticipationofthegirlchild,governmenthasmadespecificinterventionsthroughBeti Bachao Beti Padhao(BBBP)Scheme.Sexratioatbirthforchildrenborninthelastfiveyearshasimprovedin2019-21from2015-16inallstates(Table13),exceptforHimachalPradesh,Bihar,Jharkhand,Chhattisgarh,Odisha,Maharashtra,TamilNadu,Kerala,Meghalaya,GoaandNagaland
Table 13: State-wise Total Fertility Rate and Sex Ratio
States/UTs
Total Fertility Rate (Children per women)
Sex Ratio at Birth for children born in the last five years (females per 1000 males)
NFHS-4 (2015-16)
NFHS-5 (2019-21)
NFHS-4 (2015-16)
NFHS-5 (2019-21)
AllIndia 2.2 2.0 919 929AndhraPradesh 1.8 1.7 914 934ArunachalPradesh 2.1 1.8 926 979Assam 2.2 1.9 929 964Bihar 3.4 3.0 934 908Delhi 1.8 1.6 812 923Goa 1.7 1.3 966 838Gujarat 2.0 1.9 906 955Haryana 2.1 1.9 836 893HimachalPradesh 1.9 1.7 937 875JammuandKashmir 2.0 1.4 923 976Karnataka 1.8 1.7 910 978Kerala 1.6 1.8 1,047 951MadhyaPradesh 2.3 2.0 927 956Maharashtra 1.9 1.7 924 913Manipur 2.6 2.2 962 967Meghalaya 3.0 2.9 1,009 989Mizoram 2.3 1.9 949 969Nagaland 2.7 1.7 953 945Odisha 2.1 1.8 932 894Punjab 1.6 1.6 860 904Rajasthan 2.4 2.0 887 891Sikkim 1.2 1.1 809 969TamilNadu 1.7 1.8 954 878Tripura 1.7 1.7 969 1,028UttarPradesh 2.7 2.4 903 941WestBengal 1.8 1.6 960 973Chhattisgarh 2.2 1.8 977 960Jharkhand 2.6 2.3 919 899Uttarakhand 2.1 1.9 888 984Telangana 1.8 1.8 872 894AndamanandNicobar(UT) 1.4 1.3 891 941Chandigarh(UT) 1.6 1.4 981 838

382 Economic Survey 2021-22
DadraandNagarHaveli&Da-manDiu(UT) 2.1 1.8 983 817
Lakshadweep(UT) 1.8 1.4 905 1,051Puducherry(UT) 1.7 1.5 843 959Ladakh(UT) 1.3 1125
Source:NFHS-5,MinistryofHealthandFamilyWelfare
DRINKING WATER AND SANITATIONJal Jeevan Mission (JJM)
10.81 Rolled out inAugust 2019, JJM envisioned to provide adequate safe drinking waterthroughindividualhouseholdtapconnectionstoallhouseholdsinruralIndiaby2024.ThegoaloftheMissionistoenableeveryruralhouseholdtogetassuredsupplyofpotable-pipedwaterataservice levelof55 litrepercapitaperday(lpcd)regularlyon long-termbasisandalso toensurefunctionalityofthetapwaterconnections.Themissionwillbenefitmorethan19croreruralfamiliesormorethan90croreruralpopulation,bridgerural–urbandivide,improvequalityoflife,enhance‘easeofliving’andpublichealth.SpecialfeaturesofJalJeevanMissionare24:
l Shiftoffocusforwatersupplyfrom‘habitations(handpumps,publicstandposts,etc.atareasonabledistance)tohouseholds’(functionaltapinhouse).
l Notlimitedonlytocreationofwatersupplyinfrastructure,focusisonassuredsupplyofpotablewater–‘servicedelivery’&‘functionality’–toeveryhome.
l Localvillagecommunityowns,operates&maintainswatersupplysystemtoensureassuredwatersupplytoeveryhome.
l Central role of women: minimum 50 percent members of Village Water & SanitationCommittee (VWSC)/ Pani Samitis are to bewomen and proportionate representation ofweakersectionsofsociety.
l Priority to assured supply of potable-piped water in schools, anganwadi centres andashramshalas.
l Prioritytovillages/habitationshavingwaterqualityproblems.
l Surveillanceofwaterquality:trainingtofivepersonsineveryvillage,preferablywomen,onusingFieldTestKitsfortestingofwaterqualityatvillagelevel.Waterqualitytestinglaboratoriesopenedtopublictotestsamplesonpayingnominalcharges.
l Long-termdrinkingwatersecurity:VillageActionPlan(VAP)focusingonwatersources,supplysystems,greywaterreuseandoperation&maintenanceofthesesystemsforlongtermandregulartapwatersupplyineveryhome.
l Making water everyone’s business by participation; raising awareness, communitymobilizationandhandholding.
24ReformsinRuralDrinkingWaterSupply(Decentralized,demand-driven,community-managedwatersupplyprogramme).

383Social Infrastructure and Employment
l Technologicalinterventionsfortransparencyandaccountability(i)IMIStocapturephysicalandfinancialprogress;(ii)‘Dashboard’;(iii)‘MobileApp’;(iv)Sensor-basedIoTsolutionformeasurementandmonitoringwatersupplyforquantity,qualityandregularityinvillagesonrealtimebasis;(v)geo-taggingeveryassetcreated;(vi)LinkageoftapconnectionwithAadharnumber;(vii)transactionthroughPublicFinanceManagementSystem(PFMS);
l Inventivetostates:incentivegrantlinkedohighfunctionalityoftapwaterconnections.
10.82 Priorityisforqualityaffectedareas,villagesindroughtproneanddesertareas,SansadAdarsh Gram Yojana (SAGY) villages, to provide functional tap connection to Schools,Anganwadicentres,GPbuildings,Healthcentres,wellnesscentresandcommunitybuildings.TotaloutlayforthemissionisRs3.60lakhcrores.
10.83 In2019,outofabout18.93crorefamiliesinruralareas,about3.23crore(17percent)rural familieshad tapwaterconnections in theirhomes.Ason2January,2022,5,51,93,885householdshavebeenprovidedwithtapwatersupplysincethestartofthemission.Sixstates/Utshaveachievedthecovetedstatusof100percenthouseholdswithtapwatersupply,namelyGoa,Telangana,A&NIslands,Puducherry,DadraandNagarHaveliandDamanandDiuandHaryana.Equivalently,83districts,1016blocks,62,749panchayatsand1,28,893villageshaveachieved the100percenthouseholdswith tapwatersupplystatus.The twomaps (Map3(a)Statusason15August2019andMap3(b)Statusason2January2022)showtheimpressiverateofprogressinprovidingFHTCtohouseholdsacrossthecountry.
Map 3: State wise progress in providing FHTC to households across the country
Source:MinistryofJalshakti:https://ejalshakti.gov.in/jjmreport/JJMIndia.aspx

384 Economic Survey 2021-22
Swachh Bharat Mission (Grameen) [SBM-G]
10.84 RuralsanitationhasmadetremendousprogressunderSBM-Gsinceitsinceptionon2nd October,2014.Sinceinceptiontill28.12.2021,morethan10.86croretoiletshavebeenbuiltinruralIndia.
10.85 OpenDefecationFree(ODF)PlusunderPhaseIIofSBM(G)isbeingimplementedfrom2020-21to2024-25withagoalofmakingallthevillagesOpenDefecationFree(ODF)throughconvergencebetweendifferentverticalsoffinancingandvariousschemesofCentralandStateGovernments.FocusofphaseIIwithatotaloutlayofRs1,40,881croresisODFsustainabilityandSolid&LiquidWasteManagement. During2021-22(ason25.10.2021)atotalof7.16lakhIndividualhousehold latrinesfornewemerginghouseholdsand19,061CommunitySanitaryComplexeshavebeenconstructed.Also,2,194villageshavebeendeclaredasODFPlus.
10.86 AspertherecentlyreleasedfindingsofthefifthroundoftheNationalFamilyHealthSurvey,2019-21 (NFHS-5),population living inhouseholds thatusean improvedsanitationfacilityhasincreasedfrom48.5percentin2015-16to70.2percentin2019-21.Theproportionofpopulationlivinginhouseholdsusinganimprovedsanitationfacilityhasincreasedin2019-21comparedto2015-16(Table14),inallstatesexceptSikkim.Despitesignificantimprovement,the use of improved sanitation facilities instates such asBihar (49percent), Jharkhand (57percent), Odisha (60 percent), Manipur (65 percent), Madhya Pradesh (65 percent), WestBengal(68percent),Assam(69percent)andUttarPradesh(69percent)haveremainedbelowthenationalaverageof70percentin2019-21.
10.87 Electricity and Clean Cooking Fuel: GovernmenthasmadeeffortstoincreaseaccesstocleanfuelforcookingthroughthePradhan Mantri Ujjwala Yojana(PMUY).AsperNFHS-5,58.6percentofhouseholdswereusingcleanfuelforcookingin2019-21,asignificantincreasefrom43.8percentin2015-16.Proportionofhouseholdusingcleanfuelforcooking,however,variesacrossstates(Table14),whereChhattisgarh,Odisha,Jharkhand,Bihar,UttarPradesh,Rajasthan, Madhya Pradesh, Assam, West Bengal, Tripura, Nagaland, Arunachal Pradesh,HimachalPradesh,andMeghalayawerebelowthenationalaverageof58.6percentin2019-21.
10.88 GovernmenthasmadeeffortsthroughschemessuchasSAUBHAGYAYojanatoensure‘Powerforall.’AsperlatestNFHS,householdswithelectricityhaveincreasedfrom88percentin2015-16to96.8percentin2019-21.
Table 14: State wise proportion of households using sanitation facility and clean fuel for cooking (%)
States/UTs
Population living in house-holds that use an improved
sanitation facility (%)Households using clean fuel
for cooking (%)
NFHS-4 (2015-16)
NFHS-5 (2019-21)
NFHS-4 (2015-16)
NFHS-5 (2019-21)
AllIndia 48.5 70.2 43.8 58.6
AndhraPradesh 77.3 54.4 83.6 62.0
ArunachalPradesh 82.9 61.6 53.2 45.0

385Social Infrastructure and Employment
Assam 68.6 49.0 42.1 25.1
Bihar 49.4 26.5 37.8 17.8
Delhi 75.1 81.1 97.9 98.9
Goa 87.9 78.7 96.5 84.1
Gujarat 74.0 63.6 66.9 52.6
Haryana 85.0 80.6 59.5 52.2
HimachalPradesh 81.8 72.3 51.7 36.7
JammuandKashmir 75.7 53.8 69.2 57.5
Karnataka 74.8 57.8 79.7 54.7
Kerala 98.7 98.2 72.1 57.4
MadhyaPradesh 65.1 34.8 40.1 29.6
Maharashtra 72.0 52.3 79.7 59.9
Manipur 64.9 52.6 70.4 42.1
Meghalaya 82.9 61.4 33.7 21.8
Mizoram 95.3 84.4 83.8 66.1
Nagaland 87.7 76.7 43.0 32.8
Odisha 60.5 30.0 34.7 19.2
Punjab 86.6 82.7 76.7 65.9
Rajasthan 71.1 46.1 41.4 31.8
Sikkim 87.3 89.7 78.4 59.1
TamilNadu 72.6 52.5 82.9 73.0
Tripura 73.6 63.7 45.3 31.9
UttarPradesh 68.8 36.4 49.5 32.7
WestBengal 68.0 52.8 40.2 27.8
Chhattisgarh 76.8 34.8 33.0 22.8
Jharkhand 56.7 25.0 31.9 18.9
Uttarakhand 78.8 66.2 59.2 51.0
Telangana 76.2 52.3 91.8 67.3
AndamanandNicobar(UT) 75.4 88.0 63.5 79.8
Chandigarh(UT) 83.7 85.0 93.9 95.8DadraandNagarHaveli&Da-manDiu(UT) 44.4 65.8 63.1 79.9
Lakshadweep(UT) 99.8 99.6 59.4 31.8
Puducherry(UT) 64.8 84.9 84.8 92.3
Ladakh(UT) 42.3 76.3

386 Economic Survey 2021-22
RURAL DEVELOPMENT Pradhan Mantri Awaas Yojana-Gramin (PMAY-G)
10.89 PMAY-G,launchedon20thNovember2016,envisages‘HousingforAllby2022’througharobustmonitoringmechanismandimprovedschemearchitecture.Itaimstoprovideassistanceforconstructionof2.95crorehouses.Infirstphasefrom2016-17to2018-19,onecrorehousesweretakenup.UnderphaseII,assistanceisbeingprovidedforconstructionofremaining1.95crorehousesin2019-20to2021-22.ThroughconvergencewithotherGovernmentSchemes,italsoaddressesbasicneedssuchasconstructionofthetoilet,pipeddrinkingwater,electricityconnection,LPGgasconnectionand90/95person-daysofunskilledlabourfromMGNREGS.
10.90 As on 18th January 2022, 2.17 crore houses have been sanctioned and 1.69 crorehousescompletedagainstatargetof2.63crorehousestill2021-22.UnderPMAY-G,landlessbeneficiaries are accordedhighestpriority in allotmentof houses.Ason18th January, 2022,theStates/UTshave identified4,46,058 landless beneficiaries in thePermanentWaitListofPMAY-G,outofwhich2,05,847(46percent)havebeenprovidedwithlandbytheconcernedStates/UTs.Performanceoftheschemewasimpressiveduringfrom2016-17to2021-22(ason18thJanuary,2022)isgiveninFigure16.
Figure 16: Pradhan Mantri Awaas Yojana-Gramin (PMAY-G)
1
Figure 16: Pradhan Mantri Awaas Yojana-Gramin (PMAY-G)
Source: Dept. of Rural Development Note: 2021-22 data is as on 18 January 2022
32.1
44.547.3
21.9
35.332.8
05
101520253035404550
2016-17 2017-18 2018-19 2019-20 2020-21 2021-22
No. o
f hou
ses c
ompl
eted
(lak
h)
Source:Dept.ofRuralDevelopment Note:2021-22dataisason18January2022

387Social Infrastructure and Employment
Pradhan Mantri Gram Sadak Yojana (PMGSY)
10.91 TheprimaryobjectiveofthePMGSYistoprovideconnectivity,bywayofanall-weatherroadwithnecessaryculvertsandcross-drainagestructures,which isoperable throughout theyear,toeligibleunconnectedhabitationsinruralareas.
10.92 Ason18.01.2022,a totalof1,82,506 roadsmeasuring7,82,844kmand9,456LongSpanBridges (LSBs)havebeen sanctionedand1,66,798 roadsmeasuring6,84,994kmand6,404LSBshavebeencompleted(Figure17).
10.93 WorldBank (2019) in an evaluation of the scheme found that PMGSY roads had apositiveimpactonhumancapitalformationinruralIndia.Childreninmiddleorhighschoolhad0.7moreyearsofschoolingin2017;shareofbabiesdeliveredathomedecreasedby30percentinconnectedhabitations;vaccinationamongchildrenundertheageoffourincreasedby15percentagepoints,withboysandgirlsbenefitingequally.
SchemeLaunched (extended)
Objectives
PMGSY-I 2000(upto Sept,2022)
l Toprovide connectivity to eligibleunconnectedhabitationswithapopulationof500+inplainareasand250+inNorth-EasternandHimalayanstates,,Desertareas,Tribal(ScheduleV)areasandselectedtribalandbackwarddistrictsasidentifiedby theMinistry ofHomeAffairs/ PlanningCommission asperCensus,2001
l Additional relaxation given to connect habitations withpopulation of 100-249 (Census 2001) in the Left-wingExtremismAffectedblocks
PMGSY-II 2013(uptoSept,2022)
l Envisagedconsolidationof50,000Kmofexistingruralroadnetwork.
RCPLWEA 2016(uptoMarch,2023)
l Toimprovetheroadconnectivityin44worstaffectedLWEdistrictsandsomeadjoiningdistrictsin9States,viz.AndhraPradesh, Bihar, Chhattisgarh, Jharkhand, Madhya Pradesh,Maharashtra,Odisha,TelanganaandUttarPradesh
PMGSY-III 2019(uptoMarch,2025)
l Consolidation of 1,25,000 Km existing through routesand Major rural links connecting habitations, inter-alia, toGraminAgriculturalMarkets,HigherSecondarySchoolsandHospitals.

388 Economic Survey 2021-22
Figure 17: Pradhan Mantri Gram Sadak Yojana
1
Figure 17: Pradhan Mantri Gram Sadak Yojana
Source: Ministry of Rural Development: http://omms.nic.in/dbweb/Home/TimeSeries; (downloaded on 28 December 2021) Note: Road Connectivity Project for Left Wing Extremism Affected Areas (RCPLWEA)
61.16
353.94
606.13
0
100
200
300
400
500
600
700
Road
Leng
th co
mpl
eted
( 00
0 KM
)
Completed Road Length (km) Connected Habitations Precentage (PMGSY–I PMGSY–II PMGSY–IIII RCPLWEA)
Source:MinistryofRuralDevelopment:http://omms.nic.in/dbweb/Home/TimeSeries;(downloadedon27January2022)Note:RoadConnectivityProjectforLeftWingExtremismAffectedAreas(RCPLWEA)
Multidimensional Poverty
10.94 UsingNFHS-4(2015-16) report, in linewithglobalMultidimensionalPoverty Index(MPI),NITIAayogpreparedMultidimensionalPovertyIndexatthenational,forallstatesanddistrictsofIndia.Itwillenablemeasuringdeprivationacrosstwelveindicatorsatnational,Statesanddistrictslevel.In2015-16,25percenthouseholdswerefoundtobemultidimensionalpoorinIndia.Amongstates,Biharhadlargest(51.91%)multidimensionalpoorhouseholds,followedbyJharkhand(42.16%),UttarPradesh(37.79%),MadhyaPradesh(36.65%),Assam(32.67%)andRajasthan(39.46%).SincetheMPIindexisbasedonNFHS-4dataof2014-15,itmayserveasthebaselineformeasuringdeprivationinfuturestudies.

CHAPTER
11Tracking Development through Satellite Images & Cartography
An important theme of this year’s Economic Survey is the use of new forms of data and information for tracking economic activity and development. Chapter 1 looked at the use of high-frequency data for the real-time management of an economy through uncertain times. This chapter looks at the use of another kind of data – geo-spatial data and cartographic techniques – to track, compare and represent longer term developments. Geospatial maps not only lets users visualize data but also helps users to better understand trends, relationships and patterns. The use of maps is not entirely new and previous Economic Surveys have used them for years, but there is now a plethora of information from satellites, drones, mobile phones and other sources. Moreover, there has also been a dramatic improvement in cartographic technology that allows for better representation of the information. This chapter illustrates some of the interesting ways of depicting geospatial data.
Using satellite images, India’s night-time luminosity is compared between 2012 and 2021 in Figures 1A and 1B. Night-time luminosity provides an interesting representation of the expansion of electricity supply, the geographical distribution of population and economic activity, urban expansion as well as growth of ribbon developments between urban hubs. Similarly, using geospatial and cartographic techniques, the subsequent maps show the extent of physical as well as financial infrastructure development in India. This includes expansion of national highways, airports, commercial bank branches, metros, etc. The maps in Figure 5A & 5B depict change in net sown area of India over the last 15 years. The maps have been created by combining satellite data over the course of a 12 month period in each year.
The images in Figures 6A & 6B compare the Kharif crop cycle in Moga district, Punjab during 2005 and 2021. The images show that Kharif sowing cycle has shifted ahead by around two-to-three weeks causing the Kharif harvest to almost coincide with Rabi sowing in November. The closing of the gap is a likely factor that encourages farmers to burn stubble and may be related to restrictions on early transplanting of Kharif paddy. These restrictions were introduced in 2009 in order to reduce pumping of ground-water but may have had the unintended consequence of damaging air quality.
Satellite imagery is used to show annual water storage cycle at Stanley Reservoir, Tamil Nadu in Figure 7A & 7B. Using new geo-spatial methods, population density of select Indian cities is compared over time, showing the extent of urban expansion in Delhi-NCR and Bangalore between 2001 and 2021. Finally, using satellite imagery, Figures 18A, 18B, 19A & 19B illustrate wasteland redeployment in Andhra Pradesh and Gujarat.
While this chapter has restricted itself to static two-dimensional images due to practical considerations of publication, readers will be aware that dynamic and multi-dimensional cartography is now commonplace for every-day activities like ordering a taxi or looking for an address.

390 Economic Survey 2021-22
Figure 1A: India Night-time Luminosity, 2012
Source: NASA, MapmyIndia

391Tracking Development through Satellite Images & Cartography
Figure 1B: India Night-time Luminosity 2021
Source: NASA, MapmyIndia

392 Economic Survey 2021-22
Figure 2A: India’s National Highway Network (As of August 2011)
Source: Ministry of Road Transport and Highways, MapmyIndia

393Tracking Development through Satellite Images & Cartography
Figure 2B: India’s National Highway Network (As of August 2021)
Source: Ministry of Road Transport and Highways, MapmyIndia
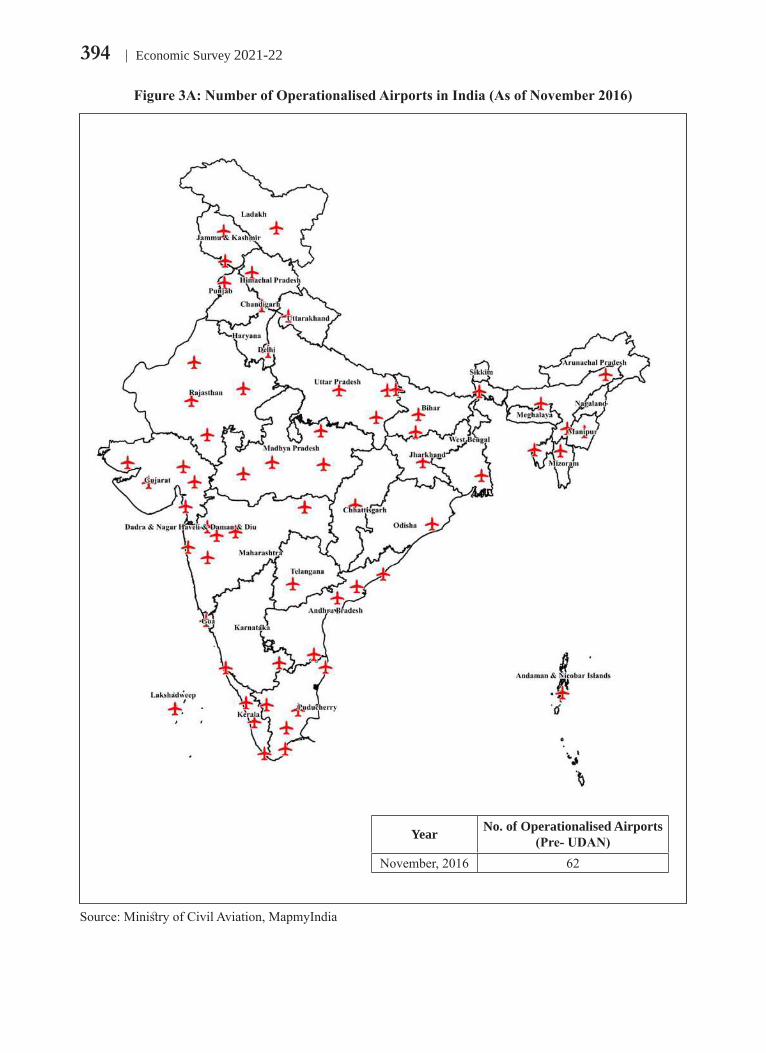
394 Economic Survey 2021-22
Figure 3A: Number of Operationalised Airports in India (As of November 2016)
Source: Ministry of Civil Aviation, MapmyIndia
Year No. of Operationalised Airports(Pre- UDAN)
November, 2016 62

395Tracking Development through Satellite Images & Cartography
Figure 3B: Number of Operationalised Airports in India (As of December 2021)
Source: Ministry of Civil Aviation, MapmyIndia
Year No. of Operationalised Airports(Post- UDAN)
December, 2021 130

396 Economic Survey 2021-22
Figure 4A: Spread of Commercial Bank Branches in India (As of March 2011)
Source: Reserve Bank of India, MapmyIndia

397Tracking Development through Satellite Images & Cartography
Figure 4B: Spread of Commercial Bank Branches in India (As of March 2021)
Source: Reserve Bank of India, MapmyIndia

398 Economic Survey 2021-22
Figure 5A: Net Sown Area in India, 2005-06
Source: Indian Space Research Organisation (ISRO)Note: The net sown area includes the extent of crops, medicinal crops, plantations, vegetables, floriculture and orchards during Kharif, Rabi and Zaid seasons. It is estimated using multi-temporal AWiFS sensor data aboard Resourcesat-1/2 satellites
Year Net Sown Area (Million Hectares)
2005-06 127.4

399Tracking Development through Satellite Images & Cartography
Figure 5B: Net Sown Area in India, 2020-21
Source: India Space Research Organisation (ISRO)Note: The net sown area includes the extent of crops, medicinal crops, plantations, vegetables, floriculture and orchards during Kharif, Rabi and Zaid seasons. It is estimated using multi-temporal AWiFS sensor data aboard Resourcesat-1/2 satellites
Year Net Sown Area (Million Hectares)
2020-21 156.8

400 Economic Survey 2021-22
Figure 6A: Kharif Crop Cycle in Moga Distrcit of Punjab, 2005
26 June 2005 28 July 2005 29 August 2005
21 September 2005 23 October 2005 8 November 2005
Source: ISRO, MapmyIndia
Figure 6B: Kharif Crop Cycle in Moga Distrcit of Punjab, 2021
25 June 2021 25 July 2021 25 August 2021
15 September 2021 25 October 2021 5 November 2021
Source: ISRO, MapmyIndia

401Tracking Development through Satellite Images & Cartography
Figure 7A: Annual cycle of water storage at Stanley Reservoir, Tamil Nadu, 2016-17
June 2016 Aug 2016 Oct 2016
Dec 2016 Mar 2017 May 2017
Source: ISRO
Figure 7B: Annual cycle of water storage at Stanley Reservoir, Tamil Nadu, 2020-21
June 2020 Aug 2020 Oct 2020
Dec 2020 Mar 2021 May 2021
Source: ISRO

402 Economic Survey 2021-22
Figure 8A: Satellite image of Golf-course Road, Gurugram 2005
Figure 8B: Satellite image of Golf-course Road, Gurugram 2021
Source: MapmyIndia

403Tracking Development through Satellite Images & Cartography
Figure 9A: Population density in Delhi NCR 2001
Figure 9B: Population density in Delhi NCR 2021
Source: MapmyIndiaNote : Population density has been estimated using geo-spatial mechanism and may not match census data.

404 Economic Survey 2021-22
Figure 10A: Satellite image of Bangmane Tech Park, Bengaluru 2002
Figure 10B: Satellite image of Bangmane Tech Park, Bengaluru 2021
Source: MapmyIndia

405Tracking Development through Satellite Images & Cartography
Figure 11A: Population density in Greater Bengaluru region 2001
Figure 11B: Population density in Greater Bengaluru region 2021
Source: MapmyIndiaNote : Population density has been estimated using geo-spatial mechanism and may not match census data.

406 Economic Survey 2021-22
Figure 12A: Satellite image of Bandra-Kurla, Mumbai 2001
Figure 12B: Satellite image of Bandra-Kurla, Mumbai 2021
Source: MapmyIndia

407Tracking Development through Satellite Images & Cartography
Figure 13A: Delhi Metro-rail network 2011
Figure 13B: Delhi Metro-rail network 2021
Source: Delhi Metro Rail Corporation, MapmyIndia

408 Economic Survey 2021-22
Figure 14A: Bangalore Metro-rail network 2011
Figure 14B: Bangalore Metro-rail network 2021
Source: Bengaluru Metro Rail Corporation, MapmyIndia

409Tracking Development through Satellite Images & Cartography
Figure 15A: Kolkata Metro-rail network 2011
Figure 15B: Kolkata Metro-rail network 2021
Source: Kolkata Metro Rail Corporation, MapmyIndia

410 Economic Survey 2021-22
Figure 16: Metro-rail networks across different Cities 2021
Lucknow
Kochi
Kanpur
Ahmedabad
Source: Uttar Pradesh Metro Rail Corporation, Kochi Metro Rail Corporation, Ahmedabad Metro Rail Corporation,MapmyIndia
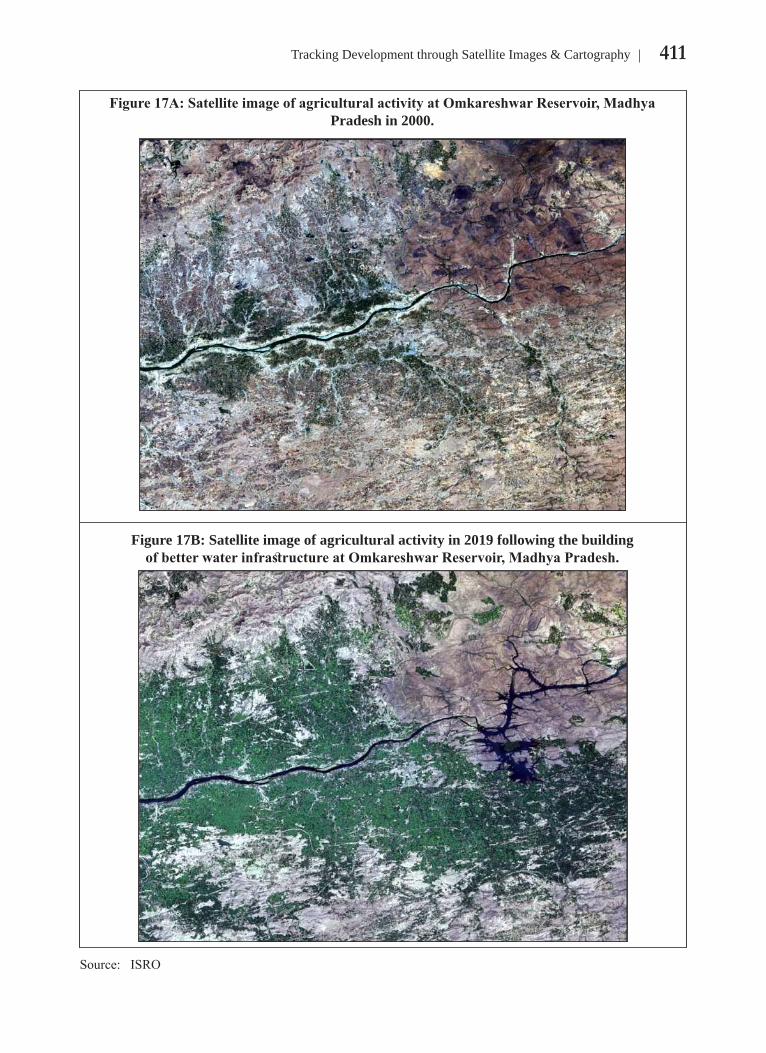
411Tracking Development through Satellite Images & Cartography
Figure 17A: Satellite image of agricultural activity at Omkareshwar Reservoir, Madhya Pradesh in 2000.
Figure 17B: Satellite image of agricultural activity in 2019 following the building of better water infrastructure at Omkareshwar Reservoir, Madhya Pradesh.
Source: ISRO

412 Economic Survey 2021-22
Satellite image of wasteland redeployment for industrial use in Nellore, Andhra Pradesh
Figure 18A: 2009
Figure 18B: 2021
Source: ISRO

413Tracking Development through Satellite Images & Cartography
Satellite image of Solar Power Plant development in Wasteland Area, Charanka, Gujarat
Figure 19A: 2005
Figure 19B: 2022
Source: ISRO


Government of India
Government of India