Economic Position and Prospects - of Colombia
187
Report No. 6%-CO Economic Position and Prospects of Colombia (In Three Volumes) Vol. 11: Statistical Appendix May 20, 1975 Latin America and Caribbean Regional Office Not for Public Use FILE COPY Document of the International Bank for Reconstruction and Development International Development Association This report was prepared for official useonly by the Bank Group. It may not be published, quoted or cited without Bank Groupauthorization. The Bonk Groupdoes not accept responsibility for the accuracy or completeness of the report. Public Disclosure Authorized Public Disclosure Authorized Public Disclosure Authorized Public Disclosure Authorized Public Disclosure Authorized Public Disclosure Authorized Public Disclosure Authorized Public Disclosure Authorized
-
Upload
khangminh22 -
Category
Documents
-
view
0 -
download
0
Transcript of Economic Position and Prospects - of Colombia

Report No. 6%-CO
Economic Position and Prospectsof Colombia(In Three Volumes)
Vol. 11: Statistical AppendixMay 20, 1975
Latin America and Caribbean Regional Office
Not for Public Use
FILE COPYDocument of the International Bank for Reconstruction and DevelopmentInternational Development Association
This report was prepared for official use only by the Bank Group. It may notbe published, quoted or cited without Bank Group authorization. The Bonk Group doesnot accept responsibility for the accuracy or completeness of the report.
Pub
lic D
iscl
osur
e A
utho
rized
Pub
lic D
iscl
osur
e A
utho
rized
Pub
lic D
iscl
osur
e A
utho
rized
Pub
lic D
iscl
osur
e A
utho
rized
Pub
lic D
iscl
osur
e A
utho
rized
Pub
lic D
iscl
osur
e A
utho
rized
Pub
lic D
iscl
osur
e A
utho
rized
Pub
lic D
iscl
osur
e A
utho
rized

CURRENCY EQUIVALENTS
Currency Unit: Peso
Exchange Rate Effective April 17, 1975
Selling Rate - US$1.00 = Col$30.03Col$1.00= US$0.333
Buying Rate - US$1.00 = Col$30.07
Average Exchange Rate (Selling)1972 1973 197h
US$1.00 Col2T1.92 Col$23-67 Col$26.14col$1.00= us$.o456 US$.0422 uS$.03 8 2

ECONOMIC POSITION AND PROSPECTS OF COLOMBIA
STATISTICAL APPENDIX
Population and Employment
1.1 Birth and Death Rates 194o0, 1945, 1950, 1955 and 1956-68, andComparison with other Latin American Countries.
1.2 Specific Fertility Rates According to the the 1966 National Health Survey.1.3 Summary Projection of Total and Economically Active Population, 1970-85.1.4 Distribution of Total Labor Force According to Sector as of June 1970.1.5 Unemployment Rates in the City of Bogota, 1965-72.1.6 Unemployment, Underemployment and Participation Rates in Four Cities,
197-74.1.7 Composition of the Labor Force Four Main Cities - June 1974.1.8 Unemployed by Occupational Position and Economic Sector Seeked
Four Main Cities - June 1974.1.9 Educational Level of the Occupied Labor Force and the Unemployed - 19701.10 Unemployed by Educational Level and Number of Years Completed Four Main
Cities - June 1974.1.11 Duration of Unemployment Four Main Cities - June 197h1.12 Employment and Remunerations in 142 Industrial Firms - 1971 -741.13 Index of Employees Covered Under Social Security System (ICSS)1.14 Income Distribution in Colombia According to Seven Estimates
National Accounts
2.1 Gross Domestic Product or Expenditure, 1958-742.2 Implicit Price Deflators for Gross Domestic Product, 1958-742.3 Gross Domestic Product or Expenditure, in 1958 prices, 1958-742.4 Gross Domestic Product by Sector 1969-742.5 Income and Product Aggregates, 1958-732.6 National Income Components, 1958-732.7 General Government Current Income Receipts, 1958-702.8 General Government Current Expenditure and Saving, 1958-732.9 Gross Saving and Investment, 1958-732.10 Composition of Gross Domestic Investment, 1958-732.11 Gross Domestic Investment, by Public and Private Sectors, 1958-732.12 Current Foreign Transactions, 1958-732.13 Disposable Personal Income, 1958-732.14 Personal Income, 1950-732.15 Wages and Salaries as Percentage of Value Added, by Sector, 1950-732.16 GNP, GDP, and National Income in Current and Constant 1958 Prices, 1950-732.17 Incremental Capital-Output Ratios, 1950-732.18 GDP and Gross Fixed Investment Price Deflators, 1950-732.19 Incremental Capital-Output Ratios, 1950-732.20 Domestic Savings Ratios, 1950-73 (Current Prices)2.21 Domestic Savings Ratios, 1950-73 (1958 Prices)2.22 General Government Income and Expenditure, 1950-73 (Current Prices)2.23 General Government Consumption, Savings and Investment, 1950-73 (1958 prices)

-2-
Trade and Payments
3.1 Average- Annual Prices for Representative Coffees of Four MajorCategories, 1 958-74
3.2 Foreign and Domestic Prices for Colombian Coffee, 1948-743.3 Supply and Distribution of Green Coffee, 1958/59 - 1973/743.4 Green Coffee Exports, by Value and Quantity, 1958-74 and 1975-773.5 Crude Petroleum Production, Apparent Domestic Consumption, and
Exportation, 1958-74 and 1975_773.6 Coffee and Other Export Registrations, 1958-743.7 Minor-Export Registrations by Main Products3.8 Reimbursable and Non-Reimbursable Import Registrations, 1958-743.9 Import Registrations by Economic Category - 1969-743.10 Customs Clearance of Merchandise Exports, 1965-733.11 CIF Imports, by Principal Product Groups, 1958-723.12 CIF Commodity Imports, Classified According to End-Use, 1958-713.13 Direction of Trade, 1971-743.14 Balance of Payments, 1969-743.15 Minor Exports Exchange Surrenders by Main Products3.16 Advance and Normal Merchandise Export Exchange Surrender, by Quarter, 1966-743.17 Central Bank Gross Receipts of Foreign Exchange, 1963-743.18 Central Bank Disbursements of Foreign Exchange, 1963-743.19 Central Bank Gross Reserves of Gold and Foreign Exchange, 1957-743.20 Central Bank International Monetary Liabilities, 1962-743.21 International Monetary Reserves of the Central Bank, 1968-743.22 Official Market Rates of Exchange, by Quarter, 1967-743.23 Certificate Market Selling Rate of Exchange, by Month 1967-743.24 Balance of Payments Export Projection3.25 Balance of Payments Import Projection3.26 Summary Balance of Payments Projections
External Debt
4.1 External Public Debt Outstanding as of December 31, 1974 Debt Repayablein Foreign Currency
4.2 External Public Debt Transactions for 1965-74 and Projected Pipeline1975-94. Repayable in Foreign Currency
4.3 External Debt Outstanding as of December 31, 1974 Debt Repayable inLocal Currency
14.4 External Public Debt Transactions for 1965-74 and Projected Pipeline1975-84. Repayable in Local Currency
Public Finances
5.1 Public Sector Resources for Investment, 1970-74 (In Millions of Col$)5.2 Public Sector Resources for Investment, 1970-74 (As percent of GDP m.p.)5.3 Public Sector Resources for Investment, 1970-74 (Percentage Distribution)5.4 Analysis of Consolidated Public Sector Finances, 1970-745.5 National Government Operations, 1970-74

-3-
5.6 National Government Revenues, 1970-7745.7 Tax Burden, 1970-745.8 Buoyancies with Respect to GDP, 1970-745.9 Public Sector Transfers, 1970-745.10 Summary Accounts of Major Decentralized Agencies, 1970-745.11 Social Security System Revenues and Expenditures, 1970-745.12 ProJected National Government Revenues, 1975-805.13 Projected National Government Operations, 1975-805.14 Projected Public Sector Finances, 1975-805.15 Sectoral Distribution of Public Gross Fixed Investment, 1970-80
Money and Credit
6.1 Money Supply and Financial Savings6.2 Money Supply and Velocity6.3 Base Money, and the Operations of the Monetary Authorities6.4 Bogota and Medellin Stock Exchanges, 1969-19746.5 Composition and Growth of the Money Supply, 1960-19746.6 Annual Percentage Increases in GDP and Money Supply, 1965-746.7 Financial Savings, 1969-746.8 New Commercial Bank Loans, by Quarter, 1965-746.9 Commercial Bank Loans, by Quarter, 1968-19746.10 Banking System Loans, by Quarter 1968-19746.11 Summary Accounts of the Banking System6.12 The Money Supply and the Money Multipliers6.13 Description of the Administered Funds
Agriculture
7.1 Production of Principal Crops7.2 Area in Principal Crops, 1962-747.3 Crop Yields per Hectare, 1962-747.4 Cattle Population and Extraction, 1963-747.5 Gross Value of Agricultural Production, in Constant 1958 Prices, 1950-747.6 Indices of Physical Volume of Agricultural Production, 1950-747.7 Agricultural Gross Value Added, in Constant 1958 Prices, 1950-74.47.8 Price Deflators for Agriculture, Non-Agriculture, and Total GDP, 1950-737.9 New Loans Extended in the Agricultural Sector, 1969-747.10 Estimated Farm Prices and Support Prices for Principal Commodities,
1950-747.11 Fertilizer Production and Plant Nutrient Supply, 1970-757.12 Census Farms by Size, 1960 and 1970/717.13 Census Farms and Farmland by Tenure and Size, 1960 and 1970/717.14 Regional Groupings of Municipios with High Concentrations of Small
Farms, by Coffee and Non-coffee areas7.15 Trends in Values of Selected Agricultural Exports, as Designated at
at Three Stages, 1970-747.16 Trends in Quantities of Selected Agricultural Exports, 1970-747.17 Per-Capita Availabilities of Foods and Principal Nutrients, 194,8, 1957, and
1970

-4-
Industry
8.1 Increases in Factory Emiployment, 1953-728.2 Indicators of Import Substitution and Sources of Industrial Growth, 1963-738.3 Structure of Manufacturing Industry by Size, 19708.4 Paid Employment in Manufacturing Industries8.5 Domestic Manufacturing Output and Imports8.6 Commercial Bank Credit to the Manufacturing Sector8.7 Corporaciones Financieras, Caja Agraria and Corporaci6n Popular -
Loans to the Industrial Sector8.8 Industrial Exports8.9 Proportion of Industrial Exports in Gross Value of Industrial Output
Wages and Prices
9.1 Consumer Price Indices for Bogota, Medellin and the Nation, 1958-729.2 National Consumer Price Indices by Expenditure Category, 1958-729.3 Wholesale Price Indices, by Main Commodity Group, 1960-749.4 Changes in Wholesale and Consumer Price Indices, 1970-749.5 Average Annual Increases in Selected Price Indicators, 1950-749.6 Prices of Construction Materials in Bogota, 1967-74
Foreign Assistance
10.1 Loan Commitments by Agency, 1961-7410.2 Loan Commitments by Agency for International Development, 1961-7410.3 Loan Commitments by Export-Import Bank of the United States, 1961-7410.4 Ioan Commitments by Inter-American Development Bank, 1961-7410.5 IBRD Loans and IDA Credits Committed, 1949-7410.6 Loan Commitments by Sector and Main Agencies, 1961-74
Human Resources
11.1 Pupil Enrollment in Primary School, 1963-7311.2 Pupil Enrollment in Secondary School, 1963-7311.3 Enrollment in Colombian Universities (Public and Private) 1963-7311.4 Enrollment in Universities According to type of Program and Course of
Studies - 197311.5 Ratio of Pupils/Teacher at each level, 1963-7311.6 Drop out Rates at all levels11.7 Educational Level of the Labor Force, 1951-7011.8 Ten Main Causes of Death Among Pre-School Children and Total Population -
Percent of all Deaths11.9 Main Causes of Death Among Children Under Age 4, 197210.10 Indirect Indicators of Nutritional Status, 1963-7111.11 Recommendations and Availabilities in Calories and Nutrients for the
Colombian Population, and Percentage of Adequacy, 197211.12 Percentage of Adequacy of Calories and Nutrient Consumption in the diet
of 1,400 Families from Various Geographical Areas, 197211.13 Comparison Between Annual Needs for Basic Food Groups for Human
Consumption and Their Availability, 1966-7211.14 Percent Adequacy of Family Dietary Intake of Calories and Nutrients per
Capita in ten Urban and Rural Areas, by Socio-Economic Levels, 1963-6611.15 Supply and Demand of "Certified" Auxiliary Nurses, 1975-90

Table 1.1 - COLOMBIA: BIRTH AND DEATH RATESav 19h09 19t5, 1950,1955AND 1956-68, AND COMPARISON WITH OTHER LATIN AMERICAN COUNTRIES
(Rates per Thousand Population)
Birth Death Average GrowthYear Rate Rate Rate in %
1940 32 151945 32 161950 36 141955 39 12
1956 40 131957 40 121958 41 121959 41 121960 39 121961 39 111962 40 111963 39 101964 39 101965 37 101966 36 91967 35 91968 33 91951-64 3.21964-73 2,9 b/
ColombiaArgentina (1970) 21 8 1.6Bolivia (1960) 44 21 3.6Brazil (1960) 39 10 2.6Chile (1960) 37 12 2.5Ecuador (1962) 48 14 3.4Mexico (1960) 45 12 3.5Peru, (1961) 45 16 3.1Uruguay (1963) 22 9 1.3Venezuela (1961) 46 8 3.5
Latin America(1960) 40 11 2.7
Total World(1960) 34 16 1.9
a/ Birth and death rates - under registration is important, mainly since1968, when the registration system was changed.
b/ Based on provisional results from 1973 census, assuming a 7% underco-verage.
Source: 1940-1965, World Bank Atlas 1970 and United Nations DemographicYearbooks.

Table 1.2 - COLOMBIA: SPECIFIC FERTILITY RATES ACCORDING TO THE 1966 NATIONAL HEALTH SURVEY
(Number in thousands, rates per thousand women, income in pesos)
A n n u a 1 F a m i 1 y I n c o m e
3,600 or Less 3,601-6,000 6,001-12,000 12,001-50,000 50,000 and More No information Total
Age Number Rate Number Rate Number Rate Number Rate Number Rate Number Rate Number Rate
Urban
15-24 26.0 173 18.0 121 26.5 110 16.1 84 4.7 45 16.2 120 107.5 11125-34 25.7 237 28.6 268 40.5 233 19.2 199 9.3 158 28.3 262 151.6 23235-44 15.4 133 10.2 131 18.5 144 5.0 73 1.8 52 7.9 95 58.8 11745-54 0.7 0.4 - 1.0 - - 2.1
Subtotal 67.8 154 57.2 147 85.5 138 41.3 98 15.8 71 52.4 139 320.0 129
Rural
15-24 74.9 232 32.9 225 15.7 198 2.8 117 0.6 53 25.3 113 152.2 21525-34 86.7 340 33.5 333 13.2 280 5.7 354 1.1 239 23.2 303 163.4 327
35-44 42.3 217 19.4 242 7.7 225 1.5 98 0.2 51 8.9 142 80.0 20445-54 4.0 26 0.8 0.5 - - 1.2 21 6.5 21
Subtotal 207.9 223 86.6 228 37.1 197 10.0 158 1.9 80 58.6 185 402.1 211
Total
15-24 100.9 212 50.9 173 42.2 132 18.9 88 5.3 46 41.5 161 259.7 155
25-34 112.4 310 62.1 299 53.7 243 24.9 221 10.4 164 51.5 279 315.0 273
35-44 57.7 188 29.6 188 26.2 161 6.5 77 2.0 52 16.8 115 138.8 15545-54 4.7 21 1.2 11 0.5 1.0 - 1.2 11 8.6 13
Total 275.7 200 143.8 187 122.6 152 51.3 106 17.7 72 111.0 160 722.1 165
In 1965-66, 1,000 pesos US$67
Rates not shown when based on a small number of cases.
Source: Aqualimpia M., Carlos, et al, Demographic Facts of Colombia, 1969 (Reference 6).

Table 1.3 - COLOMBIA: SUMMARY PROJECTION OF TOTAL A1NDECONOMICAILY ACTIVE POPULATION. 1970-85
(mid-year estimates in thousands)
1,970 1975 19810 1985
(1) Total Population 21,632 25,278 29,165 32,818
Age 0- 9 7,122 8,301 9,056 9,157Age 10-14 2,948 3,073 3,780 4,263Age 15-64 10,939 13,236 15,502 18,409Age 65 and Over 623 667 828 989
(2) Economically Active Population 6.476 7,737 9,134 10,841
Age 10-14 247 223 235 224Age 15-64 6,046 7,329 8,685 10,387Age 65 and Over 183 185 214 230
Urt.an 3,695 4,812 6,178 7,944Rural 2,781 2,925 2,956 2,897
Male 5,168 6,o96 7,106 8,322Female 1,308 1,641 2,028 2,519
(3) Percentage, 2/1 29.9 30.6 31.3 33.0
(4) Aver=ge Annual Rates of Growth: 1970-75 1975-80 1980-85
Total Population 3.2 2.9 2.4Active Population 3.5 3.5 3.5
Source: Proyecciones de la Poblacion Colombiana, 1965-85, C.E.D.E.,
Bogota, October 1968 and Proyecciones de la Poblacion Colombiana
Economicamente Activa 1965-85: Resultados Estadisticos, C.E.D.E.,
Bogota, July 1969Q

Table 1.4 - COIOMBIA: DISTRIBUTD0N OF TOTAL LABR FORCE ACCORDINGTO SNETOR AS OF JUNE 1970
Urban Rural TbtalSector Males Females males Females males Females
Agriculture 14.9 1.3 86.1 28.8 49.2 7.0
Mines and Quarries 0.6 - 0.7 0.9 0.7 0.2
Manufacturing Industry 22.1 20.3 4.0 25.7 13.4 21.4
Public Utilities 1.1 0.3 0.1 - 0.6 0.2
Construction 8.7 0.5 2.0 0.3 5.4 0.5
Trade, Restaurants, Hotels 19.4 22.9 2.7 11.4 11.3 20.5
Transport and Communications 8.6 1.5 1.5 0.3 5.2 1.3
Finance Institutions 2.8 2.0 0.1 - 1.5 1.6
Service Sector 21.8 51.2 2.8 32.6 12.7 47.3
7TOAL 100.0 100.0 100.0 100.0 100.0 100.0
Source: DANE - Analisis del Desempleo en Colombia.

Table 1.5 _ COLOMBIAt UNEDLOYMENT RATES IN THE CITYOF BOGOTA, 1965-72
Male Female Total
1965 a/ 8.3 10.1 8.9
March 8.2 10.8 9.2
June 8.0 10.2 8.8
September 9.5 10.1 9.7
December 7.4 9.3 8.0
1966 9.2 11.6 10.1
March 9.0 12.0 10.1June 10.9 12.4 11.5
September 9.7 9.7 9.7
December 7.2 12.3 9.1
1967 10.9 14.2 12.2
March 14.9 17.9 16.0
June 10.6 15.9 12.7
Septerber 9.9 11.8 10.6
December 8.3 11.3 9.5
1968 8.9 15.5 l1.5
March 10.3 18.6 L3.6
June 9.2 15.1 11.6
September 9.3 14.2. L1.2
December 7.0 14.0 9.8
1969 7.9 12.4 9.6
March 8.6 14.9 11.0
June 9.2 15.6 11.6September 7.6 11.0 8.9
December 6.1 8.1 6.9
1970 ... ... 8.2March 6.4 12.6 8.8June 6.3 10.4 7.9
September ... ... 8.8
December ... ... 7.3
1971 ......
March .0* ... 8.9June ... ... 9.3
September ... ... 8.4
December ... ... ...
1972 *' '-'
March ... ...
June ... *c.
Septemiber ... ... 6.8December
a/ Annual figures are arithmetic averages of quarterly figures.
Source: Centro de Estudios sobre Desarrollo Economico (CEDE),Universidad de los Andes.

Table 1-6 - COLM ON$M IWIWT, UNDMMW}UDIT AND PWARICIPTION RATESIN FOU4 GITD
1970-19714 /
Jun.Jul. Mar.Apr, Jul.Aug. Nov.Dee. Oct.Nov. June Nov.Deo._170 1971 1971 1971 1972 1974 1974
Unemployment Rates
Barranquilla
Urban 15.4 14.7 18.4Rural 7.1Total 11.42 9.2 11.3 15.2 14.6
hbgota
Urban 8.4 6.6 10.7 7.44Rural 11.1Total 13.0 8.9 9.3 8.4 6.8
CaliUrban 10.7 13.3 11.3 12.20Rural 7.7Total 12.44 10.9 9.4 10.5
Medellin
Urban 12.7 13.0 13.5 12.94Rural 12.6 16.4Total 5.92 13.1 12.1 12.6 14.2
Total i
Urban 10.1 12.6Rural 6.4Total 8.9
Under-employment Rates
Barranquilla
Urban 21.9 16.0 25.4Rural 6.7 7.1Total 21.5
BbgotaUrban 12.5 14.1 16.3 16.54Rural 20.0 21.1Total 12.7 14.1
CallUrban 17.8 15.8 15.8 15.91Rural - 7.7Total 17.5 15.2
Medellin
Urban 26.1 17.9 12.0 12.63Rural 27.7 14.8Total 25.9 17.5
Total 2
Urban 15.0 17.84Rural 11.1Total 13.7
Participation Rates
Barranquilla
Urban 33.7 33.8 35.4Rural 27.3Total 32.3 29.4 33.2
BogotfUrban 33.5 32.3 37.9 35.32Rural 28.5 23.9Total 33.3 33.9 33.4 32.5
CaliUrban 34.6 33.9 36.1 35.144Rural 34.9 38.2Total 32.7 30.7 34.5
Medellfn
Urban 31.0 34.8 34.6 34.29Rural 29.0 28.4Total 28,9 29.4 29.8 33.4
Total JUrban 32.0 36.6Rural 29.5Total 31.1
J Provisional figures, except for June 1970.hi Weighted average of the four cities- for
October-November 1972= National total
Source: National Statistics Department (DANE)- Unpublished figures-

Table 1.7 - COLOMBIA: COMPOSITION OF THE LABOR FORCEFOUR MAIN CITIES - JUNE 1974
PERCENTAGES
Age Groups Total Labor Force Occupied Unemployed _
Formerly First Time TotalEmployed Seekers Unemployed
Under 12 .
12-14 1 1 1 3 4
15-19 14 12 11 20 31
20-24 19 18 16 12 28
25-29 15 15 9 4 13
30-34 11 11 5 1 6
35-39 10 11 3 1 4
10-44 8 9 4 1 5
145-49 7 8 3 1 4
50-54 6 7 2 - 2
55-59 3 3 1 - 1
60-64 2 2 1 - 1
Above 65 2 2 1 - 1
Total 100 100 57 43 100
(100) (87.2) (7.4) (5.4) (12.8)
Source: DANE - Encuesta de Hogares No. 8 - June 1974(Unpablished)

Table 1.8 - COLOMBIA: UNEMPLOYED BY OCCUPATIONAL POSITION AND ECONOMIC SECTOR SEEKEDFKUPR MAIN CITIES - JUNE 1974
PERCENTAGES
First time Job seekers Had already worked
Total of which _1 Total of which =Blue White Self- Blue White Self-Collar Collar Empl. Collar Collar Empl.
Agriculture 1
Industry 25 (54) (15) (1) 32 (64) (35) (1)
Construction 3 9 (75) ( 16) (7)
Commerce 32 (8) (90) (1) 25 (6) (31) (11)
Transportation 1 5
Services 21 (7) (90) (3) 16 (17) (78) (5)
Others 4 4
Anything 13 (25) (64) (5) 8 (37) (53) -
No answer -
Total 100 (2h) (73) (2) 100 (38) (55) (5)
/1 Other categories not included here employer, does not know, no answer.
... negligible
Source: DANIE - Encuesta de Hogares no. 8 (June 1974)(unpublished)

Table 1.9- COLOMBIA: EDUCATIONAL LEVEL OF THE OCCUPIED LABOR FORCE AND THE UNEMPLOYED - 1970(Percentages of total unemployed or occupied workers)
Educational Level Colombia Bogota
- - - - - - - Unemployed - - - - - _ - - - - - - - - Unemployed - - - - - - -
Occupied formerly first-time total Occupied formerly first-time totaloccupied job-seeker unemployed occupied job-seeker unemployed
No Education 19.2 7.6 2.8 10.4 6.5 2.1 0.7 2.8
Urban Primary 39.1 30.7 16.1 46.8 43.0 27.9 14.3 42.2
Rural Primary 21.1 6.3 3.3 9.6 5.9 3.5 1.4 4.9
4 years basic Secondary 7.8 6.3 7.4 13.7 12.1 9.0 8.9 17.9
6 years Academic Secondary 5.8 4.1 5.6 9.7 14.1 7.6 6.4 14.0
Technical or Vocational Secondary 1.4 17.0 1.2 13.0 1.4 16.1 2.6 29.1 3.2 32.5 2.4 .20.0 1.8 20 4.2 40.0
Other Secondary 0.6 0.9 0.6 1.5 1,6 0.7 1.8 2.5
Primary Teacher Training 1.4 0.5 1.0 1.5 1.5 0.3 1.1 1.4(Secondary)
Higher Education 2.6 1.6 1.0 2.6 8.3 3.5 2.1 5.6
Other 1.0 0.9 0.8 1.7 3.8 3.1 1.4 4.5
Total 100.0 61.0 39.0 100.0 61.0 61.0 39.0 100.0
Source: DANE - Encuesta de Hogares 1970.

Table 1.10 - COLOMBIA: UNEMPLOYED BY EDUCATIONAL LEVEL AND NUMBER OF YEARS COMPLETEDFOUR MAIN CITIES - JUNE 197h
PERCENTAGES
Educational Total of which completed (number of years)Level 0 1 2 3 4 5 6 Total
No Education 2 100 - - - - - - 100
Urban primaryL-1 45 1 3 10 16 22 48 - 100
Rural primaryLi. 4 - 10 34 24 10 21 - 100
Bachillerato basico/2 11 - 15 24 26 36 - - 100
Bachillerato clasico/3 30 3 15 21 20 11 10 20 100
Technical or vocational secondary 2 - 28 22 6 39 5 - 100
Teachers' training 1 - - 12 - - 37 50 100
University 5 10 20 20 13 21 15 - 100
Other ... - - 50 - 50 - - 100
Total 100
/1 5 years
/2 4 first years of secondary school
13 6 years of secondary school
Source: DANE - Encuesta de Hogares no. 8 (June 1974)(unpublished)

Table 1.11 - COLOMBIA: DURATION OF UNEMPLOYMENTFOUR MAIN CITIES - JUNE 1974
PERCENTAGES
First Time FormerlyNumber of Weeks Job Seekers Employed
Up to 4 27 29
5 to 8 10 12
9 to 12 6 8
13 to 16 3 6
17 to 24 15 14
25 to 52 22 17
53 or more 16 13
No information 1 1
More than 1 year 56 50
More than 2 years 38 30
Total 100 100
Source: DAflE - Encuesta de Hogares no. 8 (June 1974)(unpublished)

Table 1.12 - COLOMBIA: EMPWQMENT AMD REMUNERATIONSIN 142 INDUSTRIAL FIRMS - 1971-1974
(January 1971 = 100)Period Z/ Real remuneration
Employment per employee l/
1971 March 99.4 101.6June 104.1 104.3September 99.7 102.8December 105.9 1020 4
1972 March 106.0 98.4June 108.2 930 4September 109.5 94.2December 109.7 93.5
1973 March 110.2 90.8June 111.2 85.6September 112.4 88.2December 112.7 86.9
1974 March 11303 84.8June 113.8 83.8
1/ Moving averages.
Source: DANE.

Table 1.13 - OOLOMBIAt INDEX OF DOlYESS COVERED UNDER SOCIAL-S=RITY SYSTEM(ICSS)
1971 1972 1973 1974(Dec.) (Dec.) (Dec,) (June)
Food 100 103.8 110.9 112.9Beverages 100 110.7 120.3 120.7Tobacco 100 104.9 112.6 107.8Textiles 100 109.1 115.9 117.6Clothing 100 110.4 152.2 127.8Timber 100 109.5 119.5 121,3Wood Furniture 100 105.2 115.9 121.8Paper 100 105.2 115.5 1 23 .0Printing 100 110.0 116.0 117.7Leather 100 108.5 124.7 125.8Rubber 100 117.0 127.8 132.8Chemicals 100 108.3 113.0 114.0Oil and Coal Ind. 100 112.4 137.1 l54-5Non Metal on Ind. 100 105.1 112.5 117.6Basic Metal Ind. 100 105.8 102.3 107,8Metal products 100 111.1 119.8 121.7Non electric Machinery 100 1O6.9 110.6 114h.4Electric Machinery 100 io.6 120.3 125.5Transport. Material 100 105.7 113.0 115.2Various Ind. 100 121.9 133.6 133.3
TOTAL 108.6 117.1 119.5'
Source: ICSS (Social Security Institute)

Table 1.114 COLOMBIA: INCOME DISTRIBUTION IN COLOMtBIA ACCORDING TO SEVEN ESTIMATES
% Population McLure 1/ Urruitia 2 DANE 3/ DANE L/ Taylor i ECLA i Berry Ji(Cumulative) 1964 1964 1970 1972 1961 1962 1960
(Urban) (Urban) (Agriculture)
10 - .5 - 1.5 1.5 - 2.0
20 - 1.0 3.5 - - 5.0
30 - 3.0 - 7.5 - - 8.5
(35-5) (9.3)
40 10.5 6.5 9.4 11.7 12.0 - 12.2
50 15.0 11.0 - 16.0 18.0 20 14.0
60 20.0 17.0 - 22.0 23.0 26 21.0
70 27.0 25.5 28.0 32.0 30.0 34 26.0
80 36.0 37.0 39.0 43.0 40.0 43 34.0
90 48.0 53.0 55.0 60.5 58.0 57 46.o
95 60.0 67.0 68.0 74.0 72.0 70 57.0
100 100.0 100.0 100.0 100.0 100.0 100 100.0
2 Charles G. McLure - The Incidence of Taxation in Colombia (1964) - in Musgrave and Gilles,Fiscal Reform for Colombia, Cambridge, 1971
2/ Miguel Urrutia and Elsa Villalba - Distribucion de Ingresos Urbanos para Colombia en 1964 - Bogota, 1970
3/ Encuesta de Hogares - 1970 - DANE
4/ Encuesta de Hogares en Siete Ciudades, 1970 - DANE - actualized to 1972 by Rodrigo Manrique in Revistade Planeacion y Desarrollo, July-Dec. 1972
5/ Milton Taylor OAS/IDB Joint Tax Program - Fiscal Survey of Colombia - JH Press, 1965
ECLA - Income Distribution in Latin America (A revised version of special study number IIIpublished in the Economic Survey of Latin America, 1969) EICN 12/863, New York, 1971
7/ Albert Berry - Land Distributio. Income oDistribution and the Productive Efficiency ofColombian Agriculture - Economic Growth Center, Yale University, March 20, 1971

Table 2.1 - COLOMBIA: GROSS DOMESTIC PRODUCT OR EXPENDITURE, 1958-74(Millions of Pesos)
Personal Gross GovernmentTotal Consump- Fixed Change Current NetGross tion Domestic in Purchases ExportsDomestic Expend- Invest- Inven- of Goods of Goods
Year Product itures ment tories & Services & Services
1958 20,682.5 15,004.9 3,338.8 523.8 1,196.1 618.9
1959 23,648.8 17,198.2 3,907.9 487.7 1,369.5 685.5
1960 26,746.7 19,589.3 4,844.9 649.9 1,659.3 13.3
1961 30,421.0 22,584.5 5,580.3 754.7 2,016.0 -514.5
1962 34,199.2 25,699.7 6,136.9 267.8 2,356.0 -261.2
1963 43,525.5 33,024.8 7,167,5 677.0 3,149.0 -492.8
1964 53,760.3 41,467.6 8,653.8 948.2 3,483.6 -792.9
1965 60,797.6 45,482.1 9,504.2 1,238.0 3,954.3 619.0
1966 73,612.3 55,842.6 12,303.6 2,736.8 4,910.4 -2,181.1
1967 83,082.7 61,596.0 14,729.1 611.9 5,716.8 428.9
1968 96,421.7 70,695.6 18,815.1 1,591.1 6,579.8 -1,259.9
1969 110,953.3 81,677.4 21,230.1 1,485.1 7,832.8 -1,272.1
1970 130,590.8 94,622.7 25,850.3 2,280.0 9,961.6 -2,123.8
1971 153,765.5 111.434.8 31,312.8 3.371.1 13.428.6 -5.781.8
1972 185.535.3 134,701.6 33.960.2 3,362.7 14,649.2 -1,138.4
1973 242,480.4 173,264.6 44,157.9 3,531.4 18,689.6 2,836.9
a 1974 319,017.0 238,906.0 50,838.0 9.452.0 24.896.0 -5.075.0
a/Estimated
Source: Banco de la Republica; IBRD

Table 2.2- COLOMBIA: IMPLICIT PRICE DEFLATORS FOR GROSSDOMESTIC PRODUCT; 1958-74
(Index Numbers, 1958=100)
Govern-mentCurrent
Per- Gross Pur- Gross Grossson- Fixed chases Exports Imports
Total al Dom- Change of of ofGross Con- estic in Goods Goods GoodsDomestic sump- Invest- Inven- and and and
Year Product tion ment tories Services Services Services
1958 100.0 100.0 100.0 100.0 100.0 100.0 100.0
1959 1o6.6 109.0 108.9 100.5 112.8 90.2 99.7
1960 115.7 118.7 114.7 118.9 123.9 92.1 103.5
1961 125.2 128.5 121.7 109.5 142.7 92.9 106.0
1962 133.5 135.0 133.4 121.2 153.9 90.9 101.8
1963 164.5 165.2 169.3 138.7 194.5 116.2 131.0
1964 191.4 190.3 181.6 160.8 212.3 135.4 132.5
1965 208.9 211.2 211.3 172.6 226.6 138.4 143.2
1966 240.1 237.4 253.2 197.2 269.4 18o.8 189.2
1967 260.1 258.4 284.2 245.6 298.1 185.5 206.7
1968 284.4 279.7 315.8 245.5 331.6 215.5 238.6
1969 307.7 299.4 347.6 255.1 366.o 241.2 260.1
1970 339.3 322.0 374.1 286.5 408.4 301.7 287.5
1971 378.7 358.9 424.0 315.4 445.3 312.8 310.3
1972 426.9 400.8 466.7 394.4 536.4 392.1 -354.3
1973 520.3 493.8 539.3 805.2 646.9 539.8 498.8
a/1974 E;45.2 618.2 673.0 950.0 809.9 640.0 642.7
a/ Estimated
Source: Banco de la Republica; IBRD

Table 2.3 - COLOMBIA: GROSS DOMESTIC PRODUCT OR EXPENDITURE,IN 1958 PRICES, 1958-74
(Millions of 1958 Pesos)
Govern- NetPersonal Gross ment Exports
Total GDP Fixed Change Current ofGross Growth tion Domestic in Purchases GoodsDomestic Rate Expend- Invest- Inven- of Goods &
Year Product % itures ment tories & Services Services
1958 20,682.5 15,004.9 3,338.8 523.8 1,196.1 618.97.2
1959 22,176.9 15,774.2 3,587.7 485.2 1,214.3 1,115.54.3
1960 23,123.4 16,509.2 4,225.6 546.6 1,339.6 502.45.1
1961 24,300.2 17,579.1 4,584.7 689.3 1,413.2 33.95.4
1962 25,615.3 19,031.4 4,602.0 220.9 1,531.2 229.83.3
1963 26,457.2 19,989.0 4,234.0 488.1 1,619.4 126.76.2
1964 28,088.8 21,795.0 4,764.2 589.8 1,641.2 -701.43.9
1965 29,100.0 21,538.9 4,498.9 717.1 1,744.8 600.35.4
1966 30,658.2 23,522.9 4,859.7 1,387.9 1,822.7 -935.04.2:
1967 31,947.0 23,840.5 5,182.6 249.1 1,917.7 757.16.1
1968 33,902.2 25,276.8 5,958.0 648.o 1,984.1 35.36.4'
1969 36,060.6 27,279.1 6,106.8 582.1 2,140.0 -47.46.7
1970 38,492.0 29,388.3 6,909,5 795.8 2,439.0 -1,040.65.5:
1971 40,604.9 31,046.5 7,385.9 1,068.7 3,015.5 -1,911.77.0
1972 43.463.0 33.610.6 7,277.1 852.7 2,731.2 -1,008.67.2
1973 46.602.6 35,087.3 8,187.5 438.6 2,889.2 - 2.06.1
1974 a/ 49.445.0 38,580.0 7,554.0 995.0 3,074.0 - 758.0
a./ Estimated
Source: Banco de la Republica; IBRD

Table 2.4 -COLOMBIA: GROSS DOMESTIC PRODUCT BY SECTOR 1969-74(Millions of 1958 Pesos)
1969 1970 1971 1972 1973 1974
Agriculture 10,250 10,691 10,960 11,563 12,081 12,683
Fishing and Hunting 131 136 122 182 207 231
Forestry 109 118 131 142 148 1.58
Mining 1,202 1,173 1,120 1,042 1,057 1,000
Manufacturing 6,836 7,404 8,030 8,763 9,567 10,216
Construction 1,350 1,402 1,503 1,530 1,706 1,518
Commerce 5,703 6,126 6,497 7,048 7,664 8,261
Transportation 2,189 2,404 2,508 2,662 2,878 3,e50
Communications 317 352 378 411 446 481
Electricity, Gas and 409 450 493 554 625 685Water
Banking, Finance, andInsurance 1,216 1,432 1,617 1,778 1,911 2,C67
House Rentals 2,184 2,310 2,449 2,574 2,725 2,909
Personal Services 2,483 2,652 2,831 3,044 3,263 3,474
Government Services 1,682 1,842 1,966 2,170 2,325 2,412
Source: Banco de la Republica.

Table 2.5-COLOMBIA: INCOME AND PRODUCT AGGREGATES, 1958-73a/
(Millions of Pesos)
Net Net NetDomestic Factor National
Net Indirect Product Income ProductDomestic Business at Factor to Rest at Factor
Year Product Taxes Subsidies Cost of World Cost
1958 18,245.9 1,41o.6 39.1 16,874.4 393.6 16,480.8
1959 21,107.7 1,564.0 35.5 19,579.2 305.9 19,273.3
1960 24,079.8 1,735.3 61.9 22,406.4 302.3 22,104.1
1961 27,617.2 1,824.3 77.6 25,870.5 394.6 25,475.9
1962 31,066.4 1,844.1 95.4 29,317.7 499.9 28,817.8
1963 39,44.7 2,346.5 115.1 37,213.3 811.4 36,401.9
1964 49,456.1 3,481.6 178.5 46,153.0 797.4 45,355.6
1965 55,801.6 4,017.8 113.6 51,897.4 897.6 50,999.8
1966 67,323.0 6,o65.5 345.6 61,603.1 1,242.9 60,360.2
1967 75,972.1 6,335.9 193.7 69,829.9 1,470.7 68,359.2
1968 88,292.1 7,869.2 211.0 80,633.9 2,003.2 78,630.7
1969 101,940.3 9,521.5 304.4 92,723.2 2,676.5 90,046.7
1970 120,370.5 11,394.6 830.1 109,806.0 3,591.9 106,214.1
1971 141,603.0 13,199.1 1,468.1 129,872.0 3,690.0 126,181.5
1972 171,534.0 15,488.7 1,628.2 157,673.5 4,478.3 153,195.2
1973 225,542.1 20,058.6 2,846.8 208,330.3 5,150.0 203,180.3
a/ Net Domestic Product at market prices is Gross Domestic Product afterdeduction of Capital Consumption Allowances. By subtracting IndirectBusiness Taxes and adding Subsidies one obtains Net Domestic Product atFactor Cost (Domestic Income), and deducting Net Factor Income to Restof World leaves Net National Product at Factor Cost (National Income).
Source: Banco de la Repuiblica.

Table 2.6- COLOMBIA: NATIONAL INCOME COMPONENTS, 1958-73
(Millions of Pesos)
Income Incomefrom fromProperty Govern- Inter-and ment estUnincor- Direct Proper- on thePorated Corpo- ties and Public
Wages & Enter- Corporate rate Enter- Debt NationalYear Salaries prises Saving Taxes prises (-) Income
1958 6,807.9 8,743.8 451.1 341.4 199.7 63.1 16,48o.8
1959 7,880.0 10,163.4 614.0 434.6 247.6 66.3 19,273.3
1960 9,202.0 11,408.2 773.9 538.7 249.5 68.2 22,104.1
1961 10,874.8 13,026.3 754.6 569.2 331.8 80.8 25,475.9
1962 12,816.0 14,427.0 787.6 580.6 341.8 135.2 28,817.8
196;3 16,595.6 17,619.9 1,232.0 816.9 315.0 177.5 36,401.9
1964 19,324.0 23,359.6 1,368.3 1,232.8 346.1 275.2 45,355.6
1965 22,300.8 25,586.9 1,675.9 1,247.4 498.0 309. 2 50,999.8
1966 26,753.9 29,966.4 2,063.5 1,497.9 566.2 487.7 60,360.2
1967 31,049.3 33,382.7 1,969.0 1,839.9 651.8 533.: 68,359.2
1968 35,044.7 38,635.3 2,312.4 2,173.4 1,078.7 613.8i 78,630.7
1969 41,862.3 41,616.0 3,109.9 2,992.4 1,404.2 938.1 90,046.7
1970 48,745.8 50,202.4 3,419.2 3,248.5 1,882.2 1,284.0 106,214.1
1971 57,807.7 58,033.7 5,186.9 4,386.7 2,307.6 1,540.6 126,182.0
1972 68,117.0 74,957.4 4,750.9 4,273.5 3,078.4 1,982.0 153,195.2
1973 82,885.1 107,606.5 6,lo4.4 5,740.5 3,339.2 2,495.4 203,180.3
Source: Banco de la Republica.

Table 2.7 - COLOMBIA: GENERAL GOVERNMENT CURRENT INCOME RECEIPTS, 1958-70(Millions of Pesos)
IncomefromGovern- Inter- Other
ment est Total Other Total Current
Proper- on the Direct Social Direct Direct Transfers Total
ties and Public Corpo- Security House- House- from Current
Enter- Debt Indirect rate Contri- hold hold House- Income
Year prises (-) Taxes Taxes butions Taxes Taxes holds Receipts
1958 199.7 63.1 1,410.6 341.4 140.5 375.0 515.5 15.1 2,419.2
1959 247.6 66.3 1,564.0 434.6 173.1 443,3 616.4 16.5 2,812.8
1960 249.5 68.2 1,735.3 538.7 207.7 494.o 701.7 24.4 3,181.4
1961 331.8 80.8 1,824.3 569.2 234.8 489.1 723.9 28.0 3,396.4
1962 341.B 135.2 1,844.1 580.6 276.6 531.7 808.3 26.2 3,465.8
1963 315.0 177.5 2.346.5 816.9 333.7 748.0 1,081.7 32.5 4,415.1
1964 346.1 275.2 3,481.6 1,232.8 396.8 979.6 1,376.4 48.o 6,209.7
1965 498.o 309.2 4,017.8 1,247.4 534.4 992.1 1,526.5 49.6 7,030.1
1966 566.2 487.7 6,o65.5 1,497.9 772.6 1,191.4 1,964.0 63.1 9,669.o
1967 651.8 533.5 6,335.9 1,839.9 1,143.6 1,592.7 2,736.3 75.1 11,433.1
1968 1,078.7 613.8 7,869.2 2,173.4 1,412.1 1,972.9 3,385.0 98.7 14,473.9
1969 1,404.2 938.1 9,521.5 2,992.4 1,668,2 2,693.4 4,361.6 101.6 18,087.8
1970 1,882.2 1,284.0 11,394.6 3,248.5 2,112.1 2,926.4 5,038.5 141.0 21,150.2
1971 2,307.6 1,540.6 13,199.1 4,386.7 2,739.9 3,955.0 6,694.9 153.7 25,867.3
1972 3,078.4 1,982.0 15,488.7 4,273.5 3,345.6 3,887.8 7,233.4 228.6 28,914.6
1973 3,339.2 2,495.4 20o,058.6 5,740.5 4,703.9 5,192.0 9.895.9 243.6 37,533.7
Source: Banco de la Republica.

Tubie 2.6 - C0L0MBIA: GTh'-ERAL GoUVEHMENT CURRENT EXPENDITURE AND SAVING, 1958-73(Millions of Pesos)
Consumption Outlays Current TotalRemu- Purchases Transfers Utilizationneration of Goods to ofof and House- Current
Year Labor Services Total Subsidies holds Savings Income
1958 997.9 198.2 1,196.1 39.1 198.7 985.3 2,419.2
1959 1,151.1 218.4 1,369.5 35.5 196.9 1,210.9 2,812.8
1960 1,373.8 285.5 1,659.3 61.9 211.9 1,248.3 3,181.4
1961 1,718.4 297.6 2,016.0 77.6 260.1 1,042.7 3,396.4
1962 1,992.4 363.6 2,356.o 95.4 391.8 622.6 3,465.8
1963 2,689.9 459.1 3,149.0 115.1 532.8 618.2 4,415.1
1964 3,025.9 457.7 3,483.6 178.5 601.6 1,946.0 6,209.7
1965 3,394.5 559.8 3,954.3 113.6 759.4 2,202.8 7,030.1
1966 4,298.6 611.8 4,910.4 345.6 966.1 3,446.9 9,669.o
1967 4,892.8 824.0 5,716.8 193.7 1,193.2 4,311.1 11,433.1
1968 5,542.7 1,037.1 6,579.8 211.0 2,049.5 5,609.5 14,473.9
1969 6,631.9 1,200.9 7,832.8 304.4 2,003.2 7,904.h 18,087.8
1970 8,283.4 1,678.2 9,961.6 830.1 2,638.8 7,660.8 21,150.2
1971 10,225.3 3,203.3 13,428.6 1,468.1 3,173.7 7,730.3 25,867.3
1972 12,714.3 1,935.0 14,649.2 1,628.2 3,868.9 8,695.1 28,914.6
1973 1i6,306.i 2,383.5 18,689.6 2,846.8 4,696.3 11,229.9 37,533.7
Source: BP- i o de la Republiea.

Table 2.9- COLOMBIA: GROSS SAVING AND INVESTMENT, 1958-73
(Millions of Pesos)
Capital GrossCurrent Consump- Domest-Account tion ic
Corporate Personal Government Surplus or Allow- CapitalYear Saving Saving Saving Deficit (+) ances Formation
1958 L5 1.1 214.9 985.3 -225.3 2,436.6 3,862.6
1959 614.0 409.2 1,210.9 -379.6 2,541.1 4,395.6
1960 773.9 506.7 1,248.3 299.0 2,666.9 5,494.8
1961 T54.6 824.8 1,042.7 -909.1 2,803.8 6,335.0
1962 787.6 1,100.6 622.6 761.1 3,132.8 6,404.7
1963 1,232.0 609.3 618.2 1,304.2 4,080.8 7,844.5
1964 1,368.3 393.2 1,946.0 1,590.3 4,304.2 9,602.0
1965 1,675.9 1,588.9 2,202.8 278.6 4,996.0 10,742.2
1966 2,063.5 -183.3 3,446.9 3,424.0 6,289.3 15,o4o.4
1967 1,969.0 1,217.8 4,311.1 732.5 7,110.6 15,341.0
1968 2,312.4 1,600.1 5,609.5 2,754.6 8,129.6 20,406.2
1969 3,109.9 -597.2 7,904.4 3,285.1 9,013.0 22,715.2
1970 3,419.2 1,600.6 7,660.8 5,229.4 10,220.3 28,130.3
1971 5,186.9 788.5 7,730.3 8,815.7 12,162.5 34,683.9
1972 4,750.9 5,007.8 8,695.1 4,867.8 14,001.3 37,322.9
1973 6,lo4.4 12,120.3 11,229.9 1,296.4 16,938.3 47,689.3
Source: Banco de la Republica.

Table 2.10 -COLOMBIA: COMPOSITION OF GROSS DOMESTIC INVESTMENT, 1958-73
(Millions of Pesos)
Gross Fixed Domestic InvestmentTrans- Machin- Grossporta- ery and Domes- Percentage
Con- tion Other Inven- tic Share of GDIstruc- Equip- Equip- tory Invest- Private Govern-
Year tion ment ment Change ment Sector ment
1958 1,951.6 356.5 1,030.7 523.8 3,862.6 8308 16.2
1959 2,486.5 480.2 941.2 487.7 4,395.6 83.1 16.9
1960 2,697.1 691.6 1,456.2 649.9 5,494.8 85,3 14.7
1961 3,272.1 746.9 1,561.3 754.7 6,335.0 81.8 18.2
1962 3,841.9 506.1 1,788.9 267.8 6,404.7 79.7 20.3
1963 4,421.1 691.7 2,054.7 677.0 7,844.5 82.3 17.7
1964 5,247.8 931.1 2,474.9 948.2 9,602.0 83.6 16.4
1965 5,976.8 840.5 2,686.9 1,238.0 10,742.2 82.6 17.4
1966 7,468.5 1,126.6 3,708.5 2,736.8 15,040.4 79.7 20.3
1967 9,738.3 1,457.3 3,533.5 611.9 15,341.0 71.7 28.3
1968 11,723.9 2,231.3 4,859.9 1,591.1 20,406.2 73.7 26.3
1969 13,873.2 2,318,7 5,038.2 1,485.1 22,715.2 70.8 29.2
1970 15,469.3 4,240.3 6,140.7 2,280.0 28,130.3 72.5 27.5
1971 18,382.6 5,301.5 7,628.1 3,371.1 34,683.3 73.7 26.3
1972 20,811.5 4,546.5 8,602.2 3,362.7 37,322.9 71.5 28.5
1973 27,436.5 3,923.0 12,798.4 3,531.4 47,689.3 72.9 2701
Source: Banco de la Republica

Table 2.11w -COLMIIS CF&SS DOYISTIC !NVESTMENT, BY PUBLIC ANDF?RV-LJ SL3OTMS, 1958-73 a
(L izrXs ±of Pesos)
Value irn 3Ixui:-nt P?rices- Value in Constant 1958 Prices:Gross Dome+'. Ins3stment Gross Domestic Investment
Year Public Pzr.atte To'al Public Private Total
1958 25.6 3 _ IfC 3,86225.6 5.6 3,237.0 3,862.6
1959 743.6 3 '$. 14,395.6 636.7 3,436.2 4,072.9
1960 580.5 o'66.3 5,494.8 622.4 4,1149.8 4,772.2
1961 1,150.8 bK.2 6,335.0 749.2 4,524.8 5,274.0
1962 1,303.2 ;'-'01. 6,404.7 753.3 4,069.6 4,822.9
1963 1),87.C ,457.5 7,844.5 647.5 4,074.6 4,722.1
1964 1j,.2 <.C28.8 9,602.0 665.8 4,688.2 5,354.0
1965 1,866.5 8,875.7 10,742.2 679.9 4,536.1 5,216.0
1966 3,045.5 h1,91.9 15,040.4 975.8 5,271.8 6,247.6
1967 4,337.C 11;ck04.0 15,341.0 1,2900 4,1141.7 5,431L7
1968 5,36C.:- 1-5045.6 2C,406.2 1,472.3 5,133.7 6,60o.0
1969 6,.so.& >c75.2 -22715.2 1,647.2 5,0)41.7 6,688.9
1970 7,732.1 20,398.2 28,130.3 1,767.3 5,938.3 7,705.3
1971 9,129*3 253,516.6 314,683.9 1,884.4 6,570.2 8,454.6
1972 l0,b634½ _ 6S8.5 37,322.9 1,971.2 63 3,129.8
1973 12i92L 34~,7?4.9 147,689.3 2)024.2 6,601.9 3,626.1
a/ Pub-i; _-- lds Government and Government enterp seE.
Source: 3an3o de la Republica

Table 2.12 - COLOMBIA: CURRENT FOREIGN TRANSACTIONS, 1958-73
(Millions of Pesos)
NetExports Imports Factor Currentof of Income AccountGoods Goods Received Surplusand and From or
Year Services Services Abroad Deficit
1958 3,889.9 3,271.0 -393.6 225.3
1959 4,o6s.8 3,384.3 -305.9 379.6
1960 4,163.9 4,160.6 -302.3 -.299.0
1961 3,920.2 4,434.7 -394.6 --909.1
1962 4,146.6 4,407.8 -499.9 --761.1
1963 5,173.5 5,666.3 -811.4 -1,304.2
1964 6,376.5 7,169.4 -797.4 -1,59o.3
1965 6,943.5 6,324.5 -897.6 -278.6
1966 8,916.5 11,097.6 -1,242.9 -3,424.0
1967 9,950.3 9,521.4 -1,470.7 *-732.5
1968 12,519.6 13,779.5 -2,003.2 -2,754.6
1969 14,675.1 15,947.2 -2,676.5 -3,285.1
1970 18,515.8 20,639.6 -3,591.9 -5,229.4
1971 19,151.2 24,933.0 -3,690.0 -8,815.7
1972 25,217.1 26,355.5 -4,478.3 -4,867.8
1973 37,526.6 34,689.7 -5,150.0 -1,298.4
a/ Exports riinus imports plus net factor payments from abroad plus nettransfers from the rest of the world.
Source: Banco de la Republica.

Table 2.13- COLOMBIA: DISPOSABLE PERSONAL INCOME, 1958-73 i'
(Millions of Pesos)
DisposablePersonal Income
National Personal Direct Other Current Constant 1958Year Income i' Incomeb/ Taxes c/ Transfers ' Prices eJ Prices f/
1958 16,480.8 15,75o.4 515.5 15.1 15,219.8 15,219.8
1959 19,273.3 18,240.3 616.4 16.5 17,607.4 16,149.6
1960 22,104.1 20,822.1 701.7 24.4 20,096. 16,936.4
1961 25,475.9 24,161.2 723.9 28.0 23,409. 18,221.2
1962 28,817.8 27,634.8 808.3 26.2 26,800. 19,846.5
1963 36,401.9 34,748.3 1,081.7 32.5 33,634. 20,357.9
1964 45,355.6 43,285.2 1,376.4 48.o 41,860. 22,001.8
1965 50,999.8 48,647.1 1,52665 49.6 47,071. 22,291.4
1966 60,36o.2 57,686.4 1,964.o 63,1 55,659. 23,445.8
1967 68,359.2 65,806.6 2,736.3 75.1 62,995. 24,382.1
1968 78,630.7 75,864.7 3,385.o 98.7 72,381. 25,879.5
1969 90,046.7 85,827.0 4,361.6 101.6 81,811. 27,297.7
1970 106,214.1 101,854.1 5,038.5 141.0 96,674. 30,023.2
1971 126,181.5 119,422.5 6,694.9 153.7 112,573. 31,363.9
1972 153,195.2 147,588.9 7,233.4 228.6 1_40,126¢ 34,964.3
1973 203,180,3 195,970.0 9,895.9 243.6 185,830. 37,632.7
a/ Net national product at factor cost, equal to GDP after adjustment for subsidies,-indirect taxes, capital consumption allowances, and net factor paymentsto foreigners.
b/ Personal income is sum of wages, salaries, property incomes, incomes Dfunincorporated enterprises, and current transfers.
c/ Direct taxes include personal income taxes and all social security conatributions.
d/ Other current transfers, such as payments for various government services(fees, matricultation charges, etc.).
e/ Disposable income equals personal income less direct taxes and other transfers.
t/ Conversions from current to constant 1958 prices accomplished by use ofpersonal consumption deflator.
Source: Banco de la Republica

Table 2.14 - COLOMIA: PERSONAL INCOMI, 1950-73
(YllJions of Pesos)
Total Direct Taxes Disposable Personal Disposabl2 PersonalWiages & Personal and Other Personal Consumption Income in ConstantSalaries Inceme a/ Transfersg/ Inc me Price Index 1958 Prices
1950 2,661.8 6,653.7 123.5 6,530.2 54.8 11,913.2
1951 3,024.6 7,406.0 141.6 7,264.4 62.8 11,573.8
1952 3,194.4 8,024.3 185.6 7,838.7 63.4 12,368.8
1953 3,626.8 8,940.6 257.7 8,682.9 66.1 13,144.5
1954 4,190.1 10,588.7 324.2 10,264.5 71.3 14,403.1
1955 4,560.o 10,900.9 363.5 10537.4 71.9 14,649.3
1956 4,957.2 12,316.6 441.5 11,875.1 77.8 15,262.4
1957 5,811.5 14,338.3 481.0 13,857.3 88.0 15,742.8
1958 6.807.9 15,750.4 530.6 15,219.8 100.0 15,219.8
1959 7,880.0 18,240.3 632.9 17,607.4 109.0 16,149.6
1960 9,202.0 20,822.1 726.1 20,096.0 118.7 16,936.4
1961 10,874.8 24,161.2 751.9 23,409.3 128.5 18,221.2
1962 12,816.0 27,634.8 834.5 26,800.3 135.0 19,846.5
1963 16,595.6 34,748.3 1,114.2 33,634.1 165.2 20,357.9
1964 19,324.0 43,285.2 1,424.4 41,860.8 190.3 22,001.8
1965 22,300.8 48,647.1 1,576.1 47,071.0 211.2 22,291.4
1966 26,753.9 57,686.4 2,027.1 55,659.3 237.4 23,445-8
1967 31,049.3 65,806.6 2,811.4 62,995.2 258.4 24,382.1
1968 35,044.7 75,864.7 3,483.7 72,381.0 279.7 25,879.5
1969 41,862.3 85,827.0 4,015.5 81,811.5 299.4 27,297.7
1970 48,745.8 101,854.1 5,179.5 96,674.6 322.0 3c4023.2
1971 57,807.7 119,422.5 6,848.6 112,573.9 358,9 31,363.9
1972 68,117.0 147,588.9 7,462.0 140,126.9 400,8 38,9iL.3
1973 82,885.1 195,970 0 10,139.5 185,830.5 493.8 37632-7
a/ Total personal income includes wages and salaries farmily incorme from prol. rties,income of unincorporated enterprises, and current transfers.
b/ Personal income taxes, social security contributions, and payments for variousSovernenlt services.
" ~u:'ce: Luna'- c_ 1 a Ren-bliC.?.

Table 2.15- COLOMBIA: WAGES AND SALARIES AS PERCENTAGE OF
VALUE ADDED, BY SECTOR, 1950-73 a/
Sector 1950 1Q55 1960 1965 1970 1971 1972 1973
Agriculture b/ 37.7 (40.3) 34.9 (34.7) 31.6 (29.4) 34.1 (27.0) 29.3 (20.6) 28.2 (19.6) 26.0 (18.9) 21.9 (17.6)
Mining 34.7 ( 2.1) 34.1 ( 2.1) 26.8 ( 2.9) 35.0 ( 2.4) 32.0 ( 1.6) 34.2 ( 1.5) 35.1 ( 1.3) 35.2 ( 1.4)
Manufacturing 27.5 (12.5) 32.4 (13.4) 34.8 (16.4) 38.1 (17.7) 41.8 (18.0) 41.1 (18.2) 40.2 (18.7) 35.5 (18.7)
Construction 73.0 ( 5.6) 72.0 ( 7.5) 72.3 ( 7.1) 74.4 ( 7.0) 81.1 (10.4) 78.8 (10.8) 75.7 ( 9.8) 74.3 (10.5)
Commerce 18.3 ( 5.9) 18.3 ( 5.7) 18.3 ( 6.5) 18.3 ( 6.5) 19.2 ( 6.4) 18.0 ( 5.9) 16.4 ( 5.5) 14.2 ( 5.4)
Transportation 35.8 ( 6.7) 37.3 (7.0) 43.8 ( 6.9) 48.4 ( 6.8) 43.7 ( 6.9) 44.9 ( 6.9) 49.0 ( 7.1) 50.7 ( 7.1)
Communications 54.7 ( 0.8) 54.3 ( 0.9) 50.2 ( 1.1) 55.4 ( 1.2) 58.1 ( 1.4) 59.7 ( 1.5) 60.1 ( 1.6) 60.7 ( 1.7)
Electricity,Gas, & Water 34.0 ( 0.5) 26.2 ( 0.5) 29.2 ( 0.7) 37.7 ( 1.3) 36.8 ( 1.4) 37.1 ( 1.4) 35.0 ( 1.4) 39.3 ( 1.6)
Personal Serv. 48.0 (10.6) 49.0 (10.4) 50.7 (10.0) 49.0 ( 9.6) 58.0 (10.8) 59.6 (11.1) 59.7 (11.4) 58.2 (11.0)
Government Serv. 100.0 (12.7) 100.0 (15.0) 100.0 (15.0) 100.0 (15.2) 100.0 (17.0) 100.0 (17.7) 100.0 (18.7) 100.0 (19.7)
Banking, Ins.,& Real Estate 48.9 ( 2.3) 49.3 ( 2.8) 58.7 ( 4.0) 65.0 ( 5.3) 61.6 ( 5.5) 59.3 ( 5.4) 57.6 ( 5.6) 57.8 ( 5.3)
Subtotal: Non-Agriculture 34.8 (59.7) 38.4 (65.3) 39.2 (70.6) 41.3 (73.0) 45.4 (79.4) 45.6 (80.4) 45.2 (81.1) 43.1 (82.4)
TOTAL GDP 36.0(100.0) 37.2(100.0) 36,7/100.0) 39.2(100.0) 40.6(100.0) 40.7(100.0) 39.7(100.0) 36.8(100,0)
a/ National Accounts "payments tsl as siar; -' u-ded, ns-osred at factor cOst in current pc'tcec. Labor pavyments includCe wages,salaries, bonuses, commi ssions, - thcr t-- e . in c,s! o. in kind, befere deduction of p¢rsonal charges for social semarit;,Figures shown in parentheses refc: s s <-- shsarc -, 'otal vagy, and salaries paid during year.
bh Agriculture included fishing, hurl g, and rstsc
iource: Banco de la Republica.

Tabe 2.16- COLBMMA: GNP, GDP, ANDI NATDNAL INCOM INCURRJT AND CONSTANT 1958 PRICE, 1950-73
(Mllions of Pesos)
Gross National Product Gross Domestic Prodact National Inc am
Curiret Prices 1956 Pries Currenta Prices 1L958 Price-s cum-uBiT Pri-e--s 19q5 Prlce2
1950 7,788.9 14,399.5 7,860.5 14,688.8 6,848.3 12,791.7
1951 8,847.0 14,890.6 8,940.9 15,106.6 7,661.7 12, 74.81952 9,572.9 15,895.9 9,650.9 16,1o2.0 8,27&14 13,8731.1953 10,650.2 16,847.4 10,734.7 17,08.60 9,214.5 16,43L.71954 12,681.1 16,880.7 12,758.8 18,262.3 109,936.4 16,404.?
1955 13,179.1 18,789.9 13,249.B 18,976.1 11,271.5 16,21.2.01956 14,773.6 19,528.7 14,862.8 19,745.7 12,724.0 16,761.41957 17,586.2 19,831.0 17,810.6 20,186.2 14,882.6 16,679.3
1958 20,288.9 20,288.9 20,682.5 20,652.5 16,420.8 16,480.81959 23,342.9 21,870.3 23,648.8 22,176.9 19,273.3 17,87.1
1960 26,444.4 22,831.6 26,746.7 23,123.4 22,104.1 18,246.31961 30,026.4 23,927.7 30,421.0 24,300.2 25,475.9 19,131.31962 33,699.3 25,124.4 34,199.2 25,615.3 28,817.8 20,173.11963 42,714.1 25,838.3 43,525.5 26,457.2 36,401.9 20,756.61964 52,962.9 27,486.6 53,760.3 28,088.8 45,355.6 22,883.7
1965 59,900.0 28,472.8 60,797.6 29,100.0 50,999.8 23,491.11966 72,369.4 30,000.9 73,612.3 30,658.2 60,360.2 24,825.01967 81,612.0 31,236.0 83,082.7 31,947.0 68,359.2 25,803.01968 94,418.5 33,062.5 96,421.7 33,902.2 78,630.7 27A553.3
94A18-5 5 -4 go~~~~~~~9 046.7 29,523.11969 108,276.8 357 9 '5 -1 0,03: f 0 32,003.P1970 126,998.9 3,2 2.7 1I30 3A,t-O 2031971 150,075.5 39,415.8 153,765.5 40,604.9 126,182.0 33,690,61972 181,057.0 42,211.2 185,535.3 43,463.0 153,195.2 36,783.2
1973 237,330.4 45,570.3 242,480.4 46,602.6 203,180.3 39,770.7
Source: Banco de la Republica.

Table 2.17- COLOMBIA: INCREENTAL CAPITAL-OUTPUT RATIOS, 1950-73(Millions of Pesos)
Gross 'FixedGDP Fixed Investment Lagged
Year GDP Increment Investment Coefficient ICOR ICOR
1950 7,860.5 ... 1,112.7 14.15 ...
1951 8,940.9 1,080.4 1,189.3 13.30 1.10 1.03
1952 9,650.9 710.0 1,333.2 13.81 1.88 1.68
1953 10,734.7 1,083.8 1,785.6 16.63 1.65 1.23
1954 12,758.8 2,024.1 2,161.8 16.94 1.07 0.88
1.955 13,249.8 491.0 2,383.0 17.98 4.85 4.40
1956 14,362.8 1,613.0 2,526.7 17.00 1.57 1.48
1957 17,810.6 2,947.8 2,643.3 14.84 0.90 0.86
1958 20,682.5 2,871.9 3,338.8 16.14 1.16 0.92
1959 23,648.8 2,966.3 3,907.9 16.52 1.32 1.12
1960 26,746.7 3,097.9 4,844.9 18.11 1.56 1.26
1961 30,421.0 3,674.3 5,580.3 18.34 1.52 1.32
1962 34il99.2 3,778.2 6,136.9 , 17.94 1.62' 1.48
1963 43,525.5 9,326.3 7,167.5 16.47 0.77' 0.66
1964 53,760.3 10,234.8 8,653.8 16.10 0.85 0.70
1965 60,797.6 7,037.3 9,504.2 15.63 1.35 1.23
1966 73,612.3 12,814.7 12,303.6 16.71 0.96 0.74
1967 83,082.7 9,470.4 14,729.1 17.73 1.56 1.30
1968 96,421.7 13,339.0 18,815.1 19.51 1.41 1.10
1969 110,953.3 14,531.6 21,230.1 19.13 1.46 1.29
1970 130,590.8 19,637.5 25,850.3 19.79 1.32 1.08
1971 153,765.5 23,174.7 31,312.8 20.36 1.35 1.12
1972 185,535.3 31,769.8 33,960.2 13.30 1.07 0.99
1973 242,480.4 56,94$.1 44,157.9 18.21 0.78 0.60
Source: Banco de ia Republica

Table,2-18 - COLOISU: GlP 6ND MOSS -11ED 1U 'IMZT
PR ICE DEFIATORS, 1°, 740-73
rGross f4ixed- GDP Cumlative Investment Cam:LativeDefla;tor Percenltage Percentage Deflator, Percentage Percentae
19r50 53.', ...** L3.1 *J
19 51 59 .0 103 * 3 3.o3 4i 3 2 7f -7 '|.7
195,r2 59,9 1$'.5 12 .c). ,4.2. 12,5
1953 62 .8 i18 7 .4; 41 s5,*0
1954; 69 9 * gL *3 30 *6 456 . 3 O a'.
15,55 6M* -0,1 S3.01 48.3 -v'20,!fi
19;6 75 .3 7I 40 .7 -1>@ -1ket3dl
195,7 8/8 .2 1 7 -I o54 .8 3 5, - 7s7
195g8 lOG.0 1 ) .4 . 6. >>f l tz-ffMw,yl.,)
1959 106.6 6 .6 99 .9 _t]'f,a1 b
1960 115. 7 8 ̂ 5 ' *- '.r6 .2 aj)
?961L 125.s2 8.2 1 35i4 - -2vF' if .7u r(W34
1'362 13 3 .5 6 .6 14X9 . 233- f34 9y f '`2-
196 3 164l .5 23 .2 2_0 7.5 ) a9- 93 2 A. a 32 .2f*
1964 191-4 16-4 257.8 .6_.'5t 307 5-2*f
i965 - 208-9 9°.1 29{0D[ 2'f11 -gw 3¢~
1'(66 240.: l14f,9 34".8 2,A; 1 {@( ;v2
1966 26o.1 8.3 3&6.2 2 8 4. 2- -1o2f}O v
1967 284 .4 f!0' $3 4A316 .8 o 7* _tt
1 9 69 307.]7 f8 2 475 v1 347 .6 0 ? -
1970 339.3 10).3 531i .3 3 Za;7o8
1971 378.7 ii.6 &b7 .9 842L;.G 13-3 951 7s
1972 4W26.9 12.7 698.o h66 7 '.01 103,
1973 52{1,3 21.9 8725.6 -5 3 9 '" 3.5 01 6) .
Source S Banco de la Republica .

Table 2.19 - COLOMBIA: INCREMENTAL CAPITAL-OUTPUT RATIOS, l950-73(Millions of Constant 1958 Pesos)
Gross FixedGDP Fixed Investment Lagged
Year GDP Increment Investment Coefficient ICOR ICOR
19'0 14,688.8 .... 2,771.8 18.87
1951 15,146.6 457.8 2,752.5 18.17 6.01 6.05
1952 16,102.0 955.4 2,965-4 18.42 3.10 2.88
1953 17,081.0 979.0 44,oU.7 23.49 4.10 3.03
19514 18,262.3 1,181.3 4,670.0 25.57 3.95 3.40
1955 18,976.1 713.8 4,935.7 26.01 6.91 6.54
1956 19,745.7 f769.6 4,683-7 23.72 6.o8 6.41
1957 20,186.2 440.5 3,511.6 17.40 7.97 10.63
1958 20,682.5 496.3 3,338.8 16.14 6.73 7.08
1959 22,176.9 1,494.4 3,587-7 16.18 2.40 2.23
1960 23,123.4 946.5 4,225.6 18.27 4.46 3.79
1961 24,300.2 1,176.8 4,584.7 18.87 3.90 3.59
1962 25,615.3 1,315.1 4,602.0 17.96 3.50 3.49
1963 26,457.2 841.9 4,234.o 16.00 5.03 5.47
1964 28,o88.8 1,631.6 4,764.2 16.96 2.92 2.59
1965 29,100.0 1,011.2 4,498.9 15.46 4.45 4.71
1966 30,658.2 1,558.2 4,859.7 15.85 3.12 2.89
1967 31,947.0 1,288.8 5,182.6 16.22 4.02 3-77
1968 33,902.2 1,955.2 5,958.0 17.57 3-05 2.65
1969 36,o60.6 2,158.4 6,106.8 16.93 2.83 2.76
1970 38,492.0 2,431.4 6,909.5 17.95 2.84 .-.51
1971 40,604.9 2,112.9 7,385.9 18.19 3,50 _.27
1972 43,463.0 2,858.1 7,277.1 16.74 2.55 3.58
-i973 46,602.6 3,139.6 8,187.5 17.57 2.6. 2.32
Source: Banco de la Repiblica.

Table 2.20 1 COLOMBIA: DOESTIC SAVINGS RATIOS, 1950-73
(l.laonsotPesos)
Reference1targinal Domestyc CoLamn:
Savings RateV NYC Prics forYear GDP GDS' GDS/GDP AnnuaI Cumulative Manizales Coffee-a
1950 7,860.5 1,382.6 17.59 .,. ... 53.25
1951 8,ol4o.9 1,463.7 16.37 .0750 .0750 58.7o
1952 9,650.9 1,587.1 16.44 .1738 .1142 57.01
1953 10,734.7 1,751.6 16.32 .1518 .1284 59.92
1954 12,758.8 2,191.0 17.17 .2171 .1650 79.93
IY55 13,209.8 2,126.8 i6.05 -.1308 .1381 64.38
1956 14,862.8 2,671.1 17.97 .3374 .1840 73.97
1957 17,810.6 3,801.1 21.34 .3833 .2431 63.94
1i58 20.682.5 4,481.5 21.67 .2369 .2417 i2.}34
1959 23,6b8.8 5,051.1 21.48 .2021 .2342 45.22
1960 26,746.7 5,498.1 20.56 .1346 .2179 -414.89
1961 30,421.0 5,820.5 19.13 .0877 .1967 143.62
1962 34,199.2 6,143.5 17.96 .0855 .1304 fc0.77
1963 !43,525.5 7,351.? 16.89 .1295 .1674 39.55
1964 53,760.3 8,809.1 16.38 .14'24 .1618 48.80
's''t'' 60,797.6 11,361.2 18.69 .3626 .1885 48.149
7_966 73,612.3 12,859.3 17.47 .1169 .1745 47.43
19t7 63,082.7 15,769.9 18.98 .3073 .1913 41.914
1968 96,W421.7 19,146.3 19.86 .2531 .2006 42.60
19hb9 110,953.3 21,443.1 19.33 .1581 .L946 44.99
1970 130,590.8 26,006.5 19.91 .2324 .2006 56.42
1971 153,765.5 28,902.1 18.80 .1249 .1886 49.27
1972 185,535.3 36,184.5 19.50 .2292 .1959 56.67
1973 242,480.4 50,526.2 20.84 .2519 .2095 72.66
/ Gross Domestic Saving equals.Gross Domestic Investment plus surplus fromtrade in goods and non-factor services.
b/ Yiarginal Savings Ra-te aniais change in GDS divided by chang-e in CGD?.N/ New York Spot Price in UfS. cents Per Dound.
source: B3RD'

Table 2.21 -COLOMBIA: DOMESTIC SAVINGS RATIOS, 1950-73
(Millions of Constant 1958 Pesos)
Miarginal Domestic Reference Column:GDS . Savings Rate J NYC Price for
Year GDP GD ]S,GDP Alntiiinl flml ati va n 1 ffA /
1950 14,688.8 2,805.3 19.10 ... ... 53.25
1951 15,146.6 3,098.0 20.45 .6394 .6394 58.70
1952 16,102.0 3,269.4 20.30 .1794 .3284 57.01
1953 17,081.0 3,346.3 19.59 .0785 .2262 59.92
1954 18,262.3 3,357.5 18.38 .0095 .1545 79.93
1955 18,976.1 3,487.2 18.38 .1817 .1591 64.38
1956 19,745.7 4,024.4 20.38 .6980 .2411 73.97
1957 20,186.2 4,284.7 21.23 .5909 .2691 63.94
1958 20,682.5 4,481.5 21.67 .3965 .2797 52.34
1959 22,176.9 5,188.4 23.40 .4730 .3183 45.22
1960 23,123.4 5,274.6 22.81 .0911 .2928 44.89
1961 24,300.2 5,307.9 21.84 .0283 .2604 43.62
1962 25,615.3 5,052.7 19.73 -.1941 .2057 40.77
1963 26,457.2 4,848.8 18.33 -.2422 .1736 39.55
1964 28,088.8 4,652.6 16.56 -.1202 .1379 48.8C
1965 29,100.0 5,816,3 19.99 1.1508 .2089 48.49
1966 30,658.2 5,312.6 17.33 -. 3233 .1570 47.42
1967 31,947.0 6,188.8 19.37 .6799 .1961 41.94
1968 33,502.2 6,641.3 19.59 .2314 .1997 42.6o
1969 36,060.6 6,641.5 18.42 .0001 .1795 44.95
1970 38,492.0 6,664.7 17.31 .oo95 .1621 56.42
1971 40,6O4.9 6,542.9 16.11 -.0576 .1442 49.27
1972 43,463.0 7,121.2 16.38 .2023 .1500 56.67
1973 46,602.6 8,624.1 18.51 .4787 .1823 72.66'
a/ Gross Domestic Saving equals Gross Domestic Investment plus surplus
from trade in goods and non-factor services.b/ Marginal. Savings Rate equals change in GDS divided by change in GDP.,c/ New York Spot Price in U.S. cents per pound.
Source: IBRD

Table 2.22 - COLOM3IA: GENERAL GOVERNMENT INCOME AND EXPENDITURE, 1950-73-
(Millions of Pesos)
Goveromeni Gover nt GovernmentConsu sption Savings Invest,sent
Debt Subsidies Investment Savings as as Z of as Z of an % ofCurrent consumption 1 Interest and Investment Minus 2 of Total Gross Domestic Gross Doestic
Year Tnmeo / Expenditure- Pavments Transfers Savinge- Expenditur_e/ Savings _ Investment __ ion _ Investmwnt
1950 772.4 433.2 15.6 64.6 ? '3.6 -110.4 174.3 6.7 lh.7 11.2
1951 991.4 520.8 16.3 68.5 385.8 213.5 -172.3 180.7 7.0 26.4 15.7
1952 1,098.8 581.8 16.1 81.9 419.0 211.5 -207.5 198.1 7.2 26.4 14.2
1953 1,267.7 724.1 19.8 97.9 425.9 288.9 -137.0 147.4 8.1 24.3 17.6
1954 1,570.5 856.0 16.0 112.8 585.7 357.8 -227.9 163.7 8.1 26.7 16.7
1955 1,727.2 937.9 15.0 153.9 620.4 518.7 -101.7 119.6 8.4 29.2 21.8
1956 1,824.4 959.4 30.2 196.0 638.8 555.8 - 83.0 114.9 7.9 23.9 20.5
1957 1,996.8 1,021.6 34.2 193.2 747.8 557.8 -190.0 134.1 7.3 19.7 15.8
1958 2,482.3 1,196.1 63.1 237.8 985.3 625.6 -359.7 157.5 7.4 22.0 16.2
1959 2,879.1 1,369.5 66.3 232.4 1,210.9 743.6 -467.3 162.8 7.4 23.8 16.9
1960 3,249.6 1,659.3 68.2 273.8 1,248.3 808.5 -439.8 154.4 7.8 22.7 14.7
1961 3,477.2 2,016.0 80.8 337.7 1,042.7 1,150.8 108.1 90.6 8.2 17.9 18.2
1962 3,601.0 2,356.0 135.2 487.2 622.6 1,303.2 680.6 47.8 8.4 8.7 20.3
1963 4,592.6 3,149.0 177.5 647.9 618.2 1,387.0 768.8 44.6 8,7 8.4 17.7
1964 6,484.9 3,483.6 275.2 780.1 1,946.0 1,573.2 -372.8 123.7 7.7 22.1 16.4
1965 7,339.3 3,954.3 309.2 873.0 2,202.8 1,866.5 -336.3 118.0 8.0 19.4 17.4
1966 10,166.7 4,910.4 487.7 1,311.7 3,446.9 3,048.5 -398.4 113.1 8.1 26.8 20.3
1967 11,966.6 5,716.8 533.5 1,405.2 4,311.1 4,337.0 25.9 99.4 8.5 27.3 28.3
1968 15,087.7 6,579.8 613.8 2,284.6 5,609.5 5,360.6 -248.9 104.6 8.5 29.3 26.3
1969 19,025.9 7,832.8 938.1 2,350.6 7,904.4 6,640.0 -1,264.4 119.0 8.8 36.9 29.2
1970 22,434.2 9,961.6 1,284.0 3,527.8 7,660.8 7,732.1 71.3 99.1 9.5 29.5 27.5
1971 27,407.9 13,428.6 1,540.6 4,708.4 7,730.3 9,122.3 1,392.0 84.7 10.8 26.7 26.3
1972 30,896.6 14,649.2 1,982.0 5,570.3 8,659.1 10,634.4 1,939.3 81.8 9.8 24.0 28.5
1973 40,029.1 18,689.6 2,495.4 7,614.2 11,229.9 12,914.4 1,684.5 87.0 9.7 22.2 27.1
a/ According to National Accounts data
bl From taces, duties, fines, fees, operating revenues and transfers from hooseholds and from rest of uorld
c/ Wages and salaries plus purchases of goods and other services
i turner-t Income msinus Consumption, Debt Interest, snd Suhbidi es ond Transfers
e Gen-r Ceverument investment retces to ,iL,cmate, 0>0 *otr-OOtme >0 , .L c f s<, i.c0lO l 5< 6te pvrrlo . such .u, PCOPETROL sm'S as the _ lctpal u tilttenterpris.s. It is important Lo note, ho0tvct, t- :0 OOst-owi 0, 0c0,, 00:y extci:tture on '0: 14bps and ot sr ! onstrbci4sJs oil expenl-At-re on menhisereon:i equipment is assigned to the private -etor for National A -c .toturnoses
Source: LBanc de Ts Republica.

Table 2.23 - COLOMBIA: GENERAL GOVERNMENT CONSUMPTION, SAVINGS AND INVESTMENT, 1950-73-/
(Millions of 1958 pesos)
Gross Government Government Government Government GovernmentDomestic Consumption Government Investment Consumption Savings Investment
b/ d/~~~Svng~ e/tDP!Year Product_! ExpenditureS/ Savings- Expenditure-/ as % of GDP_/ as 7 of GDP_/ as ' of GDP-/
1950 14,688.8 856.0 503.0 288.6 5.5 3.3 1.9
1951 15,146.6 965.5 722.6 399.9 5.8 4.3 2.4
1952 16,102.0 1,026.7 744.1 375.6 6.0 4.3 2.2
1953 17,081.0 1,231.9 722.8 490.3 6.7 4.0 2.7
1954 18,262.3 1,277.3 989.4 604.4 6.7 4.6 2.8
1955 18,976.1 1,329.4 1,013.8 847.6 7.1 4.7 3.9
1956 19,745.7 1,285.1 924.4 804.3 6.5 4.3 3.7
1957 20,186.2 1,146.4 950.2 708.8 5.7 4.2 3.1
1958 20,682.5 1,196.1 985.3 625.6 5.8 4.8 3.0
1959 22,176.9 1,214.3 1,036.8 636.7 5.8 5.1 3.1
1960 23,123.4 1,339.6 961.0 622.4 6.2 4.7 3.0
1961 24,300.2 1,413.2 678.8 749.2 6.6 3.4 3.8
1962 25,615.3 1,531.2 359.9 753.3 6.9 1.8 3.8
1963 26,457.2 1,619.4 288.6 647.5 7.2 1.4 3.2
1964 28,088.8 1,641.2 823.6 655.8 6.5 3.6 3.9
1965 29,100.0 1,744.8 802.4 679.9 6.5 3.6 3.1
1966 30,658.2 1,822.7 1,103.3 975.8 6.7 4.7 4.1
1967 31,947.0 1,917.7 1,282.3 1,290.0 6.9 5.2 5.2
1968 33,902.2 1,984.1 1,540.6 1,472.3 6.8 5.8 5.6
1969 36,060.6 2,140.0 1,960.8 1,647.2 7.1 7.1 6.0
1970 38,492.0 2,439.0 1,751.0 1,767.3 7.6 5.9 5.9
1971 40,604.9 3,015.5 1,956.9 1,884.4 8.7 5.0 5.9
1972 43,463.0 2,731.2 1,611.7 1,971.2 7.9 4.7 5.7
1973 46,602.6 2,889.2 1,760.2 2,024.2 7.7 4.6 5.3
a/ According to National Accounts data
b/ Average annual growth rate, 1950-69: 4.8 percent.
c/ Average annual gtowth rate, 1950-69: 4.9 percent.
d/ Average annual gtowth rate, 1950-69: 7.4 percent. (Series derived froym published current-peso series by applyingdeflator used on Government Investment)
e/ Average annual growth rate, 1950-69: 9.6 percent.
f/ Percentages are computed from current-peso data.
Source: Banco de la Republica.

Table 3.1 - COLOBIA- AvERAGE-- ANNUAPRICES--FOR PORSE * IVECOFFEES OF FOUR MAJOR CATEGORIES, 1958-74 a
(New Ycrk Spot Price, U.S. Cents per Pound)
Guatemala Brazil AngolanCalendar Colombian Prime Santos Ambriz
Year Nans Washed Fours 2-AAs
1958 52.34 49.81 48.41 40.25
1959 45.22 42.62 36.97 30.60
1960 44.89 41.33 36.60 25.27
1961 43.62 37.55 36.01 19.93
1962 40.77 35.83 33.96 21.55
1963 39.55 35.40 34.1 28.73
1964 48.80 47.16 46.66 36.38
-1965 48.49 45.51 144.71 31.:9
1966 47.43 42.25 40.83 33.98
1967 4.94 39.23 37.82 33833
1968 42.60 39.43 37.43 34.25
1969 44.99 40.12 40.97 33.36
1970 56.42 52.01 55.80 41.43
1971 49.27 44.99 44.69 42.:38
1972, 56.67 50.33 52.51 45.i-9
1973 72.66 62.02 69.26 50.16
1974 77.84 66.15 67.87 59.:21
/ Price averages, not weighted by quantities traded.
Source: Pan American Coffee Bureau, New York.

Table 3.2 - COLOMBIA: FOREGN AND DOMESTIC PRICES FOR COLOMBIXNCOFFEE, 1948-74
New York U.S. New Peso Price Colombian InteriorPrice in Wholesale York 'per Arroba- Wholesale PriceCents per Price In- Price in of Mani- Price In- inPound of dex, 1948 Constant zales Cof- dex, 1948 ConstantManizales Equajls 1948 fee in the Equals 1948
Year Coffee 10 a/ Prices Interior 100 i Prices
1948 32.57 100.0 32.57 10.62 100.0 10.621949 37.61 95.0 39.59 13.87 107.6 12.891950 53.25 98.8 53.90 19.88 121.0 16.42
1951 58.70 110.0 53.36 24.02 130.6 18.391952 57.01 107.0 53.28 25.99 129.0 20.14'1953 59.92 105.6 56.74 27.80 136.5 20.361954 79.93 105.8 75.55 37.90 146.1 25.941955 64.38 106.0 60.74 31.98 147.2 21.72
1956 73.97 109.5 67.55 41.61 159.6 26.071957 63.94 112.7 56.73 48.76 198.3 24.581958 52.34 114.2 45.83 46.74 232.6 20.091-959 45.22 114.5 39.49 38.75 255.0 15.191960 44.89 114.6 39.17 42.93 265.7 16.l5,
1961 43.62 114.1 38.23 47.13 283.1 16.641962 40.77 114.5 35.61 47.79 290.6 16.441963 39.55 114.1 34.66 55.55 367.0 15.131964 48.80 114.4 42.66 71.81 431.1 16.651965 48.49 116.7 41.55 71.70 466.7 15.36
16'J6 47.43 120.5 39.36 75.63 547.9 13.801967 41.94 120.8 34.72 75.91 585.3 12.971968 42.60 123.8 34.41 88.91 622.1 14.291969 44-99 128.6 34.94 98.24 663.6 14.801970 56.42 133.3 42.51 130.38 714.2 18.26
1971 49.27 137.7 35.60 124.48 796.3 15.631972 56.67 143.5 39.44 150,00 942.0 15.921973 72.f66 163.3 44.49 193.71 1,204.9 16.081974 77.84 193.4 40.25 220.66 1,638.0 13.47
i/ Shifted from original 1967 base.b/ Shifted from original 1952 base.
Sources: Banco de la Republica; International Financial Statistics.

Table 3.3 - COLOMBIA: SUPPLY AND DISTRIBUTION 0F EEN COFFEE,
1958/59 - 1973/74(Thouaands of 60-kilogram Bags)
Coff'Cee Stocqs Dame.tic Excports StocksYear Carz- Product- Consump- Quota Annex B Carry-
(Oct-SaDt) I ion tion Markets Markets Total outa]
7 9-58/9 11 I 7,442 908 6,372 59 6,431 114
11959/60 114 7,648 1,197 5,597 74 5,671 894
1960/61 894 7,500 1,270 5,990 53 6,043 1 08l
1961/62 12081 - 8,035 15526 5,536 58 5,594 1,996
1962/63 1,996 7,500 1,146 5,952 104 6,,056 2,024
1963/64 2,024 7,800 10375>- 6,228 82 6,310 2,139
19614/65 2,139 8,5147 1354 5.,612 131. 5,743 3,589
1965/66 8 8;224 1,202 5, 670 195 5,865 4,746
1966/67 -4,746 7,507 1,250 5,421 213 5,634 5,369
1967/6a 5,369 7,995 1;270 60,44 251 6,595 5,499
196R/69 5,499 7,375 1,290 6,204 330 6,534 510[
1Q69/70 5,050 0,239 i;333 6,467 407 6,874 5,082
197Q/71 5,082 7075 1,370 6,014 317 6,331 5,134
1971/72 5,134 60979 1,410 6,35o 137 6,487 4,216
1972/73 4,216 8,500 1,561 6,067 188 6,255 4,5o0
1973/74 4,900 7,800 1,760 7,008 393 7,400 3, o0
a/ Stocks include private holdings.
Source: National Coffee Growers Federation

Table 3.4 - COLOMBIA: GREEN COFFEE EXPORTS, BY VALUE ANDQUANTITY, 1958-74 AND 1975-77 .
Thousands of FOB "a-.e in ' Average FOB60-kilogram MillioTAs of Unit Talue ia
Year Bags Shipped U.S. Dollars Cents per Pound
1958 5,441 354.5 49.31959 6,413 361.-2 42.6.1960 5,938 332.2 42.31961 5,651 307.8 41.21962 6,561 332.0 38.21963 .6,134 303.0 37.31964 6,412 394.2 46.51965 5,652 343.9 46.o1966 5,566 328.3. 44.61967 6,o94 322.4 40.01968 6,588 351.4- 40.31969 6,478 343.9 40.11970 6,509 466.9. 54.21971 6,569 399.7 46. )1972 6,528 430.4 49.8
1973 6,766 597.9 66.81974 6,906- 630.1-- t0
1975_ 6,600. 567.5- 6 -01976 6,680 607.9 68.81977 6,780 625.3 69.7
a/ 1958-74 are actuals, and 1975-77 projected.
/ Does not include coffee adjustment.
Source: National Coffee Growers Federation; IBRD,'

Table - COLOMBIA: CRUDE PETROLEUM PRODUCTION, APPARENT DO1MESTICCONSUMPTION, AND EXPORTATION, 1958-74 ATD 1975-77 7
Crude Apparent Crude Petroleum ExportsPetroleum Domestic By unit v =U9
Year Production b Consumption _ _ Volume b/ Vue-/ per Barrel
1958 46,878 22,489 24,389 66,571 2.731959 53,574 25,208 28,366 73,292 2.5(31960 55,770 24l,438 31,332 79,998 2.551961 53 242 25,712 27,530 68,239 2.481962 51,908 27,597 24,311 60,584 2L41963 60,243 29,072 31,171 77,198 2,431964 62,586 31,874 30,712 74,962 2.4- r
1965 73,206 32,524 40,682 88,169 2.171966 71,915 36,340 35,575 70,596 1.981967 69,416 38,268 31,148 61,212 1.961968 63,573 45,125 18,448 36,334 J 271969 77,275 47,422 29,853 56,672 .901970 80,050 49,030 31,246 58,618 1.881971 78,635 53,383 25,246 51,236 2.021972 71,674 56,750 14,924 30,791 2.06
1973 67,089 57,690 9,399 25,677 2-731974 60,955 60,465 490 4,462 9H6
1975 56,940 62,183 (-5,243) (-53,190) lo. ir1976 55,805 64,412 (-8,612) (-93,921) 10.911977 54,750 68,599 (-13,848) (-160,922) 11.62
a/ 1958-73 actual, 1974 estimated, 1975-77 projected.
b/ Quantities in thousands of 42-gallon barrels. Apparent domesticrefinery consumption is production minus exports.
c/ Values in thousands of U.S. Dollars.
Sources: Banco de la Republica; IBRD.

Table 3.6 - COLOMBIA: COFFEE AND OTHER EXRT REGISTRATIONS, 1958-74
(Thousands of U.S. Dollars)
Year Coffee Other Total
1958 388,088 21,407 409,4951959 3914,497 23,030 417,5271960 348,736 33,297 382,0331961 328,034 45,673 373,7071962 347,303 53,943 401,2461963 3i.4,325 48,576 362,9021964 393,164 73,635 466,7991965 346,742 96,667 443,3091966 333,201 333,201 -438,0921967 312,392 312,392 431,5881968 353,792 154,171 507,9631969 356,524 204,331 560,8551970 461,015 203,431 673,6991971 399,609 233,760 653,672
1972 - I 99,784 78,620 178,14041972 - II 96,641 102,300 198 ,9411972 - III 115,679 98,909 214,5881972 - IV 22852952 112.323 2 78251972 - Total -428,056 392,152 820,208
1973 - I 125,362 123,755 249,1171973 - II 148,163 123,143 271,3061973 - III 134,105 170,469 304,5741973 - IV 187.858 166.708 3j=qj61973 - Total 595,488 5814,075 1,179,563
1974 - I 203,050 198,164 401,2141974 - II 180,343 190,823 371,1661974 - III 106,103 183,430 289,5331974 - IV 133,603 220,618 353,621974 - Total 623,099 792,435 1,415,534
a/ Excluding petroleum
Source: Banco de la Republica, INCOMEX

Table 3.7- COLDMBIa: MINOR-EXPORT REGISTRATIONS BY MAIN PRODUCTS(In thousands of U. S. dollars)
1972 1973 1/ 1969 1970 1971 I II I-II V Ttl i t t V Ttl ~ 1974VToaAgricultural Pruduata 97,424 104,823 125,713 44.765 47 0 32014 42,628 16681 53_160 ,142 488 4049 179,164 70307 iT61,20 63,4 IV 269,446Cotton 36,038 34,671 33,163 18,749 13,616 10,011 8,004 50,380 16,835 8,083 7,690 7,189 39,797 32 819 12,642 20,598 6,900 72,959Cartle and beef 16,454 25,641 32,586 6,543 13,149 5,368 15,665 40,689 7,809 7,259 14,518 16,883 46,469 18,936 10,708 8,317 8,800 46,761Sugar 16,932 14,311 18,869 6,439 6,877 7,949 9,397 30,662 12,718 1,200 8,000 5,601 27,519 - 14,335 18,925 31,000 64,260Bananas 11,972 17,081 22,126 5,777 5,774 5,106 5,143 21,800 5,536 5,000 6,200 5,291 22,027 5,039 6,652 6,962 10,000 28,653Tobato- 7,529 7,373 10,459 4 599 3,076 399 993 9,867 6,022 7,200 5,000 3,583 21.805 6,B35 9,071 2,096 10,000 28,002Shrimp and shellfish 4,118 4,754 6,733 1,872 3,422 2,578 2,060 9,933 2,157 3,000 2,800 2,241 10,198 3,130 3,610 3,481 2,500 12,721Flower. 381 992 1,777 786 736 603 1,366 3,490 2,088 2,400 2,600 4,261 11,349 3,548 4,185 3,057 53300 16,090
btanufactured Prodoocts 65,778 0,0536 22,78 739 301 4,501 133,40 4 5,811 7132 83,143 251535 98,705 105_253 91,731 111.90 407 59
Clothing and teatiles 16,971 205,718 8,7 9,690 12,090 14,129 44,657 15,486 19,576 33,079 33,913 102,054 56,799 54,417 39,135 41,000 191,358Leather and bide. 9,124 6,908 7.370 2,900 4,572 5,882 9,980 23,419 4,422 7,472 7,991 10,295 30,180 3,626 3,505 4,830 8,100 20,061Chea.nal and phanmceutic-la 3,087 8,888 11,350 2,804 3,438 4,572 4,967 15,782 4,923 8,890 8,437 12,716 34,96E 11,749 17,407 16,291 22,000 67,44;lMtallio prad-oct 4,551 5,532 7,353 1,788 3,318 3,474 3,820 12,400 5,645 6,005 7,548 8,494 27,692 6,377 7,948 8,513 15,000 1O4 383hiechaaical and electricai eqcip nanr 4,270 4,383 5,341 1,401 1,869 2,212 2,311 7,793 2,114 3,001 3,661 4,288 13,064 3,427 5,257 6,339 8,200 23,223Timber and wood produ-tr 7,020 6,020 6,466 1,4,5 1,573 2,399 7,623 8,040 2,992 3,541 3,623 4,763 14,919 5,469 5,264 4,593 4,900 20,526Paper, cartons and bo-as 8,738 9,995 14,018 1,712 3,467 3,096 3,'11 11,486 4,034 3,706 3,393 4,840 15.973 4,603 5,868 6,308 8,200 24,979C-r.ant 3,654 4,484 2,865 1,043 1,350 2,161 1,484 5,938 1,560 1,4' 0 2 300 2,610 7,828 23543 2,283 4,350 3,000 12,176Glasg 4,097 4,082 3,572 813 941 1,155 976 3,885 1,065 1,200 1,300 1,224 5,789 4,112 3.304 1,372 1,500 10.288
hlinorai _ roducd 16t223 86.40 223i 8.5729 12753 15,751 14,.672 48 519 11_561 22,52, 25.0 692 6 02.S3 129 406 449 800 2,184tmeralds 4,443 3,272 5,908 4,809 12,201 13,833 11,935 43,781 10,541 21,500 25,000 193 57,234 - -Gold 7,316 2,277 1,541 - - 1,267 1,254 2,521 - - . - - - - -Platei-a 4,464 3,191 2,342 584 502 651 480 2,217 1,021 900 600 499 3,019 529 406 449 800 2,184
Otber Prod-ucts 4 7 .807 22.20 38.5081 11,678 17 756 19,033 6,909 65,412 20,099 19.4_1 38,124 45,970 19 41. 639 S 43 .177 51.438 77 1 9 6,64
Gro.s Tot1 222,990 2131422 254,065 85,579 1Q2,127 103.739 117,710 414.152 127,79 1320504 81_8654 174,85 4 61125l 109 _LBO 210,439 1 9 207_0 54524 511 876.18?
Adj-atnent- and rancellatio -18,659 -9,991 -27,305 -5,955 -5,827 -4,830 -5,387 -22,000 -3,5314 -7,661 -11,395 -8,146 -30,516 -13,056 -19,616 -23,624 -27,492 -83,748
N't. Tctal 03_4 I3, 7 786 20 10 0 9 .rrs2sff± & L55 -90.~9 112.373rn 38522Ž 12_8 390 .23 1183 .630 2 8 25
1/ Toals fcr Octoher, Novnmb-r and D.-etuhe are a-t-als, but the dibaggregation by prod-ct ho- bent estimated.
Sourre: Banco de la Republi-a and ITutaun.

Table 3.8 - COLOMBIA: REIMBURSAELE AND NON-REIMBURSABLE
IMPORT REGISTRATIONS, 1958-74
(Thousands of U.S. Dollars)
Reimbursable Non-Reimbursable Special TotalYear Imports Imports Imports a/ Imports
1958 276,528 31,734 . . . 308,2621959 377,109 25,913 . . . 403,0221960 444,547 42,580 . . 487,1271961 462,517 59,760 v . . 522,2771962 396,662 58,646 . . . 455,3081963 470,798 85,766 .. . 556,5641964 454,705 64,165 . . . 518,8711965 431, 6 99 61,438 . . . 493,1371966 580,568 59,995 . . . 640,5631967 439,220 84,948 . . . 524,1681968 521,261 103,644 . .0. 624,9051969 638,510 116,735 6,955 762,2001970 785,390 135,213 9,497 930,1001971 710,386 74,449 9,865 794,700
1972 - I 183,195 20,211 1,816 205,2221972 - II 188,084 41,145 2,352 231,5811972 - III 195,136 27,799 3,186 226,1211972 - IV 219,469 67 1,932 248,3681972 - Total 785,884 116,122 9,286 911,292
1973 - I 240,221 35,372 2,308 277,9011973 - II 266,215 36,833 6,637 309,6851973 - III 265,600 74,800 1,900 342,3001973 - IV 306.366 50,448 2,792 359,6061973 Total 1,078,402 197,453 13,627 1,289,492
1974 - I 371,280 57,064 2,093 430,4371974 - II 358,257 52,933 2,135 413,3251974 - III 427,297 78,496 3,200 508,9931974 - IV 372.288 63.090 350 .35.7281974 Total 1,529,122 251,583 7,777 1,788,483
/ Imports into Leticia and San Andres
Source: Banco de la Republica, INCOMEX

Table 3.9- COLOMBIA: IMPORT REGISTRATIONS BY ECONOMIC CATEGORY 1/ - 1969-74(in Thousands of U. S. dollars)
1972 1973 1974 _Z71969 1970 1971 I II II IV Total I I3 III IV Total I II ITI IV Total
Consomer Goods 90,000 98.200 87,500 26,340 25,423 27,159 33,952 112,874 34,042 47,04 60,919 50019 192054 60 46733 5663 196273Durables 39,100 45,400 39,000 13,835 13,479 li,217 13,276 51,807 13,976 19,052 22,749 12,535 68,312 12,307 16,266 15,095 12.033 55,701Noadoe-blen 40,900 52,800 48,500 12,505 11,944 15,942 20,676 61,067 20,065 28,022 38,170 37,484 123,742 34,853 30,467 41,539 33.713 140,572
Iotero,adiato Goods 313,800 383_000 355,600 95,867 108.288 L 119 434,826 1I-315 _3 141.403 1982914 595_402 243 135 731 18 La 2 379 .76 23Z*. LIlouels 4.400 3,400 7,000 583 837 659 3,625 5,704 795 570 703 522 2,590 580 833 1,828 3,000 6,241Agricultural lopoto 6,900 11,100 8,700 3,374 4,312 5,719 9,318 22,723 11,811 5,953 6,108 18,439 42,311 20,929 304004 47,601 30,695 129,22Slodostriol Inpots 302,500 368,500 339,900 91,91( 103,139 105,082 106,268 406,399 121,709 130,247 134,592 163,953 550,501 221,426 200,341 230,3,8 200,065 852,390
Cooi<ol ioods 361_800 -4 _1100 844300 8,907 95,429 2 sm92
93_225 54613 102090 118259 130.604 -1- 469.785 9 U_ , 133 167_24 152.359 5Con-truntion Eq.ipn-ent 13,900 27,500 13,700 2,240 2,777 2,134 3,665 50,818 2,704 I-,215 4,503 4,590 23,012 8,899 6,125 7,115 6,310 28,444AgUi-nltor-l Equip-ent 24,400 11,600 7,000 2,497 2,609 3,270 3,015 11,391 3,097 3,206 3,379 12,547 22,229 12,867 12,506 10,879 12,649 46,981Industrial Eq.ipr,.nt 175 900 259 300 7135200 49,544 64,355 59,278 59,123 232,300 71,862 77,507 60,087 63,986 273,442 74,468 70,112 82,462 80,000 307,042ro.nsport Equip-ent 147,600 142,700 110,400 26,626 25,688 20,368 27,422 100,104 24,427 26,331 62,635 37.713 151,106 40,097 43,203 66,797 53,400 203,492
Jncla.sif-ed 6,600 _7_800 7,300 2,108 2,441 2,450 19 8,979 7.454 7,582 9.374 _7 32, 24 5.388 5 29 3
fotal 72,2z~00 794-700 205_222 233,581 226121 9,292 277,901 _309685 3 59,606 3,2475819.92 =!3! 435,;281.8,3
1/ E-cluding crude petroleum imports.
2| Totals for Otober, Nov-ber and Denenber are bntuals, hot the disaggregation hac been estimated.
Soorce: Ben- de lo Republic- ond INCOMIX

Table 3.10- COLOMBIA: CUSTOMS CLEAWAMCE OF MERCHANDISE EXPORTS, Al 1965-73
(Thousands of U.S. Dollars)
Live Rides OtherCoffee Bananas Cotton Sugar Cattle Tobacco Cement and Skins Productm TotW
1965 343,901 18,620 8,040 7,597 - 7,025 2,221 4,795 58,596 450,9751966 ~~~~328,286 19,998 2,176 ,257 6,041 5,551 2,125 3,844 60,737 436,995
1967 322,372 25,003 1,5,355 11,256 1 422 4,390 3 3,639 62,631 448,7111968 351,441 24,692 27,839 14,906 1,669 4,903 6,311 8t,656 522,045
1969 34'.91 19 731 / / 7 6 73 b/ 7- 26 3,130 / 2 b/ 115 332 2/ 550.834January 12,642 5,6160 688 696 249 338 P,180 29,954February 25,176 1,097 3,398 1,375 271 543 600 541 10,688 43,676March 34,662 1,669 2,539 1 413 881 80 941 9,717 50,903April 20,987 1,125 3,517 1,546 322 866 306 882 10,185 39,736May 32,723 3,030 4,043 2,227 379 846 442 977 14,560 59,227June 35,527 1,045 3,031 1,806 269 781 133 812 10,204 53,608July 19,274 1,453 1,031 2,281 226 1,411 168 382 9,217 35,443August 24,092 1,340 2,442 2,865 365 363 227 394 E,541 40,629September 43 828 1,356 1,925 - 224 91 232 365 6,089 56,090October 20,909 1,690 2,533 864 1,359 141 130 518 9,316 37,460November 32,489 1,813 492 352 1,014 150 179 366 8,795 45,646December 41,606 1,828 1,675 744 1,718 462 376 687 13,880 62,996
1970 466.742 b/ 18Q075 b' an30o6 b/ 14,030 17,215 b/ 7 169 124 b/ 4 630' 115,344 b/ 677039 b/
January 36,659 3,113 526 986 2,206 513 141 1,025 1],456 56,625February 44,291 2,733 897 1,185 1,408 549 155 386 10,610 62,214March 56,600 1,460 1,037 1,488 1,713 487 420 338 7,084 70,627April 33,674 1,433 1,399 2,431 2,117 1,914 346 365 14,979 58,658May 42,132 1,666 822 1,609 994 591 415 1,230 9,013 58,472June 50,017 1,274 1,097 2,548 1,521 736 320 465 10,296 6B,274July 22,888 1,494 2,328 - 336 228 46 561 5,093 32,974August 31,602 56 1,174 1 2,009 579 65 446 10,281 46,213September 60,354 62 1,112 568 1,748 669 252 414 16,381 83,560October 10,408 43 1,214 774 1,017 256 453 420 11,755 26,340November 32,219 42 583 918 1,350 124 418 162 10,868 46,684December 37,838 19 791 1,522 801 523 162 403 ,,781 49,840
1971 395,393 b/ 14,657 b/ 46,884 b/ 15_709 b/ 16,079 -/ 9,164 b/ 2,937 b/ 593 137,466 h/ 644,Z84 b/
January 25,794 1,126 970 1 1,459 356 335 519 9,701 40,261February 27,566 1,021 966 478 1 235 920 7 219 P,312 40,724March 40,919 1,080 3,759 568 1,587 1,473 664 694 14,439 65,183April 23,799 1,477 6,498 2,622 1,298 1,284 30 463 12,267 49,738May 31,343 1,330 5,051 2,549 597 2,144 440 553 12,038 56,045June 45,346 1,171 1,925 629 1,624 1,215 158 396 1I,543 65,007July 20,071 1,299 1,798 - 156 1,051 195 195 6,479 31,244August 48,394 1,233 2.179 1,657 1,787 179 215 507 12,836 68,987September 43,042 986 3,513 2,274 1,248 137 256 521 1S,O 1 67,028October J 92,709 3,763 3,963 4,932 4,861 360 440 1,039 6F,390 180,457NovemberDecember
1972 428.934 b/ 13 309 b/ 74,129 h/ 28,396 b/ 11,316 b/ 9 308 _/ 5,021 b/ 15,929 b/ 20, ,483 _/ 8]3,689 b/
January 36,935 1,388 2,721 1,730 1,468 653 139 465February 38,298 1,287 2,553 6 160 987 127 599March 23,841 1,105 9,193 2,193 630 2,151 705 984April 30,477 1,100 9,542 1,282 1,474 1,326 217 1,059May 33,125 960 6,438 1,602 457 2,082 84 1,094June 33,206 1,103 9,118 3,505 1,760 587 442 1,572July 33,850 969 6,464 1,839 1,008 597 758 1,351Au8ust 35,742 813 6,520 1,766 1,545 44 705 1,345September 48,622 1,221 4,122 2,629 523 71 293 1,398October 20,977 966 7,814 2,335 937 19 470 1,473November 38,396 44 6,156 3,289 779 128 495 1,863December 55,465 2,353 3,488 6,220 575 661 586 2,726
1973 582 226 15,421 33,953 30_188 2,737 14,967 6,263 16e146 1,084,159
January 41,804 47 3,679 2,235 485 - 440 1,769 19,959 70,?18February 34,520 898 4,548 4,494 128 - 236 789 21,398 67,011March 45,555 1,135 5,389 5,218 134 _451 1,083 1(,6897 78,862
a/ Excluding Crude Petrole,sm
b/ Monthly data do not sum to annual totals because the latter have been revised and the forcer have not.
c/ Includes November and December, 1971

Table 3.11 COLOMBIA: CIF IMPORTS, BY PRINCIPAL PRODUCT GROUPS, 1958-72
(Thousands of U.S. Dollars)
Macliinc-r rC. hen=;c s Transport Food- Textiles Paper Rubberand Elec- and Metals Vehicles Stuffs and Mate- and
trical Pharmaceu- and and Equip- and Bever-' Manufac- rials and Min- Prod-Year Equipment ticals Products ment ages tures Products erals ucts Other Total
1958 10 1,238 66,557 55,726 32,151 44h210 24,924 20,325 15,572 9,955 29,274 399,932
1559 103,309 67,838 53,160 54,772 37,207 23,412 22,032 15,651 8,387 29,820 415,588
196).5 146,357 78,644 68,238 77,326 31,373 23,425 26,176 17,495 13,256 36,295 518,585
1961 158,700 87,794 64,620 89,664 43,842 21,60g 27,552 20,762 9,890 32,696 557,129
1f62 16c9,402 87,425 62,644 61,134 31,752' 20,221 26,311 21,848 12,323 47,291 540,351
1,63 Th8,717 97,557 G0,956 63,983 22,071 22,080 21,988 18,112 12,917 37,642 506,023
1 96 172,632 99,877 78,964 84,085 35,996 24,255 21,677 1-4,328 11,576 42,901 586,291
1965 14C,327 62,042 46,615 63,864 28,145 ?0,808 21,9h3 9,936 22,274 37,098 453,502
1 55 6 l6-1,ii6 128,819 83,765 89,443 49,691 25,775 32,280 14,128 31,807 49,268 67h,O92
1`67 14 2,,69) 76,531 54,483 84,072 26,737 13,550 26,554 12,258 20,530 39,171 496,855
1 68 187,515 100,79k 64,916 117,351 38,850 114,936 35,938 10,h03 25,603 46,942 643,247
196,9 l34,499 103,073 88, 946 119,156 4h,541 15,253 hO479 13,282 33,427 h5,581 685,273
1970 232,078 121,221 111,889 156,095 51,372 17,453 48,382 11,093 36,526 57,912 844,021
1971 27,511 132,551 IA '-'7 73,760 2;1 44S 46,093 18.228 142,507 72,393 929,h1
1"7" 2 23-)^2098 5>¾;1Ž>7 c$9Jl.06, (8 &,77 92,991 3 *7sZ61 10,391 35,169 146,7ti5 755,274
Source: DANE

Table 3.12-COLOMBIA: CIF COMODITY IMPORTS, CLASSIFIED tCCORDINGTO END-USE, 1958-71 a
(Thousands of U.S. Dollars)
Consumer RawNon- Consumer Materials and Transport Industrial Other
Durables b/ Durables c/ Fuels d/ Intermediates e/ Construction Equipment £/ Machinery h/ Goods i/ TOTAL
1958 53,948 8,746 12,732 139,315 28,550 21,985 90,527 44,125 399,928(13.5) (2.2) (3.2) (34.8) (7.1) (5.5) (22.6) (11.0) (100.0)
1959 56,371 9,408 12,013 142,251 18,186 39,016 100,017 38,240 415,592(13.6) (2.3) (2.9) (34.2) (4.4) (9.4) (24.1) (9.2) (100.0)
1960 54,487 19,565 14,138 168,016 25,118 49,777 170,422 17,062 518,585(10.5) (3.8) (2.7) (32.4) (4.8) (9.6) (32.9) (3.3) (100.0)
1961 63,881 40,461 16,980 165,748 25,019 41,661 182,037 21,020 556,807(11.5) (7.3) (3.0) (29.8) (4.5) (7.5) (32.7) (3.8) (100.0)
1962 57,813 18,546 17,367 170,321 24,584 34,550 193,986 23,184 540,351(10.7) (3.4) (3.2) (31.5) (4.5) (6.4) (35.9) (4.3) (100.0)
1963 47,561 11,096 13,389 173,826 23,538 44,451 170,237 21,923 506,021(9.4) (2.2) (2.6) (34.4) (4.7) (8.8) (33.6) (4.3) (100.0)
1964 73,012 15,858 10,884 189,581 24,263 69,320 191,269 12,104 586,291(12.5) (2.7) (1.9) (32.3) (4.1) (11.8) (32.6) (2.1) (100.0)
1965 48,928 12,589 6,052 154,895 12,171 45,669 158,019 15,178 453,501(10.8) (2.8) (1.3) (34.2) (2.7) (10.1) (34.8) (3.3) (100.0)
19o 88,028 30,841 7,799 271,008 18,216 55,104 188,185 14,966 674,147(13.1) (4.6) (1.2) (40.2) (2.7) (8.2) (27.9) (2.2) (100.0)
t967 56,755 29,039 7,070 148,569 23,818 53,977 160,363 17,271 496,862(11.4) (5.8) (1.4) (29.9) (4.8) (10.9) (32.3) (3.5) (100.0)
1968 75,043 23,040 5,191 198,060 18,296 85,882 217,914 19,832 643,258(11.7) (3.6) (0.8) (30.8) (2.8) (13.3) (33.9) (3.1) (100.0)
1969 80,637 27,847 8,127 235,302 23,938 86,161 192,369 30,892 685,273(11.7) (4.1) (1.2) (34.3) (3.5) (12.6) (28.1) (4.5) (100.0)
1970 89,470 29,630 8,761 277,371 28,176 112,366 226,760 70,425 842,960(10.6) (3.5) (1.0) (32.9) (3.3) (13.3) (26.9) (8.4) (100.0)
1971 114,623 30,749 10,960 304,935 34,306 95,403 284,477 53,988 929,441(12.3) (3.3) (1.2) (32.8) (3.7) (10.3) (30.6) (5.8) (100.0)
a/ Figures in parentheses refer to percentage share of total.
b/ SITC codes 0, 1, 42, 541, 55, 652-54, 656-57, 665-66, 841, 851, 892, and 895.
c/ SITC codes 667, 696-97, 724.1, 724.2, 725, 732.1, 821, 864, 891, 893-94, 896-97, and 899.
d/ SITC code 3.
e/ SITC codes 2 (excl 24), 4 (excl 42), 5 (excl 541 and 55), 61, 62 (excl 629.1), 641-42, 65 (excl 652-54 and 656-57),67 (excl 673 and 678), 68, 692, and 693.
f/ SITC codes 24, 631-32, 661-64, 673, 678, 691, 694, 698, and 812.
g/ SITC codes 629.1 and 73 (excl 732.1)
h/ SITC codes 695, 71, 72 (excl 724-25), and 861.
i/ SITC codes other 6, other 7, 862-63, other 8, and 9.
Source: United Nations Yearbook of International Trade Statistics,

Table 3.13 -COLOMBIA: DIRECTION OF TRADE, 1971-74(Thousands of U.S. Dollars)
1971 1972 1973 1974
Import Eoport Import Export IEport Export IEpert Expert
Registrations Registrations Registrations Registrations Registratio.s Registrations Registrations RegistrationsValue %_ ale Value % Value 7 Vslse / Value %7 Value Value 7,
North America 344,552 43.36 240,235 36.75 374,326 41.08 270,413 32.11 566,647 43.94 434,165 35.88 807,138 45.13 511,002 34.08
CetLral Axerica and Caribbean 8,385 1.06 25,428 3.89 7,790 0.85 35.496 4.21 11,153 0.86 54,752 4.52 32.288 1.81 140,702 9.38
Latin America 102 675 12.92 78,680 12.04 112.651 12.36 119,477 14.19 162,992 12.64 166,269 13.74 223,671 12.51 254,456 16.97
o.w. Andean Gro-p .j (50,945) (6.41) (56,940) (8.71) (46,051) (5.05) (82,728) (9.82) (70,917) (5.50) (9.45) (126,291) (7.06) (200,598) (13.38)
E.rope 2/ 275,653 34.69 286,167 43.78 335,037 36.76 366,712 43.54 455,496 35.32 (114,339) 40.70 572,310 32.00 552.407 36.84
Asia 41,230 7.70 21,321 3.26 78,371 8.0 48,856 5.80 90,288 7.00 492,446 4.69 149,151 8.34 28.298 1.89
Africa 523 0.07 768 0.12 926 0.10 1,139 0.14 1,303 0.10 56,767 0.393,925 0.21 12,417 0.83
Other 1,682 0.20 1,075 0.16 2,191 0.25 115 0.01 1,613 0.14 4,770 0.08
Gross Totals 794,700 100.00 653,674 100.00 911,292 100.00 842,208 100.00 1,289,492 100.00 910 100.00 1,788,483 100.00 1,4QQ,282 3nn.o
1/ Veneesela only joioed the Andean Group is 1973. However, the figures for the Andean Group in 1971 and 1972 inclode Venetuela in order to make thin comparable with those for 1973 and 1974.
2/ Includes Eastern Europe.
Decree: Instituto Colohbiano de Coxercio Exterior (INCOMEX); IBRD.

Table 3.1_4 -COLOMBIA: BALANCE OF PAYMENTS, 1969-74
(Millions of US Dollars)
1969 1970 1971 1972 1973 1974hi
FOB Merchandise Exports 672 788 752 979 1,322 1,655
Coffee 344 467 400 430 598 625Coffee AdjustmentC/ 26 -3 -1 39 35 48Petroleum and derivatives 71 73 75 51 53 92Minor exports d/ 226 245 274 449 636 890Non-monetary gold 5 6 4 10 __ __
FOB Merchandise Iaports 648 802 900 848 1,000 13o43o.w. Petroleum and
derivatives 4 3 7 6 3 6
Trade Balance 2 -14 -1148 131 322 312
Service Receipts 198 208 222 228 287 322
Freight 46 43 49 49 65 64Othez Transportation 44 52 58 55 70 80Travel 45 50 61 59 72 89Other 63 63 54 65 80 89
Service Payments 291 2L2 X 388 438 529
Freight 63 68 85 74 93 136Other Transportation 60 95 112 114 124 130Travel 59 52 63 69 87 110Other 109 118 125 131 134 153
Goods and Services Balance -69 -139 -311 -29 171 105
Net Factor Payments -144 -180 -176 -197 -218 1192Net Unrequired Transfers 38 27 34 35 34 32
Current Account Balance -175 -292 -1453 -191 -13 i
Private Capital 110 100 101 67 -6 18
Direct Investment 50 39 40 17 23 28Loans (net) 60 61 61 50 -29 -10Utilization (113) (128) (145) (139) (59) (50)Amortization (-53) (-67) (-84) (-89) (-88) (60)
Public Capital 132 161 135 260 275 175
Utilization (200) (236) (227) (355) (405) (328)o.w. Private loans 10 17 13 15 19 8
Amortization (-68) (-75) (-92) (-95) (-130) (-153)o.w. Private loans -7 -7 -11 -9 -23 -16
SDR Al:ocation _ 21 17 18
Net Reserve Change (increase -3 6 82 -164 -244 339in a:;sets)Central Bank -61 -55 -18 -175 -171 95Rest of Banking System 58 61 100 11 -73 244
Other ';hQrt Term; Errorsand 6missions -64 4 118 10 -12 47 7 e/
i PrelLminaryi Estimatedc/ Includes changes in coffee stocks abroad and coffee valuation adjustment/ Inclides an adjustment in order to transform registrations into customs clearances.
e/ Includes sharp increase in import financing which occurred in last half of 1974.
Source: Banco de la Republica; IBRD.

_1 4104000 104U ° 014404040104 e0000 440 '0 04 0
os=cssscscs o o~C*os>O0 404 o1 04
440 04 040 - 41 n0eNH
0100.044 00 044440D440404 0410 4 I4 0400440401.00040440404104044010 0440m1 0' 44 '4
4044' 40401 r4010.0.0040-0o40 0430144 43 403
40-440404 0104040404 _00 04 41N
.01404404. 00 0401040 oc 1>.O40^g4404401 01° 0 0$1.''0
O> 4040404b 044 03400440a 4440404 90 0 0104
0 .0404040400 010 .100100104d.040400 04144 04%1041
1>0100040404 O0000°q l°-iS
040 0414 N040110 043S0410000404 0 401 r k 404 ° 3 0143
04 U14004.0404 4043040104444 4]04 01-Hi
01 I 1 414 0
Io0 ' 0 0 N o d e _m ^o 14 1 1I: 44 01s1<^40c4014 44040000044000 '0 0 >C1 aNO aH|O <
100400 044I004040440s000 0140140 04 °. obS0441>
0~~~~ ~ ~ 0 0404
440404040410 s 04001 04010104040100401 44040104 4 014_ 040i 6130014014_0104 )10.104.000 1040 1 43000 04 03
0 I 144 0 40440104N 04001404° DNHNN_N e0 04000 044.04
04434040104040104z 4301004044004401R 013440 0> 303-1
04I= 10110410 AS041440204 as04404 Hnp 010
x4 040014 0404010404044040. | 0 4-4010_44oil ° °1
40 14000. N ta )S0 1_ q.04000N 1040440 0 14101
I ) I- I0 i M 0 01_r_4 0 A
014sno O 0 00000-040 0 04lgn 0 0004-0g 01 0 OsO - 1>
1 0 d 0 0o 00 0 r 0 1-1N
00 o 404 |o 00004 4- 0. g0 0 - 00-4 Rl0 0404 000 0 0 S4 0 o
0.1';s00000 10.44 e.0'44 00 4444 ; 8I -I1000001N00 04-0l { 0 44 00 0DS°n ln41010 O
I 4-OOzO0 Nn~X>4000400 -00000000.000004_ 4000 I _U:. 0_ DOAOZ0 E NO 440 N0. R

T.b1. 3.16 - COLOMBIA! ADVANCE AND NORMAL 5IERCEAN5DISE EXPORT EXCEANGE
SBRBENDER, BY QUARTER, 1966.74 &
(Tho.a..d. of U.S. Dfolara)
Cott.. E rt. Minor zxvort. Total Mnrc4hndiE ExportjYItr and =Vinoe Normal Tat Advao/TORal Adven.a ENo- A ol t Adv...c/Total Adv- Nor D Advarn./Tota_Q.ULjL SurreEidr tvroEndEr SurrIndf r .. rcnitst ISurrUnder i10Lrnur Surrender _.RE0tngn._ =snurAr SL rgnE0r n hr Ua _OMtaLo ntUx_
1966-I 15,946 43,155 59,101 27,0 6,655 14,779 21,434 31.0 22,601 57,934 b0,535 28.1
1966.21 42,632 67,137 109,769 38.0 6,936 18,670 25,626 27.1 49,588 S5,807 135,395 39.6
1966-111 6,451 60,491 66,492 10.0 7,219 14,835 22,054 32.7 13,670 73,326 88,996 15.4
1966-lV 14.590 51.900 66.490 21.9 12,296 14.319 26,615 46.2 26,886 66,219 93.105 28.9
1966 Total 79,619 222,683 302.302 26.3 33,126 62,603 95.729 34.6 112,745 285,286 398.031 28.3
1967-1 16,575 46,136 62,711 26.4 8,608 10.424 19,032 45.2 25,183 56,560 81,743 30.8
1967-11 36,746 51,678 88,514 41.5 15,274 17,557 32,831 46.5 52,020 69,325 121,345 42.9
1967-III 23,005 47,025 70,030 32.9 16,982 15,004 31,986 53.1 39,987 62,029 172,016 39.2
1967-rV 41,845 _3.5713 97.550 42.9 25.864 7.357 33,211 77.8 6769 _3.70 10_ 769 51.9
1967 Total 118.171 200,642 318.813 37.1 66,718 50,342 117.060 57.0 184,889 250.984 435,873 42.4
1968-. 31,808 36,529 68,337 46.5 20,146 13,036 33,182 60.7 51,954 49,55 101,519 51.2
1968-11 45,203 40,453 93,661 40.3 23,901 21,934 45,835 52.1 5,0lD0 5.307 139,496 49.5
1968-111 24,730 47,269 71,999 34.4 25,B98 17,536 43,434 59.6 50,b29 54.805 115,433 43.9
1968-lV 34.000 46.147 80,147 42.4 29.676 26.307 55,983 53.0 63,67b 7 2 44 13h,130 46.0
1968 Total 135.746 178.398 314.144 43.2 99.621 78,813 178.434 55.8 235,367 21 492,578 47.8
1969-I 21,972 45,B66 67,838 32.4 24,407 21,852 46,259 52.8 46,370 67,728 114,097 s0.6
1969-I1 33,796 37,383 71,179 47.5 33,017 22,029 55,046 60.0 6b.813 59,412 126,225 52.5
1969-111 43,651 46,759 90,410 48.3 31,444 20,126 51,570 61.0 75,095 46,705 141,080 52.9
1969-IV 61,764 41.662 103.426 59.7 27.641 26.681 54.322 50.9 89.405 ~ b,343 I157.,748 58.7
1969 T.tal 161,183 171.670 332,853 46.4 116.509 90,688 207,197 56.2 277,69 212,358 940,050 51.4
1970-0 55,095 54,157 109,232 50.4 44,951 16.318 61,269 73.4 100,1z44 75,457 170,501 58.7
1970-II 41,624 63,865 105,489 39.5 34,031 10,365 52,396 64.9 75.465 h24,73(0 157,86s 4,7.
1970-11I 22,410 59,981 82,391 26.9 32,926 21,048 53,974 61.0 55,335 41,779 132,5,W 40.
1970-Iv 41.216 67.215 108,431 38.0 48,274 21. Q98 69,372 69. _8 9_44 1,313 _77 L3 0 57.3
2979 T-Ia, 160,345 245.198
605543 9.5 160.182 76,S29 237,011 67.4 320,527 322,Q .t7 -2.54 46 9
1971-I 28,297 49,063 77,360 36.6 39,586 10,622 58,208 68.0 7.9,83 67,4S4 133,568 `.0 1
1971-11 48,816 41,807 90,623 53.9 45,587 23,686 69,273 65.7 54,403 .5,493 109,894; 59.5
1971-II1 48,623 46,681 95,304 51.0 47,859 23,350 71,209 67.2 54,407 70,077 0s,513
57.q
1971-IlV 47,567 47.756 95.323 50.0 71.190 27,948 99.138 71.8 118.757 75,704
1461.1
1971 Total 173,303 185.307 358.610 48.3 204,222 93,606 297,828 60.4 377,525 278,913 65438 57.L5
1972-1 49,952 47,354 97,306 51.3 64,067 17,693 81,760 78.4 114,079 s45, 47 174
.0s- b3. 7
1972-II 66,990 41,373 110,363 62.5 87,882 26,160 113,942 77.0 156.812 67,533 2.54 345 69.9
1972-111 49,926 40,454 90,380 55.2 61,714 27,697 89,411 69.5 115,b40 68,151 21,791 51.1
1972-IlV 83,620 51.967 135,587 61.7 73,125 48,599 121,724 60.1 16,4 66 2 7,3. 640.
1972 Total 252.488 181,148 433,636 58.2 286,728 120,149 406,8 77 70.5 ,35,211 301,297 _ 44.2
1973-1 79,393 64,064 143,457 55.3 42,931 51,046 93,977 45.7 122,324 115,110 237,434 51.5
1973-11 58,940 85,186 144,126 40.9 66,732 68,443 135,175 49.4 125,b72 153,h29 279,301 45.0
1973-III 30,870 51,500 82,370 37.5 13,533- 108,191 121,724 11.1 44.403 159,691 205,944 21.8
1973-0v 81.397 84,060 165, 457
49.2 122,405 122,405 0.0 81,397 20_,465 ,28,962 28.3
1973 Total 250,600 264,810 535,410 44.8 123,196 35Q,095 473 ,281 2b.0 373,796 634,89/ 1 ,008 .l 37.1
1974-I 116,450 54,545 170,995 68.1 - 142.611 142,611 0.5 12j,455 157.535 313,04 3-.1
1974-11 83,687 25,645 109,332 76.5 174.457 174,875 0.0 83,447 200,502 284.189 25.4
1974-11 14,711 82,071 96,782 15.2 - 145,909 165.905 0.0 14,711 247,930 262,45 1
1974-1E 92,553 73,706 166,246 55.7 - 182.bS2 187,2 70 92,5, 264,377 _ 373,54b 2,.2
1974 Total 307.406 235,967 543,373 56.b - 671,259 6),2,s .0 371,4n6 537,742 1,214,432 29 3
a, S-rrond-r value. idootified as-ordiog tosr-igi-al 0,05-0, i.e., either adsance or- orsl (-x pstA).
b7 starting Axg..t 1973 the advanced e-ch..g. svrrendoro - prohibi-ed for si-sy oxports.
Source: Ba... do la Ropoblica.
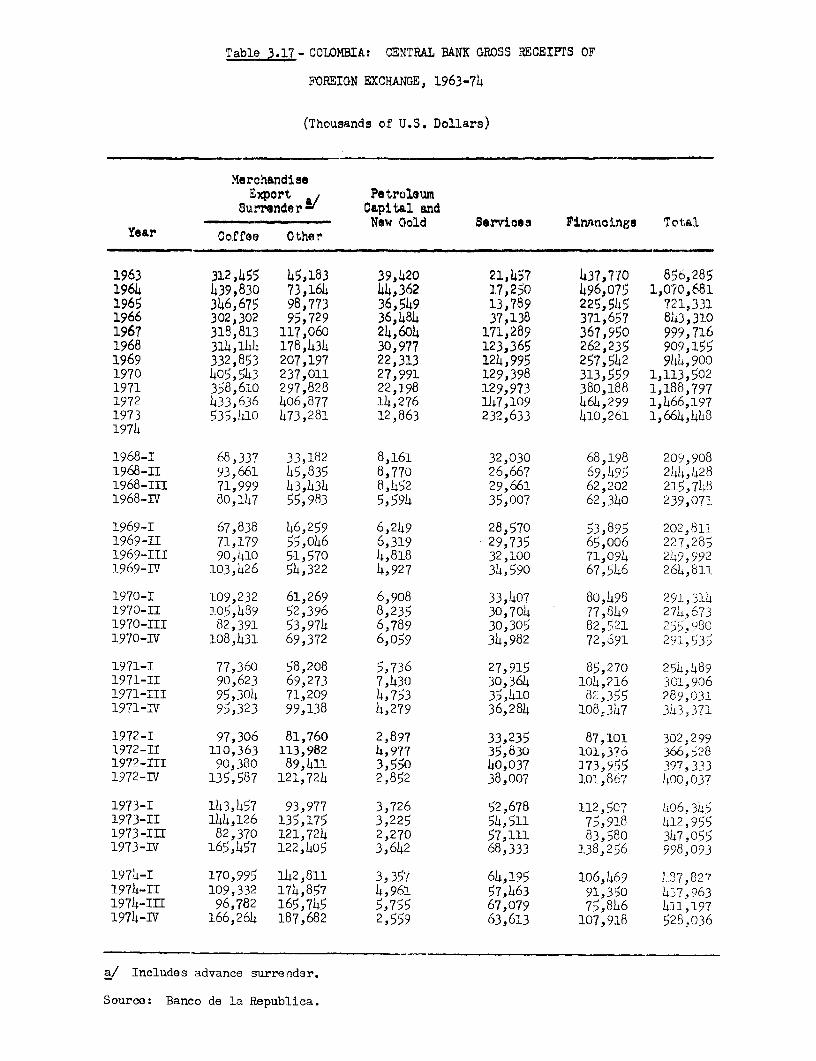
Table 2.17- COLOMBIA: CENTRAL BANK GROSS RECEIPTS OF
FOREIGN EXCHANGE, 1963-74
(Thousands of U.S. Dollars)
MerchandiseExport Petroleum
Surrenders Capital andNow Gold Services Finanoings Total
Year Coffee Other
1963 312,455 45,183 39,420 21,457 437,770 856,2851964 439,830 73,164 44,362 17,250 496,075 1,070,6811965 346,675 98,773 36,549 13,789 225,545 721,3311966 302,302 95,729 36,484 37,138 371,657 843,3101967 318,813 117,060 24,604 171,289 367,950 999,7161968 314,144 178,434 30,977 123,365 262,235 909,1551969 332,853 207,197 22,313 124,995 257,542 944,9001970 405,543 237,011 27,991 129,398 313,559 1,113,5021971 358,610 297,828 22,198 129,973 380,188 1,188,7971972 433,636 406,877 14,276 147,109 464,299 1,466,1971973 535,410 473,281 12,863 232,633 410,261 1,664,4481974
1968-I 68,337 33,182 8,161 32,030 68,198 209,9081968-IT 93,661 45,835 8,770 26,667 69,495 244,4281968-III 71,999 43,434 8,452 29,661 62,202 215,7L81968-IV 80,147 55,983 5,594 35,007 62,340 239,071
1969-I 67,838 46,259 6,249 28,570 53,895 202,811.1969-II 71,179 55,046 6,319 29,735 65,006 227,2851969-III 90,410 51,570 4,818 32,100 71,094 249,9921969-TV 103,426 54,322 4,927 34,590 67,546 264,811
1970-I 109,232 61,269 6,908 33,407 80,498 291,3141970-II 105,489 52,396 8,235 30,704 77,849 274,6731970-III 82,391 53,974 6,789 30,305 823521 25'?$,9801970-IV 108,431 69,372 6,059 34,982 72,691 291,535
1971-I 77,360 58,208 5,736 27,915 85,270 254,4891971-II 90,623 69,273 7,430 30,364 104,216 3C0,9061971-III 95,304 71,209 4,753 35,410 82,355 289,0311971-lV 95,323 99,138 4,279 36,284 108,347 343,371
1972-I 97,306 81,760 2,897 33,235 87,101 302,2991972-II 110,363 113,982 4,977 35,830 101,370 366,5281972-lII 90,380 89,411 3,550 40,037 173,955 397,3331972-IV 135,587 121,724 2,852 38,007 101,867 400,037
1973-I 143,457 93,977 3,726 52,678 112,5C7 L06.3451973-II 144,126 135,175 3,225 54,511 75,918 412,9551973-III 82,370 121,724 2,270 57,111 83,580 347,0551973-IV 165,457 122,405 3,642 68,333 138,256 998,093
1974-I 170,995 142,811 3,357 64,195 106,469 l87,8271974-II 109,332 174,857 4,961 57,463 91,350 4371,9631974-III 96,782 165,745 5,755 67,079 75,846 411,1971974-IV 166,264 187,682 2,559 63,613 107,918 528,036
a/ Includes advance surrender.
Source: Banco de la Republica.

Table 3.18 - COLOMBIA: CENTRAL BANK DISBURSEMENTS
OF FOREIGN EXCHANGE, 1963-74
(Thousands of U.S. Dollars)
Imports
Year Ordinary-a AID Other./ Petroleum Services Financings Total
1963 261,562 50,115 27,153 23,002 61,466 423,137 846,435
1964 323,101 56,994 42,935 24,607 66,848 541,523 1.056,008
1965 249,868 10,000 40,827 27,464 59,178 328,172 715,509
1966 312,480 40,617 68,249 35,582 101,342 284.902 843,172
1967 343,359 58,310 47,242 29,017 122,753 399.251-/ 999,932
1968 249,004 77,959 92,891 38,961 182,143 205,480 846,438
1969 321,388 66,031 87,069 33,434 198,298 198,404 905,254
1970 395,097 81,876 81,124 40,427 260,081 254,706 1,113,311
1971 487,945 49,346 75,370 39,768 265,460 263,103 1,180,992
1972 548,522 11,526 94,613 47,287 296,678 340,099 1,534,360
1973 661,990 9,550 72,764 51,357 388,985 349,714
1974
1968-I '7,539 24,902 29,024 8,590 41,015 76,653 237,723
1968-II 61,779 19,984 23,072 8,569 42,152 49,671 205,227
1968-III 56,655 20,492 21,784 9,300 52,344 45,845 205,420
1968-IV 73,031 12,581 19,011 12,502 46,632 33,311 197,068
1969-I ,5,697 8,724 19,317 9,727 34,998 58,510 206,973
1969-II F,2,967 13,369 22,721 8,070 49,536 51,979 228,642
1969-III 79,708 22,833 17,109 7,764 56,122 45,257 228,793
1969-IV &3,016 21,105 29,922 7,873 58,272 42,658 240,846
1970-I 76,385 13,280 17,060 9,441 52,063 63,82' 237,055
1970-Il 95,891 20,328 16,858 8,685 63,248 64,083 269,093
1970-III 100,343 23,650 24,573 11,560 68,926 47,705 276,757
1970-TV 122,478 19,618 22,633 10,741 75,844 79,092 330,406
1971-I 115,157 17,786 21,438 9,826 58,758 64,799 2S7,764
1971-II 115,042 18,934 19,443 9,659 68,083 75,158 306,319
1971-IlI 130,673 8,040 14,816 8,956 71,805 54,002 288,292
1971-IV 127,073 4,586 19,673 11,327 66,814 69,144 298,617
1972-I 127,746 2,053 25,208 10,306 66,878 80,720 312,911
1972-II 138,813 3,693 22,384 10,986 80,811 78,368 335,0551972-IIT 139,734 4,116 21,122 11,488 74,399 106,389 357,246
1972-IV 142,229 1,664 25,899 14,507 74,590 74,624 333,513
1973- 142,424 2,229 18,494 13,292 77,766 65,390 319,595
1973-II 153,309 2,952 21,929 10,646 97,590 96,256 382,682
1973-III 157,522 3,221 16,515 13,925 93,616 83,590 368,389
1973-IV 208,735 1,148 15,826 13,494 120,013 104,478 463,694
1974-I 202,920 941 31,476 18,784 93,755 87,21(1 435,086
1974-II 230,053 363 24,502 17,213 115,656 92,866 480,653
1974-III 235,300 200 30,382 15,474 141,465 85,618 508,4391974-IV 259,463 38 34,436 16,017 128,716 90,922 529,592
a/ Exchange certificate imports.b/ Bilateral agreeaments, Plan Vallejo, IBRD, lines of credit for vehicles and riachinery.c/ Financings in 1967 include some interest payments as well as amortization of principal
(interest payments normally appear under Services)
Source: Banco de la Reputblica.

Table 3.19 _ COLOMBIA: CENTRAL BJ4YC GROSS R;SERVES OF GOLD
AND FORErGN EXCHANGE, 1957-74h/
(Millions of U.S. Dollars)
End-of-quarter positions:
Year I II III IV
1957 -- __ __ 157.0
1958 128.6 121.8 150.0 172.8
1959 193.5 205.6 .195.5 230.4
1960 223.2 214.3 187.6 178.4
-1961 189.5 152.5 162.8 170.6
1962 157.9 175.2 -143,5-' 115.8
1963 131.9 147.1 117.8 124.6
1964 152.5 141.3 122.8 147.2
1965 134.6 104.1 15.5 145.3
1966 99.4 109.2 119.0 144-1
1961 152.2 142.2 1240.4 149.4
1968 123.0 163.1 174.9 27.7
1969 213.5 212.1 233.3 257.4
1970 311.5 317.1 296.3 257.5
1971 224.2 219.8 220.6 265.3
1972 253.3 285.3 326.2 392.8
1973 479.5 509.8 488.4 522.8
1974 576.0 532.9 435.6 435.3
a/ Gross holdings include gold, exchange, securities (1DB and TfRD bonds),net bilateral exchange positions, and IMF gold tranche.
Source: Banco de la Republica.

Table 3.20 - COLOMBIA: CDITRAL BANK INTERNATIONAL MONETARY
LIABEIITIES, 1962-74 /
(Thousands of U.S. Dollars)
Balances at End of Period:International
Total Monetary ForeignYear Debt Fund Banks Other
1962 195,307 72,500 122,807 _1963 236,585 121,000 115,585 -1964 269,182 108,500 135,682 25,0001965 206,771 84,500 122,271 -1966 238,826 88,750 139,289 10,7871967 185,617 122,650 57,383 5,584
1968-I 169,842 122,650 42,613 4,5791968-II 172,953 126,650 43,o80 3,2231968-III 173,864 133,900 38,037 1,9271968-IV 182,529 143,900 38,065 564
1969-I 162,466 130,400 31,910 1561969-II 161,852 130,400 31,348 1041969-III 156,982 130,400 26,478 1041969-IV 160,804 137,500 23,252 52
1970-I 142,143 124,850 17,241 521970-II 131,818 116,350 15,468 -1970-Ill 125,001 111,301 12,700 1,0001970-IV 105,492 94,101 10,391 1,000
1971-I 93,073 89,751 3,322 -1971-II 79,449 79,436 13 _1971 -III 79,449 92,501 13 -1971-- rI 94,871 92,501 13 -
1°72-t 88,609 86,251 - 2,3581972-II 87,172 83,872 - 3,3001972-I-l 47X533 42,615 - 4,9181972-IV 47,533 43,615 - 4,918
1973-I 47,533 42,651 - 4,9181973-II 49,823 42,344 - 6,9441973-TII 39,516 32,572 - 6,9441973-IV 6,944 - 6
197h-I 6,91t4 - - 6,9441978-II 6,944 - -
1974-III 6,112 - - 6,L 21978-TV 6,112 - _ 6,112
a7External obligations of a short-term and medium-ter- '1 year. orless nature; when deducted from gross reserves the revitainder isreferred to as net foreign reserves.
Source: Banco de la Republica.

Table 3.21 - COLOMBIA: INTERNATIONAL MONETARY RESERVES OF THE
CENTRAL BANK, 1968-74
(Millions of U.S. Dollars)
End-of-period positions:
1st 2nd 1st 2nd 1st 2nd 1st 2nd 1st 2nd 1st 2nd 1st 2ndHalf Half Half Half Half Half Half Half Half Half Half Half Half Half
1968 1968 1969 1969 1970 1970 1971 1971 1972 1972 1973 1973 1974 1974
Gross Reservesil 163.1 217.7 212.1 257,4 317.1 257.5 219.8 265,3 285.3 392.8 509.7 522.8 532.9 435.3
Gold 32.8 30.6 28,7 26.5 26.1 16.9 15.7 14.0 14.9 16.4 16,0 16.1 17.8 17.8IMF Gold Tranche 31.2 31.3 31.2 31.2 31.2 39.2 39.2 39.3 42.6 42.6 42,6 42.6 47.3 47.3Foreign Exchange 83.0 141.2 132.8 190.8 247.4 180.2 125.3 172.2 176.7 269.0 343.7 351.3 348.5 254.3Net Bilateral Agreements 15.0 13.6 16.4 4,9 5.3 12.1 15.7 24.0 24.8 24.5 7,6 - 1.0 - 4.0 - 12.2IDB & IBRD Bonds 1.0 1.0 3.0 4.0 7.0 9.0 8.0 7.5 9.5 21.3 80.9 88.8 93.7 98.5SDRs 15.8 8.3 16.8 19.0 18.9 25.0 29.6 29.6
Liabilitiesa/ 173.0 182.5 161.8 160.8 131.8 105.5 79.4 94.9 87.2 47.5 49.8 6.9 6.9 6.1
IMF 126.6 143.9 130.4 137.5 116.3 94.1 79.4 92.5 83.9 42.6 42.3 -- -- __
Foreign Banks 43.1 38.1 31.4 23.3 15.5 10.4 -- -- -- -- __ __ _ __Other 3.2 0.6 -- -- -- 1.0 -- 2.4 3.3 4.9 7.5 6.9 6.9 6.1
Net Reserves -9.9 35.2 50.3 96.6 185.3 152.0 140.3 170.4 198.1 345.3 459.9 515.9 526.0 429.2
a/ Figures may not add to totals because of rounding. Liabilities refer toshort-term and medium-term external obligations (10 years or less).
Source: Banco de la Republica.

Table 3.22 -COLCMBIA: OFFICIAL MARKET RATES OF EXCHANGE, BY QUARTER, 1967-74
(Pesos per US Dollar)
Dollar Purchase Dollar Sale
End Exchange Petroleum Exchange Prefer-of Certificate Capital Certificate ential
Period Rate a/ Rate g Rate v Rate £,/
1967 - I 13.53 7.67 13.53 9.001967 - II 144.6 7.67 14.51 9.001967 - III 15.30 7.67 15.30 9.001967 - IV 15.76 16.25 15.82 9.00
1968 - I 15.98 16.25 16.03 9.001968 - II 16.29 16.33 9.001968 - III 16.55 16.57 9.001968 - IV 16.88 16.91 9.00
1969 - r 17.10 17.14 9.001969 - II 17.27 17.31 9.001969 - III 17.55 17.59 9.001969 - IV 17.85 17.90 9.00
1970 - I 18.15 18.20 9.001970 - II 18.41 18.48 9.001970 - III 18.76 18.81 9.001970 - IV 19.09 19.13 9.00
1971 - I 19.48 19.52 9.001971 - II 19.87 19.91 20.001971 - III 20.38 20.42 20.001971 - IV 20.90 20.94 20.00
1972 - I 21.42 21.48 20.001972 - II 21.89 21.91 20.001972 - III 22.32 22.35 20.001972 - IV 22.78 22.83 2°0.00
1973 - T 23.02 23.07 20.001973 - II 23.36 23.32 20.001973 - III 23.77 23.83 20.001973 - IV 24.39 24.44 20.00
1974 - I 25.20 25.25 20.00197h - II 25.54 25.58 20.001974 - III 25.90 25.95 20.001974 - IV 27.57 27.65 20.00
/ Decree-Law 444 of March 22, 1967, created this flexible ExchangeCertificate Rate which remains in force today.
b/ MonE,tary Board Resolution 8 of March 10, 1965, established a rate ofCol$7.67 for the purchase of dollars brought into Colombia as capitalimportation by oil companies. Resolution 13 of March 22, 1967, continuedthiE rate and specified precisely the types of activities and outlays towhich the rate applied. Resolution 58 of November 10, 1967, ruled thata Capital Market buying rate would be used for petroleum companyconversions. This rate existed from November 1967 through May 1968 ata constant Col$16.25. On June 1, 1968, Resolution 24 transferred petroleumcapital transactions to the Certificate Market.
c/ The Preferential Rate for domestic purchases of crude petroleum was heldat Gol$9.00 from 1962 to June 25, 1971, when it was raised to Col$20.00.
Source: Banco de la Repfiblica.

Table 3.23- COLOMBIA: CERTIFICATE MARKET SELLING RATE
OF EXCHANGE, BY MDNTH 1967-74.i
(Pesos per U.S. Dollar)
Month 1967 1968 1969 1970 1971 1972 1973 1974
January 13.50 15.81 16.92 17.94 19.19 21.04 22.94 25,0013.50 15.82 16.94 17.97 19.28 21.14 23.02 25.15
February 13.50 15.87 16.97 18.04 19.32 21.21 23.08 25.2713.50 15.93 17.02 18.06 19.36 21.29 23.15 25.36
March 13.53 15.98 17.08 18.13 19.46 21.39 23.19 25-4713.53 16.03 17.14 18.20 19.52 21.48 23.23 25.51
April 13.82Ži 16.09 17.17 18.24 19.61 21.55 23.31 25.5413.94 16.15 17.18 18.32 19.66 21.62 23.36 25.57
May 14.08 16.22 17.21 18.33 19.73 21.72 23.41 25.5914.21 16.29 17.23 18.39 19.77 21.80 23-45 25.60
June 14.42 16.31 17.31 18.42 19.84 21.87 23.25 25.6214.51 16.33 17.31 18.48 19.92 21.91 23.54 25.64
July 14.63 16.35 17.37 18.52 20.02 22.01 23.65 25.6814.73 16.39 17.37 18.57 20.09 22.08 23-71 25-72
August 14.88 16.42 17.48 18.59 20.20 22.13 23.81 25.8715.02 16.48 17.54 18.63 20.26 22.19 23.93 26.00
September 15.17 16.52 17.58 18.73 20.36 22.30 24.03 26.3115.30 16.57 17.59 18.81 20.42 22.35 24.10 26.58
October 15.44 16.65 17.66 18.86 20.52 22.45 24.23 27.0515.52 16.72 17.68 18.93 20.60 22.50 24.35 27.31
November 15.67 16.79 17.73 18.96 20.69 22.58 24.42 27.6315.72 16.85 17.79 19.01 20.74 22.67 24.49 27-92
December 15.78 16.90 17.83 19.07 20.86 22.75 24,68 28.3015.82 16.91 17.90 19.13 20.94 22.83 24.82 28.60
Average 14.54 16.33 17.36 18.49 19.98 21.92 23.67 26.14
i/ Upper figure for each month refers to monthly average rate ccmputedfram daily quotations provided by the Banking Superintendency, lowerfigure refers to end-of-period value.
i.! April 1967 is first month reflecting the effect of Decree-Law 444of March 22, 1967, which stipulated that the certificate rate shouldbe determined by market forces.
Source: Banco de la RepAblica.

Table 3.24- COLOMBIA: BALANCE OF PAYMENTS EXPORT PROJECTION
1972 1973 1974 1975 1976 1977 1978 1979 1980 1985
II. Exports f.o.b.
A. Ccntar.t (1972) US$ iill.ons
Gold, Emeralds,and Platinum 54.0 53.0 1.5 1.4 5.0 6.0 7.8 10.9 16.4 80.5Crude Petroleum 31.0 19.5 1.1 - - - - - - -Coffee 469.0 486.2 496.3 474.3 480.1 487.3 494.6 502.0 509.5 548.9Cotton 56.0 24.5 38.7 42.0 40.0 42.8 45.8 49.0 52.4 73.5Sugar 34.0 21.5 15.9 23.9 30.0 36.0 41.4 47.6 53.3 80.5Bananas 24.0 21.6 25.4 34.7 45.0 54.0 63.2 72.7 81.4 121.8Cattle and Beef 45.0 37.7 33.3 24.5 45.0 54.0 63.2 72.7 81.4 122.9Manufactured Goods 148.0 222.2 302.4 265.0 285.0 330.6 386.8 456.4 538.6 965.2All Other Goods 118.0 171.8 249.2 263.6 290.0 330.6 380.2 441.0 511.6 869.4
o/w Refined Petroleum Products (20.5) (20.4) (19.2) (14.1) (12.1) (13.2) (14.2) (15.1) (16.0) (20.0)
Total Goods 979.0 1,058.0 1,163.0 1,129.4 1,220.1 1,341.3 1,483.0 1,652.3 1,844.6 2,862.7Non-factor Services 228.0 245.3 201.4 187.5 210.0 224.7 240.4 257.3 275.3 386.1Total Exports 1,207.0 1,303.3 1,365.2 1,316.9 1,430.1 1,566.0 1,723.4 1,909.6 2,119.9 3,248.8
B. Price Indices (1972 = 100)
Gold, Emeralds, and Platinum 100.0 117.0 131.6 146.7 161.1 174.8 188.8 203.0 217.2 304.6Crude Petroleum 100.0 133.3 441.7 492.5 529.4 563.8 593.7 623.4 655.8 919.8Coffee 100.0 130.2 133.8 124.0 138.2 140.0 143.0 145.0 148.0 207.6Cotton 100.0 167.6 183.7 167.5 181.1 186.5 202.7 216.2 232.4 326.0Sugar 100.0 130.1 397.3 452.0 301.4 232.9 191.7 191.7 205.0 287.5Bananas 100.0 106.6 110.2 118.3 136.2 136.0 144.1 152.9 163.2 228.9Cattle and Beef 100.0 127.2 138.0 147.2 159.2 175.2 195.2 216.0 248.8 349.0Manufactured Goods 100.0 117.1 131.6 146.7 161.1 174.8 188.8 203.0 217.2 304.6All Other Goods 100.0 117.0 131.6 146.7 161.1 174.8 188.8 203.0 217.2 304.6
Total Goods 100.0 125.0 137.9 148.1 155.2 162.5 172.4 183.8 197.2 284.7Non-factor Services 100.0 117.1 131.6 146.7 161.1 174.8 188.8 203.0 217.2 304.9Total Exports 100.0 123.5 137.0 148.0 156.1 164.3 174.4 186.4 199.8 287.1
C. Current u.S.$ millions
Gold, Emeralds, and Platinum 54.0 62.0 2.0 2.0 8.1 10,5 14.7 22.2 35.6 245.2Crude Petroleum 31.0 26.0 5.0 - - - - - - -Coffee 469.0 633.0 664.0 640.0 663.4 682.2 707.2 727.9 754.1 1,139.4Cotton 56.0 41.0 71.0 70.0 72.4 79.8 92.8 105.9 121.9 239.7Sugar 34.0 28.0 63.0 108.0 90.4 83.8 79.4 91.3 109.3 231.6Bananas 24.0 23.0 28.0 41.0 61.3 73.4 91.0 111.1 132.8 278.8Cattle and Beef 45.0 48.0 46.0 36.0 71.6 94.6 123.3 156.9 202.5 428.9Manufactured Goods 148.0 260.2 398.0 388.8 459.2 577.9 730.3 926.3 1,169.6 2,939.8All Other Goods 118.0 201.0 328.0 386.8 467.2 577.9 717.8 895.1 1,111.0 2,648.0
o/w Refined Petroleum Products (20.5) (27.2) (85.0) (69.4) (64.1) (74.4) (84.3) (94.1) (104.9) (184.0)
Total Goods 979.0 1.322.2 1,605.0 1,672.6 1,893.6 2,180.1 2,556.6 3,036.7 3,636.6 8,151.2Non-factor Services 228.0 287.2 265.3 275.4 338.7 393.2 454.4 522.7 598.4 1,177.1Total Exports 1,207.0 1,609.4 1,870.3 1,948.0 2,232.3 2,573.3 3,011.0 3,559.4 4,235.0 9,328.3
Source: IBRD

Table 3.25 - COLOMBIA: BALANCE OF PAYMENTS IMPORT PROJECTION
1972 1973 1974 1975 1976 1977 1978 1979 1980 1985
I. Imports f.o.b.
A. Constant (1972) US$ millions
Food 57.3 67.6 46.3 45.0 46.0 48.2 50.7 54.1 58.1 82.9Other Consumer Goods 48.6 46.4 32.5 29.0 30.0 31.3 32.8 34.8 37.2 51.4Crude Petroleum - - - 10.8 17.7 28.5 33.5 39.4 46.3 101.5Raw Materials and Intermediate Goods 404.1 405.0 577.1 555.0 565.0 620.1 688.6 769.2 862.1 146.3
olw Refined Petroleum Products (6.0) (2.3) (1.4) (3.9) (4.0) (4.4) (4.8) (5.4) (6.1) (10.2)Capital Goods 333.0 329.3 347.4 345.0 356.0 387.9 421.3 448.1 470.6 569.4
Total Goods 848.0 848.3 1,003.3 948.8 1,014.7 1,116.0 1,226.9 1,345.6 1,474.3 2,268.5Non-factor Services 388.0 374.4 395.1 400.0 414.0 434.8 458.3 483.9 511.0 671.9Total Imports 1,236.0 1,222.7 1,398.4 1,384.8 1,428.7 1,550.8 1,685.2 1,829.5 1,985.3 2,940.4
B. Price Indices
Food 100.0 145.0 233.0 250.0 224.0 210.0 206.0 209.0 222.0 318.7Other Consumer Goods 100.0 117.0 131.6 146.7 161.1 174.8 188.8 203.0 217.2 304.6Crude Petroleum 100.0 133.3 441.7 492.5 529.4 563.8 593.7 623.4 655.8 919.8Raw Materials and Intermediate Goods 100.0 116.9 130.9 144.3 158.5 172.0 185.9 200.0 214.0 304.6Capital Goods 100.0 113.4 129.5 144.7 161.3 175.0 189.0 203.2 217.4 300.3
Total Goods 100.0 117.8 135.6 160.4 169.6 185.4 199.7 214.5 305.5 331.5Non-factor Services 100.0 117.1 131.7 146.9 161.3 175.0 189.0 203.2 217.4 304.9Total Imports 100.0 117.6 134.5 152.3 167.2 182.5 196.8 211.5 226.9 325.5
C. Current US$ millions
Food 57.3 98.0 107.9 112.5 103.0 101.1 104.5 113.0 128.9 264.3Other Consumer Goods 48.6 54.3 42.8 42.6 48.3 54.7 62.0 70.6 80.7 156.6Crude Petroleum - - - 53.2 93.9 160.9 199.1 245.7 303.7 933.7Raw Materials and Intermediate Goods 403.1 470.9 753.4 795.2 889.1 1,059.1 1,271.5 1,527.3 1,832.2 4,456.7
o/w Refined Petroleum Products (6.0) (3.0) (6.0) (19.2) (21.2) (24.8) (28.5) (33.7) (40.0) (93.8)Capital Goods 333.1 373.4 449.9 499.1 565.4 668.5 784.1 896.6 1,007.4 1,709.7
Total Goods 848.1 999.6 1,360.0 1,521.8 1,720.9 2,069.1 2,449.7 2,886.9 3,392.9 7,521.1Non-factor Services 388.0 438.4 520.5 587.5 667.7 760.9 866.2 983.2 1,110.8 2,048.6Total Imports 1,236.1 1,438.0 1,880.5 2,109.3 2,388.6 2,830.0 3,315.9 3,870.1 4,503.7 9,569.7
Source: IBRD

Table 3.26 - COLOMBIA: SUMMARY BALANCE OF PAYMENTS PROJECTIONS(Current US$ Million)
1972 1973 1974 1975 1976 1977 1978 1979 1980 1985
Imports 1,236.1 1,438.0 1,880.5 2,109.3 2,388.6 2,830.0 3,315.9 3,870.1 4,503.7 9,569.7
Exports 1,207.0 1,609.4 1,870.3 1,948.0 2,232.3 2,573 3 3,011.0 3,559.4 4,235.0 9,328.3
Balance of Goods and NFS -29.1 171.4 -10.2 -161.3 -156.3 -256.7 -304.9 -310.7 -268.7 -241.4
Factor Services -197.0 -218.1 -194.5 -206.9 -241.5 -276.1 -323.0 -375.7 -428.4 -660.3Profits (-73.0) (-74.0) (-67.0) (-74.7) (-82.0) (-89.0) (-96.1) (-103.3) (-110.6) (-155.1)Other (-124.0) (-144.1) (-127.5) (-132.2) (-159.5) (-187.1) (-226.9) (-272.4) (-317.8) (-505.2)
Current Transfers 35.0 34.0 41.0 45.7 50.2 54.5 58.8 63.2 67.7 94.9
Current Account Balance -191.1 -12.7 -163.7 -322.5 -347.6 -478.3 -569.1 -623.2 -629.4 -806.8
Direct Foreign Investment 17.0 23.0 39.0 45.0 65.0 80.0 100.0 125.0 150.0 210.4
Official Capital Grants - - - - - - - - - -
Public M & LT Loans (Net) 260.0 274.3 238.9 277.5 329.2 472.0 550.3 590.7 585.2 824.1Disbursements (355.0) (404.5) (392.1) (426.3) (478.1) (668.6) (824.5) (966.7) (1,088.5) (1,729.9)Repayments (-95.0) (-130.2) (-153.2) (-148.8) (-148.9) (-196.6) (-274.2) (-376.0) (-503.3) (-905.8)
Other M & LT Loans (Net) 50.0 -29.0 -71.0 - - - - - - -
IMF Drawings 18.0 - - - - - - _ _ _
Other Short Term; Errors &Omissions 10.1 -11.6 -184.2 - - - - - - -
Change in Net Reserves(- Increase) -164.0 -244.0 -141.0 0.0 -46.6 -73.7 -81.2 -92.5 -105.8 -227.7
Total Net Reserves(End of Period) -12.0 232.0 91.0 91.0 137.6 211.3 292.5 385.0 490.8 718.5
Debt Service Ratio 12.6 13.0 13.5 13.5 13.0 14.3 16.3 18.1 19.5 15.8
External Public Debt Outstanding 1/ 1,657.8 1,938.0 2,177.1 2,454.6 2,783.7 3,255.3 3,805.4 4,296.4 4,981.7 8,176.5o/w IBRD 453.4 504.5 555.1 604.8 657.9 727.9 831.8 973.9 1,145.3 2,405.1
IDA 20.9 23.0 22.7 22.5 22.3 22.1 21.9 21.7 21.5 18.2
IBRD - IDA Debt Service as a %of Public Debt Service 31.6 29.1 25.9 27.9 27.0 22.4 18.1 15.2 13.9 18.1
Debt Service as a % of GDP 1.8 2.0 2.1 1.9 1.9 2.1 2.4 2.8 3.2 3.2
1/ Disbursed only.
Source: IBRD

Z*a ..le - C00 A AL N=0 33 D TUT DZ1A AS Ql DlkOB 31, 19thD1Watum s n Dli Q511CIC
(O Thosnds of U.S. dollar)
Debt outstanding December 31, 1974Croditort + Dndia-
T?e ofCr ,tor _ _ DlbursK Trb d Total
Azantit 701 - 701Austria 1727 1 1727Beahmu 63 - 63Belgium 710 720Brazil 733 2567 3300France 29216 - 29216Germn (Pederal Republic of) 5842 262 6104Italy 5955 - 5955Japan 15068 3500 18568Mexico 11200 - 11200Netherlands 3894 - 39LPanama 320 - 320Spain 21610 3300 24910Sweden 28462 3830 32292Switzerland L645 - 46k5United Kingdom 12219 - 12219USA 8179 - 8179Multiple Lenders 2836 4254 7090
Suppliers 153381 17713 171093
Bahamas 8813. - 8813Belgium 1860 - 1860France 19517 - 19517Italy 4355 - 4355Japan 25000 - 25000Luxembourg 303 907 2210
Netherlands 1178 - 1178Switzerland 2328 - 2328United Kingdom 41954 - 41954USA 84008 23867 107875Multiple Lenders 122000 6000 128000
Private Banks 311316 30774 342090
United Kingdom 195 - 195USa 9804 - 980kMultiple Lenders 18667 - 18667
Publicly Issued Bonds 28665 - 28665
Japan 25000 - 25000
Privately Placed Bonds 25000- 25000
USA 17123 - 17123
Nationalization 17123 - 17123
United Kingdom 78 - 78USA 18863 18863Multiple Lenders 79 - 79
Other Private Financial Inatitutions 19020 - 19020
IBRD 555086 291424 846510IDA 22722 - 227221DB 148644 128903 2775L7
Loans from International Organizations 726453 420326 1146779
Canada 17500 1629 19129Czechoslovakia 3978 - 3978Denmark 1867 - 1867France 204.18 - 20418Germany (Federal Republic of) 36207 11039 47246Ita2ly 4700 502 5202Japan 1761 - 1761Netherlands 4799 3461 8260
Poland ~~~~68 - 68Romania (Republic of) 128 - 128USA 8041h8 96595 9007k3Multiple Lenders 593 - 593
Loans from Governments 896164 113226 1009390
TOTAL EXTRNAL PUBLIC DEBT 2177122 582039 2759161
NOTE: Debt with a maturity of over one yearj items may not add up due to rounding.
SOURCE: IBRD External Debt Division, Economic Analysis and Projections Department.

Table L.2 COLOMBIA: EXTERNAL PUBLIC DEBT 03/07/75
TRANSACTIONS FOR 1965-74 AND
PROJECTED PIPELINE 1975-94 PAGE 1
DEBT REPAYABLE IN FOREIGN CURRENCY
IN THOUSANDS OF U.S. DOLLARS
TOTAL
DEBT OUTSTANDING TRANSACt1ONS DURING PERIODBEGINNING OF PERIOD CANCEL-
LATIONS,DISBURSED INCLUDING -COMITO DISBURSE- SERVICE PAYMENTS ADJUST-
YEAR ONLY UNDISBURSED MENTS NENTS PRINCIPAL INTEREST TOTAL NENTS(1) (2) (3) C4) Cs) 46) C?) CS)
1965 566,742 889.333 194,085 156.408 79#543 22,524 102.067 010.7861966 643,318 993.089 1274T40 156,589 86.354 23.426 109.780 -308891967 713P276 1.030.586 247.643 176,207 74,9D6 250992 100.898 1114331968 813.677 1,191,890 279.444 219*015 730785 29.716 103P501 *44.6261969 959,071 1.352.923 305,634 199,942 67,565 35,437 103002 *6.7701970 1,090,233 1.584.222 357.885 235,785 75,118 43.690 118.808 '10.5301971 1.251.554 1.856p459 377.231 226.564 92.091 51.923 144.014 -18.2961972 1.391.793 2.123.303 351.162 355.331 94,724 57.925 152.649 *1.3491973 1.657.820 2,378,392 502.301 404.574 130.287 78P461 208.748 28.6441974 1.937.996 2.721.762 190.548 392,275 153,149 99,739 252.888 -
1975 2.177.122 2.759.161 193.462 148.739 1130731 262.4711976 2,221.845 2.610.422 * 130,974 14e.938 117.389 266.3281977 2.203.881 2.461.4a3 93.870 147.865 116.888 264.753 -1978 2.149.886 2#313.618 - 67,529 166.685 113.785 280.4691979 20O50.731 2.146.934 - 47.654 157,233 10?,951 265.1841980 1.941.151 1.989.700 - 22.949 148*356 100.212 248.5681981 1,815.744 1.841.344 . 12.?16 1430511 91,877 235.3881982 1.684,473 1.697.357 - 9.680 136.959 82,969 219.9281983 1.557.193 1.560.398 * 2,830 135.284 74.460 209.7441984 1.424.739 1.425.114 375 114.495 650783 180.278 -1985 1.310,619 1.310.619 * - 104.197 59.454 163.6521986 1.206.422 1.206.422 - 99.860 53.693 153.5531987 1.106.562 1*106,562 - - 97.511 48#128 145.639 -1988 1.009.051 1.009.051 9- 88869 42.798 131.6671989 920.182 920.182 75- 7635 37*957 113P5911990 844.547 844.547 7 - 73.369 33*950 107.318 -1991 771,179 771.179 - 67.750 30.177 97s9261992 703.429 703.429 * - 65,603 26.784 92.3871993 637.826 637.826 * * 63.811 230539 87r350 -1994 574.015 5 14015 - 55.016 20*567 75.583
NOTE: Debt with a maturity of over one year; includes all loans listed on table 4A.1.

Table ).2 COL20I4BTA: EXTE;NH'IAL PUBLIC DERT 03/0/ 75
TKckpiSACTIMUi"S PFUR 1l;65-7L4 AIND
PROJECTED PIPELINE 1975-94 PAGE 2DEBT REPAYABLE IN FOREIGN CURRENCY
IN THOUSANDS OF U.S. DOLLARS
SUPPLIERS
DEBT OUTSTANDING TRANSACTIONS DURING PERIODBEGINNING OF PERIOD CANCEL*
LATIONSoDISBURSED INCLUDING COMMITO DISBURSEo SERVICE PAYMENTS ADJUST&
YEAR ONLY UNDISBURSED MENTS MENTS PRINCIPAL INTEREST TOTAL MENTS(1) (2) C3) (4) Cs) (6) C?) (8)
1965 34P813 74*459 46*509 16#680 8.468 1.087 9,555 "1491966 43*016 112,351 19#628 34#053 14*024 1J889 15#913 "611967 63*039 117,894 33#824 15,410 15#432 1J831 17*263 "9J8571968 63*020 126,429 33*596 22*094 14*437 2*296 16,733 "31*5591969 70J642 114*029 21J3474 ' 38*141 14*650 2*805 17P455 '6221970 93#177 120,104 116P869 28,409 24*995 4p726 29#721 '7201971 95#695 211,258 34.499 48,282 29o784 'i339 34j123 *4941972 114,253 215,479 31#602 45,819 41*277 5J044 46*321 1*1801973 122P50o 206P984 33*338 54*337 37#487 6J097 43j584 "7,2961974 137*171 195s539 23.781 64*437 48,227 9#672 57#899
1975 153*381 171.09.' 13,304 29*390 1O*236 39*6271976 137,295 141#703 3*256 27,763 9,315 37*0781977 112*188 113P940 " 786 4h6#925 7j564 34*4891978 66*648 87,015 - 367 24*723 5*750 30*473 -
1979 62*292 62*292 - " 20.359 4#073 24J4311980 41,933 41,933 - " 13,753 2*703 16,4561981 28*180 28,180 - - 10*026 1*823 11*8491982 18,154 18,o154 - ' 7*028 1*151 8J1791983 11,126 11,126 ' ' 5,078 688 5*7661984 6.048 6,048 - " 2,807 354 3 1611985 3,241 3,241 " ' 2*021 179 2*200 -
1986 1,220 1,;220 ' ' 672 60 9331987 347 317 ' " 347 18 366

Table lt.2 COL(MBIA: EXTERNAL PITI3LIC DEBT 03/07/7S
TRANSACTIONS FOR 1965-74 AlID
PROJECTED I:IPELIHE 1975-94 PAGE 3
DEBT REPAYABLE IN FOREIGN CURRENCY
IN THOUSANDS OF U.S. DOLLARS
PRIVATE BANKS
DEBT OUTSTANDING TRANSACTIONS DURINO PERIODBEGINNING OF PERIOD CANCEL
LATIONSDISBURSED INCLUDING COMMIT' DISBURSES SERVICE PAYMENTS ADJUST&
YEAR ONLY UNDISBURSED MENTS MENTS PRINCIPAL INTEREST TOTAL MENTS(1) (2) (3) (4) (S) (6) (7) (8)
1965 31.*275 57,335 58,532 53P771 24,030 2.916 26.946 161966 61,016 91.821 7.000 6.394 26#506 3.101 29P60? '1.927196? 40,905 70,388 10,650 16,035 18,391 1#972 20.363 '5201968 38,549 62.127 25,222 9.921 19.535 2,148 21.683 11969 28.937 67,815 l4#139y L 11.421 16.018 1.557 17.575 S4951970 24.340 65,441 18.112 11,789 10,505 1.250 11.755 11971 26.929 73,049 37,887 24.182 11,443 1.359 12.802 -14.7041972 38.537 84,789 84.193 113.544 6,376 1.635 8.011 1J6551973 146,451 164,261 185.201 95.029 27.310 68270 35S580 1J7131974 215,829 323,865 50,575 127.837 32,350 21.462 53.812
1975 311,316 342.090 12.969 33.855 28,578 62.4341976 290.430 308,235 ' 10,003 32,396 27.216 59.611197? 208036 275,839 -7803 29,944 25.626 55J5701978 245.895 245,895 - 43,585 23,740 67,3251979 202*310 202P310 45#813 19#334 65,16 1980 156,477 156.477 - 36.830 15.216 52.0481981 119.647 119.647 33.039 11.622 44.6611982 86.608 86J608 28.8??7 8312 37.1891983 57.731 57.731 ' ' 28.421 5.302 33.723 -
1984 29P309 29o309 - 10.500 2.718 13.*2181985 18.810 18.810 50952 1.817 7,7701986 12,857 12,857 - 4*286 1.282 5.5681987 8B571 8,571 4.286 816 5#1021988 4.286 4,286 - 4.266 350 4.635

T4z ",( ,)M RI a :EJyT;A! 1T,T IC M,--T 03/07/75
TIRKSACTI iTS KOR 1965-7)4 A;D
Pit JEGTElD )ItSELIiI6 1975-94 PAGE 4
DEBT REPAYABLE IN FOREIGN CURRENCY
IN THOUSANDS OF U&S. DOLLARS
PUBLICLY ISSUED BONDS
DEBT OUTSTANDING TRANSACTIONS DURING PERIODBEGINNING OF PERIOD CANCEL&
LATIONS,DISBURSEO INCLUDING COMMIT DISBURSE SERVICE PAYMENTS ADJUST
YEAR ONLY UNDISBURSED MENTS MENTS PRINCIPAL INTEREST TOTAL MENTS(1) (2) (3) (4) (s) (6) (7) (8)
1965 38,089 38,089 - 2,949 938 3887 0276
1966 34,864 34P864 - 2,925 841 3P766 b2751967 31,664 31J664 - 2,890 792 3#682 '5371968 28,237 28,237 13 13 ?,482 622 3,104 1961969 25,572 25,572 2,236 948 3*184 -2131970 23,123 23,123 2,5C7 702 3,209 -1971 20*616 20o616 -4,432 4,354 8,786 141972 16,198 16,198 - - 100 580 680 1-2471973 14o851 14,851 20#000 20,OOO 705 154 859 1#9831974 32,163 32J163 U - 3,498 1F991 5#489
1975 28,665 28,665 - 2,741 1J828 4J569 -
1970 25P925 25#925 U 2,736 1,676 4#413 U
1977 23,189 23,189 2,P740 1,524 4,2641978 20,448 20,448 * * 7,110 1,354 8#464 U
1979 13o338 13,338 * - 1333 1#l00 2#433 -
1980 12,005 12P005 ' ' 1*333 990 2'323 U
1981 10,672 10s672 U 1,333 880 2'213 U
1982 9,336 9,338 - - 1,333 770 2103 31983 8,005 8,005 ' - 1,333 660 1*993 U
1984 6,672 6J672 - U is333 550 1P8831i95 ),3j0 S,jO - U 1,333 440 1,773 -1986 4,005 4,005 U - 1'333 330 1'663 U
1987 2,672 2,672 - i,333 220 1'553 -198w 1,338 1#338 - - i,333 110 1*443 U
1989 5 5 U U ' ' U
1990 5 5 U U 5 ' 5 U

Table h.2 COLOMBIA: EXTERNAL PUBLIC DEBT 03907t1S
TRANSACTIONS FOR 1965-74 AND
PPOJECTED PIPELINE 19745-9PAGE 5
DEBT REPAYABLE IN FOREIGN CURRENCY
IN THOUSANDS OF U*S. DOLLARS
PRIVATELY PLACED BONDS
DEBT OUTSTANDING TRANSACTIONS DURING PERIODBEGINNING OF PERIOD CAOICEL6
,LAUGHNS,OISBURSED INCLUDING COMMIT DISSURSE SERVICE PAYMENTS ADJUsT'
YEAR ONLY UNDISBURSED MENTS NENTS PRINCIPAL INTEREST TOTAL MENTS(1) (2) (3) (4) (5) (6) (7) CS)
1973 a a 25#000 25.000 0
1974 25.000 25,000 - a 2#125 2.125
1975 25,000 25.000 - 2*125 2.1251976 25.000 25,000 - P2125 2,1251977 25,000 25,00O ' - ' 2.125 2#1251978 25,000 25,000 ' 2#381 2,074 4.455199i9 22619 2#381 1.872 4*253 a1980 20,238 20,238 ' ' 2.381 1,670 4.0511981 17857 17T.57 U _ 2,3381 1.467 3.8461982 15.476 15,476 - 0 2,381 1,265 3.6461983 13,095 13,095 - 2,381 557 209381984 10,114 10.714 0 21,381 2.381 a1985 8.333 8,333 - - 2,381 2#3811986 5.952 5.952 ' 2,381 ' 2.3611987 3P571 3,571 2.,381 2.3611988 1,190 1.-190 1.190 1.190

Table ih. 2 COLOMHIA: EXTFRNAL PUJBLIC DEBT
TRANSACTIOlTS FOR 1965-74 AND
PROJECTED PIPELINE 1975-9)4
PAGE 6DEBT REPAYABLE IN FOREIGN CURRENCY
IN ThOUSANDS OF U.S. DOLLARS
NATIONALIZATION
DEBT OUTSTANDING TRANSACTIONS DURING PERIODBEGINNING OF PERIOD CANCEL
LATIONS*DISBURSED INCLUDING COMMIT' DISBURSE- SERVICE PAYMENTS ADJUST
YEAR ONLY UNDISBURSED MENTS MENTS PRINCIPAL INTEREST TOTAL MENYS(1) (2) (3) (4) (5) (6) (C) (B)
1965 1 8892 16i892 '- 2,453 to 2P4631966 16,439 16#439 54 54 2,618 28 2.6461967 13,875 13.875 - 2.514 13 205271966 11.362 11.362 15.889 15.889 1i494 872 2.6661969 25,457 25,457 m 1,248 1.690 2.9361970 24,209 24.209 a 1.322 1.606 2,#9281971 22.*886 22.886 a a 1.349 771 2.1201972 21,537 21,537 a a io374 704 2.078 1973 20s. 163 20.163 I A 470 1.248 2.7181974 18P693 18.693 a 1,570 1*209 2.779
1975 17.123 171i23 - 1.678 1.156 2#834 a1976 15.445 15.445 - 1,792 1.043 2.835 ,1977 13,653 13.653 a 1-920 922 2.8421978 il,733 11.733 a - 2,030 792 2#822 a1979 9,703 9.703 a 2.180 655 2.835 al1v50 7,52:3 (.523 a 2.330 508 2.838 a1981 5,193 5.193 2,510 351 2#8611982 2.683 2.683 -3 2#683 181 2.864 a

Table 1b.2 COLOMBIA: EXTERNAL PUBLIC DEBT
03/07/?5TRANSACTIONS FOR 1965-74 AND
PRr)JECTED PIPELINE 1975-94
PAGE 7DEBT REPAYABLE IN FOREIGN CURRENCY
IN ThOUSANDS OF U.S. DOLLARS
OTHER PRIVATE FINANCIAL INST.ODET OUTSTANDING TRANSACTIONS DURIhG PERIODBEGINNING OF PERIOD
CANCELLATIONSo
DISBURSED INCLUDING COMMIT" DISBURSE SERVICE PAYMENTS ADJUSTYEAR ONLY UNDISBURSED MENTS MENTS PRINCIPAL INTEREST TOTAL MENTS
(1) (2) (3) (4) (C) (6) (T) CS)1965 1T725 7,462 644 1,209 745 139 884 m11966 2,189 7,360 8#176 1.299 1J055 288 1.343 M
1967 2P432 14,480 26.009 9,026 ,S555 143 1,6981968 9,903 38.934 - 12,869 1,613 220 1.8331969 21#159 37,321 - 704 2,716 572 3,288 811970 19J146 34,604 914 250 2,467 644 3 111
a
1971 16,929 33,051 0 500 2,044 1,063 3,107 i-TP2831912 15.384 23,724 7,000 15,340 1.680 1#221 2,901
U
1973 29,044 29,044 89 - 8,283 1J30) 9*584 -
1974 20,761 20,850 - 89 1.830 1#207 3,038
a1975 19.020 1 9, 020
I - 1 763 1.091 2,8541976 17,257 17,257
1 ',667 985 2,6521977 15.590 15,590 - * 1.651 887 2,537
a
1978 13J939 13#939 - - 1,640 789 2,o428 U
1919 12J299 12,299 a - 1,629 693 2,321
a
19ou 10,671 10#671 a - 1.629 596 2,226
a
1981 9,042 9,042 a a 1,629 502 2,131
a
1982 7,414 7p4i4 - 1,629 407 2#035 U
1903 5,785 5#785 - a 1.36T 311 1.678
1984 4.419 4.419 1 - j105 240 1J344
t
1985 2 .314 3.314 ' a 1,105 176 1.2811986 2*209 2#209
a 1.105 112 1.2171987 1,105 1.105 a ' 1.105 4 8 1153

Tabl'e L 2 C I ,TC IA: EXTERNAL PUBLIC DEBT
03/07/75TRANSACTIONS FOR 1965-7)i AND
PROJECTED PIPELINE 1975-94
PAGE 8DEBT REPAYABLE IN FOREIGN CURRENCY
IN THOUSANDS OF U.S. DOLLARS
LOANS FROM INTL. ORGANIZATIONSIBRD
DEBT OUTSTANDING TRANSACTIONS DURING PERIODBEGINNING OF PERIOD CANCEL&
LATIONSNDISBURSED INCLUDING COMMIT& DISBURSE- SERVICE PAYMENTS ADJUSTu
YEAR ONLY UNOISBURSED MENTS MENTS PRINCIPAL INTEREST TOTAL NENTScl) (2) (3) (4) (C) (6) (?) (a)
1965 198.015 322P467 29P279 6177 9#942 16.119 I1966 221,177 316P289 41p7O0 31,042 100181 10os39 20,920 41967 242P841 347,812 25,000 32,793 11,385 13,434 24,819 .I1968 264,245 361,426 105,600 39#873 14,259 14.860 29.119 '1521969 289,858 452P615 60.300 38,791 15,559 16,764 32t323 '3#0001970 313.090 494,356 109,300 57.834 16,860 19,869 36,729 08.8751971 354,064 577,921 153,100 54.685 17,999 23.464 41.463 '62?1972 390,750 712,395 74.100 82,839 20,141 27,448 47,589 '3.6631973 453,448 762,691 162,200 75,898 24,807 35,973 60,T80 03100671974 504,539 869,017 8,000 81,054 30,507 35,037 65.544
1975 555,086 846,510 - 82,640 35,792 317469 73P2611976 601,934 810,718 - 71,450 37,326 40*722 78,0481977 636,058 773,392 53#064 37.586 43,088 80,6741978 651,536 735,806 40,132 38o456 44,129 82,5851979 653,212 697,350 - 27.649 38,726 44*169 82.8951980 642,135 658624 12,525 40,144 43,161 83,3051981 614,516 618.480 3.Ob8 41,566 41,301 62,867 -1982 576,038 576P914 - 876 44,284 368755 83,039 -1983 532,630 532,630 * 45,119 35,895 81.0141984 487,511 487,511 * - 45,892 32,%945 78.837 =
1985 441,619 441,619 41,692 29,0982 71,674 -1986 399,927 399,927 - 40,575 270199 67,774 -1987 359,352 359,352 - - 38,862 24,459 63,321 -
1988 320U490 32cv49= - 35,427 21,878 57.s305 -1989 285,063 285JO63 - - 29,390 19.506 48o896 -1990 255,673 255,673 - 31,475 17.415 48,890 -1991 224,198 224,198 . 25,635 15.306 40,941 -1992 198,563 198,563 - 25,840 13,532 39#3721993 172,723 172,723 - 2S5635 11,746 37*383 81994 147,088 141,088 - . 24.355 9,988 34,343 a

N'Tfj isI (lA: EXTERATAI I GIPT
03/07/75TNAT'SACTJIUTS FfR 1965-74 AND
PROJEC TED PIELINE 1975-9i4PAGE 9
DEBT REPAYABLE IN FOREIGN CURRENCY
iN THOuSANDS OF U.S. DOLLARS
LOANS FROM INTL. ORGANIZATIONSIDA
DEBT OUTSTANDING TRANSACTIONS DURING PERIODBEGINNING OF PERIOD CANCEL&
LATIONS,DISBURSED INCLUDING COMMIT DISBURSEN SERVICE PAYMENTS ADJUST-
YEAR ONLY UNDISBURSED MENTS MENTS PRINCIPAL INTEREST TOTAL MENTS(1) (2) (3) (4) (5) (6) (7) (8)
1965 8,351 19,500 - 2,329 69 691966 10,680 19,500 . 2*553 - 86 86 a1967 13,233 19,500 - 4o818 - 117 1171968 18,051 19,50 1D401 139 1391969 19,452 19,500 - 48 . 146 1461970 19, 500 19, 500 - - - 146 146 a1971 19,500 19,500 - - 98 146 244 -1972 19,402 19,402 - 162 239 421 1,6631973 20,883 20,883 * , 245 250 495 2,3191974 22,957 22J957 . 235 172 407
1975 22,722 22,722 a - 235 170 4051976 22,487 22,487 - - 235 168 403 -1977 22,253 22,253 ' 235 166 4011978 22,018 22#018 - - 235 165 400 -1979 21,783 21,783 - * 235 163 398 -1980 21,548 21,548 - - 235 161 396 a1981 21,313 210313 - 470 159 629 a1982 20,844 20,844 a a 704 155 859 -1983 20,139 2U,139 a 704 150 854 -1984 19,435 19,435 - 7U4 144 849 a1985 18,730 18,730 - 704 139 844 -1986 18,026 18,026 a - 704 134 838 -1987 17,322 17,322 704 129 833 a19v8 16,617 16.617 ' 704 123 e2a -1989 15,913 15,913 ' 704 116 822 a1990 15,208 15,208 ' - 704 113 B171991 14,504 14,504 ' 704 lot 8121992 13,799 13,799 704 102 807 -1993 13,095 13,095 - 704 97 801 a1994 12J391 12,391 - 704 92 796

aJ- .I ,'viIA: Vil2AL 1'L36I2 DEBT' 03/0T/75
TRA,VSACTl,'DTS FC>R 1965-7L1 ANTD
FRr'.JECTED PIPELIlE 1975-9L PAGE 10
DEBT REPAYABLE IN FOREIGN CURRENCY
IN THOUSANDS OF U.S. DOLLARS
LOANS FROM INTL. ORGANIZATIONSIDO
DEBT OUTSTANDING TRANSACTIONS DURING PERIODBEGINNING OF PERIOD CANCEL
LATIONS.DISBURSED INCLUDING COMMIT DISBURSE- SERVICE PAYMENTS ADJUST
YEAR ONLY UNOISBURSED MENTS MENTS PRINCIPAL INTEREST TOTAL MENTS(1) (2) (3) (4) (5) (6) (7) (6)
1965 14,367 33.680 21,40' 5,275 175 1,221 1,396 2971966 19,467 54,608 8,100 10.051 1,090 1.605 2.695 5541967 28o429 61,064 16,900 12P562 2,049 2,199 40248 4661968 38,581 75.449 400 13*101 3,333 2J739 6,0721969 48,349 72,516 55.621 12P421 3,920 3.122 7,042 -3?197o 56,851 124,180 15#878 5,145 4,502 9,647 X1971 67,585 119,034 41,475 12.053 7,730 5,645 13,375 6.3241972 78,232 159,103 40,600 14*911 7,683 6,549 14.232 11973 65,460 192,021 29.100 24#804 B,232 8,293 16.525 7,6351974 102,687 220.524 64.500 53,434 7,477 9,372 16P848
1975 148,644 277,547 58.419 11,681 12.091 23,7721976 195,383 265,866 27.607 11,129 15.007 26.1361977 211,861 254,738 18#105 14,940 15,961 30,9011978 215,027 239,798 14.839 14,457 16.073 30.5301979 215,409 225,341 * 9,375 13,610 15,867 29*47? -1980 211,174 211,731 557 15,873 15,294 31,1671981 195,858 195,858 15,813 14,092 29,9061982 10.045 180,045 * 15,518 12,882 28,400 -1983 164,527 164,527 15,411 11*695 27.1051984 149,116 149,116 S- 15530 10,499 26,0291985 133.586 133,586 . 15,550 9,283 24.8331986 118.036 118,036 15275 8,093 23.3681987 102,761 102.761 15s595 60896 22*4911988 8,1600 81.166 15,803 5.673 21#4761989 71,363 71,363 16,022 40438 20,461199o 55,340 55,340 12232 3.271 15.5031991 43,109 43,109 - 12,437 2,344 14.7811992 30.672 30,672 10,172 1,461 11,633 -1993 20.500 20,500 - 8,902 736 9.6371994 11.599 11,599 a - 1J649 245 1.895 -

Table 4.2 COLDIOBIA: EXTERNAL PUBLIC DEBT
TRANSACTIONS FOR 1965-74 AND
PROJECTED PIPELINE 1975-94
DE8T REPAYABLE IN FOREIoN CURRENCY
IN THOUSANDS OF U&So DOLLARS
LOANS FRON INTL. ORGANIZATIONS
DOBT OUTSTANDING TRANSACTIONS DURING PERIODBEGINNING OF PERIOD CANCEL
LATIONS.DISBURSED INCLUDING COMMIT' DISBURSE- SERVICE PAYMENTS ADJUST
YEAR ONLY UNDIS8URSEO MENTS MiNTS PRINCIPAL INTEREST TOTAL NENTS(C) (2) (3) (4) Cs) (6) C?) (a)
1965 220,793 375p647 21,400 36b883 6,352 11J232 17,564 -2961966 251,324 390,397 49.800 440446 11,271 12,430 23.701 -5501967 284P503 428,376 41*900 50s173 13,434 15,750 29.184 -4671968 320,877 456,375 106.000 54p375 17,592 1t7738 35,330 -1521969 357,659 544,631 115#921-iR - 51,260 19,479 20P032 39,511 -3#0371970 389,441 638,036 109.300 730712 22,005 24,517 46*522 8e,8761971 441,149 716.455 194,575 66,738 25,827 29,255 55.082 5,6971972 488,384 890,900 114,700 97*750 28,006 34,236 62J242 &19991973 559,791 975,595 191,300 100,702 33,284 44,516 77,800 -21.1131974 630,183 1.112.498 72.500 134.488 38,219 44,580 82,799 -
1975 726,453 1,146,779 - 141O059 47,708 49,130 97.4301976 819,804 1.099,072 99,057 48,690 55,898 104,588 -1977 870,172 1#050,382 71,169 52,760 59,215 111.9761978 8bd,581 997,622 ' 54,971 53,I47 60,366 113.5141979 890,404 944,474 37,o024 52,571 6o0199 112,7701980 874p857 891.903 13.082 56,252 56,616 114.668 0
1981 831,667 835N651 * 3,088 57,649 55*552 113.4011982 776,927 777,803 8 876 60,507 51,791 112.2981983 717P296 717,296 * - 61.234 47,740 10809741984 656,062 656.062 - 62,126 43,588 105,7141985 593,936 593,936 - - 57,947 39.404 97*351 -1986 535,989 535.989 ' 56,554 350426 91,980 -1987 479,435 479P435 - - 55,162 31,483 866645i9it 424.273 z4rZrJ - 5j35 2716I 79,609 -1989 372,338 372,338 - - 46,117 24,062 tO01791990 326,221 326,221 - 44,411 20,799 65.2101991 281,811 281,811 0 0 38,776 17,757 56,534?992 243,034 243,034 0 36,716 15,096 51.8121'93 206,318 206,318 0 . 35,241 12.560 47,8211994 171077 171.077 - - 26,709 10*325 37.034

Table 4.2 COIDMBIA: EXTERNAL PTJUBLIC DEBT03.40rOts
TRANSACTIONS FOR 1965-74r AND
PROJECTED PIPELINE 1975-94PAGE 12
DEBT REPAYABLE IN FOREIGN CURRENCY
IN THOUSANDS OF U.S. DOLLARS
LOANS FROM GOVERNMENTS
CANADA
DEST OUTSTANDING TRANSACTIONS DURING PERIODBEGINNING OF PERIOD CANCEL&
LATIONS,DISBURSED INCLUDING COMMIT- DISBUR5cE SERVICE PAYMENTS AD4JUtt
YEAR ONLY UNDISBURSED MENTS MENTS PRINCIPAL INTEREST TOTAL NENTS(1) (2) (3) (4) (5) (6) (7) t)
1967 744 234 -
1968 234 744 999 510 * 3 3 -
1969 744 1,743 15485 522 87 8 951970 1,179 17P141 - 3,004 87 119 206 1o1541971 4,341 18,208 - 3,5o3 B8 120 208 831972 7,789 18,203 ' 4,933 88 117 205 -
1973 12,634 18,15 1#030 4,543 88 111 199 1591974 17,225 19#216 - 362 87 249 336 -
1975 17,500 19P129 - 362 259 244 5031976 17,602 18,869 362 259 231 4901977 17,705 18,610 362 215 217 432 -1978 17J852 18,395 362 224 207 431 -
1979 17,990 1d,171 - 181 429 198 62?1980 17J742 17,742 - * 634 184 8171981 17,109 17,109 - 462 170 632 -
1982 16,646 16P646 - - 462 165 627 -
1983 16,184 16,184 - - 462 161 6231984 15,722 15P722 - 462 156 6181985 15,260 15,260 - 462 151 6141986 14,?98 14,798 462 147 6091987 14,336 14,336 462 142 604 -
198w 13,873 13,873 - ' 462 138 600 0
.946 3,h 4 § 3sM4 i ' - e 3 9 062 i~33 91990 12,949 12f949 4 - 462 128 5911991 12,487 1247 - 462 124 5861992 12,025 12,025 462 119 5811993 11I562 11562 - 462 114 577 0
1994 11,11 1,100 -oO 462 110 572

Table 4.2 COLOMBIA: EXTERNAL PUBLIC DEBT03/07/75
TRAi4SACTIONS FOR 1965-74 AIJD
PROJECTED PIPELINE 1975-94 P 3PAGE 13
DEST REPAYABLE IN fOREIGN CURRENCY
IN THOUSANDS OF U.S. DOLLARS
LOANS FROM GOVERNMENTSCZECHOSLOVAKIA
DEBT OUTSTANDING TRANSACTIONS DURING PERIODBEGINNING OF PERIOD CANCELO
LATIONSPDISBURSED INCLUDING COMMIT' OISBURSES SERVICE PAYMENTS ADJUST&YEAR ONLY UNDISBURSED MENTS MENTS PRINCIPAL INTEREST TOTAL MENTS(1) C2) (3) 4) (5) (6) CT) C()
1971 - a 6s0 OO .U1972 ' 6 000 ' 466 ' '1973 466 6D000 a - 33 14 47-1974 433 5,967 * 5534 i0989 162 2'151
1975 3,978 3,978 - 1J989 209 2#198 _1976 1,989 1,989 - a 1,989 90 2#079 -

Table 4.2 ,(X3CkiA: TERNAL PITrTIC DEBT 03/07/75
TRANSACTIONTS FOR 1965-7 ANID
PROJECTED PIPELINE 1975-94 PAGE 14
DEBT REPAYABLE IN FOREIGN CURRENCY
IN THOUSANDS OF U.S. DOLLARS
LOANS FROM GOVERNMENTSDENMARK
DEBT OUTSTANDING TRANSACTIONS DURING PERIODBEGINNING OF PERIOD CANCELS
DISBURSED INCLUDING COMMIT' DISBURSE& SERVICE PAYMENTS ADJUSTYEAR ONLY UNDISOURSED MENTS MENTS PRINCIPAL INTEREST TOTAL MENTS
(1) (2) (3) (4) (5) (6) (7) (0)
1968 ' 1J867 * * * -
1969 1J,867 * * * * *1970 1,867 ' '1971 1,011 1,867 * 3211972 1,331 1,867 U 63 '1973 1,394 1,867 4 *1974 1,394 1,867 * 473 '
1975 1J867 1,867 * 107 ' 107 -1976 1,760 1,160 - 107 * 1071977 1,654 1,654 * U 107 * 1071978 1,547 1,547 - a 107 ' 1071979 1 ,440 1,440 U U 107 - 1071980 1,334 1,334 - ' 107 * 1071981 1J227 1,227 * * 107 U 1071982 1,120 1,120 107 1071983 1,014 1,014 ' U 107 ' 1071984 907 907 * 107 a 1071985 800 800 - - 107 - 1071989 693 693 U U 107 * 1071987 5817 587 . 107 ' 1071986 480 480 -107 Uor 107 1989 373 373 '107 U 1071990 267 267 ' U 107 ' 1071991 160 160 U U 107 ' 1071992 53 53 U a 53 ' 53

Table 4. 2 COLOI.,1lA: EXTERITAL PU13BLIC DEBT031OS/75
TRANSACTIONS FOR 1965-7L AND
PRO'-JECTED PIPELINE 1975-94PAGE 15
DEBT REPAYABLE IN FOREIGN CURRENCY
IN THOUSANDS OF U.S. DOLLARS
LOANS FROM GOVERNMENTSFRANCE
DEBT OUTSTANDING TRANSACTIONS DURING PERIODBEGINNING OF PERIOD CANCEL-
LATIONSPDISBURSED INCLUDING CUMMIT' DISBURSE SERVICE PAYMENTS ADJUSTO
YEAR ONLY UNOISBURSED MENTS MENTS PRINCIPAL INTEREST TOTAL MENTS(1) (2) (3) (4) (5) (6) (7) (8)
1968 - 2O019 -'
1969 2,019 - - - ' '1970 ' 2,019 - 59 197 19?1971 397 1,822 1S823 1,117 29 19 48 1121972 1J485 3#728 1*800 144 55 199 1951973 3,*336 31779 - 210 - 129 129 4061974 3,905 4,185 17'143 17'423 910 550 1'461
1975 20,418 20,418 ' - 1p889 1'109 2'9991976 18'528 18,528 I889 999 2#888 a
1977 16,639 16,639 ' i'889 888 2J7781978 14,750 14jf750 - - .1889 77B 2J6671979 12,861 12,861 ' 1i889 668 2P5571980 10F972 LU0972 -1889 557 2J4461981 9,082 9jO82 a - 1,869 447 2J336 a1982 7,193 7e193 a ' 1*889 336 2J226 a1983 5,304 5,304 a - 1,889 226 2J11519I4 3J415 3,415 a a134 117 12511985 2P281 2,281 f _ 580 76 6561986 1,701 1*?01 - - 580 56 636 a
1987 1,120 1,120 ' - 580 35 616 a1988 540 540 425 15 4401989 115 115 ' - 115 2 117 I

TI'able 1:.2 (7h77l0l4rIlA: EXTDR1TAL PFJ.-tLC DEBT03/0?/75
TRLTTSA(CTI.TI'I3 FOR 1965)'-7M AlD
PRI,JECTED PIPEIIIE 1975-9)
PAGE 16DEST REPAYABLE IN FOREIGN CURRENCY
IN THOUSANDS OF U.S. DOLLARS
LOANS FROM GOVERNMENTSGERMANY (FELDREP*oF)
DEBT OUTSTANDING TRANSACTIONS DURING PERIODBEGINNING OF PERIOD CANCEL.
LATIONS.DISBURSED INCLUDING CUMMIT' DISBURSE SERVICE PAYMENTS ADJUSTf
YEAR ONLY UNDISOURSED mENTS MENTS PRINCIPAL INTEREST TOTAL t4ENTS(1) (2) (3) (4) (s) (6 (7) (5)
196c o.000 a - a1967 - 6,000 1.019 * 11 111968 1.019 6.000 - 2.059 86 99 1851969 2P992 5,914 6P886 3.240 63 229 292 901970 6#259 12,827 14.261 2.452 356 430 786 1541971 c,355 20,886 6p472 6.485 648 556 1.204 2.0001972 14,614 34#710 5P297 16#471 1.337 849 2#186 4001973 30,081 39,070 5p301 3,134 2,070 1.181 3.251 4,8561974 35.500 47.157 2,924 3,543 2J,35 2.132 40967
1975 36,207 47,246 2.734 2,926 2P114 50040 a1976 36,015 44,320 3.025 2,926 2.017 4,9431977 36,113 41o394 1734 2,435 1.936 4,3711978 35,411 38.958 - 946 2,806 1,846 4,6521979 33,551 36,152 621 2,968 1*682 4,6501980 31,204 33,184 589 3,655 1,502 5.1581981 28,137 29,528 . 557 3.081 1#287 4,366 -1982 25P613 26,447 5S7 2.593 1,127 3,7201983 23,S76 23,854 . 278 2,669 997 3.6661984 21,186 21,186 a 2,801 85s 3,659 -1985 18,385 18,385 - 2,801 716 3.5171986 15,584 15.584 - 2,801 573 3,3741987 12,783 12o,783 ' 2.639 430 3,0681O 9 lo^l h L s . 4 : 1, .6 2 6 2 322 * 81989 9.082 9.082 - io022 279 1.301 -1990 8,060 8.060 630 239 1.0691991 7,230 7.230 830 208 1.038 -1992 6,401 6.401 0 775 176 9541993 5.625 5#625 - 775 150 926 -1994 4,850 4#850 - 775 122 898 -

Table 4.2 (YOIWMBIA: EXTERNAL PUJ3LIC DEBT 03/07/75
TRANSACTIONS FOR i965-7b AIX
PR_JECTED PIPELINE 1975-94PAGE 17
DEBT REPAYABLE IN FOREIGN CURRENCY
IW 4OS.uSANDS OF U.S. DOLLARS
LOANS FROM GOVERNMENTSITALY
DEBT OUTSTANDING TRANSACTIONS DURING PERIODBEGINNING OF PERIOD CANCEL'
LATIONStDISBURSED INCLUDING COMMIT' DISBURSE- SERVICE PAYMENTS ADJUST&
YEAR ONLY UNDISBURSED MENTS MENTS PRINCIPAL INTEREST TOTAL MENTS(1) (2) (3) (4) (s) (8) (7) (8)
1967 - 2,016 - - - -
1968 - 2,016 4#500 2,016 202 84 2861969 1,814 6,314 2.742 2.215 201 450 651 -197u 3J828 8,055 1J000 2,246 202 351 553 11971 5,872 9J654 28 10123 480 418 898 A11972 6#514 9,201 - 13 ?16 436 1.1521973 5,811 8P485 281 798 386 1.186 '10?201974 5,364 5#967 101 765 314 1.078
1975 4,700 5202 101 765 264 1.0281976 4,036 4.438 - 101 765 214 9791977 3.372 3.673 101 765 164 9291978 2,708 2,909 - 101 548 115 6621979 2.261 2,361 0lo 548 03 6301980 1J814 1#814 - - 572 51 6231981 1.241 1J241 * 291 22 312 a
1982 951 951 - - 25 9 34 a
1983 926 926 - - 25 9 34 a1984 901 901 - - 25 9 34 a
1985 877 877 - * 25 9 331986 852 852 - * 25 33 1987 827 827 - - 25 8 33 a
1988 802 802 - 25 8 331989 778 776 - * 25 8 321990 753 753 - 25 7 321991 728 728 - 25 7 32 0
1992 704 704 25 7 32 0
1993 679 679 a * 25 7 31 a
1994 654 654 - - 25 6 31

Table 11.2 COIf)MBIA: EXTERNAL PUBLIC DEBT 03O/io7s
TRANSACTIONS FOR 1965-74 AND
PROJECTED PIPELITE 1975-94 PAGE 18
DEBT REPAYABLE IN FOREIGN CURRENCY
IN THOUSANDS OF U.S. DOLLARS
LOANS FROM GOVERNMENTSJAPAN
OEBT OUTSTANDING TRANSACTIONS DURING PERIODBEGINNING OF PERIOD LATIONS.
DISBURSED INCLUDING COMMIT DISBURSEs SERVICE PAYMENTS ADJUST6YEAR ONLY UND13BURSED MENTS MENTS PRINCIPAL INTEREST TOTAL P4ENTS
(1) C2) (3) (4) (S) (6) (7) (8)
1969 3.906 '1970 ' 3,906 ' 20098 16 17 33 03261971 2,082 3J562 ' 422 164 114 278 -11972 2,339 3,397 110 248 170 418 '9481973 2*201 2,201 328 182 510 163t974 2,036 2,036 ' 275 133 408
1915 1,761 1.761 0 275 114 3891976 1.486 1,486 0 275 96 3711977 1,211 1.211 ' 275 77 352r97B 936 936 ' 275 59 334
1979 661 661 ' 275 40 315 -1980 386 386 275 21 2961981 111 111 74 6 801982 37 37 ' 37 1 38

Table 4.2 COI0&BIA: EXTERNAL PUBLIC DEBT
TRANSACTIONS FOR 1965-74 AND
PROJECTED PIPELINE 1975-94PAME 19_DEST REPAYABLL IN FOREIoN CURRENCY
IN THOUSANDS OF U*s DOLLARS
LOANS FROM GOVERNMENTSNETHERLANDS
DEBT OUTSTANDING TRANSACTIONS DURING PERIODBEGINNING OF PERIOD CANCELS
LATIONS,DISBURSED INCLUDING COMMIT DISBURSEt SERVICE PAYMENTS ADJUSTYEAR ONLY UNDISBURSED bENTS WENTS PRINCIPAL INTERE5T TOTAL MENTS
(1) (2) (3) (4) (5) (6) (t) (a)1965 1,383 I,383 2O000 169 ' 98 981966 1*552 3,383 414 1,073 1i4 108 2921967 2,441 3,613 a 1,080 114 88 202 w11968 3,406 3,498 1'506 62 283 153 4361969 3,185 4,721 206 125 75 200 301970 3 266 4#566 - 437 138 92 230 11971 3,56c 4,429 1'526 155 167 86 253 1191972 3,553 5i907 - 1,656 255 110 365 421973 4,996 5,694 86 178 630 229 859 -3371974 4,815 4,815 3P955 494 510 293 803
1975 4,799 8,260 - 494 512 274 T861976 4,781 7,747 - 494 494 255 749197? 4*782 7w254 ' 494 475 238 7131978 4.801 6,779 494 503 222 7251979 4,792 6,275 - 494 449 204 6531980 4,837 5P826 - 494 357 189 5461981 4,975 5J469 494 357 180 5371982 5P112 5#112 ' 533 166 6991983 4,579 4,579 - 554 140 6941984 4,025 4,025 ' 316 114 4301985 3,s09 3,709 ' - 316 101 417 -1986 3,392 3P392 - 316 67 4031987 3,076 3,i76 ' - 176 76 252 a
'. 'r a Aa 2F900 2,S900 i76 7i L4_1989 2,725 2'725 * 176 67 2431990 2,549 2,549 - 176 63 2361991 2,373 2P373 * 176 58 2341992 2,197 2,197 - - 176 54 2301993 2,021 2,021 - a 176 49 225 -1994 1,846 1,846 - a 176 45 221

Table 14.2 COLOMBIA: EXTERNAL PUBLIC DEBT o Wi@1f?5
TRANSACTIONS FOR 1965-74 AND
PROJECTED PIPELINE 1975-94 PAGE 20
DEBT REPAYABLE IN FOREIGN CURRENCY
IN THOUSANDS Of U.S. DOLLARS
LOANS FROM GOVERNMENTSPOLAND
DEBT OUTSTANDING TRANSACTIONS DURING pERIOD CAKELOBEGINNING Of PERIOD ANCEL
LATZONSoDISBURSED INCLUDING COMMITs DISURSE SERVICE PAYMENTS AOJU5T
YEAR ONLY UNDISBURSED MENTS MENTS PRINCIPAL INTEREST lToAL MINTS(1) (2) (3) (4) C5) (6) -1 c4)
1974 a a 90 90 23 4 26
1975 68 68 45 51976 23 23 * 23 1 23

Table 4s.2 COLOMBIA: EXTERNAL PUBLIC DEBT
TRANSACTIONS FOR 1965-74 AND
PROJECTED PIPELINE 1975-94PAGE 21
DEBT REPAYABLE IN FOREIGN CURRENCY
IN THOUSANDS OF U*.S DOLLARS
LOANS FROM GOVERNMENtSROMANIA* REPUBLIC OF
DEBT OUTSTANDING TRANSACTIONS DURING PERIODBEGINNING OF PERIOD CANCEL
LATIONSPDISBURSED INCLUDING COMMITO DISBURSE* SERVICE PAYMENTS AOJUSt?
YEAR ONLY UNDISBURSED MENTS MENTS PRINCIPAL tNTEREST TOTAL MINTS(1) (2) (3) (4) Cs) (6) (?) CS)
1974 ' 170 170 43 6 4,
1975 126 128 85 7 92 -
1976 43 43 43 1 44

Table 4.2 COLOMBIA: EXTERAL PUBLIC DEBT
TRANSACTIONS FOR 1965-74 AND
PROJECTED PIPELINE 1975-94
PAGE 22DEBT REPAYABLE IN rOREIGN CURRENCY
ZN ;HcLSLNR nC S
LOANS FROM GOVERNMENTSUSA
DEBT OUTSTANDING TRANSACTIONS DURING PERIODBEGINNING OF PERIOD CANCEL-
LATIONS#DISBURSED INCLUDING COMMITO DISBURSE SERVICE PAYNENTS ADJUVS'
YEAR ONLY UNDISBURSED M4ENTS MENTS PRINCIPAL INTEREST TOTAL M£EUS(1) (2) (3) (4) (5) (6) CT) Cs)
1965 219,772 316PO66 65J.000 47,696 34.546 6,104 40,650 1010461966 232P918 336J474 36,668 69,270 27,771 4*741 32.512 1.p0751967 274.417 344J296 125.500 76,230 15,326 5#323 20,649 ,521968 335P320 454,418 b7.833 100,007 14.011 5J398 19.409 112'7201969 420,910 515,520 125.208 920233 10.742 7,071 17.813 2p4621970 5o2p265 627o524 97.429 109.783 10.321 9#236 19#557 1s9161971 601,726 712P716 94,421 73.736 15J636 9,469 25.105 b3.S381972 659J875 787,663 108.370 57,366 13.123 12,768 25.891 '6271973 704,101 8e2J283 40.954 101,160 17,801 14.641 320442 -3#4921974 787,524 901.944 18P620 36,445 19.821 13,595 33.416 w
1975 804.148 900J743 22j440 22,358 14,577 36.935 -
1976 804,229 878.385 - 14.677 24#929 15,214 40s1431977 793.978 853J456 - 11,422 25,763 15,505 41.2691978 779,637 827,693 - 10,289 25,718 15P693 41#4111979 764,209 801,975 - 9,233 24,283 17.152 41£4351980 749.158 777P692 - 8P784 26.359 17.406 43.T64 _1981 731,583 751i334 - 8.577 28,483 17,569 46.0521982 711,201 722P375 - 8,247 26,875 17,256 44.1611983 692J573 695p499 - 2.551 29.764 17*670 47.434 -
1984 665#360 665.735 - 375 29,399 17,078 46.477 -
1985 636p336 636.336 - - 29.167 16,386 45.5531986 607.169 607,169 - - 29038 15,612 44,o6501987 578.132 578,132 - 28#909 14.851 43.760 1988 549,223 549#223 ' - 27.868 14,110 41.978 -1989 521,354 521,354 - - 27.#611 13.406 41.017 -1990 493.744 493.744 - 27,354 12*712 40.066 -
1991 466,390 466,390 - 27,375 12.O22 39.396 -
1992 439,015 439.015 ' - 27,396 11,330 38.726 -1993 411.620 411.620 - 27.132 1O0630 37*770 -
1994 364.488 384p488 26J869 9,956 36,827

Table 4.2 COLOMBIA: EXTERNAL PUBLIC DEBT
0J/0rz7sTRANSACTIONS FOR 1965-74 AND
PROJECTED PIPELINE 1975-9PE
PAGE 23DEBT REPAYABLE IN FOREIGN CURRENCY
IN THOUSANDS OF U.S. DOLLARS
LOANS FROM GOVERNMENTSVENEZUELA
DEBT OUTSTANDING TRANSACTIONS DURING PERIODBEGINNING OF PERIOD CANCEL&
LATIDNSsDISBURSED INCLUDING COMMIT* DISBURSE SERVICE PAYMENTS ADJUST
YEAR ONLY UNDISBURSED MENTS MENTS PRINCIPAL INTEREST TOTAL MENTS(1) C2) (3) C4) (5) 46) (7) (C)
1967 ' l ?000 7000O s,250 69 5D3191968 1,750 1,750 1,750 83 1J8331969a
0

Tible 1L.2 .2( if]1I'IA: EXTERTNAL PUBLIC DEBT03/077r5
TRA.TNSACTvLDT̂iS FOR 1965-7L AUD
PROJECTED PIPELINE 1975-9LPAGE 24
DEBT REPAYABLE IN FOREIGN CURRENCY
IN THOUSANDS OF U.S. DOLLARS
LOANS FROM GOVERNMENTSMULTIPLE LENDERS
DEBT OUTSTANDING TRANSACTIONS DURING PERIODBEGINNING OF PERIOD CANCELS
LATIONSDDISBURSED INCLUDING COMMIT& DISBURSEC SERVICE PAYMENTS ADJUST-
YEAR ONLY UNDISBURSED MENTS MENTS PRINCIPAL INTEREST TOTAL MENTS
(1) (2) (3) (4) (s) (6) (7) (8)
1974 a a 790 790 198 55 253
1975 593 593 - - 395 69 464
1976 198 198 '198 14 211

Tjble. 4.2 COLOMBIA: EXTERNAL PUBLIC DEBT' 03/07/75
TRANISACTIrNS FOR 1965-74 AND
PROJECTED PIPELINE 1975-9k,PAGE 25
DEBT REPAYABLE IN FOREIGN CURRENCY
IN THOUSAND5 OF U.s. DOLLARS
LOANS FROM GOVERNMENTS
DEBT OUTSTANDING TRANSACTIONS DURING PERIODBEGINNING OF PERIOD CANCELL
LATIONS.DISBURSED INCLUDING COMMIT- DISBURSE" SERVICE PAYMENTS ADJUSTw
YEAR ONLY UNDISOURSED MENTS MENTS PRINCIPAL INTEREST TOTAL NENTSCl) C2) (3) (4) C5) (6) C?) CS)
1965 221,I55 317t449 67,000 47,865 34,546 6,202 40,748 *10,0461966 234,470 339,857 43,082 70,343 27,955 4,849 32C804 *1,075196? 276,858 353,909 135,260 85.563 20,690 5,491 26'181 -531968 341,729 468,426 98,724 104,654 16,332 5*820 22#152 12#7201969 429,645 538,098 154,227 980416 11,P218 7,833 19.051 *2,4021970 516.79? 678J705 112,690 121,625 11,317 10.245 21,562 '9341971 627,350 779,144 11O'270 86#862 17,212 10,782 27,994 ,15261972 697,500 87QO676 113i667 82#878 15,911 14,505 30#416 9381973 765c020 967,494 47?373 109P506 21,748 16#87b 38,623 351974 858,196 993,154 43,692 65,424 27*456 17,492 44,948 -
1975 896,164 1,0090390 26,130 31,605 18.986 50,5911976 890,690 977786 18,659 33,895 19,132 53,0261977 875,454 943P891 - 14#113 31,924 19,026 50,9511978 857,642 911,967 12#192 32,069 18,919 50,9881979 837,765 879,897 10C629 30C948 20C026 50,9731980 817,447 848,950 9,867 33,848 19,910 53,7581981 793,466 815,102 a 9,628 34,744 19,680 54,4251982 767,873 779,b81 - 8#804 32,521 19C091 51,6131983 744,155 747,360 2,830 35,470 19,203 54,6721984 7110515 711,890 375 34,244 18,332 52P5761985 677,647 677,647 33P458 17,438 50,8961986 644,189 644,189 a a 33,329 16,483 49,8121987 610J86O 610P860 6 U 32We97 15,543 48,4401988 577,963 577.963 - a 30.125 14,664 44,788 -i989 54?#839 5470439 ' ' 29,51' 3;891' 43C 4121990 518,321 518,321 - a 28,953 13,150 42,103 a1991 469,368 489,368 - - 28,973 12,419 41.392 a1992 460,395 460,395 - 288687 11,688 40*5751993 431,508 43i1508 ' 28,570 10,959 39c5291994 402,936 402,938 ' - 28,307 10,242 38#549

Table 4.3 COLOMBIA: EXTERNAL DEBT OUTSTANDING AS OF DECEMBER 31, 1974DEBT REPAYABLE IN LOCAL CURRENCY
(In thousands of U.S. dollars)
Debt Outstanding December 31, 1974Creditor Country IJndis-
Type of Creditor Disbursed bursed Total
TDP 163.421 38.70o 202.125
Loans from International Organizations 163.421 38.70Ll 202.125
USA 5.151 5.151
Loans from Governments 5.151 - 151
TCTAL EXTErNAL PIJBELIC DEBT 168.572 38.70o 207.276
NOTE: Debt with a maturity of over one year.
SC'JPLCE: TBRD External Debt Division, Economic Program Department.

,, tt Table L14 C'LlAMBIA: EXTFERAL PUBIJC DEBT1$ 88 -- ~~~~~~~~~~~~~~~~~~~~~~~~~~03/11/75 TRANSACTI)NS FOR 1965-74 AND
PROJECTED PIPELINE 1975-aL
DEBT REPAYABLL IN LOCAL CURRENCY PAGE 1
IN THOUSANDS Of U*S. DOLLARS
TUTAL..1
DEBT OUTSTANOING TRANSACTIONS OURING pERIODBEGINNING OF PERIOU CANCEL;
LATIONSDISBURSED INCLUDING COMMIT UIShURSE SERVICE PAYmENTS ADJUST-YEAR ONLY UNOISBURSEO MENTS NENTS PRINcIPAL INTEREST TOTAL MENTS(1) (2) (3) (4) (5) C6) (7) (8)
1965 44,465 60#335 150550 5#744 506 1,154 1#660 861251966 41,819 67,254 i0,99U 9,402 854 1,395 2,249 1s0221967 50,727 88w412 8'1OJ 10'420 1,213 1,688 2,901 1651968 57,,402 95P470 42#200 14,725 2,149 2,163 4'312 2#9171969 69,028 132P604 33#800 1 7185 2,793 2,544 5w637 2P1511970 52,70o 161P460 465300 27P996 3,373 3J27U 6P643 7773971 106,557 205P610 4'!U0U 21'853 4,429 4,186 8#615 I1972 129,981 245#981 9*300 20P919 6,230 5P356 11,586 5,6091973 144,610 243P442 3'100 22#363 7,470 5J962 13,432 -2P1501974 151,329 236P922 9P200 41'498 7P708 5#825 13P534 -31JI38
1975 16a#572 207#276 - 21'226 1o,273 6,219 16#4931976 179#525 197002 _ 10'594 12,940 6'555 19.4961977 177,178 184P062 - SiOl1 13,090 oa482 19P5731978 169,100 170.971 - 665 13,425 6P135 19.5601979 156,339 157P547 - 604 13P503 5,649 19J1521980 143.440 144,044 - 604 14.156 5,156 19.3111981 129,888 129,888 - * 14P123 4,648 18.7711982 115,765 115.165 - 13.810 4,139 17.948198 3 101,955 101.955 I - 11,959 3,646 15,6051984 b9,996 89,996 - * 11,442 3,208 14.6501985 7TP554 78,554 I 11o028 2,784 13*8131986 67,526 67,526 - * 10,104 2,376 12,4791987 57,422 57.422 9,682 1,984 11,6661988 41,740 47P740 - 8,702 1,608 10.3101989 39,038 39,038 _ - 7,949 1P292 9.2411990 31,089 31,089 . 7,194 1,002 8B1961991 23,895 23,895 _ , 6.537 735 7#2721992 11,358 17,358 _ , 4P442 523 4,9651993 12,916 12#916 - * 3P809 358 4,167'994 9.107 '1Q - 3 079 22A 0 3
-~~~~~~~~~~~~~~~~~~~~~~~~~~~~~~~~~~~~~~~~~~~~~~~~~~~~~~~~~~~~~~~~~~~~~~~~~~~-
NOTE: Debt with a maturity of over one year; includes all loans listed on table L
- - - - - -- --- -- ---- -- --- - - - - - - - -

Ta.ble- li.1T tD N'i,IA: EXTERNAL PUTJITITC DEBT03/11/75
TRAIISACTJNB2iS F R ' ;('-71) AY'D
FR(. JEGTE FTFELII',E l79T-8L
DEbT REPAYABLL IN LOCAL CURRLNCY PAGE 2
IN THOUSANDS OF U.5* DOLLARS
LOANS FKOM INTL. ORGANIZATIONSID8
DEBT OUTSTANOING TRANSACTIONS DURING PERIODBEGINNING OF PERIOD CANCEL'
LATIONSPDISbURSED INCLUDING CUMMIT DISBURSE- SERVICL PAYMENTS ADJUST-
YEAR ONLY UNDISBURSED MLNTS MENTS PRINCIPAL INTEREST TOTAL MENTS(1) (2) (3) (4) (5) (6) (7) (8)
1965 22P8l4 38J587 15,550 5*744 367 579 946 -8631966 27o537 52,907 19,410 7.822 686 824 1*510 1l0031967 35*014 72,634 6*103 10,420 1*007 1'245 2#252 2,4901968 44,207 82,220 42,200 14,725 1*909 1,660 3*569 -2*0391969 56,948 120,472 33,800 17*185 2,471 2*375 4,846 -1*4931970 71,604 150,308 48,0300 27s996 2,986 2,848 5#834 -571971 V6,558 195*565 44,80u 27,851 3,994 4,78U 7'774 -1972 12U*415 236,371 9,300 20*919 5,752 4..970 10o722 5'6091973 135,582 234'310 3*100 22P363 7#065 5*6b1 12*746 -1974 150,U52 230,345 Y,200 41,498 7110 5,587 12*697 -30'311
1975 163P421 202,125 - 21,226 9,700 b015 15*715 -1976 174,947 192*425 - 10*594 12,367 6P374 18*7411977 13,174 180,057 - 5,o011 12,517 6*325 18,842 .1978 165,668 167,540 - 665 12,852 6*001 18*8531919 153,4a2 154*689 - 604 12,929 5.539 18*46b -
198U 141,156 141,759 6 604 13,583 5,069 18#651 -
1981 128,177 128,177 - - 13*550 4,585 18*134 -1982 114,627 114,627 - 13,296 4,096 17,394 .1983 101U331 101*331 - 11*600 3#625 15'226 ,1984 B9,731 89,731 - - 11,177 3#200 14,377 -1985 18,554 78*554 - . 1l1O28 2,784 13*813 -
1986 67,526 67t526 I 10*104 2,376 12*479 -
1981 57,422 57,422 . 9*682 1,984 11*666 -
1988 47,740 47P740 - 8*702 1,60b 10#310 -
1989 39*038 39*038 ' - 7,949 1,292 9*241 -
1990 31,089 31,069 ' 7,194 1*002 8*1961991 23,895 23,895 _ _ 6,537 735 7*2721992 17,358 17,358 - - 4,442 523 4*965 -
1993 12*916 12,916 - - 3,809 358 4*167 -1994 9,107 9#107 - - 3,079 228 3*307 -

Table 4.4 COLOMBIA: EXTERNAL PUBLIC DEBT
TRANSACTIONS FOR 1965-74 AND
PROJECTED PIPELINE 1975-84
DEBT REPAYABLE IN LOCAL CURRLNCY PAGM 3
IN THOUSANDS OF U.S. DOLLARS
LOANS FROM INTL. ORGANIZATIONS
DEBT OUTSTANDING TRANSACTIONS DURING PERIODBEGINNING oF PERIOD CANCEL-
LATIONS*DISBURSED INCLUDING COMMIT DISBURSE' SERVICE PAYmENTS ADJUST'
YEAR ONLY UNDISBURSED MENTS NENTS PRINCIPAL INTEREST TOTAL NINTS(1) (2) (3) (4) (5) (6) (7) (8)
1965 22,814 38,587 15.550 5,744 367 579 946 -8631966 27,537 52,907 19,410 7.822 686 824 1.510 1.0031967 35,014 72.634 b8103 10,420 1,007 1,245 2.252 2,490196b 44,207 82P220 42*200 14#725 1.909 1.660 3.569 -2.0391969 56.948 1200412 33.800 17.185 2.471 2,375 4#646 .1.4931970 11.604 150,308 48P300 27.996 2,986 2,084 5.834 '571971 96.558 195.565 44.800 27,851 3.994 3.780 7,774 -1972 120,415 236.371 9#300 20.919 5.752 4.970 10.722 -5.6091973 135.582 234.310 3,100 22.363 7.065 5.661 12.7461974 150.752 230.345 9.200 41.498 7.110 5J.587 12J697 -30.311
1975 163.421 202.125 - 21.226 9#700 60015 15.7151976 174.947 192P425 ' 10.594 12,367 6.374 18.741 -1977 173.174 180,057 5'.011 12.517 6,325 18.8421978 165,666 167.540 - 665 12.852 6.001 18,8531979 153.482 154.689 - 604 12P929 5*539 18.4681980 141.156 141,759 - 604 13,583 5,069 18.6511981 128,177 128,177 - - 13.550 '4585 l18134 -1982 114.627 114,627 ' 13.296 4,098 17.394 -1983 101.331 101.331 ' ' 11.600 3.625 15J2261984 b9.731 89.731 ' - 11,177 3*200 14,377 -1985 78.554 78.554 - 11.028 2,784 13.8131986 67.526 67.526 ' - 10.104 2,376 12.479 -198? 57,422 57.422 ' 9.682 1.984 11.666 -
471740 4f.7'40 8*702 1.608 10.310 -1989 39#038 39,038 ' - 7J949 1.292 9J241 -199U 31J089 31,089 ' 7,194 1.002 8.1961991 23.895 23.895 - - 6*537 735 7.272 -1992 17,358 17.358 ' 4,442 523 4*965 -1993 12.916 12.916 - - 3.809 358 4.1671994 9,107 9,107 ' ' 3,079 220 3.307
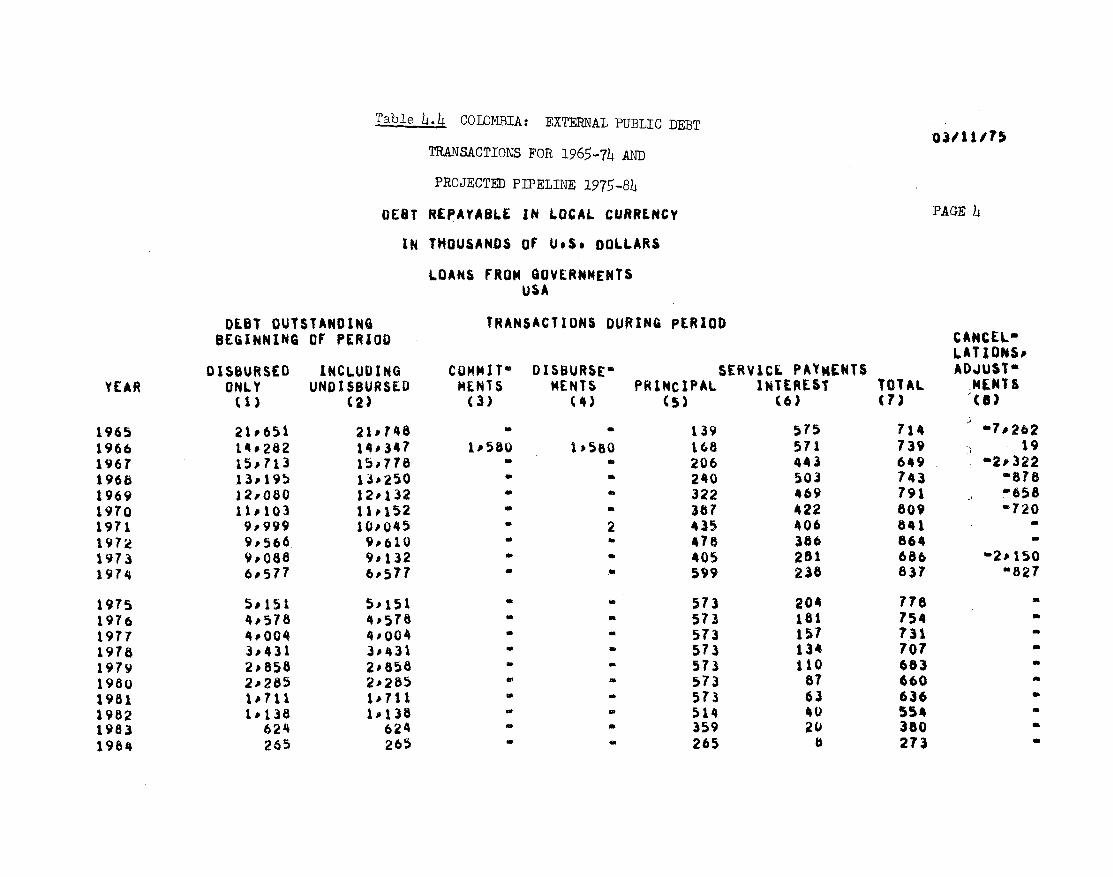
Table 4.4 COI()MBIA: EXTERNAL PUBLIC DEBT030pI l/T5
TRANSACTIONS FOR 1965-74 AND
PROJECTED PIPELINE 1975-84
DEBT REPAYABLE IN LOCAL CURRENCY PAGE
IN THOUSANDS OF U.S. DOLLARS
LOANS FROM GOVERNMENTSUSA
DEBT OUTSTANDING TRANSACTIONS DURING PERIODBEGINNING OF PERIOD CANCEL
LAT IONS,DISBURSED LNCLUDING CUMMIT DISBURSE' SERVICL PAYMENTS ADJUST-
YEAR ONLY UNDISBURSED MENTS MENTS PRINCIPAL INTEREST TOTAL MENTS(1) (2) (3) (4) (5) (6) (7) (6)
1965 21,651 21r,748 139 575 714 17291966 14,282 14,347 1'580 IP5B0 168 571 739 191967 15,713 15.778 * - 206 443 649 -2,3221968 13,195 l8.250 * 240 503 743 -8781969 12,080 12'132 322 469 791 6581970 11,103 11,152 367 422 809 -7201971 9s999 10,045 ' 2 435 406 841 -1972 9,566 9,610 l 478 386 864 -1973 9,088 9#132 405 281 686 -2#1501974 6,577 6#577 - 599 238 837 -827
1975 5F151 5PI51 * 573 204 7rB -1976 4*578 4,578 - 573 li 7541977 4,004 4#004 - 573 157 731 -1978 3,431 30431 ' 573 134 7071979 2#858 2,858 573 110 6831980 2,285 2s285 - 573 87 6601981 1'711 11 ' 573 63 6361982 10138 1.138 - 514 40 554 -1983 624 624 359 20 3801984 265 265 - a 265 8 273

Table 4.4 COLOMBIA: EXTFRNAL PUBLIC DEBT
o3d'11/?5TRANSACTIONS FOR 1965-74 AND
PROJECTED PIPELINE 1975-84
DEBT REPAYABLE IN LOCAL CURRENCY PAGE.5
IN THOUSANDS OF U.S. DOLLARS
LOANS FROM GOVERNMENTS
OEBT OUTSTANOING TRANSACTIONS DURING PERIODBEGINNING OF PERIOD CANCEL-
LATIONS#DISBURSEO INCLUDING COMNITO DISBURSE- SERVICE PAYMENTS ADJUST-
YEAR ONLY UNDISBURSED MENTS MENTS PRINCIPAL INTEREST TOTAL MENTS(1) (2) (3) (4) (5) (6) (7) (8)
1965 21*651 21448 - 139 575 714 '7J2621966 14,282 14,341 1*580 1*580 168 571 739 191967 15.713 15,778 - ' 206 443 649 :2#322
1968 13*195 13.250 * 240 503 743 '8781969 12PO8O 12*132 - - 322 469 791 -6581970 11,103 11*152 - 387 422 809 . 7201971 9.999 10,045 ' 2 435 406 8411972 9,566 9*610 - 478 386 864 -
1973 9o08a 9*132 - 405 281 686 -2*1501974 6,577 6*577 a - 599 236 837 '827
1975 5*151 5*151 - 573 204 7781976 4P578 4P578 - - 573 181 7541977 4.004 4J004 * 573 151 7311976 3,431 3P431 ' - 573 134 7071979 2P858 2*858 5 - 573 110 6831980 2P285 2P285 573 87 660 ,1981 1*711 1*711 - 573 63 6361982 1*138 1.138 - - 514 40 5541983 624 624 - 359 20 3801984 265 265 - 265 8 273

Table 5. - COLOMBIA: PUBLIC SECTOR RESOURCES FOR INVESTMENT 1970-74
(In dillions of Colombian pesos)
ACTUAL ESTIMATED1970 1971 1972 1973 1974
I. SOURCES
A. Current Account Surplus - 9_282 9,872 10.050 10,648 17,3991. Central Government 6,404 7,793 8,351 10,389 14,189
National Government 5,953 7,154 7,829 9,598 13,305National Highway Fund 48 50 100 69 109Social Security 403 589 422 722 775
2. Decentralized Agencies 1,333 884 1,009 - 88 3,081(a) National Decentralized
Agencies 609 - 75 - 125 -_1515 1,502ECOPETROL 568 900 1,375 1,406 5,148IDEMA 113 - 328 - 474 -1,436 -2,107TELECOM 229 296 461 470 488Others - 301 -1,023 -1,487 -1,955 -2,027
(b) Municipal DecentralizedAgencies 724 959 1,134 LAZ7 1,579
EAAB 109 256 278 304 320EEEB 209 254 316 440 454EPM 294 318 375 488 577Others 112 131 165 195 228
3. Departments 238 11 - 168 - 964 -1,087
4. Municipalities 1,307 1,184 858 1,311 1,216
B. Capital Account Revenues 762 672 766 1,178 -1,05
C. Borrowing 7,400 9,140 135 15,454 16,8311. External 3,512 4,219 6,912 7,892 6,01t2. Domestic 3,888 4,921 6,423 7,562 10,820
TOTAL 17,444 19,684 24,151 27,280 35_325
II. USES
A. Investment Expenditures 13,326 15,128 17,379 20,737 27,31i1. Gross Fixed Investment 12,168 13,501 15,967 19,170 . 25,26f
a. Central Government 2,394 3,058 3,283 307 4,50''National Government 737 995 1,030 1,020 1,512National Highway Fund 1,555 1,957 2,146 2,182 2,85iSocial Security 102 106 107 105 135
b. Decentralized Agencies 5,882 5,926 8013 9,674 13,350(I) National Decentralized
Agencies 4,302 4,559 6,357 7,7Z4 11,02!ECOPETROL 824 862 1,558 1,601 3,052INSCREDIAL 633 734 854 1,002 1,477ICCE 240 308 435 678 946CVC - 305 604 1,041 937ISA 460 402 487 1,044 1,400Others 2_145 1,948 2,419 2,358 3,210
(II) Municipal DecentralizedAgencies 1,580 1,367 1,656 1,950 2,!
EAAB 573 410 579 594 601EPM 372 434 460 500 1,083Others 635 523 617 856 63:
c. Departments 1,169 1,490 1,442 1,50 1, 92'
d. Municipalities 2,723 3,027 3,229 4,539 5,49.
2. Financial Investment 1,158 1,627 1,412 1,567 2,04,ICSS 595 857 741 985 1,182Others 563 770 671 582 86'
B. Amortization Payments 4,031 3,930 5,984 6,009 7,2621. External 1,139 1,214 1,970 2,498 2,6872. Domestic 2,892 2,716 4,014 3,511 4,579
C. Cash Balances 4! 87 626 788 531, 750
TOTAL 17.444 _ 2
1/ Before transfers.2/ Balancing item. Informe Financiero of the Controller General's 08'ice'
Financial Reports of Public,Enterprises; Nationa'Sources: Planning Department; Banco de la Republica;
and Mission estimates.

Table 5.2 -COLOMBIA: PUBLIC SECTOR RESOURCES FOR INVESTMENT 1970-74(As percent of G.D.P. at m.p.)
ACTUAL ESTIMATED1970 1971 1972 1973 1974
I. SOURCES
A. Current Account Surplus 1 6.4 5.4 4.4 5.51. Central Government 4.9 7T T7 7;7
National Government 4.6 4.7 4.2 4.0 4.2
National Highway Fund - - - -
Social Security 0.3 0.4 0.2 0.3 0.2
2. Decentralized Agencies 1.0 0.6 0.5 - 1.0
(a) National DecentralizedAgencies 0.5 - - 0.1 - 0.6 0.5
ECOPETROL 0.4 0.6 0.7 0.6 1.6
IDEMA 0.1 - 0.2 - 0.3 - 0.6 - 0.7
TELECOM 0.2 0.2 0.2 0.2 0.2Others - 0.2 - 0.7 - 0.8 - 0.8 - 0.6
(b) Municipal DecentralizedAgencies 0.6 0.6 0.6 0.6 0.5
EAAB 0.1 0.2 0.1 0.1 0.1
EEEB 0.2 0.2 0.2 0.2 0.1
EPM 0.2 0.2 0.2 0.2 0.2Others 0.1 - 0.1 0.1 0.1
3. Departments 0.2 - - 0.1 - 0.4 - 0.3
4 Municipalities 1.0 0.8 0.5 0.5 0.4
B,. CGpital Account Revenues 0.6 0.4 0.4 0.5 0.3
C. Borrowing 5.7 5.9 7.2 6.4 5.31. External 2.7 2.7 3.7 3.3 1.9
2. Domestic 3.0 3.2 3.5 3.1 3.4
TOTAL 13.4 12.8 13.0 11.3 11.1
II. USES
A. Investment Expenditures 1l0.2 9.8 9.4 8.6 8.6
1. Gross Fixed Investment 9.3 8.8 8.6 7.9 7.9
a. Central Government 1.8 2.0 1.8 1.4 1.4
National Government 0.6 0.6 0.6 0.4 0.5
National Highway Fund 1.2 1.3 1.2 0.9 0.9Social Security - 0.1 - - -
b. Decentralized Agencies 4.5 3.9 4.3 4.0 4.2
(I) National DecentralizedAgencies 3.3 3.0 3.4 3.2 3.5
ECOPETROL 0.6 0.6 0.8 0.7 1.0INSCREDIAL 0.5 0.5 0.5 0.4 0.5ICCE 0.2 0.2 0.2 0.3 0.3CVC - 0.2 0.3 0.4 0.3
ISA 0.4 0.3 0.3 0.4 0.4Others 1.6 1.3 1.3 1.0 1.0
(II) Municipal DecentralizedAgencies 1.2 0.9 0.9 0.3 1.7
EAAB 0.4 0.3 0.3 0.2 0.2
EPM 0.3 0.3 0.3 0.2 0.3Others 0.5 0.3 0.3 0.4 0,2
c. Departments 0.9 1.0 0.8 0.7 0,6
d. Municipalities 2.1 2.0 1.7 1.9 1,7
2. Financial Investment 0.9 1.1 0.8 0.6 0,6ICSS 0.5 0.6 0.4 0.4 0,4Others 0.4 0.5 0.4 0.2 0.2
B. Anortization Payments 3.1 2.6 3.2 2.5 2.3
1. External 0.9 0.8 1.1 1.0 0 8
2. Domestic 2.2 1.8 2.1 1.4 1 4
C. Cash Balances _ 0.4 0.2 0 2
TOTAL 13.4 12.8 13.0 11.3 11,1
Sources: Same as Table 5.1.

Table 5.3 -COLOMBIA: PUBLIC SECTOR RESOURCES FOR INVESTMENT 1970-74
(percentage distribution)
ACTUAL ESTIMATED1970 1971 1972 1973 1974
I. SOURCES
A. Current Account Surplus 53.2 50.2 41.6 39.0 49.31. Central Government 36.7 39.6 34.6 38.1 40.2
National Government 34.1 36.3 32.4 35.2 37. '7National Highway Fund .3 .3 .4 .3 .3
Social Security 2.3 3.0 1.8 2.7 2.2
2. Decentralized Agencies 7.6 4.5 4.2 - .3 8.'(a) National Decentralized
Agencies 3.5 - .4 - .5 -5.6 4.3ECOPETROL 3.3 5.0 5.7 5.2 14.6
IDEMA .7 -1.7 -2.0 -5.3 -6.0
TELECOM 1.3 1.5 1.9 1.7 1.4Others -1.7 -5.2 -6.2 -7.2 -5.;'
(b) Municipal DecentralizedAgencies 4.2 4.9 4.7 5.2 4.5
EAAB .6 1.3 1.2 1.1 .O
EEEB 1.2 1.3 1.3 1.6 1.3
EPM 1.7 1.6 1.6 1.8 1.6Others .6 .7 .7 .7 .;
3. Departments 1.4 .1 - .7 -3.5 -3.1
4. Municipalities 7.5 6.0 3.6 4.8 3.t
B. Capital Account Revenues 4.4 3.4 3.2 4.3 3.1
C. Borrowing 42.4 46.4 76.4 56.7 47.7
1. External 20.1 21.4 28.6 28.9 17.C
2. Domestic 22.3 25.0 26.6 27.7 30.6
TOTAL 100.0 100.0 100.01 100.0 100.0
II. USES
A. Investment Expenditures 76.4 76.9 72.0 76.0 77.3
1. Gross Fixed Investment 69.8 68.6 66.1 70.3 71.5
a. Central Government 13.7 15.5 13.6 12.1 12.7National Government 4.2 5.1 4.3 3.7 4.3
National Highway Fund 8.9 9.9 8.9 8.0 8.1Social Security .6 .5 .4 .4 .4
b. Decentralized Agencies 33.7 30.1 33.2 35.5 37.8
(I) National DecentralizedAgencies 24.7 23.2 26.3 28.3 31.2
ECOPETROL 4.7 4.4 6.5 5.9 8.6INSCREDIAL 3.6 3.7 3.5 3.7 4.2ICCE 1.4 1.6 1.8 2.5 2.7CVC - 1.6 2.5 3.8 2.7ISA 2.6 2.0 2.0 3.8 4.0(tU.ters 12.3 9.9 10.0 8.6 9.1
(II) Municipal DecentraliedApencies 9.1 6.9 6.9 7.2 6.6
EAAB 3.3 2.1 2.4 2.2 1.7
EPM 2.1 2.2 1.9 1.8 3.1Others 3.6 2.7 2.6 3.1 1.8
c. Departments 6.7 7.6 6.0 6.1 5.4
D. Municipalities 15.6 15.4 13.4 16.6 15.6
2. Financial Investment 6.6 8.3 5.9 5.7 5.8ICSS 3.4 4.4 3.1 3.6 3.4Others 3.2 3.9 2.8 2.1 2.5
B. Amortization Payments 23.1 20.0 24.8 22.0 20.61. External 6.5 6.2 8.2 9.2 7.62. Domestic 16.6 13.8 16.6 12.9 13.0
C. Cash Balances .5 3.2 3.3 2.0 2.1
TOTAL 100.0 100.0 100.0 100.0 100.0
Sour:e: Same as Table 5.1.

Table0ju4 - COLOMBIA, ANALYSIS OF CONSOLIDATED PUBLIC SECTOR FINAIICSS, 1970-74
(In millions of Colombian peaos)
ACTUAL ESTIMATED1970 1971 1972 173 1974 _
Central GovernmentCurrent revenues 13,7Q8 1i,R1k 1R,9Q4 24,13n0 3n,708Current expenditures 7,394 9,021 10,643 13,741 16,519Current accoun ,surplus/deficit -/ 6,404 7,793 8,351 10,389 14,189Savings rati - 0.464 0.463 0.440 0.431 0.462Investment 2,394 3,058 3,283 3,307 4,502Savings as percent of investment 267.5 254.8 254.4 314.2 315.2
Decentralized AgenciesCurrent revenues 6,605 7,863 9,306 10,512 17,265Current expenditures 5,272 6,979 8,297 10,600 14,184Current account surplus/deficit 1' 1,333 884 1,009 - 88 3,081Savings ratiq 0.202 0.112 0.108 - 0.008 0.178Investment - 5,882 5,926 8,013 9,674 13,350Savings as percent of investment 22.7 14.9 12.6 - 0.9 23.1
DepartmentsCurrent revenues 2,432 2,834 3,202 3,486 4,231Current expenditures 2,194 2,823 3,370 4,450 5,318Current account surplus/deficit 1, 238 11 - 168 - 964 - 1,087Savings ratiq 2/ 0.098 0.004 - 0.052 - 0.277 - 0.257Investment 3_ 1,169 1,490 1,442 1,650 1,921Savings as percent of investment 20.4 0.7 - 11.7 - 58.4 - 56.6
MunicipalitiesCurrent revenues 4,077 4,426 4,678 5,931 E,536Current expenditures 2,770 3,242 3,820 4,620 5,320Current account surplus/deficit - 1,307 1,184 858 1,311 1,216Savings ratio 2/ 0.321 0.268 0.183 0.221 C.186Investment 3/ 2,723 3,027 3,229 4,539 5,493Savings as percent of investment 48.0 39.1 26.6 28.9 22.1
CONSOLIDATED PUBLIC SECTOR
Current revenues 26,912 31.937 36,180 44,09q 58,740Current expenditures 17,630 22,065 26,130 33,411 41,341Current account surplus/deficit 9,282 9,872 10,050 10,648 1i,399Savings ratio 0.345 0.309 0.278 0.242 r.206Gross fixed investment 12,168 13,501 15,967 19,170 25,266Savings as percent of investment 76.3 73.1 62.9 55.5 68.9
Capital revenue 762 672 766 1,178 1,095Financial investment 1,158 1,627 1,412 1,567 ;,047
Overall surplus/deficit - 3,282 4,584 - 6,563 - 8,911 _ 0,819
Financi 3282 4,584 6563 8911 9External (net) 2,373 3,005 4,942 5,394 ;,328
Borrowing ( 3,512) ( 4,219) ( 6,912) ( 7,892) ( 6,011)Amortization (- 1,139) (- 1,214) (-11,970) (- 2,498) (- ,683)
Domestic (net) 996 2,205 2,409 4,051 6,241Borrowing ( 3,888) ( 4,921) ( 6,423) ( 7,562) ( 10,820)Amortization (- 2,8Q2) (- 2,716) (- 4,014) (- 3,511) (- 4,579)
Short-t,erm financing and cash balances - 87 - 626 - 788 - 534 - 750
1/ Before transfers.
2/ Current account surplus/deficit + current revenues.
3/ Gross fixed investment.
Source: Same as Table 5.1.

Table 5.5- COLOMBIA: NATIONAL GOVERNMENT OPERATIONS 1970-742/
(In millions of Colombian pesos)
ACTUAL1970 1971 1972 1973 1974
I. Current Revenues 11,967 14.388 16,108 20,361 26,3561. Total revenue including CATs
and CTDs 12,391 14,931 17,208 21,817 28,639a. Income and net wealth tax t 5,617) ( 6,484) ( 7,624) ( 8,766) (10,725b. Sales tax ( 1,074) ( 1,614) ( 1,933) ( 2,460) ( 3,944)c. Customs revenues ( 2,542) ( 2,952) ( 3,079) ( 4,156) ( 5,646)d. Special exchange account ( 785) ( 840) ( 940) ( 2,001) ( 3,041)
2. Less (-): Taxes paid throughredemption of CATs and CDTs - 424 - 543 -1,100 -1,456 -2,283
II. Current Expenditures 8,069 10,178 11,583 14,735 18,2121. Personal Services 4,203 5,237 6,022 7,503 9,532
a. Wages and salaries ( 3,474) ( 4,135) ( 4,761) ( 5,390) ( 7,102)b. Contributions to social
security institutions ( 729) ( 1,102) ( 1,261) ( 2,113) ( 2,430)2. Goods and services 735 726 745 788 1,2753. Current transfers 2,501 3,483 3,817 5,029 5,765
a To decentralized agencies ( 864) ( 1,197) ( 942) ( 1,063) ( 1,025)b. To departments and
municipalities ( 1,257) ( 1,908) ( 2,515) ( 3,158) ( 4,468)c. To private sector C 323) ( 323) ( 290) ( 712) ( 122)d. To international agencies ( 57) ( 55) ( 70) ( 96) ( 150)
4. Interest payments 630 732 999 1,415 1,667a. Internal debt ( 380) ( 431) ( 620) C 679) ( 681)
b. External debt ( 250) ( 301) ( 379) ( 736) ( 986)
III. Current Account Surplus 3,898 4,210 4,525 5,626 8,144
IV. Investment Expenditures 5,442 5,903 8,362 8,424 10,9121. Gross fixed investment 737 995 1,030 997 1,5122. Capital transfers 4,705 4,908 7,332 7,427 9,400
a. Decentralized agencies ( 4,324) ( 4,616) ( 7,104) ( 6,926) ( 8,836)b. Departments and
municipalities ( 381) ( 292) ( 228) ( 501) ( 564)
V. Overall Surplus Deficit (-) -1,544 -1,693 -3,837 -2,798 -2,763
VI. Financing 1,544 1,693 3,837 2,798 2,768
A. Foreign financing (net) 1,463 1,227 3,279 2,996 3141. Drawings 1,838 1,605 4,102 4,082 1,246
U.S. AID ( 1,641) ( 1,217) ( 1,711) ( 1,801) ( 928)IBRD ( 137) ( 212) ( 374) ( 375) ( 78)IDB ( 60) ( 176) ( 242) ( 149) ( 139)Other ( - ) ( - ) ( 1,775) ( 1,757) ( 101)
2. Amortization - 380 - 369 - 811 -1,030 - 963U.S. AID (- 77 ( 103) (_ 120) (- 170 (- i/8)IBRD (_ 101) (_ 96) (_ 110) C- 130) (_ 172)IDB (_ 45) (_ 66) (- 85) (- 49) (- 108)Other (- 157) ( 104) ( 496) (- 683) (_ 505)
B. Domestic financing (net) 86 466 558 197 .45_1. Monetary authorities (net) 1 834 140 - 850 7152. Other domestic lenders (net) 82 - 403 26Q 72° ]RRn
3. Change in cash balances(increase -) 3 16 - 3 - 8 30
4. Change in deposits ofregional offices(increase -) ... ... ... - 124 - 140
5. Float (decrease -) - 15 57 - 26. Adjustment - 4 95 23 - 29
1/ Because of minor reclassification of the fiscal accounts, the 1973-74 period is notstrictly comparable with those of previous years.
Sources: Ministry of Finance, National Treasury, Controller General's Office, NationalPlanning Department, Banco de la Republica and Mission estimates.

TABLE 5.6 -COLOMBIA: NATIONAL GOVERNMENT REVENUES 1970-74(In millions of Colombian pesos)
ACTUAL
1970 1971 1972 1973 1974
Total Revenue Including CATs and CDTs 12,391 14,931 17,208 21,817 28,639
A. Taxes on Income and Property 5,958 6,941 8,022 9188 11,2591. Income and net wealth tax 5,617 6,484 7,624 8,766 10,7252. Other 341 457 398 422 534
a. Inheritance and gift taxes ( 170) ( 257) ( 216) C 257) ( 380)b. Cattle tax ( 153) ( 176) ( 159) ( 137) ( 125)c. Ten percent tax on land
property ( 18) ( 24) ( 23) ( 28) ( 29)
B. Taxes oni Foreign Trade 3,337 3,798 4,023 6,163 8,6921. Customs 2,246 2,619 2,741 3,705 4,8452. Three percent import surcharge - 296 333 338 451 8013. Special exchange account
operations (including coffeeexport tax) 785 840 940 2,001 3,041
4. Other 10 6 4 6 5
C. Taxes on Domestic Consumption andTransactions 29532 3,536 4,358 5,333 7,340
1. Sales tax 1,074 1,614 1,933 2,460 3,9442. Gasoline tax 836 1,018 1,353 1,455 1,5463. Stamp taxes 599 876 1,040 1,375 1,7914. Service tax (Proturismo) 23 28 32 43 59
D. Nontax Revenue 564 656 805 1,134 1,3481. Fees and fines 403 446 525 E.28 8182. Royalties and contractual income 161 210 280 306 530
a. Share in petroleum exploration ( 139) ( 147) ( 140) ( 140) ( 212)b. Other ( 22) ( 63) ( 140) ( 166) ( 318)
Less: Tax Credit Certificates - 424 - 543 -1,100 -1,456 -2,283
Total Current Revenue 11,967 14,388 16,108 20,361 26,356
1/ Beginning in 1975, resources earmarked for PROEXPO will be transferred directly.
Source: Same as Table 5.5.

Table 5.7-COLOMBIA: TAX BURDEN,, 1970-74
As n)arrcnt pfi- f nop-1970 1971 1972 1973 1974
Total Revenue Including CATs and CDTs 9.5 9.7 9.3 9.0 9.0
A. Taxes on Income and Property 4.6 4.5 4.3 3.8 3.51. Income and net wealth tax 42 3.6 42. Other 0.3 0.3 0.2 0.2 0.2
B. Taxes on Foreign Trade 2.6 2.5 2.2 2.5 2.71. Customs 1.7 1.7 1.5 1.5 1.52. 3 percent import surcharge 0.2 0.2 0.2 0.2 0.33. Special exchange account
operations (includingcoffee export tax ) o.6 o.6 0.5 0.8 0.9
4. Other - -
C. Taxes on Domestic Consumptionand Transactions 1.5 1.7 1.8 1.6 1.7
1. Sales tax 0.8 1.0 1.0 1.0 1.22. Gasoline tax o.6 0.7 0.7 o.6 0.53- Stamp taxes 0.5 0.6 0.7 0.6 0.64. Service tax (Proturismo) - - - -
D. Nontax Revenue 0.4 o.4 0.4 0.5 0__4
Less: Tax Credit Certificates -0.3 -0.4 -o.6 -o.6 -0.7
Total Current Revenue 9.2 9.4 8.7 8.4 8.3
Source: Same as Table 5.6.

Table 5.8 -COLOMBIA: BUOYANCIES WITH RESPECT TO G.D.P. 1970-74
1970 1971 1972 1973 1974
Totil Revenue Including CATs and CDTs 1.44 1.16 0.74 0.87 0.99
A. Taxes on Income and Property 1.38 0.93 0.75 0.47 0.711. Income and net wealth tax 1.41 0.87 5 0.89 0.712. Other
a. Inheritance and gift
taxes 0.41 2.89 -0.77 0.62 1.51b. Cattle tax 0.95 0.85 -0.47 -0.45 -0.28c. 10 percent tax on land
property 4.73 1.88 0.20 0.71 0.11
B. Taxes on Foreign Trade 2.14 0.78 0.29 1.73 1.301. Customs 2.04 0;94 0.23 1.15 0.972. 3 percent import surcharge 1.87 0.70 0.07 1.C9 2.463. Special exchange account
(including coffee export
tax ) 2.61 0.40 0.58 3.68 1.644. Other -0-59 -2.25 -1.61 1.63 -0.53
C. Taxes on Domestic Consumption
and Transactions 0.61 2.12 1.20 0.63 27.22
1. SaLes tax 1.03 2.83 o.96 o.89 1.912. Gasoline tax 0.87 1.23 1.59 0.25 0.20
3. Stamp taxes 0.81 2.61 0.91 1.C5 0.964. Service tax (Proturismo) -8.11 1.23 0.69 1.12 1.18
D. Nontax Revenue 1.69 0.92 1.10 1. 3,3 0.601. Fees and fines 1.76 0.60 0.86 -O.C2 1.792. Royalties and contractual
income 1.50 1.72 1.61 0.-,0 2.32a. Share in petroleum
exploration 0.95 0.32 -0.23 - 1.63b. Other 6.36 10.51 5.92 0.61 2.90
Less: Tax Credit Certificates 1.52 1.58 4.97 1.05 1.80
Total Current Revenue 1.43 1.14 o.58 0.86 0.93
Source: Table 5.6.

TABLE 5.9 - COLOMBIA: PUBLIC SECTOR TRANSFERS, 1970-74(In millions of Colombian pesos)
ACTUAL
1970 1971 1972 1973 1974
Current TransfersFrom: National GovernmentTo: Rest of Public Sector 2,121 3,105 3,457 4,221 5,493
Decentralized Agencies ( 864) (1,197) ( 942) (1,063) (1,025)Departments andMunicipalities (1,257) (1,908) (2,515) (3,158) (4,468)
From: Rest of Public Sector(Decentralized Agencies)
To: National Government 66 161 153 249 332
Capital TransfersFrom: National GovernmentTo: Rest of Public Sector 4,705 4,908 7,332 7,427 9,400
Decentralized Agencies (4,324) (4,616) (7,104) (6,926) (8,836)Departments andMunicipalities ( 381) ( 292) ( 228) ( 501) ( 564)
Total TransfersFrom: National GovernmentTo: Rest of Public Sector 6,826 8,013 10,789 11,648 14,893
Decentralized Agencies (5,188) (5,813) (8,046) (7,989) (9,861)Departments andMunicipalities (1,638) (2,200) (2,743) (3,659) (5,032)
Transfer payments as percentageof National GovernmentCurrent Revenue1. Current Transfers 17.7 21.6 21_5 20.7 20.82. Capital Transfers 39.3 34.1 45.5 36.5 35.73. Total Transfer Payments 57.0 55.7 67.0 57.2 56.5
Source: Planning Department and Mission Estimates

Table 5.10 - COLOMBIA: SUMMARY ACCOUNTS OF MAJOR DECENTRALIZED AGENCIS, 1970-74 2
(In millions of Colombian pesos at current prices) Page 1 of 6
ACTUAL ESTIMATED1970 1971 1972 1973 1974
I. EMPRESA COLOMBIANA DE PETROLEOS - ECOPETROL
I. Own Current Revenues 1,262.5 1.821.4 2487.3 3,012.5 7,339.5Sale of goods and services 1,216.8 1,652.0 2,466.1 2,944.5 .Other c:urrent revenues 45.7 169.4 26.2 68.0 ,
II. Direct Current Expenditures 694.9 841.6 1,112.0 1,606.3 2,191-4Remuneration 240.8 320.5 359.8 450.9 561.2Purchases of goods and services 333.6 404.1 561.5 688.7 1,223.5Interest payments 30.1 1.0 - - 41.5Current transfers to private sector 85.7 110.9 184.2 460.5 359.4Others 4.7 5.1 6.5 6.2 5.8
IIIa. Savings Generated 567.6 979.8 1,375.3 1406.2 5,1481
IIIb. Current Public Sector Transfer (net) -28.2 -105.9 -87.4 -170.6 -159.1
IIIc. Current Account Surplus/Deficit 539.4 873.9 1,287.9 1,235.7 4,989.0
IV. Other Revenues 87.4 91.9 1.8 _ _ -Capital transfers from public sector 87.4 91.9 - - -
V. Capital Expenditures 823.7 861.5 1,558.4 1,600.9 3,051.9Fixed capital formation 823.7 861.5 1,558.4 1,600.9 3,051.9Financ:Lal irvestment - - - - -
VI. Overall Surplus/Deficit -196.9 104.2 -268.7 -365.2 +1,937.0
VII. Long-Term Financing 185.6 141.9 -23.8 27.3 271.6Loans granted (net) 34.2 - 0.8 63.6 54.9Loans receiveda. foreign, net 142.5 -91.0 -54.3 -22.3 252.7b. domestic, net 8.9 -50.9 29.6 -14.2 -36.0
VIII. Short-Term Financing and Cash Balances 11.3 37.7 292.5 337.9 208.6
II. INSTITUTO DE CREDITO TERRITORIAL - INSCREDIAL
I. Own Current Revenues 221.7 208.1 314.6 428.+ 706.1Sale of goods and services 10.6 ( 8.2) 7.0 8.3Other current revenues 211.1 ( 199.9) 307.6 419.6.
II. Direct Cuirrent Expenditures 168.0 235,9 271.2 361.5 441.7Remuneration 46.2 60.3 40.9 4.3. .Purchases of goods and services 36.9 40.6 40.9 48.33 ...Interest payments 76.1 120.0 142.8 197.5 ...Current: transfers to private sector 2.5 3.7 -.4 6.9Social security contributions 5.8 10.9 7.9 20.e.Others 0.5 .4 33.3 ,
Illa. Savings Generated 537 -7.8 _ 43. bC. 264.3
IIIb. Current P'ublic Sector Transfers (net) - 4.3 -i.2 - 8.6 -- 0. - 4.3
IlIc. Current Account Surplus/Deficit 49.4 -36.0 34.7 53. , 260.0
IV. Other Revenues 128.2 124.0 600.4 4 334 517.5Capital transfers from public sector 128.1 124.0 5'J9.7 4...
V. Capital penditures 633.4 733.6 854.0 11477.2Fixed capital formation 633.4 733.6 854.0 1,001.8 1,477.2Financial investment -- - - - -
VI. Overall Surplus/Deficit -455.8 -645.5 -219.9 -509.6 -699.7
VII. Long-Term Financing 538.3 646.1 286.4 747.2 827.2Loans granted 205.0 248.5 61.2 169.4 347.8Loans receiveda. foreign, net 47.7 33.8 -28.6 -66.6 -88.3b. domestic, net 285.6 363.8 253.8 644.4 567.7
VIII. Short-Term FLnancing and Cash Balances -82.5 - .6 -67.5 -237.5 -127.4
1/ List of decetntralized agencies included in the consolidated public sector accounts are listed on page 6 ofTable 5.10.

Table 5.10 - COLOMBILt SUMhURY ACCOUNTS OF MAJOR DECENTRALIZED ADENCIS, 1970-74
(In milliona of Colombian pesos at current prices) ,a. 2 of 6
ACTUAL ~ ESTIMATED1970 1971 1972 19734
III. INTERCONEXION ELECTRICA S.A. - ISA
I. Own Current Revenues 35.9 3.2 23.4 67.8 -Sale of goods and services - _ - -Other current revenues 35.9 3.2 23.4 67.8 -
II. Direct Current Expenditures 13.1 17.1 38.7 59.9 45.8
IlIa. Savings Generated 22.8 -13.9 -15.3 7.9 -45.8
IIIb. Current Public Sector Transfer (net) 9.0 17.4 - - 67.7
IlIc. Current Account Surplus/Deficit 31.8 3,5 -15.3 7.9 21.9
IV. Other Revenues 63.3 87.4 155.9 176.9 218.2Capital transfers from public sector 63.3 87.4 155.9 176.9 218.2
V. Capital Expenditures 463.6 402.1 486.5 l.043.8 1,400.0Fixed capital formation 459.9 402.1 486.5 1,043.8 1,400.0Financial investment 3.7 - - - -
VI. Overall Surplus/Deficit -368.5 -311.2 -345.9 -859.0 -1,159.9
VII. Long-Term Financing 327.2 325.1 339.9 725.1 959.1Loans granted, net - 0.2 - -
Loans receiveda. foreign, aet 306.6 289.9 269.8 597.2 785.2b. domestic, net 20.8 35.2 70.1 127.9 173.9
VIII. Short-Term Fina:icing and Cash Balances 41.3 -13.9 6.0 133.9 200.8
IV. EMPRESAS PUBLICAS DE MEDELLIN - EPM
I. Own Current Revenues 509.6 567.7 654.5 844.1 1,171.5Sale of goods and services 446.9 508.4 604.7 764.6 . .Other current revenues 62.7 59.3 49.8 79.5
II. Direct Current Expenditures 216.1 249.8 279.3 356.1 594.3
Illa. Savings Generated 293.5 317.9 375.2 488.o 577.2
IlIb. Current Public Sector Transfer (net) -16.9 -14.1 -23.0 -28.9 -35.9
IlIc. Current Account Surplus/Deficit 276.6 303.8 352.2 459.1 54123
IV. Other Revenues 3.6 132.4 111.0 9.5 -
Capital transfers from public sector - - - -
V. Capital Expenditures 385.7 461.9 520.7 572.0 1,106.8Fixed capital formation 371.8 433.9 460.2 499.5 1,083.4Financial investment 13.9 28.0 60.5 72.5 23.4
VI. Overall Surplus/Deficit -105.5 -25.7 -57.5 -103.4 -565.5
VIl. Long-Term Financing 92.7 34.6 58.1 75.7 556.9Loans granted, net - - - - -
Loans receiveda. foreign, net 92.7 34.6 58.1 75.7 556.9b. domestic, net - - - - _
VIII. Short-Term Financing and Cash Balances 12.8 -8.9 -0.6 27.7 8.6

Table 5.10 - C0OXMBIAt SUMMARY ACCOUNTS OF MAJOR DECENTRALIZED AGENCIES, 1970-74
(In millions of Colombian pesos at current prices)
Page 3 of 6
ACTUAL ESTIMATED1970 1971 1972 1973 1974
V. INSTITUTO COLOMBIANO DE CONSTRUCCIONES ESCOLARES - ICCE
r. Own Current Revenues 4.0 5.1 8.0 10.5 10.4Sale of goods and services - - - -Other current revenues 4.0 5.1 8.0 10.5
II. Direct Current Expenditures 26.5 132.4 201.4 235.6 193.5Remuneration 16.7 108.9 167.7 197.5Purchases of goods and services 8.5 22.6 27.2 34.8 ..Interest payments - - - -Current transfers to private sector - - - -Social security contributions 1.3 .9 6.6 3.4 ...
Illa. Savings Generated -22.4 -127.3 -193.4 -225.1 -183.1
Illb. Current Public Sector Transfer (net) - 1.2 - 1.2 - 1.6 - 1.8 - 3.0
IIIc. Current Account Surplus/Deficit -23.6 -128.5 -195.0 -227.0 -186.1
IV. Other Revenues 168.6 214.2 538.5 323.8 836.4Capital transfers from public sector 168.6 214.2 538.5 323.8 836.4
V. Capital E:xpenditures 240.2 308.2 434.6 677.6 946.1Fixed capital formation 240.2 308.2 434.6 677.7 946.1Financial investment - - - - -
VI. Overall Surplus/Deficit -95.3 -222.5 -91.2 -580.9 -295.9
VII. Long-Term Financing 48.0 - - - -Loans granted - - - - -Loans receiveda. foreign, net 48.0 _ _ _ _b. domestic, net - - - - -
VIII. Short-Term Financing and Cash Balances 47.2 222.5 91.2 580.9 295.9
VI. CORPORACION AUTONOMA REGIONAL DEL CAUCA - CVC
I. Own Current Revenues 102.4 96.5 140.0 162.2 486.3Sale ef goods and services 41.0 47.9 90.2 102.8 ...Other current revenues 61.4 48.6 49.8 59.4 ...
II. Direct Current Expenditures 47.7 96.1 82.6 112.5 209.8Remuneration 6.5 8.2 9.2 10.2Purchases of goods and services 4.0 3.9 4.3 5.7 ...Interest payments 37.2 38.5 58.1 89.7 ...Current transfers to private sector - - -Others
- 45.5 11.0 6.9
IIIa. Savings Generated 54.7 0.4 57.3 49.7 276.5
IIlb. Current Public Sector Transfer (net) _ - - -
IIIc. Current Account Surplus/Deficit 54.7 0.4 57.3 49.7 276.5
IIV. Other Revenues 116.8 78.0 101.2 267.5 50.3Capital transfers from public sector 115.1 72.0 98.6 266.6 50.3Others 1.8 6.0 2.6 0.9 -
V. Capital Expenditures - 304.9 604.3 1,040.6 936.6Fixed capital formation - 59.5 604.3 1,026.2 936.6Financial investment - 245.4 - 14.4 -
VI. Overall Surplus/Deficit 171.6 -226.5 -445.7 -723.4 -609.8
VII. Long-Tenr Financing 118.3 255.4 361.9 532.1 652.2Loans granted - -Loans receiveda. foreign, net 123.0 233.7 346.2 472.0 566.8b. domastic, net - 4.7 21.7 15.7 60.1 85.4
VIII. Short-Term Financing and Cash Balances -289.8 -29.0 83.8 191.4 -42.4

Table 5.10 - COLONBIA: SUMMARY ACCOUNTS OF MAJOR DECENTRALIZED AGENCIES, 1970-74
(In miilions of Colombian posos at current prices)
Page 4 of 6
ACTUAL ESTIMATED1970 1971 1972 1973 1974
VII. EMPRESA DE ACUEDUCTO Y ALCANTARILLADO DE BOGOTA D. E. - EAAB
1. Own Current Revenues 245.0 414.1 464.5 577.5 681.0Sale of goods and services 245.0 318.1 369.2 458.1 ...Other current revenues - 96.0 95.3 119.4 ...
II. Direct Current Expenditures 136.4 158.0 186.3 273.4 361.0I. Operating expenditures 127.1 148.6 171.3 223.4 ...2. Interest payments 9.3 9.4 15.0 50.0 ...
IlIa. Savings Generated 108.6 256.1 278.2 304.1 320.0
IIIb. Current Public Sector Transfer (net) - 16.3 4.2 - -
IlIc. Current Account Surplus/Deficit 108.6 272.4 282.4 304.1 320.0
IV. Other Revenues - 0.9 0.4 27.1 -
V. Capital Expenditures 572.9 439.7 595.5 600.4 620.0Fixed capital formation 572.9 409.8 579.2 593.5 608.0Financial investment - 29.9 16.3 6.9 12.0
VI. Overall Surplus/Deficit -464.3 -166.4 -312.7 -269.2 -300.0
VII. Long-Term Financing 159.8 141.7 258.2 147.0 150.0Loans granted, net - - - - -Loans receiveda. foreign, net 113.3 141.7 258.2 147.00 150.0b. domestic, net 46.5 - - - -
VIII. Short-Term Financing and Cash Balances 304.5 24.7 54.5 122.2 150.0
VIII EMPRESA DE ENERGtA ELECTRICA DE BOGOTA
I. Own Current Revenues 413.4 501.1 646.5 816.5 898.0Sale of goods and services 408.7 493.6 619.5 784.2 ...Other current revenues 4.6 7.5 27.0 32.3
II. Direct Current Expenditures 204.3 247.6 330.8 376.6 444.5Operating expenses 110.3 140.4 184.2 205.9 286.9Interest payments 92.4 89.9 107.9 128.8 109.0Other 1.6 17.3 38.7 41.9 48.6
IIIa. Savings Generated 209.1 253.5 315.7 439.9 453.5
IlIb. Current Public Sector Transfer (net) - - - - -
tlIc. Current Account Surplus/Deficit 209.1 253.5 315.7 439.9 453.5
IV. Other RevenuesCapital transfers from public sector - - - - -
V. Capital Expenditures 517.9 394.6 446.0 852.3 846.2Fixed capital formation 526.6 344.4 383.5 677.1 414.1Financial investment 91.3 50.2 62.5 175.2 432.1
VI. Overall Surplus/Deficit -308.8 -141.1 -130.3 -412.4 -392.7
VII. Long-Term Financing 63.4 181.3 96.5 234.9 148.9Loans granted, net - - - - -Loans receiveda. foreign, net 107.6 211.8 106.1 221.9 106.7b. domestic, net -44.2 -30.5 - 9.6 13.0 42.2
VIII. Short-Term Financing and Cash Balances 245.4 -40.2 33.8 177.5 243.8

Table 5.10 - COLOMBIA: SUMMARY ACCOUNTS OF MAJOR DECENTRALIZED AGENCIES, 1970-74
(In millions of Colombian pesos at current prices) Page 5 of 6
ACTUAL ESTIMATED1970 1971 1972 1973 1974
IX. EMPRESA NACIONAL DE TELECOMUNICACIONES - TELECOM
I. Own Current Revenues 772.7 1,029.1 1,323,5 1,507.7 L,979.7Sale of goods and services 681.6 912.8 1,125.9 1,277.6 ...Other current revenues 91.1 116.3 197.6 230.1 ...
II. Direct Current Expenditures 543.3 732.8 862.2 1,038.1 1,491.6Remuneration 329.0 400.9 475.7 569.0 ...Purchases of goods and services 84.9 167.0 148.7 173.7 ...Interest payments 12.5 22.1 43.3 38.1 ...Current transfers to private sector 30.1 22.2 41.9 47.1Social security contributions 15.2 19.0 25.1 12.8 ...Others 71.6 101.6 127.5 197.4
IIIa. Savings Generated 229.4 296.3 461.3 469.6 488.1
IIIb. Current Public Sector Transfer (net) -98.1 -145.5 -168.8 -178.9 -270.6
IIIc. Current Account Surplus/Deficit 131.3 150.8 292.4 290.8 217.5
IV. Other Revenues 12.0 - - - -Capital transfers from public sector 12.0 - - - -
V. Capital Expenditures 228.4 293.2 224.5 290.2 248.8Fixed capital formation 228.4 134.2 224.5 290.2 248.8Financial investment - 159.0 - - -
VI. Overall Surplus/Deficit -85.1 -142.4 67.9 .6 -31.2
VII. Long-Term Zinancing 104.9 124.7 22.7 58.7 358.8Loans granted 11.7 - - - -Loans rezeiveda. foreign, net 89.8 103.9 56.8 79.5 192.4b. domestic, net 3.5 20.8 -34.1 -20.8 166.5
VIII. Short-Term Financing and Cash Balances -19.8 17.7 -90.6 -59.2 -327.6
X - INSTITUT DE mERCAIDE ACR.OPrCUARTO - IDEMA -
I. Own Curreit Revenues 550.9 542.6 458.1 -482.7 -840.1Sale of goods and services 411.7 458.9 375.2 -654.9 -994.5Other cirrent revenues 139.2 83.7 82.8 172.2 154.4
II. Direct Current Expenditures 438.3 870.6 932.5 953.6 1,267.4Remuneration 113.8 152.6 193.5 181.6 ...Purchasas of goods and services 117.8 108.8 203.7 401.9Interest payments 42.2 35.3 104.0 319.0Current transfers to private sector 11.4 15.3 16.7 30.1 ...Social security contributions 3.1 3.6 7.0 8.4 ...Others 150.0 555.0 407.6 12.6
IIIa. Savings Generated 112.6 -328.0 -474.5 -1,436.3 -2,107.5
IIIb. Current Piblic Sector Transfer (net) - 8.4 - 6.8 16.9 - 9.9 -29.8
IlIc. Current Account Surplus/Deficit 104.2 -334.8 -457.6 -1,446.3 -2,137.3
IV. Other Revenues 54.0 44.5 77.6 13.0 -Capital transfers from public sector 54.0 44.5 77.6 13.0 -
V. Capital Eapenditures 123.9 109.0 105.- 117.2 133.2Fixed capital 123.9 109.0 10. 117.2 133.2Financial investment -
VI. Overall Surplus/Deficit 34.3 -399.3 -489.8 -1,550.5 -2,270.6
VII. Long-Term Financing -132.2 295.4 32 /7 1,386.2 2,800.3Loans granted - 0.4 62.0 4E 4 227.3 68.1Loans receiveda. foreign, net -10.8 14.5 32.2 21.9 67.4b. domestic, net -121.0 218.9 244.0 1,137.0 2,664.7
VIII. Short-Term Financing and Cash Balances 98.0 103.9 165.1 164.3 -529.7

Table 5.10 - COWLOHAs SUMRY ACCOUNTS OF MLJOR DECITRU11SD AGENCIES, 1970-74.
(In mions of Colombian pesos at current prices) Pat 6 of 6
ACTUAL ZSTIMATED1970 1971 1972 1973 1974
TX. OTE DECENTRALIZED AGENCIES CONSOLIDATED
I. Own Current Revenues 2,487.2 2,673.9 2,78S 8 3,570,6 4,833.9
II. Direct Current Expenditures 2,783.2 3,396.9 4O000.6 5,230.7 6,946 9
III&. Savinna Genrated -296.0 -723.0 -1.214.8 -1.660 1 -2.113.0
Illb. Current Public Sector Transfer (not) 600.2 693.5 848.5 573,7 914.0
IlIc. Curront Account Surplus/Deficit 304.2 -29.5 -366.3 -1.086.4 -1.199.0
IV. Other Revenues 1 275.9 1 547.9 1 982 0 2 371,1 2 297.6Capital transfers from public sector 1:269.1 1544.9 1 913.7 2 2170 Other 6.8 3.0 68.3 154.1
V. Ca!pital .oditures 2 202.8 2 174.8 2 335.1 2148. 9 3,057.9Fixed capital formation 201.5 2 1297 21317 4 M,I.Wlinancial investment 201.3 45.1 17.7 2 3
VI. Overall Surplus/Deficit -622.7 -656.4 -719.4 -864.2 -1.959.3
Colombia - Public Sector Decentralized Agencies Included in the Consolidated Public Sector Accourts, Tables 5.1-5.4
AbbreviLtion Name
1. ADPOSTAL Administraci6n Postal Nacional2. CAJANAL* Cala Nacional de Previsi6n Social3. CAR Corporaci6n Aut6noma RogtonLl de la SLbana de BogotA y de lon Vallec de
Ubati y Chiquinquird4. CxEC Central Hidroelgctrica de CelIda, S.A.5. COFITrA Corporaoid6n Finszoisra del Trinoporte6. COLPUERTOS Empresa Puertoo ie Colombia7, CORELCA Corporaci6n Elictrica de la Costs Atlhptico8. CVC Corcoraci6n Aut6nona Regional del Cauca9. EAAB Enrpes de Acueducto y Aloantarillado do BogotA
10. ECOPETRQL Enpresa Colombiana de. PtrA51omli. EEM Em¶reo de Energfa El16tricis e BogotA12. EMCALI Emresas Municipales ie Coli13. EPM Empresas o Po blioaa is Modollln14. PAN Fonda Aeronlutioc Nlaional15. FNC Ferrocarriles Nacionales ie Colombia16. FONADE Fondo Nacional is Proyootoos i Desarrollo17. FONDO VIAL# Fonco ViLl Nacional18. ICA Instituto Colombieno Agroeoouario19, 203F Znstituto ColoubtesO 4s 3itnestLr PFailiar20, ICCE Instituto Colomblane de Conetrueelonoe lesolares21, IoL Instituto Colemblne deo e norgt Iloetrlea22, 1085* Instituto Colombiano is legures oelaloes23. IDEMA Instituteo d Marer4d0 Agropeocuarlo24. ZNCORA Instituto Colombi no de, la Reformn Agrarls25, INDERENA Instituto ie Doesrrollo deo lo Resurses Naturales eonevabnee26 21 P1 In.tituto Colombilno part Progrs ;e wpeGulGWm de lalud27, INSCANDIAL sntituteo de CrEdite Torrlttrial28. INIFOPAL :nstitute Nacwlnal de Fomento Mmluleal29, ZIA InteracnexiOn Elstrnia I.A.30, NAVINAL Cnpdlfa Naceonol as Nayvegaeln, N.A.31 lSNA serviclo Naelonal deo Apnendimaje32. TELECOM Empress Nasional de Tsleeomunioscionse
* Clasulfied Si part of the Central Oovernment tn the Coneolleated Putlie leater Amounts,
Sourooe SLei as source of Table 5.1

TABLE 5.11 COLOIBIA: SOCIAL SECURITY SYSTEM REVENUES AND EXPENDITURES,1970-1973 ACTUAL; 1974 (ESTIMATED) 1/
(In millions of Colombian pesos)
ACTlUAL ESTIMATED1970 1971 1972 1973 1974
I. Own Curreat Revenues 1,849.1 2,536.7 2,939.4 3,949.2 4,575.41. Sale of goods and services 1,765.6 2,357.2 2,718.4 3,677.02. Other current revenues 83.5 179.4 221.1 272.2
II. Direct Current Expenditures 1,446.5 1,947.6 21. 3,226.9 3,800.31. Remuneration 701.3 781.2 1,012.4 1,300.72. Purchases of goods and services 417.4 519.1 733.7 947.33. Interest payments 2.0 1.5 1.3 3.9
a. external debt C - ) C ) ( - ) ( - )b. domestic debt ( 2.0) ( 1.5) ( 1.3) ( 3.9)
4. Current transfers to private sector 325.7 597.4 760.5 940.95. Current transfers to abroad - - - -6. Social security contributions - 48.4 8.8 33.17. Marketing expenditures - - - -8. Agricultural extension work - - - -
IIIa. Savings Generated 402.6 589.0 422.6 722.4 775.1
IlIb. Current Public Sector Transfers (Net) 46.8 88.0 69.4 167.0 112.41. Transfer revenues 190.1 100.0 83.3 179.2
a. from Central Government ( 75.0) ( 100.0) ( 83.3) ( 179.2)b. from rest of public sector (115.1) C - ) ( - ) ( - )
2. Transfer expenditures 143.3 12.0 13.9 12.2a. direct taxes ( -) C -) ( -) ( -)b. indirect taxes ( -) ( -) C -) C -)c. other current transfers to
Central Government ( 7.7) ( 12.0) C 13.9) ( 12.2)d. other current transfers to
rest of public sector ( 135.6) ( - ) ( - ) ( -
IIIc. Current Account Surplus/Deficit 449.4 677.0 492.0 889.3 887.5
IV. Other Revenues 41.7 123.3 192.6 203.5 135.21. Capital transfers from public sector - - - _ _
a. from Central Covernment ( - ) ( - ) ( - ) ( - )b. from rest of public sector ( - ) ( - ) ( - ) ( - )
2. Other capital revenue 41.7 123.3 192.6 203.5 135.2
V. Capital Expenditures 697.0 963.7 867.5 1,098.5 1.17.01. Capital transfers to public sector - - - -
a. to Central Government ( - ) ( - ) ( - ) ( - )b. to rest of public sector ( - ) ( - ) ( - ) ( - )
2. Fixed capital formation 102.4 106.4 107.4 105.5 135.3a. studies ( .4) ( - ) ( - ) ( -)b. construction ( 87.6) ( 106.4) ( 107.4) ( 105.5) ( 135.3)c. machinery and equipment ( 14.4) ( - ) ( - ) ( - )
3. Financial investment 594.7 857.3 760.1 993.1 1>181.8a. buildings, land, etc. ( 5.8) ( - ) ( - ) C - )b. government bonds (net) ( 588.9) ( 857.3) ( 760.1) ( 993.1) (1,181.8)c. other public securities (net) ( - ) ( - ) ( - ) ( - )d. other investment ( - ) ( - ) ( - l ( - )
VI. Overall Surplus/Deficit - 205.9 - 163.4 - 183.0 - 5.7 - 294.3
VII. Long-Term Financing 93.3 138.5 11.8 - 97.4 - 11.41. Loans granted 83.2 - - -
a. disbursements made - ) ( - ) ( - ) - )b. amortization received ( 83.2) C - ) C - ) ( - )
2. Loans receiveda. foreign -
Mi) used funds ( -) ( -) ( -) ( -)(ii) amortization payments ( -) ( -) ( -) (
b. domestic 10.2 138.5 12.2 - C.9 - 11.4(i) used funds ( 13.0) ( 142.8) ( 24.8) ( .2) C 4.5)(ii) amortization payments (- 2.8) (- 4.3) (- 13.3) (-10£.6) (- 15.9)
VIII Short-Term Financing and Cash Balances 112.6 24.9 171.2 1,1.1 305.7
I/ CAJANAL and ICSS combined.
Source: Informe Financiero: 1970-First Semester of 1974, Controller General's Office.

.~~~ 7f'eez j- b - ~
Table 5.12 - COLOMNIA: PROJECTED NATIONAL GOVI-UNMT REVENURS, 1975-1980(In aillions of Colombian pesos at current prices)
1975 Y 1976 1977 1978 1979 1980_ ~ ~ ~~~~~~A B
Total Revenue including CATs and CDTs 35,425 35.346 45,810 55,483 66.561 79,026 92,790
A. Taxes on Tncome and Property 13,785 13,970 17,356 21,318 25,889 30,950 36,3661. Income and net wealth tax 13,350 13,535 16,892 20,828 25,369 30,392 35,7712. Other 435 435 464 490 520 558 595
a. Inheritance and gift taxes ( 400) ( 400) ( 422) ( 440) ( 462) ( 492) ( 521)b. Cattle tax (-) (-) (-) (-) (-) (.-) (.-)c. Ten percent tax on land
property 35) ( 35) ( 42) ( 50) ( 58) ( 66) ( 74)
B. Taxes on Foreign Trade 10.000 9 078 11.650 14,111 16,866 ZO,109 23,9501. Customs 7,140 6,559 8,173 10,419 12,932 15,777 19,2032. Import surcharge 435 440 548 698 867 1,057 1,2873. Coffee export tax 2,491 2,145 2,389 2,494 2,567 2,775 2,9604. Special exchange account
operations - 66 - 66 540 500 500 500 5005. Other - - - - - - -
C. Taxes on Domestic Consumptionand Transactions 10,310 10,910 15,176 18,146 21,566 229,381
1. Sales tax 6,385 6,889 8,597 10,600 12,911 15,467 18,2052. Gasoline tax 1,710 1,710 3,720 4,050 4,430 4,840 5,2903. Stamp duties 2,150 2,246 2,787 3,417 4,138 4i,932 5,7804. Service tax 65 65 72 79 87 96 106
D. Nontax Revenue 1,330 1,3B8 1X628 1,908 2,i40 ?,632 3,91. Fees and fines 915 973 1,158 1,378 1,640 1,952 2,3232. Royalties and contractual income 415 415 470 530 600 680 770
a. Share in petroleum exploration ( 180) ( 180) ( 210) ( 240) ( 275) ( 315) ( 360)b. Other ( 235) ( 235) ( 260) ( 290) ( 325) ( 365) ( 410)
Less; Tax Credit Certificates -1,833 -1.833 - 945 -1,185 -1,480 -1,850 -2,313
Total Current Income 33.592 33,513 44,865 54,298 65,081 77,176 90,477
1/ A - Planniag Department Projection.B - Hissioi Projectionj
Source: Mission estimatas.

Table 5.13 COLOMBIA: PROJECTED NATIONAL GOVERNMENT OPERATIONS, 1975-1980
(In millions of Colombian pesos at current prices)
1975 ±/ 1976 1977 1978 1979 1980A B
I. Current Revenues 33,592 33,513 44,865 54,330 65,131 77,238 90,5551. Total revenue including
CATs and CDTs 35,425 35,346 45,810 55,483 66,561 79,026 92,790
a. Income and net wealth tax (13,350) (13,535) (16,892) (20,828) (25,369) (30,392) (35,771)b. Sales tax ( 6,385) ( 6,889) ( 8,597) (10,600) (12,911) (15,467) (18,205)c. Customs revenues ( 7,140) ( 6,559) ( 8,173) (10,419) (12,932) (15,777) (19,203)d. Other ( 8,550) ( 8,363) (12,148) (13,636) (15,349) (17,390) (19,611)
2. Less (-): Taxes paid throughredemption of CATs and CDTs - 1,823 - 1,833 - 945 - 1,153 - 1,430 - 1,788 - 2,235
II. Current Expenditures 21,700 22,900 28,874 34,531 40,269 46,345 52,6581. Personal services 11,410 11,410 13,758 16,275 18,929 21,616 24,254
a. Wages and salaries ( 8,620) ( 8,620) (10,344) (12,237) (14,232) (16,253) (18,236)b. Contributions to social
security institutions ( 2,790) ( 2,790) ( 3,414) ( 4,038) ( 4,697) ( 5,363) ( 6,018)2. Other goods and services 1,360 1,610 2,009 2,477 3,017 3,614 4,2543. Current transfers 6,530 7,480 10,348 12,639 14,776 17,129 19,682
a. To decentralized agencies ( 855) ( 1,230) ( 1,451) ( 1,683) ( 1,919) ( 2,149) ( 2,364)b. To departments and
municipalities ( 5,145) ( 5,720) ( 7,627) ( 9,236) (11,072) (13,130) (15,394)c. To private sector ( 365) ( 365) ( 1,080) ( 1,500) ( 1,530) ( 1,555) ( 1,585)d. To international agencies ( 165) ( 165) ( 190) ( 220) ( 255) ( 295) ( 339)
4. Interest payments 2,400 2,400 2,759 3,140 3,547 3,986 4,468a. Internal Debt ( 1,080) ( 1,080) ( 1,274) ( 1,478) ( 1,685) ( 1,887) ( 2,076)b. External debt ( 1,320) ( 1,320) ( 1,485) ( 1,662) ( 1,862) ( 2,099) ( 2,392)
III. Current Account Surplus 11,892 10,613 15,991 19,799 24,862 30,893 37,897
IV. Investment Expenditures 13,035 15,210 21.215 25,859 31,770 38,630 46,4081. Gross fixed investment 1,985 1,985 2,310 3,079 4,015 4,973 5,9272. Capital transfers 11,050 13,225 18,905 22,780 27,755 33,657 40,481
a. Decentralized agencies (10,300) (12,299) (17,582) (21,185) (25,812) (31,301) (37,647)b. Departments and municipalities ( 750) ( 926) ( 1,323) ( 1,595) ( 1,943) ( 2,356) ( 2,834)
V. Overall surplus/deficit (-) - 1,143 - - 5,224 - 6,060 - 6,908 - 7,737 - 8,511
1/ A - Planning Department Projection-B - Mission Projection.
Source: Mission estimates

TABLE 5.14 COLOZBIA: PROJECTED PUnLIC SECTOR FINANCES, 1975-1980 j /h I
(In millions of Colombian pesos at current prices)
1975 1976 1977 1978 1979 1980
Central GovernmentCurrent Revenues 38,748 51,116 61,700 73,720 87,101 101,705Current Expenditures 20,706 25,684 30,819 35,657 41,434 47,031Current Account Surplus 18,042 25,432 30,881 38,063 45,667 54,674
Decentralized AgenciesCurrent Revenues 20,256 24,376 31,463 39,296 48,075 55,783Current Expenditures 17,560 21,528 26,092 31,258 36,884 42,785Current Account Surplus j/ 2,696 2,848 5,371 8,038 11,191 12,998
DepartmentsCurrent Revenues 4,819 5,450 6,120 6,830 7,547 8,256Current Expenditures 6,180 7,132 8,159 9,260 10,399 11,543Current Account Surplus l/ -1,361 -1,682 -2,039 -2,430 -2,852 - 3,287
MunicipalitiesCurrent Revenues 7,373 8,273 9,216 10,202 11,192 12,166Current Expenditures 6,129 7,012 7,959 8,962 9,993 11,022Current Account Surplus -l 1,244 1,261 1,257' 1,240 1,199 1,144
Public SectorCurrent Revenues 71,196 89,215 108,499 130,048 153,915 177,910Current Expenditures 50,575 61,356 73,029 85,137 98,710 112,381Current Account Surplus - 20,621 27,859 35,470 44,9i1 55,205 65,529
1/ Before transfers.
Source: Mission estimates.

-/ er4,- r 2 7 e l- ".-7-'-
Table 5.15 - COLOKBIA: SECTORAL DISTRIBUTION OF PUBLIC GROSS FIXED INVESTME11T, 1970-80-
(Million of Col.$)
1970 1971 1972 1973 1974 1975 1976 1977 1978 1979Amount % Amount 7. Amount % Amount % Amount % Amount 7. hnount % Amount 7. Amount 7. Amount 7. Amour
.griculture 1,801 14.8 1,796 13.3 2,491 15.6 2,339 12.2 3,133 12.4 2,888 10.1 4,385 11.2 5,898 11.3 7,757 11.4 9,862 11.7 11,9!
:ndustry- / 718 5.9 905 6.7 814 5.1 1,515 7.9 1,870 7.4 2,145 7.5 2,936 7.5 3,967 7.6 5,648 8.3 7,502 8.9 9.lZ
lutrition & Health 1,144 9.4 837 6.2 1,182 7.4 1,035 5.4 1,945 7.7 2,717 9.5 3,563 9.1 4,854 9.3 6,532 9.6 8,429 10.0 10,44
later Supply & Sewerage 438 3.6 405 3.0 463 2.9 613 3.2 808 3.2 1,287 4.5 1,879 4.8 2,505 4.8 3,743 5.5 5,142 6.1 6,73
ower 450 3.7 675 5.0 655 4.1 1,419 7.4 2,148 8.5 2,688 9.4 3,367 8.6 4,489 8.6 5,988 8.8 7,586 9.0 9,14
elecommunications 182 1.5 148 1.1 144 0.9 441 2.3 632 2.5 715 2.5 940 2.4 1,253 2.4 1,701 2.5 2,023 2.4 2,31
ransportation 3,626 29.8 3,618 26.8 3,848 24.1 4,313 22.5 5,104 20.2 5,491 19.2 6,773 17.3 10,282 19.7 12,997 19.1 15,762 18.7 17,88
ducation 900 7.4 1,121 8.3 1,996 12.5 2,396 12.5 4,194 16.6 4,519 15.8 6,342 16.2 8,038 15.4 10,275 15.1 12,222 14.5 13,96
ourism 110 0.9 81 0.6 64 0.4 134 0.7 202 0.8 286 1.0 391 1.0 574 1.1 680 1.0 843 1.0 90
rban Development 743 6.1 756 5.6 1,229 7.7 1,879 9.8 2,299 9.1 2,545 8.9 3,719 9.5 4,906 9.4 6,601 9.7 8,766 10.4 11,05
entral Services 511 4.2 378 2.8 367 2.3 364 1.9 531 2.1 801 2.8 1,214 3.1 939 1.8 1,089 1.6 1,264 1.5 1,40
)ther3
/ 1.545 12,7; 2.781 20.6 2,714 17.0 2.722 14.2 2,400 9.5 2.517 8.8 3,641 9.3 4.489 8.6 5,035 7.4 4.889 5.8 5.52
12,168 100.0 13,501 100.0 15,967 100.0 19,170 100.0 25,266 100.0 28,599 100.0 39,150 100.0 52,194 100.0 68,046 100.0 84,290 100.0 100.45
I't5 for 1970-74 is actual; for 1975-80 is projected..'c d nufactulnto, mining and petroleum
.tes ?'blllc buildings, urban ,orks and roads, development studies, purchase of food by IDEMA.

T Table 6.1 - COLOMBIA: MONEY SUPPLY AND FINANCIAL SAVINGS
End of Period 1969 1970 1971 1972 1973 1974
In Million of Colombian Pesos
Money and quasi-money (M31 25,768 30,761 35,151 44,711 60,005 74,888
Money (M1) 18,414 21,603 23,951 29,807 38484 46,049
Currency 6,531 7,856 8,620 10,844 12,707 15,827Demand deposits 11,883 13,747 15,331 18,963 25,777 30,222
Quasi-monev 7,354 9,158 11,200 14.904 21,521 28,839
Savings deposits 2,892 3,681 4,303 5,973 8,192 9,524UPAC deposits - - - 184 4,649 8,274Certificates of deposit - - - - 9 2,469Bonds 4,122 5,125 6,451 7,761 7,643 7,892Deposits in foreign exchange 340 352 446 986 1,028 680
As Per tent of GDP
Money and quasi-money (M3) 23.2 23.6 22.9 24.1 24.8 23.4
Money (Ml) 16.6 16.5 15.6 16.1 15.9 14.4Quasi-money 6.6 7.0 7.3 8.0 8.9 9.0
1/ Provisional data.
Source: Banco de la Republica.

Table 6.2 - COLOMBIA: MONEY SUPPLY AND VELOCITY
1969 1970 1971 1972 1973 1974
In Millions of Colombian pesos
Money supply (average) 16,584 19,699 22,324 26,082 32,896 40,700Velocity 6.69 6.63 6.89 7.11 7.37 7.84K 0.149 0.151 0.145 0.141 0.136 0.128GDP deflator 100.0 110.3 123.1 132.2 168.2 208.6Nominal GDP 110,953 130,591 153,760 185,535 242,480 319,104
Annual Changes (in Der cent)
Money supplyAverage 16.7 18.8 13.3 16.8 26.1 23.7End of year 19.5 17.3 10.9 24.4 29.:L 19.7
Velocity -1.3 -0.9 3.9 3.2 3.7 6.4GDP deflator 8.2 10.3 11.6 12.3 21.? 24.0Real GDP 6.4 6.8 5.5 7.0 7.2 6.1
Sources: Ban2o de la Republica; and Fund staff estimates.

Table 6.3 - COLOMBIA: BASE MONEY, AND THE OPERATIONSOF THE MONETARY AUTHORITIES
(Changes in million of Colombian pesos)
1970 1971 1972 1973 1974
Currency in hands of public 1,325 764 2,224 1,863 3,120
Commercial bark reserves 780 622 1,157 3.949 1,618
Base money 2,105 1,386 3.3815,312 4,738
Net domestic asE ets of the
ironetary author its 1,131 1,044 2,056 6,794National Gcverrui!ent (net) - 257 1,563 518 - 489 2,280Other cfficial entitios (net) - 8 72 - 42 -81 40Credit to com=ercial banks 790 280 - 500 2,094 1,901Credit to specializer. banks 376 1,068 1,433 1,647 3,272
Agricultural Bank (67) (294) (199) (60) ('v)Mortgage Bank (--) (209) (-201) (11) (_'
Administered tnmds (111) (272) (1,032) (1,366) (3,0C3)Investmeint banks (198) (293) (403) (210) (171)
Pri.vate sector 726 -1,302 359 893 -1,376Coffee (366) (-683) (156) (235) (-,103)Other (360) (-619) (203) (658) (-273)
Import deposits -243 192 -286 -1,165 -173Medium-and long-term foreign
liabilities -233 -442 -452 -200 -306SDR allocation -370 -310 -429 __ _Open-market titles -- __ __ -- -143
Other (net) 350 -77 -743 -643 1,299
Net foreign assets 974 342 3,523 3,756 -2,C56
1/ Provisional data.
Source: Banco de la Republica.

Table 6.4 - COLONMBIA BOGOTA AND MiE,LIN STOCK EEHANGES, 1969-74&
1969 1970 1971 1972 1973 lW74
Total transactions (millions of~Colombian pesos) 8 1 524 2173 312 7 4Bogoth 1,304 1,416 1,104 1,527 2,252 3,307Medellin 504 557 420 646 985 1,510
Percentage of transactions(BogotYI) 100 100 1-00 100 100 100Banking and financial shares 20 18 17 9 11 9Industrial shares 44 39 30 20 22 15Bonds 12 21 14 16 18 29CATs and CDTM/ 23 21 38 55 49 47Other 1 1 1 -- -- --
Percentage change in prices(Bogota - end of year)Banking and financial, shares 12.4 12.3 -24.6 -16.i 11.1 -13.6Industrial shlares 40.7 12.7 -30.3 -2.7 12.8 -13.6Cost of living (national -
white collar) 8.5 7.2 12.6 14.1 22.1 25.2
Tax credit certificates granted by the Government for minor exports and tourist devel-opment projects.
Source: Banco de la Republica.

Table 6.5 - COLOMBIA: COMPOSITION AND GROWTHOF THE MONEY SlUPPLY, 1960-1974
(Millions of Pesos)
End Currency Total Perecentage Currency withof Currency with the Demand Money Increase Public as % of
Period Outstanding Public Deposits SupplyR/During Period Money Supply
1960 1,724 1,606 2,497 4,103 10.4 39.11961 1,983 1,846 3,267 5,112 24.6 36.11962 2,287 2,115 4,054 6,169 20.7 34.31963 2,743 2,537 4,386 6,923 12.2 36.61964 3,385 3,115 5,255 8.370 20.9 37.21965 3,872 3,595 6,085 9,680 15. 6 37.11966 4,358 4,104 6,931 11,035 14.0 37.21967 5,051 4,759 8,691 13,450 21.9 35.41968 5,898 5,548 9,887 15,435 14. 8 35.91969 7,015 6,531 11,883 18,414 19. 3 35.51970 8.357 7,856 13,747 21,603 17.3 :36.41971 9,137 8,620 15,331 23,951 10.9 36.01972 11,400 10,844 18,963 29,807 24.4 :36.41973 13,150 12,707 25,777 38,484 29.1 :33. 01974 16.533 15.827 30,222 46,049 19.7 34.4
1972-1 7,016 6,390 18,234 24,623 2.8 216.01972-Il 7,348 6,627 18,862 25,489 3.5 '26.01972-III 7,394 6,668 20,017 26, 685 4. 7 25. 01972-IV 11,400 10,844 18,963 29,807 11.7 36.4
1973-1 8,065 7,576 22,969 30,545 2.5 24.81973-11 8,811 8,284 24,238 32,522 6.5 25.51973-Il 8,250 7,691 26, 160 33,851 4. 1 22.71973-IV 13.150 12,707 25,777 38,484 13.7 33.0
1974-I 9,338 8,751 30,660 39,411 2.4 22.21974-Il 9,813 9,206 30,809 40,015 1.5 23.01974-Il 9,015 8,452 32,209 40,661 1.6 2C.81974-IV 16,533 15,827 30,222 46,049 13.3 .34.4
a/ Currency Outstanding less cash holdings of banks equals Currency with thePublic. Adding Demand Deposits to Currency with the Public gives TotalMoney Supply, defined to exclude deposits of the government and officialentities in the central bank.
Source: Banco de la Rep6iblica.

Table 6.6 - COLOMBIA: ANNUAL PERCENTAGE INCREASESIN GDP AND MONEY SUPPLY, 1965-74
R eal GDP Nominal Money MoneyYear GDP Deflator GDP Supply SuPplY
1965 3.6 9.1 13.1 15.6 15.1
1966 5.4 14.9 21.1 14.0 15.4
1967 4.2 8.3 12.9 21.9 17.0
1968 6.1 9.3 16.0 14.8 19.9
1969 6.4 8.2 15.1 19.3 16.4
1970 6.7 10.3 17.7 17.3 18.9
1971 5.5 11.2 17.7 10.9 13.4
1972 7.0 12.7 20.7 24.4 16.8
1973 7.2 21.9 30.7 29.1 26.1
1974 6.1 c/ 24. 0/ 31.6 / 19.7 23.7
a/ Year-end to year-end.
b/ Change in annual average computed from monthly data.
c/ Estimate.
Source: Banco de la Reptiblica

Table 6.7 - COLOMBIA: FINANCIAL SAVINGS, 1969-74
(End of Year Balances, Millions of Pesos)
1969 1970 1971 1972 1973 1974
Money 18,414 21,603 23,951 29,807 28,484 46,049
Cash in circulation 7,015 8,357 9,137 11,400 13,150 16,533Deposits in current accounts 11,883 13,747 15,331 18,963 25,777 30,222(less Cash held by banks 484 501 517 556 443 706
Quasi-money 7,354 9,158 11,200 14,904 21,521 28,839Time, savings and certificatesof deposit a/ 2,892 3,681 4,303 6,157 12,850 20,267
Bonds 4,122 5,125 6,451 7,761 7,643 7,892
Foreign exchange deposits a/ 340 352 446 986 1.028 680
Total liabilities of bankingsystem other than capital a 29,683 35,409. 40,86 51,122 68,929 86,129
Total liabilities of bankingsystem a/ including capital 33,694 40,787 47,805 58,416 77,718 97.914
GDP 110,953 130,591 153,766 185,535 242.4,o 319.017
As a percentage of GDP:Money 16.6 16,5 15.6 16.1 15.9 14.4Quasi-money 6.6 7.0 7.3 8.0 8.9 9.0
Total liabilities of bankingsystem other than capital 26.8 27.1 26.5 27.6 28.4 27.0
Total liabilities of bankingsystem including capital 30.4 31.2 31.1 31.5 32.1 30.7
a. Includes Commercial Banks, Agricultural Bank, Investment Banks, Mortgage Bank,Workers Savings Bank, and Savings and Loan Corporations.
Source: Banco de la Repilblica and Superintendencia Bancaria.

Table 6.8 - COLOMBIA: NEW COMMERCIAL BANK WOANS, BY QUARTER, 1965-74 A
(Millions of Pesos)
Agriculture
Coffee Other .b/ Total Livestock Commerce Industry Mining Construction Government Other Total
1965 197.4 539.9 737.3 743.3 2,672.6 2,781.2 42.6 308.3 122.2 572.9 7,980.41966 255.9 781.0 1,036.9 884.1 2,904.5 3,234.2 43.2 384.8 142.9 666.2 9,296.81967 277.0 899.8 1,176.8 1,001.7 3,261.8 3,958.3 67.7 465.9 246.8 868.3 U,046.71968 293.8 903.5 1,197.2 1,097.4 3,856.8 4,206.2 84.2 518.0 297.8 895.6 12,153.41969 337.6 991.7 1,329.3 1,226.4 4,333.2 4,604.6 46.3 466.4 609.7 1,016.8 13,632.71970 297.2 2,153.5 2,450.7 1,325.2 4,881.2 4,711.0 62.3 578.1 810.6 1,239.6 16,058.7
1971 I 58.9 1,077.6 1,136.5 291.6 1,237.0 964.1 24.2 157.2 137.6 419.3 4,367.5II 60.8 754.5 815.3 343.2 1,300.7 946.9 19.5 140.8 203.3 471.7 4,241.4III 72.0 1,118.3 1,190.3 351.2 1,626.6 1,111.2 26.5 154.1 122.4 550.3 5,132.6IV 41.9 775.6 817.5 373.2 1,781.1 1,014.2 23.3 173.8 243.3 743.7 5,070.1
233.6 3,726.0 3.959.6 1,35902 5.945.4 3.936.4 93.5 625.9 706.6 2,185.0 18.811.6
1972 I 62.6 1,387.4 1,450.0 298.0 1,474.3 1,124.6 13.4 223.3 189.3 1,163.0 5,935.8II 52.9 94605 999.4 365.3 1,939.5 962.5 31.2 209.5 360.1 701.7 5,569.2III 71.9 1,551.4 1,623.3 286.4 1,733.8 903.2 27.8 217.1 315.2 669.0 5,774.9IV 51.1 1,030.8 1,081.9 345.0 2.263.8 1,369.2 35.3 207.0 312.1 634.2 6.248.5
238.5 4,916.1 5,154.6 1,294.7 7,411.4 4,359.5 107.7 855.9 1,176.7 3,167,9 23,528.4
1973 I 85.4 416.9 502.3 436.0 2,716.7 1,587.0 27.4 276.6 329.0 717.2 6,592.2II 70.0 2,309.1 2,379.1 329,1 2,179.3 1,647.0 63.4 237.1 272.2 718.5 7,825.7III 119.9 1,796.8 1,916.7 339.9 2,390.1 2,651.9 45.1 259.6 295.6 735.3 8,634.2IV 128.6 1,230.1 1,358.7 295.1 3,494.3 2,434.2 33.5 304.7 1,287.1 667.2 9,874.8
403.9 5,752.9 6,156.8 1,400.1 10,780.4 8,320.1 169.4 1,078.0 2,183.9 2,838.2 32,926.9
1974 I 193.0 2,164.5 2,357.5 213.1 2,718.5 2,519.6 24,9 351.9 562.9 907.3 9,655.7
J Quarterly figures may not sum to annual totals because of rounding./ Includes warehouse bonds after second quarter of 1970.
Source: Banco de la Repdblica.

TabAlc 6.09 - COLOMBIA: COMMRICAL. BANKI LOANS, BY WtARTRR, 1968-1974 a
(Loans outstanding at end of quarter, Millions of Pesos)
AgricultureCoffee Other Ž1 Total Livestock Commerce Industry Mining Construction Governiment Other Total
1968 I 254.7 627.2P 881.9 1,221.7 2,151.9 2,444.0 50.4 381.3 277.5 769.5 8,178.2II 262.7 705.8 968.5 1,272.8 2,208.3 2,104.0 40.9 396.6 31-4.0 759.6 8,064.7
III 277.6 638.9 916.5 1,274.5 2,372.7 2,394.8 43.4 399.0 333.3 780.3 8,514.3IV 284.7 670.1 954.8 1,352.4 2,547.3 2,344.2 49.6 436.1 351.9 790.7 8,-826.9
1969 I 281.7 631.1 912.8 1,380.3 2,599.5 2,598.6 43.9 422.8 41-6.6 796.0 9,170.5II 296.0 666.0 962.0 1,448.4 2,607.5 2,468.3 41.4 419.7 469.0 804.0 9,220.4
III 327.1 686.1 1,013.2 1,510.7 2,588.8 2,699.7 44.8 432.2 497.7 842.8 9,630.6Iv 319.7 782.6 1,102.3 1,573.7 2,676.4 2,619.8 44.5 4.41.1 578.9 860.3 9,897.0
1970 I 310.7 667.1 977.8 1,567.8 2,646.8 2,953.6 45.9 446.9 673.? 875.0 10,186.8II 339.5 740.6 1,080.1 1,622.3 2,817.0 2,947.0 40.1 471.1 721.3 902.0 10,600.9
III 360.8 1,468.5 1,829.3 1,675.2 2,907.2 2,659.0 39.2 421.3 774.1 930.4 11,235.8IV 383.8 1,409.5 1,793.3 1,788.3 3,137.2 2,727.6 48.1 483.1 849.8 1,010.3 1-1,837.7
1971 I 362.6 1,629.6 1,992.2 1,811.6 3,147.3 2,796.3 54.4 459.9 872.8 1,098.8 12,9269.5
II 412.6 1,473.6 1,886.2 1,869.8 3,237.0 2,799.3 54.3 493.9 942.2 1,210.8 12.493.5III 460.6 1,1682.5 2,143.1 1,927.6 3,477.7 2,894.0 57.4 497.6 948.4 1,340.3 13.286.2
IV 485.3 1,635.4 2,120.7 1,999.9 3,657.9 2,355.5 60.1 519.1 701.3 2,396.1 13.810.6
1972 I 476.0 1,981.5 2,457.5 2,004.8 3,431.6 2,925.6 45.7 557.1 1,034.2 2,242 460.II 497.5 1,774.9 2,272.4 2,055.0 3,699.1 3,015.1 61.2 6034.4 1,195.9 2,1254.5 15.156.6
III 526.5 2,168.1 2,694.6 2,035.5 3,613.6 2,946.0 58.4 620.3 1,306.0 2,337.6 15.612.0
IV 543.2 2,036.2 2,579.4 2,065.5 3,949.0 3,310.5 76.6 644.6 1,436.2, 23,166.6 1.2-
1973 I 188.2 2,678.1 2,886.3 2,096.1 4,215.0 3,583.3 59.8 663.0 1,513.0 1,701.8 16.698.3II 200.8 2,327.3 2,528.1 2,069.9 4,070.4 3,907.3 7t7.0o 662.8 1,531.6 2,004.9 16.852.0III 247.2 2,720.9 2,698.1 2,073.8 4,276.9 5,174.8 90.6 674.0 1,536.4 1,870.3 18,691.9
IV 318.4 2,683.9 3,002.3 2,026.6 4,807.3 5,983.2 96. 5 753.9 2,545.2 1,944.? 21,159.2
1974 I 367.6 3,064.2 3,431.8 1,871.2 5,078.7 6,396.0 93.5 802.4 2,608.5 2,178.8 22,532.9
a/ Figures may not add to row totals because of roundings
~/Includes warehouse bonds.
Source: Banco de la Rep&blica

Table 6-10 - COLOMBIA: BANKING SYSTEM LOANS, BY QUARTER 1968-1974 -/
(Loans outstanding at end of quarter, millions of pesos)
Commercial Bank Loans Total Banking System Loans
Short . Medium Long Total Short Mediium Long LI Total
1968 I 6,023.8 1L, A37.2 717.? 8,i78.? 7,261.6 2,940.2 3,004.8 13,206.6II 5,858.5 1,486.7 /19.5 8,0 W, 7,143.8 3,120.1 3,125.9 13,389.8
III 6, 279.4 1,463.0 7/1 9 8,1;14,3 7,813.7 3,277.5 3,331.5 14,222.7
IV 6,491.4 1,503.8 8)L.'i 8, 82V6, 8,090.1 3,500.2 3,578.6 15,168.9
1969 T 6,708tl 1,558.3 9,-170h.' 8,398.4 3,725.8 3,831.5 15,965.71 (6,956.3 1, 5284 U) , I/ 9, ".1 ,l 8,337.6 3,912.0 4,138.8 16,388.4HITL 6,9iS*2 1,61/1-4 .t, :)j,./ 92KJ' (\vs 8,851.9 4,164.3 4,492.7 17,508.8IV 6, 9860. 3 1,685.5 1' ! 9, L19K1 9 8,885.3 4,3'-'5.0 4,932.9 18,197.2
1970 i 7,V0'8.5 1,714,? I i' 1018CA 9,054.7 4,629.3 5,81.1 18,965.1*1 7, 5.J0.1 1,741.i' 1vr 1 i0j(R 9 9,315.1 /4,730.8 5,703.8 19,469.7
)11 8,173.1 1,677.1 3 i;( 11)'> V10,100.4 4,819.0 6,198.8 21,118.2V 8, 490.4 9 1,752.5 1, /'-,. 1-1,e, 8 10,518.7 5,0701.t5 6,916.7 22,505.9
1971 1 P,7(1 5,5 1,7711.9 1 I 12?,(t') 10,715.4 5,240.9 7,650.1 23,606.411 8,83u.8 1,909.7 1 0 12,49g. 5 10,811.4 5,505.8 8,264.1 24,581.3
T11 9,44(1,7 2,041,1 1,8o:le_ 13,286.2 11,676.6 5,840.8 9,023.5 26,540.9IV 9,81,4.1 2,078.6 1,887/.8 13,810.5 12,187.4 6,045.0 9,739.5 29,413.5
1972 1 10,578.1 2,107.6 2,005 .:t 14,680,8 13,062.3 6,044.7 10,306.5 29,413.5Il 10,836.9 ,21,4.1 2,105.t, 1 5,"I.J*5 13,276.9 6,362.4 10,880.4 30,519.7
III 11,106,3 2,310.6 2 ,)95.- 15,62." t 13,760.8 6,513.2 11,427.8 31,701.8lV 11,559.7 2,338.9 2,392. 6 16 ,2'<83 14,169.5 6,598.4 12,043.4 32,811.3
1973 I 12,067.6 2,409.3 2,221.2 16,698.1 14,704.5 6,720.7 12,361.6 33,786.8II 12,075.6 2,476.4 2,299.7 16,851.7 14,770.5 6,884.6 12,905.6 34.560.7
III 13,804.5 2,514.4 2,372.8 18,691.7 16,858.2 7,092.7 13,328.3 37,219.2IV 15,876.7 2,688.4 2,604.2 21,169.3 18,944.7 7,247.4 13,866.8 40,058.8
1974 I 17,103.0 2,521.3 2,908.9 22,532.2 20,323.6 7,076.9 14,282.0 41,682.4II 17,406.4 2,734.4 3,498.8 23,639.7 20,637.0 7,223.2 14,981.8 42,842.0
a/ Figures may not add to row totals because of rounding./ Includes Popular Bank and Livestock Bank.
j Includes Commercial Banks, Mortgage Banks and Agricultural Credit Bank./ Less than one year.
i One to five years./ More than five years.
Source: Banco de la Repuiblica.

Table 6.11- COLOMBIA: SUMMARY ACCOUNTS OF THE BANKING SYSTEM
(In Millions of Colombian Pesos)
-E------------------------------------------------ End of Year-------------------_____-_-____- _-___- ____-__-_-____ _ ~~~~~~~~~~~~~~~~6/Rev.
1969-1/ 1 9 70-'-/ 19 02/ 4/ 5/~3/ 419691' 1970k' 19702/ 19711/ 19712/ 1971'/ 1972-/ 1972-/ 1 9 7 3 -/ L973-'
Foreign assets (net) -1,564 - 1,642 -l,745 -3,795 -4,134 -4,134 -242 -264 5,017 5,405
Assets 4,634 4,640 4,877 4,989 5,433 5,433 8,149 8,897 12,757 13,743Liabilities (-) -6,198 -6,282 -6,622 -8,784 -9,567 -9,567 -8,391 -9,161 -7,740 -8,338
Domestic credit (net) 36.579 45,033 45,231 53,706 54,303 54,951 63, 335 63. 828 78,136 78,081
National Governm,eot (ret) 4,655 4,569 4,439 6,068 5,892 6,968 7,558 7,001 6,947 6,260Credit (6,159) (6,163) (6,078) (7,516) (7,393) (8,469) (9,333) (8,825) (9,000) (8,421)Deposits (-1,504) (-1,594) (-1,639) (-1,448) (-1 ,501) (-1,501) (-1,775) (-1,824) (-2.053 (-2,16/)
Other official enaLt M s (net) 1,139 1,178 1,178 716 716 203 -108 -108 -49 -49Credit (2,069) (2,747) (2 747) (3,025) (3,025) (2,512) (3,037) (3,037) (4,717) (4,717)Deposits (-93(0) (-1,569) (-1,569) (-2,309) (-2,309) (-2,309) (-3,145) (-3,145) (-4,766) (-4,7ff6)
Private sector 3o0,721 39,669 40,025 47,239 47,998 47,132 55,725 56,579 71,258 71,913Coffee (1,543) (2,502) (2,502) (1,965) (1,965) (1,965) (2,087) (2,087) (2, ,00) (2,5l00)Other (29,178) (37,167) (37,523) (45,274) (46,033) (45,167) (53,638) (54,492) (68,758) (69,4:3)
Counterpart Jh\pds -5,71,1 e1,353 -1,353 -1,439 -1,439 -1,439 -1,409 -1,409 -1,494 -1,494Unclassified arec$ (,wt) 1,304 955 885 1,082 937 1,128 707 713 856 870Interbank float 21 15 57 40 199 959 862 1,052 618 581
Medium- and long-tern foreign liabilities 1.321 2252 230 2812 2 70 _ 2,97 30 826 4 4,135 4 58
Liabilities to private sector 32,601 39,534 39, 552 44,968 45.005 45,653 56,531 56.671 75,898 76,008
Money 18,414 21,603 21,603 23,951 23,951 23,952 29,807 29,807 38,484 38,484Currency (6,531) (7,856) (7,856) (8,620) (8,620) (8,620) (10,844) (10,844) (12.707) (12,707)Sight deposits (11,883) (13,747) (13,747) (15,331) (15,331) (15,331) (18,963) (18,963) (25,777) (25,777)
Quasi-money 7,354 9,140 9,158 11,163 11,200 11,200 14,821 14,904 21,521 21,600Time, savings, and certificates of depusits (2,892) (3,681) (3,681) (4,303) (4,303) (4,303) (6,157) (6,157) (12,850) (12,850)Bonds (4,122) (5,125) (5,125) (6,451) (6,451) (6,451) (7,761) (7,761) (7,643) (7,643)Deposits in foreign exchange (540) (334) (352) (409) (446) (446) (903) (986) (1,028) (1,107)
Private bank capital and surplus 2,918 4,143 4,143 4,847 4,847 4,847 5,749 5,749 6,969 6,969Import deposits 2,159 2,402 2,402 2,210 2,210 2,210 2,496 2,496 3,661 3,661Other peso deposits 1,756 2,246 2,246 2,797 2,797 3,445 3,658 3,715 5,263 5,294
SDR allocation __ 370 389 699 762 762 1,191 1,300 1,30 1,30
Official bank capital and surplus 1,093 1,235 1.235 1,432 1,432 1.432 1,545 1,545 1,820 1,820
I/ Accounts denominated in foreign exchange are valued at a rate of Col$17.60 per U.S. dollar.2/ Accounts denominated in foreign exchange are valued at a rate of Col$18.50 per U.S. dollar.3/ Accounts denominated in foreign exchange are valued at a rate of Col$20,15 per U.S. dollar.4/ Accounts denominated in foreign exchange are valued at a rate of Col$22.00 per U.S. dollar,5/ Accounts denominated in foreign exchange are valued at a rate of Col$23.70 per U,S. dollar,6/ Because of a reclassification of the accounts of the Banco de la Republica in 1972, revised accounts for 1971 are included for comparison with those of 1972 and 1973.7/ Provisional data.
Source: Banco de la Republica.

Table 6.12 - COLOMBIA: THE MONEY SUPPLY AND THE MONEY MULTIPLIERS
1969 1970 1971 1972 1973 1974
In Millions of Colombian Pesos
Private sector monetary holdingsCurrency in hands of public 6,531 7,586 8,620 10,844 12,707 15,827Demand deposits 11,883 13,747 15,331 18,963 25,777 30,222Money (M1) 18,414 21,603 23,951 29,807 38,484 46,049Quasi-money 7,354 9,158 11,200 14,904 21,521 28,839Money and quasi-money (M3) 25,768 30,761 35,151 44,711 60,005 74,888
Actual reserves hold by commercial banks 4,524 5,309 5,953 7,137 11,086 12,704
Base money (currency in hands of public plusactual reserves held by commercial banks) 11,055 13,165 14,573 17,981 23,793 28,531
Money Multiplier Ratios
Money multipliersRatio of M1 to base money 1.666 1.641 1.644 1.658 1.617 1.614Ratio of M3 to base money 2.331 2.337 2.412 2.487 2.522 2.625
Ratios affecting money multiplierBank behaviorRatio of required reserves to total deposits 0.413 0.336 0.282 0.294 0.341 0.283Ratio of actual reserves to total deposits 0.400 0.336 0.282 0.298 0.338 0.301
Private sector behaviorRatio of currency to M1 0.355 0.364 0.360 0.364 0.330 0.344Ratio of M1 to M3 0.715 0.702 0.681 0.667 0.641 0.615
1/ Provisional data.
Sources Banco de la Republica.

Table 6.13 - COLOMSIA: DESCRIPTION OF THE ADMINISTERED FUNDS
Size of Fund o Msxiim &aturityDec. 31, 197i 1 Anwual Interest Terd of loans
Xnanguration (milions of Rate on Leans Rediscount Rae (in numbersFunds D Lte Colbian pesos) Oridn of Funds' Resources Destination of Funds' Resources (in per cent) (in soer ntt)e of vears)
Agricultural Financing march 1979' 3,436 Placement of Agricultural develowaent titles Provides financing for the agricul- 15 12.5-13 1-15Fund (PFAP) within the banking system; rediscount facility tural and livestock sector
within the Banco de la Repdblica; and loanscontracted by the Government for the FFAP.
savings snd Loan May 1972 2,003 Placement of three-month credit titled with Functions as a qsai-central bank to 8-4' 7-81J 3 and 15Fund (FAVI) the Savings and Loan Corporations and line the Savings and Loan Corporations,
of credit with the Banco de la Republica. providing them with credit whenresource deficiencies eLrise
Publi Works Fund Decesber 1971 363 line of credit frm the Ranco de la Repdblica Provides loans for contractors of 14 11 5(FCOB) pablic works to finance working
capital requirements and importsof machinery; Fund expires inAugust 1979.
Industrial Financing August 1971 861 Placement of external debt titles, the a. Provides financing for small and a. 18-24 a. 14-21 a. 5FUnd (m) transfer of counterpart funds from the medium-size mining and manufactur-
Government generated by U.S. AID loans ing industries, subject to the con-and transfer of required reserves of the dition that 30 per cent of productionextra-bank market is devoted to exports
b. Provides financing for the sale of b. 20-21 b. 17-18 b. 7capital goods to the public sector
c. Provides financing for nonprofit c. 16 . 14 c. 5
foundations and corporations
Urban Development November 1968 664 Placement of urban development titles and Provides financing to municipalities 14-15 12-13 10Fund (FDU) transfers from the Government for urban development projects
Export Promotion March 1967 2,340 Direct lines of credit and rediscounting a. Provides financing to exporters a. 18 a. 10 a. I and 1Fund (PIKOMO) facilities in the Banco de la Repirblica, for working capital
as well as earmarked funds from import b. Provides financing of export sales b. 18 b. 10 b. 10surcharge by discounting letters of credit
and other documents, as well asloans for promotion purposes andmarket studies
Private Investment February 1963 1,798 Loans from international agencies, transfers Finances investment projects aimed at 20-26 17-23 10Fund (FIP) from the Government, and reinvested profits import substitution and export diversi-
from own operation fication as well as ANCOM multinationalcorporations operating within Colombia
1/ Includes available resources plus lines of credit extended from the Banco de la Repdblica; in the case of FAVI, includes required re_erves of CAVs totaling Col$541 million at the end of 1974.In March 1973, the FFA, which was originally set up in May 1966, vas reorganized.
1' Subject to full monetary correction for changes in the national cost of living indices, up to a rnximum 20 per cent ceiline,.
Source: Banco de Ie Republics.

Table 7.1 - COLOMBIA: PRODUCTION OF PRINCIPAL CROPS
000 Metric tons. )
1962-64 1966-68 1974 1975AV. Av. 1970 1971 1972 1973 (Prelimi (Program)
nary)
CEREALSRice (Paddy) 582 707 702 852 997 1.151 1.540 1.707Barley 113 88 87 107 98 82 94 123Wheat 112 110 54 53 69 72 59 81Corn 831 862 877 818 806 739 792 801Sorghum 27 87 118 240 210 280 337 350
COTTON AND OILSEEDSSeed cotton 190 241 376 322 412 335 420 496Soybeans 28 78 132 101 105 97 114 167Sesame 34 28 18 31 28 18 17 23African palm oil 27 36 41 44 51 60
OTHER EXPORT CROPSCoffee 450 h74H 492 462 420 510 468 510Sugar 399 599 672 744 824 810 897 976Bananos 1/ 553 752 335 351 282 301 410 658Tobacco 40 40 42 39 36 40 53 58Caraotas - - 8 13 18 9 16 52
OTHER FOODCROPSYuca 760 859 1.200 1.240 1.280 1.450 1.320 1.395Potatoes 770 820 913 825 782 983 903 972P1atano 1.315 1.538 1.690 n.a. n.a n.a. n.a. -
Panela 643 677 444 457 508 524 557 637Beans (common) 44 38 39 36 43 48 52 58Cacao 16 18 18 19 20 22 23 25
1/ Series may not be comparable between the 1960's and 1970's.
Source: OPSA, Ministerio de Agricultura, Calendar year data before 1970; crop year thereafter.
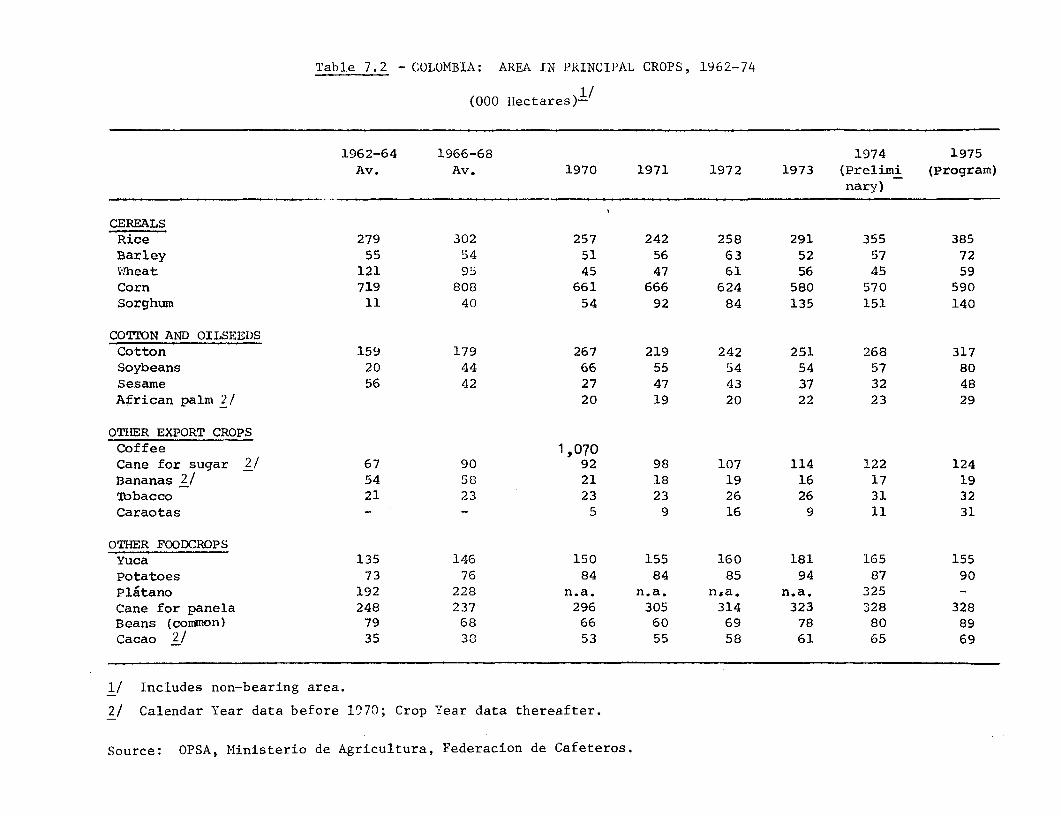
Table 7.2 - COLOMBIA: AREA IN PRINCIPAL CROPS, 1962-74
(000 llectares)l/
1962-64 1966-68 1974 1975Av. Av. 1970 1971 1972 1973 (Prelimi (Program)
nary)
CEREALSRice 279 302 257 242 258 291 355 385Barley 55 54 51 56 63 52 57 72Wheat 121 95 45 47 61 56 45 59Corn 719 808 661 666 624 580 570 590Sorghum 11 40 54 92 84 135 151 140
COTION AND OILSEEDSCotton 159 179 267 219 242 251 268 317Soybeans 20 44 66 55 54 54 57 80Sesame 56 42 27 47 43 37 32 48African palm 2/ 20 19 20 22 23 29
OTHER EXPORT CROPSCoffee 1,070Cane for sugar 2/ 67 90 92 98 107 114 122 124Bananas 2/ 54 58 21 18 19 16 17 19Tbbacco 21 23 23 23 26 26 31 32Caraotas - - 5 9 16 9 11 31
OTHER FOODCROPSYuca 135 146 150 155 160 181 165 155Potatoes 73 76 84 84 85 94 87 90Platano 192 228 n.a. n.a. n,a. n.a. 325 -Cane for panela 248 237 296 305 314 323 328 328Beans (comon) 79 68 66 60 69 78 80 89Cacao 2/ 35 38 53 55 58 61 65 69
1/ Includes non-bearing area.
2/ Calendar Year data before l1070; Crop Year data thereafter.
Source: OPSA, Ministerio de Agricultura, Federacion de Cafeteros.

Table 7.3 - COIOMBIA: CROP YIELDS PER HECTARE, 1962-74
(Metric tons/ha)
1962-64 1966-68 1974 1975Av. Av. 1970 1971 1972 1973 (Prelimi- (Program)
nary)
CEREALSRice (paddy) 2.1 2.3 2.7 3.5 3.9 4.0 4.3 4.4Barley 2.1 1.6 1.7 1.9 1.5 1.6 1.7 1.7Wheat 0.9 1.2 1.2 1.1 1.1 1.3 1.3 1.4Corn 1.1 1.1 1.3 1.2 1.3 1.3 1.4 1.4Sorghum 2.4 2.2 2.2 2.6 2.5 2.1 2.2 2.5
COTTON AND OILSEEDSCotton 1.2 1.3 1.4 1.5 1.7 1.3 1.6 1.6Soybeans 1.4 1.8 2.0 1.8 1.9 1.8 2.0 2.1Sesame 0.6 0.7 0.65 0.67 0.66 0.49 0.53 0.49African palm oil 1/ 2/ 2/ 1.3 1.9 2.1 2.0 2.2 2.1
OTHER EXPORT CROPS
Sugar 1/ 6.0 6.7 7.3 7.6 7.7 7.1 7.4 7.9Bananas 1/ 10.2 13.0 16.0 19.5 15.2 18.5 23.8 34.6Tobacco 1.9 1.8 1.8 1.7 1.4 1.5 1.7 1.8Caraotas - - 1.8 1.5 1.2 1.1 1.5 1.7
OTHER FOODCROPSYuca 5.6 5.9 8.0 8.0 8.0 8.0 8.0 9.0Potatoes 10.5 10.8 10.9 9.8 9.2 10.4 10.3 10.8Platano 6.8 6.7 n.a. n.a. n.a. n.a. n.a. -Panela 3/ 2.6 2.9 1.5 1.5 1.6 1.6 1.7 1.9Beans (common) 0.56 0.56 0.58 0.59 0.62 0.61 0.64 0.65Cacao 0.46 0.47 0.35 0.35 0.35 0.36 0.35 0.41
1/ Yield per planted-acre including non-bearing.2/ Plantations mainly in non-bearing stage.3/ Series subject to revision.
Source: Calculated from data in tables 7.1 and 7.2.

Table 7.4.- COLOMBIA: CATTLE POPULATION AND EXTRACTION, 1963-74
197419b3 1967 1970 1971 1972 1973 (Prelimi
nary)
CAITLE ON HAND, JAN 1 (million Head)=ales 6.5 6.8 7.0 7.3
Females 13.7 14.2 14.7 15.3Total 16.2 18.1 20.2 21.0 21.7 22.6 23.9
BIRTHS (Million Head) 4.1 4.6 4.7 4.6
DEATHS (Million Head) 0.8 0.8 0.9 0.9
EXTRACTIONRegistered slaughters - males (mi-
llion Head) 1.4 1.5 1.4 1.2 1.2Ferales (million Head) 1.0 1.1 1.0 0.7 0.7
Subtotal 2.0 1.8 2.4 2.6 2.5 1.9 1.9
Registered exports (million Head) /1 /1 0.1 0.1 0.1 /1 0.1
Unregistered extraction (million -Head) 0.3 0.4 0.3 0.3 0.4 0.4 0.5
Total 2.4 2.2 2.8 3.0 2.9 2.4 2.5
Rate (Percent) 15 12 14 14 13 11 11
Source: OPSA, Ministerio de Agricultura.

Table 7.5 - COLOMIBIA: GROSS VALUE OF AGRICULTURAL PRODJJCTION,
IN CONST.NT 1958 PRICEs, 1950-74
(Millions of pesos)
Year Crops Livestock Other Total
1950 3,340.7 2,167.8 771.3 6,279.8
1951 3,790.8 1,881.6 654.0 6,326.4
1952 4,107.8 1,930.7 711.3 6,749.8
1953 4,170.8 1,924.3 664.4 6,759.5
1954 4,230.3 1,980.4 757.9 6,968.6
1955 4,171.4 2,220., 770.9 7,162.8
1956 4,288.8 2,336.2 742.9 7,367.9
1957 4,581.0 2,440.4 760.1 7,781.5
1958 4,789.8 2,510.7 745.4 8,045.9
1959 5,143.5 2,560.9 750.7 8,455.1
1960 4,990.2 2,703.0 801.4 8,494.6
1961 5,159.2 2,762.0 895.9 8,817.1
1962 5,350.5 2,918.7 871.3 9,140.5
1963 5,220.5 3,134.3 799.1 9,153.9
1964 5,629.2 3,187.7 861.1 9,678.0
1965 5,574.7 3,198.9 921.4 9,695.0
1966 5,830.3 3.207.2 1,008.2 10,045.7
1967 6,237.6 3,417.0 1,113.5 10,768.1
1968 6,7140.0 3,580.5 1,181.9 11,502.4
1969 6,821.1 3,821.2 1,216.4 11,855.7
1970 7,130.4 4,020.6 1,308.9 12,459.9
1971 7,104.1 4,319.4 1,341.6 12,765.1
1972 7,548.8 4,529.2 1,382.3 13,460.3
1973 7,851.4 4,747.4 1,472.8 14,071.61974 8,306.8 1/ 4,904.1 a/ na na.
1/ Preliminary.Source: Banco de la Republica.

Table 7,6 - COLOCBIA: INDICFU OF PHYSICAL VOLUIE OF
AGRICULTURAL PRODUCTION, 195O-?w
(1958 1030.0)
Ui2l CofeeYear Crops Only .Livestock Other Total
19g0 69.7 70.0 86.3 10365 78.0
1951 79.1 76.7 74.9 87.7 78.6
1`>2 85.8 8 .6 76.9 95.4 83.9
1953 87.1 86.o 76.6 89.2 84.0
i954 88.3 84.5 78.9 101.7 86.6
95 85 7. 7- .0 88.4 1J334 89.0
1956 89.5 83.6 93.1 99,7 91.6
1937 >93.6 99.1 97.2 102.0 96.7
19D8 ;100,0 100.0 100.0 100.0 100.0
1959 107. L 1052. 102.0 100 7 105.1
1960 104.2 95.5 107.7 1075 lo05.6
19J1 1 -0't IC 10.o0 110.0 12032 109.6
1t962 1 ' 7 99.6 116.2 11 e.9 113.6
1553 0o.6 99.9 124.8 109.7 1131.7
'964 11-,7-5 1066 127.0 115.5 120.3
1965 116.4 100.8 127.4 123.6 12065
7i96_ 17 -104,1 127.7 135.3 124.9
19r67 130.2 98.6 136.1 14.4 133.8
1i968 140,7 102.4 142.6 15.6 i43.0
1969 1 °2 < 102. 4 1 2.2 263.2 147.4
1970 148.9 102.4 160.1 15.6 154.9
197: I48.3 96.;7 172.0 180.0 158.7
'972 167,6 102.6 180.4 185.4 167.3
973 16-.9 112.9 189.1 197.6 174.91974 173.4 n.a. 195.4 nDa. n.a.
a/ Gross Value of Production at 1958 urit prices,
Source: Banco de la Republica

Table 7.7 - COLCBIA: AGRIIC Z>JR.2M '3?SS VAL;i? ALZD I, CONSTAC11
PIUCA'S 19 .53 7_-, 4.ik
tv ar.ket P=ces, ",-'lliuns of' 21e.Ss)
Year Crops Livestock Other Total
1950 3,130.0 1,539.6 583.7 D1,553.3
1951
1953 3,•. 5 5,227.2
1955 3, o558 .1 > E< 5-;; L 8- ' 3 ,2{
1956 5`5 ; 79
1957 1-1. R, - , 2__.2
1959 4,760.8 2,174.2 569.8 7 904.8
1960 4>, C. , .8 50. 7 -512.
1961 4,790.3 274.9 672.4 -37.6
1962 534G , 2. 7
1963 4,826.2 z 14 . 7 07.3
1964 5,2C8.0 .7)07.3 62. 3,564.0
196• , 1._. >5596
1966 1:374. 7 C22.2 54 3,2
1967 5y 96.: 1 ,779-. 5Ž2
1968 ,2? 05-2 .67
1969 6,141.8 9). 23.7 10,249.5
1970 6 >z, 356 -
1971 , 53621.C : _C>
1972 6f.76Q,3 3 3,796.2 3 0O0. 11,562.06
1973 9 .5, 2, 12 0 3
1974 7 4,38 J7 7j O . i / n 0 ao
1/ Preliminary.
Source: Banco de la Republica

Table 78 -COLO0MBIA: PR12E bk1ATC1S FCR AGR:T-L77RE) ICNON-AGPICU?LTlRE,
- 195 C -=z,100) ,
Agrin uiiure Non- Total
Year Crops Livestock Total Azri,-uLture GDP
1950 51.3 49.3 50.8 55.1 5a.D1951 59.2 51.14 57.1 ( 51.01952 56.6 59.S 57.8 c1.c ,9.91953 61.2 64. X 62.5 d3. 62 . 31954 77.1 72.1 75.0 6?.2 69.91955 69.0 75.7 71.4 69.1 69.81956 83.0 74.6 79.9 73.0 75.31957 97.3 85.8 92.9 5. 88.21958 100.0 100.0 100.0 1i00.3 1030.01959 96.8 119.3 104.4 10.8 -106.61960 102.5 132.5 112.9 117. 3115.71961 112.7 133.4 120.6 127.3 125.21962 114.4 16. 2 124.2 137.3 133.51963 148.6 153.0 152.7 169.7 164.51964 197.8 179.9 192.4 190.9 191.141965 195.7 209.4 203.8 211.0 208.91966 220.2 249.1 232.5 2)3.2 240.11967 228.8 2<>.9 247.7 2(>.1 260.11968 252.7 2cc;.6 268.3 291.1 29-4.41969 274.8 3C^.2 290.6 31_. 307.71970 298.1 ,<4 316.2 339.31971 333.3 3 -3 356. .v
1972 392.1 416.2 426.S1973 518.5 .w, 537.6 14.3 520.3
Source: Banco de la Republica.

Tablce 7.9 - COIfLOMBIA: NEW LOANS EXTrDZ 1N THE AGRICUZOTU?.L SZOTO., 1969-74(1tlions of Pesos)
.LS~ ~~~~~~~~~Q , 97 tat ar.a Sub Sector '9 ? 1971 273 197
4aria
2S z,-t - 1 2 210a/L4 ss6ock c0 697 6)46 1%,097 I.,2 60oa/
-mn - i:k> -i
3~ 12 1,286 1,482 1,822 2532 6531 : 1 05tt 1,382 2,262 1,365 283-/
r.18q 8 ; 52 9 7 17334/
TOTAL 5-8__ 5685 6521 0 964
ad zr ar -y a Junre, at approximately haLI ^I ae l' 1ee1V
-b/f Includes 3anco Popular and Banco Ganadero.
aI PartiaL figure .
'>irc3sa Caja Agraria, Bano de la Republica, INCCRA

Table 710 C COLOM3TA: ESTIMIATCRO FAM PRICES AND SUPPORT PRICES FOR PRINCTPAL COMMODITIES, 1950-1974 --
1950 1955 1960 1965 1970 1971 1972 1973 1974_(Pesos mer metric ton) _______________________________
(kern - farm 290 300 474 903 1,490 1,696 2,170 3,329- support (yellow corn) 925 1,350 1,600 1,760 - 1,900 2,400 - 2,900 3,300 - 3,900 M/
Grain Sorghum - farm 369 857 1,592 1,885 2,057 3,000 S2/- support 700 1,170 1,200 1,260 - 1,550 2,080 - 2,400 3,000 - 3,600
Rice (paddy)- farm 350 475 883 1,703 1,850 1,931 1,882 2,514- support (Type 1-L/3) 1,090 1,600 1,990 1,990 2,270 - 2,490 3,194 - 4,400
Wheat - farm 610 650 880 1,525 1,933 1,933 2,514 2,795- support 1,429 2,100 2,100 2,400 - 2,700 3,200 - 3,520 5,000 - 5,980
Barley - farm 300 400 624 999 1,592 1,885 2,052 3,019- support 2,000 2,150 2,150 - 2,300 2,550 - 3,000 4,000 - 5,000
Soybeans - farm 800 1,700 2,945 3,050 3,202 5,950 .2- support 1,460 2,000 2,600 2,600 - 2,800 3,000 - 4,000 7,000
Tobacco - farm 1,290 1,360 1,989 4,858 5,897 7,267 8,300 15,245
Sesame - farm 588 686 1,519 3,283 4,799 4,901 5,219 6,109- support 2,100 3,700 4,000 4,700 - 5,000 5,300 - 6,100 9,500 - 11,700
Beans - farm 1,180 1,070 2,000 3,477 4,774 8,259 8,251 8,251- support (Type IT/1) 4,500 4,500 5,835 - 7,240 9,200 11,500 - 14,500
Seed Cotton - farm 807 858 1,726 3,506 3,929 4,687 5,114 8,808
Banana - farm 120 150 306 653 905 964 1,000 1,000 S/- farm (export) 1,266 1,266 1,416 1,508
Cacao - farm 2,150 2,700 5,759 7,179 14,613 13,926 14,409 19,524
Coffee - farm 1,476 2,472 3,105 5,004 9,886 9,618 11,571 15,497
Potatoes - farm 337 211 350 612 1,045 1,042 1,447 2,047
Yuca - farm 110 193 303 658 891 1,361 1,467 1,467Platano - farm 128 185 224 698 762 1,033 1,228 1,362
Onions - fam 2,286 2,671 2,601 3,404
Cans for Sugar - farm 7 12 30 63 93 97 116 135
Panela - farm 184 217 392 885 1,487 1,384 2,243 n.a.
i Support prices are shown by semesters from 1972 - 1974, but the applicable time period does not wholly correspond to the year for whichfarm prices are shown and interim adjustments alri sonetimes made. Also the farm prices represent the entire crop whereas the rupport pricesapply for designated categories or grades at specified buying points.
b/ The price of 3,900 pesos applier at IflEMA1s agencieo ~ard silos,but at buying stations in field the support price is 3,700 pesosa
oI Estimates of OPSA.
Farm priees. from Banco Pe OZ Rep,1 sfilea ex -;. ,. noted. Suppart prices are from IDEMA, as sapplied by OPSA.

Table 7.11 - COIOMBIA: FERTILIZER PROIDUCTION AND PLANT NUTRIENT SUPPLY 1970-75
1970 1971 1972 1973 1974 1975
Prel. Proj.(Thousand metric tons)
NATIONAL FERTILIZER PRODUCTIONMixed 221 264 284 353 410 440Nitrogenous (mainly urea &
ammonium nitrate) 102 109 112 110 114 130Phosphates (mainly Escorias Thomas) 524 58 42 70 780Others £3 3 3 5 )0
Subtotal 379 434 441 536 600 650
IMPORTS FOR DIRECT APPLICATIONMixed - 15 27 76 20Urea 5 19 71 128 130
Total Supply 354 468 540 740 750 801
NUTRIENT SUPPLYNitrogen (N) 64 78 113 154 1642/ 193Phosphorus (P205 ) 48 65 7 8$ 84e/ 83Potassium (K) 32 4157 8Q
IMPORTED NUTRIENTS AS PERCENTOF TOTAL SUPPLY (Percent)Nitrogen (N) 45 58Phosphorus (P205) 88 87
Potassium (K) 100 100Weighted All 68 75
I/The difference between total national production and projected use could besupplied by 130,000 tons of urea, 40,000 tons of mixed fertilizers, and 10,000 tonsof potassium sulphate orchlorate, resulting in a total supply somovhat larger thanthe projected 801,000 tons appearing above.
Source: Martin Echavarria: 'Elements para un diagnostico de los fertilizantesQuimicos en ColombianI Ministerio de Agricultura, OPSA, Sept. 1974.

Table 7.12 - 50LOMBIA: CENSUS FARMS BY SIZE, 1960 and 1970/71 i
Size Mi iatlveClass 1960 1970/71 Change
(hectares) Thousands) (Percent)
Less than 1 298.1 268.7 _9.9
1 to 1.9 191.3 177.8 -7.1
2 to 2.9 117.0 112.5 -3.8
3 3.9 92.0 84.7 -7.9
4 4.9 58.2 56.4 -3.0
5 9.9 169.1 159.7 -5.6
10 19.9 114.2 117.8 3.2
20 49.9 86.8 100.0 15.2
50 99.9 40.0 47.8 19.4
100 199.9 22.3 26.6 19o0
200 499.9 13.7 16.3 19.4
500 999.9 4.1 4.9 19.0
1,000 2,499.9 2.0 2.4 19.6
2,500 or more 0.8 1.1 W-5
All Farms 1,209.7 1,176.8 -2 7
a! Data do not include La Guajira and Choco.
Source: DANE: Censo Nacional Agropecuario, 1970-71: Resumen Nacional(Bogota: Dec. 1974), Part B, Table 1.

S . . . . . . . . .
It 1 .a 4Sc o¢y oooo<ooo w wo &: ov
c-~ ~~~~~~~~' - - 0 t
P P Y,~~~~~~~~~~~~~~~~~~~~~~ ' 0'
ft~~~~~~~~~~~~~~~~~~~~~~~~~~~~~~~~~~~~~~~~~A

Table 7.14 - COLOyBIA: REGIONAL GROUPINGS OF MUIIICIPIOS WITH hIGX CONCEiNTRATIONSOF SMALL FARMS BY COFFEE AND NON-COFFEE AREAS
Depts. Group Grouping Point Number of All Farms OvarContiguous Municipios Farms 20 has.
COFFEE AREAS
Caldas 1 Ianizales 2 4,024 516
2 Arse'a 3 6,152 594
3 Riosucio 5 10,408 534
4 Pensilvania & Samana 3 6,586 1,218
Ouindis 1 Ciroasia 1 1,415 65
Risaralda 1 Pereira & Sta. Rosa de Caboal 4 10 425 591
Littioquta 1 Sonson 4 11.519 1,110
Subt-tal 7 22 50,,29 5,028
Antiocuai, 1 Madailin, Env_gadc, 'Cagui,La Lstralla 17 2C 53
2 Yan=aal 6 6,937
3 Andes 2 4,14 _,
4 Rionegro 8 20,30C ',2-2
5 Caldas 6 8,037 483
6 Urrao 2 4,259
Solivar 1 Caraan de Bolivar 1 2,970
_oyI; 1 TLria 31 54,332 1,688
2 Chiqulirjaia 17 24,574 1,G21
3 fui-ana, Paips 29 43,687 1,289
4 Sogonosa 14 20,079 507
Canoe 1 Fopayan, El Tambo 14 1/ 32,632 2,744
2 301ivar 5 17,869 I',
Cor-oba 1 2ionosria, Cerate 2 ' ,22_ 2. 03
2 Sahagun 2
3 L ozt&a 2 _
Cundinamarca 1 Bogota 4 3
2 Zipaquira 15 2,
3 Facatat_va 15 7,1
s FVsagaz-4g4 5 6,373
j .- i:a; 3 _ t 5,o55 3 ,6
F:cila 1 ;3> - 3
2 Tuq;ares 3
3 Zpialas, Tunaco 12 21,715 2 <"2
Sa3tander I Charta 2 3/ 2,199 -9
2 Sar. kmdras 9 11,470 589
3 San Gil 7 5,608 465
4 Velez 13 4/ 25,235 3,126
Tolima 1 Ibague and Guano 6 17,663 2,324
Valle 1 Calt and Palmira 11 i/ 23,926 2 jl,2C
Subtotal 37 323 557,113 39 265
TOTAL 4. 345 607,64 44,293
1/ Includes 2 in NarIno
2/ Includes 5 in Boyaca
I/ Includes 1 In Nor-a de Santander
/ Includes 3 in Boyaca
5/ Includes 6 in Cauca
Source: Leonard Kornfeld, New Gar= as in Rual Development in Colombia.Prepared for AID under Contract 514-152T (Bogota, December 1974).Summarized from Table 11 of Anmex 1.
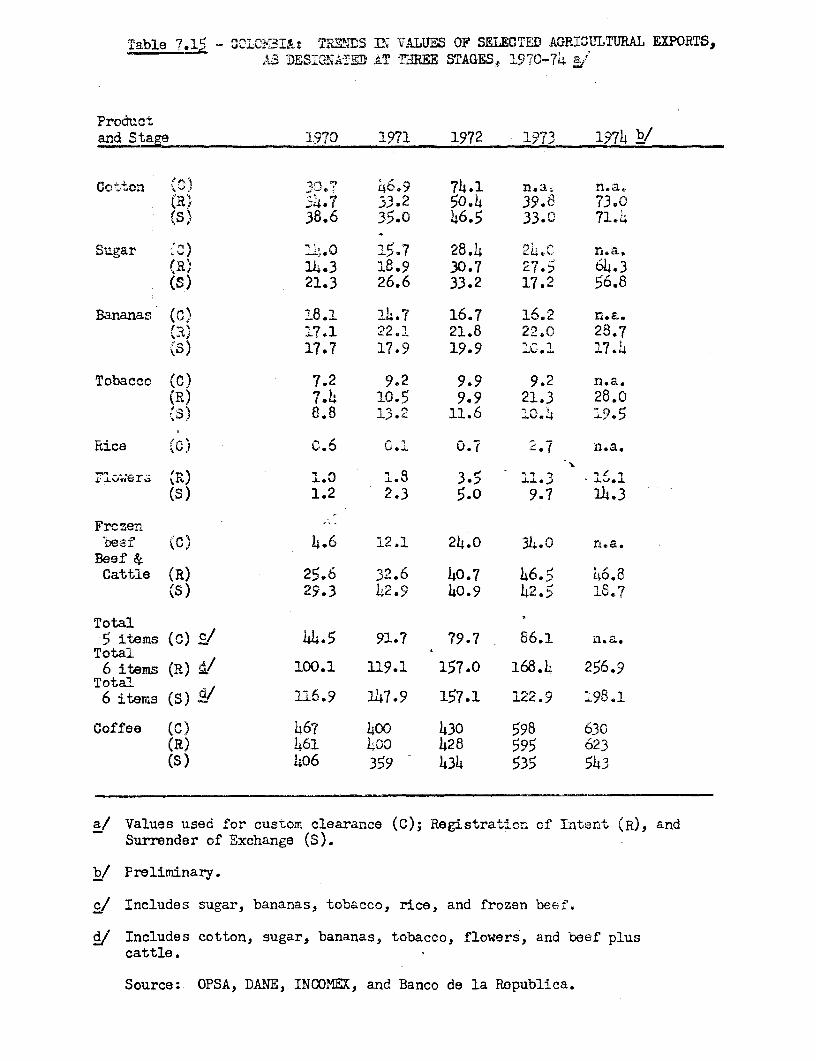
Table 7.5 - 3,LOILt Tr?-EMS IN VALUES OF SELECTED AGRICULTURAL EXPORTS,AS JE;SruaNATC m.T TiIITEE STAGES. 1970-74 a/
Prodtzctand Staze l970 1971 1972 1973 19714 b/
Cotton 4t at 6.9 74.1 n,a,, n.a.33.2 50.4 39.0 73.0
(S) 38.6 35.0 46.5 33.0 71.d
Sugar n) LL,.O 15.7 28.4 2i. n.a(R) J.14 3 2.8.9 30.7 27.) 614.3(s) 21.3 26.6 33.2 17.2 56.8
Bananas (0) 18.1 14.7 16.7 16.2 n.a.(t) 17.1 22.1 21.8 22.0 28.7(S) 17.7 17.9 19.9 CL. 17.14
Tobacco (C) 7.2 9.2 9.9 9.2 n.a.(R) 7e4 10.5 9.9 21.3 28.0(s) 8.8 13.2- 11.6 I 0.4 19,5
iRice (C),i 0.6 0.1 0.7 2.7 n.a.
rV -Lcie rz IL 1. 0 3 3.5 L i 3 .*l.-(S) 1.2 2.3 5.0 9.7 14.3
Frczen -
'beef (C) 14.6 12.1 24.0 34.0 n.a.Beef &Cattle (R) 25.6 32.6 40.7 46.5 146.8
(s) 29.3 12.9 140.9 42.5 18,7
Total5 items (c) c/ 44.5 91.7 79.7 86.1 n.a.
Total6 items (R) / 100.1 119.1 157.0 168.14 256.9
Total6 items (S) 1/ 16.9 147.9 157.1 122.9 -98.1
Coffee (C) 467 40 1430 598 630(R) 1461 Lco 428 595 623(S) 406 359 1434 535 543
a/ Values used for custom clearance (C); Registration of ITtent (R), andSurrender of Exchange (S).
b/ Preliminary.
c/ Includes sugar, bananas, tobacco, rice, and frozen beef.
# Includes cotton, sugar, bananas, tobacco, flowers, and beef pluscattle.
Source: OPSA, DANE, INCOMEX, and Banco de la Republica.

Table 7.16 - COLOMBIA: TRENDS IN QUANTITIES OF SELECTED AGRICULTURALEXPORTS, 1970-74
TIn Metric Tons)
1-970 1971. 1972 >7 1 4 a/
Cotton b/ 48.5 49.1 52.2 46.5 43.5
Sugar 13-0 i38.0
Bananas 262.0 229.0 212 0 184.o n.a.
Tobacco 12.7 15.5 13.7 9.8 n,a,
Rice 5.2 0.3 3.0 15.8 n.a.
Frozen Beef 7.8 17.3 27.7 27.0 r'a.
Coffee 390.0 394.0 392.0 406 o 4C&c
a/ Preliminary estimates.
b/ Year ending July 1931.
Source: OPSA, DANE

Table 7.17 - COLOMBIA; PER-CAPITA AVAILABILITIES OF FOODSAND PRINCIPAL NUTRIENTS, 1948, 1957, and 1970
Item 1948 1957 1964/66 1970
(Kilos per person per year)
Cereals 72 75 79 85
Starchy Roots andVegetables 98 63 132 118
Sugars 62 51 48 61
Pulses 8 5 6 8
Other Veg. 12 16 18 11
Fuits 105 55 40 99
Meat and Eggs 33 37 33 35
Fish 1 2 1.5 n.i
Milk (equiv.) 127 73 99 67
Fats and Oils 3 5 4.7 5
(Number per person per day)
Calories 2,220 2,050 2,190 2,196
(Grams per person per day)
Protein 56 48 50 47
Sources: FAO for 1948, 1957 and 1964/66; ICBF for 1970.

Table 8.1 _ COLOMBIA: INCREASES IN FACTORY EMPLOYMENT, 1953-1972
Employment Contribution to increased employment EmploymentF
1953 1953-60 1960-67 1967-72 1953-67 1972
Consumer goods 126817 19844 8722 52909 81475 208292
Intermediate good., 43794 26426 19661 31687 77774 121568
Capital goods 8084 13098 7211 7169 27478 35562
Other 2045 3469 3212 13112 19793 22438
TOTAL 181340 62837 38806 104877 206520 387860
Source: DANE and CEDE

Table 8.2 -COLO0BIA: INDICATORS OF IMPORT SUBSTITUTION AND SOURCES OF INDUSTRIAL GROWTH, 1963-1973
(Values in US$ Million)
1953 1963 1968 1973
I) Indicators of Import Substitution Sm
1. Imports cif (Mm) 544 506 643 876
2. Gross value of manufacturing output 994 1938 A 2585 . 4055 v
3. Supply (1 plus 2) (Sm) 1538 2444 3228 4931
4. Industrial exports 5 19 '54 329
5. Availability 6f manufactures (3-4) (Am) 1533 2425 3174 4602
6. Percentage imports in availability of 35.5 20.9 20.3 19.0manufactures
1953-1963 1963-1968 1968-1973 1962-1
2) Sources of industrial growth
a) Defined in terms of Mm/Sm (%)
Domestic demand .61.01 91.66 77.82 81.53
Import substitution 38.04 4.01 7.21 6.84
Export demand 0.95 4.33 14.97 11.63
TOTAL . 100.00 100.00 100.00 100.00
b) Defined,in terms of Mm/Am (%)
Domestic demand 61.18 92.58 79.16 82.19
Import substituti6n 37.64 . 2.94 3.81 3.96
Export demand 1.18 4.48 17.03 13.85
TOTAL 100.00 100.00 100.00 100.00
1/ Production figures have been converted at 1968 prices and converted into US dollars at the principal sellingrote of the peso.
Sources: DANE, Banco de la Republica, IBRD.

Table 8.3 - COLOMBIA: STRUCTURE OF MANUFACTURING INDUSTRY BY SIZE, 1970
(In Percent)
Number ofEmployment by Size Establishments Employment Value Added Gross Investment
1 - 4 3.5 0.3 0.1 0.1
5 - 9 34.1 5.0 1.7 1.1
10 - 14 14.9 3.7 1.6 1.0
15- 19 8.7 3.J. 1.4 1.4
20 - 24 6.1 2.8 1.2 0.9
25 - 49 15.0 11.0 6.1 5.2
50 - 74 5.9 7.7 5.2 3.6
75 - 99 3.0 5.5 4.4 3.0
100 - 1?9 4.7 14.1 16.5 10.8
200 and over 4.1 46.8 61.8 72.9
TOTAL 100.0 100.0 100.0 100.0
Source: DANE - 1970 Industrial Census

Table 8.4 - COLOMBIA: PAID EMPLOYMENT IN MANUFACTURING INDUSTRIES
(percent)
1953 1958 1960 1965 1967 1968 1969 1970 1971 1972Non durable consumer goodsFood 20.3 15.0 14.7 14.1 14.4 14.1 13.5 14.7 13.8 14.0Beverrages 5.9 5.9 5*9 5.9 5,4 5.4 4.7 4,5 4.6 4.7Tobacco products 3.3 1.9 1-7 _.3 1.2 1.2 1.0 1.1 1.1 0.9
Sub total 29.5 22.8 22.4 21.43 21.0 20.7 19.2 20.3 19.5 19.6
Textiles 19.5 17.2 17.9 15.6 16.3 16.5 16.9 17.4 18.2 17.2Clothing, footwear 13.4 12.5 11.2 11.0 9.5 9.8 9.9 9.5 10.3 10.0Printing 4.0 4.2 4.3 4.0 4.0 4.2 4.1 3.8 -L, 2 I
Sub total 66.5 56.7 55.8 51.9 50.8 51.2 50.1 51.0 51.9 50.4
Durable consumer goodsFurniture, fixture 1.9 2.2 1.9 1.7 1.7 1.7 1.6 1.9 1.8 1.7Rubber products 1.5 2.2 2.4 a j 2.4 2.2 2.2 2.0 2.0 1.6
Sub total 3.4 4.4 4.3 4.2 4.1 3.9 3.8 3.9 3.8 3.3
Intermediate goodsWooden products 1.9 2.3 2.3 2.1 2.1 2.0 1.9 2.3 2.0 2.0Paper and products 1.1 1.5 1.6 2.0 2.2 2.1 2.2 2.3 2.4 2.6Leather end products 2.0 2.1 1.7 1.6 1.4 1.5 1.4 1.3 1.5 1.3Chemicals 5.1 6.o 6.6 7.c2 3.3 8.2 7.9 7.1 7.7 7.20i1 products 0.9 1.1 0.8 0.7 0.7 0.8 0.3 0.7 0.8 0.7Non-iretallic minerals 9.0 8.7 9.0 8. c 8.4 8.4 7.9 7.3 7.2 7.0Basic metals 0.7 2.4 1.3 1.4 1.7 1.6 1.8 3.8 1.9 3.5Metal products 3.4 4.3 5.4 4,.0 7.0 7.2 7.8 7.0 6.9 6.9
Sub total 24.1 28.4 28.7 30.° 31.8 31.8 31.7 31.8 30.4 31.2
C>pttal goodsMechanical machinery o.8 1.3 1.3 1.7 2.0 1.9 2.3 3.7 4.0 3.5Eleccrical machinery 0.9 2.0 2.5 3,5 3.3 3.1 3.6 2.5 2.6 2.9Tran3port equipment 2.8 4.9 49 5._ 4.7 5.3 4.8 2.9 2.8 2.8
Sub total 4.5 8.2 8.7 10.3 10.0 10.3 10.7 9.1 9.4 9.2
Other 1.5 2.3 2.5 2.7 3.3 2.4 3.7 4.2 4.5 5.8
TOTAL 100.0 '100.0 100,0 2,00.0 100.0 100.0 a 100 100. 21.
Sourees: DANTE

Table 8.5 - COLOMBIA: DOMESTIC MANUFACTURING OUTPUT AND IMPORTS
(Million US $)
(Est.)1958 1963 1966 1968 1969 1970 1971 1972 1973
Consumer goods
Output 943 2366 14185 1577 1592 1691 1855 2095 2597Imports 22 28 47 32 71 89 98 107 na
Total 965 1394 1532 1609 1663 1780 1953 2202 na
% imports in total 2.3 2.0 3.1 2.0 4.3 5.0 5.0 4.9 na
Intermediate goods
Output 378 677 816 875 973 1159 1288 1443 1710Imports 173 259 52 202 22 Y 417 411 na
Total 551 936 1166 1107 1275 1534 1705 1854 na
% imports in total 31.4 27.7 30.0 21.0 23.7 24.4 224.5 22.2 na
Capital goods
Output 57 134 157 161 235 269 296 347 418
Imports E1 208 24 306 371 392 X2 na
Total 140 291 355 395 5411 640 694 679 na
% imports in total 59.3 54.0 57.0 59.2 56.6 58.0 57.3 48.9 na
Total l/
Ouitputs 1397 2217 2509 2681 2868 3194 3522 X9176 4838Imports 400 506 674 6!643 685 343 92 876
Total 1797 2723 3133 3324 3553 4037 4451 4835 5714
% imports in total 22.3 18.6 21.2 19.3 19.3 20.9 20.9 17.8 15.3
Exchange rate (Peso/US$) 6.40 9.00 13.49 16.33 17.36 18.49 19.98 21.92 23.098
1/ Includes miscellaneous production and imports
'Source: DANE

Table 8.6 - COLOMBIA: COMMERCIAL BANK CREDIT TO THE MANUFACTURING SECTOR
New Loans Loans Outstanding
Total Manufacturing % of Manufacturing Total Manufacturing % of Manufacturing(In Million Pesos) in Total (In Million Pesos) in Total
1953 1619.8 354.9 21.9 890.0 210.5 23.7
1958 3127.2 769.5 24.5 1879.1 523.6 27.9
1963 5962.6 1902.1 31.9 4126.2 1193.1 28.9
1964 6667.2 21145.7 36.7 4447.9 1396.2 31.4
1965 7098.9 2653.9 37.4 4996.7 1487.6 29.8
1966 7955.2 3011.2 37.9 5475.8 1705.7 31.1
1967 9103.9 3628.1 39.9 6211.9 1942.2 31.3
1968 12153.4 4206.2 34.6 8826.9 2344.2 26.6
1969 13632.7 4604.65 33.8 9897.0 2619.8 26.5
1970 16058.7 4711.0 29.3 11837.7 2727.6 23.0
1971 18809.3 4500.4 23.9 13810.6 3004.8 21.8
1972 23528.3 4539.5 19.3 16228.4 3310.5 20.4
1973 32920.0 7447.0 22.6
Source: Banco de la Republica

Table 8.7 - COLOMBIA: C3R?O;5iACIONES FINANCIERAS, CAJA AGRARIA ANDCORPORACION Pc-?UlIR - I0ANS TO THE INDUSTRLAL SECTOR
(Million Colombian Pescsj
Corporaciones Fina e.ras Caja QA-- __ororacion Pop'aroutstanding at end of year) (nev; loans) ( Cloan ;ratfolio)
1968 2270.5 n.a. 8.4
1969 293J6.1 115.9 47.3
1970 41377.5 139.7 94.7
1971 5109.5 183.8 190.0
1972 6647.7 559.6 290.2
1973 7464.7 790.9 364.9
1/ August 1973.21 Including lending to smal mfir.ing coerations.
Source: DANE. Banco de la Republica and Corporacion Financiera Popular.

Table 8.8 - COLOMBIA: INDUSTRIAL EXPORTS
(Thousand US Dollars)
1963 1964 1965 1966 1967 1968 1969 1970 1971 1972 1973
Food products 182.8 653.7 3897.5 5546.7 4971.4 7496.8 7712.2 10795.3 114473 8 15608.0 8014.0
Beverages 20.8 19.0 13.3 10.9 4.9 16.3 33.9 38.9 32.0 93.0 110.0
Tobaccq products 19.8 84.2 47.2 35.3 26.4 15.4 18.4 24.8 25.1 n.a. n.a,
Tex.tiles 5286.) 7543.8 8521.1 9017.8 8219.3 11610.1 16007.3 19237.8 23821.7 32460.0 64467.0
Clothing, footwear 117.7 235.1 489.9 467.3 406.8 1078.8 1823.0 3036,2 3701.3 13933.0 42060,0
Wood and products 2537.7 3522.0 1244.4 718.9 532.1 4459.7 7003.3 6046.1 6379.0 8017.0 14080.0
Furniture, fixture8 . 3.3 - - 9.2 432.1 732.5 806,7 1015.5 2089.0 11200.0
Paper and products 38O6 191.4 810.5 5659.0 9277.4 7553.9 7770.7 7522.4 6629.1 6955.0 8990.0
Printing 524.1 891.1 456.3 626.8 728.1 647.6 1712.8 2432.4 3502.0 4614.0 6814.0
Leather products 26I6.4 4212.8 2271.8 4512.3 3676.8 2123.6 6859.5 5422,3 5450.4 17222,0 22565.0
Rubber products 1536.9 4637.6 3948.6 2181.3 1473.0 1542.8 1520.9 1556.4 1757.0 2955.0
Chemical products 3166.1 5555.9 2936.4 53023 3997.0 5313.3 7905.7 8573.1 lc816.2 18532.0 32927.0
Oil products 1196.7 1123.2 1.4 12.9 55.9 61.7 200.9 465.1 -358.1 n.a. n.a.
Non metallic minerp.1; 2310.0 3007.9 3602.0 5367.1 6299.7 6706.5 9084.3 9903.9 8190.2 11533.0 16658.0
Basic metals 16,2 217.8 212.2 508&8 434.1 628.6 898.8 1316.8 1697.5 (12302.0 24990.0
Metal products 1l(" 508.6 1467.8 2378.5 2099.4 1404.6 2732.3 30752.5 3837.8 ( (
Mechanical machinery 14 3 550.4 444.7 362.8 415.9 617.2 1849.9 2868.1 3511.1 5549,0 9895.0
Electrical machirnery 6') .4 795.1 246.7 743.2 648.8 754,1 837.0 1240.3 133,4.0 1794.0 2380.0
Transport equipnent 7j.4 94.7 27.2 89,9 38.1 141e8 311,5 -144.3 23-°2.4 2005.0 2401.0
Other 14.0 27.4 6<891.2 71829 -225 4083.J _L'5 .7 5i' 21066.0 58905.0
192W.L t 30899.8 33055.5 46203.6 44063.6 54311 O 79125.1 8915121 104593.1 176529.0 329411.0
Equal to Colcmbian $ 192;.6 278.1 446.2 623.8 641.7 886.9 1373.5 1648.4 2089.8 3867.5 7826.8(millions)
l/ Including 4585 thousand US $ eop-oJlactam exports,2/ Of which 11 millioni US $ of reptile and other animal processed leather.
Source: Incomex

Table 8.9 - COLOMBIA: PROPORTION OF INDUSTRIAL EXPORTS IN
GROSS VALUE OF INDUSTRIAL OUTPUT
(In percent)
1967 1970 1971 1972 1973
Focd products 0.70 1.51 1.55 1.93 C.78
Beverages - o.ol 0 .01 0. 05o .Y
ToThacco products 0.05 0.04 0.05 n.a. n.a.
Te;ti1es 2.72 5.01 5.11 6.i4 8.71
Clothing, footwear 0.38 2.21 2.24 -. 68 18.51
Wocd and produqts 2.56 19.52 18.50 19.03 :,5.45
Pr:n±ture, 'ixtures - .92 5.73 9.56 4.46
Paper and products 11.46 6.90 4.99 6.52 4.77
Prllnting 0.12 35.28 3.63 4.15 4.98
Leather products -12.39 15.71 15.42 40. 42 '1.84
-fthbber products 3.77 2.?f3 2.14 2.02 3.14
Chemicals 1.58 2.24 2.84 4.54 6.33
012 products 0.55 0.43 0.26 xa. nI.a.
Non metallic minerals 5.63 6.29 4.57 6.76 7.44
Basic metahls 0.44 0.8,7 1.14 9, _9~~r)-9Metal produzts 2.i6 2.06 2.35 .
Mechanical machinery 1.83 7.59 8.07 11.53 16.09
Electrical machinery o.84 1.22 1.69 1.44 1.49
Transport equipment 0.06 1.631 1.46 I1` 1.19
Others 1._3 12.22 11.07 51.65
TOTA.'irA 1.72 2.79 2.97 4.43 6.75
1/ Exports include wood (madera bruta) wbich may not be incudd in Corresponding datafor production of wood and products, thus exaggerating the % of exports in totalproduction.
2/ Total production - including reptile leather which is almost ent±frely exported.
Sources: Banco de la Republica (gross value of output estimates) and Incomex (exportsregistrations)

Table 9.1 - COLOMBIA: CONSUMER PRICE INDICES FOR BOGOTA
MEDELLIN, AND THE NATION, 1958-72
(-Uly 1954-'une 1955 = 100)
bBogota/ Medellin-/ NationPeriod-:' Empleados Obreros Empleados Obreros Empleados Obreros
1330 155.3 17.i 160.0 161.2 158, 6 160.5
1%961 167.4 171.0 171.9 175.1 171.1 174.11962 176.4 175.2 182.9 185.9 180.6 181.6_163 221.9 231.2 227.8 236.2 224.9 231.1i964 252.6 272.0 259.3 274.3 260.1 272.11965 269.1 281.6 280.4 288.1 232.8 291.31966 318,.3 337.5 327.3 3 3.5 33O02 339.91967 348. 9 365.0 359.8 364.2 359.6 367.31968 372.3 386.3 391.1 395.3 386.8 394.51969 402.4 425.5 422.7 423.7 414.0 421.91970 429.2 454.6 455.9 - 451.5 444.4 450.21971 470.3 495.7 501.1 510.3 492.8 503.4
72 52SR 3 63`5 381.3 57<1.3.79.3 573.11373 630.5 0395.4 662.3 697.1 6 7', 4 699.0
1974 765.8 864.8 802.5 860.7 822.8 875.1
1973-July 641.3 728.1 680.5 732.3 681.3 726.4August 643.1 711.2 682.7 723.8 684.1 720.7September 649.5 713.4 689.3 729.6 693.5 730.7October 652.8 710.8 693.9 732.2 698.8 734.0Nobember 659.3 721.1 703.4 751.2 7612.4 750,7December 671.8 735,2 710.9 578.7 721,1 759.4
1974-January 684.9 760.0 728.3 781.7 739.2 782.3February 702.4 783.3 738.2 793.4 757.0 802.6March 728. 2 828.8 764.1 822, 0 779. 6 830. 1April 741.1 853.2 782.4 848.7 797.8 854.1May 747.8 857.1 793.1 858.1 807.1 864.3June 756.7 862.4 799.5 860.1 818.0 872. 1July 763.1 851.8 811.2 866.0 829.6 878.5August 770,2 855.2 815.7 867.9 833. 8 880. 3September 789.4 882.7 819.6 872.3 844.7 894.9October 818.6 926.0 848.5 904.9 877.6 933.8November 837.5 950.2 855.3 916.6 886.5 945.0December 849.5 967.0 872.9 936.4 903.0 963.5
a' Annual figures are simple averages of monthly data.bI Bogota has a weight of 20.2 percent in the national total.or,! Medellin has a weight of 23.5 ?ercent in the national total.
Source' National Statistics Department (DANE)

Table 9.2 - COLOMBIA: NATIONAL CONSUWER PRICE INDICES
BY EXPENDITURE CATEGORY, 1958-72 a!
(July 1954-June 1955 = 100)
Foodstuffs Xousing Olothing Miscellaenous Total
PeriodJ_ A B A B A
1960 161.5 163.5 145.7 151.7 159.0 160.0 166.1 165.3 158.6 16C.51961 176.1 180.9 158.0 263.4 167.3 166.6 176.7 174.0 271.0 174.11962 181.1 182.8 170.5 176.7 175.5 173.8 191.7 189.5 180.6 181.61963 233.6 241.5 199.9 211.5 217.9 215.2 239.7 237.4 224.9 231.11964 285.7 299.9 223.3 236.8 231.3 228.6 269.4 266.4 260.1 272.11965 306.9 312.9 246.7 265.6 248.3 245.9 294.8 290.0 282.8 ?91.31966 361.2 369.7 279.0 297.6 304.5 306.1 342.3 331.2 330.2 339.91967 382.5 388.1 305.8 327.3 331.5 338.8 388.5 377.0 359.6 367.31968 409.6 416.1 327.9 353.2 353.7 361.0 418.5 407.0 386.8 394.51969 433.6 440.3 352.4 383.1 382.2 388.2 452.8 442.1 414.0 421.91970 459.3 465.0 379.9 413.6 419.5 424.5 489.9 473.5 444.4 450.21971 517.1 523.7 415.0 462.5 455.3 468.6 539.4 523.6 492.8 503.41972 592.4 604.5 470.6 522.3 522.9 532.5 600.1 578.5 557.8 573.11973 754.9 778.7 534.9 592.3 630.4 653.3 662.5 6421.7 667.4 699.01974 977.2 1005.7 626.3 711.4 779.9 817.5 769.0 752.7 822.8 275.1
19'3
July 787.1 833.9 535.0 590.7 630.7 652.5 664.9 644.3 681.3 726.4August 782.4 812.8 540.3 597.4 650.2 675.1 671.0 649.4 684.1 720.7September 791.5 816.8 551.9 619.0 655.2 681.3 680.4 662.4 693.5 730.7October 797.2 818.2 555.8 623.5 666.5 694.4 683.4 664.4 698.8 734.0November 819.0 842.7 565.0 636.4 676.8 704.6 687.7 668.4 712.4 750.7December 828.9 850.7 573.2 646.5 693.6 724.2 692.4 671.- ' 721.1 759.4
1974
January 864.2 886.3 585.0 666.1 797.0 728.3 694.7 673.8 739.2 782.3February 894.8 917.5 586.7 668.0 720.8 757.3 700.9 680.7 757.0 802.6March 921.1 952.7 596.8 679.7 733.0 766.5 736.7 717.9 779.6 830.1April 953.2 991.4 601.6 684.3 748.3 785.1 744.9 727.0 797.8 854.1May 961.5 2000.6 60'7.7 695.1 770.3 803.8 751.8 733. 807.1 864.33uae 969.0 1004.2 624.9 707.7 783.8 821.7 761.8 818D0 272.1July 981.8 1005.7 635.4 718.0 788.4 826.4 7 773,9 829. 6 8378.5August 982.9 1002.7 640.3 723.8 796.0 834.4 782.4 76,._ 83308 880.3September 1001.9 1024.4 646.8 734.9 798.9 837.4 787.6 767.8 844.7 894.9October 1058.0 1082.2 654.2 743.1 824.8 868.8 812.7 8012C 877.6 933.8Niovember 1058.7 1088.1 662.9 752.6 842.9 882.6 831.6 82'- 8$ 5 945.0December 1079.7 1112.7 673.8 763.8 854.6 897.8 848.6 84-.1 90. 96 3.5
City Foodstuffs Housing Clothing Miscellanecuol _.ta2
A B A B A B A B ___B
Bcgotr (20.23) 36.70 48.71 30.04 21.71 12.81 12.12 20,45 17-4 C _J 00 lOu.C9Medellin
(23.54) 35.11 46.30 24.85 23.21 12.02 9.90 28.02 20.59 13.00 1100.01,Cali (16.44) 35.02 46.58 28.65 25.38 12.92 11245. 23.421 6.59 _00.00 100.00Earxranqilla
(26.13) 45.70 52.78 22.85 23.00 10.13 8.14 21.32 16.06 100.00 100.[.iBuoaramanga
( 7.40) 47.64 53.73 27.18 27.14 10.05 6.91 15.13 12.22 100.00 100.^0Manizalea
(4.07 ) 40.96 48.55 25.50 23.29 12.31 10.61 21.23 17.55 120.00 1O0.00Pasto (2.19) 49.65 51.55 22.66 25.08 11.86 9.35 15.83 '4.0~ 1JO.00 100.00
100 39.67 49.29 26.15 23.54 11.70 9.94 22.48 17.23 200.CO 100.0
a/ The following weights apply to the expenditure categories in the seven urban areas covered (weightsbased on 1953 household survey).
b/ Annual figures are simple averages of monthly data.c/ "A" refers to Empleados, "B" to Obreros.
Source: National Statistics Department (DANE)

Table 9.3 - COLOMBIA: WHOLESALE PRICE INDICES, BY MAIN COMM)DITY GROUP1960-t974
Beverages Raw Materials Fuels Manufac- Machinery Various Total Total Indexand excluding and Oils and Chemical tured and Transport Manufactured excluding
Period Foodstuffs Tobacco Fuels Lubricants Fats Products Products equipment Products Index foodstuffs
1952= 100
1960 199.1 193.9 201.8 234.6 301.0 205.9 199.8 278.8 198.3 205.9 214.91961 214.7 .199.l1 214,6 239.6 302.2 211.2 205.2 3j0.7 212.2 219.4 225,11962 2.17.2 217.5 226.8 2H/,'j 344.1 219.4 21.-7 32(.l 220.3 225.2 235.71963 277. 28L.5 255.8 313/4 /,55.9 269.1 267/.9 3'79J. 279.'7 284.4 294.111964. 344.0 329.4 272.3 33/4 8 537.0 289.6 201' t 4'. 294./ 334. 320.71965 36,6.4 3/0.2 2'99.6 356.4 754.3 31, 0 311. '7 4'51, 3T1.1 '361.7 355,31961'. 426.9 42(.9 349.0 391 .6 1265.8 367.3 3f.0 g j42;/ 395.2 1,4.6 421.31967 449.2 466.6 405.7 4Jf,6 l692.0 404 5 3'38. 587 9 415.3 4n3.6 459.41966 479.4 491.4 456.5 464. 5 i.38. i 44!, 0 428.3 6 t3.2 4314 482.1 485.61969 505.3 506.6 49(.3 4971 1 256.1 47f,.2 462?6 689 1 5(2.11 514.3 526.31970 536.2 53J.8 508.7 5,1,8 1267.7 49f.'7 499.4 816C 5550.4 553.5 576.71971 593.5 574.0 542.4 61. 133.l1 539.0 531 2 908.8 618.8 607.5 626.31972 678.3 648.9 636. 67U.P 1380.9 575.0 59/.8 970.0 6't13.7 683.9 691.4
1L97Q0' 100/
1970 100.0 100.0 100.0 100.0 100.0 100.0 100.0 100.0 100.0 lO.O.1971 111.7 114.7 115.1 117.7 108.1 108.4 107.1 110.6 110.4 111.51972 129.8 135.1 128.8 137.6 104.4 118.1 123.8 131.6 123.5 13-1.91973 171.4 156.9 170.8 157.1 !1A447 143.1 154.0 151.2 149.3 168.7
1973January 147.5 143.8 138.1 143.0 1110.8 126.6 136.4 140.5 134.0 146.7February 151.7 144.8 140.7 14,2.7 107.8 127.9 139.4 140.8 137.7 150.0harolh 158.0 146.0 143.8 150.8 110.2 129.1 141.4 1,43.3 138.7 155.1'April 166.o 145.7 147.2 149.5 114.4 130.5 143.2 143.5 140.1 160.2May 169.0 149.2 158.0 149.5 130.6 134.0 144.5 146.3 142.7 163.7June 174.5 149.1 169.6 148.3 139.5 138.2 1-47.4 148.8 145.6 168.1Jvll- 175.5 150.1 171.8 150.5 146.8 146.2 156.5 151.2 153.9 171.1Al-,u.at 174.5 149.1 1169.6 24.3 139.5 138.2 147.4 148.8 145.6 1174.1!;.> p; ,bsr 179.6 168.1 1R2.0.6 160.9 i67.9 154.6 16.3,3 156.2 158.3 1'7730,tb4br 182.3 117:].8 19)3.6 167.0 174.9 157.0 16'1,1 '161.0 1159.6 1 1.8Novo,.-1 A r 186.5 172.4 2o) .6 177.0 183.3 159.2 1'72,3 152.9 161.t 186.0Decom bar 189.1 174.4 223,3 119.4 19u.7 162.5 175.6 165.8 163.9 190.7
1974January 196.7 181.6 233.2 221.4 218.0 168.9 191.9 173.5 172.1 199.6February 215.0 182.6 272.4 224.6 226.9 176.1 204.5 177.2 183.8 2a44_2March 218.8 183.2 265.4 234.1 261.0 183.1 210.9 178.8 187.0 213.4April 228.4 183.0 271.3 233.6 262.0 198,8 218.7 185.3 190.0 221.4May 227.6 183.4 273.8 241.5 262.5 203.5 222.8 187.5 191.9 227.7June 231.5 183.2 296.4 239.8 262.7 207.8 226.2 190.2 197.2 227.3July 231.2 189.2 290.0 241.5 261.0 211.8 228.8 193.1 197.8 228.0August 236.4 201.8 300.4 245.1 287.5 223.6 234.3 198.8 201.5 234.4September 236.5 204.5 303.2 248.8 289.8 231.0 236.2 206.6 204.6 236.1October 251.5 211.9 302.6 254.4 286.6 244.6 247.2 214.8 212.1 247.8November 255.7 215.3 300.5 258.0 288.3 248.8 251.1 219.3 217.4 251.7
A new series was introduced in 1973 with January 1970 as a base. Total index excluding foodstuffs rot available after 1972.
Source: Banco de la Repdblica.

Table 9.4 - COLOMBIAt CHANGES IN WHOLESALE ANDCONSUMER PRICE INDICES, 1970-74
Wholesale Prices a/ Consumer Prices b/
Year and Month Index Cum. % Chg. c/ Inolex Cum. % Chg. c/
Ad B A B d/
(1969-Dec.) (537.6)1970-Dec. 573.0 102.6 6.6 437.11971-Dec. 638.7 118.6 11.5 15.6 464.5 6.31972-Dec. 732.7 143.5 14.7 21.0 532.9 14.71973-Dec. 190.7 32.9 607.3 14.0
1973 January 145.7 2.2 613.0 0.9February 150.0 4.5 625.6 3.0March 155.1 8.1 648.5 6.8April 160.2 11.6 672.9 10.8May 163.7 14.1 695.7 14.6June .168.1 17.1 710.9 17.1July 171.1 19.2 726.4 19.6August 174.1 21.3 720.7 18.7September 177.3 23.6 730.7 20.3October 181.8 26.7 734.0 20.9November 186.0 29.6 750.7 23.6December 190.7 32.9 759.4 25.0
1974January 199.6 4.7 782.3 3.0February 209.7 10.0 802.6 5.7March 213.4 11.9 830.1 9.3April 221.4 16.1 854.1 12.5May 227.7 19.4 864.3 13.8June 227.3 19.2 872.1 14.8July 228.0 19.6 878.5 15.7August 234.4 22.9 880.3 15.9September 236.1 23.8 894.9 17.8October 247.8 29.9 933.8 29.0November 251.7 32.0 945.0 24.4December n.a. n.a. 963.5 26.9
a/ Total wholesale pricesb/ Blue Collar workers (Obreros)c/ Cumulatxv- percentage change in index relative to previous Decemberd/ A 1951- 10
B . > 9 , - L O'J
Sourcet Ban,:;c I Renz-ic-,Nlat_ona,L StatiLstic-s _aren D.)

Table 9.5 - COWOMBIA: AVERAGE ANNUAL INCREASES IN SELECTEDPRICE INDICATORS, 1950-74 .W'
(Percentage Changes)
INTERIORWholesale Prices Consumer Prices GDP PRICE COFFEE
Year Total Excl. Food White Collar Blue Collar DEFLATOR PRICE
A c2/ B c/
1960 4.2 4.5 6.0 5.7 8.5 10.8
1961 6.6 4.7 7.9 8.5 8.2 9.7
1962 2.6 4.7 5.6 4.3 6.6 1.4
1963 26.3 24.8 24.5 27.3 23.2 16.3
1964 17.5 9.0 15.7 17.7 16.4 31.9
1965 8.3 10.8 8.7 7.1 9.1 - 1.8
1966 17.4 18.6 16.8 16.1 14.9 5.1
1967 6.8 9.0 8.9 8.1 8.3 0.3
1968 6.3 5.7 7.6 7.4 9.4 17.1
1969 6.7 8.4 7.0 6.9 8.2 10.5
1970 7.6 9.6 7.3 6.7 10.3 32.7
1971 9.8 11.5 8.6 10.9 11.8 11.6 - 4.5
1972 12.6 18.3 10.4 13.2 13.8 12.7 20.3
1973 n.a. 27.9 n.a. 19.6 22.0 21.7 29.3
1974 n.a. n.a. n.a. 23.3 252 24.0 b/ 13.0
a/ Simple arithmetic means of 12 monthly percentage changes
b/ Estimate
c/ A : 1952 = 100, B : 1970 = 100
Source: Banco de la Rep6blicaNational Department Statistics (DANE)

Table 9.6 - COLOMBIA: PRICES OF CONSTRUCTION MATERIALS IN BOGOTA 1967-74 /
(1951-53 - 100)
Item 1967 1968 1969 J970 1971 1972 1973
Non-MetallicMinerals & Products 416.7 436.4 503.7 5.0 622.5 717.5 813.8
(Gray C-7omenk) (374.'5) (ifi,8.6) (40(8.3) (1$36}5) (565Qo) (63',.t;) ('00a.3)(Common BTicks) (s;90.0) (W-9j3.8) (46z065) (5.o65) (704.3) (9gl.Ž) (9!4.0)
Iron and MetalArticles 417.7 5L17.9 542.9 609.7 615.o 698.6 900.0
Lumber 392.9 k-35.3 459.o 54) xl2 9 .8 63';., 8Ž8.9
TOTAL 409.9 462.4 505.2 561.5 614.5 690o1 829.1(1967Tl00) (10o.0) (112.8) (123,2) (:-7.0) (149.9) (168.h) (202.3)
1974 Jan Feb Mar Apr May Jun Jul Aug Sep
Non-Met,al01eMineralt -'j92 9, I oi- 19.' 1 -0.-:3.2 ibx68fc I j %(
(Gra4 (70:1,) (W9 " (917. -) (< 0( (981j l ( 3) (98L ½ K <6)(Corfimon ryz, C'' 462t ,8) (1 .91 i023 < .'3811) ( L0 94 .-7) ( ,1C}6 I ( / '' f) (L{ 'I 6
Iron ar-' Mt..-
~~~~~~~~~~~~~~~7 140 ., .7 O. 0 .i6 1729 I :2 Arti'3lfc3 .i,,.6 1,v _ 1Jl LrJ; 9#ff( 1 ..660,'7 :1.7ihzc- 1.720,0 .lif 7K.6 l.7.3'f.} Ar. (2.2c
Lumber Ai.0h.0 1,072.1 1.068 .4 1,118.0 1.066,8 1i088,0 1.089,7 1.132,1 1140o.8
TOTAL 1,024.1 l.04i.4 1.062.1h 1.079,!4 1.099.1 1.118.8 1.135.0 1,163.7 1.156.6(1967=100) (249.8) (254.1) (259.2) (263.3) (268.1) (272.9) (276.9) (283.9) (284.6)
a/ Figures for 1967-1973 refer to annual averages
Source: Banco de la Repuibliwa

Table 10.1- COLOMBIA: LOAN COnMITMENTS BY AGENCY, 1961-74
(In millions of U.S. dollars)
1961 1962 1963 1964 1965 1966 1967 1968 1969 1970 1971 1972 1973 1974
AID 20.0 97.3 18.7 65.5 63.8 16.5 98.2 72.9 95.0 72.1 82.3 89.0 19.4 17.5
EXIMBANK 54.4 3.4 2.5 24.2 4.0 3.4 25.5 15.5 21.4 2.1 22.8 0.3 14.3 7.8
IDB 35.2 12.0 25.0 30.3 27.8 22.7 27.9 115.4 55.5 23.1 78.9 49.9 32.2 73.7
IBRD & IDA 61.0 50.0 73.8 45.0 - 41.7 25.0 105.6 60.3 109.3 153.1 44.1 162.2 8.0
OTHERS - - 8.6 20.5 15.1 41.4 49.3 65.6 30.3 79.7 62.0 155.0 268.4 92.7
SUBTOTAL 170.6 162.7 128.6 185.5 110.7 125.7 225.9 375.0 262.5 286.3 399.1 338.3 496.5 199.7
PL-480-I - - 6.9 13.4 - 16.9 - 13.0 - 16.2 3.0 10.4 8.9 -
TOTAL 170.6 162.7 135.5 198.9 110.7 142.6 225.9 388.0 262.5 302.5 402.1 348.7 505.4 199.7
1/ Includes amounts repayable in local currency,
Source: Statements of Loans of respective agencies and National Planning Department data.

Table 13 * 2 - XCLO?-IA LQhN UcmIOie BY AfENCY FOR INTERNATIONAL DEVEIDPI4IT, 1961-74
(In millions of U.S. dollars)
Loan or Date of Original Prin- Cumulative
Credit No, -'urnose Astregsent cipal Amount Original Amounts
1961 514- .- Cl1 E_K ing August 2 1_.0514-a-C16 Aiigr_"Iture August 2 ,,
Sub-total 20.C 20.0
1962 514- -017 Pr_ w'rL Loan April 12 30.0514-L-C24 Cr-_rur _uOI: Dec. 6 59.85'4--C2_ sir, June 26 ',7
Sub-tocal 91.3 117.3
1963 5 L- C t2 d June 26 3.0
1A - '2' Agriculture June 26 1O.C'14-- -O, Se-tieragc Sept. 20 3.7
314-L-O- Stud Sept. 18 2.3Sub-total 18.7 136.0
1964 14_TL_'^53 Pregrer Loan March 11 '5.G51-.L-53 C lowe-n May 11 1.S
514-L-35t ~ S-we-age July 18 0.2
514-L-_7 Watur J_ly 18 C.4_agx -rc_l:ura July 18 4.C
51!S-L-_ 9 Prc-r,m l-'can July 13 35.05,4-7 -_`9 In3scscry Dec, 23 9.6
Sub-total 65.5 201.5
1965 514-L-0-4 Programr. Loan Dec. 20 63.8 265.3
1966 514-L-046 Agriculture March 16 8.5
514-L-048 Agriculture July 25 8.0Sub-total 16.5 281.8
1967 514-L-049 Program Loan May 27 96.2 380.0
1968 514-L-052 `n-z--.-.r Loan July 15 57.9
514-L-0T ' A ricutie re a Xly 15 1.GSub-total 72 9 452.9
1969 514-T-Cs- 'riceu ure Va-, 19 15.3Y~Lz, 19 113
E14s-_- _ 5 _ P±o rat 'Ka. 19 oO.35. -- nds _rna rec. 22 1 0
Sub-total 95.3 547.9
1970 5q4-L-056 IrcJatrr June 11 2.1
514-L-59 EdUacat o. JIie 11 r
514-L-CoO lt_ 111SG514-'-06i 'ro'rar. Loan luna 11 4G0
Sub-total 620,0
1971 51 -L-0583 re'a e Rescurce -ri. 28514---062" Cadartral Loan '"v. 45;4-L-06; U-rbe-, Developmen Aug. 19 29. 0
514-_-064 A ricuj:ure 19 280
514-- -0D' Education A-3- 19 20. 0S.Th-:> _c__; 1 _.3 702.3
1972 514-L-366 Hdurcan o_ La 13 C. 5
511-L-067 A:rtculcu:u _u? 13 3.85-4-L-066 TUrban Dev 0 lopmen: Jul7 13 3:
Sub-total 89.0 791.3
1973 514-L-069 Health e_. 28 19.4 810.7
1974 514-L-073 idueation t 26 10.C
514-L-076 Water Supply and Sew-erage Dec. 17 7.5 828.2
Sub-totaS 17.5
Source: AID

Table 10.3 - COLOMBIA; LOWN OO4MTNTS BY ZDORTDQORT BAME OF TE UNITED STATS, 1961-74
(In mil ions of U.S. dollars)
Original CumulativeDate of Principal Original
Year Loan No. Purpose Agreement Amount Amount
19611432 Aviation Jan. 19 7.61573 General Imports May 10 45.41644 Transportation June 28 1.4
Sub-total 54.4 54.4
19622070 Industry Dec. 13 3.4 57.8
19632140 Agriculture Dec. 31 2.5 60.3
1964
2161 Power Apr. 8 18.42165 Industry Apr. 23 3.5
2205 Water Sept. 24 2.3Sub-total 24.2 84.5
19652234 Industry Apr. 8 4.0 88.5
19662292 Agriculture Jan. 17 3.4 91.9
19672410 Aviation Feb. 9 25.5 117.4
19682531 Water June 6 4.02532 Power June 6 2.02571 Industry Oct. 1 9.5
Sub-total 15.5 132.9
19692611 Industry Feb. 24 6.72641 Aviation June 5 3.82647 Power July 2 4.22674 Telecommunications Oct. 9 1.72679 Roads Oct. 16 5.0
Sub-total 21.4 154.3
1970
2728 Housing Feb. 19 0.22814 Power June 1 1.02861 Industry July 20 0.9
Sub-total 2.1 156.4
19713183 Power May 24 2.13254 Industry June 29 0.33256 Power June 29 1.93309 Transport Aug. 8 3.23345 Aviation Aug. 26 6.13527 Power Dec. 23 9.2
Sub-total 22.8 179.2
1972 19098 Industry Apr. 7 -I
9188 Incdistry Apr. 19 0.19189 Industry Apr. 19 0.19636 Industry Aug. 15 0.19820 Industry Oct. 11 - 1/
Sub-total 0.3 179.5
19733256 Power May 5 1.93309 Road maintenance and July 5 3.2
equipment3527 Power Aug. 22 9.2
Sub-total 14.3 190.6
19744834 Transportation Mar. 8 1.15179 Cement plant Sept. 30 6.3
Various relending credits 0.4with banks Sub-total 7.8 198.4
1/ Less than US$50,000
Source: Eximbank

Table 10.4 - COLONOSA: LOAN COMMITMENTS BY INTER-AMERICAN DEVELOPMENT BANK, 1961-74
(In millions of U.S. dollars)
Source of Financing Total Cumulativeteen or Date of Original Pri-ipal
Year Credit No. Purpose Approval Ordinary Fund for Serial Progress O i PrincCapital Special Operations Trust Fnd Ao.u. bAu-t
1961 5 Industry Apr. 9 0.76 (Water and Apr. 9 6.09 (Sewerage Zfay 15 5.2
23 Studies Sep. 3 0.59 Water & Sew. Oct. 26 2.4
10 Housing Nov. 16 15.211 Water & Sew. Nov. 22 5.2
Su-ooe 12.4 - 22.8 35.2 35.2
1962 41 Industry Jan. IS 0.750 Wetar & Sew. July 12 0.421 Studies May 11 0.623 Neter & Sew. July 12 2.537 Water & S-. Tuly 12 7.8
Sub-totals 1.1 3.1 7.8 12.0 47.2
1963 64 Industry Apr. 9 12.072 Iudu-try Ort. l0 3.077 Transpo-totio- Dle. 5 10.0
SUb-rtevls 25.0 - - 25.0 77.2
1964 99 Agritulture Aug. 28 1.2106 Power Nov. 19 8.0107 Power Det. 3 3.2
77 Edutstio- Apr. 30 1.179 Agriculrure Apr. 21 6.893 Housing Oct. 8 7.598 H-using Dec. 24 2.5
Sub-trtale 12.4 _ 17.9 30.3 Z02.5
1965 111 Treesport-tion Jan. 28 5.0121 Industry Aug. 26 5.1125 Power Nov. 10 8.1
55 Weter & Sow. Apr. 15 4.865 Power Occ. 21 3.374 Edurtioso Oc. 16 1.0
112 Studie- J.oe 10 0.3Sub-rorols 18.2 9.1 0.5 27.8 130.0
1966 92 Agriculture Apr. 24 9.7102 Educ-tion July 21 5.3125 Edu-ti- Dou 68 7.7,
125 Education Dec- 8 sub-totals - 22.7 - 22.7 153.0
1967 145 Agri-ulture Feb. 2 12.2151 rodustry Sep. 7 5.0161 Agrirultur- D1c. 14 10. 7
Sub-totals 17.2 10.7 - 27.9 100.9
1960 173 Industry Dc-. 13 2.6175 Power Dec. 30 45.2174 Studies Apr. 4 3.1175 Ed-catio- Apr. 4 6.6182 Transportation Apr. 21 12.7187 Housing Aug. 15 9.1197 Agritulture Non. 29 10.0200 Industry Dnc. 13 7.5iSA' Studies Apr. 4 1.I13i' Power DIc. 30 06.7
Sub-retain 47.8 49.8 17.8 115.4 296.3
1969 178 Agriltuiore Ju,e 26 4.4179 Water & Sew. June 26 3.4207 Studies Men. 20 0.3223 Agriculture June 26 9.5224 Water 4 Sew. June 26 5.7237 Transp-rtation No-. 12 17.0246 Transporetaion DOc. 18 15.2
Sub-retaln 7.8 47.7 - .5 75 T5 1.7
1970 263 Transp. rvation Jun- 18 16.1276 Studies Ocr. 22 6.0
FPP1-/ Agriculture Kor. 12 1.0Sub-totals - 22.1 1.0 23.1 374.9
1971 211 Powne Frb. 11 9.0290 Pewe FPeb. 11 16.02i4 Power aMy 5 34.1303 Power Aug. 12 19.8
Sub-totals 43.1 35.8 _ 78.9 b5l
1972 334 Ed-catin Oct. 5 5.9344 Noosing Nov. 29 24.0234 Noosing Nov 29 20.0
Slb-tovels 20.0 29.9 - 49.9 503.7
1973 247 Transpectatien Apr. 25 11.0249 Power Nov. 23 21.2
Sub-totals 32.2 - - 32.21/ 5359
1974 251 Watnr Supply Nou. 23 3.8avd Sewerage
257 Agriculture Mar. 4 6.0258 Power JOve 18 4.5263 Power Dec. 31 48.5362 Water aud Jau. 31 8.5
- Sew7erage374 Power June 18 2.4
Svb-totals 62.8 10.9 - 73 727 609.6
Total 300.0 241.8 67.8 609.6 609.6
Share in Grand Total 49.2% 39.7Y 11.12
1/ Secludes US$3.1 million repayable in local curre- ny.21 Includes USS9.2 million repayable in local cuerenty
Source IDB
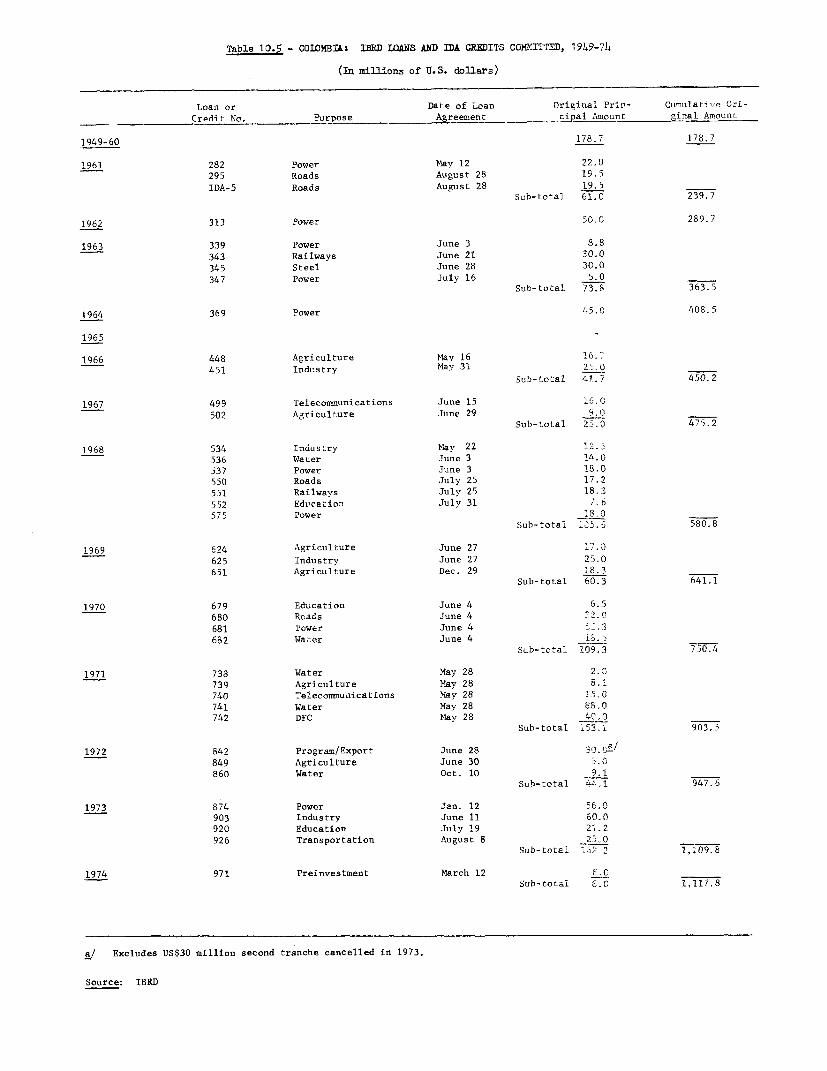
Table 10.5 - COLOMBIA: IBRD LQANS AND DA CREDI3-S COXITTEDf, 1949-74
(In millions of U.S. dollars)
Loan or Date of Loan Original Prin- Cumulative Ori-Crpciit No. Purpose Agreement cipal Amount ginal Amount
1949-60 178.7 178.7
1961 282 Power May 12 22.0295 Roads August 28 19.5IDA-5 Roads August 28 19.5
Sub-total 61.0 239.7
1962 313 Power 50.0 289.7
1963 339 Power June 3 8.8343 Railways June 21 30.0345 Steel June 28 30.0347 Power July 16 5.0
Sub-total 73.8 363.5
1964 369 Power 45.C 408.5
1965
1966 448 Agriculture May 16 16.7L51 Industry May 31 2_.0_
Sub-total 41.7 450.2
1967 499 Teleconmunications June 15 16.0502 Agriculture June 29 9.0
Sub-total 25.0 475.2
1968 534 Industry May 22 12.r536 Water June 3 14.0537 Power June 3 18.0550 Roads July 25 17.2551 Railways July 25 18.3552 Education July 31 7.6575 Power 18.0
Sub-total 105.5 580.8
1969 624 Agriculture June 27625 Industry June 27 25.0651 Agriculture Dec. 29 18.3
Sub-total 60.3 641.1
1970 679 Education June 4 6.5680 Roads June 4 32.0681 Power June 4 _.3682 Water June 4 1s.5
Sub-total 109.3 750.4
1971 738 Water May 28 2.0739 Agriculture May 28 8.1740 Telecommunications May 28 55,741 Water May 28 88.0742 DFC May 28 4_0O
Sub-total L_3.i 903.5
1972 842 Program/Export June 28 3)fGi/849 Agriculture June 30 5.0860 Water Oct. 10 9l
Sub-cotal 4a.1 947.6
1973 874 Power Jan. 12 56.0903 Industry June 11 60.0920 Education July 19 21.2926 Transportation August 8 25-0
Sub-total 162.2 1,.09.8
1974 971 Preinvestment March 12 £.0Sub-total E.0 1,117.8
a/ Excludes US$30 million second tranche cancelled in 1973.
Source: IBRD

Table 10.6 CoLOalIA: LOAN CO0TMf ENTS BY SECTOR AND IlAIN AGENCIES, 1961-74
(In illions U of U.S. dollars)
Agenc-' s Sector's
1961 1962 1963 1964 1965 1966 1967 1968 1969 1970 1971 1972 1973 1974 1961-74 sector le- di- tore 1-din
AgrSi-l t-r'BRD - - - - - 16.7 9.0 - 35.3 - 8.1 5.0 - -
74.1 25 2
IDB - _ - 8.0 - 9.7 22.9 10.8 13.9 1.0 - - _ 6.0 72 3 24 S
AID 8.0 _ 10.0 4.0 16.5 - 15.0 15.0 15.0 28.0 30.8 - 142.3 43.3
SlcSobas2k - 2.5 - _ 3.4 _ _ _ - - - _ - 5 9 2 0
Sobti[otl S.0 _ 12.5 12.0 - 46.3 31.9 25.8 64.2 16.0 36.1 35.8 - 6.0 294.6 100.0 11.4
IBRD - - - - - - 16.0 - - - 15.0 - - - 31.0 94.9
IDB - - - - _ - - _ _ _ _ _ _ _ _
Asicear.k _ - .. - - - - 17 - _ _ _ _ 1.7 5.2
Othtotcl - - - - - - 16.0 - ;.7 - 15.0 - - _ 32.7 100.0 1.3
Ed-ceai-IBRD - - - - - - - 7.6 - 6.5 - - 21.2 - 35.3 25.5
IDB - - - 1.1 1.0 13.0 - 6.6 - - - 5.9 - - 27.6 19.9
AID - - - - _ - - - 10.0 15.0 20.0 20.5 - 10.0 75.5 54.6
Subcotal _ - _ t. 1.0 13.0 - 14.2 10.0 21.5 20.0 26.4 21.2 10.7 138.4 100.0 5.4
InduostryIRD - - 37.C - - 25.0 - 12.5 25.0 - 40.0 - 60.0 - 192.5 67.4
130 0.7 0.7 13.0 5.1 - 3.0 10.1 - - - - - -36.6 12.8
AID - - - 9.6 - - - - 10. 2.1 - - - -21.7 7 .6E.iob-nk - 3. -_ 3.5 4.0 - - 9.5 6.7 0.9 0.3 0.3 6.3 34.9 12.2
0c6:oral 0.7 4.' 45.0 13.1 9.1 25.0 5.0 32.1 41.7 3.0 40.3 0.3 60.0 6.3 285.7 100.0 11.1
PowerTBRD 22.0 50.0 13.8 45.0 _ - - 36.0 - 52.3 - - 56.0 - 275.1 48.6
IDB - - - 11.2 11.4 - - 61.9 - - 78.9 - 2'.2 3.4 240.0 42.4
AID - - - 1.3 - - - - - - - - - - 1.3 0.2
Loirbeok - _ _ 16.4 - _ - 2.0 4.2 0.0 13.2 - 10.1 - 49 6.0
Scbootal 22.0 10.0 13.8 73.9 11.4 - - 99.9 4.2 53.3 92.1 - 6. 66.3 100.0 72 0
Iransportat Loo00RD & IDA 39.0 - 30.0 - - _ _ 35.5 - 32.0 - _ 23.0 5&. 53.4
i2.B - _ 10.0 - 5.0 - - 12.7 32.2 16.1 - .C7.0 29.8
A.7t 9. - _ - - - 23-5_ - -- - - -.. tl=De.zk .....9 0 25.5 _ 8.S 9.3 - 32 I -37 : 7.8 _
S7StotcI 48.0 - 40.0 _ 5.0 - 25.5 48.2 4_.0 48.1 9.3 - 39. 1 3C22 1.c 17
Water 4 Sowerageei03R - - - - - - - 14.0 - 18.5 90.0 9.1 - 131.6 64.1
iDB 18.8 10.7 - - 4.8 - 0. - - - 12.3 55. 27.1
ATD - - 3.7 3.6 - - - - - - 7 - - 3. S 5.7
athmba-k - - _ 2.3 - - - 4. - - -
3 o a' 10.0 10.7 1.7 2.9 4.3 - - 18.0 9.1 18.5 90.0 9.1 10.7 .0
Ot:.e- - - -- - - - 8.0 38.C 5.1015.7 0.6 - 10.0 0.; - - 13.3 7.3 6.0 - 44.0 - - 90.4 12.1
_D 12.0 97.3 1.0 5C.0 43.8 - 98.2 57.9 60.3 40.0 34.3 37.7 19.4 - 55.6 76.7
-,;t,et6 45.4 _ _ _ - - _ _ - 3.2 - '4 6.3
3osoc 73.1 97.9 5.0 41.3 64.3 - 96. 2 -1 . 64.3 46.2 34.3 111.7 5.14 C.
TC- .- A- I SECTORS
-Rt. & I3A S1.0 1C.0 73.8 4-.3 - 41.7 :5.0 105.4 60.3 109.3 153./'033.2 12.0 25.0 30.3 07.0 22.7 27.9 1:15.2. 35.3 23.1 76.4 443 3.1 ~
A7D 20.0 97.3 06.7 93.5 63.0 16.3 98.2 72.9 350. 72.1 82.3 04.0 14 5 .3 .2 322Eximbank 54.4 3.4 2.3 24.2 4.0 3 4 25 .1 22. 4.3 7.4 198.4 7c_
GRAND T71AL 170.6 162.7 120.0 16;.0 95.6 84.3 176.6 309.4 232.2 206.6 337.1 183.3 228.1 107.0 2,575.3 100.0 100.0
a! Inclodes h loghin, pre-eie-t-ast st.di.a fioaseiog, cod so-e AID pregra- loant. (Where poseible ge.er-al import -oses are -asig-e- o sector for stooto porchased goods aere destined).
D/ Osclde USS030 ..il i .o second tlasehe of Peag-ca cod Eaport Promoe-ie Lesn eanoelled in 1973.
Source: 13hD

Table 11,1 -COLOMBIA: PUPIL ENROLLMENT IN PRIMARY SCHOOL, 1963-1973
(Thousands of Pupils)
Percentage Increase
1963 1968 1973 1963-68 1968-73
All Schools
Rural 781.8 998.8 n.a.
Urban 1,314.6 1,734.7 n.a
Total 2,o96.4 2,733.4 3,721.7 30.4 36.2
Public Schools
Rural 767.8 937.7 1,247.6 22.0 33
Urban 1,018.8 1,275.7 1,926.4 25.0 51
Total 1,786.6 2,213.4 3,174h0 24.0 43
Private Schools
Rural 13.9 61.o n.a.
Urban 295.9 459.0 n.a.
Total 309.8 520.0 547.7 67.8 5
Source: DANE (Boletin Mensual de Estadistica - April, 1972); and Ministry of Education

7able 11.2 - COLOMBIA: PUPIL ENROLLMENT IN SECONDARY SCHOOL, 1963- 1973
(Thousand of Pupils)
Course of Study Percentage Increaseand Schools - 1963--- --- 1968--- ---- 1973-- 1963-68 -968-73
.~~~~~~~ LAll Schools 3L4.9 100 586.7 100 1158.4 / 100 70 9?
Bachid"lratc - 202.0 59 405.8 69 908.3 78 101 124Industrial 15.1 4 27.8 5 41.4 4 8 49Commercia1 52.3 15 69.2 12 105.9 9 32 53Agricultural 3.6 1 7.9 1 13.1 1 119 66Education 2/ 47 7 14 54.2 9 56.6 5 L4 40th~r~ 2R 24.2 7 21.8 4 - - -' n.a.
:NMS 5 - - - - 33.1 3 -
Public Schools 142.7 100 272.8 100 588.2 k/ 100 91 116
Ba ihle !l vc 1/ 7507 53 177.6 35 430.8 73 1)3 14312.8 9 22.8 8 36.9 S 62
Comn rcia, 1 9.1 7 16.3 6 33.4 6 75 105Agr cul t-ra1 3.3 2 6.2 2 10.4 2 83 68EducatiozO 2/ 28.8 20 38.6 14 43.6 7 34 13
EM - - 33.1 6
0ths½r 3/ 13.0 9 11.3 5 13a.
PrIvate S3hcc1s 202.2 100 313.9 100 570.3 4/ 100 33 82
Ea_Zi~3-eratC 1/ 126.3 63 228.2 73 477.5 Ql 21 109TIS S!,_^E _ 2.3 1 ).0 2 4.5 1 117 -13
43.2 21 53.0 17 72.5 13 2.3 20- 2W-t~> / 18.9 9 15.6 5 13.0 2 -17 - 7
A A _ < 1 L a ° -0.3 ... 1.8 1 2.8 ... 222 5611.2 6 10.3 2 - - - -
! ?uCr-a1 LuZ'ricu1um
2/ Normralista - Preparation for teaching in primary schools
3/ ThncLudes religious, artistic, home economics, nursing.
4/ Does not include "others"
S i Aegligible.
Source: DANE, Ministry of Education

Table 11.3- COLOMBIA: ENROLLMENT IN COLOMBIAN UNIVERSITIES (PUBLIC AMJ PRIVA'TE)1963-1973
Percentz,age is--- L--- -1963---- ----1968---- --- 1973----- 1963-68 1968-7
/0 % %iTotal 35,162 100 65,144 100 124,236 100 35 g7
Administration andEconomics 2,809 8 7,268 11 30,868 25 159 325
Agriculture 2,726 8 4,114 6 7,138 8 51 7'4
Architecture andArts 3,275 9 4,806 7 6,109 5 47 27
Exact Sciences 806 2 1,210 2 3,062 2 50 153
Health 4,736 14 6,474 10 11,854 9 37 Q3
Social Sciences 1,439 4 3,210 5 5,477 4 123 ?1
Law 4,977 14 7,051 11 14,929 12 42 LIZ
Education 2,905 8 7,542 12 20,581 `1 160 -
Humanities 3,017 9 3,031 5 2,189 2
Engineering 8,216 23 12,693 19 22,029 i8
Others 256 1 7,745 12 - _ _
Source: ICFES - Estadisticas Universitarias

Table 11.4 - COLOIlIA s ENROLLMENT IN UNIVERSITIES ACCORDING TO TYPE OF PROGRAM AND COURSE OF STUDIES1973
Public Universities Private Universivies Total Universities
Longl/ Short2/ Post-Grad Long Short Post-Grad. Long Short Post-Grad.
Administration and Economics 7,781 440 45) 21,325 642 126 29,106 1,082 30,188Agriculture 6,846 40 - 133 119 - 6,979 159 7,138Architecture and Arts 2,183 355 - 3,054 517 - 5,237 872 6,109Exact and Natural Sciences 1,708 279 111 894 - 70 2,602 279 2,881Health 8,351 890 266 2,238 72 37 10,589 962 11,551Social Sciences 1,481 - 16 3,656 324 - 5,137 324 5,461Law 2,359 - 154 12,159 - 257 114,518 - 14,518Education 13,278 506 189 6,608 - - 19,886 506 20,392Humanities 544 28 19 1,348 199 51 1,892 227 2,119Engineering 12,707 861 215 7,620 614 12 20,327 1,475 21,802
Total 57,338 3,399 1,424 59,035 2,487 553 116,373 5,886 122,259
1/ At least 4-years duration
2/ From 3 semesters to 4 years
Source: ICFES - Estadisticas Universitarias

Table 11.5 - COLOMBIA: RATIO OF PUPILS/TEACHER AT EACH LEVEL, 1963-1973
1963 ------ - 1968 1973 ------Public Private Public Private Public Private
Primary School 40.4 22.8 35.5 13.6 36.2 21.9
Urban 41.7 22.8 33.5 12.9 37.5 n.a.Rural 38.8 26.7 38.7 22.6 34.5 n.a.
Secondary School
Bachillerato 15.1 11.9 13.8 8.9 23.9 17A4Industrial 12.8 11.5 11.4 6.2 15.7 15.8Commercial 12.8 11.7 12.1 8.2 20.8 15.4Education 12.0 10.5 11.7 7.4 18.6 12.4Agriculture 11.0 15.0 10.3 9.0 13.6 12.7INEM - - - - 10.2 -
1971 1973Universities Public Private Public Private
Administrationand Economics 34 28 37 30Agriculture 13 16 14 20Architecture and Arts 6 16 8 18Exact and Natural Sciences 3 10 3 9Health 7 7 7 7Social Sciences 9 16 8 18Law 18 24 16 30Education 27 19 29 21Humanities 2 12 1 11Engineering 13 18 14 21
Total 10 19 11 22
Source: DANE - Boletin Mensual de Estadistica - April 1972Ministry oP EducationICF$S

Table 11.6 - COLOViBIA: DROP OUT RATES AT ALL LEVELS
Out of 1000 children arriving at age 7 Drop out rates
1. 770 enroll in the first grade of primary school 23% never go to school(600 in rural areas) (40% in rural areas)(780 in urban areas) (22% in urban areas)
2. 357 will enroll in the third grade 54% drop out before the third grade
3. 216 will complete primary school 72% drop out from primary school(218 in urban areas) (72% in urban areas)(36 in rural areas) (94% in rural areas)
4. 119 will enroll in first grade of secondary school 45% leave the educational system aftercompletion of primary school
5. 60 will complete the fourth grade 50% drop out before the fourth grade
6. 37 will graduate as "Bachilleres" (or equivalent) 39% drop out between the fourth andthe sixth grade
70% drop out from secondary school
7. 25 will enter the university 33% leave the educational system aftercompletion of secondary school
8. 11 will graduate as "Licenciados" 44% drop out of university.
Source: Prepared by Daniel Ceballos Nieto, January 1974.Quoted in: Carreras Tecnologicas - Una Necesidad - ICFES, 1974, p 1.

Table 11.7 - COLOMIBIA: EDUCATIONAL LEVEL OF THE LABOR FORCE, 1951-1970
(Percentages)
Educational Level Total Men Women
-151 - - - - - - - - -Total 100.0 100.0 100.0
Primary 49.7 51.1 43.9Secondary 7.1 6.6 9.2University 0.9 1.0 0.3Other levels 1.2 0.9 2.6No instruction 41.0 40.1 43.9
- - - - - - --1964
Total 100.0 100.0 100.0
Primary 60o6 61.8 55.8Secondary 9.1 8.9 9.9University 104 1.5 0.8Other levels 28.9 27.7 33.5No instruction - - -
- - - - - - - - 1970 _
Total 100.0 100.0 l00.0
Primary 60.3 62.6 53.6Secondary 17.2 *408 24.3University 2.4 2.7 1.6Other levels 1.0 0.7 1.9No instruction 19.2 19.3 18M6
Source: 1951 and 1964 censuses, and 1970 DANE Encuesta de Hogares.

Table 11.8 - COLOMBIA: TEN MAIN CAUSES OF DEATH AMONG PRE-SCHOOL CHILDREN
AND TOTAL POPULATION - % OF ALL DEATHS
Under 1 1-4 years Total Population
Illnesses of the respiratory system 24.6 21.5 13.7
Perinatal illnesses of early childhood 21.5 - 5.
Illnesses of the digestive system 19.6 24.7 12.4
Other infectious and parasitic diseases 9.4 13.0 6.1
Ill-defined or unknown causes 9.2 11.4 10.6
Avitaminosis and other nutritionaldeficiencies; Anemia 7.8 13.9 6.4
Birth defects 2.8 -6
Cardio vascular diseases 1.0 1.5 19.5
Accidents, violence and intoxications 0.8 4.4 9.3
Ancylostoma and other Helminitiasis 0.6 3.4 _
Illnesses of the genito-urinary system - 1.2 _
Tuberculosis 1.1 1.9
Tumors 7.3
Source: DNP - La Mortalidad en Colombia segun Edad, Sexo y Grupo de Causa- 1956-1972. Octobre 1974

Table 11.9 - COLOMBIA: MAIN CAUSES OF DEATH AMONG CHILDRENUNDER AGE 4, 1972
(Rate for 10,000 Born Alive)
Under 1 1 to
Illnesses of the respiratory system 174.7 15.7
Intestinal infectious diseases 153.1 18.3
llnesses of the early childhood 141.4 ...
Ill-defined or unknown causes 66.0 8.5
Antaminosis and other nutritionaldeficiencies 57.2 10.4
Birth defects 20.8 ...
Other infectious and parasitic diseases 20.7 2.0
Whooping cough 12.1 1.9
Tetanus 11.4
Accidents, violence and intoxications ... 3.3
Measles .. 3.3
Ancylostoma and other Helmintiasis ... 2.6
Source: DANE (National Statistical Office)

Table 11.10 - COLOMBIA: INDIRECT INDICATORS OF NUTRITIONAL STATUS, 1963-1971
--- e-S-hOOl CIldi ercentage oIInfant mortality rate7 (A) under 5 year- Measles mortality Rate of mortality by
Years tortality (1-4 year-old) old miortality rate among less intestinal infectiousrate* (B) in general than 5 year-old diseases among under
(A) (B) mortality children 5 year-old childrenm7
1963 88.2 13.8 6.4 50.3 5.7 6.7
1964 83.2 13.3 6.3 48.2 5.7 6.51965 03.8 12.6 6.7 47.9 7.9 6.7
1966 80.0 10.6 7.5 46.5 4.0 6.11967 78.3 11.4 6.9 46.7 6.8 6.11968 76.0 9.7 7.8 46.4 7.0 4.91969 73.3 9.5 7.7 43.1 6.3 4.11970 (1) 70.3 9.4 7.5- 40.1 4.5 3.11971 (1) 67.9 9.2 7.4 39.0 5.7 3.5
Mexico/69 (2) 68.4 8.9 7.7 44.1 1.4 1.3
Switzerland/69(2) 11.6 0.5 23.2 - 0.0 0.0
U.S.A./67 (3) 22.4 0.8 28.0 0.0 0.4
i Rate for 1000 born aliveRate for 1000 of the respective age groups
-'s* Rate for 10,000 of under age 5
(1) Ministry of Public Health - Informe al Honorable Congreso de la Republica de Colombia, 1971-72.(2) WHO - Handbook of Sanitary Statistics, 1969(3) WHO - Handbook of Sanitary Statistics, 1967
Source: I.C.B.F. - El Problema Nutiscional y Alimentario de Colombia - Bogota, 1974.

TABLE 11.11 - COTOMBIA: RECOMMENDATIONS AND AVAILABILITIESIN CALORIES AND NUTRIENTS FOR THE COLOMBIANPOPULATION, AND PERCENTAGE OF ADEQUACY, 1972 /
CaNories and Recommendations Availability Percentage ofNutrients Adequacy
Calories 2,150 2,251 104
Proteins 56.3 g. 47.0 g. 83
Calcium 670 mg. 611 mg. 91
Iron 13.0 mg. 13.1 mg. 100
Vitamin A 4,150 U.I. 3,046 U.I. 73
Thiamin 0.8 mg. 0.8 mg. 100
Riboflavin 1.3 mg. 1.0 mg. 77
Niacin 14.3 mg. 11.1 mg. 78
Vitamin C 45 mg. 96 mg. 213
1/ k.,erage daily per capita recommendation for the population
Source: I.C.B.F.

Table 11.12 - COLOMBIA: PERCENTAGE OF ADEQUACY OF CALORIES AND NUTRIENT CONSUMPTION IN THE DIET
OF 1,400 FAMILIES FROM VARIOUS GEOGRAPHICAL AREAS, 1972
Regions Calories Proteins Tron Vitamin A Calcium Tlhinmin Riboflavin Niacin Vitamin C
1. Atl1ntico, C6rdobaGuajira, Bolivar 97 87 72 49 48 70 54 58 132
2. Antioquia, Caldas,Quindio, Risaralda 89 76 103 45 57 32 71 68 449
3. Choc6, Valle delCauca, Cauca 106 96 82 104 87 86 87 54 166
4. Bogota, Boyac&,Cundinamarca 99 98 127 59 69 15 93 84 255
5. Meta 106 111 15 87 72 13 98 80 223
6. Nariflo 92 93 102 76 44 96 63 75 219
7. Norte de Santander,Santander 96 94 110 68 70 96 81 8L 223
8. Huila, Tolimia 77 75 88 59 45) 72 56 63 181
9. National Teri-itories 97 96 li85 67 83 76 92 68 198
TOTAL 94 88 102 64 63 100 75 75 256
Source: I.C.B.F.

Table 11.13 COLOMBIA: COMPARISON BETWEEN ANNUAL NEEDS FOR BASIC FOOD GROUPS FOR HUMAN CONSUMPTION
AND THEIR AVAILABILITY, 1966-1972
(Thousand Metric Tons)
M:K MEAT----- LEGUMES- - ------ CEREJ:S---- -Years Needs Avail. Needs Avail. % Needs Avail.JNed Ai1 j
1966 22401,4 1227.0 50,3 814.7 532.7 65.4 202.7 139.8 69.0 1595.9 1572.3 98.51967 2522.9 1301.0 51.6 841.0 600.2 71.4 200.3 158.7 75.8 1647.4 1391.9 84.51968 2601i7 1372.0 52.7 867.2 641 1 78.0 215.8 174.9 81.0 1698.8 1629.0 95.91969 2680.6 1446.0 54.0 893wS 740.2 82.8 222.4 166.7 74.9 1798.3 1562,4 89.31970 2772.5 1412.0 50.9 9214,2 745.7 80.7 230.0 170.4 74.1 1810.4 1629.8 90.01971 2856.0 1691.2 59.2 872,0 715.9 32.1 240.0 140.7 58.6 1831.0 1995.0 108.91972 2946.0 2641.3 89.6 900.0 683.5 75.9 247.0 100.5 40.7 1889.0 1977.0 104.6
---- VEGETABLES FRUIT- - FATS-Years Needs Avail. a Needs Avail.. % NedsAvail. %
1966 597,1. 223.4 37.4 3740.5 1853.5 49.6 163.7 99.8 61.01967 616.3 230.4 37,4 3861.1 2034.3 52.7 169.0 74.1 43.81968 635,6 256.2 40.3 3981.8 1924,5 48.3 174.2 99.7 57.21969 654.8 264.4 40.4 4102.4 2114.6 52.2 179.5 103.4 57,61970 677,3 326.7 48.2 42b3.2 2105.9 49.6 185.7 115.3 62.21971 610.0 335.4 58.3 2507.0 2588.2 103.2 196.4 164t.2 83.81972 630.0 392.7 62,3 258600 2152.1 83.2 202,0 128.4 63.6
Source: I.C.B.F. Food balance sheets
Note: Does not include the part of production for seeds, fodder, manufacturing and export.

Table 11.14 - COLOMBIA: PERCENT ADEQUACY OF FAtfl.LY DIETARY INTAKFE OF CALORIES AND NUTRIENTS P.ER CAPLTADN TEN URBAN AND RUIAt, AREAS, BY SOCIO-ECONONJ.U LEVEMS, 1963-1966 /
Area & Socio- Vitamin Vitair&nE5conomic Level Faml.lies Calories Protoins Calcium Iron 11p Tbiamr:ino Ribof1avjn F.e.ln "C"
Urban
High 2l 114 126 87 165 135 110 110 1,24 200Middle 16 93 ., J06 69 112 107 77 92 102 148Low 9 80 8G )!3 108 54 67 55 87 101Very Low 44 76 67 39 109 56 82 47 77 91
Rural
High 10 98 97 66 124 8)T 98 74 95 216Middle 15 87 82 49 140 -6 88 60 93 161Low 47 90 82 54 125 68 77 68 94 192Very Low 94 77 64 ho t o8 8 _4
All levels 166 83 72 46 15f 83 61 90 178
1/ Based oux a comparative standard (A.' 100
Source: 1CBIF

Table 11.15 - COLOMBIA: SUPPLY AND DEMAND OF "CERTIFIED"AUXILIARY NJRSES, 1975-1990
Supply 1975 1980 1985 1990
(A) with 5% annual 8,267 12,981 16,890 19,844attrition rate
(B) with 10% annual 7,750 10,449 12,313 13,414attrition rate
Demand
(C) with one AN per 15,427 17,656 20,336 23,5752,500 rural population
(D) with one AN per 5,000 13,364 15,378 17,811 20,648rural population
Shortage
(A) - (C) 7,160 4,675 3,,446 3,731(A) - (D) 5,097 2,397 1,921 804(B) - (C) 7,857 7,207 8,023 10,161(B) - (D) 4,039 2,915 3,065 4,397
Source: IBRD - Population and Nutrition Projects Department, A Reportof a Population and Nutrition Reconnaissance Mission to Colombia,March 4L-. 197.