Economic Complex Networks - Edgar van Boven
266
Economic Complex Networks a holarchy of evolving sectors 1
-
Upload
khangminh22 -
Category
Documents
-
view
1 -
download
0
Transcript of Economic Complex Networks - Edgar van Boven

Economic Complex Networks a holarchy of evolving sectors
1

2

Economic Complex Networks a holarchy of evolving sectors
Proefschrift
ter verkrijging van de graad van doctor aan de Technische Universiteit Delft,
op gezag van de Rector Magnificus Prof.ir. K.C.A.M. Luyben, voorzitter van het College voor Promoties,
in het openbaar te verdedigen op maandag 11 november 2013 om 15.00 uur
door Edgar Ferdinand Marcel van BOVEN HTS ingenieur elektrotechniek
geboren te Kloetinge
3
Dit proefschrift is goedgekeurd door de promotor: Prof.dr.ir. N.H.G. Baken Samenstelling promotiecommissie: Rector Magnificus, Voorzitter Prof.dr.ir. N.H.G. Baken, Technische Universiteit Delft, promotor Prof.dr. B.M. Balk, Erasmus Universiteit (Rotterdam School of Management) Prof.dr.ir. J.A. van den Brakel, Universiteit Maastricht Prof.dr.ir. P.F.A. Van Mieghem, Technische Universiteit Delft Prof.dr.ir. R.E. Kooij, Technische Universiteit Delft Dr.ir. H. Wang, Technische Universiteit Delft Dr.ir. R. Hekmat, KPN Royal ISBN 978-94-6186-201-3 This Research was funded by KPN Royal. Keywords: Complex Networks, Economic Activity Classification System, Econophysics, Functions, Holon, Input-Output table, Sector, Telecommunications, Trans-sector Innovation. Copyright © 2013 by E.F.M. van Boven All rights reserved. No part of the material protected by this copyright notice may be reproduced or utilized in any form or by any means, electronic or mechanical, including photocopying, recording or by any information storage and retrieval system, without written permission from the author. Printed in The Netherlands
4

to Olga
5

Acknowledgements At the point of finishing this project I would like to thank the colleagues, acquaintances and family for all their support, inspiration and willingness to share knowledge and experience. Fortunate with the many people who have contributed to this adventure, firstly I express my gratitude to the community that facilitated my research. Thank you Professor Nico Baken for the rare kind of freedom that allowed for thinking at a global scale and far ahead in time, Ger Behonek for opening KPN’s doors to this research, Regine von Stieglitz for the trustful conjunction of decision makers, Joost Farwerck for agreeing and Edwin Jongejans for safeguarding the finalisation of the research against all odds. Becoming a NAS member, I am particularly indebted to Professor Piet Van Mieghem guiding my first steps in complex network science (and encouraging me to let economic data speak) and Huijuan Wang reaching out to connect our research domains (which seemed so difficult to bridge). Sharing your knowledge and wisdom, inspired towards uncovering some of the secrets of weighted economic networks. I sincerely hope our endeavour has not come to an end as we seem to be at the verge of a next step in econophysics. I thank Antònio Pinto Suarez Madureira for teaming up. Initially, being alone together, we noticed that our trans-sector challenges were quite different from what our PhD colleagues at NAS were doing. Our discussions helped us find our ways, agreeing that whatever we would publish, it should be clear. Looking back, it is impossible to express my luck entering Statistics Netherlands for an explorative meeting chaired by Eric Wassink early January 2008. The willingness of key experts to participate in a research initiative, has led to more than five years of knowledge sharing, indispensable multi-disciplinary interaction and aid in navigating through massive amounts of statistical publications. I thank Hans van Hooff (currently the very last Dutch methodologist active in economic activity classification systems) for actively sharing your experience, the great many vivid conversations, phone calls and lengthy chains of email. I am grateful and thank Taeke Takema for explaining and providing the Dutch Input-Output tables that constituted the fundament for the network analysis. Finally, the Statistics Netherlands connection has led to the involvement of Professor Jan van den Brakel and Professor Bert Balk leading to the inclusion of the German economic network in the research yielding valuable insights from comparing Germany and the Netherlands. I thank you both for your feedback and for participating in the promotion committee. Furthermore, I thank the committee members Ramin Hekmat for co-publishing, encouraging the vital sectors study (and your crystal-clear lectures on graph theory) and Professor Rob Kooij for joining the analysis team on telecom functions and for our inspiring interaction since the late 90s. I express my gratitude to the NAS members Ebisa Negeri, Christian Doerr, Fernando Kuipers, Yue Lu, Siyu Tang, Javier Hernandez, Anteneh Beshir, Cong Li, Ruud van de Bovenkamp, Almerima Jamakovic, Milena Janic, Jasmina Omic, Wynand Winterbach, Norbert Blenn, Tom Kleiberg and (from WMC) Professor Jos Weber, Jinglong Zou and (from TBM) Marc de Reuver and Professor Harry Bouwman for your support, sharing your knowledge and passing on relevant publications. I thank Bingjie Fu in particular for translating the Chinese economic activity classification system and Wendy Murtinu for your crucial operational support, helping me through that mountain of action items. Marlies van Steenbergen, Noor Huijboom, Rob Reitsma and Rogier Noldus, thank you for strengthening my confidence. Indeed, a PhD project can be done part-time, complementing our challenging work “outside” the university. At the campus one can experience a second or (in my case) a third youth. Learning from a decade of interaction with more than a hundred young master talents is an unprecedented phenomenon. From this community, the contributions of Jos Berière, Lars de Jonge, Wim van de Lagemaat, Shahin Mesgar Zadeh, Carolyn Simmonds Zuñiga, Aarabi Krishnakumar and Mohammad Hosseini deserve highlighting. Beyond expectations the thousands of working hours on your
6

Master thesis projects have clearly boosted the knowledge in and around the research team of Professor Nico Baken. This I witnessed and never shall I forget the intensity and the insights that each of your adventurous theses have brought. Hopefully each of you can spread or carry our work towards the 22nd century. Together we learnt that successful dissemination of ideas worth spreading, requires the art of storytelling and visualisation. Hereby I thank Jim Stolze, Randolph Plomp and Yolanda Bakker who master this dimension and helped to communicate the messages from a labyrinth of trans-sector content.
For co-publishing and sparring I thank Annemieke de Korte, Ludmila Menert, Frank den Hartog, Rob Reitsma, Bert Feunekes and the following telecom professionals currently active within KPN: John Hoffmans for participating in the analysis of telecom functions and your support on crucial moments, Harm Mulder for showing how to deal with a mission impossible and quoting Dilbert to keep spirits up, Nico van Belleghem for giving ICT support and frolicking towards those rare moments of success, and Willem Hollemans for your clear sketching and analysing the effects of contemporary (ICT) governance. Furthermore I thank the KPN colleagues Pieter Veenstra for mastering the forces necessary to set things in motion before anyone else notices, Jack Tuyt for your prophecies, Stefan Satijn & Tim Ensing for load balancing our LCM work over our precious time, René Fehling for rendering your magic and creativity, Marieke Fijnvandraat for shedding light on the black hole of contemporary decision making, Coen Pegels for sharing interesting publications accompanied by personal connotations, Martin Janssen for sharing telecom market data and ancient telecom literature, Peter Maarten Westerhout for showing how to give the most powerful ET4-034 lecture, Jan Garnier & Ig Nieuwenhuis for your uncompromising feedback and sharing your vast experience, Wouter de Vries for your lucid analytics, Ed Sloot for filtering contemporary management jargon, Marko Krcevinac for pointing out some fundamentals about mankind, Marten Rooimans for your music and elegantly formulated observations, Bert Blom for encouraging me while traveling, Rob Poland & Frans Bak for the in depth reflections in the safety of our office and Han Naber for safeguarding my disk drive and pointing out that there exists a life outside work. I would like to acknowledge the former KPN colleagues Marco Kind, Sander Tolsma and Franklin Selgert for their contributions to the research. I thank Peter Quatfass for our lengthy discussions especially during our cycling weekends, Frans Stoffijn for revealing F4CC (the ultimate isomorphism) and Ad de Vogel for your wise and sometimes hilarious propositions such as “Niet iedere volzin is zinvol”. Thank you Ludmila Menert for pointing out the same in other words: “Less is more”. During the final stage of my research this advice proved to be crucial. Writing down in clear language what grew in seven years is difficult, in particular for engineers like me that strive for completeness and precision. I thank Kees Koster for explaining the meaning of key terminology from ancient Greek and Latin sources and Erik de Vries ever supportive, active and vivid since we met in the early 80s. To Marc de Crom I am indebted, particularly for your indispensable comments on my attempts to approximate clear English wording. Thank you for feeding me and “paranymphing” together with Hans on St. Martin’s Day (11-11), that very day of sharing. Finally I complete my acknowledgements by thanking Olga for your endless patience, support and devotion. When you were allowed to enter the Netherlands in 2006, my dual work was already on-going, scarcely leaving room for us both. Especially the great loss in our family coming across during the finalisation of my dissertation, made us look ahead. Looking forward to the years to come, to enjoy life together. Edgar van Boven
7
Table of contents
Chapter 1 Introduction ………………………………………………………………….
1.1 Problem statement ………………………………………………………...1.2 Literature overview ……………………………………………………….1.3 Research objective ………………………………………………………..1.4 Research questions .……………………………………………………….1.5 Research domains and relevance ………………………………………….1.6 Methodology ………………………………………………………………1.7 Structure …………………………………………………………………..
Chapter 2 Theoretical framework .……………………………………………………..
2.1 Theoretical Environment ………………………………………………….2.2 Classification systems …………………………………………………….2.3 Sector related models and their structure .………………………………...
2.3.1 Leontief Economic Model …………………………………….. 2.3.2 Value Chain concept …………………………………………...2.3.3 Integral Network Architecture method & model ………………2.3.4 STOF method & model ………………………………………..2.3.5 Open Systems Interconnection reference model .……………...2.3.6 New Generation Operations Software and Systems …………..2.3.7 ITU-T G.80x …………………………………………………..2.3.8 Framework for Cure and Care …………………………………2.3.9 IEC 61850 ……………………………………………………..2.3.10 Overview related models ………………………………………
2.4 Holons and Holarchy ……………………………………………………...2.5 Hypotheses ………………………………………………………………..2.6 Conclusions ……………………......………………………………………
Chapter 3 Sectors, economic activity classification systems and their evolution …….
3.1 What defines a sector and which ones can be distinguished? …………….3.2 Inventory and comparison of economic activity classification systems ….3.3 Evolution of sectors and economic activity classification systems ..……..3.4 Which functions characterise a sector? …………………………………...3.5 Conclusions ……………………………………………………………….
11
11121414151719
21
21262930323334353637394041424445
46
4650556063
8
Chapter 4 Sector network analysis ……………………………………………….…….
4.1 Classification systems visualised as networks .…………………………..4.2 Input-Output tables ..……………………………………………………...4.3 Analysis methodology of monetary flows from recorded statistical data ..
4.3.1 The first case study ..……………………………………………4.3.2 The second case study .…………………………………………
4.4 Comparing the German and Dutch economies as networks ..…………….4.4.1 Quantitative aspects .……………………………………………4.4.2 Hierarchical aspects …………………………………………….4.4.3 Distributions ……………………………………………………4.4.4 Correlations .……………………………………………………
4.5 Labour force trends ……………………………………………………….4.6 Vital sectors in a sector network context …………………………………4.7 Conclusions ………………………………………………………………
4.7.1 Conclusions from the data analyses .……………………………4.7.2 Intuitive conclusions ……………………………………………
Chapter 5 Modelling the sector network ………………………………………………
5.1 Contributions to theory …………………………………………………..5.2 The sector network model ..………………………………………………5.3 Alternatives and application of the models ………………………………5.4 Conclusions ………………………………………………………………
Chapter 6 Trans-sector innovation and isomorphisms .…………………………..…..
6.1 Isomorphisms …………………………………………………………….6.2 Results from a Trans-sector Innovation idea generation experiment .……6.3 Service bundle 2020 ...……………………………………………………6.4 Trans-sector Innovation combinations .…………………………………..6.5 Conclusions .………………………………………………………………
Chapter 7 The telecommunications related sector .……………………………….…..
7.1 Communications value offered to the sector network ……………………7.1.1 The OECD alternative aggregation .……………………………7.1.2 Definitions related to communications .……………………….
7.2 The functions of telecommunications .……………………………………7.3 A telecommunications hierarchical graph ..………………………………7.4 A contemporary double paradox ………………………………………….
7.4.1 The responsibility paradox .…………………………………...7.4.2 The communications business paradox ……..………………...
7.5 Conclusions ………………………………………………………………
64
6566717173767782889299
103110110114
118
118122128129
130
130131135138142
144
144145148150152154155157162
9
Chapter 8 Conclusions .……………………………………………….……….…….…..
8.1 Main findings ……………………………………………………………..8.2 Hypothesis testing ………………………………………………………..8.3 Recommendations for future work ……………………………………….
8.3.1 Towards the next revision of ISIC .……………………………..8.3.2 Towards unravelling the definitional perspectives of sectors ….8.3.3 Economic network research …………………………………....
Summary .………………….…………………………………………….……….…….…....
Nederlandstalige samenvatting ……………………………………….……….…….……..
Curriculum vitae .……………………………………….……….…….………………….…
References ..………………….…………………………………………….……….………..
Appendices ..………………….…………………………………………….……….…….…
Publications .…………………………………………………………………..
Definitions ...………………………………………………………………….
Economic Activity Classification Systems .…………………………………..ISIC rev. 4 (United Nations) ....……………………………………….ANZSIC rev. 1 (Australia and New Zealand) .………………………..ICNEA 2011 (Republic of China) ...………………………….……….SIC of ROC 2002 (Republic of China) .……………………………….JSIC rev. 12 (Japan) .………………………………………………….NAICS 2012 (US, Canada and Mexico) ......………………………….OKVED 2010 (Russian Federation) ………………………………….
Observations from the World Input-Output Database 2012 ………………….
Telecommunications functions ……………………………………………….
Repository of assessed models ……………………………………………….
Symbols and Acronyms ..……………………………………………………..
164
165176178178180180
182
183
185
186
198
198
200
226226240241242243244245
246
248
256
261
10
Chapter 1 Introduction 1.1 Problem statement Most systems consist of connected sub-systems. This allows for viewing, perceiving and studying systems from a network perspective. Tangible examples of real networks are power-grids, roads, railways and telecommunications networks. In general, a network consists of a set of nodes interconnected by a set of links. Advances in various disciplines of science have provided evidence that networks can be distinguished on different scales [Barabási,2003],[Jamakovic,2008] and aggregation levels. Large systems of elements (nodes) and their interactions or relations (links) can be represented as complex networks [Van Mieghem,2011]. In this sense a national economy can be considered to be a complex network. Our society and economy have been decomposed into a network of networks that consists of interdependent sectors [Leontief,1936],[Bryson et al.,2006],[Miller&Blair,2009]. Phrased in complex network terminology: the sectors of an economic network are inter-linked nodes that together constitute a sector network. Roughly 11.000 years ago, the beginning of a major transition in human history took place. Nomadic families became colonists settling down in the first villages. This transition initiated the process of functional decomposition, also referred to as the division of labour [Kinneging,p227-240,2005]. Specialists took over vital and non-vital tasks previously performed by each family. As a result, productivity scaled up and the division of labour became an irreversible fact of life. In the work of Adam Smith (An Inquiry into the Nature and Causes of the Wealth of Nations) and Anne-Robert Jacques Turgot (Réflexions sur la Formation et la distribution des Richesses) [Hoyng,2011] the notion of the division of labour has been formulated and widely accepted as a fundament of economic science. At national level, [Hidalgo&Hausmann,2009] state that level of the division of labour is limited by the size of a country’s economy. The bigger the market, the more its participants can specialise and the deeper the division of labour that can be achieved. Outsourcing of tasks/functions is primarily based on trust relations [Fukuyama,1995] and supported by transactions. As money was gradually introduced [Pringle,1998], this trusted value symbol has simplified the exchange of value in a standardised way. Both the process of specialisation and the trusted ability to transact, has enlarged efficiency and thereby the scale of economy and society, continuously reshaping the sectors and their ever changing boundaries. In parallel, the evolution of physical transportation and communication arrangements have significantly reduced travel time and the cost of bridging distance and time, enabling the growth of economy and society all the way from local to global. Furthermore our economic and social activities have become less tied to geographical, organisational and political boundaries [Friedman,2005]. The limitations of our collective competency [Pearson,2006] and means to oversee, understand and govern the sector network (its dynamics, its structure, its resources and its interdependencies) are reflected in global system crashes such as the Internet bubble crash (2000 – 2003). Obviously, the current financial and economic crisis that announced itself in 2007 [Teulings et al.,2011], constitutes an unprecedented example and is now entering the sixth year of its existence. Though many explanations of its origin have been given, finding a way out of this crisis does not seem in reach. The need for an innovative approach to invention, tooling and orchestration at sector network level is getting stronger as the recent crisis proves to have a devastating impact on the welfare and well-being of a substantial part of the world population [Obama,2009]. The US government Financial Crisis Inquiry Commission [US FCIC,pxvii,2011] concluded that this crisis was caused by the failure of many different actors and could have been avoided if a trans-sector orchestration arrangement would have been in place (regarding the sectors of finance, government, real estate and household). In this thesis the term trans-sector refers to innovation, transactions, collaboration and orchestration
11
involving actors originating from two or more sectors. Although at enterprise level an orchestration need is evident too, the prime difference between orchestration at enterprise level versus sector level is that orchestration at sector level explicitly addresses the public domain while at enterprise level it is limited to the business domain. When examining steps to find a way out of the crisis by realising innovations and optimisations in a trans-sector manner, we need a thorough understanding of the different sectors, their interdependencies and the trends that influence their evolution [Ángeles
Serrano et al.,2007],[Helbing,2013]. A trans-sector approach from a network perspective can play a significant role here and possibly complex network theory may prove to be a helpful tool [Schweitzer,2009]. These approaches and the economic data sets, generously provided by Statistics Netherlands and Statistics Germany, have enabled this thesis’ complex network research of the German and Dutch sector network at various overlay levels. The main problem addressed in this thesis is the lack of understanding of the components, the structure and developments within and between sectors. The current inability to orchestrate the sector network as a whole illustrates this problem. This thesis endeavours to give a contribution to the understanding of our contemporary sector network by gathering knowledge on the structure, composition, functions, properties and dynamics of our current economic system and by applying complex network theory. 1.2 Literature overview Concerning innovation and collaboration, an abundant spectrum of literature is available. However, at the beginning of this thesis project in 2006, few publications were available that touched on the subject of trans-sector innovation. Bryson et al performed a literature review and proposed a framework for understanding cross-sector collaboration (published in “The Design and Implementation of Cross-Sector Collaborations: Propositions from the Literature”, 2006). Bryson et al provided 21 propositions concerning cross-sector collaboration with focus on complex public problems and public value. The authors present their view on this topic in which they argue that “organisations will only collaborate when they cannot get what they want without collaborating. In effective cross-sector collaborations organisational participants have to fail into their role in the collaboration”. The authors state that “in the United States the presumption is that we will let markets (for-profit sectors) work until they fail. Only in that case government intervention is allowed as a last resort to try fixing the failure”. A public-value-failure-model introduced in [Bozeman,2002] underlines the need to consider public values irrespective of market efficiency. According to Bozeman public-value-failure occurs when: - core public values are not reflected in social relations, either in the market or in public policy, - neither the market nor the public sector provides goods and services required to achieve core public values. The adjectives cross-sector [Roodink,2011] and trans-sector both appear in the literature to address the same concept but cannot be clearly distinguished. The adjective trans originates from Latin and has a broader array of meanings compared to cross. Within the context of innovation the adjective cross may associate somewhat more to the meaning through things while the meaning of the adjective trans seems to associate somewhat more to bridging things (e.g. trans-Atlantic and cross-country). Relating to trans-sector innovation, value chains [Porter,1985], value networks [de Reuver,2009] , joined-up ICT innovation [Huijboom,2010] and multi-actor business models [Bouwman,2008] are and have been researched intensely. In 2011, Madureira has provided a literature survey and proposed a Holonic Framework (HF) to account for the value of digital information networks, relating to trans-sector innovation with focus on the perspective of network evolution. The HF identifies 13 capabilities, which are defined as procedures that a holon [Koestler,1967] can use to navigate through streams of
12
information flowing through networks that potentially bring value. The HF can be used to explain evolutionary change in policy making, economy and biology. From the early 20th century on, many research initiatives have been devoted to studying economic systems e.g. by means of Input-Output matrices [Leontief,1936],[Miller&Blair,2009] and economic activity classification systems [ISIC,2008],[SBI,2009],[van den Brakel,2010]. The International Standard Industrial Classification of All Economic Activities (ISIC) provided by the United Nations Statistics Division, proved to be a prevalent source for this thesis, enhancing the study of sectors from various viewpoints. Interestingly, blending the research disciplines of complex networks (complex systems) and economic systems is relatively new and provides a viable and scientifically attractive combination commonly coined as economic networks. In 2009, Schweitzer et al stated in the paper Economic Networks: What do we know and what do we need to know? that economic networks and their dynamics is an emergent field of research and identifies a knowledge gap addressed in this thesis’ research. Schweitzer underlines the importance of the combination of massive data analysis, time series analysis, complexity theory and simulation with analytical tools that have been developed by game theory, graph and matrix theory This thesis requires a selection of vocabulary from various scientific fields. Chapter 2 discusses the central nomenclature of this thesis and accounts for the proposed selection serving for a limited amount of newly introduced vocabulary. The main views that have influenced the selection of the nomenclature are a) network view, b) hierarchy, c) economic activity classification and functional view. This for example resulted in the frequent appearance of the terms a) node and link, b) holon and sub-system, c) enterprise, organisation, actor, activity cluster, unique functions and non-unique functions which together constitute the sub-central nomenclature of this thesis respectively. Concerning functions, abundant literature is available [ITU-T G.80x],[Bunge,1979],[Barnes,1982]. The functions of economic (sub-)systems are considered relevant within the scope of this thesis, because of their strong interrelatedness with (economic) activities and the fact that these functions can be studied in a more abstract sense, apart from the objects in which functions can be implemented. In his treatise on basic philosophy, Bunge touches on recognition and characterisation of sectors and their sub-systems. He considers society as a system with the following properties: - Some members do labour, thus transforming the environment, - Every member shares information, services or goods with some other members of the same community. [Bunge,p194,1979] mentions two classical doctrines (holism versus individualism) dividing social philosophers over the nature of institutions and the proper way of studying them. Bunge claims that his systemic theory serves neither of these doctrines where to his opinion the individualistic view sees society as an aggregate of individuals, and the holistic view sees society as a mystic totality hovering above the individuals’ humble membership [Bunge,p241,1979]. Alternatively, Bunge regards human society as a system composed of persons bounded by social relations. Section 2.1 explains in more detail how his theory connects sectors, systems, networks and functions. Concerning the functions of digital information networks, extensive research, standardisation and modelling initiatives [ITU-T,1995],[OSI,1985],[eTOM,2002],[NGOSS,2004] took place, triggered by the need of telecom operators to interconnect their networks at different hierarchical levels. Section 2.3 and the Appendix Repository of assessed models discuss these related models in more detail. The telecommunications related sub-set of functions is considered relevant within the scope of this thesis as well, mainly because of their relative short existence and their substantial impact on the recent societal and economic developments. This thesis adds a trans-sector contribution to a gap in the literature. This gap regards our (orchestration of) contemporary networked economies by providing insight and overview from a multi-disciplinary approach that combines the research of functions in economic sectors, analysis of sector network value flows and lessons learnt from telecommunications related developments.
13
1.3 Research objective This thesis’ first aim is to contribute to the understanding of developments in real economic systems by applying advances and tooling from the field of complex networks on time series of sector network related statistical data. Initially, this research requires knowledge about economic activity classification systems, Input-Output analysis and the individual nodes of the sector network. Studying sector related models and the functions of sectors is imperative. Subsequently, the second aim is to design a novel sector network model and a sector model (generically applicable to any sector) both reflecting the main findings of this thesis work. Thirdly, this project aims to enrich the area of complex networks with new insights derived from studying real economic networks and the monetary flows between their nodes. From these flows the complex network properties of the Dutch and German sector network are researched in order to understand and compare their structure, their clustering and their development over time. Additionally, this research enables comparing economic networks to other types of real networks. From a valorisation perspective, the fourth aim of this project is to: - provide a (model-based) view on the classification methodology of economic activities that can help future international coordinated revisions of these classifications on the one hand, and the use of these classifications for classifying individual cases on the other hand. - provide a set of inter-sector isomorphisms, - generate promising trans-sector innovation ideas and understand the patterns and similarities, - visualise and explain the thesis results by means of animations and presentations for a broad (non-academic) target group. 1.4 Research questions Three research questions (RQs) have been selected out of many possible research directions that address the research objectives. RQ2 builds on a fundament provided by RQ1 and subsequently RQ3 builds on RQ2. Figure 3 in section 1.7 elucidates the inter-relatedness of RQs, SQs, chapters and sections. The first RQ and its six SQs address a) the definition of a sector, b) the current and historical sector inventory and c) the sector modelling part of the analysis: RQ1 What defines a sector and which ones can be distinguished? SQ1a Which functions characterise a sector? SQ1b Which specific and generic telecommunications related functions can be found? SQ1c Which relevant sector related data is available? SQ1d Which economic activity classification systems exist? SQ1e How did the sectors evolve? SQ1f Can we derive a generic sector model and what does it look like? The second RQ and its three SQs address a) the sector network definition, b) the comparison of the sector networks’ characteristics/properties with those of an inventory of other types of complex networks and c) the sector network modelling part of the analysis: RQ2 What is a sector network and how did it evolve? SQ2a Does the sector network constitute a complex network? SQ2b What are the main observations, properties and characteristics derived from sector network related data? SQ2c Can we derive a generic sector network model and what does it look like?
14
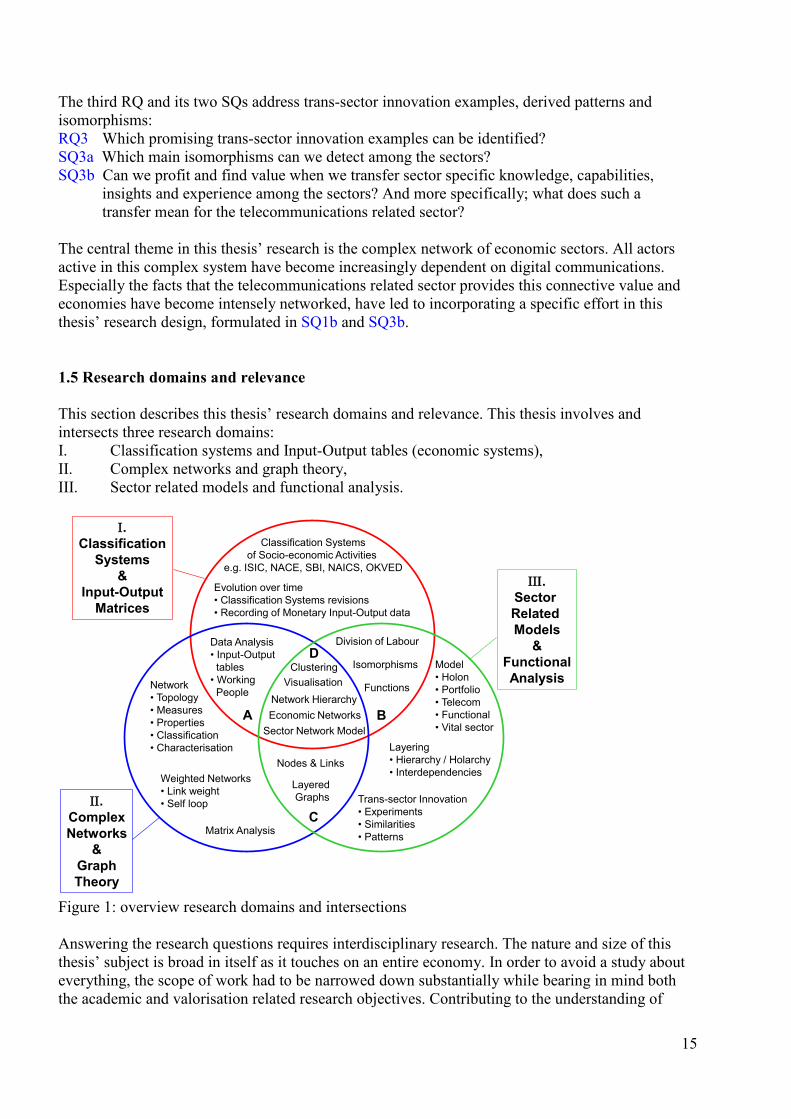
The third RQ and its two SQs address trans-sector innovation examples, derived patterns and isomorphisms: RQ3 Which promising trans-sector innovation examples can be identified? SQ3a Which main isomorphisms can we detect among the sectors? SQ3b Can we profit and find value when we transfer sector specific knowledge, capabilities, insights and experience among the sectors? And more specifically; what does such a transfer mean for the telecommunications related sector? The central theme in this thesis’ research is the complex network of economic sectors. All actors active in this complex system have become increasingly dependent on digital communications. Especially the facts that the telecommunications related sector provides this connective value and economies have become intensely networked, have led to incorporating a specific effort in this thesis’ research design, formulated in SQ1b and SQ3b. 1.5 Research domains and relevance This section describes this thesis’ research domains and relevance. This thesis involves and intersects three research domains: I. Classification systems and Input-Output tables (economic systems), II. Complex networks and graph theory, III. Sector related models and functional analysis.
Figure 1: overview research domains and intersections Answering the research questions requires interdisciplinary research. The nature and size of this thesis’ subject is broad in itself as it touches on an entire economy. In order to avoid a study about everything, the scope of work had to be narrowed down substantially while bearing in mind both the academic and valorisation related research objectives. Contributing to the understanding of
Ι.Classification
Systems&
Input-OutputMatrices
ΙΙ.ComplexNetworks
&GraphTheory
Network• Topology• Measures• Properties• Classification • Characterisation
Classification Systemsof Socio-economic Activities
e.g. ISIC, NACE, SBI, NAICS, OKVED
Functions
Sector Network Model
ΙΙΙ.Sector Related Models
&FunctionalAnalysis
Division of LabourData Analysis• Input-Output
tables• Working
People
Evolution over time• Classification Systems revisions• Recording of Monetary Input-Output data
Network Hierarchy
Clustering
Weighted Networks• Link weight• Self loop
Model• Holon• Portfolio • Telecom • Functional• Vital sector
Matrix Analysis
Visualisation
Isomorphisms
Layered Graphs
Nodes & LinksLayering• Hierarchy / Holarchy• Interdependencies
Trans-sector Innovation• Experiments• Similarities• Patterns
Economic Networks
D
A
C
B
15
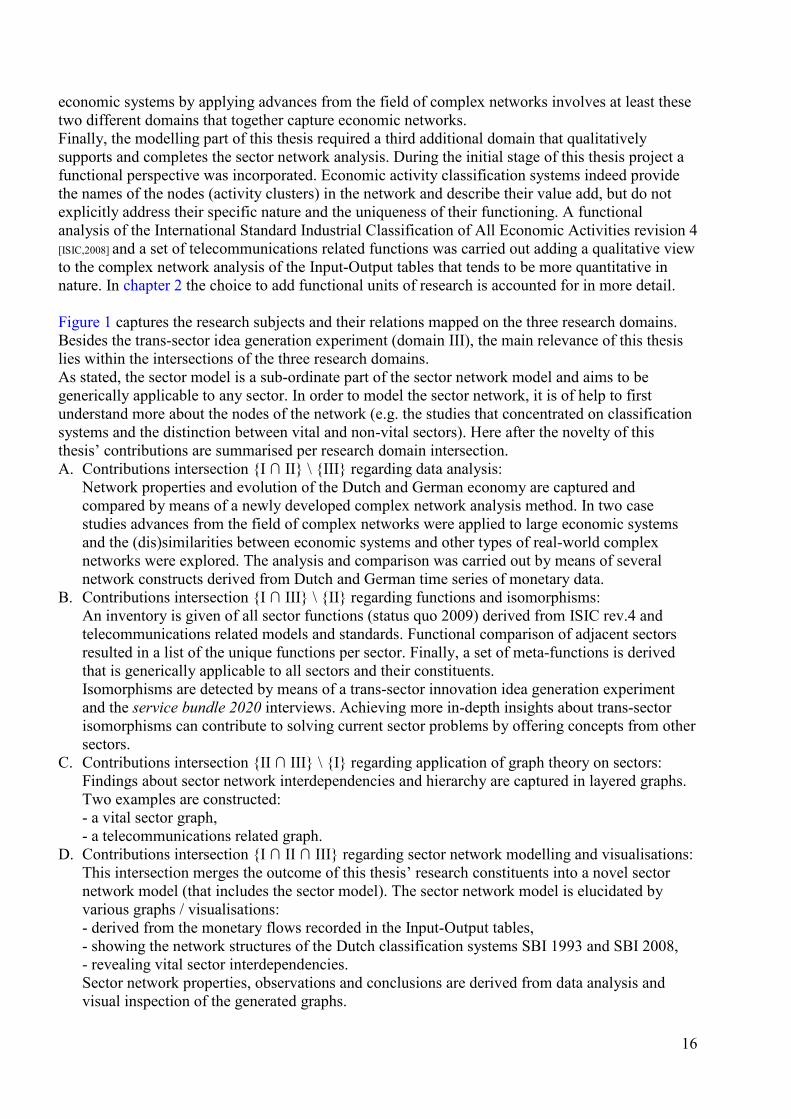
economic systems by applying advances from the field of complex networks involves at least these two different domains that together capture economic networks. Finally, the modelling part of this thesis required a third additional domain that qualitatively supports and completes the sector network analysis. During the initial stage of this thesis project a functional perspective was incorporated. Economic activity classification systems indeed provide the names of the nodes (activity clusters) in the network and describe their value add, but do not explicitly address their specific nature and the uniqueness of their functioning. A functional analysis of the International Standard Industrial Classification of All Economic Activities revision 4 [ISIC,2008] and a set of telecommunications related functions was carried out adding a qualitative view to the complex network analysis of the Input-Output tables that tends to be more quantitative in nature. In chapter 2 the choice to add functional units of research is accounted for in more detail. Figure 1 captures the research subjects and their relations mapped on the three research domains. Besides the trans-sector idea generation experiment (domain III), the main relevance of this thesis lies within the intersections of the three research domains. As stated, the sector model is a sub-ordinate part of the sector network model and aims to be generically applicable to any sector. In order to model the sector network, it is of help to first understand more about the nodes of the network (e.g. the studies that concentrated on classification systems and the distinction between vital and non-vital sectors). Here after the novelty of this thesis’ contributions are summarised per research domain intersection. A. Contributions intersection {I ∩ II} \ {III} regarding data analysis:
Network properties and evolution of the Dutch and German economy are captured and compared by means of a newly developed complex network analysis method. In two case studies advances from the field of complex networks were applied to large economic systems and the (dis)similarities between economic systems and other types of real-world complex networks were explored. The analysis and comparison was carried out by means of several network constructs derived from Dutch and German time series of monetary data.
B. Contributions intersection {I ∩ III} \ {II} regarding functions and isomorphisms: An inventory is given of all sector functions (status quo 2009) derived from ISIC rev.4 and telecommunications related models and standards. Functional comparison of adjacent sectors resulted in a list of the unique functions per sector. Finally, a set of meta-functions is derived that is generically applicable to all sectors and their constituents. Isomorphisms are detected by means of a trans-sector innovation idea generation experiment and the service bundle 2020 interviews. Achieving more in-depth insights about trans-sector isomorphisms can contribute to solving current sector problems by offering concepts from other sectors.
C. Contributions intersection {II ∩ III} \ {I} regarding application of graph theory on sectors: Findings about sector network interdependencies and hierarchy are captured in layered graphs. Two examples are constructed: - a vital sector graph, - a telecommunications related graph.
D. Contributions intersection {I ∩ II ∩ III} regarding sector network modelling and visualisations: This intersection merges the outcome of this thesis’ research constituents into a novel sector network model (that includes the sector model). The sector network model is elucidated by various graphs / visualisations: - derived from the monetary flows recorded in the Input-Output tables, - showing the network structures of the Dutch classification systems SBI 1993 and SBI 2008, - revealing vital sector interdependencies. Sector network properties, observations and conclusions are derived from data analysis and visual inspection of the generated graphs.
16
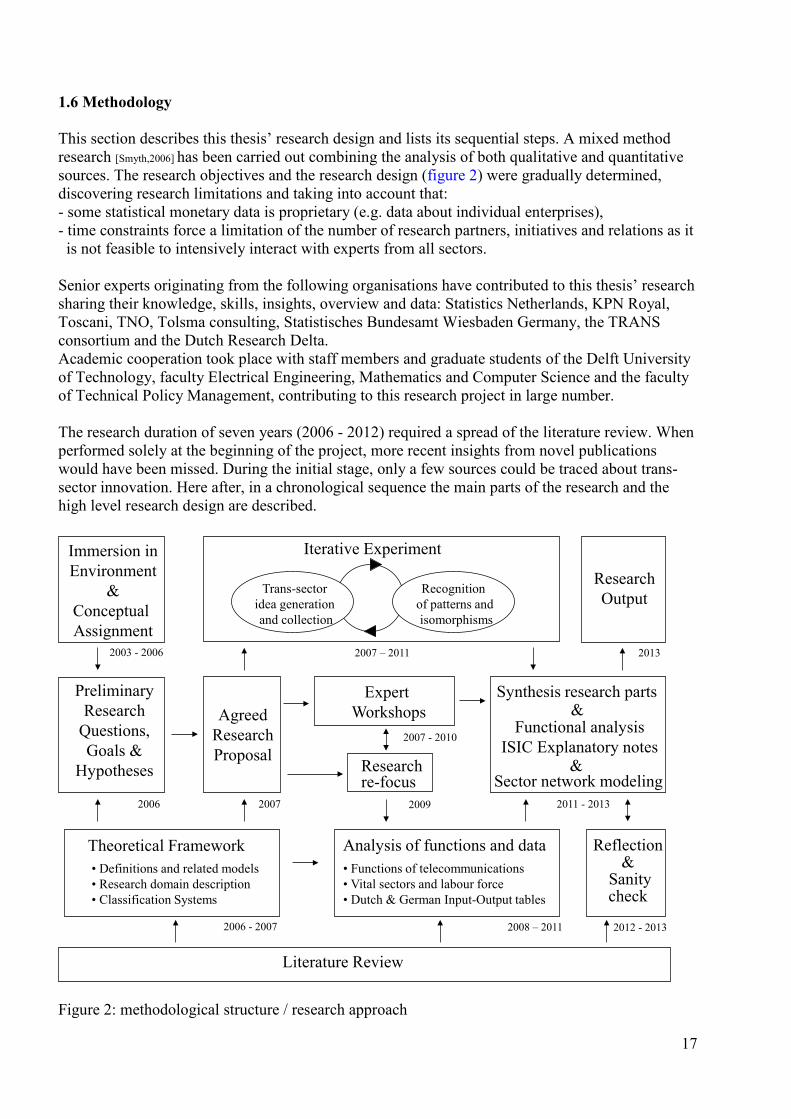
1.6 Methodology This section describes this thesis’ research design and lists its sequential steps. A mixed method research [Smyth,2006] has been carried out combining the analysis of both qualitative and quantitative sources. The research objectives and the research design (figure 2) were gradually determined, discovering research limitations and taking into account that: - some statistical monetary data is proprietary (e.g. data about individual enterprises), - time constraints force a limitation of the number of research partners, initiatives and relations as it is not feasible to intensively interact with experts from all sectors. Senior experts originating from the following organisations have contributed to this thesis’ research sharing their knowledge, skills, insights, overview and data: Statistics Netherlands, KPN Royal, Toscani, TNO, Tolsma consulting, Statistisches Bundesamt Wiesbaden Germany, the TRANS consortium and the Dutch Research Delta. Academic cooperation took place with staff members and graduate students of the Delft University of Technology, faculty Electrical Engineering, Mathematics and Computer Science and the faculty of Technical Policy Management, contributing to this research project in large number. The research duration of seven years (2006 - 2012) required a spread of the literature review. When performed solely at the beginning of the project, more recent insights from novel publications would have been missed. During the initial stage, only a few sources could be traced about trans-sector innovation. Here after, in a chronological sequence the main parts of the research and the high level research design are described.
Figure 2: methodological structure / research approach
Literature Review
PreliminaryResearch
Questions, Goals &
Hypotheses
Analysis of functions and data
AgreedResearchProposal
Synthesis research parts
Iterative Experiment
• Functions of telecommunications• Vital sectors and labour force• Dutch & German Input-Output tables
Trans-sector idea generation and collection
Recognition of patterns and isomorphisms
Immersion inEnvironment
&Conceptual Assignment
Expert Workshops
Sector network modeling
2003 - 2006
2006 2007
Theoretical Framework• Definitions and related models• Research domain description• Classification Systems
2008 – 2011
Reflection&
Sanity check
2007 – 2011
2007 - 2010
ResearchOutput
2013
2012 - 2013
Research re-focus
2009 2011 - 2013
2006 - 2007
Functional analysisISIC Explanatory notes
&
&
17
In May 2006, a stakeholder agreement formally acknowledged the research assignment*. This assignment (based on the outcome of a preceding three year orientation, an immersion in the environment of the research topic and a condensed domain study), resulted in a preliminary research proposal and hypotheses. Stated as a general rule of method, all envisaged research parts should follow the sequence; a) define, b) inventory and c) analyse. A next realisation step d) compose innovation instantiations, was declared out of research scope for feasibility reasons. In 2007, the agreed on research proposal initiated a high level sector related definitional study and an inventory of classification systems carried out in order to understand what a sector is. From the perspective of theoretical classification principles, classification systems were compared qualitatively and sector related models were selected for further study. In 2008, besides sector network visualisation efforts, an analysis was started regarding the functional inventory of sectors, taking the concept of transactions as a specific example. In 2009, a functional analysis of the telecommunications related sector was carried out (including layering, generic/specific functions and functional model assessment). An intermediate research evaluation resulted in a re-focus of the research directions and fine tuning of the research questions and sub-questions. As the initial research parts were mainly qualitative in nature, here after stronger effort was put on balancing the quantitative and qualitative research contributions more equally (adding data analysis cases and the set-up of the corresponding analysis methods). In 2010, the first quantitative case study concerning the Dutch Input-Output tables was carried out in cooperation with Statistics Netherlands experts. Additionally, the workshops in which these experts and complex network scientists from the Delft University of Technology have interacted, were of great importance validating the results and reviewing the research methodology. Vital sectors and their vital infrastructures were included in the research and distinguished from non-vital sectors by means of network analysis and visualisations from their monetary flows. In parallel, shifts in the Dutch distribution of the jobs of employees were examined and the service bundle 2020 interviews were carried out, revealing innovation trends and patterns. In 2011, the construction of the sector model and sector network model took place (which included comparison and assessment of the related models). A reflection on the 2010 research outcome at the Erasmus University resulted in a second quantitative case study allowing for the comparison of the Dutch and German economic networks from their 1987-2007 monetary Input-Output table data. In 2012, remaining work was completed by analysing: - the ISIC rev.4 explanatory notes regarding the unique functions of sectors, - quantitative shifts in the size of the Dutch labour force, enterprises and non-profit organisations, - the link density of the German and Dutch sector network at four different overlays derived from the 1987-2007 monetary Input-Output table data. Early 2013, a set of network properties was derived from the 1995-2009 time series in [WIOD,2012]**. Finally a synthesis of the conclusions, of which some intuitive, connected all units of research. (*) A beneficial side effect of a PhD project duration of seven years (instead of the more common four years), is the possibility to involve a substantial number of students contributing to parts of the research. The size and relevance of the outcome of the Trans-sector Innovation idea generation experiment (involving 114 master students) has been positively influenced by the above-average duration. In parallel, this time spread enabled the cooperation with seven master students in internships and MSc graduation projects related to this thesis. (**) The time series of 40 countries captured in the World Input Output Database were published in the course of 2012.
18
1.7 Structure This section describes the structure of this thesis. Figure 3 summarises which chapters and sections answer this thesis’ RQs and SQs. It is worth noting that the closing of the larger sections also gives its specific and more elaborate conclusions while the conclusions taken from the smaller sections are given in the final conclusive section of each chapter. Chapter 2 describes the theoretical environment of this thesis. It discusses the backgrounds of large systems analysis, holon theory, economic activity classification systems, Input-Output analysis and accounts for the selection of the central nomenclature. Definitions of the related vocabulary are collected in the Appendix (from various viewpoints). Regarding the selected sector related models, their added value, application area, purpose, structure and similarities are compared and discussed. Section 2.5 contains this thesis’ three hypotheses. Chapter 3 covers RQ1 and its SQs 1a, 1c, 1d and 1e, focussing on the analysis of individual sectors, economic activity classification systems and their history (mainly 1930 – 2008). Besides comparing the main (dis)similarities of these systems, the functions per sector were identified from the explanatory notes of ISIC revision 4 (see section 3.4). Concerning the functions of the telecommunications related sector, chapter 7 gives additional results. Chapter 4 covers RQ2, SQ2a and SQ2b, focussing on the analysis of the sector network. This chapter contains the design and results of the two quantitative analysis case studies. Furthermore, sector network visualisations from various viewpoints are presented and trends observed in the Dutch labour force are included. A complex network exercise is provided that builds on the results of a program carried out by the Dutch Ministry of the Interior and Kingdom Relations addressing the vital sectors and vital infrastructures. Chapter 5 presents the construction of the sector model (SQ1f) and subsequently the sector network model (SQ2c). Furthermore chapter 5 summarises this thesis’ contribution to theory. Chapter 6 focuses on trans-sector isomorphisms answering SQ3a and the generic part of RQ3 and SQ3b. This chapter exemplifies the main results and the patterns that were observed during a Trans-sector Innovation idea generation experiment and the service bundle 2020 interviews. Chapter 7 covers the telecommunications specific part of RQ1 (SQ1b) and RQ3 (SQ3b) and focuses on the unique value offered by the telecommunications related sector. Section 7.2 gives the results of the analysis of the telecommunications related functions, answering SQ1b. In section 7.3 the dependencies and hierarchy of current telecommunications platforms are examined and visualised. Section 7.4 discusses the trans-sector paradox applicable to contemporary telecommunications and completes the answer to SQ3b. Chapter 8 discusses the research results and joins the main conclusions from the chapters 2-7. Section 8.1 summarises the answers to the research questions and sub-questions. Section 8.2 assesses whether this thesis’ three hypotheses hold. Finally, recommendations for future work are suggested in section 8.3.
19
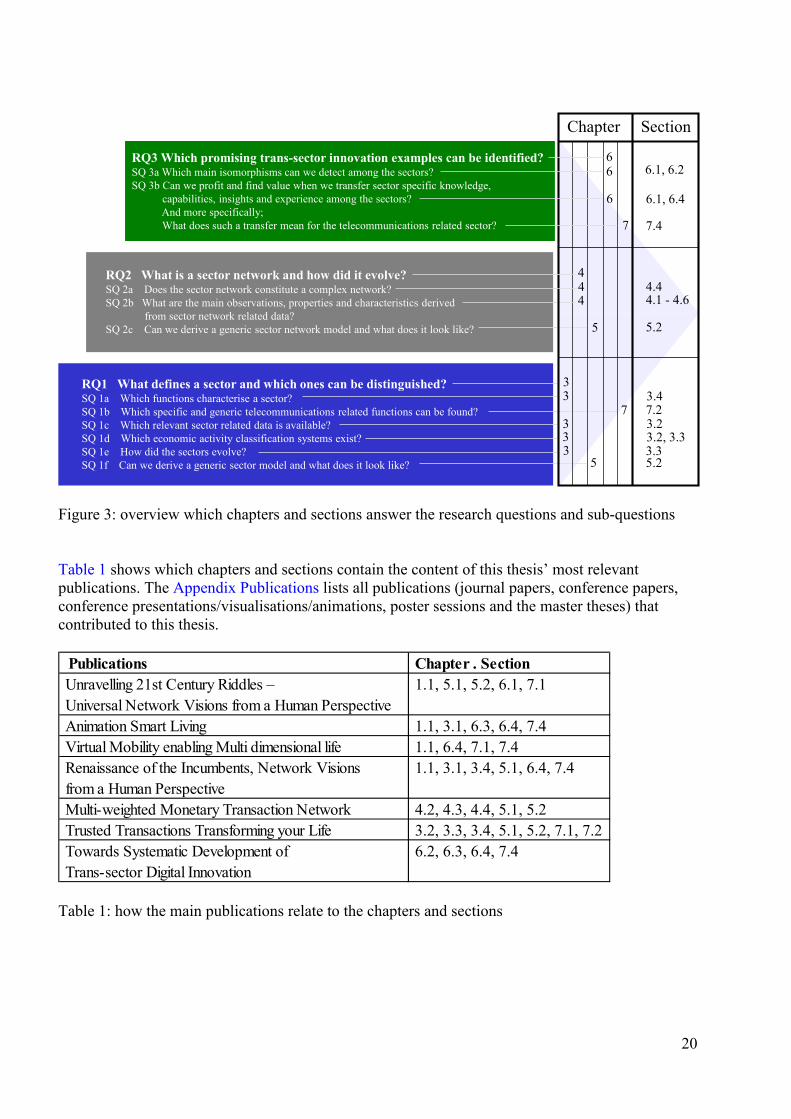
Figure 3: overview which chapters and sections answer the research questions and sub-questions Table 1 shows which chapters and sections contain the content of this thesis’ most relevant publications. The Appendix Publications lists all publications (journal papers, conference papers, conference presentations/visualisations/animations, poster sessions and the master theses) that contributed to this thesis.
Table 1: how the main publications relate to the chapters and sections
RQ1 What defines a sector and which ones can be distinguished?SQ 1a Which functions characterise a sector?SQ 1b Which specific and generic telecommunications related functions can be found?SQ 1c Which relevant sector related data is available?SQ 1d Which economic activity classification systems exist?SQ 1e How did the sectors evolve?SQ 1f Can we derive a generic sector model and what does it look like?
RQ2 What is a sector network and how did it evolve?SQ 2a Does the sector network constitute a complex network?SQ 2b What are the main observations, properties and characteristics derived
from sector network related data?SQ 2c Can we derive a generic sector network model and what does it look like?
RQ3 Which promising trans-sector innovation examples can be identified?SQ 3a Which main isomorphisms can we detect among the sectors?SQ 3b Can we profit and find value when we transfer sector specific knowledge,
capabilities, insights and experience among the sectors? And more specifically; What does such a transfer mean for the telecommunications related sector?
Chapter Section
3
4
5
6
5
7
6
6
3
33
44
3
7
7.23.4
3.23.2, 3.33.35.2
5.2
4.1 - 4.64.4
7.4
6.1, 6.2
6.1, 6.4
Publications Chapter . Section Unravelling 21st Century Riddles – 1.1, 5.1, 5.2, 6.1, 7.1 Universal Network Visions from a Human Perspective Animation Smart Living 1.1, 3.1, 6.3, 6.4, 7.4 Virtual Mobility enabling Multi dimensional life 1.1, 6.4, 7.1, 7.4 Renaissance of the Incumbents, Network Visions 1.1, 3.1, 3.4, 5.1, 6.4, 7.4 from a Human Perspective Multi-weighted Monetary Transaction Network 4.2, 4.3, 4.4, 5.1, 5.2 Trusted Transactions Transforming your Life 3.2, 3.3, 3.4, 5.1, 5.2, 7.1, 7.2 Towards Systematic Development of 6.2, 6.3, 6.4, 7.4 Trans-sector Digital Innovation
20
Chapter 2 Theoretical framework This chapter aims to provide the theoretical background of this thesis (in section 2.1 and 2.2) and contributes to connecting the terms function, network, sector and system. Together these four terms constitute the central nomenclature of this thesis. The notion of a holarchy is introduced in section 2.4 capturing hierarchical and recursive aspects of networks and Economic Activity Classification Systems. This thesis’ three initial hypotheses (H1-H3) are given in section 2.5 and from the research output section 8.2 discusses whether these hypotheses hold. Economic Activity Classification Systems, Input-Output tables, graph theory and related models are considered to be the tooling of this thesis’ work. From the literature, this chapter discusses examples of related models, their aims and compares their structure (in section 2.3). 2.1 Theoretical Environment Philosophers, active in the scientific field of ontology, have tried to define which types of objects exist in reality [Barnes,p40,1982] by means of human language and mathematics [Bunge,1979],[Gleick,p28-50,2011]. In a stepwise sense, James Gleick captures the levels of ontological and definitial complexity by means of the road of abstraction paved by literacy: from things to words, from words to categories, from categories to metaphor and logic [Gleick,p39,2011]. A word gives a name to an object. By means of commonly accepted names anything can be identified, pointed at, defined, distinguished, classified and included in day-to-day speech. Aristotle enriched the ontological theory adopting Plato’s systematic and axiomatic approach though disagreeing with Plato’s principal view [Eidos (meaning forms)] on how conceptual and real objects relate. While introducing various new classification systems of objects [Categoriae], Aristotle discriminated real from conceptual substances. In order to solve this discriminative problem, he proposed to follow the demarcations provided by the classification of the disciplines of science. He classified the objects or substances studied in natural science as real and objects that are for example studied in mathematics as conceptual. Aristotle considered natural science to comprise botany, zoology, psychology, meteorology, chemistry and physics. As a result, all animals, plants and man-made artefacts were classified as real. According to Aristotle, luminaries like the sun, the moon etcetera are real as well. Two characteristics are always applicable to any real object; over time it can change and/or (be) move(d) [Aristotle,Physica],[Barnes,p44,1982]. Conceptual objects on the other hand, do not always have these two characteristics. An example of such a conceptual object is a numeral that is not subject to change. In complex network theory the adjectives real or real-world are commonly used in order to address various types of networks. In this field of research it is widely accepted that the adjective real means that a studied network exists in physical reality. Although viable synonyms for real can be concrete or material [Bunge,1979], for sake of simplicity and compliance with complex networks terminology, the attributes real versus conceptual are distinguished in this thesis. This section discusses this thesis central nomenclature* regarding its different meanings, main relations, definitions and etymology. [Webster,1993] proved to be a relevant source because it dates the earliest recorded use in English language and traces back the appearance of a word to the earliest language in which it is attested. Concerning nomenclature originating from ancient Greek and Latin, more detailed backgrounds were taken from [Liddell&Scott,1968] and [Lewis&Short,1980] respectively. (*) In addition to this thesis’ central nomenclature (function, network, sector and system), the Appendix Definitions provides a repository of meanings, definitions and references regarding the entire nomenclature of this thesis.
21
function (1533) from Latin “functio” meaning performance or execution [Lewis&Short,p792,1980]: 1) professional or official position (occupation) 2) the action for which a person or thing is specially fitted or used, or for which a thing exists 3) any of a group of related actions contributing to a larger action The primary meaning of the Greek noun “ergon” [Liddell & Scott,p683 IV.1,1968] is work or deed (something that is done). In a text originating from the 5th century BC, Thucydides uses the noun “ergon” in the meaning of a function (being the first recorded use in a naval context). network (1560) [Webster,p780,1993]: 1) a fabric or structure of chords or wires that cross at regular intervals and are knotted or secured at the crossings 2) a system of lines or channels resembling a network 3a) an interconnected or interrelated chain, group, or system 3b) a system of computers, terminals, and databases connected by communications lines From these meanings the first clearly associates to matrices. sector (1570) from Latin meaning one who cuts or cuts off, a cutter [Lewis&Short,p1654,1980]: 1a) a geometric figure bounded by two radii and the included arc of a circle 1c) an area or portion resembling a sector 1d) a social, economic or political sub-division of society (greater cooperation between the public and private sectors) system (1603) from Greek “systema” meaning total, crowd or union [Liddell&Scott,p1735,1968]: 1) a regularly interacting or interdependent group of items forming a unified whole 2) an organized set of doctrines, ideas, or principles 3a) an organized or established procedure 3b) a manner of classifying, symbolizing, or schematizing (a taxonomic system) 4) harmonious arrangement or pattern From the selection of meanings mentioned above can be observed that the term(s): - function, sector and system existed more than 2000 years ago, while the term network has emerged relatively recent, regardless the various meanings these terms can have, - system was used in Greek* and can be considered the eldest of all four, - network can be defined by means of the term system (ad 2, 3a & 3b), while a system can be presented, depicted or viewed as a network, - system in its taxonomic meaning (ad 3b) comprises all types of classifications, - sector, system and network are used to address objects that can be real or conceptual, - function is conceptual. A function can describe an activity/action which a person, a group or an object can perform. Further more a function can describe a state of being. Functions are often described by means of verbs and can be mapped hierarchically (ad 3), - sector, used as a verb, relates to the process of dividing and classifying without any overlap. The term system can comprise networks and sectors due to its large conceptual reach (and history). Furthermore, a system can have one or more functions. An overview of system related literature is given in table 2 that relates systems to various application areas and fields of science. Accordingly, table 2 summarises some of the aspects that are relevant for this thesis that can be of help explaining the theoretical background of functions, networks, sectors and systems. From ancient sources some fundamentals are selected which are still considered valid today. Contemporary theorists, philosophers and scientists from various disciplines have studied the concepts of these four terms and their relations, building on the work of their predecessors. (*) [Sloterdijk,p183,2011] mentions that in the pre-socratic period some archaic Greek verbs have transformed into nouns. For example the verb “sophronein” meaning to be prudent changed into the noun ”sophrsynè“ meaning the virtue of thoughtfulness. Interestingly, the noun “systema” [Liddell&Scott,p1735,1968] originates from the archaic verb “sunìstemi” meaning uniting or put together [Liddell&Scott,p1718,1968].
22
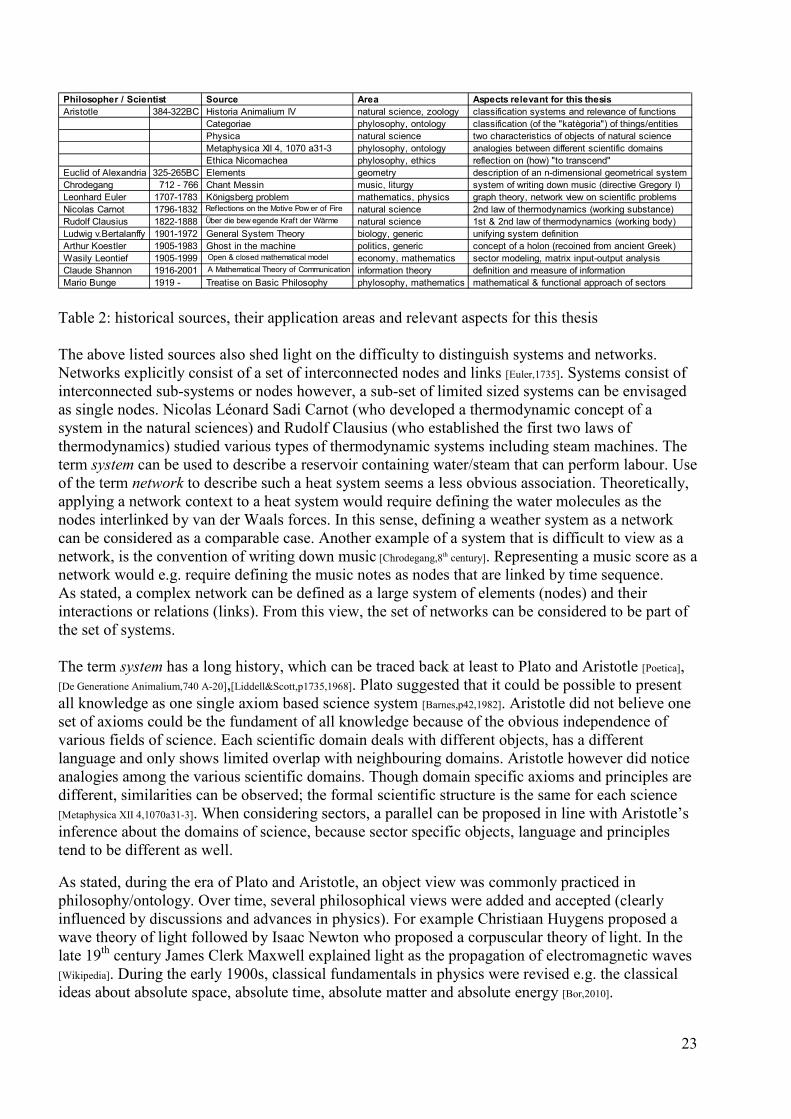
Table 2: historical sources, their application areas and relevant aspects for this thesis The above listed sources also shed light on the difficulty to distinguish systems and networks. Networks explicitly consist of a set of interconnected nodes and links [Euler,1735]. Systems consist of interconnected sub-systems or nodes however, a sub-set of limited sized systems can be envisaged as single nodes. Nicolas Léonard Sadi Carnot (who developed a thermodynamic concept of a system in the natural sciences) and Rudolf Clausius (who established the first two laws of thermodynamics) studied various types of thermodynamic systems including steam machines. The term system can be used to describe a reservoir containing water/steam that can perform labour. Use of the term network to describe such a heat system seems a less obvious association. Theoretically, applying a network context to a heat system would require defining the water molecules as the nodes interlinked by van der Waals forces. In this sense, defining a weather system as a network can be considered as a comparable case. Another example of a system that is difficult to view as a network, is the convention of writing down music [Chrodegang,8th century]. Representing a music score as a network would e.g. require defining the music notes as nodes that are linked by time sequence. As stated, a complex network can be defined as a large system of elements (nodes) and their interactions or relations (links). From this view, the set of networks can be considered to be part of the set of systems. The term system has a long history, which can be traced back at least to Plato and Aristotle [Poetica], [De Generatione Animalium,740 A-20],[Liddell&Scott,p1735,1968]. Plato suggested that it could be possible to present all knowledge as one single axiom based science system [Barnes,p42,1982]. Aristotle did not believe one set of axioms could be the fundament of all knowledge because of the obvious independence of various fields of science. Each scientific domain deals with different objects, has a different language and only shows limited overlap with neighbouring domains. Aristotle however did notice analogies among the various scientific domains. Though domain specific axioms and principles are different, similarities can be observed; the formal scientific structure is the same for each science [Metaphysica XII 4,1070a31-3]. When considering sectors, a parallel can be proposed in line with Aristotle’s inference about the domains of science, because sector specific objects, language and principles tend to be different as well. As stated, during the era of Plato and Aristotle, an object view was commonly practiced in philosophy/ontology. Over time, several philosophical views were added and accepted (clearly influenced by discussions and advances in physics). For example Christiaan Huygens proposed a wave theory of light followed by Isaac Newton who proposed a corpuscular theory of light. In the late 19th century James Clerk Maxwell explained light as the propagation of electromagnetic waves [Wikipedia]. During the early 1900s, classical fundamentals in physics were revised e.g. the classical ideas about absolute space, absolute time, absolute matter and absolute energy [Bor,2010].
Source Area Aspects relevant for this thesis Aristotle 384-322BC Historia Animalium IV natural science, zoology classification systems and relevance of functions
Categoriae phylosophy, ontology classification (of the "katègoria") of things/entities Physica natural science two characteristics of objects of natural science Metaphysica XII 4, 1070 a31-3 phylosophy, ontology analogies between different scientific domains Ethica Nicomachea phylosophy, ethics reflection on (how) "to transcend"
Euclid of Alexandria 325-265BC Elements geometry description of an n-dimensional geometrical system Chrodegang 712 - 766 Chant Messin music, liturgy system of writing down music (directive Gregory I) Leonhard Euler 1707-1783 Königsberg problem mathematics, physics graph theory, network view on scientific problems Nicolas Carnot 1796-1832 Reflections on the Motive Pow er of Fire natural science 2nd law of thermodynamics (working substance) Rudolf Clausius 1822-1888 Über die bew egende Kraft der Wärme natural science 1st & 2nd law of thermodynamics (working body) Ludwig v.Bertalanffy 1901-1972 General System Theory biology, generic unifying system definition Arthur Koestler 1905-1983 Ghost in the machine politics, generic concept of a holon (recoined from ancient Greek) Wasily Leontief 1905-1999 Open & closed mathematical model economy, mathematics sector modeling, matrix input-output analysis Claude Shannon 1916-2001 A Mathematical Theory of Communication information theory definition and measure of information Mario Bunge 1919 - Treatise on Basic Philosophy phylosophy, mathematics mathematical & functional approach of sectors
Philosopher / Scientist
23
In 1900, Max Planck defined energy packages. In 1905, Albert Einstein formulated the relation between energy and matter. Here after Werner Karl Heisenberg and Niels Henrik David Bohr formulated the uncertainty principle in quantum mechanics. In 1924, Louis-Victor de Broglie formulated the wave-particle duality hypothesis that all matter (not just light) has a wave-like nature as well. Inspired by these advances in physics, new views were introduced in philosophy [Gleick,p178,2011]. For example, adding a process view can be attributed to philosophers like William James (according to Alfred North Whitehead in Science of the Modern World). Subsequently, adding a time view can be attributed to Henri-Louis Bergson (1950s). As a result, philosophers started to recognise the temporal character of reality. Adding the view that an observation can influence an object to change, can be attributed to Whitehead. A summary from a process thinker who embraces the previous inferences could be as [Bor,2010]* puts it: “In the end, material objects are compressed energy subject to continuous change and motion” . Systems Theory During the 20th century, theorists/philosophers developed generalised system models captured by means of Systems Theory, originating from the General System Theory (GST) in which one of its founders Karl Ludwig von Bertalanffy defined system as “elements in standing relationship” [Wikipedia]. System types have been classified from various perspectives, views and research disciplines. Comparison of various system classifications shows a widely accepted discrimination between: 1. natural systems versus man-made systems (that are designed to work):
- where natural systems are always physically real, - while man-made systems can be either conceptual or real.
2. bounded systems versus unbounded systems [ITU T G80x], for example a network of pipelines is a bounded system, while a radio bearer is an unbounded system. 3. open systems versus closed systems: - where open systems (common cases) exchange energy, matter and information with their environment, - while closed systems (rare cases) are considered to only exchange energy [Wikipedia]. Formulating a generic definition for closed systems proved to be difficult. As a result, some variety has been proposed, ranging from relatively closed systems to isolated systems that exchange nothing at all (the latter being a purely theoretical case). The GST or systemics studies the principles and properties common to all (complex) systems irrespective of their particular constitution and the specific nature of their component elements and their relations [Bunge,p3,1979]. According to Bunge “the approach of the GST can be useful to address common objectives and solving problems in different fields”. Furthermore, he states that the study of networks is part of the GST, which can be applicable to any kind of network also contributing to discover similarities between systems and to deal with their complexity. However, a disadvantage of the systemic approach is the tendency to de-emphasis specific peculiarities of the components of a studied system. His Treatise on Basic Philosophy consists of eight volumes in nine parts. In Ontology II, A world of systems, vol. 4, Bunge characterises his world view as systemic and states about systems: - the universe is not a heap of things but a thing composed of interconnected things – i.e. a system, - a system, then, is a complex object, the components of which are interrelated rather than loose. - some things are not systems, assuming that there are elementary things (things without parts), - there are some concepts and structural principles that seem to hold for all systems, - there are some modelling strategies that seem to work everywhere. (*) Original Dutch phrasing proposed by philosopher Jan Bor: “Materiële objecten zijn uiteindelijk samengevatte energie die in een voortdurende toestand van verandering en beweging is”.
24
Regarding Popper’s “world 3” he states that it mixes both conceptual and concrete objects (for instance a system consisting of theories and books). Bunge avoids these mixed systems because to his knowledge; “No theory specifies the manner whereby conceptual items could combine with concrete ones”. For example: “Mathematical theories specify the way conceptual items combine, and ontological theories take care of the combination of concrete items. If the components are conceptual, so is the system. If the components are concrete or material, then they constitute a concrete or material system”. Thus, Bunge recognises two system kingdoms only. He concludes; either conceptual or concrete, “a system may be said to have a definite composition (C), a definite environment (E), and a definite structure (S)”. From a systemist perspective, hereafter some of his definitional views [Bunge,p188-193,1979] are given. These views interrelate human society, its members, systems, sub-systems, sectors and functions (interchanging the terms community and society): 1. Every human society is characterised by means of 10 properties. Three examples are: - some members do labour, thus transform parts of their environment (postulate 4.26 (i)), - some members manage the activities of others (from 4.26 (iii)), - every member shares information, services or goods with some other members of the same community (from 4.26 (vii)). 2. Every human society has a number of sectors (postulate 5.2): - every member belongs to at least two sectors of it, - no individual belongs to all sectors at the same time, - every society can be analysed into a number of sectors and, in particular, sub-systems. 3. There is some division of labour in every society. 4. All sub-systems have at least three functions/activities in common: - consuming or transforming energy, - producing waste products, - communicating with other sub-systems of the community, 5. There are no systems without functions. The functions of a system define what the system does. Every function is related to a system that does the functioning, but the user of a system defines the function. To these definitional views Bunge adds a mathematical representation and introduces mathematical symbols and definitions (terms of concepts): σ a human society, where ∑ = {σ1, σ2, …, σm} is the set of human societies, where
human society is an example of a concrete system (definition 5.1) σ’ a social sub-system of a human society, S(σ) set of all social sub-systems of human society σ (definition 5.4) S set of social relations: information, goods, services and management T set of transformation relations S U T the structure of σ equal to the disjoint union of the two sets of relations S and T
(definition 5.1) G(σ) the generic function(s) of the sub-systems of σ (these functions are common to all the
social sub-systems in and they are part of the structure of each σ’). F F-system, where F is short for the set of function(s) characterising the member sub-
systems in contradistinction to others. F is a set of the disjoint union of the two sets social relations S or transformation relations T thus F ⊂ S U T
F (σ) F-sector of human society σ FS (σ) the specific functions of the F-sector of σ. These functions are in the structure of each
sub-system σ’ but not in G(σ). FS (σ) are the specific functions of the F-sector of σ. These functions are in the structure of each sub-system σ’ but not in G (σ).
25
Bunge’s systemic theory and conceptual view on functions of sectors are applied in this thesis as: - his definitions contribute to constructing the sector model (section 5.2), - it offers a reference framework for the analysis of the sector functions. Empirical support to his theory on sectors’ functions was found by means of functional analysis of two types of sources: - the functions derived from the ISIC rev.4 explanatory notes (presented in section 3.4), - the functions which constitute the telecommunications related sector derived from worldwide accepted standards and models (presented in section 7.2). Section 5.1 relates these two research exercises. 2.2 Classification systems This section provides and exemplifies the theoretical principles of classification systems with focus on economic activity classification systems and their structure. Section 3.2 covers these systems in more detail and compares several national economic activity classification systems. Here after the term economic activity classification system is often abbreviated to EACS. The goal of any specific classification system needs to be determined and influences the structure of the classification. George J. Klir [Wikipedia] states that “no classification system is complete and perfect for all purposes”. However, some principles and requirements seem to be applicable to all classification systems such as the requirement of resolving ambiguity: each object can only be exclusively classified in one category at one hierarchical level. The main goal of an EACS is classifying organisations. A dynamic property of EACSs is that the structure and definitions of their categories continuously change over time. When taking into account that the ever-changing objects (subject to classifying) are part of the goal, they influence the design and structure of the classification system [van Hooff]. Thus, concerning classifications the dynamic sequence of influence (goal-system-category-object) is circular. The earliest known efforts on developing a classification methodology and setting up classification systems originate from Aristotle 4th century BC [Barnes,1982]. Aristotle described the results from his taxonomic research on zoology (a classification of animals) in the Categoriae and the Historia Animalium VI. Concerning classification methodology the following conclusion of Aristotle still holds today. For classification purposes the function and shape of a part of an animal are more significant as classification criterion than the size or weight of that part. Applied in the field of sector related statistical data, this inference of Aristotle is in line with [Potter,1988]. Potter underlines the importance of homogeneity of the production types performed by establishments, enterprises or other statistical units. Homogeneity is one of the most fundamental characteristics of statistical compilations (data about organisations categorised in classification systems). E.g. in EACSs, the statistical units homogeneously classified in any category should be of one kind. Furthermore worth noting is his general observation that in EACSs the homogeneity increases with the number of classes. Derived from [Potter,1988], a definition of an EACS could be: a hierarchical taxonomic system designed for homogeneous categorising of establishments and their specific functioning into exclusive classes. More broadly, a definition of a classification system could be: a hierarchical taxonomic system designed for homogeneous categorising of specific types of objects into exclusive classes. In order to give answers to RQ1 “What defines a sector and which ones can be distinguished?”, reviewing prevalent sources provided by the United Nations Statistics Division is mandatory. Their website states the following: “The UN Statistics Division is committed to the advancement of the
26
global statistical system. We compile and disseminate global statistical information, develop standards and norms for statistical activities, and support countries’ efforts to strengthen their national statistical systems. We facilitate the coordination of international statistical activities and support the functioning of the UN Statistical Commission (since 1947) as the apex entity of the global statistical system”. The UN have developed a classification code and a classification methodology to standardise data collection, analysis, and comparison of economic activities between different regions (thus forging global classification harmonisation and transparency). Important instruments to monitor and influence the national classification harmonisation progress are the regularly published UN questionnaires filled in by all individual member states. The International Standard of Industrial Classification of All Economic Activities (ISIC code) groups together organisations if they produce the same type of goods and/or services or if they use similar processes (i.e. the same raw materials, process of production, skills or technology). This thesis’ Appendix Economic Activity Classification Systems describes ISIC rev.4 in detail. The current ISIC rev.4 code comprises a classification hierarchy consisting of four levels:
X – Section, xx – Division, xxx – Group, xxxx – Class
where X represents a heading identified by a one character alphabetic code and x is an integer number. Thus, after the character that distinguishes each section at superior level, the first two digits can distinguish 99 divisions at the next sub-ordinate hierarchical level. The third digit identifies the groups within each division at the third level. At the lowest level the fourth digit identifies the classes within a group. For example, the character “B” in “B0721” points at the mining related section B in which “07” points at a division called “Mining of metal ores” in which the third digit “2” points at the group “Mining of non-ferrous metal ores” and finally the fourth digit “1” identifies “Mining of uranium and thorium ores”. ISIC rev.4 section A “Agriculture” consists of three divisions 01, 02 and 03, section B “Mining” consists of the next five divisions 04-09 and the division C “Manufacturing” consists of the next 24 divisions 10-33 (see section 7.1 table 24). The current ISIC version [ISIC,2008] comprises 21 sections (A-U), sub-divided into 88 divisions, 238 groups and 419 classes which implies a significant increase compared to the previous ISIC version [ISIC,1993] that comprises 17 sections, 60 divisions, 159 groups and 419 classes. In ISIC classification vocabulary, the generic term for an item at any level within the classification system is category [unstats.un.org/unsd/class/glossary]. A corresponding term for category proposed in this thesis is activity cluster. Both these terms have a conceptual reach that allows for capturing the recursive nature of the EACSs and statistical data aggregates researched in this thesis. Available since 1948, the ISIC code is subject to periodical review because: - new/emergent types of economic activity require initial classification, - types of economic activity gaining worldwide importance can be redefined at a higher hierarchical level in the classification (while declining importance can lead to hierarchical degradation), - harmonisation with other national EACSs is aimed at in order to increase the compliance to ISIC in as many member states as possible. Derived from ISIC rev.4, the current Dutch national EACS called “Standaard Bedrijfsindeling” (SBI 2008) distinguishes five levels (figure 4). In SBI 2008, a fifth sub-ordinate level of sub-classes is added. On its turn derived from SBI, the “Nieuwe HandelsRegister” (NHR) used at the Chamber of Commerce, contains six levels enabling the issuing of licenses to any organisation.
27
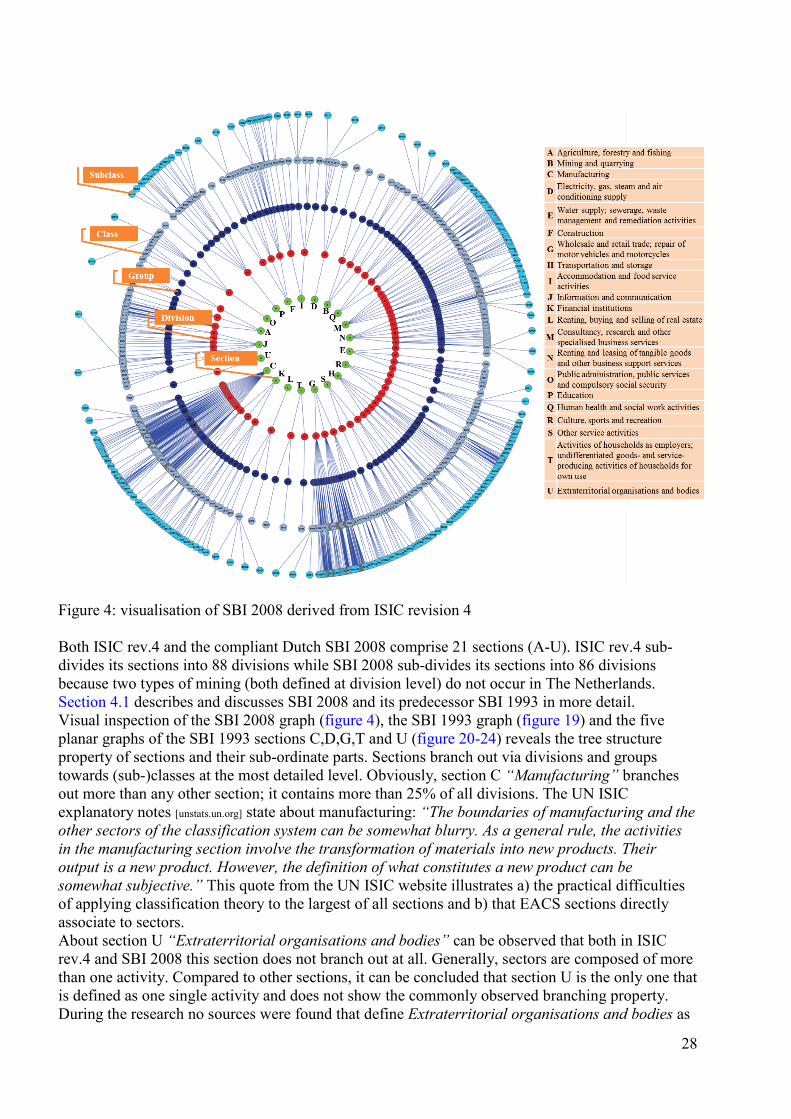
Figure 4: visualisation of SBI 2008 derived from ISIC revision 4 Both ISIC rev.4 and the compliant Dutch SBI 2008 comprise 21 sections (A-U). ISIC rev.4 sub-divides its sections into 88 divisions while SBI 2008 sub-divides its sections into 86 divisions because two types of mining (both defined at division level) do not occur in The Netherlands. Section 4.1 describes and discusses SBI 2008 and its predecessor SBI 1993 in more detail. Visual inspection of the SBI 2008 graph (figure 4), the SBI 1993 graph (figure 19) and the five planar graphs of the SBI 1993 sections C,D,G,T and U (figure 20-24) reveals the tree structure property of sections and their sub-ordinate parts. Sections branch out via divisions and groups towards (sub-)classes at the most detailed level. Obviously, section C “Manufacturing” branches out more than any other section; it contains more than 25% of all divisions. The UN ISIC explanatory notes [unstats.un.org] state about manufacturing: “The boundaries of manufacturing and the other sectors of the classification system can be somewhat blurry. As a general rule, the activities in the manufacturing section involve the transformation of materials into new products. Their output is a new product. However, the definition of what constitutes a new product can be somewhat subjective.” This quote from the UN ISIC website illustrates a) the practical difficulties of applying classification theory to the largest of all sections and b) that EACS sections directly associate to sectors. About section U “Extraterritorial organisations and bodies” can be observed that both in ISIC rev.4 and SBI 2008 this section does not branch out at all. Generally, sectors are composed of more than one activity. Compared to other sections, it can be concluded that section U is the only one that is defined as one single activity and does not show the commonly observed branching property. During the research no sources were found that define Extraterritorial organisations and bodies as
28
a sector. Furthermore, section U cannot be part of this thesis’ quantitative data analysis because no related quantitative data is publicly available (except for the finding that 90 Dutch enterprises have been registered as associated to section U). As a consequence of the above mentioned reasons, this thesis does not consider Extraterritorial organisations and bodies as a sector. Another dissimilar example is section S “Other service activities” which is a residual section both in ISIC and SBI 2008. During this research, no sources were found that define a sector called “Other services”. The main conclusions from this section are the following. Without any ambiguity, all categories in any classification system should be exclusive and non-overlapping at one hierarchical level. At superior level, any classification system should be complete, comprising all categories. The majority of the section names (see the legend of figure 4) shows resemblance with and relates to commonly used sector names, but not all are synonym. The names of the two sections U and S are clearly not sector names. Section 3.1 covers this translation issue in more detail. 2.3 Sector related models and their structure This section describes a selection of models which relate to this thesis’ central nomenclature (systems, sectors, networks and functions). Together these models provide a substantial part of the theoretical context and background of the sector network. Additionally, the Appendix Repository of assessed models describes the other models examined within this thesis’ scope. This section gives an overview of the main related models and briefly discusses and compares their specific aims, structure, properties, similarities, differences and vocabulary (summarised in table 3). From these various views, this thesis’ sector network model is constructed in chapter 5 after having: - reviewed the selected models and concepts, - researched the network structure/properties of EACSs and Input-Output tables. Hereafter in sub-section 2.3.1 Input-Output theory is elucidated by means of the Leontief Economic Model and section 4.2 relates Input-Output tables to complex network mathematics in more detail. Matrix analysis provides a universal approach for modelling and analysis of large system cases. From a complex network perspective provided by network theory [Van Mieghem,2011], N actors can be represented as N nodes that together constitute a network. Their network topology, denoted by a graph G(N,L), consists of a set N of N nodes interconnected by a set L of L links. Any pair of nodes (e.g. actors, activity clusters) can be directly or indirectly connected, taking into account that any node can be temporarily disconnected from the network. The network can be represented by an adjacency matrix A, an N x N matrix consisting of elements aij that are either one or zero depending on whether there is a link between node i and j (aij = 1) or not (aij = 0). A weighted adjacency matrix W may further incorporate the link weight structure by letting wij denote the weights of link i → j. A weighted adjacency matrix W can describe the production and consumption value exchanged between the nodes in an economic network. During this thesis’ research, economic networks have been studied at various overlay levels by means of network constructs. The number of nodes N of each network construct is determined by the number of activity clusters in the studied data sets. Chapter 4 describes the four different sources of researched data and their corresponding units of research (I - IV) in more detail. Regarding the first unit of research, figure 4 visualises an example of an EACS network construct. Constructed inside-out, a green coloured section node represents an activity cluster at superior section level and comprises the sub-ordinate red coloured node(s) at division level to which it is linked. A red coloured division node comprises the dark blue coloured node(s) at group level to which it is linked, etcetera. Thus in this thesis’ first unit of research, the hierarchical structure of an EACS defines the links between the nodes. For example figure 4 depicts the 21 tree graphs the EACS SBI 2008 that together consist of 1404 nodes.
29
Regarding the second unit of research, figure 28 (in section 4.3) visualises an example of a 72x72 matrix network construct derived from a German Input-Output table. Each of the 72 nodes represents an activity cluster which is connected to at least one adjacent activity cluster by means of their monetary transactions recorded during one year. Thus in the second unit of research, a link represents the monetary flow between a node pair (the link weight). It is important noting that both an EACS and an Input-Output table can describe the same economic system but do not have the same number of nodes. Furthermore, nation specific Input-Output tables can have a different number of activity clusters too. The number of nodes derived from the German and Dutch Input-Output tables approaches the order of magnitude of the number of nodes at the division level of contemporary EACSs. 2.3.1 Leontief Economic Model For three quarters of a century, many research initiatives have been devoted to studying economic systems and their complexity by means of Input-Output analysis [Leontief,1936],[Ferreira do Amaral et al.,2007]. In their second edition [Miller&Blair,2009] state that Input-Output analysis is the name given to the analytical framework developed by Wassily Leontief in the late 1930s building on earlier work of the 19th century economist and physician François Quesnay. In [Miller&Blair,p724,2009] the thought of a circular flow of productive interdependencies in an economy is mentioned as the founding concept of Input-Output analysis. The very beginning of these ideas can be attributed to Sir William Petty assigned by Oliver Cromwell to assess the spoils of war. Leontief developed a mathematical Input-Output model for a national (or regional) economy that captures the existence of a variety of (sub-)sectors and their produced and consumed value. Having achieved to decompose the United States economy into 500 economic activity clusters [Leontief,1941]
referred to them as industries, Leontief provided a closed model and an open model. The latter takes the interaction of a regional or national economy with its (international) environment into account. It is important noting that the terms industry and sector are often used interchangeably in Input-Output analysis. Furthermore, inter-sector flows are measured for a particular time period, usually one year, and are recorded in monetary terms [Miller&Blair,p10-11,2009]. The Closed Leontief Economic Model The closed Leontief Economic model describes a theoretical case of an economy that exclusively satisfies its own needs; thus no goods leave or enter this economic system. This closed model is a system of linear equations describing the distribution of a sector’s (or sub-sector’s) products throughout the economy [Miller&Blair,2009]. The convention [math.fullerton.edu,2003] given here after elucidates the basic principle of the closed Leontief Economic Input-Output model: Assume that an economy* consists of n interdependent sectors S1, S2, …, Sn. In order to produce, each sector will consume some of the goods produced by other sectors and uses** a fraction of its own production. pi = production level of sector Si ai,j = number of units produced by sector Si that is necessary to produce one unit by sector Sj ai,j pj = number of units produced by sector Si and consumed by sector Sj a i,1 p1 + ai,2 p2 + a i,3 p3 + … + ai,n pn is the total number of units produced by sector Si P = production vector. (*) [Miller&Blair,p34-38,2009] use n+1 to identify the household sector when closing the model with respect to household labour (zn+1,n) and consumption (zn,n+1). In this case the Input-Output matrix is modified, making the household endogenous instead of exogenous and adjusting the final demand into fi* exclusive that of households. (**) [math.fullerton.edu,2003] exemplifies a power-generating plant that uses some of its own power for production.
30
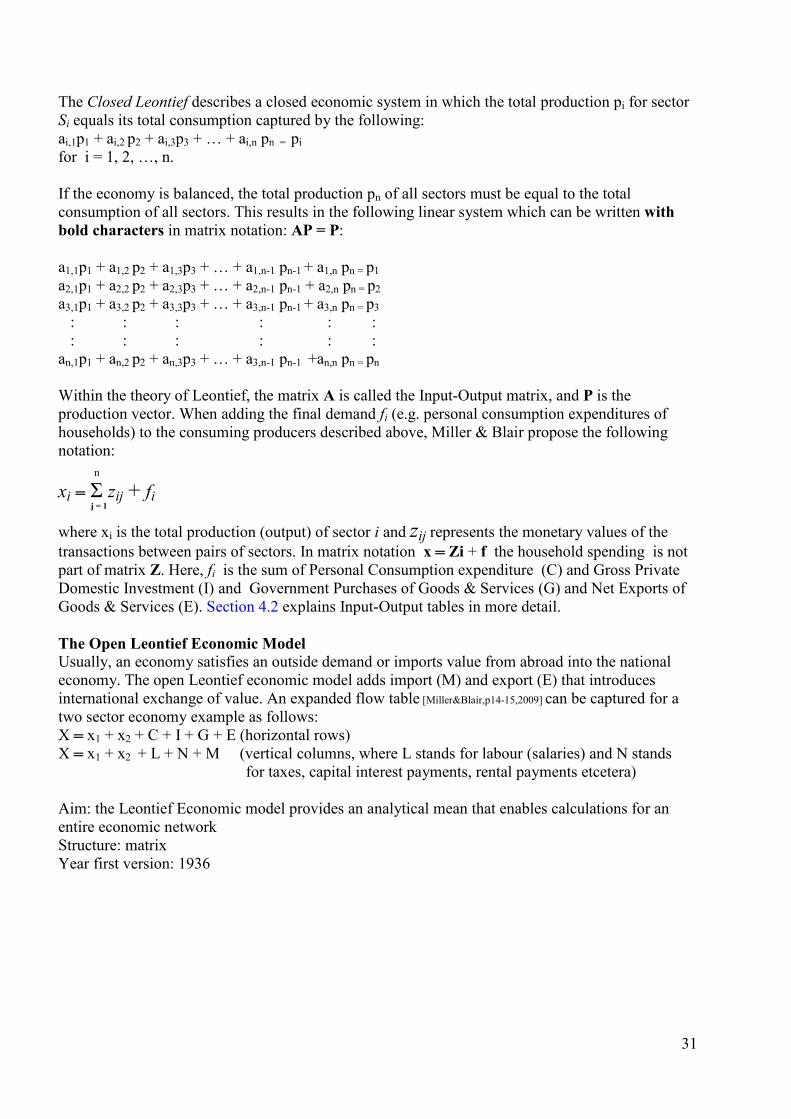
The Closed Leontief describes a closed economic system in which the total production pi for sector Si equals its total consumption captured by the following: ai,1p1 + ai,2 p2 + ai,3p3 + … + ai,n pn = pi for i = 1, 2, …, n. If the economy is balanced, the total production pn of all sectors must be equal to the total consumption of all sectors. This results in the following linear system which can be written with bold characters in matrix notation: AP = P: a1,1p1 + a1,2 p2 + a1,3p3 + … + a1,n-1 pn-1 + a1,n pn = p1 a2,1p1 + a2,2 p2 + a2,3p3 + … + a2,n-1 pn-1 + a2,n pn = p2 a3,1p1 + a3,2 p2 + a3,3p3 + … + a3,n-1 pn-1 + a3,n pn = p3 : : : : : : : : : : : : an,1p1 + an,2 p2 + an,3p3 + … + a3,n-1 pn-1 +an,n pn = pn Within the theory of Leontief, the matrix A is called the Input-Output matrix, and P is the production vector. When adding the final demand fi (e.g. personal consumption expenditures of households) to the consuming producers described above, Miller & Blair propose the following notation: n
xi ═ Σ zij + fi j = 1
where xi is the total production (output) of sector i and zij represents the monetary values of the transactions between pairs of sectors. In matrix notation x ═ Zi + f the household spending is not part of matrix Z. Here, fi is the sum of Personal Consumption expenditure (C) and Gross Private Domestic Investment (I) and Government Purchases of Goods & Services (G) and Net Exports of Goods & Services (E). Section 4.2 explains Input-Output tables in more detail. The Open Leontief Economic Model Usually, an economy satisfies an outside demand or imports value from abroad into the national economy. The open Leontief economic model adds import (M) and export (E) that introduces international exchange of value. An expanded flow table [Miller&Blair,p14-15,2009] can be captured for a two sector economy example as follows: X ═ x1 + x2 + C + I + G + E (horizontal rows) X ═ x1 + x2 + L + N + M (vertical columns, where L stands for labour (salaries) and N stands for taxes, capital interest payments, rental payments etcetera) Aim: the Leontief Economic model provides an analytical mean that enables calculations for an entire economic network Structure: matrix Year first version: 1936
31
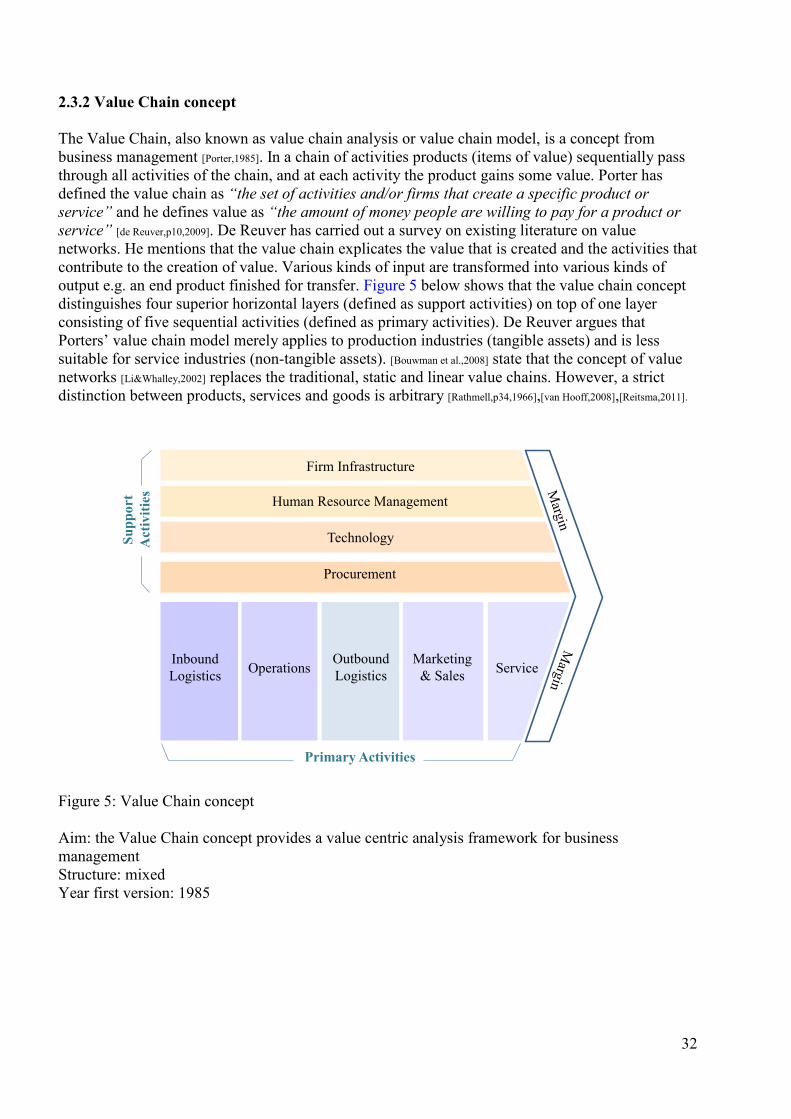
2.3.2 Value Chain concept The Value Chain, also known as value chain analysis or value chain model, is a concept from business management [Porter,1985]. In a chain of activities products (items of value) sequentially pass through all activities of the chain, and at each activity the product gains some value. Porter has defined the value chain as “the set of activities and/or firms that create a specific product or service” and he defines value as “the amount of money people are willing to pay for a product or service” [de Reuver,p10,2009]. De Reuver has carried out a survey on existing literature on value networks. He mentions that the value chain explicates the value that is created and the activities that contribute to the creation of value. Various kinds of input are transformed into various kinds of output e.g. an end product finished for transfer. Figure 5 below shows that the value chain concept distinguishes four superior horizontal layers (defined as support activities) on top of one layer consisting of five sequential activities (defined as primary activities). De Reuver argues that Porters’ value chain model merely applies to production industries (tangible assets) and is less suitable for service industries (non-tangible assets). [Bouwman et al.,2008] state that the concept of value networks [Li&Whalley,2002] replaces the traditional, static and linear value chains. However, a strict distinction between products, services and goods is arbitrary [Rathmell,p34,1966],[van Hooff,2008],[Reitsma,2011].
Figure 5: Value Chain concept Aim: the Value Chain concept provides a value centric analysis framework for business management Structure: mixed Year first version: 1985
InboundLogistics Operations Outbound
LogisticsMarketing
& Sales Service
Primary Activities
Supp
ort
Act
iviti
es
Procurement
Technology
Human Resource Management
Firm Infrastructure
32
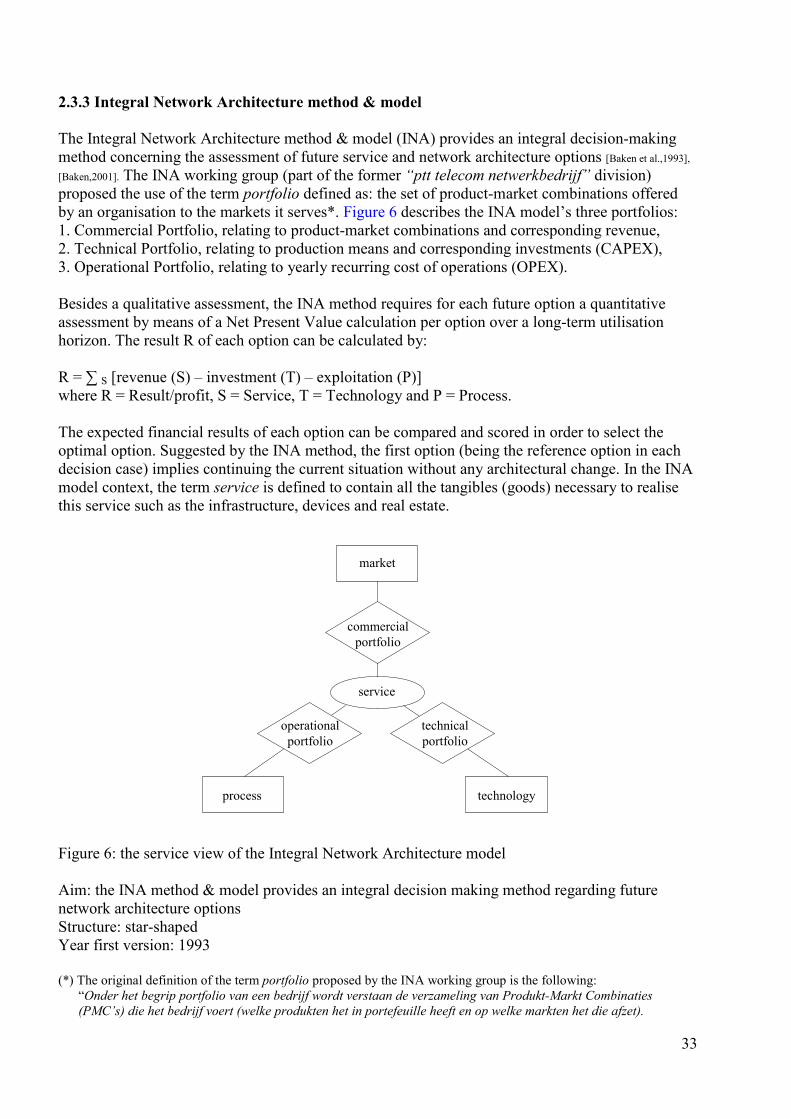
2.3.3 Integral Network Architecture method & model The Integral Network Architecture method & model (INA) provides an integral decision-making method concerning the assessment of future service and network architecture options [Baken et al.,1993], [Baken,2001]. The INA working group (part of the former “ptt telecom netwerkbedrijf” division) proposed the use of the term portfolio defined as: the set of product-market combinations offered by an organisation to the markets it serves*. Figure 6 describes the INA model’s three portfolios: 1. Commercial Portfolio, relating to product-market combinations and corresponding revenue, 2. Technical Portfolio, relating to production means and corresponding investments (CAPEX), 3. Operational Portfolio, relating to yearly recurring cost of operations (OPEX). Besides a qualitative assessment, the INA method requires for each future option a quantitative assessment by means of a Net Present Value calculation per option over a long-term utilisation horizon. The result R of each option can be calculated by: R = ∑ S [revenue (S) – investment (T) – exploitation (P)]
where R = Result/profit, S = Service, T = Technology and P = Process. The expected financial results of each option can be compared and scored in order to select the optimal option. Suggested by the INA method, the first option (being the reference option in each decision case) implies continuing the current situation without any architectural change. In the INA model context, the term service is defined to contain all the tangibles (goods) necessary to realise this service such as the infrastructure, devices and real estate.
process technology
market
commercialportfolio
technicalportfolio
operationalportfolio
service
Figure 6: the service view of the Integral Network Architecture model Aim: the INA method & model provides an integral decision making method regarding future network architecture options Structure: star-shaped Year first version: 1993 (*) The original definition of the term portfolio proposed by the INA working group is the following: “Onder het begrip portfolio van een bedrijf wordt verstaan de verzameling van Produkt-Markt Combinaties (PMC’s) die het bedrijf voert (welke produkten het in portefeuille heeft en op welke markten het die afzet).
33
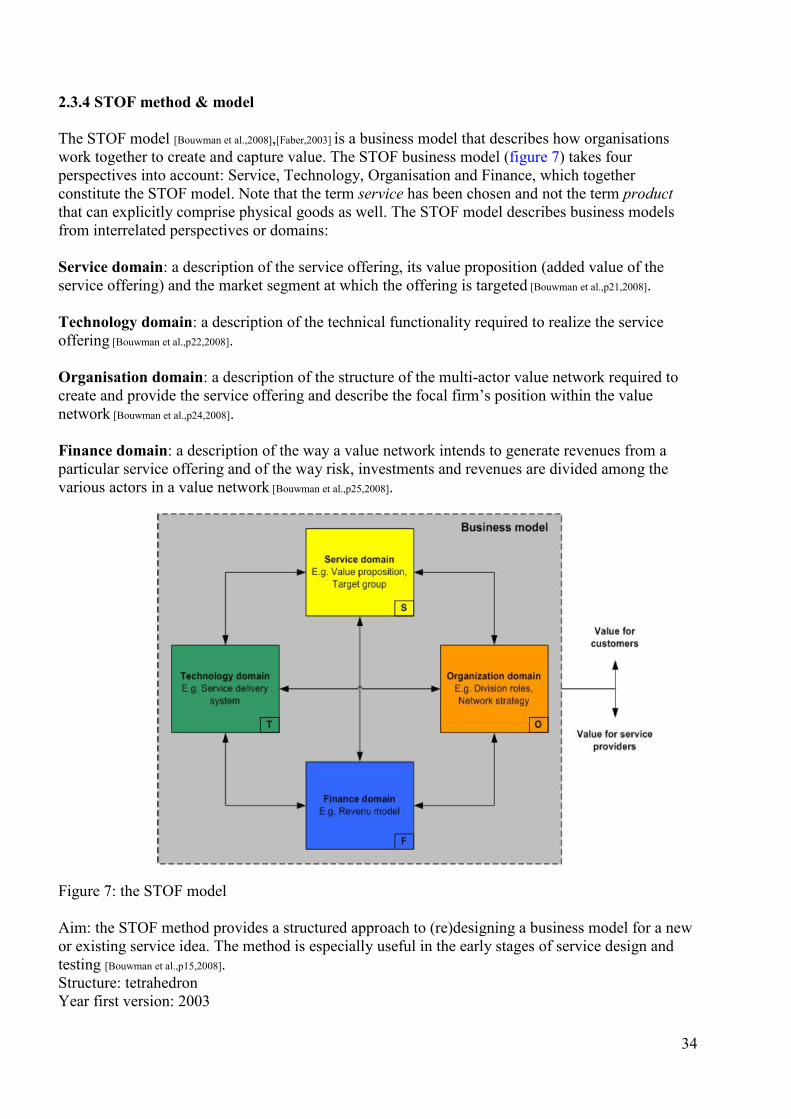
2.3.4 STOF method & model The STOF model [Bouwman et al.,2008],[Faber,2003] is a business model that describes how organisations work together to create and capture value. The STOF business model (figure 7) takes four perspectives into account: Service, Technology, Organisation and Finance, which together constitute the STOF model. Note that the term service has been chosen and not the term product that can explicitly comprise physical goods as well. The STOF model describes business models from interrelated perspectives or domains: Service domain: a description of the service offering, its value proposition (added value of the service offering) and the market segment at which the offering is targeted [Bouwman et al.,p21,2008]. Technology domain: a description of the technical functionality required to realize the service offering [Bouwman et al.,p22,2008]. Organisation domain: a description of the structure of the multi-actor value network required to create and provide the service offering and describe the focal firm’s position within the value network [Bouwman et al.,p24,2008]. Finance domain: a description of the way a value network intends to generate revenues from a particular service offering and of the way risk, investments and revenues are divided among the various actors in a value network [Bouwman et al.,p25,2008]. Figure 7: the STOF model Aim: the STOF method provides a structured approach to (re)designing a business model for a new or existing service idea. The method is especially useful in the early stages of service design and testing [Bouwman et al.,p15,2008]. Structure: tetrahedron Year first version: 2003
34
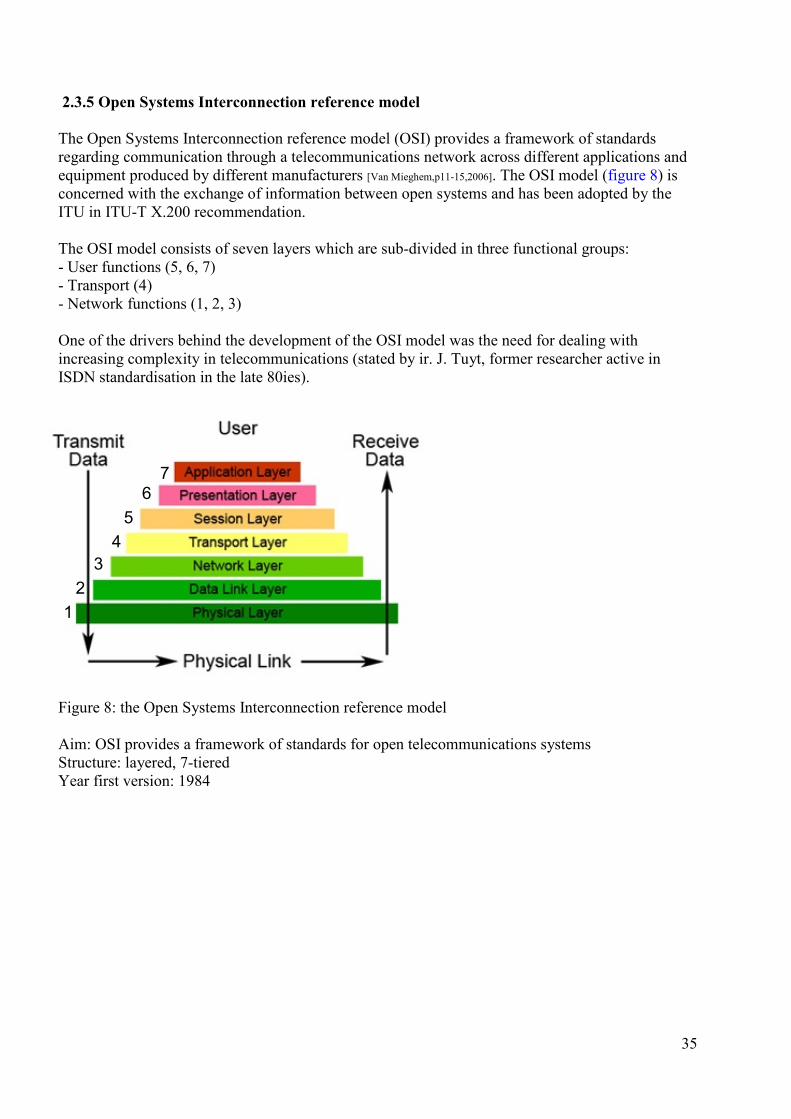
2.3.5 Open Systems Interconnection reference model The Open Systems Interconnection reference model (OSI) provides a framework of standards regarding communication through a telecommunications network across different applications and equipment produced by different manufacturers [Van Mieghem,p11-15,2006]. The OSI model (figure 8) is concerned with the exchange of information between open systems and has been adopted by the ITU in ITU-T X.200 recommendation. The OSI model consists of seven layers which are sub-divided in three functional groups: - User functions (5, 6, 7) - Transport (4) - Network functions (1, 2, 3) One of the drivers behind the development of the OSI model was the need for dealing with increasing complexity in telecommunications (stated by ir. J. Tuyt, former researcher active in ISDN standardisation in the late 80ies).
Figure 8: the Open Systems Interconnection reference model Aim: OSI provides a framework of standards for open telecommunications systems Structure: layered, 7-tiered Year first version: 1984
35
12
34
56
7
12
34
56
7
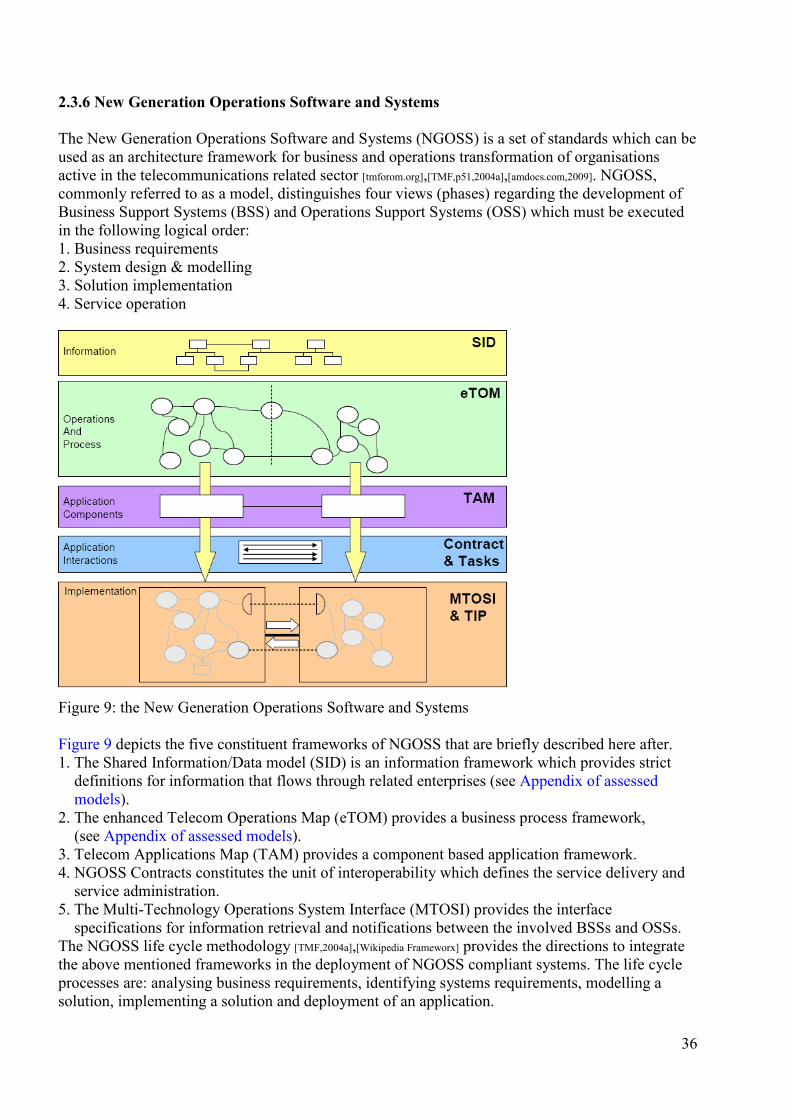
2.3.6 New Generation Operations Software and Systems The New Generation Operations Software and Systems (NGOSS) is a set of standards which can be used as an architecture framework for business and operations transformation of organisations active in the telecommunications related sector [tmforom.org],[TMF,p51,2004a],[amdocs.com,2009]. NGOSS, commonly referred to as a model, distinguishes four views (phases) regarding the development of Business Support Systems (BSS) and Operations Support Systems (OSS) which must be executed in the following logical order: 1. Business requirements 2. System design & modelling 3. Solution implementation 4. Service operation
Figure 9: the New Generation Operations Software and Systems Figure 9 depicts the five constituent frameworks of NGOSS that are briefly described here after. 1. The Shared Information/Data model (SID) is an information framework which provides strict definitions for information that flows through related enterprises (see Appendix of assessed models). 2. The enhanced Telecom Operations Map (eTOM) provides a business process framework, (see Appendix of assessed models). 3. Telecom Applications Map (TAM) provides a component based application framework. 4. NGOSS Contracts constitutes the unit of interoperability which defines the service delivery and service administration. 5. The Multi-Technology Operations System Interface (MTOSI) provides the interface specifications for information retrieval and notifications between the involved BSSs and OSSs. The NGOSS life cycle methodology [TMF,2004a],[Wikipedia Frameworx] provides the directions to integrate the above mentioned frameworks in the deployment of NGOSS compliant systems. The life cycle processes are: analysing business requirements, identifying systems requirements, modelling a solution, implementing a solution and deployment of an application.
36

Functions identified in NGOSS NGOSS specifies its functions by means of a set of use cases [TMF,p67,2004b]. A use case is the specification of a sequence of actions that a system (or actor) can perform interacting with other systems (or actors). The use cases capture the functional requirements in software design but it should be noted that their applicability is much wider. A use case example illustrates how a user is intending to use a system (this is a functional perspective taking into account essentially capturing the system behaviour from the user’s point of view). Aim: NGOSS provides a framework for transforming telecommunications business and operations Structure: layered, 5-tiered Year first version: 2004 2.3.7 ITU-T G.80x Recommendation ITU-T G.80x standardises and describes a functional architecture for telecommunications transport networks consisting of three recommendations/documents: - Unified functional architecture of transport networks (ITU-T G.800) - Circuit Switched network through Multi-layer network (ITU-T G.805) - Packet Switched network through Multi-layer network (ITU-T G.809) The generic functional architecture described in ITU-T G.800 should be taken as the basis for the ITU-T G.805 and G.809. These latter two are both concerned with specific layer network technologies (circuit switching or packet switching), and a corresponding set of recommendations for management, performance analysis and equipment specifications. ITU-T G.800 describes the functional architecture for telecommunications transport networks in a technology independent way and from the viewpoint of the information transfer capability. Besides the corresponding semantics, ITU-T G.80x provides definitions and diagrammatic symbols for visualisation purposes (see figure 10). Figure 10: example of ITU-T G.805 diagrammatic conventions
Trail (monitored connection)
CP CP
Network
Connection
AP AP
TCP TCP
TrailTerminationFunction
AdaptationFunction
Connection Point
Adaptation Point
TransferCapabilityPoint
37
As an abstract representation of physical network elements (such as devices and interfaces) ITU-T G.800 defines six functional elements: 1. Nodes: Connection Points (receiving and transmitting data), 2. Links: Link connection, 3. Tandem connections: consecutive link connections, 4. Network connections: End-to-End connection on a certain layer, 5. Sub-networks: parts of the network at a single layer, 6. Matrix: undividable sub-network connection. Subsequently, a connection is defined as the association of ports for the purpose of transferring information. The defined generic functions in ITU-T G.80x are: 1. the adaptation function performing the format transformation through different layers, 2. the trail termination function executing the transport processing, 3. the data transport function. Additionally, ITU-T G.800 distinguishes layer networks and defines the term layer as all possible connection points of the same type. A data transport function can be created between connection points of the same layer. Each layer within the transport network provides the same service to the layer above: the transfer of information. Furthermore, ITU-T G.800 states “a telecommunications network is a complex network which can be described in a number of different ways depending on the particular purpose of the description” [ITU-T Rec.G.800 prepublished version, 09/2007]. Aim: ITU-T G.80x standardises and describes the functional architecture of telecommunications networks Structure: a layered network which can theoretically comprise an infinite number of layers as a consequence of repetitive (dis)assembling of payloads Year first version: 1995
38
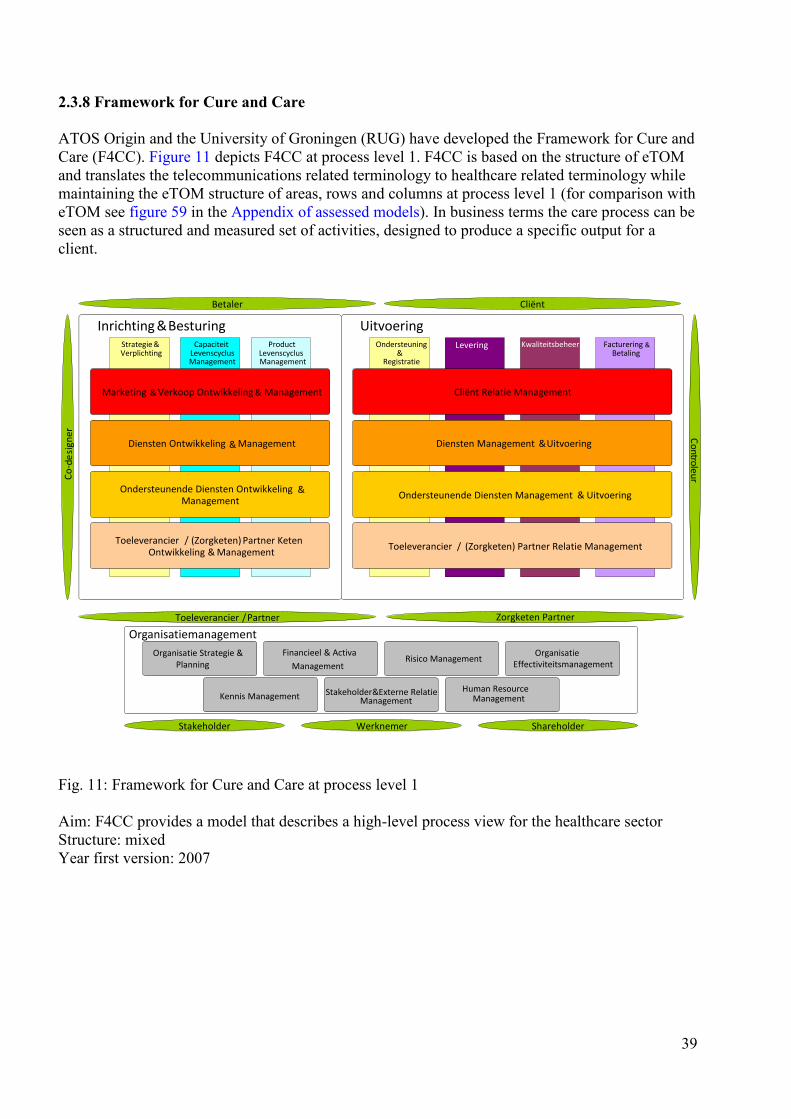
2.3.8 Framework for Cure and Care ATOS Origin and the University of Groningen (RUG) have developed the Framework for Cure and Care (F4CC). Figure 11 depicts F4CC at process level 1. F4CC is based on the structure of eTOM and translates the telecommunications related terminology to healthcare related terminology while maintaining the eTOM structure of areas, rows and columns at process level 1 (for comparison with eTOM see figure 59 in the Appendix of assessed models). In business terms the care process can be seen as a structured and measured set of activities, designed to produce a specific output for a client.
Fig. 11: Framework for Cure and Care at process level 1 Aim: F4CC provides a model that describes a high-level process view for the healthcare sector Structure: mixed Year first version: 2007
Inrichting & Besturing Uitvoering
Organisatiemanagement
ControleurCo- d
esig
ner
Toeleverancier / Partner Zorgketen Partner
ShareholderWerknemerStakeholder
Betaler Cliënt
Strategie & Verplichting
Capaciteit Levenscyclus Management
Product Levenscyclus Management
Marketing & Verkoop Ontwikkeling & Management
Diensten Ontwikkeling & Management
Ondersteunende Diensten Ontwikkeling & Management
Toeleverancier / (Zorgketen) Partner Keten Ontwikkeling & Management
Ondersteuning &
Registratie
Levering Kwaliteitsbeheer Facturering & Betaling
Toeleverancier / (Zorgketen) Partner Relatie Management
Ondersteunende Diensten Management & Uitvoering
Diensten Management & Uitvoering
Cliënt Relatie Management
Organisatie Effectiviteitsmanagement
Human Resource
Risico ManagementFinancieel & Activa
ManagementOrganisatie Strategie &
Planning
Kennis Management Stakeholder & Externe Relatie Management Management
39
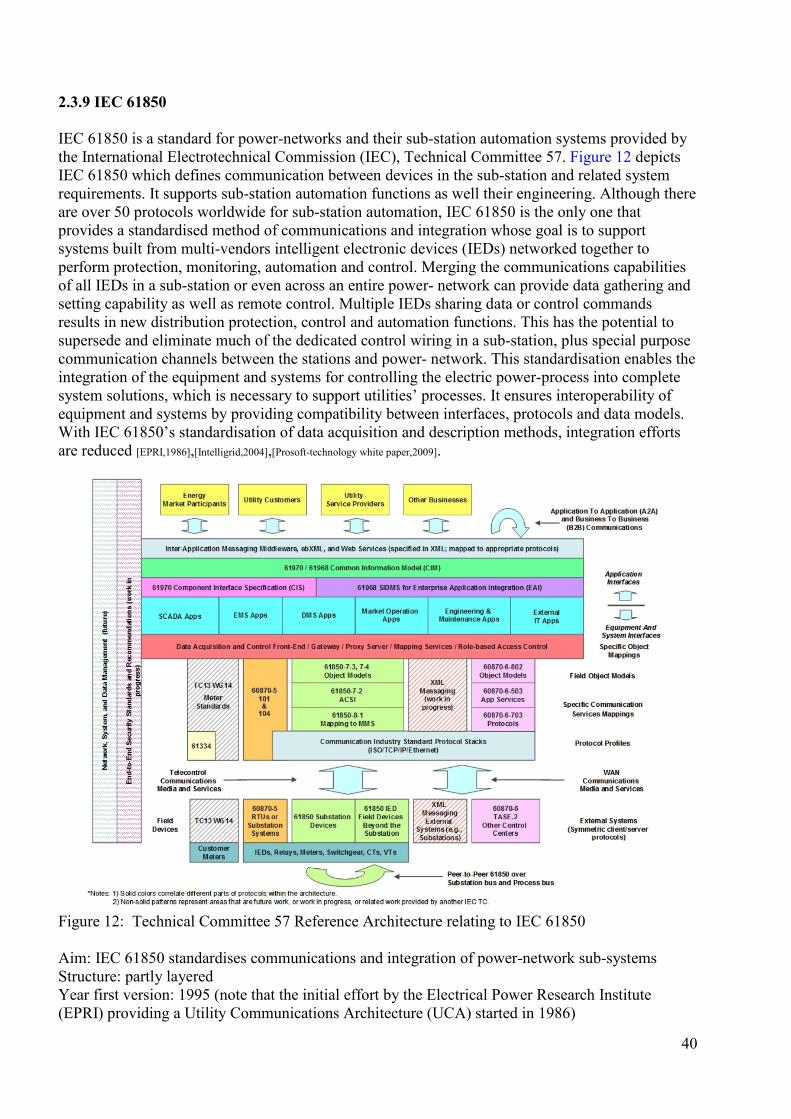
2.3.9 IEC 61850 IEC 61850 is a standard for power-networks and their sub-station automation systems provided by the International Electrotechnical Commission (IEC), Technical Committee 57. Figure 12 depicts IEC 61850 which defines communication between devices in the sub-station and related system requirements. It supports sub-station automation functions as well their engineering. Although there are over 50 protocols worldwide for sub-station automation, IEC 61850 is the only one that provides a standardised method of communications and integration whose goal is to support systems built from multi-vendors intelligent electronic devices (IEDs) networked together to perform protection, monitoring, automation and control. Merging the communications capabilities of all IEDs in a sub-station or even across an entire power- network can provide data gathering and setting capability as well as remote control. Multiple IEDs sharing data or control commands results in new distribution protection, control and automation functions. This has the potential to supersede and eliminate much of the dedicated control wiring in a sub-station, plus special purpose communication channels between the stations and power- network. This standardisation enables the integration of the equipment and systems for controlling the electric power-process into complete system solutions, which is necessary to support utilities’ processes. It ensures interoperability of equipment and systems by providing compatibility between interfaces, protocols and data models. With IEC 61850’s standardisation of data acquisition and description methods, integration efforts are reduced [EPRI,1986],[Intelligrid,2004],[Prosoft-technology white paper,2009].
Figure 12: Technical Committee 57 Reference Architecture relating to IEC 61850 Aim: IEC 61850 standardises communications and integration of power-network sub-systems Structure: partly layered Year first version: 1995 (note that the initial effort by the Electrical Power Research Institute (EPRI) providing a Utility Communications Architecture (UCA) started in 1986)
40
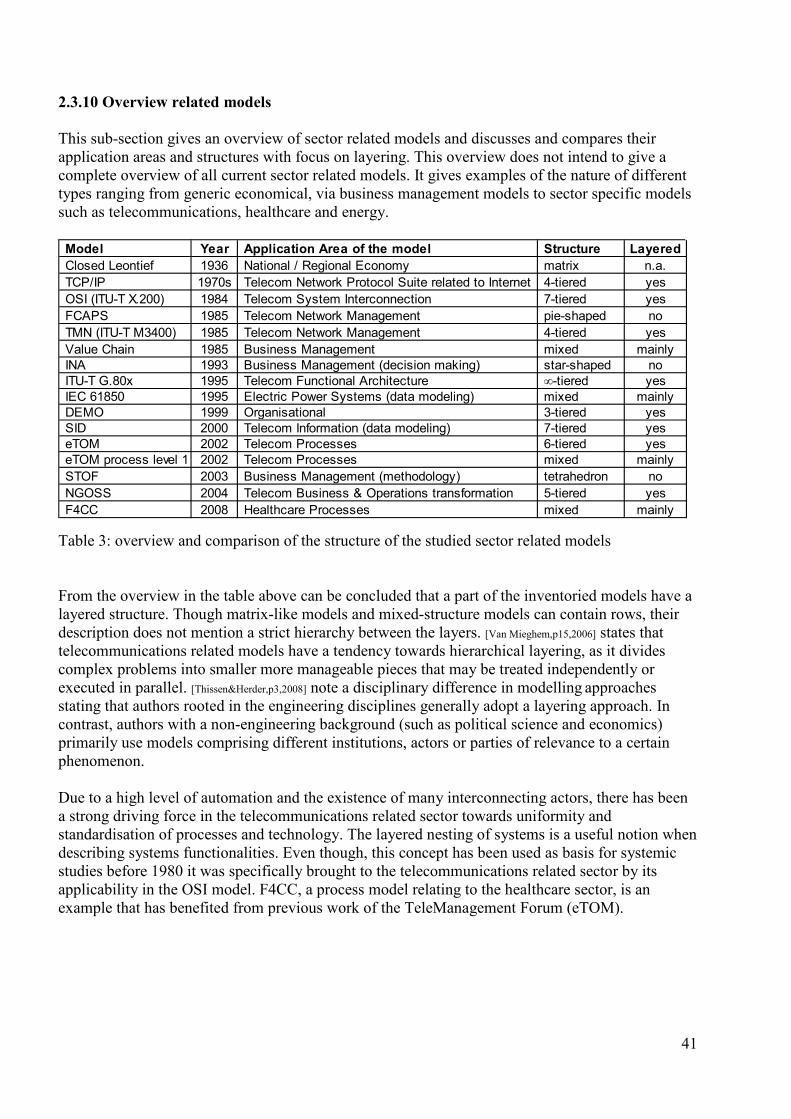
2.3.10 Overview related models This sub-section gives an overview of sector related models and discusses and compares their application areas and structures with focus on layering. This overview does not intend to give a complete overview of all current sector related models. It gives examples of the nature of different types ranging from generic economical, via business management models to sector specific models such as telecommunications, healthcare and energy.
Table 3: overview and comparison of the structure of the studied sector related models From the overview in the table above can be concluded that a part of the inventoried models have a layered structure. Though matrix-like models and mixed-structure models can contain rows, their description does not mention a strict hierarchy between the layers. [Van Mieghem,p15,2006] states that telecommunications related models have a tendency towards hierarchical layering, as it divides complex problems into smaller more manageable pieces that may be treated independently or executed in parallel. [Thissen&Herder,p3,2008] note a disciplinary difference in modelling approaches stating that authors rooted in the engineering disciplines generally adopt a layering approach. In contrast, authors with a non-engineering background (such as political science and economics) primarily use models comprising different institutions, actors or parties of relevance to a certain phenomenon. Due to a high level of automation and the existence of many interconnecting actors, there has been a strong driving force in the telecommunications related sector towards uniformity and standardisation of processes and technology. The layered nesting of systems is a useful notion when describing systems functionalities. Even though, this concept has been used as basis for systemic studies before 1980 it was specifically brought to the telecommunications related sector by its applicability in the OSI model. F4CC, a process model relating to the healthcare sector, is an example that has benefited from previous work of the TeleManagement Forum (eTOM).
Model Year Application Area of the model Structure Layered Closed Leontief 1936 National / Regional Economy matrix n.a. TCP/IP 1970s Telecom Network Protocol Suite related to Internet 4-tiered yes OSI (ITU-T X.200) 1984 Telecom System Interconnection 7-tiered yes FCAPS 1985 Telecom Network Management pie-shaped no TMN (ITU-T M3400) 1985 Telecom Network Management 4-tiered yes Value Chain 1985 Business Management mixed mainly INA 1993 Business Management (decision making) star-shaped no ITU-T G.80x 1995 Telecom Functional Architecture ∞-tiered yes IEC 61850 1995 Electric Power Systems (data modeling) mixed mainly DEMO 1999 Organisational 3-tiered yes SID 2000 Telecom Information (data modeling) 7-tiered yes eTOM 2002 Telecom Processes 6-tiered yes eTOM process level 1 2002 Telecom Processes mixed mainly STOF 2003 Business Management (methodology) tetrahedron no NGOSS 2004 Telecom Business & Operations transformation 5-tiered yes F4CC 2008 Healthcare Processes mixed mainly
41
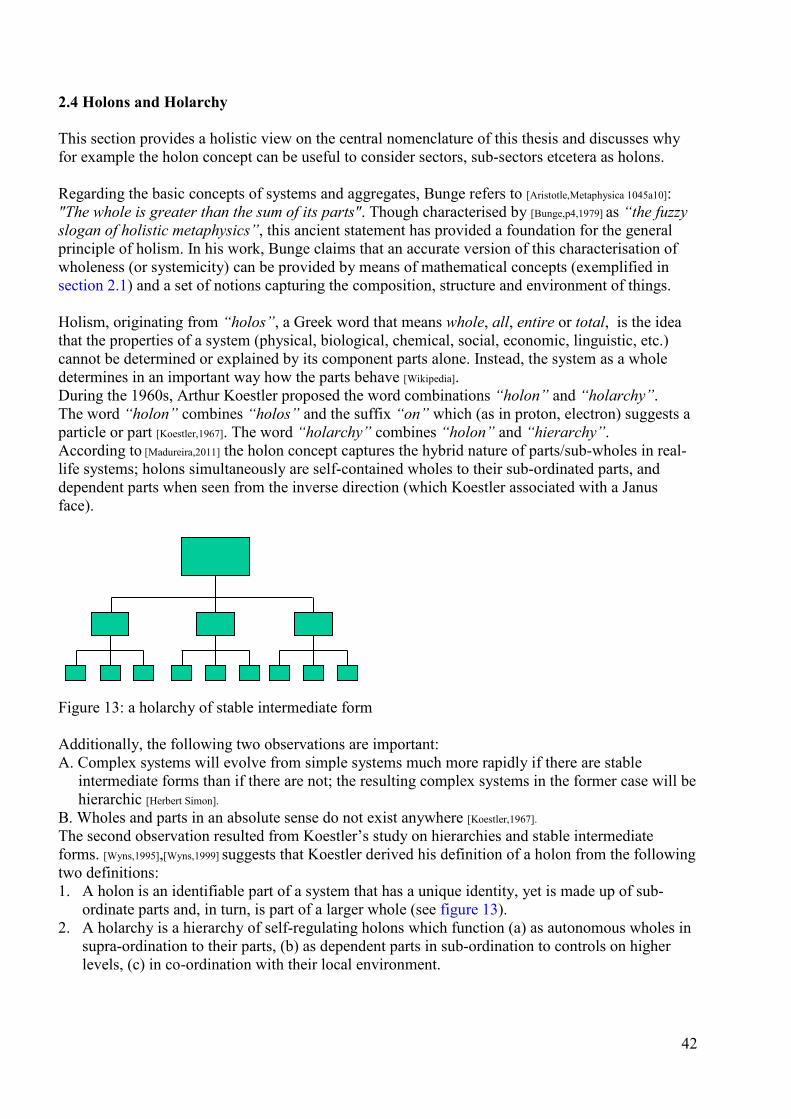
2.4 Holons and Holarchy This section provides a holistic view on the central nomenclature of this thesis and discusses why for example the holon concept can be useful to consider sectors, sub-sectors etcetera as holons. Regarding the basic concepts of systems and aggregates, Bunge refers to [Aristotle,Metaphysica 1045a10]: "The whole is greater than the sum of its parts". Though characterised by [Bunge,p4,1979] as “the fuzzy slogan of holistic metaphysics”, this ancient statement has provided a foundation for the general principle of holism. In his work, Bunge claims that an accurate version of this characterisation of wholeness (or systemicity) can be provided by means of mathematical concepts (exemplified in section 2.1) and a set of notions capturing the composition, structure and environment of things. Holism, originating from “holos”, a Greek word that means whole, all, entire or total, is the idea that the properties of a system (physical, biological, chemical, social, economic, linguistic, etc.) cannot be determined or explained by its component parts alone. Instead, the system as a whole determines in an important way how the parts behave [Wikipedia]. During the 1960s, Arthur Koestler proposed the word combinations “holon” and “holarchy”. The word “holon” combines “holos” and the suffix “on” which (as in proton, electron) suggests a particle or part [Koestler,1967]. The word “holarchy” combines “holon” and “hierarchy”. According to [Madureira,2011] the holon concept captures the hybrid nature of parts/sub-wholes in real-life systems; holons simultaneously are self-contained wholes to their sub-ordinated parts, and dependent parts when seen from the inverse direction (which Koestler associated with a Janus face). Figure 13: a holarchy of stable intermediate form Additionally, the following two observations are important: A. Complex systems will evolve from simple systems much more rapidly if there are stable intermediate forms than if there are not; the resulting complex systems in the former case will be hierarchic [Herbert Simon]. B. Wholes and parts in an absolute sense do not exist anywhere [Koestler,1967]. The second observation resulted from Koestler’s study on hierarchies and stable intermediate forms. [Wyns,1995],[Wyns,1999] suggests that Koestler derived his definition of a holon from the following two definitions: 1. A holon is an identifiable part of a system that has a unique identity, yet is made up of sub-
ordinate parts and, in turn, is part of a larger whole (see figure 13). 2. A holarchy is a hierarchy of self-regulating holons which function (a) as autonomous wholes in
supra-ordination to their parts, (b) as dependent parts in sub-ordination to controls on higher levels, (c) in co-ordination with their local environment.
42
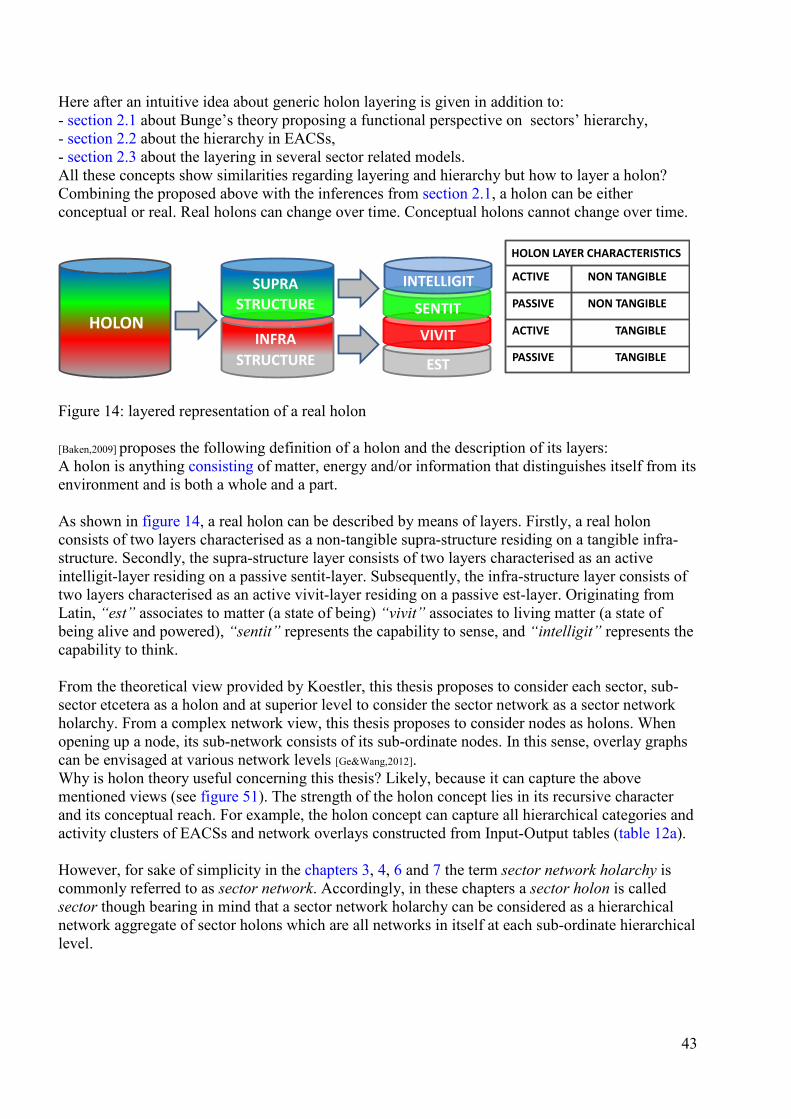
Here after an intuitive idea about generic holon layering is given in addition to: - section 2.1 about Bunge’s theory proposing a functional perspective on sectors’ hierarchy, - section 2.2 about the hierarchy in EACSs, - section 2.3 about the layering in several sector related models. All these concepts show similarities regarding layering and hierarchy but how to layer a holon? Combining the proposed above with the inferences from section 2.1, a holon can be either conceptual or real. Real holons can change over time. Conceptual holons cannot change over time.
Figure 14: layered representation of a real holon [Baken,2009] proposes the following definition of a holon and the description of its layers: A holon is anything consisting of matter, energy and/or information that distinguishes itself from its environment and is both a whole and a part. As shown in figure 14, a real holon can be described by means of layers. Firstly, a real holon consists of two layers characterised as a non-tangible supra-structure residing on a tangible infra-structure. Secondly, the supra-structure layer consists of two layers characterised as an active intelligit-layer residing on a passive sentit-layer. Subsequently, the infra-structure layer consists of two layers characterised as an active vivit-layer residing on a passive est-layer. Originating from Latin, “est” associates to matter (a state of being) “vivit” associates to living matter (a state of being alive and powered), “sentit” represents the capability to sense, and “intelligit” represents the capability to think. From the theoretical view provided by Koestler, this thesis proposes to consider each sector, sub-sector etcetera as a holon and at superior level to consider the sector network as a sector network holarchy. From a complex network view, this thesis proposes to consider nodes as holons. When opening up a node, its sub-network consists of its sub-ordinate nodes. In this sense, overlay graphs can be envisaged at various network levels [Ge&Wang,2012]. Why is holon theory useful concerning this thesis? Likely, because it can capture the above mentioned views (see figure 51). The strength of the holon concept lies in its recursive character and its conceptual reach. For example, the holon concept can capture all hierarchical categories and activity clusters of EACSs and network overlays constructed from Input-Output tables (table 12a). However, for sake of simplicity in the chapters 3, 4, 6 and 7 the term sector network holarchy is commonly referred to as sector network. Accordingly, in these chapters a sector holon is called sector though bearing in mind that a sector network holarchy can be considered as a hierarchical network aggregate of sector holons which are all networks in itself at each sub-ordinate hierarchical level.
SENTIT
VIVIT
EST
STRUCTURE
INFRASTRUCTURE
HOLON
ACTIVE NON TANGIBLE
PASSIVE NON TANGIBLE
ACTIVE TANGIBLE
PASSIVE TANGIBLE
HOLON LAYER CHARACTERISTICS
SUPRA INTELLIGIT
43
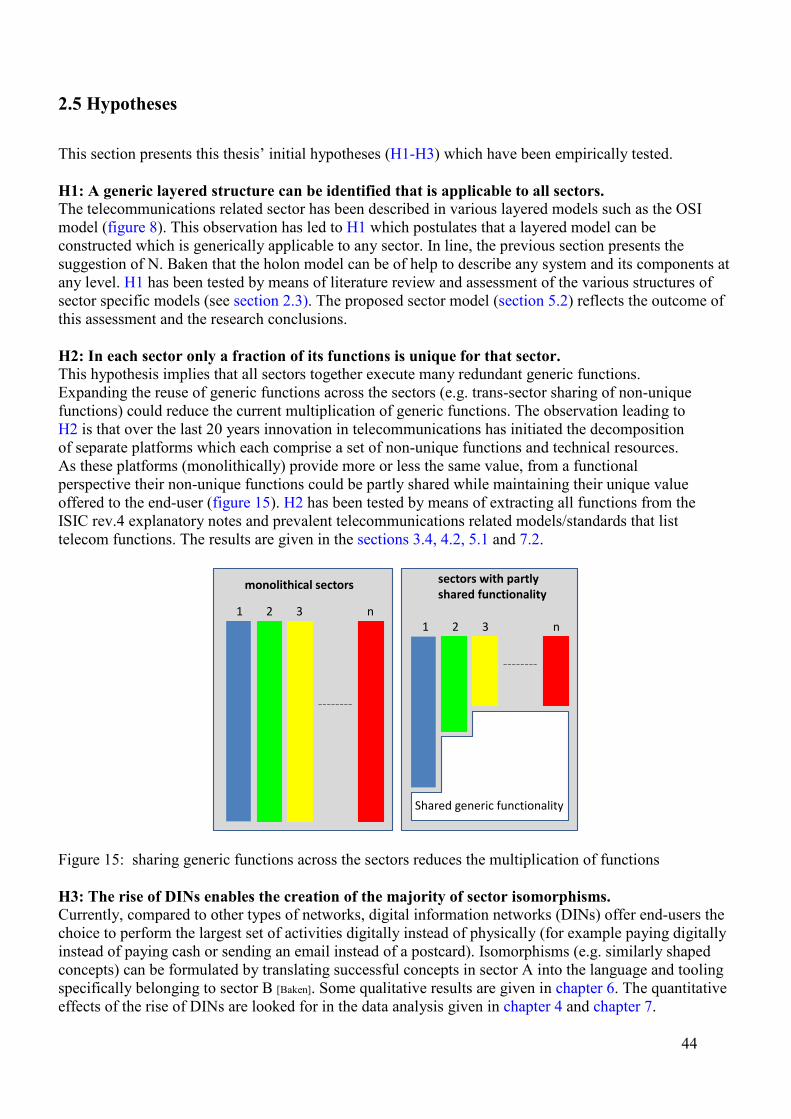
2.5 Hypotheses This section presents this thesis’ initial hypotheses (H1-H3) which have been empirically tested. H1: A generic layered structure can be identified that is applicable to all sectors. The telecommunications related sector has been described in various layered models such as the OSI model (figure 8). This observation has led to H1 which postulates that a layered model can be constructed which is generically applicable to any sector. In line, the previous section presents the suggestion of N. Baken that the holon model can be of help to describe any system and its components at any level. H1 has been tested by means of literature review and assessment of the various structures of sector specific models (see section 2.3). The proposed sector model (section 5.2) reflects the outcome of this assessment and the research conclusions. H2: In each sector only a fraction of its functions is unique for that sector. This hypothesis implies that all sectors together execute many redundant generic functions. Expanding the reuse of generic functions across the sectors (e.g. trans-sector sharing of non-unique functions) could reduce the current multiplication of generic functions. The observation leading to H2 is that over the last 20 years innovation in telecommunications has initiated the decomposition of separate platforms which each comprise a set of non-unique functions and technical resources. As these platforms (monolithically) provide more or less the same value, from a functional perspective their non-unique functions could be partly shared while maintaining their unique value offered to the end-user (figure 15). H2 has been tested by means of extracting all functions from the ISIC rev.4 explanatory notes and prevalent telecommunications related models/standards that list telecom functions. The results are given in the sections 3.4, 4.2, 5.1 and 7.2.
Figure 15: sharing generic functions across the sectors reduces the multiplication of functions H3: The rise of DINs enables the creation of the majority of sector isomorphisms. Currently, compared to other types of networks, digital information networks (DINs) offer end-users the choice to perform the largest set of activities digitally instead of physically (for example paying digitally instead of paying cash or sending an email instead of a postcard). Isomorphisms (e.g. similarly shaped concepts) can be formulated by translating successful concepts in sector A into the language and tooling specifically belonging to sector B [Baken]. Some qualitative results are given in chapter 6. The quantitative effects of the rise of DINs are looked for in the data analysis given in chapter 4 and chapter 7.
monolithical sectors sectors with partlyshared functionality
Shared generic functionality
1 2 3 n1 2 3 n
44
2.6 Conclusions This chapters’ main conclusion from the literature is that sectors together constitute a sector network, which can be envisaged and mathematically modelled as a complex network; a holarchy of sectors. The terms function, network, sector and system together constitute the central nomenclature of this thesis and capture the object of research. Concerning this entire thesis, the following general notions are important and applicable to each chapter. When the term sector is used, it means economic sector as this thesis focuses on the economic aspect of all sectors. By definition, the set of sectors that constitutes the sector network is complete, thus this set comprises all activities categorised in contemporary EACSs such as ISIC rev. 4 and all sectors are complementary and non-overlapping thus by nature exclusive without any ambiguity. Concerning functions: - Bunge proposes to distinguish sector specific functions from generic functions. For example he mentions that Transform commonly appears in every sector as a generic function. - ITU-T proposes Transfer as a generic function in transport networks. The transfer function evidently appears in several sectors other than the telecommunications related sector e.g. manufacture, trade, finance, transport, professional and administrative activities [ISIC,2008]. Concerning classification systems: At superior level the hierarchical structure of an EACS consists of sections. Their names partly show resemblance with commonly used sector names but are not always synonym. EACSs enable its users to translate the names of the sections and divisions into a list of sectors, sub-sectors etcetera. Besides their hierarchical structure, homogeneity is one of the most fundamental characteristics of all classification systems. Generic requirements for these taxonomic systems are that they should solve ambiguity. The statistical units classified in any category should be of one kind [Potter,1988]. When examining the tree structure of ISIC rev.4 (and SBI 2008), 20 trees can be identified. Only the 21st section U has a deviant structure and its repositioning could be considered in next versions of EACSs. Concerning layering and hierarchy: At higher abstraction level, layered views can be constructed for any sector, (sub-sector etcetera). The examined sector related models do not all have a layered structure, as various views can be constructed depending on the specific purpose of a model. However, telecommunications related models at higher abstraction level indeed tend to be clearly layered, while more detailed telecommunications related models show less rigid layering. Concerning holon theory: The concept of holons and holarchy provides a recursive hierarchy of stable intermediate forms applicable to any network and its components. The strength of the holon concept lies in its recursive character and its conceptual reach as this concept can capture all hierarchical categories and activity clusters of EACSs and network overlays constructed from Input-Output tables. This thesis builds on holon theory and the holon concept is applied in order to construct the sector network model. However, for sake of simplicity the researched set of sectors is mainly referred to as sector network (instead of sector network holarchy) because this thesis’ contribution touches on perceiving an economic system as an economic complex network.
45
Chapter 3 Sectors, economic activity classification systems and their evolution Currently, it is unknown how many sectors exist and which ones can be distinguished. From the achieved research results, this chapter answers RQ1 “What defines a sector and which ones can be distinguished?” and its sub-questions: SQ1a “Which functions characterise a sector?” answered in section 3.4, SQ1c “Which relevant sector related data is available?” answered in section 3.2, SQ1d “Which economic activity classification systems exist?” answered in section 3.2, SQ1e “How did the sectors evolve?” answered in section 3.3. The questions above have been approached by means of the following units of research: - literature review with focus on classification principles, sector definitions and classification codes, - a functional analysis aiming to assess the uniqueness of all verbs listed in ISIC rev.4, - a comparison of ISIC rev.4 with a selection of EACSs (originating from G20 member states), - a historical perspective focusing on developments in Dutch EACSs (1930-2008), - a connectivity development perspective of the Dutch sector network (1987-2007). 3.1 What defines a sector and which ones can be distinguished? This section proposes a definition of a sector from the perspective of economic activities. Furthermore, the relation is discussed between the sections of an EACS and the names of sectors. Finally, the criteria that influence an activity cluster to be named a sector are given and ranked. In section 2.1 and the Appendix Definitions, several meanings of the term sector are given and discussed. Wikipedia mentions: “One of several sub-divisions in an economic system used for analysis and classification”. An intuitive answer to the first part of RQ1 could be the following. From any perspective any individual is free to define a list of sectors and sector names. In daily practice, this freedom can be observed in newspaper articles, financial overviews, analyst reports, political/governmental programs [Braams&Urlings,2010] and scientific publications [Florida,2002]. The result culminates in an overwhelming and ever-changing variety of sector names*. However, a group of government related administrative organisations responsible for executing public tasks are bound to operate within the constraints of legislation and a valid classification code. Examples of these tasks are: - issuing licenses to organisations, - formal registration of organisations (establishments) and connecting sector related collective labour agreements to corresponding salaries, - publishing statistical data. Targeted for this specific group of users, a taxonomic system provides a strict methodology and code to categorise any statistical unit [Potter,1988]. Their tasks depend on an up-to-date EACS [van Hooff]. Adapting these classification codes over time, requires a strict implementation methodology as well [van den Brakel,2010]. From this classification view, answering the first part of RQ1 “What defines a sector?” narrows down to: approved EACSs and the experts involved to maintain and adapt them. (*) Recent examples are Horticulture and propagation materials sector, Head offices sector, Creative sector and Agri-food sector [www.government.nl/issues/entrepreneurship-and-innovation/investing-in-top-sectors,2012]. This thesis recommends that e.g. policy makers should propose sector names more carefully, taking general classification principles and conventions into account. Heterogeneous tailor-made statistical compilations requiring data beyond two-digit level can only be (re)produced having access to strictly proprietary micro data of a national statistical office under NDA. This complicates (re)producing or verifying current top-sector related compilations e.g. by a chamber of commerce.
46
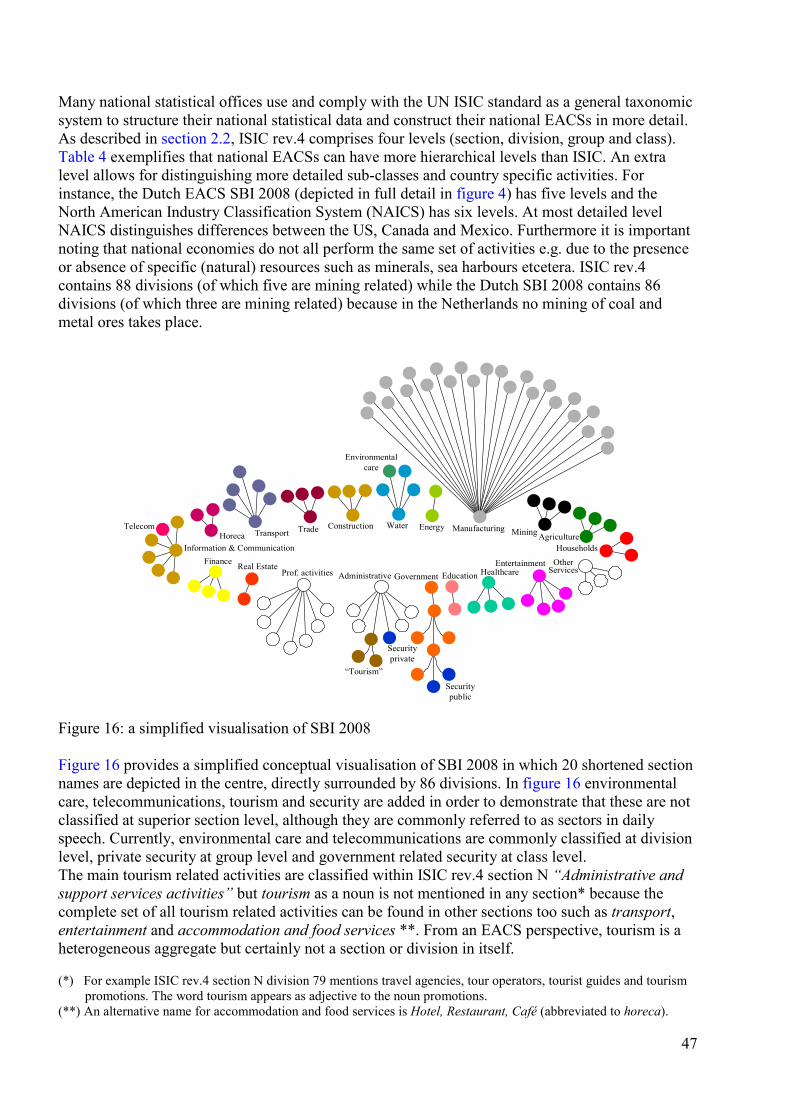
Many national statistical offices use and comply with the UN ISIC standard as a general taxonomic system to structure their national statistical data and construct their national EACSs in more detail. As described in section 2.2, ISIC rev.4 comprises four levels (section, division, group and class). Table 4 exemplifies that national EACSs can have more hierarchical levels than ISIC. An extra level allows for distinguishing more detailed sub-classes and country specific activities. For instance, the Dutch EACS SBI 2008 (depicted in full detail in figure 4) has five levels and the North American Industry Classification System (NAICS) has six levels. At most detailed level NAICS distinguishes differences between the US, Canada and Mexico. Furthermore it is important noting that national economies do not all perform the same set of activities e.g. due to the presence or absence of specific (natural) resources such as minerals, sea harbours etcetera. ISIC rev.4 contains 88 divisions (of which five are mining related) while the Dutch SBI 2008 contains 86 divisions (of which three are mining related) because in the Netherlands no mining of coal and metal ores takes place.
AgricultureInformation & Communication
Energy Manufacturing MiningHoreca TransportConstruction Water
Prof. activities GovernmentAdministrative Education HealthcareEntertainment
Households
Trade
Real Estate
Securitypublic
“Tourism”
Telecom
Environmentalcare
OtherServices
Finance
Securityprivate
Figure 16: a simplified visualisation of SBI 2008 Figure 16 provides a simplified conceptual visualisation of SBI 2008 in which 20 shortened section names are depicted in the centre, directly surrounded by 86 divisions. In figure 16 environmental care, telecommunications, tourism and security are added in order to demonstrate that these are not classified at superior section level, although they are commonly referred to as sectors in daily speech. Currently, environmental care and telecommunications are commonly classified at division level, private security at group level and government related security at class level. The main tourism related activities are classified within ISIC rev.4 section N “Administrative and support services activities” but tourism as a noun is not mentioned in any section* because the complete set of all tourism related activities can be found in other sections too such as transport, entertainment and accommodation and food services **. From an EACS perspective, tourism is a heterogeneous aggregate but certainly not a section or division in itself. (*) For example ISIC rev.4 section N division 79 mentions travel agencies, tour operators, tourist guides and tourism promotions. The word tourism appears as adjective to the noun promotions. (**) An alternative name for accommodation and food services is Hotel, Restaurant, Café (abbreviated to horeca).
47
Criteria and factors that influence an activity cluster to be named a sector According to Potter [Potter,1988], homogeneity (meaning of similar kind or nature) is one of the most fundamental characteristics of statistical compilations related to establishments (organisations). Homogeneity is a generic aspect concerning classification system development and methodology (grouping like with like). Potter states: “each system of classification embodies some criterion or criteria for defining homogeneity and thus delineating the class”. Potter identifies: 1. the type of economic activity carried out, 2. the type of goods or services produced or dealt with, as the two most significant definitional criteria for defining homogeneity of groupings of statistical units to compile statistical data about. Qualified as less relevant by Potter, three additional criteria to categorise statistical units are: 3. size (because quantity is empirical information and not a definitional criterion), 4. nationality of control, 5. regional location. From a Statistics Netherlands expert workshop the following factors (A,B) and criteria (C-K) were added (to the above mentioned by Potter) and ranked on their estimated definitional influence. Examples of sources that provide evidence concerning this influence are subjoined: A. effectiveness of lobbies related to a specific sector, sub-sector or alternative grouping, B. sector specific interests for particular countries, C. homogeneity of production means (tools). The factors A, B and criterion C are evidently influential. For example, the OECD published an alternative aggregation for the information economy and its sectors [OECD,2006] (see section 7.1 for more details). [ISIC rev.4,p277,2008] mentions: “The OECD has taken a leading role in standardizing the definition of the ICT and “content” sectors”. Firstly, note that the OECD participated in the review of ISIC rev. 4. [OECD, Annex 1B,p103,remark 397,2007] on behalf of its 29 member countries. Secondly, note that the OECD publication “Information Economy – Sector Definitions based on ISIC rev.4”, DSTI/ICCP/IIS(2006)2/FINAL was published before the release of the final version of ISIC rev.4 in 2008. Thirdly, note that in the previous ISIC rev.3.1, section I was named “Transport, storage and communications” while in ISIC rev.4 in section J the previous term “communications” has been replaced by “Information and communication”. [OECD, Annex 1B,p103,remark 399,2007] mentions “The UNSD agreed to integrate the OECD proposed sector and product definitions in their 2007 classifications as alternative aggregates. This presented an opportunity to encourage the use of these standards outside the boundaries of the OECD, a goal supported by the Committee for Information, Computer and Communication Policy (ICCP) and in line with the outreach strategy embraced at the World Summits on the Information Society (2003 and 2005)”. As a result, ISIC rev.4 Part 4 Appendix B has incorporated the OECD 2006 alternative aggregate. Furthermore the existence of more than 400 Dutch branch representing organisations [Roodink,p159,2011] (some of which claiming that their specific activity cluster is a sector), also indicate the relevance of lobbies. D. inter-relatedness of activities (for example the energy related ISIC section D contains manufacture, trade, long-distance transport and distribution to end-users), E. proximity of functions (for example aerial advertising is categorised in the ISIC advertising related class M7310 and not in the transport related section H ), Although the definitional influence of the criteria D and E can be observed in EACSs [van Hooff], no evidence in documents, meeting reports etcetera was found. F. change introduced in the input to produce the output, G. funding of activities (activity clusters that fund). The definitional influence of the criteria F and G is unclear and no sources of evidence were found.
48
In order to complete the list of possible criteria mentioned during the expert workshop, the size of a sector* can be sub-divided into: H. sector size in terms of the number of different activities I. sector size in terms of the volume of units of value transacted (e.g. expressed in euro), J. sector size in terms of the number of involved employees, K. sector size in terms of the number of enterprises. Historic track record The historic track record of a section/sector name is not a criterion but an observed fact (because old criteria cause inertness). From the examined Dutch EACSs [SN,1930],[SN,1950],[SN,1960],[SN,1974], [SBI1993],[SBI2008] it can be observed that section and sector naming is clearly influenced from a historical track record. Table 6 demonstrates this renaming process over a period of 80 years. Over time, the relevance of a section must diminish substantially before it will be classified at a lower level in a next version of ISIC or a national EACS. Knowing that national EACSs are updated once in a period of 15-20 years and the fact that change in an EACS induces substantial amounts of administrative work at national level (e.g. collecting and recording reported national data in a renewed structure), adaptation and implementation takes many years. Furthermore, when defining a new version of ISIC, the international consensus reaching process (with many involved stake holders) requires a substantial period as well. The ISIC rev.4 introduction [ISIC,p5,2008] mentions about the international acceptance of ISIC that: “ISIC was developed with rigorous consultation and collaboration among all stakeholders – national statistical offices, international organizations, academia and others. Through this inclusive revision process, it has been possible to include features in ISIC that make it useful and attractive for the majority of countries around the world.” Though not forced by EACS adaptations, sector naming in day-to-day speech is also subject to gradual change. Describing functions with verbs As stated from theory in chapter 2, among the properties and criteria that define a sector and its name, the sector’s specific functions are crucial. Functions capture what an activity cluster does, expressed by means of verbs. The set of specific functions comprises a sub-set of unique functions. For example the sector name Education is a clearly accepted name that does not seem to require further discriminative additions. This name is commonly used as section name and sector name (see table 5). Furthermore, the corresponding verb to educate does not appear in the descriptions of other sections (see section 3.4 and the ISIC rev.4 explanatory notes analysis results listed in Appendix EACS ISIC). However, this example of exclusiveness in name and function belongs to a minority because the majority of specific sector related functions is not always uniquely associated to a sector or section (see table 8). For example the verb to cure clearly relates to the health care sector and section. But because veterinary organisations engaged in animal health care, are commonly classified and perceived outside health care, the verb/function to cure is not exclusively related to one section or sector. Thus, in line with the two definitional criteria mentioned by Potter; “when a unique and exclusive description of a category is required and the name of a specific function does not uniquely distinguish this category from all others, a composite is required that combines specific functions with the related specific type of value/objects that sector produces or deals with”. Section 3.2 deals with the matter of uniqueness and consensus regarding section and sector names while section 3.4 explains the corresponding research and methodology regarding functions. (*) Although the relevance of size as a definitional criterion is doubtful (see section 4.1), it is worth noting that the manufacturing sector involves the largest number of different activities (observed in all investigated EACSs) and the largest amount of produced value expressed in euros (observed in the German and Dutch Input-Output data). Currently, the largest part of the Dutch labour force is employed in the trade sector.
49
Conclusions from this section Regarding the notion of a sector, this thesis builds on a definition derived from [ISIC rev.4,2008] and
[Potter,1988]: A sector is a more or less homogeneous economic activity cluster that produces similar type of goods and/or services or uses similar processes. In the context of this thesis, two additions to this definition are important: - a sector performs at least one unique function that enables its value offer to all sectors, - social activities can be classified and analysed from an economic view as well [van Hooff]. Without any constraint, any individual is free to define a list of sectors and sector names from any perspective. Everyone can aggregate activities for any purpose and label this cluster a sector. In contrast, government related organisations that issue licenses, classify organisations and publish statistics are bound to classification constraints and international agreements. From a classification view, the answer to the first part of RQ1 “What defines a sector?” narrows down to; EACSs and the experts authorised to maintain and adapt them. Observed from theory, homogeneity is an important and generic aspect concerning classification system development and methodology. The two most significant criteria for defining homogeneity of groupings of statistical units are: 1) the type of economic activity (its directly related functions), 2) the type of goods or services produced or dealt with (its directly transacted value). Combining 1) and 2), any sector and its sub-ordinate activity clusters can be uniquely distinguished and defined (named). Additionally, influential factors worth mentioning are the effectiveness of lobbies and the historical track record of the name of a sector or section. Concerning naming, quantitative criteria are less influential. 3.2 Inventory and comparison of economic activity classification systems This section answers SQ1c “Which relevant sector related data is available?” It gives an inventory, compares and discusses examples of contemporary EACSs issued by: - the United Nations Statistics Division (ISIC rev.4), - the European Community (NACE rev.2), - clusters of countries; - the Statistical bureaus of the US, Canada and Mexico (NAICS 2012), - the Australian Bureau of Statistics and Statistics New Zealand (ANZSIC rev.1), - national statistical offices. Based on a UN questionnaire, the UN Statistics Division website [unstats.un.org/unsd/cr/ctryreg,1Q2013] mentions the existence of ~700 classification systems/codes originating from 133 countries; 55 African, 186 Asian, 67 North American, 25 Oceanian, 36 South American and 342 European. Because national statistical offices can publish statistics captured in national classification codes constructed from various classification system perspectives (such as activities, occupations and products), the set of EACSs is a sub-set within the UN inventory of ~700 classification systems. Organisations such as news agencies, credit rating organisations, banks and consultancy firms also publish classification systems (containing quantitative compilations). Examples are: STOXX 600, Thomson Reuters Business Classification, Sector overview NRC Handelsblad, etcetera. In this thesis’ research, the abundance of sector names provided by these business oriented classification systems has been examined (but not their composition which tends to be incomplete due to their prime focus on private companies).
50
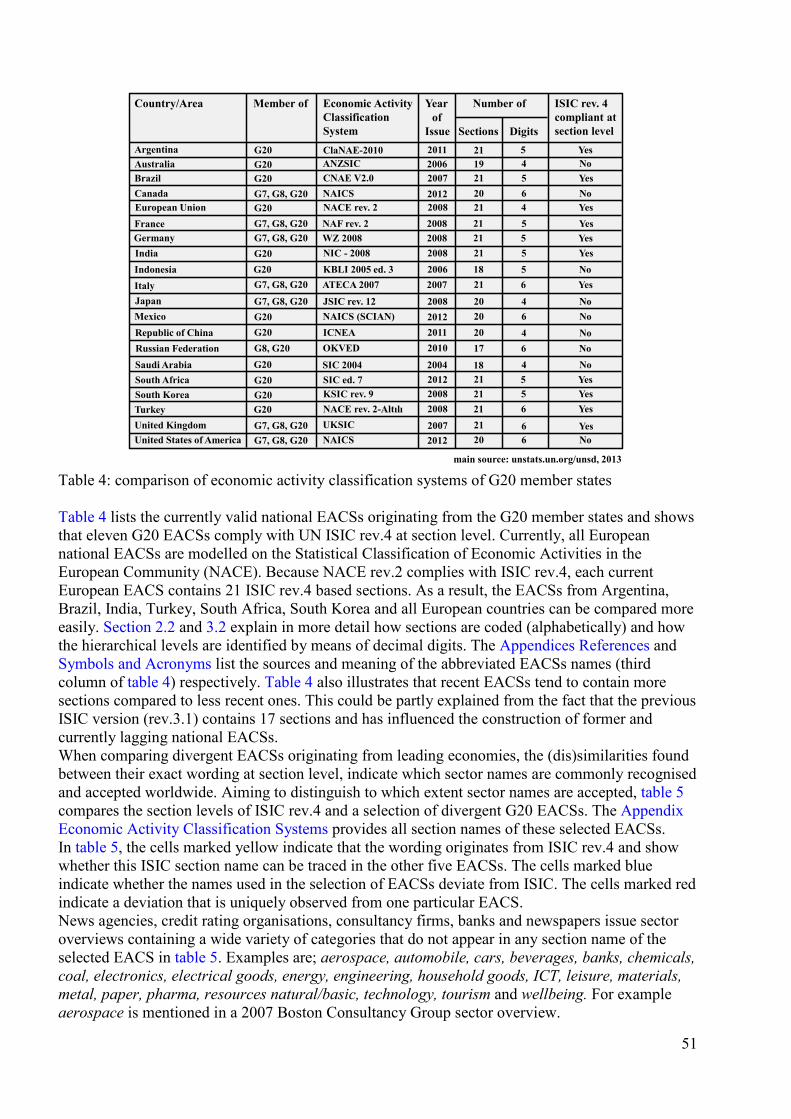
Table 4: comparison of economic activity classification systems of G20 member states
Table 4 lists the currently valid national EACSs originating from the G20 member states and shows that eleven G20 EACSs comply with UN ISIC rev.4 at section level. Currently, all European national EACSs are modelled on the Statistical Classification of Economic Activities in the European Community (NACE). Because NACE rev.2 complies with ISIC rev.4, each current European EACS contains 21 ISIC rev.4 based sections. As a result, the EACSs from Argentina, Brazil, India, Turkey, South Africa, South Korea and all European countries can be compared more easily. Section 2.2 and 3.2 explain in more detail how sections are coded (alphabetically) and how the hierarchical levels are identified by means of decimal digits. The Appendices References and Symbols and Acronyms list the sources and meaning of the abbreviated EACSs names (third column of table 4) respectively. Table 4 also illustrates that recent EACSs tend to contain more sections compared to less recent ones. This could be partly explained from the fact that the previous ISIC version (rev.3.1) contains 17 sections and has influenced the construction of former and currently lagging national EACSs. When comparing divergent EACSs originating from leading economies, the (dis)similarities found between their exact wording at section level, indicate which sector names are commonly recognised and accepted worldwide. Aiming to distinguish to which extent sector names are accepted, table 5 compares the section levels of ISIC rev.4 and a selection of divergent G20 EACSs. The Appendix Economic Activity Classification Systems provides all section names of these selected EACSs. In table 5, the cells marked yellow indicate that the wording originates from ISIC rev.4 and show whether this ISIC section name can be traced in the other five EACSs. The cells marked blue indicate whether the names used in the selection of EACSs deviate from ISIC. The cells marked red indicate a deviation that is uniquely observed from one particular EACS. News agencies, credit rating organisations, consultancy firms, banks and newspapers issue sector overviews containing a wide variety of categories that do not appear in any section name of the selected EACS in table 5. Examples are; aerospace, automobile, cars, beverages, banks, chemicals, coal, electronics, electrical goods, energy, engineering, household goods, ICT, leisure, materials, metal, paper, pharma, resources natural/basic, technology, tourism and wellbeing. For example aerospace is mentioned in a 2007 Boston Consultancy Group sector overview.
Number of
Sections
Country/Area Year
2007
20
19
20
Economic ActivityClassificationSystem
21
21Australia
OKVED
main source: unstats.un.org/unsd, 2013
NACE rev. 2 2008
2011
2011Republic of ChinaNAICS (SCIAN)
2010
ANZSIC
2012Mexico
2006
2008
21
JSIC rev. 12
Digits5 Yes
4 No
6 Yes
4 Yes
6 NoICNEA
6 No
4 No
4 No
of
UKSIC
Argentina
Issue
European Union
Japan
Russian Federation 17
United Kingdom
20
2008India NIC - 2008 5 Yes21
2007Brazil CNAE V2.0 5 Yes21
Member of
G20
G20
G7, G8, G20
G20
G20
G7, G8, G20
G8, G20G20
G20
G2020NAICS 2012Canada 6 NoG7, G8, G20
20NAICS 2012United States of America 6 NoG7, G8, G20
France G7, G8, G20
SIC 2004 2004 4 NoSaudi Arabia 18G20
South Korea G20
Germany G7, G8, G20
Turkey G20
Indonesia G20
ClaNAE-2010
NAF rev. 2 2008 5 Yes21WZ 2008 2008 5 Yes21
Italy G7, G8, G20 ATECA 2007 2007 6 Yes212006KBLI 2005 ed. 3 5 No18
South Africa G20 SIC ed. 7 212012 5 Yes212008 5 YesKSIC rev. 9212008 6 YesNACE rev. 2-Altılı
ISIC rev. 4compliant atsection level
51
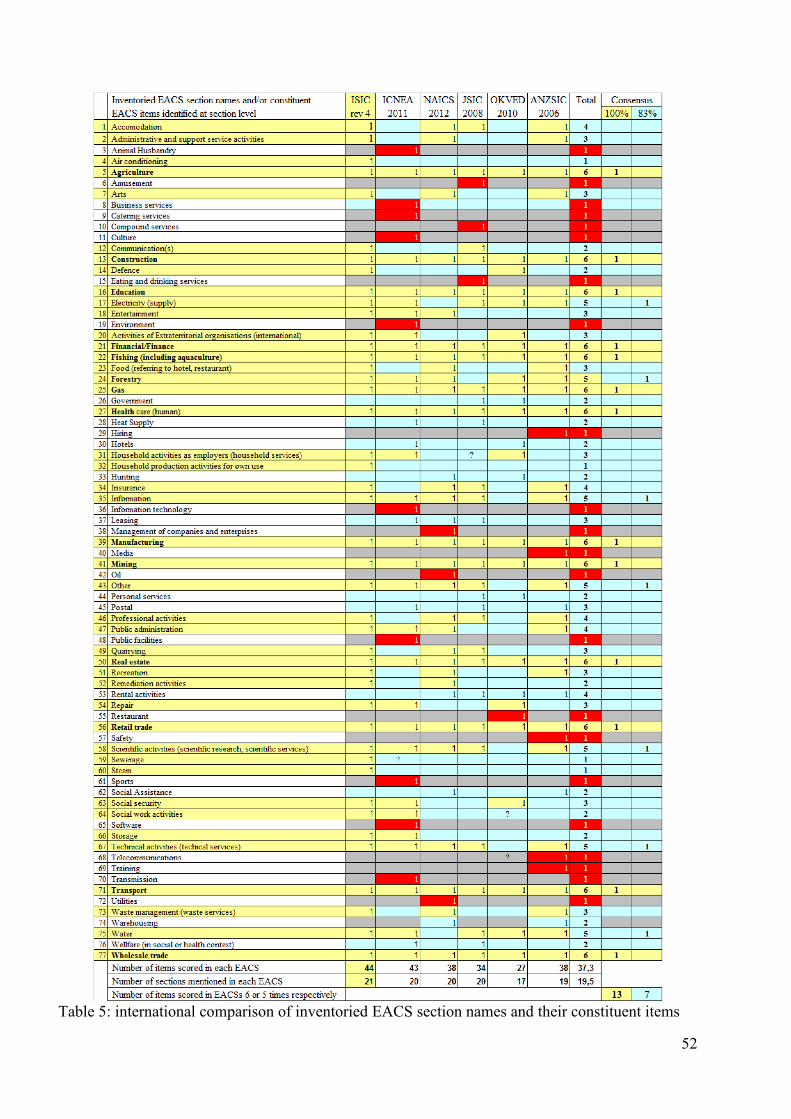
Table 5: international comparison of inventoried EACS section names and their constituent items
52
It is worth noting that within one EACS section name approximately two items are mentioned on average in the set of selected EACSs. An example of a section name consisting of four items is ISIC rev.4 section D “Electricity, gas, steam and air conditioning supply”. Section name examples consisting of one item are section F “Construction” and section C “Manufacturing”. Table 5 shows that 13 section names/items unanimously appear at section level in the selected EACSs: 1. Agriculture, 2. Construction, 3. Education, 4. Finance, 5. Fishing, 6. Gas, 7. Health care, 8. Manufacturing, 9. Mining, 10. Real Estate, 11. Retail trade, 12. Transport, and 13. Wholesale trade. Table 5 also shows that seven section names/items appear at section level in five out of six selected EACSs: 1. Electricity, 2. Forestry, 3. Information, 4. Other (services), 5. Scientific activities, 6. Technical activities and 7. Water. For example NAICS 2012 [www.census.gov,2013] classifies water and electricity within “Utilities” . National EACSs are described in each country’s native language. Comparing national EACSs introduces translation difficulties because not all national EACSs (and filled in UN questionnaires) are available in English on publicly accessible websites or statistical archives. The Appendix Economic Activity Classification Systems exemplifies the Russian OKVED 2010 [Goskomstandart,2010]
and the Chinese ICNEA 2011 accounting for the English translation of their section names as included in table 5. ISICs’ residual section S “Other services activities” comprises human well-being, human care and repair related activity clusters. Interestingly, OKVED 2010 proves that a contemporary EACS can be defined without a residual section. This fact gives rise to consider an EACS alternative. An option could be to merge the human care part of ISIC section S and section Q “Human health and social work activities” into a broader human-care and wellness oriented section. Their functions and value context are alike to a high extent. The proposed name of this section and corresponding sector could be “Human care” or “Care”. This adaption would require a merger of the remaining repair activities from section S into other existing sections which is common practice; the ISIC rev.4 explanatory notes categorises repair activities in seven different sections B,C,F,G,N,S and T. From section names to sector names Answering RQ1 requires translating section to sector names. Sector names tend to be shorter and more condensed than EACS section names as the latter need to reflect all their prime items while sector names aim to capture the heart of the matter. The EACS comparison (table 5 column Total) indicates 13 section names/items appearing unanimously and seven appearing in all but one. At first glance, eight out of these 13 are commonly used as sector names: 1. Construction, 2. Education, 3. Finance, 4. Mining, 5. Manufacturing, 6. Real Estate, 7. Transport and 8. Water. The list of sector names could be extended to eleven without severe conflicts or contradictions when taking the following three observations into account: 9. Retail trade and Wholesale trade seem homogeneous in nature. Observed from newspaper articles, scientific publications etcetera, this duo is commonly grouped together and shortened into the sector name Trade. 10. Agriculture and Forestry are commonly grouped together where the sector name Agriculture seems prevalent for this merger in all examined EACSs. However, fishing and agriculture activities pose some difficulty because these are not always grouped together at section level. From this sections’ comparison, the sector name Agriculture and fishing seems defendable. This inference is in line with observations from a historical perspective (see table 6). 11. The name of ISIC section D “Electricity, gas, steam and air conditioning supply” seems too long to serve as a sector name. Observed from newspaper articles, scientific publications etcetera, the four items of this section are often associated with the sector name Energy.
53
From section and sector names towards estimates of the number of sectors The residual ISIC section S “Other services activities” cannot be counted as a sector. Thus, after this correction the maximum number of contemporary sectors could be estimated 20 (from ISIC). Having identified only 11 sectors from table 5 so far, indicates that there are other sectors to distinguish. Table 5 (column Total) also scores several related items that are mentioned five times or less. This indicates the existence of sectors that lack (world-wide) consensus how to exactly name them. Four examples are: - accommodation (4x), food services (3x), hotels (2x), restaurant (1x) and catering services (1x), - entertainment (3x), arts (3x), recreation (3x), culture (1x), amusement (1x), - information (5x), communication (2x), telecommunications (1x), transmission (1x), media (1x), - human healthcare, human health, human care and health care (6x care in large variety). Although each of these four examples may refer to one and the same sector, their variety in section naming (and translation from and to English) complicates determining the sector names. Despite this complication, these four examples can be safely counted as four sectors. When adding these four examples to the 11 found previously, the minimum number of contemporary sectors could be extended to 15. Identifying the remaining sectors cannot be done solely from analysing section names/items from the left-hand column of table 5 because this would require intuitive or speculative assumptions. The following examples of EACS item names listed in table 5 feature this problem: - scientific activities (5x), technical activities/services (5x), professional activities (4x), - waste management (3x), remediation activities (2x), environment and public facilities (1x), sewerage (1x), - rental (4x), administrative & support service activities (3x), leasing (3x), hiring (1x), - public administration (4x), government (2x), activities of extraterritorial organisations (3x), social security (3x), social work activities (2x), social assistance (2x), defence (2x), safety (1x), - household activities as employers (3x), household production activities for own use (1x). In order to complete the analysis towards a proposed list of sector names (see table 8 and table 26), section 3.3 examines RQ1 from a historical viewpoint and section 3.4 from a functional viewpoint. The sections 4.1 and 4.4 each provide an additional complex network analysis viewpoint and a method to address the problem of estimating the number of sectors. Conclusions from this section From a selection of contemporary EACSs, this section compares a variety of section names and their composition. The G7 member countries have EACSs that currently consist of 20.6 sections per EACS on average and for the G8 member countries (G7 and the Russian Federation) 20.1 is found. Most EACs contain a residual section “Other services activities” * which cannot be counted as a sector. When leaving this residual section out and assuming that the number of remaining sections indicates the number of contemporary sectors, for the leading world economies a range is found between 17 and 20 sectors. Sector lists provided by private organisations and the item names mentioned within the full section names of the compared EACS, enable determining corresponding sector names. As a result, 11 sector names seem fairly clear worldwide and four additional sectors can be counted without solving their naming issues. Thus from this sections’ EACS comparison, the minimum number of contemporary sectors is estimated higher than 15 at least. (*) Both OKVED 2010 and its predecessor OKVED 2003 have no residual section. In line with the classification principles described by [Potter,1988], OKVED classifies ISIC rev.4 residual section related activities based on the homogeneity of their functions. For example repair of household equipment and personal goods are grouped together with the repair of other types of goods in OKVEDs trade related section. Furthermore in OKVED 2003/2010 personal services are grouped together with municipal and social services.
54
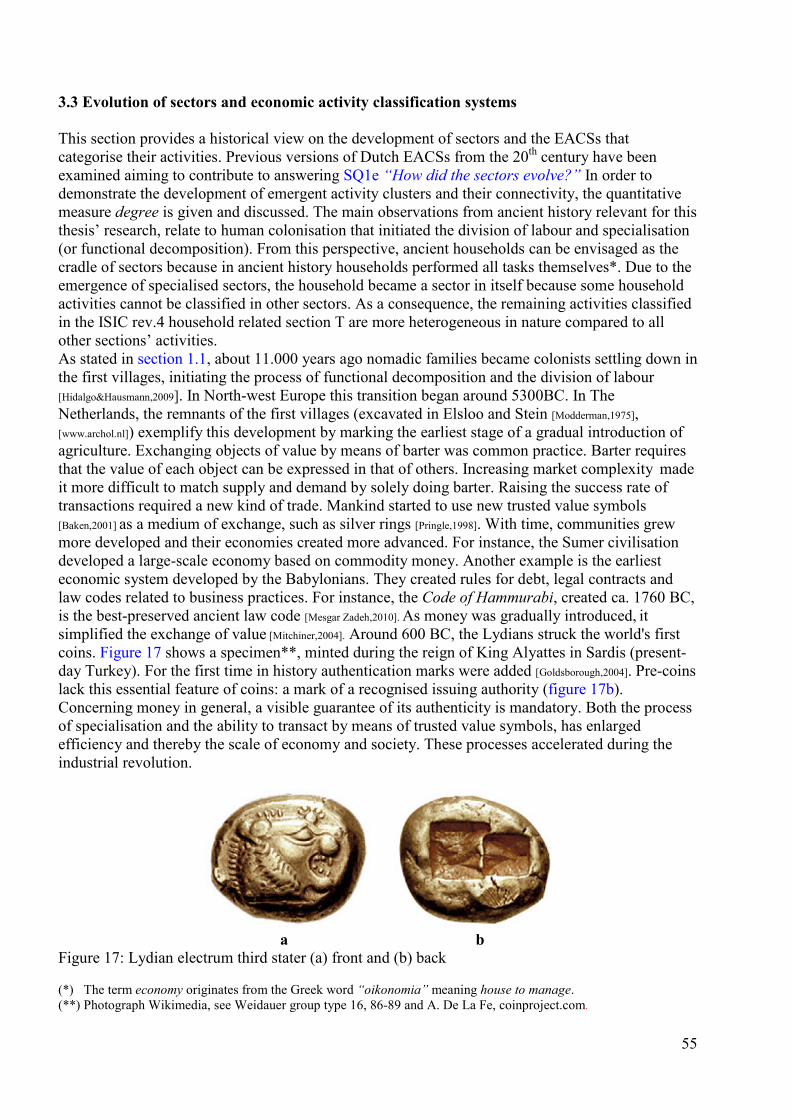
3.3 Evolution of sectors and economic activity classification systems This section provides a historical view on the development of sectors and the EACSs that categorise their activities. Previous versions of Dutch EACSs from the 20th century have been examined aiming to contribute to answering SQ1e “How did the sectors evolve?” In order to demonstrate the development of emergent activity clusters and their connectivity, the quantitative measure degree is given and discussed. The main observations from ancient history relevant for this thesis’ research, relate to human colonisation that initiated the division of labour and specialisation (or functional decomposition). From this perspective, ancient households can be envisaged as the cradle of sectors because in ancient history households performed all tasks themselves*. Due to the emergence of specialised sectors, the household became a sector in itself because some household activities cannot be classified in other sectors. As a consequence, the remaining activities classified in the ISIC rev.4 household related section T are more heterogeneous in nature compared to all other sections’ activities. As stated in section 1.1, about 11.000 years ago nomadic families became colonists settling down in the first villages, initiating the process of functional decomposition and the division of labour [Hidalgo&Hausmann,2009]. In North-west Europe this transition began around 5300BC. In The Netherlands, the remnants of the first villages (excavated in Elsloo and Stein [Modderman,1975], [www.archol.nl]) exemplify this development by marking the earliest stage of a gradual introduction of agriculture. Exchanging objects of value by means of barter was common practice. Barter requires that the value of each object can be expressed in that of others. Increasing market complexity made it more difficult to match supply and demand by solely doing barter. Raising the success rate of transactions required a new kind of trade. Mankind started to use new trusted value symbols [Baken,2001] as a medium of exchange, such as silver rings [Pringle,1998]. With time, communities grew more developed and their economies created more advanced. For instance, the Sumer civilisation developed a large-scale economy based on commodity money. Another example is the earliest economic system developed by the Babylonians. They created rules for debt, legal contracts and law codes related to business practices. For instance, the Code of Hammurabi, created ca. 1760 BC, is the best-preserved ancient law code [Mesgar Zadeh,2010]. As money was gradually introduced, it simplified the exchange of value [Mitchiner,2004]. Around 600 BC, the Lydians struck the world's first coins. Figure 17 shows a specimen**, minted during the reign of King Alyattes in Sardis (present-day Turkey). For the first time in history authentication marks were added [Goldsborough,2004]. Pre-coins lack this essential feature of coins: a mark of a recognised issuing authority (figure 17b). Concerning money in general, a visible guarantee of its authenticity is mandatory. Both the process of specialisation and the ability to transact by means of trusted value symbols, has enlarged efficiency and thereby the scale of economy and society. These processes accelerated during the industrial revolution.
a b
Figure 17: Lydian electrum third stater (a) front and (b) back (*) The term economy originates from the Greek word “oikonomia” meaning house to manage. (**) Photograph Wikimedia, see Weidauer group type 16, 86-89 and A. De La Fe, coinproject.com.
55
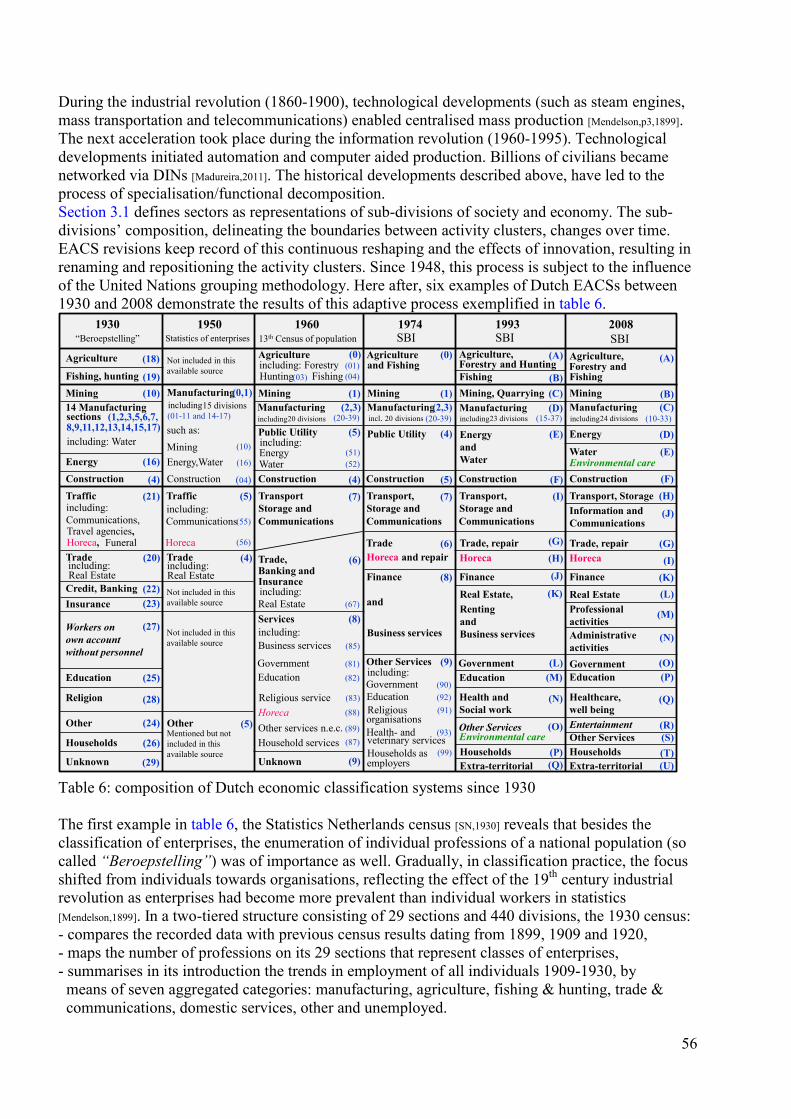
During the industrial revolution (1860-1900), technological developments (such as steam engines, mass transportation and telecommunications) enabled centralised mass production [Mendelson,p3,1899]. The next acceleration took place during the information revolution (1960-1995). Technological developments initiated automation and computer aided production. Billions of civilians became networked via DINs [Madureira,2011]. The historical developments described above, have led to the process of specialisation/functional decomposition. Section 3.1 defines sectors as representations of sub-divisions of society and economy. The sub-divisions’ composition, delineating the boundaries between activity clusters, changes over time. EACS revisions keep record of this continuous reshaping and the effects of innovation, resulting in renaming and repositioning the activity clusters. Since 1948, this process is subject to the influence of the United Nations grouping methodology. Here after, six examples of Dutch EACSs between 1930 and 2008 demonstrate the results of this adaptive process exemplified in table 6.
Table 6: composition of Dutch economic classification systems since 1930
The first example in table 6, the Statistics Netherlands census [SN,1930] reveals that besides the classification of enterprises, the enumeration of individual professions of a national population (so called “Beroepstelling”) was of importance as well. Gradually, in classification practice, the focus shifted from individuals towards organisations, reflecting the effect of the 19th century industrial revolution as enterprises had become more prevalent than individual workers in statistics
[Mendelson,1899]. In a two-tiered structure consisting of 29 sections and 440 divisions, the 1930 census: - compares the recorded data with previous census results dating from 1899, 1909 and 1920, - maps the number of professions on its 29 sections that represent classes of enterprises, - summarises in its introduction the trends in employment of all individuals 1909-1930, by means of seven aggregated categories: manufacturing, agriculture, fishing & hunting, trade & communications, domestic services, other and unemployed.
1930 1950 1960 1974 1993 2008“Beroepstelling” Statistics of enterprises 13th Census of population SBISBISBI
Agriculture
Fishing, huntingMining14 Manufacturing
EnergyConstructionTraffic
Other
Households
Religion
Workers onown accountwithout personnel
Education
Trade
Credit, BankingInsurance
Unknown
Horeca,
Communications,Travel agencies,
Funeral
Unknown
Manufacturing
Information andCommunications
Trade, repair
Finance
Mining
Energy
Water
Horeca
Real Estate
Transport, StorageConstruction
Agriculture,
ProfessionalactivitiesAdministrativeactivitiesGovernmentEducation
Healthcare,well beingEntertainmentOther ServicesHouseholds
Not included in this available source
Environmental care
(A)Agriculture,
Mining, QuarryingManufacturing
Energy andWater
FishingFishing
ConstructionTransport,Storage andCommunications
Agriculture Agriculture
Mining
Trade, repairHoreca
Households
Other Services
Health andSocial work
EducationGovernment
Finance
Real Estate, Renting andBusiness services
Environmental care
Manufacturing
Public Utility Public Utility
ConstructionConstructionConstruction
Manufacturing
Transport, Storage andCommunications
MiningEnergy,Water
Traffic
such as:
Other Services
including:Communications
including:Transport Storage andCommunications
Trade
Not included in this available source
Not included in this available source
Finance
and
TradeHoreca and repairTrade,
Banking andInsurance
Real Estate
Horeca
MiningManufacturing
Servicesincluding:
Education
Religious service
Household services
Government
Other services n.e.c.
Extra-territorialExtra-territorial
WaterEnergy
Forestry and
Business services
Forestry and Hunting
including:
Horeca
(A)
(B)(B)
(C)(C)
(D)
(D)
(E)
(E)
(F)(F)
(G)(G)
(H)
(H) (I)
(I)(J)
(J) (K)(K) (L)
(L)
(M)
(M)
(N)
(N)
(O)
(O)
(P)
(P)
(1)
(18)
(19)(10)
(1,2,3,5,6,7,
(16)
(4)(21)
(20)
(22)(23)
(27)
(25)
(28)
(24)
(Q)
(01-11 and 14-17)
(10)
(16)
(04)(5)
(56)
(1)
(51)(52)
(67)
(0)
(2,3)
(R)
(Q)
(S)(T)(U)
(26)
(29)
(55)
(4)
(04)
(20-39)
(5)
(4)(7)
(0)
(8)
(85)
(81)(82)
(83)
(88)
(87)(89)
8,9,11,12,13,14,15,17)
(9)
(4)
(5)(7)
(6)
(9)
(8)
including: ForestryHunting Fishing
(01)(03)
sections
(6)
including:
(2,3)
Business services
including:Real Estate
including: Water
including (20-39)incl. 20 divisions20 divisions including23 divisions including24 divisions
Households as (99)
including:
EducationReligious
Government (90)(92)(91)
Health- and (93)veterinary services
(15-37) (10-33)
and Fishing
(0,1)including15 divisions
including:Real Estate
Other (5)Mentioned but not included in thisavailable source
employers
organisations
56
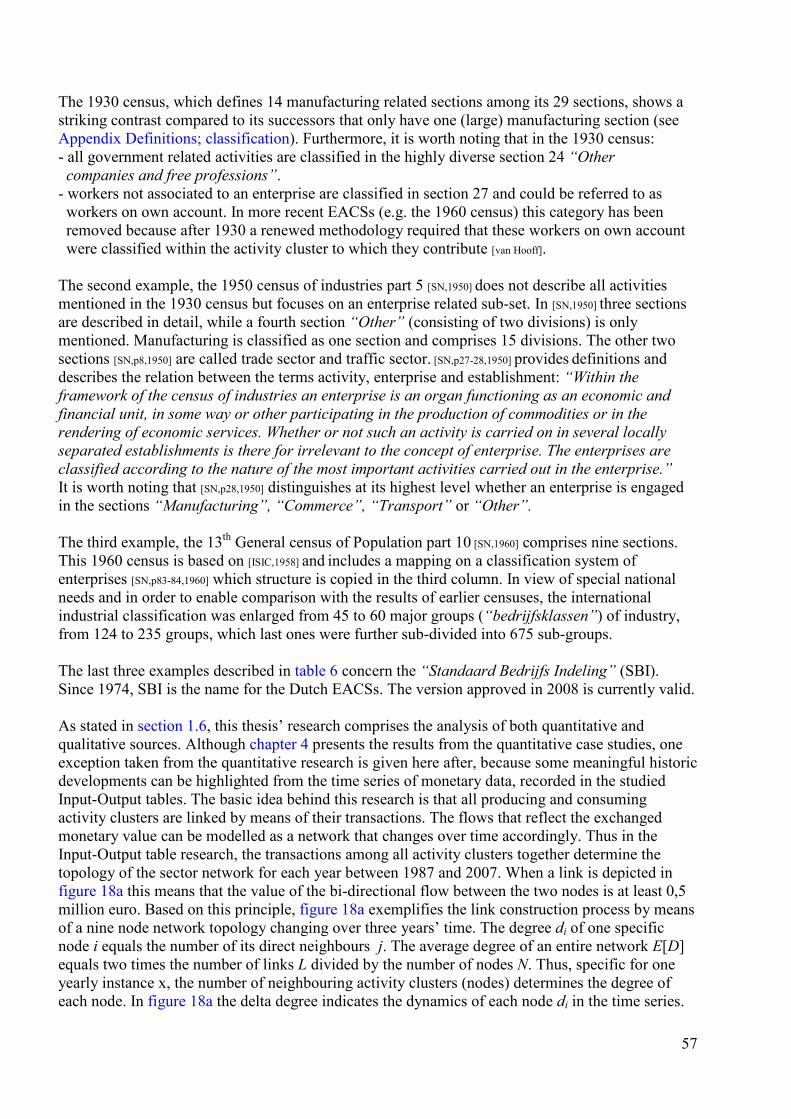
The 1930 census, which defines 14 manufacturing related sections among its 29 sections, shows a striking contrast compared to its successors that only have one (large) manufacturing section (see Appendix Definitions; classification). Furthermore, it is worth noting that in the 1930 census: - all government related activities are classified in the highly diverse section 24 “Other companies and free professions”. - workers not associated to an enterprise are classified in section 27 and could be referred to as workers on own account. In more recent EACSs (e.g. the 1960 census) this category has been removed because after 1930 a renewed methodology required that these workers on own account were classified within the activity cluster to which they contribute [van Hooff]. The second example, the 1950 census of industries part 5 [SN,1950] does not describe all activities mentioned in the 1930 census but focuses on an enterprise related sub-set. In [SN,1950] three sections are described in detail, while a fourth section “Other” (consisting of two divisions) is only mentioned. Manufacturing is classified as one section and comprises 15 divisions. The other two sections [SN,p8,1950] are called trade sector and traffic sector. [SN,p27-28,1950] provides definitions and describes the relation between the terms activity, enterprise and establishment: “Within the framework of the census of industries an enterprise is an organ functioning as an economic and financial unit, in some way or other participating in the production of commodities or in the rendering of economic services. Whether or not such an activity is carried on in several locally separated establishments is there for irrelevant to the concept of enterprise. The enterprises are classified according to the nature of the most important activities carried out in the enterprise.” It is worth noting that [SN,p28,1950] distinguishes at its highest level whether an enterprise is engaged in the sections “Manufacturing”, “Commerce”, “Transport” or “Other”. The third example, the 13th General census of Population part 10 [SN,1960] comprises nine sections. This 1960 census is based on [ISIC,1958] and includes a mapping on a classification system of enterprises [SN,p83-84,1960] which structure is copied in the third column. In view of special national needs and in order to enable comparison with the results of earlier censuses, the international industrial classification was enlarged from 45 to 60 major groups (“bedrijfsklassen”) of industry, from 124 to 235 groups, which last ones were further sub-divided into 675 sub-groups. The last three examples described in table 6 concern the “Standaard Bedrijfs Indeling” (SBI). Since 1974, SBI is the name for the Dutch EACSs. The version approved in 2008 is currently valid. As stated in section 1.6, this thesis’ research comprises the analysis of both quantitative and qualitative sources. Although chapter 4 presents the results from the quantitative case studies, one exception taken from the quantitative research is given here after, because some meaningful historic developments can be highlighted from the time series of monetary data, recorded in the studied Input-Output tables. The basic idea behind this research is that all producing and consuming activity clusters are linked by means of their transactions. The flows that reflect the exchanged monetary value can be modelled as a network that changes over time accordingly. Thus in the Input-Output table research, the transactions among all activity clusters together determine the topology of the sector network for each year between 1987 and 2007. When a link is depicted in figure 18a this means that the value of the bi-directional flow between the two nodes is at least 0,5 million euro. Based on this principle, figure 18a exemplifies the link construction process by means of a nine node network topology changing over three years’ time. The degree di of one specific node i equals the number of its direct neighbours j. The average degree of an entire network E[D] equals two times the number of links L divided by the number of nodes N. Thus, specific for one yearly instance x, the number of neighbouring activity clusters (nodes) determines the degree of each node. In figure 18a the delta degree indicates the dynamics of each node di in the time series.
57
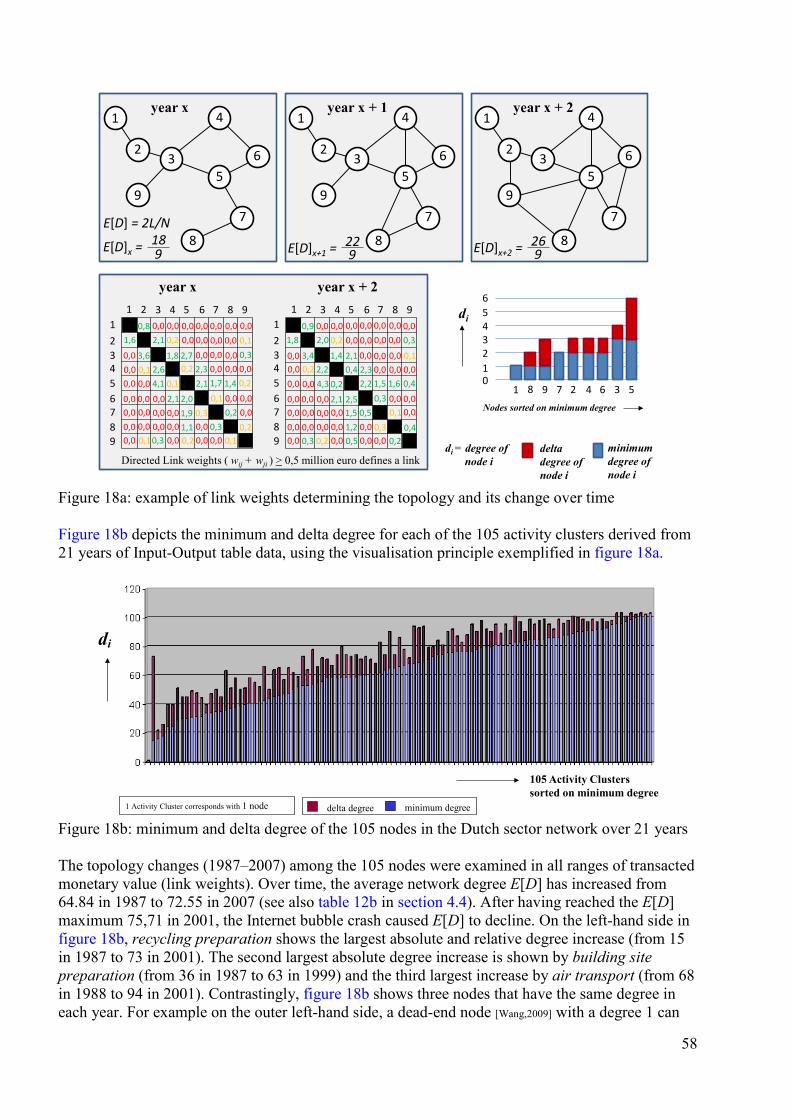
Figure 18a: example of link weights determining the topology and its change over time Figure 18b depicts the minimum and delta degree for each of the 105 activity clusters derived from 21 years of Input-Output table data, using the visualisation principle exemplified in figure 18a.
Figure 18b: minimum and delta degree of the 105 nodes in the Dutch sector network over 21 years The topology changes (1987–2007) among the 105 nodes were examined in all ranges of transacted monetary value (link weights). Over time, the average network degree E[D] has increased from 64.84 in 1987 to 72.55 in 2007 (see also table 12b in section 4.4). After having reached the E[D] maximum 75,71 in 2001, the Internet bubble crash caused E[D] to decline. On the left-hand side in figure 18b, recycling preparation shows the largest absolute and relative degree increase (from 15 in 1987 to 73 in 2001). The second largest absolute degree increase is shown by building site preparation (from 36 in 1987 to 63 in 1999) and the third largest increase by air transport (from 68 in 1988 to 94 in 2001). Contrastingly, figure 18b shows three nodes that have the same degree in each year. For example on the outer left-hand side, a dead-end node [Wang,2009] with a degree 1 can
year x1
23
9
4
56
7
8
year x + 11
23
9
4
56
7
8
year x + 21
23
9
4
56
7
8
1
di
7 4 528 9 36Nodes sorted on minimum degree
minimumdegree ofnode i
deltadegree ofnode i
123456
0
year x
876543
9
21
876543
9
21
1 4 6 952 3 87
Directed Link weights ( wij + wji ) > 0,5 million euro defines a link
0,0
0,0 0,1
0,2
0,0
0,00,0
0,0
0,0
0,0
0,0
0,0
0,0
0,0
0,0
0,0
0,0
0,0
0,0
0,0
0,0
0,0
0,0
0,0
0,0
0,0 0,0
0,0
1 4 6 952 3 87
0,0 0,0 0,00,00,0
0,0
0,0
0,0
0,0
0,0
0,0
0,0
0,0 0,2
0,2
0,00,00,0
0,0
0,0
0,0
0,0
0,0
0,0
0,0
0,0
0,0
0,0
0,0
0,0
0,0
0,0
0,0 0,0
0,0
0,0 0,0 0,00,00,0
0,0
0,0
0,0
0,0
0,0
0,0
1,6
year x + 2
0,81,8
0,9 0,0
0,10,2
0,20,4
0,3
0,3 0,2
0,1
0,1
0,1
0,10,30,3
0,2
0,2
0,2
0,5
0,4
2,7
4,1
2,1
4,32,0 2,5
0,3
0,3
3,6
2,1
3,4
2,0
2,61,8
2,21,4
0,10,2
0,20,40,0
0,0
0,0
0,0
2,3
2,1
2,3
2,10,0 0,0
0,0
0,00,0
2,1 2,21,7 1,5
1,9 1,50,1
0,3 0,50,3
1,1 1,2
1,4 1,6
E[D] = 2L/N
E[D]x+1 = 2218E[D]x = 9 9 E[D]x+2 = 269
di = degree ofnode i
105 Activity Clusters sorted on minimum degree
D
1 Activity Cluster corresponds with 1 node delta degree minimum degree
di
58
be observed. This household services node is exclusively connected to its employer being the node with degree 103 on the outer right-hand side (household salaries and spending). Conclusions from this section This section provides a historical perspective on economic systems, its sectors and their gradual change over time which is reflected in the composition of EACSs and the names given to their activity clusters. Statistics Netherlands archive material allowed for constructing an overview of Dutch EACS (table 6) from 1930 towards the currently valid EACS SBI 2008, published in 2009. The main conclusions from recent history are: - the number of sections has varied strongly between 29 (in 1930) and nine (in 1960). - the 1950 census describes an enterprise related sub-set and describes three sections defined as the manufacture, traffic and trade sector, - during the 1960s,1970s and 1980s EACS consisted of approximately 10 sections only, because one decimal digit was used to identify the section level, - since 1993 until present, one alphabetic character identifies the section level theoretically allowing for 26 sections. In 1993, A-Q implied 17 sections while in 2008 A-U implied 21 sections. From this EACS historical point of view can be concluded that there are at least more than 10 sectors and currently less than 21 due to the consistent presence of a residual section. The change in connectedness (degree) of an activity cluster over time is a measure that indicates whether it is emergent, stable or declining. Observed from the Dutch EACSs (1930-2008), e.g. environmental care and recycling are clearly emergent compared to other activity clusters. A substantial degree increase derived from Dutch Input-Output table data, supports this inference. However, remediation [ISIC,p171-172,2008] is not (yet) visible at section level in the current Australian, Japanese, Chinese and Russian EACS (see table 5 which shows that only NAICS 2012 copies remediation from ISIC and the Chinese ICNEA 2011 section N mentions environmental facilities). Environmental care emerges within SBI 1993 section O “Other Services”. In SBI 2008, all environmental care related activities were merged into section E including water treatment and distribution. Intuitively, the environmental care related activity cluster seems a likely candidate for upgrading to section level in a future EACS. A clear example of decline can be observed regarding religious services and organisations. This activity cluster disappeared from section level (1930) via division level (1960, 1974) and finally classified at sub-class level S94911in SBI’08 section S “Other services activities”. Additionally, from the 80 years of Dutch EACS can be observed that: - apparently, agriculture and fishing pose a classification difficulty because over time these have been joined and separated several times (see table 6), - construction and mining retain a stable position at section level over 80 years except in 1950, - the name “construction” appears unchanged in the current SBI 2008 and all previous versions and it is worth noting that this is the case too in all contemporary national EACSs, - the activity cluster involved in hotels, restaurants and cafés has been classified in three different sections before becoming a section in itself in 1993. The main conclusions from ancient history relate to human colonisation that initiated the division of labour. From this perspective, ancient households can be envisaged as the cradle of sectors. Due to the emergence of sectors, the household became a sector in itself. As a consequence, the (remaining) activities categorised in the ISIC household related section T are more heterogeneous in nature compared to all other sections activities.
59
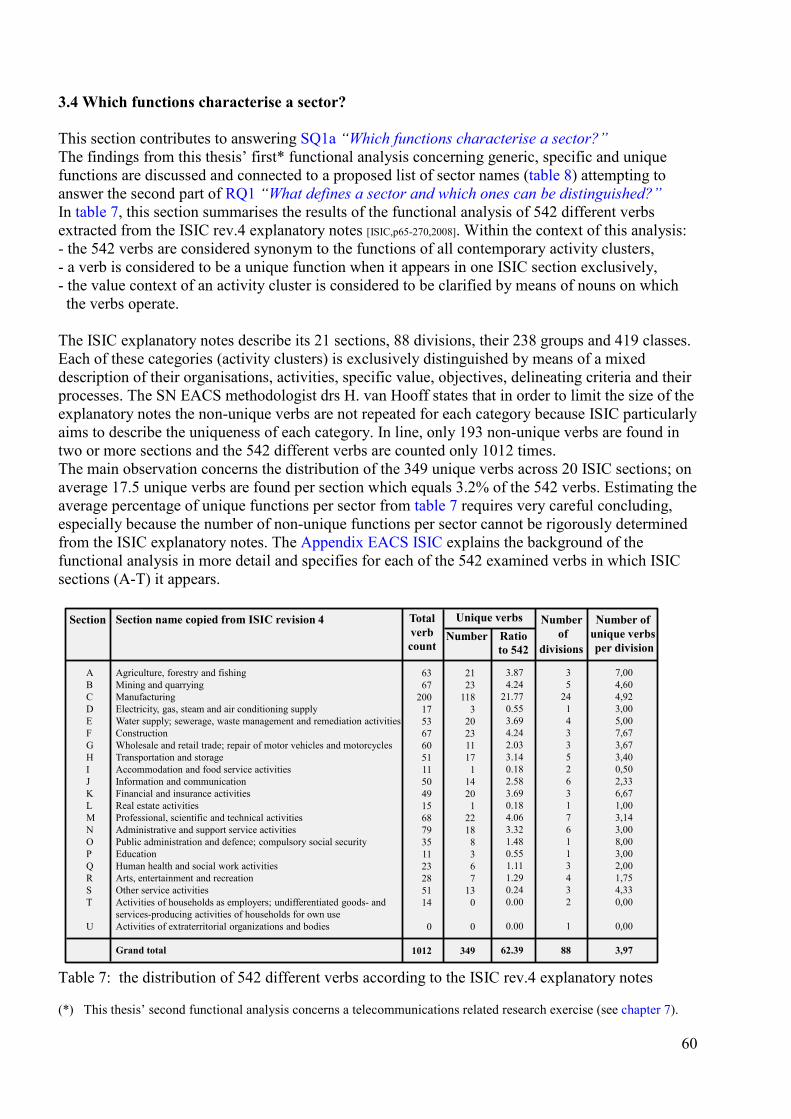
3.4 Which functions characterise a sector? This section contributes to answering SQ1a “Which functions characterise a sector?” The findings from this thesis’ first* functional analysis concerning generic, specific and unique functions are discussed and connected to a proposed list of sector names (table 8) attempting to answer the second part of RQ1 “What defines a sector and which ones can be distinguished?” In table 7, this section summarises the results of the functional analysis of 542 different verbs extracted from the ISIC rev.4 explanatory notes [ISIC,p65-270,2008]. Within the context of this analysis: - the 542 verbs are considered synonym to the functions of all contemporary activity clusters, - a verb is considered to be a unique function when it appears in one ISIC section exclusively, - the value context of an activity cluster is considered to be clarified by means of nouns on which the verbs operate. The ISIC explanatory notes describe its 21 sections, 88 divisions, their 238 groups and 419 classes. Each of these categories (activity clusters) is exclusively distinguished by means of a mixed description of their organisations, activities, specific value, objectives, delineating criteria and their processes. The SN EACS methodologist drs H. van Hooff states that in order to limit the size of the explanatory notes the non-unique verbs are not repeated for each category because ISIC particularly aims to describe the uniqueness of each category. In line, only 193 non-unique verbs are found in two or more sections and the 542 different verbs are counted only 1012 times. The main observation concerns the distribution of the 349 unique verbs across 20 ISIC sections; on average 17.5 unique verbs are found per section which equals 3.2% of the 542 verbs. Estimating the average percentage of unique functions per sector from table 7 requires very careful concluding, especially because the number of non-unique functions per sector cannot be rigorously determined from the ISIC explanatory notes. The Appendix EACS ISIC explains the background of the functional analysis in more detail and specifies for each of the 542 examined verbs in which ISIC sections (A-T) it appears.
Table 7: the distribution of 542 different verbs according to the ISIC rev.4 explanatory notes (*) This thesis’ second functional analysis concerns a telecommunications related research exercise (see chapter 7).
Section Section name copied from ISIC revision 4
ABCDEFGHIJKLMNOPQRST
U
Agriculture, forestry and fishingMining and quarryingManufacturingElectricity, gas, steam and air conditioning supplyWater supply; sewerage, waste management and remediation activitiesConstructionWholesale and retail trade; repair of motor vehicles and motorcyclesTransportation and storageAccommodation and food service activitiesInformation and communicationFinancial and insurance activitiesReal estate activitiesProfessional, scientific and technical activitiesAdministrative and support service activitiesPublic administration and defence; compulsory social securityEducationHuman health and social work activitiesArts, entertainment and recreationOther service activitiesActivities of households as employers; undifferentiated goods- and services-producing activities of households for own useActivities of extraterritorial organizations and bodies
Grand total
2123
1183
202311171
14201
22188367
130
0
349
35
2414335263176113432
1
88
6367
2001753676051115049156879351123285114
0
1012
divisionsNumber
Number of
Number of unique verbs per division
7,004,604,923,005,007,673,673,400,502,336,671,003,143,008,003,002,001,754,330,00
0,00
3,97
Unique verbsRatio to 542
3.874.24
21.770.553.694.242.033.140.182.583.690.184.063.321.480.551.111.290.240.00
0.00
62.39
Totalverbcount
60
Table 7 shows that manufacturing* comprises the largest number of unique functions compared to all other sections (118 of all identified 349 unique verbs). When taking into account that 24 out of ISICs’ 88 divisions are manufacturing related (see right-hand column table 7), at division level the number of unique manufacturing related verbs is still above the average of four unique verbs per division**. Apparently, the vast array of crafts and professions seems to account for the relatively high number of different manufacturing related verbs. Except for household related activities (section T) and the activities of extraterritorial organisations and bodies (section U), unique verbs/functions have been found in the ISIC explanatory notes of all other 19 sections. This thesis proposes a set of 20 sectors taking into account that: - the residual section S named ”Other services activities”, cannot be translated into a sector name, - results from section 4.1, 4.2, 4.5 and 4.6 indicate that the household can be considered a sector, - section 3.3 indicates the emergence of environmental care observed from IO table data. As a consequence, table 8 presents the mapping of functions on this set of 20 sectors. It connects the proposed sector names to examples of the corresponding sectors’ functions by means of unique and specific verbs selected form the ISIC explanatory notes. In some cases the functions require a typical composite; a value context that distinguishes the uniqueness of a sector’s composite (e.g. the verb to care appears in 6 sections and thus requires a value context). Furthermore it is worth noting that in ISIC section Q “Human health and social work activities” the term “care” is often mentioned in the explanatory notes as a noun but not as a verb. In case no typical value context example is given in table 8, the verbs uniquely distinguish the corresponding sector. This is in line with the two definitional criteria mentioned by Potter; when a unique and exclusive description of a category is required and the name of a specific function does not uniquely distinguish this category from all others, a composite is required that combines specific functions with the related specific type of value/objects that sector produces or deals with. In table 8, the 11 verbs printed in blue italic characters were found in the explanatory notes and these exactly match with the sector names. In addition to the 349 verbs identified as unique, the Appendix EACS ISIC*** accounts for the identification of 193 non-unique verbs, either generic or specific. Here after examples of generic verbs are given and each number represents how often these verbs appear in different ISIC sections: to clean (8x), to collect (11x), to contract (7x), to deliver (7x), to distribute (9x), to install (6x), to maintain (11x), to operate (16x), to produce (9x), to provide (17x), to repair (7x), to rent (7x), to sell (12x), to service (13x), to support (9x), to transport (9x). Although not concisely mentioned in each section, obviously all sectors contract, deliver, produce, provide and sell. This makes clear that all sectors perform a substantial part of the 193 non-unique functions. Furthermore the ISIC explanatory notes clearly aim to exclusively describe activities and do not collect and repeat all non-unique functions for each category. Likely, a uniqueness percentage lower than 3% can be found when setting up an additional inventory of non-unique functions per EACS category. (*) About manufacturing the explanatory notes [ISIC,p86,2008] mention: “the section manufacturing includes the physical or chemical transformation of materials, substances, or components into new products, although this cannot be used as the single universal criterion for defining manufacturing”. (**) Only the governmental section O, the construction section F, the agriculture and fishing related section A, the financial section K and the water and environmental care related section E show higher numbers of unique verbs per division compared to manufacturing. (***) In daily practice (e.g. at the chamber of commerce) the alphabetical list of functions in Appendix EACS ISIC could be a helpful tool to classify enterprises by asking an enterprise representative to mention particular activities in terms of verbs that this organisation performs or says it is going to perform after its start-up. Especially in doubtful cases the verbs mentioned can point to sections.
61
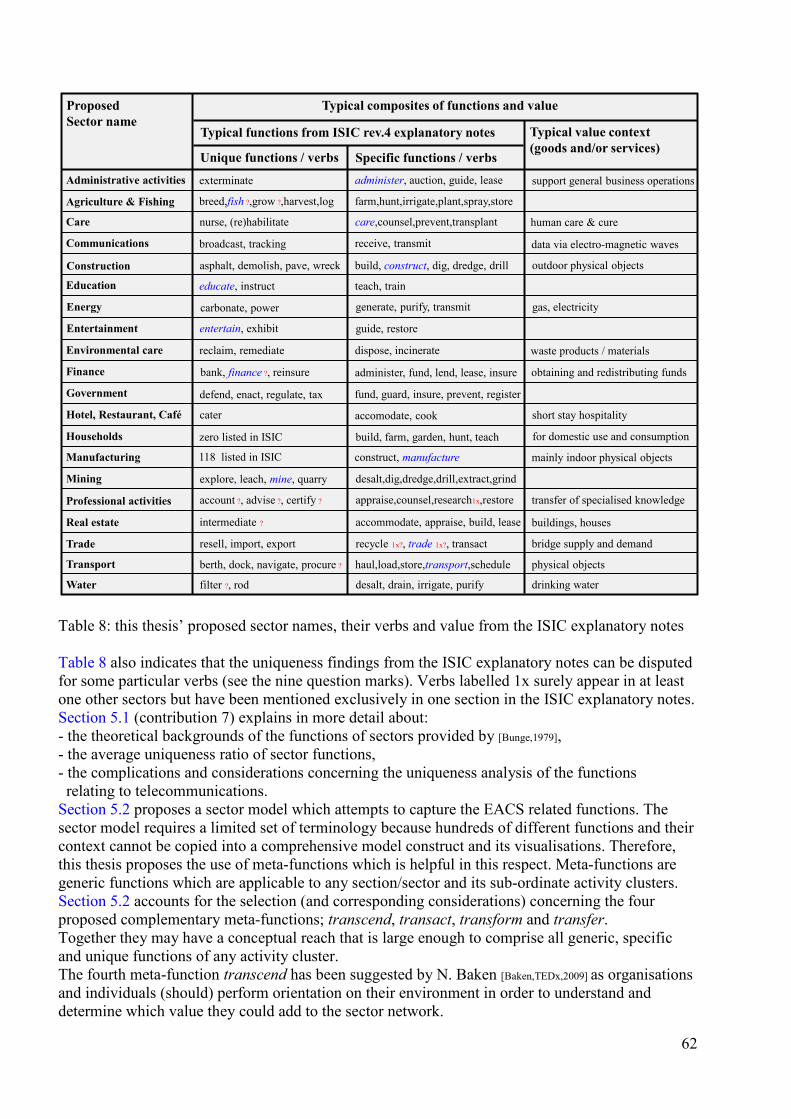
Table 8: this thesis’ proposed sector names, their verbs and value from the ISIC explanatory notes Table 8 also indicates that the uniqueness findings from the ISIC explanatory notes can be disputed for some particular verbs (see the nine question marks). Verbs labelled 1x surely appear in at least one other sectors but have been mentioned exclusively in one section in the ISIC explanatory notes. Section 5.1 (contribution 7) explains in more detail about: - the theoretical backgrounds of the functions of sectors provided by [Bunge,1979], - the average uniqueness ratio of sector functions, - the complications and considerations concerning the uniqueness analysis of the functions relating to telecommunications. Section 5.2 proposes a sector model which attempts to capture the EACS related functions. The sector model requires a limited set of terminology because hundreds of different functions and their context cannot be copied into a comprehensive model construct and its visualisations. Therefore, this thesis proposes the use of meta-functions which is helpful in this respect. Meta-functions are generic functions which are applicable to any section/sector and its sub-ordinate activity clusters. Section 5.2 accounts for the selection (and corresponding considerations) concerning the four proposed complementary meta-functions; transcend, transact, transform and transfer. Together they may have a conceptual reach that is large enough to comprise all generic, specific and unique functions of any activity cluster. The fourth meta-function transcend has been suggested by N. Baken [Baken,TEDx,2009] as organisations and individuals (should) perform orientation on their environment in order to understand and determine which value they could add to the sector network.
Unique functions / verbs
Typical functions from ISIC rev.4 explanatory notes
Typical composites of functions and value
Typical value context(goods and/or services)
educate, instruct
breed,fish ?,grow ?,harvest,log
asphalt, demolish, pave, wreck
ProposedSector name
reclaim, remediate
Care
Environmental care
support general business operations
Specific functions / verbs
receive, transmit
fund, guard, insure, prevent, register
Finance administer, fund, lend, lease, insure
Hotel, Restaurant, Café
Education
Agriculture & Fishing
teach, train
Communications
Construction
Government
Households
administer, auction, guide, lease
build, construct, dig, dredge, drill
nurse, (re)habilitate
cater
build, farm, garden, hunt, teach
broadcast, tracking
bank, finance ?, reinsure
defend, enact, regulate, tax
guide, restoreEntertainment entertain, exhibit
gas, electricityEnergy generate, purify, transmit
Administrative activities
Manufacturing
Mining
Professional activities
Real estate
Trade
Transport
Water
berth, dock, navigate, procure ?
filter ?, rod
resell, import, export
drinking water
physical objects
bridge supply and demand
buildings, houses
mainly indoor physical objects
accommodate, appraise, build, lease
account ?, advise ?, certify ?
explore, leach, mine, quarry
for domestic use and consumption
transfer of specialised knowledge
short stay hospitality
data via electro-magnetic waves
outdoor physical objects
construct, manufacture
farm,hunt,irrigate,plant,spray,store
exterminate
appraise,counsel,research1x,restore
obtaining and redistributing funds
waste products / materials
accomodate, cook
desalt,dig,dredge,drill,extract,grind
recycle 1x?, trade 1x?, transact
haul,load,store,transport,schedule
desalt, drain, irrigate, purify
carbonate, power
118 listed in ISIC
intermediate ?
care,counsel,prevent,transplant human care & cure
zero listed in ISIC
dispose, incinerate
62
3.5 Conclusions From this chapter’s research is estimated that our current sector network consists of 20 sectors. ISIC rev.4 (containing 21 sections) is the prevalent EACS to which many national EACSs comply. Section names in an EACS (table 7) tend to differ from sector names (table 8). Sector names tend to be shorter than section names which reflect all their prime items while sector names aim to capture the heart of the matter. Any individual is free to define a list of sectors and sector names. Everyone can aggregate activities for any purpose and label this cluster as a sector from any perspective (e.g. EACS activity, product, occupation, organisation or even a mix of these perspectives). In contrast, government related organisations that issue licenses, classify organisations and publish statistics are bound to constraints. From the practice of classifying economic activities the answer to the first part of RQ1 “What defines a sector and which ones can be distinguished?” narrows down to EACSs and the experts that maintain and adapt them. EACSs change over time. In 20th century Dutch EACSs the number of sections has varied between 29 and 9. Furthermore, contemporary national EACSs differ from each other. The EACSs of the G8 member states show a range between 17 and 20 sections that correspond to sectors. Most contemporary EACSs contain a residual section such as ISIC section S “Other services activities”. Clearly, both its name and its residual composition do not correspond to any sector. A connectivity development analysis of Input-Output table data revealed that the activity cluster Environmental care is clearly emergent and seems to be a candidate for upgrading from division to section level in future EACSs and can be added to sector lists. Table 8 lists the sector names proposed in this thesis. Observed from theory [Potter,1988], homogeneity is an important and generic aspect of classification system development and methodology. The two most significant criteria for defining homogeneity of groupings of statistical units are: 1) the type of activity (its directly related functions), 2) the type of goods or services produced or dealt with (its directly transacted value). When considering verbs to represent functions, from the ISIC explanatory notes can be observed that 19 out of 21 sections contain unique functions. Likely, the uniqueness of functions is also applicable to sectors, because EACSs categorise sectors’ economic activities (and not the other way around). From theory [Bunge,1979] is concluded that a sector performs at least one unique function that contributes to producing value offered to all sectors. From the functional analysis of the ISIC explanatory notes 542 different functions were identified of which 349 functions uniquely appear in one of 20 ISIC sections. On average 17.5 unique functions are found per section (349/20) but rigorous concluding about the functions’ uniqueness ratio per sector is not possible because the observed appearance and number of non-unique functions in all sections can be disputed. Thus, based on the findings from ISIC, it is only a rough estimate that ~3% of the functions of a sector is unique on average. Likely, a lower percentage can be found when setting up an inventory of non-unique /generic functions per EACS category. However, the finding (~3%) is in line with the theoretical principles of [Bunge,1979] and supports this thesis’ second hypothesis that in each sector only a fraction of its functions is unique. Furthermore, four meta-functions (transact, transfer, transform and transcend) were found which could have a conceptual reach large enough to represent all functions of any activity cluster. From an economic activity classification perspective, this chapter proposes an essential part of this thesis’ definition of an economic sector: A sector is a more or less homogeneous economic activity cluster that has at least one unique function and produces a similar type of goods and/or services or uses similar processes. Section 8.1 proposes the complete definition including the sector network related findings.
63
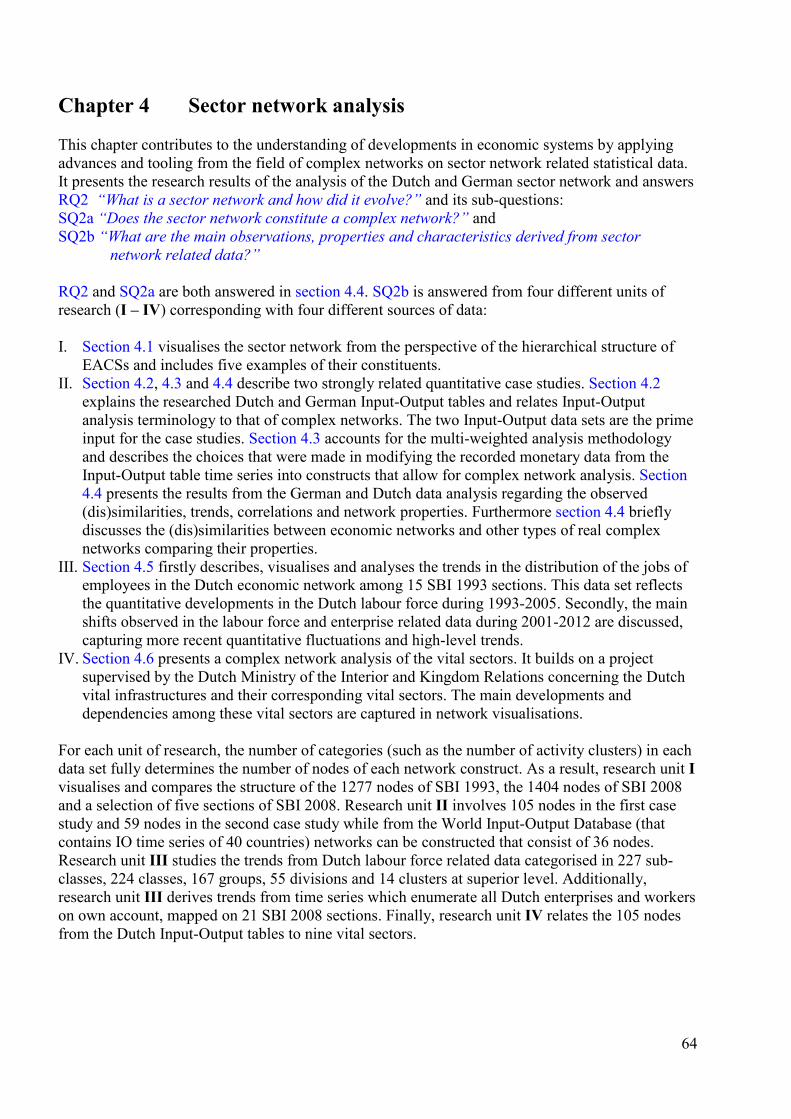
Chapter 4 Sector network analysis This chapter contributes to the understanding of developments in economic systems by applying advances and tooling from the field of complex networks on sector network related statistical data. It presents the research results of the analysis of the Dutch and German sector network and answers RQ2 “What is a sector network and how did it evolve?” and its sub-questions: SQ2a “Does the sector network constitute a complex network?” and SQ2b “What are the main observations, properties and characteristics derived from sector network related data?” RQ2 and SQ2a are both answered in section 4.4. SQ2b is answered from four different units of research (I – IV) corresponding with four different sources of data: I. Section 4.1 visualises the sector network from the perspective of the hierarchical structure of
EACSs and includes five examples of their constituents. II. Section 4.2, 4.3 and 4.4 describe two strongly related quantitative case studies. Section 4.2
explains the researched Dutch and German Input-Output tables and relates Input-Output analysis terminology to that of complex networks. The two Input-Output data sets are the prime input for the case studies. Section 4.3 accounts for the multi-weighted analysis methodology and describes the choices that were made in modifying the recorded monetary data from the Input-Output table time series into constructs that allow for complex network analysis. Section 4.4 presents the results from the German and Dutch data analysis regarding the observed (dis)similarities, trends, correlations and network properties. Furthermore section 4.4 briefly discusses the (dis)similarities between economic networks and other types of real complex networks comparing their properties.
III. Section 4.5 firstly describes, visualises and analyses the trends in the distribution of the jobs of employees in the Dutch economic network among 15 SBI 1993 sections. This data set reflects the quantitative developments in the Dutch labour force during 1993-2005. Secondly, the main shifts observed in the labour force and enterprise related data during 2001-2012 are discussed, capturing more recent quantitative fluctuations and high-level trends.
IV. Section 4.6 presents a complex network analysis of the vital sectors. It builds on a project supervised by the Dutch Ministry of the Interior and Kingdom Relations concerning the Dutch vital infrastructures and their corresponding vital sectors. The main developments and dependencies among these vital sectors are captured in network visualisations.
For each unit of research, the number of categories (such as the number of activity clusters) in each data set fully determines the number of nodes of each network construct. As a result, research unit I visualises and compares the structure of the 1277 nodes of SBI 1993, the 1404 nodes of SBI 2008 and a selection of five sections of SBI 2008. Research unit II involves 105 nodes in the first case study and 59 nodes in the second case study while from the World Input-Output Database (that contains IO time series of 40 countries) networks can be constructed that consist of 36 nodes. Research unit III studies the trends from Dutch labour force related data categorised in 227 sub-classes, 224 classes, 167 groups, 55 divisions and 14 clusters at superior level. Additionally, research unit III derives trends from time series which enumerate all Dutch enterprises and workers on own account, mapped on 21 SBI 2008 sections. Finally, research unit IV relates the 105 nodes from the Dutch Input-Output tables to nine vital sectors.
64
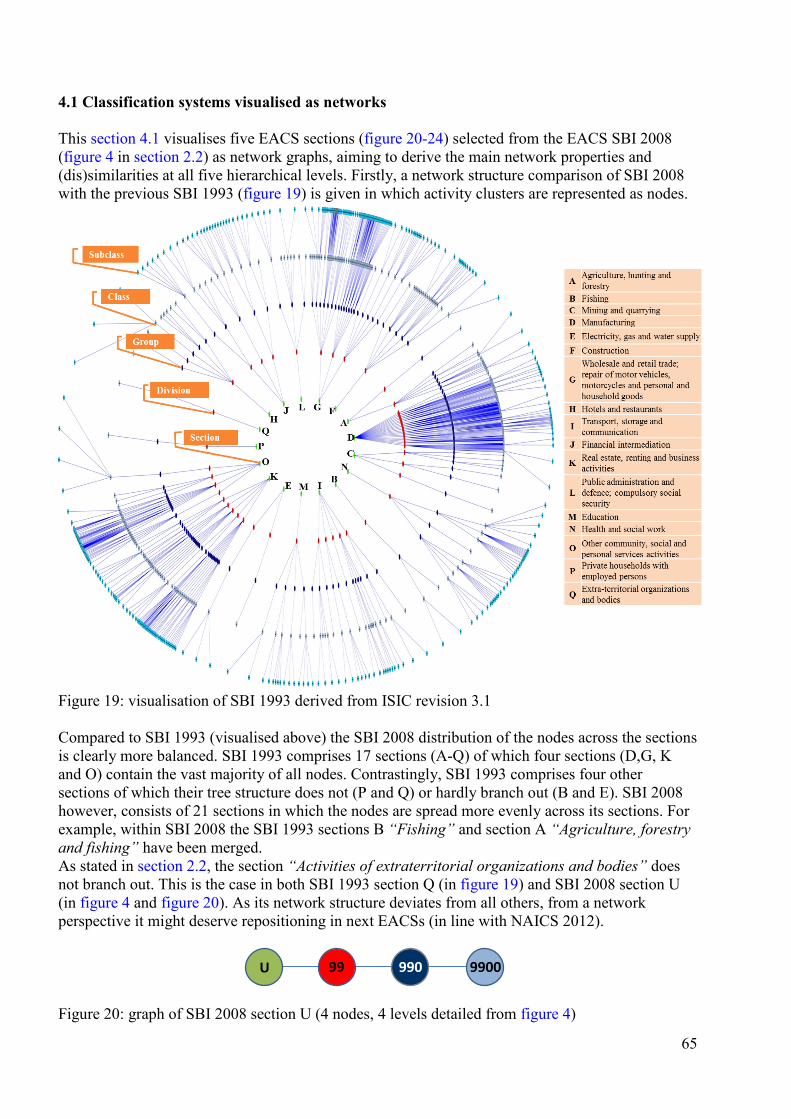
4.1 Classification systems visualised as networks This section 4.1 visualises five EACS sections (figure 20-24) selected from the EACS SBI 2008 (figure 4 in section 2.2) as network graphs, aiming to derive the main network properties and (dis)similarities at all five hierarchical levels. Firstly, a network structure comparison of SBI 2008 with the previous SBI 1993 (figure 19) is given in which activity clusters are represented as nodes.
Figure 19: visualisation of SBI 1993 derived from ISIC revision 3.1 Compared to SBI 1993 (visualised above) the SBI 2008 distribution of the nodes across the sections is clearly more balanced. SBI 1993 comprises 17 sections (A-Q) of which four sections (D,G, K and O) contain the vast majority of all nodes. Contrastingly, SBI 1993 comprises four other sections of which their tree structure does not (P and Q) or hardly branch out (B and E). SBI 2008 however, consists of 21 sections in which the nodes are spread more evenly across its sections. For example, within SBI 2008 the SBI 1993 sections B “Fishing” and section A “Agriculture, forestry and fishing” have been merged. As stated in section 2.2, the section “Activities of extraterritorial organizations and bodies” does not branch out. This is the case in both SBI 1993 section Q (in figure 19) and SBI 2008 section U (in figure 4 and figure 20). As its network structure deviates from all others, from a network perspective it might deserve repositioning in next EACSs (in line with NAICS 2012).
Figure 20: graph of SBI 2008 section U (4 nodes, 4 levels detailed from figure 4)
U 99 990 9900
65
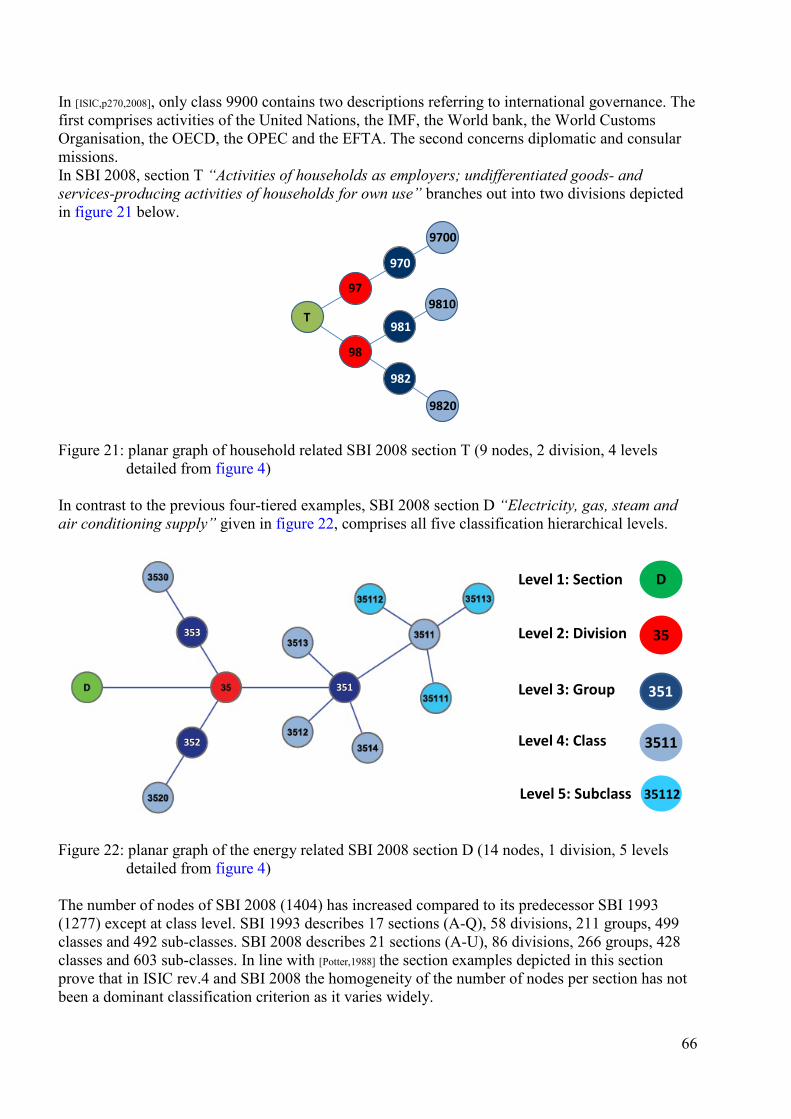
In [ISIC,p270,2008], only class 9900 contains two descriptions referring to international governance. The first comprises activities of the United Nations, the IMF, the World bank, the World Customs Organisation, the OECD, the OPEC and the EFTA. The second concerns diplomatic and consular missions. In SBI 2008, section T “Activities of households as employers; undifferentiated goods- and services-producing activities of households for own use” branches out into two divisions depicted in figure 21 below.
Figure 21: planar graph of household related SBI 2008 section T (9 nodes, 2 division, 4 levels detailed from figure 4) In contrast to the previous four-tiered examples, SBI 2008 section D “Electricity, gas, steam and air conditioning supply” given in figure 22, comprises all five classification hierarchical levels.
Figure 22: planar graph of the energy related SBI 2008 section D (14 nodes, 1 division, 5 levels detailed from figure 4) The number of nodes of SBI 2008 (1404) has increased compared to its predecessor SBI 1993 (1277) except at class level. SBI 1993 describes 17 sections (A-Q), 58 divisions, 211 groups, 499 classes and 492 sub-classes. SBI 2008 describes 21 sections (A-U), 86 divisions, 266 groups, 428 classes and 603 sub-classes. In line with [Potter,1988] the section examples depicted in this section prove that in ISIC rev.4 and SBI 2008 the homogeneity of the number of nodes per section has not been a dominant classification criterion as it varies widely.
T
97
98
970
981
982
9700
9810
9820
Level 1: Section
Level 2: Division
Level 3: Group
Level 4: Class
Level 5: Subclass
D
35
351
3511
35112
351
352
353
66
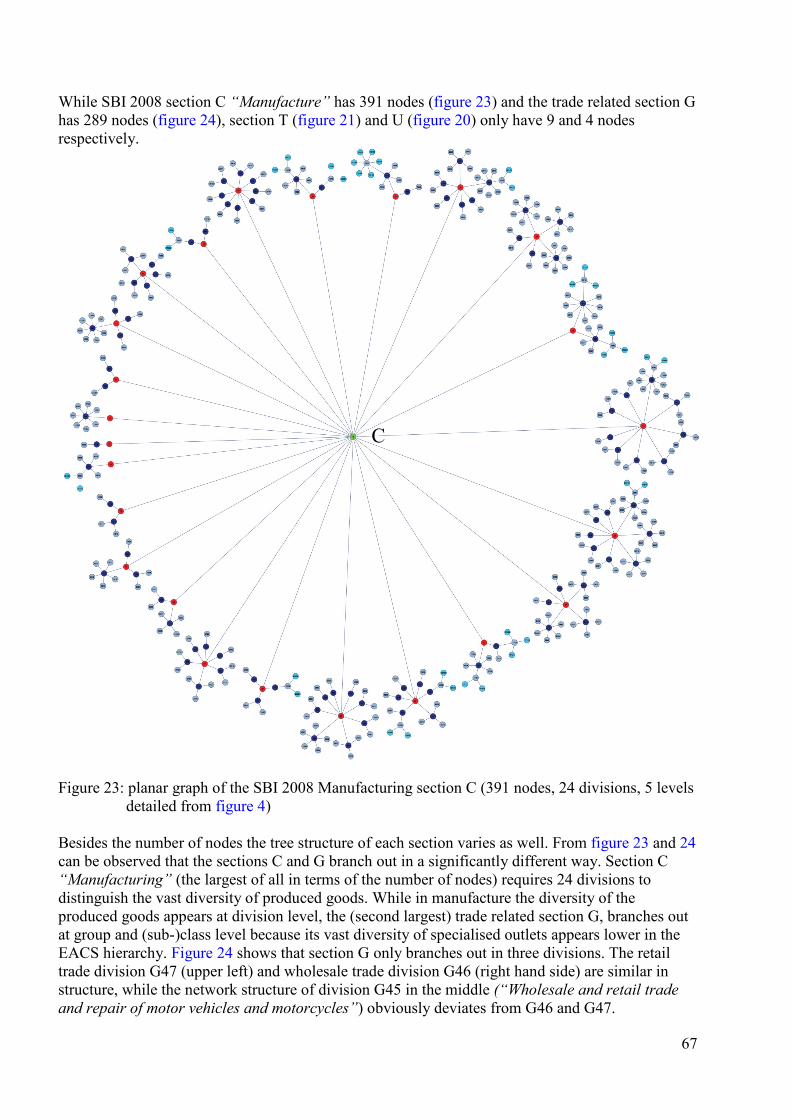
While SBI 2008 section C “Manufacture” has 391 nodes (figure 23) and the trade related section G has 289 nodes (figure 24), section T (figure 21) and U (figure 20) only have 9 and 4 nodes respectively.
Figure 23: planar graph of the SBI 2008 Manufacturing section C (391 nodes, 24 divisions, 5 levels detailed from figure 4) Besides the number of nodes the tree structure of each section varies as well. From figure 23 and 24 can be observed that the sections C and G branch out in a significantly different way. Section C “Manufacturing” (the largest of all in terms of the number of nodes) requires 24 divisions to distinguish the vast diversity of produced goods. While in manufacture the diversity of the produced goods appears at division level, the (second largest) trade related section G, branches out at group and (sub-)class level because its vast diversity of specialised outlets appears lower in the EACS hierarchy. Figure 24 shows that section G only branches out in three divisions. The retail trade division G47 (upper left) and wholesale trade division G46 (right hand side) are similar in structure, while the network structure of division G45 in the middle (“Wholesale and retail trade and repair of motor vehicles and motorcycles”) obviously deviates from G46 and G47.
2573
C
67
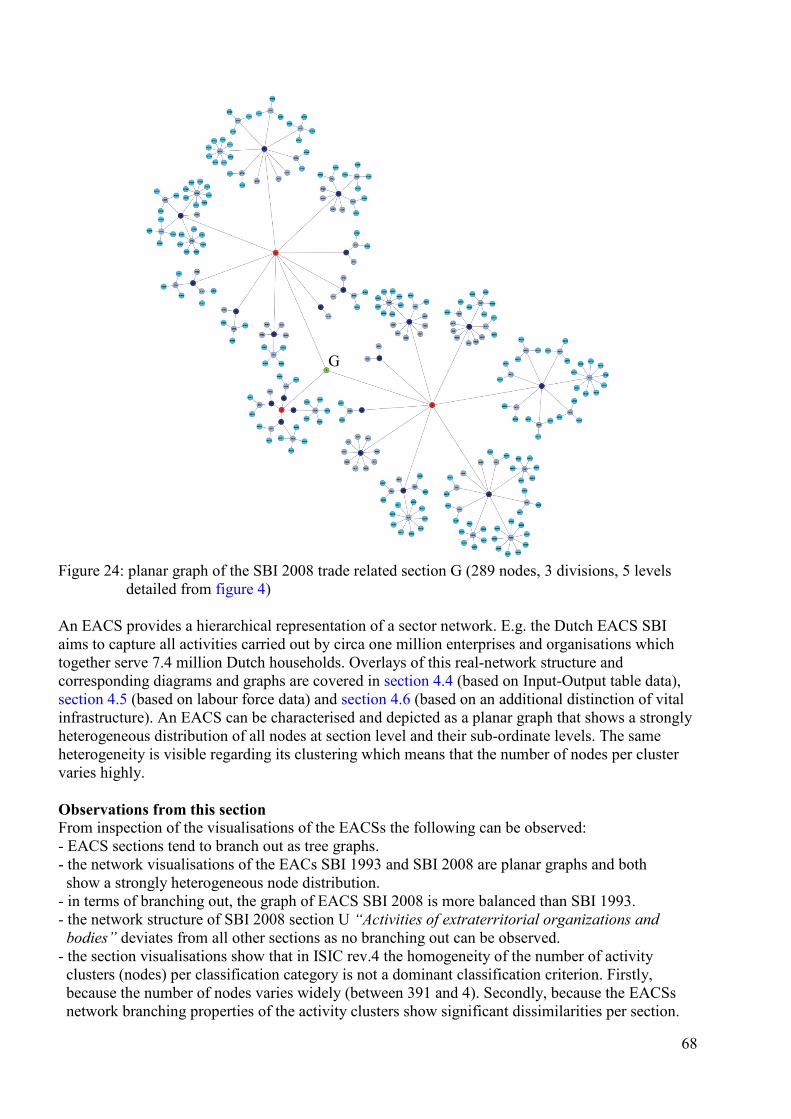
Figure 24: planar graph of the SBI 2008 trade related section G (289 nodes, 3 divisions, 5 levels detailed from figure 4) An EACS provides a hierarchical representation of a sector network. E.g. the Dutch EACS SBI aims to capture all activities carried out by circa one million enterprises and organisations which together serve 7.4 million Dutch households. Overlays of this real-network structure and corresponding diagrams and graphs are covered in section 4.4 (based on Input-Output table data), section 4.5 (based on labour force data) and section 4.6 (based on an additional distinction of vital infrastructure). An EACS can be characterised and depicted as a planar graph that shows a strongly heterogeneous distribution of all nodes at section level and their sub-ordinate levels. The same heterogeneity is visible regarding its clustering which means that the number of nodes per cluster varies highly. Observations from this section From inspection of the visualisations of the EACSs the following can be observed: - EACS sections tend to branch out as tree graphs. - the network visualisations of the EACs SBI 1993 and SBI 2008 are planar graphs and both show a strongly heterogeneous node distribution. - in terms of branching out, the graph of EACS SBI 2008 is more balanced than SBI 1993. - the network structure of SBI 2008 section U “Activities of extraterritorial organizations and bodies” deviates from all other sections as no branching out can be observed. - the section visualisations show that in ISIC rev.4 the homogeneity of the number of activity clusters (nodes) per classification category is not a dominant classification criterion. Firstly, because the number of nodes varies widely (between 391 and 4). Secondly, because the EACSs network branching properties of the activity clusters show significant dissimilarities per section.
G
68
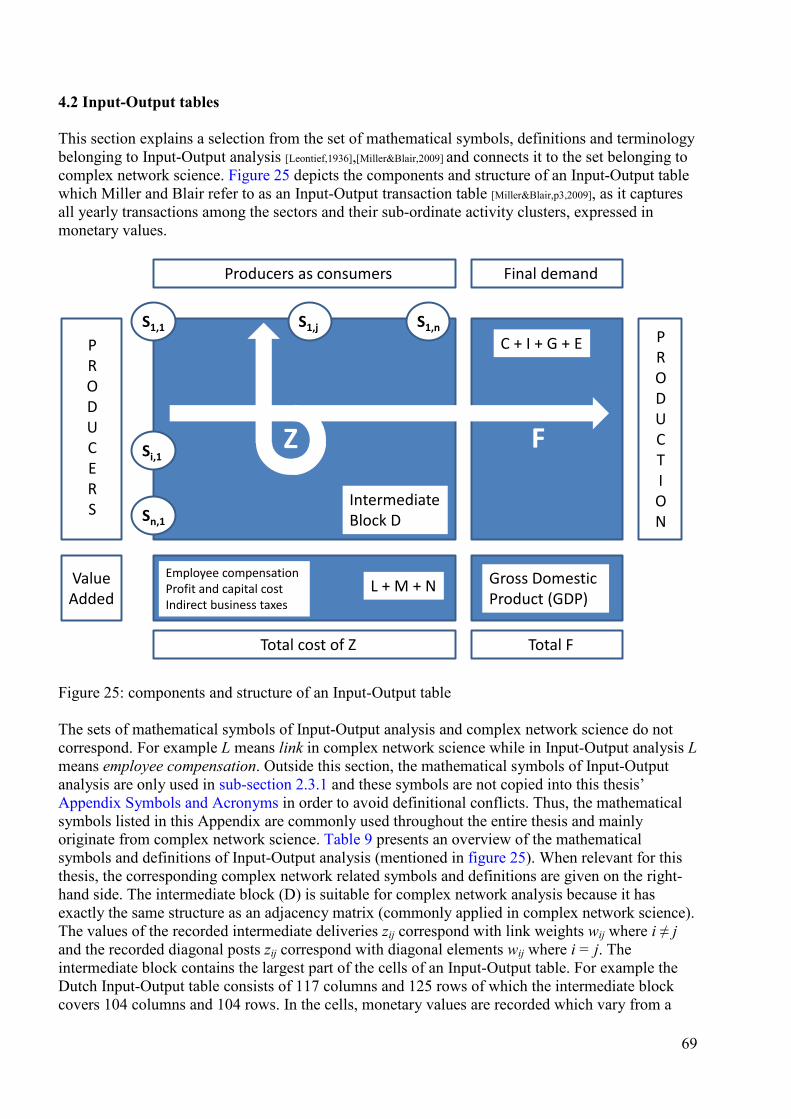
4.2 Input-Output tables This section explains a selection from the set of mathematical symbols, definitions and terminology belonging to Input-Output analysis [Leontief,1936],[Miller&Blair,2009] and connects it to the set belonging to complex network science. Figure 25 depicts the components and structure of an Input-Output table which Miller and Blair refer to as an Input-Output transaction table [Miller&Blair,p3,2009], as it captures all yearly transactions among the sectors and their sub-ordinate activity clusters, expressed in monetary values.
Figure 25: components and structure of an Input-Output table
The sets of mathematical symbols of Input-Output analysis and complex network science do not correspond. For example L means link in complex network science while in Input-Output analysis L means employee compensation. Outside this section, the mathematical symbols of Input-Output analysis are only used in sub-section 2.3.1 and these symbols are not copied into this thesis’ Appendix Symbols and Acronyms in order to avoid definitional conflicts. Thus, the mathematical symbols listed in this Appendix are commonly used throughout the entire thesis and mainly originate from complex network science. Table 9 presents an overview of the mathematical symbols and definitions of Input-Output analysis (mentioned in figure 25). When relevant for this thesis, the corresponding complex network related symbols and definitions are given on the right-hand side. The intermediate block (D) is suitable for complex network analysis because it has exactly the same structure as an adjacency matrix (commonly applied in complex network science). The values of the recorded intermediate deliveries zij correspond with link weights wij where i ≠ j and the recorded diagonal posts zij correspond with diagonal elements wij where i = j. The intermediate block contains the largest part of the cells of an Input-Output table. For example the Dutch Input-Output table consists of 117 columns and 125 rows of which the intermediate block covers 104 columns and 104 rows. In the cells, monetary values are recorded which vary from a
IntermediateBlock D
Producers as consumers
PRODUCTION
Gross DomesticProduct (GDP)
Employee compensationProfit and capital costIndirect business taxes
PRODUCERS
C + I + G + E
L + M + N
Z
Final demand
ValueAdded
Total cost of Z Total F
F
S1,nS1,jS1,1
Si,1
Sn,1
69
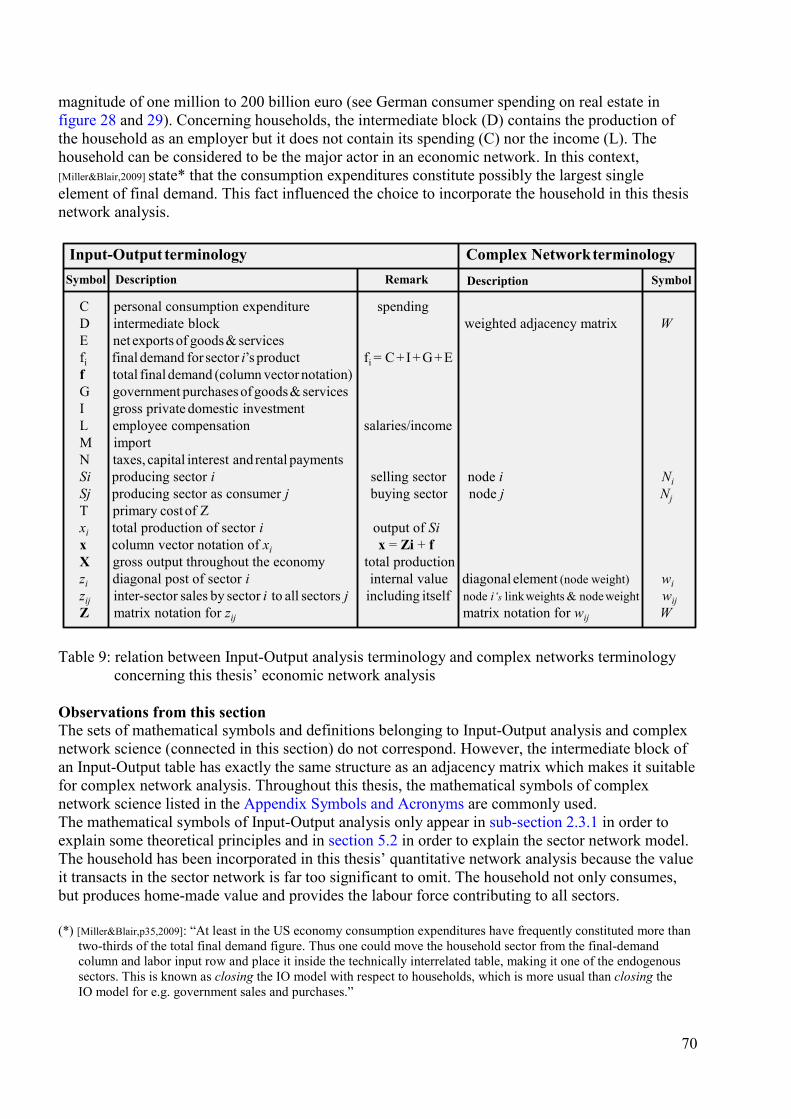
magnitude of one million to 200 billion euro (see German consumer spending on real estate in figure 28 and 29). Concerning households, the intermediate block (D) contains the production of the household as an employer but it does not contain its spending (C) nor the income (L). The household can be considered to be the major actor in an economic network. In this context, [Miller&Blair,2009] state* that the consumption expenditures constitute possibly the largest single element of final demand. This fact influenced the choice to incorporate the household in this thesis network analysis.
Table 9: relation between Input-Output analysis terminology and complex networks terminology concerning this thesis’ economic network analysis Observations from this section The sets of mathematical symbols and definitions belonging to Input-Output analysis and complex network science (connected in this section) do not correspond. However, the intermediate block of an Input-Output table has exactly the same structure as an adjacency matrix which makes it suitable for complex network analysis. Throughout this thesis, the mathematical symbols of complex network science listed in the Appendix Symbols and Acronyms are commonly used. The mathematical symbols of Input-Output analysis only appear in sub-section 2.3.1 in order to explain some theoretical principles and in section 5.2 in order to explain the sector network model. The household has been incorporated in this thesis’ quantitative network analysis because the value it transacts in the sector network is far too significant to omit. The household not only consumes, but produces home-made value and provides the labour force contributing to all sectors. (*) [Miller&Blair,p35,2009]: “At least in the US economy consumption expenditures have frequently constituted more than two-thirds of the total final demand figure. Thus one could move the household sector from the final-demand column and labor input row and place it inside the technically interrelated table, making it one of the endogenous sectors. This is known as closing the IO model with respect to households, which is more usual than closing the IO model for e.g. government sales and purchases.”
Remark SymbolDescriptionDescription
C personal consumption expenditure spendingD intermediate block weighted adjacency matrix WE net exports of goods& servicesfi final demand for sector i’s product fi = C+ I + G+ Ef total final demand (column vector notation)G government purchases of goods& servicesI gross private domestic investmentL employee compensation salaries/income M importN taxes, capital interest and rental paymentsSi producing sector i selling sector node i NiSj producing sector as consumer j buying sector node j NjT primary cost of Zxi total production of sector i output of Six column vector notation of xi x = Zi + fX gross output throughout the economy total productionzi diagonal post of sector i internal value diagonal element (node weight) wizij inter-sector sales by sector i to all sectors j including itself node i‘s linkweights & node weight wijZ matrix notation for zij matrix notation for wij W
Input-Output terminologySymbol
Complex Networkterminology
70
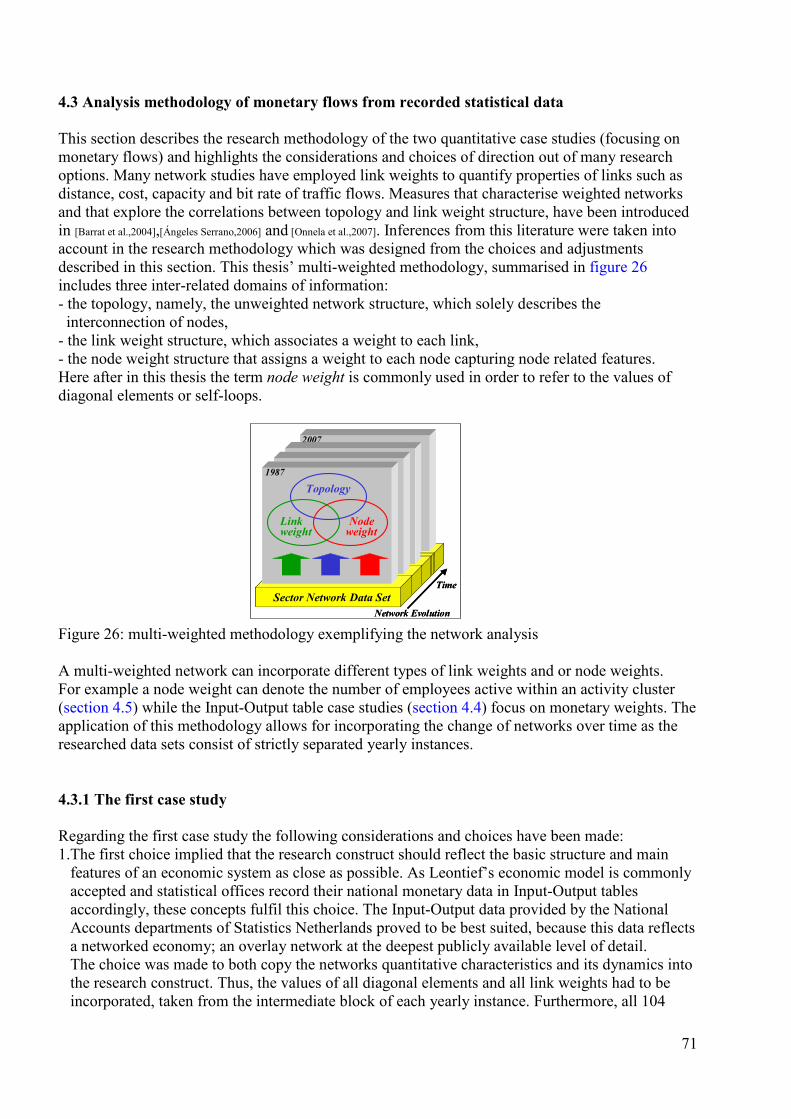
4.3 Analysis methodology of monetary flows from recorded statistical data This section describes the research methodology of the two quantitative case studies (focusing on monetary flows) and highlights the considerations and choices of direction out of many research options. Many network studies have employed link weights to quantify properties of links such as distance, cost, capacity and bit rate of traffic flows. Measures that characterise weighted networks and that explore the correlations between topology and link weight structure, have been introduced in [Barrat et al.,2004],[Ángeles Serrano,2006] and [Onnela et al.,2007]. Inferences from this literature were taken into account in the research methodology which was designed from the choices and adjustments described in this section. This thesis’ multi-weighted methodology, summarised in figure 26 includes three inter-related domains of information: - the topology, namely, the unweighted network structure, which solely describes the interconnection of nodes, - the link weight structure, which associates a weight to each link, - the node weight structure that assigns a weight to each node capturing node related features. Here after in this thesis the term node weight is commonly used in order to refer to the values of diagonal elements or self-loops. Figure 26: multi-weighted methodology exemplifying the network analysis A multi-weighted network can incorporate different types of link weights and or node weights. For example a node weight can denote the number of employees active within an activity cluster (section 4.5) while the Input-Output table case studies (section 4.4) focus on monetary weights. The application of this methodology allows for incorporating the change of networks over time as the researched data sets consist of strictly separated yearly instances. 4.3.1 The first case study Regarding the first case study the following considerations and choices have been made: 1.The first choice implied that the research construct should reflect the basic structure and main features of an economic system as close as possible. As Leontief’s economic model is commonly accepted and statistical offices record their national monetary data in Input-Output tables accordingly, these concepts fulfil this choice. The Input-Output data provided by the National Accounts departments of Statistics Netherlands proved to be best suited, because this data reflects a networked economy; an overlay network at the deepest publicly available level of detail. The choice was made to both copy the networks quantitative characteristics and its dynamics into the research construct. Thus, the values of all diagonal elements and all link weights had to be incorporated, taken from the intermediate block of each yearly instance. Furthermore, all 104
2007
Topology
Linkweight
Nodeweight
Sector Network Data SetNetwork Evolution
1987
Time
2007
Topology
Linkweight
Nodeweight
Sector Network Data SetNetwork Evolution
1987
Time
71
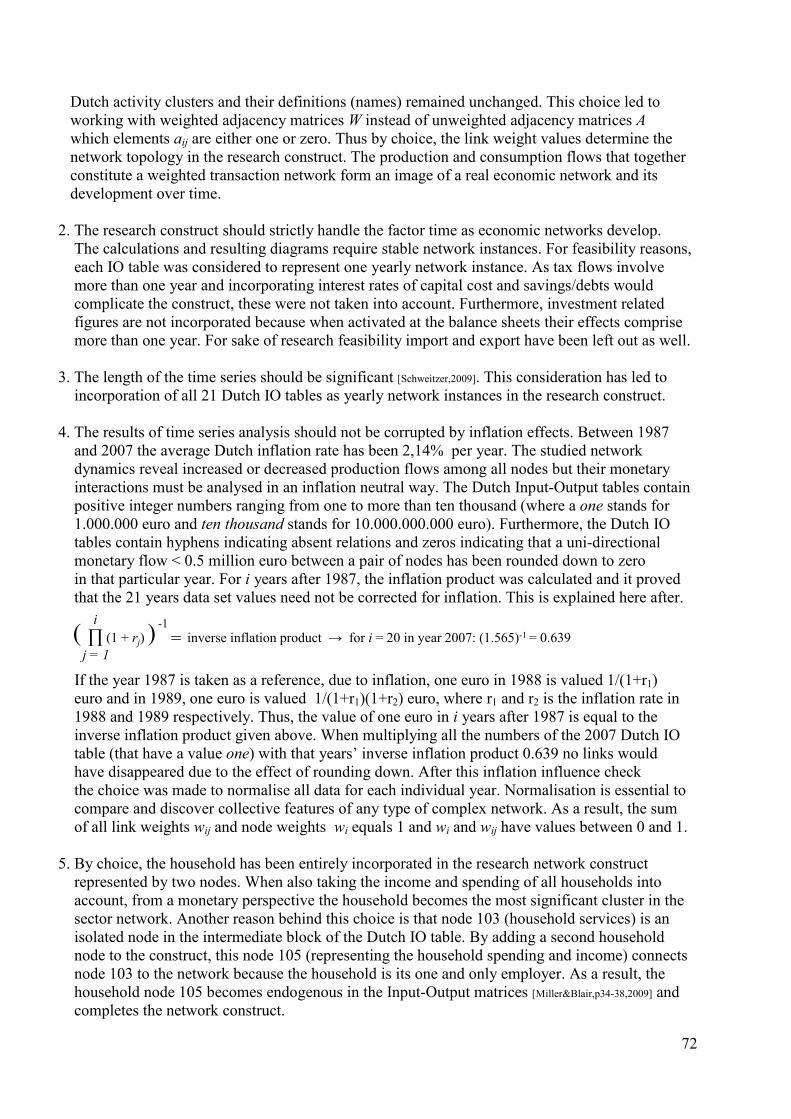
Dutch activity clusters and their definitions (names) remained unchanged. This choice led to working with weighted adjacency matrices W instead of unweighted adjacency matrices A which elements aij are either one or zero. Thus by choice, the link weight values determine the network topology in the research construct. The production and consumption flows that together constitute a weighted transaction network form an image of a real economic network and its development over time. 2. The research construct should strictly handle the factor time as economic networks develop. The calculations and resulting diagrams require stable network instances. For feasibility reasons, each IO table was considered to represent one yearly network instance. As tax flows involve more than one year and incorporating interest rates of capital cost and savings/debts would complicate the construct, these were not taken into account. Furthermore, investment related figures are not incorporated because when activated at the balance sheets their effects comprise more than one year. For sake of research feasibility import and export have been left out as well. 3. The length of the time series should be significant [Schweitzer,2009]. This consideration has led to incorporation of all 21 Dutch IO tables as yearly network instances in the research construct. 4. The results of time series analysis should not be corrupted by inflation effects. Between 1987 and 2007 the average Dutch inflation rate has been 2,14% per year. The studied network dynamics reveal increased or decreased production flows among all nodes but their monetary interactions must be analysed in an inflation neutral way. The Dutch Input-Output tables contain positive integer numbers ranging from one to more than ten thousand (where a one stands for 1.000.000 euro and ten thousand stands for 10.000.000.000 euro). Furthermore, the Dutch IO tables contain hyphens indicating absent relations and zeros indicating that a uni-directional monetary flow < 0.5 million euro between a pair of nodes has been rounded down to zero in that particular year. For i years after 1987, the inflation product was calculated and it proved that the 21 years data set values need not be corrected for inflation. This is explained here after.
If the year 1987 is taken as a reference, due to inflation, one euro in 1988 is valued 1/(1+r1) euro and in 1989, one euro is valued 1/(1+r1)(1+r2) euro, where r1 and r2 is the inflation rate in 1988 and 1989 respectively. Thus, the value of one euro in i years after 1987 is equal to the inverse inflation product given above. When multiplying all the numbers of the 2007 Dutch IO table (that have a value one) with that years’ inverse inflation product 0.639 no links would have disappeared due to the effect of rounding down. After this inflation influence check the choice was made to normalise all data for each individual year. Normalisation is essential to compare and discover collective features of any type of complex network. As a result, the sum of all link weights wij and node weights wi equals 1 and wi and wij have values between 0 and 1. 5. By choice, the household has been entirely incorporated in the research network construct represented by two nodes. When also taking the income and spending of all households into account, from a monetary perspective the household becomes the most significant cluster in the sector network. Another reason behind this choice is that node 103 (household services) is an isolated node in the intermediate block of the Dutch IO table. By adding a second household node to the construct, this node 105 (representing the household spending and income) connects node 103 to the network because the household is its one and only employer. As a result, the household node 105 becomes endogenous in the Input-Output matrices [Miller&Blair,p34-38,2009] and completes the network construct.
i∏ (1 + rj)
j = 1) ( -1
= inverse inflation product → for i = 20 in year 2007: (1.565)-1 = 0.639
72
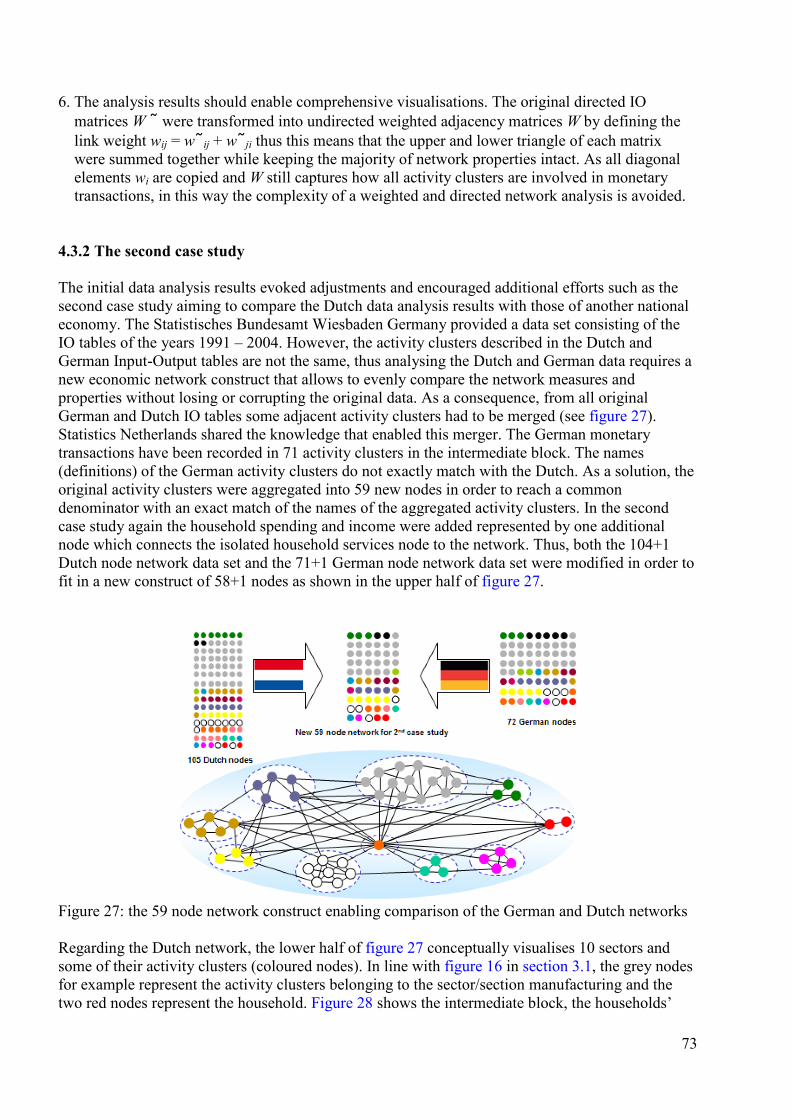
6. The analysis results should enable comprehensive visualisations. The original directed IO matrices W ῀ were transformed into undirected weighted adjacency matrices W by defining the link weight wij = w῀ij + w῀ji thus this means that the upper and lower triangle of each matrix were summed together while keeping the majority of network properties intact. As all diagonal elements wi are copied and W still captures how all activity clusters are involved in monetary transactions, in this way the complexity of a weighted and directed network analysis is avoided. 4.3.2 The second case study The initial data analysis results evoked adjustments and encouraged additional efforts such as the second case study aiming to compare the Dutch data analysis results with those of another national economy. The Statistisches Bundesamt Wiesbaden Germany provided a data set consisting of the IO tables of the years 1991 – 2004. However, the activity clusters described in the Dutch and German Input-Output tables are not the same, thus analysing the Dutch and German data requires a new economic network construct that allows to evenly compare the network measures and properties without losing or corrupting the original data. As a consequence, from all original German and Dutch IO tables some adjacent activity clusters had to be merged (see figure 27). Statistics Netherlands shared the knowledge that enabled this merger. The German monetary transactions have been recorded in 71 activity clusters in the intermediate block. The names (definitions) of the German activity clusters do not exactly match with the Dutch. As a solution, the original activity clusters were aggregated into 59 new nodes in order to reach a common denominator with an exact match of the names of the aggregated activity clusters. In the second case study again the household spending and income were added represented by one additional node which connects the isolated household services node to the network. Thus, both the 104+1 Dutch node network data set and the 71+1 German node network data set were modified in order to fit in a new construct of 58+1 nodes as shown in the upper half of figure 27.
Figure 27: the 59 node network construct enabling comparison of the German and Dutch networks Regarding the Dutch network, the lower half of figure 27 conceptually visualises 10 sectors and some of their activity clusters (coloured nodes). In line with figure 16 in section 3.1, the grey nodes for example represent the activity clusters belonging to the sector/section manufacturing and the two red nodes represent the household. Figure 28 shows the intermediate block, the households’
73
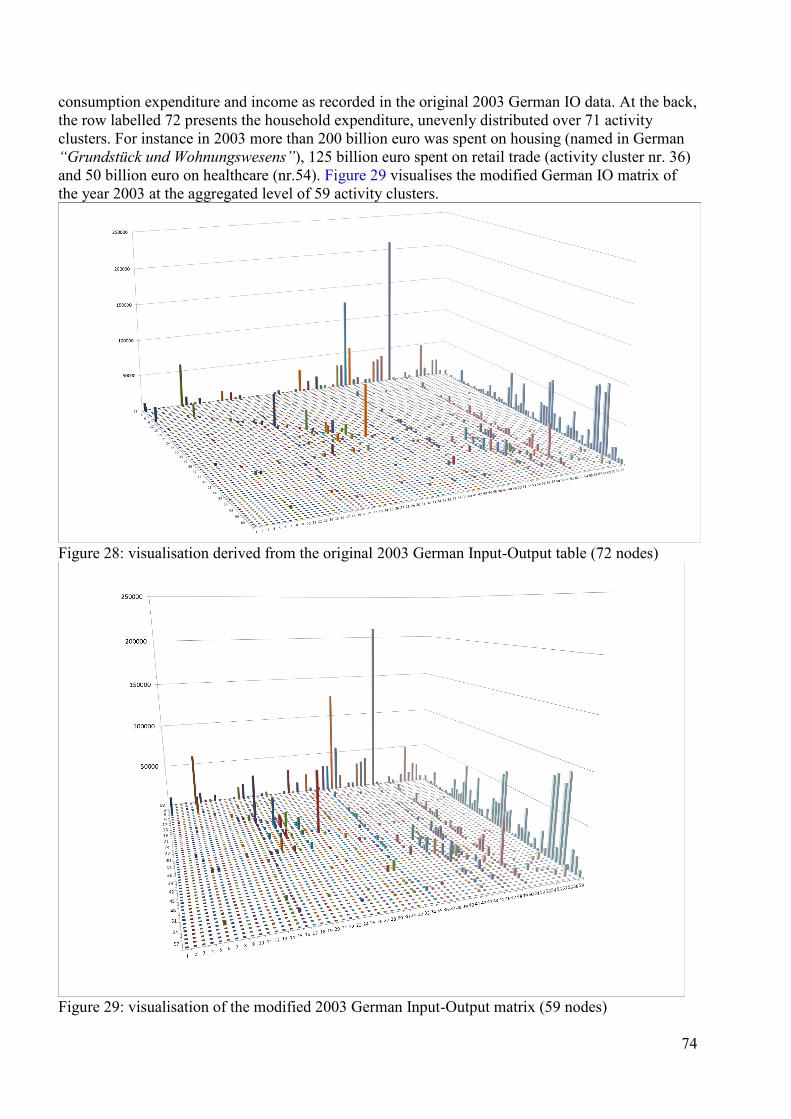
consumption expenditure and income as recorded in the original 2003 German IO data. At the back, the row labelled 72 presents the household expenditure, unevenly distributed over 71 activity clusters. For instance in 2003 more than 200 billion euro was spent on housing (named in German “Grundstück und Wohnungswesens”), 125 billion euro spent on retail trade (activity cluster nr. 36) and 50 billion euro on healthcare (nr.54). Figure 29 visualises the modified German IO matrix of the year 2003 at the aggregated level of 59 activity clusters.
Figure 28: visualisation derived from the original 2003 German Input-Output table (72 nodes)
Figure 29: visualisation of the modified 2003 German Input-Output matrix (59 nodes)
74
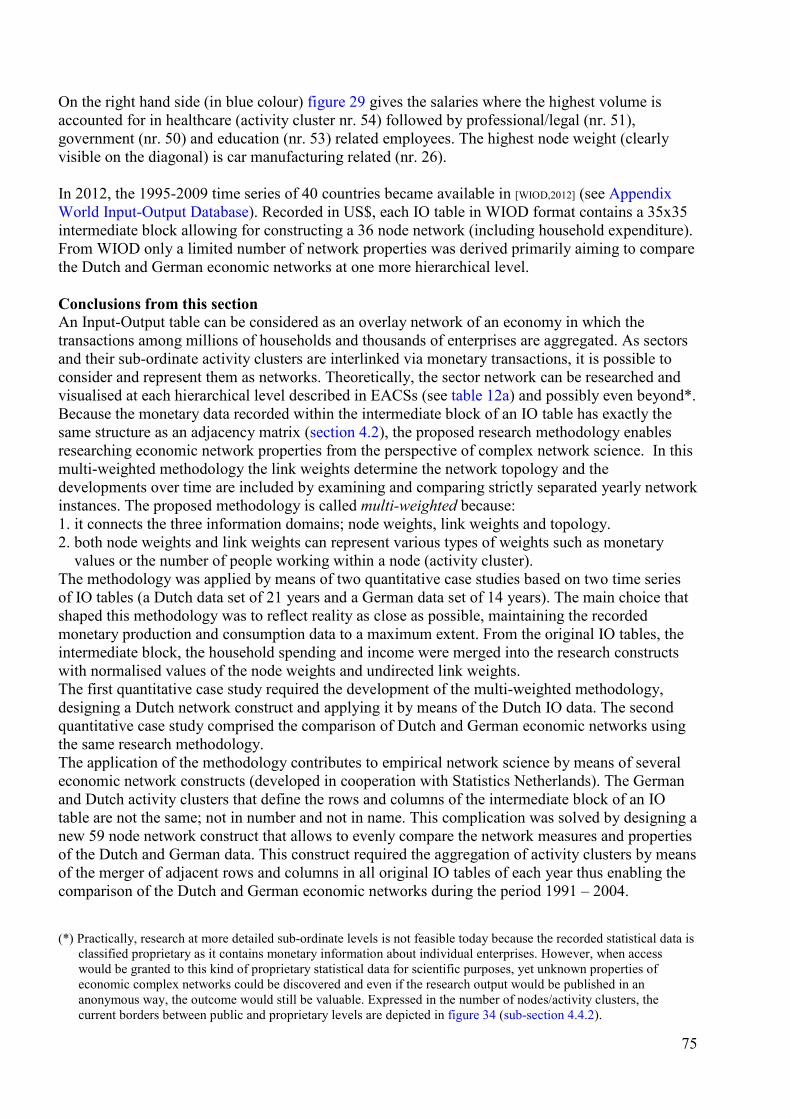
On the right hand side (in blue colour) figure 29 gives the salaries where the highest volume is accounted for in healthcare (activity cluster nr. 54) followed by professional/legal (nr. 51), government (nr. 50) and education (nr. 53) related employees. The highest node weight (clearly visible on the diagonal) is car manufacturing related (nr. 26). In 2012, the 1995-2009 time series of 40 countries became available in [WIOD,2012] (see Appendix World Input-Output Database). Recorded in US$, each IO table in WIOD format contains a 35x35 intermediate block allowing for constructing a 36 node network (including household expenditure). From WIOD only a limited number of network properties was derived primarily aiming to compare the Dutch and German economic networks at one more hierarchical level. Conclusions from this section An Input-Output table can be considered as an overlay network of an economy in which the transactions among millions of households and thousands of enterprises are aggregated. As sectors and their sub-ordinate activity clusters are interlinked via monetary transactions, it is possible to consider and represent them as networks. Theoretically, the sector network can be researched and visualised at each hierarchical level described in EACSs (see table 12a) and possibly even beyond*. Because the monetary data recorded within the intermediate block of an IO table has exactly the same structure as an adjacency matrix (section 4.2), the proposed research methodology enables researching economic network properties from the perspective of complex network science. In this multi-weighted methodology the link weights determine the network topology and the developments over time are included by examining and comparing strictly separated yearly network instances. The proposed methodology is called multi-weighted because: 1. it connects the three information domains; node weights, link weights and topology. 2. both node weights and link weights can represent various types of weights such as monetary values or the number of people working within a node (activity cluster). The methodology was applied by means of two quantitative case studies based on two time series of IO tables (a Dutch data set of 21 years and a German data set of 14 years). The main choice that shaped this methodology was to reflect reality as close as possible, maintaining the recorded monetary production and consumption data to a maximum extent. From the original IO tables, the intermediate block, the household spending and income were merged into the research constructs with normalised values of the node weights and undirected link weights. The first quantitative case study required the development of the multi-weighted methodology, designing a Dutch network construct and applying it by means of the Dutch IO data. The second quantitative case study comprised the comparison of Dutch and German economic networks using the same research methodology. The application of the methodology contributes to empirical network science by means of several economic network constructs (developed in cooperation with Statistics Netherlands). The German and Dutch activity clusters that define the rows and columns of the intermediate block of an IO table are not the same; not in number and not in name. This complication was solved by designing a new 59 node network construct that allows to evenly compare the network measures and properties of the Dutch and German data. This construct required the aggregation of activity clusters by means of the merger of adjacent rows and columns in all original IO tables of each year thus enabling the comparison of the Dutch and German economic networks during the period 1991 – 2004. (*) Practically, research at more detailed sub-ordinate levels is not feasible today because the recorded statistical data is classified proprietary as it contains monetary information about individual enterprises. However, when access would be granted to this kind of proprietary statistical data for scientific purposes, yet unknown properties of economic complex networks could be discovered and even if the research output would be published in an anonymous way, the outcome would still be valuable. Expressed in the number of nodes/activity clusters, the current borders between public and proprietary levels are depicted in figure 34 (sub-section 4.4.2).
75
4.4 Comparing the German and Dutch economies as networks This section answers RQ2 “What is a sector network and how did it evolve?” and SQ2a “Does the sector network constitute a complex network?” and contributes to answering SQ2b “What are the main observations, properties and characteristics derived from sector network related data?” From theory [Bunge,1979], the relations of this thesis’ main terminology are defined as follows: - An economic system is composed of sectors, thus the sectors are components of an economy. - The systems’ structure is defined by the set of all relations between the systems’ components*. - The transactions between the connected sectors define the structure of the economic network. This thesis’ research is designed from a complex network perspective. As this section presents the network analysis results from the monetary transactions between sector components, here after the object of research is commonly referred to as the sector network representing the German and Dutch economies as economic networks. From a physical perspective the answer to SQ2a is positive. At global, continental and national scale, it can be assumed that (the mathematical representation of) a sector network consisting of millions of actors, is a complex network. This inference is supported by this thesis’ research findings presented in this section that seem to be in line with the following definition of a complex network provided by Wikipedia. “In the context of network theory, a complex network is a graph (network) with non-trivial topological features that do not occur in simple networks such as lattices or random graphs but often occur in real graphs. Most social, biological, and technological networks display substantial non-trivial topological features, with patterns of connection between their elements that are neither purely regular nor purely random. Examples of these non-trivial features are power-law degree distributions, short path lengths and (dis)assortativity. Furthermore, some of the components of economic networks and (recursively) some of the components of sectors are commonly studied and considered to be complex networks. Examples are DINs, power-grids and social networks. As people constitute a maze of social networks and engage in an economic system, likely their sum is a complex network too. Concerning SQ2b, this section presents, compares and analyses the research results of the two quantitative case studies extracted from two original time series of monetary production data: - the Dutch Input-Output tables of 1987-2007 issued by Statistics Netherlands National Accounts, - the German Input-Output tables of 1991-2004 issued by the Statistisches Bundesamt Volkswirtschaftliche Gesamtrechnungen. Additionally, a limited number of network properties was derived from the German and Dutch 1995-2009 time series captured in the World Input-Output database [WIOD,2012]. Although the German economy is about six times as large as the Dutch economy, the results demonstrate that their network properties and developments over time are to a high extent alike. For instance their network structures both show increasing clustering over time. Furthermore, the observed correlations among their main properties prove their kinship. A clear difference observed from the data, is that the Dutch network is more sensitive to international crises. However, the similarities found outnumber the dissimilarities. (*) The relations with the environment of a system also defines its structure [Bunge,p5-6,1979]. E.g. the German and Dutch economies are connected internationally. However, for sake of feasibility this research focuses on the national developments and properties of the German and Dutch sector networks.
76
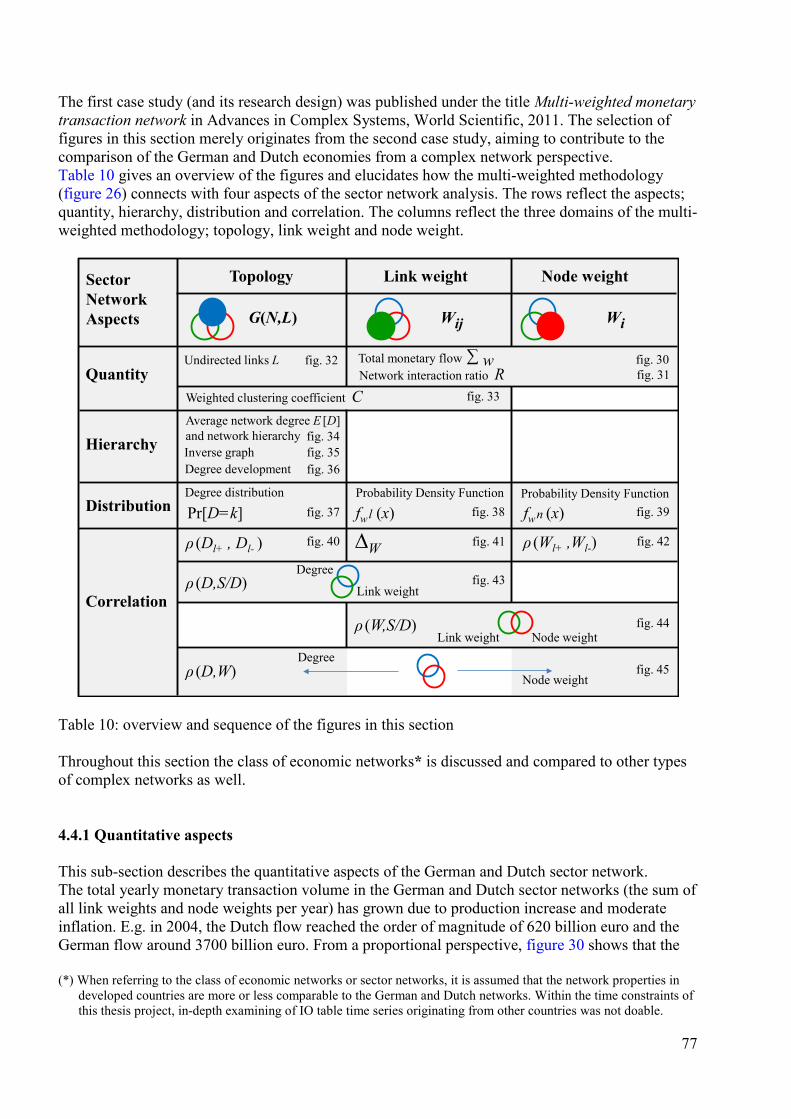
The first case study (and its research design) was published under the title Multi-weighted monetary transaction network in Advances in Complex Systems, World Scientific, 2011. The selection of figures in this section merely originates from the second case study, aiming to contribute to the comparison of the German and Dutch economies from a complex network perspective. Table 10 gives an overview of the figures and elucidates how the multi-weighted methodology (figure 26) connects with four aspects of the sector network analysis. The rows reflect the aspects; quantity, hierarchy, distribution and correlation. The columns reflect the three domains of the multi-weighted methodology; topology, link weight and node weight.
Table 10: overview and sequence of the figures in this section
Throughout this section the class of economic networks* is discussed and compared to other types of complex networks as well. 4.4.1 Quantitative aspects This sub-section describes the quantitative aspects of the German and Dutch sector network. The total yearly monetary transaction volume in the German and Dutch sector networks (the sum of all link weights and node weights per year) has grown due to production increase and moderate inflation. E.g. in 2004, the Dutch flow reached the order of magnitude of 620 billion euro and the German flow around 3700 billion euro. From a proportional perspective, figure 30 shows that the (*) When referring to the class of economic networks or sector networks, it is assumed that the network properties in developed countries are more or less comparable to the German and Dutch networks. Within the time constraints of this thesis project, in-depth examining of IO table time series originating from other countries was not doable.
Topology Link weight Node weightSectorNetwork Aspects
Distribution
Correlation
Quantity
HierarchyAverage network degree E [D]and network hierarchy
ρ (Dl+ , Dl- ) ρ (Wl+ ,Wl-)∆W
Total monetary flow fig. 30
Wij Wi
Undirected links L ∑ wNetwork interaction ratio R fig. 31
fig. 44
fig. 39fig. 38fig. 37
fig. 34
fig. 40 fig. 41 fig. 42
fig. 32
Weighted clustering coefficient C fig. 33
Degree distribution Probability Density Function Probability Density Function
ρ (D,S/D)
ρ (W,S/D)
fig. 43
Pr[D=k]
fig. 45ρ (D,W)
G(N,L)
Degree
Link weight
Node weightLink weightDegree
Node weight
fwl (x) fwn (x)
fig. 35fig. 36
Inverse graphDegree development
77
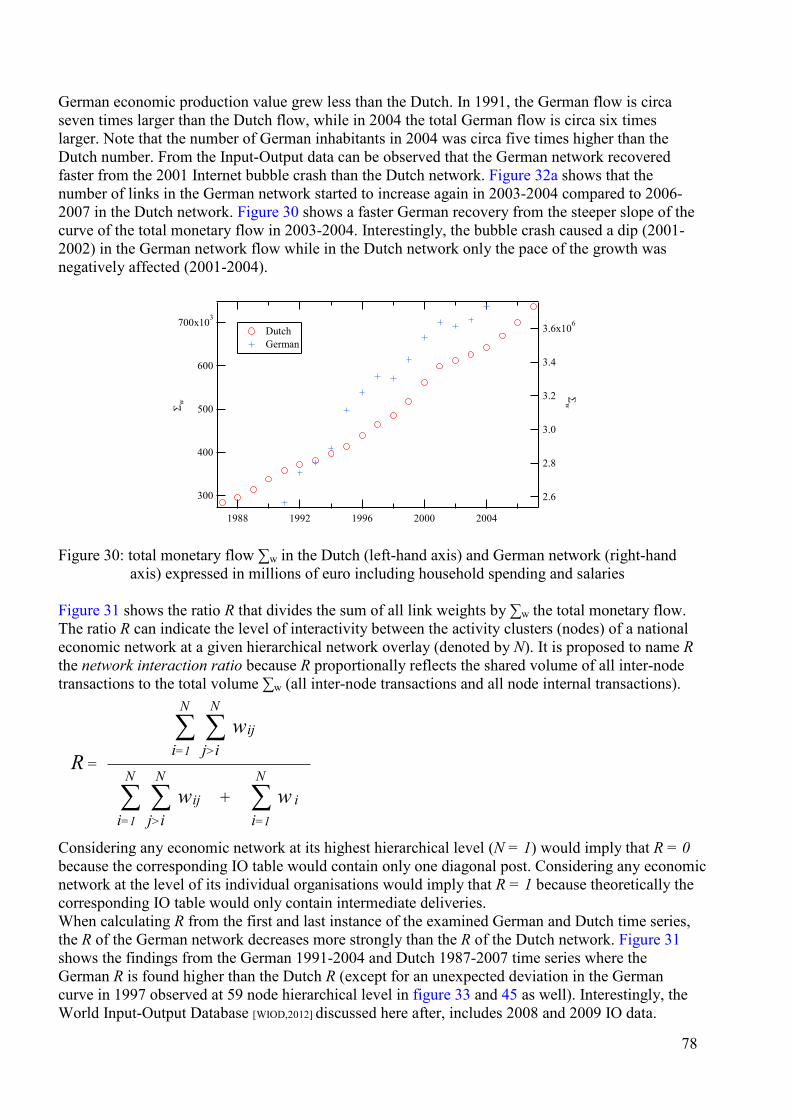
German economic production value grew less than the Dutch. In 1991, the German flow is circa seven times larger than the Dutch flow, while in 2004 the total German flow is circa six times larger. Note that the number of German inhabitants in 2004 was circa five times higher than the Dutch number. From the Input-Output data can be observed that the German network recovered faster from the 2001 Internet bubble crash than the Dutch network. Figure 32a shows that the number of links in the German network started to increase again in 2003-2004 compared to 2006-2007 in the Dutch network. Figure 30 shows a faster German recovery from the steeper slope of the curve of the total monetary flow in 2003-2004. Interestingly, the bubble crash caused a dip (2001-2002) in the German network flow while in the Dutch network only the pace of the growth was negatively affected (2001-2004).
Figure 30: total monetary flow ∑w in the Dutch (left-hand axis) and German network (right-hand axis) expressed in millions of euro including household spending and salaries Figure 31 shows the ratio R that divides the sum of all link weights by ∑w the total monetary flow. The ratio R can indicate the level of interactivity between the activity clusters (nodes) of a national economic network at a given hierarchical network overlay (denoted by N). It is proposed to name R the network interaction ratio because R proportionally reflects the shared volume of all inter-node transactions to the total volume ∑w (all inter-node transactions and all node internal transactions).
Considering any economic network at its highest hierarchical level (N = 1) would imply that R = 0 because the corresponding IO table would contain only one diagonal post. Considering any economic network at the level of its individual organisations would imply that R = 1 because theoretically the corresponding IO table would only contain intermediate deliveries. When calculating R from the first and last instance of the examined German and Dutch time series, the R of the German network decreases more strongly than the R of the Dutch network. Figure 31 shows the findings from the German 1991-2004 and Dutch 1987-2007 time series where the German R is found higher than the Dutch R (except for an unexpected deviation in the German curve in 1997 observed at 59 node hierarchical level in figure 33 and 45 as well). Interestingly, the World Input-Output Database [WIOD,2012] discussed here after, includes 2008 and 2009 IO data.
700x103
600
500
400
300
Σw
20042000199619921988
3.6x10⁶
3.4
3.2
3.0
2.8
2.6
Σw
Dutch German
R =i=1 j>i∑ ∑ wij
N N
i=1 j>i∑ ∑ wij
N N
∑ w i
N
i=1
+
78
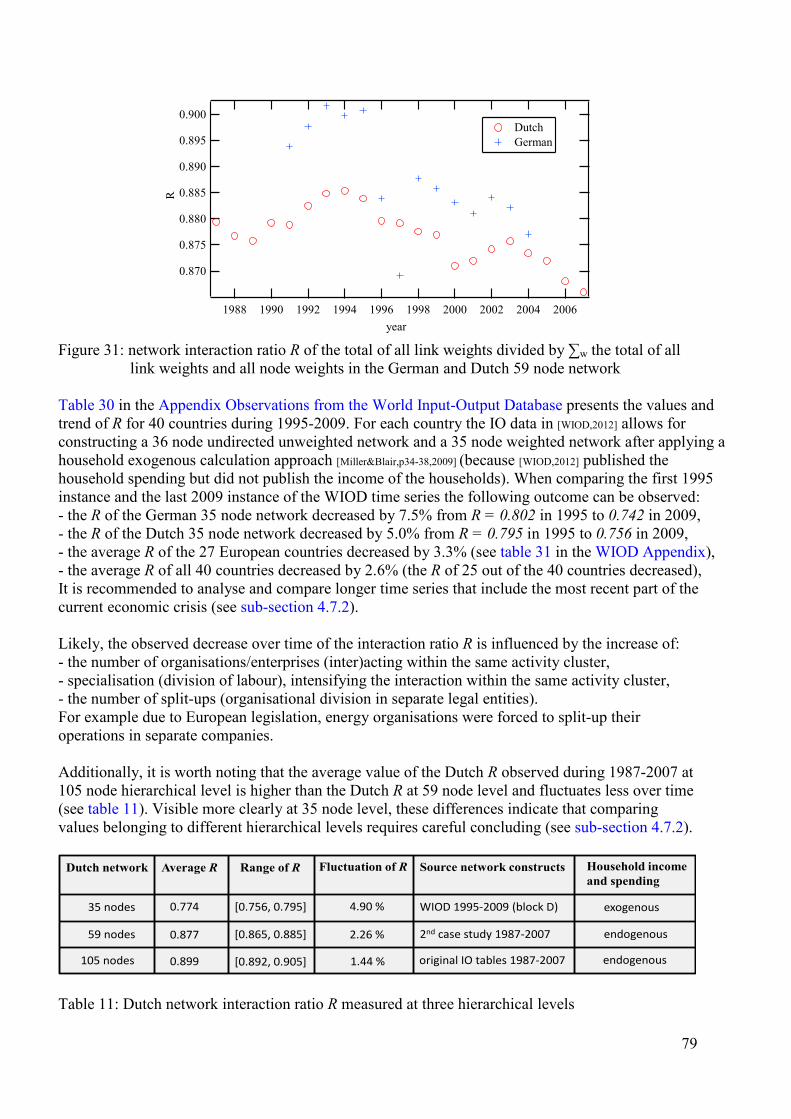
Figure 31: network interaction ratio R of the total of all link weights divided by ∑w the total of all link weights and all node weights in the German and Dutch 59 node network Table 30 in the Appendix Observations from the World Input-Output Database presents the values and trend of R for 40 countries during 1995-2009. For each country the IO data in [WIOD,2012] allows for constructing a 36 node undirected unweighted network and a 35 node weighted network after applying a household exogenous calculation approach [Miller&Blair,p34-38,2009] (because [WIOD,2012] published the household spending but did not publish the income of the households). When comparing the first 1995 instance and the last 2009 instance of the WIOD time series the following outcome can be observed: - the R of the German 35 node network decreased by 7.5% from R = 0.802 in 1995 to 0.742 in 2009, - the R of the Dutch 35 node network decreased by 5.0% from R = 0.795 in 1995 to 0.756 in 2009, - the average R of the 27 European countries decreased by 3.3% (see table 31 in the WIOD Appendix), - the average R of all 40 countries decreased by 2.6% (the R of 25 out of the 40 countries decreased), It is recommended to analyse and compare longer time series that include the most recent part of the current economic crisis (see sub-section 4.7.2). Likely, the observed decrease over time of the interaction ratio R is influenced by the increase of: - the number of organisations/enterprises (inter)acting within the same activity cluster, - specialisation (division of labour), intensifying the interaction within the same activity cluster, - the number of split-ups (organisational division in separate legal entities). For example due to European legislation, energy organisations were forced to split-up their operations in separate companies. Additionally, it is worth noting that the average value of the Dutch R observed during 1987-2007 at 105 node hierarchical level is higher than the Dutch R at 59 node level and fluctuates less over time (see table 11). Visible more clearly at 35 node level, these differences indicate that comparing values belonging to different hierarchical levels requires careful concluding (see sub-section 4.7.2).
Table 11: Dutch network interaction ratio R measured at three hierarchical levels
0.900
0.895
0.890
0.885
0.880
0.875
0.870
R
2006200420022000199819961994199219901988year
Dutch German
Dutch network Average R Range of R Fluctuation of R
59 nodes 0.877
105 nodes [0.892, 0.905]
[0.865, 0.885]
0.899
2.26 %
1.44 %
35 nodes 0.774 [0.756, 0.795] 4.90 %
Source network constructs
2nd case study 1987-2007
original IO tables 1987-2007
WIOD 1995-2009 (block D)
Household incomeand spending
exogenous
endogenous
endogenous
79
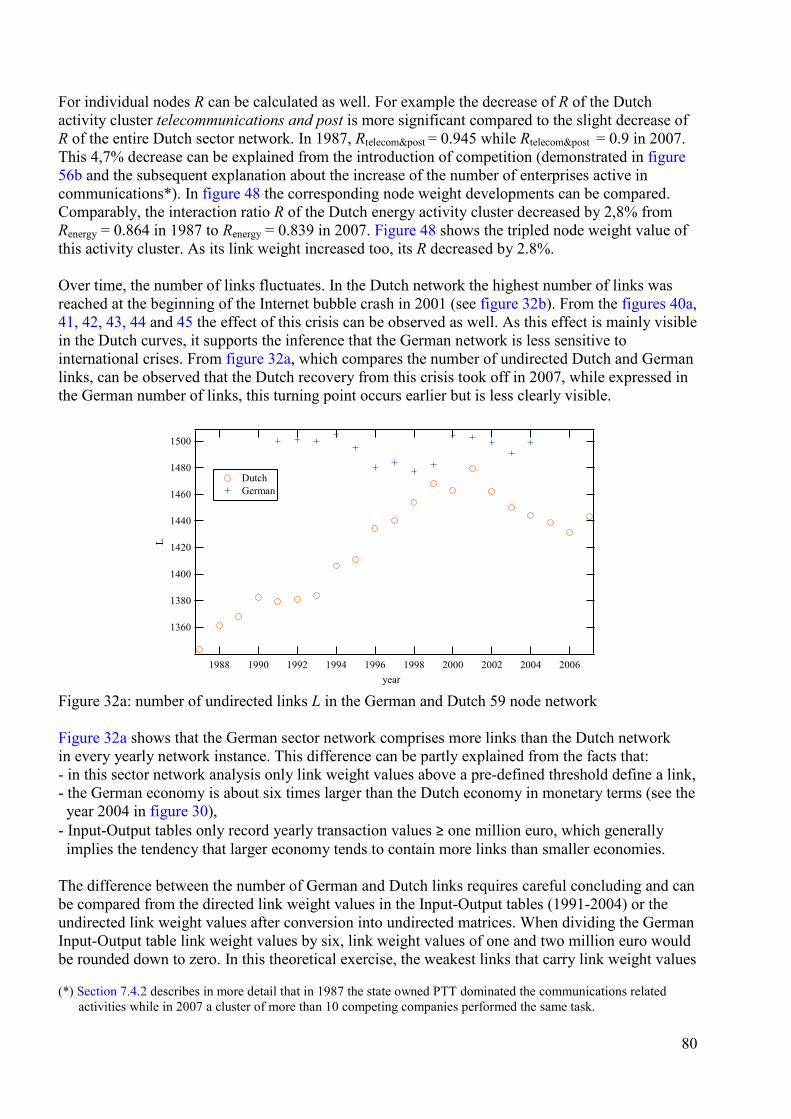
For individual nodes R can be calculated as well. For example the decrease of R of the Dutch activity cluster telecommunications and post is more significant compared to the slight decrease of R of the entire Dutch sector network. In 1987, Rtelecom&post = 0.945 while Rtelecom&post = 0.9 in 2007. This 4,7% decrease can be explained from the introduction of competition (demonstrated in figure 56b and the subsequent explanation about the increase of the number of enterprises active in communications*). In figure 48 the corresponding node weight developments can be compared. Comparably, the interaction ratio R of the Dutch energy activity cluster decreased by 2,8% from Renergy = 0.864 in 1987 to Renergy = 0.839 in 2007. Figure 48 shows the tripled node weight value of this activity cluster. As its link weight increased too, its R decreased by 2.8%. Over time, the number of links fluctuates. In the Dutch network the highest number of links was reached at the beginning of the Internet bubble crash in 2001 (see figure 32b). From the figures 40a, 41, 42, 43, 44 and 45 the effect of this crisis can be observed as well. As this effect is mainly visible in the Dutch curves, it supports the inference that the German network is less sensitive to international crises. From figure 32a, which compares the number of undirected Dutch and German links, can be observed that the Dutch recovery from this crisis took off in 2007, while expressed in the German number of links, this turning point occurs earlier but is less clearly visible.
Figure 32a: number of undirected links L in the German and Dutch 59 node network Figure 32a shows that the German sector network comprises more links than the Dutch network in every yearly network instance. This difference can be partly explained from the facts that: - in this sector network analysis only link weight values above a pre-defined threshold define a link, - the German economy is about six times larger than the Dutch economy in monetary terms (see the year 2004 in figure 30), - Input-Output tables only record yearly transaction values ≥ one million euro, which generally implies the tendency that larger economy tends to contain more links than smaller economies. The difference between the number of German and Dutch links requires careful concluding and can be compared from the directed link weight values in the Input-Output tables (1991-2004) or the undirected link weight values after conversion into undirected matrices. When dividing the German Input-Output table link weight values by six, link weight values of one and two million euro would be rounded down to zero. In this theoretical exercise, the weakest links that carry link weight values (*) Section 7.4.2 describes in more detail that in 1987 the state owned PTT dominated the communications related activities while in 2007 a cluster of more than 10 competing companies performed the same task.
1500
1480
1460
1440
1420
1400
1380
1360
L
2006200420022000199819961994199219901988year
Dutch German
80
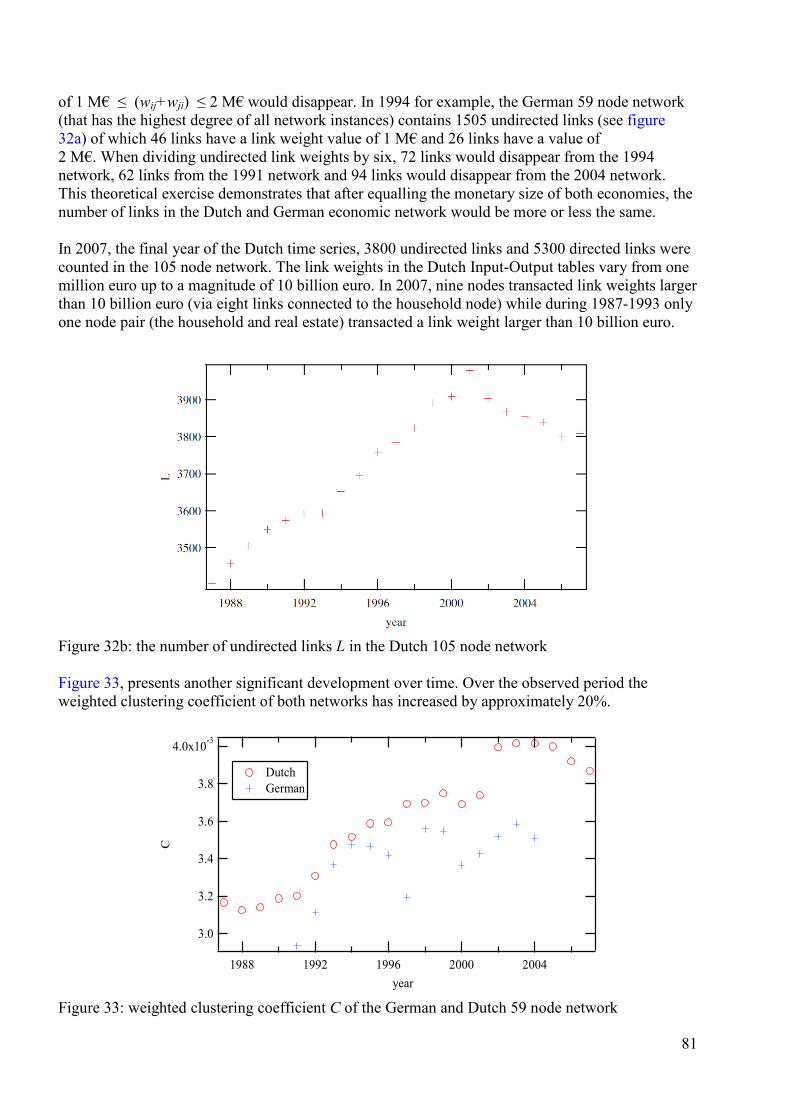
of 1 M€ ≤ (wij+wji) ≤ 2 M€ would disappear. In 1994 for example, the German 59 node network (that has the highest degree of all network instances) contains 1505 undirected links (see figure 32a) of which 46 links have a link weight value of 1 M€ and 26 links have a value of 2 M€. When dividing undirected link weights by six, 72 links would disappear from the 1994 network, 62 links from the 1991 network and 94 links would disappear from the 2004 network. This theoretical exercise demonstrates that after equalling the monetary size of both economies, the number of links in the Dutch and German economic network would be more or less the same. In 2007, the final year of the Dutch time series, 3800 undirected links and 5300 directed links were counted in the 105 node network. The link weights in the Dutch Input-Output tables vary from one million euro up to a magnitude of 10 billion euro. In 2007, nine nodes transacted link weights larger than 10 billion euro (via eight links connected to the household node) while during 1987-1993 only one node pair (the household and real estate) transacted a link weight larger than 10 billion euro.
Figure 32b: the number of undirected links L in the Dutch 105 node network Figure 33, presents another significant development over time. Over the observed period the weighted clustering coefficient of both networks has increased by approximately 20%.
Figure 33: weighted clustering coefficient C of the German and Dutch 59 node network
4.0x10⁻³
3.8
3.6
3.4
3.2
3.0
C
20042000199619921988year
Dutch German
81
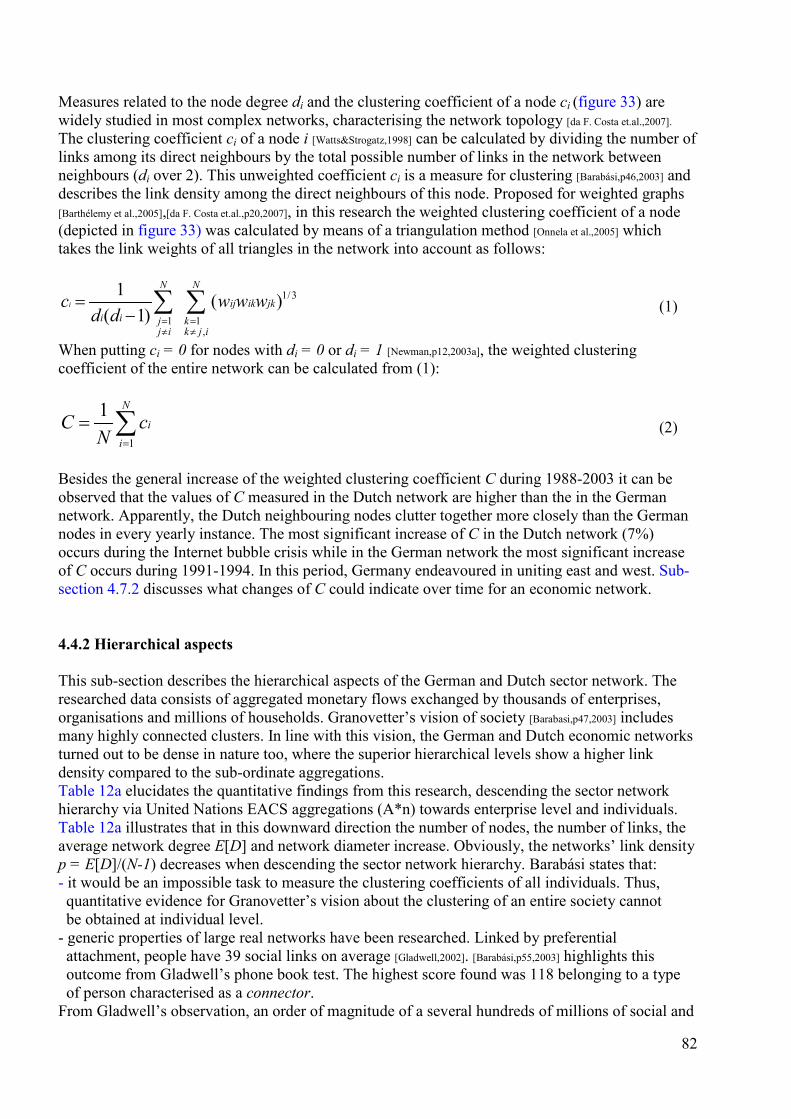
Measures related to the node degree di and the clustering coefficient of a node ci (figure 33) are widely studied in most complex networks, characterising the network topology [da F. Costa et.al.,2007].
The clustering coefficient ci of a node i [Watts&Strogatz,1998] can be calculated by dividing the number of links among its direct neighbours by the total possible number of links in the network between neighbours (di over 2). This unweighted coefficient ci is a measure for clustering [Barabási,p46,2003] and describes the link density among the direct neighbours of this node. Proposed for weighted graphs [Barthélemy et al.,2005],[da F. Costa et.al.,p20,2007], in this research the weighted clustering coefficient of a node (depicted in figure 33) was calculated by means of a triangulation method [Onnela et al.,2005] which takes the link weights of all triangles in the network into account as follows:
1/3
1 1,
1 ( )( 1)
i
N N
ij ik jki i j k
j i k j i
c w w wd d = =
≠ ≠
=− ∑ ∑ (1)
When putting ci = 0 for nodes with di = 0 or di = 1 [Newman,p12,2003a], the weighted clustering coefficient of the entire network can be calculated from (1):
1
1 N
ii
C cN =
= ∑ (2)
Besides the general increase of the weighted clustering coefficient C during 1988-2003 it can be observed that the values of C measured in the Dutch network are higher than the in the German network. Apparently, the Dutch neighbouring nodes clutter together more closely than the German nodes in every yearly instance. The most significant increase of C in the Dutch network (7%) occurs during the Internet bubble crisis while in the German network the most significant increase of C occurs during 1991-1994. In this period, Germany endeavoured in uniting east and west. Sub-section 4.7.2 discusses what changes of C could indicate over time for an economic network. 4.4.2 Hierarchical aspects This sub-section describes the hierarchical aspects of the German and Dutch sector network. The researched data consists of aggregated monetary flows exchanged by thousands of enterprises, organisations and millions of households. Granovetter’s vision of society [Barabasi,p47,2003] includes many highly connected clusters. In line with this vision, the German and Dutch economic networks turned out to be dense in nature too, where the superior hierarchical levels show a higher link density compared to the sub-ordinate aggregations. Table 12a elucidates the quantitative findings from this research, descending the sector network hierarchy via United Nations EACS aggregations (A*n) towards enterprise level and individuals. Table 12a illustrates that in this downward direction the number of nodes, the number of links, the average network degree E[D] and network diameter increase. Obviously, the networks’ link density p = E[D]/(N-1) decreases when descending the sector network hierarchy. Barabási states that: - it would be an impossible task to measure the clustering coefficients of all individuals. Thus, quantitative evidence for Granovetter’s vision about the clustering of an entire society cannot be obtained at individual level. - generic properties of large real networks have been researched. Linked by preferential attachment, people have 39 social links on average [Gladwell,2002]. [Barabási,p55,2003] highlights this outcome from Gladwell’s phone book test. The highest score found was 118 belonging to a type of person characterised as a connector. From Gladwell’s observation, an order of magnitude of a several hundreds of millions of social and
82
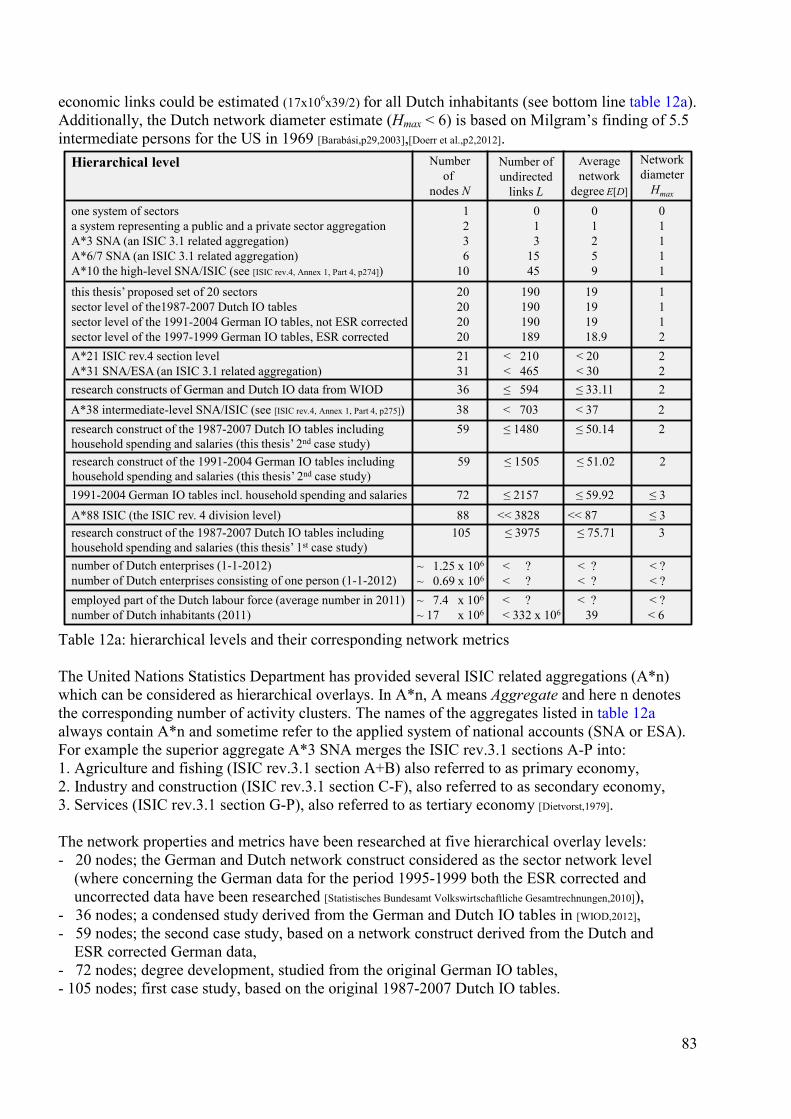
economic links could be estimated (17x106x39/2) for all Dutch inhabitants (see bottom line table 12a). Additionally, the Dutch network diameter estimate (Hmax < 6) is based on Milgram’s finding of 5.5 intermediate persons for the US in 1969 [Barabási,p29,2003],[Doerr et al.,p2,2012].
Table 12a: hierarchical levels and their corresponding network metrics The United Nations Statistics Department has provided several ISIC related aggregations (A*n) which can be considered as hierarchical overlays. In A*n, A means Aggregate and here n denotes the corresponding number of activity clusters. The names of the aggregates listed in table 12a always contain A*n and sometime refer to the applied system of national accounts (SNA or ESA). For example the superior aggregate A*3 SNA merges the ISIC rev.3.1 sections A-P into: 1. Agriculture and fishing (ISIC rev.3.1 section A+B) also referred to as primary economy, 2. Industry and construction (ISIC rev.3.1 section C-F), also referred to as secondary economy, 3. Services (ISIC rev.3.1 section G-P), also referred to as tertiary economy [Dietvorst,1979]. The network properties and metrics have been researched at five hierarchical overlay levels: - 20 nodes; the German and Dutch network construct considered as the sector network level (where concerning the German data for the period 1995-1999 both the ESR corrected and uncorrected data have been researched [Statistisches Bundesamt Volkswirtschaftliche Gesamtrechnungen,2010]), - 36 nodes; a condensed study derived from the German and Dutch IO tables in [WIOD,2012], - 59 nodes; the second case study, based on a network construct derived from the Dutch and ESR corrected German data, - 72 nodes; degree development, studied from the original German IO tables, - 105 nodes; first case study, based on the original 1987-2007 Dutch IO tables.
Numberof
nodes N
Number ofundirected
links L
Networkdiameter
Hmax
one system of sectors 1 0 0 0a system representing a public and a private sector aggregation 2 1 1 1A*3 SNA (an ISIC 3.1 related aggregation) 3 3 2 1A*6/7 SNA (an ISIC 3.1 related aggregation) 6 15 5 1A*10 the high-level SNA/ISIC (see [ISIC rev.4, Annex 1, Part 4, p274]) 10 45 9 1
Hierarchical level
number of Dutch enterprises (1-1-2012)number of Dutch enterprises consisting of one person (1-1-2012)employed part of the Dutch labour force (average number in 2011)number of Dutch inhabitants (2011)
Averagenetwork
degree E[D]
research construct of the 1987-2007 Dutch IO tables including 105 ≤ 3975 ≤ 75.71 3 household spending and salaries (this thesis’ 1st case study)
A*88 ISIC (the ISIC rev. 4 division level) 88 << 3828 << 87 ≤ 31991-2004 German IO tables incl. household spending and salaries 72 ≤ 2157 ≤ 59.92 ≤ 3
research construct of the 1991-2004 German IO tables including 59 ≤ 1505 ≤ 51.02 2household spending and salaries (this thesis’ 2nd case study)
research construct of the 1987-2007 Dutch IO tables including 59 ≤ 1480 ≤ 50.14 2household spending and salaries (this thesis’ 2nd case study)
A*21 ISIC rev.4 section level 21 < 210 < 20 2A*31 SNA/ESA (an ISIC 3.1 related aggregation) 31 < 465 < 30 2
this thesis’ proposed set of 20 sectors 20 190 19 1sector level of the1987-2007 Dutch IO tables 20 190 19 1sector level of the 1991-2004 German IO tables, not ESR corrected 20 190 19 1sector level of the 1997-1999 German IO tables, ESR corrected 20 189 18.9 2
~ 1.25 x 10⁶ < ? < ? < ?~ 0.69 x 10⁶ < ? < ? < ?~ 7.4 x 10⁶ < ? < ? < ?~ 17 x 106 < 332 x 106 39 < 6
A*38 intermediate-level SNA/ISIC (see [ISIC rev.4, Annex 1, Part 4, p275]) 38 < 703 < 37 2research constructs of German and Dutch IO data from WIOD 36 ≤ 594 ≤ 33.11 2
83
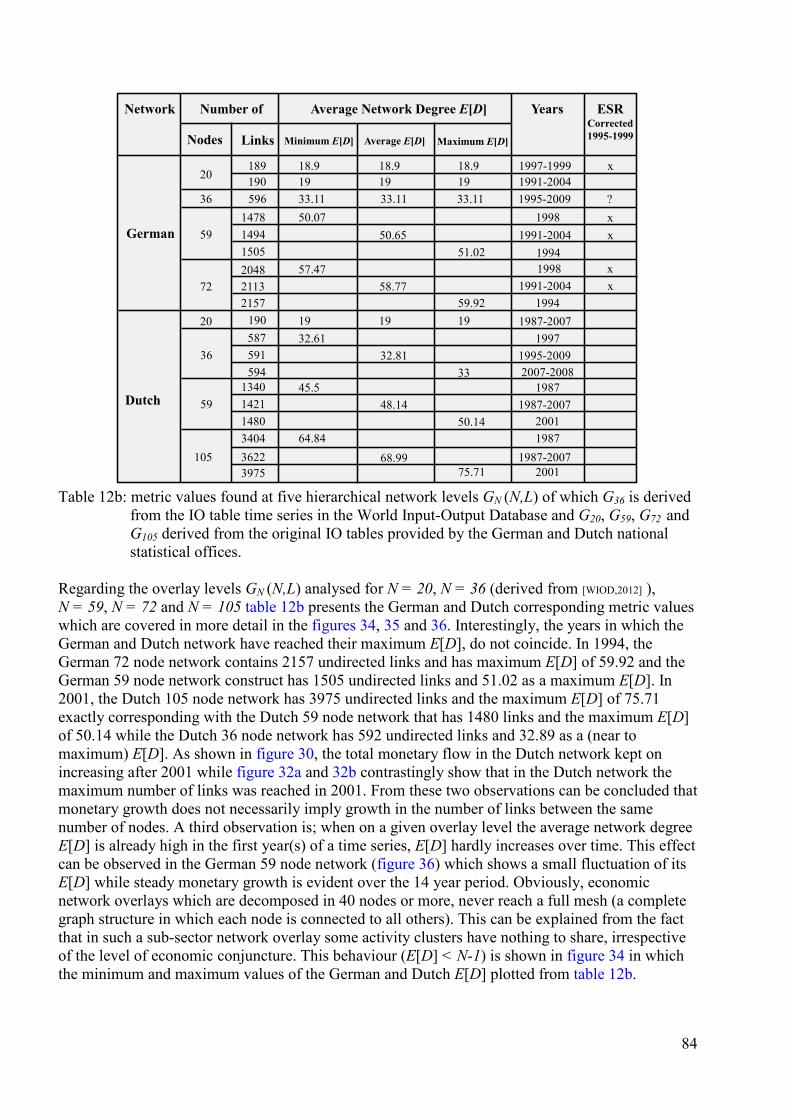
Table 12b: metric values found at five hierarchical network levels GN (N,L) of which G36 is derived from the IO table time series in the World Input-Output Database and G20, G59, G72 and G105 derived from the original IO tables provided by the German and Dutch national statistical offices. Regarding the overlay levels GN (N,L) analysed for N = 20, N = 36 (derived from [WIOD,2012] ), N = 59, N = 72 and N = 105 table 12b presents the German and Dutch corresponding metric values which are covered in more detail in the figures 34, 35 and 36. Interestingly, the years in which the German and Dutch network have reached their maximum E[D], do not coincide. In 1994, the German 72 node network contains 2157 undirected links and has maximum E[D] of 59.92 and the German 59 node network construct has 1505 undirected links and 51.02 as a maximum E[D]. In 2001, the Dutch 105 node network has 3975 undirected links and the maximum E[D] of 75.71 exactly corresponding with the Dutch 59 node network that has 1480 links and the maximum E[D] of 50.14 while the Dutch 36 node network has 592 undirected links and 32.89 as a (near to maximum) E[D]. As shown in figure 30, the total monetary flow in the Dutch network kept on increasing after 2001 while figure 32a and 32b contrastingly show that in the Dutch network the maximum number of links was reached in 2001. From these two observations can be concluded that monetary growth does not necessarily imply growth in the number of links between the same number of nodes. A third observation is; when on a given overlay level the average network degree E[D] is already high in the first year(s) of a time series, E[D] hardly increases over time. This effect can be observed in the German 59 node network (figure 36) which shows a small fluctuation of its E[D] while steady monetary growth is evident over the 14 year period. Obviously, economic network overlays which are decomposed in 40 nodes or more, never reach a full mesh (a complete graph structure in which each node is connected to all others). This can be explained from the fact that in such a sub-sector network overlay some activity clusters have nothing to share, irrespective of the level of economic conjuncture. This behaviour (E[D] < N-1) is shown in figure 34 in which the minimum and maximum values of the German and Dutch E[D] plotted from table 12b.
Average Network Degree E[D]Number of
Average E[D]Minimum E[D] Maximum E[D]
German
Dutch
Years
1998
20
59
20
Network
105
59
19
50.07
64.84
50.6551.02 1994
1997-1999 x18.9
200175.71
1987
45.5 198748.14
1991-2004 x
1987-2007
1987-2007
1987-200768.99
50.14 2001
Nodes Links
189
190
1478
1505
1340
14803404
39753622
1494
1421
722048
21572113
57.4758.77
59.92
1998
19941991-2004 x
18.918.9
1919
ESRCorrected1995-1999
1991-200419190 191936 596 33.11 33.11 33.11 1995-2009 ?
3632.61 1997
32.81 1995-200933 2007-2008
587
594591
x
x
84
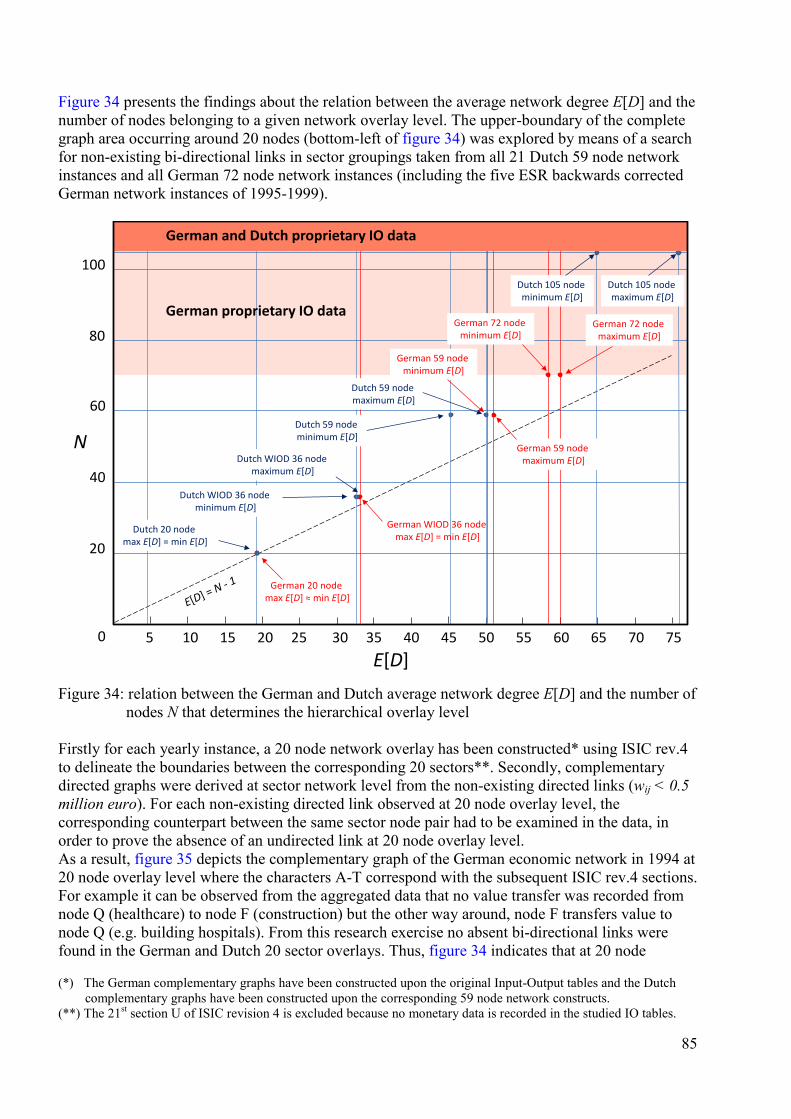
Figure 34 presents the findings about the relation between the average network degree E[D] and the number of nodes belonging to a given network overlay level. The upper-boundary of the complete graph area occurring around 20 nodes (bottom-left of figure 34) was explored by means of a search for non-existing bi-directional links in sector groupings taken from all 21 Dutch 59 node network instances and all German 72 node network instances (including the five ESR backwards corrected German network instances of 1995-1999).
Figure 34: relation between the German and Dutch average network degree E[D] and the number of nodes N that determines the hierarchical overlay level
Firstly for each yearly instance, a 20 node network overlay has been constructed* using ISIC rev.4 to delineate the boundaries between the corresponding 20 sectors**. Secondly, complementary directed graphs were derived at sector network level from the non-existing directed links (wij < 0.5 million euro). For each non-existing directed link observed at 20 node overlay level, the corresponding counterpart between the same sector node pair had to be examined in the data, in order to prove the absence of an undirected link at 20 node overlay level. As a result, figure 35 depicts the complementary graph of the German economic network in 1994 at 20 node overlay level where the characters A-T correspond with the subsequent ISIC rev.4 sections. For example it can be observed from the aggregated data that no value transfer was recorded from node Q (healthcare) to node F (construction) but the other way around, node F transfers value to node Q (e.g. building hospitals). From this research exercise no absent bi-directional links were found in the German and Dutch 20 sector overlays. Thus, figure 34 indicates that at 20 node (*) The German complementary graphs have been constructed upon the original Input-Output tables and the Dutch complementary graphs have been constructed upon the corresponding 59 node network constructs. (**) The 21st section U of ISIC revision 4 is excluded because no monetary data is recorded in the studied IO tables.
N
5 10 15 20 25 30 35 40 45 50 55 60 65 70 750
100
20
40
60
80
German proprietary IO data
Dutch 105 nodemaximum E[D]
German 59 nodeminimum E[D]
German 59 nodemaximum E[D]
German 72 nodemaximum E[D]
German 72 nodeminimum E[D]
Dutch 105 nodeminimum E[D]
E[D]
Dutch WIOD 36 nodeminimum E[D]
German WIOD 36 nodemax E[D] = min E[D]
German and Dutch proprietary IO data
Dutch 59 nodeminimum E[D]
Dutch 59 nodemaximum E[D]
Dutch 20 nodemax E[D] = min E[D]
German 20 nodemax E[D] ≈ min E[D]
Dutch WIOD 36 nodemaximum E[D]
85
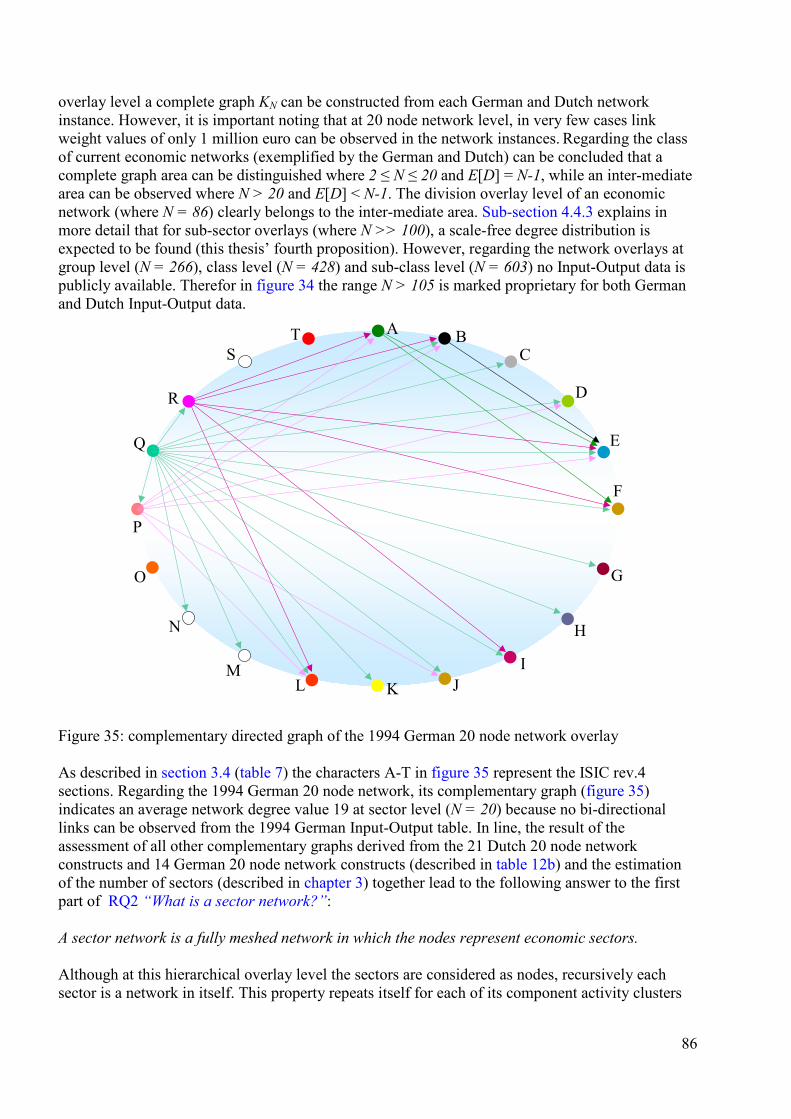
overlay level a complete graph KN can be constructed from each German and Dutch network instance. However, it is important noting that at 20 node network level, in very few cases link weight values of only 1 million euro can be observed in the network instances. Regarding the class of current economic networks (exemplified by the German and Dutch) can be concluded that a complete graph area can be distinguished where 2 ≤ N ≤ 20 and E[D] = N-1, while an inter-mediate area can be observed where N > 20 and E[D] < N-1. The division overlay level of an economic network (where N = 86) clearly belongs to the inter-mediate area. Sub-section 4.4.3 explains in more detail that for sub-sector overlays (where N >> 100), a scale-free degree distribution is expected to be found (this thesis’ fourth proposition). However, regarding the network overlays at group level (N = 266), class level (N = 428) and sub-class level (N = 603) no Input-Output data is publicly available. Therefor in figure 34 the range N > 105 is marked proprietary for both German and Dutch Input-Output data.
Figure 35: complementary directed graph of the 1994 German 20 node network overlay As described in section 3.4 (table 7) the characters A-T in figure 35 represent the ISIC rev.4 sections. Regarding the 1994 German 20 node network, its complementary graph (figure 35) indicates an average network degree value 19 at sector level (N = 20) because no bi-directional links can be observed from the 1994 German Input-Output table. In line, the result of the assessment of all other complementary graphs derived from the 21 Dutch 20 node network constructs and 14 German 20 node network constructs (described in table 12b) and the estimation of the number of sectors (described in chapter 3) together lead to the following answer to the first part of RQ2 “What is a sector network?”: A sector network is a fully meshed network in which the nodes represent economic sectors. Although at this hierarchical overlay level the sectors are considered as nodes, recursively each sector is a network in itself. This property repeats itself for each of its component activity clusters
BC
D
E
F
G
H
IJKL
M
N
O
P
Q
R
ST A
86
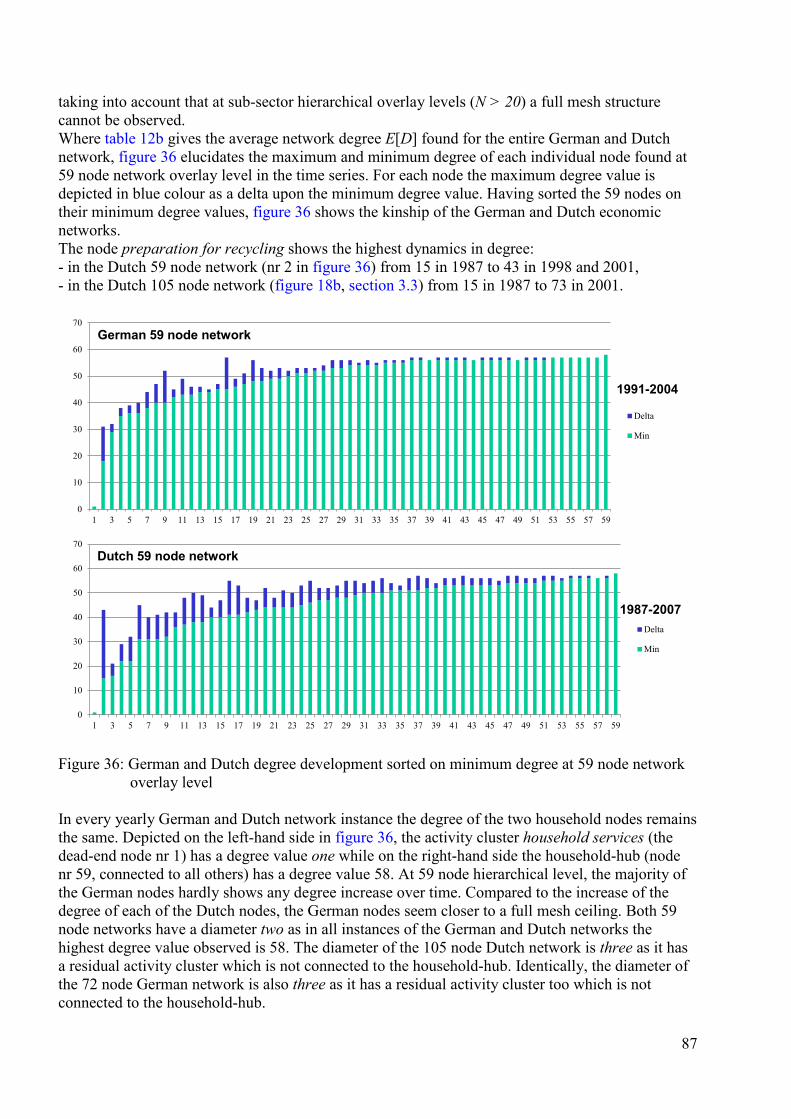
taking into account that at sub-sector hierarchical overlay levels (N > 20) a full mesh structure cannot be observed. Where table 12b gives the average network degree E[D] found for the entire German and Dutch network, figure 36 elucidates the maximum and minimum degree of each individual node found at 59 node network overlay level in the time series. For each node the maximum degree value is depicted in blue colour as a delta upon the minimum degree value. Having sorted the 59 nodes on their minimum degree values, figure 36 shows the kinship of the German and Dutch economic networks. The node preparation for recycling shows the highest dynamics in degree: - in the Dutch 59 node network (nr 2 in figure 36) from 15 in 1987 to 43 in 1998 and 2001, - in the Dutch 105 node network (figure 18b, section 3.3) from 15 in 1987 to 73 in 2001.
Figure 36: German and Dutch degree development sorted on minimum degree at 59 node network overlay level In every yearly German and Dutch network instance the degree of the two household nodes remains the same. Depicted on the left-hand side in figure 36, the activity cluster household services (the dead-end node nr 1) has a degree value one while on the right-hand side the household-hub (node nr 59, connected to all others) has a degree value 58. At 59 node hierarchical level, the majority of the German nodes hardly shows any degree increase over time. Compared to the increase of the degree of each of the Dutch nodes, the German nodes seem closer to a full mesh ceiling. Both 59 node networks have a diameter two as in all instances of the German and Dutch networks the highest degree value observed is 58. The diameter of the 105 node Dutch network is three as it has a residual activity cluster which is not connected to the household-hub. Identically, the diameter of the 72 node German network is also three as it has a residual activity cluster too which is not connected to the household-hub.
German 59 node network
0
10
20
30
40
50
60
70
1 3 5 7 9 11 13 15 17 19 21 23 25 27 29 31 33 35 37 39 41 43 45 47 49 51 53 55 57 59
Delta
Min
0
10
20
30
40
50
60
70
1 3 5 7 9 11 13 15 17 19 21 23 25 27 29 31 33 35 37 39 41 43 45 47 49 51 53 55 57 59
Delta
Min
1991-2004
1987-2007
Dutch 59 node network
87
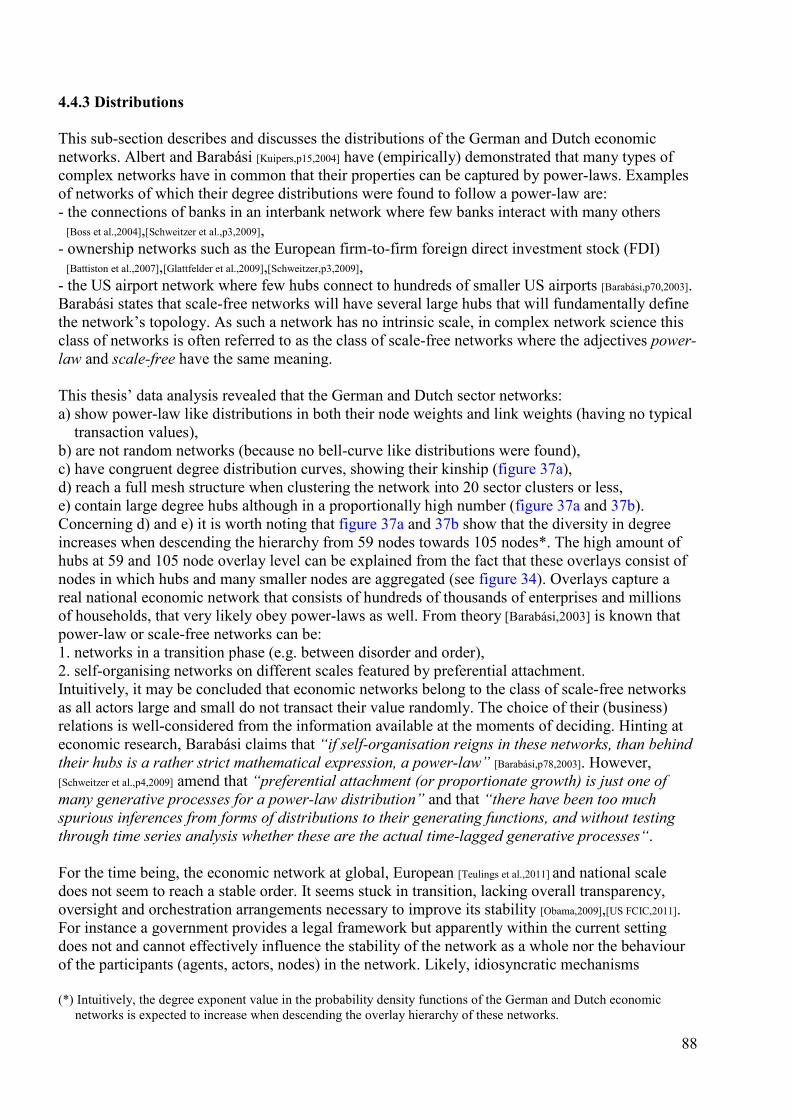
4.4.3 Distributions This sub-section describes and discusses the distributions of the German and Dutch economic networks. Albert and Barabási [Kuipers,p15,2004] have (empirically) demonstrated that many types of complex networks have in common that their properties can be captured by power-laws. Examples of networks of which their degree distributions were found to follow a power-law are: - the connections of banks in an interbank network where few banks interact with many others [Boss et al.,2004],[Schweitzer et al.,p3,2009], - ownership networks such as the European firm-to-firm foreign direct investment stock (FDI)
[Battiston et al.,2007],[Glattfelder et al.,2009],[Schweitzer,p3,2009], - the US airport network where few hubs connect to hundreds of smaller US airports [Barabási,p70,2003]. Barabási states that scale-free networks will have several large hubs that will fundamentally define the network’s topology. As such a network has no intrinsic scale, in complex network science this class of networks is often referred to as the class of scale-free networks where the adjectives power- law and scale-free have the same meaning. This thesis’ data analysis revealed that the German and Dutch sector networks: a) show power-law like distributions in both their node weights and link weights (having no typical transaction values), b) are not random networks (because no bell-curve like distributions were found), c) have congruent degree distribution curves, showing their kinship (figure 37a), d) reach a full mesh structure when clustering the network into 20 sector clusters or less, e) contain large degree hubs although in a proportionally high number (figure 37a and 37b). Concerning d) and e) it is worth noting that figure 37a and 37b show that the diversity in degree increases when descending the hierarchy from 59 nodes towards 105 nodes*. The high amount of hubs at 59 and 105 node overlay level can be explained from the fact that these overlays consist of nodes in which hubs and many smaller nodes are aggregated (see figure 34). Overlays capture a real national economic network that consists of hundreds of thousands of enterprises and millions of households, that very likely obey power-laws as well. From theory [Barabási,2003] is known that power-law or scale-free networks can be: 1. networks in a transition phase (e.g. between disorder and order), 2. self-organising networks on different scales featured by preferential attachment. Intuitively, it may be concluded that economic networks belong to the class of scale-free networks as all actors large and small do not transact their value randomly. The choice of their (business) relations is well-considered from the information available at the moments of deciding. Hinting at economic research, Barabási claims that “if self-organisation reigns in these networks, than behind their hubs is a rather strict mathematical expression, a power-law” [Barabási,p78,2003]. However, [Schweitzer et al.,p4,2009] amend that “preferential attachment (or proportionate growth) is just one of many generative processes for a power-law distribution” and that “there have been too much spurious inferences from forms of distributions to their generating functions, and without testing through time series analysis whether these are the actual time-lagged generative processes“. For the time being, the economic network at global, European [Teulings et al.,2011] and national scale does not seem to reach a stable order. It seems stuck in transition, lacking overall transparency, oversight and orchestration arrangements necessary to improve its stability [Obama,2009],[US FCIC,2011]. For instance a government provides a legal framework but apparently within the current setting does not and cannot effectively influence the stability of the network as a whole nor the behaviour of the participants (agents, actors, nodes) in the network. Likely, idiosyncratic mechanisms (*) Intuitively, the degree exponent value in the probability density functions of the German and Dutch economic networks is expected to increase when descending the overlay hierarchy of these networks.
88
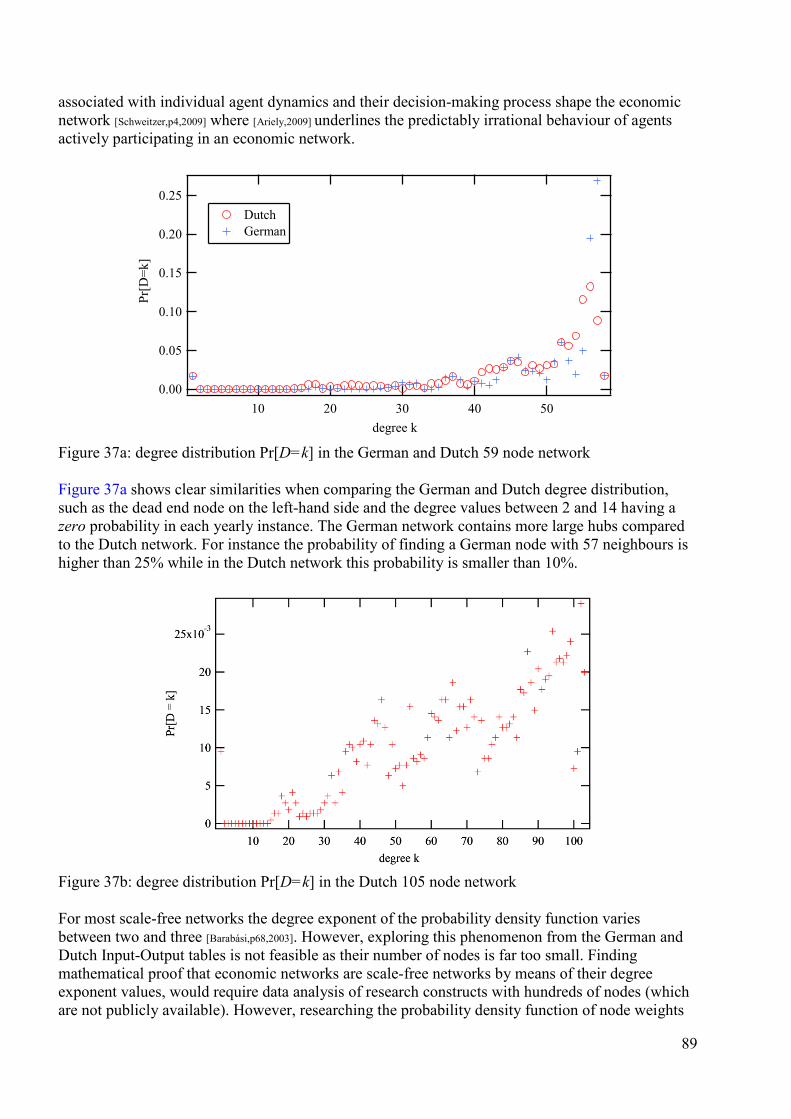
associated with individual agent dynamics and their decision-making process shape the economic network [Schweitzer,p4,2009] where [Ariely,2009] underlines the predictably irrational behaviour of agents actively participating in an economic network.
Figure 37a: degree distribution Pr[D=k] in the German and Dutch 59 node network Figure 37a shows clear similarities when comparing the German and Dutch degree distribution, such as the dead end node on the left-hand side and the degree values between 2 and 14 having a zero probability in each yearly instance. The German network contains more large hubs compared to the Dutch network. For instance the probability of finding a German node with 57 neighbours is higher than 25% while in the Dutch network this probability is smaller than 10%.
Figure 37b: degree distribution Pr[D=k] in the Dutch 105 node network For most scale-free networks the degree exponent of the probability density function varies between two and three [Barabási,p68,2003]. However, exploring this phenomenon from the German and Dutch Input-Output tables is not feasible as their number of nodes is far too small. Finding mathematical proof that economic networks are scale-free networks by means of their degree exponent values, would require data analysis of research constructs with hundreds of nodes (which are not publicly available). However, researching the probability density function of node weights
0.25
0.20
0.15
0.10
0.05
0.00
Pr[D
=k]
5040302010degree k
Dutch German
89
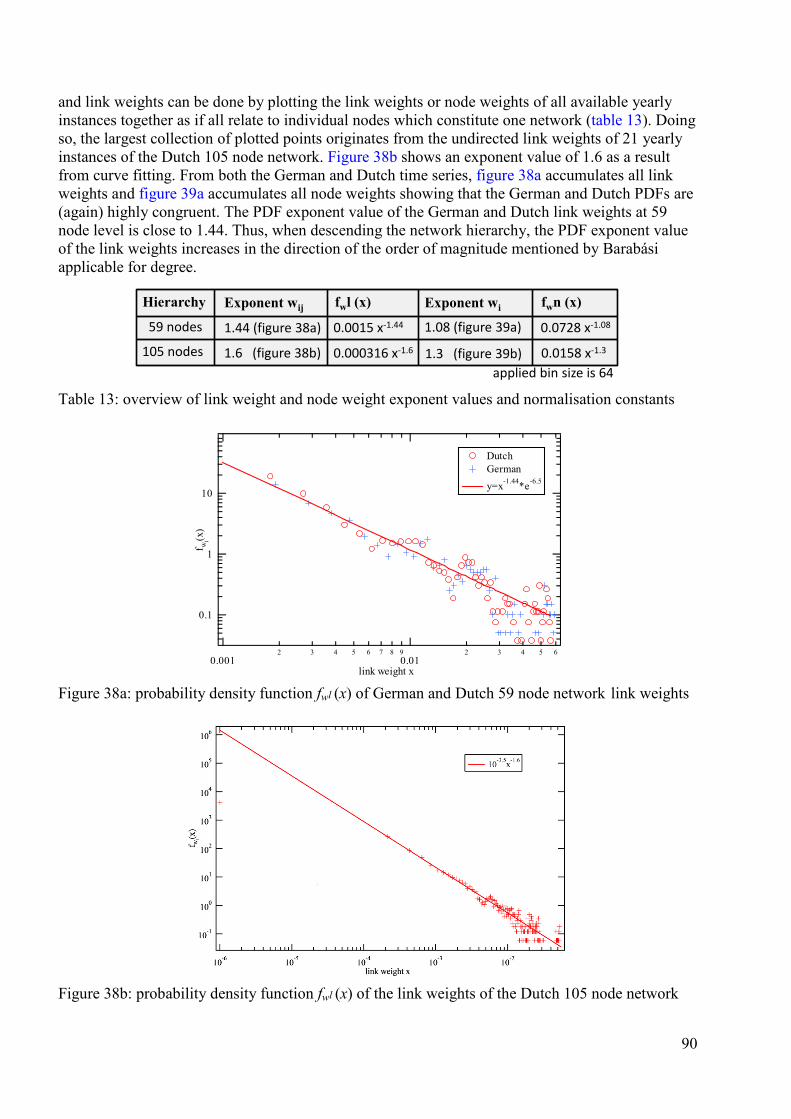
and link weights can be done by plotting the link weights or node weights of all available yearly instances together as if all relate to individual nodes which constitute one network (table 13). Doing so, the largest collection of plotted points originates from the undirected link weights of 21 yearly instances of the Dutch 105 node network. Figure 38b shows an exponent value of 1.6 as a result from curve fitting. From both the German and Dutch time series, figure 38a accumulates all link weights and figure 39a accumulates all node weights showing that the German and Dutch PDFs are (again) highly congruent. The PDF exponent value of the German and Dutch link weights at 59 node level is close to 1.44. Thus, when descending the network hierarchy, the PDF exponent value of the link weights increases in the direction of the order of magnitude mentioned by Barabási applicable for degree.
Table 13: overview of link weight and node weight exponent values and normalisation constants
Figure 38a: probability density function fwl (x) of German and Dutch 59 node network link weights
Figure 38b: probability density function fwl (x) of the link weights of the Dutch 105 node network
Hierarchy Exponent wij fwl (x) Exponent wi fwn (x)
59 nodes 1.44 (figure 38a)
105 nodes 1.3 (figure 39b)
1.08 (figure 39a)
1.6 (figure 38b)
0.0015 x-1.44
0.000316 x-1.6
0.0728 x-1.08
applied bin size is 640.0158 x-1.3
0.1
1
10
f wl(x
)
0.0012 3 4 5 6 7 8 9
0.012 3 4 5 6
link weight x
Dutch German y=x-1.44*e-6.5
90
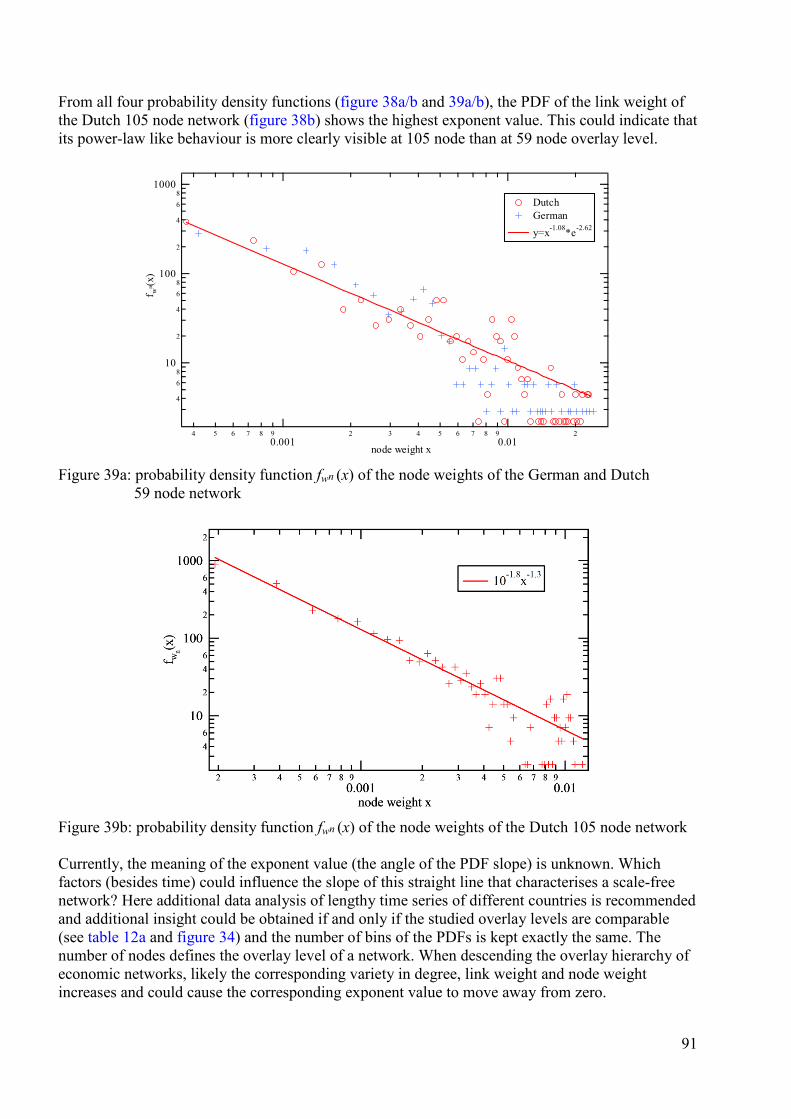
From all four probability density functions (figure 38a/b and 39a/b), the PDF of the link weight of the Dutch 105 node network (figure 38b) shows the highest exponent value. This could indicate that its power-law like behaviour is more clearly visible at 105 node than at 59 node overlay level.
Figure 39a: probability density function fwn (x) of the node weights of the German and Dutch 59 node network
Figure 39b: probability density function fwn (x) of the node weights of the Dutch 105 node network Currently, the meaning of the exponent value (the angle of the PDF slope) is unknown. Which factors (besides time) could influence the slope of this straight line that characterises a scale-free network? Here additional data analysis of lengthy time series of different countries is recommended and additional insight could be obtained if and only if the studied overlay levels are comparable (see table 12a and figure 34) and the number of bins of the PDFs is kept exactly the same. The number of nodes defines the overlay level of a network. When descending the overlay hierarchy of economic networks, likely the corresponding variety in degree, link weight and node weight increases and could cause the corresponding exponent value to move away from zero.
4
68
10
2
4
68
100
2
4
68
1000
f wn (x
)
4 5 6 7 8 90.001
2 3 4 5 6 7 8 90.01
2
node weight x
Dutch German y=x-1.08*e-2.62
91
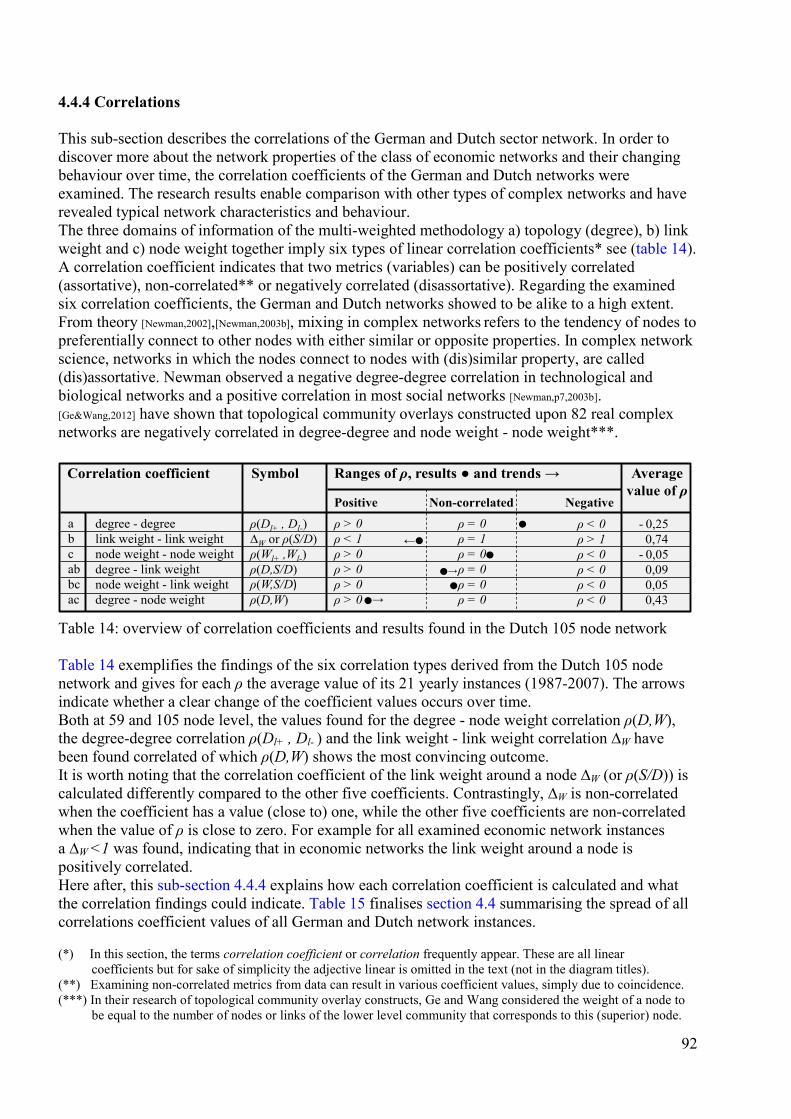
4.4.4 Correlations This sub-section describes the correlations of the German and Dutch sector network. In order to discover more about the network properties of the class of economic networks and their changing behaviour over time, the correlation coefficients of the German and Dutch networks were examined. The research results enable comparison with other types of complex networks and have revealed typical network characteristics and behaviour. The three domains of information of the multi-weighted methodology a) topology (degree), b) link weight and c) node weight together imply six types of linear correlation coefficients* see (table 14). A correlation coefficient indicates that two metrics (variables) can be positively correlated (assortative), non-correlated** or negatively correlated (disassortative). Regarding the examined six correlation coefficients, the German and Dutch networks showed to be alike to a high extent. From theory [Newman,2002],[Newman,2003b], mixing in complex networks refers to the tendency of nodes to preferentially connect to other nodes with either similar or opposite properties. In complex network science, networks in which the nodes connect to nodes with (dis)similar property, are called (dis)assortative. Newman observed a negative degree-degree correlation in technological and biological networks and a positive correlation in most social networks [Newman,p7,2003b]. [Ge&Wang,2012] have shown that topological community overlays constructed upon 82 real complex networks are negatively correlated in degree-degree and node weight - node weight***.
Table 14: overview of correlation coefficients and results found in the Dutch 105 node network Table 14 exemplifies the findings of the six correlation types derived from the Dutch 105 node network and gives for each ρ the average value of its 21 yearly instances (1987-2007). The arrows indicate whether a clear change of the coefficient values occurs over time. Both at 59 and 105 node level, the values found for the degree - node weight correlation ρ(D,W), the degree-degree correlation ρ(Dl+ , Dl- ) and the link weight - link weight correlation ∆W have been found correlated of which ρ(D,W) shows the most convincing outcome. It is worth noting that the correlation coefficient of the link weight around a node ∆W (or ρ(S/D)) is calculated differently compared to the other five coefficients. Contrastingly, ∆W is non-correlated when the coefficient has a value (close to) one, while the other five coefficients are non-correlated when the value of ρ is close to zero. For example for all examined economic network instances a ∆W <1 was found, indicating that in economic networks the link weight around a node is positively correlated. Here after, this sub-section 4.4.4 explains how each correlation coefficient is calculated and what the correlation findings could indicate. Table 15 finalises section 4.4 summarising the spread of all correlations coefficient values of all German and Dutch network instances. (*) In this section, the terms correlation coefficient or correlation frequently appear. These are all linear coefficients but for sake of simplicity the adjective linear is omitted in the text (not in the diagram titles). (**) Examining non-correlated metrics from data can result in various coefficient values, simply due to coincidence. (***) In their research of topological community overlay constructs, Ge and Wang considered the weight of a node to be equal to the number of nodes or links of the lower level community that corresponds to this (superior) node.
SymbolCorrelation coefficient
abcabbcac
Positive Non-correlated Negative degree - degreelink weight - link weightnode weight - node weightdegree - link weightnode weight - link weightdegree - node weight
ρ(Dl+ , Dl-) ∆W or ρ(S/D) ρ(Wl+ ,Wl-)ρ(D,S/D) ρ(W,S/D)ρ(D,W)
ρ > 0ρ < 1ρ > 0ρ > 0ρ > 0ρ > 0
ρ = 0ρ = 1ρ = 0ρ = 0ρ = 0ρ = 0
Ranges of ρ, results ● and trends → Averagevalue of ρ
ρ < 0ρ > 1ρ < 0ρ < 0ρ < 0ρ < 0
- 0,250,74
- 0,050,090,050,43
●
●●→
●→●
●←
92
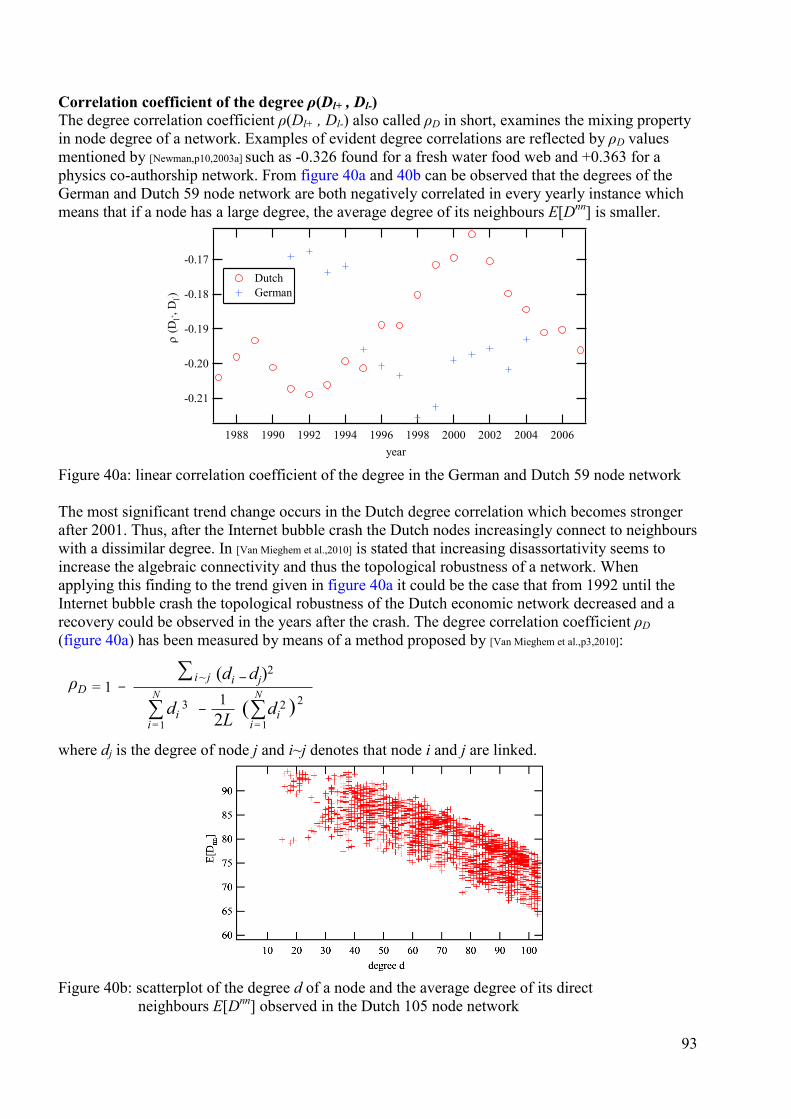
Correlation coefficient of the degree ρ(Dl+ , Dl-) The degree correlation coefficient ρ(Dl+ , Dl-) also called ρD in short, examines the mixing property in node degree of a network. Examples of evident degree correlations are reflected by ρD values mentioned by [Newman,p10,2003a] such as -0.326 found for a fresh water food web and +0.363 for a physics co-authorship network. From figure 40a and 40b can be observed that the degrees of the German and Dutch 59 node network are both negatively correlated in every yearly instance which means that if a node has a large degree, the average degree of its neighbours E[Dnn] is smaller.
Figure 40a: linear correlation coefficient of the degree in the German and Dutch 59 node network The most significant trend change occurs in the Dutch degree correlation which becomes stronger after 2001. Thus, after the Internet bubble crash the Dutch nodes increasingly connect to neighbours with a dissimilar degree. In [Van Mieghem et al.,2010] is stated that increasing disassortativity seems to increase the algebraic connectivity and thus the topological robustness of a network. When applying this finding to the trend given in figure 40a it could be the case that from 1992 until the Internet bubble crash the topological robustness of the Dutch economic network decreased and a recovery could be observed in the years after the crash. The degree correlation coefficient ρD (figure 40a) has been measured by means of a method proposed by [Van Mieghem et al.,p3,2010]:
where dj is the degree of node j and i~j denotes that node i and j are linked.
Figure 40b: scatterplot of the degree d of a node and the average degree of its direct neighbours E[Dnn] observed in the Dutch 105 node network
-0.21
-0.20
-0.19
-0.18
-0.17
ρ (D
l+ , D
l- )
2006200420022000199819961994199219901988year
Dutch German
ρD
2Ldi 3
∑= 1
i ~ j (di __ dj)2
∑ _ 1 di2(∑
N
i = 1)2N
i = 1
93
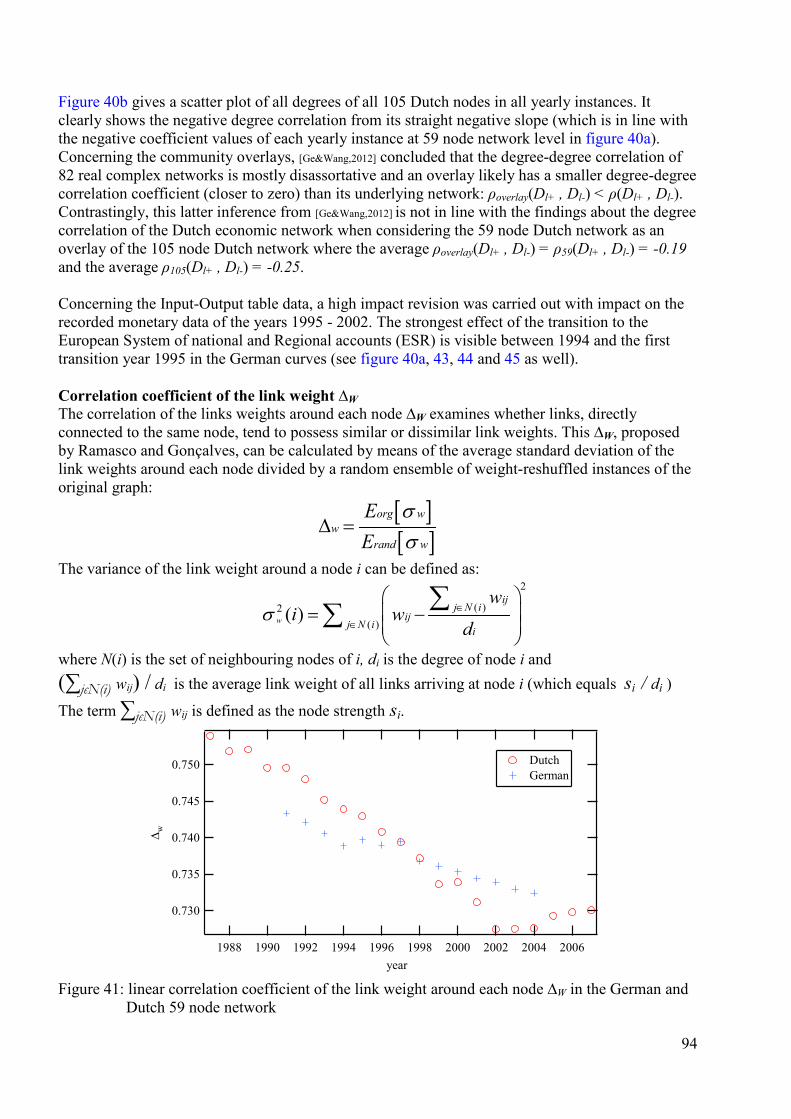
Figure 40b gives a scatter plot of all degrees of all 105 Dutch nodes in all yearly instances. It clearly shows the negative degree correlation from its straight negative slope (which is in line with the negative coefficient values of each yearly instance at 59 node network level in figure 40a). Concerning the community overlays, [Ge&Wang,2012] concluded that the degree-degree correlation of 82 real complex networks is mostly disassortative and an overlay likely has a smaller degree-degree correlation coefficient (closer to zero) than its underlying network: ρoverlay(Dl+ , Dl-) < ρ(Dl+ , Dl-). Contrastingly, this latter inference from [Ge&Wang,2012] is not in line with the findings about the degree correlation of the Dutch economic network when considering the 59 node Dutch network as an overlay of the 105 node Dutch network where the average ρoverlay(Dl+ , Dl-) = ρ59(Dl+ , Dl-) = -0.19 and the average ρ105(Dl+ , Dl-) = -0.25. Concerning the Input-Output table data, a high impact revision was carried out with impact on the recorded monetary data of the years 1995 - 2002. The strongest effect of the transition to the European System of national and Regional accounts (ESR) is visible between 1994 and the first transition year 1995 in the German curves (see figure 40a, 43, 44 and 45 as well). Correlation coefficient of the link weight ∆W The correlation of the links weights around each node ∆W examines whether links, directly connected to the same node, tend to possess similar or dissimilar link weights. This ∆W, proposed by Ramasco and Gonçalves, can be calculated by means of the average standard deviation of the link weights around each node divided by a random ensemble of weight-reshuffled instances of the original graph:
[ ][ ]
org ww
rand w
EE
σσ
∆ =
The variance of the link weight around a node i can be defined as: 2
( )2( )
( )w
ijj N i
ijj N i i
wi w
dσ ∈
∈
= −
∑∑
where N(i) is the set of neighbouring nodes of i, di is the degree of node i and (∑jєN(i) wij) / di is the average link weight of all links arriving at node i (which equals si / di )
The term ∑jєN(i) wij is defined as the node strength si.
Figure 41: linear correlation coefficient of the link weight around each node ∆W in the German and Dutch 59 node network
0.750
0.745
0.740
0.735
0.730
∆w
2006200420022000199819961994199219901988year
Dutch German
94
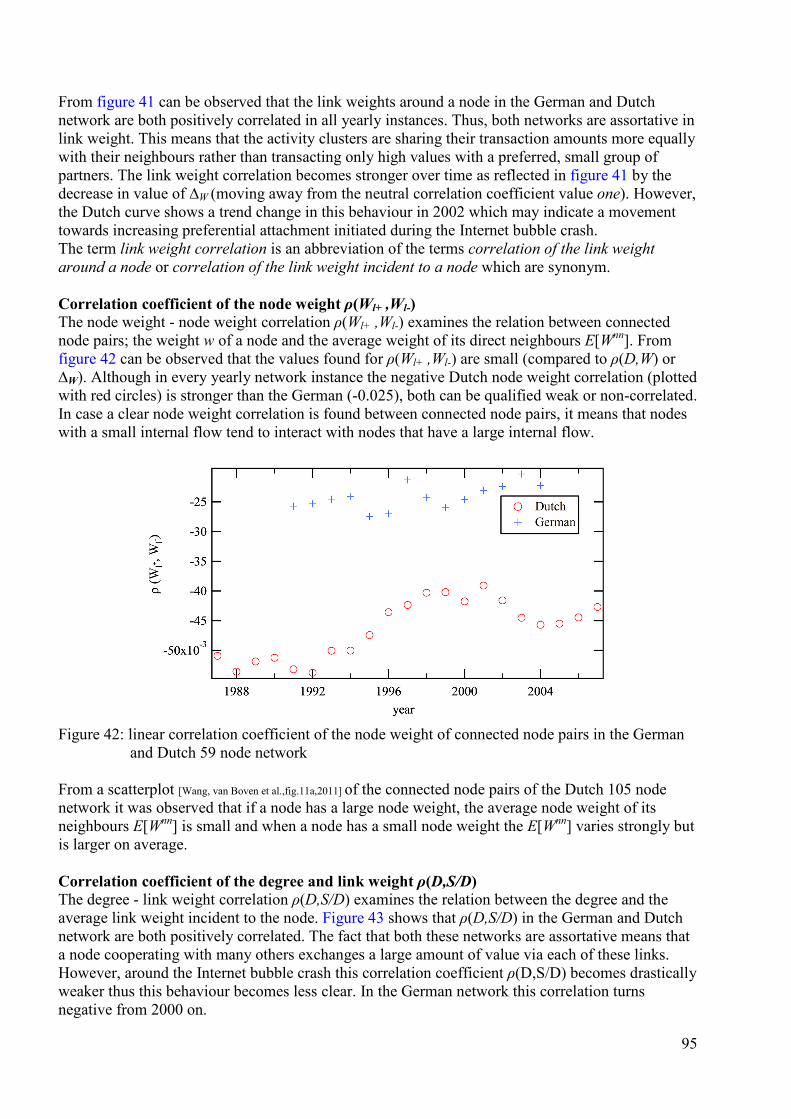
From figure 41 can be observed that the link weights around a node in the German and Dutch network are both positively correlated in all yearly instances. Thus, both networks are assortative in link weight. This means that the activity clusters are sharing their transaction amounts more equally with their neighbours rather than transacting only high values with a preferred, small group of partners. The link weight correlation becomes stronger over time as reflected in figure 41 by the decrease in value of ∆W (moving away from the neutral correlation coefficient value one). However, the Dutch curve shows a trend change in this behaviour in 2002 which may indicate a movement towards increasing preferential attachment initiated during the Internet bubble crash. The term link weight correlation is an abbreviation of the terms correlation of the link weight around a node or correlation of the link weight incident to a node which are synonym. Correlation coefficient of the node weight ρ(Wl+ ,Wl-) The node weight - node weight correlation ρ(Wl+ ,Wl-) examines the relation between connected node pairs; the weight w of a node and the average weight of its direct neighbours E[Wnn]. From figure 42 can be observed that the values found for ρ(Wl+ ,Wl-) are small (compared to ρ(D,W) or ∆W). Although in every yearly network instance the negative Dutch node weight correlation (plotted with red circles) is stronger than the German (-0.025), both can be qualified weak or non-correlated. In case a clear node weight correlation is found between connected node pairs, it means that nodes with a small internal flow tend to interact with nodes that have a large internal flow.
Figure 42: linear correlation coefficient of the node weight of connected node pairs in the German and Dutch 59 node network From a scatterplot [Wang, van Boven et al.,fig.11a,2011] of the connected node pairs of the Dutch 105 node network it was observed that if a node has a large node weight, the average node weight of its neighbours E[Wnn] is small and when a node has a small node weight the E[Wnn] varies strongly but is larger on average. Correlation coefficient of the degree and link weight ρ(D,S/D) The degree - link weight correlation ρ(D,S/D) examines the relation between the degree and the average link weight incident to the node. Figure 43 shows that ρ(D,S/D) in the German and Dutch network are both positively correlated. The fact that both these networks are assortative means that a node cooperating with many others exchanges a large amount of value via each of these links. However, around the Internet bubble crash this correlation coefficient ρ(D,S/D) becomes drastically weaker thus this behaviour becomes less clear. In the German network this correlation turns negative from 2000 on.
95
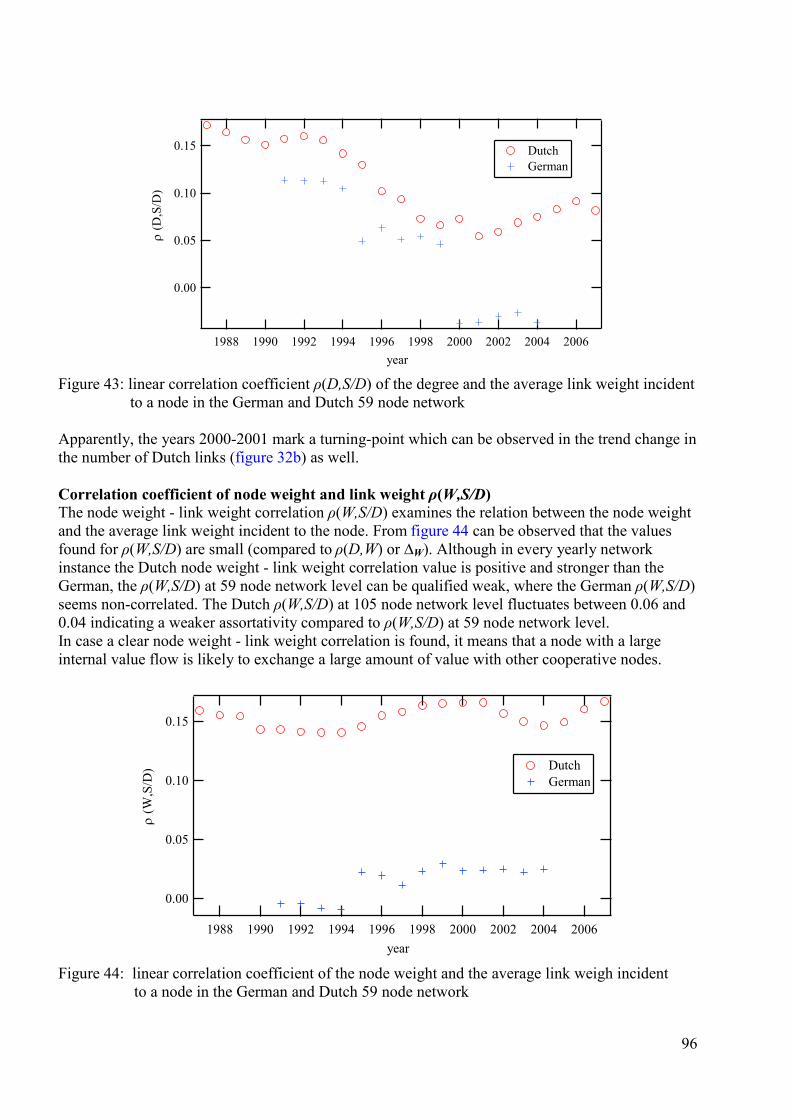
Figure 43: linear correlation coefficient ρ(D,S/D) of the degree and the average link weight incident to a node in the German and Dutch 59 node network Apparently, the years 2000-2001 mark a turning-point which can be observed in the trend change in the number of Dutch links (figure 32b) as well. Correlation coefficient of node weight and link weight ρ(W,S/D) The node weight - link weight correlation ρ(W,S/D) examines the relation between the node weight and the average link weight incident to the node. From figure 44 can be observed that the values found for ρ(W,S/D) are small (compared to ρ(D,W) or ∆W). Although in every yearly network instance the Dutch node weight - link weight correlation value is positive and stronger than the German, the ρ(W,S/D) at 59 node network level can be qualified weak, where the German ρ(W,S/D) seems non-correlated. The Dutch ρ(W,S/D) at 105 node network level fluctuates between 0.06 and 0.04 indicating a weaker assortativity compared to ρ(W,S/D) at 59 node network level. In case a clear node weight - link weight correlation is found, it means that a node with a large internal value flow is likely to exchange a large amount of value with other cooperative nodes.
Figure 44: linear correlation coefficient of the node weight and the average link weigh incident to a node in the German and Dutch 59 node network
0.15
0.10
0.05
0.00
ρ (D
,S/D
)
2006200420022000199819961994199219901988year
Dutch German
0.15
0.10
0.05
0.00
ρ (W
,S/D
)
2006200420022000199819961994199219901988year
Dutch German
96
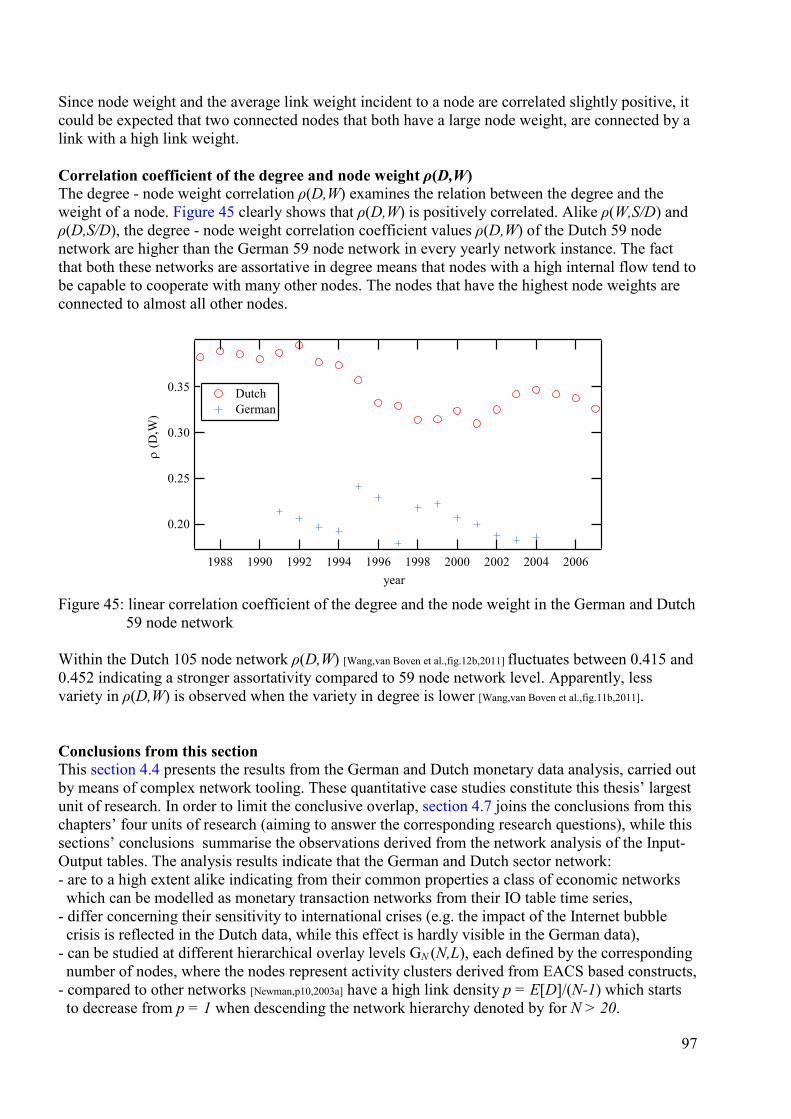
Since node weight and the average link weight incident to a node are correlated slightly positive, it could be expected that two connected nodes that both have a large node weight, are connected by a link with a high link weight. Correlation coefficient of the degree and node weight ρ(D,W) The degree - node weight correlation ρ(D,W) examines the relation between the degree and the weight of a node. Figure 45 clearly shows that ρ(D,W) is positively correlated. Alike ρ(W,S/D) and ρ(D,S/D), the degree - node weight correlation coefficient values ρ(D,W) of the Dutch 59 node network are higher than the German 59 node network in every yearly network instance. The fact that both these networks are assortative in degree means that nodes with a high internal flow tend to be capable to cooperate with many other nodes. The nodes that have the highest node weights are connected to almost all other nodes.
Figure 45: linear correlation coefficient of the degree and the node weight in the German and Dutch 59 node network Within the Dutch 105 node network ρ(D,W) [Wang,van Boven et al.,fig.12b,2011] fluctuates between 0.415 and 0.452 indicating a stronger assortativity compared to 59 node network level. Apparently, less variety in ρ(D,W) is observed when the variety in degree is lower [Wang,van Boven et al.,fig.11b,2011]. Conclusions from this section This section 4.4 presents the results from the German and Dutch monetary data analysis, carried out by means of complex network tooling. These quantitative case studies constitute this thesis’ largest unit of research. In order to limit the conclusive overlap, section 4.7 joins the conclusions from this chapters’ four units of research (aiming to answer the corresponding research questions), while this sections’ conclusions summarise the observations derived from the network analysis of the Input-Output tables. The analysis results indicate that the German and Dutch sector network: - are to a high extent alike indicating from their common properties a class of economic networks which can be modelled as monetary transaction networks from their IO table time series, - differ concerning their sensitivity to international crises (e.g. the impact of the Internet bubble crisis is reflected in the Dutch data, while this effect is hardly visible in the German data), - can be studied at different hierarchical overlay levels GN (N,L), each defined by the corresponding number of nodes, where the nodes represent activity clusters derived from EACS based constructs, - compared to other networks [Newman,p10,2003a] have a high link density p = E[D]/(N-1) which starts to decrease from p = 1 when descending the network hierarchy denoted by for N > 20.
0.35
0.30
0.25
0.20
ρ (D
,W)
2006200420022000199819961994199219901988year
Dutch German
97
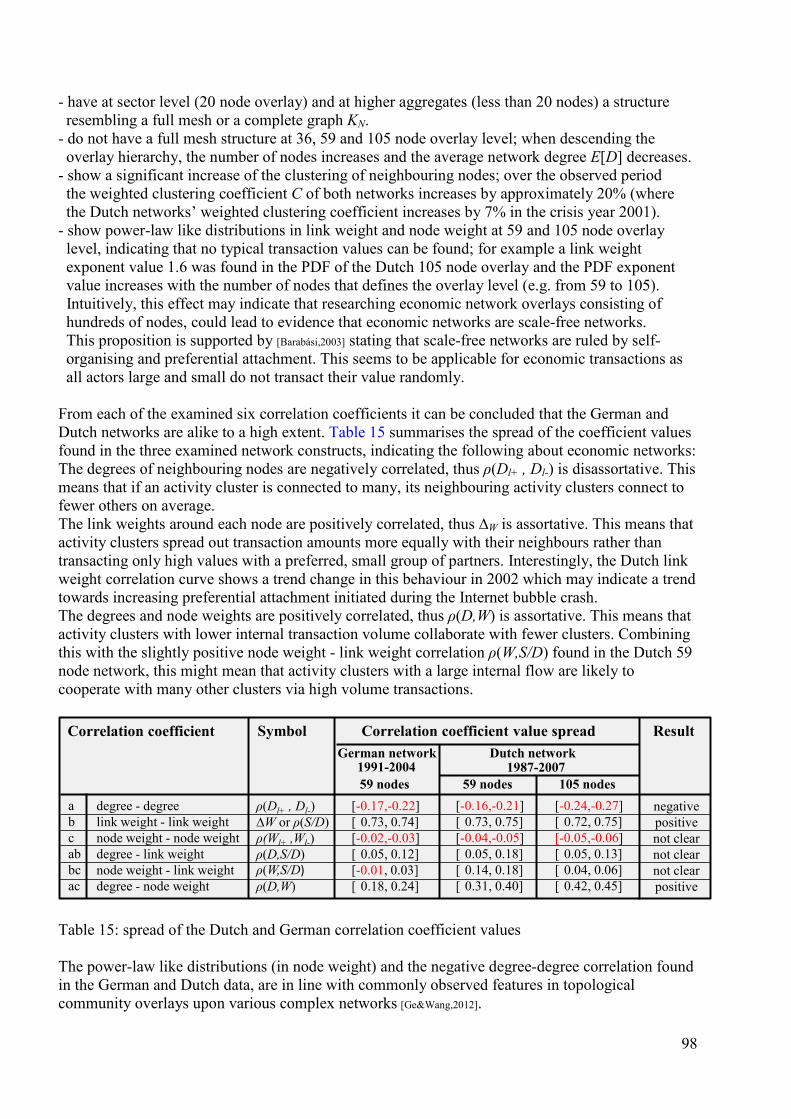
- have at sector level (20 node overlay) and at higher aggregates (less than 20 nodes) a structure resembling a full mesh or a complete graph KN. - do not have a full mesh structure at 36, 59 and 105 node overlay level; when descending the overlay hierarchy, the number of nodes increases and the average network degree E[D] decreases. - show a significant increase of the clustering of neighbouring nodes; over the observed period the weighted clustering coefficient C of both networks increases by approximately 20% (where the Dutch networks’ weighted clustering coefficient increases by 7% in the crisis year 2001). - show power-law like distributions in link weight and node weight at 59 and 105 node overlay level, indicating that no typical transaction values can be found; for example a link weight exponent value 1.6 was found in the PDF of the Dutch 105 node overlay and the PDF exponent value increases with the number of nodes that defines the overlay level (e.g. from 59 to 105). Intuitively, this effect may indicate that researching economic network overlays consisting of hundreds of nodes, could lead to evidence that economic networks are scale-free networks. This proposition is supported by [Barabási,2003] stating that scale-free networks are ruled by self- organising and preferential attachment. This seems to be applicable for economic transactions as all actors large and small do not transact their value randomly. From each of the examined six correlation coefficients it can be concluded that the German and Dutch networks are alike to a high extent. Table 15 summarises the spread of the coefficient values found in the three examined network constructs, indicating the following about economic networks: The degrees of neighbouring nodes are negatively correlated, thus ρ(Dl+ , Dl-) is disassortative. This means that if an activity cluster is connected to many, its neighbouring activity clusters connect to fewer others on average. The link weights around each node are positively correlated, thus ∆W is assortative. This means that activity clusters spread out transaction amounts more equally with their neighbours rather than transacting only high values with a preferred, small group of partners. Interestingly, the Dutch link weight correlation curve shows a trend change in this behaviour in 2002 which may indicate a trend towards increasing preferential attachment initiated during the Internet bubble crash. The degrees and node weights are positively correlated, thus ρ(D,W) is assortative. This means that activity clusters with lower internal transaction volume collaborate with fewer clusters. Combining this with the slightly positive node weight - link weight correlation ρ(W,S/D) found in the Dutch 59 node network, this might mean that activity clusters with a large internal flow are likely to cooperate with many other clusters via high volume transactions.
Table 15: spread of the Dutch and German correlation coefficient values The power-law like distributions (in node weight) and the negative degree-degree correlation found in the German and Dutch data, are in line with commonly observed features in topological community overlays upon various complex networks [Ge&Wang,2012].
SymbolCorrelation coefficient
abcabbcac
German network Dutch network
degree - degreelink weight - link weightnode weight - node weightdegree - link weightnode weight - link weightdegree - node weight
ρ(Dl+ , Dl-) ∆W or ρ(S/D) ρ(Wl+ ,Wl-)ρ(D,S/D) ρ(W,S/D)ρ(D,W)
Correlation coefficient value spread Result
[-0.24,-0.27][ 0.72, 0.75][-0.05,-0.06][ 0.05, 0.13][ 0.04, 0.06][ 0.42, 0.45]
59 nodes 59 nodes 105 nodes [-0.16,-0.21][ 0.73, 0.75][-0.04,-0.05][ 0.05, 0.18][ 0.14, 0.18][ 0.31, 0.40]
[-0.17,-0.22][ 0.73, 0.74][-0.02,-0.03][ 0.05, 0.12][-0.01, 0.03][ 0.18, 0.24]
1987-20071991-2004
negativepositivenot clearnot clearnot clearpositive
98
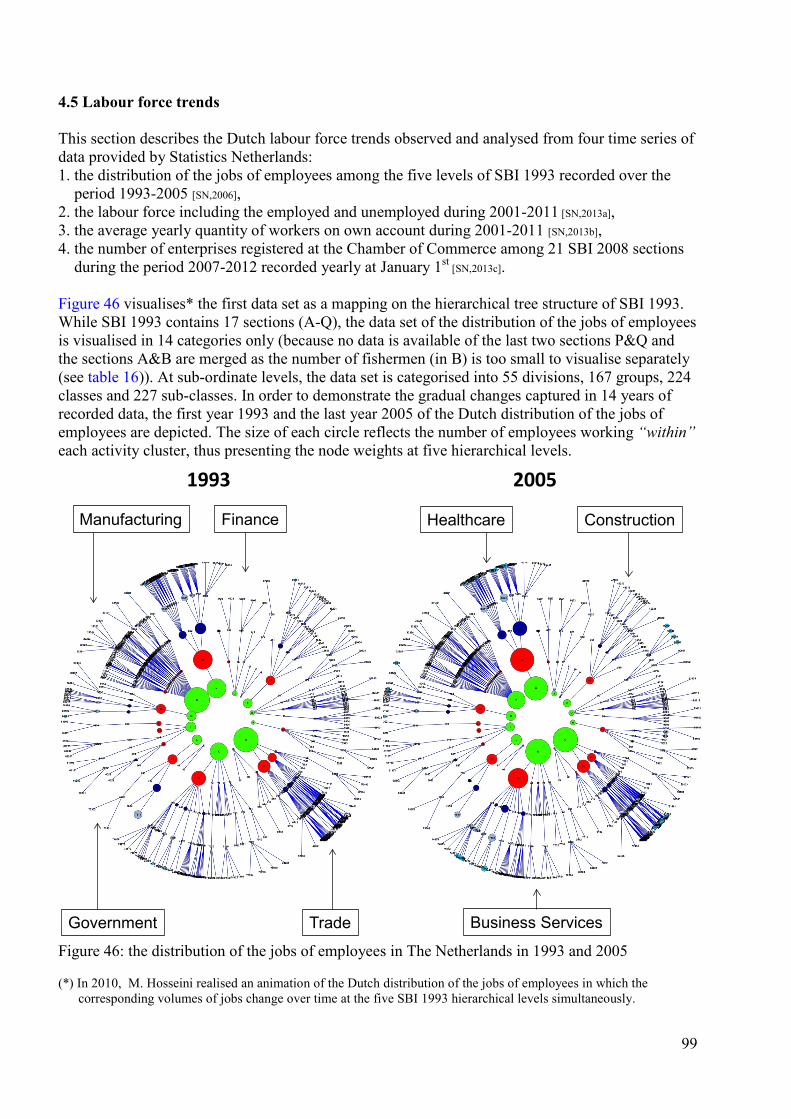
4.5 Labour force trends This section describes the Dutch labour force trends observed and analysed from four time series of data provided by Statistics Netherlands: 1. the distribution of the jobs of employees among the five levels of SBI 1993 recorded over the period 1993-2005 [SN,2006], 2. the labour force including the employed and unemployed during 2001-2011 [SN,2013a], 3. the average yearly quantity of workers on own account during 2001-2011 [SN,2013b], 4. the number of enterprises registered at the Chamber of Commerce among 21 SBI 2008 sections during the period 2007-2012 recorded yearly at January 1st
[SN,2013c]. Figure 46 visualises* the first data set as a mapping on the hierarchical tree structure of SBI 1993. While SBI 1993 contains 17 sections (A-Q), the data set of the distribution of the jobs of employees is visualised in 14 categories only (because no data is available of the last two sections P&Q and the sections A&B are merged as the number of fishermen (in B) is too small to visualise separately (see table 16)). At sub-ordinate levels, the data set is categorised into 55 divisions, 167 groups, 224 classes and 227 sub-classes. In order to demonstrate the gradual changes captured in 14 years of recorded data, the first year 1993 and the last year 2005 of the Dutch distribution of the jobs of employees are depicted. The size of each circle reflects the number of employees working “within” each activity cluster, thus presenting the node weights at five hierarchical levels.
Figure 46: the distribution of the jobs of employees in The Netherlands in 1993 and 2005 (*) In 2010, M. Hosseini realised an animation of the Dutch distribution of the jobs of employees in which the corresponding volumes of jobs change over time at the five SBI 1993 hierarchical levels simultaneously.
20051993
Manufacturing
Trade
Healthcare
Government
Finance Construction
Business Services
99

In figure 46, seven out of fourteen SBI 1993 sections are highlighted of which “Manufacturing”, “Healthcare” and “Business services” show a clear change in the number of jobs of employees. Table 16 presents the corresponding numbers of the sections’ quantitative shifts in more detail. Table 16 totalises the number of jobs of employees in The Netherlands and shows that the Internet bubble crash (around 2001) seems to temporarily mark the stagnation of their growth during 1993-2005. As no employee related data is available for the SBI 1993 section P “Household services” and section Q “Extra-territorial organisations and bodies”, only the numbers belonging to the SBI 1993 sections A-O are listed in table 16.
Table 16: Number of jobs of employees (x1000) mapped on the structure of SBI 1993 Here after are discussed the main features and changes observed from the data [SN,2008] summarised at SBI 1993 section level in table 16. At the time the research exercise regarding the jobs of employees has been carried out, a quantitative mapping on the structure of SBI 2008 was not available. Compared to other SBI 1993 sections, the number of jobs recorded in section A showed to be the most stable over the period 1993-2005. The smallest number of workers is employed in the fishing related SBI 1993 section B and the mining related section C the latter facing a relative decrease of 13%. It is worth noting that the ISIC rev.3.1/SBI 1993 sections A and B were merged into the ISIC rev.4/SBI 2008 section A called “Agriculture, forestry and fishing”. In 1993, SBI 1993 section D “Manufacturing” still employed the largest number of workers (960.000) showing the largest absolute decrease of 124.700 workers (13%). The SBI 1993 section E “Electricity, gas and water supply” showed the largest relative decrease of 47%. The largest relative (77%) and absolute (514.700) increase can be observed in the SBI 1993 section K called “Real estate, renting and business services”. It is important noting that the ISIC rev.3.1/SBI 1993 section K was split up in ISIC rev.4/SBI 2008 due to its expansion at that time. As a consequence, the ISIC rev.4/SBI 2008 section L “Real estate”, section M “Professional activities” and section N “Administrative activities” were defined separately, based on the delineating criterion of their different purposes. For instance professional activities primarily aim to transfer knowledge while administrative activities aim to support business operations. Furthermore worth mentioning are both the SBI 1993 section H related to hotels, restaurants and cafés with a relative (58.3%) and absolute increase of 94.100 workers and the healthcare and social work related section N with a relative (51.5%) and absolute increase of 379.400 workers.
Sections Approximation of the correponding SBI 1993 sector names 1993 1994 1995 1996 1997 1998 1999 2000 2001 2002 2003 2004 2005 A Agriculture & 97 96 82 86 89 92 99 100 101 100 95 97 96 B Fishing 1 1 1 2 2 2 2 2 2 2 2 2 2 C Mining 10 10 10 10 10 10 9 9 9 9 9 9 9 D Manufacturing 960 928 904 899 912 925 953 957 951 920 885 858 835 E Energy & Water 44 44 42 40 40 38 36 35 33 30 29 29 25 F Construction 357 352 344 352 365 375 394 406 413 403 389 371 372 G Trade 937 951 965 1000 1030 1076 1161 1195 1204 1200 1183 1166 1152 H Hotel Restaurant Café 161 176 176 190 197 207 235 254 265 269 258 258 256 I Transport & Communications 383 373 376 381 388 400 433 451 456 451 443 434 424 J Finance 204 203 200 207 219 231 258 265 270 264 257 254 258 K Real estate, Prof. & Admin. activities 671 726 796 880 949 987 1093 1115 1125 1131 1101 1123 1185 L Government 379 377 440 440 443 449 477 485 499 519 523 512 500 M Education 375 377 379 385 388 398 412 424 438 456 468 468 469 N Care 737 749 761 790 813 841 881 911 966 1025 1072 1091 1116 O (other) Care related 194 195 202 208 222 231 253 263 270 279 281 277 277 Total 5509 5557 5678 5869 6067 6262 6694 6871 6999 7055 6995 6948 6976
Number of Jobs of Employees expressed in full time equivalents x 1000
100
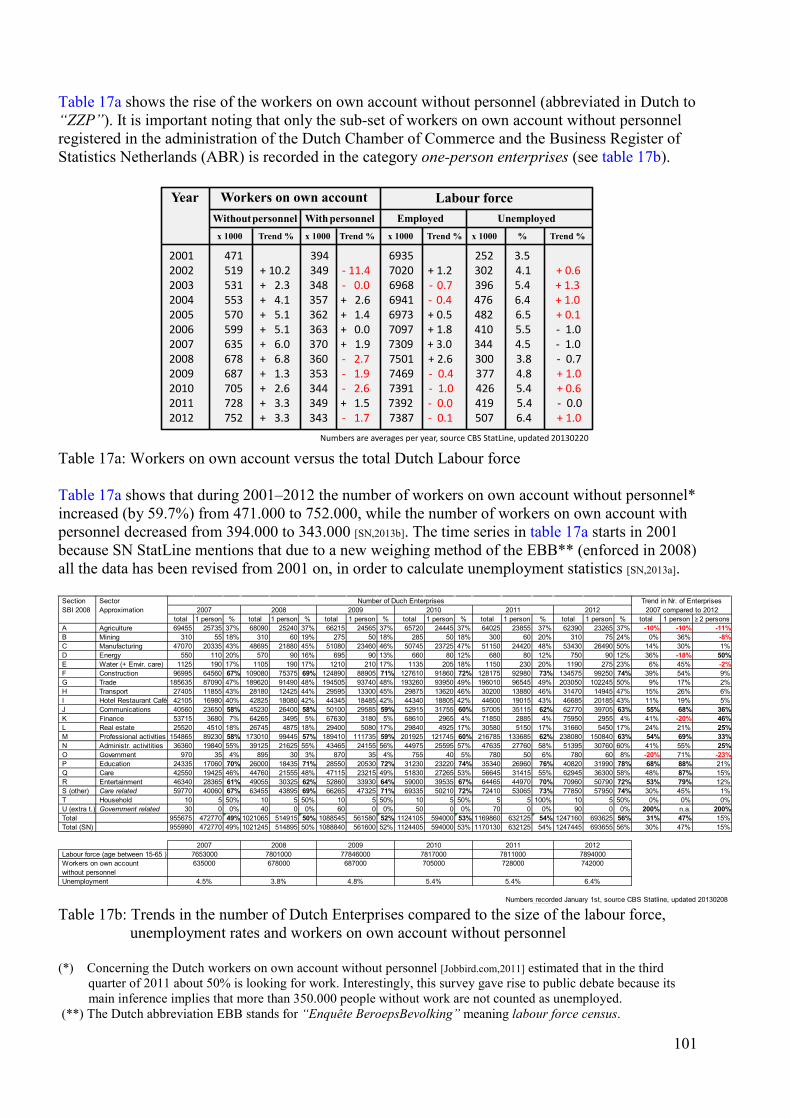
Table 17a shows the rise of the workers on own account without personnel (abbreviated in Dutch to “ZZP”). It is important noting that only the sub-set of workers on own account without personnel registered in the administration of the Dutch Chamber of Commerce and the Business Register of Statistics Netherlands (ABR) is recorded in the category one-person enterprises (see table 17b).
Table 17a: Workers on own account versus the total Dutch Labour force Table 17a shows that during 2001–2012 the number of workers on own account without personnel* increased (by 59.7%) from 471.000 to 752.000, while the number of workers on own account with personnel decreased from 394.000 to 343.000 [SN,2013b]. The time series in table 17a starts in 2001 because SN StatLine mentions that due to a new weighing method of the EBB** (enforced in 2008) all the data has been revised from 2001 on, in order to calculate unemployment statistics [SN,2013a].
Table 17b: Trends in the number of Dutch Enterprises compared to the size of the labour force, unemployment rates and workers on own account without personnel (*) Concerning the Dutch workers on own account without personnel [Jobbird.com,2011] estimated that in the third quarter of 2011 about 50% is looking for work. Interestingly, this survey gave rise to public debate because its main inference implies that more than 350.000 people without work are not counted as unemployed. (**) The Dutch abbreviation EBB stands for “Enquête BeroepsBevolking” meaning labour force census.
Workers on own account Labour force
2001 471 394 6935 252 3.52002 519 + 10.2 349 - 11.4 7020 + 1.2 302 4.1 + 0.62003 531 + 2.3 348 - 0.0 6968 - 0.7 396 5.4 + 1.32004 553 + 4.1 357 + 2.6 6941 - 0.4 476 6.4 + 1.02005 570 + 5.1 362 + 1.4 6973 + 0.5 482 6.5 + 0.12006 599 + 5.1 363 + 0.0 7097 + 1.8 410 5.5 - 1.02007 635 + 6.0 370 + 1.9 7309 + 3.0 344 4.5 - 1.02008 678 + 6.8 360 - 2.7 7501 + 2.6 300 3.8 - 0.72009 687 + 1.3 353 - 1.9 7469 - 0.4 377 4.8 + 1.02010 705 + 2.6 344 - 2.6 7391 - 1.0 426 5.4 + 0.62011 728 + 3.3 349 + 1.5 7392 - 0.0 419 5.4 - 0.02012 752 + 3.3 343 - 1.7 7387 - 0.1 507 6.4 + 1.0
YearWithoutpersonnel With personnel Employed Unemployedx 1000 Trend % x 1000 Trend % x 1000 Trend %
Numbers are averages per year, source CBS StatLine, updated 20130220
x 1000 % Trend %
Section Sector SBI 2008 Approximation
total 1 person % total 1 person % total 1 person % total 1 person % total 1 person % total 1 person % total 1 person ≥ 2 persons A Agriculture 69455 25735 37% 68090 25240 37% 66215 24565 37% 65720 24445 37% 64025 23855 37% 62390 23265 37% -10% -10% -11% B Mining 310 55 18% 310 60 19% 275 50 18% 285 50 18% 300 60 20% 310 75 24% 0% 36% -8% C Manufacturing 47070 20335 43% 48695 21880 45% 51080 23460 46% 50745 23725 47% 51150 24420 48% 53430 26490 50% 14% 30% 1% D Energy 550 110 20% 570 90 16% 695 90 13% 660 80 12% 680 80 12% 750 90 12% 36% -18% 50% E Water (+ Envir. care) 1125 190 17% 1105 190 17% 1210 210 17% 1135 205 18% 1150 230 20% 1190 275 23% 6% 45% -2% F Construction 96995 64560 67% 109080 75375 69% 124890 88905 71% 127610 91860 72% 128175 92980 73% 134575 99250 74% 39% 54% 9% G Trade 185635 87090 47% 189620 91490 48% 194505 93740 48% 193260 93950 49% 196010 96545 49% 203050 102245 50% 9% 17% 2% H Transport 27405 11855 43% 28180 12425 44% 29595 13300 45% 29875 13620 46% 30200 13880 46% 31470 14945 47% 15% 26% 6% I Hotel Restaurant Café 42105 16980 40% 42825 18080 42% 44345 18485 42% 44340 18805 42% 44600 19015 43% 46685 20185 43% 11% 19% 5% J Communications 40560 23650 58% 45230 26400 58% 50100 29585 59% 52915 31755 60% 57005 35115 62% 62770 39705 63% 55% 68% 36% K Finance 53715 3680 7% 64265 3495 5% 67630 3180 5% 68610 2965 4% 71850 2885 4% 75950 2955 4% 41% -20% 46% L Real estate 25520 4510 18% 26745 4875 18% 29400 5080 17% 29840 4925 17% 30580 5150 17% 31660 5450 17% 24% 21% 25% M Professional activities 154865 89230 58% 173010 99445 57% 189410 111735 59% 201925 121745 60% 216785 133685 62% 238080 150840 63% 54% 69% 33% N Administr. activitities 36360 19840 55% 39125 21625 55% 43465 24155 56% 44975 25595 57% 47635 27760 58% 51395 30760 60% 41% 55% 25% O Government 970 35 4% 895 30 3% 870 35 4% 755 40 5% 780 50 6% 780 60 8% -20% 71% -23% P Education 24335 17060 70% 26000 18435 71% 28550 20530 72% 31230 23220 74% 35340 26960 76% 40820 31990 78% 68% 88% 21% Q Care 42550 19425 46% 44760 21555 48% 47115 23215 49% 51830 27265 53% 56645 31415 55% 62945 36300 58% 48% 87% 15% R Entertainment 46340 28365 61% 49055 30325 62% 52860 33930 64% 59000 39535 67% 64465 44970 70% 70960 50790 72% 53% 79% 12% S (other) Care related 59770 40060 67% 63455 43895 69% 66265 47325 71% 69335 50210 72% 72410 53065 73% 77850 57950 74% 30% 45% 1% T Household 10 5 50% 10 5 50% 10 5 50% 10 5 50% 5 5 100% 10 5 50% 0% 0% 0% U (extra t.) Government related 30 0 0% 40 0 0% 60 0 0% 50 0 0% 70 0 0% 90 0 0% 200% n.a. 200% Total 955675 472770 49% 1021065 514915 50% 1088545 561580 52% 1124105 594000 53% 1169860 632125 54% 1247160 693625 56% 31% 47% 15% Total (SN) 955990 472770 49% 1021245 514895 50% 1088840 561600 52% 1124405 594000 53% 1170130 632125 54% 1247445 693655 56% 30% 47% 15%
Labour force (age between 15-65 ) Workers on own account without personnel Unemployment
Numbers recorded January 1st, source CBS Statline, updated 20130208
2007 2008 2009 2010
742000
2008 2009
2011 2012Trend in Nr. of Enterprises
2007 compared to 2012 Number of Duch Enterprises
7653000 78010002007
635000 678000 687000 705000 72800077846000 7817000 7811000
4.5% 3.8% 4.8% 5.4% 5.4% 6.4%
2010 2011 20127894000
101
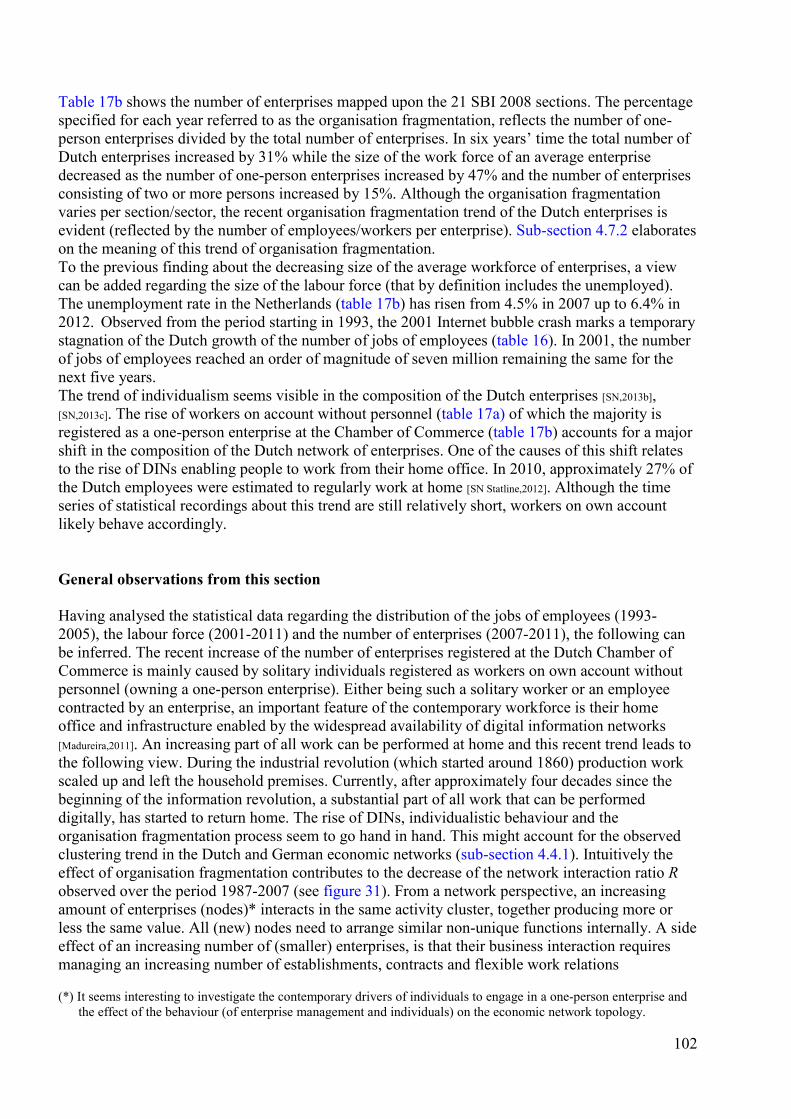
Table 17b shows the number of enterprises mapped upon the 21 SBI 2008 sections. The percentage specified for each year referred to as the organisation fragmentation, reflects the number of one-person enterprises divided by the total number of enterprises. In six years’ time the total number of Dutch enterprises increased by 31% while the size of the work force of an average enterprise decreased as the number of one-person enterprises increased by 47% and the number of enterprises consisting of two or more persons increased by 15%. Although the organisation fragmentation varies per section/sector, the recent organisation fragmentation trend of the Dutch enterprises is evident (reflected by the number of employees/workers per enterprise). Sub-section 4.7.2 elaborates on the meaning of this trend of organisation fragmentation. To the previous finding about the decreasing size of the average workforce of enterprises, a view can be added regarding the size of the labour force (that by definition includes the unemployed). The unemployment rate in the Netherlands (table 17b) has risen from 4.5% in 2007 up to 6.4% in 2012. Observed from the period starting in 1993, the 2001 Internet bubble crash marks a temporary stagnation of the Dutch growth of the number of jobs of employees (table 16). In 2001, the number of jobs of employees reached an order of magnitude of seven million remaining the same for the next five years. The trend of individualism seems visible in the composition of the Dutch enterprises [SN,2013b], [SN,2013c]. The rise of workers on account without personnel (table 17a) of which the majority is registered as a one-person enterprise at the Chamber of Commerce (table 17b) accounts for a major shift in the composition of the Dutch network of enterprises. One of the causes of this shift relates to the rise of DINs enabling people to work from their home office. In 2010, approximately 27% of the Dutch employees were estimated to regularly work at home [SN Statline,2012]. Although the time series of statistical recordings about this trend are still relatively short, workers on own account likely behave accordingly. General observations from this section Having analysed the statistical data regarding the distribution of the jobs of employees (1993-2005), the labour force (2001-2011) and the number of enterprises (2007-2011), the following can be inferred. The recent increase of the number of enterprises registered at the Dutch Chamber of Commerce is mainly caused by solitary individuals registered as workers on own account without personnel (owning a one-person enterprise). Either being such a solitary worker or an employee contracted by an enterprise, an important feature of the contemporary workforce is their home office and infrastructure enabled by the widespread availability of digital information networks [Madureira,2011]. An increasing part of all work can be performed at home and this recent trend leads to the following view. During the industrial revolution (which started around 1860) production work scaled up and left the household premises. Currently, after approximately four decades since the beginning of the information revolution, a substantial part of all work that can be performed digitally, has started to return home. The rise of DINs, individualistic behaviour and the organisation fragmentation process seem to go hand in hand. This might account for the observed clustering trend in the Dutch and German economic networks (sub-section 4.4.1). Intuitively the effect of organisation fragmentation contributes to the decrease of the network interaction ratio R observed over the period 1987-2007 (see figure 31). From a network perspective, an increasing amount of enterprises (nodes)* interacts in the same activity cluster, together producing more or less the same value. All (new) nodes need to arrange similar non-unique functions internally. A side effect of an increasing number of (smaller) enterprises, is that their business interaction requires managing an increasing number of establishments, contracts and flexible work relations (*) It seems interesting to investigate the contemporary drivers of individuals to engage in a one-person enterprise and the effect of the behaviour (of enterprise management and individuals) on the economic network topology.
102
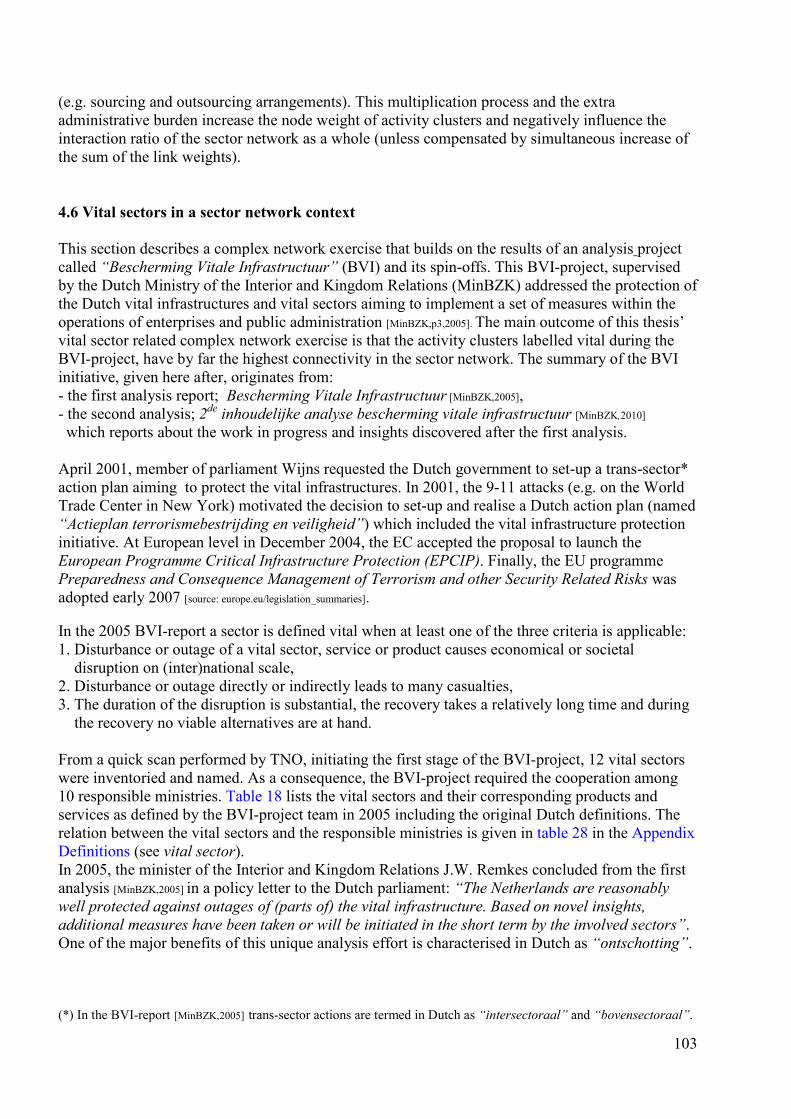
(e.g. sourcing and outsourcing arrangements). This multiplication process and the extra administrative burden increase the node weight of activity clusters and negatively influence the interaction ratio of the sector network as a whole (unless compensated by simultaneous increase of the sum of the link weights). 4.6 Vital sectors in a sector network context This section describes a complex network exercise that builds on the results of an analysis project called “Bescherming Vitale Infrastructuur” (BVI) and its spin-offs. This BVI-project, supervised by the Dutch Ministry of the Interior and Kingdom Relations (MinBZK) addressed the protection of the Dutch vital infrastructures and vital sectors aiming to implement a set of measures within the operations of enterprises and public administration [MinBZK,p3,2005]. The main outcome of this thesis’ vital sector related complex network exercise is that the activity clusters labelled vital during the BVI-project, have by far the highest connectivity in the sector network. The summary of the BVI initiative, given here after, originates from: - the first analysis report; Bescherming Vitale Infrastructuur [MinBZK,2005], - the second analysis; 2de inhoudelijke analyse bescherming vitale infrastructuur [MinBZK,2010] which reports about the work in progress and insights discovered after the first analysis. April 2001, member of parliament Wijns requested the Dutch government to set-up a trans-sector* action plan aiming to protect the vital infrastructures. In 2001, the 9-11 attacks (e.g. on the World Trade Center in New York) motivated the decision to set-up and realise a Dutch action plan (named “Actieplan terrorismebestrijding en veiligheid”) which included the vital infrastructure protection initiative. At European level in December 2004, the EC accepted the proposal to launch the European Programme Critical Infrastructure Protection (EPCIP). Finally, the EU programme Preparedness and Consequence Management of Terrorism and other Security Related Risks was adopted early 2007 [source: europe.eu/legislation_summaries]. In the 2005 BVI-report a sector is defined vital when at least one of the three criteria is applicable: 1. Disturbance or outage of a vital sector, service or product causes economical or societal disruption on (inter)national scale, 2. Disturbance or outage directly or indirectly leads to many casualties, 3. The duration of the disruption is substantial, the recovery takes a relatively long time and during the recovery no viable alternatives are at hand. From a quick scan performed by TNO, initiating the first stage of the BVI-project, 12 vital sectors were inventoried and named. As a consequence, the BVI-project required the cooperation among 10 responsible ministries. Table 18 lists the vital sectors and their corresponding products and services as defined by the BVI-project team in 2005 including the original Dutch definitions. The relation between the vital sectors and the responsible ministries is given in table 28 in the Appendix Definitions (see vital sector). In 2005, the minister of the Interior and Kingdom Relations J.W. Remkes concluded from the first analysis [MinBZK,2005] in a policy letter to the Dutch parliament: “The Netherlands are reasonably well protected against outages of (parts of) the vital infrastructure. Based on novel insights, additional measures have been taken or will be initiated in the short term by the involved sectors”. One of the major benefits of this unique analysis effort is characterised in Dutch as “ontschotting”. (*) In the BVI-report [MinBZK,2005] trans-sector actions are termed in Dutch as “intersectoraal” and “bovensectoraal”.
103
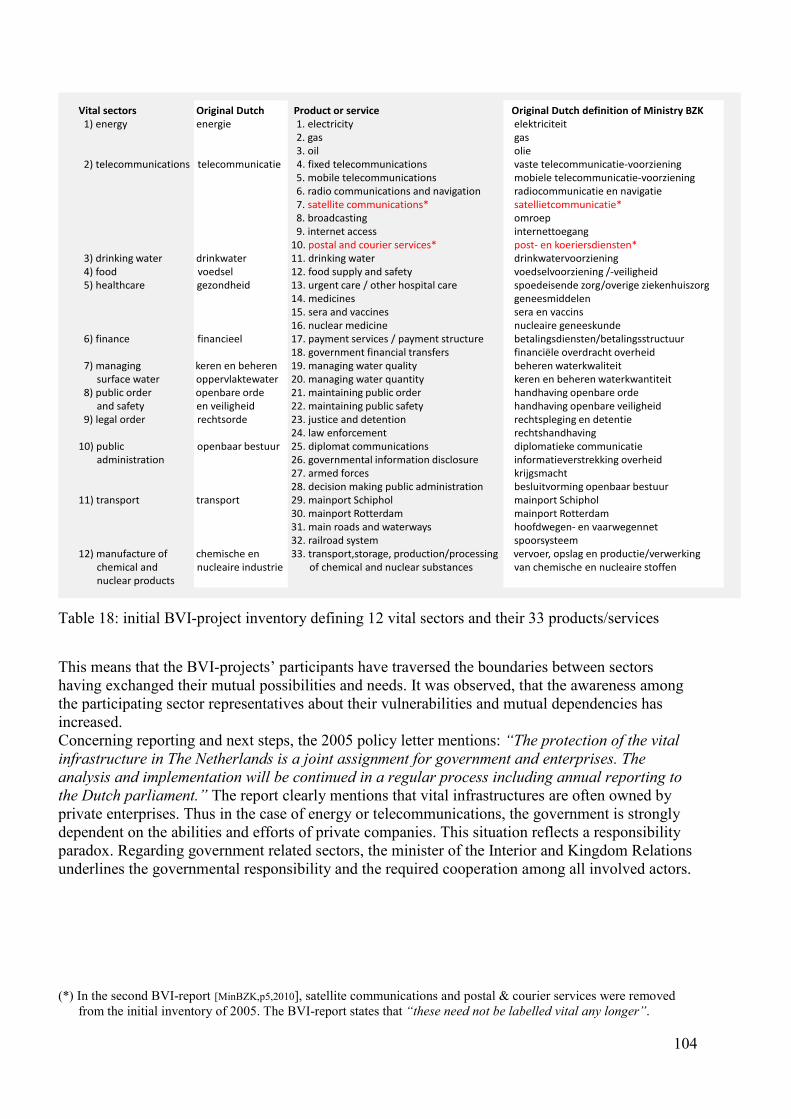
Table 18: initial BVI-project inventory defining 12 vital sectors and their 33 products/services This means that the BVI-projects’ participants have traversed the boundaries between sectors having exchanged their mutual possibilities and needs. It was observed, that the awareness among the participating sector representatives about their vulnerabilities and mutual dependencies has increased. Concerning reporting and next steps, the 2005 policy letter mentions: “The protection of the vital infrastructure in The Netherlands is a joint assignment for government and enterprises. The analysis and implementation will be continued in a regular process including annual reporting to the Dutch parliament.” The report clearly mentions that vital infrastructures are often owned by private enterprises. Thus in the case of energy or telecommunications, the government is strongly dependent on the abilities and efforts of private companies. This situation reflects a responsibility paradox. Regarding government related sectors, the minister of the Interior and Kingdom Relations underlines the governmental responsibility and the required cooperation among all involved actors. (*) In the second BVI-report [MinBZK,p5,2010], satellite communications and postal & courier services were removed from the initial inventory of 2005. The BVI-report states that “these need not be labelled vital any longer”.
Vital sectors Original Dutch Product or service Original Dutch definition of Ministry BZK1) energy energie 1. electricity elektriciteit
2. gas gas3. oil olie
2) telecommunications telecommunicatie 4. fixed telecommunications vaste telecommunicatie-voorziening5. mobile telecommunications mobiele telecommunicatie-voorziening6. radio communications and navigation radiocommunicatie en navigatie7. satellite communications* satellietcommunicatie*8. broadcasting omroep9. internet access internettoegang
10. postal and courier services* post- en koeriersdiensten*3) drinking water drinkwater 11. drinking water drinkwatervoorziening4) food voedsel 12. food supply and safety voedselvoorziening /-veiligheid5) healthcare gezondheid 13. urgent care / other hospital care spoedeisende zorg/overige ziekenhuiszorg
14. medicines geneesmiddelen15. sera and vaccines sera en vaccins16. nuclear medicine nucleaire geneeskunde
6) finance financieel 17. payment services / payment structure betalingsdiensten/betalingsstructuur18. government financial transfers financiële overdracht overheid
7) managing keren en beheren 19. managing water quality beheren waterkwaliteit surface water oppervlaktewater 20. managing water quantity keren en beheren waterkwantiteit
8) public order openbare orde 21. maintaining public order handhaving openbare orde and safety en veiligheid 22. maintaining public safety handhaving openbare veiligheid
9) legal order rechtsorde 23. justice and detention rechtspleging en detentie24. law enforcement rechtshandhaving
10) public openbaar bestuur 25. diplomat communications diplomatieke communicatieadministration 26. governmental information disclosure informatieverstrekking overheid
27. armed forces krijgsmacht28. decision making public administration besluitvorming openbaar bestuur
11) transport transport 29. mainport Schiphol mainport Schiphol30. mainport Rotterdam mainport Rotterdam31. main roads and waterways hoofdwegen- en vaarwegennet32. railroad system spoorsysteem
12) manufacture of chemische en 33. transport,storage, production/processing vervoer, opslag en productie/verwerking chemical and nucleaire industrie of chemical and nuclear substances van chemische en nucleaire stoffennuclear products
104
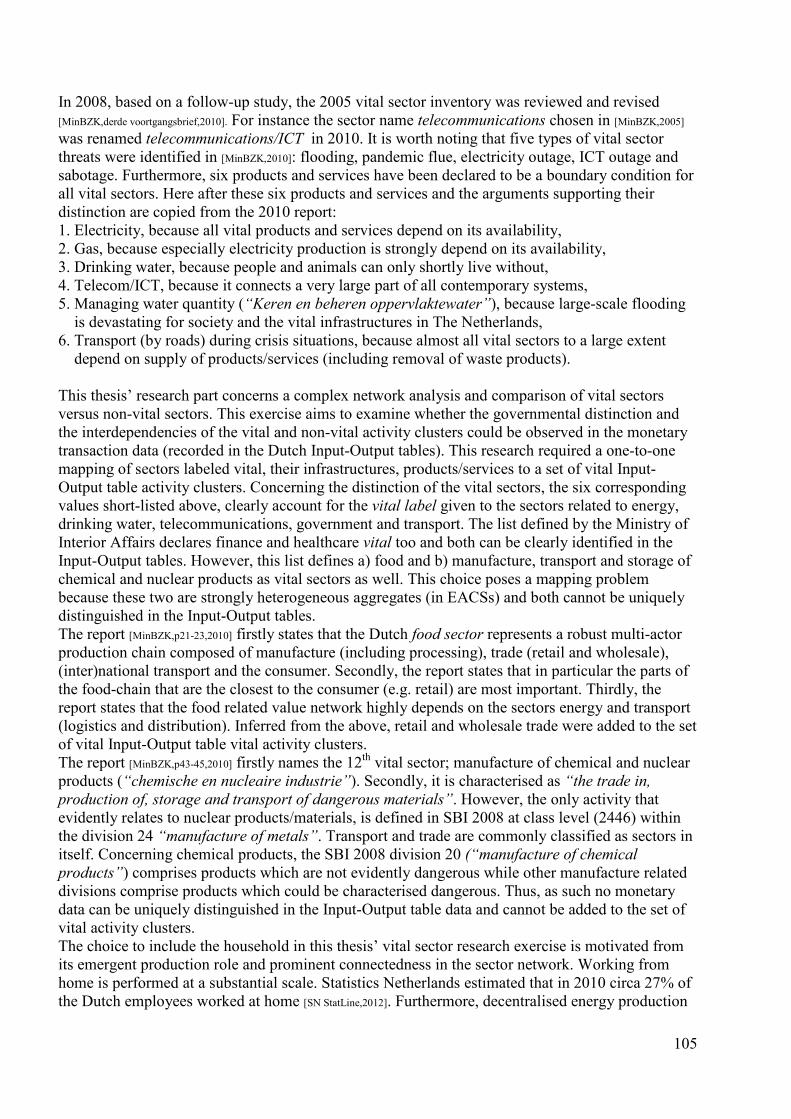
In 2008, based on a follow-up study, the 2005 vital sector inventory was reviewed and revised [MinBZK,derde voortgangsbrief,2010]. For instance the sector name telecommunications chosen in [MinBZK,2005] was renamed telecommunications/ICT in 2010. It is worth noting that five types of vital sector threats were identified in [MinBZK,2010]: flooding, pandemic flue, electricity outage, ICT outage and sabotage. Furthermore, six products and services have been declared to be a boundary condition for all vital sectors. Here after these six products and services and the arguments supporting their distinction are copied from the 2010 report: 1. Electricity, because all vital products and services depend on its availability, 2. Gas, because especially electricity production is strongly depend on its availability, 3. Drinking water, because people and animals can only shortly live without, 4. Telecom/ICT, because it connects a very large part of all contemporary systems, 5. Managing water quantity (“Keren en beheren oppervlaktewater”), because large-scale flooding is devastating for society and the vital infrastructures in The Netherlands, 6. Transport (by roads) during crisis situations, because almost all vital sectors to a large extent depend on supply of products/services (including removal of waste products). This thesis’ research part concerns a complex network analysis and comparison of vital sectors versus non-vital sectors. This exercise aims to examine whether the governmental distinction and the interdependencies of the vital and non-vital activity clusters could be observed in the monetary transaction data (recorded in the Dutch Input-Output tables). This research required a one-to-one mapping of sectors labeled vital, their infrastructures, products/services to a set of vital Input-Output table activity clusters. Concerning the distinction of the vital sectors, the six corresponding values short-listed above, clearly account for the vital label given to the sectors related to energy, drinking water, telecommunications, government and transport. The list defined by the Ministry of Interior Affairs declares finance and healthcare vital too and both can be clearly identified in the Input-Output tables. However, this list defines a) food and b) manufacture, transport and storage of chemical and nuclear products as vital sectors as well. This choice poses a mapping problem because these two are strongly heterogeneous aggregates (in EACSs) and both cannot be uniquely distinguished in the Input-Output tables. The report [MinBZK,p21-23,2010] firstly states that the Dutch food sector represents a robust multi-actor production chain composed of manufacture (including processing), trade (retail and wholesale), (inter)national transport and the consumer. Secondly, the report states that in particular the parts of the food-chain that are the closest to the consumer (e.g. retail) are most important. Thirdly, the report states that the food related value network highly depends on the sectors energy and transport (logistics and distribution). Inferred from the above, retail and wholesale trade were added to the set of vital Input-Output table vital activity clusters. The report [MinBZK,p43-45,2010] firstly names the 12th vital sector; manufacture of chemical and nuclear products (“chemische en nucleaire industrie”). Secondly, it is characterised as “the trade in, production of, storage and transport of dangerous materials”. However, the only activity that evidently relates to nuclear products/materials, is defined in SBI 2008 at class level (2446) within the division 24 “manufacture of metals”. Transport and trade are commonly classified as sectors in itself. Concerning chemical products, the SBI 2008 division 20 (“manufacture of chemical products”) comprises products which are not evidently dangerous while other manufacture related divisions comprise products which could be characterised dangerous. Thus, as such no monetary data can be uniquely distinguished in the Input-Output table data and cannot be added to the set of vital activity clusters. The choice to include the household in this thesis’ vital sector research exercise is motivated from its emergent production role and prominent connectedness in the sector network. Working from home is performed at a substantial scale. Statistics Netherlands estimated that in 2010 circa 27% of the Dutch employees worked at home [SN StatLine,2012]. Furthermore, decentralised energy production
105
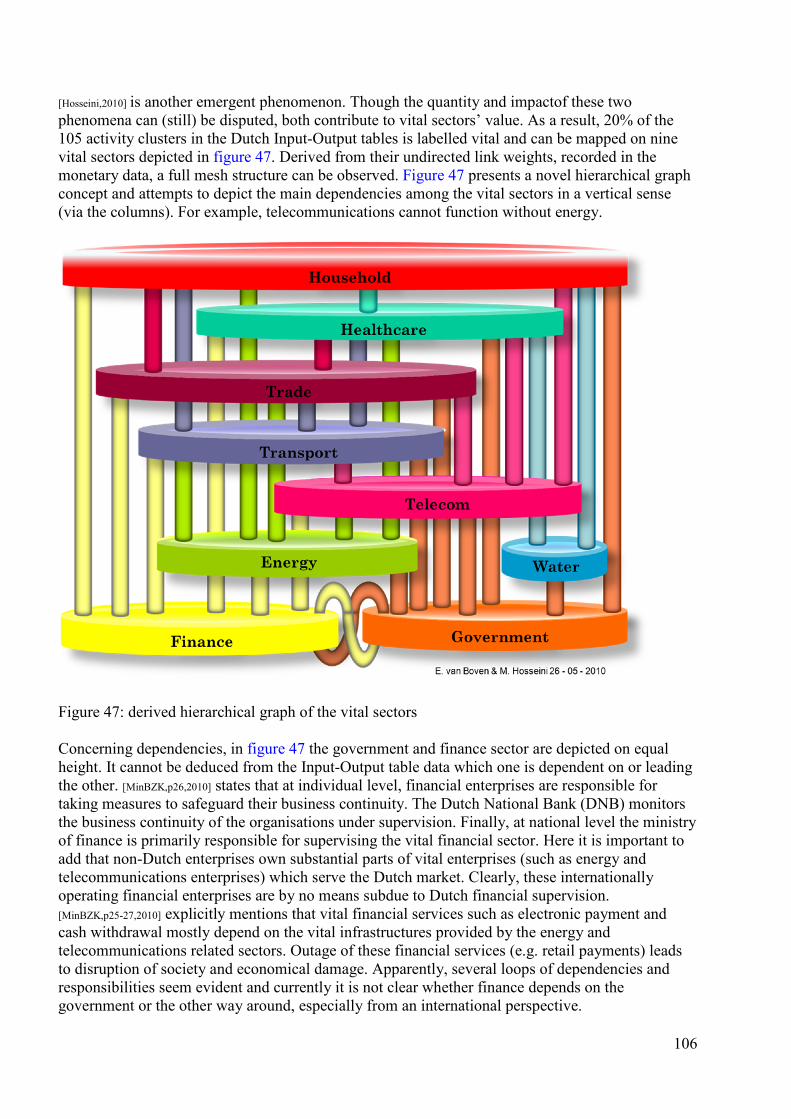
[Hosseini,2010] is another emergent phenomenon. Though the quantity and impactof these two phenomena can (still) be disputed, both contribute to vital sectors’ value. As a result, 20% of the 105 activity clusters in the Dutch Input-Output tables is labelled vital and can be mapped on nine vital sectors depicted in figure 47. Derived from their undirected link weights, recorded in the monetary data, a full mesh structure can be observed. Figure 47 presents a novel hierarchical graph concept and attempts to depict the main dependencies among the vital sectors in a vertical sense (via the columns). For example, telecommunications cannot function without energy.
Figure 47: derived hierarchical graph of the vital sectors Concerning dependencies, in figure 47 the government and finance sector are depicted on equal height. It cannot be deduced from the Input-Output table data which one is dependent on or leading the other. [MinBZK,p26,2010] states that at individual level, financial enterprises are responsible for taking measures to safeguard their business continuity. The Dutch National Bank (DNB) monitors the business continuity of the organisations under supervision. Finally, at national level the ministry of finance is primarily responsible for supervising the vital financial sector. Here it is important to add that non-Dutch enterprises own substantial parts of vital enterprises (such as energy and telecommunications enterprises) which serve the Dutch market. Clearly, these internationally operating financial enterprises are by no means subdue to Dutch financial supervision. [MinBZK,p25-27,2010] explicitly mentions that vital financial services such as electronic payment and cash withdrawal mostly depend on the vital infrastructures provided by the energy and telecommunications related sectors. Outage of these financial services (e.g. retail payments) leads to disruption of society and economical damage. Apparently, several loops of dependencies and responsibilities seem evident and currently it is not clear whether finance depends on the government or the other way around, especially from an international perspective.
106
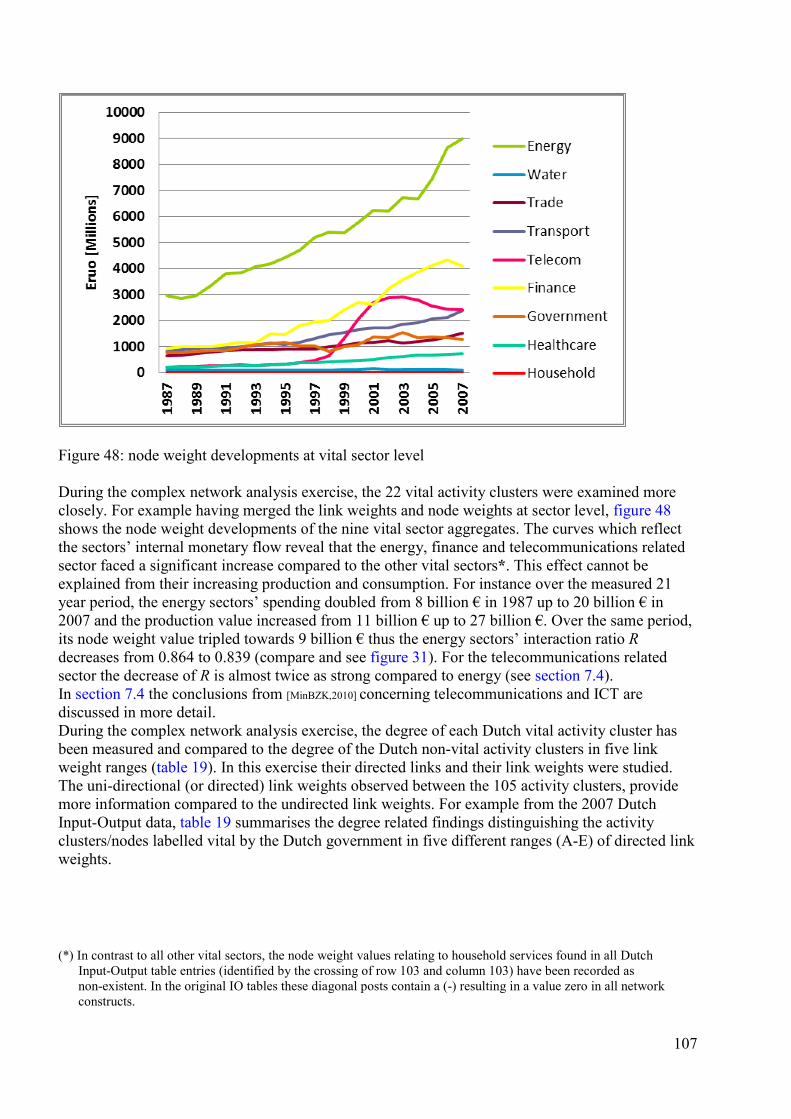
Figure 48: node weight developments at vital sector level During the complex network analysis exercise, the 22 vital activity clusters were examined more closely. For example having merged the link weights and node weights at sector level, figure 48 shows the node weight developments of the nine vital sector aggregates. The curves which reflect the sectors’ internal monetary flow reveal that the energy, finance and telecommunications related sector faced a significant increase compared to the other vital sectors*. This effect cannot be explained from their increasing production and consumption. For instance over the measured 21 year period, the energy sectors’ spending doubled from 8 billion € in 1987 up to 20 billion € in 2007 and the production value increased from 11 billion € up to 27 billion €. Over the same period, its node weight value tripled towards 9 billion € thus the energy sectors’ interaction ratio R decreases from 0.864 to 0.839 (compare and see figure 31). For the telecommunications related sector the decrease of R is almost twice as strong compared to energy (see section 7.4). In section 7.4 the conclusions from [MinBZK,2010] concerning telecommunications and ICT are discussed in more detail. During the complex network analysis exercise, the degree of each Dutch vital activity cluster has been measured and compared to the degree of the Dutch non-vital activity clusters in five link weight ranges (table 19). In this exercise their directed links and their link weights were studied. The uni-directional (or directed) link weights observed between the 105 activity clusters, provide more information compared to the undirected link weights. For example from the 2007 Dutch Input-Output data, table 19 summarises the degree related findings distinguishing the activity clusters/nodes labelled vital by the Dutch government in five different ranges (A-E) of directed link weights. (*) In contrast to all other vital sectors, the node weight values relating to household services found in all Dutch Input-Output table entries (identified by the crossing of row 103 and column 103) have been recorded as non-existent. In the original IO tables these diagonal posts contain a (-) resulting in a value zero in all network constructs.
107
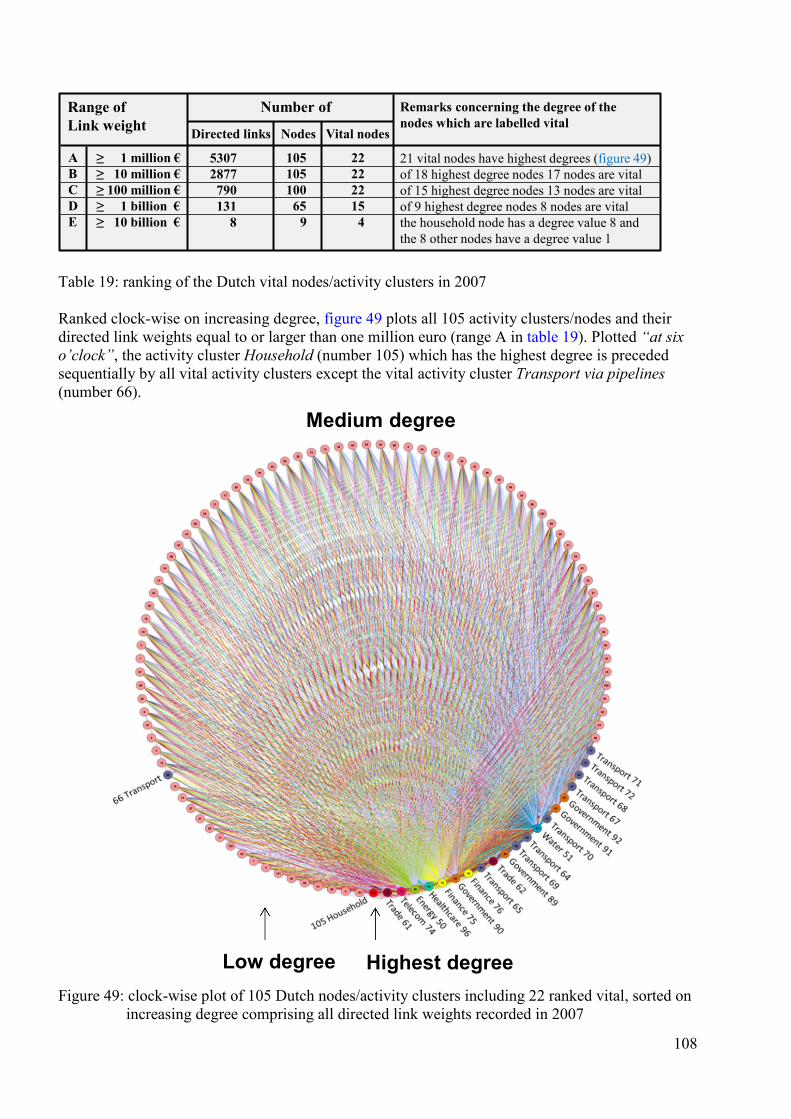
Table 19: ranking of the Dutch vital nodes/activity clusters in 2007 Ranked clock-wise on increasing degree, figure 49 plots all 105 activity clusters/nodes and their directed link weights equal to or larger than one million euro (range A in table 19). Plotted “at six o’clock”, the activity cluster Household (number 105) which has the highest degree is preceded sequentially by all vital activity clusters except the vital activity cluster Transport via pipelines (number 66).
Figure 49: clock-wise plot of 105 Dutch nodes/activity clusters including 22 ranked vital, sorted on increasing degree comprising all directed link weights recorded in 2007
Number ofRange ofLink weight
ABCDE
Remarks concerning the degree of the nodes which are labelled vital
Directed links Nodes Vital nodes
≥ 1 million €≥ 10 million €≥ 100 million €≥ 1 billion €≥ 10 billion €
53072877790131
8
10510510065
9
222222154
21 vital nodes have highest degrees (figure 49)of 18 highest degree nodes 17 nodes are vitalof 15 highest degree nodes 13 nodes are vitalof 9 highest degree nodes 8 nodes are vitalthe household node has a degree value 8 and the 8 other nodes have a degree value 1
Highest degreeLow degree
Medium degree
108
The main observations from the vital sector complex network exercise (table 19 and figure 49) are the following: - On average the vital activity clusters have a significantly higher degree compared to non-vital ones in all ranges of link weight indicating their high connectedness in all these ranges. This effect is most evident when the smallest link weights < 10 million € are included (range A), - The household has the highest degree in all ranges of link weight in each year of the time series followed by wholesale trade (in the link weight ranges A, B and E), - In 2007 all activity clusters have at least one directed link with a link weight between 10 million € and 100 million €, - Four vital activity clusters have at least one directed link with a link weight higher than 10 billion euro. In this range E, the household (105) has degree value eight, while Wholesale trade (61), Finance (insurance (76)) and healthcare (medical services (96)) have a degree value one. Observations from this section The main observations from table 18, the BVI-project [MinBZK,2005],[MinBZK,2010] and [Prins&Broeders,2011]
are the following: - As explicitly mentioned in the 2005 policy letter, the unprecedented trans-sector cooperation and orchestration, setup during the BVI-project is qualified as one of the major benefits of the project. In this letter, the minister of the Interior and Kingdom Relations claims that from 2005 on, a novel orchestration arrangement is in place, characterised in Dutch as “bovensectoraal”, which could be translated into “supra-sector” and somewhat more freely into “trans-sector”. - The BVI-report mentions that parts of the vital infrastructures are often owned by private enterprises. Thus, for example in the case of energy and telecommunications, the government strongly depends on the abilities and efforts of private (or privatised) companies. The three following notions together introduce a responsibility paradox: a) [Prins&Broeders,p48-50,2011] refer to governmental sources (such as*) that state that one of the roles of the government is protecting the interests of citizens and society, b) private companies own parts of the vital infrastructure but do not own the responsibility for the protection of the interests and well-being of citizens, c) the well-being of citizens strongly depends on the availability of vital infrastructure value. - The BVI-project team defined a list of 12 sectors which is clearly divergent from the available United Nations ISIC (and Dutch SBI) section structure. - In the course towards the 2010 BVI-report, the 12 vital sector names and definitions have been adjusted and novel insights about sector interdependencies and composition have been discovered. However, between the sections of the 2010 BVI-report, inconsistencies in sector naming can still be observed. - The household, its infrastructure and its functions were not labelled vital by the BVI-project. The main finding from the complex network analysis of the monetary flows of the vital sectors, is that in all ranges of link weight the activity clusters labelled vital, have by far the highest degree values compared to non-vital activity clusters indicating their high connectedness. The household has the highest degree in all ranges of link weight in each year of the studied time series due to the volume of their spending and salaries. (*) [Ministry of Security and Justice, Visie op biometrie in de identiteitsketen publieke sector, p33,2010]
109
4.7 Conclusions This section joins this chapters’ conclusions from the sector network data analysis and summarises the research results from four complementary units of research and their sources: I. Economic Activity Classification Systems (EACSs), II. German and Dutch Input-Output table time series, III. Dutch labour force and enterprise related time series, IV. the vital sectors report about the protection of our vital infrastructures [MinBZK,2010]. Each of these four units of research adds a particular complex network view contributing to the understanding of the structure and developments of economic systems with focus on Germany and The Netherlands. Sub-section 4.7.1 presents the conclusions derived from the four units of research. Because section 4.4 provides this chapters’ largest unit of research (II), its conclusions are combined with answering research question RQ2 and its sub-questions SQ2a and SQ2b. Sub-section 4.7.2 discusses the intuitive conclusions inferred from the research units II and III. 4.7.1 Conclusions from the data analyses In this sub-section the sector network related conclusions are given in the following sequence: 1) Visualisations of the network structures of EACSs (section 4.1), 2) Trends observed from Dutch labour force and enterprise related time series (section 4.5), 3) Network related findings from the vital sectors report (section 4.6), 4) Background (section 4.2), methodology (section 4.3) and results from the analysis of Input-Output table time series (section 4.4). 1. Visualisations of the network structures of EACSs The network visualisations of the EACSs SBI 1993 and SBI 2008 are planar graphs and both show a strongly heterogeneous node distribution. From the EACS SBI 2008 (figure 4) can be observed that the number of activity clusters per section varies between 4 and 391, differing a factor 100. EACS sections tend to branch out as tree graphs and their visualisations support the inference from [Potter,1988] that homogeneity in the size of the number of activity clusters per classification category is not a dominant classification criterion. 2. Trends observed from Dutch labour force and enterprise related time series From four studied time series a) the number of jobs of employees during 1993-2005, b) the size of the labour force during 2001-2012, c) the workers on own account during 2001-2012 and d) the number of enterprises during 2007-2012, the following can be concluded. Observed from the period starting in 1993, the 2001 Internet bubble crash marks a temporary stagnation of the growth of the number of jobs of employees (remaining constant around seven million) during the period 2001-2005. Since the above mentioned time series have been revised and the enterprise registration policy has been adapted and carried out (up till 2009), this thesis’ analysis refrains from connecting time series (e.g. before and after 2001). During 2007-2012, the total number of Dutch enterprises increased by 30% while the number of one-person enterprises increased by 47% and the number of enterprises consisting of two or more persons increased by 15%. Likely, the increase in the number of enterprises is mainly caused by the rise of workers on own account without personnel registered as a one-person enterprise. As a result,
110
the size of the workforce of an average enterprise is decreasing. This trend combined with the fact that during 2007-2012 the size of the Dutch labour force hardly grew (7.3 million in 2007 to 7.4 million in 2011) indicates a process of organisation fragmentation. Currently, an increasing part of all work is performed at home which could be explained by the widespread availability of DINs. Either being a solitary worker on own account or an employee contracted by a large enterprise, an important feature of the contemporary workforce is their digitally networked home office. In 2010, approximately 27% of the Dutch employees were estimated to regularly work at home [SN StatLine,2012]. 3. Network related findings from the vital sectors report Regarding the protection of the Dutch vital sectors and vital infrastructures, the BVI-project supervised by the Dutch Ministry of the Interior and Kingdom Relations, aimed to implement a set of measures within the operations of enterprises and public administration [MinBZK,p3,2005]. In the BVI-report, twelve sectors and their infrastructures have been labelled vital. The energy sector, the telecommunications and drinking water related sectors lead their ranking list. The main finding from this thesis’ vital sector analysis of the monetary flows is that in all ranges of link weight the activity clusters which are labelled vital, have by far the highest degree values (compared to the non-vital activity clusters’ degree values), indicating their high connectedness. The household has been incorporated in this thesis’ quantitative network analysis too, because the value it transacts in the sector network is far too significant to omit and its connectivity (reflected by its degree) is higher than the connectivity of any other vital or non-vital activity cluster in the sector network. The household has the highest degree in all ranges of link weight due to the volume of its spending and salaries. Although the household, its infrastructure and its functions have not been labelled vital by the BVI-project, clearly some workers remotely contribute from their home office to the vital value provided by the vital sectors. Furthermore, a household that produces energy evidently contributes to the value produced by the energy sector heading the current vital sector ranking list. 4. Background, methodology and results from the analysis of Input-Output table time series Combining the disciplines of economic data research and complex network research by means of the network analysis from Input-Output table time series, resulted in observations and insights about network properties, (dis)similarities of the German and Dutch economies and changes over time. An Input-Output table can be considered as an overlay network of a national economy in which the monetary transactions between thousands of enterprises and millions of households are aggregated. Because economic sectors and their sub-ordinate activity clusters are interlinked by monetary transactions and the intermediate block of an IO table has the same structure as an adjacency matrix, it is possible to model and represent economic systems as networks (suitable for complex network analysis). Thus in this unit of research, monetary transaction networks have been constructed from time series of monetary IO data. In the proposed multi-weighted research methodology the monetary transactions are described as link weights between the activity clusters represented as nodes. As a consequence, the link weights determine the network topology. The research methodology is called multi-weighted because: 1. it includes three information domains; node weights, link weights and topology, 2. both node weights and link weights can represent various types of weights such as monetary values or the number of people working within a node (activity cluster).
111
The proposed methodology has been applied by means of two quantitative case studies. The first case study focusses on the Dutch economic network (105 activity clusters/nodes) and the second case study aims to compare the German and the Dutch networks. The latter required the design of a new 59 node network construct which enables comparing the Dutch and German network metrics and properties. Furthermore, the changes/developments over time in a network construct are taken into account by examining and comparing strictly separated network instances. Over the period 1987-2007 each of the 21 Dutch network instances has been constructed from one particular Input-Output table that records the monetary transactions in the Dutch economy during one particular year. Here after the conclusions from the analysis results of the Input-Output table time series are given, combined with answering RQ2 “What is a sector network and how did it evolve?” and its sub-questions SQ2a and SQ2b. The proposed answer to the first part of RQ2 “What is a sector network?” is the following: A sector network is a (fully meshed) network in which the nodes represent economic sectors. Although at this overlay level the economic sectors are the nodes, recursively each sector is a network in itself. This property repeats itself for each of its component activity clusters. From an economic system perspective, the term sector network is an abstraction capturing the produced and consumed value, shared through all relations in the sector network [Leontief,1936]. A sector network can be envisaged at global scale, continental scale, national scale and smaller geographical areas such as provinces, cities and neighbourhoods. From a physical perspective, the infrastructures that for example connect 7.4 million Dutch households and 1.25 million enterprises constitute the real networks at Dutch national level in 2012. The sector network is an abstraction aggregating all activity clusters of an economic system which can be envisaged transacting and transferring economic (and social) value upon these real networks. From a complex network perspective, the sector network and its topology can be analysed (from national Input-Output data) at various hierarchical network overlay levels. Each overlay is solely defined by the corresponding number of nodes/activity clusters (N) belonging to that particular aggregate. However, it is important noting that all different overlays denote one and the same network. At the overlay level N = 20 in each yearly instance of the German and Dutch Input-Output data, the 20 activity clusters have been observed to be fully meshed although at this overlay level a few links have bi-directional link weights of only one million euro. Note that one million euro is the smallest unit of value recorded in the researched Input-Output tables. Regarding the observed full mesh topology at N = 20, an exception was discovered in three yearly instances of corrected German data [Statistisches Bundesamt Volkswirtschaftliche Gesamtrechnungen,2010]. Due to the ESR95 revision, in each of the 1997-1999 network instances one bi-directional link weight has been rounded down to zero causing one missing link at overlay level N = 20. Combining this with the observations at the overlay levels N = 36, N = 59, N = 72 and N = 105 (see figure 34), the conclusion is drawn that beyond the number of 20 activity clusters (N > 20), not all nodes/activity clusters are linked to each other. Supported by the observations from researching contemporary EACSs (presented in chapter 3) and the observations from the network analysis (presented in section 4.4), the network overlay level of 20 activity clusters is proposed to be called the sector network level. Thus, at sector network level (N = 20) and at all higher aggregate overlay level (with N < 20), the network structure can be characterised as a complete graph KN (with link density p = 1). At lower hierarchical overlay levels (N > 20) still a high link density p and a relatively high percentage of hubs can be observed, but at these overlay levels a full mesh structure is not visible (p < 1). When increasing the number of nodes N of economic network overlays in the range N > 20, the average network degree E[D] increases but the link density p decreases. Descending the hierarchy of economic network overlays into the range of very large numbers of nodes, it is unknown whether E[D] will keep on increasing (see table 12a).
112
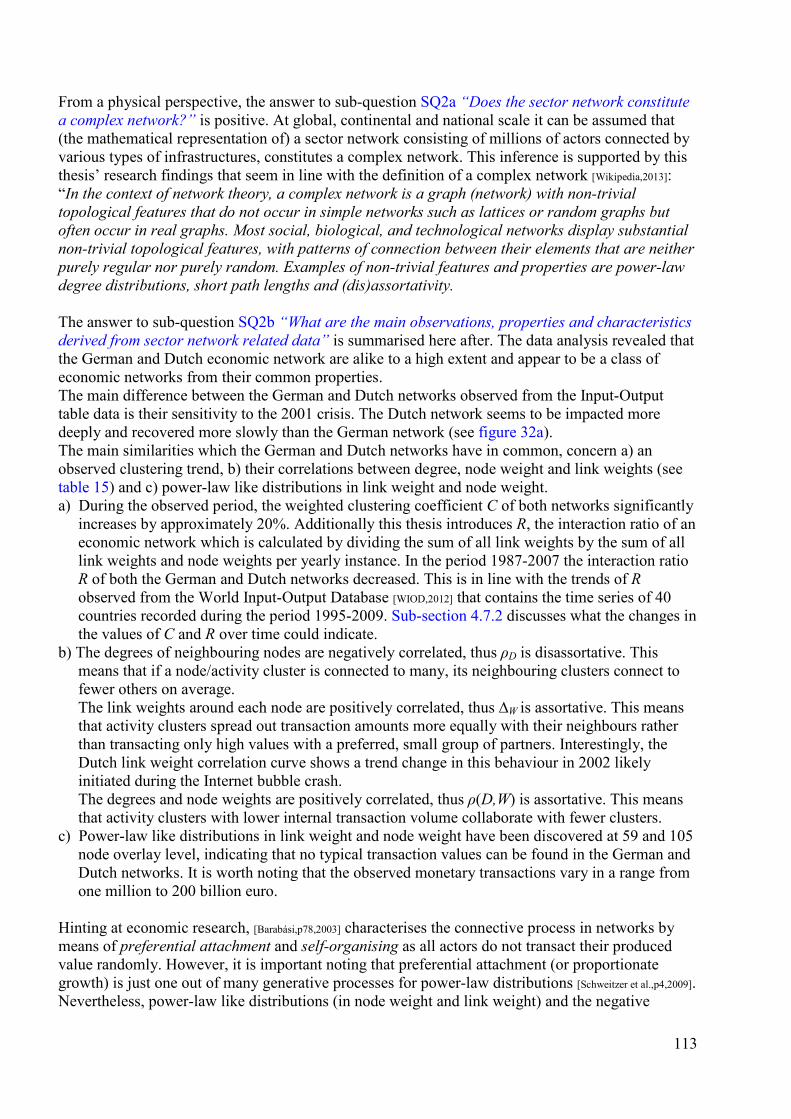
From a physical perspective, the answer to sub-question SQ2a “Does the sector network constitute a complex network?” is positive. At global, continental and national scale it can be assumed that (the mathematical representation of) a sector network consisting of millions of actors connected by various types of infrastructures, constitutes a complex network. This inference is supported by this thesis’ research findings that seem in line with the definition of a complex network [Wikipedia,2013]: “In the context of network theory, a complex network is a graph (network) with non-trivial topological features that do not occur in simple networks such as lattices or random graphs but often occur in real graphs. Most social, biological, and technological networks display substantial non-trivial topological features, with patterns of connection between their elements that are neither purely regular nor purely random. Examples of non-trivial features and properties are power-law degree distributions, short path lengths and (dis)assortativity. The answer to sub-question SQ2b “What are the main observations, properties and characteristics derived from sector network related data” is summarised here after. The data analysis revealed that the German and Dutch economic network are alike to a high extent and appear to be a class of economic networks from their common properties. The main difference between the German and Dutch networks observed from the Input-Output table data is their sensitivity to the 2001 crisis. The Dutch network seems to be impacted more deeply and recovered more slowly than the German network (see figure 32a). The main similarities which the German and Dutch networks have in common, concern a) an observed clustering trend, b) their correlations between degree, node weight and link weights (see table 15) and c) power-law like distributions in link weight and node weight. a) During the observed period, the weighted clustering coefficient C of both networks significantly increases by approximately 20%. Additionally this thesis introduces R, the interaction ratio of an economic network which is calculated by dividing the sum of all link weights by the sum of all link weights and node weights per yearly instance. In the period 1987-2007 the interaction ratio R of both the German and Dutch networks decreased. This is in line with the trends of R observed from the World Input-Output Database [WIOD,2012] that contains the time series of 40 countries recorded during the period 1995-2009. Sub-section 4.7.2 discusses what the changes in the values of C and R over time could indicate. b) The degrees of neighbouring nodes are negatively correlated, thus ρD is disassortative. This means that if a node/activity cluster is connected to many, its neighbouring clusters connect to fewer others on average. The link weights around each node are positively correlated, thus ∆W is assortative. This means that activity clusters spread out transaction amounts more equally with their neighbours rather than transacting only high values with a preferred, small group of partners. Interestingly, the Dutch link weight correlation curve shows a trend change in this behaviour in 2002 likely initiated during the Internet bubble crash. The degrees and node weights are positively correlated, thus ρ(D,W) is assortative. This means that activity clusters with lower internal transaction volume collaborate with fewer clusters. c) Power-law like distributions in link weight and node weight have been discovered at 59 and 105 node overlay level, indicating that no typical transaction values can be found in the German and Dutch networks. It is worth noting that the observed monetary transactions vary in a range from one million to 200 billion euro. Hinting at economic research, [Barabási,p78,2003] characterises the connective process in networks by means of preferential attachment and self-organising as all actors do not transact their produced value randomly. However, it is important noting that preferential attachment (or proportionate growth) is just one out of many generative processes for power-law distributions [Schweitzer et al.,p4,2009]. Nevertheless, power-law like distributions (in node weight and link weight) and the negative
113
degree-degree correlation found in the German and Dutch data are in line with commonly observed features in topological community overlays constructed upon various types of complex networks [Ge&Wang,2012] such as the Internet and biological networks [Newman,p7,2003b]. Derived from the literature [Bunge,1979],[Barabási,2003],[Kinneging,2005] and the above mentioned findings from the German and Dutch data analysis, the proposed answer to the second part of RQ2 “How did the sector network evolve?” is the following: The sector network evolved as a result of the division of labour, the specialisation of all actors and their choices to preferentially relate, transact and exchange their produced value. This answer implies that the behaviour of the actors reshapes the topology of economic networks. In sub-section 4.7.2, five intuitive conclusions are added to the answers given to RQ2 and SQ2b. 4.7.2 Intuitive conclusions This sub-section discusses this thesis’ intuitive conclusions (IC1-IC4) attempting to relate: a. the economic network of interacting nodes (organisations and individuals), b. the behaviour of interacting nodes (e.g. individualism, preferential attachment and preferential detachment in economic networks), c. drivers that influence the behaviour of interacting nodes (availability/scarcity of resources, the urge to efficiently save time and money), d. transition processes (e.g. the fragmentation of organisations*), e. metrics such as clustering, degree, link weight, node weight, number of nodes and number of links from which network properties and indicators can be derived, f. network properties (scale-free distributions in degree/link weight/node weight), g. network indicators (the change over time regarding the values of the clustering coefficient C, the network interaction ratio R** and the trend of the organisation fragmentation). The four intuitive conclusions discussed here after may generate new hypotheses. First Intuitive Conclusion Probably, contemporary economic networks belong to the class of scale-free networks. Albert and Barabási have demonstrated that many types of complex networks have in common that their properties can be captured by power-laws [Kuipers,2004] and that these networks seem to be ruled by preferential attachment and self-organising. The scarcity of resources as perceived by many actors, could be a universal driver behind preferential attachment behaviour and scale-free distributions. This could relate to the often quoted explanatory mechanism that the rich get richer, the large get larger while the small get smaller (trying to connect to the winners). Then the statistical data reflects the interplay of the involved actors in power-law like distributions. The meaning of the exponent value of the Probability Density Function (PDF) is currently unknown. The research on power-law behaviour has mainly focussed on the degree distributions of networks. According to [Barabási,p86,2003] for large scale-free networks, the degree PDF exponent values have been observed to vary between 2 and 3. This is in line with the exponent values between 1.4 and 3.2 listed in an overview of findings from the analysis of 27 types of networks [Newman,p10,2003a]. (*) Here, the organisation fragmentation process refers to the downsizing of organisations (shrinking in headcount) resulting in an increase of the number of small/one person enterprises. (**) The network interaction ratio R reflects the level of value sharing between the nodes in an economic network as a fraction (between 0 and 1) of the shared value and the total value present in that network.
114
Second Intuitive Conclusion Probably, the scale-free property of economic networks can be deduced from the distribution of their node weights and their link weights as well. Supportive to IC1 and IC2 are the findings from the IO data analysis that the link weight and node weight PDF exponent values of the Dutch economic network increase when descending the network hierarchy. For example, a link weight PDF exponent value 1.44 was found at 59 node overlay level and 1.6 was found at the 105 node overlay of one and the same Dutch economic network (see table 13). Unfortunately it was not feasible to find convincing scale-free degree distributions due to the relatively small number of nodes derived from the IO data of the researched economic networks. When descending the overlay hierarchy of economic networks, likely the corresponding variety in degree (compare and ), link weight and node weight increases. This effect may figure 37a 37bindicate that researching the distributions of the degree, link weights and node weights in overlays consisting of hundreds of nodes, could prove that economic networks are scale-free networks. Explained here after, the behaviour of the PDF slopes of sets of network instances over split time intervals could be researched from their link weights and node weights. A set of economic networks would need to be selected representing countries clearly affected by the same crisis. This research would require comparing the selected economic networks at exactly the same overlay levels while also keeping the number of bins of the PDFs exactly the same (see table 12a and figure 34). The years featuring the commonly recognised start, apex or ending of a crisis should be determined and could be used to split the time series in two parts (before and after the apex of a crisis) or in three parts (before the start, during and after a crisis). Doing so, insight about the meaning of the PDF slope could be derived from IO data reflecting the recorded economic high and low points of past business cycles. If future analysis of (early 21st century) split time series would give different PDF slope values, this “backward-engineering” approach could shed new light on the meaning of the PDF slope, because most industrialised countries faced the recent economic crisis simultaneously and their IO data is recorded and publicly available [WIOD,2012]. It could also be possible to merge IO data of sets of comparable countries in order to construct split time series that contain a sufficient amount of nodes. Third Intuitive Conclusion Probably, the behaviour of the interacting nodes (e.g. preferential attachment and detachment) collectively reshapes the structure of a) economic networks as can be observed from their transactions and b) the underlying physical networks. Likely related, the reshaping of a) and b) occurs time-lagged which complicates understanding the robustness and stability of economic networks. This IC3 proposes that the collective behaviour of the participating actors continuously reshapes the economic network structure and subsequently the underlying physical networks. [Newman,p1,2003b] states that recent studies of network structure have concentrated on a small number of properties that appear to be common to many networks and can be expected to affect the functioning of networked systems in a fundamental way. Among these, perhaps the best studied are the “small-world effect” [Travers&Milgram,1969] network transitivity or “clustering” [Watts&Strogatz,1998] and degree distributions [Barabási&Albert,1999]. How do the forces that reshape economic networks cascade their influence towards the underlying physical networks? One can compare the water level in a river with the transaction volume on a link in an economic network and compare a riverbed with a physical link of an underlying infrastructure (enabling economic transactions). Temporarily, a riverbed can run dry or the river- banks can be overflowed as the seasons pass. Because fluctuations are natural, such a situation does not necessarily imply a crisis. However, when drought or flooding become structural over a longer period, a transition process may start to fundamentally reshape the landscape. This time-lagged
115
mechanism could also be applicable to the reshaping of the physical networks that provide the foundation for economic networks. Fourth Intuitive Conclusion Three network parameters are proposed as additional economic indicators, because being network related, they seem to reflect some socio-economic processes better than the existing economic indicators [SN,p5,2013d],[Miller&Blair,p306-308,2009]. An elaboration follows of what these new network indicators measure, how they relate, and which economic processes they possibly reflect. The three network indicators are likely to be independent, because they are calculated differently and from different parts of the data. They have in common that they reflect the effect of the collective behaviour of all actors on the reshaping of an economic network but these indicators emphasise three different aspects: amount of personnel per node (organisation), value concentration and value sharing 1. The organisation fragmentation could be defined in several variants such as small enterprises to total (in various ranges of numbers of workers per small enterprise), or more broadly from statistics about enterprise split ups, privatisation, agencification [Dan et al.,2012], mergers and acquisitions. This thesis highlights the extreme variant one-person enterprises to total* because compared to other organisation fragmentation variants this one clearly reflects solitariness and relates to the relatively recent phenomenon of workers on own account without personnel. Likely, there is a connection with the outsourcing of personnel by companies and likely, the increase in organisation fragmentation is partly caused by the current widespread availability of Digital Information Networks (DINs). A substantial part of all work that can be performed digitally, has started to return to the household premises because doing so saves time and money. Probably, ensembles of fragmenting organisations together increase the node weight value of the activity cluster to which they primarily belong due to the extra administrative burden and the additional complexity of the multiplication of functions and business relations. From a network perspective, an increasing amount of (smaller) enterprises interacts within and from the same activity clusters**, together producing more or less the same value that eventually results in the final demand fi [Miller&Blair,2009]. Unless compensated by an increase in the sum of all link weights an increasing organisation fragmentation contributes to a decreasing value of R (being the second network indicator to discuss). 2. The interaction ratio R measures the level of value sharing between economic activity clusters as a fraction (between 0 and 1) of the shared value and the total value present in that network. From the 1991-2004 German and 1987-2007 Dutch time series of IO data, the trends were both found negative. In line, the 1995-2009 German and Dutch trends from the WIOD time series (see Appendix Observations from the World Input-Output Database and [WIOD,2012]) were also found negative demonstrating that during 1995-2009 the network interaction ratio value of 25 out of 40 countries decreased (see table 30 and 31). R decreases, when the sum of the internal monetary flows of the nodes increases unless compensated by an increase in the sum of all link weights. R can decrease under the circumstances of an increasing organisation fragmentation. A comparable situation could arise, when privatisation and dismantling of monopolies create multiple enterprises, which “blow up” the internal monetary flows within an activity cluster. (*) E.g. from the national enterprise related data in table 17b can be calculated that the organisation fragmentation increased by 7% between 2007 and 2012 (as 694k/1.247k = 0.56 in 2012 and 473k/956k = 0.49 in 2007). (**) The Dutch and German economic networks are assortative in link weight. Thus in this case activity clusters share their transaction amounts more equally with their neighbours rather than transacting only high values with a preferred, small group of partners. Assortativity in link weight likely influences the value of C more positively than disassortativity.
116
3. According to [Watts&Strogatz,1998] the weighted clustering coefficient C measures the network transitivity of any weighted network. In this thesis, C is called to measure the level of clustering in an economic network. C measures the clustering trend of a weighted economic network by means of link weight values multiplied within all triangles of activity clusters that can be identified in the network (see sub-section 4.4.1 and [Onnela et al.,2005] for more detail). From the 1991-2004 German and 1987-2007 Dutch time series of IO data, their clustering trends were both found positive, indicating concentration(s) of value. While R operates on link weights and node weights, C sums all the nodes’ weighted clustering coefficients ci which operate on triangles of link weights (wijwikwjk)1/3 and degree di. The trend in R reflects dynamic effects within and between the activity clusters. In contrast, C ignores the node internal effect of organisation fragmentation and only deals with the external effect between activity clusters*. As the above is merely an attempt to connect econophysics to socio-economic processes, sub-section 8.3.3 recommends further research regarding the socio-economic meaning of the network indicators. This research could include studying the network indicator fluctuations in the 40 IO time series recorded in [WIOD,2012] and if possible from more detailed network constructs at organisational level**. Comparing the network indicator fluctuations with coinciding economic business cycles could contribute to gaining more insight about the impact of actors’ collective behaviour on the process of cluster formation. (*) When attempting to make meaning from comparing values of R or C belonging to different countries’ economic networks, the overlay level of the network constructs should be similar. For instance in [WIOD,2012] all IO tables contain a 35x35 matrix constituting the intermediate block (explained in section 4.2). (**) When comparing economic networks at organisational level, the number of nodes will differ per geographical area because at this detailed network level each node represents an individual organisation.
117
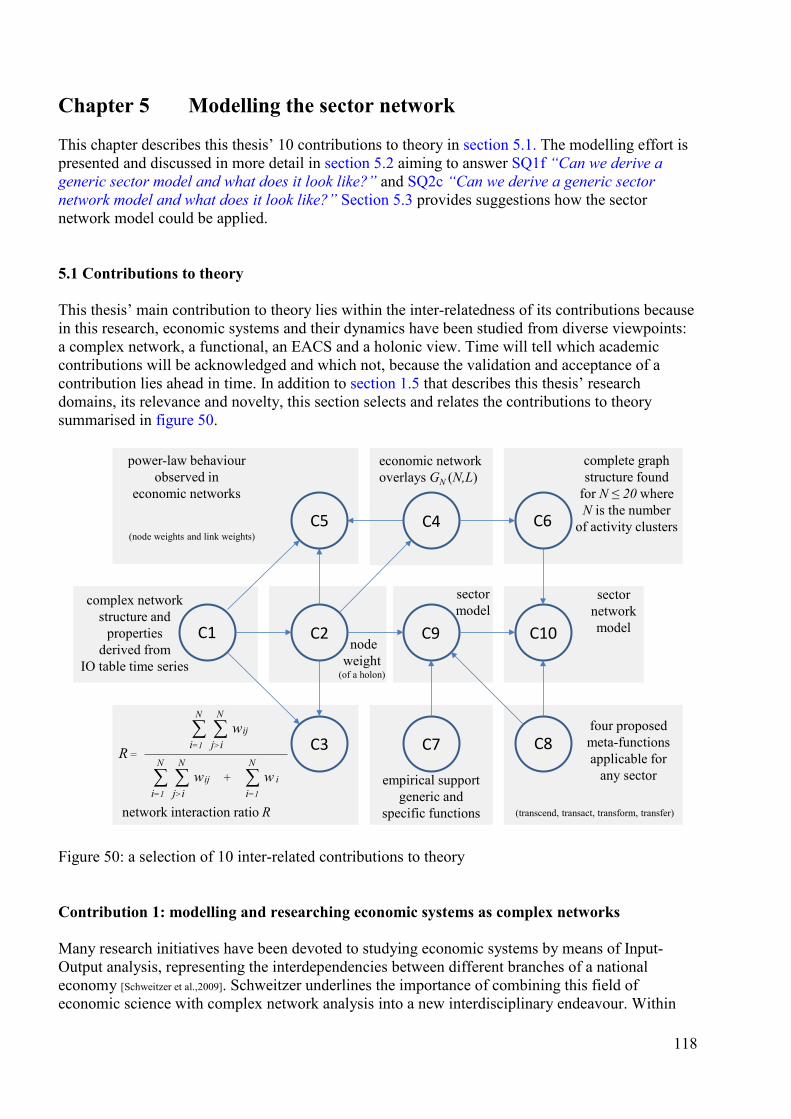
Chapter 5 Modelling the sector network
This chapter describes this thesis’ 10 contributions to theory in section 5.1. The modelling effort is presented and discussed in more detail in section 5.2 aiming to answer SQ1f “Can we derive a generic sector model and what does it look like?” and SQ2c “Can we derive a generic sector network model and what does it look like?” Section 5.3 provides suggestions how the sector network model could be applied. 5.1 Contributions to theory This thesis’ main contribution to theory lies within the inter-relatedness of its contributions because in this research, economic systems and their dynamics have been studied from diverse viewpoints: a complex network, a functional, an EACS and a holonic view. Time will tell which academic contributions will be acknowledged and which not, because the validation and acceptance of a contribution lies ahead in time. In addition to section 1.5 that describes this thesis’ research domains, its relevance and novelty, this section selects and relates the contributions to theory summarised in figure 50.
Figure 50: a selection of 10 inter-related contributions to theory Contribution 1: modelling and researching economic systems as complex networks Many research initiatives have been devoted to studying economic systems by means of Input-Output analysis, representing the interdependencies between different branches of a national economy [Schweitzer et al.,2009]. Schweitzer underlines the importance of combining this field of economic science with complex network analysis into a new interdisciplinary endeavour. Within
C1
C5
C2
C3 C7 C8
C6C4
C9 C10
complex networkstructure and
properties derived from
IO table time seriesnode
weight(of a holon)
network interaction ratio R
economic network overlays GN (N,L)
sector model
sectornetworkmodel
complete graph structure found
for N ≤ 20 whereN is the number
of activity clusters
empirical supportgeneric and
specific functions
four proposedmeta-functionsapplicable for
any sector
(transcend, transact, transform, transfer)
power-law behaviourobserved in
economic networks
(node weights and link weights)
R =i=1 j>i∑ ∑ wij
N N
i=1 j>i∑ ∑ wij
N N
∑ w i
N
i=1
+
118
this emergent intermediate field, this thesis’ first contribution to theory aims to provide a more in-depth understanding of economic systems by applying advances from the scientific discipline of complex networks. Besides designing a research methodology (section 4.3) to enable the network analysis of time series of Input-Output tables, other data sets were added such as the time series of the jobs of employees and the structure of EACSs, in order to broaden this research. Contribution 2: introduction of the term node weight This contribution proposes the condensed term node weight firstly aiming to strengthen the connection between complex network theory and holon theory and secondly to introduce* a term with a conceptual reach comparable to the widely used term link weight. In [Newman,2003b] is stated: “Vertices** can also have weights or other numerical quantities associated with them, or may be drawn from some discrete set of vertex types”. Known from complex network theory and graph theory, the terms self-loop and diagonal element (the latter in a matrix context) touch on the attributes and properties of nodes, as formulated above by Newman. When a transaction between activity clusters (or nodes) is defined as a link, the transaction within an activity cluster (or node) can be regarded as a self-loop. The term node weight however, can be used in more general cases where the node weight and link weight may capture different properties of links and nodes. For example, the number of employees in an activity cluster, can be denoted by node weight which has no evident association to self-loops. Although this thesis aims to strongly limit the amount of new vocabulary, the term node weight seems to fill a gap because economic networks were studied in a weighted fashion and at various overlay levels. A node can be considered a network at lower hierarchical overlay level, so its weight (being the whole of its internal transactions and functions), can be analysed as a network. This phenomenon of recursiveness reflects that a node and its weight constitute a non-overlapping community network at a lower overlay level [Ge&Wang,2012]. From a functional perspective, the term node weight also illustrates the difference in complexity between nodes and links. Although the variety of classes of real networks complicates making generic statements, the following might be generally applicable. Without transforming them, the links carry the transacted items of value (prepared for transfer within the originating nodes) towards the destination nodes which can transform the received items (figure 51). Contribution 3: the network interaction ratio R In sub-section 4.4.1 this thesis proposes a network interaction ratio R which could be applied as an economic network indicator as well. It is calculated by dividing the sum of all link weight values by the sum of all node weight and link weights values in one yearly network instance at a given overlay level GN (N,L). Applicable for (at least) economic networks, R indicates the level of interactivity within a network (or sub-network) derived from its weighted adjacency matrix W. If R approximates zero at an overlay level N > 1, theoretically this economic network would reach a standstill. From time series of weighted adjacency matrices, R can capture an important dynamic aspect of an (economic) network or sub-network. The trend in R reflects the development in value sharing between N activity clusters as a fraction (between 0 and 1) of the shared value and the total value present in that economic network (see figure 31 in sub-section 4.4.1). (*) The IEEE paper Node Weight Computation in MANETs [Farkas et al.,2007] is an early example of a publication that utilises the term node weight (in the context of real-time managing applications in mobile ad hoc networks). (**) In this thesis, the terms node and vertex (plural vertices) are considered synonyms.
119
Contribution 4: measuring economic network properties at various overlay levels Section 4.4 presents economic systems by means of complex network constructs based on their IO table time series at five different overlay levels. Also at five different overlay levels section 4.1 describes the branching properties of EACSs and section 4.5 exemplifies the branching and quantitative properties from statistical data about the jobs of employees in The Netherlands. This fourth contribution enriches the insights about the properties of one and the same network at different hierarchical levels such as the nature of its structure, its connectedness, its degree distributions and power-law behaviour. Contribution 5: power-law behaviour Sub-section 4.4.4 demonstrates power-law like behaviour in economic networks as observed in the node weight and link weight probability density functions (PDFs). In line with [Barabási,2003], this observation leads to the intuitive conclusion that economic networks can be characterised as scale-free networks (see also sub-section 4.7.2). Contribution 6: the boundary observed around N = 20 in the German and Dutch IO data Elucidated in figure 34, the maximum number of sector nodes of a contemporary sector network is explained in sub-section 4.4.2. Concerning the class of economic networks, this contribution suggests that at sector level all nodes can reach a full mesh structure (in prosperous years) while a larger set of sub-sectors cannot. Within the context of this thesis’ research, a full mesh sector network structure indicates that at least in one direction, value flows between all node pairs which can be visualised by means of a complete undirected graph. From the Input-Output data, a complete graph area can be distinguished where 2 ≤ N ≤ 20 and the average network degree E[D] = N-1,while an adjacent inter-mediate area can be observed where N > 20 and E[D] < N-1. Section 3.3 shows that over the past 80 years the number of sections in EACSs varied between 9 and 29. Combining these observations from classification history and IO data analysis (see table 12a and 12b), it may be concluded that N = 20 is a kind of a break-point which demarcates (from a complex network perspective) a border where activity clusters can be qualified as sectors on the one side and as sub-sectors on the other side. Thus each pair of economic sectors can share unique value without another sector intermediating while this is not always the case for economic sub-sectors. Contribution 7: empirical support for Bunge’s theory about the functions of sectors This contribution concerns the empirical support found for the part of the systemic theory [Bunge,1979] that postulates the distinction between generic and specific functions of sectors (see section 2.1). Bunge’s theory about the functions of sectors can be summarised as follows: - every human society (σ) can be analysed into a number of sectors and sub-systems, - the functions of a system define what the system does. His theory about the functions of sectors contains: G(σ) representing the generic functions of all sub-systems of human society σ F an F-system representing the set of functions characterising a member sub-system σ’,
where a sector is considered to be a sub-system F(σ) representing an F-sector of human society σ
120

FS(σ) representing the specific functions of the F-sector of σ. These functions are in the structure of each sub-system σ’ but not in G(σ).
Connecting Bunge’s theoretical distinction between generic functions G(σ) and specific functions FS(σ) to this thesis’ functional analysis (section 3.4 and 7.2), requires a hermetic distinction between unique and non-unique functions per sector. From Bunge’s theory it is not entirely clear if a function can be labelled specific when it appears in two sectors*. For this reason in this thesis the following convention is proposed: a complete set N of N non-overlapping economic sectors comprises all sectors’ unique functions and all sectors’ non-unique functions present in the network (containing all G(σ) and FS(σ) of FN (σ) in human society σ). When assuming a sector network consisting of 20 sectors, the ratio of the average number of unique functions per sector to the total number of functions in the sector network is always smaller than 1/N because each sector also has non-unique functions that appear in two or more sectors. Thus in a set of 20 sectors, the average uniqueness ratio of sector functions is smaller than 0.05 and in line with this prediction derived from the systemic theory of Bunge, some empirical support was found from two functional analysis exercises regarding: 1. the ISIC rev.4 explanatory notes (see table 7 in section 3.4) 2. the telecommunications related functions (see table 25 in section 7.2). From the functional analysis of the ISIC explanatory notes, on average 17.5 unique functions per section are found. The inventoried 542 different verbs consist of 349 verbs representing unique functions and 193 verbs representing non-unique functions. When associating functions to verbs and 20 economic sectors to ISIC sections, the average uniqueness ratio of sector functions is roughly estimated ~3% (explained and accounted for in section 3.4 and Appendix EACS ISIC). From the functional analysis of the selected telecommunications models and standards 331 different functions were inventoried (section 7.2). In expert workshops a uniqueness ratio of 0.03 was found (10/331). Although the findings from the second analysis exercise are also in line with the predicted value of the average uniqueness ratio (smaller than 0.05), in this second exercise the values of the uniqueness ratio fluctuate due to different possible viewpoints and complications caused by different definitions of telecommunications. Firstly, ISIC section J “Information & Communication” mentions 14 unique verbs on a total of 542 sector network functions. From ISIC this gives a uniqueness ratio (14/542) = 0.026. Secondly, in the inventory of telecommunications models and standards two unique functions (broadcasting and roaming) and nine unique composites were found. These composites require the noun data to uniquely distinguish them (see table 25). These two approaches give two uniqueness ratios: 2/331 = 0.006 and (2+9)/331 = 0.036 respectively. As a contribution to theory from this thesis’ functional analyses is estimated that on average ~3% of the functions of a sector is unique. Likely a lower uniqueness percentage/ratio could be found when extending this research on unique and non-unique functions. Contribution 8: four meta-functions recursively applicable at each network overlay level This contribution to theory proposes the verbs transcend, transact, transform and transfer as the four complementary meta-functions captured in this thesis’ sector model. From their names, meanings and applications observed in literature (see table 20 in section 5.2) these may have a conceptual reach large enough to represent all sector network functions (as researched in the sections 3.2, 3.4, 7.2 and Appendix EACS ISIC). (*) For instance, a function performed in the household sector and in one other sector poses this problem.
121
Contributions 9 and 10: the sector model and the sector network model These two complementary contributions to theory are explained in section 5.2 and visualised in figure 51 and figure 52(a-c). Both models unite this thesis’ findings at the highest abstraction level. Concerning hypothesis H1, examples of layered hierarchical graphs are included. Firstly, at sector network level, figure 47 in section 4.6 presents a layered view of the vital sectors. Secondly, figure 54 in section 7.3 presents an example the telecommunications related sector showing the interdependencies among its main technical components reflecting the vertical structure of the OSI model. 5.2 The sector network model This section answers the research sub-questions: SQ1f “Can we derive a generic sector model and what does it look like?” SQ2c “Can we derive a generic sector network model and what does it look like?” The answer to the first parts of both sub-questions is positive. Both models have been constructed: - from assessment and synthesis of sector related models known from literature (see section 2.3 and the Appendix Repository of assessed models), - reflecting the recursive character of holons proposed from holon theory [Koestler,1967], embedded in a systemic view provided by [Bunge,1979], - from the analysis of functions mainly based on the ISIC rev.4 explanatory notes and ITU G.80x, - based on the complex network structure and properties derived from IO table time series. This section firstly constructs the sector model (answering SQ1f) and secondly the sector network model (answering SQ2c). The sector network model contains the sector model as a generic component. Although this nesting is reflected in the title of this section, it is necessary to distinguish both strongly related models. This section accounts for the selection of views, arguments and considerations arising from literature review and the selection of research results (e.g. the functional analysis) that together have shaped both proposed models. Both the sector model and sector network model describe an economic system.The Wikipedia web page about systems theory lists the following aspects of system models: Models tend to provide specific views of reality (e.g. a national road system). A system comprises multiple views. For man-made systems it may be such views as planning, requirement, design, implementation, deployment, operational, structure, behaviour, input data, and output data views. A system model is required to describe and represent all these multiple views.
122

Model design requirements Practically, all the above mentioned multiple views cannot be gathered in one system model and certainly not in one comprehensive visualisation. The purpose of a model determines its view in order to offer a means to structure our thoughts about a particular domain (see thesis proposition 6). This thesis’ second research objective (section 1.3) addresses the modelling part and imposes the following model design requirements: 1. build knowledge from sector (network) related literature with focus on models and EACSs, 2. the sector model should be generically applicable to any sector, 3. both models must capture and reflect the main findings of this thesis work. Additionally, this thesis’ first and second hypothesis (section 2.5) encourage investigating: 4. generic layering in the selected models (focus H1), 5. functions and their uniqueness for each sector in particular (focus H2). Classes of functions and meta-functions of the sector model Firstly, as a result from literature review, hundreds of different functions were identified as a consequence of the research choice to directly associate functions with the verbs that characterise them. Secondly, the functional analysis (section 3.4, Appendix EACS ISIC and section 7.2) required classifying* the assessed sector related functions in order to understand their nature, to investigate and compare the quantities of functions in each class and to incorporate them in a sector model. Thirdly, constructing a sector model requires a limited set of terminology because hundreds of functions cannot be visualised in a comprehensive model construct. In order to capture this large number of functions this thesis proposes the use of meta-functions. The three main criteria for the selection of the meta-functions and their names are: 1. they should not the be the same as commonly used sector names or EACS section names, 2. they should support and reflect the recursive character of holons, 3. together they should be complementary and have a conceptual reach that is large enough to represent all generic, specific and unique functions of any activity cluster. The third criterion follows from the second holonic criterion implying that the meta-functions and the model in which they are incorporated, are usable at sub-ordinate hierarchical levels as well. Thus, the proposed meta-functions transcend, transact, transform and transfer are generic functions which are applicable to any section/sector and its sub-ordinate activity clusters. In addition to the above mentioned requirements it is important to distinguish activity clusters that change objects of value from activity clusters that do not change objects of value. This fundamental discriminatory rule has influenced the current classification methodology that shaped ISIC rev.4. For example [ISIC,2008] mentions that all activities classified in the trade related section G concern activities without transformation of the transacted objects. In line, from ISIC rev.4 can be observed that activities involving the movement of objects over distance are classified in ISIC sections other than the sections that involve the transformation of objects. Thus, these fundamental distinctions are reflected in the choice of the proposed four complementary meta-functions. (*) The labelling and grouping of functions has been validated by means of expert workshops and expert review; - telecom architects regarding the functions of telecommunications and, - classification methodology expert review from Statistics Netherlands regarding all ISIC related functions.
123
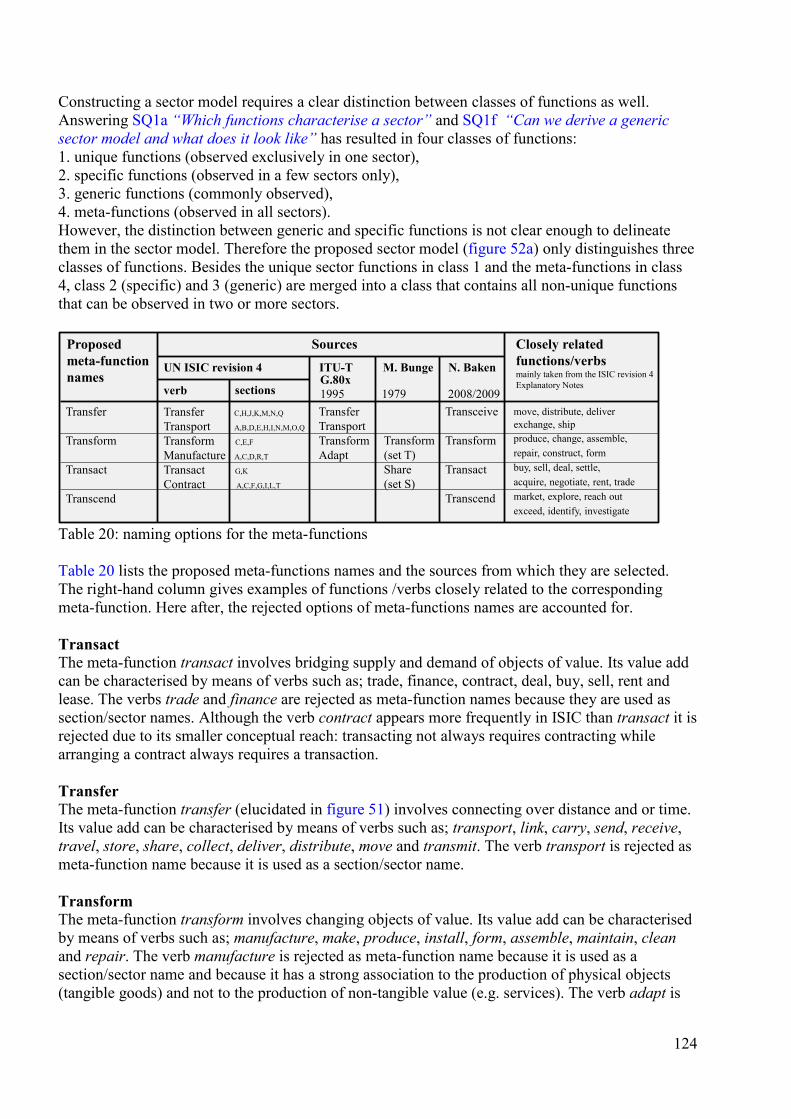
Constructing a sector model requires a clear distinction between classes of functions as well. Answering SQ1a “Which functions characterise a sector” and SQ1f “Can we derive a generic sector model and what does it look like” has resulted in four classes of functions: 1. unique functions (observed exclusively in one sector), 2. specific functions (observed in a few sectors only), 3. generic functions (commonly observed), 4. meta-functions (observed in all sectors). However, the distinction between generic and specific functions is not clear enough to delineate them in the sector model. Therefore the proposed sector model (figure 52a) only distinguishes three classes of functions. Besides the unique sector functions in class 1 and the meta-functions in class 4, class 2 (specific) and 3 (generic) are merged into a class that contains all non-unique functions that can be observed in two or more sectors.
Table 20: naming options for the meta-functions Table 20 lists the proposed meta-functions names and the sources from which they are selected. The right-hand column gives examples of functions /verbs closely related to the corresponding meta-function. Here after, the rejected options of meta-functions names are accounted for. Transact The meta-function transact involves bridging supply and demand of objects of value. Its value add can be characterised by means of verbs such as; trade, finance, contract, deal, buy, sell, rent and lease. The verbs trade and finance are rejected as meta-function names because they are used as section/sector names. Although the verb contract appears more frequently in ISIC than transact it is rejected due to its smaller conceptual reach: transacting not always requires contracting while arranging a contract always requires a transaction. Transfer The meta-function transfer (elucidated in figure 51) involves connecting over distance and or time. Its value add can be characterised by means of verbs such as; transport, link, carry, send, receive, travel, store, share, collect, deliver, distribute, move and transmit. The verb transport is rejected as meta-function name because it is used as a section/sector name. Transform The meta-function transform involves changing objects of value. Its value add can be characterised by means of verbs such as; manufacture, make, produce, install, form, assemble, maintain, clean and repair. The verb manufacture is rejected as meta-function name because it is used as a section/sector name and because it has a strong association to the production of physical objects (tangible goods) and not to the production of non-tangible value (e.g. services). The verb adapt is
Proposedmeta-functionnames
Transfer
Transform
Transact
Transcend
Transfer C,H,J,K,M,N,Q
Transport A,B,D,E,H,I,N,M,O,Q
Transform C,E,F
Manufacture A,C,D,R,T
Transact G,K
Contract A,C,F,G,I,L,T
Sources Closely relatedfunctions/verbsmainly taken from the ISIC revision 4Explanatory Notes
Transceive
Transform
Transact
Transcend
UN ISIC revision 4 ITU-T M. Bunge N. Baken
Transform(set T)Share(set S)
TransferTransportTransformAdapt
move, distribute, deliverexchange, shipproduce, change, assemble,repair, construct, form buy, sell, deal, settle, acquire, negotiate, rent, trademarket, explore, reach out exceed, identify, investigate
sectionsverbG.80x1995 1979 2008/2009
124
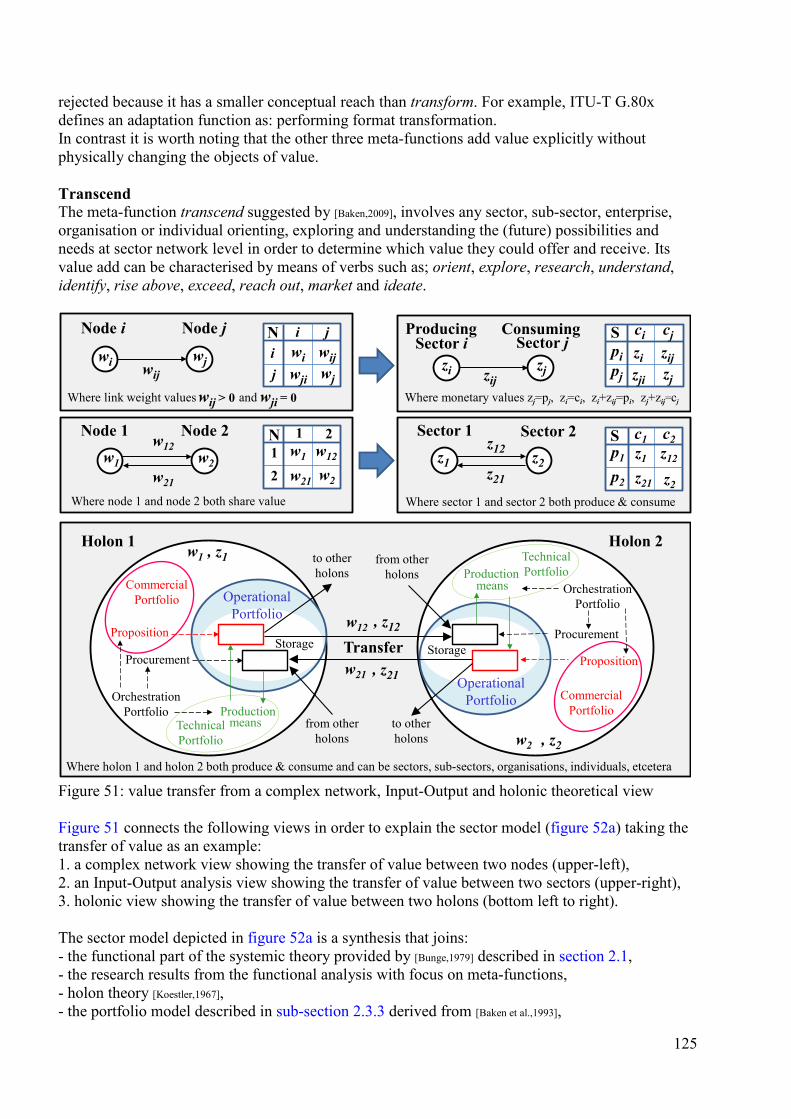
rejected because it has a smaller conceptual reach than transform. For example, ITU-T G.80x defines an adaptation function as: performing format transformation. In contrast it is worth noting that the other three meta-functions add value explicitly without physically changing the objects of value. Transcend The meta-function transcend suggested by [Baken,2009], involves any sector, sub-sector, enterprise, organisation or individual orienting, exploring and understanding the (future) possibilities and needs at sector network level in order to determine which value they could offer and receive. Its value add can be characterised by means of verbs such as; orient, explore, research, understand, identify, rise above, exceed, reach out, market and ideate.
Figure 51: value transfer from a complex network, Input-Output and holonic theoretical view Figure 51 connects the following views in order to explain the sector model (figure 52a) taking the transfer of value as an example: 1. a complex network view showing the transfer of value between two nodes (upper-left), 2. an Input-Output analysis view showing the transfer of value between two sectors (upper-right), 3. holonic view showing the transfer of value between two holons (bottom left to right). The sector model depicted in figure 52a is a synthesis that joins: - the functional part of the systemic theory provided by [Bunge,1979] described in section 2.1, - the research results from the functional analysis with focus on meta-functions, - holon theory [Koestler,1967], - the portfolio model described in sub-section 2.3.3 derived from [Baken et al.,1993],
Node i
Where node 1 and node 2 both share value
wi wijwj
wijwji
wiwj
Sector 1Node 1
w1
Node 2
w21
w2
w12
wij > 0
N i j
ji
w12
w21
w1
w2
N 1 2
21
Holon 1 Holon 2
Sector 2
Where link weight values Where monetary values zj=pj, zi=ci, zi+zij=pi, zj+zij=cj
Where sector 1 and sector 2 both produce & consume
Where holon 1 and holon 2 both produce & consume and can be sectors, sub-sectors, organisations, individuals, etcetera
Node jSector i
ConsumingProducingSector j zij
zji
zizj
S ci cjpipj
zi zijzj
z12
z21
z1
z2
S
wji = 0and
z1z21
z2z12
Transfer
c1 c2p1
p2
w2 , z2
TechnicalPortfolio
CommercialPortfolio
OrchestrationPortfolio
Proposition
w1 , z1
w12 , z12Storage
OperationalPortfolio
Procurement
Productionmeans
OperationalPortfolio
Storage
CommercialPortfolio
Proposition
Procurement
OrchestrationPortfolio
w21 , z21
meansProduction
TechnicalPortfolio
to otherholons
to otherholons
from otherholons
from otherholons
125
- the extended portfolio model that adds a financial portfolio to the 1993 portfolio model [Baken,2001], - the STOF model described in sub-section 2.3.4 [Bouwman et al.,2008]. The composition and structure of the extended portfolio model and the STOF model are to a high extent alike. Both models contain four inter-related component parts which describe the value proposition, the production means, the realisation of providing the value and the enabling financial arrangements respectively. Explicable from their different aims (sub-section 2.3.3 and 2.3.4), the main difference between these two models concerns the S of the STOF model which exclusively refers to Services, where its pendant in the extended portfolio model (the Commercial Portfolio) explicitly refers to both physical goods and services. As this thesis addresses a sector network in which both services and goods are relevant, the proposed sector model adopts the latter. Components of the sector model This thesis’ sector model is a system model that generically describes a sectors’ components and structure from an economic perspective. The sector model is constructed in a holonic manner supporting the recursive character of its activity clusters (sector, sub-sectors, organisation clusters, organisations and individual actors). The sector models’ terminology is applicable at each of these aggregation levels. Its components are the following four complementary portfolios. The Commercial Portfolio relating to: a) the STOF models’ Service domain (S), b) the value proposition e.g. the added value of the product offering, c) revenue (from operational sales), d) the description of the transferable value (e.g. the goods and services on sale), e) packaged, repackaged value elements, f) marketing plan. The Technical Portfolio relating to: a) the STOF models’ Technology domain (T), b) production means required to realise the product offering, c) investments or capital expenditure (CAPEX) concerning the production means, d) the means that enable transforming input value elements into transferrable output value, e) buildings, machines, equipment and tools (deployed more than one year), f) architecture roadmap concerning the innovation of inter-related production means (technology). The Operational Portfolio relating to: a) the STOF models’ Organisation domain (O), b) processes and or functions (activities performed by humans and production means), c) cost or operational expenditure (OPEX) concerning yearly recurring cost, d) transcend, transact, transform and transfer (representing generic, specific and unique functions), e) realisation of product provisioning/sales, assurance, billing, procurement and innovation, f) execution of tasks, making inter-related plans, monitoring and adjusting these plans. The Orchestration Portfolio relating to: a) the STOF models’ Finance domain (F), b) financial arrangements and rules, c) profit (the result of revenue minus cost, minus investments over time), d) enabling transactions and fulfilling boundary conditions for the other three portfolios, e) decisions concerning pricing, accepted risk, (expected) profitability assessments and contracts, f) business plan, evaluations and value cases (externally focused on the sector network as a whole).
126
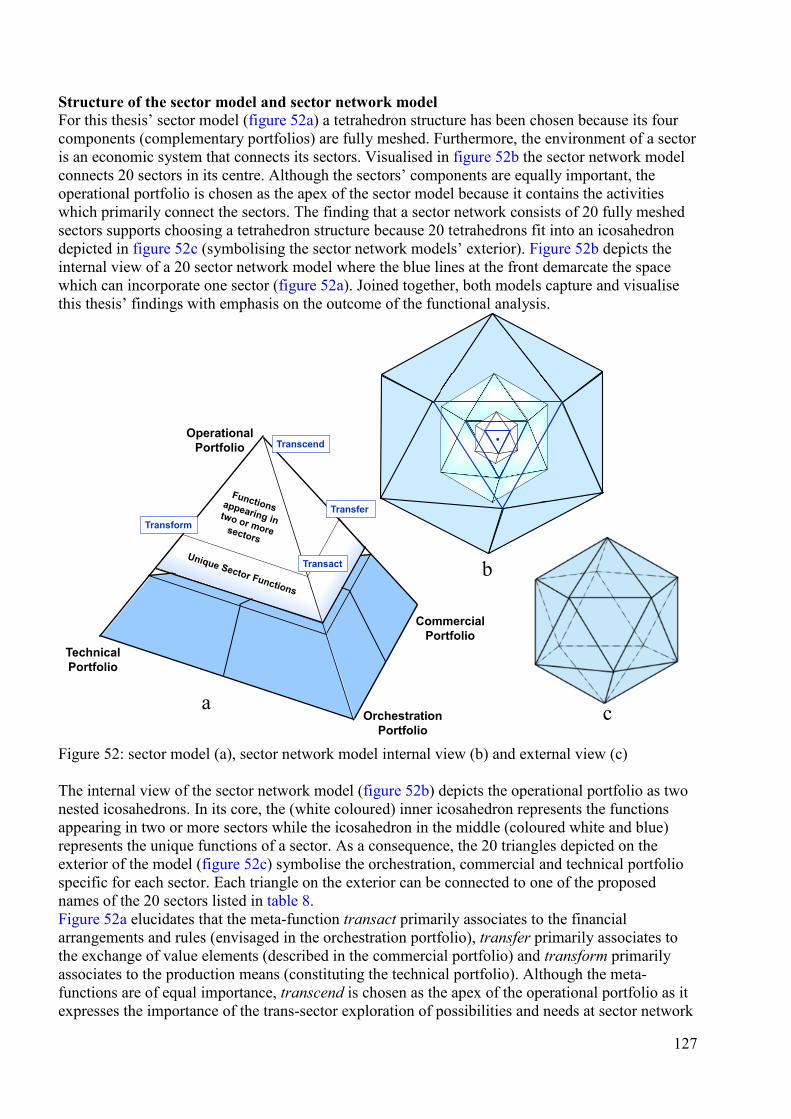
Structure of the sector model and sector network model For this thesis’ sector model (figure 52a) a tetrahedron structure has been chosen because its four components (complementary portfolios) are fully meshed. Furthermore, the environment of a sector is an economic system that connects its sectors. Visualised in figure 52b the sector network model connects 20 sectors in its centre. Although the sectors’ components are equally important, the operational portfolio is chosen as the apex of the sector model because it contains the activities which primarily connect the sectors. The finding that a sector network consists of 20 fully meshed sectors supports choosing a tetrahedron structure because 20 tetrahedrons fit into an icosahedron depicted in figure 52c (symbolising the sector network models’ exterior). Figure 52b depicts the internal view of a 20 sector network model where the blue lines at the front demarcate the space which can incorporate one sector (figure 52a). Joined together, both models capture and visualise this thesis’ findings with emphasis on the outcome of the functional analysis.
Figure 52: sector model (a), sector network model internal view (b) and external view (c)
The internal view of the sector network model (figure 52b) depicts the operational portfolio as two nested icosahedrons. In its core, the (white coloured) inner icosahedron represents the functions appearing in two or more sectors while the icosahedron in the middle (coloured white and blue) represents the unique functions of a sector. As a consequence, the 20 triangles depicted on the exterior of the model (figure 52c) symbolise the orchestration, commercial and technical portfolio specific for each sector. Each triangle on the exterior can be connected to one of the proposed names of the 20 sectors listed in table 8. Figure 52a elucidates that the meta-function transact primarily associates to the financial arrangements and rules (envisaged in the orchestration portfolio), transfer primarily associates to the exchange of value elements (described in the commercial portfolio) and transform primarily associates to the production means (constituting the technical portfolio). Although the meta-functions are of equal importance, transcend is chosen as the apex of the operational portfolio as it expresses the importance of the trans-sector exploration of possibilities and needs at sector network
a c
b
CommercialPortfolio
TechnicalPortfolio
OrchestrationPortfolio
OperationalPortfolio
Transact
Transfer
Transcend
Transform
127
level. When opening up the point in the core of the icosahedron, the 190 inter-sector connections become visible that join the sectors and their actors. 5.3 Alternatives and application of the models This section firstly discusses four alternatives which were considered during the construction of this thesis’ sector model and sector network model. Secondly, this section gives a suggestion for application of the two models. The experts responsible for the update of ISIC rev.4 and national EACSs are invited to take notice of this work when actualising these classification systems. The alternative modelling options and views are discussed here after and give room for discussion. Alternative views Constructing a layered view of the sector model has been considered. At higher abstraction level, the layered representation of a holon (figure 14) can represent a sector. However, a conclusion from the literature review and model assessment (sub-section 3.2.10) is that visualisations of models need not necessarily be layered. Constructing a layered view is optional. In this thesis, constructing a more detailed layered sector model is rejected as it would complicate: - elucidating the relations between the sector models’ four portfolio components, - visualising the inter-sector connections in a fully meshed sector network model. Constructing a circular view of the sector network model has been considered as well. For example figure 16 plots 20 ISIC sections on an ellipse showing their divisions and examples of groups and classes. However, constructing a circular view of a generic sector network model was rejected as it would be difficult to visualise 190 bi-directionally connected sectors. Alternative distribution of functions between the portfolios Constructing a sector model that attributes operational activities in each (or more than one) of its components, has been considered. For example sales activities could be attributed to the commercial portfolio, strategic and managerial activities attributed to the orchestration portfolio and engineering work to the technical portfolio. In this thesis, constructing both a sector model and sector network model with distributed functions was rejected as it would: - pose a partial conflict with the STOF model that attributes activities to its organisational domain, - complicate visualising the different types of functions in the two models simultaneously, - suggest that some activities/functions are more important than others. Alternative set of sector model components A five component sector model alternative has been proposed by N. Baken which separates and distinguishes a primary actor and a secondary actor as two separate model components. A primary actor produces and fulfils the supply towards a secondary actor receiving the demanded items of value. The five components of this alternative model are the commercial, technical, operational, supply and demand portfolio. Indeed, as elucidated in sub-section 2.3.1, Input-Output theory [Leontief,1936] distinguishes within sector S a producing Si and consuming Sj but introducing a fifth component in the sector (network) model would add modelling difficulties because: - a primary actor and secondary actor can belong to the same sector or different sectors, - a fifth component implies dividing up the four universal financial components profit, revenue, cost and investments (see sub-section 2.3.3),
128
Application of this thesis’ models When the initial meetings at the United Nations Statistics Division concerning the update of ISIC rev.4 are about to start, Statistics Netherlands representatives could bring this thesis’ work (based on a complex network approach) and the models that capture its essence, to the attention of this international community. They could discuss the suggestions how the current ISIC EACS could be upgraded. Derived from the ISIC explanatory notes, this thesis’ functional analysis (unique versus non-unique functions) influenced the construction of the model and yielded insights about what makes a sector a sector and which ones can be distinguished. The resulting functional view and structure could be of help solving current ambiguities in the ISIC explanatory notes. It could be of help clarifying the difference between sections and sectors and finally the sector network model could be supportive to a discussion about the 21st ISIC section U. 5.4 Conclusions This chapter joins this thesis’ contributions to theory. Likely, this thesis’ main contribution to theory lies within the inter-relatedness of its 10 contributions, because in this research economic systems have been studied from diverse viewpoints: a complex network*, a functional, an EACS and a holonic view. The contributions to theory include the proposed sector model and sector network model. The sector model connects four fully meshed components; the commercial, technical, operational and orchestration portfolio (relating to revenue, investments, cost and profit respectively). A tetrahedron structure has been chosen as it can connect four components and because its form allows for merging into an icosahedron connecting 20 sector tetrahedrons in its centre. This thesis’ seventh contribution provides empirical findings supporting the systemic theory of Bunge which distinguishes generic functions from sector specific functions. Both theory and the findings, derived from the functional analysis (of the ISIC rev.4 explanatory notes (section 3.4) and the models and standards relating to telecommunications (section 7.2)) seem in line with each other. For a contemporary 20 sector network is roughly estimated that ~3% of the inventoried functions of a sector is unique on average. Likely a lower average uniqueness percentage (or ratio) could be found when extending the research on unique and non-unique functions. When the initial meetings are about to start at the UN Statistics Department concerning the update of ISIC rev.4, Statistics Netherlands representatives could bring this thesis’ work and its models to the attention of this community as it gives suggestions to adapt the current EACS ISIC rev.4 and solve classification and descriptive ambiguities observed in this current version. (*) Conclusions from the complex network analysis are described in section 4.7 and are not repeated in this section.
129

Chapter 6 Trans-sector Innovation and isomorphisms This chapters’ connection between theory and practice contributes to answering RQ3 “Which promising trans-sector innovation examples can be identified?” and addresses its sub-questions: SQ3a “Which main isomorphisms can we detect among the sectors?” and the first part of SQ3b “Can we profit and find value when we horizontally transfer sector specific knowledge, capabilities, insights and experience among the sectors? This chapter relates and confronts the theory of trans-sector innovation and the binomial theorem applied on innovation combinations on the one hand, with experimental findings and results from expert interviews on the other hand. As an introduction, section 6.1 explains the theoretical concept of trans-sector innovation [Baken et al.,2003] and how an isomorphism based method could contribute to finding promising innovation examples. From practice, section 6.2 presents the results, the patterns and isomorphisms derived from an innovation experiment in which 114 master students have engaged. Additionally, section 6.3 summarises the results from trans-sector innovation related expert interviews, referred to as the service bundle 2020 containing examples of innovation concepts and combinations envisaged by the interviewees. Finally, section 6.4 joins trans-sector innovation from theory and patterns from practice. It analyses observed distributions of innovation combinations and the isomorphisms found. 6.1 Isomorphisms The concept of trans-sector innovation can be defined in short as innovation that involves two or more sectors. Regarding the term innovation [Wikipedia] suggests; “Innovation or renewal is the introduction of new ideas, goods, services and processes. Innovation can take place within organisations but also within broader arrangements”. Combined from [Bryson et al.,2006],[Webster,p603]
and the above mentioned suggestions, the following definition could be proposed: Trans-sector innovation concerns participants, originating from two or more sectors, actively engaged in the introduction of new ideas, goods, services, methods and or processes. From the 21 propositions of [Bryson et al.,2006] can be amended that collaboration is not an aim in itself. Together the participants define the short and long-term goals of each trans-sector innovation effort. N. Baken proposes: “Any sector contributes its specific value to our society and economy. Although each sectors’ technological or process concepts have a different status, theory building and language, they can have their pendants in other sectors. In this sense, sectors can be isomorphic. Just their nomenclature is different. Every sector speaks its own language”. The adjective isomorphic means being of identical or similar form, shape or structure [Webster,p622]. When two objects are of equal shape one could say these are isomorphic: they are related by an isomorphism. Identifying isomorphisms between sectors could be of help in searching for promising trans-sector innovations. Therefore N. Baken has suggested an isomorphism based innovation method consisting of two complementary methodological components. The first contributes to answering SQ3a and can be explained as follows: Identify concepts from sector A and B and label the ones that are isomorphic. Only concepts (instantiations) can be detected which are already in place and one can practice the translation of concepts between sectors. For example the following two concepts could be labelled isomorphic: uploading personal content to a shared medium (such as You-tube) and contributing home-generated energy to a distribution network for use by neighbouring households.
130
As a next step, the second methodological component contributes to answering SQ3b and aims to translate successful concepts known in sector A into unknown concepts in sector B as an experiment of thought. In this sense, value can be transferred from sector A to sector B. For example ATOS Origin [Stoffijn] and the University of Groningen [Kloppenburg,2008] have developed the Framework for Cure and Care (sub-section 2.3.8, figure 11). F4CC is based on the structure of the widely used process model eTOM (figure 66 in the Appendix Repository of assessed models) and translates telecommunications related terminology into healthcare related terminology while maintaining the eTOM structure of areas, rows and columns at process level 1. The layered structure of eTOM process level 0 (figure 60) has been maintained in F4CC as well. This example shows that an experiment of thought can increase mutual comprehension of sector specific value, tools and processes both in healthcare and telecommunications. Constructing F4CC firstly required insight and overview of the processes, components and structure on either side (see the vertically mounted layers of a holon figure 14) before the transfer of knowledge from telecommunications to healthcare could take place. The isomorphism based trans-sector innovation method proposed by N. Baken builds on the following general rule: only when a clear driver for change is commonly perceived among the potential participants, trans-sector innovation can take place. Implementing any solution firstly requires a sub-optimal situation featured by urgent needs, substantial dissatisfaction of involved actors (end-users, customers, employees etcetera) or increasing cost without compensation. Having analysed the trans-sector innovation examples from the experiment described in section 6.2 the tension between long term and short term interests became clearly visible. Ideas that seem useful will not always be realised because their revenues fall ahead in time. Also ideas that only serve a general purpose without reflecting the specific interests of a sector or a set of organisations, are less likely to take off compared to ideas that could serve the interests of specific actors. In this respect the success rate of the trans-sector innovation method could be positively influenced by trans-sector orchestration and leadership arrangements. Intuitively, the answer to the first part of SQ3b “Can we profit and find value when we transfer sector specific knowledge, capabilities, insights and experience among the sectors? must be positive. Practically, answering this question from literature review, experimental findings and expert interviews yielded additional insights which are presented in section 6.2, 6.3 and 6.4. 6.2 Results and patterns from a Trans-sector Innovation idea generation experiment This section presents the results from a trans-sector innovation idea generation experiment described in the publication “Towards Systematic Development of Trans-sector Digital Innovation” [Madureira et al.,2009]. The patterns derived from the experimental results contribute to answering RQ3 “Which promising trans-sector innovation examples can be identified?” and SQ3a “Which main isomorphisms can we detect among the sectors?”. The experiment has been carried out at the Delft University of Technology, faculty Electrical Engineering, Mathematics and Computer Science during 2007-2011. This experiment involved 114 master students (mainly originating from countries outside the EC) engaging in an innovation assignment. Listed in table 21, the participating students generated 55 innovation concepts, that clearly reflect solutions for global needs such as flood warning systems, oil-spill management, forest protection and disaster recovery management. During the initial stage of the experiment the number and names of sectors were unknown. For this reason the actors envisaged in the innovation ideas were mapped on an initial set of 22 categories serving as a provisional set of sectors. Mapping actors to sectors associated with security, media, communications and or administrative activities was perceived most difficult.
131
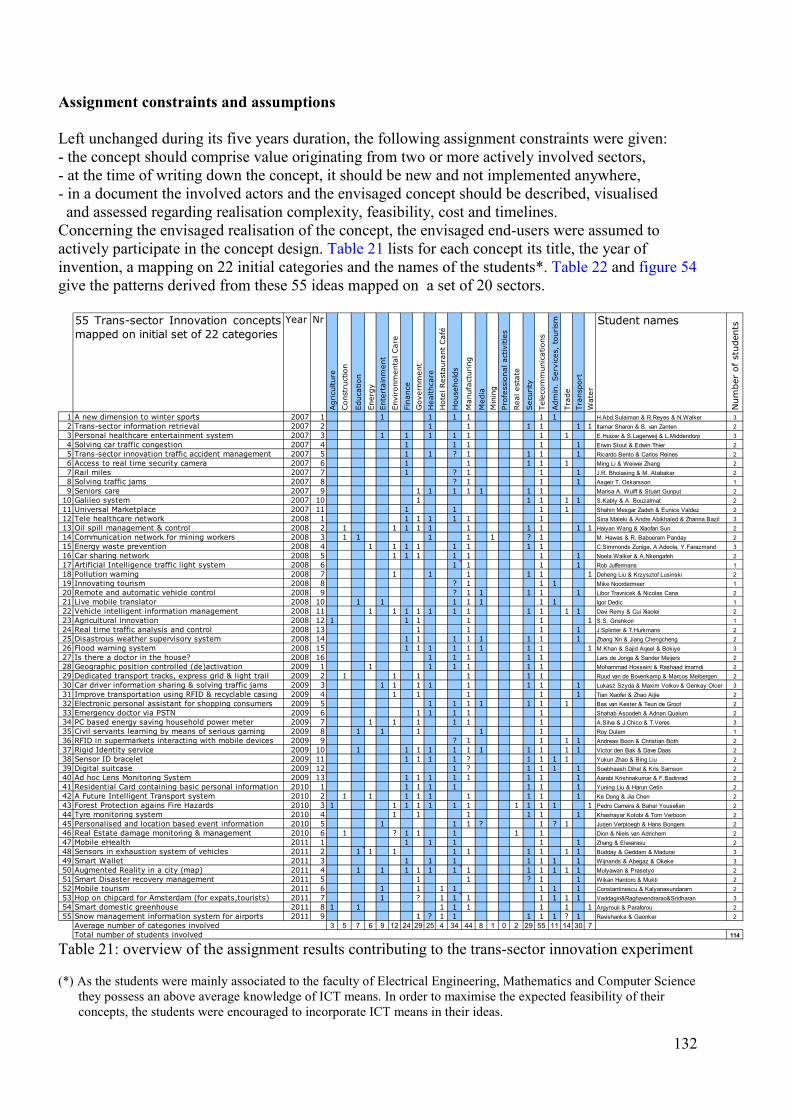
Assignment constraints and assumptions Left unchanged during its five years duration, the following assignment constraints were given: - the concept should comprise value originating from two or more actively involved sectors, - at the time of writing down the concept, it should be new and not implemented anywhere, - in a document the involved actors and the envisaged concept should be described, visualised and assessed regarding realisation complexity, feasibility, cost and timelines. Concerning the envisaged realisation of the concept, the envisaged end-users were assumed to actively participate in the concept design. Table 21 lists for each concept its title, the year of invention, a mapping on 22 initial categories and the names of the students*. Table 22 and figure 54 give the patterns derived from these 55 ideas mapped on a set of 20 sectors.
Table 21: overview of the assignment results contributing to the trans-sector innovation experiment (*) As the students were mainly associated to the faculty of Electrical Engineering, Mathematics and Computer Science they possess an above average knowledge of ICT means. In order to maximise the expected feasibility of their concepts, the students were encouraged to incorporate ICT means in their ideas.
55 Trans-sector Innovation conceptsmapped on initial set of 22 categories
Year NrAgr
icul
ture
Con
stru
ctio
n
Educ
atio
n
Ener
gyEn
tert
ainm
ent
Envi
ronm
enta
l Car
eFi
nanc
eG
over
nmen
tH
ealth
care
Hot
el R
esta
uran
t Caf
é
Hou
seho
lds
Man
ufac
turing
Med
iaM
inin
gPr
ofes
sion
al a
ctiv
ities
Rea
l est
ate
Sec
urity
Tele
com
mun
icat
ions
Adm
in.
Ser
vice
s, t
ourism
Trad
eTr
ansp
ort
Wat
er
Student names
Num
ber
of s
tude
nts
1 A new dimension to winter sports 2007 1 1 1 1 1 1 1 H.Abd.Sulaiman & R.Reyes & N.Walker 32 Trans-sector information retrieval 2007 2 1 1 1 1 1 1 Itamar Sharon & B. van Zanten 23 Personal healthcare entertainment system 2007 3 1 1 1 1 1 1 1 E.Huizer & S.Lagerweij & L.Middendorp 34 Solving car traffic congestion 2007 4 1 1 1 1 1 Erwin Stout & Edwin Thier 25 Trans-sector innovation traffic accident management 2007 5 1 1 ? 1 1 1 1 Ricardo Bento & Carlos Reines 26 Access to real time security camera 2007 6 1 1 1 1 1 Ming Li & Weiwei Zhang 27 Rail miles 2007 7 1 ? 1 1 1 J.R. Bholasing & M. Atabakar 28 Solving traffic jams 2007 8 ? 1 1 1 Asgeir T. Oskarsson 19 Seniors care 2007 9 1 1 1 1 1 1 1 Marisa A. Wulff & Stuart Gunput 2
10 Galileo system 2007 10 1 1 1 1 1 S.Kably & A. Bouzalmat 211 Universal Marketplace 2007 11 1 1 1 1 Shahin Mesgar Zadeh & Eunice Valdez 212 Tele healthcare network 2008 1 1 1 1 1 1 1 Sina Maleki & Andre Abikhaled & Zhanna Bazil 313 Oil spill management & control 2008 2 1 1 1 1 1 1 1 1 1 1 Haiyan Wang & Xiaofan Sun 214 Communication network for mining workers 2008 3 1 1 1 1 1 ? 1 M. Hawas & R. Baboeram Panday 215 Energy waste prevention 2008 4 1 1 1 1 1 1 1 1 C.Simmonds Zuniga, A.Adeola, Y.Farazmand 316 Car sharing network 2008 5 1 1 1 1 1 1 1 Noela Walker & A.Nkengafeh 217 Artificial Intelligence traffic light system 2008 6 1 1 1 1 Rob Juffermans 118 Pollution warning 2008 7 1 1 1 1 1 1 Deheng Liu & Krzysztof Lusinski 219 Innovating tourism 2008 8 ? 1 1 1 Mike Noordermeer 120 Remote and automatic vehicle control 2008 9 ? 1 1 1 1 1 Libor Travnicek & Nicolas Cana 221 Live mobile translator 2008 10 1 1 1 1 1 1 1 Igor Dedic 122 Vehicle intelligent information management 2008 11 1 1 1 1 1 1 1 1 1 1 1 Davi Remy & Cui Xiaolei 223 Agricultural innovation 2008 12 1 1 1 1 1 1 S.S. Grishkori 124 Real time traffic analysis and control 2008 13 1 1 1 1 J.Splinter & T.Hurkmans 225 Disastrous weather supervisory system 2008 14 1 1 1 1 1 1 1 1 Zhang Xin & Jiang Chengcheng 226 Flood warning system 2008 15 1 1 1 1 1 1 1 1 1 M.Khan & Sajid Aqeel & Bokiye 327 Is there a doctor in the house? 2008 16 1 1 1 1 1 Lars de Jonge & Sander Meijers 228 Geographic position controlled (de)activation 2009 1 1 1 1 1 1 1 Mohammad Hosseini & Rashaad Imamdi 229 Dedicated transport tracks, express grid & light trail 2009 2 1 1 1 1 1 1 Ruud van de Bovenkamp & Marcos Meibergen 230 Car driver information sharing & solving traffic jams 2009 3 1 1 1 1 1 1 1 1 Lukasz Szyda & Maxim Volkov & Genkay Olcer 331 Improve transportation using RFID & recyclable casing 2009 4 1 1 1 1 1 Tian Xiaofei & Zhao Aijie 232 Electronic personal assistant for shopping consumers 2009 5 1 1 1 1 1 1 1 Bas van Kester & Teun de Groot 233 Emergency doctor via PSTN 2009 6 1 1 1 1 1 Shahab Asoodeh & Adnan Quaium 234 PC based energy saving household power meter 2009 7 1 1 1 1 1 1 A.Silva & J.Chico & T.Veres 335 Civil servants learning by means of serious gaming 2009 8 1 1 1 1 1 Roy Dulam 136 RFID in supermarkets interacting with mobile devices 2009 9 ? 1 1 1 1 Andreas Boon & Christian Both 237 Rigid Identity service 2009 10 1 1 1 1 1 1 1 1 1 1 1 Victor den Bak & Dave Daas 238 Sensor ID bracelet 2009 11 1 1 1 1 ? 1 1 1 1 Yukun Zhao & Bing Liu 239 Digital suitcase 2009 12 1 ? 1 1 1 1 Soebhaash Dihal & Kris Samson 240 Ad hoc Lens Monitoring System 2009 13 1 1 1 1 1 1 1 1 Aarabi Krishnakumar & F.Badinrad 241 Residential Card containing basic personal information 2010 1 1 1 1 1 1 1 1 Yuning Liu & Harun Cetin 242 A Future Intelligent Transport system 2010 2 1 1 1 1 1 1 1 1 1 Ke Dong & Jia Chen 243 Forest Protection agains Fire Hazards 2010 3 1 1 1 1 1 1 1 1 1 1 1 1 Pedro Carreira & Bahar Yousefian 244 Tyre monitoring system 2010 4 1 1 1 1 1 1 Khashayar Kotobi & Tom Verboon 245 Personalised and location based event information 2010 5 1 1 1 ? 1 ? 1 Jurjen Verploegh & Hans Bongers 246 Real Estate damage monitoring & management 2010 6 1 ? 1 1 1 1 1 Dion & Niels van Adrichem 247 Mobile eHealth 2011 1 1 1 1 1 1 Zhang & Elavarasu 248 Sensors in exhaustion system of vehicles 2011 2 1 1 1 1 1 1 1 1 1 Budday & Geddam & Madurai 349 Smart Wallet 2011 3 1 1 1 1 1 1 1 Wijnands & Abegaz & Okeke 350 Augmented Reality in a city (map) 2011 4 1 1 1 1 1 1 1 1 1 1 1 1 Mulyawan & Prasetyo 251 Smart Disaster recovery management 2011 5 1 1 ? 1 1 Wikan Hantoro & Mukti 252 Mobile tourism 2011 6 1 1 1 1 1 1 1 Constantinescu & Kalyanasundaram 253 Hop on chipcard for Amsterdam (for expats,tourists) 2011 7 1 ? 1 1 1 1 1 1 1 Vaddagiri&Raghavendrarao&Sridharan 354 Smart domestic greenhouse 2011 8 1 1 1 1 1 1 1 1 Argyrouli & Paraforou 255 Snow management information system for airports 2011 9 1 ? 1 1 1 1 1 ? 1 Ravishanka & Gaonkar 2
Average number of categories involved 3 5 7 6 9 12 24 29 25 4 34 44 8 1 0 2 29 55 11 14 30 7Total number of students involved 114
132
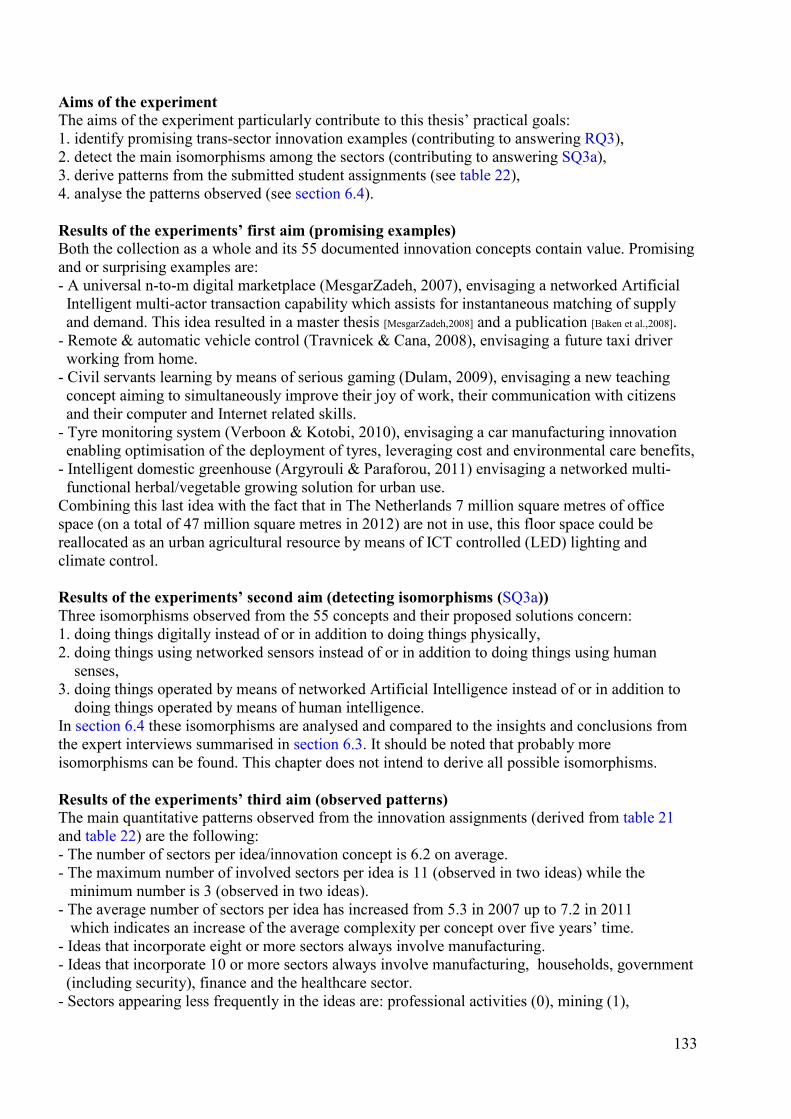
Aims of the experiment The aims of the experiment particularly contribute to this thesis’ practical goals: 1. identify promising trans-sector innovation examples (contributing to answering RQ3), 2. detect the main isomorphisms among the sectors (contributing to answering SQ3a), 3. derive patterns from the submitted student assignments (see table 22), 4. analyse the patterns observed (see section 6.4). Results of the experiments’ first aim (promising examples) Both the collection as a whole and its 55 documented innovation concepts contain value. Promising and or surprising examples are: - A universal n-to-m digital marketplace (MesgarZadeh, 2007), envisaging a networked Artificial Intelligent multi-actor transaction capability which assists for instantaneous matching of supply and demand. This idea resulted in a master thesis [MesgarZadeh,2008] and a publication [Baken et al.,2008]. - Remote & automatic vehicle control (Travnicek & Cana, 2008), envisaging a future taxi driver working from home. - Civil servants learning by means of serious gaming (Dulam, 2009), envisaging a new teaching concept aiming to simultaneously improve their joy of work, their communication with citizens and their computer and Internet related skills. - Tyre monitoring system (Verboon & Kotobi, 2010), envisaging a car manufacturing innovation enabling optimisation of the deployment of tyres, leveraging cost and environmental care benefits, - Intelligent domestic greenhouse (Argyrouli & Paraforou, 2011) envisaging a networked multi- functional herbal/vegetable growing solution for urban use. Combining this last idea with the fact that in The Netherlands 7 million square metres of office space (on a total of 47 million square metres in 2012) are not in use, this floor space could be reallocated as an urban agricultural resource by means of ICT controlled (LED) lighting and climate control. Results of the experiments’ second aim (detecting isomorphisms (SQ3a)) Three isomorphisms observed from the 55 concepts and their proposed solutions concern: 1. doing things digitally instead of or in addition to doing things physically, 2. doing things using networked sensors instead of or in addition to doing things using human senses, 3. doing things operated by means of networked Artificial Intelligence instead of or in addition to doing things operated by means of human intelligence. In section 6.4 these isomorphisms are analysed and compared to the insights and conclusions from the expert interviews summarised in section 6.3. It should be noted that probably more isomorphisms can be found. This chapter does not intend to derive all possible isomorphisms. Results of the experiments’ third aim (observed patterns) The main quantitative patterns observed from the innovation assignments (derived from table 21 and table 22) are the following: - The number of sectors per idea/innovation concept is 6.2 on average. - The maximum number of involved sectors per idea is 11 (observed in two ideas) while the minimum number is 3 (observed in two ideas). - The average number of sectors per idea has increased from 5.3 in 2007 up to 7.2 in 2011 which indicates an increase of the average complexity per concept over five years’ time. - Ideas that incorporate eight or more sectors always involve manufacturing. - Ideas that incorporate 10 or more sectors always involve manufacturing, households, government (including security), finance and the healthcare sector. - Sectors appearing less frequently in the ideas are: professional activities (0), mining (1),
133
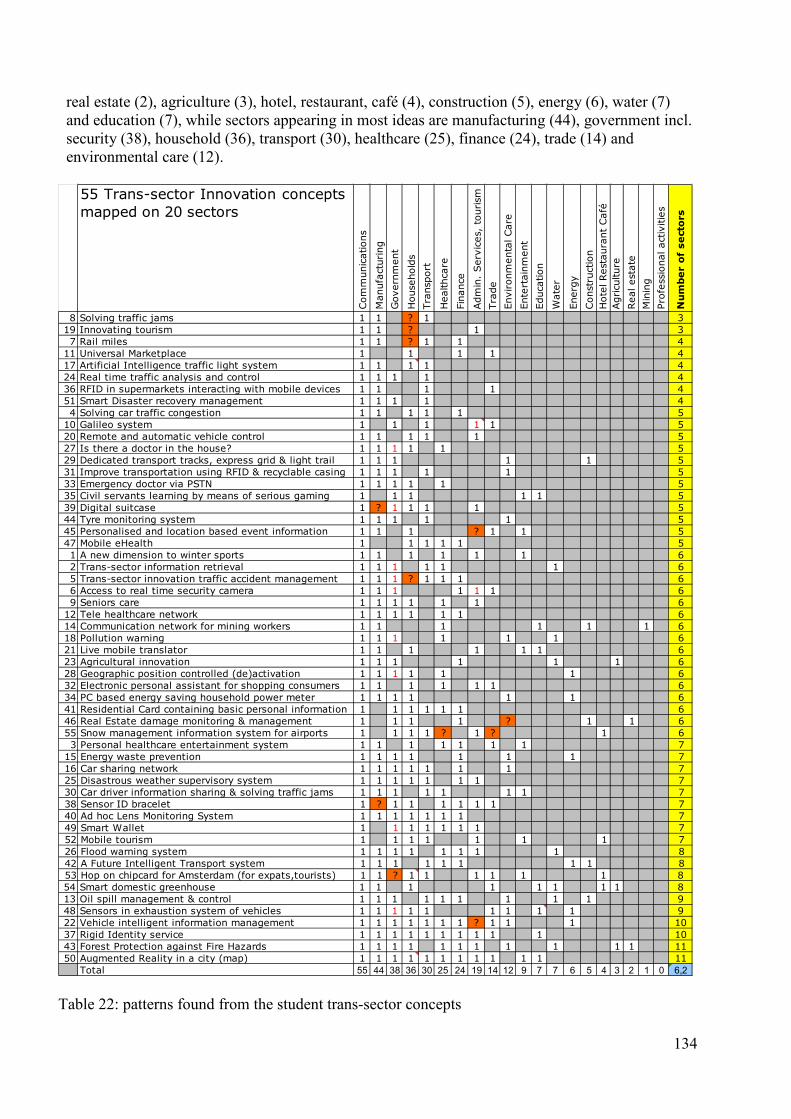
real estate (2), agriculture (3), hotel, restaurant, café (4), construction (5), energy (6), water (7) and education (7), while sectors appearing in most ideas are manufacturing (44), government incl. security (38), household (36), transport (30), healthcare (25), finance (24), trade (14) and environmental care (12).
Table 22: patterns found from the student trans-sector concepts
55 Trans-sector Innovation conceptsmapped on 20 sectors
Com
mun
icat
ions
Man
ufac
turing
Gov
ernm
ent
Hou
seho
lds
Tran
spor
t
Hea
lthca
re
Fina
nce
Adm
in.
Ser
vice
s, t
ourism
Trad
eEn
viro
nmen
tal C
are
Ente
rtai
nmen
tEd
ucat
ion
Wat
er
Ener
gyCon
stru
ctio
nH
otel
Res
taur
ant
Caf
éAgr
icul
ture
Rea
l est
ate
Min
ing
Prof
essi
onal
act
iviti
es
Num
ber
of s
ecto
rs
8 Solving traffic jams 1 1 ? 1 319 Innovating tourism 1 1 ? 1 37 Rail miles 1 1 ? 1 1 4
11 Universal Marketplace 1 1 1 1 417 Artificial Intelligence traffic light system 1 1 1 1 424 Real time traffic analysis and control 1 1 1 1 436 RFID in supermarkets interacting with mobile devices 1 1 1 1 451 Smart Disaster recovery management 1 1 1 1 44 Solving car traffic congestion 1 1 1 1 1 5
10 Galileo system 1 1 1 1 1 520 Remote and automatic vehicle control 1 1 1 1 1 527 Is there a doctor in the house? 1 1 1 1 1 529 Dedicated transport tracks, express grid & light trail 1 1 1 1 1 531 Improve transportation using RFID & recyclable casing 1 1 1 1 1 533 Emergency doctor via PSTN 1 1 1 1 1 535 Civil servants learning by means of serious gaming 1 1 1 1 1 539 Digital suitcase 1 ? 1 1 1 1 544 Tyre monitoring system 1 1 1 1 1 545 Personalised and location based event information 1 1 1 ? 1 1 547 Mobile eHealth 1 1 1 1 1 51 A new dimension to winter sports 1 1 1 1 1 1 62 Trans-sector information retrieval 1 1 1 1 1 1 65 Trans-sector innovation traffic accident management 1 1 1 ? 1 1 1 66 Access to real time security camera 1 1 1 1 1 1 69 Seniors care 1 1 1 1 1 1 6
12 Tele healthcare network 1 1 1 1 1 1 614 Communication network for mining workers 1 1 1 1 1 1 618 Pollution warning 1 1 1 1 1 1 621 Live mobile translator 1 1 1 1 1 1 623 Agricultural innovation 1 1 1 1 1 1 628 Geographic position controlled (de)activation 1 1 1 1 1 1 632 Electronic personal assistant for shopping consumers 1 1 1 1 1 1 634 PC based energy saving household power meter 1 1 1 1 1 1 641 Residential Card containing basic personal information 1 1 1 1 1 1 646 Real Estate damage monitoring & management 1 1 1 1 ? 1 1 655 Snow management information system for airports 1 1 1 1 ? 1 ? 1 63 Personal healthcare entertainment system 1 1 1 1 1 1 1 7
15 Energy waste prevention 1 1 1 1 1 1 1 716 Car sharing network 1 1 1 1 1 1 1 725 Disastrous weather supervisory system 1 1 1 1 1 1 1 730 Car driver information sharing & solving traffic jams 1 1 1 1 1 1 1 738 Sensor ID bracelet 1 ? 1 1 1 1 1 1 740 Ad hoc Lens Monitoring System 1 1 1 1 1 1 1 749 Smart Wallet 1 1 1 1 1 1 1 752 Mobile tourism 1 1 1 1 1 1 1 726 Flood warning system 1 1 1 1 1 1 1 1 842 A Future Intelligent Transport system 1 1 1 1 1 1 1 1 853 Hop on chipcard for Amsterdam (for expats,tourists) 1 1 ? 1 1 1 1 1 1 854 Smart domestic greenhouse 1 1 1 1 1 1 1 1 813 Oil spill management & control 1 1 1 1 1 1 1 1 1 948 Sensors in exhaustion system of vehicles 1 1 1 1 1 1 1 1 1 922 Vehicle intelligent information management 1 1 1 1 1 1 1 ? 1 1 1 1037 Rigid Identity service 1 1 1 1 1 1 1 1 1 1 1043 Forest Protection against Fire Hazards 1 1 1 1 1 1 1 1 1 1 1 1150 Augmented Reality in a city (map) 1 1 1 1 1 1 1 1 1 1 1 11
Total 55 44 38 36 30 25 24 19 14 12 9 7 7 6 5 4 3 2 1 0 6,2
134
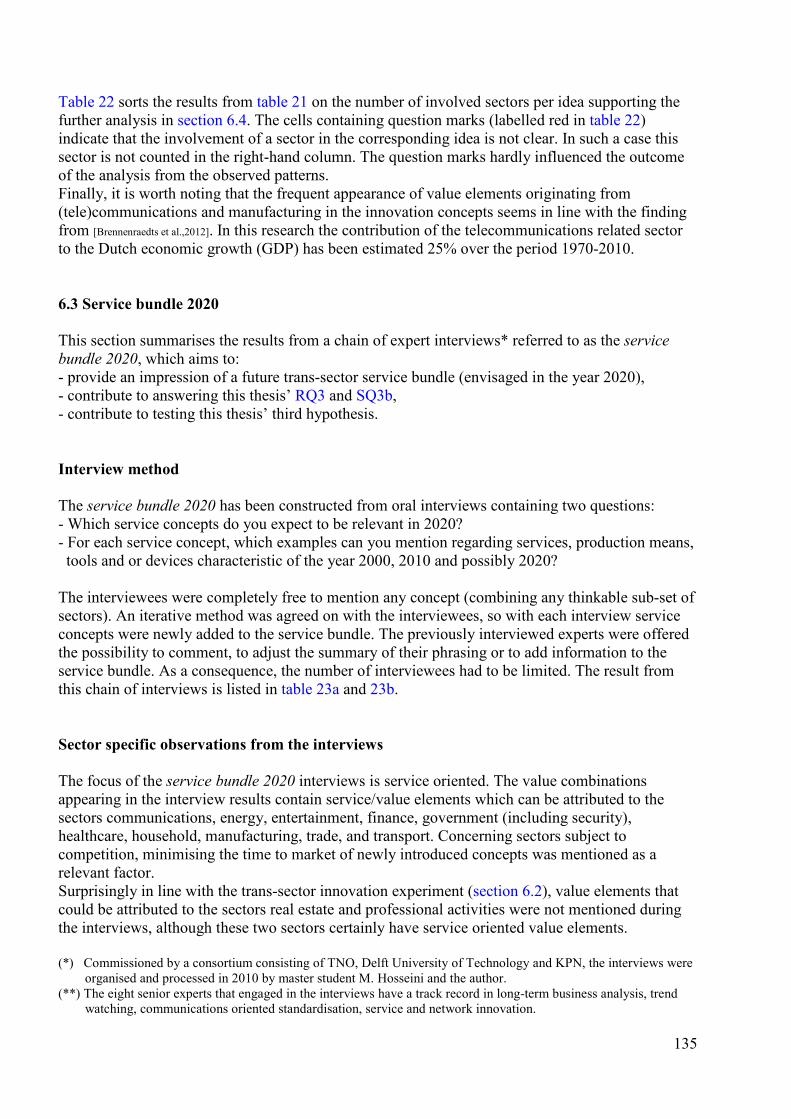
Table 22 sorts the results from table 21 on the number of involved sectors per idea supporting the further analysis in section 6.4. The cells containing question marks (labelled red in table 22) indicate that the involvement of a sector in the corresponding idea is not clear. In such a case this sector is not counted in the right-hand column. The question marks hardly influenced the outcome of the analysis from the observed patterns. Finally, it is worth noting that the frequent appearance of value elements originating from (tele)communications and manufacturing in the innovation concepts seems in line with the finding from [Brennenraedts et al.,2012]. In this research the contribution of the telecommunications related sector to the Dutch economic growth (GDP) has been estimated 25% over the period 1970-2010. 6.3 Service bundle 2020 This section summarises the results from a chain of expert interviews* referred to as the service bundle 2020, which aims to: - provide an impression of a future trans-sector service bundle (envisaged in the year 2020), - contribute to answering this thesis’ RQ3 and SQ3b, - contribute to testing this thesis’ third hypothesis. Interview method The service bundle 2020 has been constructed from oral interviews containing two questions: - Which service concepts do you expect to be relevant in 2020? - For each service concept, which examples can you mention regarding services, production means, tools and or devices characteristic of the year 2000, 2010 and possibly 2020? The interviewees were completely free to mention any concept (combining any thinkable sub-set of sectors). An iterative method was agreed on with the interviewees, so with each interview service concepts were newly added to the service bundle. The previously interviewed experts were offered the possibility to comment, to adjust the summary of their phrasing or to add information to the service bundle. As a consequence, the number of interviewees had to be limited. The result from this chain of interviews is listed in table 23a and 23b. Sector specific observations from the interviews The focus of the service bundle 2020 interviews is service oriented. The value combinations appearing in the interview results contain service/value elements which can be attributed to the sectors communications, energy, entertainment, finance, government (including security), healthcare, household, manufacturing, trade, and transport. Concerning sectors subject to competition, minimising the time to market of newly introduced concepts was mentioned as a relevant factor. Surprisingly in line with the trans-sector innovation experiment (section 6.2), value elements that could be attributed to the sectors real estate and professional activities were not mentioned during the interviews, although these two sectors certainly have service oriented value elements. (*) Commissioned by a consortium consisting of TNO, Delft University of Technology and KPN, the interviews were organised and processed in 2010 by master student M. Hosseini and the author. (**) The eight senior experts that engaged in the interviews have a track record in long-term business analysis, trend watching, communications oriented standardisation, service and network innovation.
135
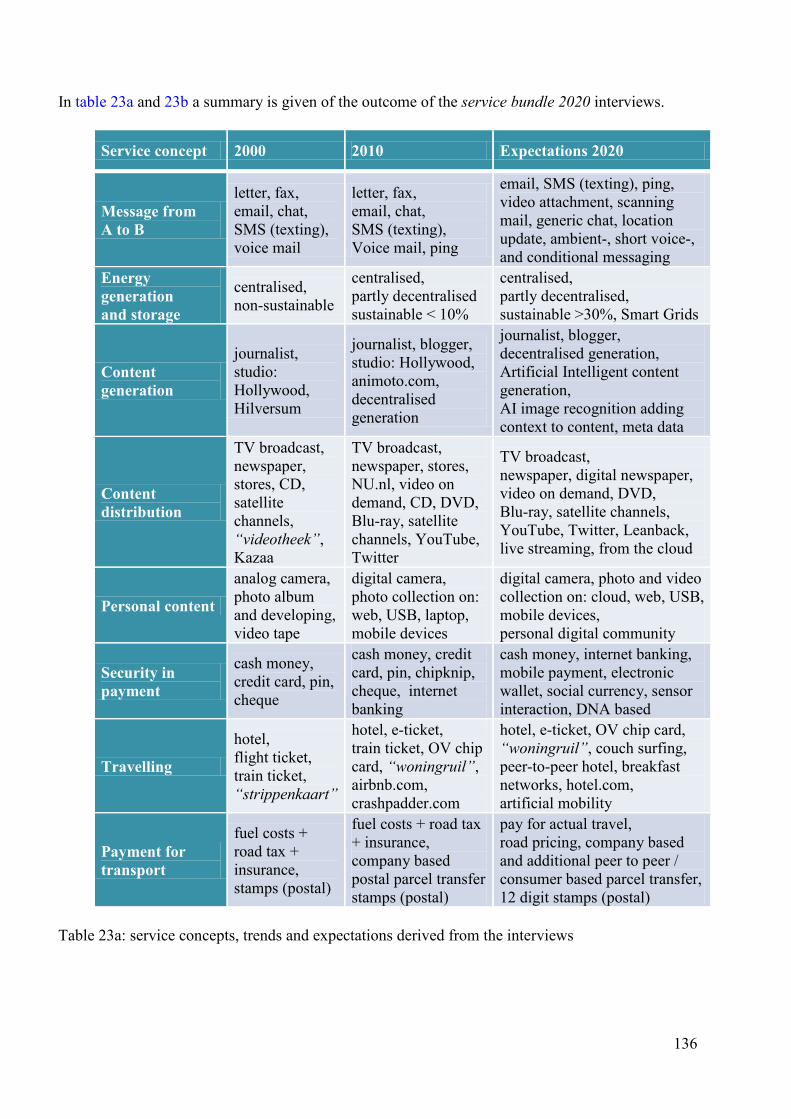
In table 23a and 23b a summary is given of the outcome of the service bundle 2020 interviews.
Service concept 2000 2010 Expectations 2020
Message from A to B
letter, fax, email, chat, SMS (texting), voice mail
letter, fax, email, chat, SMS (texting), Voice mail, ping
email, SMS (texting), ping, video attachment, scanning mail, generic chat, location update, ambient-, short voice-, and conditional messaging
Energy generation and storage
centralised, non-sustainable
centralised, partly decentralised sustainable < 10%
centralised, partly decentralised, sustainable >30%, Smart Grids
Content generation
journalist, studio: Hollywood, Hilversum
journalist, blogger, studio: Hollywood, animoto.com, decentralised generation
journalist, blogger, decentralised generation, Artificial Intelligent content generation, AI image recognition adding context to content, meta data
Content distribution
TV broadcast, newspaper, stores, CD, satellite channels, “videotheek”, Kazaa
TV broadcast, newspaper, stores, NU.nl, video on demand, CD, DVD, Blu-ray, satellite channels, YouTube, Twitter
TV broadcast, newspaper, digital newspaper, video on demand, DVD, Blu-ray, satellite channels, YouTube, Twitter, Leanback, live streaming, from the cloud
Personal content
analog camera, photo album and developing, video tape
digital camera, photo collection on: web, USB, laptop, mobile devices
digital camera, photo and video collection on: cloud, web, USB, mobile devices, personal digital community
Security in payment
cash money, credit card, pin, cheque
cash money, credit card, pin, chipknip, cheque, internet banking
cash money, internet banking, mobile payment, electronic wallet, social currency, sensor interaction, DNA based
Travelling
hotel, flight ticket, train ticket, “strippenkaart”
hotel, e-ticket, train ticket, OV chip card, “woningruil”, airbnb.com, crashpadder.com
hotel, e-ticket, OV chip card, “woningruil”, couch surfing, peer-to-peer hotel, breakfast networks, hotel.com, artificial mobility
Payment for transport
fuel costs + road tax + insurance, stamps (postal)
fuel costs + road tax + insurance, company based postal parcel transfer stamps (postal)
pay for actual travel, road pricing, company based and additional peer to peer / consumer based parcel transfer, 12 digit stamps (postal)
Table 23a: service concepts, trends and expectations derived from the interviews
136
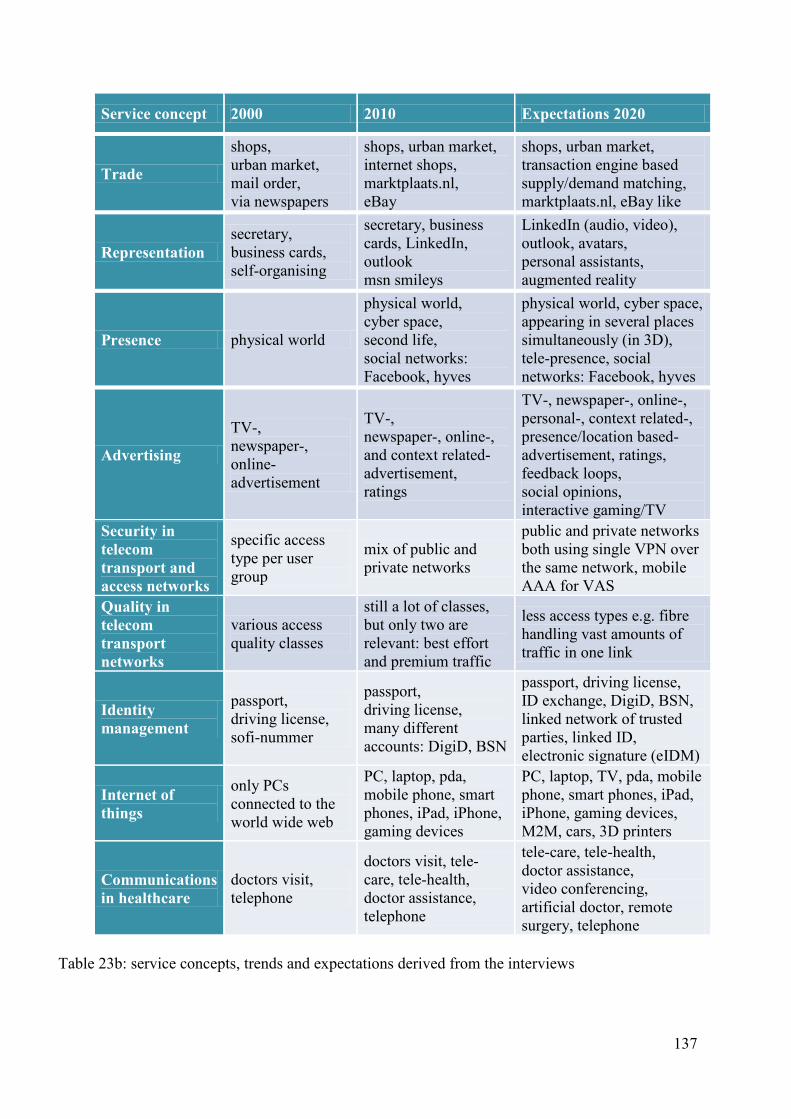
Service concept 2000 2010 Expectations 2020
Trade
shops, urban market, mail order, via newspapers
shops, urban market, internet shops, marktplaats.nl, eBay
shops, urban market, transaction engine based supply/demand matching, marktplaats.nl, eBay like
Representation secretary, business cards, self-organising
secretary, business cards, LinkedIn, outlook msn smileys
LinkedIn (audio, video), outlook, avatars, personal assistants, augmented reality
Presence physical world
physical world, cyber space, second life, social networks: Facebook, hyves
physical world, cyber space, appearing in several places simultaneously (in 3D), tele-presence, social networks: Facebook, hyves
Advertising
TV-, newspaper-, online- advertisement
TV-, newspaper-, online-, and context related- advertisement, ratings
TV-, newspaper-, online-, personal-, context related-, presence/location based- advertisement, ratings, feedback loops, social opinions, interactive gaming/TV
Security in telecom transport and access networks
specific access type per user group
mix of public and private networks
public and private networks both using single VPN over the same network, mobile AAA for VAS
Quality in telecom transport networks
various access quality classes
still a lot of classes, but only two are relevant: best effort and premium traffic
less access types e.g. fibre handling vast amounts of traffic in one link
Identity management
passport, driving license, sofi-nummer
passport, driving license, many different accounts: DigiD, BSN
passport, driving license, ID exchange, DigiD, BSN, linked network of trusted parties, linked ID, electronic signature (eIDM)
Internet of things
only PCs connected to the world wide web
PC, laptop, pda, mobile phone, smart phones, iPad, iPhone, gaming devices
PC, laptop, TV, pda, mobile phone, smart phones, iPad, iPhone, gaming devices, M2M, cars, 3D printers
Communications in healthcare
doctors visit, telephone
doctors visit, tele-care, tele-health, doctor assistance, telephone
tele-care, tele-health, doctor assistance, video conferencing, artificial doctor, remote surgery, telephone
Table 23b: service concepts, trends and expectations derived from the interviews
137
The main observations derived from the interview results (table 23a and 23b) is that during 2000-2010 the number of newly introduced service elements has exceeded the number of disappearing older ones. The interviewees expect this trend to continue towards 2020 which could indicate increasing diversity and complexity. Furthermore, transitions can be observed and expected from service concepts based on physical objects commonly used in 2000, towards service concepts based on combinations of digital and physical objects in 2020. The role of DINs is expected to gain importance because DINs for example empower people to autonomously perform specific activities which used to be performed by specialised organisations and their specialised employees exclusively [Anderson,2009]. Related examples of organisations / professions declining in number are photographers, employees of banks, post offices, travel agencies, video/music stores and newspaper issuing companies (employing professional journalists) etcetera. The above mentioned decline (affecting various service oriented sectors) may also support this thesis’ third hypothesis that the rise of DINs enables the majority of sector isomorphisms, because a massive shift from physical to digital can be observed in our contemporary sector network. Some isomorphic examples can be observed from table 23a and 23b such as paying digitally instead of paying cash or sending an email instead of a letter, but still careful concluding is necessary because: - amateurs empowered by DINs cannot always match the quality level of (paid) professionals, - according to table 23a e.g. cash payment will not have been replaced by digital payment in 2020, - not all activities (e.g. from Appendix EACS ISIC) have been researched with focus on finding additional isomorphisms between the sectors’ activities. A general conclusion from the above mentioned trends and innovation concepts is that there must be a certain market potential in (remotely) assisting citizens to securely navigate via DINs aiming to match their supply and demand. For instance, digitally equipped navigators could help citizens to obtain subsidies, discounts or refunds in a maze of optional (regulatory) arrangements and receive a small fraction of the financial result. Public navigation aid could be offered to citizens that lack the skills or have personal difficulties to operate (or pay for) the devices which enable secure navigating through increasingly complex DINs. As a result, citizens can find and obtain what they need or they can transact and share their personal value with other citizens or organisations. 6.4 Trans-sector Innovation combinations This section aims to relate theory and practice concerning the findings about trans-sector innovation combinations, firstly from a quantitative perspective and secondly from a qualitative perspective. The qualitative analysis concerns the observations from the trans-sector innovation idea generation experiment (section 6.2), the expert interviews (section 6.3) and the isomorphisms found. The quantitative analysis compares the distribution of the number of sector combinations found from the trans-sector innovation experiment and the theoretical distribution of the number of sector combinations derived from the binomial theorem provided by Newton and his predecessors. This theorem, elucidated in figure 53 (by means of Pascal’s triangle and a corresponding histogram), enables calculating the number of different (sector) combinations (for a set of n sectors) by expanding the powers of a binomial x + y into a sum of n + 1 terms. This binomial formula can be written as follows:
∑k=0
(x + y)n
=
n
( )nk x y
n-k kwhere the binomial coefficient =
n !
k ! n - k( ) !( )nk
138
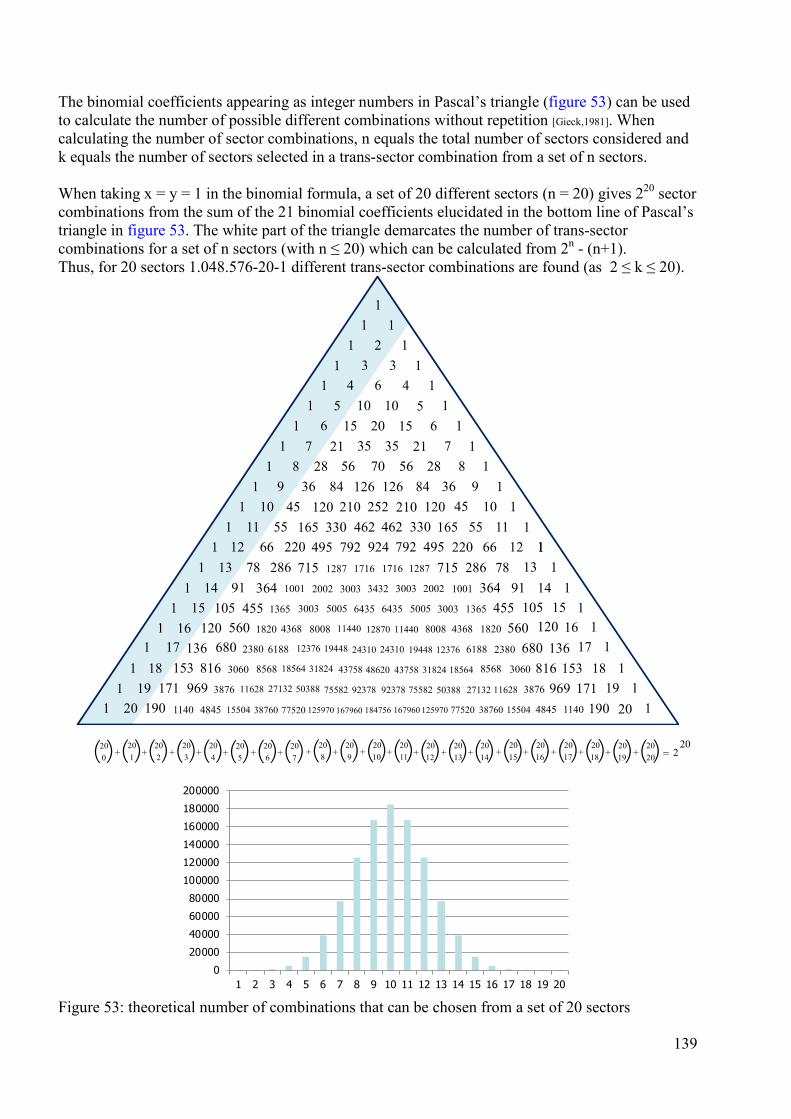
The binomial coefficients appearing as integer numbers in Pascal’s triangle (figure 53) can be used to calculate the number of possible different combinations without repetition [Gieck,1981]. When calculating the number of sector combinations, n equals the total number of sectors considered and k equals the number of sectors selected in a trans-sector combination from a set of n sectors. When taking x = y = 1 in the binomial formula, a set of 20 different sectors (n = 20) gives 220 sector combinations from the sum of the 21 binomial coefficients elucidated in the bottom line of Pascal’s triangle in figure 53. The white part of the triangle demarcates the number of trans-sector combinations for a set of n sectors (with n ≤ 20) which can be calculated from 2n - (n+1). Thus, for 20 sectors 1.048.576-20-1 different trans-sector combinations are found (as 2 ≤ k ≤ 20).
Figure 53: theoretical number of combinations that can be chosen from a set of 20 sectors
111
11
11
23 3
44 65105 10
171
281841
21011
89 36
12010 4533016511 55
1131
9114551
182011
1415 105
56016 120238068017 136
728
1841210
1462
836 9
10120 451155330 165
1113
1911455
11820
1
14105 15
16560 12017136680
66 1515 202121 35 35
5656 70126 126
252462
11
1
1819
20
12 79249566 220 1792 1266495 220924128771578 286 1716 782861287 7151716
30032002364 1001 3003 3642002 10013432
500530031365 6435 13655005 30036435
3060816153969171
11401903876
4845
4368
6188
8568
11628
15504
8008
12376
18564
27132
38760
11440
19448
31824
50388
77520 125970 167960 184756 167960 125970 77520 38760 15504 4845 1140 190 20
11
1819
1
153171
816969
3060
3876
2380
4368800811440
61881237619448
85681856431824
116282713250388
12870
2431024310
4862043758 43758
7558275582 92378 92378
11
11
11
1
+( )2015 +( )20
16 +( )2017 +( )20
18 +( )2019 +( )20
20+( )208 +( )20
9 +( )2010 +( )20
11 +( )2012 +( )20
13 +( )2014 2
20=( )20
0 +( )201 +( )20
2 +( )203 +( )20
4 +( )205 +( )20
6 +( )207
0
20000
40000
60000
80000
100000
120000
140000
160000
180000
200000
1 2 3 4 5 6 7 8 9 10 11 12 13 14 15 16 17 18 19 20
139
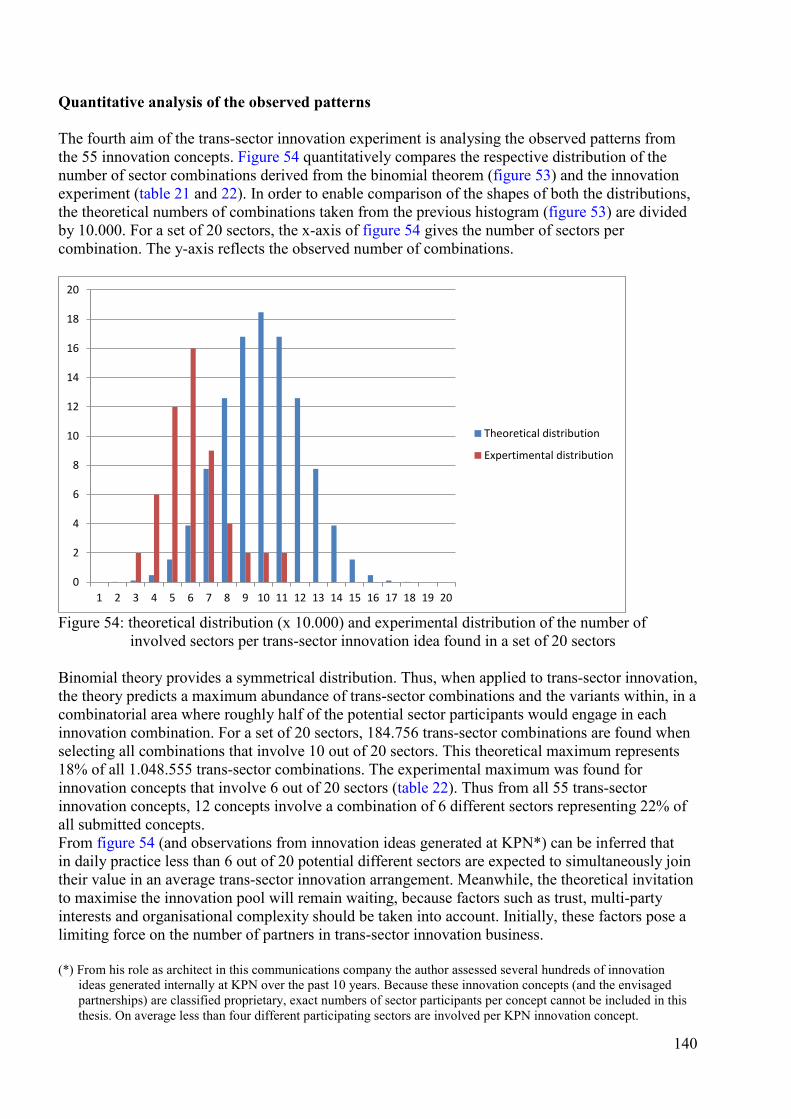
Quantitative analysis of the observed patterns The fourth aim of the trans-sector innovation experiment is analysing the observed patterns from the 55 innovation concepts. Figure 54 quantitatively compares the respective distribution of the number of sector combinations derived from the binomial theorem (figure 53) and the innovation experiment (table 21 and 22). In order to enable comparison of the shapes of both the distributions, the theoretical numbers of combinations taken from the previous histogram (figure 53) are divided by 10.000. For a set of 20 sectors, the x-axis of figure 54 gives the number of sectors per combination. The y-axis reflects the observed number of combinations.
Figure 54: theoretical distribution (x 10.000) and experimental distribution of the number of involved sectors per trans-sector innovation idea found in a set of 20 sectors Binomial theory provides a symmetrical distribution. Thus, when applied to trans-sector innovation, the theory predicts a maximum abundance of trans-sector combinations and the variants within, in a combinatorial area where roughly half of the potential sector participants would engage in each innovation combination. For a set of 20 sectors, 184.756 trans-sector combinations are found when selecting all combinations that involve 10 out of 20 sectors. This theoretical maximum represents 18% of all 1.048.555 trans-sector combinations. The experimental maximum was found for innovation concepts that involve 6 out of 20 sectors (table 22). Thus from all 55 trans-sector innovation concepts, 12 concepts involve a combination of 6 different sectors representing 22% of all submitted concepts. From figure 54 (and observations from innovation ideas generated at KPN*) can be inferred that in daily practice less than 6 out of 20 potential different sectors are expected to simultaneously join their value in an average trans-sector innovation arrangement. Meanwhile, the theoretical invitation to maximise the innovation pool will remain waiting, because factors such as trust, multi-party interests and organisational complexity should be taken into account. Initially, these factors pose a limiting force on the number of partners in trans-sector innovation business. (*) From his role as architect in this communications company the author assessed several hundreds of innovation ideas generated internally at KPN over the past 10 years. Because these innovation concepts (and the envisaged partnerships) are classified proprietary, exact numbers of sector participants per concept cannot be included in this thesis. On average less than four different participating sectors are involved per KPN innovation concept.
0
2
4
6
8
10
12
14
16
18
20
1 2 3 4 5 6 7 8 9 10 11 12 13 14 15 16 17 18 19 20
Theoretical distribution
Expertimental distribution
140
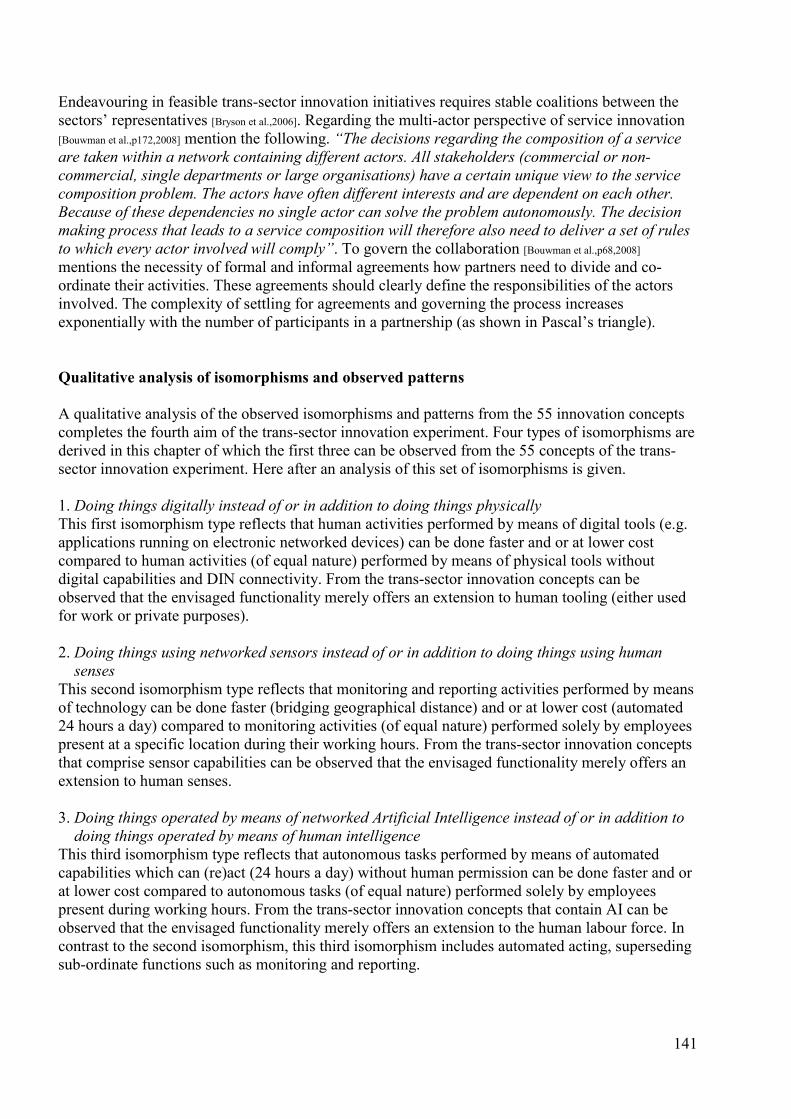
Endeavouring in feasible trans-sector innovation initiatives requires stable coalitions between the sectors’ representatives [Bryson et al.,2006]. Regarding the multi-actor perspective of service innovation [Bouwman et al.,p172,2008] mention the following. “The decisions regarding the composition of a service are taken within a network containing different actors. All stakeholders (commercial or non-commercial, single departments or large organisations) have a certain unique view to the service composition problem. The actors have often different interests and are dependent on each other. Because of these dependencies no single actor can solve the problem autonomously. The decision making process that leads to a service composition will therefore also need to deliver a set of rules to which every actor involved will comply”. To govern the collaboration [Bouwman et al.,p68,2008]
mentions the necessity of formal and informal agreements how partners need to divide and co-ordinate their activities. These agreements should clearly define the responsibilities of the actors involved. The complexity of settling for agreements and governing the process increases exponentially with the number of participants in a partnership (as shown in Pascal’s triangle). Qualitative analysis of isomorphisms and observed patterns A qualitative analysis of the observed isomorphisms and patterns from the 55 innovation concepts completes the fourth aim of the trans-sector innovation experiment. Four types of isomorphisms are derived in this chapter of which the first three can be observed from the 55 concepts of the trans-sector innovation experiment. Here after an analysis of this set of isomorphisms is given. 1. Doing things digitally instead of or in addition to doing things physically This first isomorphism type reflects that human activities performed by means of digital tools (e.g. applications running on electronic networked devices) can be done faster and or at lower cost compared to human activities (of equal nature) performed by means of physical tools without digital capabilities and DIN connectivity. From the trans-sector innovation concepts can be observed that the envisaged functionality merely offers an extension to human tooling (either used for work or private purposes). 2. Doing things using networked sensors instead of or in addition to doing things using human senses This second isomorphism type reflects that monitoring and reporting activities performed by means of technology can be done faster (bridging geographical distance) and or at lower cost (automated 24 hours a day) compared to monitoring activities (of equal nature) performed solely by employees present at a specific location during their working hours. From the trans-sector innovation concepts that comprise sensor capabilities can be observed that the envisaged functionality merely offers an extension to human senses. 3. Doing things operated by means of networked Artificial Intelligence instead of or in addition to doing things operated by means of human intelligence This third isomorphism type reflects that autonomous tasks performed by means of automated capabilities which can (re)act (24 hours a day) without human permission can be done faster and or at lower cost compared to autonomous tasks (of equal nature) performed solely by employees present during working hours. From the trans-sector innovation concepts that contain AI can be observed that the envisaged functionality merely offers an extension to the human labour force. In contrast to the second isomorphism, this third isomorphism includes automated acting, superseding sub-ordinate functions such as monitoring and reporting.
141
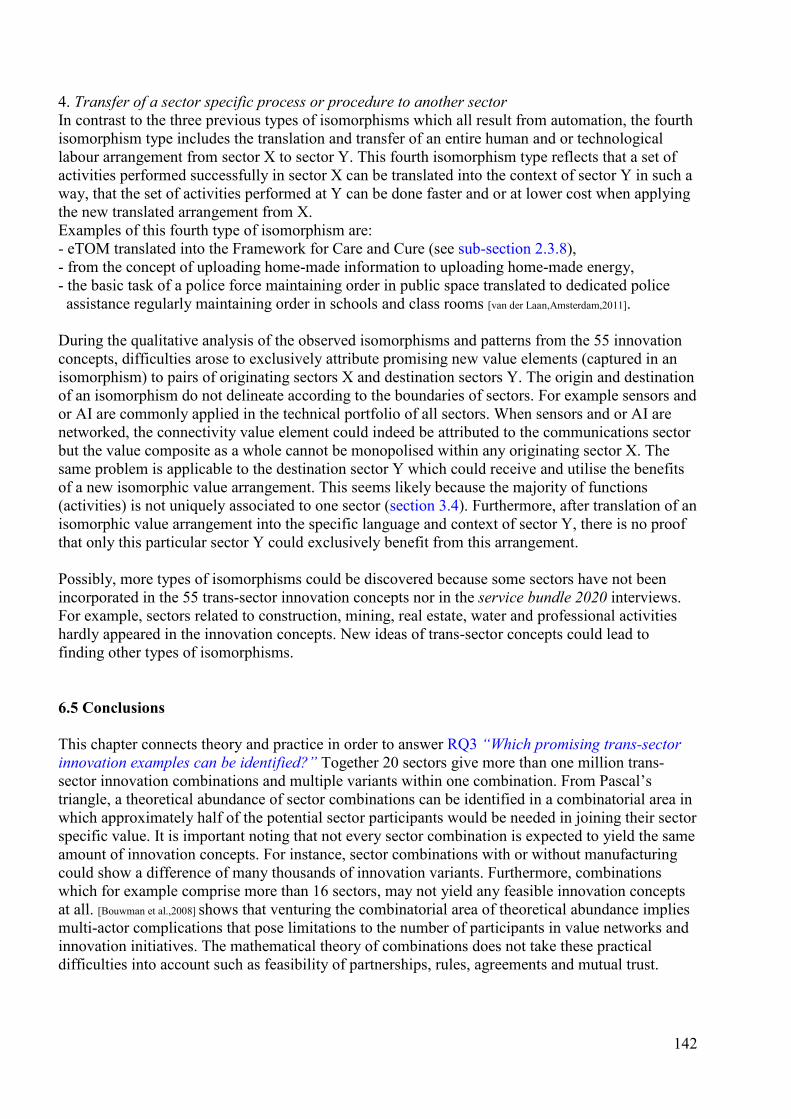
4. Transfer of a sector specific process or procedure to another sector In contrast to the three previous types of isomorphisms which all result from automation, the fourth isomorphism type includes the translation and transfer of an entire human and or technological labour arrangement from sector X to sector Y. This fourth isomorphism type reflects that a set of activities performed successfully in sector X can be translated into the context of sector Y in such a way, that the set of activities performed at Y can be done faster and or at lower cost when applying the new translated arrangement from X. Examples of this fourth type of isomorphism are: - eTOM translated into the Framework for Care and Cure (see sub-section 2.3.8), - from the concept of uploading home-made information to uploading home-made energy, - the basic task of a police force maintaining order in public space translated to dedicated police assistance regularly maintaining order in schools and class rooms [van der Laan,Amsterdam,2011]. During the qualitative analysis of the observed isomorphisms and patterns from the 55 innovation concepts, difficulties arose to exclusively attribute promising new value elements (captured in an isomorphism) to pairs of originating sectors X and destination sectors Y. The origin and destination of an isomorphism do not delineate according to the boundaries of sectors. For example sensors and or AI are commonly applied in the technical portfolio of all sectors. When sensors and or AI are networked, the connectivity value element could indeed be attributed to the communications sector but the value composite as a whole cannot be monopolised within any originating sector X. The same problem is applicable to the destination sector Y which could receive and utilise the benefits of a new isomorphic value arrangement. This seems likely because the majority of functions (activities) is not uniquely associated to one sector (section 3.4). Furthermore, after translation of an isomorphic value arrangement into the specific language and context of sector Y, there is no proof that only this particular sector Y could exclusively benefit from this arrangement. Possibly, more types of isomorphisms could be discovered because some sectors have not been incorporated in the 55 trans-sector innovation concepts nor in the service bundle 2020 interviews. For example, sectors related to construction, mining, real estate, water and professional activities hardly appeared in the innovation concepts. New ideas of trans-sector concepts could lead to finding other types of isomorphisms. 6.5 Conclusions This chapter connects theory and practice in order to answer RQ3 “Which promising trans-sector innovation examples can be identified?” Together 20 sectors give more than one million trans-sector innovation combinations and multiple variants within one combination. From Pascal’s triangle, a theoretical abundance of sector combinations can be identified in a combinatorial area in which approximately half of the potential sector participants would be needed in joining their sector specific value. It is important noting that not every sector combination is expected to yield the same amount of innovation concepts. For instance, sector combinations with or without manufacturing could show a difference of many thousands of innovation variants. Furthermore, combinations which for example comprise more than 16 sectors, may not yield any feasible innovation concepts at all. [Bouwman et al.,2008] shows that venturing the combinatorial area of theoretical abundance implies multi-actor complications that pose limitations to the number of participants in value networks and innovation initiatives. The mathematical theory of combinations does not take these practical difficulties into account such as feasibility of partnerships, rules, agreements and mutual trust.
142
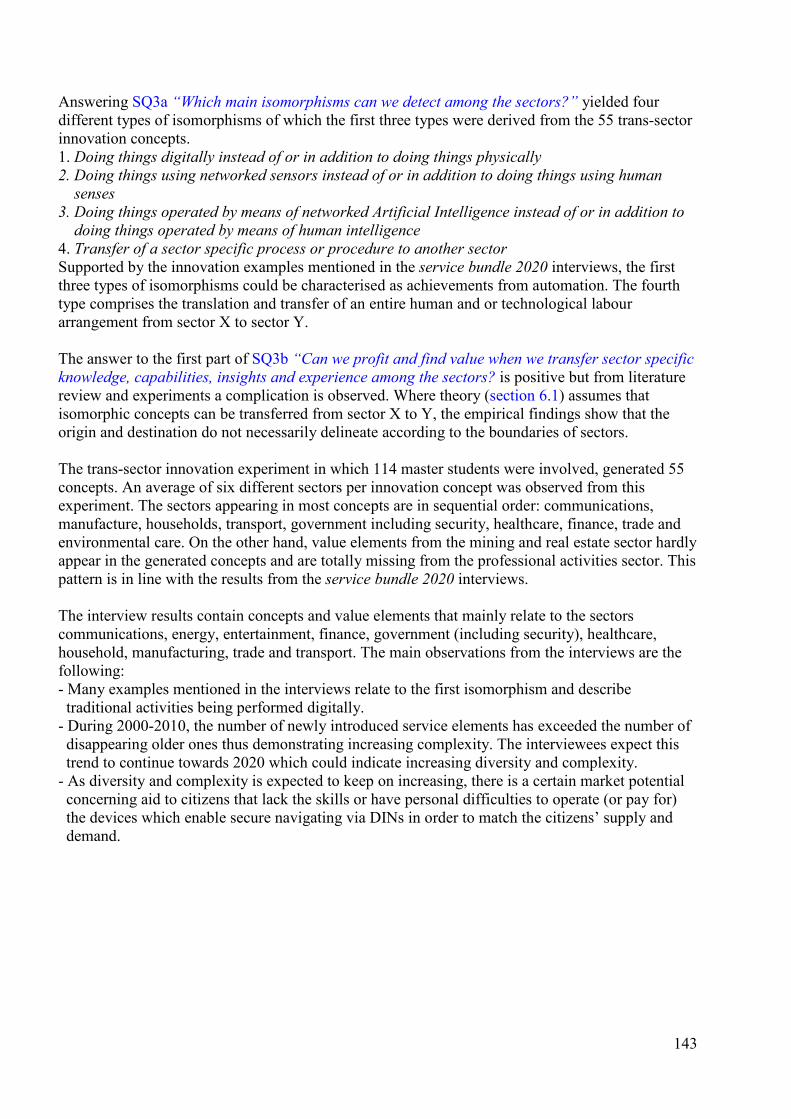
Answering SQ3a “Which main isomorphisms can we detect among the sectors?” yielded four different types of isomorphisms of which the first three types were derived from the 55 trans-sector innovation concepts. 1. Doing things digitally instead of or in addition to doing things physically 2. Doing things using networked sensors instead of or in addition to doing things using human senses 3. Doing things operated by means of networked Artificial Intelligence instead of or in addition to doing things operated by means of human intelligence 4. Transfer of a sector specific process or procedure to another sector Supported by the innovation examples mentioned in the service bundle 2020 interviews, the first three types of isomorphisms could be characterised as achievements from automation. The fourth type comprises the translation and transfer of an entire human and or technological labour arrangement from sector X to sector Y. The answer to the first part of SQ3b “Can we profit and find value when we transfer sector specific knowledge, capabilities, insights and experience among the sectors? is positive but from literature review and experiments a complication is observed. Where theory (section 6.1) assumes that isomorphic concepts can be transferred from sector X to Y, the empirical findings show that the origin and destination do not necessarily delineate according to the boundaries of sectors. The trans-sector innovation experiment in which 114 master students were involved, generated 55 concepts. An average of six different sectors per innovation concept was observed from this experiment. The sectors appearing in most concepts are in sequential order: communications, manufacture, households, transport, government including security, healthcare, finance, trade and environmental care. On the other hand, value elements from the mining and real estate sector hardly appear in the generated concepts and are totally missing from the professional activities sector. This pattern is in line with the results from the service bundle 2020 interviews. The interview results contain concepts and value elements that mainly relate to the sectors communications, energy, entertainment, finance, government (including security), healthcare, household, manufacturing, trade and transport. The main observations from the interviews are the following: - Many examples mentioned in the interviews relate to the first isomorphism and describe traditional activities being performed digitally. - During 2000-2010, the number of newly introduced service elements has exceeded the number of disappearing older ones thus demonstrating increasing complexity. The interviewees expect this trend to continue towards 2020 which could indicate increasing diversity and complexity. - As diversity and complexity is expected to keep on increasing, there is a certain market potential concerning aid to citizens that lack the skills or have personal difficulties to operate (or pay for) the devices which enable secure navigating via DINs in order to match the citizens’ supply and demand.
143
Chapter 7 The telecommunications related sector This chapter contributes to the understanding of the value originating from the telecommunications related sector by answering the telecommunications specific part of RQ1 “What defines a sector and which ones can be distinguished?” and SQ3b (see below). The answers to RQ1 given in chapter 3 are completed in section 7.1 which discusses the definitional difficulties and dispute regarding the boundaries of the activity clusters associated with communications. Furthermore this section describes and defines the communications value offered to the sector network based on a comparison of the communications related activity clusters according to UN ISIC and the OECD. Based on the research regarding the functions inventoried from telecommunications related models and standards, section 7.2 verifies this thesis’ second hypothesis and answers SQ1b “Which specific and generic telecommunications related functions can be found?”. Section 7.3 reflects on this thesis’ first hypothesis and gives a telecommunications related hierarchical graph which depicts the main dependencies between the component parts of a telecom operators’ network of platforms. In chapter 6 the first part of SQ3b “Can we profit and find value when we transfer sector specific knowledge, capabilities, insights and experience among the sectors?“ is answered positively. By all means the telecommunications related sector has contributed to the trans-sector transfer of DIN based value and a vast innovation potential yet unknown, lies ahead in time. Section 7.4 answers the second part of SQ3b “What does such a transfer mean for the telecommunications related sector?” and takes the paradoxes into account concerning the responsibility for our vital sectors and the current communications business situation. From the literature and comparison of EACS it became clear that the activity cluster telecommunications is not a sector in itself. It is part of the communications sector. 7.1 Communications value offered to the sector network Claude Shannon realised a breakthrough in information theory [Shannon,1948]. He defined the measure of information (the bit), formulated a mathematical definition and provided the following declaration. “The fundamental problem of communication is that of reproducing at one point either exactly or approximately a message selected at another point”. Shannon’s choice to select the term “point”, enables to explain one of the conceptual difficulties about information bridging both time and geographical distance. Simultaneously, time and space are applicable to information transfer and relate to its storage and spatial transport respectively. According to James Gleick, Shannon’s declaration invites to consider the case where the source of the message is the outside world and the receiver is the mind [Gleick,p259,2011]. But how to name the items being transferred? Is it information or data? How to distinguish information from its bearers? How to categorise communications related activities? Here definitions are crucial while taking the following perspectives into account: - the perspective of the end-users who create, perceive and or share information, - the perspective of economists and statisticians who try to understand the notions of information and communications from statistical data and categories of activities and products, - the engineering perspective concerning the design of the machinery and networks (DINs), - a technological perspective of the networked machines that receive, store, process and transmit, - a perspective of the information itself varying in age from thousands of years old to hours ago. From the conceptual complexity sketched above, the lack of worldwide consensus in how to define and classify communications, telecommunications, information and ICT can be explained and demonstrated (see table 24 and the derived observations and considerations). Contributing to answering RQ1, this section provides the definitions of these terms from the perspective of sectors, EACSs and the widely accepted work of Shannon in the field of information theory.
144
7.1.1 The OECD alternative aggregation Taking the structure of ISIC rev.4 as a reference, table 24 highlights the activities that associate to communications categorised across its sections C, G, H, I, M, R and S. Additionally, table 24 relates the alternative OECD aggregation for the information economy [OECD,2006] to ISIC rev.4. About alternative aggregations in general, the following is stated in [ISIC rev.4,p5,2008]: “While ISIC provides a standard way of grouping economic activities, there is sometimes a need to provide data on other sets of economic activities that may cross the boundaries of existing high-level ISIC categories but have become of interest to the statisticians, economists and policy makers. An example of this is the interest in measuring the information economy, which includes activities from a wide range of ISIC sections, including section C (Manufacturing), section J (Information and communication) and others. Since such groupings cannot be built into the existing ISIC structure, additional alternative aggregations can be created to serve these special data needs and provide a standard way of presenting such data. The present publication provides a set of internationally agreed alternative aggregations that have been defined for ISIC”. As a result, the 2006 version of the OECD alternative aggregation has been copied into Appendix B of ISIC rev.4 Part 4 which aims to collect a set of internationally agreed alternative aggregations. The opening statement of ISIC rev. 4 Part 4 explains that “Any statistical classification reflects compromises between a number of theoretical principles and practical considerations. Thus, not all needs for aggregated data will be equally well served by simple aggregation through the various levels within the existing structure of ISIC” [ISIC rev.4,Part 4,p273,2008]. The following UN introduction is amended to the OECD alternative aggregation [ISIC rev.4, Part 4,p277,2008]: “In recent years, there has been a growing demand for data related to the information economy, that is, information and communication technologies (ICT) and so-called “content”. While all activities related to the information economy have been described by, or been part of, ISIC classes in a number of ISIC divisions, the interpretation of classes belonging to the information economy and its boundaries have been subject to discussion. The OECD has taken a leading role in standardizing the definition of the ICT and “content” sectors. Previously used definitions have been reviewed by the Working Party on Indicators for the Information Society and new recommendations have been developed using the extended detail available in ISIC rev.4”. The OECD alternative aggregation for the information economy consists of a three section aggregate called “ICT sector” [OECD, box 5,2006] and a one section aggregate called “Content and media sector” [OECD, box 6,2006] . These sector aggregates are described by the following definitions: - The definition of the ICT sector provides a statistical basis for the measurement, in an internationally comparable way, of that part of economic activity that is generated by the production of ICT goods and services. - The following general principle (definition) is used to identify ICT economic activities (industries): “The production (goods and services) of a candidate industry must primarily be intended to fulfil or enable the function of information processing and communication by electronic means, including transmission and display”. - The activities (industries) in the ICT sector can be grouped into ICT manufacturing industries, ICT trade industries and ICT services industries. - The following general principle (definition) is used for the identification of activities in the content and media sector: “The production (goods and services) of a candidate industry must primarily be intended to inform, educate and/or entertain humans through mass communication media. These industries are engaged in the production, publishing and/or the distribution of content (information, cultural and entertainment products) where content corresponds to an organised message intended for human beings.”
145
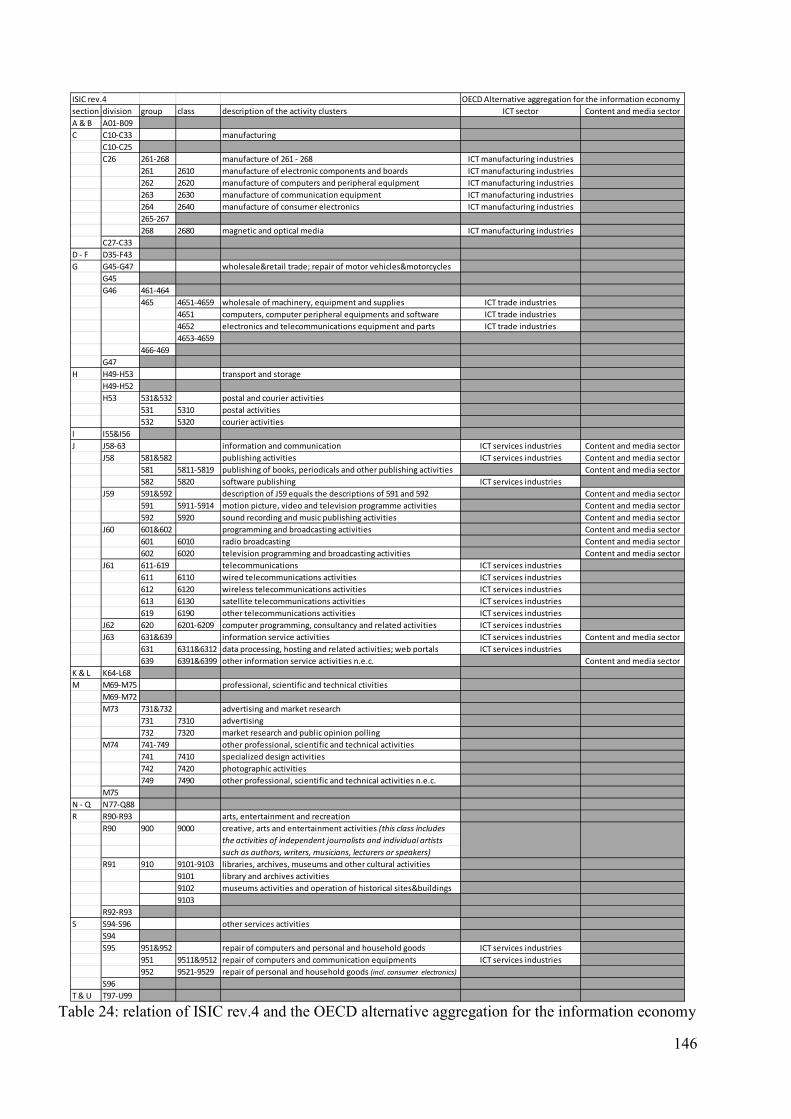
Table 24: relation of ISIC rev.4 and the OECD alternative aggregation for the information economy
ISIC rev.4 OECD Alternative aggregation for the information economysection division group class description of the activity clusters ICT sector Content and media sectorA & B A01-B09C C10-C33 manufacturing C10-C25
C26 261-268 manufacture of 261 - 268 ICT manufacturing industries261 2610 manufacture of electronic components and boards ICT manufacturing industries262 2620 manufacture of computers and peripheral equipment ICT manufacturing industries263 2630 manufacture of communication equipment ICT manufacturing industries264 2640 manufacture of consumer electronics ICT manufacturing industries265-267268 2680 magnetic and optical media ICT manufacturing industries
C27-C33D - F D35-F43G G45-G47 wholesale&retail trade; repair of motor vehicles&motorcycles G45
G46 461-464465 4651-4659 wholesale of machinery, equipment and supplies ICT trade industries 4651 computers, computer peripheral equipments and software ICT trade industries
4652 electronics and telecommunications equipment and parts ICT trade industries4653-4659
466-469G47
H H49-H53 transport and storageH49-H52H53 531&532 postal and courier activities
531 5310 postal activities532 5320 courier activities
I I55&I56J J58-63 information and communication ICT services industries Content and media sector J58 581&582 publishing activities ICT services industries Content and media sector
581 5811-5819 publishing of books, periodicals and other publishing activities Content and media sector582 5820 software publishing ICT services industries
J59 591&592 description of J59 equals the descriptions of 591 and 592 Content and media sector591 5911-5914 motion picture, video and television programme activities Content and media sector592 5920 sound recording and music publishing activities Content and media sector
J60 601&602 programming and broadcasting activities Content and media sector601 6010 radio broadcasting Content and media sector602 6020 television programming and broadcasting activities Content and media sector
J61 611-619 telecommunications ICT services industries611 6110 wired telecommunications activities ICT services industries612 6120 wireless telecommunications activities ICT services industries613 6130 satellite telecommunications activities ICT services industries619 6190 other telecommunications activities ICT services industries
J62 620 6201-6209 computer programming, consultancy and related activities ICT services industriesJ63 631&639 information service activities ICT services industries Content and media sector
631 6311&6312 data processing, hosting and related activities; web portals ICT services industries639 6391&6399 other information service activities n.e.c. Content and media sector
K & L K64-L68M M69-M75 professional, scientific and technical ctivities
M69-M72 M73 731&732 advertising and market research
731 7310 advertising 732 7320 market research and public opinion polling
M74 741-749 other professional, scientific and technical activities741 7410 specialized design activities742 7420 photographic activities749 7490 other professional, scientific and technical activities n.e.c.
M75N - Q N77-Q88R R90-R93 arts, entertainment and recreation
R90 900 9000 creative, arts and entertainment activities (this class includesthe activities of independent journalists and individual artistssuch as authors, writers, musicians, lecturers or speakers)
R91 910 9101-9103 libraries, archives, museums and other cultural activities9101 library and archives activities9102 museums activities and operation of historical sites&buildings9103
R92-R93S S94-S96 other services activities S94
S95 951&952 repair of computers and personal and household goods ICT services industries951 9511&9512 repair of computers and communication equipments ICT services industries952 9521-9529 repair of personal and household goods (incl. consumer electronics)
S96T & U T97-U99
146
Comparing the OECD alternative aggregation and ISIC rev.4 leads to the following observations: 1. The OECD ICT sector aggregation has a heterogeneous character because it is taken from various ISIC sections C “Manufacturing”, G “Wholesale and retail trade; repair of motor vehicles and motorcycles”, J “Information & Communication” and S “Other services activities”. 2. The OECD proposes the acronym ICT as a sector name while up till now no other examples of widely accepted sector or section names are known that include the term Technology. 3. The OECD content and media sector excludes content creation activities which are classified in the ISIC sections M and R. Furthermore, publishing software is declared out of its scope. 4. The ISIC division S95 “Repair of computers and personal and household goods” consists of two groups. The OECD aggregation proposes to isolate ISIC group S951 “Repair of computers and communications equipment” from the other ISIC group S952 “Repair of personal and household goods” which contains class S9521 “Repair of consumer electronics” 5. The OECD aggregation uses the term “industries” in all three components of the OECD ICT sector, where ISIC consistently avoids using this term in the names of any of its categories. 6. The OECD aggregation uses the term “services” in one name of an ICT sector component. 7. The OECD aggregation excludes group G474 “Retail sale of information and communications equipment in specialized stores”. This group G474 is not included in the OECD content and media sector nor in the OECD ICT sector. However concerning sales, the OECD ICT sector includes class G4651 “Wholesale of computers, computer peripheral equipment and software” and class G4652 “Wholesale of electronic and telecommunications equipment and parts”. The following considerations correspond to each of the seven above mentioned observations: Ad 1: The theoretical principles which are fundamental to constructing any classification, advocate the prevalent criterion of homogeneity (opposed to heterogeneity). Ad 2: The choice to use the term ICT in the name of a sector or EACS section is not in line with
the theoretical classification principles [Potter,1988] where criteria such as homogeneity of activities or produced value should prevail. The homogeneity of production means (tooling) is not a prime criterion for defining any category in EACSs which aim to categorise activities. Furthermore, technology can refer to both production means and products. For example, computers are used to produce computers. This ambiguity complicates classifying when selecting the term ICT.
Ad 3: The OECD sector name Content and media relates to information but excludes from its definition the creation of information, the retail sale of information and software publishing. Information obviously associates to more than one sector. So does content. Furthermore, this OECD sector name suggests a larger conceptual reach than the reach derived from the sum of its component parts (selected from ISIC). Ad 4: Repair related activities are classified across the seven ISIC sections B, C, F, G, N, S and T. The nature of the good and whether or not a good has an evident relation to households both determine in which ISIC category the goods offered for repair are classified. The ISIC residual section S “Other services activities” consists of three divisions: - S94 “Activities of membership organizations”, - S95 “Repair of computers and personal and household goods”, - S96 “Other personal service activities”. The OECD ICT sector aggregate suggests a separation of group S951 “Repair of computers and communications equipment” from group S952 “Repair of personal and household goods”. S952 includes consumer electronics e.g. audio/video players. However, advances in the integration of functions in electronic equipment have made a strict distinction between consumer electronics and computers arbitrary. For instance smartphones and tablet computers
147
offer the capabilities to play music or video content and to use applications associated to computing. When the OECD proposal would be extended to classifying all division S95 related repair activities away from section S, the homogeneity of section S would clearly improve (as in this case, only well-being related activities remain in ISIC section S). For example, the Russian EACS OKVED has classified these repair related activities in its trade related section. OKVED does not have a residual section. Thus, division S95 could be classified in a new trade related division G48. Ad 5: The term industry has several meanings. It can refer to group level in EACSs*, to class levels in EACSs [Leontiev,1941],[JSIC rev.12,2007], to a sector in general or specifically to manufacturing (see Appendix Definitions). When applying the term sector and the widely accepted ISIC classification categories (section, division, group and class), instead of the term industry, potential confusion can be reduced in classification practice and other disciplines. Ad 6: The OECD endeavoured in distinguishing and defining ICT goods and ICT services [OECD,2007],[Roberts,2007]. However, from the literature is known that there are only very few pure goods and pure services [Rathmell,p34,1966]. In line with this consideration, [Hyötyläinen&Möller,2007] have demonstrated that service offerings tend to include tangibles. In this sense, the strict distinction between ICT goods and ICT services is arbitrary, artificial and complicating. Ad 7: From the sources [OECD,2006],[OECD,2007] it cannot be clearly explained why the OECD ICT sector includes a sales component and the OECD content and media sector does not. Furthermore, it is not clear why both OECD sectors exclude group G474 “Retail sale of information and communications equipment in specialized stores” while the OECD ICT sector includes related wholesale activities (group G465). Regarding the OECD alternative aggregation for the information economy can be concluded that it provides a heterogeneous sector aggregate. Proposing ICT as a sector name introduces classification ambiguity and is not in line with theoretical classification principles. 7.1.2 Definitions related to communications The ISIC rev.4 explanatory notes describe a wide variety of activities by means of the term service in the 13 ISIC sections A,B,E,G,H,I,J,K,L,M,N,S and T. Selection of the term service for defining the names of sectors and categories in EACSs introduces ambiguity because the term service has many different meanings**. When using the term service, it is inevitable adding a value context in order to solve classification ambiguity. In [Reitsma,p31-38,2011], definitions of the terms service and service sector have been reviewed from the literature. Reitsma demonstrates how perceptions and (scientific) interpretations concerning the definitions of the term service have branched out over the last five decades. In his research, Reitsma for instance identified nine different meanings of the term service within a telecom operator context and finally he concludes that there is no widely accepted definition of the term service. As a result of his literature review, Reitsma proposes to apply the definition provided by C. Grönroos. [Grönroos,2000] defines a service as “a process consisting of a series of more or less intangible activities that normally, but not necessary always, take place in interactions between the customer and service employees and/or physical resources or goods and/or systems of the service provider, which are provided as solutions to customer problems”. Furthermore, Reitsma concludes that the term service sector has become somewhat blurred. Here (*) For example in NAICS 2012 its 1st and 2nd digit define economic sectors, its 3rd digit defines sub-sectors, its 4th digit defines industry groups and its fifth digit defines NAICS industries and the 6th digit is country specific. (**) [Webster, p1070,1993] lists more than 20 different meanings of the term service (see Appendix Definitions).
148
[Levitt,1976] is illustrative, arguing that: “[t]here is no such thing as a service industry. There are only industries whose service components are greater or less than those of other industries”. The sector names proposed in this thesis do not contain the terms ICT, industry, information or service because these four do not clearly relate to one sector. Applying these terms introduces ambiguity and would severely complicate completing a set of complementary sector names. Chapter 3 answers RQ1 “What defines a sector and which ones can be distinguished?” and lists the outcome of the analysis in table 8. From the definitions and considerations discussed above, section 7.1 completes the answer to RQ1 with proposing communications sector as the name for the sector that comprises telecommunications related activities. The main reasons supporting this proposal are the following: - Information cannot be solely ascribed to one sector or EACS section which is a recommendation for excluding the term information from any sectors’ name. Furthermore, the simplified name communications sector avoids defining the difference between data and information. - The studied contemporary EACs issued by the UN and national statistical offices unanimously classify telecommunications at division level and not at section level as shown in table 5 in section 3.2. Sections approximate sectors most closely in terms of conceptual reach compared to classes, groups and divisions. - [Miller&Blair,p305,2009] mentioning communications as one of the general inputs sectors. Here after, the definitions supportive to the above proposal are given including the refinements contributed by the previous chapters. In the context of this thesis: - A sector can be defined as a homogeneous economic activity cluster that produces a similar type of goods and/or services or uses similar processes. At sector network level, all sectors are connected to each other in a full mesh structure, enabling direct exchange of their unique value. It is worth noting that the level of homogeneity varies per sector. For example, the communications sector is more homogeneous in nature compared to the household sector. - A section in an EACS can be defined as a type of classification category. As the definitions of a section and sector are different, the name of a sector does not necessarily have to be the same as the name of a corresponding section in an EACS. - Communications can be defined by means of the declaration of Shannon: The fundamental problem of communication is that of reproducing at one point either exactly or approximately a message selected at another point”. - Telecommunications can be defined as communications over distance from the Greek word “tele” (τηλε) meaning “at a distance” or “far off” [Liddell&Scott,p1787,1968]. Because telecommunications is assumed to be a sub-set of communications, this thesis refers to the telecommunications related sector and not to the telecommunications sector. - Information can be defined by means of the formulae of Shannon*, Nyquist and Hartley**. The unique value offered by the communications sector is bridging geographical distance between points (users) that can perceive the transferred items as information. The communications sector also provides functions such as storage, computing and processing. In contrast these three functions are not exclusively offered by actors which are part of the communications sector. This is explained in the next section. Although information transfer by means of physical information bearers (e.g. postal activities) is currently classified in the ISIC rev.4 transport section, postal activities contribute to the unique value characteristic of the communications sector. (*) Shannon’s formula H = - ∑ pi log2 pi where H is the entropy of the set of probabilities p1,…,pn where pi is the probability of each message and H is expressed by means of the measure bit. Receiving one bit (either 0 or 1) reduces uncertainty by 50% thus H = 1. When the outcome of the message is certain H = 0. Quantities of the form H play a central role in information theory as measures of information, choice and uncertainty [Shannon,1948]. (**) In 1928, Nyquist and Hartley proposed the formula H = n log2 s where H is the amount of information, n is the number of symbols transmitted in a message and s is the size of the alphabet [Gleick,p228,2011]
149
7.2 The functions of telecommunications This section presents the result of an analysis of telecommunications related functions. This analysis contributes to the understanding of the value offered by the telecommunications related sector and answers SQ1b “Which specific and generic telecommunications related functions can be found?”. This original phrasing of SQ1b formulated in the 2006 initial research proposal, requires distinguishing specific from generic functions. Having carried out the analyses of the telecommunications related functions and the sector network related functions derived from ISIC, it was found that in the phrasing of SQ1b the terms unique and non-unique would have been more accurate than specific and generic. The verification of this thesis’ second hypothesis required this hermetic distinction (as explained in section 5.2). The telecommunications related functions were captured from the following versions of the selected international telecommunications standards and models, valid in the period 2008-2009: - DEMO (Design & Methodology for Organisations) [Dietz,2006], - eTOM (enhanced Telecom Operations Map) [TMF,2004], - FCAPS (Fault, Configuration, Accounting, Performance & Security management) [ISO/ITU-T,2000], - ITU-T G.800 (International Telecommunication Union - Telecommunications sector G.800) [ITU-T,2007], - NGOSS (New Generation Operations Software and Systems) [TMF,2004], - OSI (Open Systems Interconnection) [ISO,1994], - TMN (Telecommunications Management Network) [ITU-T,2000]. From ITU-T M.3200 the function “roaming” was added to the inventory of telecommunication functions. In section 2.3 and the Appendix Repository of assessed models, the above mentioned selection is described in more detail. The following telecom related models and standards could have been added to the above selection: - ITIL v3 (Information Technology Infrastructure Library issued by the UK’s CCTA), - SID (Shared Information/Data model), - TAM (Telecom Applications Map). However, these latter three have been excluded from the selection, because ITIL functions can be mapped to eTOM and because NGOSS includes the general overview of SID and TAM. Furthermore, the TINA model (Telecommunications Information Networking Architecture) has been consulted in order to assess the level of completeness of the inventory of telecommunications related functions. This check did not yield any additional functions. During the evaluation of the inventory, only the function “streaming data” was proposed by a telecom expert and added to the long-list and short-list. As a final result, the long-list contains 331 telecommunications related functions extracted from the selection of models and standards (see Appendix Telecommunications functions). Subsequently, the uniqueness of each function has been reviewed in cooperation with two expert architects (both ITU-T members). Table 25 presents the result: a short-list of eleven unique functions of which only two (broadcasting and roaming) can be described with verbs exclusively. Identical to the analysis of the functions derived from ISIC (section 3.4) is was also necessary to add a value context to a verb in order to distinguish the uniqueness of the composite. In this case, for each verb a typical value context has been copied from the examined telecommunications standards and models. Accordingly, table 25 shows that nine out of eleven functions need the addition of a value context which mainly concerns data.
150
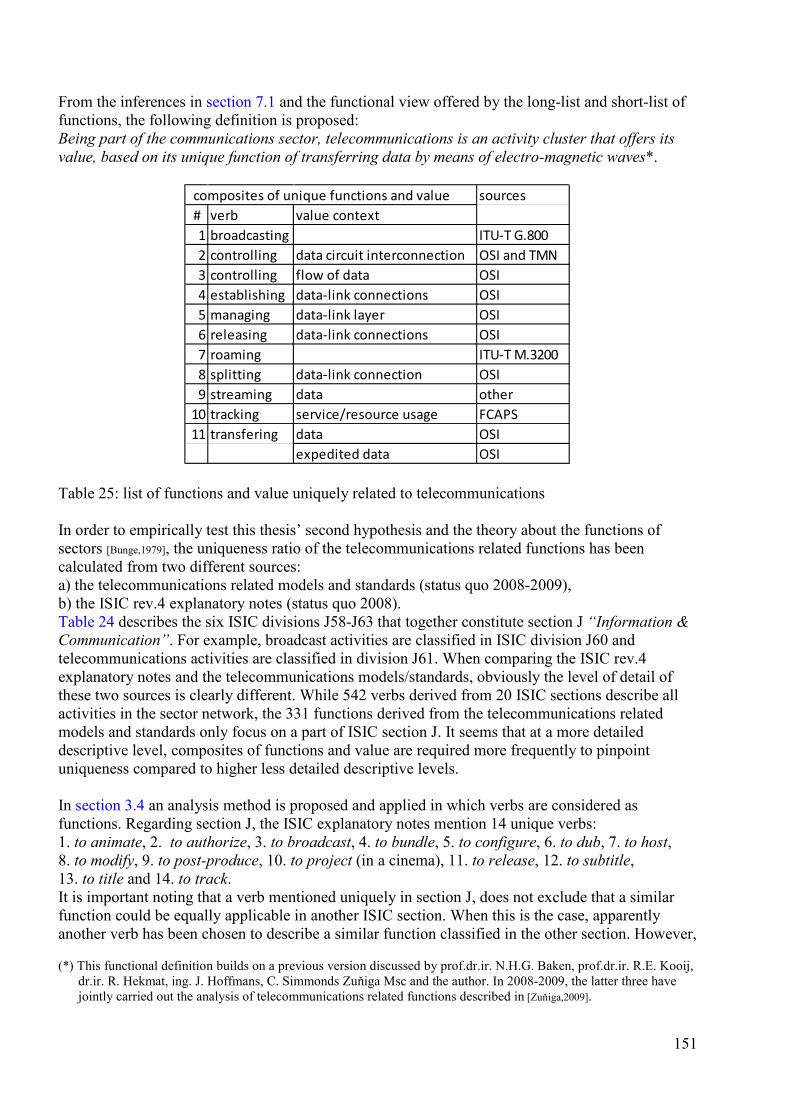
From the inferences in section 7.1 and the functional view offered by the long-list and short-list of functions, the following definition is proposed: Being part of the communications sector, telecommunications is an activity cluster that offers its value, based on its unique function of transferring data by means of electro-magnetic waves*.
Table 25: list of functions and value uniquely related to telecommunications In order to empirically test this thesis’ second hypothesis and the theory about the functions of sectors [Bunge,1979], the uniqueness ratio of the telecommunications related functions has been calculated from two different sources: a) the telecommunications related models and standards (status quo 2008-2009), b) the ISIC rev.4 explanatory notes (status quo 2008). Table 24 describes the six ISIC divisions J58-J63 that together constitute section J “Information & Communication”. For example, broadcast activities are classified in ISIC division J60 and telecommunications activities are classified in division J61. When comparing the ISIC rev.4 explanatory notes and the telecommunications models/standards, obviously the level of detail of these two sources is clearly different. While 542 verbs derived from 20 ISIC sections describe all activities in the sector network, the 331 functions derived from the telecommunications related models and standards only focus on a part of ISIC section J. It seems that at a more detailed descriptive level, composites of functions and value are required more frequently to pinpoint uniqueness compared to higher less detailed descriptive levels. In section 3.4 an analysis method is proposed and applied in which verbs are considered as functions. Regarding section J, the ISIC explanatory notes mention 14 unique verbs: 1. to animate, 2. to authorize, 3. to broadcast, 4. to bundle, 5. to configure, 6. to dub, 7. to host, 8. to modify, 9. to post-produce, 10. to project (in a cinema), 11. to release, 12. to subtitle, 13. to title and 14. to track. It is important noting that a verb mentioned uniquely in section J, does not exclude that a similar function could be equally applicable in another ISIC section. When this is the case, apparently another verb has been chosen to describe a similar function classified in the other section. However, (*) This functional definition builds on a previous version discussed by prof.dr.ir. N.H.G. Baken, prof.dr.ir. R.E. Kooij,
dr.ir. R. Hekmat, ing. J. Hoffmans, C. Simmonds Zuňiga Msc and the author. In 2008-2009, the latter three have jointly carried out the analysis of telecommunications related functions described in [Zuňiga,2009].
sources# verb value context1 broadcasting ITU-T G.8002 controlling data circuit interconnection OSI and TMN3 controlling flow of data OSI4 establishing data-link connections OSI5 managing data-link layer OSI6 releasing data-link connections OSI7 roaming ITU-T M.32008 splitting data-link connection OSI9 streaming data other
10 tracking service/resource usage FCAPS11 transfering data OSI
expedited data OSI
composites of unique functions and value
151
when applying this thesis’ functional analysis method, uniqueness ratios can be calculated for any category by dividing the number of its unique verbs by the total number of verbs in the entire set. From the ISIC explanatory notes a total number of 542 different verbs was found. Having found 14 unique verbs in section J, this gives a uniqueness ratio 14/542 = 0.026. This outcome should be considered as an order of magnitude because 14 is a rather small number. As the number of unique telecommunications composites (combinations of unique functions and value listed in table 25) is relatively small in number too (11 found from the set of telecommunications models/standards) one exact value of the uniqueness ratio cannot be claimed for telecommunications either. Furthermore, during the review of the research outcome by the telecommunications expert architects, some doubt was casted on the uniqueness of the function “tracking service/resource usage” and the two functions “transferring data” and “transferring expedited data”, can be assumed alike (see table 25). From these observations, the uniqueness ratio varies between 10/331 = 0.030 and 12/331 = 0.036 for the telecommunications related sector. Another (more rigorous) approach could be to only accept a function as a unique function when the descriptive verb does not need any distinctive value context that demonstrates its uniqueness. Table 25 contains two functions of this kind: broadcasting and roaming. When applying this strict approach, a uniqueness ratio of 2/331 = 0.006 is found. The result of the functional analysis of the telecommunications models and standards indicates that the uniqueness ratio could be smaller than 0.036 for the telecommunications related sector. Surprisingly, this outcome is in the same order of magnitude as the uniqueness ratio 0.026 found for ISIC section J “Information and Communication” derived from the ISIC explanatory notes. Although this result can be disputed, it is in line with the theoretical prediction formulated in section 5.1 contribution 7; the uniqueness ratio found from each analysis of the different sources is smaller than 0.05. 7.3 A telecommunications hierarchical graph This section presents the telecommunications specific findings, relating to this thesis’ first hypothesis H1 “A generic layered structure can be identified that is applicable to all sectors”. The observation that models such as the telecommunications related OSI model can be presented as a layered structure, has led to H1. Subsequently, the holon concept [Koestler,1967] was selected and furnished with hierarchical layers [Baken,2009]. As proposed in section 2.4, any real holon can be described by means of four layers; a non-tangible active (1) and passive layer (2) both residing on a tangible active (3) and passive layer (4). In this concept, the tangible layers (3) and (4) constitute the infrastructure of a holon. The mere reason to embrace the holon concept in this thesis, lies in its recursive character which allows for viewing and explaining holons at various aggregation levels. In order to test H1 and to demonstrate the recursive property of a holon, this thesis contains the result of two visualisation exercises that exemplify two different aggregation levels; vital sectors (figure 47) and the telecommunications related sector (figure 55). As a consequence, these two empirical visualisations incorporate the hierarchical relations between the nodes symbolised by means of columns. Constructing a hierarchical graph of a set of networked components requires data about a) the dependencies between the components and b) the network structure captured in an adjacency matrix. The hierarchical graph of the network of nine vital sectors is derived from Input-Output matrices (containing monetary production data). The hierarchical graph of the network of telecommunications related platforms is derived from an adjacency matrix based on KPN specific data, validated by KPN architects.
152
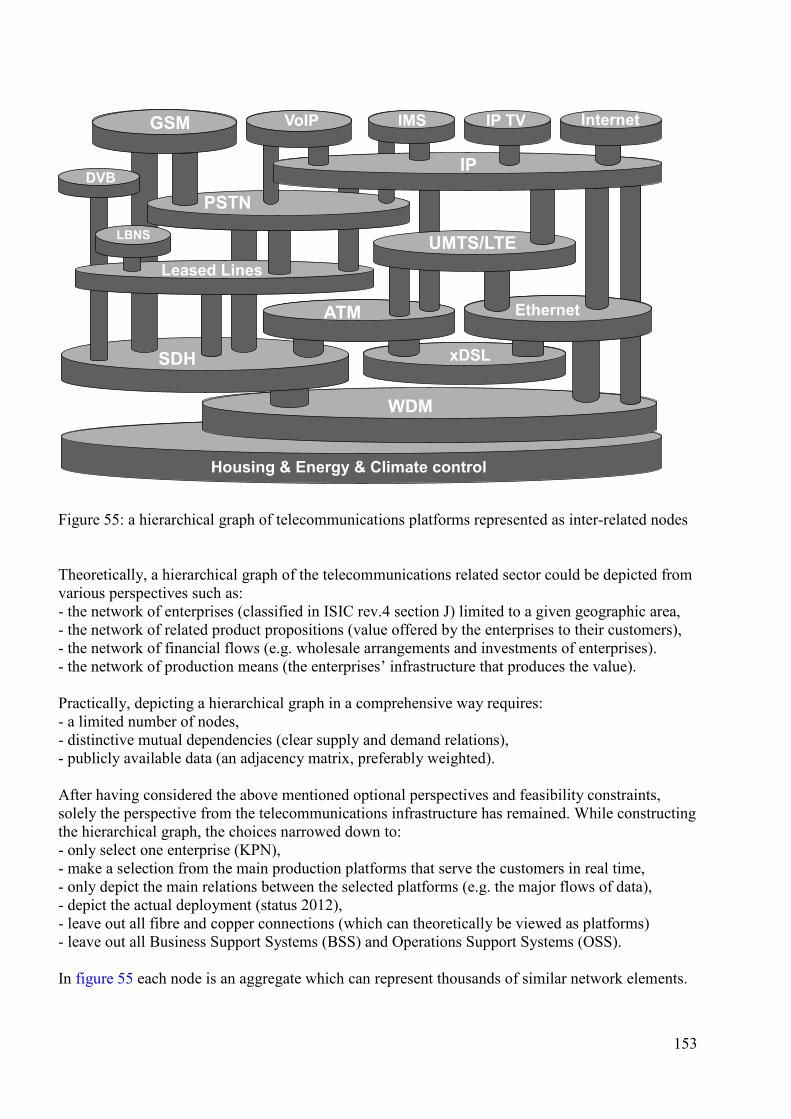
Figure 55: a hierarchical graph of telecommunications platforms represented as inter-related nodes Theoretically, a hierarchical graph of the telecommunications related sector could be depicted from various perspectives such as: - the network of enterprises (classified in ISIC rev.4 section J) limited to a given geographic area, - the network of related product propositions (value offered by the enterprises to their customers), - the network of financial flows (e.g. wholesale arrangements and investments of enterprises). - the network of production means (the enterprises’ infrastructure that produces the value). Practically, depicting a hierarchical graph in a comprehensive way requires: - a limited number of nodes, - distinctive mutual dependencies (clear supply and demand relations), - publicly available data (an adjacency matrix, preferably weighted). After having considered the above mentioned optional perspectives and feasibility constraints, solely the perspective from the telecommunications infrastructure has remained. While constructing the hierarchical graph, the choices narrowed down to: - only select one enterprise (KPN), - make a selection from the main production platforms that serve the customers in real time, - only depict the main relations between the selected platforms (e.g. the major flows of data), - depict the actual deployment (status 2012), - leave out all fibre and copper connections (which can theoretically be viewed as platforms) - leave out all Business Support Systems (BSS) and Operations Support Systems (OSS). In figure 55 each node is an aggregate which can represent thousands of similar network elements.
Housing & Energy & Climate control
WDM
SDH
DVB
xDSL
ATM Ethernet
UMTS/LTELeased Lines
LBNS
PSTN
GSM
IP
IP TV InternetVoIP IMS
153
The acronyms used in figure 55 have the following meaning: ATM: Asynchronous Transfer Mode (cell switching transmission technology) DVB: Digital Video Broadcasting (enabling the service “Digitenne”) GSM: Global System for Mobile communications (enabling wireless voice services) IMS: IP Multimedia Subsystem (service enabling layer) IP: Internet Protocol (routers) IP TV: Internet Protocol Television (enabling the service Interactive TV) LBNS: “Landelijk Beheer Netwerk Service” (network for operations and maintenance) PSTN: Public Switched Telephony Network (enabling wire line voice services) SDH: Synchronous Digital Hierarchy (TDM transmission technology) UMTS: Universal Mobile Telecommunications System (enabling 3G wireless services) LTE: Long Term Evolution (enabling 4G wireless services) VoIP: Voice over IP (enabling the voice part of the service “Internet Plus Bellen”) WDM: Wave(length) Division Multiplexing (optical transport technology) xDSL: Digital Subscriber Loop technology (such as ADSL and VDSL) Completing the description of the nodes visualised in figure 55: - Internet refers to the service that gives end-users access to the World Wide Web, - Leased Lines refer to the set of analogue and digital point-to-point connections serving either retail business customers, wholesale customers and operator internal purposes, - Ethernet refers to the transport technology (based on the IEEE 802.x set of standards) which serves either retail customers, wholesale customers and operator internal deployment, - Housing, Energy & Climate control refers to the buildings that host the telecommunications network elements and the equipment that powers and cools these elements. In [Van Mieghem,2006] the technologies ATM, GSM, Ethernet IEEE 802.3 and 802.11 (wireless LAN), IP, PSTN, SDH and WDM are explained in more detail. The main observations from the visualisation exercise are the following: - Together the platforms depicted in figure 55 contain a substantial amount of redundant functions. For example the functions of ATM, Ethernet and SDH are similar to a large extent. However, their design principles and average age differs. - Technologies such as GSM, UMTS/HSPA, VoIP and WiFi can offer end-users wireless and wired complementary access to DINs utilising IMS [Baken et all.,2007b],[van de Lagemaat,2007]. - When taking into account that the vast majority of systems (BSS and OSS) are not depicted in figure 55, this hierarchical graph gives a high level impression about the complexity of the network of platforms. Over the last decades, the major problem in the telecommunications related sector has become how to deal with complexity [van den Dool,1994]. - A layered view is just one out of many optional views. The main limitation of a hierarchical graph is the relatively small amount of nodes it can comprise, especially when aiming to plot this kind of graph in a two dimensional planar way. Thus, hierarchical graphs can serve for visualisation of networks mainly at high abstraction level. 7.4 A contemporary double paradox This section completes the answers to SQ3b “Can we profit and find value when we transfer sector specific knowledge, capabilities, insights and experience among the sectors? And more specifically: what does such a transfer mean for the telecommunications related sector?” The potential benefits of trans-sector innovation are explored in chapter 6. The observations from this unit of research have led to a positive answer to the first part of SQ3b. Answering the second
154
part of SQ3b requires exploring the contemporary status quo of the telecommunications related sector. The selected quantitative examples mainly concern the situation in The Netherlands during the period 1987-2011. Discussed here after, the observed situation seems to be featured by a double paradox. The first paradox concerns private telecommunications enterprises which have to safeguard: a) innovation budgets that ensure the control of autonomous complexity increase [van den Dool,1994], b) investments required for up-scaling network and processing capacity, c) continuity and availability of their DINs, while annual revenue in telecommunications decreases (in particular since 2007) [Morgan Stanley,2009],
[Anderson,2009],[American Bankers Association,2011],[Telecompaper,2012],[Brennenraedts et al.,p7,2012]. In this thesis, this first paradox is referred to as the communications business paradox*. The second paradox concerns the governance of vital sectors** and infrastructures: a) one of the (difficult) roles of governments is protecting citizens, their public interests and rights against companies that for example violate human rights [de Hert,p43,2011], b) the well-being of citizens strongly depends on the availability of vital infrastructure value, c) (international) private companies often own vital infrastructure such as telecommunications and energy networks but do not own the responsibility for the protection of the interests and well being of citizens. This second paradox, introduced in section 4.6 is referred to in this thesis as the responsibility paradox. Here after both paradoxes are discussed in more detail, taking the contemporary situation in The Netherlands as an example. 7.4.1 The responsibility paradox Like never before, the functioning of society depends on the reliability, availability and security of information, DINs [Bos&Spijkerman,2012] and energy networks [Ministry of Security and Justice,2012],[Agentschap
Telecom,2012]. The policy letter to the Dutch parliament [MinBZK,2005] states that protection of our vital infrastructures is a joint assignment for the government and enterprises. This assignment clearly implies a shared responsibility. However, in any system of networked sectors only a government is authorised to regulate [Prins&Broeders,2011]. In their essay that discusses the tension between system responsibility and information governance, Corien Prins and Dennis Broeders exemplify governmental interventions necessary to enforce limitations to the exchange of vital information and reduce societal risk. By means of DINs, vital information (such as identities, user profiles and possibly genetic predispositions of individuals) can be transacted and transferred in an unlimited way between (commercially driven) organisations. Gradually accepted, vital information seems to belong to everyone besides the responsible non-profit organisations and the citizens who it concerns. Accordingly, [Prins&Broeders,p44,2011],[The Netherlands Scientific Counsel for Government policy,2011] describe the related societal risk introduced by the combination of: - the connecting nature of DINs, - the blurring borders between the domains of public organisations and (semi-)private enterprises, - the contemporary lack of (international) regulation concerning the abuse of digital technology. As a result, (semi-)closed systems governed by dedicated (non-profit) organisations can become part of an open system; the Internet. (*) In contemporary consultancy jargon the communications business paradox is also referred to as “the perfect storm”; reflecting telecommunications revenue decrease at increasing traffic volume. (**) In the context of the protection of infrastructures and sectors, in EC related literature the English equivalent of the Dutch terms “bescherming vitale infrastructuur” is “protection of critical infrastructure”. In this thesis, the term “vital” is preferred instead of “critical” because “vital” primarily relates to the functioning of a sector network (which is a boundary condition for contemporary life) while “critical” primarily relates to a dangerous situation.
155

[Prins&Broeders,p45,2011] state that centralised control of a networked society is and will be impossible. Nevertheless, a government has a protective and regulating role. It is expected to define the borders between legal and illegal activities. Either from a system responsibility, a process responsibility or a residual responsibility*, governments should prescribe which developments are to be sanctioned, discouraged or encouraged. In line with an advise of the Netherlands Scientific Counsel for Government policy, in 2012 the Information Government Committee was installed, aiming to address strategic questions about system responsibility at Dutch and European level [The Netherlands
Scientific Counsel for Government policy,2011],[Prins&Broeders,p49,2011]. Within the context of vital information governance, [Prins&Broeders,p48,2011] mention the option of installing a lead authority at European level. Furthermore, it is worth noting that the Dutch Ministry of the Interior and Kingdom Relations has catalysed a broad set of initiatives aiming to improve the protection of vital infrastructure and vital sectors. In this context, the BVI report [MinBZK,2005] refers to the following related protective arrangements and measures taken so far. Nationaal Adviescentrum Vitale Infrastructuur (NAVI) Since 2007, the National Advisory Centre for the Critical Infrastructure has conjoined parties from government and business to improve the way of protecting the Dutch vital infrastructures against malicious disruption [www.rijksoverheid.nl,2007]. Nationaal Continuïteitsplan Telecommunicatie (NACOTEL) In 2006, this Public-Private Partnership initiative has resulted in setting up a national plan aiming to structure the governmental continuity and crisis management policy in the telecommunications related sector. Inferences from vulnerability analyses have been translated into measures under guidance of the Ministry of Economic Affairs. Agreements applicable to emergency situations, have been settled between the involved private enterprises and corresponding governmental bodies and have been described in a manual. Nationale waarschuwingsdienst Since 2003, the Dutch National Alerting Service has aimed to timely provide citizens and SMEs with warnings regarding IT security related incidents. This service resides within the National Cyber Security Centre (NCSC) [www.waarschuwingsdienst.nl,2012]. Computer Emergency Response Team (CERT) Since 2012, CERT has been part of the National Cyber Security Centre (NCSC) aiming to strengthen the resilience of Dutch society against IT disruptions. The NCSC offers expertise and advise how to make use of the Internet more safely. Furthermore, the NCSC stimulates the awareness of citizens and enterprises about their responsibilities [www.govcert.nl,2011],[www,NCSC.nl]. Platform continuïteit vitale ICT-bedrijven Since 2004, the platform continuity of vital ICT enterprises aims to exchange information about ICT problems and the usage of solutions among its members [MinBZK,2010]. Agentschap telecom The Dutch Telecom Agency is responsible for policy implementation, inspection and law enforcement concerning electronic communications, its radio spectrum allocation and protection. The telecom agency is authorised to audit and intervene when necessary. The telecom agency provides annual reports about the performance of the telecommunications enterprises active on the Dutch market and advises the Ministry of Economic affairs on issues raised at national level. (*) The EC has a system responsibility at European level. The term residual responsibility can be used to address the complementary responsibility of a member country of the EC.
156
In [Agentschap Telecom,2012], the Dutch Telecom Agency expressed its worries about the use of unlicensed spectrum for security applications and outages of parts of the communications infrastructure in The Netherlands. In July 2011, an outage of a telecom hub severely impacted the Rotterdam region, proved its vulnerability and motivated governmental investigations with focus on the cause, the approach during the incident, the measures taken after the incident and the societal impact [Ministry of
Security and Justice,2012]. During the incident, consequences of the outage have been the unavailability of; public transport, the public emergency service 1-1-2, the P2000 alarm network, the C2000-communications network, the national emergency network and fire alarm equipment. The letter to parliament [Ministry of Security and Justice,2012] reacts on: - the inspection report [Bos&Spijkerman,2012] about this telecom outage, - the investigation report [van Dorssen et al.,2012]* about recent energy outages. Furthermore, [Ministry of Security and Justice,2012] announced an additional investigation [Bos&Spijkerman,2013] about the outages in 2012 that caused the unavailability of the national 1-1-2 emergency service**. Consequences of the June 2012 outage have been 214 unanswered emergency calls and two related deadly casualties mentioned in [Bos&Spijkerman,p34&p123,2013]. In [Ministry of Security and Justice,2012] is concluded that: - continuity management needs prime attention at national scale, - risk perception concerning telecom and energy outages in vital organisations needs improvement. - continuity plans must be established, especially in decentralised governmental organisations such as security regions (responsible for disaster and crisis management), police and municipalities. - the main reason for the current absence of continuity plans in decentralised governmental organisations is a lack of time, resources and sense of urgency. In [MinBZK,2010] is concluded that safeguarding the agreed-on performance and availability of vital infrastructures is a shared responsibility of government and enterprises. From this source can be concluded that at least three Dutch ministries*** are involved in orchestrating vital sector continuity management. A challenge for this coalition is to effectively deal with the interests and fragmented responsibilities of enterprises (owning the vital infrastructures), decentralised governmental organisations and mobilise organisations mentioned on the previous page such as the Dutch Telecom Agency. 7.4.2 The communications business paradox Since the beginning of this century, the annual revenue of telecom operators has started to decrease worldwide. In [American Bankers Association,2011] is reported that in the US, wired telecommunication carriers have faced a revenue decline from $342 billion at the end of 2000 to $154 billion in 2010. In terms of absolute revenue decline this drop is by far the largest compared to any other activity cluster in the US. To the observed drop of 55% over this past decade, the ABA added a forecast of an additional 37% decline over the period 2010-2016. According to Statistics Netherlands, 91% of Dutch households and companies had wire line broadband access to Internet in 2010. Regarding Internet usage, 8% of the Dutch inhabitants reported to never use Internet while the European average equivalent was 26%. In roughly 15 (*) WODC report “Continuïteitsplannen ICT/elektriciteit” commissioned by the ministry of Security and Justice and carried out in 2011 and 2012 by i&o research and Berenschot (**) Concerning both the national 1-1-2 domain and the 1-1-2 chain, two sectors are involved; the government sector responsible for the functioning of the national police 1-1-2 emergency service and the communications sector responsible for the functioning of the (related) fixed and mobile telecommunications networks. (***) The Ministry of the Interior and Kingdom Relations, the Ministry of Security and Justice and the Ministry of Economic Affairs (which includes the Dutch Telecom Agency) authorised the Dutch Telecom Agency to intervene in the telecommunications market when necessary.
157
years’ time, this infrastructure coverage was achieved in The Netherlands noting that the realisation of UMTS network capacity (enabling large scale wireless Internet access), took off more recently. The telecommunications market consists of Internet access, fixed and mobile telephony, television and connectivity. The latter type of services such as leased lines are only offered to the business and wholesale market. The total Dutch telecommunications market revenue is estimated to decrease by circa 2.5% each year. Since 2010, mobile revenue decline is also evident. For example, [Telecompaper,2012] reported that compared to 2010, the Dutch mobile telecommunications market (telephony & Internet) decreased by 3.8% in 2011. Broadband Internet access enables massive use of Internet applications such as Skype, YouTube, Whatsapp, Internet radio and television. As a consequence, full competition and the relatively high broadband Internet penetration in The Netherlands catalysed a price erosion of the prime sources of revenue of telecom operators and cable operators: metered mobile and fixed voice services and television respectively. Additionally, it is worth noting that regulated by Dutch law, operators have to refrain from prioritising high revenue traffic through their networks*. Thus enforced by law, the transfer of low revenue traffic must be safeguarded requiring abundant network capacity in place for all types of traffic. Increasing fixed and mobile data volumes drive an obligatory up-scaling of network capacity while revenue decreases. [Brennenraedts et al.,p8-9,2012] show that Dutch telecom investments declined by 25% from 2.67 billion euro in 2006 to 1.98 bn euro in 2010 and the telecom related labour force declined 9% from 55.000 in 2008 to 50.000 in 2010 while the total Dutch labour force only declined by 1.6% during the same period. Together the above mentioned developments intensify the tension in the telecom market characterised in this thesis as the communications business paradox. [Roodink,2011] and [Anderson,2009] discuss the trends and cost curves of doing business by means of Internet. Chris Anderson claims that these curves all point in the same direction: towards zero. He argues that the price of processing power, bandwidth and digital storage decreases rapidly mainly due to the fact that Internet combines these three technology driven developments. As a result, he demonstrates a net online deflation percentage of 50% per year (e.g. playing a video on YouTube costs half in half a years’ time). By means of 50 contemporary examples of (Internet based) business models, Anderson explains the notion of free pricing models and what he calls “freemium” tactics. These balancing acts aim at maximising profit by weighing the trade-offs in commercial offerings that consist of multiple service components. Contemporary electronic business requires sophisticated marketing choices which optimise the balance between zero cost transactions, cross-subsidising, cross-selling, up-selling, advertising options, attracting customers, social media interaction and giving away value components for free that constitute the core business of competitors. Additionally, Anderson explains the practices of misleading, deceiving, trading user profiles, digital piracy and the art of letting a third party pay for (a part of) a transaction between two parties. Competitors giving away value components at lower prices (or for free) cause intra-sector price erosion. For example, cable providers offer a telephony value component at a lower price compared to a telecom operators’ offering. In turn, telecom operators offer a television value component at a lower price compared to a cable providers’ offering. In the end, the value is the amount of money people are willing to pay for a product [de Reuver,p10,2009], influenced by (fluctuations in) supply and demand. The rise of mass market Internet applications and DINs has clearly reduced the value of a broad range of products (services and/or goods). As discussed in section 6.4, doing things digitally instead of physically saves time and money. However, the combination of advances in automation and usage of Internet applications impacted society even more fundamentally [Roodink,p160,2011]. (*) The Dutch net neutrality law has been accepted in 2011.
158

Douglas Rushkoff, quoted in [Roodink,p160,2011], posted a blog on CNN in 2011 bearing the title “Are jobs obsolete”. In this contribution Rushkoff discusses the potential loss of 600.000 jobs at the state owned US Postal Service due to the rise of email. Subsequently, Rushkoff confronts the aims of automation (business efficiency and optimising the cost of production) and the 2011 US government employment program. His confrontation addresses the lack of orchestration at sector network level and the responsibility to determine which perspectives are fundamentally prevalent; which aims should prevail and what measures need to be decided on at which moment in time. From the perspective of the politics of planning, [Ovink,2011] states* that “We misuse the complexity of the world to not know, or not even want to know.” Concerning decision-making [Fijnvandraat,2008] provided insights with focus on telecom operators rolling out broadband infrastructure**. Interviews and analysis results have shown that: 1. this kind of decision-making processes involves huge investments, high risk and uncertainties, 2. the duration of rollout initiatives varies between several months to ten years, 3. probably, the most important part of the process is the financial side in which expected revenues are the most important variable within the process, 4. major strategic decisions are made by senior management in small groups, 5. two decision-making theories seem applicable to characterise telecom companies; a) the Garbage can model applicable to organisational anarchies [Cohen et al.,1972],
b) Logical Incrementalism [Quinn,1980],[Das&Teng,1999]. Ad 5a) When an organisation matches the following criteria (problematic goals, unclear technology and fluid participation) the Garbage can model can characterise its decision-making process. [Fijnvandraat,p298,2008] claims its applicability from the interview results: “Strategic decision-making with regard to network upgrades and roll-out is not a structured, rational process, but can be characterised by connections of existing and suddenly emerging problems and solutions in combination with the availability of people at a certain time and place.” Ad 5b) When an organisation matches the following characteristics (incremental nature, broad and relatively vague objectives and many options for developments and adjustments), Logical Incrementalism can be applicable to its decision-making process. [Fijnvandraat,p298,2008] assumes from the interview results that this theory is applicable on telecom operators as well. The fact that telecom operators prefer and deploy evolutionary paths instead of revolutionary network rollout strategies indicates Logical Incrementalism to be generally applicable. Kotter researched transformation processes within 100 companies and the reasons why many transformation efforts fail [Kotter,1996]. From this empirical research he developed a transformation framework consisting of eight stages and concluded that the first step should be to put a stable leading coalition in place to conduct successful change. If this insight from the research of Kotter is applicable to a company, it could also work for transforming a sector consisting of comparable companies hindered by their “Garbage can like” decision making. [Helbing,2013] extends decision making to a global scale as our contemporary systems are strongly connected facing systemic risks that require a fundamental redesign. Helbing proposes new tooling which can process and analyse a wide spectrum of massive data, which can simulate effects of decisions and which can provide multi-perspective pictures aiming to support political decision-makers, business leaders and citizens. The results from the sum of all decisions taken at European level, national governmental level and company level concerning telecommunications and postal services is visualised in the figures 56a and 56b. Figure 56a shows the monetary development of the German production of the post and (*) [Ovink,2011] amends ”Our lack of feeling and knowledge, and our short-term and short-sighted approach, is making us not only financially bankrupt, but morally and socially as well.” (**) In this research a broadband connection is defined as a symmetric data connection of at least 10Mb/s.
159
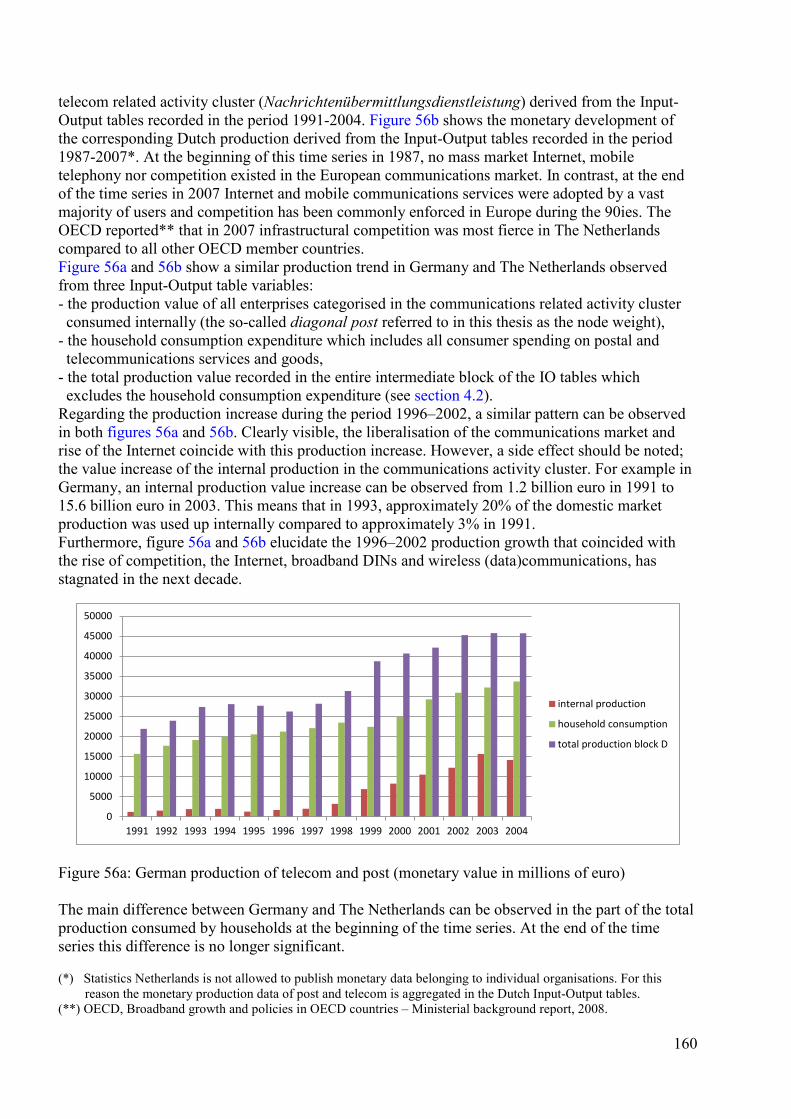
telecom related activity cluster (Nachrichtenübermittlungsdienstleistung) derived from the Input-Output tables recorded in the period 1991-2004. Figure 56b shows the monetary development of the corresponding Dutch production derived from the Input-Output tables recorded in the period 1987-2007*. At the beginning of this time series in 1987, no mass market Internet, mobile telephony nor competition existed in the European communications market. In contrast, at the end of the time series in 2007 Internet and mobile communications services were adopted by a vast majority of users and competition has been commonly enforced in Europe during the 90ies. The OECD reported** that in 2007 infrastructural competition was most fierce in The Netherlands compared to all other OECD member countries. Figure 56a and 56b show a similar production trend in Germany and The Netherlands observed from three Input-Output table variables: - the production value of all enterprises categorised in the communications related activity cluster consumed internally (the so-called diagonal post referred to in this thesis as the node weight), - the household consumption expenditure which includes all consumer spending on postal and telecommunications services and goods, - the total production value recorded in the entire intermediate block of the IO tables which excludes the household consumption expenditure (see section 4.2). Regarding the production increase during the period 1996–2002, a similar pattern can be observed in both figures 56a and 56b. Clearly visible, the liberalisation of the communications market and rise of the Internet coincide with this production increase. However, a side effect should be noted; the value increase of the internal production in the communications activity cluster. For example in Germany, an internal production value increase can be observed from 1.2 billion euro in 1991 to 15.6 billion euro in 2003. This means that in 1993, approximately 20% of the domestic market production was used up internally compared to approximately 3% in 1991. Furthermore, figure 56a and 56b elucidate the 1996–2002 production growth that coincided with the rise of competition, the Internet, broadband DINs and wireless (data)communications, has stagnated in the next decade.
Figure 56a: German production of telecom and post (monetary value in millions of euro) The main difference between Germany and The Netherlands can be observed in the part of the total production consumed by households at the beginning of the time series. At the end of the time series this difference is no longer significant. (*) Statistics Netherlands is not allowed to publish monetary data belonging to individual organisations. For this reason the monetary production data of post and telecom is aggregated in the Dutch Input-Output tables. (**) OECD, Broadband growth and policies in OECD countries – Ministerial background report, 2008.
0
5000
10000
15000
20000
25000
30000
35000
40000
45000
50000
1991 1992 1993 1994 1995 1996 1997 1998 1999 2000 2001 2002 2003 2004
internal production
household consumption
total production block D
160
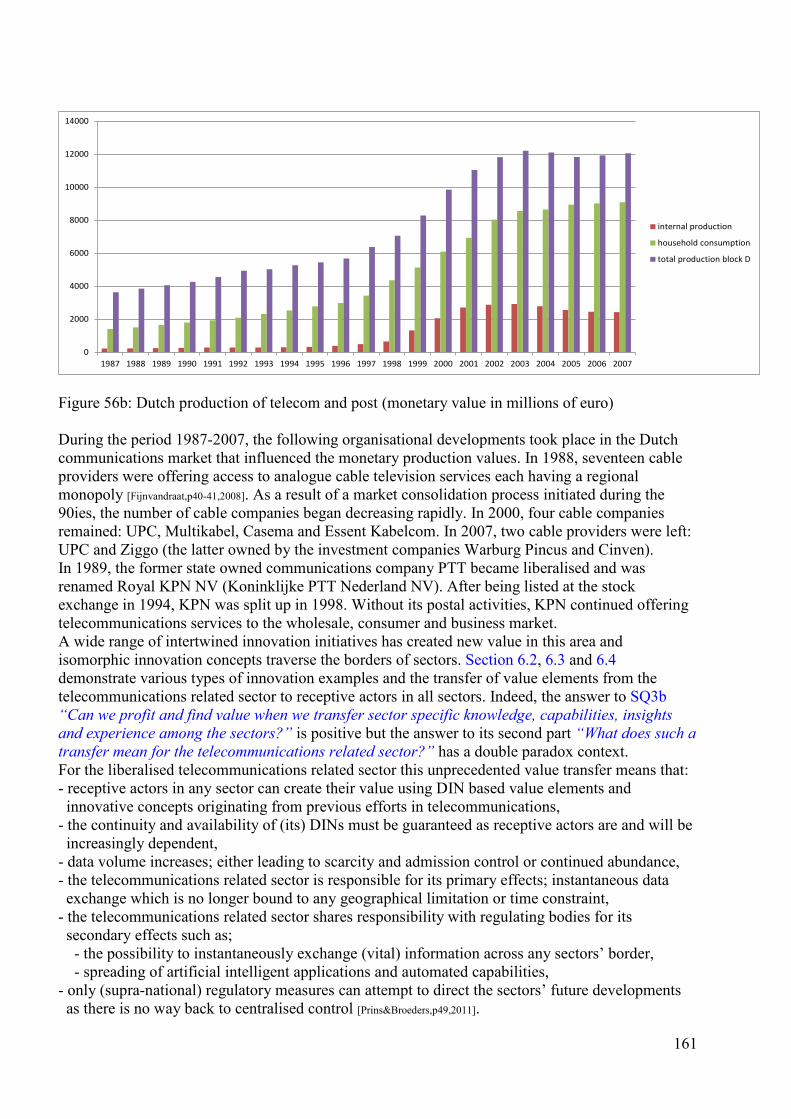
Figure 56b: Dutch production of telecom and post (monetary value in millions of euro) During the period 1987-2007, the following organisational developments took place in the Dutch communications market that influenced the monetary production values. In 1988, seventeen cable providers were offering access to analogue cable television services each having a regional monopoly [Fijnvandraat,p40-41,2008]. As a result of a market consolidation process initiated during the 90ies, the number of cable companies began decreasing rapidly. In 2000, four cable companies remained: UPC, Multikabel, Casema and Essent Kabelcom. In 2007, two cable providers were left: UPC and Ziggo (the latter owned by the investment companies Warburg Pincus and Cinven). In 1989, the former state owned communications company PTT became liberalised and was renamed Royal KPN NV (Koninklijke PTT Nederland NV). After being listed at the stock exchange in 1994, KPN was split up in 1998. Without its postal activities, KPN continued offering telecommunications services to the wholesale, consumer and business market. A wide range of intertwined innovation initiatives has created new value in this area and isomorphic innovation concepts traverse the borders of sectors. Section 6.2, 6.3 and 6.4 demonstrate various types of innovation examples and the transfer of value elements from the telecommunications related sector to receptive actors in all sectors. Indeed, the answer to SQ3b “Can we profit and find value when we transfer sector specific knowledge, capabilities, insights and experience among the sectors?” is positive but the answer to its second part “What does such a transfer mean for the telecommunications related sector?” has a double paradox context. For the liberalised telecommunications related sector this unprecedented value transfer means that: - receptive actors in any sector can create their value using DIN based value elements and innovative concepts originating from previous efforts in telecommunications, - the continuity and availability of (its) DINs must be guaranteed as receptive actors are and will be increasingly dependent, - data volume increases; either leading to scarcity and admission control or continued abundance, - the telecommunications related sector is responsible for its primary effects; instantaneous data exchange which is no longer bound to any geographical limitation or time constraint, - the telecommunications related sector shares responsibility with regulating bodies for its secondary effects such as; - the possibility to instantaneously exchange (vital) information across any sectors’ border, - spreading of artificial intelligent applications and automated capabilities, - only (supra-national) regulatory measures can attempt to direct the sectors’ future developments as there is no way back to centralised control [Prins&Broeders,p49,2011].
0
2000
4000
6000
8000
10000
12000
14000
1987 1988 1989 1990 1991 1992 1993 1994 1995 1996 1997 1998 1999 2000 2001 2002 2003 2004 2005 2006 2007
internal production
household consumption
total production block D
161
7.5 Conclusions This chapter joins this thesis’ telecommunications specific research results in order to complete the answers to RQ1 and RQ3. This research connects four telecommunications related studies about: 1. the definitions from EACSs and OECD alternative sector aggregates (section 7.1), 2. the functions derived from widely accepted models and standards (section 7.2), 3. hierarchy, layering and dependencies among telecommunications platforms (section 7.3), 4. the paradoxes observed in societal trends and the value of production (section 7.4). Derived from section 7.1 the following can be concluded. The UN ISIC rev.4 and other examined contemporary EACSs unanimously categorise telecommunications at division level and not at section level. This implies that telecommunications is not a sector in itself. Guided by theoretical classification principles [ISIC,2008],[Potter,1988] and after comparison of various literature sources, the proposed name of the sector of which telecommunications is part, is communications sector (and not ICT sector). Listed in table 18 (section 4.6) the telecommunications sector aggregate labelled a vital sector in [MinBZK,2005] does not match with ISIC section J “Information & Communication”, listed in table 24 in section 7.1. Furthermore, the scope of the telecommunications models and standards (subject to the second functional analysis) does not delineate according to the borders of EACS categories. Despite this mismatch, the results from the two functional analyses are in line. The uniqueness ratio of the functions within ISIC section J (derived from the ISIC rev.4 explanatory notes) is 0.026 and the uniqueness ratio of the functions (derived from the telecommunications models and standards) is approximately 0.03. Both empirical results are supportive to this thesis’ second hypothesis that states that in each sector only a fraction of its functions is unique for that sector. Combining the above mentioned findings with the unique technological property of data transfer by means of telecommunications equipment, the following definition is proposed: Being part of the communications sector, telecommunications is an activity cluster that offers its value, based on its unique function of transferring data by means of electro-magnetic waves. The main conclusion derived from section 7.3 concerns the outcome of the assessment of this thesis’ first hypothesis about hierarchical layering. Constructing hierarchical graphs which give insight in layering and components’ dependencies is feasible, but poses a strong limitation to the number of nodes incorporated in the graph. This was learnt from the attempts to construct figure 47 (vital sectors) data and figure 55 (telecommunications related platforms). The main conclusions derived from section 7.4 address the paradoxes observed in and around the contemporary communications business: - Since the early 90ies, the responsibility for continuity and availability has been divided up among liberalised (tele)communications enterprises and the national regulators. - Communications enterprises and private investment companies own parts of vital infrastructures which are a boundary condition for the well-being of citizens. Contrastingly, these organisations do not own any formal responsibility to protect the interests of citizens and society which is a governmental responsibility. This situation can be characterised as a responsibility paradox. - A typical telecom operators’ strategic decision-making process matches the characteristics listed in the garbage can model (for a characterisation see Ad 5a) [Fijnvandraat,2008]. - From the monetary production value recorded in the German and Dutch Input-Output tables, the largest growth can be observed during the second half of the 90ies followed by growth stagnation in the next decade. Currently, the (Dutch) total telecommunications market revenue decreases while the exchanged data volume increases rapidly. Although the Dutch and European govern- ment arranged a set of measures, the current situation can be characterised as a communications business paradox.
162
Section 7.4 answers SQ3b, reflecting on the meaning and the effects of telecommunications related examples of trans-sector innovation concepts (as described in Chapter 6). Some trans-sector concepts involve two or more sector participants to realise them. Some concepts, appearing in two or more sectors can be identified as isomorphic; although their implementation is sector specific, their nature is clearly isomorphic. Some concepts which proved to be successful in sector X can be reshaped and transferred to sector Y. For example, doing things physically and doing things digitally are clearly isomorphic. The latter (enabled by communications enterprises), has fundamentally influenced the functioning of our society. The meaning for the telecommunications related sector of the transfer of isomorphic concepts, its specific knowledge, insights and capabilities, narrows down to four aspects: - all members of society increasingly depend on digital communications, - successful transfer (e.g. contribution to economic growth) achieved so far [Brennenraedts et al.,2012], - a vast potential of yet unknown innovations (trans-sector combinations) enabling receptive actors in any sector to create and transact their value. - a clear responsibility obliges to safeguard the availability, continuity, quality and knowledge of the DINs that enable the massive use of a wide range of vital applications. Kotter researched enterprises’ transformation processes and the reasons why many transformation efforts fail [Kotter,1996]. Derived from this research, his eight-step transformation framework advises to put a stable leading coalition in place as a first step. It starts with a stable coalition that conducts the change. This approach seems in line with the option mentioned by [Prins&Broeders,p48,2011] to install a lead authority at European level*. According to [Helbing,2013] our strongly connected systems imply globally networked risks and to make our systems manageable, a fundamental redesign is needed. This work would also require new tooling which can process and analyse a wide spectrum of massive data, which can simulate effects of decisions and which can provide multi-perspective pictures aiming to support political decision-makers. The current economic crisis requires clear responsibilities, overview and orchestrated measures leading to a more stable situation at sector network level with focus on its vital sectors. The stability and continuity of the communications sector (described in this chapter by means of the communications business paradox and responsibility paradox), needs enforcement above the level of individual enterprises and sectors. At national level, this for instance requires collaboration of at least the Ministry of the Interior and Kingdom Relations, the Ministry of Security and Justice, the Ministry of Economic Affairs, enterprises responsible for operational continuity of our vital infrastructures, institutions such as the Netherlands Scientific Counsel for Government policy and researchers engaged in disciplines such as Global Systems Science, public security and Complex Network theory . (*) Within the context of vital information governance [The Netherlands Scientific Counsel for Government policy,2011]
163
Chapter 8 Conclusions This chapter presents this thesis’ conclusions and recommendations. Section 8.1 summarises the answers to the research questions. Section 8.2 discusses to which extent this thesis’ three hypotheses hold by means of a reflection from the research output. Finally, recommendations for further research are provided in section 8.3. This thesis’ central theme is the network of sectors which is analysed from five perspectives: 1. Economic systems; historic developments of sectors and their functions from EACSs (chapter 3), 2. Complex networks; properties and dynamics from IO table and labour force data (chapter 4), 3. Modelling (chapter 5), 4. Trans-sector Innovation (chapter 6), 5. Communications and its functions (chapter 7). As a foundation for the answers to this thesis’ research questions, the following definitions and propositions have been selected from system theory [Bunge,1979]. The central nomenclature of this thesis can be captured in five interrelated definitions: 1. Every human society can be analysed into a number of sectors and sub-systems. 2. A systems’ structure is defined by the set of relations between the systems’ components. 3. An economic system is composed of sectors, thus the sectors are components of an economy. 4. The transactions between the connected sectors define the structure of the economic network. 5. There are no systems without functions; the functions of a system define what the system does. The four propositions selected from system theory are: 1. In every human society every member shares information, services or goods with some other members of the same community. 2. In every human society some members perform labour thus transform parts of their environment. 3. All sub-systems have at least three functions/activities in common: - communicating with other sub-systems of the community, - consuming or transforming energy, - producing waste products. 4. Each sector performs at least one unique (distinct) function with which it distinguishes itself from the other sectors (its environment) and by which it is enabled to produce a distinct value to that environment. From classification theory the following theoretical classification principles are selected: 1. Homogeneity is an important and generic aspect concerning classification system development and methodology. 2. The two most significant criteria for defining homogeneity of groupings of statistical units (such as economic sectors) are: - the type of economic activity (its directly related functions), - the type of goods or services produced or dealt with (its directly transacted value). One can distinguish a societal view from an economical view relating to well-being and well-fare respectively. In this sense, one could envisage a transaction serving a social purpose or a business purpose. This definitional ambiguity requires a clear choice. As a result, this research focuses on the sector network from an economic perspective and endeavours to apply complex network theory and tooling. This choice is reflected in the title of this thesis. By definition, the set of sectors constituting the sector network is complete, so this set comprises all activities categorised in contemporary EACSs such as ISIC rev.4 and all sectors are complementary and non-overlapping, thus exclusive by nature.
164
8.1 Main findings This section gives an overview of this thesis’ research output and summarises the conclusions. These findings are presented by answering this thesis’ three research questions (RQ1-RQ3) and eleven sub-questions (SQ1a-SQ1f, SQ2a-SQ2c and SQ3a-SQ3b). RQ1 “What defines a sector and which ones can be distinguished?” An Economic Activity Classification System (here after abbreviated to EACS) categorises and describes hundreds of different activities which can be aggregated into sectors and EACS sections. The International Standard Industrial Classification of All Economic Activities issued by the United Nations Statistics Division (here after abbreviated to ISIC) is the prevalent standard to which many national EACSs comply. Unless explicitly mentioned, in this chapter the abbreviation ISIC refers to its current revision 4 which contains 21 sections. Section names in EACSs (table 7) tend to differ from sector names (table 26). Section names tend to be longer than sector names because they aim to precisely reflect their prime activity clusters, whereas sector names aim to capture the heart of the matter in one or only a few words. Without any constraints, any individual is free to define a list of sectors and sector names. Everyone can aggregate activities for any purpose and label this cluster a sector. In contrast, government related organisations (such as the Chamber of Commerce) that issue licenses, classify organisations and publish statistics are bound to classification constraints and international agreements. From a classification point of view the answer to the first part of RQ1 “What defines a sector?” narrows down to the EACSs and the experts authorised to maintain and adapt them. EACSs change over time and even national EACSs that belong to the same generation, show obvious differences. In 20th century Dutch EACSs the number of sections has varied between 29 (in 1930) and 9 (in 1960). An international selection of contemporary EACSs (table 5) shows a range between 17 and 21 sections. This range also indicates the order of magnitude of the number of sectors. Developments over time reveal the rise and fall of activity clusters across the hierarchical levels in subsequent generations of classification systems (see table 6). For example, environmental care related activities* are clearly emergent and seem to be a candidate for upgrading from division to section level in future EACSs and from sub-sector to sector level in sector lists. This conclusion is based on: - comparing previous generations of Dutch EACSs (see section 3.3), - the current fact that the unique functions belonging to ISIC section E* are clearly heterogeneous in nature (see the set of functions related to ISIC section E in the Appendix EACSs), - comparing the increase in degree of environmental care related activities versus other emerging candidates (based on observations from Input-Output table data), - the fact that all sectors produce waste products [Bunge,1979] and all connect to the environmental care related activity cluster that processes their waste. This fact has been verified and confirmed from German and Dutch Input-Output table data. Most EACSs contain a residual section such as ISIC section S “Other services activities”. Clearly, both the sections’ name and residual composition do not exclusively correspond to any sector. An example is given in table 26 how the residual categories could be redistributed in ISIC. (*) ISIC section E “Water supply; sewerage, waste management and remediation activities” groups together the activities relating to drinking water provisioning (E36/E37) and environmental care (E38/E39). In ISIC section E, the diversity of its sub-set of unique functions and value gives a heterogeneous impression. Furthermore, NAICS 2012 separates water/sewage (NAICS 2213) from waste management/remediation services (NAICS 562).
165

Derived from section 7.1 the following can be concluded concerning the telecommunications related activity cluster. ISIC and other contemporary EACSs categorise telecommunications at division level and not at section level. Although labelled vital, this fact indicates that telecommunications is not a sector in itself. Guided by theoretical classification principles [ISIC,2008],[Barnes,1982],[Potter,1988],[Gleick,2011] and after comparison of various literature sources, the proposed name for the sector of which telecommunications is part, is communications sector (and not ICT sector). From the research results (presented in section 2.2, chapter 3, section 4.1, sub-section 4.4.2, section 4.5, 4.6, 7.1 and 7.2) is estimated that a contemporary economic network consists of 20 complementary sectors. Table 26 proposes this thesis’ complete set of 20 non-overlapping sectors thus answering the second part of RQ1 “Which sectors can be distinguished?” Additionally, table 26 relates these 20 sectors to all corresponding ISIC categories in order to define a classification of all activities belonging to each sector exclusively.
Table 26: this thesis’ proposed list of 20 sectors and mapping to the corresponding ISIC categories The number of sectors and the EACS sections that describe them change over time and so do their names. The above proposed number of 20 sectors cannot be derived solely from comparing EACSs (section 3.2). Besides literature review of classification theory (section 2.1 and 3.1), this number is also derived from: - complex network analysis of various overlay levels observed from monetary data recorded in German and Dutch Input-Output tables (sub-section 4.4.2), - functional analysis with focus on unique functions (section 3.4 and 7.2). Currently, repair related activities are classified across the ISIC sections B, C, F, G, N, S and T. This classification choice is based on the second activity classification criterion [Potter,1988] which advocates the dominance of the type of goods or services produced or dealt with instead of the first criterion that advocates the dominance of the type of economic activity carried out (section 3.1). Table 26 however, promotes grouping the repair related division S95 “Repair of computers and personal and household goods” away from the residual ISIC section S into ISICs trade related
Related with ISIC revision 4
section P
section A
section F
Sector name
divisions E38 and E39
Care
Environmental careFinance
Hotel, Restaurant, Café
Education
Agriculture & Fishing
Communications
Construction
Government
Households
section Q and the divisions S94 and S96
section I
section J
section K
section O and section U
Entertainment section REnergy
Administrative activities
ManufacturingMining
Professional activitiesReal estateTradeTransportWater
section Hsection E excluding the divisions E38 and E39
section G and division S95
section Msection B
section N and class S9601
section D
section C
section L
section T
3.
9. 10.
12.
6.
2.
4.
5.
11.
13.
8.7.
1.
14.15.
16.17.18.19.20.
166
section G* which includes the repair of motor vehicles and motorcycles (see sub-section 7.1.1). Grouping these repair related activities together would be in line with the first activity classification criterion which has been applied in the Russian EACS OKVED [Goskomstandart,2010]. Applying this theoretical principle in the next ISIC version could result in EACSs without a residual section when classifying; a) ISIC S94 and S96 well-being related divisions into an extended care related section and, b) ISIC class S9601** into ISIC group N812 “Cleaning activities” and, c) ISIC division S95 into the trade related section G. These new EACSs would describe our contemporary sectors more homogeneously compared to the current ISIC rev.4 code. In sub-section 8.3.1 recommendation R1c captures the above mentioned classification options. SQ1a “Which functions characterise a sector?” In order to answer SQ1a two theoretical classification principles [Potter,1988] and one proposition from systems theory are selected: 1. Homogeneity is an important and generic aspect concerning classification system development and methodology. 2. The two most significant criteria for defining homogeneity of groupings of statistical units (such as economic sectors) are: - the type of economic activity (their directly related functions), - the type of goods or services produced or dealt with (their directly transacted value). 3. From systems theory [Bunge,1979] is proposed that each economic sector performs at least one unique function that contributes to producing the value offered to all sectors. The above mentioned selection from theory has been empirically tested by means of functional analyses. Taking into account that produced value can be shared directly between any pair of sectors without the interference of an intermediate sector, the following is concluded regarding the answer to SQ1a. - Especially its unique functions characterise a sector (see section 2.1, 3.4, 7.2 and this thesis’ seventh contribution to theory described in section 5.1). - When considering verbs to represent functions, from the ISIC explanatory notes can be observed that 19 out of its 21 sections contain unique functions. Likely, this uniqueness of functions is also applicable to sectors, because EACSs describe and categorise sectors’ economic activities. - The outcome of the uniqueness ratios is in line with the corresponding theoretical propositions regarding the functions of sectors [Bunge,1979] and supports this thesis second hypothesis. During the functional analyses a solution has been proposed for three practical problems: 1. Systems theory [Bunge,1979] proposes to distinguish specific sector functions from generic sector functions. When attempting to derive functions from EACSs this distinction poses a problem. For example the activity hunting is classified in ISIC section A “Agriculture, forestry and fishing”, but it is also mentioned in the description of the household related section T. On the one hand, hunting is definitely not a generic function which could be observed in other ISIC (*) An optional next step in applying the first activity classification criterion (that advocates the dominance of the type of economic activity carried out) could be considered in classifying all repair and maintenance related activities together in one section. The trade related section G seems most suitable for this. For example, this classification choice would require moving ISIC group C331 (that includes the classes C3314 “Repair and maintenance of electrical equipment” and C3313 “Repair of electronic and optical equipment”) to section G. (**) ISIC class S9601categorises “Washing and (dry-)cleaning of textile and fur products”.
167
sections. On the other hand, hunting cannot be uniquely observed in one ISIC section. The proposed solution enabling this thesis’ analysis of the functions of EACSs is to distinguish unique functions from non-unique functions at section level (which equals sector level). 2. The importance of functions in EACSs required incorporating functions in the construct of this thesis’ generic sector model (SQ1f). A solution was found in distinguishing meta-functions besides the division of hundreds of functions in unique functions and non-unique functions. Four meta-functions (transact, transfer, transform and transcend) were identified that seem to have a conceptual reach large enough to categorise any function within any activity cluster. 3. SQ1a aims to characterise a sector by its functions, but in some cases the functions/verbs found were not entirely unique to that particular sector or corresponding section. Based on theory, the solution is proposed to add a characteristic type of good or service produced or dealt with, to the verb that approximates the unique function. In classification theory [Potter,1988] such an ensemble is called a composite. It enables to exclusively characterise a sector or any of its activity clusters. The outcome of the functional analyses, an average uniqueness ratio of sector functions, was derived from two independent sources: a) the ISIC explanatory notes describing economic activities by means of 542 different verbs, b) 331 inventoried functions from telecommunications models and standards. In both functional analyses the inventoried verbs were considered to correspond to functions. Ad a) Among the 542 ISIC functions, 349 functions were found unique. When in a set of 20 sectors this gives an average uniqueness ratio 0.032 for the functions of all sectors (section 3.4). Ad b) Among the 331 telecommunications related functions, two functions were found unique. This gives 2/331 = 0.006 as the uniqueness ratio of the telecommunications related functions. When taking unique combinations into account consisting of both a telecom- function and a telecom-value produced or dealt with (so-called composites), the telecommunications uniqueness ratio varies between 0.03 and 0.36 (for more details see section 7.2 and the answer to SQ1b below). The results from b) the analysis of the telecommunications functions need very careful interpreting due to the small numbers of unique functions and unique combinations (composites). Although the findings from a) and b) can be disputed, they are in line with the theoretical propositions [Bunge,1979] reformulated in section 5.1 contribution 7: the average uniqueness ratio of sector functions found from the analyses of the two independent sources is smaller than 0.05. The findings from a) and b) also support this thesis’ second hypothesis that in each sector only a fraction of its functions is unique for a sector. From a) can be concluded that 349 unique functions present in 20 sectors, give 17.5 unique functions per sector on average (and 17.5/542 gives ~3%). Likely a lower average uniqueness percentage (or ratio) could be found when extending the research on unique and non-unique functions. This thesis proposes the following definition of an economic sector from both an economic classification perspective and an economic complex network perspective: A sector is a more or less homogeneous economic activity cluster that has at least one unique function and produces a similar type of goods and/or services or uses similar processes. At sector network level, all sectors can connect to each other in a full mesh structure, enabling direct exchange of their (unique) value.
168
SQ1b “Which specific and generic telecommunications related functions can be found?” Initially, answering SQ1b required inventorying functions from telecommunications models and standards such as DEMO, eTOM, FCAPS, NGOSS, OSI and TMN (see section 7.2 and the Appendix Telecommunications functions). During the research, 331 telecommunications related functions have been inventoried and each was labelled unique or non-unique. Renaming the labels implied a rephrasing of SQ1b into “Which unique and non-unique telecommunications related functions can be found?” As a result from the first functional analysis of the telecommunications models and standards: - terms such as data, data-flow, data-link and data-link connection have been identified as a typical value context of telecommunications related functions, - two unique telecommunications related functions (broadcasting and roaming) were found which can be distinguished without the need of adding a typical value context, - nine unique function composites were found (see table 25) which include an additional typical value context to distinguish their uniqueness, - 320 functions were found non-unique, giving 0.036 as a maximum value indication of the uniqueness ratio of the telecommunications related functions. The proposed definition of the telecommunications related activity cluster follows from literature review and the outcome of the functional analysis: Being part of the communications sector, telecommunications is an activity cluster that offers its value, based on its unique function of transferring data by means of electro-magnetic waves. SQ1c “Which relevant sector related data is available?” and SQ1d “Which economic activity classification systems exist?” Sector related data can be found in a wide spectrum of public and private publications such as business market surveys, analyst reports, trend forecasts and statistical compilations. Organisations providing this kind of publications all deal with the problem how to name and group the data of the involved activity clusters about which they report. As a result, a wide variety of self-proclaimed EACSs and aggregated data is published continuously. The EACSs issued by private organisations (such as news agencies, newspapers, banks, credit rating agencies and consultancy firms) are exemplified in chapter 3 because their publications provide interesting examples of sector names. Examples of these publications are STOXX 600, Thomson Reuters Business Classification and the sector overview of the newspaper NRC Handelsblad. These private publications tend to focus on private companies’ business and report about sector related economic data such as employment rates, stock prices, investments, international benchmarks, profit, loss and revenue trends. However, the public EACSs issued by the United Nations and national statistical offices can be used to report about all thinkable profit and non-profit activities. The Input-Output tables published by National Accounts departments of statistical offices record time series of monetary data regarding all activities of a national economy. Currently, ISIC is the prevalent EACS world standard to which many national EACSs comply. Based on a UN questionnaire, the UN Statistics Division website [unstats.un.org/unsd/cr/ctryreg,1Q2013] mentions the existence of ~700 classification systems/codes originating from 133 countries. Because national statistical offices can publish statistics captured in national classification codes constructed from various classification system perspectives (such as activities, organisations, occupations and products), the set of EACSs is a sub-set within the UN inventory of ~700 classification systems. Clearly, the EACS inventory (table 4) discussed in section 3.2 is not complete but a global selection of contemporary leading economies (member of G20) is assumed
169
representative and provides EACS examples which are divergent from ISIC. This divergence indicates which sector names are commonly used worldwide and which are not. SQ1e “How did the sectors evolve?” Since the 16th century, the term sector has been used in various meanings [Webster,1993] such as: - a geometric figure bounded by two radii and the included arc of a circle, - a sub-division of a military area of operation, - an area or portion resembling a sector, - a social, economic or political sub-division of society. Regarding the meanings that the term sector can have, this thesis’ research primarily centres around its economic aspect; an economic sub-division of our contemporary society. However, a historical view on the development of economic sectors is included in the research as well. Section 3.3 provides this historical perspective on economic systems with focus on the activity clusters mentioned at the highest level in the hierarchy of the EACSs that categorise the sectors’ activities. The names attributed to sectors (and EACS sections) by statisticians and economists reflect the sectors’ gradual rise and fall, their development and perceived importance (see table 6). The household has been unanimously categorised at section level in current and previous EACSs. The term economy originates from the Greek word “oikonomia” meaning house to manage. About 11.000 years ago nomadic families became colonists settling down in the first villages, initiating the process of functional decomposition also referred to as specialisation or the division of labour [Hidalgo&Hausmann,2009]. Enabled by early trade such as barter, specialists took over vital and non-vital tasks previously performed by each family. From this perspective, ancient households can be seen as the cradle of sectors and with the emergence of sectors, the household became a residual sector in itself. As a consequence, the household sector is fundamentally different in nature compared to all other sectors to which households outsourced most of their tasks. In contemporary EACSs and Input-Output tables only economic activities and functions that cannot be classified elsewhere, have remained in household related categories. Examples are production for domestic use and the role as employer for domestic personnel. As a result, the (remaining) activities mentioned in the household related ISIC section T are more heterogeneous in nature when compared to the activities of other sections. Besides its consumption, it can be defended that the household completes the set of sectors. As the household sector performs a wide variety of activity types, this heterogeneity accounts for the addition “more or less” in this thesis’ sector definition “A sector is a more or less homogeneous economic activity cluster etcetera”. SQ1f “Can we derive a generic sector model and what does it look like?“ The answers to the modelling related sub-questions SQ1f and SQ2c are combined; see SQ2c. RQ2 “What is a sector network and how did it evolve?” In order to answer RQ2 the following perspectives have been explored: - theoretical classification principles and EACS hierarchy, - economic systems and related historical developments, - physical infrastructures (vital and non-vital), - economic complex networks and hierarchical overlay levels.
170
This thesis proposes the following answer to RQ2: A sector network is a (fully meshed) network in which the nodes represent economic sectors. The sector network evolved as a result of the division of labour, the specialisation of all actors and their choices to preferentially relate, transact and exchange their produced value. By definition, an economic system is composed of sectors, thus the sectors are components of an economy [Bunge,1979] and the set of sectors constituting the sector network is complete. Recursively each sector is a network in itself. This property repeats itself for each of its component activity clusters. At sector level, a full mesh network topology allows for direct value exchange without the interference of any intermediate sector. Although this phenomenon was observed from German and Dutch IO data, it is not necessarily applicable to all national economic networks because some economies could have inter-sector link weights close or sometimes equal to zero. From a theoretical classification perspective, the set of sectors comprises all activities categorised in contemporary EACSs and all sectors are complementary, non-overlapping and exclusive without any ambiguity. Combining the set of ISIC sections and the analysis of time series of German and Dutch Input-Output data, has led to finding 20 fully meshed activity clusters referred to as sectors. From an economic system perspective, the term sector network is an abstraction capturing the produced and consumed value, shared through all relations in the sector network [Leontief,1936]. From a physical perspective, the vital and non-vital infrastructures that connect households and enterprises/organisations constitute the real networks. The sector network is an abstraction aggregating all activity clusters of an economic system which can be envisaged transacting and transferring economic (and social) value upon these real networks. From a complex network perspective, the sector network and its topology can be analysed (from national IO data) at various hierarchical network overlay levels. Each overlay is solely defined by the corresponding number of nodes/activity clusters N belonging to that particular aggregate. At sector network level and all higher aggregate overlay levels (N ≤ 20), the network structure can be characterised as a complete graph KN (with link density p = 1). At lower hierarchical overlay levels (e.g. N = 36, N = 59 and N = 105) still a high link density p and a relatively high percentage of hubs can be observed, but at these overlay levels a full mesh structure is not visible (p < 1). When increasing the number of nodes N of economic network overlays in the range N > 20, the average network degree E[D] increases and the link density p decreases. Additionally, it was discovered that on average the activity clusters belonging to vital sectors have a significantly higher degree in all examined ranges of link weights compared to non-vital activity clusters (see table 19 in section 4.6). This finding from the Dutch Input-Output data strongly indicates the high connectedness of vital infrastructures. In sub-section 4.7.1 a more detailed answer to RQ2 is formulated and discussed. SQ2a “Does the sector network constitute a complex network?” The answer to SQ2a is positive. Economic systems can be viewed and studied as networks (e.g. from their transactions). At global, continental and national scale it can be assumed that (the mathematical representation of) a sector network consisting of millions of actors connected by various types of infrastructures, constitutes a complex network. This inference is supported by this thesis’ research findings that seem in line with the definition and feature examples of a complex network [Wikipedia,2013]: “In the context of network theory, a complex network is a graph (network) with non-trivial topological features that do not occur in simple networks such as lattices or random graphs but often occur in real graphs. Most social, biological, and technological networks display substantial non-trivial topological features, with patterns of connection between their elements that are neither purely regular nor purely random. Examples of non-trivial features and properties are power-law degree distributions, short path lengths and (dis)assortativity.
171
SQ2b “What are the main observations, properties and characteristics derived from sector network related data?” The data analysis revealed that the German and Dutch economic network are alike to a high extent and appear to be a class of economic networks from their common properties. The main difference between the German and Dutch networks observed from the Input-Output table data is their sensitivity to the 2001 crisis. The Dutch network seems to be impacted more deeply and recovered more slowly than the German network (see figure 32a). The three main similarities which the German and Dutch networks have in common, concern a) an observed clustering trend, b) their correlations between degree, node weight and link weights (see table 15) and c) power-law like distributions in link weight and node weight. a) During the observed period, the weighted clustering coefficient C of both networks significantly increases by approximately 20%. Additionally this thesis introduces R, the network interaction ratio of an economic network, which is calculated from IO table data by dividing all link weights by the sum of all link weights and node weights per yearly instance. In the period 1987-2007 the R of both the German and Dutch economic networks decreased. This is in line with the trends of R observed from the World Input-Output Database [WIOD,2012] that contains the time series of 40 countries recorded during the period 1995-2009. b) The degrees of neighbouring nodes were found negatively correlated, thus ρD is disassortative. This means that if a node/activity cluster is connected to many, its neighbouring clusters connect to fewer others on average. The link weights around each node were found positively correlated, thus ∆W is assortative. This means that activity clusters spread out transaction amounts more equally with their neighbours rather than transacting only high values with a preferred, small group of partners. The degrees and node weights were found positively correlated, thus ρ(D,W) is assortative. This means that activity clusters with lower internal transaction volume collaborate with fewer clusters. c) Power-law like distributions in link weight and node weight have been discovered at 59 and 105 node overlay level, indicating that no typical transaction values can be found in the German and Dutch networks. Illustrative is the exponent value 1.6 which was found from the probability density function (PDF) of the link weights observed in the Dutch 105 node overlay. This research indicates that some empirical support was found to characterise the class of economic networks as scale-free networks because power-law like distributions (in node weight and link weight) and a negative degree-degree correlation (ρD) were found in the German and Dutch IO data. This finding is in line with commonly observed features in topological community overlays constructed upon various types of complex networks. SQ2c “Can we derive a generic sector network model and what does it look like?” and SQ1f “Can we derive a generic sector model and what does it look like?” The answer to sub-question SQ1f and SQ2c is positive and a visualisation of the models is given in figure 52 in section 5.2. This thesis’ sector model is a system model that generically describes a sectors’ components and structure from an economic perspective. From the research, four fully meshed components were found that together constitute a tetrahedron and are generically applicable to any sector. In line with the structure described in the STOF model and method [Bouwman et al.,2008], the proposed components of the sector model are: 1. the operational portfolio representing its functions relating to yearly recurring cost (OPEX), 2. the commercial portfolio representing its products relating to revenue,
172
3. the technical portfolio representing its production means relating to investments (CAPEX), 4. the orchestration portfolio representing its financial arrangements, plans, decisions, rules (relating to its internal and external relations) and profit obtained from its transactions. Here, profit is defined as the result of revenue minus cost, minus investments over time. The sector model is constructed in a holonic manner that supports the recursive character of its activity clusters (sector, sub-sectors, organisation clusters, organisations and individual actors). The four components are chosen and described by means of portfolios [Baken et al.,1993] in such a way that the tetrahedron shaped sector model is also applicable at the level of sub-sectors, organisation clusters, organisations and individual actors. A tetrahedron structure has been chosen as it can connect four components and because its shape allows for merging into an icosahedron connecting 20 sector tetrahedrons in its centre. Although the sectors’ four components are equally important, the operational portfolio is chosen as the apex of the sector model because it contains the activities which primarily connect the sectors and because activities reflect the dynamic character of the sectors in the core of the sector network model. As the sector model is generic, so is the sector network model that joins 20 sectors by their operational apexes via 190 connections. RQ3 ”Which promising trans-sector innovation examples can be identified?” As demonstrated in section 6.4, combining value elements from 20 sectors results in more than one million trans-sector innovation combinations and multiple variants (examples of innovation concepts) within each innovation combination. Theoretically an abundance of sector combinations appears in a combinatorial area where approximately 10 out of 20 potential sector participants would join their sector specific value in an innovation concept (see figure 53). However, not every sector combination is expected to yield the same amount of innovation concepts. For example, sector combinations that include the manufacturing sector could give many thousands of innovation variants, while sector combinations that exclude the manufacturing sector could give a significantly smaller number of innovation variants. Practically trans-sector innovation combinations which for example would require collaboration between more than 16 sectors, may not yield feasible innovation concepts at all due to collaboration complexity. [Bouwman et al.,2008] shows the multi-actor complications that pose limitations to the number of participants in value networks and innovation initiatives. Thus, when exploring the combinatorial area of theoretical abundance one should initially engage in innovation practice that involves less than 10 sectors per innovation initiative. This conclusion has been empirically tested by means of a trans-sector innovation experiment in which 114 master students participated during 2007-2011. This experiment (resulting in 55 trans-sector innovation concepts) is described and analysed in more detail in section 6.2 and section 6.4 respectively. From the experiment was observed that innovation concepts involving six different sector participants, appeared most frequently. The 10 sectors appearing most frequently in the generated concepts are (in sequential order of appearance): communications, manufacture, household, transport, government including security, healthcare, finance, trade and environmental care (see table 22). Concerning this innovation experiment it is worth noting that the background, the interests, the innovation experience and average age of the population seem to influence: - the selection of the value elements / corresponding sectors, - the number of sectors per innovation concept (relating to the feasibility of an innovation project). Besides the innovation concepts ideated by 114 master students, other sets of innovation concepts have been examined during this thesis’ research such as a set of a several hundreds of ideas generated and inventoried at KPN over the last 10 years and the concepts mentioned in the service bundle 2020 interviews. On average the highest number of sectors per innovation concept was
173
found in the set of 55 innovation concepts generated by the master students. Having compared these results, the following can be concluded intuitively. When endeavouring in a trans-sector innovation, initially select concepts that require a limited number of sector participants. An innovation coalition between two and six sector participants could be stable enough for solving practical difficulties regarding feasibility of partnerships, rules, agreements and mutual trust. After gaining trans-sector innovation experience, innovation concepts can be selected that involve a larger number of participants. In order to contribute to answering RQ3 and SQ3b, an image of the service bundle 2020 was established from interviewing innovation experts originating from communications enterprises (see section 6.3). Free to mention any service concept (combining service elements from any thinkable sub-set of sectors), the interviewees have reflected on the following questions: - Which service concepts do you expect to be relevant in 2020? - For each service concept, which examples can you mention regarding services, production means, tools and or devices characteristic of the year 2000, 2010 and possibly 2020? The main conclusions from the service bundle 2020 interviews are the following. - The 17 service concepts mentioned, mainly relate to the sectors communications, energy, entertainment, finance, government (including security), healthcare, household, manufacturing, trade and transport (see table 23). - During 2000-2010, the number of newly introduced service elements has exceeded the number of disappearing older concepts. The interviewees expect this trend to continue towards 2020 which could indicate increasing diversity and complexity. - Most service examples mentioned relate to traditional activities being performed digitally some of which involving Artificial Intelligence. Having analysed the innovation concepts (either generated during the trans-sector innovation experiment or mentioned in the service bundle 2020 interviews) a representative example could be the following. There must be a certain market potential in (remotely) assisting citizens to securely navigate through DINs aiming to match their supply and demand. For instance, digitally equipped navigators could help citizens to obtain subsidies, discounts or refunds in a maze of optional (regulatory) arrangements and receive a small fraction of the financial result. This public navigation aid could be offered to citizens that lack the skills or have personal difficulties to operate (or pay for) the devices which enable secure navigating through increasingly complex DINs. As a result, citizens can find and obtain what they need or they can transact and share their personal value with other citizens or organisations. SQ3a “Which main isomorphisms can we detect among the sectors?” Answering SQ3a yielded four different types of isomorphisms of which the first three types were derived from the innovation concepts generated during the trans-sector innovation experiment and the service bundle 2020 interviews. As a result, the following types of isomorphisms were found of which the first three types could be characterised as achievements from automation: 1. Doing things digitally instead of or in addition to doing things physically, 2. Doing things using networked sensors instead of or in addition to doing things using human senses, 3. Doing things operated by means of networked Artificial Intelligence instead of or in addition to doing things operated by means of human intelligence, 4. Transfer of a sector specific process or procedure to another sector.
174
The first isomorphism type reflects concepts that can be viewed as extensions to human tooling. The second type reflects extensions to human senses. The third type reflects extensions to the human labour force. In contrast to the first three types, the fourth isomorphism type (detected from literature such as the Framework for Cure and Care (F4CC)), includes the translation and transfer of an entire human and or technological labour arrangement from an originating sector X to a destination sector Y. The F4CC is based on the structure of eTOM and translates its telecommuni-cations related terminology to healthcare related terminology while maintaining the structure of areas, rows and columns at eTOM process level 1 (see sub-section 2.3.8 and the Appendix Repository of assessed models). Other examples of isomorphic concepts of the fourth type are: - uploading digital home-made personal content to the public Internet versus uploading energy produced locally at a household premises to a public energy transportation network. - manufacturing physical objects at locations other than traditional facilities attributed to the manufacturing sector by means of digitally networked 3D printers for domestic use. The above mentioned set of isomorphisms does not intend to be complete. For sure more than four types of isomorphisms could be identified. SQ3b “Can we profit and find value when we transfer sector specific knowledge, capabilities, insights and experience among the sectors? And more specifically; what does such a transfer mean for the telecommunications related sector?” The answer to the first part of SQ3b is positive but from literature review and the trans-sector innovation experiment the following complication is observed. Where theory (section 6.1) suggests that (isomorphic) concepts can be transferred from an originating sector X to a destination sector Y, the empirical findings show that the origin and destination of transferred value elements do not necessarily delineate according to the boundaries of sectors. This fact has complicated the research regarding SQ3b. For example, the development of Artificial Intelligence (AI) cannot be monopolised within any originating sector X, nor the deployment of AI in any destination sector Y. Nevertheless, a successful AI based capability or the expertise built up from its development could very well be adjusted and transferred to other sectors. Despite this origin/destination complication surrounding SQ3b, from a functional perspective a positive answer to SQ3b seems also likely, as the majority of functions (activities) is not necessarily associated uniquely to one sector. The second part of SQ3b addresses the meaning for the telecommunications related sector in the transfer of sector specific knowledge, capabilities, insights and experience. This transfer of sector specific value can be envisaged in two directions; outside-in entering organisations (categorised in the communications sector) and inside-out offered by these organisations to any actor in any sector. Outside-in, the meaning of the transfer narrows down to all thinkable possibilities of translating and or enhancing concepts involving physical means originating from any sector into concepts involving digital value elements. Inside-out, the meaning of the transfer narrows down to at least the following aspects. 1. All members of society have become increasingly dependent on digital communications, 2. The successful transfer (e.g. contribution to economic growth) achieved so far [Brennenraedts et al.,2012], 3. The vast potential of yet unknown innovations (trans-sector combinations) enabling receptive actors in any sector to create and transact their value, 4. A great responsibility obliges to safeguard the availability, continuity, quality and knowledge of networked digital machines that enable using a wide range of vital applications (section 7.4). Concerning the first and second aspect, according to [Brennenraedts et al.,2012] the contribution of telecommunications to the Dutch economic growth (GDP) has been estimated 25% over the period 1970-2010. Regarding the third and fourth aspect, the resulting increase of the data volume obliges scaling up the digital network capacity. Worldwide, telecommunications related revenue decreases
175
unprecedentedly [American Bankers Association,2011], putting pressure on budgets and investments. [Brennenraedts
et al.,p8-9,2012] have shown that Dutch telecom investments declined by 25% from 2.67 billion euro in 2006 to 1.98 billion euro in 2010 and the telecom related labour force declined 9% from 55.000 in 2008 to 50.000 in 2010 while the total Dutch labour force only declined by 1.6% during the same period. Together the above mentioned developments intensify the tension in the telecom market characterised in this thesis as the communications business paradox (see sub-section 7.4.2). The following conclusions are intuitive. 1. Before the industrial revolution commenced around 1860, the household constituted the main production location. During the industrial revolution work left home and economies scaled up. Production became more collective and centralised while working hours were standardised (towards working days from “9 to 5”). During the early 21st century, a substantial part of contemporary production will become home- made again after 150 years of industrialisation due to the wide spreading of intelligent digitally networked machines. As a consequence, the household could regain its production role in the sector network. Production becoming more individual and decentralised while working hours become flexible (towards “24x7” working weeks enabled by artificial intelligent assistants). 2. Under the current economic circumstances, the risks of market-driven organisation fragmentation and vital sectors’ failure seem to require trans-sector orchestration chaired by a governmental institution. It is worth noting that building up a network of organisations and a well-considered set of regulated arrangements aiming to protect civilians’ well-being and well-fare generally takes decades, while fragmentation and disintegration can happen within a few years. 8.2 Hypothesis testing This section discusses whether this thesis’ three hypotheses hold by means of a reflection from the research output. Section 2.5 describes these hypotheses (H1-H3) formulated during the initial stage of the research. H1 “A generic layered structure can be identified that is applicable to all sectors”. This thesis’ first hypothesis H1 holds. Observed from the literature, (e.g. Koestler’s holarchy of holons), various models (such as [OSI,1984]), standards (such as [NGOSS,2004]), systems (such as EACSs [ISIC,2008]) and real networks have a hierarchical structure. From table 3 in sub-section 2.3.10 can be concluded that a layered structure can be observed in a sub-set of the inventoried models and standards. Especially telecommunications related models have a tendency towards hierarchical layering and an explanation for this observation could be the following. Due to a high level of automation and the existence of many interconnecting actors, there has been a strong driving force in the telecommunications related sector towards uniformity and standardisation of processes and technology. Obviously, layering divides complex problems into smaller more manageable pieces that may be treated independently or executed in parallel [Van Mieghem,p15,2006]. Proposing a set of generic layers applicable to any real holon (figure 14) implies proposing generic layering of economic sectors as well. However, systems (holons) can be modelled and analysed from many perspectives serving specific goals. A layered view is just one of them and can be constructed mainly at a higher abstraction level (section 7.3). The main conclusion from section 7.3 concerns the outcome of the assessment of H1 by means of the hierarchical layering exercise. Constructing hierarchical graphs which give insight in layering and components’ dependencies is feasible but poses a strong limitation to the number of nodes incorporated in the graph. This was
176
learnt from the attempts to construct figure 47 (vital sectors) and figure 55 (telecommunications related platforms). However, visualising a systems’ hierarchy and its dependencies by means of layered graphs contributes to the understanding of a systems’ composition, structure and functioning. From the sector model proposed in section 5.2 can be concluded that a generic structure for each sector can be identified, but a model does not necessarily have to embody a generic layered structure. H2 “In each sector only a fraction of its functions is unique for that sector”. This thesis’ second hypothesis H2 holds. This conclusion is supported by empirical testing of the theory of [Bunge,1979]. Mario Bunge has postulated that each sector has at least one unique function. For an average sector, a uniqueness ratio value of approximately 0.03 was found. This outcome has been derived from joining the results of: - the functional analysis of the ISIC rev.4 explanatory notes (see section 3.4), - the analysis of telecommunications related functions (see section 7.2), - the investigation of the number of sectors (summarised in the initial part of section 8.1). Having found 20 non-overlapping sectors (together comprising all economic activities), only the manufacturing sector poses a problem regarding H2. Having concluded that the manufacturing sector corresponds to the ISIC manufacturing section C, an overwhelming majority of unique functions can be observed in the description of ISIC Section C “Manufacturing” (118 unique and 200 non-unique functions). For this particular ISIC section, H2 does not seem to hold but here it is important to immediately note that the ISIC descriptive method focuses on the exclusiveness of activities and does not repeat each non-unique function in the description of each section nor in its sub-categories. H3 “The rise of DINs enables the creation of the majority of sector isomorphisms”. This thesis’ third hypothesis H3 regarding the effect of Digital Information Networks (DINs) holds. However compared to H1 and H2, assessing the validity of H3 proved most difficult due to the conceptual nature of the constituent notions of H3 and the difficulty to quantitatively measure the value (effects) of DINs in the current sectors. [Madureira,p9,2011] mentions the extensive number of studies in this area and the research challenge captured by Robert Solow “You can see the computer age everywhere but in the productivity statistics” [Solow,1987]. Firstly, the following clarifications aim to provide a foundation for the notions constituting H3. - Recall (section 6.1) that when two objects are of equal shape these are isomorphic and they are related by an isomorphism. Then, since DINs belong to a specific type of technological enabler*, H3 requires to distinguish and compare similar objects with and without DIN based parts at sector level. - Contemporary computers are networked and contemporary DINs connect computerised devices. In order to simplify the assessment of H3, here after the distinction between DINs and IT is not taken into account. - DINs/IT provide data transfer functions [ITU-T,2007] enabling both high-speed storage and high- speed bridging of geographical distance. When comparing the transfer of physical goods (taking hours or days) with digital transfer (taking seconds or less), digital transfer can be perceived as (*) DINs constitute digital communications technology. In order to simplify the assessment of H3, the remnants of analogue communications technology currently in use, are not taken into account.
177
instantaneous. This feature seems a clear driver for the development of isomorphic concepts that enable “doing things digitally instead of or in addition to doing things physically”. - Although production (value) is measured in statistics, this is not the case for the tooling used to produce. This explains the difficulty to qualitatively measure the value of DINs/IT [Madureira,p5,2011] because after being produced and put in place, DINs/IT constitute tooling. Only the impact of the 2001 Internet bubble crash could be observed in statistics (the Dutch Input-Output data), coinciding with an evident turning point in the trends of the number of links and the link weight correlation around a node. (However when looking back, the bubble crash was related to over- estimating the value of enterprises providing DINs/IT and not to digitally enhanced production in itself). Secondly, the following findings aim to account for the statement that H3 holds. - From the service bundle 2020 interviews (see section 6.3) during 2000-2010, the number of newly introduced service elements appears to have exceeded the number of disappearing older ones (see table 23a and 23b). Clearly, DIN based alternatives were introduced next to traditional non-DIN based concepts of which some entirely isomorphic (digital versus physical). - When observing the nature of the four types of isomorphisms found (see section 6.4), three out of four isomorphism types are DIN-based. - [Brennenraedts et al.,2012] state that the telecommunications related sector has contributed 25% to the Dutch economic growth (GDP) over the period 1970-2010. They derived from statistical data that one euro invested in the telecom related sector generates 1.3 euro in other sectors. As DINs were introduced at large scale since the 80ies, this indicates that a substantial part of recent isomorphisms have a “digital signature”. - Recently emerging, 3D printers are DIN/IT controlled devices that offer a new spectrum of isomorphic concepts. 8.3 Recommendations for future work This section proposes three recommendations (R1-R3) for future work: - R1 described in sub-section 8.3.1 regarding the next revision of the United Nations ISIC, - R2 described in sub-section 8.3.2 regarding the definitial perspectives of sectors, - R3 described in sub-section 8.3.3 regarding economic network research. 8.3.1 Towards the next revision of ISIC The first recommendation (R1) proposes an invitation to the experts responsible for the update of the United Nations ISIC rev.4 and concerns the following ISIC rev. 4 sections: R1a) split up section E in two sections; one related to environmental care and one related to drinking water production and distribution, R1b) changing the name of section J, R1c) cancelling section S by redistributing its three divisions, R1d) merging section U and section O. Recommendation 1a: Currently, section E joins the activities related to drinking water provisioning (E36/E37) and environmental care (E38/E39). The diversity within the sub-set of unique functions and value of section E gives a strongly heterogeneous impression.
178
At highest classification level, the North American Industry Classification System 2012 [NAICS,2012] addresses this particular case of heterogeneity by separating water/sewage (NAICS category 2213) from waste management/remediation services (NAICS category 562). R1a proposes to split up ISIC rev.4 section E in such a way that activities related to environmental care will be categorised at section level. The reason behind R1a is that the value of the drinking water related sector and the environmental care related sector are both offered to and consumed by all sectors and both originate from fundamentally different unique functions. The split up would lead to a more homogeneous EACS that distinguishes the activities related to producing and distributing drinking water on the one hand from processing waste products and remediation of environmental quality on the other hand. The downside of this split is the statistical difficulty to classify organisations that perform both drinking water provisioning and environmental care related activities in two instead of one category. Thus when splitting up section E, especially the categorising of sewage activities requires a well-considered choice. Recommendation 1b: R1b proposes to consider changing the current name of ISIC rev. 4 section J “Information and communication” into “Communications” because information cannot be exclusively attributed to any section or sector. Regarding the corresponding section, R1b would lead to highlighting the communications related unique functions and value while reducing the definitional confusion concerning the complicated and intertwined notions of information, data and the technology that enables its transport, transformation and creation. Recommendation 1c: R1c proposes to cancel the ISIC rev.4 residual section S “Other services activities“ by: R1c1) classifying the division S95 currently called “Repair of computers and personal and household goods” in section G, for instance by defining a new division G48 while maintaining the distinction of the repair of household related equipment versus non- household related equipment. R1c2) merging the two divisions S94 “Activities of membership organizations” and S96 “Other personal service activities” with section Q except for S9601 “Washing and (dry-)cleaning of textile and fur products” that can be categorised into N812 “Cleaning activities”. R1c3) renaming ISIC rev.4 section Q “Human health and social work activities” into a broader human care, wellness and well-being oriented section called “Care” or “Human care”. Regarding the activities related to care and repair see section 3.2, sub-section 7.1.1 and section 8.1 for a more detailed background. In line with the Russian OKVED, R1c would lead to (a set of) EACS sections which can be connected to sectors more consistently because this set would not have a residual section. Recommendation 1d: The NAICS economic sector 92 “Public Administration” contains NAICS category 928120 “International Affairs” [NAICS,2002],[NAICS,2007],[NAICS,2012]. R1d proposes to merge ISIC rev.4 section U “Activities of extraterritorial organizations and bodies” with the government related ISIC section O. In line with NAICS, within such a merged category, national activities can be similarly distinguished from international activities. R1d would lead to an EACS of which all of its sections can be consistently connected to Input-Output data (which is currently not the case). Furthermore classifying governmental related international activities confined within one public administration related section could reduce activity classification difficulties and ambiguity.
179

8.3.2 Towards unravelling the definitional perspectives of sectors The second recommendation (R2) consists of two aspects: R2a) defining the relations between sector names and section names by means of a UN mapping, R2b) designing a framework that can be used to distinguish several classification perspectives and to simplify making statistical compilations for thematic aggregates. Recommendation 2a: R2a proposes to endeavour in clarifying the relation between the ISIC sections and the corresponding economic sectors. This can be achieved by a (UN) mapping of sector names and ISIC section names (see for example table 26). Within the context of this mapping exercise, it would be helpful to consistently describe the unique and non-unique functions of all ISIC classes by means of verbs in an update of the ISIC explanatory notes. A (UN sponsored) analysis of the functions of the contemporary sector network could contribute to understanding and solving current classification difficulties for all member states. Recommendation 2b: Making statistical compilations regarding recently proposed thematic aggregates such as the creative sector [SN,2013d] is becoming increasingly complicated and time consuming. Especially, mixing up classification perspectives seems to cause this complication. It could be useful to investigate how perspective-specific classifications relate. R2b proposes an effort to define sectors from at least the following classification perspectives: activities (functions), products (services and/or goods), organisations (enterprises) and occupations (crafts of individuals). Possibly, more classification perspectives can be identified. R2b could lead to a framework which can be used by national statistical offices and chambers of commerce to define thematic aggregates (referred to as sectors) for statistical compilation purposes more easily. The list of the Dutch top-sectors [SN,2013d] could be helpful in creating this framework and the classification perspectives could be derived from the following sources: - activities (e.g. functions derived from ISIC or any national EACS captured by means of verbs), - products (Classification of Products to Activity (e.g. the CPA issued by the European Union)), - organisations (the Business Register of Statistics Netherlands (abbreviated in Dutch to ABR)), - occupations (e.g. the International Standard Classification of Occupations (ISCO)). 8.3.3 Economic network research The third recommendation (R3) consisting of three aspects, proposes to extend the economic complex network research: R3a) Research of network constructs with >> 100 nodes, R3b) Research of recent time series to investigate the effects of the current economic crises, R3c) Research of time series of other countries besides Germany and The Netherlands. Recommendation 3a: From this thesis’ intuitive conclusions (IC1 and IC2 discussed in sub-section 4.7.2) two new hypotheses arose respectively: 1. Contemporary economic networks belong to the class of scale-free networks. 2. The scale-free property of economic networks can be observed from degree, link weight and node weight distributions derived from the relations between the nodes, their transactions (such as monetary flows and tax payments) and the number of workers constituting a node.
180
In this thesis is presumed but not proven that the scale-free property of economic networks can be observed from degree, link weight and node weight distributions, derived from data such as IO tables. R3a proposes to research more detailed network constructs (N >>100) aiming to test this thesis’ IC1 that economic networks are scale-free networks (see the sub-sections 4.4.2, 4.4.3 and 4.7.2). It is recommended to setup a research strategy that examines the influence of the contemporary use of DINs and the socio-economic trends regarding the presumed preferential attachment and preferential detachment behaviour (commonly attributed to the actors in scale-free networks). The research would require the consent of a national statistical office to access more detailed proprietary data (e.g. time series that include transactions performed by individual organisations). The research outcome could be presented anonymously in order to safeguard the privacy of individual organisations. R3a could lead to deeper insight regarding the consequences for a (national) economic network as a whole if the presumed behaviour is the case. As a next step, near-future consequences could be explored if the observed behaviour would proceed unchanged. Recommendation 3b: R3b proposes to research more recent German and Dutch time series in order to observe the effect of the current economic crisis on all network metrics as described in section 4.4. It is important noting that the IO tables recorded in the World Input Output Database [WIOD,2012], contain the 1995-2009 Dutch and German time series. However, compared to the researched 1991-2004 German and the 1987-2007 Dutch IO data set, the WIOD data set is less detailed. In [WIOD,2012] each countries’ number of activity clusters in the intermediate block is 35* and the salaries (part of the production cost) are not included. These facts influence the design of the network constructs [Miller&Blair,p34-
38,2009] and require careful comparison with this thesis’ results derived from the1991-2004 German and the 1987-2007 Dutch IO data set. R3b and R3c could lead to a verification of this thesis’ fifth intuitive conclusion IC5 (explained in sub-section 4.7.2) regarding the three proposed network indicators; - the organisation fragmentation trend, - the change over time of the weighted clustering coefficient C, - the change over time of the network interaction ratio R. Recommendation 3c: R3c proposes to research the meaning of the proposed network indicators at global scale. In this context it could be helpful to derive and compare the underlying network metrics from time series of (many) other countries. For example the data from [WIOD,2012] could be used as it contains large parts of the IO tables of 40 countries**. Comparing the trends from their network metrics, properties and correlations*** with those of Germany and The Netherlands will give additional insight and overview at global scale. It also offers the possibility to examine (coinciding) patterns in the business cycles and in the subsequent values of the network indicators of the worlds’ leading economies. Adding a philosophical perspective to meaning making from economic network data research, could also be helpful as the outcome of R3c aims to contribute to orchestration of the sector network as a whole. (*) The number of activity clusters incorporated in the intermediate block D of the original Dutch and German IO tables are 104 and 71 respectively. (**) Regarding these 40 countries, the network interaction ratios derived from the WIOD time series are included in this thesis’ Appendix World Input-Output Database. (***) See sub-section 4.4.4 regarding the correlations in degree, link weight and node weight.
181
Summary Economic Complex Networks a holarchy of evolving sectors This thesis aims to contribute to the understanding of the structure, composition, properties, functions and dynamics of economic systems. The research output results from joining advances in the scientific disciplines of systems theory, complex networks, Input-Output analysis and economic activity classification systems. The relevance of this research primarily lies in the insight and overview that arose from bridging these disciplines. The central theme in this research is the complex network of economic sectors in which the transactions between sectors determine the dynamic structure of an economic network. A sector network is an abstract aggregate of sectors. When observed in more detail, the network structure of an economic system becomes visible between sub-sectors and their constituent parts (revealing organisations and individuals at most detailed level). In this thesis, this hierarchy is also referred to as a holarchy. Sectors can be analysed from various perspectives such as activities (functions), products (services and/or goods), organisations (enterprises), occupations (crafts of individuals) and production means (tools). For instance, financing is an activity, a loan is a product, a bank is an organisation and a banker is an occupation. Sector names such as finance sector or banking sector are commonly used which illustrates the difficulties in establishing a set of non-ambiguous sector names and definitions. In daily practice the above mentioned perspectives tend to be mixed up and (overlapping) thematic aggregates are defined as sectors (e.g. creative sector, technology sector), complicating the production of statistical compilations. This mixed perspective approach ignores classification principles such as completeness, summability, exclusiveness and categorising from one perspective, based on the criterion of homogeneity. The perspective of activities or functions emphasised in this thesis, is also expressed in the design of a novel sector model and sector network model. The functional analysis of sector related activities (sourced from the UN economic activity classification system (ISIC) and a set of standards and models specific to the telecom related sector) shows that only 3% of the inventoried functions of a sector was found unique on average. This finding is in line with propositions from system theory. Prominently included in this thesis are the representation of economic systems as complex networks and the accompanying analysis of German and Dutch Input-Output data. This analysis of the monetary flows in the German and Dutch economic networks shows a full-mesh structure at sector level, thus each sector can directly share produced (unique) value with every other sector. Supported by findings from literature review, a contemporary sector network appears to consist of twenty complementary economic sectors. When descending the hierarchy below the sector level, the link density decreases, thus not all sub-sectors are directly connected. Observations from the analysis of the Input-Output data (1987-2007) show an increasing network clustering coefficient and a decreasing value of the interaction ratio of the sector network over time. Furthermore organisation fragmentation is observed from Dutch statistics about the composition of enterprises (2001-2012). Possibly these indicators directly relate to the increasing scale of outsour-cing activities and the governmental policy of privatisation and the dismantling of monopolies in order to stimulate competition. This observation and interpretation show that network analysis generates interesting questions and hypotheses, which could enrich economic science.
182
The above mentioned economic phenomena and the recent economic crises, raise the question if the sector network can be safely exposed to market forces. This thesis pleads for a more intensive orchestration of the sector network as a whole and the functioning of our vital sectors in particular. Nederlandstalige samenvatting Economische Complexe Netwerken een holarchie van evoluerende sectoren Dit proefschrift beoogt bij te dragen aan het begrip van de structuur, compositie, eigenschappen, functies en dynamiek van economische systemen. Het samenbrengen van gedachtegoed vanuit de wetenschappelijke disciplines van systeemtheorie, complexe netwerken, Input-Output analyse en classificatiesystemen van economische activiteiten heeft een onderzoeksresultaat opgeleverd waarvan de waarde vooral ligt in het inzicht en overzicht dat is ontstaan uit de combinatie van deze disciplines. Het centrale thema in dit onderzoek is het complexe netwerk der economische sectoren, waarin de transacties tussen de sectoren de dynamische structuur van het economische netwerk bepalen. Een sectornetwerk is een abstract samenstel van sectoren. Als een economisch systeem op een gedetailleerder niveau wordt bekeken, wordt de netwerkstructuur zichtbaar tussen sub-sectoren en hun samenstellende delen (uitkomend bij organisaties en individuen op het meest gedetailleerde niveau). Deze hiërarchie wordt in dit proefschrift ook holarchie genoemd. Sectoren kunnen vanuit meerdere perspectieven worden geanalyseerd zoals activiteiten (functies), producten (diensten en/of goederen), organisaties (bedrijven), beroepen (ambachten) en productiemiddelen (gereedschap). Bijvoorbeeld is financieren een activiteit, een lening is een product, een bank is een organisatie en een bankier is een beroep. Voor deze sector worden benamingen als financiële sector of bankensector gebruikt, wat illustratief is voor de moeilijkheid om tot eenduidige sectornamen en -definities te komen. In de praktijk worden perspectieven vermengd en ook worden (elkaar overlappende) thematische aggregaten als sectoren gedefinieerd (b.v. creatieve sector, technologie sector) hetgeen het maken van statistische compilaties compli-ceert. Hierbij wordt voorbij gegaan aan classificatieprincipes zoals compleetheid, optelbaarheid, exclusiviteit en het categoriseren vanuit één perspectief op basis van het homogeniteitscriterium. In dit proefschrift ligt de nadruk op het perspectief van de activiteiten of functies, wat mede tot uiting komt in een nieuw sectormodel en een sectornetwerkmodel. Een functionele analyse van activiteiten per sector, met als bronnen het economische activiteiten classificatiesysteem van de Verenigde Naties (ISIC) en een set standaarden en modellen specifiek voor de telecom-gerelateerde sector, laat zien dat per sector gemiddeld slechts 3% van de functies uniek is, hetgeen in lijn is met veronderstellingen vanuit de systeemtheorie. Prominent in dit proefschrift staan de representatie van economische systemen als complexe netwerken en de bijbehorende analyse van Duitse en Nederlandse Input-Output data. Deze analyse van de monetaire stromen in de Duitse en Nederlandse economische netwerken laat op sectorniveau een volledige vermazing zien, dus elke sector kan geproduceerde (unieke) waarde direct delen met elke andere sector. Mede op basis van literatuuronderzoek blijkt het hedendaagse sectornetwerk uit twintig complementaire economische sectoren te bestaan. Afdalend in de hiërarchie beneden sectorniveau neemt de link-dichtheid af en zijn niet alle sub-sectoren direct met elkaar verbonden.
183

Observaties uit de Input-Output data analyse (1987-2007) laten een toenemende netwerk-clustering coëfficiënt en een afnemende waarde van de interactieratio van het sectornetwerk zien. Verder is organisatiefragmentatie zichtbaar in de Nederlandse statistiek van de bedrijfssamenstelling (2001-2012). Mogelijk houden deze indicatoren direct verband met het overheidsbeleid van privatisering en het opheffen van monopolies ter bevordering van concurrentie en met de toegenomen outsourcing door bedrijven. Deze observatie en duiding laten zien dat netwerkanalyse interessante vragen en hypotheses genereert, wat een verrijking in de economische wetenschap kan betekenen. Bovenstaande economische fenomenen en de recente economische crises roepen de vraag op of het sectornetwerk wel veilig aan de vrije markt kan worden over gelaten. Dit proefschrift pleit voor een intensievere orkestratie van het sectornetwerk als geheel en het functioneren van onze vitale sectoren in het bijzonder.
184
Curriculum vitae Edgar van Boven has studied electronics and information technology at HTS Vlissingen. Though tempted to start an adventurous life as a pianist, he graduated in 1987. After military service as a sergeant in a telecommunications battalion, he entered KPN Royal. Initially, telephony dominated his career from various viewpoints starting with hardware & software engineering, via operational network planning to architecture & program management. In the late 90's he started to work on the evolution to voice over packet in the former Unisource Business Networks environment within KPN. In 2001, he entered the Delft University of Technology as a guest lecturer. From 2003 on, music has gradually returned in his life after 10 years of silence. In 2004 the Scarbo pianisten collectief, performing before live audiences, welcomed him as a member. Since 2006, Edgar has combined his work for KPN Royal with a PhD research project at the Delft University of Technology, faculty Electrical Engineering, Mathematics and Computer Science (EEMCS). From 2006 until 2011, Edgar has worked together with and coached seven Master students towards their successful graduation in the disciplines of Economic Complex Networks and Trans-sector Innovation. Currently at KPN Royal, Edgar is active in the area of network transition and life cycle management.
185
References Agentschap Telecom, Staat van de Ether 2011, Annual report, 2012. American Bankers Association, Commercial insights Sales and Marketing: Ten key industries That Will Decline, Even After the Economy Revives, www.aba.com, 2011. C. Anderson, Free, The Future of a Radical Price, Hyperion, New York, 2009. M. Ángeles Serrano, M. Boguñá and R. Pastor-Satorras, Correlations in Weighted Networks, Physical Review E74, 055101R, 2006. M. Ángeles Serrano, M. Boguñá and A. Vespignani, Patterns of dominant flows in the world trade web, Journal of Economic Interaction and Coordination, Volume 2, Issue 2, p111-124, 2007. D. Ariely, Predictably Irrational: The Hidden Forces That Shape Our Decisions, revised and expanded edition, ISBN 978-0-00-725653-2, London, 2009. Australian Bureau of Statistics and Statistics New Zealand, Australian and New Zealand Standard Industrial Classification 2006 (Revision 1.0), ABS Catalogue No. 1292.0, ISBN 0-642-17241-2, 2006. Badan Pusat Statistik of Statistics Indonesia, Klasifikasi Baku Lapangan Usaha Indonesia (KBLI 2005), 3d edition, Jakarta, 2006. N.H.G. Baken, F. Bosman, R. Klein and B. Mulckhuijse, Integrale bedrijfsvoering door afstemming van het Commercieel, Technisch en Organisatorisch portfolio, PTT Telecom netwerkbedrijf, Den Haag, 1993. N.H.G. Baken, F. Bosman, R. Klein and B. Mulckhuijse, De Portfolio theorie, een praktisch model voor het omgaan met vernieuwingen binnen PTT Telecom, Studieblad KPN, p268-285, 1995. N.H.G. Baken, Options for Options in an uncertain world, Inaugural speech, Delft, 2001. N.H.G. Baken, E. van Boven and R. Reitsma, Broadband Infrastructures and Services – Trans-sector thinking, the difference between a Beneficial Sector or Tower of Babel, FITCE, Berlin, 2003. N.H.G. Baken, E. van Boven, F. den Hartog and R. Hekmat, A Four-Tiered Hierarchy in a Converged Fixed-Mobile Architecture enabling Personal Networks, FITCE, Gent, 2004. N.H.G. Baken, E. van Boven, R. Hekmat and L. Menert, Virtual Mobility enabling Multi dimensional life, FITCE, Vienna, 2005. N.H.G. Baken, N. van Belleghem, E. van Boven and A. de Korte, Unravelling 21st Century Riddles – Universal Network Visions from a Human Perspective, The Journal of The Communications Network, Volume 5 Part 4, p11-20, London, 2006.
186
N.H.G. Baken, E. van Boven and A. Madureira, Renaissance of the Incumbents, Network Visions from a Human Perspective, eChallenges, Expanding the Knowledge Economy, Part 2, IOS Press, ISSN 1574-1230, ISBN 978-1-58603-801-4, p1419-1425, Amsterdam, 2007a. N.H.G. Baken, E. van Boven, J. Hoffmans, W. Hollemans and W. van de Lagemaat, Roadmap to Personalized Liquid Bandwidth, FITCE, Warsaw, 2007b. N.H.G. Baken, E. van Boven, B. Feunekes, J. Hoffmans, and S. Mesgarzadeh, Trusted Transactions Transforming your Life, FITCE, London, 2008. N.H.G. Baken, Holon, TEDx, Amsterdam, 2009. A.L. Barabási, Linked: The new science of networks, Cambridge, 2003. J. Barnes, Aristotle, Oxford University Press, 1982. A. Barrat, M. Barthélemy, R. Pastor-Satorras and A. Vespignani, The architecture of complex weighted networks, PNAS 101(11) 3747-3752, 2004. M. Barthélemy, A. Barrat, R. Pastor-Satorras and A. Vespignani, Characterization and modeling of weighted networks, Physica A, 346:34-43, 2005. F.M. Bator, The Anatomy of Market Failure, Quarterly Journal of Economics, Volume 72, Issue 3, p351-379, 1958. S. Battiston, J.F. Rodrigues, H. Zeytinoglu, The Network of Inter-Regional Direct Investment Stocks across Europe, Advances in Complex Systems, Volume 10, No. 1, p29-51, 2007. J. Berière, Promoting multi-stakeholder services through use of a business role model, Delft, 2007. S. de Boer, W. van Nunspeet and T. Takema, Supply and use tables in current and constant prices for the Netherlands: an experience of 15 years, Statistics Netherlands, Voorburg/Heerlen, 1999. S. de Boer, J. van Dalen, T. Takema and P. Verbiest, Supply and use tables A multipurpose framework, Statistics Netherlands, Den Haag, 2006. J. Bor, Een (nieuwe) geschiedenis van de filosofie, Uitgeverij Bert Bakker, 2010. J.G. Bos (Inspectie Veiligheid en Justitie) and P.A. Spijkerman (Agentschap Telecom), Storing telecommunicatienetwerk Waalhaven Rotterdam, Inspectie Veiligheid en Justitie, J-14452, Den Haag, 2012. J.G. Bos (Inspectie Veiligheid en Justitie) and P.A. Spijkerman (Agentschap Telecom), 1-1-2 onder de loep, Inspectie Veiligheid en Justitie, J-18240, Den Haag, 2013. M. Boss, H. Elsinger, M. Summer, S. Thurner, Network topology of the interbank market, Quantitative Finance Volume 4, No. 6, p677-684, 2004. H. Bouwman, M. de Reuver, H. de Vos, E. Faber et al., Creating Successful ICT-services, Practical Guidelines based on the STOF method, Telematica Instituut, Enschede, 2008.
187
H. Bouwman, E. Faber, T. Haaker, B. Kijl and M.D. de Reuver, Conceptualizing the STOF Model, Mobile Service Innovation and Business Models, p31-70, Springer Berlin, Heidelberg, 2008. B. Bozeman, Public - Value Failure: When Efficient Markets May Not Do, Public Administration Review, Volume 62, No. 2, 2002. N. Braams and N. Urlings, Creatieve industrie in Nederland, Statistics Netherlands, Den Haag, 2010. J. van den Brakel, Sampling and estimation techniques for the implementation of new classification systems: the change-over from NACE Rev. 1.1 to NACE Rev. 2 in business surveys, Survey Research Methods (2010), ISSN 1864-3361, http://www.surveymethods.org, European Survey Research Association, Volume 4, No.2, p103-119, 2010. R. Brennenraedts, B. Minne, R. te Velde and J. Veldkamp, De bijdrage van de telecomsector aan de economische groei in Nederland, dialogic 2012.004-1236, Utrecht, 2012. J.M. Bryson, B.C. Crosby and M. Middleton Stone, The Design and Implementation of Cross-Sector Collaborations: Propositions from the Literature, Public Administration Review, 2006. M. Bunge, Treatise on basic philosophy. Ontology II. A world of systems Volume 4 Dordrecht: Reidel, 1979. Central Statistical Organisation, Ministry of Statistics and Programme Implementation, Government of India, National Industrial Classification (NIC – 2008), New Delhi, 2008. F.-T. Cheng, H.-C. Yang and J.-Y. Lin, Development of Holonic Information Coordination Systems With Failure-Recovery Considerations, IEEE Transactions On Automation Science and Engineering, Volume 1, No. 1, 1545-5955/04, 2004. J.H. Christensen, Holonic Manufacturing Systems, Initial Architecture and Standards Directions, Proc. of 1st European Conf. on Holonic Manufacturing Systems, Hannover, 1994. L. da F. Costa, F.A. Rodrigues, G. Travieso, P.R. Villas Boas, Characterization of Complex Networks: A survey of measurements, Advances in physics, Volume 56, No. 1, p167-242, 2007. S. Dan, S. Jilke, C. Pollit, R. van Delft, S. Van de Walle and S. van Thiel, Effects of privatization and agencification on citizens and citizenship: an international comparison, COCOPS, 2012. J.S. Demski, Accounting and Economics, The New Palgrave Dictionary of Economics, 2nd edition, 2005. A.G.J. Dietvorst, Telefoonverkeer en economische structuur, Nijmegen, 1979. J. L. G. Dietz, Enterprise Ontology: Theory and Methodology: Springer-Verlag New York Inc, 2006. E. Dietzenbacher, The measurement of interindustry linkages: key sectors in the Netherlands, Economic Modeling, Volume 9, p419-438, 1992.
188
Director-General for Policy Planning (Statistical Standards), Ministry of International Affairs and Communications, Japan Standard Industrial Classification (Rev.12), Tokyo, 2008. C. Doerr, N. Blenn, S. Tang and P. Van Mieghem, Are friends overrated? A study for the social news aggregator Digg.com, Elsevier, Computer Communications, Volume 35, p796-809, 2012. F. van den Dool, Telecommunication system architectures: Dealing with complexity, International Journal of Communication Systems, Volume 7, p1-6, 1994. M. van Dorssen, M. Holzmann, K. Franx and L. Rens, Continuïteitsplannen ICT / elektriciteit, WODC, ministerie van Veiligheid en Justitie, 2012. Economic Classification Policy Committee, Criteria for Determining Industries, Issue Paper No. 4, 1993. Eerste Kamer der Staten-Generaal, Verbinding verbroken? Onderzoek naar de parlementaire besluitvorming over de privatisering en verzelfstandiging van overheidsdiensten, Hoofdrapport Parlementair Onderzoek Privatisering/Verzelfstandiging Overheidsdiensten, ISBN 978-90-125-76284 NUR 823, SDU, Den Haag, 2012a. Eerste Kamer der Staten-Generaal, Verbinding verbroken? Onderzoek naar de parlementaire besluitvorming over de privatisering en verzelfstandiging van overheidsdiensten, Deelrapport Parlementair Onderzoek Privatisering/Verzelfstandiging Overheidsdiensten, ISBN 978-90-125-76291 NUR 823, SDU, Den Haag, 2012b. Eerste Kamer der Staten-Generaal, Verbinding verbroken? Onderzoek naar de parlementaire besluitvorming over de privatisering en verzelfstandiging van overheidsdiensten, Verslagen openbare gesprekken Parlementair Onderzoek Privatisering/Verzelfstandiging Overheidsdiensten, ISBN 978-90-125-76307 NUR 823, SDU, Den Haag, 2012c. European Community, Nomenclature statistique des activités économiques dans la Communauté Européenne, rev.2, 2006. K. Farkas, T. Hossmann, B. Plattner and L. Ruff, Node Weight Computation in MANETs, IEEE, p1059-1064, 2007. J. Ferreira do Amaral, J. Dias and J. Carlos Lopes Complexity as interdependence in input-output systems, Environment and Planning, Volume 39, pages 1770-1782, 2007. R. Florida, The rise of the creative class, 2002. T.L. Friedman, The world is flat, New York, 2005. C.H. Fu, Z.P. Zhang, H. Chang, J.R. Tao, Z.H. Chen, Y.L. Dai, W. Zhang and D.R. Hea, A kind of collaboration-competition networks, 2007. F. Fukuyama, Trust, the social virtues and the creation of prosperity, New York, ISBN 0-02-910976-0, 1995.
189
M.L. Fijnvandraat, Shedding light on the black hole, The roll-out of broadband access networks by private operators, ISBN 978-90-79878-03-1, Delft, 2008. X. Ge and H.Wang, Community structures of real-world complex networks, The European Physical Journal B, Volume 76, No. 4, pp. 643-652, 2012. K. Gieck, Technische Formelsammlung, D6, Heilbronn, 1981. M. Gladwell, The Tipping Point: How Little things Can Make a Big Difference, chapter 2, 2002. J. Gleick, The information, Fourth Estate, London, 2011. R. Goldsborough, A Case for the World's First Coin, 2004. Goskomstandart, OKVED, Moscow, 2003. Goskomstandart, OKVED, Moscow, 2010. C. Grönroos, Service Management and Marketing : A Customer Relationship Management Approach, Wiley, p44, 2000. D. Helbing, Globally networked risks and how to respond, Nature 12047, Volume 497, p51-59, 2013. P. de Hert, Systeemverantwoordelijkheid voor de Informatiemaatschappij als positieve mensenrechten verplichting, De staat van informatie, WRR verkenning nr. 25, Amsterdam University Press, 2011. C.A. Hidalgo and R. Hausmann, The building blocks of economic complexity, PNAS, p10570-10575, 2009. H. van Hooff, The treatment of Services in NACE rev.2, Statistics Netherlands, 2008. M. Hosseini, Telecom and Energy, Vital Sectors Enabling Smart Living, Delft, 2010. A.-C. Hoyng, Turgot en Smith; een paar apart, ISBN 978-94-6191-097-4, Amsterdam, 2011. N. Huijboom, Joined-up ICT Innovation in Government, An Analysis of the creation of eIDM systems from an Advocacy Coalition and Social Capital perspective, ISBN 978-90-8559-072-9, Erasmus University, Rotterdam, 2010. Instituto Brasileiro de Geografia e Estatística, Classificação Nacional de Atividades Econômicas, version 2.0, Rio de Janeiro, 2007. Instituto Nacional de Estadistica y censos, Clasificación Nacional de Actividades Económicas 2010 of Argentina, Beunos Aires, 2010. Instituto Nacional de Estadistica y Geografia, Sistema de Clasificaciòn de América del Norte (SCIAN)México, Aguascalientes, 2007.
190
Institute national de la statistique et des études économiques, Nomenclature d’activités française, Paris, 2008. Istituto nazionale di statistica, Classificazione delle attività economiche (ATECO 2007), Rome, 2007. ITU-T, Unified functional architecture of transport networks, ITU-T G.800, p48, 2007. ITU-T, Telecommunications management network-TMN Management Functions, ITU-T M.3400, p110, 2000. A. Jamakovic, Characterization of Complex networks, ISBN 978-90-79787-01-2, Delft, 2008. L. de Jonge, Business model Smart Home; Using STOF method & scenario analysis to design a business model for KPN, Delft, 2009. A. Kinneging, Geografie van goed en kwaad, ISBN 978 90 274 28257, Utrecht, 2005. R. L. Kloppenburg, Framework for Cure and Care, MSc thesis, RUG Faculty of Economics and Business, 2008. A. Koestler, The ghost in the machine, London, 1967. R.E. Kooij, Overal netwerken? Reken maar!, Inaugural speech, Delft, 2012. J.P. Kotter, Leading Change, Why Transformation Efforts Fail, 1996. A. Krishnakumar, Modelling the Dynamic Nature of Networks, Enabling Smart Living, Delft, 2010. F.A. Kuipers, Quality of service Routing in the Internet; Theory, Complexity and Algorithms, p15, Delft, 2004. W. van de Lagemaat, Complementary Access; Optimised Access Anywhere for Everyone Starting in The Netherlands, Delft, 2007. J. Lanier, Who Owns the Future, ISBN 978-1-846-14522-3, London, 2013. W. Leontief, Quantitative Input-Output Relations in the Economic System of the United States, Review of Economics and Statistics, Volume 18, p105-125, 1936. W. Leontief, The structure of the American Economy 1919-1939, Oxford University Press, New York, 1941. T. Levitt, The industrialization of Service, Harvard Business Review, Volume 54 Part 5, p63, 1976. C.T. Lewis and C. Short, A Latin Dictionary, 1980. J. Li and J. Whalley, Deconstruction of the telecommunications industry: from value chains to value networks, Telecommunications Policy, Volume 26 Part 9-10, p451-472, 2002. Liddell and Scott, New Edition Greek English lexicon, Oxford Clarendon Press, 1968.
191
A.J.P. Soares Madureira, E. van Boven and N.H.G. Baken, Towards Systematic Development of Trans-sector Digital Innovation, NG Infra, Chennai, 2009. A.J.P. Soares Madureira, Value of Digital Information Networks: a Holonic Framework, ISBN 978-94-6186-016-3, Delft, 2011. M. Mendelson, Die Stellung des Handwerks in den hauptsaechlichsten der ehemals zünftigen Gewerbe, Verlag von Gustav Fischer, Jena, 1899. S. Mesgar Zadeh, Future of Transactions, Delft, 2008. S. Milgram, The small-world problem, Psychology Today 1(1), p61-67, 1967. R.E. Miller and P.D. Blair, Input-Output Analysis, Cambridge University press, 2nd edition, 2009. Ministry of the Interior and Kingdom Relations, Bescherming Vitale Infrastructuur, Den Haag, 2005. Ministry of the Interior and Kingdom Relations, 2de inhoudelijke analyse bescherming vitale infrastructuur, Den Haag, 2010. Ministry of Security and Justice, Continuïteit bij uitval ICT en elektriciteit, Directie Nationale Veiligheid, letter 281371, Den Haag, 2012. M. Mitchiner, Ancient Trade and Early Coinage, Hawkins Publications, London, 2004. P. Modderman, Elsloo, a Neolithic farming community in the Netherlands, edited by R. Bruce-Mitford in, Recent Archaeological Excavations in Europe, Chapter 9, p260-286, 1975. National Bureau of Statistics of China, Industrial Classification for National Economic Activities, Beijing, 2011. The Netherlands Scientific Counsel for Government policy, Het borgen van publiek belang, WRR
Rapporten aan de Regering nr. 56, Amsterdam University Press, 2000. The Netherlands Scientific Counsel for Government policy, iOverheid, WRR Rapporten aan de Regering nr. 86, Amsterdam University Press, 2011. M.E.J. Newman, Assortative Mixing in Networks, Physical Review Lett. 89, 208701, 2002. M.E.J. Newman, The structure and function of complex networks, SIAM Review 45, p167-256, 2003a. M.E.J. Newman, Mixing patterns in networks, Physical Review E 67 026126, 2003b. B. Obama, Remarks by the president on 21st century financial regulatory reform, Office of the Press Secretary, Washington, 2009. Office for National Statistics, Classifications and Harmonisation Unit, United Kingdom Standard Industrial Classification 2007, ISBN 978-0-230-21012-7, Titchfield, 2007.
192

Organisation for Economic Co-operation and Development, Growth in Services – Fostering Employment, Productivity and Innovation, OECD report, 2005. Organisation for Economic Co-operation and Development, Information Economy – Sector Definitions based on ISIC rev.4, OECD document DSTI/ICCP/IIS(2006)2/FINAL, 2006. Organisation for Economic Co-operation and Development, OECD definitions of the information economy sectors (Annex 1B), Guide to Measuring the Information Society, Volume JT00193469, Paris, 2007. Organisation for Economic Co-operation and Development, OECD Policy guidance on convergence and NGN networks, OECD Ministerial Meeting on the future of Internet Economy, Seoul, 2008. J.P. Onnela, J. Saramäki, J. Kertész and K. Kaski, Analysis of a large scale weighted network of one-to-one human communication, Physical Review E, 71:065103(R), 2005. J.P. Onnela, J. Saramäki, J. Hyvonen, G. Szabó, M. Argollo de Menezes, K. Kaski, A.L. Barabási and J. Kertész, Analysis of a large scale weighted network of one-to-one human communication, New J. Phys.9, 179, 2007. H. Ovink, Politics of planning, Interoperabel Nederland, ISBN 978-90-79490-03-5, p53-59, Den Haag, 2011. I. Pearson, The New Dark Age – A View from a Futurologist, The Journal of The Communications Network, Volume 5 Part 4, p5-10, London, 2006. M. Porter, Competitive Advantage: Creating and Sustaining Superior Performance, 1985. H.D. Potter, Some conceptual aspects of measuring homogeneity of industrial data from manufacturing censuses and surveys, Statistical Journal of the United Nations ECE5, p359-375, 1988. H. Pringle, The Cradle of Cash, Discover, The Magazine of Science, Technology, and the Future, 1998. J.E.J. Prins and D. Broeders, De iSamenleving de maat meten, Interoperabel Nederland, p43-50, 2011. T. ten Raa, The Economics of Input-Output Analysis, Cambridge University Press, 2005. J.M. Rathmell, What Is Meant by Services?, Journal of Marketing, Volume 30, No. 4, p32-36,1966. R.O. Reitsma, Innovating Mass-customized Service, ISBN 978 90 5972 5867, Eburon, p31-36, Delft, 2011. M. de Reuver, Governing mobile service innovation in co-evolving value networks, ISBN 978-90-79787-13-5, Delft, 2009.
193
S. Roberts, ICT sector and trade core indicators: classifications and concepts, Capacity building workshop on Information Society Statistics: Infrastructure, Household and other Indicators, Bangkok, 2007. C. Roodink, Regeren is vooruitzien, Interoperabel Nederland, p153-167, ISBN 978-90-79490-03-5, Den Haag, 2011. F. Schweitzer, G. Fagiolo, D. Sornette, F. Vega-Redondo, D.R. White, Economic Networks: What do we know and what do we need to know?, Advances in Complex Systems, Volume 12, no 4, 2009. C.E. Shannon, A Mathematical Theory of Communication, The Bell System Technical Journal, Volume 27, p379-423, 623-656, July, October, 1948. C. Simmonds Zuñiga, Telecom Sector Modelling from a Functional Perspective, Delft, 2009. P. Sloterdijk, Je moet je leven veranderen, uitgeverij Boom, p183, 2011. R. Smyth, Exploring Congruence between Habermasian Philosophy, Mixed-Method Research, and Managing Data using NVivo, International Journal of Qualitative Methods 5 (2), 2006. Sociaal Cultureel Planbureau, Op afstand gezet, ISBN 978-90-377-0639-0, Den Haag, 2012. R. Solow, We’d better watch out, New York Times Book Review, p36,1987. Statistics Bureau, Director-General for Policy Planning (Statistical Standards) & Statistical Research and Training Institute, Japan Standard Industrial Classification rev.12, Tokyo, 2007. Statistics Korea, Korean Standard Industrial Classification, 2008. Statistics Netherlands, Dénombrement des Professions, Volume VIII, Den Haag, 1930. Statistics Netherlands, 2e Algemene bedrijfstelling Deel 5, Den Haag, 1950. Statistics Netherlands, 13th General census of Population part 10, Den Haag, 1960. Statistics Netherlands, standaard bedrijfsindeling (s.b.i. 1974) deel 2 systematische bedrijfsindeling, Voorburg, 1974. Statistics Netherlands, Standaard Bedrijfsindeling SBI 1993, Den Haag, 1994. Statistics Netherlands, Enquête werkgelegenheid en lonen, Den Haag, 2006. Statistics Netherlands, De digitale economie, Den Haag, 2009. Statistics Netherlands, Standaard Bedrijfsindeling SBI 2008, Den Haag, 2009. Statistics Netherlands, CBS Enquête ICT bedrijven, Den Haag, 2010.
194
Statistics Netherlands, Employment of the Dutch labour force during the period 2001-2011, SN StatLine, Den Haag, 2013a. Statistics Netherlands, Workers on own account during the period 2001-2011, SN StatLine, Den Haag, 2013b. Statistics Netherlands, Bedrijven; grootte, rechtsvorm, bedrijfstak/branche SBI 2008 per 1 januari, SN StatLine, Den Haag, 2013c. Statistics Netherlands, Monitor Topsectoren, Uitkomsten eerste meting, Den Haag, 2013d. Statistics Netherlands and TNO, Nationale Enquête Arbeidsomstandigheden, Den Haag, 2010. Statistics South Africa, Standard Industrial Classification of all Economic Activities (SIC), 7th edition, No. 09-90-02, ISBN 978-0-621-39214-2, Pretoria, 2012. Statistics Sweden, Swedish Standard Industrial Classification SNI-codes, www.scb.se, Stockholm, 2007. Statistisches Bundesamt, Klassifikation der Wirtschaftszweige WZ 2008, Wiesbaden, 2008. Statistisches Bundesamt Volkswirtschaftliche Gesamtrechnungen, Input-Output-Rechnung 1995 bis 1999, Artikelnummer 218020099015, Wiesbaden, 2010. B. Stellinga, Dertig jaar privatisering, verzelfstandiging en marktwerking, WRR achtergrondstudie, Amsterdam University Press, ISBN 978-90-8964-514-2, 2012. Swiss Federal Statistical Office, General Classification of Economic Activities NOGA, Neuchâtel, 2008. Tele Management Forum, The NGOSS Lifecycle and Methodology, GB927, Release 4.5, v.1.3.1, p51, 2004 (a). Tele Management Forum, The NGOSS Technology-Neutral Architecture, TMF053, Release 4.0, v4.0, p67, 2004 (b). C. Teulings, M. Bijlsma, G. Gelauff, A. Lejour and M. Roscam Abbing, Europa in crisis, Het Centraal Planbureau over de schulden en toekomst van de eurozone, ISBN 978-94-600-34077, Amsterdam, 2011. W.A.H Thissen and P.M. Herder, System of systems perspectives on infrastructures, Chapter 11 in System of Systems – Innovations for the 21st Century, 2008. Turkstat, NACE Rev.2-Altılı Ekonomik Faaliyet Sınıflaması, Ankara, 2008. E.H. Van Leeuwen and D. Norrie, Intelligent Manufacturing: Holons and holarchies, Manufacturing Engineering 76(2), p86-88, 1997. P. Van Mieghem, Data Communications Networking, Techne Press, Amsterdam, 2006.
195
P. Van Mieghem, H. Wang, X. Ge, S. Tang and F.A. Kuipers, Influence of assortativity and degree-preserving rewiring on the spectra of networks, The European Physical Journal B, Volume 76, p643-652, 2010. P. Van Mieghem, Graph Spectra for Complex Networks, Cambridge University Press, New York, 2011. United Nations Statistics Department, International Standard Industrial Classification of all economic activities, Series M, No. 4, Rev. I, New York, 1958. United Nations Statistics Department, International Standard Industrial Classification of all economic activities, rev.3.1, New York, 1993. United Nations Statistics Department, International Standard Industrial Classification of all economic activities, rev.4, New York, 2008. United Nations Statistics Department, System of National Accounts 2008, New York, 2008. United States Census Bureau, North America Industry Classification System, Volume 76, No. 159, NTIS, 2012. United States government Financial Crisis Inquiry Commission, Final Report of the National Commission on the Causes of the Financial and Economic Crisis in the United States, ISBN 978-0-16-087727-8, Washington, 2011. F. Van Waarden, Was Privatisering van het Publieke Domein wel in het Publieke Belang?, Utrecht, 2012. H. Wang, Robustness of Networks, ISBN 978-90-90245-02-7, Delft, 2009. H. Wang, E. van Boven, A. Krishnakumar, M. Hosseini, T. Takema, H. van Hooff, N.H.G. Baken and P. Van Mieghem, Multi-weighted Monetary Transaction Network, Advances in Complex Systems, Volume 14, No 6, p1-20, 2011. P. Waters, N. Westpalm van Hoorn and P. Wisse, Interoperabel Nederland, Forum Standaardisatie, ISBN 978-90-79490-03-5, Den Haag, 2011. D.J. Watts and S.H. Strogatz, Collective Dynamics of ‘Small-World’ Networks, Nature 393, p440-442, 1998. J. Wyns, Reference Architecture for Holonic Manufacturing Systems, PhD Thesis, Katholieke Universiteit, Leuven, 1999. A. De La Fe, coinproject.com http://kostat.go.kr/kssc, 2013. http://mospi.nic.in/Mospi_New, 2013. www.amdocs.com/white papers/Standards-Best-Practices, 2009.
196

www.ausstats.abs.gov.au, 2013. www.bps.go.id, 2013. www.census.gov, 2013. www.destatis.de/DE/Methoden/Klassifikationen/GueterWirtschaftklassifikationen, 2013. www.govcert.nl, 2011. www.ibge.gov.br, 2013. www.cnae.ibge.gov.br, 2013. www.indec.gov.ar, 2013. www.inegri.org.mx, 2013. www.insee.fr, 2013. www.ncsc.nl, 2012. www.noga.bfs.admin.ch, 2012. www.pique.at (Privatization of Public Services and the Impact on Quality, Employment and Productivity) www.planning.gov.sa, 2013. www.receita.fazenda.gov.br, 2013. www.rijksoverheid.nl, National Advisory Centre for the Critical Infrastructure, press release, 2007. www.stat.go.jp, 2013. www.stats.gov.cn/tjbz, 2013. www.statssa.gov.za, 2013. www.waarschuwingsdienst.nl, 2012. www.unstats.un.org/unsd/cr/ctryreg, 2013. www.unstats.un.org/unsd/nationalaccount/sna.asp, 2013. www.wiod.org/database, 2012. www.istat.it/strumenti/definizioni/ateco, 2013.
197

Appendices
Appendix Publications Journal H. Wang, E. van Boven, A. Krishnakumar, M. Hosseini, T. Takema, H. van Hooff, N. Baken and P. Van Mieghem, Multi-weighted Monetary Transaction Network, Advances in Complex Systems, Volume 14, No. 6, p1-20, 2011. N. Baken, N. van Belleghem, E. van Boven and A. de Korte, Rethinking the Role of Networks in the Global Economy, The Cook report on Internet Protocol, New York, 2007. N. Baken, N. van Belleghem, E. van Boven and A. de Korte, Unravelling 21st Century Riddles – Universal Network Visions from a Human Perspective, The Journal of The Communications Network, Volume 5, Part 4, p11-20, London, 2006. Conference A. Madureira, E. van Boven and N. Baken, Towards Systematic Development of Trans-sector Digital Innovation, NG Infra, Chennai, 2009. E. van Boven, J. Stolze, R. Plomp and N. Baken, Smart Living, Ministerie van Economische Zaken werkconferentie Nederland Ondernemend Innovatieland, The Hague, 2009. N. Baken, E. van Boven, B. Feunekes, J. Hoffmans, and S. Mesgarzadeh, Trusted Transactions Transforming your Life, FITCE, London, 2008. N. Baken, E. van Boven and A. Madureira, Renaissance of the Incumbents, Network Visions from a Human Perspective, eChallenges, Expanding the Knowledge Economy, part II, p1419-1425, IOS Press, ISSN 1574-1230, Amsterdam, 2007. N. Baken, E. van Boven, J. Hoffmans, W. Hollemans and W. van de Lagemaat, Roadmap to Personalized Liquid Bandwidth, FITCE, Warsaw, 2007. N. Baken, J. Berière, E. van Boven and H. Mulder, Promoting multi-actor services, Business transformation strategies, TMForum, Nice, 2007. N. Baken, E. van Boven, R. Hekmat and L. Menert, Virtual Mobility enabling Multi dimensional life, FITCE, Vienna, 2005. N. Baken, E. van Boven, F. den Hartog and R. Hekmat, A Four-Tiered Hierarchy in a Converged Fixed-Mobile Architecture enabling Personal Networks, FITCE, Gent, 2004. N. Baken, E. van Boven and R. Reitsma, Broadband Infrastructures and Services – Trans-sector thinking, the difference between a Beneficial Sector or Tower of Babel, FITCE, Berlin, 2003. Awarded by the Dutch Royal Institute of Engineers with the second ALU-KIVI telecom prize E. van Boven, How can telecom actors reinvent themselves having a vital role in the sector network, Putten, 2012.
198

Poster sessions N. Baken, P. Van Mieghem, F. den Hartog, N. Huijboom, E. van Boven, A. Madureira, SIREN, Trans-sectoral Innovation, poster session, 2007. E. van Boven, A. Madureira, N. Baken, Trans-sectoral Innovation framework, Dutch Research Delta, poster session, Delft, 2008. E. van Boven, N. Baken, SIREN, Trans-sector Innovation Framework, poster session, University of Twente, Enschede, 2009. Master theses Promoting multi-stakeholder services through use of a business role model Jos Berière 2007 Complementary Access; Optimised Access Anywhere for Everyone Wim van de Lagemaat 2007 Starting in The Netherlands Future of Transactions Shahin Mesgar Zadeh 2008 Business model Smart Home; Using STOF method & scenario analysis Lars de Jonge 2009 to design a business model for KPN Telecom Sector Modelling from a Functional Perspective Carolyn Simmonds Zuniga 2009 Modelling the Dynamic Nature of Networks, Enabling Smart Living Aarabi Krishnakumar 2010 Telecom and Energy, Vital Sectors Enabling Smart Living Mohammad Hosseini 2010 Table 27: Related MSc thesis projects that contributed to this thesis
199
Appendix Definitions This Appendix gives definitions and references regarding the nomenclature of this thesis. The main sources of definitions that have been consulted are: - ISIC rev.4, 2008 including its explanatory notes. - L. da F. Costa, F.A. Rodrigues, G. Travieso, P.R. Villas Boas, Characterization of Complex Networks: A survey of measurements, Advances in physics, Volume 56, No. 1, 2007. - M.E.J. Newman, The structure and function of complex networks, SIAM Review 45, 2003a. - R.E. Miller and P.D. Blair, Input-Output Analysis, Cambridge University press, 2nd edition, 2009. - Wikipedia. - The 10th edition of the Merriam Webster’s Collegiate Dictionary, 1993. If here after a specific year or century is mentioned after a defined term, it dates the earliest recorded use in English language according to [Webster,1993]* unless explicitly mentioned. When relevant, the application of the term is specified (e.g. as noun, verb, adjective or prefix) and a selection is given of the meanings a term can have. In order to simplify defining the complex network related nomenclature, the choice has been made to generally use the terms node, (plural nodes) and link (plural links) instead of vertex, (plural vertices), and edge (plural edges) respectively. For example, Newman generally uses the term vertex as the name for the fundamental unit of a network and attributes the use of the term node to the discipline of computer science [Newman,p5,2003b]. activity cluster: In this thesis, the term activity cluster is proposed by the author to capture any set of (economic) activities. Analogous to the notion of a holon or a category (terms which can be used to address recursiveness) an activity cluster can be defined on more than one hierarchical level. For example for classification purposes ISIC rev.4 denotes a section level, a division level, a group level and a class level. In this thesis the terms node and activity cluster are considered synonyms. adjacency matrix: An adjacency matrix A is an N x N matrix consisting of elements aij that are either one or zero depending on whether there is a link between node i and node j or not. An adjacency matrix A can represent a graph G(N,L). aggregate (15th century [Webster,p41]): 1) a mass or body of units or parts somewhat loosely associated with one another 2) the whole sum or amount 4) a set The United Nations Statistics Department provides several ISIC related aggregations (A*n) which can be considered as hierarchical overlays [ISIC,2008]. In A*n, A means aggregate and n denotes the corresponding number of categories (activity clusters). analogy (15th century [Webster,p41]): 1) inference that if two or more things agree with another in some respects they will probably agree in others. 2) resemblance in some particulars between things otherwise unlike (similarity) 3) correspondence between the members of pairs of sets of linguistic forms that serves as a basis for the creation of another form 4) correspondence in function between anatomical parts of different structure and origin (*) The definitions/meanings taken from [Webster,1993] have not been altered from US spelling into the UK spelling.
200
assortativity: Degree assortativity is the pairing of nodes with comparable connectivity. In contrast, degree disassortativity is the pairing of highly connected and less connected nodes [Schweitzer et all.,2009]. In this thesis‘ research, also the (dis)assortativity of the node weights and the link weights around a node have been examined. For example the link weights around a node ∆w were found positively correlated in the German and Dutch economic networks. This means that the activity clusters are sharing their transaction amounts more equally with their neighbours rather than transacting only high values with a preferred, small group of partners. average network degree: The average network degree (or average degree) is defined as E[D] = 2L/N where L is the total number of undirected links in the network and N is the number of nodes. capability: A capability is a quality of an economic agent used for productive purposes [Madureira et al.,2009]. clustering coefficient: The clustering coefficient ci of a node i [Watts&Strogatz,1998] can be calculated by dividing the number of links among its direct neighbours by the total possible number of links in the network. Proposed for weighted graphs [Barthélemy et al.,2005],[da F. Costa et.al.,p20,2007], the weighted clustering coefficient of a node can be calculated by means of the triangulation method [Onnela et al.,2005] which takes the link weights of all triangles in the network into account. complete graph: A complete graph is a graph of a fully meshed network. In such a network all nodes are directly connected to each other. In a complete graph KN the number of nodes N and the number of undirected links L relate as follows: L = ½N(N-1). complex network: In 2013, Wikipedia provides the following. In the context of network theory, a complex network is a graph (network) with non-trivial topological features — features that do not occur in simple networks such as lattices or random graphs but often occur in real graphs. The study of complex networks is a young and active area of scientific research inspired largely by the empirical study of real-world networks such as computer networks and social networks. Most social, biological, and technological networks display substantial non-trivial topological features, with patterns of connection between their elements that are neither purely regular nor purely random. Such features include a heavy tail in the degree distribution, a high clustering coefficient, assortativity or disassortativity among vertices, community structure and hierarchical structure. In the case of directed networks these features also include reciprocity, triad significance profile and other features. In contrast, many of the mathematical models of networks that have been studied in the past, such as lattices and random graphs, do not show these features. Two well-known and much studied classes of complex networks are scale-free networks and small-world networks, whose discovery and definition are canonical case-studies in the field. Both are characterized by specific structural features—power-law degree distributions for the former and short path lengths and high clustering for the latter. However, as the study of complex networks has continued to grow in importance and popularity, many other aspects of network structure have attracted attention as well [Wikipedia,2013].
201
connection (14th century [Webster,p245] from Latin “con(n)exio(n)”): 1) the act of connecting: the state of being connected: as 1a) causal or logical relation or sequence <the connection between two ideas> 1b) contextual relation or association <in this connection the word has a different meaning> 2) relationship in fact 2a) something that connects: a link 2b) a means of communication or transport 3) a person connected with another especially by marriage, kinship, or common interest 4) a political, social, professional, or commercial relationship: as 4a) position, job 4b) an arrangement to execute orders or advantage interests of another <a firm’s foreign connections> 5) a set of persons associated together [Lewis and Short,p410 and p424,1980] translate “conexio” or “connexio” as a binding together or close union. [ITU-T G.800,1995] defines a connection as an association of ports for the purpose of transferring infor-mation (where a link is defined as a link connection and a node is defined as a connection point). cross-sector collaboration: See the definition of trans-sector innovation. degree (13th century [Webster,p304] from Latin “de+gradus”): 1) a step or stage in a process, course, or order classification 2a) a rank or grade of official, ecclesiastical, or social position 2c) the civil condition or status of a person 3) a step in a direct line of descent or in the line of ascent to a common ancestor 7a) a title conferred on students by a college, university, or professional school on completion of a program of study 11) one of the divisions or intervals marked on a scale of a measuring instrument 12a) the sum of the exponents of the variables in the term of highest degree in a polynomial, polynomial function, or polynomial equation 12b) the sum of the exponents of the variable factors of a monomial 12c) the greatest power of the derivative of highest order in a differential equation after the equation has been rationalized and cleared of fractions with respect to the derivative [Lewis&Short,p821,1980] translates the Latin word “gradus” as a step or pace related to the verb gradior (which means to go) and additionally mentions its meanings stage or degree as well. The degree of a node di is the number of direct neighbours j of that node in the network. The network can be represented by an adjacency matrix A, an N x N matrix consisting of elements aij that are either 1 or 0 depending on whether there is a link between node i and j (aij = 1) or not (aij = 0). N di = ∑ aij where N is the number of nodes in the network j=1 Regarding the degree of a network as a whole, see average network degree E[D] in this Appendix.
202
DoD model (1970): The Internet protocol suite is the set of communication protocols, commonly known as the TCP/IP model. It is also known as the DoD model due to the foundational influence of the ARPANET in the 1970s (operated by DARPA, an agency of the United States Department of Defense) [Wikipedia]. Top-down, the TCP/IP model consists of an application layer, a transport layer, an Internet layer and a link layer. economy (1485, from Greek “oikonomia” meaning house to manage): [Webster,p365] distinguishes the archaic meaning 1) the management of household or private affairs and especially expenses from the following contemporary meanings: 2a) frugal meaning: thrifty and efficient use of material resources 2b) efficient and concise use of nonmaterial resources (as effort, language or motion) 3) the arrangement or mode of operation of something (organisation) 4) the structure of economic life in a country, area or period (specific: an economic system)
[Bunge,p182,1979] defines the term economy in a societal context: the economy of a society σ is the sub-system of a society σ whose members engage in the active and organised transformation of the environment of society σ. [Demski,2005] states that economics is concerned with production and allocation of resources and accounting is concerned with measuring and reporting on the production and allocation of resources. econometrics (1920):
Where [Miller&Blair,p724,2009] mention Ragnar Frisch as its pioneer, [Webster,p365] dates the earliest recorded use in 1933 and gives the meanings: 1) blend of economy and metrics 2) the application of statistical methods to the study of economic data and problems economic indicators: [Wikipedia] mentions that an economic indicator allows for analysis of economic performance and predictions of future performance. One application of economic indicators is the study of business cycles where: - leading indicators (such as stock market returns and the index of consumer expectations) attempt to predict future developments, - coinciding indicators aim to demonstrate on-going developments, - lagging indicators look back in time, attempting to explain previous events. economic indicators that measure the performance of the Dutch top-sectors: Regarding the nine Dutch top-sectors the report [SN,p5,2013d] includes the (initial) measurement of the following ratios: a) the number of enterprises associated to a top-sector and the total number of enterprises in all sectors, b) a top-sectors’ production and the total national production (calculated by means of euro values), c) a top-sectors’ value ad and the national value ad (calculated by subtracting the intermediate usage from the basic prices of production expressed in euro), d) a top-sectors’ export of goods and the total national export (calculated by means of euro values), e) the amount of euros spent on Research and Development by a top-sector and the total national Research & Development spending, f) number of employed persons in a top-sector and the total number of employees (calculated by means of FTE’s).
203
econophysics (1995): [Wikipedia,2013] states that econophysics is an interdisciplinary research field, applying theories and methods originally developed by physicists in order to solve problems in economics. The term econophysics was coined by H. Eugene Stanley, to describe the large number of papers written by physicists in the problems of (stock and other) markets, in a conference on statistical physics in Kolkata in 1995 and first appeared in its proceedings publications in Physica A 1996. Historically, the interest of physicists in social sciences can be observed from the times the work of the mathematician and physicist Daniel Bernoulli (1700-1782) was published. His 1738 Specimen theoriae novae de mensura sortis (Exposition of a New Theory on the Measurement of Risk) which contains the St. Petersburg paradox, is said to form the base of the economic theory of risk aversion, risk premium and utility. Jan Tinbergen, who won the first Nobel prize in economics in 1969 for having developed and applied dynamic models for the analysis of economic processes, studied physics with Paul Ehrenfest at Leiden University. edge (before 12th century [Webster,p366]): 2a) the line where an object or area begins or ends (border) 2b) the narrow part adjacent to a border 2c) a point near the beginning or the end 3) a line or line segment that is the intersection of two plane faces or of two planes An edge is the line connecting two vertices, also called a bond (physics), a link (computer science), or a tie (sociology) [Newman,p5,2003a]. eIDM: The acronym eIDM stands for electronic Identity Management. An eIDM system is a means of electronically and officially proving one’s identity in his/her interaction with businesses or governments. It enables end-users, for instance, to access secured databases (e.g. bank accounts), to sign electronic documents (e.g. tax forms) and to obtain digital products (e.g. building permits). There are multiple types of eIDM systems; examples are an electronic identity card (smart card) or a username and password [Huijboom,p51,2010]. enterprise (15th century [Webster,p386]): 1) a project or undertaking that is especially difficult, complicated or risky 2) readiness to engage in daring action 3a) a unit of economic organization or activity 3b) a systematic purposeful activity entropy (1875 [Webster,p387] from Greek “trope” meaning change): 1) a measure of the unavailable energy in a closed thermodynamic system that is also usually considered to be a measure of the system’s disorder and that is a property of the system’s state and is related to it in such a manner that a reversible change in heat in the system produces a change in the measure which varies directly with the heat change and inversely with the absolute temperature at which the change takes place; broadly: the degree of disorder or uncertainty in a system 2a) the degradation of the matter and energy in the universe to an ultimate state of inert uniformity 2b) a process of degradation or running down or a trend to disorder 3) chaos, disorganization, randomness Claude Shannon has related information (H) to entropy. H is conventionally called the entropy of a message (see information in this Appendix) [Shannon,p11,1948],[Gleick,p228-229,2011].
204
establishment (15th century): The United Nations System of National Accounts describes the statistical unit to be defined and delineated for industrial or production statistics as the establishment. The establishment is defined as an enterprise or part of an enterprise that is situated in a single location and in which only a single (non-ancillary) productive activity is carried out or in which the principal productive activity accounts for most of the value added [ISIC,p16,2008]. eTOM (2002): The acronym eTOM stands for enhanced Telecom Operations Map. See this thesis’ Appendix Repository of assessed models for more details about this TeleManagement Forum model. European System of Accounts: The European System of Accounts (often abbreviated as ESA) is the system of national accounts and regional accounts used by members of the European Union. It was updated most recently in 1995 (ESA 1995). The ESA 1995 is fully consistent with the United Nations System of National Accounts (1993 SNA) in definitions, accounting rules and classifications [stats.oecd.org/glossary],[European
Commission, “European System of Accounts ESA 1995”,1996],[Council Regulation (EC) No 2223/96 of 25 June 1996 on the European system of
national and regional accounts in the Community] (the annex contains the whole ESA95),[Wikipedia,5 October 2012]. However, ESA 1995 incorporates certain differences, particularly in its presentation, that are more in line with use within the European Union. The ESA 1995 is undergoing a revision to meet the requirements of the update of the SNA 1993 launched in 2003 under the auspices of the United Nations. function (1533 [Webster,p472] from Latin “functio”) as noun: 1) professional or official position (occupation) 2) the action for which a person or thing is specially fitted or used or for which a thing exists (purpose) 3) any of a group of related actions contributing to a larger action 4) an official or formal ceremony or social gathering 5) a mathematical correspondence that assigns exactly one element (result) 6) characteristic behavior of a chemical compound due to a particular reactive unit (functional group) 7) a computer subroutine [Lewis&Short,p792,1980] translates the Latin word “functio” as performance or execution. Besides complex network related functions, this thesis deals with the following types of functions: meta-functions, generic functions, specific functions, production functions, non-unique functions and unique functions. For the adjective specific (appearing in 1631) [Webster,1128] gives the meanings constituting or falling into a specifiable category or sharing or being those properties of something that allow it to be referred to a particular category. For the adjective generic (appearing in 1676) [Webster,485] gives the meanings relating to or characteristic of a whole group or class or being or having a non-proprietary name or having no particularly distinctive quality or application. For the prefix “meta” (from Greek or Latin) [Webster,730] gives the meanings situated behind or beyond or later or more highly organised or specialised form of or transcending (in the context of meta-physics and meta-psychology. function (1856 [Webster,p472]) as verb: 1) to have a function (to serve) 2) to carry on a function or be in action (to operate)
205
good (before 12th century [Webster,p502]) as noun: Something that has economic utility or satisfies an economic want. graph (1886 [Webster,p508]) as noun: 1) collection of all points whose coordinates satisfy a given relation (as a function) 2) a diagram (as a series of one or more point, lines, line segments, curves or areas) that represent the variation of a variable in comparison with that of one or more other variables A graph G(N,L) denotes a network topology. A link is defined as a connection between a pair of nodes. The word graph was first used in this sense by James Joseph Sylvester in 1878 [Wikipedia]. graph (1898 [Webster,p508]) as verb: 1) to represent by a graph 2) to plot on a graph graph theory (1735): [Newman,p2,2003a] states that the study of networks, in the form of mathematical graph theory, is one of the fundamental pillars of discrete mathematics. Euler’s celebrated 1735 solution of the Königsberg bridge problem is often cited as the first true proof in the theory of networks, and during the twentieth century graph theory has developed into a substantial body of knowledge. In his lectures on graph theory R. Hekmat gives the following short definition; graph theory is a theory that offers a mean to simplify a problem from a network perspective by defining nodes and links in order to say something about the properties of a network. holarchy (1967): [Koestler,1967] defines a holarchy as a hierarchy of self-regulating holons which function (a) as autonomous wholes in supra-ordination to their parts, (b) as dependent parts in sub-ordination to controls on higher levels, (c) in co-ordination with their local environment. Hierarchies of holons are called holarchies [Madureira,2011]. Any holon in a holarchy has three perspectives: 1. sub-ordinate; seeing its constituent parts in layer(s) below 2. peer; where it “sees” other holons on the same hierarchical plane 3. superior; i.e. that holon of which it is a part From this theory a network can be defined as a holon too; a holarchy is a hierarchical network of networks. holism (1926 from Greek ”holos”, meaning all, whole, entire or total): Holism is the idea that all the properties of a given system (physical, biological, chemical, social, economic, mental, linguistic, etc.) cannot be determined or explained by its component parts alone. Instead, the system as a whole determines in an important way how the parts behave. The general principle that has led to the notion of holism was summarised by Aristotle in [Aristotle,Metaphysica,1045a10]: "The whole is greater than the sum of its parts", providing a theory that the universe and especially living nature is correctly seen in terms of interacting wholes (as of living organisms) that are more than the mere sum of elementary particles [Webster,p553]. Concerning wholes [Bunge,p39,1979] distinguishes three possible philosophical doctrines: holism, atomism and systemism. Bunge characterises his world view as systemic (but not holistic), naturalistic, pluralistic (with respect to properties, not substances) and dynamicist. He states that holism is the ontological view that stresses the integrity of systems at the expense of their components and the mutual actions among them. [Bunge,p41,1979] characterises holism as anti-analytic and therefore anti-scientific (mainly) because he observed that holists did not care for the disclosure of the couplings of the system’s parts (the system structure). He quotes examples of holist
206

statements such as “a whole dictates the functioning of its parts” or “the whole acts on its parts” which he counters by stating that “there are actions of some components upon others”. Bunge mentions two classical doctrines (holism versus individualism) dividing social philosophers over the nature of institutions and the proper way of studying them [Bunge,p194,1979]. Reductionism is sometimes seen as the opposite of holism. Reductionism in science says that a complex system can be explained by reduction to its fundamental parts. For example, that the processes of biology can be reduced to chemistry and the laws of chemistry explained by physics [Wikipedia]. holon (1967): A holon is an identifiable part of a system that has a unique identity, yet is made up of sub-ordinate parts and, in turn, is part of a larger whole [Koestler,1967]. In [Baken,2009] the following definition is proposed: a holon is anything consisting of matter, energy and/or information that distinguishes itself from its environment and is both a whole and a part. Holonic Framework (2011): [Madureira,p19-20,2011] contributed a Holonic Framework (HF) which identifies a set of 13 capabilities: coordinatibility, cooperatibility, selectibility, biddability, adoptability, creatibility, brokerability, normatibility, trustability, culturability, decisability, modelability and perceptability. The HF defines capabilities as procedures that a holon can use to navigate through streams of information flowing through networks that potentially bring value. With the HF, [Madureira,2011] has provided an information theoretical contribution, which is discussed relatively to the Advocacy Coalition Framework (the reference framework in policy making), to the initiative Generalized Darwinism (in evolutionary economics), and to the Modern Synthesis, the current paradigm in biological evolution. [Madureira,2011] contributes to address business interoperability with the ultimate goal of increasing the value generated through DINs. homeomorphism (1854 [Webster,p554]): A function that is a one-to-one mapping between sets such that both the function and its inverse are continuous and that in topology exists for geometric figures which can be transformed one into the other by an elastic deformation. homogeneity (1625 [Webster,p555]): 1) the quality or state of being homogeneous 2) the state of having identical distribution functions or values <~of two statistical populations>. According to [Potter,1988] homogeneity is the opposite of heterogeneity or diversity. homogeneous (1641 [Webster,p555] from Greek “homogenes”): 1) of the same or a similar kind of nature 2) of uniform structure or composition throughout In this context, [Liddell&Scott,p1223,1968] mentions of the same kind. icosahedron (1570 [Webster,p574] from Greek “eikosaedron”): A polyhedron having 20 faces. [Liddell&Scott,p485,1968] translates “eikosaedron” as body with twenty surfaces. industry (15th century [Webster,p596] from Latin “industria” meaning diligence (energetic effort)): 1) diligence in an employment or pursuit 2a) systematic labour esp. for some useful purpose or the creation of something of value 2b) a department or branch of a craft, art, business or manufacture especially: one that employs a
207
large personnel and capital especially in manufacturing 2c) a distinct group of productive or profit-making enterprises 2d) manufacturing activity as a whole 3) work devoted to the study of a particular subject or author information (14th century [Webster,p599]): 1) the communication or reception of knowledge or intelligence 2a1) knowledge obtained from investigation, study, or instruction 2a2) intelligence, news 2a3) facts, data 2b) the attribute inherent in and communicated by one of two or more alternative sequences or arrangements of something (as nucleotides in DNA or binary digits in a computer program) that produce specific effects 2c1) a signal or character (as in a communication system or computer) representing data 2c2) something (as a message, experimental data, or a picture) which justifies change in a construct (as a plan or theory) that represents physical or mental experience or another construct 2d) a quantitative measure of the content of information; a numerical quantity that measures the uncertainty in the outcome of an experiment to be performed 3) the act of informing against a person 4) a formal accusation of a crime made by a prosecuting officer as distinguished from an indictment presented in a grand jury Claude Shannon has defined the measure of information (represented as H), as the measure of uncertainty. H = - ∑ pi log2 pi where H is the entropy of the set of probabilities p1,…,pn where pi is the probability of each message and H is expressed by means of the measure bit . Receiving one bit (either 0 or 1) reduces uncertainty by 50% thus H = 1. When the outcome of the message is certain H = 0. Quantities of the form H play a central role in information theory as measures of information, choice and uncertainty. Shannon wrote: “If x is a chance variable we will write H(x) for its entropy; thus x is not an argument of a function but a label for a number, to differentiate it from H(y) say the entropy of the chance variable y.” [Shannon,p11,1948],[Gleick,p228,2011]. innovation (15th century [Webster,p603]): 1) the introduction of something new 2) a new idea, method, or device isomorphic (1862 [Webster,p622]) as adjective: 1a) being of identical or similar form, shape or structure 2) related by an isomorphism isomorphism (1828 [Webster,p622]) as noun: 1) the quality or state of being isomorphic as 1a) similarity in organisms of different ancestry resulting from convergence 1b) similarity of crystalline form between chemical compounds 2) a one-to-one correspondence between to mathematical sets ISIC (1958): ISIC stands for International Standard Industrial Classification of All Economic Activities issued by the United Nations. ISIC rev.4 is described in section 2.2 in which the theoretical principles behind this EACS are explained. For detailed backgrounds about ISIC see Appendix Economic Activity Classification Systems ISIC.
208
ITU and ITU-T (1865): The International Telecommunication Union (ITU) consists of three units of which the ITU Telecommunication Standardization Sector (ITU-T) coordinates the telecommunications standards. The standardisation work of ITU dates back to 1865, with the birth of the International Telegraph Union. This name remained unchanged until 1934. It became a United Nations specialised agency in 1947, and the International Telegraph and Telephone Consultative Committee (CCITT), (from the French name "Comité Consultatif International Téléphonique et Télégraphique") was created in 1956. It was renamed ITU-T in 1993 [Wikipedia]. ITU-T G.80x (1995): Recommendation ITU-T G.80x standardises and describes a functional architecture for telecommunications transport networks. The ITU network layers, which have been identified in the transport network functional model, should not be confused with the layers of the OSI Model (ITU-T X.200). An OSI layer offers a specific service using one protocol among different protocols. On the contrary, each layer network (in this ITU Recommendation) offers the same service using a specific protocol (the characteristic information). See sub-section 2.3.7 for more details concerning ITU-T G.80x and sub-section 2.3.5 for the OSI model. JSIC: The Japan Standard Industrial Classification [JSIC rev.12,2007] defines its current hierarchy by means of 20 divisions, 99 major groups, 529 groups and 1455 industries. The Japanese classification uses the term “industries” to refer to what ISIC defines as classes, the term “major groups” to refer to what ISIC defines as divisions and at upper hierarchical level the term “divisions” to refer to what ISIC defines as sections. labour force (1911 [Webster,p650] referring to workforce [Webster,p1363]): 1) the workers engaged in a specific activity or enterprise 2) the number of workers potentially assignable for any purpose [SN StatLine,2012] defines the labour force as employed and unemployed persons aged between 15-65. layer (13th century [Webster,p660]) as noun: 1) one that lays 2a) one thickness, course or fold laid or lying over or under another layering: Layering provides re-use of functionalities [Van Mieghem,2006], which makes this concept an appropriate base for structuring models of functional systems. Additionally, layering helps to represent the value-adding characteristic of complex systems. Layering is a technique that permits modelling of systems as a logically composed succession of ordered layers, where a system in some layer supports the system in the next higher layer. Conversely, the system in some layer uses the system in the next lower layer. Each layer adds value to services provided by the set of lower layers [TMF NGOSS,2004],[Dietz,2006]. link (15th century [Webster,p678] of Scandinavian origin): 1) a connecting structure 2b) a connecting element or factor 2c) a unit in a communication system Within the context of complex networks see also the definition of the notion edge.
209
link density: The link density of a network p = E[D]/(N-1) where N is the number of nodes and E[D] is the average network degree. As E[D] = 2L/N and thus p = 2L/N(N-1) the range of the link density of a network is: 0 < p ≤ 1 where p = 1 for a fully meshed network (commonly referred to as a complete graph KN). link weight correlation: The link weight correlation Δw = Eorg[σw] / Erand[σw] market-failure model (1958): A model that addresses issues of price efficiency and traditional utilitarianism originating from Frances Bator, one of the inventors of the market-failure paradigm [Bator,1958],[Bozeman,2002]. Bozeman quotes a description provided by John D. Donahue (The Privatization Decision, 1991): Market failure occurs when “prices lie - that is, when the prices of goods and services give false signals about their real value, confounding the communication between consumers and producers.” measure (13th century [Webster,p720] from Latin “mensura” and from Greek “metron”) as noun: 1a1) an adequate or due portion 1a2) a moderate degree, 1a3) a fixed or suitable limit 1b) the dimensions, capacity, or amount of something ascertained by measuring 1c) an estimate of what is to be expected (as a person or situation) 1d1) a measured quantity 1d2) amount, degree 2a) an instrument or utensil for measuring 2b1) a standard or unit of measurement 2b2) a system of standard units of measure <metric measure> 3) the act or process of measuring 4a1) melody, tune 4b) rhythmic structure or movement: cadence 4b1) poetic rhythm measured by temporal quantity or accent: meter 4b2) musical time 4c1) a grouping of a specified number of musical beats located between two consecutive vertical lines on a staff 4c2) a metrical unit: foot 5) an exact divisor of a number 6) a basis or standard of comparison <wealth is not a measure of happiness> 7) a step planned or taken as a means to an end: a proposed legislative act Both the Greek noun “metron“ and Latin noun “mensura” are derived from the verb that means to measure. According to [Liddell&Scott,p1123,1968] the Greek noun “metron“ means measure or by which anything is measured. [Lewis&Short,p1133,1980] translates the Latin word “mensura” as a measuring or measure. Additionally [Lewis&Short,p1133,1980] gives the meanings quantity, capacity, proportion, power, extent or degree. In a complex network context, R. Hekmat translates the notion of a measure in Dutch as; “een kerngetal van een matrix”.
210
measure (14th century [Webster,p720]) as verb: 1a) to choose or control with cautious restraint: regulate 1b) to regulate by a standard: govern 2) to allot or apportion in measured amounts 3) to lay off by making measurements 4) to ascertain the measurements of 5) to estimate or appreciate by a criterion 7) to serve as a means of measurement <a thermometer measures temperature> 8) to take or make a measurement 9) to have a specified measurement metric (1760 [Webster,p732]): standard of measurement
monetarism (1969 [Webster,p750]): a theory in economics that stable economic growth can be assured only by control of the rate of increase of the money supply to match the capacity for growth of real productivity monetary (~1812 [Webster,p750]): relating to money or to the mechanism by which it is supplied to and circulates in the economy NACE (1970): According to [wikipedia] NACE originates from the French title "Nomenclature statistique des Activités économiques dans la Communauté Européenne". According to [van den Brakel,2010] NACE is derived from "Nomenclature générale des Activités économiques dans la Communauté Européenne". NACE is the acronym used to designate the various statistical classifications of economic activities developed since 1970 in the European Union. NACE provides the framework for collecting and presenting a large range of statistical data according to economic activity in the field of economic statistics (e.g. production, employment, national account) and in other statistical domains. Statistics produced on the basic of NACE are comparable at European and, in general, at world level. The use of NACE is mandatory within the European Statistical System. NACE is the European standard classification of productive economic activities. It presents the universe of economic activities in such a way that a NACE code can be associated with a statistical unit carrying them out [NACE Rev.2,2008],[NOGA, section 1.2,2008]. NACE consists of a hierarchical structure (as established in the NACE Regulation), the introductory guidelines and the explanatory notes. In descending order of aggregation, the following levels are distinguished under de NACE Rev.2 code: i. a first level consisting of headings identified by a one character alphabetic code (sections), ii. a second level consisting of headings identified by a two-digit numerical code (divisions), iii. a third level consisting of headings identified by a three-digit numerical code (groupings), iv. a fourth level consisting of headings identified by a four-digit numerical code (classes). The code for the section level is not integrated in the NACE Rev.2 code that identifies the division, the group and the class describing a specific activity. The divisions are coded consecutively. However some “gaps” have been provided to allow for the introduction of additional divisions without complete change of the NACE coding. The gaps have been introduced in sections that are most likely to prompt the need for additional divisions. For this purpose, the following division code numbers have been left unused in the NACE Rev.2: 04, 34, 40, 44, 48, 54, 57, 67, 76, 83 and 89 [NOGA, sub-section 1.2.3].
211
NAICS: The North American Industry Classification System (NAICS) is the standard used by Federal statistical agencies in classifying business establishments for the purpose of collecting, analyzing, and publishing statistical data related to the U.S. business economy. NAICS was developed under the auspices of the Office of Management and Budget (OMB), and adopted in 1997 to replace the Standard Industrial Classification (SIC) system. It was developed jointly by the U.S. Economic Classification Policy Committee (ECPC), Statistics Canada , and Mexico's Instituto Nacional de Estadistica y Geografia, to allow for a high level of comparability in business statistics among the North American countries [www.census.gov]. National Account Systems: According to Wikipedia, National Accounts (NA) or National Account Systems (NAS) are the implementation of complete and consistent accounting techniques for measuring the economic activity of a nation. These include detailed underlying measures that rely on double-entry accounting. By construction, such accounting makes the totals on both sides of an account equal even though they each measure different characteristics, for example production and the income from it. As a method, the subject is termed national accounting or, more generally, social accounting. Stated otherwise, national accounts as systems may be distinguished from the economic data associated with such systems (e.g. [UNSNA]). While sharing many common principles with business accounting, national accounts are based on economic concepts [Demski,2005]. National accounting has developed in tandem with macroeconomics from the 1930s with its relation of aggregated demand to total output through interaction of such broad expenditure categories as consumption and investments. Economic data from national accounts are also used for empirical analysis of economic growth and development [Wikipedia,2013]. Also see the definition of the System of National Accounts provided by the United Nations [unstats.un.org/unsd/nationalaccount/sna.asp,2013]. network (1560 [Webster,p780]) as noun: 1) a fabric or structure of chords or wires that cross at regular intervals and are knotted or secured at the crossings 2) a system of lines or channels resembling a network 3a) an interconnected or interrelated chain, group, or system 3b) a system of computers, terminals, and databases connected by communications lines [Newman,p2,2003a] gives the following definition; “A network is a set of items, which we call vertices or sometimes nodes, with connections in between them, called edges. Systems taking the form of networks (also called “graphs” in much of the mathematical literature) abound the world”. network (1887 [Webster,p780]) as verb:
1) to cover with or as if with a network 2) to distribute for broadcast on a television network 3) to join (as computers) in a network 4) to engage in networking node (15th century [Webster,p787] from Latin “nodus” meaning knot): 5d) vertex node strength: The node strength si can be defined as the total weight of all the links connected to a node i. si = ∑ jє N (i) wij
212
node weight (2007?): 1. The weight wi of a node i can be placed on the diagonal of matrix W. Matrix W can be defined as a weighted adjacency matrix. In this way, the node weight can be understood as the weight of a self-loop [Wang et al.,2011]. 2. One expresses a kind of activities, organizations or events, named “acts”: and another expresses the actors participating in some acts. In each act the actors basically show collaboration relationship with each other, however they play different roles in the cooperation. Usually every actor tries to play the most important role; therefore the role difference can be regarded as a kind of competition. The node weight usually signifies the role or the importance degree of each actor [C.H.Fu et al.,2007]. NOGA: NOGA 2008 is the currently valid version of the Swiss General Classification of Economic Activities called NOGA issued by the Swiss Federal Statistical Office. The 6 digit NOGA code is compatible with NACE up to level 4. NOGA level 5 (called type), consisting of two digits, takes account of Swiss specificities. The NOGA code comprises the following levels: 21 sections, 88 divisions, 272 groups, 615 classes and 794 types. The acronym NOGA corresponds to Nomenclature Générale des Activités économiques in French and Nomenclatura Generale delle Attività economiche in Italian [www.noga.bfs.admin.ch]. persons employed [SN,p59,2013d]: Persons employed are all persons having paid jobs, even for only one or some hours a week, and even if they: - work legally as such, but without registration for income tax and social security (“undeclared work”), - are temporarily not at work, but have continued receipt of wages or salary (for instance owing to illness or hold-ups due to frost) - are on a temporary unpaid-leave. planar graph: A graph is planar if it can be embedded in a plane without crossing any links [Kuipers,2004]. portfolio (1722 [Webster,p908]): 1) a hinged cover or flexible case for carrying loose papers, pictures, or pamphlets 2) [fr. the use of such a case to carry documents of state]; the office and functions of a minister of state or member of a cabinet 3) the securities held by an investor: the commercial paper held by a financial house (as a bank) 4) a set of pictures (as drawings or photographs) either bound in book form or loose in a folder. Onder het begrip portfolio van een bedrijf wordt verstaan de verzameling van Produkt-Markt Combinaties (PMC’s) die het bedrijf voert (welke produkten het in portefeuille heeft en op welke markten het die afzet). Het produkt (dienst in het geval van een Telecom bedrijf) staat centraal en verbindt het commercieel, technisch en operationeel/organisatorisch portfolio. Een portfolio is een abstracte portefeuille, waarin een groep voor het bedrijf kenmerkende elementen is opgenomen (eventueel: in relatie tot de geleverde diensten [Baken et al.,Appendix A,p14,1993]. power-law (1926): [Newman,p7,2003a] mentions: “in 1926 Alfred Lotka discovered the so-called Law of Scientific Productivity, which states that the distribution of the numbers of papers written by individual scientists follows a power-law. That is, the number of scientists who have written k papers falls off as k -α for some constant α.”
213
Initially, this law captured the distribution phenomenon that relatively many scientists have written few papers and few scientists have written many papers. Later on, this power-law behaviour has been observed in many types of real networks (with focus on their degree distributions). In this thesis, α is referred to as the exponent of a probability density function (PDF) related to the observed distribution in link weights and node weights calculated from Input-Output tables. In the literature, τ is also used instead of α. According to [Newman,p10,2003a] regarding degree distributions, the value of the exponent tends to vary between 1.5 and 3.2 in various types of human social networks. In other types of networks such as biological, information and technological networks the exponent value varies between two and three. probability density function: A probability density function of X (where X refers to a random variable and x to a real number), can be written as follows: fX (x) = dFX (x) / dx Where ever in this thesis the acronym PDF is used, it always refers to the meaning probability density function and not probability distribution function. The probability density function is the first derivative of the probability distribution function (defined and exemplified here after). probability distribution function: A probability distribution function of X (where X refers to a random variable and x to a real number), can be written as follows: FX (x) For example in this thesis’ research of the Dutch and German IO tables (see figure 36, 37a and 37b in sub-section 4.4.3), the distribution of the degree Pr[D=k] = ck –τ has been examined. For denoting the mathematical symbol for the exponent in the probability distribution function both α and τ are used in the literature. Here Pr is the probability that an event where the random variable degree D in a graph equals k can be observed in the network. By means of c which represents the normalisation constant, all probabilities together sum up to 1. For example in figure 37a can be observed that finding k = 1 (a node that has a degree value 1) has a probability 1/59 = 0.01695 (both in the Dutch and in the German 59 node network construct only one of the 59 nodes in each network is a dead-end node). For example in figure 37b can be observed that finding k = 1 has a probability 1/105 = 0.00953 (as in the Dutch 105 node network construct only one of the 105 nodes is a dead-end node). Regarding the degree distribution in economic network constructs that have 20 nodes (representing economic sectors), a small probability is expected of finding nodes with degree values other than k = 19 (see for example table 12a and 12b). process (14th century [Webster,p929]) as noun: 1a) progress, advance 1b) something going on: proceeding 2a1) a natural phenomenon marked by gradual changes that lead toward a particular result 2a2) a natural continuing activity or function 2b) a series of actions or operations conducting to an end: especially: a continuous operation or treatment especially in manufacture 3a) the whole course of proceedings in a legal action 3b) the summons, mandate, or writ used by a court to compel the appearance of the defendant in a legal action or compliance with its orders 4) a prominent or projecting part of an organism or organic structure product (15th century [Webster,p930]): 2a) something produced 3) the amount, quantity or total produced Within the context of this thesis a product is defined as a good and/or a service.
214
production (15th century [Webster,p930]): 2a) the act or process of producing 2b) the creation of utility; the making of goods available for use 3) total output (of a commodity or industry) [SN,p57,2013] mentions: De waarde van alle voor verkoop bestemde goederen (ook de nog niet verkochte) en de ontvangsten voor bewezen diensten, alsmede de waarde van producten met een marktequivalent die voor eigen gebruik zijn geproduceerd zoals investeringen in eigen beheer, eigen woning diensten en landbouwproducten voor eigen consumptie door landbouwers. production function: Production functions relate the amounts of inputs used (by a sector) to the maximum amount of output that could be produced (by that sector) with those inputs. [Miller&Blair,p16,2009] distinguishes four types of production functions; a) linear, b) classical, c) Leontief and d) activity analysis. In an Input-Output analysis context a Leontief production function xj can be calculated as follows: xj = f (z1j ,z2j,…,znj,vj,mj ) productivity (1810 [Webster,p930]): [Wikipedia] defines productivity as an average measure of the efficiency of production. Productivity is a ratio of production output to what is required to produce it (inputs of capital, labour, land, energy, materials etcetera). The measure of productivity is defined as a total output per one unit of a total input. public interest: [Bozeman,p4,2002] refers to Lippman (1955) who defined public interest as “what people would choose if they saw clearly, thought rationally, and acted disinterestedly and benevolently.” public-value-failure-model (2002): According to Barry Bozeman [Bozeman,2002], market-failure models address issues of price efficiency, traditional utilitarianism and the allocation of goods and services, but market-failure models have shortcomings as a standard for public-value aspects of public policy and management. Public failure occurs when neither the market nor the public sector provides goods and services required to achieve core public values. [Bozeman,p6,2002] states that the lack of consensus on public values tempers our ability to develop simple analytical tools. An example of an obvious public value is public health. Additionally Bozeman mentions that his public-value-failure model is intended to expand the public dialogue and not to complete agreement about a course of action (as his model does not require consensus on values and it is not a decision-making tool). Regarding his public-value-failure-model, [Bozeman,p2,2002] presents criteria for identifying: - public value failures (diagnosing values problems that are not easily addressed by market-failure models), - public successes (noting that success is the opposite of failure). The proposed public-failure criteria [Bozeman,p7,2002] are: 1) mechanisms for articulating and aggregating value, 2) imperfect monopolies, 3) benefit hoarding, 4) scarcity of providers, 5) short time horizon, 6) substitutability versus conservation of resources, 7) threats to subsistence and human dignity. risk (~1661 [Webster,p1011]): [Helbing,p1,2013] states: According to the standard ISO 31000, risk is defined as “effect of uncertainty on objectives”. It is often quantified as the probability of occurrence of an (adverse) event, times its
215
(negative) impact (damage), but it should be kept in mind that risks might also create positive impacts, such as opportunities for some stakeholders. Compared to this, systemic risk is the risk of having not just statistically independent failures, but interdependent, so-called ‘cascading’ failures in a network of N interconnected system components. That is, systemic risks result from connections between risks (‘networked risks’). In such cases, a localized initial failure (‘perturbation’) could have disastrous effects and cause, in principle, unbounded damage as N goes to infinity. robust (1549 [Webster,p1013] from Latin “robustus” meaning strong) as adjective: 1a) having or exhibiting strength or vigorous health 1b) having or showing vigor, strength, or firmness 1c) strongly formed or constructed: sturdy 3) requiring strength or vigor 5) relating to resembling, or being any of the primitive, relatively large, heavyset hominids robustness [Webster,p1013]: [Webster,p1013] mentions the existence of the word robustness in its application as noun but does not give any definitions or meanings. [Kooij,2012] defines robustness as the extent to which a system can deal with perturbations imposed upon it. [IEEE St. 610.121990] defines robustness in relation with quality and availability: - Quality: The degree to which a system, component, or process meets specified requirements - Availability: The degree to which a system or component is operational and accessible when required for use (often expressed as a probability or a percentage). - Robustness: The degree to which a system or component can function correctly in the presence of invalid inputs or stressful environmental conditions. A system with high availability under normal operational conditions may prove to have low robustness, once confronted with stressful conditions. Testing the availability of end-to-end system with cases where things go wrong is one way of showing the robustness of the system. SBI (1974): Standaard Bedrijfsindeling (SBI) is the name of the Dutch EACS which consists of five hierarchical levels. SBI++ is a more detailed EACS which is used by the Dutch Chamber of Commerce (part of the “Nieuwe Handels Register”). SBI++ consists of six hierarchical levels and is used to for example issue licenses to registered individual enterprises [SBI2008++,2009].
scale-free graph In 2013 Wikipedia provides the following. A network is named scale-free if its degree distribution, i.e., the probability that a node selected uniformly at random has a certain number of links (degree), follows a particular mathematical function called a power-law. The power-law implies that the degree distribution of these networks has no characteristic scale. In contrast, networks with a single well-defined scale are somewhat similar to a lattice in that every node has (roughly) the same degree. Examples of networks with a single scale include the Erdős–Rényi (ER) random graph and hypercubes. In a network with a scale-free degree distribution, some vertices have a degree that is orders of magnitude larger than the average - these nodes are often called "hubs", although this is a bit misleading as there is no inherent threshold above which a node can be viewed as a hub. If there were such a threshold, the network would not be scale-free. Interest in scale-free networks began in the late 1990s with the reporting of discoveries of power-law degree distributions in real world networks such as the World Wide Web, the network of Autonomous Systems (ASs), some network of Internet routers, protein interaction networks, email networks, etcetera.
216
sector (1570 [Webster,p1056] from Latin meaning cutter) as noun: 1a) a geometric figure bounded by two radii and the included arc of a circle 1b1) a sub-division of a defensive military position 1b2) a portion of a military front or area of operation 1c) an area or portion resembling a sector 1d) a social, economic or political sub-division of society (greater cooperation between the public and private sectors) 2) a mathematical instrument consisting of two rulers connected at one end by a joint and marked with several scales 3) a sub-division of a track on a computer disc Derived from inventoried definitions (including [Potter,1988]) the following is proposed in this thesis: A sector is a more or less homogeneous economic activity cluster that has at least one unique function and produces a similar type of goods and/or services or uses similar processes. At sector network level, all sectors can connect to each other in a full mesh structure, enabling direct exchange of their (unique) value. [Potter,1988] defines industries as groupings of statistical units engaged in producing particular output classes. The term industry is used worldwide to address a grouping of economic establishments and their activities. In EACS practice the term industry commonly refers to statistical units (a section or section constituents). During this thesis’ research, different perceived meanings of the term industry were observed (see for instance the Japanese JSIC rev.12 and SIC of the Republic of China). sector (1884, sectoring) as verb: The verb to sector relates to the process of exclusive dividing and classifying without any overlap. [Webster,p1056] gives the meaning to divide into or furnish with sectors. sector network: A sector network is a fully meshed network in which the nodes represent economic sectors. This definition is proposed by the author within the context of this thesis that explores economic complex networks, thus the adjective economic is the prime aspect of the studied complex network. service (13th century [Webster,p1070] from Latin “servitium” meaning condition of a slave) as noun: 1a) the occupation or function of serving 1b) employment as a servant 2a) the work performed by one that serves 2b) help, use, benefit 2c) contribution to the welfare of others 2d) disposal for use 4) the act of serving as 4a) a helpful act 4b) useful labor that does not produce a tangible commodity 6a) an administrative division (as of a government or business) 6b) one of a nation’s military forces (as the army or navy) 7a) a facility supplying some public demand 7b) a facility providing maintenance and repair 9) the act of bringing a legal writ, process, or summons to notice as prescribed by law 11) a branch of a hospital medical staff devoted to a particular specialty Note that the above is a selection of the meanings which the term service can have.
217
[Grönroos,2000] defines a service as; a process consisting of a series of more or less intangible activities that normally, but not necessary always, take place in interactions between the customer and service employees and/or physical resources or goods and/or systems of the service provider, which are provided as solutions to customer problems. service (1528 [Webster,p1070]) as verb: 1) to repair or provide maintenance for 2) to meet interest and sinking fund payments on (as government debt) 3) to perform any of the business functions auxiliary to production or distribution of
SIC of RoC (2002): Standard Industrial Classification System of The Republic of China. small-world property A network is said to have the small-world property when the hopcount in that network is not strongly affected by an increase in the network size. Examples can be found in [Barabási,2003] regarding web pages on the Internet and the research of Stanley Milgram regarding the “Six degrees of separation” in social networks and “The small-world problem” both published in 1967. SNA (1947): See the definition of the System of National Accounts [unstats.un.org/unsd/nationalaccount/sna.asp,2013]. stability (14th century [Webster,p1142]): 1) the quality, state, or degree of being stable 1a) the strength to stand or endure (firmness) 1b) the property of a body that causes it when disturbed from a condition or equilibrium or steady motion to develop forces or moments that restore the original condition 1c) resistance to chemical change or to physical disintegration 2) residence for life in one monastery streaming data (1991): [Wikipedia,2013] streaming media, (webcast). First implementation is the Cambridge coffeepot. sub-system: A sub-system is a set of elements, which is a system itself, and a component of a larger system. [Wikipedia] system (1603 [Webster,p1197] from Greek “systema” originating from the verb “sunistemi” meaning set together, combine, associate, unite, put together, organize or frame [Liddell&Scott,p1718]): 1) a regularly interacting or interdependent group of items forming a unified whole 2) an organized set of doctrines, ideas, or principles 3a) an organized or established procedure 3b) a manner of classifying, symbolizing, or schematizing (a taxonomic system) 4) harmonious arrangement or pattern 5) an organized society or social situation regarded as stultifying (establishment) Karl Ludwig von Bertalanffy defined a system as elements in standing relationship [Wikipedia]. The following is copied straight from the concluding remarks in [Bunge,p15-16,1979] about systems: “The literature on systems is vast, rapidly growing, and somewhat bewildering [Cf. Klir and Rogers,1977]. However, the field is still immature and its reputation is jeopardized by a fringe of charlatans. Suffice it to mention three indicators of immaturity. Firstly, the very definition of the concept of a
218
system is still in doubt, so that many papers start by spending time defining or redefining the concept. Yet, so much effort spent on definitions has yielded only three which are as popular as they are incorrect. According to the first definition: A system is a set of interrelated elements - which is fine for conceptual systems but not for concrete ones since sets, no matter how structured, are sets, hence concepts not things. The second definition equates a system with a black box equipped with inputs and outputs, which is fine in a few cases but useless when the internal structure of the system is relevant. And the third widely used definition is a generalization of the preceding, namely this: a system is a binary relation – again a conceptual object. Secondly, some writers claim that everything imaginable is a system, and that a general theory of systems should deal with every possible thing (without thereby becoming part of philosophy) and every possible problem, theoretical or practical regarding the behaviour of systems of all kinds. Some have even asserted that such a theory should cover not only concrete systems but also conceptual ones, so that it would be a thoroughly unified science of everything. Thirdly, some enthusiasts of general theories of a system have seen in these a vindication of holistic philosophies, hence a condemnation of the analytic method characteristic of science. However, most of those who approve of general systems theories for their alleged holistic virtues either misuse the term ‘holistic’ to designate “systemic”, or are interested in instant wisdom rather than painstaking scientific or philosophical research.” Bunge recognises two system kingdoms only. He concludes; either conceptual or concrete, “a system may be said to have a definite composition (C), a definite environment (E), and a definite structure (S)”. From a systemist perspective, hereafter some of his definitional views [Bunge,p188-193,1979] are given. These views interrelate human society, its members, systems, sub-systems, sectors and functions (interchanging the terms community and society (p189)): 1. Every human society is characterised by means of 10 properties. Three examples are: - some members do labour, thus transform parts of their environment (postulate 4.26 (i)), - some members manage the activities of others (from 4.26 (iii)), - every member shares information, services or goods with some other members of the same community (from 4.26 (vii)). 2. Every human society has a number of sectors (postulate 5.2, p193): - every member belongs to at least two sectors of it, - no individual belongs to all sectors at the same time, - every society can be analysed into a number of sectors and, in particular, sub-systems. 3. There is some division of labour in every society. 4. All sub-systems have at least three functions/activities in common (p193): - consuming or transforming energy, - producing waste products, - communicating with other sub-systems of the community, 5. There are no systems without functions. The functions of a system define what the system does. Every function is related to a system that does the functioning, but the user of a system defines the function. [Bunge,p45-46,1979] proposes a hierarchy of five main genera of things constituting the furniture of the world: - the highest level; the set of socio systems (5) and the set of technical systems (4) on equal height, - the second highest level; the set of psychosystems founded on biosystems (3), - the second lowest level; the set of biochemo systems founded on chemosystems (2), - the bottom level; the set of physical things (1).
219
[Wikipedia] gives the following definition of a system from a process and transformation process view: A system can also be viewed as a bounded transformation process that is a process (or collection of processes) that transforms inputs into outputs. Inputs are consumed; outputs are produced. The concept of input and output here is very broad. E.g. an output of a passenger ship is the movement of people from departure to destination. System of National Accounts (1947): The System of National Accounts (SNA) is the internationally agreed standard set of recommendations on how to compile measures of economic activity provided by the United Nations. The SNA describes a coherent, consistent and integrated set of macroeconomic accounts in the context of a set of internationally agreed concepts, definitions, classifications and accounting rules. In addition, the SNA provides an overview of economic processes, recording how production is distributed among consumers, businesses, government and foreign nations. It shows how income originating in production, modified by taxes and transfers, flows to these groups and how they allocate these flows to consumption, saving and investment. Consequently, the national accounts are one of the building blocks of macroeconomic statistics forming a basis for economic analysis and policy formulation. The SNA is intended for use by all countries, having been designed to accommodate the needs of countries at different stages of economic development. It also provides an overarching framework for standards in other domains of economic statistics, facilitating the integration of these statistical systems to achieve consistency with the national accounts [unstats.un.org/unsd/nationalaccount/sna.asp,2013]. systems theory: [Wikipedia]: Systems theory is the trans-disciplinary study of systems in general, with the goal of elucidating principles that can be applied to all types of systems in all fields of research. The term does not yet have a well-established, precise meaning, but systems theory can reasonably be considered a specialization of systems thinking and a generalization of systems science. The term originates from Bertalanffy's General System Theory (GST) and is used in later efforts in other fields, such as the action theory of Talcott Parsons and the system-theory of Niklas Luhmann. In this context the word system is used to refer specifically to self-regulating systems, i.e. that are self-correcting through feedback. Self-regulating systems are found in nature, including the physiological systems of our body, in local and global ecosystems, and in climate. According to [Dietz,2006] ”the General System Theory (GST) provides a basis for the common understanding of some area of interest by means of a hierarchical organisation of all relevant entities and their relations”. systemics: Synonym for general system theory. Systemics is the set of theories that focuses on the structural characteristics of systems and can therefor cross the largely artificial barriers between disciplines [Bunge,1979]. taxonomy (1828 [Webster,p1208]): 1) the study of the general principles of scientific classification: systematics 2) classification The term taxonomic is the adjective form of the noun taxonomy.
220
telecommunications (1932): Telecommunications can be defined as communications over distance. Concerning telecommunications, translation from original national EACSs into English does not always give a unanimous result. For example, the English translation taken from the Chinese EACS gives “transmission” instead of telecommunications. Furthermore, the 2010 Russian EACS OKVED section I gives the term связь (“svjaz”) which means in this context connection over distance or contact. Thus, OKVED provides an authentic view on the nature of the telecommunications related activity cluster and names it transport and connection which does not distinguish between the characteristics physical and digital respectively. To some extent, the Russian convention resembles the previous version of ISIC [ISIC rev.3.1,1993] in which for instance post and telecommunications were still classified together within division 64 (part of ISIC rev.3.1 section I) named “Transport, storage and communications”. An observation here is that the activity clusters information creation, storage and post are not classified in ISIC rev.4 section J. In ISIC rev.4 the physical transport of tangible goods has been separated from the transport of information/data via Digital Information Networks. Currently, the activity cluster storage is classified within the ISIC rev.4 section H “Transportation and storage”. From this can be concluded that the storage of digital information/data is classified within the six divisions of ISIC rev.4 section J. telephony (1835): Telephony originates from the Greek words “tele” (τηλε) meaning at a distance or far off [Liddell&Scott,p1787,1968] and “phone” (ϕωυη) meaning sound, tone mostly of human beings speech, voice, utterance [Liddell&Scott,p1967,1968]. This choice was preceded by the name chosen for the invention of the telegraph originating from the Greek words “tele” and “grapho” (γραϕω) meaning write [Liddell&Scott,p360,1968]. tetrahedron (1570 [Webster,p1219]): A polyhedron that has four faces. thermodynamics (1854): The first law of thermodynamics is an expression of the principle of conservation of energy (in nature). This law expresses that energy can be transformed, i.e. changed from one form to another, but cannot be created nor destroyed. It is usually formulated by stating that the change in the internal energy of a system is equal to the amount of heat supplied to the system, minus the amount of work performed by the system on its surroundings. The German scientist Rudolf Clausius is credited with the first formulation of the second law, now known as the Clausius statement: No process is possible whose sole result is the transfer of heat from a body of lower temperature to a body of higher temperature. Spontaneously, heat cannot flow from cold regions to hot regions without external work being performed on the system, which is evident from ordinary experience of refrigeration. For example, in a refrigerator, heat flows from cold to hot, but only when forced by an external agent, a compressor. The second law of thermodynamics is an expression of the tendency that over time, differences in temperature, pressure, and chemical potential equilibrate in an isolated physical system [Wikipedia]. topology (1850 [Webster,p1244]): 1) topographic study of a particular place 2a1) a branch of mathematics concerned with those properties of geometric configurations (as point sets) which are unaltered by elastic deformations (as a stretching or a twisting) that are homeomorphisms 2a2) the set of all open subsets of a topological space
221
trans ([Webster,p1252] from Latin meaning across, beyond, through and so as to change) as prefix: 1) on or to the other side of : across : beyond <transatlantic> 2a) beyond, (a special chemical element) in the periodic table <transuranium> 3) through <transcutaneous> 4) so or such as to change or transfer <translocation> <transliterature> <transship> transact (1585 [Webster,p1252] from Latin “transactus”/ “transigere” meaning to complete or to transact) as verb: 1) to carry on business 2) to carry to completion 3) to carry on the operation or management to completion (transact a sale) transaction (1647 [Webster,p1252]): 1a) something transacted; especially: an exchange or transfer of goods, services or funds 1b) the often published record of the meeting of a society or association 2a) an act, process, or instance of transacting 2b) a communicative action or activity involving two parties or things that reciprocally affect or influence each other transceiver (1934) as noun: A radio transmitter-receiver that uses many of the same components for both transmission and reception [Webster,p1253]. Note that [Webster,1993] does not mention transceive as a verb. [Wiktionary,2011] mentions to transceive as a verb and gives a meaning only in the context of a communications device: to both transmit and receive. transcend (14th century [Webster,p1253] from Latin “transcendere” meaning to climb across) as verb: 1a) to rise above or go beyond the limits of 1b) to triumph over the negative or restrictive aspects of : overcome 1c) to be prior to, beyond, and above (the universe or material existence) 2a) to outstrip or outdo in some attribute, quality, or power 2b) to rise above or extend notably beyond ordinary limits (synonym: exceed) transfer (1674 [Webster,p1253]) as noun: 1a) conveyance of right, title, or interest in real or personal property from one person to another 1b) removal or acquisition of property by mere delivery with intent to transfer title 2a) an act, process, or instance of transferring (transference) 2b) the carryover or generalization of learned responses from one type or situation to another 3) one that transfers or is transferred 4) a place where a transfer is made (as of trains to ferries or as where one form of power is changed to another) 5) a ticket entitling a passenger on a public conveyance to continue the trip on another route transfer (14th century [Webster,p1253] from Latin “transferre” meaning to carry) as verb: 1a) to convey from one person, place, or situation to another: transport 1b) to cause to pass from one to another: transmit 2) to make over the possession or control of: convey 3) to print or otherwise copy from one surface to another by contact 4) to move to a different place, region, or situation, especially to withdraw from one educational institution to enroll at another 5) to change from one vehicle or transportation line to another
222
trans-sector innovation: The concept of trans-sector innovation can be defined as innovation that involves two or more sectors. Regarding the term innovation [Wikipedia] suggests; “Innovation or renewal is the introduction of new ideas, goods, services and processes. Innovation can take place within organisations but also within broader arrangements”. Combined from [Bryson et al.,2006], [Webster,p603]
and the above mentioned, the following definition could be proposed: Trans-sector innovation concerns participants, originating from two or more sectors, actively engaged in the introduction of new ideas, goods, services, methods and or processes. [Bryson et al.,2006] define cross-sector collaboration as the linking or sharing of information, resources, activities, and capabilities by organizations in two or more sectors, to achieve jointly an outcome that could not be achieved by organizations in one sector separately. tree (in the context of graph theory): In graph theory, a tree is defined as a connected acyclic simple graph. A graph is simple if it does not have any self-loops or parallel links [Kuipers,2004]. utilitarianism (1827) [Webster,p1302]: A doctrine that the useful is the good and that the determining consideration of right conduct should be the usefulness of its consequences; specific: a theory that the aim of action should be the largest possible balance of pleasure over pain or the greatest happiness of the greatest number, [Bozeman,2002]. valorisation (1906, [Webster,p1305]): The valorisation of capital is a theoretical concept created by Karl Marx in his critique of political economy. The original German term is "Verwertung" (specifically “Kapitalverwertung”) but this is difficult to translate, and often wrongly rendered as realisation of capital, creation of surplus-value or self-expansion of capital or increase in value. In German language, the general meaning of "Verwertung" is the use or application of something (an object, process or activity) so that it makes money, or generates value, with the connotation that the thing validates itself and proves its worth when it results in earnings, a yield. Thus, something is "valorised" if it has yielded its value. Similarly, Marx's specific concept refers both to the process whereby a capital value is conferred or bestowed on something, and to the increase in the value of a capital asset. In modern translations of Marx's economic writings, the term valorisation (as in French) is preferred because it is recognised that it denotes a highly specific economic concept, i.e. a term with a technical meaning [Wikipedia]. [Webster,p1305] mentions valorization as noun and dates the use of the verb to valorize around 1906 meaning: to enhance or try to enhance the price, value or status of by organized and Governmental action. value (14th century [Webster,p1305] from Latin “valere” meaning to be worth or to be strong) as noun: 1) a fair return or equivalent in goods, services or money for something exchanged 2) the monetary worth of something: marketable price 3) relative worth, utility, or importance 4a) a numerical quantity that is assigned or is determined by calculation or measurement 4b) precise signification (value of a word) 5) the relative duration of a musical note 6a) relative lightness or darkness of a color (luminosity) 6b) the relation of one part in a picture to another with respect to lightness and darkness 7) something (as a principle or quality) intrinsically valuable or desirable Porter defines value as the amount of money people are willing to pay for a product or service [de Reuver,p10,2009].
223
value (15th century [Webster,p1305]) as verb: 1a) to estimate or assign the monetary worth of 1b) to rate or scale in usefulness, importance, or general worth (evaluate) 2) to consider or rate highly (appreciate) value added: The value added equals the production (in basic prices) minus intermediate consumption (excluding deductible value added tax).Intermediate consumption covers the goods and services which, during the period of review, are consumed as inputs by the process of production (in purchasing prices and without deduction of value added). This may be raw materials, semi-manufactured goods or fuels, whether or not bought during the period of review, but also telecommunication services, services of externe-accountants or cleaners [SN,p58,2013d]. value chain (1985): Porter has defined the value chain as the set of activities and/or firms that create a specific product or service. The value chain, also known as value chain analysis, is a concept from business management that was first described and popularised in 1985 by Michael Porter in “Competitive Advantage: Creating and Sustaining Superior Performance” [Wikipedia]. value network: A dynamic network of actors working together to generate customer value and network value by means of a specific service offering, in which tangible and intangible value is exchanged between the actors involved [de Reuver,2009]. [Van Eck et al.,p5,2000] define a value network as a graph that represents a number of collaborating actors that create, distribute and consume objects of value. Note that besides collaboration competition exists as well. This gives rise to diversity in definitions and descriptions of value networks. vertex (1570 [Webster,p1313]): A vertex (pl. vertices) is the fundamental unit of a network, also called a site (physics), a node (computer science), or an actor (sociology) [Newman,p5,2003a]. Among other meanings, [Webster,p1313] mentions a point (as of an angle, polygon, polyhedron, graph, or network) that terminates a line or curve or comprises the intersection of two or more lines or curves. vital sector: The terms vital sector and critical sector are considered synonyms in this thesis. According to [MinBZK,2005] a sector is defined vital when at least one of the following three criteria is applicable: 1. Disturbance or outage of a vital sector, service or product causes economical or societal disruption on (inter)national scale, 2. Disturbance or outage directly or indirectly leads to many casualties, 3. The duration of the disruption is substantial, the recovery takes a relatively long time and during the recovery no viable alternatives are at hand. The first report “Bescherming Vitale Infrastructuur (BVI)” resulting from the BVI-project, supervised by the Dutch Ministry of the Interior and Kingdom Relations, [MinBZK,footnote 4,p3,2005]
mentions a quick scan performed by TNO from which the vital sectors were inventoried and named. This initial analysis comprised 11 sectors. This proposal was accepted as the basis for the vital sectors and vital infrastructures analysis. Later on, a 12th vital sector was added named chemical and nuclear industry (in Dutch “chemische en nucleaire industrie”). Table 28 relates the 10 ministries involved in the BVI-project to the 12 vital sectors.
224
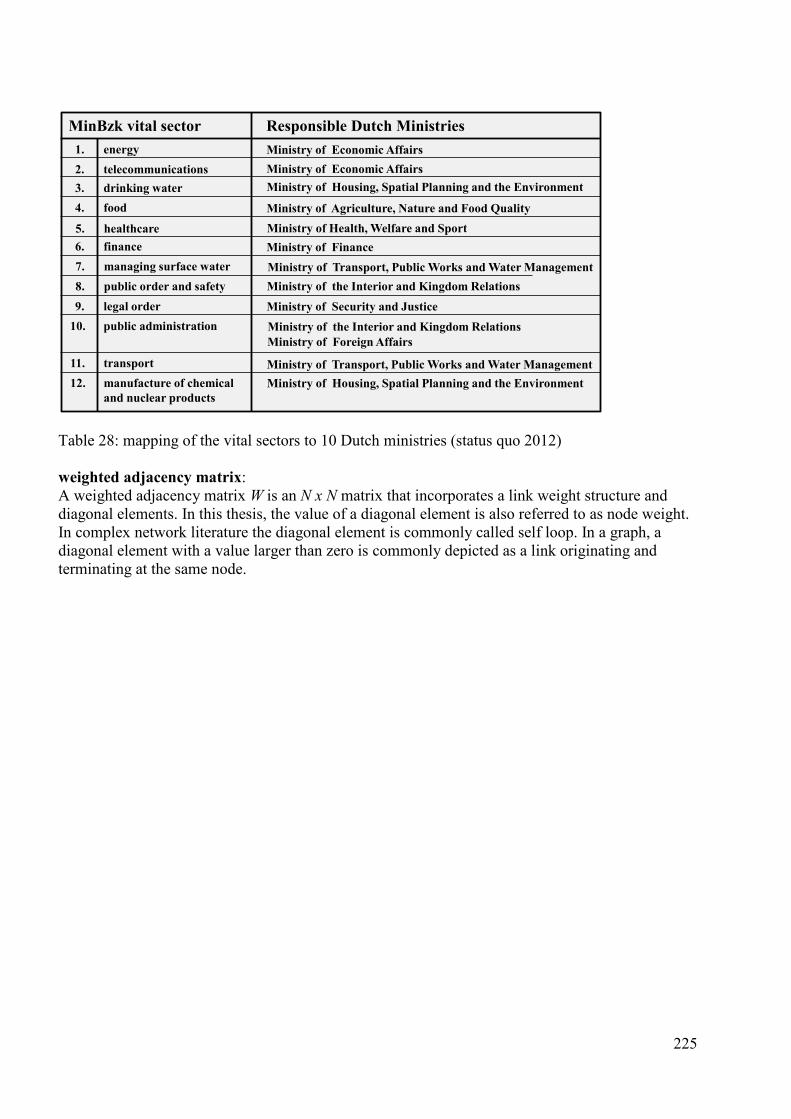
Table 28: mapping of the vital sectors to 10 Dutch ministries (status quo 2012) weighted adjacency matrix: A weighted adjacency matrix W is an N x N matrix that incorporates a link weight structure and diagonal elements. In this thesis, the value of a diagonal element is also referred to as node weight. In complex network literature the diagonal element is commonly called self loop. In a graph, a diagonal element with a value larger than zero is commonly depicted as a link originating and terminating at the same node.
Responsible Dutch Ministries
Ministry of Finance
Ministry of Economic Affairs
Ministry of Health, Welfare and Sport
MinBzk vital sector
Ministry of Security and Justice
drinking water
legal orderpublic administration
manufacture of chemical and nuclear products
finance
telecommunications
food
healthcare
transportMinistry of Housing, Spatial Planning and the Environment
Ministry of Agriculture, Nature and Food Quality
Ministry of the Interior and Kingdom Relations
Ministry of Transport, Public Works and Water Management
public order and safety Ministry of the Interior and Kingdom Relations managing surface water
energy Ministry of Economic Affairs
Ministry of Transport, Public Works and Water Management
3.
9. 10.
12.
6.
2.
4.
5.
11.
8.7.
1.
Ministry of Housing, Spatial Planning and the Environment
Ministry of Foreign Affairs
225
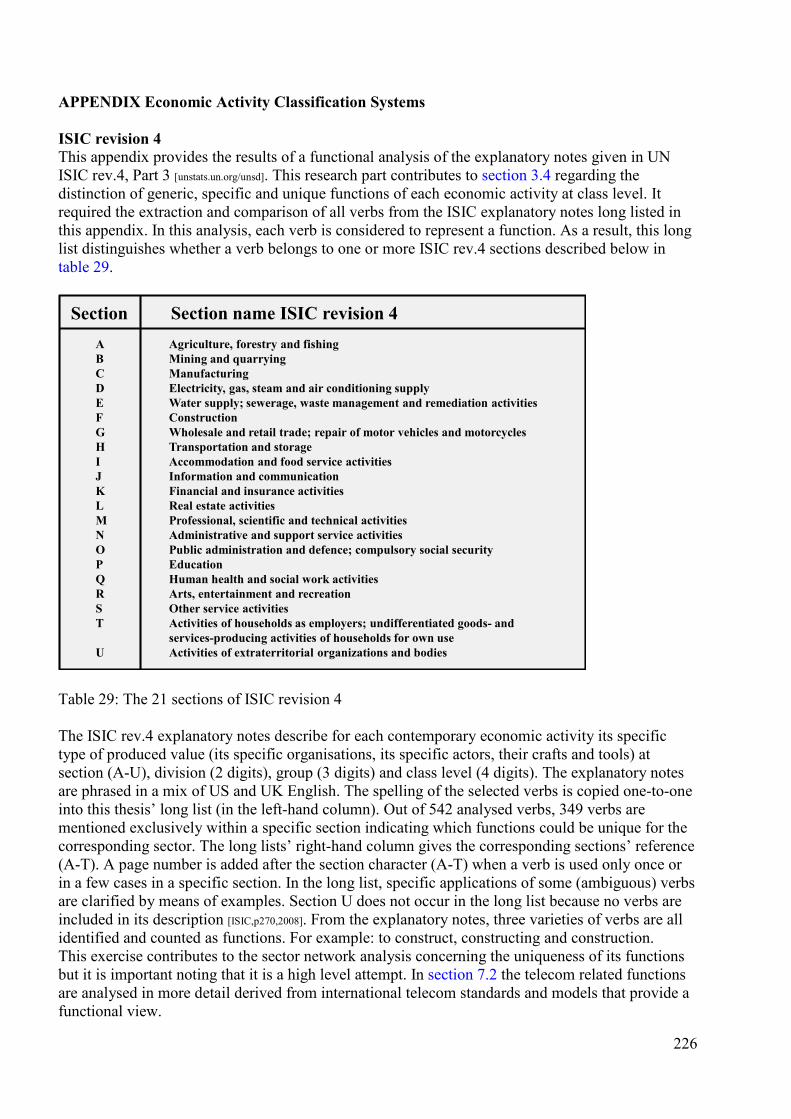
APPENDIX Economic Activity Classification Systems ISIC revision 4 This appendix provides the results of a functional analysis of the explanatory notes given in UN ISIC rev.4, Part 3 [unstats.un.org/unsd]. This research part contributes to section 3.4 regarding the distinction of generic, specific and unique functions of each economic activity at class level. It required the extraction and comparison of all verbs from the ISIC explanatory notes long listed in this appendix. In this analysis, each verb is considered to represent a function. As a result, this long list distinguishes whether a verb belongs to one or more ISIC rev.4 sections described below in table 29.
Table 29: The 21 sections of ISIC revision 4 The ISIC rev.4 explanatory notes describe for each contemporary economic activity its specific type of produced value (its specific organisations, its specific actors, their crafts and tools) at section (A-U), division (2 digits), group (3 digits) and class level (4 digits). The explanatory notes are phrased in a mix of US and UK English. The spelling of the selected verbs is copied one-to-one into this thesis’ long list (in the left-hand column). Out of 542 analysed verbs, 349 verbs are mentioned exclusively within a specific section indicating which functions could be unique for the corresponding sector. The long lists’ right-hand column gives the corresponding sections’ reference (A-T). A page number is added after the section character (A-T) when a verb is used only once or in a few cases in a specific section. In the long list, specific applications of some (ambiguous) verbs are clarified by means of examples. Section U does not occur in the long list because no verbs are included in its description [ISIC,p270,2008]. From the explanatory notes, three varieties of verbs are all identified and counted as functions. For example: to construct, constructing and construction. This exercise contributes to the sector network analysis concerning the uniqueness of its functions but it is important noting that it is a high level attempt. In section 7.2 the telecom related functions are analysed in more detail derived from international telecom standards and models that provide a functional view.
A Agriculture, forestry and fishingB Mining and quarryingC ManufacturingD Electricity, gas, steam and air conditioning supplyE Water supply; sewerage, waste management and remediation activitiesF ConstructionG Wholesale and retail trade; repair of motor vehicles and motorcyclesH Transportation and storageI Accommodation and food service activitiesJ Information and communicationK Financial and insurance activitiesL Real estate activitiesM Professional, scientific and technical activitiesN Administrative and support service activitiesO Public administration and defence; compulsory social securityP EducationQ Human health and social work activitiesR Arts, entertainment and recreationS Other service activitiesT Activities of households as employers; undifferentiated goods- and
services-producing activities of households for own useU Activities of extraterritorial organizations and bodies
Section Section name ISIC revision 4
226
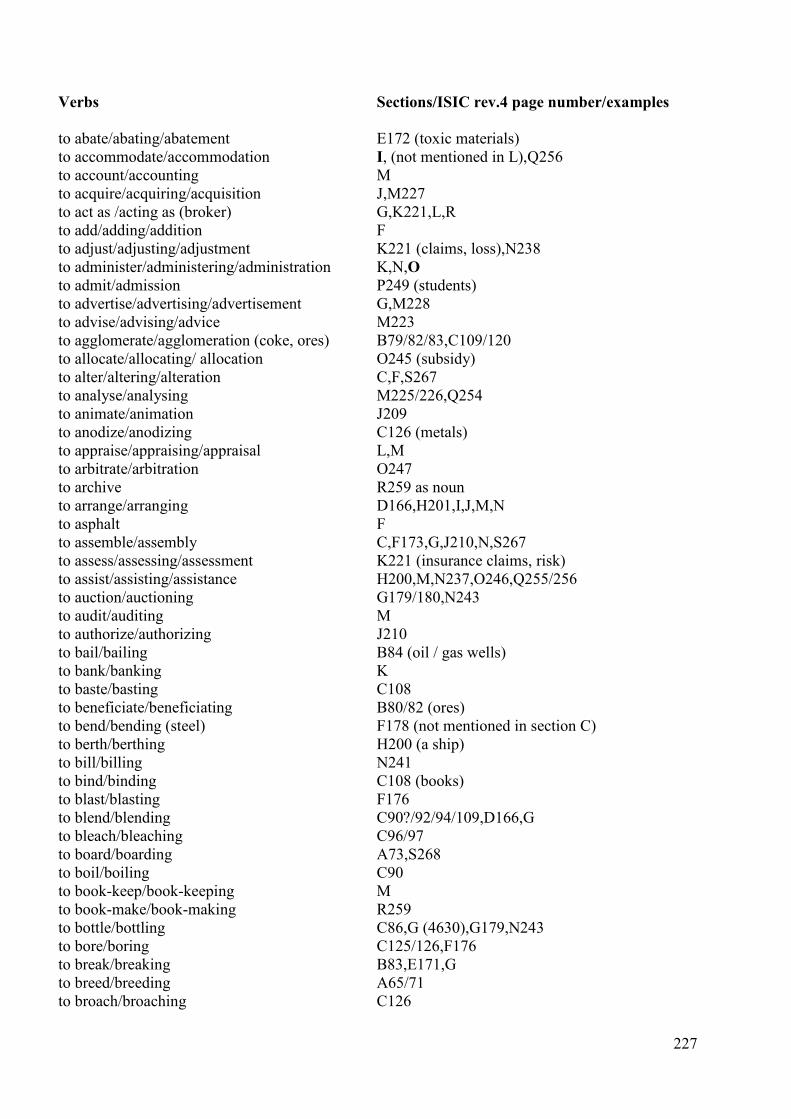
Verbs Sections/ISIC rev.4 page number/examples to abate/abating/abatement E172 (toxic materials) to accommodate/accommodation I, (not mentioned in L),Q256 to account/accounting M to acquire/acquiring/acquisition J,M227 to act as /acting as (broker) G,K221,L,R to add/adding/addition F to adjust/adjusting/adjustment K221 (claims, loss),N238 to administer/administering/administration K,N,O to admit/admission P249 (students) to advertise/advertising/advertisement G,M228 to advise/advising/advice M223 to agglomerate/agglomeration (coke, ores) B79/82/83,C109/120 to allocate/allocating/ allocation O245 (subsidy) to alter/altering/alteration C,F,S267 to analyse/analysing M225/226,Q254 to animate/animation J209 to anodize/anodizing C126 (metals) to appraise/appraising/appraisal L,M to arbitrate/arbitration O247 to archive R259 as noun to arrange/arranging D166,H201,I,J,M,N to asphalt F to assemble/assembly C,F173,G,J210,N,S267 to assess/assessing/assessment K221 (insurance claims, risk) to assist/assisting/assistance H200,M,N237,O246,Q255/256 to auction/auctioning G179/180,N243 to audit/auditing M to authorize/authorizing J210 to bail/bailing B84 (oil / gas wells) to bank/banking K to baste/basting C108 to beneficiate/beneficiating B80/82 (ores) to bend/bending (steel) F178 (not mentioned in section C) to berth/berthing H200 (a ship) to bill/billing N241 to bind/binding C108 (books) to blast/blasting F176 to blend/blending C90?/92/94/109,D166,G to bleach/bleaching C96/97 to board/boarding A73,S268 to boil/boiling C90 to book-keep/book-keeping M to book-make/book-making R259 to bottle/bottling C86,G (4630),G179,N243 to bore/boring C125/126,F176 to break/breaking B83,E171,G to breed/breeding A65/71 to broach/broaching C126
227
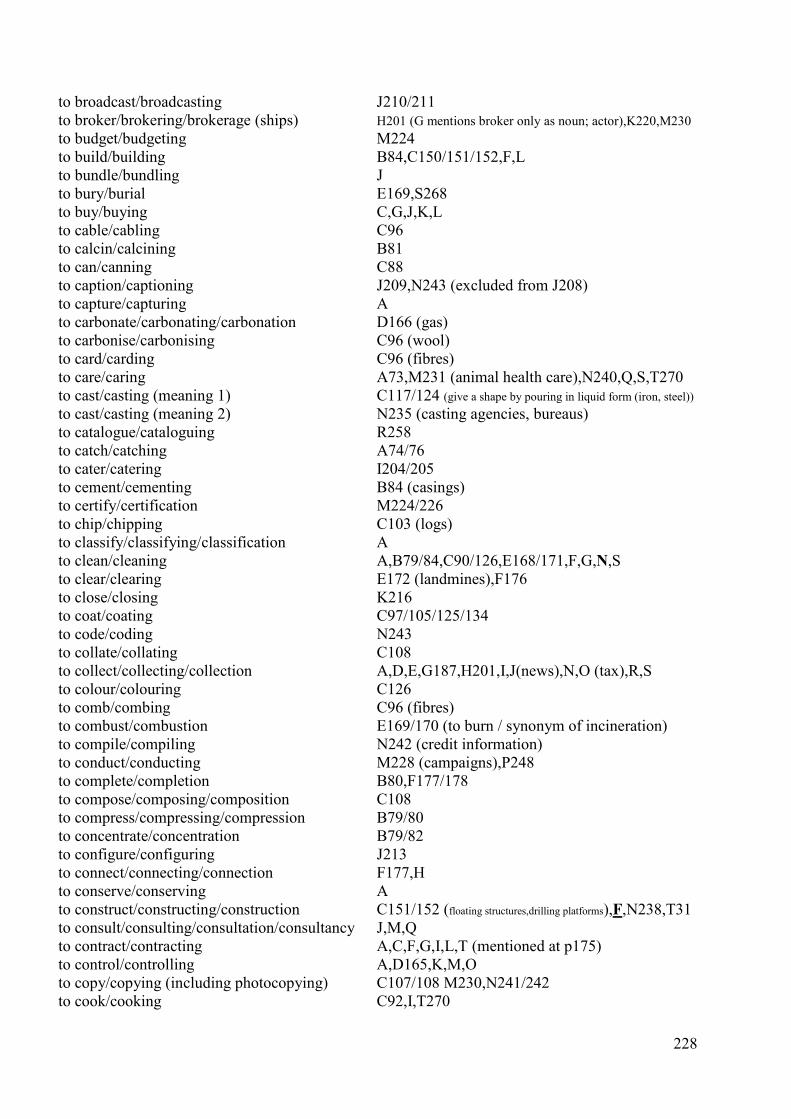
to broadcast/broadcasting J210/211 to broker/brokering/brokerage (ships) H201 (G mentions broker only as noun; actor),K220,M230 to budget/budgeting M224 to build/building B84,C150/151/152,F,L to bundle/bundling J to bury/burial E169,S268 to buy/buying C,G,J,K,L to cable/cabling C96 to calcin/calcining B81 to can/canning C88 to caption/captioning J209,N243 (excluded from J208) to capture/capturing A to carbonate/carbonating/carbonation D166 (gas) to carbonise/carbonising C96 (wool) to card/carding C96 (fibres) to care/caring A73,M231 (animal health care),N240,Q,S,T270 to cast/casting (meaning 1) C117/124 (give a shape by pouring in liquid form (iron, steel)) to cast/casting (meaning 2) N235 (casting agencies, bureaus) to catalogue/cataloguing R258 to catch/catching A74/76 to cater/catering I204/205 to cement/cementing B84 (casings) to certify/certification M224/226 to chip/chipping C103 (logs) to classify/classifying/classification A to clean/cleaning A,B79/84,C90/126,E168/171,F,G,N,S to clear/clearing E172 (landmines),F176 to close/closing K216 to coat/coating C97/105/125/134 to code/coding N243 to collate/collating C108 to collect/collecting/collection A,D,E,G187,H201,I,J(news),N,O (tax),R,S to colour/colouring C126 to comb/combing C96 (fibres) to combust/combustion E169/170 (to burn / synonym of incineration) to compile/compiling N242 (credit information) to conduct/conducting M228 (campaigns),P248 to complete/completion B80,F177/178 to compose/composing/composition C108 to compress/compressing/compression B79/80 to concentrate/concentration B79/82 to configure/configuring J213 to connect/connecting/connection F177,H to conserve/conserving A to construct/constructing/construction C151/152 (floating structures,drilling platforms),F,N238,T31 to consult/consulting/consultation/consultancy J,M,Q to contract/contracting A,C,F,G,I,L,T (mentioned at p175) to control/controlling A,D165,K,M,O to copy/copying (including photocopying) C107/108 M230,N241/242 to cook/cooking C92,I,T270
228
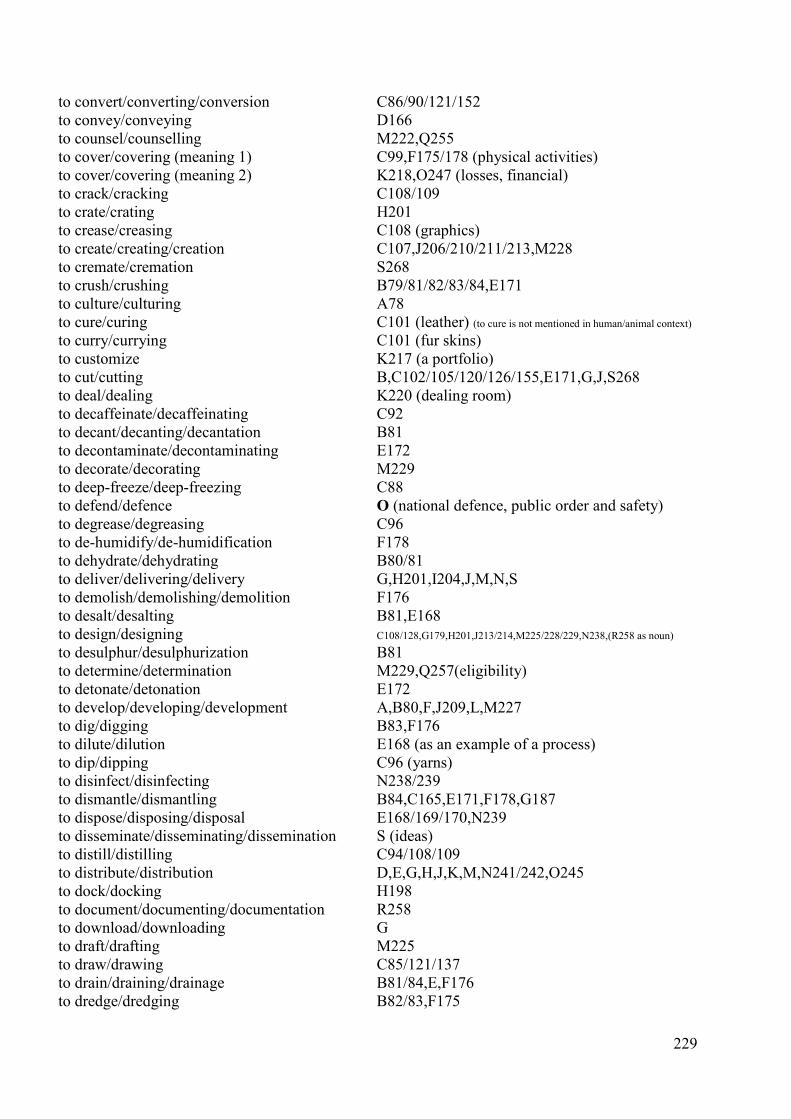
to convert/converting/conversion C86/90/121/152 to convey/conveying D166 to counsel/counselling M222,Q255 to cover/covering (meaning 1) C99,F175/178 (physical activities) to cover/covering (meaning 2) K218,O247 (losses, financial) to crack/cracking C108/109 to crate/crating H201 to crease/creasing C108 (graphics) to create/creating/creation C107,J206/210/211/213,M228 to cremate/cremation S268 to crush/crushing B79/81/82/83/84,E171 to culture/culturing A78 to cure/curing C101 (leather) (to cure is not mentioned in human/animal context)
to curry/currying C101 (fur skins) to customize K217 (a portfolio) to cut/cutting B,C102/105/120/126/155,E171,G,J,S268 to deal/dealing K220 (dealing room) to decaffeinate/decaffeinating C92 to decant/decanting/decantation B81 to decontaminate/decontaminating E172 to decorate/decorating M229 to deep-freeze/deep-freezing C88 to defend/defence O (national defence, public order and safety) to degrease/degreasing C96 to de-humidify/de-humidification F178 to dehydrate/dehydrating B80/81 to deliver/delivering/delivery G,H201,I204,J,M,N,S to demolish/demolishing/demolition F176 to desalt/desalting B81,E168 to design/designing C108/128,G179,H201,J213/214,M225/228/229,N238,(R258 as noun)
to desulphur/desulphurization B81 to determine/determination M229,Q257(eligibility) to detonate/detonation E172 to develop/developing/development A,B80,F,J209,L,M227 to dig/digging B83,F176 to dilute/dilution E168 (as an example of a process) to dip/dipping C96 (yarns) to disinfect/disinfecting N238/239 to dismantle/dismantling B84,C165,E171,F178,G187 to dispose/disposing /disposal E168/169/170,N239 to disseminate/disseminating/dissemination S (ideas) to distill/distilling C94/108/109 to distribute/distribution D,E,G,H,J,K,M,N241/242,O245 to dock/docking H198 to document/documenting/documentation R258 to download/downloading G to draft/drafting M225 to draw/drawing C85/121/137 to drain/draining/drainage B81/84,E,F176 to dredge/dredging B82/83,F175
229
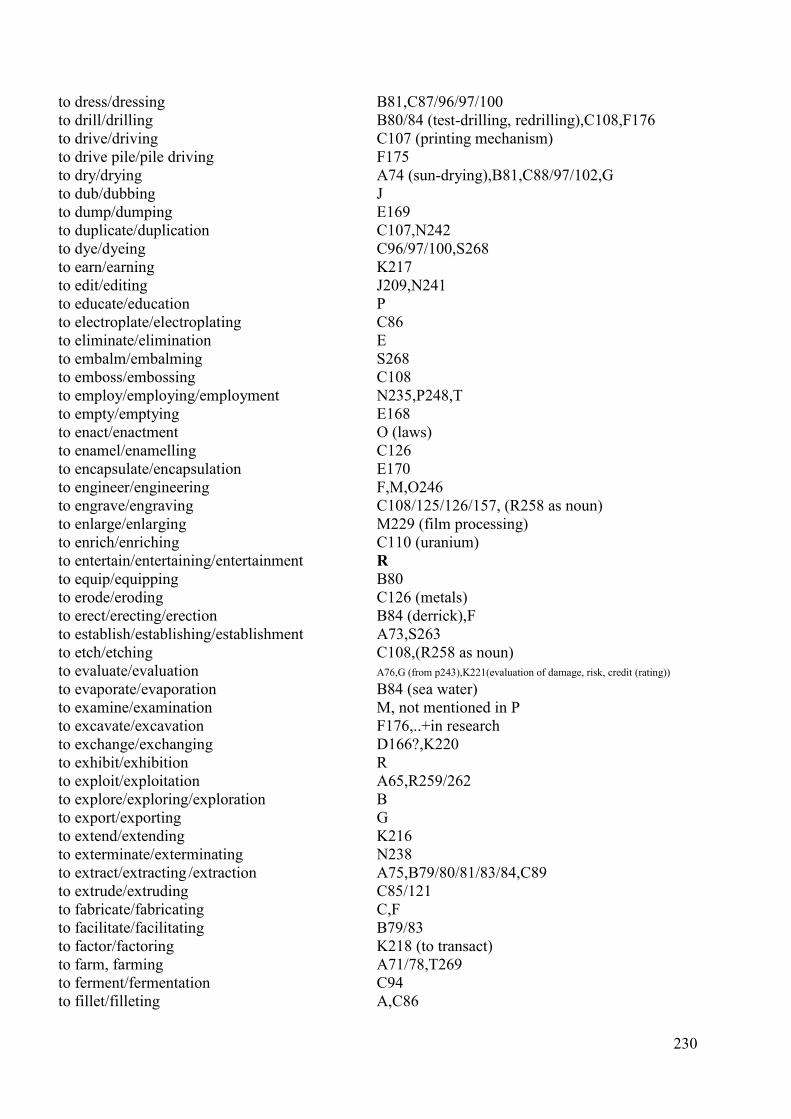
to dress/dressing B81,C87/96/97/100 to drill/drilling B80/84 (test-drilling, redrilling),C108,F176 to drive/driving C107 (printing mechanism) to drive pile/pile driving F175 to dry/drying A74 (sun-drying),B81,C88/97/102,G to dub/dubbing J to dump/dumping E169 to duplicate/duplication C107,N242 to dye/dyeing C96/97/100,S268 to earn/earning K217 to edit/editing J209,N241 to educate/education P to electroplate/electroplating C86 to eliminate/elimination E to embalm/embalming S268 to emboss/embossing C108 to employ/employing/employment N235,P248,T to empty/emptying E168 to enact/enactment O (laws) to enamel/enamelling C126 to encapsulate/encapsulation E170 to engineer/engineering F,M,O246 to engrave/engraving C108/125/126/157, (R258 as noun) to enlarge/enlarging M229 (film processing) to enrich/enriching C110 (uranium) to entertain/entertaining/entertainment R to equip/equipping B80 to erode/eroding C126 (metals) to erect/erecting/erection B84 (derrick),F to establish/establishing/establishment A73,S263 to etch/etching C108,(R258 as noun) to evaluate/evaluation A76,G (from p243),K221(evaluation of damage, risk, credit (rating))
to evaporate/evaporation B84 (sea water) to examine/examination M, not mentioned in P to excavate/excavation F176,..+in research to exchange/exchanging D166?,K220 to exhibit/exhibition R to exploit/exploitation A65,R259/262 to explore/exploring /exploration B to export/exporting G to extend/extending K216 to exterminate/exterminating N238 to extract/extracting /extraction A75,B79/80/81/83/84,C89 to extrude/extruding C85/121 to fabricate/fabricating C,F to facilitate/facilitating B79/83 to factor/factoring K218 (to transact) to farm, farming A71/78,T269 to ferment/fermentation C94 to fillet/filleting A,C86
230
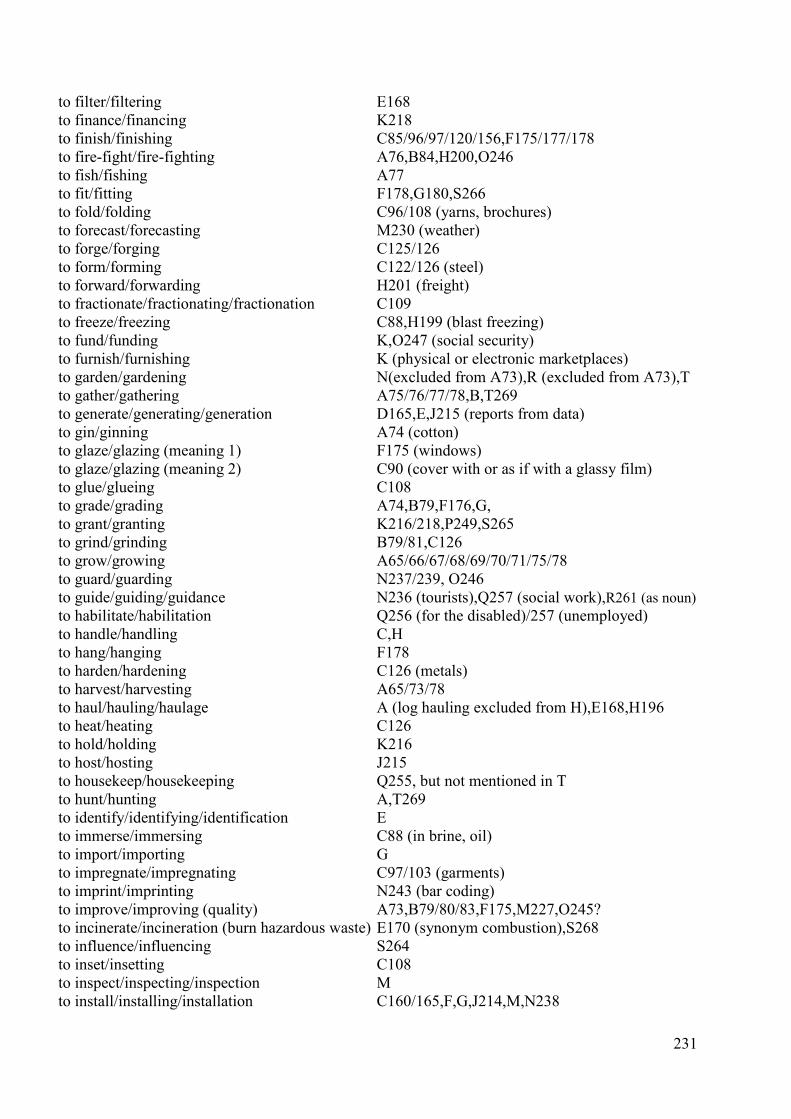
to filter/filtering E168 to finance/financing K218 to finish/finishing C85/96/97/120/156,F175/177/178 to fire-fight/fire-fighting A76,B84,H200,O246 to fish/fishing A77 to fit/fitting F178,G180,S266 to fold/folding C96/108 (yarns, brochures) to forecast/forecasting M230 (weather) to forge/forging C125/126 to form/forming C122/126 (steel) to forward/forwarding H201 (freight) to fractionate/fractionating/fractionation C109 to freeze/freezing C88,H199 (blast freezing) to fund/funding K,O247 (social security) to furnish/furnishing K (physical or electronic marketplaces) to garden/gardening N(excluded from A73),R (excluded from A73),T to gather/gathering A75/76/77/78,B,T269 to generate/generating/generation D165,E,J215 (reports from data) to gin/ginning A74 (cotton) to glaze/glazing (meaning 1) F175 (windows) to glaze/glazing (meaning 2) C90 (cover with or as if with a glassy film) to glue/glueing C108 to grade/grading A74,B79,F176,G, to grant/granting K216/218,P249,S265 to grind/grinding B79/81,C126 to grow/growing A65/66/67/68/69/70/71/75/78 to guard/guarding N237/239, O246 to guide/guiding/guidance N236 (tourists),Q257 (social work),R261 (as noun) to habilitate/habilitation Q256 (for the disabled)/257 (unemployed) to handle/handling C,H to hang/hanging F178 to harden/hardening C126 (metals) to harvest/harvesting A65/73/78 to haul/hauling/haulage A (log hauling excluded from H),E168,H196 to heat/heating C126 to hold/holding K216 to host/hosting J215 to housekeep/housekeeping Q255, but not mentioned in T to hunt/hunting A,T269 to identify/identifying/identification E to immerse/immersing C88 (in brine, oil) to import/importing G to impregnate/impregnating C97/103 (garments) to imprint/imprinting N243 (bar coding) to improve/improving (quality) A73,B79/80/83,F175,M227,O245? to incinerate/incineration (burn hazardous waste) E170 (synonym combustion),S268 to influence/influencing S264 to inset/insetting C108 to inspect/inspecting/inspection M to install/installing/installation C160/165,F,G,J214,M,N238
231
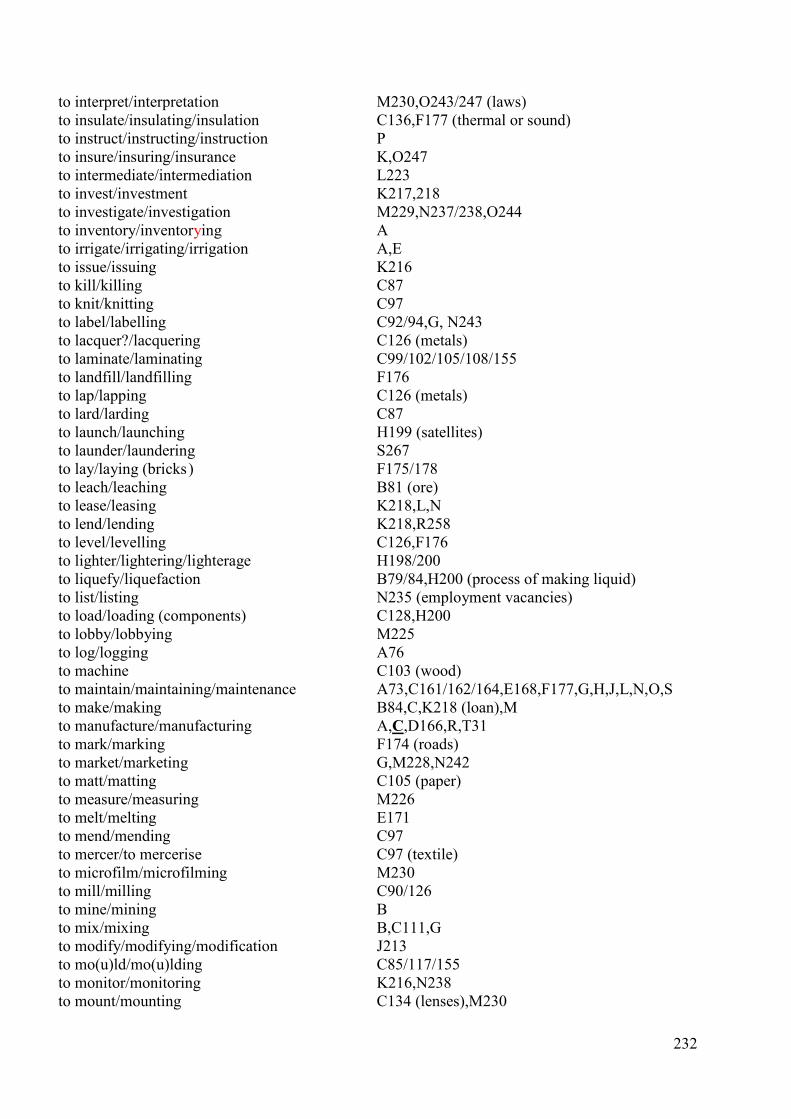
to interpret/interpretation M230,O243/247 (laws) to insulate/insulating/insulation C136,F177 (thermal or sound) to instruct/instructing/instruction P to insure/insuring/insurance K,O247 to intermediate/intermediation L223 to invest/investment K217,218 to investigate/investigation M229,N237/238,O244 to inventory/inventorying A to irrigate/irrigating/irrigation A,E to issue/issuing K216 to kill/killing C87 to knit/knitting C97 to label/labelling C92/94,G, N243 to lacquer?/lacquering C126 (metals) to laminate/laminating C99/102/105/108/155 to landfill/landfilling F176 to lap/lapping C126 (metals) to lard/larding C87 to launch/launching H199 (satellites) to launder/laundering S267 to lay/laying (bricks ) F175/178 to leach/leaching B81 (ore) to lease/leasing K218,L,N to lend/lending K218,R258 to level/levelling C126,F176 to lighter/lightering/lighterage H198/200 to liquefy/liquefaction B79/84,H200 (process of making liquid) to list/listing N235 (employment vacancies) to load/loading (components) C128,H200 to lobby/lobbying M225 to log/logging A76 to machine C103 (wood) to maintain/maintaining/maintenance A73,C161/162/164,E168,F177,G,H,J,L,N,O,S to make/making B84,C,K218 (loan),M to manufacture/manufacturing A,C,D166,R,T31 to mark/marking F174 (roads) to market/marketing G,M228,N242 to matt/matting C105 (paper) to measure/measuring M226 to melt/melting E171 to mend/mending C97 to mercer/to mercerise C97 (textile) to microfilm/microfilming M230 to mill/milling C90/126 to mine/mining B to mix/mixing B,C111,G to modify/modifying/modification J213 to mo(u)ld/mo(u)lding C85/117/155 to monitor/monitoring K216,N238 to mount/mounting C134 (lenses),M230
232
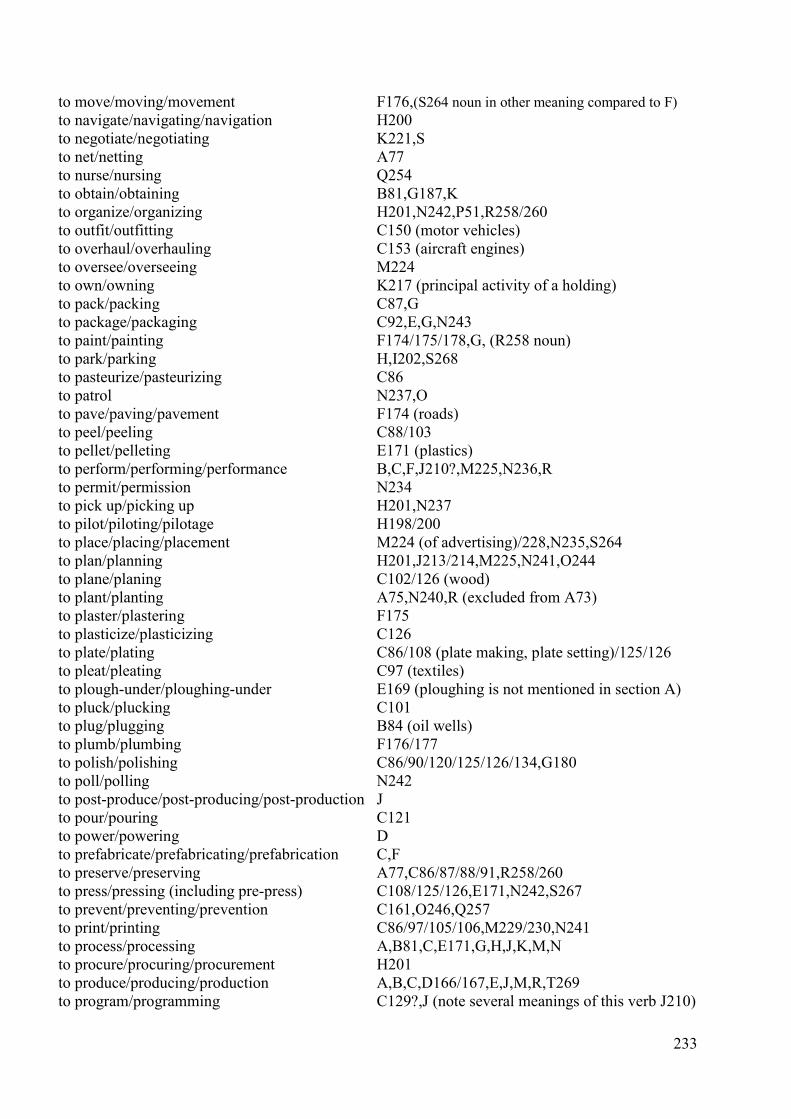
to move/moving/movement F176,(S264 noun in other meaning compared to F) to navigate/navigating/navigation H200 to negotiate/negotiating K221,S to net/netting A77 to nurse/nursing Q254 to obtain/obtaining B81,G187,K to organize/organizing H201,N242,P51,R258/260 to outfit/outfitting C150 (motor vehicles) to overhaul/overhauling C153 (aircraft engines) to oversee/overseeing M224 to own/owning K217 (principal activity of a holding) to pack/packing C87,G to package/packaging C92,E,G,N243 to paint/painting F174/175/178,G, (R258 noun) to park/parking H,I202,S268 to pasteurize/pasteurizing C86 to patrol N237,O to pave/paving/pavement F174 (roads) to peel/peeling C88/103 to pellet/pelleting E171 (plastics) to perform/performing/performance B,C,F,J210?,M225,N236,R to permit/permission N234 to pick up/picking up H201,N237 to pilot/piloting/pilotage H198/200 to place/placing/placement M224 (of advertising)/228,N235,S264 to plan/planning H201,J213/214,M225,N241,O244 to plane/planing C102/126 (wood) to plant/planting A75,N240,R (excluded from A73) to plaster/plastering F175 to plasticize/plasticizing C126 to plate/plating C86/108 (plate making, plate setting)/125/126 to pleat/pleating C97 (textiles) to plough-under/ploughing-under E169 (ploughing is not mentioned in section A) to pluck/plucking C101 to plug/plugging B84 (oil wells) to plumb/plumbing F176/177 to polish/polishing C86/90/120/125/126/134,G180 to poll/polling N242 to post-produce/post-producing/post-production J to pour/pouring C121 to power/powering D to prefabricate/prefabricating/prefabrication C,F to preserve/preserving A77,C86/87/88/91,R258/260 to press/pressing (including pre-press) C108/125/126,E171,N242,S267 to prevent/preventing/prevention C161,O246,Q257 to print/printing C86/97/105/106,M229/230,N241 to process/processing A,B81,C,E171,G,H,J,K,M,N to procure/procuring/procurement H201 to produce/producing/production A,B,C,D166/167,E,J,M,R,T269 to program/programming C129?,J (note several meanings of this verb J210)
233
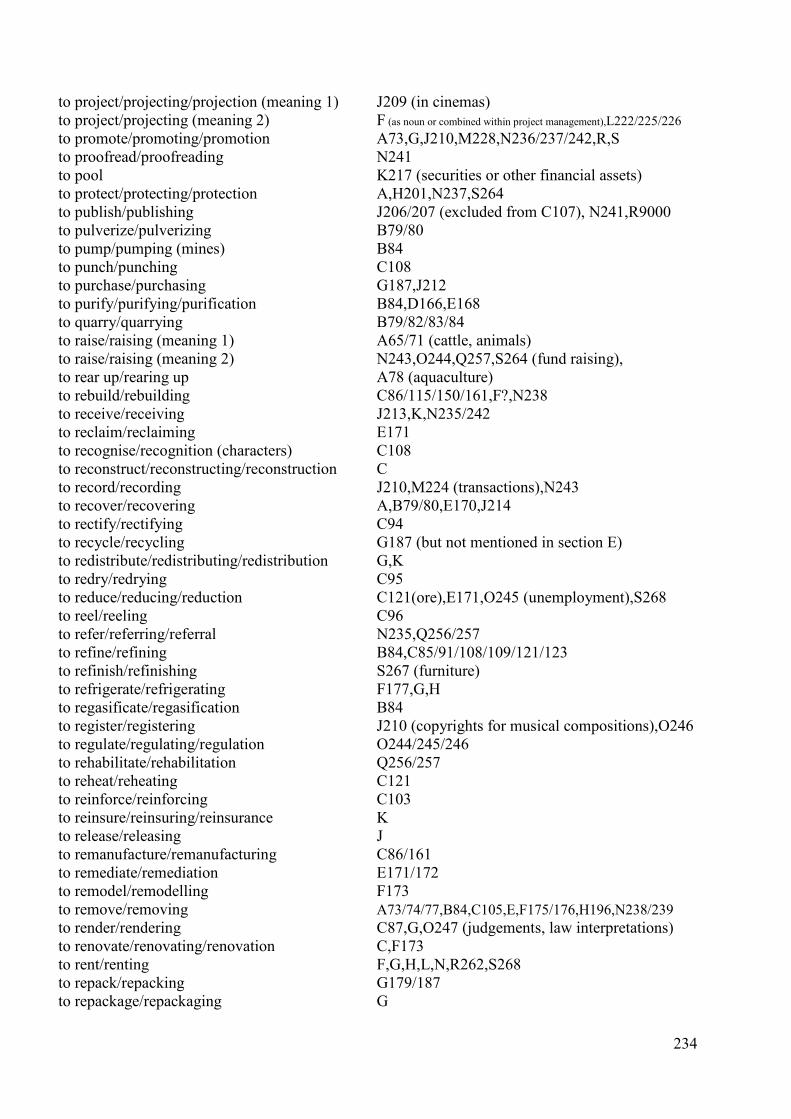
to project/projecting/projection (meaning 1) J209 (in cinemas) to project/projecting (meaning 2) F (as noun or combined within project management),L222/225/226
to promote/promoting/promotion A73,G,J210,M228,N236/237/242,R,S to proofread/proofreading N241 to pool K217 (securities or other financial assets) to protect/protecting/protection A,H201,N237,S264 to publish/publishing J206/207 (excluded from C107), N241,R9000 to pulverize/pulverizing B79/80 to pump/pumping (mines) B84 to punch/punching C108 to purchase/purchasing G187,J212 to purify/purifying/purification B84,D166,E168 to quarry/quarrying B79/82/83/84 to raise/raising (meaning 1) A65/71 (cattle, animals) to raise/raising (meaning 2) N243,O244,Q257,S264 (fund raising), to rear up/rearing up A78 (aquaculture) to rebuild/rebuilding C86/115/150/161,F?,N238 to receive/receiving J213,K,N235/242 to reclaim/reclaiming E171 to recognise/recognition (characters) C108 to reconstruct/reconstructing/reconstruction C to record/recording J210,M224 (transactions),N243 to recover/recovering A,B79/80,E170,J214 to rectify/rectifying C94 to recycle/recycling G187 (but not mentioned in section E) to redistribute/redistributing/redistribution G,K to redry/redrying C95 to reduce/reducing/reduction C121(ore),E171,O245 (unemployment),S268 to reel/reeling C96 to refer/referring/referral N235,Q256/257 to refine/refining B84,C85/91/108/109/121/123 to refinish/refinishing S267 (furniture) to refrigerate/refrigerating F177,G,H to regasificate/regasification B84 to register/registering J210 (copyrights for musical compositions),O246 to regulate/regulating/regulation O244/245/246 to rehabilitate/rehabilitation Q256/257 to reheat/reheating C121 to reinforce/reinforcing C103 to reinsure/reinsuring/reinsurance K to release/releasing J to remanufacture/remanufacturing C86/161 to remediate/remediation E171/172 to remodel/remodelling F173 to remove/removing A73/74/77,B84,C105,E,F175/176,H196,N238/239 to render/rendering C87,G,O247 (judgements, law interpretations) to renovate/renovating/renovation C,F173 to rent/renting F,G,H,L,N,R262,S268 to repack/repacking G179/187 to repackage/repackaging G
234
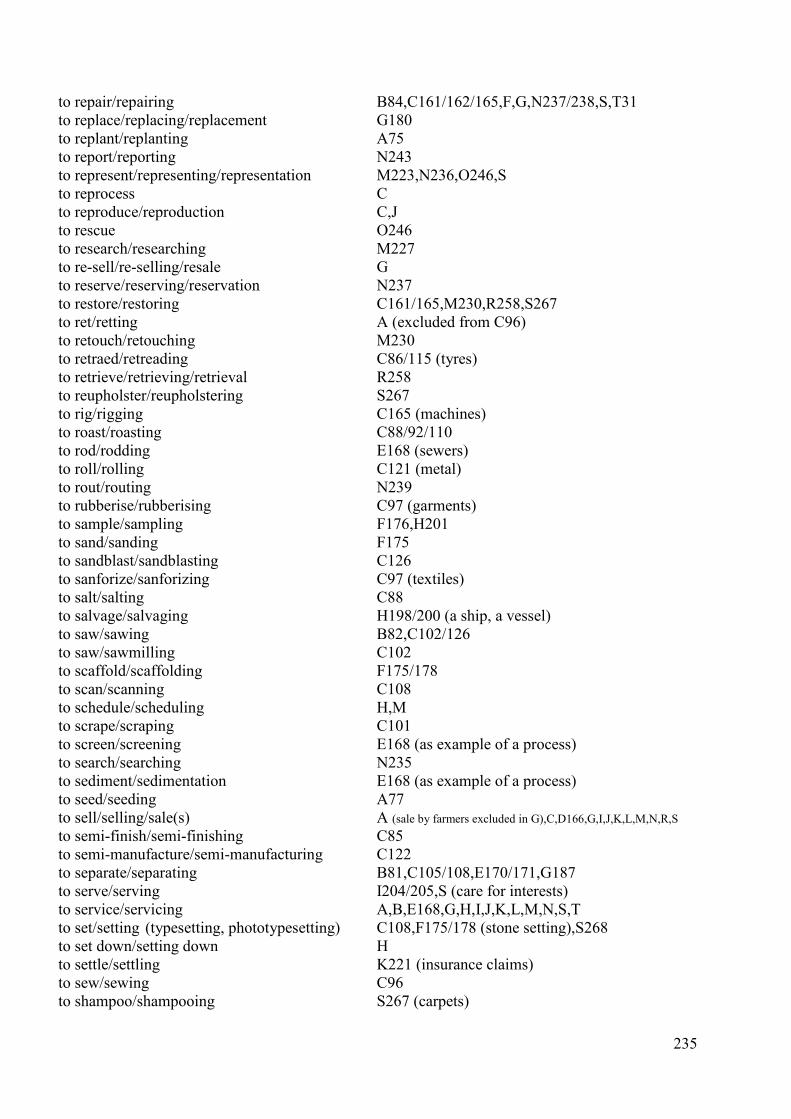
to repair/repairing B84,C161/162/165,F,G,N237/238,S,T31 to replace/replacing/replacement G180 to replant/replanting A75 to report/reporting N243 to represent/representing/representation M223,N236,O246,S to reprocess C to reproduce/reproduction C,J to rescue O246 to research/researching M227 to re-sell/re-selling/resale G to reserve/reserving/reservation N237 to restore/restoring C161/165,M230,R258,S267 to ret/retting A (excluded from C96) to retouch/retouching M230 to retraed/retreading C86/115 (tyres) to retrieve/retrieving/retrieval R258 to reupholster/reupholstering S267 to rig/rigging C165 (machines) to roast/roasting C88/92/110 to rod/rodding E168 (sewers) to roll/rolling C121 (metal) to rout/routing N239 to rubberise/rubberising C97 (garments) to sample/sampling F176,H201 to sand/sanding F175 to sandblast/sandblasting C126 to sanforize/sanforizing C97 (textiles) to salt/salting C88 to salvage/salvaging H198/200 (a ship, a vessel) to saw/sawing B82,C102/126 to saw/sawmilling C102 to scaffold/scaffolding F175/178 to scan/scanning C108 to schedule/scheduling H,M to scrape/scraping C101 to screen/screening E168 (as example of a process) to search/searching N235 to sediment/sedimentation E168 (as example of a process) to seed/seeding A77 to sell/selling/sale(s) A (sale by farmers excluded in G),C,D166,G,I,J,K,L,M,N,R,S to semi-finish/semi-finishing C85 to semi-manufacture/semi-manufacturing C122 to separate/separating B81,C105/108,E170/171,G187 to serve/serving I204/205,S (care for interests) to service/servicing A,B,E168,G,H,I,J,K,L,M,N,S,T to set/setting (typesetting, phototypesetting) C108,F175/178 (stone setting),S268 to set down/setting down H to settle/settling K221 (insurance claims) to sew/sewing C96 to shampoo/shampooing S267 (carpets)
235

to shape/shaping C102/105/120 to sharpen/sharpening C120/126/162 to shave/shaving S268 to shear/shearing A73,C101 to sheath/sheathing/sheathed C99 to ship/shipment G181 to shred/shredding E171 (plastic) to shrink/shrinking C97 to shuck/shucking C to shunt/shunting H200 (land transport) to sink/sinking C108 (die-sinking),F178 (shaft sinking (column)) to sinter/sintering B81,C126 to size/sizing B79 to slaughter/slaughtering C87 to slice/slicing C103 to smelt/smelting C121,123 to smoke/smoking C88 to solicit/soliciting K221 (annuities, policies) to sort/sorting (including presorting) B79,E168/170/171,G,H201,N243 to spin/spinning C96 to splice/splicing (metalwork, fibre) C126 (not mentioned in F) to sponsor/sponsoring O245 to spray/spraying A73 (crop),C140,G (motor vehicles) to stabilize/stabilization B81 to stamp/stamping C108/126,N243 to steam/steaming C97 to stem/stemming C95 to sterilize/sterilization Q252/253 to stevedore/stevedoring (ship cargo) H200 to stitch/stitching C108 to store/storing/storage A74,B79/83,E170,G,H,R258 to straighten/straightening S268 (hairdressing) to strip/stripping G187 to subcontract/subcontracting F,M to subdivide/subdividing/subdivision F175,L222 to subtitle/subtitling J209 to supervise/supervising/supervision K216 (central banking)/220,O244,Q,S to supply/supplying /supplement D166,E,J,N235/236,O to support/supporting A,F,H201,J213/214,K,N,O246,R260,S to survey/surveying M225 to swab/swabbing B84 (oil & gas wells) to sweep/sweeping N238/239 to switch/switching H200 to tailor/tailoring C99 to take deposit/deposit-taking K216 to tan/tanning C101 (leather) to tax/taxing/taxation O243/244 (imposition, collection, estimate) to teach/teaching P (p244 excluded from O),T270 to terminate/termination Q252/253 to test/testing A73,J213,M225
236
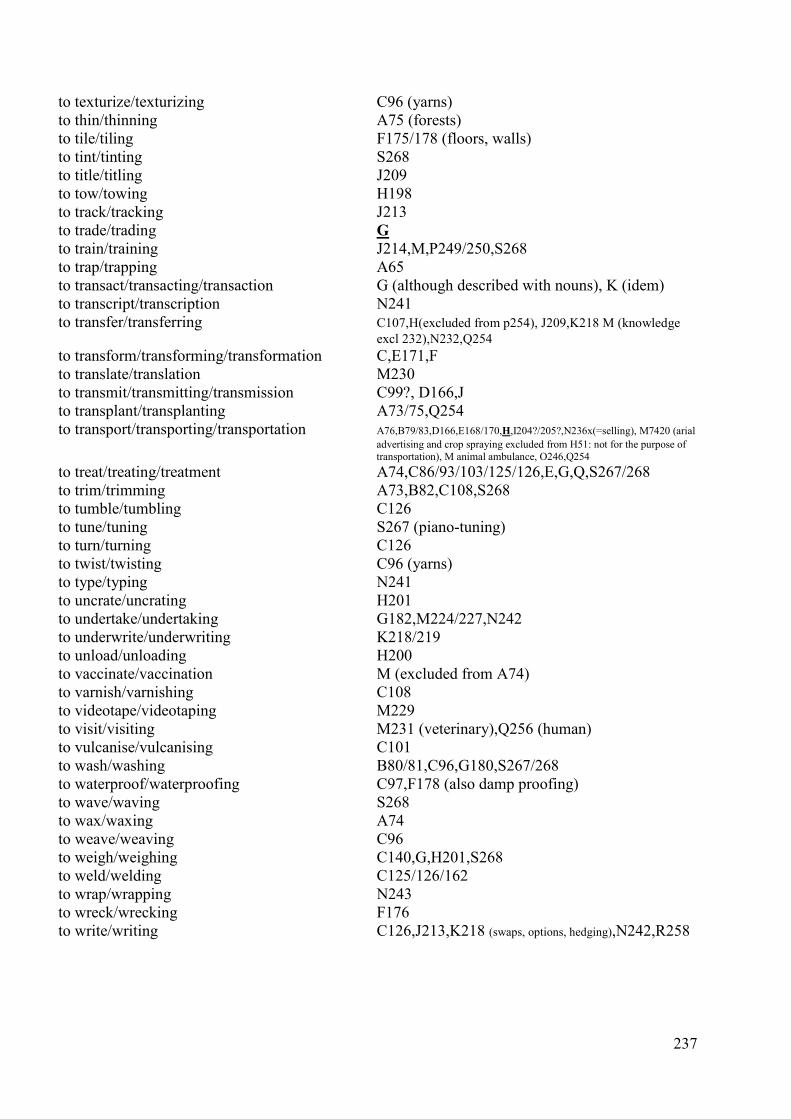
to texturize/texturizing C96 (yarns) to thin/thinning A75 (forests) to tile/tiling F175/178 (floors, walls) to tint/tinting S268 to title/titling J209 to tow/towing H198 to track/tracking J213 to trade/trading G to train/training J214,M,P249/250,S268 to trap/trapping A65 to transact/transacting/transaction G (although described with nouns), K (idem) to transcript/transcription N241 to transfer/transferring C107,H(excluded from p254), J209,K218 M (knowledge
excl 232),N232,Q254 to transform/transforming/transformation C,E171,F to translate/translation M230 to transmit/transmitting/transmission C99?, D166,J to transplant/transplanting A73/75,Q254 to transport/transporting/transportation A76,B79/83,D166,E168/170,H,I204?/205?,N236x(=selling), M7420 (arial
advertising and crop spraying excluded from H51: not for the purpose of transportation), M animal ambulance, O246,Q254
to treat/treating/treatment A74,C86/93/103/125/126,E,G,Q,S267/268 to trim/trimming A73,B82,C108,S268 to tumble/tumbling C126 to tune/tuning S267 (piano-tuning) to turn/turning C126 to twist/twisting C96 (yarns) to type/typing N241 to uncrate/uncrating H201 to undertake/undertaking G182,M224/227,N242 to underwrite/underwriting K218/219 to unload/unloading H200 to vaccinate/vaccination M (excluded from A74) to varnish/varnishing C108 to videotape/videotaping M229 to visit/visiting M231 (veterinary),Q256 (human) to vulcanise/vulcanising C101 to wash/washing B80/81,C96,G180,S267/268 to waterproof/waterproofing C97,F178 (also damp proofing) to wave/waving S268 to wax/waxing A74 to weave/weaving C96 to weigh/weighing C140,G,H201,S268 to weld/welding C125/126/162 to wrap/wrapping N243 to wreck/wrecking F176 to write/writing C126,J213,K218 (swaps, options, hedging),N242,R258
237
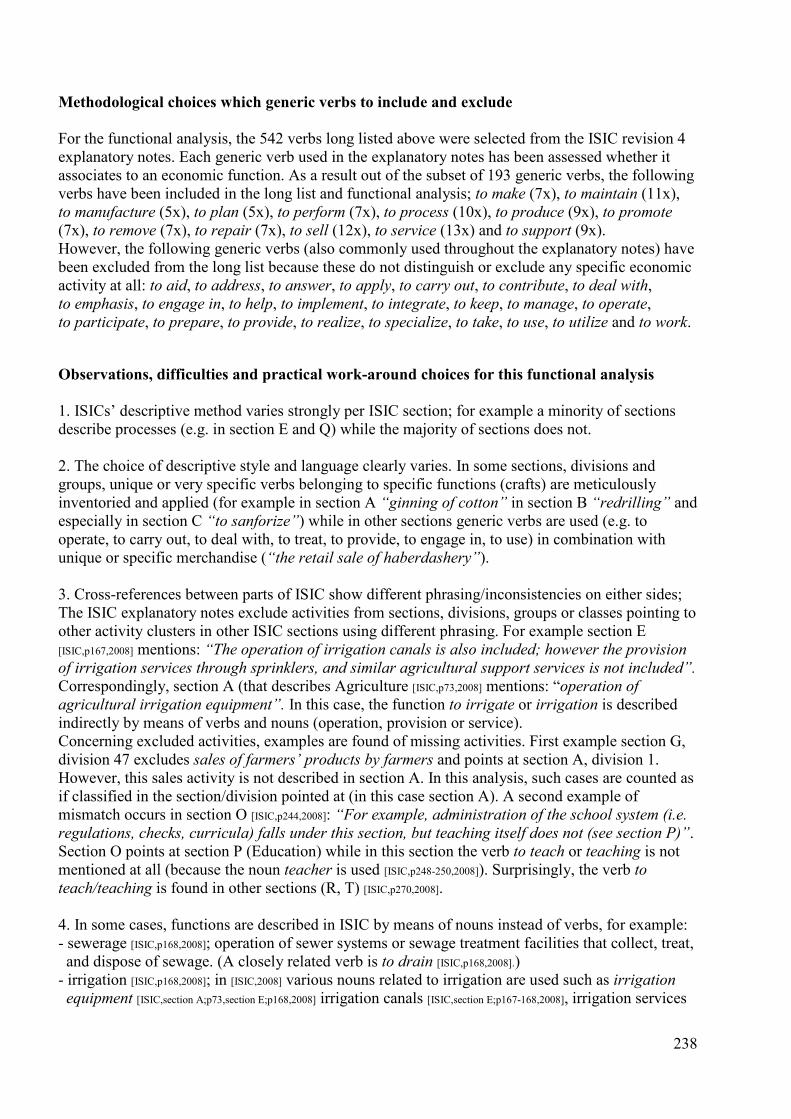
Methodological choices which generic verbs to include and exclude For the functional analysis, the 542 verbs long listed above were selected from the ISIC revision 4 explanatory notes. Each generic verb used in the explanatory notes has been assessed whether it associates to an economic function. As a result out of the subset of 193 generic verbs, the following verbs have been included in the long list and functional analysis; to make (7x), to maintain (11x), to manufacture (5x), to plan (5x), to perform (7x), to process (10x), to produce (9x), to promote (7x), to remove (7x), to repair (7x), to sell (12x), to service (13x) and to support (9x). However, the following generic verbs (also commonly used throughout the explanatory notes) have been excluded from the long list because these do not distinguish or exclude any specific economic activity at all: to aid, to address, to answer, to apply, to carry out, to contribute, to deal with, to emphasis, to engage in, to help, to implement, to integrate, to keep, to manage, to operate, to participate, to prepare, to provide, to realize, to specialize, to take, to use, to utilize and to work. Observations, difficulties and practical work-around choices for this functional analysis 1. ISICs’ descriptive method varies strongly per ISIC section; for example a minority of sections describe processes (e.g. in section E and Q) while the majority of sections does not. 2. The choice of descriptive style and language clearly varies. In some sections, divisions and groups, unique or very specific verbs belonging to specific functions (crafts) are meticulously inventoried and applied (for example in section A “ginning of cotton” in section B “redrilling” and especially in section C “to sanforize”) while in other sections generic verbs are used (e.g. to operate, to carry out, to deal with, to treat, to provide, to engage in, to use) in combination with unique or specific merchandise (“the retail sale of haberdashery”). 3. Cross-references between parts of ISIC show different phrasing/inconsistencies on either sides; The ISIC explanatory notes exclude activities from sections, divisions, groups or classes pointing to other activity clusters in other ISIC sections using different phrasing. For example section E [ISIC,p167,2008] mentions: “The operation of irrigation canals is also included; however the provision of irrigation services through sprinklers, and similar agricultural support services is not included”. Correspondingly, section A (that describes Agriculture [ISIC,p73,2008] mentions: “operation of agricultural irrigation equipment”. In this case, the function to irrigate or irrigation is described indirectly by means of verbs and nouns (operation, provision or service). Concerning excluded activities, examples are found of missing activities. First example section G, division 47 excludes sales of farmers’ products by farmers and points at section A, division 1. However, this sales activity is not described in section A. In this analysis, such cases are counted as if classified in the section/division pointed at (in this case section A). A second example of mismatch occurs in section O [ISIC,p244,2008]: “For example, administration of the school system (i.e. regulations, checks, curricula) falls under this section, but teaching itself does not (see section P)”. Section O points at section P (Education) while in this section the verb to teach or teaching is not mentioned at all (because the noun teacher is used [ISIC,p248-250,2008]). Surprisingly, the verb to teach/teaching is found in other sections (R, T) [ISIC,p270,2008]. 4. In some cases, functions are described in ISIC by means of nouns instead of verbs, for example: - sewerage [ISIC,p168,2008]; operation of sewer systems or sewage treatment facilities that collect, treat, and dispose of sewage. (A closely related verb is to drain [ISIC,p168,2008].) - irrigation [ISIC,p168,2008]; in [ISIC,2008] various nouns related to irrigation are used such as irrigation equipment [ISIC,section A;p73,section E;p168,2008] irrigation canals [ISIC,section E;p167-168,2008], irrigation services
238
[ISIC,section E;p167,2008], irrigation systems [ISIC,section F;p172-174,2008] but the verb to irrigate is not used at all. - phrasing such as: activities of <noun>, activities involved in <noun>, <noun> activities, services of <noun>, <noun>service activities, engaging in <noun>, management of <noun> or provision of <noun>. 5. When two or more verbs are mentioned (next to each other) which could be synonyms, all are included in this thesis’ functional analysis because these can appear separately elsewhere in the ISIC explanatory notes and can have different meanings in other ISIC categories. For example about the employment activities division 78 [ISIC,p235,2008] states: “This division includes activities of listing employment vacancies and referring or placing applicants for employment, when the individuals referred or placed are not employees of the employment agencies”. 6. In exceptional cases, a verb clearly has two (or more) different meanings. For example to cast iron and steel in section C and to cast artists in section N. In this case the verb is mentioned twice and counted twice in this thesis’ functional analysis. 7. In one case* an activity was found that seems to be classified twice [ISIC,section O,class 8421,p246,2008] and [ISIC,section U,class 9900,p270,2008]. Class 8421 “Foreign affairs” mentions: “This class includes: administration and operation of the ministry of foreign affairs and diplomatic and consular missions stationed abroad or at offices of international organizations.” Class 9900 “Activities of extraterritorial organizations and bodies” mentions: “This class also includes: activities of diplomatic and consular missions when being determined by the country of their location rather than by the country they represent”. In the ISIC rev.4 explanatory notes examples of verbs can be observed which are mentioned in one section but are not mentioned in another section where these evidently belong. For example the verb to recycle only appears once in section G (trade) while it is also a core activity classified in section E (remediation of waste). The verb to deal only appears in the section K (finance) while it also belongs in section G (trade). (*) Regarding this observation a correction of the ISIC explanatory notes is recommended.
239
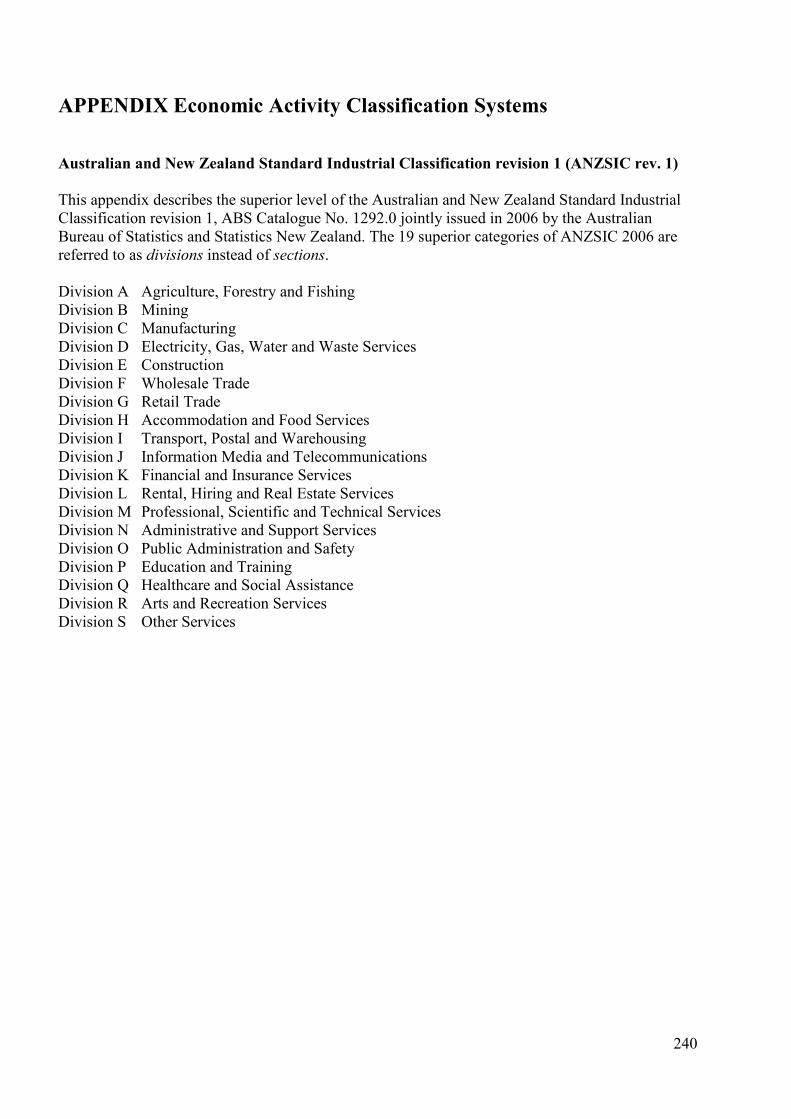
APPENDIX Economic Activity Classification Systems Australian and New Zealand Standard Industrial Classification revision 1 (ANZSIC rev. 1) This appendix describes the superior level of the Australian and New Zealand Standard Industrial Classification revision 1, ABS Catalogue No. 1292.0 jointly issued in 2006 by the Australian Bureau of Statistics and Statistics New Zealand. The 19 superior categories of ANZSIC 2006 are referred to as divisions instead of sections. Division A Agriculture, Forestry and Fishing Division B Mining Division C Manufacturing Division D Electricity, Gas, Water and Waste Services Division E Construction Division F Wholesale Trade Division G Retail Trade Division H Accommodation and Food Services Division I Transport, Postal and Warehousing Division J Information Media and Telecommunications Division K Financial and Insurance Services Division L Rental, Hiring and Real Estate Services Division M Professional, Scientific and Technical Services Division N Administrative and Support Services Division O Public Administration and Safety Division P Education and Training Division Q Healthcare and Social Assistance Division R Arts and Recreation Services Division S Other Services
240
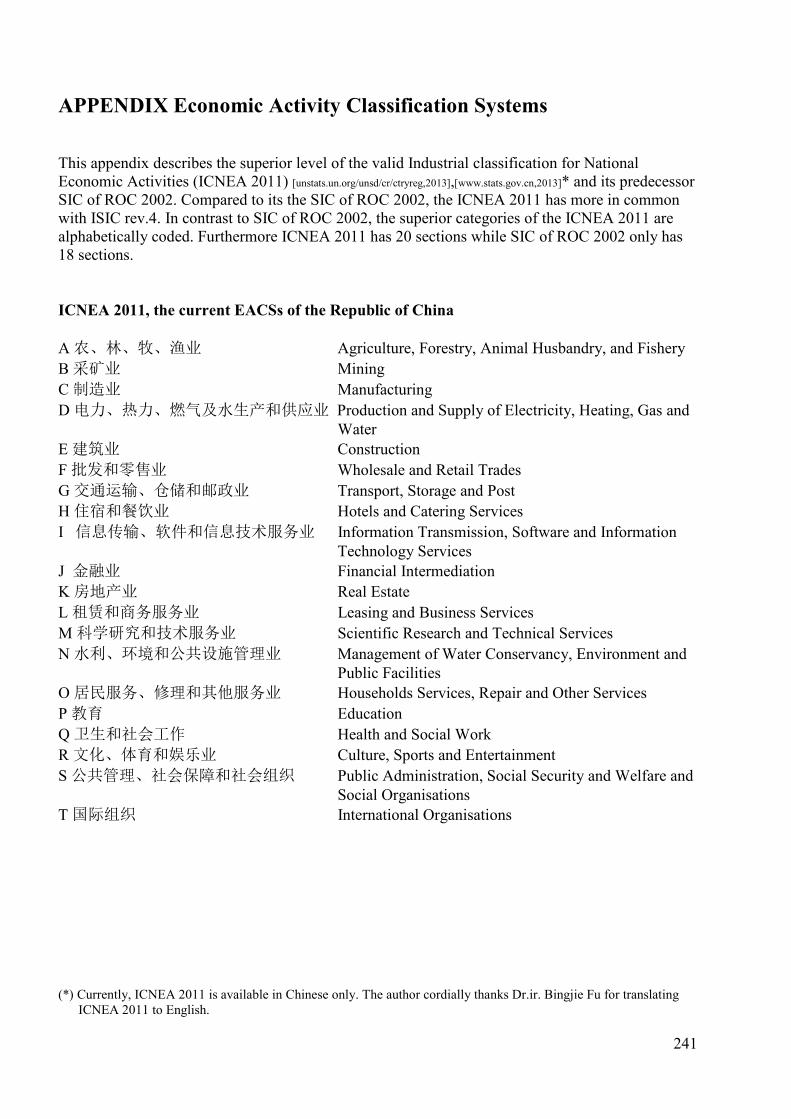
APPENDIX Economic Activity Classification Systems This appendix describes the superior level of the valid Industrial classification for National Economic Activities (ICNEA 2011) [unstats.un.org/unsd/cr/ctryreg,2013],[www.stats.gov.cn,2013]* and its predecessor SIC of ROC 2002. Compared to its the SIC of ROC 2002, the ICNEA 2011 has more in common with ISIC rev.4. In contrast to SIC of ROC 2002, the superior categories of the ICNEA 2011 are alphabetically coded. Furthermore ICNEA 2011 has 20 sections while SIC of ROC 2002 only has 18 sections. ICNEA 2011, the current EACSs of the Republic of China A 农、林、牧、渔业 Agriculture, Forestry, Animal Husbandry, and Fishery B 采矿业 Mining C 制造业 Manufacturing D 电力、热力、燃气及水生产和供应业 Production and Supply of Electricity, Heating, Gas and Water E 建筑业 Construction F 批发和零售业 Wholesale and Retail Trades G 交通运输、仓储和邮政业 Transport, Storage and Post H 住宿和餐饮业 Hotels and Catering Services I 信息传输、软件和信息技术服务业 Information Transmission, Software and Information Technology Services J 金融业 Financial Intermediation K 房地产业 Real Estate L 租赁和商务服务业 Leasing and Business Services M 科学研究和技术服务业 Scientific Research and Technical Services N 水利、环境和公共设施管理业 Management of Water Conservancy, Environment and Public Facilities O 居民服务、修理和其他服务业 Households Services, Repair and Other Services P 教育 Education Q 卫生和社会工作 Health and Social Work R 文化、体育和娱乐业 Culture, Sports and Entertainment S 公共管理、社会保障和社会组织 Public Administration, Social Security and Welfare and Social Organisations T 国际组织 International Organisations (*) Currently, ICNEA 2011 is available in Chinese only. The author cordially thanks Dr.ir. Bingjie Fu for translating ICNEA 2011 to English.
241
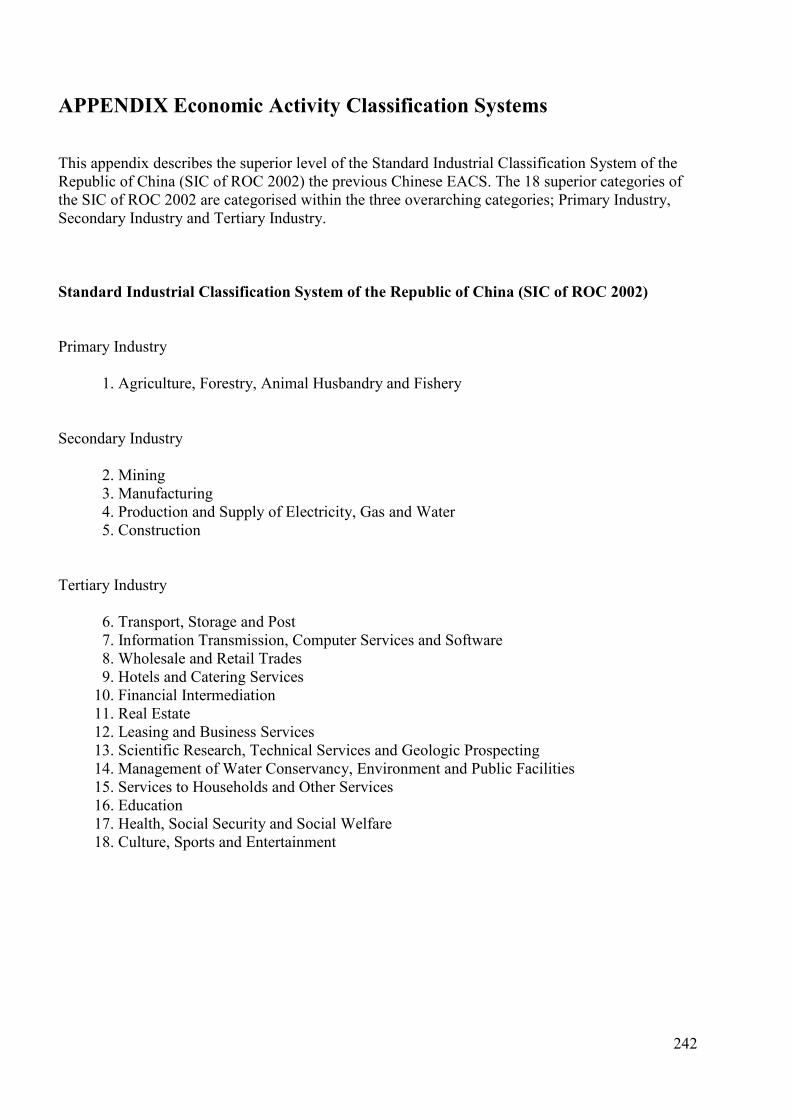
APPENDIX Economic Activity Classification Systems This appendix describes the superior level of the Standard Industrial Classification System of the Republic of China (SIC of ROC 2002) the previous Chinese EACS. The 18 superior categories of the SIC of ROC 2002 are categorised within the three overarching categories; Primary Industry, Secondary Industry and Tertiary Industry. Standard Industrial Classification System of the Republic of China (SIC of ROC 2002) Primary Industry 1. Agriculture, Forestry, Animal Husbandry and Fishery Secondary Industry 2. Mining 3. Manufacturing 4. Production and Supply of Electricity, Gas and Water 5. Construction Tertiary Industry 6. Transport, Storage and Post 7. Information Transmission, Computer Services and Software 8. Wholesale and Retail Trades 9. Hotels and Catering Services 10. Financial Intermediation 11. Real Estate 12. Leasing and Business Services 13. Scientific Research, Technical Services and Geologic Prospecting 14. Management of Water Conservancy, Environment and Public Facilities 15. Services to Households and Other Services 16. Education 17. Health, Social Security and Social Welfare 18. Culture, Sports and Entertainment
242
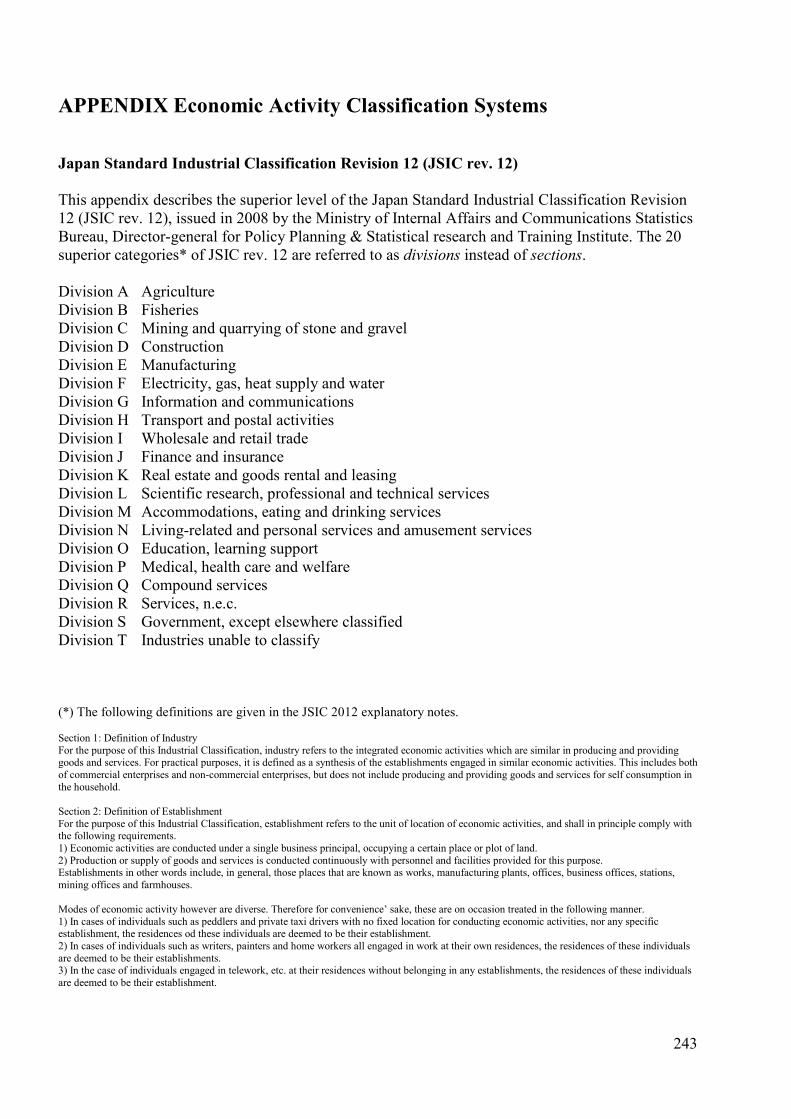
APPENDIX Economic Activity Classification Systems Japan Standard Industrial Classification Revision 12 (JSIC rev. 12) This appendix describes the superior level of the Japan Standard Industrial Classification Revision 12 (JSIC rev. 12), issued in 2008 by the Ministry of Internal Affairs and Communications Statistics Bureau, Director-general for Policy Planning & Statistical research and Training Institute. The 20 superior categories* of JSIC rev. 12 are referred to as divisions instead of sections. Division A Agriculture Division B Fisheries Division C Mining and quarrying of stone and gravel Division D Construction Division E Manufacturing Division F Electricity, gas, heat supply and water Division G Information and communications Division H Transport and postal activities Division I Wholesale and retail trade Division J Finance and insurance Division K Real estate and goods rental and leasing Division L Scientific research, professional and technical services Division M Accommodations, eating and drinking services Division N Living-related and personal services and amusement services Division O Education, learning support Division P Medical, health care and welfare Division Q Compound services Division R Services, n.e.c. Division S Government, except elsewhere classified Division T Industries unable to classify (*) The following definitions are given in the JSIC 2012 explanatory notes. Section 1: Definition of Industry For the purpose of this Industrial Classification, industry refers to the integrated economic activities which are similar in producing and providing goods and services. For practical purposes, it is defined as a synthesis of the establishments engaged in similar economic activities. This includes both of commercial enterprises and non-commercial enterprises, but does not include producing and providing goods and services for self consumption in the household. Section 2: Definition of Establishment For the purpose of this Industrial Classification, establishment refers to the unit of location of economic activities, and shall in principle comply with the following requirements. 1) Economic activities are conducted under a single business principal, occupying a certain place or plot of land. 2) Production or supply of goods and services is conducted continuously with personnel and facilities provided for this purpose. Establishments in other words include, in general, those places that are known as works, manufacturing plants, offices, business offices, stations, mining offices and farmhouses. Modes of economic activity however are diverse. Therefore for convenience’ sake, these are on occasion treated in the following manner. 1) In cases of individuals such as peddlers and private taxi drivers with no fixed location for conducting economic activities, nor any specific establishment, the residences od these individuals are deemed to be their establishment. 2) In cases of individuals such as writers, painters and home workers all engaged in work at their own residences, the residences of these individuals are deemed to be their establishments. 3) In the case of individuals engaged in telework, etc. at their residences without belonging in any establishments, the residences of these individuals are deemed to be their establishment.
243

APPENDIX Economic Activity Classification Systems North American Industry Classification System 2012 (NAICS 2012) This appendix describes the superior level of the North American Industry Classification System issued in 2012 by the United States Census Bureau [www.census.gov,2013]. The 20 superior categories of NAICS 2012 are referred to as sectors instead of sections and are identified by means of a two digit system instead of the more common alphabetical convention. NAICS 2012 comprises six digits in total. At most detailed level, the sixth digit of NAICS 2012 allows for classifying nation specific items (differing between the US, Canada and Mexico). Sector 11 Agriculture, Forestry, Fishing and Hunting Sector 21 Mining, Quarrying, and Oil and Gas Extraction Sector 22 Utilities Sector 23 Construction Sector 31-33 Manufacturing Sector 42 Wholesale Trade Sector 44-45 Retail Trade Sector 48-49 Transportation and Warehousing Sector 51 Information Sector 52 Finance and Insurance Sector 53 Real Estate and Rental and Leasing Sector 54 Professional, Scientific and Technical Services Sector 55 Management of Companies and Enterprises Sector 56 Administrative and Support and Waste Management and Remediation Services Sector 61 Educational Services Sector 62 Health Care and Social Assistance Sector 71 Arts, Entertainment and Recreation Sector 72 Accommodation and Food Services Sector 81 Other Services (except Public Administration) Sector 92 Public Administration
244
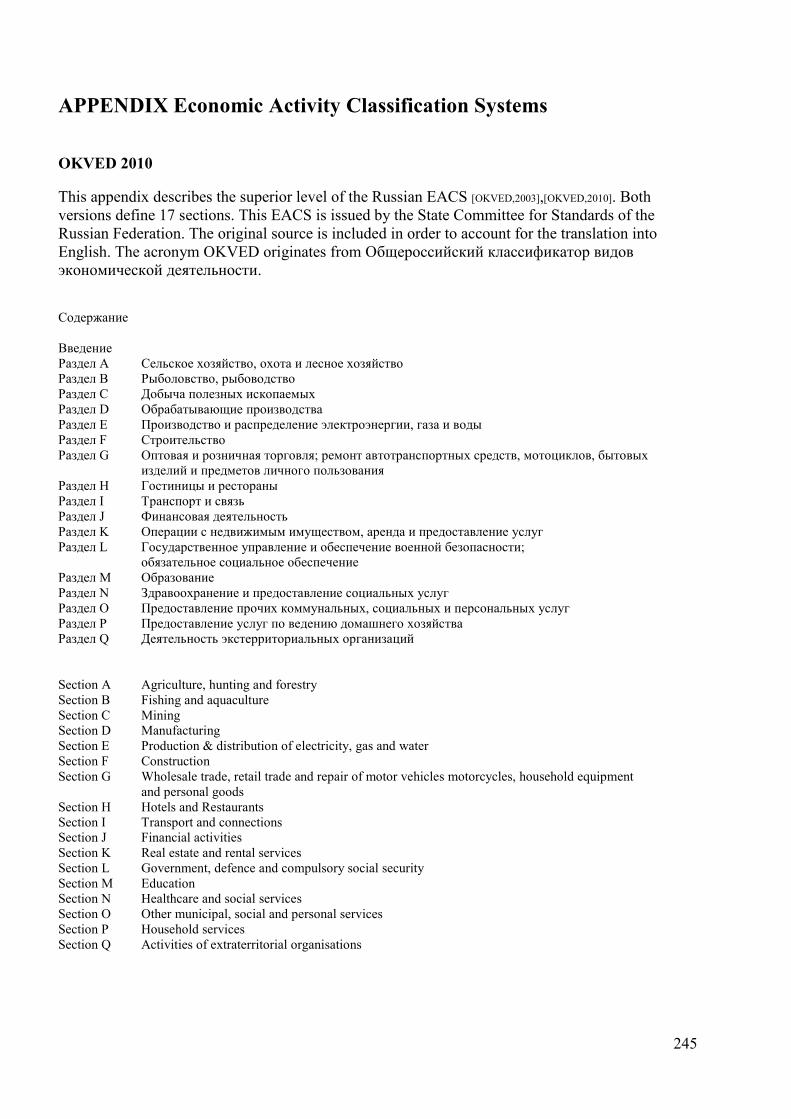
APPENDIX Economic Activity Classification Systems OKVED 2010 This appendix describes the superior level of the Russian EACS [OKVED,2003],[OKVED,2010]. Both versions define 17 sections. This EACS is issued by the State Committee for Standards of the Russian Federation. The original source is included in order to account for the translation into English. The acronym OKVED originates from Общероссийский классификатор видов экономической деятельности. Содержание Введение Раздел А Сельское хозяйство, охота и лесное хозяйство Раздел В Рыболовство, рыбоводство Раздел С Добыча полезных ископаемых Раздел D Обрабатывающие производства Раздел Е Производство и распределение электроэнергии, газа и воды Раздел F Строительство Раздел G Оптовая и розничная торговля; ремонт автотранспортных средств, мотоциклов, бытовых изделий и предметов личного пользования Раздел Н Гостиницы и рестораны Раздел I Транспорт и связь Раздел J Финансовая деятельность Раздел K Операции с недвижимым имуществом, аренда и предоставление услуг Раздел L Государственное управление и обеспечение военной безопасности; обязательное социальное обеспечение Раздел M Образование Раздел N Здравоохранение и предоставление социальных услуг Раздел O Предоставление прочих коммунальных, социальных и персональных услуг Раздел Р Предоставление услуг по ведению домашнего хозяйства Раздел Q Деятельность экстерриториальных организаций Section A Agriculture, hunting and forestry Section B Fishing and aquaculture Section C Mining Section D Manufacturing Section E Production & distribution of electricity, gas and water Section F Construction Section G Wholesale trade, retail trade and repair of motor vehicles motorcycles, household equipment and personal goods Section H Hotels and Restaurants Section I Transport and connections Section J Financial activities Section K Real estate and rental services Section L Government, defence and compulsory social security Section M Education Section N Healthcare and social services Section O Other municipal, social and personal services Section P Household services Section Q Activities of extraterritorial organisations
245
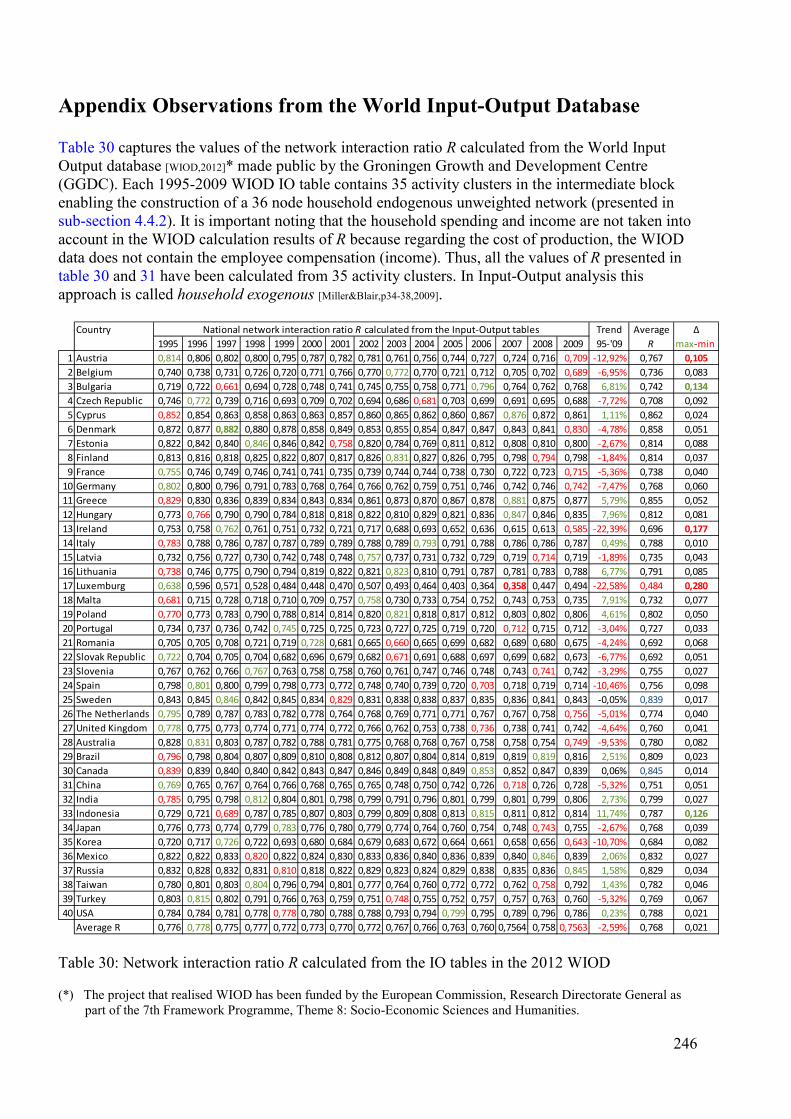
Appendix Observations from the World Input-Output Database Table 30 captures the values of the network interaction ratio R calculated from the World Input Output database [WIOD,2012]* made public by the Groningen Growth and Development Centre (GGDC). Each 1995-2009 WIOD IO table contains 35 activity clusters in the intermediate block enabling the construction of a 36 node household endogenous unweighted network (presented in sub-section 4.4.2). It is important noting that the household spending and income are not taken into account in the WIOD calculation results of R because regarding the cost of production, the WIOD data does not contain the employee compensation (income). Thus, all the values of R presented in table 30 and 31 have been calculated from 35 activity clusters. In Input-Output analysis this approach is called household exogenous [Miller&Blair,p34-38,2009].
Table 30: Network interaction ratio R calculated from the IO tables in the 2012 WIOD (*) The project that realised WIOD has been funded by the European Commission, Research Directorate General as part of the 7th Framework Programme, Theme 8: Socio-Economic Sciences and Humanities.
Country Trend Average ∆1995 1996 1997 1998 1999 2000 2001 2002 2003 2004 2005 2006 2007 2008 2009 95-'09 R max-min
1 Austria 0,814 0,806 0,802 0,800 0,795 0,787 0,782 0,781 0,761 0,756 0,744 0,727 0,724 0,716 0,709 -12,92% 0,767 0,1052 Belgium 0,740 0,738 0,731 0,726 0,720 0,771 0,766 0,770 0,772 0,770 0,721 0,712 0,705 0,702 0,689 -6,95% 0,736 0,0833 Bulgaria 0,719 0,722 0,661 0,694 0,728 0,748 0,741 0,745 0,755 0,758 0,771 0,796 0,764 0,762 0,768 6,81% 0,742 0,1344 Czech Republic 0,746 0,772 0,739 0,716 0,693 0,709 0,702 0,694 0,686 0,681 0,703 0,699 0,691 0,695 0,688 -7,72% 0,708 0,0925 Cyprus 0,852 0,854 0,863 0,858 0,863 0,863 0,857 0,860 0,865 0,862 0,860 0,867 0,876 0,872 0,861 1,11% 0,862 0,0246 Denmark 0,872 0,877 0,882 0,880 0,878 0,858 0,849 0,853 0,855 0,854 0,847 0,847 0,843 0,841 0,830 -4,78% 0,858 0,0517 Estonia 0,822 0,842 0,840 0,846 0,846 0,842 0,758 0,820 0,784 0,769 0,811 0,812 0,808 0,810 0,800 -2,67% 0,814 0,0888 Finland 0,813 0,816 0,818 0,825 0,822 0,807 0,817 0,826 0,831 0,827 0,826 0,795 0,798 0,794 0,798 -1,84% 0,814 0,0379 France 0,755 0,746 0,749 0,746 0,741 0,741 0,735 0,739 0,744 0,744 0,738 0,730 0,722 0,723 0,715 -5,36% 0,738 0,040
10 Germany 0,802 0,800 0,796 0,791 0,783 0,768 0,764 0,766 0,762 0,759 0,751 0,746 0,742 0,746 0,742 -7,47% 0,768 0,06011 Greece 0,829 0,830 0,836 0,839 0,834 0,843 0,834 0,861 0,873 0,870 0,867 0,878 0,881 0,875 0,877 5,79% 0,855 0,05212 Hungary 0,773 0,766 0,790 0,790 0,784 0,818 0,818 0,822 0,810 0,829 0,821 0,836 0,847 0,846 0,835 7,96% 0,812 0,08113 Ireland 0,753 0,758 0,762 0,761 0,751 0,732 0,721 0,717 0,688 0,693 0,652 0,636 0,615 0,613 0,585 -22,39% 0,696 0,17714 Italy 0,783 0,788 0,786 0,787 0,787 0,789 0,789 0,788 0,789 0,793 0,791 0,788 0,786 0,786 0,787 0,49% 0,788 0,01015 Latvia 0,732 0,756 0,727 0,730 0,742 0,748 0,748 0,757 0,737 0,731 0,732 0,729 0,719 0,714 0,719 -1,89% 0,735 0,04316 Lithuania 0,738 0,746 0,775 0,790 0,794 0,819 0,822 0,821 0,823 0,810 0,791 0,787 0,781 0,783 0,788 6,77% 0,791 0,08517 Luxemburg 0,638 0,596 0,571 0,528 0,484 0,448 0,470 0,507 0,493 0,464 0,403 0,364 0,358 0,447 0,494 -22,58% 0,484 0,28018 Malta 0,681 0,715 0,728 0,718 0,710 0,709 0,757 0,758 0,730 0,733 0,754 0,752 0,743 0,753 0,735 7,91% 0,732 0,07719 Poland 0,770 0,773 0,783 0,790 0,788 0,814 0,814 0,820 0,821 0,818 0,817 0,812 0,803 0,802 0,806 4,61% 0,802 0,05020 Portugal 0,734 0,737 0,736 0,742 0,745 0,725 0,725 0,723 0,727 0,725 0,719 0,720 0,712 0,715 0,712 -3,04% 0,727 0,03321 Romania 0,705 0,705 0,708 0,721 0,719 0,728 0,681 0,665 0,660 0,665 0,699 0,682 0,689 0,680 0,675 -4,24% 0,692 0,06822 Slovak Republic 0,722 0,704 0,705 0,704 0,682 0,696 0,679 0,682 0,671 0,691 0,688 0,697 0,699 0,682 0,673 -6,77% 0,692 0,05123 Slovenia 0,767 0,762 0,766 0,767 0,763 0,758 0,758 0,760 0,761 0,747 0,746 0,748 0,743 0,741 0,742 -3,29% 0,755 0,02724 Spain 0,798 0,801 0,800 0,799 0,798 0,773 0,772 0,748 0,740 0,739 0,720 0,703 0,718 0,719 0,714 -10,46% 0,756 0,09825 Sweden 0,843 0,845 0,846 0,842 0,845 0,834 0,829 0,831 0,838 0,838 0,837 0,835 0,836 0,841 0,843 -0,05% 0,839 0,01726 The Netherlands 0,795 0,789 0,787 0,783 0,782 0,778 0,764 0,768 0,769 0,771 0,771 0,767 0,767 0,758 0,756 -5,01% 0,774 0,04027 United Kingdom 0,778 0,775 0,773 0,774 0,771 0,774 0,772 0,766 0,762 0,753 0,738 0,736 0,738 0,741 0,742 -4,64% 0,760 0,04128 Australia 0,828 0,831 0,803 0,787 0,782 0,788 0,781 0,775 0,768 0,768 0,767 0,758 0,758 0,754 0,749 -9,53% 0,780 0,08229 Brazil 0,796 0,798 0,804 0,807 0,809 0,810 0,808 0,812 0,807 0,804 0,814 0,819 0,819 0,819 0,816 2,51% 0,809 0,02330 Canada 0,839 0,839 0,840 0,840 0,842 0,843 0,847 0,846 0,849 0,848 0,849 0,853 0,852 0,847 0,839 0,06% 0,845 0,01431 China 0,769 0,765 0,767 0,764 0,766 0,768 0,765 0,765 0,748 0,750 0,742 0,726 0,718 0,726 0,728 -5,32% 0,751 0,05132 India 0,785 0,795 0,798 0,812 0,804 0,801 0,798 0,799 0,791 0,796 0,801 0,799 0,801 0,799 0,806 2,73% 0,799 0,02733 Indonesia 0,729 0,721 0,689 0,787 0,785 0,807 0,803 0,799 0,809 0,808 0,813 0,815 0,811 0,812 0,814 11,74% 0,787 0,12634 Japan 0,776 0,773 0,774 0,779 0,783 0,776 0,780 0,779 0,774 0,764 0,760 0,754 0,748 0,743 0,755 -2,67% 0,768 0,03935 Korea 0,720 0,717 0,726 0,722 0,693 0,680 0,684 0,679 0,683 0,672 0,664 0,661 0,658 0,656 0,643 -10,70% 0,684 0,08236 Mexico 0,822 0,822 0,833 0,820 0,822 0,824 0,830 0,833 0,836 0,840 0,836 0,839 0,840 0,846 0,839 2,06% 0,832 0,02737 Russia 0,832 0,828 0,832 0,831 0,810 0,818 0,822 0,829 0,823 0,824 0,829 0,838 0,835 0,836 0,845 1,58% 0,829 0,03438 Taiwan 0,780 0,801 0,803 0,804 0,796 0,794 0,801 0,777 0,764 0,760 0,772 0,772 0,762 0,758 0,792 1,43% 0,782 0,04639 Turkey 0,803 0,815 0,802 0,791 0,766 0,763 0,759 0,751 0,748 0,755 0,752 0,757 0,757 0,763 0,760 -5,32% 0,769 0,06740 USA 0,784 0,784 0,781 0,778 0,778 0,780 0,788 0,788 0,793 0,794 0,799 0,795 0,789 0,796 0,786 0,23% 0,788 0,021
Average R 0,776 0,778 0,775 0,777 0,772 0,773 0,770 0,772 0,767 0,766 0,763 0,760 0,7564 0,758 0,7563 -2,59% 0,768 0,021
National network interaction ratio R calculated from the Input-Output tables
246
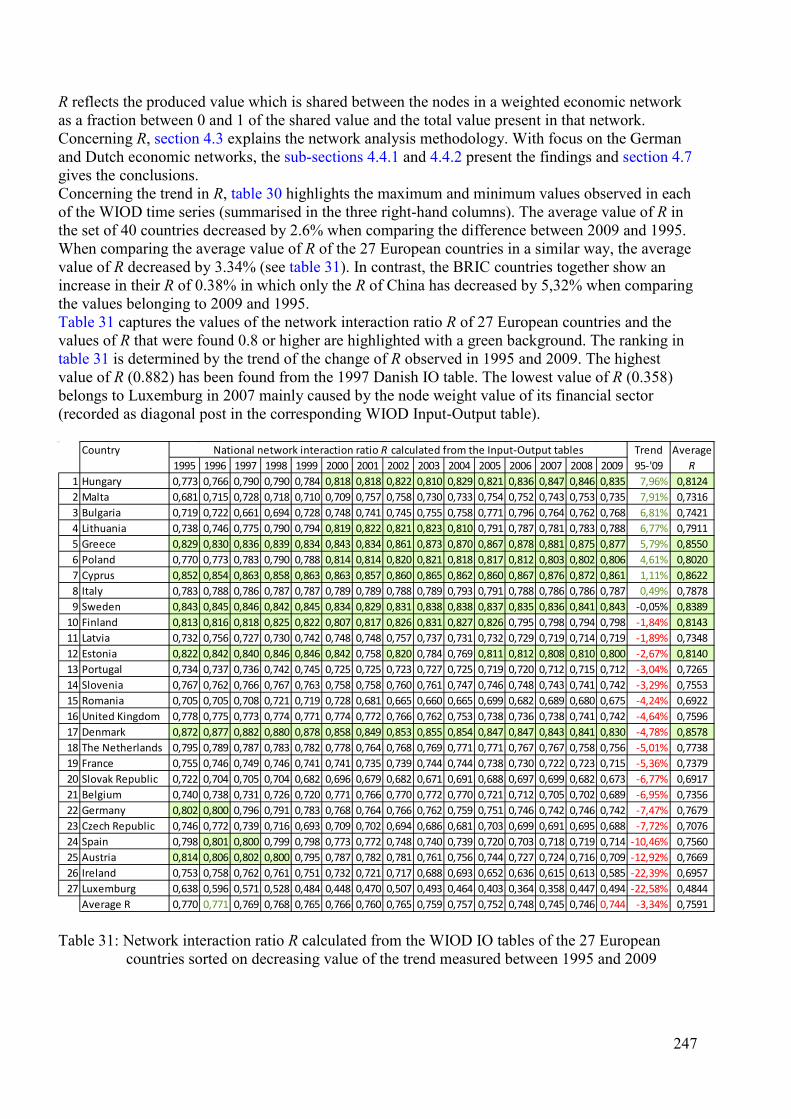
R reflects the produced value which is shared between the nodes in a weighted economic network as a fraction between 0 and 1 of the shared value and the total value present in that network. Concerning R, section 4.3 explains the network analysis methodology. With focus on the German and Dutch economic networks, the sub-sections 4.4.1 and 4.4.2 present the findings and section 4.7 gives the conclusions. Concerning the trend in R, table 30 highlights the maximum and minimum values observed in each of the WIOD time series (summarised in the three right-hand columns). The average value of R in the set of 40 countries decreased by 2.6% when comparing the difference between 2009 and 1995. When comparing the average value of R of the 27 European countries in a similar way, the average value of R decreased by 3.34% (see table 31). In contrast, the BRIC countries together show an increase in their R of 0.38% in which only the R of China has decreased by 5,32% when comparing the values belonging to 2009 and 1995. Table 31 captures the values of the network interaction ratio R of 27 European countries and the values of R that were found 0.8 or higher are highlighted with a green background. The ranking in table 31 is determined by the trend of the change of R observed in 1995 and 2009. The highest value of R (0.882) has been found from the 1997 Danish IO table. The lowest value of R (0.358) belongs to Luxemburg in 2007 mainly caused by the node weight value of its financial sector (recorded as diagonal post in the corresponding WIOD Input-Output table).
Table 31: Network interaction ratio R calculated from the WIOD IO tables of the 27 European countries sorted on decreasing value of the trend measured between 1995 and 2009
Country Trend Average1995 1996 1997 1998 1999 2000 2001 2002 2003 2004 2005 2006 2007 2008 2009 95-'09 R
1 Hungary 0,773 0,766 0,790 0,790 0,784 0,818 0,818 0,822 0,810 0,829 0,821 0,836 0,847 0,846 0,835 7,96% 0,81242 Malta 0,681 0,715 0,728 0,718 0,710 0,709 0,757 0,758 0,730 0,733 0,754 0,752 0,743 0,753 0,735 7,91% 0,73163 Bulgaria 0,719 0,722 0,661 0,694 0,728 0,748 0,741 0,745 0,755 0,758 0,771 0,796 0,764 0,762 0,768 6,81% 0,74214 Lithuania 0,738 0,746 0,775 0,790 0,794 0,819 0,822 0,821 0,823 0,810 0,791 0,787 0,781 0,783 0,788 6,77% 0,79115 Greece 0,829 0,830 0,836 0,839 0,834 0,843 0,834 0,861 0,873 0,870 0,867 0,878 0,881 0,875 0,877 5,79% 0,85506 Poland 0,770 0,773 0,783 0,790 0,788 0,814 0,814 0,820 0,821 0,818 0,817 0,812 0,803 0,802 0,806 4,61% 0,80207 Cyprus 0,852 0,854 0,863 0,858 0,863 0,863 0,857 0,860 0,865 0,862 0,860 0,867 0,876 0,872 0,861 1,11% 0,86228 Italy 0,783 0,788 0,786 0,787 0,787 0,789 0,789 0,788 0,789 0,793 0,791 0,788 0,786 0,786 0,787 0,49% 0,78789 Sweden 0,843 0,845 0,846 0,842 0,845 0,834 0,829 0,831 0,838 0,838 0,837 0,835 0,836 0,841 0,843 -0,05% 0,8389
10 Finland 0,813 0,816 0,818 0,825 0,822 0,807 0,817 0,826 0,831 0,827 0,826 0,795 0,798 0,794 0,798 -1,84% 0,814311 Latvia 0,732 0,756 0,727 0,730 0,742 0,748 0,748 0,757 0,737 0,731 0,732 0,729 0,719 0,714 0,719 -1,89% 0,734812 Estonia 0,822 0,842 0,840 0,846 0,846 0,842 0,758 0,820 0,784 0,769 0,811 0,812 0,808 0,810 0,800 -2,67% 0,814013 Portugal 0,734 0,737 0,736 0,742 0,745 0,725 0,725 0,723 0,727 0,725 0,719 0,720 0,712 0,715 0,712 -3,04% 0,726514 Slovenia 0,767 0,762 0,766 0,767 0,763 0,758 0,758 0,760 0,761 0,747 0,746 0,748 0,743 0,741 0,742 -3,29% 0,755315 Romania 0,705 0,705 0,708 0,721 0,719 0,728 0,681 0,665 0,660 0,665 0,699 0,682 0,689 0,680 0,675 -4,24% 0,692216 United Kingdom 0,778 0,775 0,773 0,774 0,771 0,774 0,772 0,766 0,762 0,753 0,738 0,736 0,738 0,741 0,742 -4,64% 0,759617 Denmark 0,872 0,877 0,882 0,880 0,878 0,858 0,849 0,853 0,855 0,854 0,847 0,847 0,843 0,841 0,830 -4,78% 0,857818 The Netherlands 0,795 0,789 0,787 0,783 0,782 0,778 0,764 0,768 0,769 0,771 0,771 0,767 0,767 0,758 0,756 -5,01% 0,773819 France 0,755 0,746 0,749 0,746 0,741 0,741 0,735 0,739 0,744 0,744 0,738 0,730 0,722 0,723 0,715 -5,36% 0,737920 Slovak Republic 0,722 0,704 0,705 0,704 0,682 0,696 0,679 0,682 0,671 0,691 0,688 0,697 0,699 0,682 0,673 -6,77% 0,691721 Belgium 0,740 0,738 0,731 0,726 0,720 0,771 0,766 0,770 0,772 0,770 0,721 0,712 0,705 0,702 0,689 -6,95% 0,735622 Germany 0,802 0,800 0,796 0,791 0,783 0,768 0,764 0,766 0,762 0,759 0,751 0,746 0,742 0,746 0,742 -7,47% 0,767923 Czech Republic 0,746 0,772 0,739 0,716 0,693 0,709 0,702 0,694 0,686 0,681 0,703 0,699 0,691 0,695 0,688 -7,72% 0,707624 Spain 0,798 0,801 0,800 0,799 0,798 0,773 0,772 0,748 0,740 0,739 0,720 0,703 0,718 0,719 0,714 -10,46% 0,756025 Austria 0,814 0,806 0,802 0,800 0,795 0,787 0,782 0,781 0,761 0,756 0,744 0,727 0,724 0,716 0,709 -12,92% 0,766926 Ireland 0,753 0,758 0,762 0,761 0,751 0,732 0,721 0,717 0,688 0,693 0,652 0,636 0,615 0,613 0,585 -22,39% 0,695727 Luxemburg 0,638 0,596 0,571 0,528 0,484 0,448 0,470 0,507 0,493 0,464 0,403 0,364 0,358 0,447 0,494 -22,58% 0,4844
Average R 0,770 0,771 0,769 0,768 0,765 0,766 0,760 0,765 0,759 0,757 0,752 0,748 0,745 0,746 0,744 -3,34% 0,7591
National network interaction ratio R calculated from the Input-Output tables
247
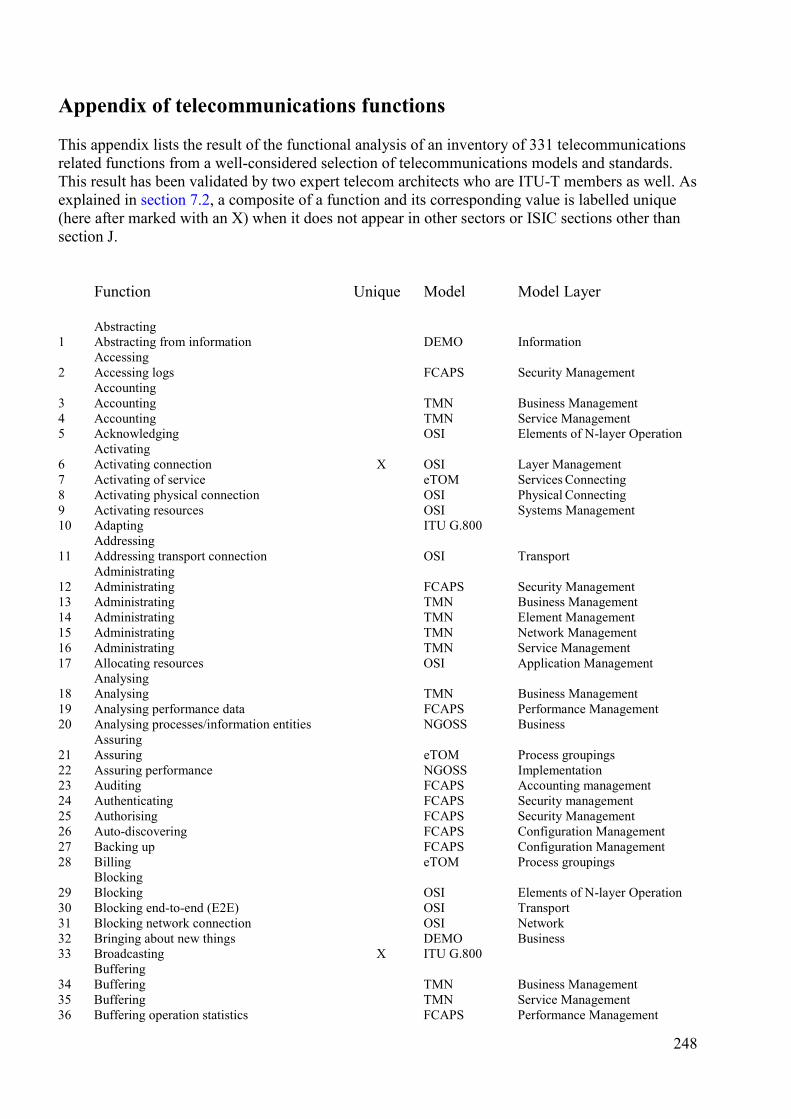
Appendix of telecommunications functions This appendix lists the result of the functional analysis of an inventory of 331 telecommunications related functions from a well-considered selection of telecommunications models and standards. This result has been validated by two expert telecom architects who are ITU-T members as well. As explained in section 7.2, a composite of a function and its corresponding value is labelled unique (here after marked with an X) when it does not appear in other sectors or ISIC sections other than section J. Function Unique Model Model Layer Abstracting 1 Abstracting from information DEMO Information Accessing 2 Accessing logs FCAPS Security Management Accounting 3 Accounting TMN Business Management 4 Accounting TMN Service Management 5 Acknowledging OSI Elements of N-layer Operation Activating 6 Activating connection X OSI Layer Management 7 Activating of service eTOM Services Connecting 8 Activating physical connection OSI Physical Connecting 9 Activating resources OSI Systems Management 10 Adapting ITU G.800 Addressing 11 Addressing transport connection OSI Transport Administrating 12 Administrating FCAPS Security Management 13 Administrating TMN Business Management 14 Administrating TMN Element Management 15 Administrating TMN Network Management 16 Administrating TMN Service Management 17 Allocating resources OSI Application Management Analysing 18 Analysing TMN Business Management 19 Analysing performance data FCAPS Performance Management 20 Analysing processes/information entities NGOSS Business Assuring 21 Assuring eTOM Process groupings 22 Assuring performance NGOSS Implementation 23 Auditing FCAPS Accounting management 24 Authenticating FCAPS Security management 25 Authorising FCAPS Security Management 26 Auto-discovering FCAPS Configuration Management 27 Backing up FCAPS Configuration Management 28 Billing eTOM Process groupings Blocking 29 Blocking OSI Elements of N-layer Operation 30 Blocking end-to-end (E2E) OSI Transport 31 Blocking network connection OSI Network 32 Bringing about new things DEMO Business 33 Broadcasting X ITU G.800 Buffering 34 Buffering TMN Business Management 35 Buffering TMN Service Management 36 Buffering operation statistics FCAPS Performance Management
248
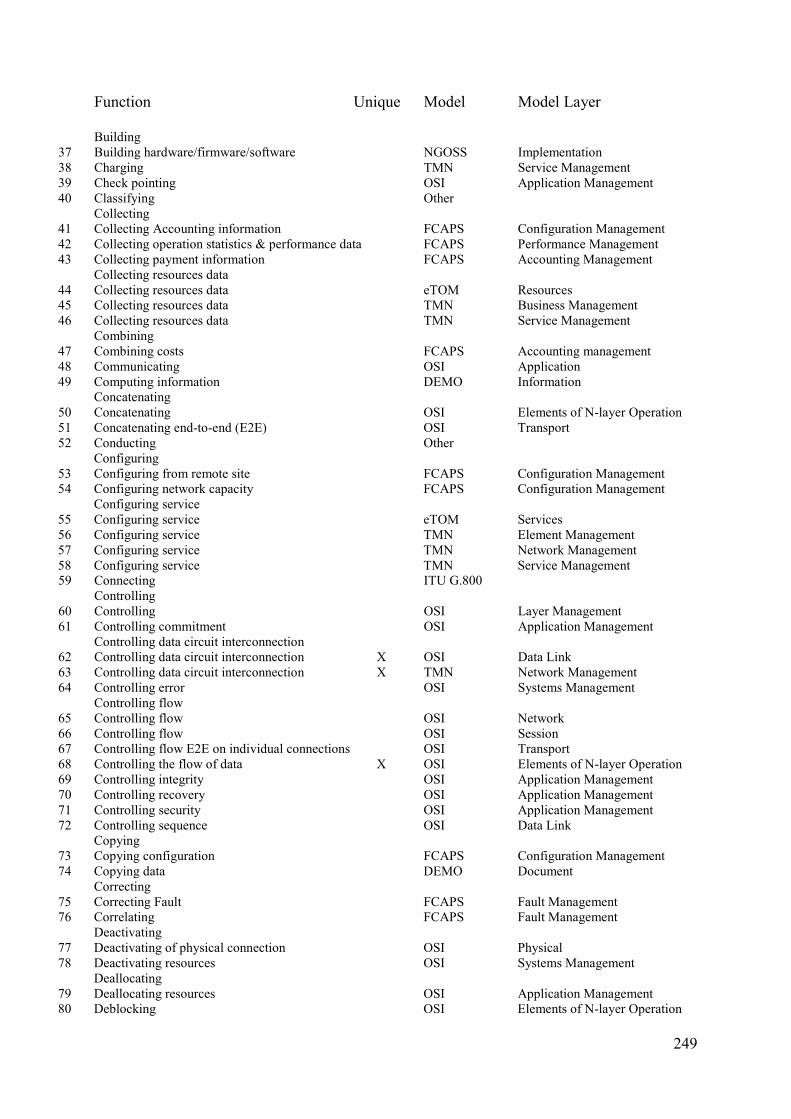
Function Unique Model Model Layer Building 37 Building hardware/firmware/software NGOSS Implementation 38 Charging TMN Service Management 39 Check pointing OSI Application Management 40 Classifying Other Collecting 41 Collecting Accounting information FCAPS Configuration Management 42 Collecting operation statistics & performance data FCAPS Performance Management 43 Collecting payment information FCAPS Accounting Management Collecting resources data 44 Collecting resources data eTOM Resources 45 Collecting resources data TMN Business Management 46 Collecting resources data TMN Service Management Combining 47 Combining costs FCAPS Accounting management 48 Communicating OSI Application 49 Computing information DEMO Information Concatenating 50 Concatenating OSI Elements of N-layer Operation 51 Concatenating end-to-end (E2E) OSI Transport 52 Conducting Other Configuring 53 Configuring from remote site FCAPS Configuration Management 54 Configuring network capacity FCAPS Configuration Management Configuring service 55 Configuring service eTOM Services 56 Configuring service TMN Element Management 57 Configuring service TMN Network Management 58 Configuring service TMN Service Management 59 Connecting ITU G.800 Controlling 60 Controlling OSI Layer Management 61 Controlling commitment OSI Application Management Controlling data circuit interconnection 62 Controlling data circuit interconnection X OSI Data Link 63 Controlling data circuit interconnection X TMN Network Management 64 Controlling error OSI Systems Management Controlling flow 65 Controlling flow OSI Network 66 Controlling flow OSI Session 67 Controlling flow E2E on individual connections OSI Transport 68 Controlling the flow of data X OSI Elements of N-layer Operation 69 Controlling integrity OSI Application Management 70 Controlling recovery OSI Application Management 71 Controlling security OSI Application Management 72 Controlling sequence OSI Data Link Copying 73 Copying configuration FCAPS Configuration Management 74 Copying data DEMO Document Correcting 75 Correcting Fault FCAPS Fault Management 76 Correlating FCAPS Fault Management Deactivating 77 Deactivating of physical connection OSI Physical 78 Deactivating resources OSI Systems Management Deallocating 79 Deallocating resources OSI Application Management 80 Deblocking OSI Elements of N-layer Operation
249
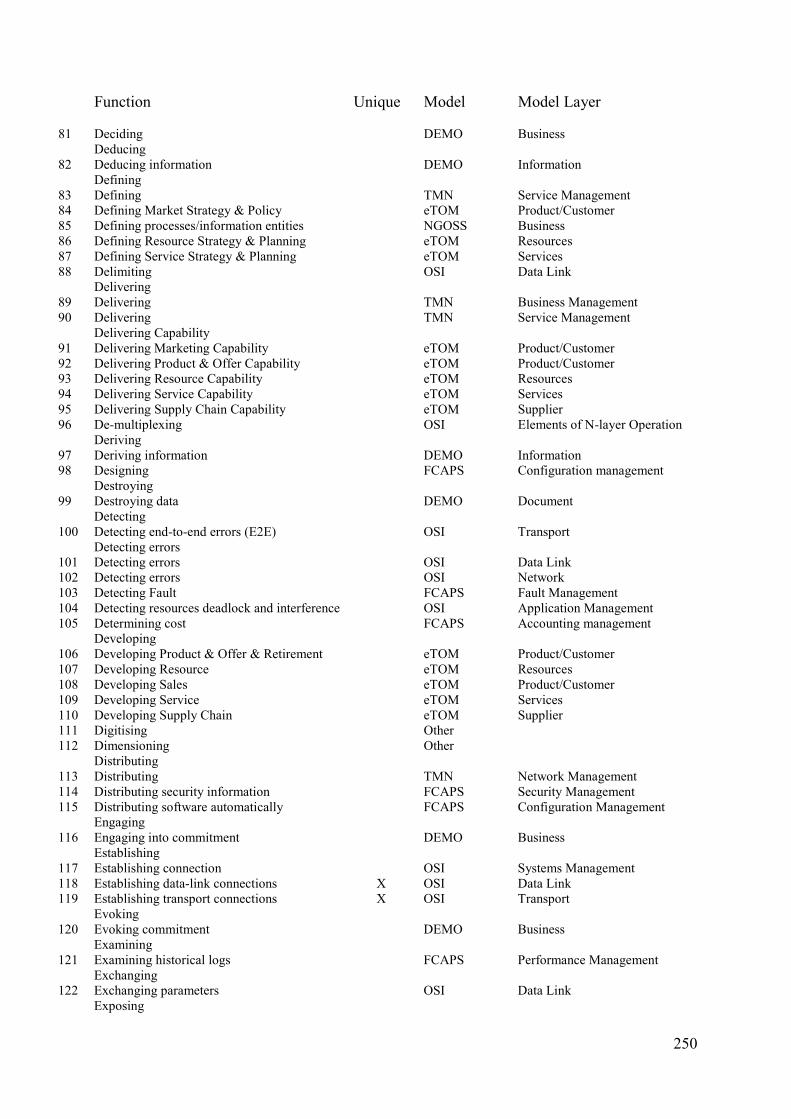
Function Unique Model Model Layer 81 Deciding DEMO Business Deducing 82 Deducing information DEMO Information Defining 83 Defining TMN Service Management 84 Defining Market Strategy & Policy eTOM Product/Customer 85 Defining processes/information entities NGOSS Business 86 Defining Resource Strategy & Planning eTOM Resources 87 Defining Service Strategy & Planning eTOM Services 88 Delimiting OSI Data Link Delivering 89 Delivering TMN Business Management 90 Delivering TMN Service Management Delivering Capability 91 Delivering Marketing Capability eTOM Product/Customer 92 Delivering Product & Offer Capability eTOM Product/Customer 93 Delivering Resource Capability eTOM Resources 94 Delivering Service Capability eTOM Services 95 Delivering Supply Chain Capability eTOM Supplier 96 De-multiplexing OSI Elements of N-layer Operation Deriving 97 Deriving information DEMO Information 98 Designing FCAPS Configuration management Destroying 99 Destroying data DEMO Document Detecting 100 Detecting end-to-end errors (E2E) OSI Transport Detecting errors 101 Detecting errors OSI Data Link 102 Detecting errors OSI Network 103 Detecting Fault FCAPS Fault Management 104 Detecting resources deadlock and interference OSI Application Management 105 Determining cost FCAPS Accounting management Developing 106 Developing Product & Offer & Retirement eTOM Product/Customer 107 Developing Resource eTOM Resources 108 Developing Sales eTOM Product/Customer 109 Developing Service eTOM Services 110 Developing Supply Chain eTOM Supplier 111 Digitising Other 112 Dimensioning Other Distributing 113 Distributing TMN Network Management 114 Distributing security information FCAPS Security Management 115 Distributing software automatically FCAPS Configuration Management Engaging 116 Engaging into commitment DEMO Business Establishing 117 Establishing connection OSI Systems Management 118 Establishing data-link connections X OSI Data Link 119 Establishing transport connections X OSI Transport Evoking 120 Evoking commitment DEMO Business Examining 121 Examining historical logs FCAPS Performance Management Exchanging 122 Exchanging parameters OSI Data Link Exposing
250
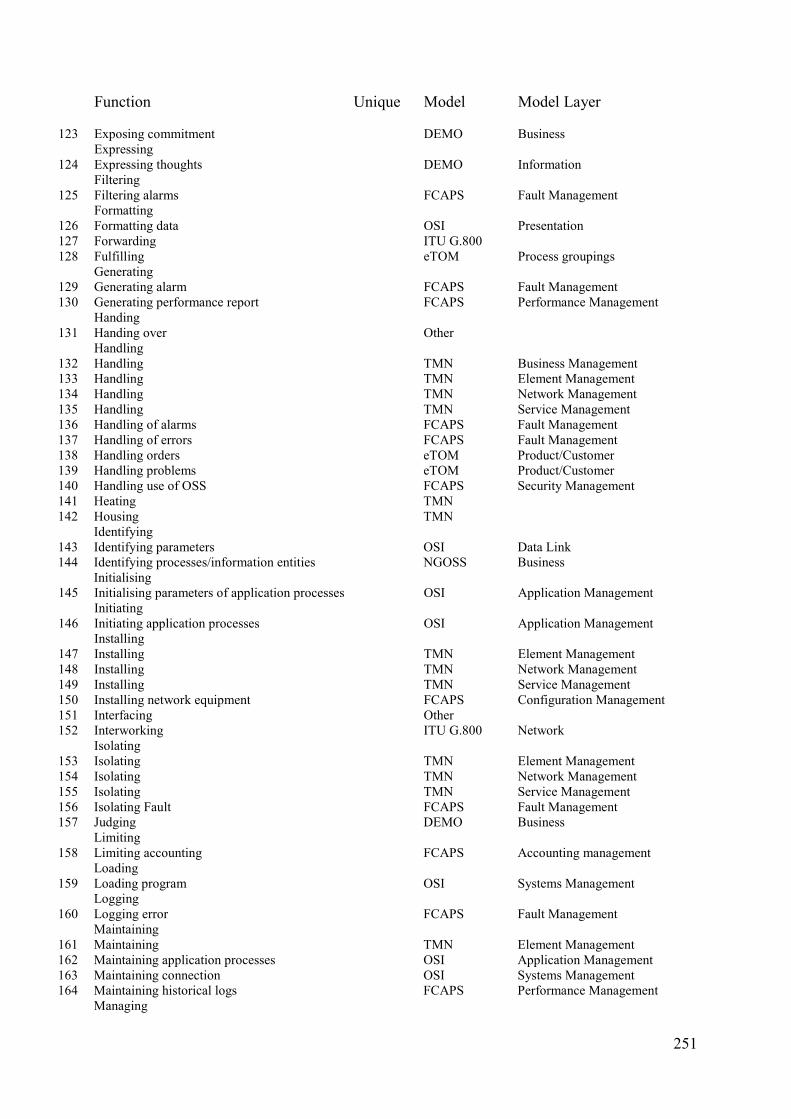
Function Unique Model Model Layer 123 Exposing commitment DEMO Business Expressing 124 Expressing thoughts DEMO Information Filtering 125 Filtering alarms FCAPS Fault Management Formatting 126 Formatting data OSI Presentation 127 Forwarding ITU G.800 128 Fulfilling eTOM Process groupings Generating 129 Generating alarm FCAPS Fault Management 130 Generating performance report FCAPS Performance Management Handing 131 Handing over Other Handling 132 Handling TMN Business Management 133 Handling TMN Element Management 134 Handling TMN Network Management 135 Handling TMN Service Management 136 Handling of alarms FCAPS Fault Management 137 Handling of errors FCAPS Fault Management 138 Handling orders eTOM Product/Customer 139 Handling problems eTOM Product/Customer 140 Handling use of OSS FCAPS Security Management 141 Heating TMN 142 Housing TMN Identifying 143 Identifying parameters OSI Data Link 144 Identifying processes/information entities NGOSS Business Initialising 145 Initialising parameters of application processes OSI Application Management Initiating 146 Initiating application processes OSI Application Management Installing 147 Installing TMN Element Management 148 Installing TMN Network Management 149 Installing TMN Service Management 150 Installing network equipment FCAPS Configuration Management 151 Interfacing Other 152 Interworking ITU G.800 Network Isolating 153 Isolating TMN Element Management 154 Isolating TMN Network Management 155 Isolating TMN Service Management 156 Isolating Fault FCAPS Fault Management 157 Judging DEMO Business Limiting 158 Limiting accounting FCAPS Accounting management Loading 159 Loading program OSI Systems Management Logging 160 Logging error FCAPS Fault Management Maintaining 161 Maintaining TMN Element Management 162 Maintaining application processes OSI Application Management 163 Maintaining connection OSI Systems Management 164 Maintaining historical logs FCAPS Performance Management Managing
251
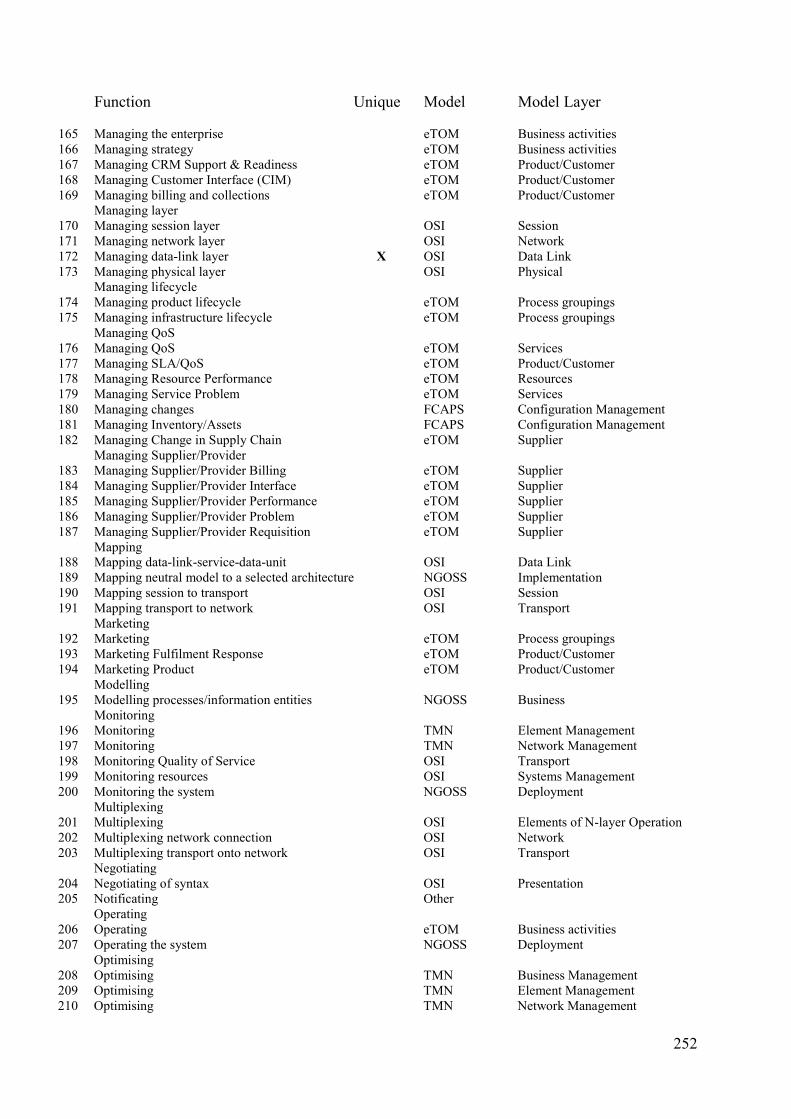
Function Unique Model Model Layer 165 Managing the enterprise eTOM Business activities 166 Managing strategy eTOM Business activities 167 Managing CRM Support & Readiness eTOM Product/Customer 168 Managing Customer Interface (CIM) eTOM Product/Customer 169 Managing billing and collections eTOM Product/Customer Managing layer 170 Managing session layer OSI Session 171 Managing network layer OSI Network 172 Managing data-link layer X OSI Data Link 173 Managing physical layer OSI Physical Managing lifecycle 174 Managing product lifecycle eTOM Process groupings 175 Managing infrastructure lifecycle eTOM Process groupings Managing QoS 176 Managing QoS eTOM Services 177 Managing SLA/QoS eTOM Product/Customer 178 Managing Resource Performance eTOM Resources 179 Managing Service Problem eTOM Services 180 Managing changes FCAPS Configuration Management 181 Managing Inventory/Assets FCAPS Configuration Management 182 Managing Change in Supply Chain eTOM Supplier Managing Supplier/Provider 183 Managing Supplier/Provider Billing eTOM Supplier 184 Managing Supplier/Provider Interface eTOM Supplier 185 Managing Supplier/Provider Performance eTOM Supplier 186 Managing Supplier/Provider Problem eTOM Supplier 187 Managing Supplier/Provider Requisition eTOM Supplier Mapping 188 Mapping data-link-service-data-unit OSI Data Link 189 Mapping neutral model to a selected architecture NGOSS Implementation 190 Mapping session to transport OSI Session 191 Mapping transport to network OSI Transport Marketing 192 Marketing eTOM Process groupings 193 Marketing Fulfilment Response eTOM Product/Customer 194 Marketing Product eTOM Product/Customer Modelling 195 Modelling processes/information entities NGOSS Business Monitoring 196 Monitoring TMN Element Management 197 Monitoring TMN Network Management 198 Monitoring Quality of Service OSI Transport 199 Monitoring resources OSI Systems Management 200 Monitoring the system NGOSS Deployment Multiplexing 201 Multiplexing OSI Elements of N-layer Operation 202 Multiplexing network connection OSI Network 203 Multiplexing transport onto network OSI Transport Negotiating 204 Negotiating of syntax OSI Presentation 205 Notificating Other Operating 206 Operating eTOM Business activities 207 Operating the system NGOSS Deployment Optimising 208 Optimising TMN Business Management 209 Optimising TMN Element Management 210 Optimising TMN Network Management
252
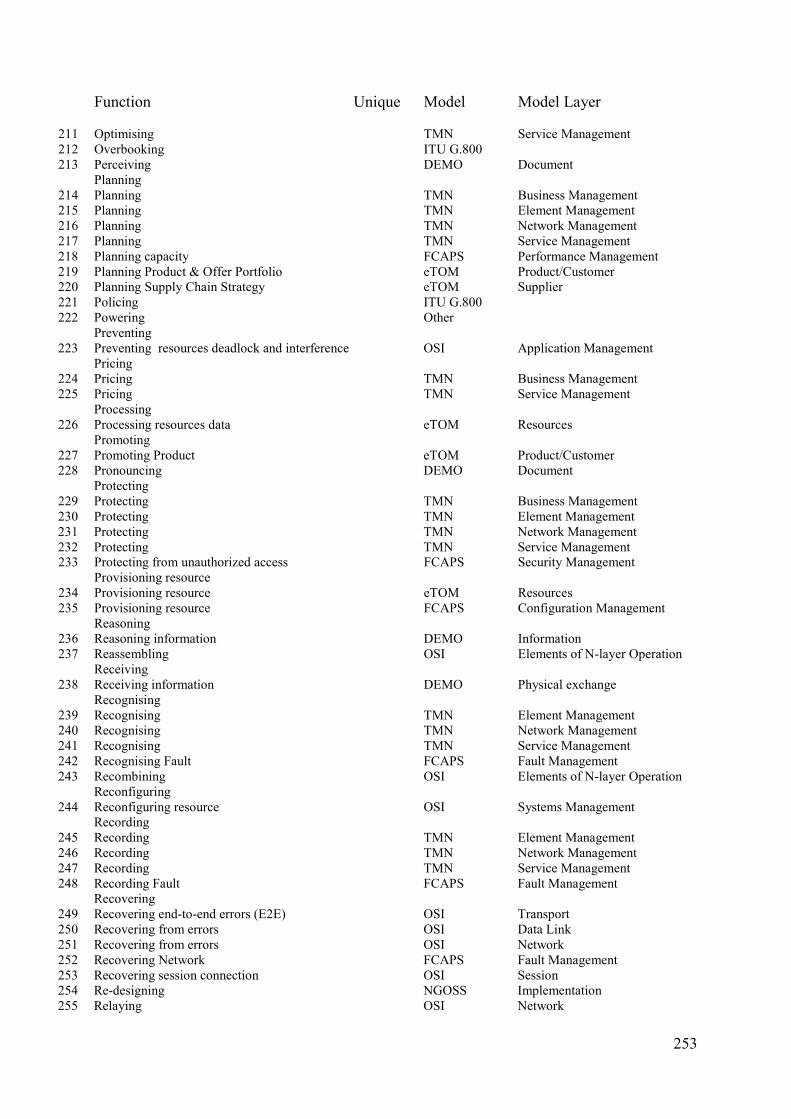
Function Unique Model Model Layer 211 Optimising TMN Service Management 212 Overbooking ITU G.800 213 Perceiving DEMO Document Planning 214 Planning TMN Business Management 215 Planning TMN Element Management 216 Planning TMN Network Management 217 Planning TMN Service Management 218 Planning capacity FCAPS Performance Management 219 Planning Product & Offer Portfolio eTOM Product/Customer 220 Planning Supply Chain Strategy eTOM Supplier 221 Policing ITU G.800 222 Powering Other Preventing 223 Preventing resources deadlock and interference OSI Application Management Pricing 224 Pricing TMN Business Management 225 Pricing TMN Service Management Processing 226 Processing resources data eTOM Resources Promoting 227 Promoting Product eTOM Product/Customer 228 Pronouncing DEMO Document Protecting 229 Protecting TMN Business Management 230 Protecting TMN Element Management 231 Protecting TMN Network Management 232 Protecting TMN Service Management 233 Protecting from unauthorized access FCAPS Security Management Provisioning resource 234 Provisioning resource eTOM Resources 235 Provisioning resource FCAPS Configuration Management Reasoning 236 Reasoning information DEMO Information 237 Reassembling OSI Elements of N-layer Operation Receiving 238 Receiving information DEMO Physical exchange Recognising 239 Recognising TMN Element Management 240 Recognising TMN Network Management 241 Recognising TMN Service Management 242 Recognising Fault FCAPS Fault Management 243 Recombining OSI Elements of N-layer Operation Reconfiguring 244 Reconfiguring resource OSI Systems Management Recording 245 Recording TMN Element Management 246 Recording TMN Network Management 247 Recording TMN Service Management 248 Recording Fault FCAPS Fault Management Recovering 249 Recovering end-to-end errors (E2E) OSI Transport 250 Recovering from errors OSI Data Link 251 Recovering from errors OSI Network 252 Recovering Network FCAPS Fault Management 253 Recovering session connection OSI Session 254 Re-designing NGOSS Implementation 255 Relaying OSI Network
253
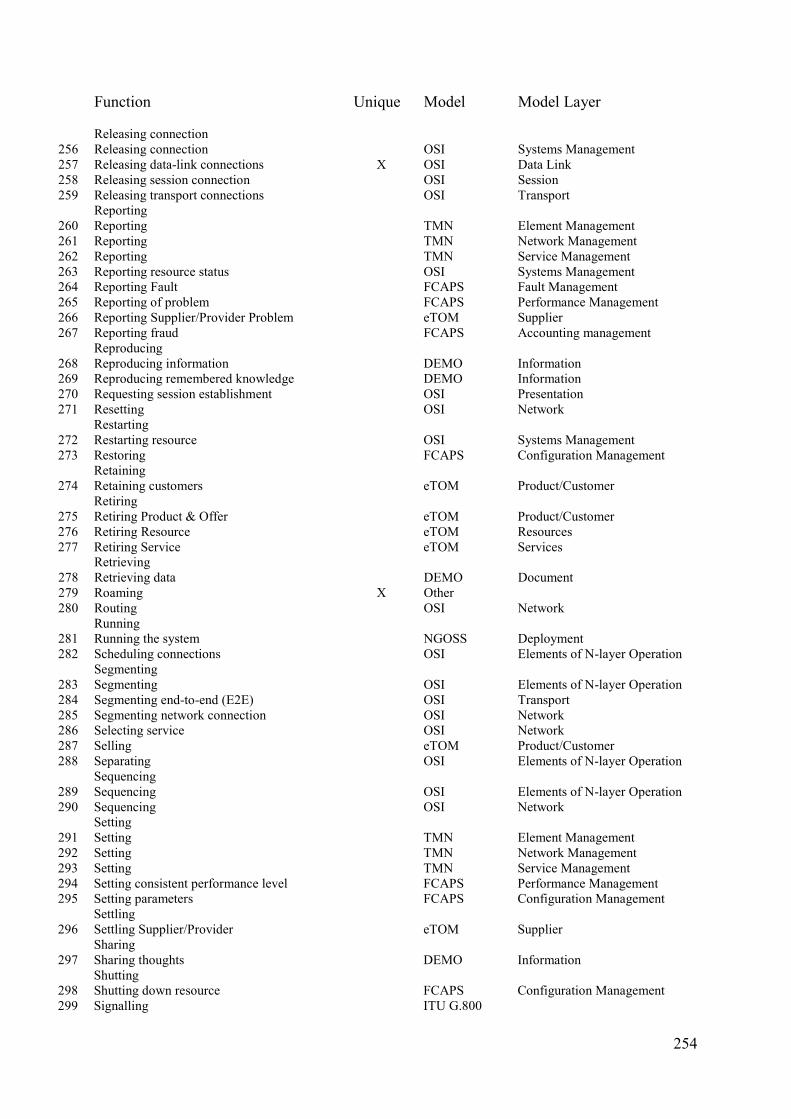
Function Unique Model Model Layer Releasing connection 256 Releasing connection OSI Systems Management 257 Releasing data-link connections X OSI Data Link 258 Releasing session connection OSI Session 259 Releasing transport connections OSI Transport Reporting 260 Reporting TMN Element Management 261 Reporting TMN Network Management 262 Reporting TMN Service Management 263 Reporting resource status OSI Systems Management 264 Reporting Fault FCAPS Fault Management 265 Reporting of problem FCAPS Performance Management 266 Reporting Supplier/Provider Problem eTOM Supplier 267 Reporting fraud FCAPS Accounting management Reproducing 268 Reproducing information DEMO Information 269 Reproducing remembered knowledge DEMO Information 270 Requesting session establishment OSI Presentation 271 Resetting OSI Network Restarting 272 Restarting resource OSI Systems Management 273 Restoring FCAPS Configuration Management Retaining 274 Retaining customers eTOM Product/Customer Retiring 275 Retiring Product & Offer eTOM Product/Customer 276 Retiring Resource eTOM Resources 277 Retiring Service eTOM Services Retrieving 278 Retrieving data DEMO Document 279 Roaming X Other 280 Routing OSI Network Running 281 Running the system NGOSS Deployment 282 Scheduling connections OSI Elements of N-layer Operation Segmenting 283 Segmenting OSI Elements of N-layer Operation 284 Segmenting end-to-end (E2E) OSI Transport 285 Segmenting network connection OSI Network 286 Selecting service OSI Network 287 Selling eTOM Product/Customer 288 Separating OSI Elements of N-layer Operation Sequencing 289 Sequencing OSI Elements of N-layer Operation 290 Sequencing OSI Network Setting 291 Setting TMN Element Management 292 Setting TMN Network Management 293 Setting TMN Service Management 294 Setting consistent performance level FCAPS Performance Management 295 Setting parameters FCAPS Configuration Management Settling 296 Settling Supplier/Provider eTOM Supplier Sharing 297 Sharing thoughts DEMO Information Shutting 298 Shutting down resource FCAPS Configuration Management 299 Signalling ITU G.800
254
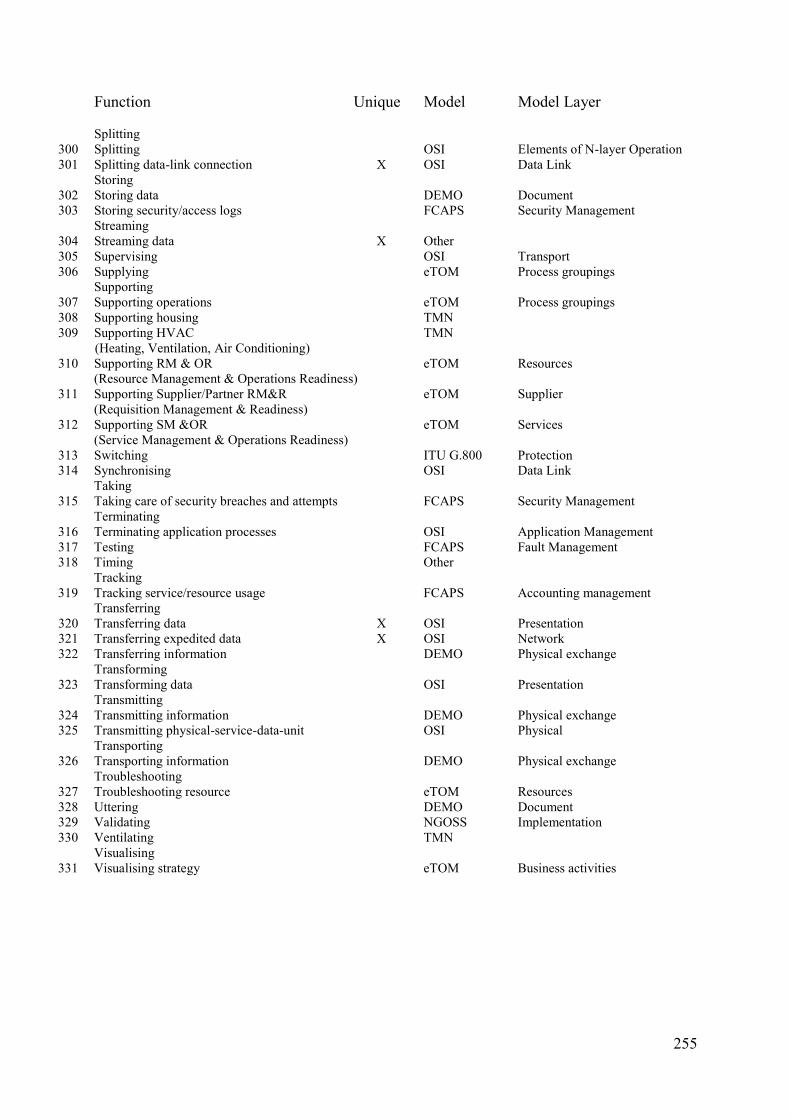
Function Unique Model Model Layer Splitting 300 Splitting OSI Elements of N-layer Operation 301 Splitting data-link connection X OSI Data Link Storing 302 Storing data DEMO Document 303 Storing security/access logs FCAPS Security Management Streaming 304 Streaming data X Other 305 Supervising OSI Transport 306 Supplying eTOM Process groupings Supporting 307 Supporting operations eTOM Process groupings 308 Supporting housing TMN 309 Supporting HVAC TMN (Heating, Ventilation, Air Conditioning) 310 Supporting RM & OR eTOM Resources
(Resource Management & Operations Readiness) 311 Supporting Supplier/Partner RM&R eTOM Supplier
(Requisition Management & Readiness) 312 Supporting SM &OR eTOM Services
(Service Management & Operations Readiness) 313 Switching ITU G.800 Protection 314 Synchronising OSI Data Link Taking 315 Taking care of security breaches and attempts FCAPS Security Management Terminating 316 Terminating application processes OSI Application Management 317 Testing FCAPS Fault Management 318 Timing Other Tracking 319 Tracking service/resource usage FCAPS Accounting management Transferring 320 Transferring data X OSI Presentation 321 Transferring expedited data X OSI Network 322 Transferring information DEMO Physical exchange Transforming 323 Transforming data OSI Presentation Transmitting 324 Transmitting information DEMO Physical exchange 325 Transmitting physical-service-data-unit OSI Physical Transporting 326 Transporting information DEMO Physical exchange Troubleshooting 327 Troubleshooting resource eTOM Resources 328 Uttering DEMO Document 329 Validating NGOSS Implementation 330 Ventilating TMN Visualising 331 Visualising strategy eTOM Business activities
255
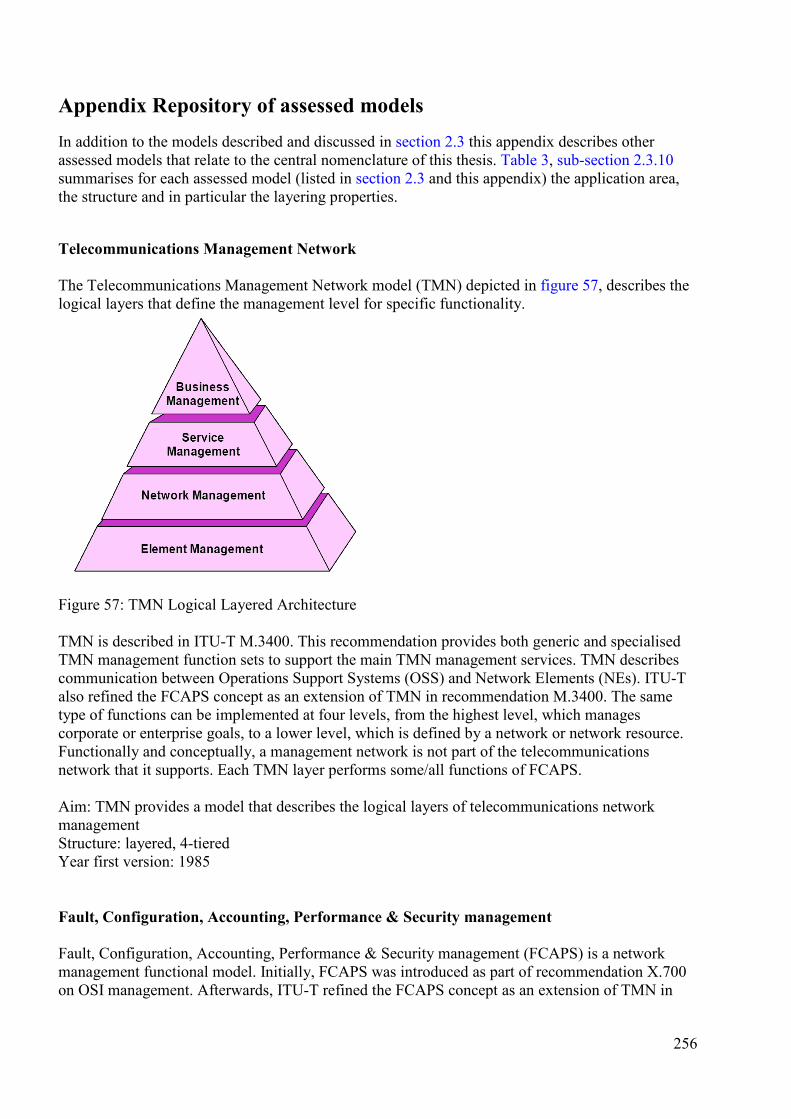
Appendix Repository of assessed models In addition to the models described and discussed in section 2.3 this appendix describes other assessed models that relate to the central nomenclature of this thesis. Table 3, sub-section 2.3.10 summarises for each assessed model (listed in section 2.3 and this appendix) the application area, the structure and in particular the layering properties. Telecommunications Management Network The Telecommunications Management Network model (TMN) depicted in figure 57, describes the logical layers that define the management level for specific functionality.
Figure 57: TMN Logical Layered Architecture TMN is described in ITU-T M.3400. This recommendation provides both generic and specialised TMN management function sets to support the main TMN management services. TMN describes communication between Operations Support Systems (OSS) and Network Elements (NEs). ITU-T also refined the FCAPS concept as an extension of TMN in recommendation M.3400. The same type of functions can be implemented at four levels, from the highest level, which manages corporate or enterprise goals, to a lower level, which is defined by a network or network resource. Functionally and conceptually, a management network is not part of the telecommunications network that it supports. Each TMN layer performs some/all functions of FCAPS. Aim: TMN provides a model that describes the logical layers of telecommunications network management Structure: layered, 4-tiered Year first version: 1985 Fault, Configuration, Accounting, Performance & Security management Fault, Configuration, Accounting, Performance & Security management (FCAPS) is a network management functional model. Initially, FCAPS was introduced as part of recommendation X.700 on OSI management. Afterwards, ITU-T refined the FCAPS concept as an extension of TMN in
256
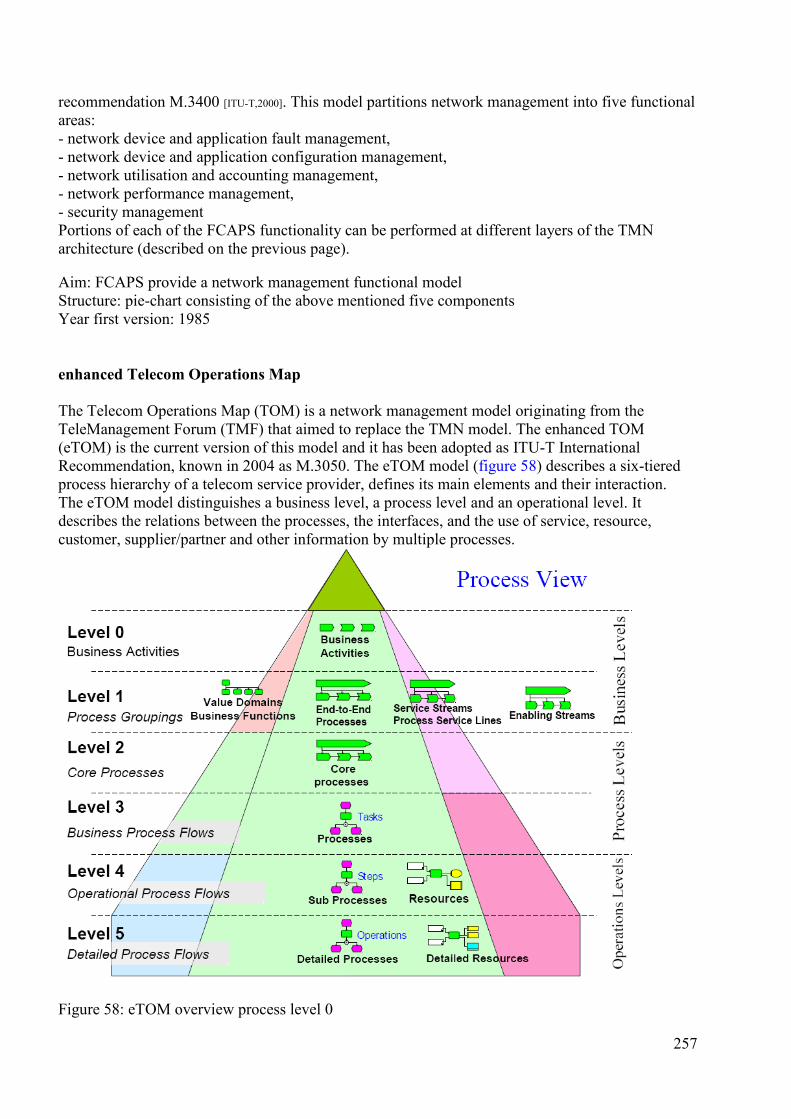
recommendation M.3400 [ITU-T,2000]. This model partitions network management into five functional areas: - network device and application fault management, - network device and application configuration management, - network utilisation and accounting management, - network performance management, - security management Portions of each of the FCAPS functionality can be performed at different layers of the TMN architecture (described on the previous page). Aim: FCAPS provide a network management functional model Structure: pie-chart consisting of the above mentioned five components Year first version: 1985 enhanced Telecom Operations Map The Telecom Operations Map (TOM) is a network management model originating from the TeleManagement Forum (TMF) that aimed to replace the TMN model. The enhanced TOM (eTOM) is the current version of this model and it has been adopted as ITU-T International Recommendation, known in 2004 as M.3050. The eTOM model (figure 58) describes a six-tiered process hierarchy of a telecom service provider, defines its main elements and their interaction. The eTOM model distinguishes a business level, a process level and an operational level. It describes the relations between the processes, the interfaces, and the use of service, resource, customer, supplier/partner and other information by multiple processes.
Figure 58: eTOM overview process level 0
257
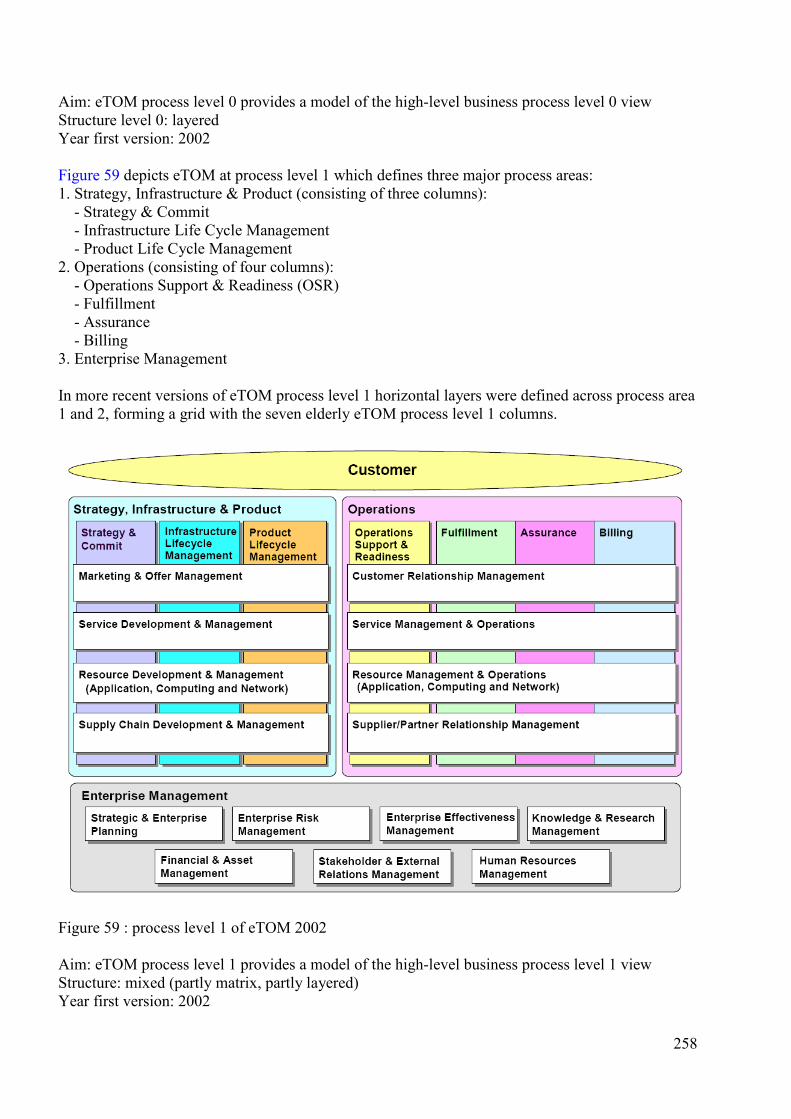
Aim: eTOM process level 0 provides a model of the high-level business process level 0 view Structure level 0: layered Year first version: 2002 Figure 59 depicts eTOM at process level 1 which defines three major process areas: 1. Strategy, Infrastructure & Product (consisting of three columns): - Strategy & Commit - Infrastructure Life Cycle Management - Product Life Cycle Management 2. Operations (consisting of four columns): - Operations Support & Readiness (OSR) - Fulfillment - Assurance - Billing 3. Enterprise Management In more recent versions of eTOM process level 1 horizontal layers were defined across process area 1 and 2, forming a grid with the seven elderly eTOM process level 1 columns. Figure 59 : process level 1 of eTOM 2002 Aim: eTOM process level 1 provides a model of the high-level business process level 1 view Structure: mixed (partly matrix, partly layered) Year first version: 2002
258
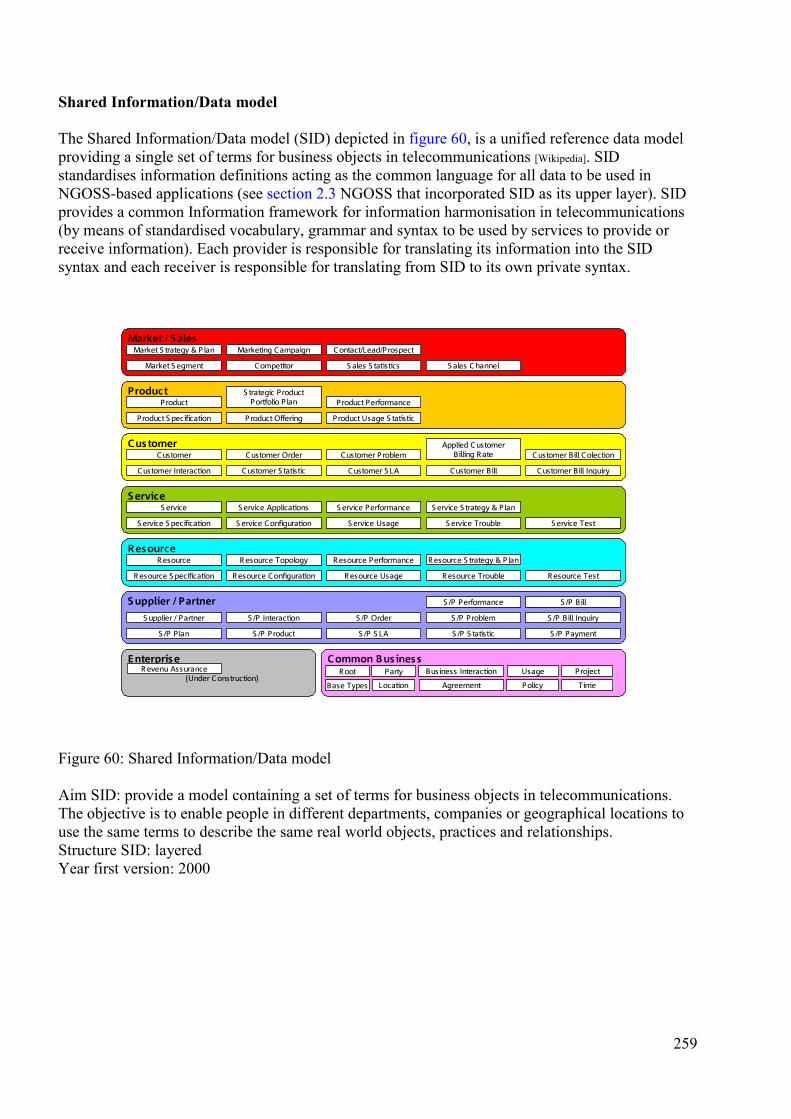
Shared Information/Data model The Shared Information/Data model (SID) depicted in figure 60, is a unified reference data model providing a single set of terms for business objects in telecommunications [Wikipedia]. SID standardises information definitions acting as the common language for all data to be used in NGOSS-based applications (see section 2.3 NGOSS that incorporated SID as its upper layer). SID provides a common Information framework for information harmonisation in telecommunications (by means of standardised vocabulary, grammar and syntax to be used by services to provide or receive information). Each provider is responsible for translating its information into the SID syntax and each receiver is responsible for translating from SID to its own private syntax.
Market / Sales
Product
Customer
Service
Resource
Supplier / Partner
Enterprise Common Business
(Under Construction)
Market S trategy & P lan
Market S egment
Marketing Campaign
S ales S tatisticsCompetitor
Contact/Lead/Prospect
S ales C hannel
Product
Product S pecification
S trategic ProductPortfolio P lan
Product Usage S tatisticProduct Offering
Product Performance
Customer
Customer Interaction
Customer Order
Customer S LACustomer S tatistic
Customer Problem
Customer Bill
S ervice
S ervice S pecification
S ervice Applications
S ervice UsageS ervice Configuration
S ervice Performance
S ervice Trouble
Resource
Resource S pecification
Resource Topology
Resource UsageResource Configuration
Resource Performance
Resource Trouble
S upplier / Partner
S /P Plan
S /P Interaction
S /P S LAS /P Product
S /P Order
S /P S tatistic
Customer Bill Colection
Customer Bill Inquiry
Applied C ustomerBilling Rate
Party
Location
Business Interaction
Policy
S ervice Test
Resource Test
S ervice S trategy & P lan
Resource S trategy & P lan
Agreement
S /P Problem
S /P Performance
S /P Payment
S /P Bill Inquiry
S /P Bill
Revenu Assurance Root
Base Types
Project
Time
Usage
Figure 60: Shared Information/Data model Aim SID: provide a model containing a set of terms for business objects in telecommunications. The objective is to enable people in different departments, companies or geographical locations to use the same terms to describe the same real world objects, practices and relationships. Structure SID: layered Year first version: 2000
259

Design & Methodology for Organisations DEsign & Methodology for Organisations (DEMO) is a methodology that indicates the way of modelling, the way of working and the way of managing organisations [Dietz,2006]. It uses and demonstrates that the underlying PSI-theory (Performance in Social Interaction) is a viable basis for dealing with organisational changes of all kinds. This methodology provides the grounding theory for producing an ontological model of an organisation, based on a description of its current operations. DEMO considers an organisation to consist of a coherent layered integration of three aspect-organisations: the Business organisation (B-organisation), the Information organisation (I-organisation) and the Document (D-organisation). These constitute a hierarchy, in which the I-organisation supports the B-organisation and the D-organisation supports the I-organisation. The integration of this system is established by the personnel of the organisation. Each DEMO layer is associated to human communication abilities. DEMO is not a standard, but its concept and methodology provides a strong theoretical background to understand organisations and the functionalities of their OSS tools. Aim: DEMO provides a methodology how to model orchestration and operations of an organisation Structure: layered, 3-tiered Year first version:1999
260

Appendix Symbols and Acronyms The mathematical symbols listed in this Appendix are commonly used throughout the entire thesis and mainly originate from complex network science. Each of the mathematical symbols relating to systemics (proposed by [Bunge,1979]) is distinguished with a reference. In order to minimise definitional conflicts, the mathematical symbols relating to Input-Output analysis are not listed in this Appendix and are exclusively described and explained in sub-section 2.3.1 and section 4.2. Symbols A adjacency matrix of graph G aij (i,j) entry of adjacency matrix c normalisation constant ci weighted clustering coefficient of node i C weighted clustering coefficient of a weighted network (or weighted graph) di degree of node i (the number of direct neighbours of node i) dmin minimum degree dmax maximum degree D degree in a graph (random variable) E [D] average network degree E [Dnn] average degree of a node’s direct neighbours E [Wnn] average node weight of a node’s direct neighbours fwl (x) probability density function of the link weights fwn (x) probability density function of the node weights F certain set of Transformation relations T where F ⊂ T [Bunge,1979] F(σ) F-sector of human society σ where all the transformation relations contained in the
sub-systems structure (σ‘) define the F-sector [Bunge,1979] FS (σ) the specific functions of the F-sector F(σ) of human society σ [Bunge,1979] FX (x) probability distribution function of X G graph G(N,L) a network topology denoted by a graph G(N,L) consisting of a set N of N nodes
interconnected by a set L of L links GN hierarchical overlay level of an economic network relating to its graph GN (N,L) G(σ) generic functions of a human society σ [Bunge,1979]
Hmax maximum hopcount (the diameter of a network) KN complete graph with N nodes L number of links in a graph L set of L links in a graph N number of nodes in a graph N set of N nodes in a graph p link density of a network Pr[D=k] degree distribution R network interaction ratio si node strength (si sj /di dj)½ geometric mean of the average link weight incident to node i and j si/di average link weight incident to a node i
261
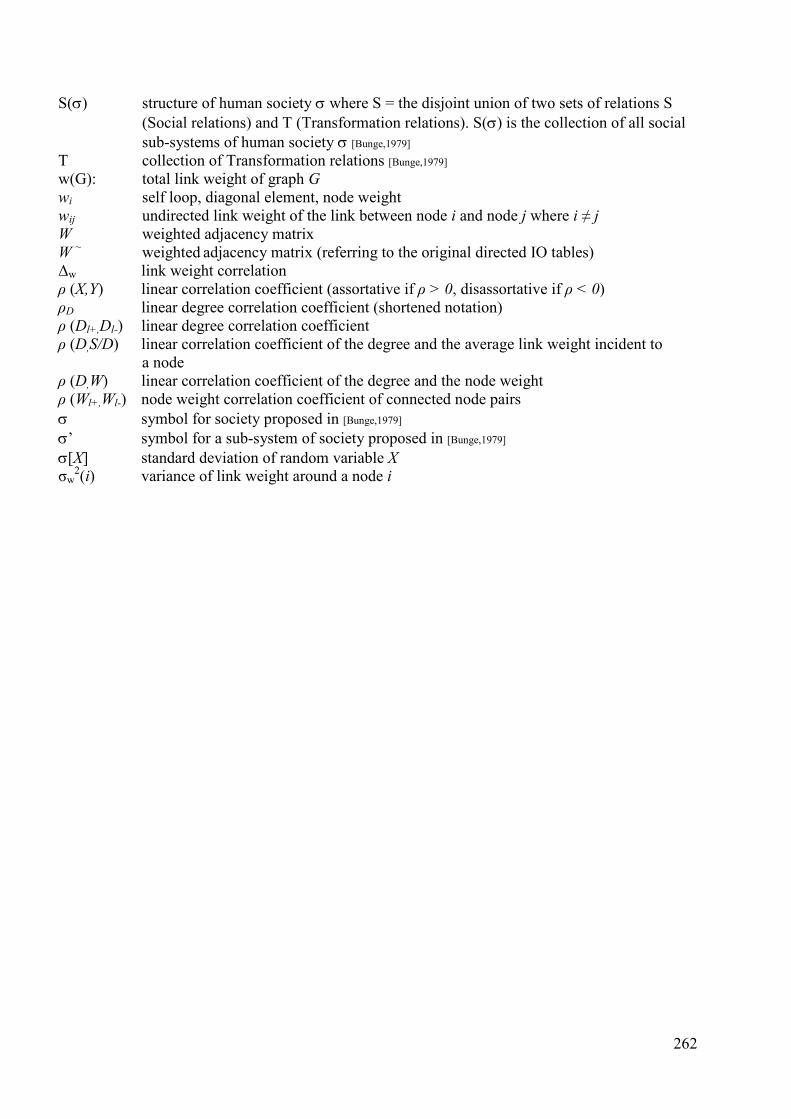
S(σ) structure of human society σ where S = the disjoint union of two sets of relations S (Social relations) and T (Transformation relations). S(σ) is the collection of all social sub-systems of human society σ [Bunge,1979]
T collection of Transformation relations [Bunge,1979] w(G): total link weight of graph G wi self loop, diagonal element, node weight wij undirected link weight of the link between node i and node j where i ≠ j W weighted adjacency matrix W ~ weighted adjacency matrix (referring to the original directed IO tables) Δw link weight correlation ρ (X,Y) linear correlation coefficient (assortative if ρ > 0, disassortative if ρ < 0) ρD linear degree correlation coefficient (shortened notation) ρ (Dl+,Dl-) linear degree correlation coefficient ρ (D,S/D) linear correlation coefficient of the degree and the average link weight incident to
a node ρ (D,W) linear correlation coefficient of the degree and the node weight ρ (Wl+,Wl-) node weight correlation coefficient of connected node pairs σ symbol for society proposed in [Bunge,1979] σ’ symbol for a sub-system of society proposed in [Bunge,1979] σ[X] standard deviation of random variable X σw
2(i) variance of link weight around a node i
262
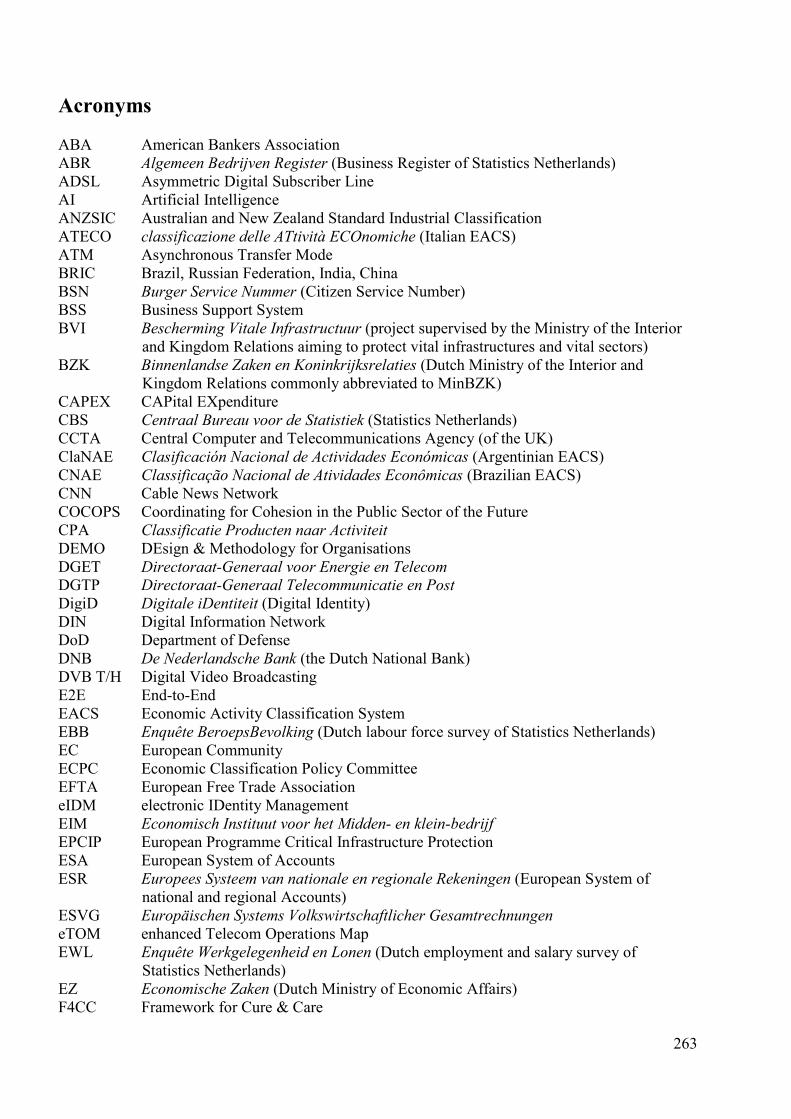
Acronyms ABA American Bankers Association ABR Algemeen Bedrijven Register (Business Register of Statistics Netherlands) ADSL Asymmetric Digital Subscriber Line AI Artificial Intelligence ANZSIC Australian and New Zealand Standard Industrial Classification ATECO classificazione delle ATtività ECOnomiche (Italian EACS) ATM Asynchronous Transfer Mode BRIC Brazil, Russian Federation, India, China BSN Burger Service Nummer (Citizen Service Number) BSS Business Support System BVI Bescherming Vitale Infrastructuur (project supervised by the Ministry of the Interior and Kingdom Relations aiming to protect vital infrastructures and vital sectors) BZK Binnenlandse Zaken en Koninkrijksrelaties (Dutch Ministry of the Interior and Kingdom Relations commonly abbreviated to MinBZK) CAPEX CAPital EXpenditure CBS Centraal Bureau voor de Statistiek (Statistics Netherlands) CCTA Central Computer and Telecommunications Agency (of the UK) ClaNAE Clasificación Nacional de Actividades Económicas (Argentinian EACS) CNAE Classificação Nacional de Atividades Econômicas (Brazilian EACS) CNN Cable News Network COCOPS Coordinating for Cohesion in the Public Sector of the Future CPA Classificatie Producten naar Activiteit DEMO DEsign & Methodology for Organisations DGET Directoraat-Generaal voor Energie en Telecom DGTP Directoraat-Generaal Telecommunicatie en Post DigiD Digitale iDentiteit (Digital Identity) DIN Digital Information Network DoD Department of Defense DNB De Nederlandsche Bank (the Dutch National Bank) DVB T/H Digital Video Broadcasting E2E End-to-End EACS Economic Activity Classification System EBB Enquête BeroepsBevolking (Dutch labour force survey of Statistics Netherlands) EC European Community ECPC Economic Classification Policy Committee EFTA European Free Trade Association eIDM electronic IDentity Management EIM Economisch Instituut voor het Midden- en klein-bedrijf EPCIP European Programme Critical Infrastructure Protection ESA European System of Accounts ESR Europees Systeem van nationale en regionale Rekeningen (European System of national and regional Accounts) ESVG Europäischen Systems Volkswirtschaftlicher Gesamtrechnungen eTOM enhanced Telecom Operations Map EWL Enquête Werkgelegenheid en Lonen (Dutch employment and salary survey of Statistics Netherlands) EZ Economische Zaken (Dutch Ministry of Economic Affairs) F4CC Framework for Cure & Care
263
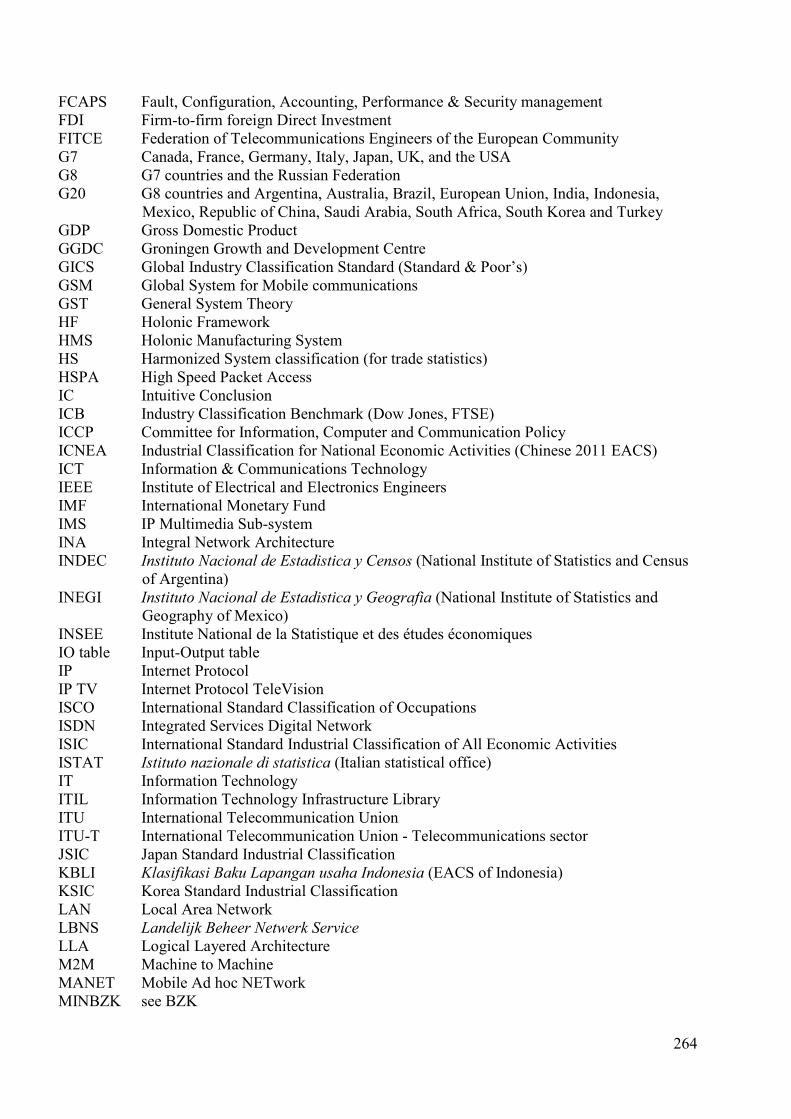
FCAPS Fault, Configuration, Accounting, Performance & Security management FDI Firm-to-firm foreign Direct Investment FITCE Federation of Telecommunications Engineers of the European Community G7 Canada, France, Germany, Italy, Japan, UK, and the USA G8 G7 countries and the Russian Federation G20 G8 countries and Argentina, Australia, Brazil, European Union, India, Indonesia, Mexico, Republic of China, Saudi Arabia, South Africa, South Korea and Turkey GDP Gross Domestic Product GGDC Groningen Growth and Development Centre GICS Global Industry Classification Standard (Standard & Poor’s) GSM Global System for Mobile communications GST General System Theory HF Holonic Framework HMS Holonic Manufacturing System
HS Harmonized System classification (for trade statistics) HSPA High Speed Packet Access IC Intuitive Conclusion ICB Industry Classification Benchmark (Dow Jones, FTSE) ICCP Committee for Information, Computer and Communication Policy ICNEA Industrial Classification for National Economic Activities (Chinese 2011 EACS) ICT Information & Communications Technology IEEE Institute of Electrical and Electronics Engineers IMF International Monetary Fund IMS IP Multimedia Sub-system INA Integral Network Architecture INDEC Instituto Nacional de Estadistica y Censos (National Institute of Statistics and Census of Argentina) INEGI Instituto Nacional de Estadistica y Geografia (National Institute of Statistics and Geography of Mexico) INSEE Institute National de la Statistique et des études économiques IO table Input-Output table IP Internet Protocol IP TV Internet Protocol TeleVision ISCO International Standard Classification of Occupations ISDN Integrated Services Digital Network ISIC International Standard Industrial Classification of All Economic Activities ISTAT Istituto nazionale di statistica (Italian statistical office) IT Information Technology ITIL Information Technology Infrastructure Library ITU International Telecommunication Union ITU-T International Telecommunication Union - Telecommunications sector JSIC Japan Standard Industrial Classification KBLI Klasifikasi Baku Lapangan usaha Indonesia (EACS of Indonesia) KSIC Korea Standard Industrial Classification LAN Local Area Network LBNS Landelijk Beheer Netwerk Service LLA Logical Layered Architecture M2M Machine to Machine MANET Mobile Ad hoc NETwork MINBZK see BZK
264
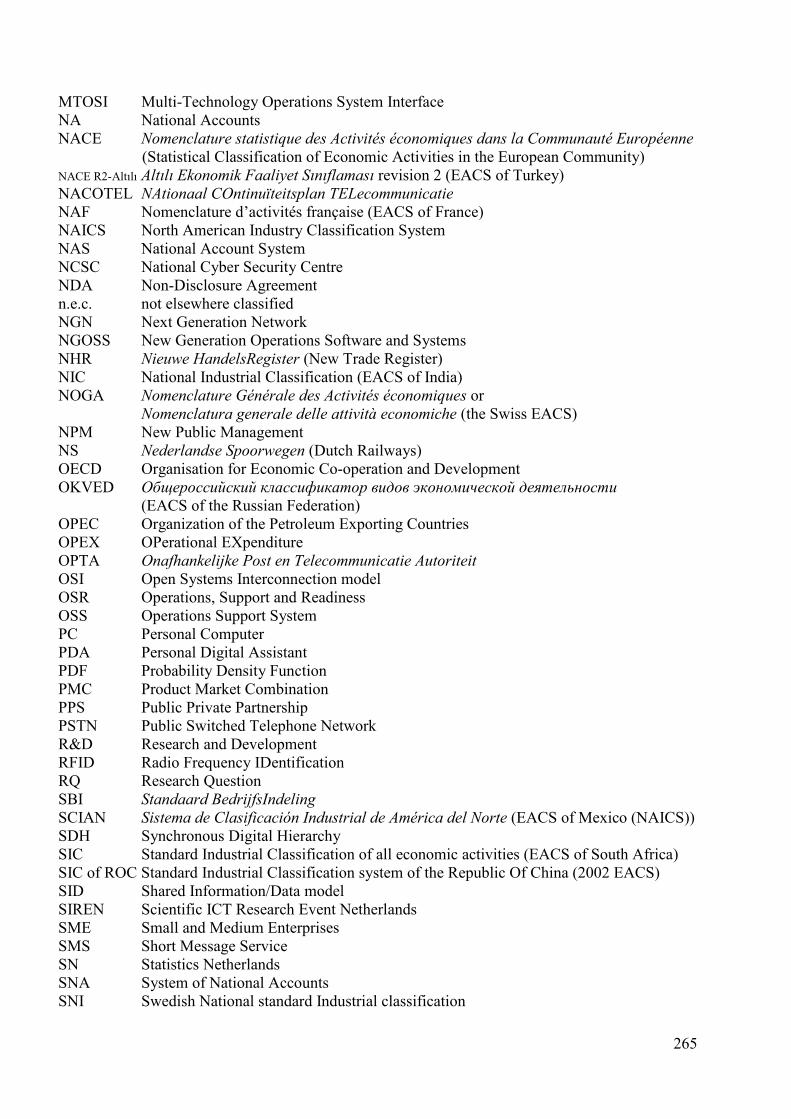
MTOSI Multi-Technology Operations System Interface NA National Accounts NACE Nomenclature statistique des Activités économiques dans la Communauté Européenne
(Statistical Classification of Economic Activities in the European Community) NACE R2-Altılı Altılı Ekonomik Faaliyet Sınıflaması revision 2 (EACS of Turkey) NACOTEL NAtionaal COntinuïteitsplan TELecommunicatie NAF Nomenclature d’activités française (EACS of France) NAICS North American Industry Classification System NAS National Account System NCSC National Cyber Security Centre NDA Non-Disclosure Agreement n.e.c. not elsewhere classified NGN Next Generation Network NGOSS New Generation Operations Software and Systems NHR Nieuwe HandelsRegister (New Trade Register) NIC National Industrial Classification (EACS of India) NOGA Nomenclature Générale des Activités économiques or
Nomenclatura generale delle attività economiche (the Swiss EACS) NPM New Public Management NS Nederlandse Spoorwegen (Dutch Railways) OECD Organisation for Economic Co-operation and Development OKVED Общероссийский классификатор видов экономической деятельности (EACS of the Russian Federation) OPEC Organization of the Petroleum Exporting Countries OPEX OPerational EXpenditure OPTA Onafhankelijke Post en Telecommunicatie Autoriteit OSI Open Systems Interconnection model OSR Operations, Support and Readiness OSS Operations Support System PC Personal Computer PDA Personal Digital Assistant PDF Probability Density Function PMC Product Market Combination PPS Public Private Partnership PSTN Public Switched Telephone Network R&D Research and Development RFID Radio Frequency IDentification RQ Research Question SBI Standaard BedrijfsIndeling SCIAN Sistema de Clasificación Industrial de América del Norte (EACS of Mexico (NAICS)) SDH Synchronous Digital Hierarchy SIC Standard Industrial Classification of all economic activities (EACS of South Africa) SIC of ROC Standard Industrial Classification system of the Republic Of China (2002 EACS) SID Shared Information/Data model SIREN Scientific ICT Research Event Netherlands SME Small and Medium Enterprises SMS Short Message Service SN Statistics Netherlands SNA System of National Accounts SNI Swedish National standard Industrial classification
265
SOFI SOciaal-FIscaal nummer SQ Sub-Question of a Research Question Stats SA Statistics South Africa STOF Service, Technology, Organization, Finance TAM Telecom Applications Map TCP Transmission Control Protocol TDM Time Division Multiplexing TI Trans-sector Innovation TINA Telecommunications Information Networking Architecture TIP TMF Interface Program TMF TeleManagement Forum TMN Telecommunications Management Network TNO Nederlandse Organisatie voor toegepast natuurwetenschappelijk onderzoek TRBC Thomson Reuters Business Classification UKSIC United Kingdom Standard Industrial Classification of Economic Activities UMTS Universal Mobile Telecommunications System UN United Nations UNSC United Nations Statistical Commission UNSD United Nations Statistics Division USB Universal Serial Bus VAS Value Added Service VGR Volkswirtschaftliche Gesamtrechnungen (German National Accounts) VoIP Voice over Internet Protocol VPN Virtual Private Network WDM Wavelength Division Multiplexing WIOD World Input Output Database WODC Wetenschappelijk Onderzoeks- en DocumentatieCentrum WPIIS Working Party on Indicators for the Information Society (OECD 1997) WRR Wetenschappelijke Raad voor het Regeringsbeleid (the Netherlands Scientific Counsel for Government policy) WZ Klassifikation der Wirtschaftszweige (EACS of Germany) xDSL Digital Subscriber Line (where x indicates the class of DSL technology)
266