Adelaide stroke incidence study: declining stroke rates but many preventable cardioembolic strokes
Upload
khangminh22Category
view
1download
0
International Journal of
Environmental Research
and Public Health
Review
Economic Burden of Stroke Disease: A Systematic Review
Thinni Nurul Rochmah 1,2,* , Indana Tri Rahmawati 1 , Maznah Dahlui 1,3 , Wasis Budiarto 1
and Nabilah Bilqis 1
�����������������
Citation: Rochmah, T.N.;
Rahmawati, I.T.; Dahlui, M.; Budiarto,
W.; Bilqis, N. Economic Burden of
Stroke Disease: A Systematic Review.
Int. J. Environ. Res. Public Health 2021,
18, 7552. https://doi.org/10.3390/
ijerph18147552
Academic Editors: Zubair Kabir and
Paul B. Tchounwou
Received: 30 April 2021
Accepted: 10 July 2021
Published: 15 July 2021
Publisher’s Note: MDPI stays neutral
with regard to jurisdictional claims in
published maps and institutional affil-
iations.
Copyright: © 2021 by the authors.
Licensee MDPI, Basel, Switzerland.
This article is an open access article
distributed under the terms and
conditions of the Creative Commons
Attribution (CC BY) license (https://
creativecommons.org/licenses/by/
4.0/).
1 Department of Health Administration and Policy, Faculty of Public Health, Universitas Airlangga,Surabaya 60115, Indonesia; [email protected] (I.T.R.);[email protected] (M.D.); [email protected] (W.B.); [email protected] (N.B.)
2 The Airlangga Centre for Health Policy Research Group, Surabaya 60115, Indonesia3 Centre of Population Health, Department of Social and Preventive Medicine, Faculty of Medicine,
University of Malaya, Kuala Lumpur 50603, Malaysia* Correspondence: [email protected]; Tel.: +62-812-3160-690
Abstract: Globally, one of the main causes of non-communicable disease as a cause of death everyyear is stroke. The objective of this study was to analyze the burden in consequence of stroke. Thisresearch used a systematic review method. Furthermore, a search for articles was carried out inJune–July 2020. Four databases were used to search articles from 2015 to 2020. Eligible studieswere identified, analyzed, and reported following the Preferred Reporting Items for SystematicReviews and Meta-Analysis (PRISMA) guidelines. The inclusion criteria were prospective coststudies, retrospective cost studies, database analysis, mathematical models, surveys, and COI studiesthat assess burden of stroke in primary and referral healthcare (hospital-based). The results showedthat from four databases, 9270 articles were obtained, and 13 articles were qualified. A total of9270 articles had the identified search keywords, but only 13 articles met the set criteria for inclusion.The criteria for inclusion were stroke patients, the economic burden of stroke disease based on costof illness method, which is approximately equal to USD 1809.51–325,108.84 (direct costs 86.2%, andindirect costs 13.8%). Those that used the health expenditure method did not present the total cost;instead, only either direct or indirect cost of health expenditure were reported. For most hospitaladmissions due to stroke, LOS (length of stay) was the dominant cost. The high economic burden tomanage stroke justifies the promotion and preventive efforts by the policymakers and motivates thepractice of healthy lifestyles by the people.
Keywords: economic burden of disease; length of stay; stroke; cerebrovascular accident
1. Introduction
Cardiovascular disease (CVD) is a non-communicable disease and the world’s maincause of death (17.9 million deaths annually) [1]. Cardiovascular disease has been responsi-ble for 37% of total mortality in Indonesia. Stroke is the leading cause of cardiovasculardisease, followed by coronary heart disease and diabetes [2]. This shows that there is cur-rently an epidemiological transition that has shifted the burden of disease from infectiousdiseases to non-communicable diseases [3].
Stroke is the leading cause of death and disability worldwide, and the economic costsof post-stroke care are enormous [4]. As of now, approximately 34% of the global totalhealthcare expenditure is spent on stroke. The average healthcare cost of stroke per person,including inpatient care, rehabilitation, and follow-up care, is estimated at USD 140,048 inthe United States [5].
Stroke burden in people under the age of 65 has increased in recent decades. Currently,there is an alarming shift from the overall stroke burden to younger age groups, particularlyin low-moderate-income countries. The worldwide incidence of stroke in the 20 to 64 yearsage group has increased by 25%, while the incidence of stroke is higher in men aged
Int. J. Environ. Res. Public Health 2021, 18, 7552. https://doi.org/10.3390/ijerph18147552 https://www.mdpi.com/journal/ijerph

Int. J. Environ. Res. Public Health 2021, 18, 7552 2 of 16
55–75 years [6]. The epidemic increase in cardiovascular risk factors in young adults inregions such as Russia, China, and India has contributed to the increased stroke burdenamong the younger population [5]. The highest incidence rate of stroke occurred in Asia, acontinent containing more than 60% of the world’s population; the second highest incidencerate of stroke was experienced by people in Eastern Europe, while the lowest was in centralLatin America [6]. Mortality caused by stroke is higher in Asia than in Western Europe,America, or Australasia (similar to Eastern Europe).
In Indonesia, the national prevalence of stroke has increased from 0.7% in 2013 to1.09% in 2018 [7]. The increase in the prevalence of cardiovascular disease results in thehigher number of outpatient and inpatient services, as well as the economic impact thatthe state must manage through the National Health Insurance (JKN) Program. The dataissued by the Social Security Agency for 2016 stated that stroke costs a service fee of USD950,715, which makes non-communicable diseases a significant disease burden. Apart frommedical expenses, people with cardiovascular disease will cause economic losses for thecountry’s productivity. Patients with cardiovascular disease generally have disabilities,making them unable to carry out their daily activities independently. This condition causesthem to depend on other people to accompany them on their activities, including patientsundergoing treatment [8].
Disease burden studies could help policymakers understand the economic costs ofa particular disease. Such disease burden studies identify various cost components fora particular disease or disease-related complications in different sectors that might havebeen saved if the disease is not present. Moreover, disease burden studies have an essentialrole in public health to formulate and prioritize healthcare policies and allocate healthcareresources by estimating the total costs that can be incurred by the disease(s) [9].
Various indicators could describe the disease burden in the population. Epidemiolog-ical indicators include life expectancy, mortality rates, and the total of new and existingspecific disease cases (e.g., incidence and prevalence) [10]. Epidemiological indicators showthe value of the disability-adjusted life year (DALY) and quality-adjusted life year (QALY)from a disease. The use of inpatient and outpatient services is also an indicator of thedisease burden [11] and economic loss measurements such as absences, incapacity to work,the use of medical facilities, and other related costs. The calculated economic componentsinclude direct medical costs, direct non-medical costs, and indirect costs outlined in thecost of illness (COI) and health expenditure (HE) methods.
This systematic review aimed to analyze the disease burden due to stroke. In thissystematic review, some of the critical questions posed are: (1) analyzing the averagelength of hospitalization for stroke, and (2) the magnitude of economic losses due to stroke,including direct medical costs, direct non-medical costs, and indirect costs.
2. Methods
The method used in this systematic review consisted of a search strategy, inclusionand exclusion criteria, data extraction, and quality assessments of included studies.
2.1. Search Strategy
The literature search in this systematic review used databases with high- and medium-quality criteria, namely, Scopus, Science Direct, Proquest, and Springerlink journals. Searchterms used burden of stroke disease studies were: “burden of disease”, “length of stay”,“cost of illness”, “burden of illness”, “cost of disease”, “cost of sickness”, “disease cost”,“economics burden of disease”, “sickness cost”, “cardiovascular disease”, “cerebrovascu-lar accident (CVA)”, “cerebral accident”, “cerebrovascular apoplexy”, “cerebrovascularstroke”, “vascular accident”. The terms were matched with terms in the Medical SubjectHeading (MeSH) database. The strategy used to search for articles was enacted by spec-ifying the basis of economic evaluation studies considered in systematic reviews. Theseconsiderations included the participant or population, exposure, context (geographicalhealth setting and culture), and outcome measures framework (PECOS) [12]. In addi-

Int. J. Environ. Res. Public Health 2021, 18, 7552 3 of 16
tion, study selection was also reported in the Preferred Reporting Items for SystematicReviews and Meta-Analysis (PRISMA) flowchart. The search strategy identified 9270 stud-ies. The elimination of duplicates and title and abstract screening resulted in the removalof 6456 studies. The full-text screening was performed in 2814 studies that resulted in2720 unrelated studies, which should be excluded. A total of 94 articles were assessed foreligibility and resulted in 81 articles that were excluded for being not related to stroke, itsburden, and original articles. The search was carried out in June–July 2020, wherein theliterature search was limited to the year of publication from 2015 to 2020. The searchedarticles for this systematic review had been confined to publications in the last 5 years (1January 2015 to 22 March 2020) to capture the studies conducted in the era of multipletreatment options available which reduces the burden of recurrent stroke.
2.2. Inclusion and Exclusion Criteria
Inclusion and exclusion criteria were applied in economic evaluation to obtain rele-vant studies for further systematic review research. Inclusion and exclusion criteria wereassessed according to PECOS. The inclusion criteria for participants or populations werestudies that focused on stroke patients, while the exclusion criteria were absent. Further-more, the inclusion criteria for exposure(s) were studies that examined stroke burden, whilethe exclusion criteria were absent. Furthermore, the inclusion criteria for context were stud-ies covering primary and referral healthcare (hospital-based), and there were no exclusioncriteria. In the outcome measures indicator, the inclusion criteria needed were studies thatexplained direct or indirect costs. Direct cost is expenditure related with expenditure fortreatment and rehabilitation, as well as non-medical cost outside the health system suchas patient transportation, the cost of informal care, or other expenses borne by the patient.Indirect costs are the loss of household productive labor time for patient and caregiversdue to disability and mortality. This is mentioned in the Discussion section. There were noexclusion criteria. On the other hand, for study design and publication type, the inclusioncriteria were all types of publications, including prospective cost studies, retrospective coststudies, database analysis, mathematical models, surveys, and COI studies. Meanwhile,the exclusion criteria were those that were not original articles. Regarding the publicationyears and language, those that had a publication year of 2015–2020 and were written inEnglish were included, and there were no exclusion criteria.
2.3. Data Extraction and Data Analysis
Data extraction was used to separate which data were involved in the research, con-sisting of several indicators used in assessing research articles. These indicators includedthe year of publication (2015–2020). The disease studied for this study was stroke. Researchsettings were grouped on the basis of the economic status of a country (lower-moderateincome, upper-moderate income, and high income). Study designs that were includedwere prospective, retrospective, or cross-sectional studies. The calculation method usedwas cost of illness or health expenditure. The approach used was incidence-based orprevalence-based, a cost perspective on the healthcare system, third-party payers, partic-ipants, or society. This study was peer-reviewed by two people, namely, ITR and TNR.Keywords in this systematic review were adjusted to the Medical Subject Heading (MeSH).The keywords used to search were “length of stay”, “burden of disease”, “cost of ill-ness”, “burden of illness”, “cost of disease”, “cost of sickness”, “disease cost”, “economicsburden of disease”, “sickness cost”, “cardiovascular disease”, “cerebrovascular accident(CVA)”, “cerebral accident”, “cerebrovascular apoplexy”, “cerebrovascular stroke”, and“vascular accident”.
Data analysis was carried out by collecting and synthesizing information on generalstudy characteristics (including country settings and economic status), methodologicalcharacteristics (study design, data sources, approaches, and calculated disease burdenindicators), and estimated economic burdens (currency and year, cost components, costperspective). Information was carried out by descriptively focusing on the burden of

Int. J. Environ. Res. Public Health 2021, 18, 7552 4 of 16
disease due to stroke at the household, health system, and community levels. Data weremanaged and analyzed using Microsoft Excel software.
2.4. Quality Assessments
Quality assessment has several eligibility criteria based on seven-question qualityassessment tool adapted from Gheorghe’s study [13], in which it includes both the economicand epidemiological components. This instrument focuses on two aspects, namely, thedesign of economic and epidemiological studies (carried out in conjunction with economicstudies). They include several questions that researchers use to assess the article content’squality, appropriateness, and suitability. The economic aspects include: (1) explanation ofdata sources for expenditure, resource use, and unit costs; (2) transparency of data on costsand/or expenses; (3) calculation of productivity costs; (4) the results of the calculation ofproductivity costs; (5) analysis addresses uncertainty and/or heterogeneity, e.g., analysis onsubgroups. In addition, the epidemiological aspects considered in this quality assessmenthad included: (1) sampling method to determine prevalence/incidence; (2) the source ofprevalence data that contributes to the study’s internal validity. The total assessment ofquality criteria categories performed were good (score 74–100%; fair (score 47–73%), andpoor (20–46%).
3. Results
Figure 1 presents a PRISMA flow chart that summarizes the inclusion and exclusiondecisions made by the authors. Researchers found 9270 articles that matched the keywords,and search results obtained were then checked for duplications. At the initial identificationstage, at least 6456 duplicate articles were deleted. A total of 2814 titles and abstracts werescreened according to the theme (stroke burden). However, 2720 articles were excluded asthey did not match the theme. On the basis of the title and abstract selection stages, weassessed 94 articles for their feasibility and conformity with the eligibility criteria. Thisstage resulted in 81 articles being excluded as they were not related to stroke (42 articles)nor disease burden (28 articles), were original articles (10 articles), and were not Englishfull-texts (1 article). The application of these inclusion criteria resulted in 13 articles deemedsuitable for systematic review research.
3.1. Quality of Included Studies
The quality of each article was determined using a seven-question quality assess-ment tool adapted from a previous study by Gheorghe et al. [14]. This instrument fo-cused on two aspects, namely, epidemiological studies carried out in conjunction witheconomic studies. A summary of the results of this systematic review is presented (seeSupplementary Materials Table S1). The majority of included studies did not meet all qual-ity assessment criteria; however, none of the studies were classified as poor-quality studies.Five studies obtained a percentage of 100% good quality criteria (items 3, 4, 6, 8, and 11,see Supplementary Materials Table S2). One of the challenges associated with qualityassessment was that quality was judged on the basis of published data only. There mightbe discrepancies between what has been reported and what has been done. The majority ofthe criteria that could not be met were the criteria regarding productivity costs due to theCOI method, which did not calculate production costs, and thus many articles did not meetthese criteria. In addition, for the epidemiological component, even though all articles metthe criteria, there was no single article that presented the calculation of QALY or DALY.

Int. J. Environ. Res. Public Health 2021, 18, 7552 5 of 16Int. J. Environ. Res. Public Health 2021, 18, x 5 of 17
Figure 1. PRISMA flowchart.
3.1. Quality of Included Studies The quality of each article was determined using a seven-question quality assessment
tool adapted from a previous study by Gheorghe et al. [14]. This instrument focused on two aspects, namely, epidemiological studies carried out in conjunction with economic studies. A summary of the results of this systematic review is presented (see Supplemen-tary Materials Table S1). The majority of included studies did not meet all quality assess-ment criteria; however, none of the studies were classified as poor-quality studies. Five studies obtained a percentage of 100% good quality criteria (items 3, 4, 6, 8, and 11, see Supplementary Materials Table S2). One of the challenges associated with quality assess-ment was that quality was judged on the basis of published data only. There might be discrepancies between what has been reported and what has been done. The majority of the criteria that could not be met were the criteria regarding productivity costs due to the COI method, which did not calculate production costs, and thus many articles did not meet these criteria. In addition, for the epidemiological component, even though all arti-cles met the criteria, there was no single article that presented the calculation of QALY or DALY.
3.2. Characteristics of Included Studies The characteristics of included studies (n = 13) are shown in Table 1. The characteris-
tics of the included studies are made to determine the study design, study scope, economic perspective, and the types of diseases required in the systematic review. Furthermore,
Figure 1. PRISMA flowchart.
3.2. Characteristics of Included Studies
The characteristics of included studies (n = 13) are shown in Table 1. The characteristicsof the included studies are made to determine the study design, study scope, economicperspective, and the types of diseases required in the systematic review. Furthermore, fromthe included studies, 13 articles (100%) were studies on types of stroke [15–27]. Three typesof study designs included a prospective cost study of five articles (38%) [15,22–24,26], aretrospective cost study of six articles (46%) [15,16,18,20,24,26], and a cross-sectional studyof two articles (15%) [18,20]. The calculation method used was the COI in eight articles(62%) [15,17,19,20,23,25–27] and the HE method in five articles (38%) [16,18,21,22,24]. Theapproach taken was a prevalence-based approach in 11 articles (85%) [16–21,23–27] and2 articles on the basis of incidence rate (15%) [15,22]. On the other hand, there were fivearticles (38%) with a societal economic perspective [18,20–22,25], and five articles (38%)with an economic perspective of healthcare system [15,19,23,25,27]. One article (8%) hada third-party payer perspective [16], and two articles (15%) had a participant and familyperspective [17,24]. Meanwhile, countries used as research locations in terms of economicstatus were only in upper-middle-income and high-income countries whose articles wereincluded in the criteria. In countries with upper-middle-income economic status, therewas one article (8%) that fit the criteria in Lebanon, Colombia, China, Turkey, South Africa,and Brazil [15,16,19,23,26,27]. Furthermore, study locations in countries with high-incomeeconomic status and suitable articles were South Korea, Denmark, and the Netherlands,each with one article, respectively (8%) [17,20,25], while Sweden and United States hadeach published two articles (15%) [18,21,22,24].

Int. J. Environ. Res. Public Health 2021, 18, 7552 6 of 16
Table 1. A summary of the indicators of disease burden studied in selected articles (n = 13).
No. Researcher andYear
ResearchSetting Country Group
ApproachSource of Data
Indicator ofCalculated
Disease BurdenResearch Design CalculationMethod Method Cost Perspective
1 Abdo, et al. (2018)[15] Lebanon Upper-
middleincome Prospective Cost of illness(COI) Incidence-based Healthcare
system 203 stroke patients Direct medical cost
2 Camacho, et al.(2018) [16] Colombia Upper-
middleincome Retrospective Healthexpenditure Prevalence-based Third-party
payer
Data are provided byACEMI, an association ofColombian private health
insurance companies
Direct medical cost
3 Cha, Yu–Jin (2018)[17] South Korea High income Retrospective Cost of illness
(COI) Prevalence-basedParticipant
(patients) andfamilies
Insurance claims datagenerated during 2015 in
Korea (N = 515,848)
Direct medical cost,direct cost,
indirect cost.
4 Ganapathy (2015)[18] United States High income Cross-sectional Health
expenditure Prevalence-based Society
Internet survey data werecollected from
153 caregivers ofstroke patients
Indirect cost(productivity lost)
5 Içagasıoglu, et al.(2017) [19]
Turkey Upper-Middleincome Retrospective Cost of Illness
(COI) Prevalence-based Healthcaresystem 84 stroke patients Direct and
Indirect cost
6 Jennum, et al.(2015) [20] Denmark High income Cross-sectional Cost of illness
(COI) Prevalence-based Society
Records from the DanishNational Patient Registryof 93,047 ischemic, 26,012hemorrhagic, and 128,824
stroke patients wereunspecified and
compared with 364,433,103,741, and 500,490
matched controls,respectively.
Direct medical cost
7 Joo, et al. (2017)[21] United States High income Retrospective Health
expenditure Prevalence-based Society
Using the 2010 Healthand Pension Study, dataon un-institutionalizedadults aged ≥ 65 years
(n = 10,129) in 2015–2017
Indirectmedical cost
8 Lekander, et al.(2017) [22] Sweden High income Prospective Health
expenditure Incidence-based Society
47,807 patients werediagnosed with stroke
during 2007–2010,allowing for two years of
follow-up
Total cost

Int. J. Environ. Res. Public Health 2021, 18, 7552 7 of 16
Table 1. Cont.
No. Researcher andYear
ResearchSetting Country Group
ApproachSource of Data
Indicator ofCalculated
Disease BurdenResearch Design CalculationMethod Method Cost Perspective
9 Maredza andChola (2016) [23] South Africa Upper-
middleincome Prospective Cost of illness(COI) Prevalence-based Healthcare
system
A population of around90,000 people living in
the Agincourt sub-districtof Mpumalanga province,
northeast South Africa,covered by a
demographic and healthsurveillance system
(health and demographicsurveillance system,
HDSS)
Direct cost
10 Persson, et al.(2017) [24] Sweden High income Prospective Health
expenditure Prevalence-basedParticipant
(patients) andfamilies
53 couples providedinformal support, and 168couples did not provide
informal support
Indirectmedical cost
11 Van Eeden, et al.(2015) [25]
TheNetherlands High income Retrospective Cost of illness
(COI) Prevalence-based Society 395 stroke patients Total cost
12 Vieira, et al. (2019)[26] Brazil Upper-
middleincome Prospective Cost of illness(COI) Prevalence-based Healthcare
system 173 stroke patients Direct medical cost
13 Zhang, et al.(2019) [27] China Upper-
middleincome Retrospective Cost of illness(COI) Prevalence-based Healthcare
system
A total of 114,872 werehospitalized for five types
of strokeDirect medical cost

Int. J. Environ. Res. Public Health 2021, 18, 7552 8 of 16
Table 1 shows a summary of the disease burden indicators studied in each article,which included a total of 13 studies. The indicators studied in each article depended onthe method used; either direct, indirect or both direct and indirect cost. On the basis ofthe results of these studies, one can group them according to the determined systematicreview theme, namely, the burden of stroke. Presentation of results will be determined onthe basis of length of hospitalization; calculation of economic losses in terms of methods,approaches, cost components, and economic perspectives; and the condition of economicloss due to stroke as per the included articles.
There are six countries with upper-middle-income economic status that were examinedin terms of economic losses due to stroke, namely, Lebanon, Turkey, South Africa, Brazil,China, and Colombia, while the remaining countries have high-income economic status.Meanwhile, calculation using the COI or HE methods depends on the objective of thestudy. Both COI and HE may include either direct, indirect or both direct and indirect cost,therefore, a study can use a complex disease burden analysis using both the COI and HEmethods [28].
3.3. Average Length of Stay for Stroke
Of the 13 selected articles, 3 articles examined the average length of hospitalizationof stroke patients. The description of the length of stay for stroke patients can be seen inTable 2.
Table 2. Descriptions of length of hospitalization for stroke patients.
No. Research Cited Results of Research on Length ofHospitalization
Description on the Causes of Lengthof Hospitalization
1 Abdo et al. (2018) [15] In Lebanon, the average strokehospitalization was 13–18 days.
Predictors of higher LOS were highNational Institution of Health Stroke
Scale (NIHSS) at admission, ICU LOS,surgery, and infection complications.
2 Içagasıoglu et al. (2017) [19]
In Turkey, the length of hospitalizationof stroke patients ranged from 0 and
75 days, with a mean duration of11–15 days.
NA
3 Zhang et al. (2019) [27]In China, the average length of
hospitalization in the hospital was27 days.
NA
Abdo [14] showed that in Lebanon, the average length of stroke at the hospital was13–18 days. Another study conducted by Içagasıoglu et al. (2017) [19] showed that inTurkey, the length of stay of stroke patients ranged from 0 to 75 days, with an averagelength of stay of 11–15 days. Meanwhile, a study conducted by Zhang et al. (2019) [27]showed that in China, stroke patients had an average of 27 days of hospitalization.
The mean LOS was higher in patients with intracerebral hemorrhage (ICH) com-pared to ischemic stroke (IS). Predictors of higher LOS were the National Institution ofHealth Stroke Scale (NIHSS), which had a high admission scale, patients at ICU, patientsundergoing surgery, and patients with infectious complications [15].
On the other hand, Içagasıoglu et al. (2017) [19] and Zhang et al. (2019) [27] didnot describe in detail the causes of the length of hospitalization, and therefore morecomplete information could not be obtained by the researcher. Of the three articles, Turkeyoccupied the lowest position in the duration of hospitalization for stroke patients, whileChina occupied the highest position in the length of stroke hospitalization, which reached27 days.

Int. J. Environ. Res. Public Health 2021, 18, 7552 9 of 16
3.4. Cost Incurred by Stroke
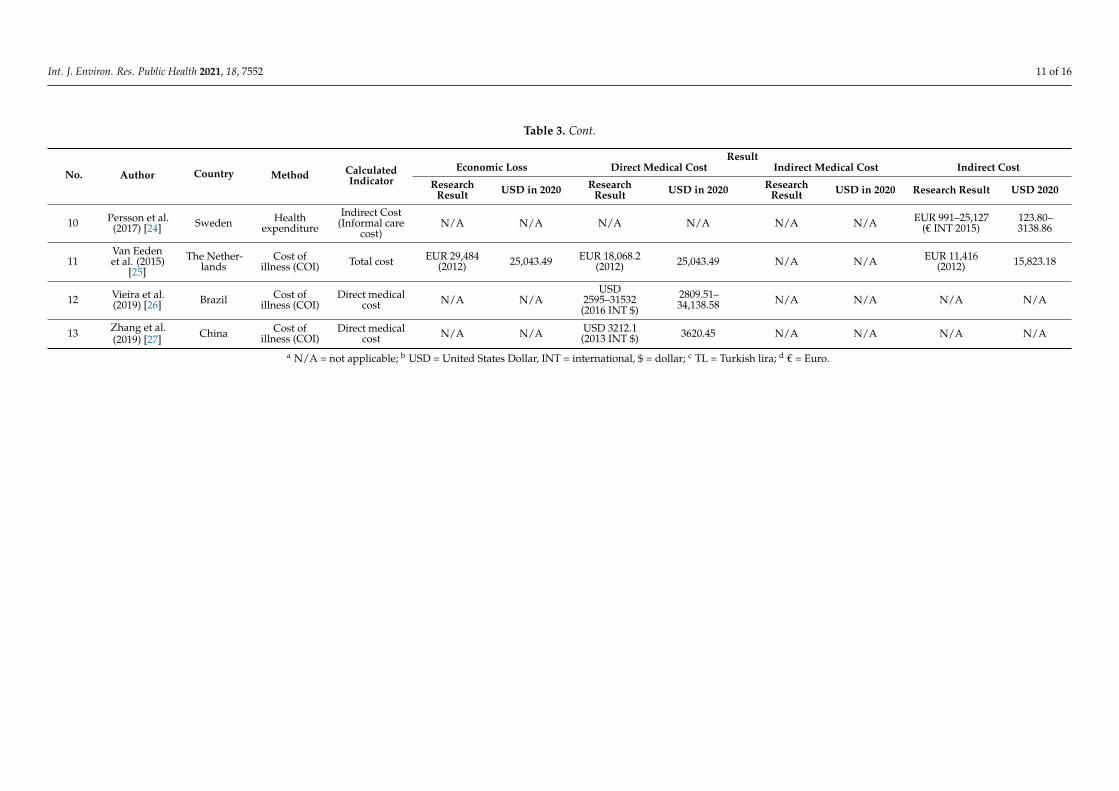
There were 13 articles included to calculate the economic loss due to stroke. Thearticles came from different countries with different currencies and different years ofresearch. In this systematic review, each result of economic loss calculation from theselected articles was adjusted to USD in 2020 (INT $2020). The results of the currencyconversion for each cost are presented in Table 3.
Table 3 show the presentation of economic burden due to stroke was differentiatedon the basis of country groups, namely, upper-middle-income and high-income countries.Each country group was also presented separately between the calculations on the basis ofthe COI method and the health expenditure method. The entire value of economic lossespresented in this study was adjusted to USD in 2020. On the basis of 13 articles, there were5 articles that analyzed the economic burden of stroke based on health expenditure, whilethe other 8 articles analyzed the economic burden of stroke on the basis of cost of illness.On the basis of the cost of illness method, we found that the largest cost component due tostroke was direct medical cost and indirect medical cost, accounting for 86.2% and 13.8%of the total cost, respectively. The economic burden of stroke disease in terms of cost ofillness method was approximately equal to USD 1809.51–325,108.84. As for the articles thatreported the cost on the basis of health expenditure method, only one article was found tohave reported that the direct cost to treat stroke was, on average, USD 4905.33, while fourarticles measured the indirect cost, which was, on average, USD 2739.73.
The COI method is a method that is easy to implement but has the disadvantage oflosing utility value due to disease [29]. On the other hand, the HE method can measuretotal health expenditure, representing the amount spent on healthcare and related activities(such as insurance administration) but lacks data that require more detailed and specificdata on household spending, especially on indirect costs [24].
COI studies measure economic losses due to disease in certain populations [20]. COIstudies generally involve two separate cost analyses, namely, direct costs and indirect costs.Direct costs are the value of the resources used for the treatment and rehabilitation of theperson with the condition under study. Direct costs refer to all goods, services, and otherresources consumed during the delivery of a health intervention for a particular disease.This includes money spent on hospital care, on the services of doctors and other medicalprofessionals, medicines, equipment, and rehabilitation [19].
HE studies are used to calculate the costs incurred due to a disease. In this systematicreview, we found that the seven articles that used the HE method focused on direct non-medical costs and indirect costs, which include informal caregiver costs and productivitylost. Informal caregivers are defined as care activities provided by relatives, with or withoutcompensation. These activities include providing support for activities of daily living orinstrumental activities of daily living [21]. Caregiver costs include personal travel time tovisit sufferers and any expenses related to caregiving [18].
Loss of productivity is defined as the number of days of net sick leave and days ofearly retirement due to illness [30]. Meanwhile, the loss of productivity is assessed usingthe human capital approach with the assumption that production losses are assessed atmarket prices, namely, gross salary and payroll taxes. The cost of decreasing a person’sproductivity is equal to the amount the employer is willing to pay for the production. Thisis assumed to be the average gross salary plus employer contributions [24].

Int. J. Environ. Res. Public Health 2021, 18, 7552 10 of 16
Table 3. Results of cost conversion due to stroke.
No. Author Country Method CalculatedIndicator
ResultEconomic Loss Direct Medical Cost Indirect Medical Cost Indirect Cost
ResearchResult USD in 2020 Research
Result USD in 2020 ResearchResult USD in 2020 Research Result USD 2020
1 Abdo, et al.(2018) [15] Lebanon Cost of
Illness (COI)Direct medical
cost N/A a N/AUSD 6961
(2016 INT $)b
7536.43 N/A N/A N/A N/A
2 Camachoet al. (2018)
[16]Colombia Health
expenditureDirect medical
costN/A N/A
USD4277–4846
(2012 INT $)4905.33–4905.33 N/A N/A N/A N/A
N/A N/A USD 6245(2012 INT $) 7162.45 N/A N/A N/A N/A
3 Cha, Yu-Jin(2018) [17] South Korea Cost of
illness (COI)
Direct medicalcost, direct
cost, indirectcost
USD 7247(2015 INT $) 7931.80 N/A N/A N/A N/A N/A N/A
4 Ganapathy(2015) [18]
UnitedStates
Healthexpenditure
Indirect cost(productivity
lost)N/A N/A N/A N/A N/A N/A
Productivityloss of USD 269for absenteeismand USD 598 for
presenteeism.Total lost
productivity ofUSD 835 permonth (2012
INT $)
308.52685.85957.67
5Içagasıogluet al. (2017)
[19]Turkey Cost of
illness (COI)Direct and
indirect costTL 17,253.50
(2014) c 16,662.20 TL 8668(2014) 8370.94 N/A N/A TL 10,800 (2014) 10,429.87
6 Jennum et al.(2015) [20] Denmark Cost of
illness (COI)Direct medical
cost
EUR 10,772–13,888 (2009)
d
1701.07–2193.13
EUR8297–10,088
(2009)1310.23–1593.05 N/A N/A
EUR7377–10,720
(2009)1164.94–1692.86
7 Joo et al.(2017) [21]
UnitedStates
Healthexpenditure
Indirectmedical cost N/A N/A N/A N/A N/A N/A USD 2883–5777
(2015 INT $)3155.43–6322.90
8Lekander
et al. (2017)[22]
Sweden Healthexpenditure Total cost EUR 10,000–
120,0005,367,715.39–64,412,584.69 N/A N/A N/A N/A N/A N/A
9Maredza andChola (2016)
[23]South Africa Cost of
illness (COI) Direct cost N/A N/A USD 283,465(2012 INT $) 325,108.84 N/A N/A N/A N/A
Int. J. Environ. Res. Public Health 2021, 18, 7552 11 of 16
Table 3. Cont.
No. Author Country Method CalculatedIndicator
ResultEconomic Loss Direct Medical Cost Indirect Medical Cost Indirect Cost
ResearchResult USD in 2020 Research
Result USD in 2020 ResearchResult USD in 2020 Research Result USD 2020
10 Persson et al.(2017) [24] Sweden Health
expenditureIndirect Cost
(Informal carecost)
N/A N/A N/A N/A N/A N/A EUR 991–25,127(€ INT 2015)
123.80–3138.86
11Van Eedenet al. (2015)
[25]The Nether-
landsCost of
illness (COI) Total cost EUR 29,484(2012) 25,043.49 EUR 18,068.2
(2012) 25,043.49 N/A N/A EUR 11,416(2012) 15,823.18
12 Vieira et al.(2019) [26] Brazil Cost of
illness (COI)Direct medical
cost N/A N/AUSD
2595–31532(2016 INT $)
2809.51–34,138.58 N/A N/A N/A N/A
13 Zhang et al.(2019) [27] China Cost of
illness (COI)Direct medical
cost N/A N/A USD 3212.1(2013 INT $) 3620.45 N/A N/A N/A N/A
a N/A = not applicable; b USD = United States Dollar, INT = international, $ = dollar; c TL = Turkish lira; d € = Euro.

Int. J. Environ. Res. Public Health 2021, 18, 7552 12 of 16
4. Discussion
Stroke rapidly develops clinical signs of focal (or global) impairment of brain function,with symptoms lasting 24 h or more or leading to death without apparent cause other thana vascular cause [31]. To our knowledge, research is rarely conducted on the review ofeconomic evaluation methods in various countries to see the calculation of economic lossesusing the COI and HE methods and to analyze the average length of stay for stroke patients.
The review identified several emerging patterns. We found that among publishedeconomic evaluations, there were no consistent outcome measures. The majority of thestudies reported using the COI method, which varied on the basis of the point of view, datasource, indirect cost criteria, and timeframe for cost calculation [32]. On the other hand, theuse of the HE method was used to see the costs incurred by patients and families duringhealthcare, such as administrative costs and insurance in addition to the main variablesanalyzed such as the number of days at the hospital, home care services, the number ofdays with at least single contact with physicians, benefits of palliative home care, utilizationof health services in the past weeks, and public healthcare expenditures [33]. This showsthat the calculation of COI and HE could be carried out according to research needs, notwith certainty. The heterogeneity of this outcome measure could prevent the comparison ofthe two methods to see the economic loss due to stroke in certain income groups, regions,or even countries.
On the basis of the results, the average LOS of stroke patients was 11 to 27 days. Severalfactors causing LOS were severity, stroke volume, infection, complications, demographiccharacteristics, and the presence of emergency or medical status of the patient. This is inline with research by Curtain et al. (2017) [34], who stated that stroke patients at NorwichUniversity Hospital underwent an average hospitalization of 11 to 33 days. Furthermore,several factors affecting LOS for stroke patients included neurological lateralization, pre-stroke disability status, congestive heart failure, and age. Research conducted by Saxenaand Prasad in 2016 also supported the results of this study [35], which stated that somecauses of LOS for stroke patients were complications due to pressure sores and sepsis thatneeded them to stay for >7 days. Several studies suggested that a longer LOS leads tohigher economic losses [36]. The less time the patient is hospitalized, the more effectiveand efficient services the hospital can provide. Meanwhile, inefficient services are onecausing increased costs [37,38].
Direct costs incurred by the health system, society, families, and individual patientsconsisted of health and non-health costs. Health costs are defined as medical care expen-ditures for diagnosis, treatment, and rehabilitation. One of the challenges in calculatingdirect medical costs, particularly hospital costs, was that costs were often the only dataavailable. Due to the nature of determining hospital costs, it often did not accuratelyreflect the underlying costs. Costs were often higher than unit costs [39], and the resultsof the systematic review showed that the direct medical costs due to stroke were USD1593–34,138 [20,26]. In Indonesia, the average direct cost for stroke patients participating inthe Social Security Agency at Dr. Moh. Saleh Hospital was USD 1895.36, with a minimumto the maximum value range of USD 463.43–5159.22 [40].
Meanwhile, for patients without insurance from the Social Security Agency, the totaldirect cost was USD 38,013.72. The systematic review results showed that the highestcost in direct medical costs was found in inpatient costs (almost 65%). This finding is inline with research by Ye et al. (2020) [41], who showed that inpatient care was the largestcontributor to healthcare costs (70% of total costs), followed by outpatient services (11%)and skilled nursing care (8%).
Meanwhile, non-health costs are related to the consumption of non-healthcare re-sources such as transportation, household expenses, relocation, property loss, and informalcare of any kinds. Estimation of the direct costs associated with chronic disease was higherthan that related to an acute disease or infectious disease, for which methods of treatmentand prevention were effective [42]. These non-medical direct costs were estimated toaccount for 50% or more of all direct costs [43]. This systematic review showed that the

Int. J. Environ. Res. Public Health 2021, 18, 7552 13 of 16
highest contributor to the high direct non-medical costs was the cost of caregivers (around82%). This finding is in line with Alvarez-Sabín et al. [44], who showed that more thantwo-thirds of stroke care costs were spent for social costs, especially informal care.
Furthermore, indirect costs were part of the social welfare loss due to diseases. Theremaining loss of welfare was represented by the loss of health time due to illness, suffering,and sadness [42]. For many diseases, the indirect costs were enormous and much greaterthan the direct medical costs [39]. The results of this systematic review discovered that theindirect costs of stroke were USD 957–15,823 [18,25]. In Indonesia, the average indirect costof stroke patients participating in the Social Security Agency at Dr. Moh. Saleh Hospitalwas USD 223.08, with a minimum to the maximum value range of USD 102.18–486.33 [40].
Meanwhile, for patients without the insurance mechanism, the total indirect cost wasUSD 100,117.68. The current systematic review showed that the highest indirect costs weredue to the cost of productivity lost spent for premature deaths (around 80%). This finding isin line with previous studies, which stated that 66% of the total costs of stroke in the UnitedStates was due to the indirect costs of premature deaths [45]. It is challenging to generalizethe results of economic studies in various countries. Economic results were difficult tocompare due to monetary issues (i.e., fluctuating exchange rates, the purchasing power ofcurrencies), although purchasing power parity (PPP) can help compare results. It eliminatesdifferences in price levels between countries, while regional demographic characteristicsalso influence resource consumption and unit costs. This resulted in the treatment costsvarying widely between studies [46]. On the other hand, the epidemiological indicatorsfound in the selected articles included prevalence and incidence. There were no articlesthat calculated DALY or QALY due to stroke in this systematic review.
4.1. Strengths and Limitations
This study provided an overview of the economic costs due to stroke in several coun-tries. This study provided an evidence base of disease economic losses in terms of eachtype of cost (direct medical costs, direct non-medical costs, and indirect costs). This studyalso described the differences in calculating the economic loss of disease on the basis oftwo methods, namely, COI and HE. In addition, this study also looked at the length ofhospitalization for stroke patients. An economic perspective was also presented separately.This study was expected to be used as a consideration for policymaking, especially forpriority allocation of health resources and preparation of disease prevention programs asin this study, the contributing component to cost for each disease was explained. However,the articles included in this study did not specifically discuss the economic costs of strokein specific regions or groups of countries. This allowed for differences in the characteristicsof each country, for example, the health system, health financing system, and sociodemo-graphic characteristics of the people. This study also did not find indicators of DALY andQALY from the articles included. In writing this systematic review, the two reviewers(I.T.R. and T.N.R.) had different opinions, and thus they asked for the others reviewer’sopinion (M.D., W.B., and N.B., respectively).
4.2. Implication
Stroke is classified as a cardiovascular disease, a group of catastrophic diseases thatrequire long treatment, and the cost is expensive. Nowadays, stroke attack many produc-tive age groups, and therefore it can reduce productivity at work. Patients with diseasegenerally have disabilities, being unable to carry out their daily activities independently.This makes them dependent on other people to be able to perform activities and undergotreatment. It can reduce the productivity of caregivers, who are usually not paid becausethey are members of their own family. Therefore, strengthening preventive efforts is impor-tant. The Ministry of Health has implemented several policies, including regular healthchecks, tobacco control, regular physical activity, healthy and balanced diet, adequate rest,and management of stress (Presidential Instruction Number 1 with the Healthy LivingCommunity Movement, and Integrated Development Post for Non-Communicable Dis-

Int. J. Environ. Res. Public Health 2021, 18, 7552 14 of 16
eases (Ministry of Health of the Republic of Indonesia, 2017). In Indonesia, it is necessaryto encourage the government to not only allocate attention and budget for BPJS Health, butalso to pay attention and allocate a large budget for public health efforts as the spearheadof health promotion programs and primary prevention of disease in Indonesia. Reducingthe burden of disease can be done with risk factor management as a preventive measure.
A systematic review of the burden of disease due to stroke is needed, including twoindicators, namely, epidemiological indicators (covering DALY and QALY) and economicindicators (covering direct and indirect costs). Further research is needed on the burden ofCHD and stroke in Indonesia because they are still very rare.
5. Conclusions
This review showed that stroke is not only one of the major disease burdens but alsothat it incurs substantial economic loss to the country. The cost to manage stroke is highbecause of the long hospital care required, and even after discharge, continued healthexpenditures are necessary for its risk management and long rehabilitation. The highfinancial burden to manage stroke justifies the promotion and preventive efforts by thepolicymakers and motivates the practice of healthy lifestyles by the people.
6. Patents
This research produced non-patent work as further research can find other differencesin results.
Supplementary Materials: The following are available online at https://www.mdpi.com/article/10.3390/ijerph18147552/s1, Table S1: PRISMA Checklist [47], Table S2: Quality Assessment [14].References [14,47] are cited in the Supplementary Materials.
Author Contributions: Conceptualization, T.N.R. and I.T.R.; methodology, T.N.R. and I.T.R.; soft-ware, T.N.R. and I.T.R.; validation, T.N.R., M.D. and W.B.; formal analysis, T.N.R., I.T.R. and M.D.;investigation, T.N.R. and I.T.R.; resources, T.N.R. and I.T.R.; data curation, T.N.R., I.T.R., W.B. andN.B.; writing—original draft preparation, T.N.R., I.T.R., W.B. and M.D.; writing—review and editing,T.N.R., M.D. and N.B.; visualization, T.N.R.; supervision, M.D.; project administration, N.B.; fundingacquisition, W.B. All authors have read and agreed to the published version of the manuscript.
Funding: This research received no external funding from any funding agency in the public, com-mercial, or not-for-profit sectors.
Institutional Review Board Statement: Not applicable.
Informed Consent Statement: Not applicable.
Acknowledgments: The authors would like to thank Siti Mei Saroh for technical help, editing andtranslating, writing the systematic review, and copy editing the manuscript.
Conflicts of Interest: The authors declare no conflict of interest.
References1. World Health Organization. Monitoring Health for The SDGs; World Health Organization: Geneva, Switzerland, 2018; Volume 15.2. The George Institute for Global Health. Reducing the Burden of Cardiovascular Disease in Indonesia; The George Institute for Global
Health: Sydney, Australia, 2017.3. Kementerian Kesehatan. Laporan Tahunan Badan Penelitian Dan Pengembangan Kesehatan 2019; Kementerian Kesehatan Republik
Indonesia: Jakarta, Indonesia, 2019.4. Johnson, A.J.; Dudley, W.N.; Wideman, L.; Schulz, M. Physiological Risk Profiles and Allostatic Load: Using Latent Profile
Analysis to Examine Socioeconomic Differences in Physiological Patterns of Risk. Eur. J. Environ. Public Health 2019, 3, 2–9.[CrossRef]
5. Katan, M.; Luft, A. Global Health Neurology. Semin. Neurol. 2018, 38, 208–211. [CrossRef] [PubMed]6. Gorelick, P.B. The global burden of stroke: Persistent and disabling. Lancet Neurol. 2019, 18, 417–418. [CrossRef]7. Riskesdas, K. Hasil Utama Riset Kesehata Dasar (RISKESDAS). J. Phys. A Math. Theor. 2018, 44, 1–200. [CrossRef]8. Lilissuriani Saputra, I.; Ruby, M. Perbedaan Biaya Riil Rumah Sakit dan Rarif INA-CBG untuk kasus katastropik dengan penyakit
Jantung Koroner pada Pasien Rawat inap Peserta Jaminan Kesehatan Nasional di RSUZA. J. Kesehat Masy. 2017, 3, 198–205.

Int. J. Environ. Res. Public Health 2021, 18, 7552 15 of 16
9. Tremmel, M.; Gerdtham, U.G.; Nilsson, P.M.; Saha, S. Economic burden of obesity: A systematic literature review. Int. J. Environ.Res. Public Health 2017, 14, 435. [CrossRef]
10. Devleesschauwer, B.; Havelaar, A.H.; De Noordhout, C.M.; Haagsma, J.A.; Praet, N.; Dorny, P.; Speybroeck, N. DALY calculationin practice: A stepwise approach. Int. J. Public Health 2014, 59, 571–574. [CrossRef]
11. Zhu, B.; Wang, Y.; Ming, J.; Chen, W.; Zhang, L. Disease burden of COPD in china: A systematic review. Int. J. COPD 2018, 13,1353–1364. [CrossRef]
12. The Joanna Briggs Institute. The Systematic Review of Economic Evaluation Evidence; The Joanna Briggs Institute & The University ofAdelaide: Adelaide, Australia, 2014.
13. Katsanos, A.H.; Hart, R.G. New Horizons in Pharmacologic Therapy for Secondary Stroke Prevention. JAMA Neurol. 2020, 77,1308–1317. [CrossRef]
14. Gheorghe, A.; Griffiths, U.; Murphy, A.; Legido-Quigley, H.; Lamptey, P.; Perel, P. The economic burden of cardiovascular diseaseand hypertension in low- and middle-income countries: A systematic review. BMC Public Health 2018, 18, 1–11. [CrossRef]
15. Abdo, R.R.; Abboud, H.M.; Salameh, P.G.; Jomaa, N.A.; Rizk, R.G.; Hosseini, H.H. Direct medical cost of hospitalization for acutestroke in lebanon: A prospective incidence-based multicenter cost-of-illness study. Inquiry 2018, 55. [CrossRef]
16. Camacho, S.; Maldonado, N.; Bustamante, J.; Llorente, B.; Cueto, E.; Cardona, F.; Arango, C. How much for a broken heart? Costsof cardiovascular disease in Colombia using a person-based approach. PLoS ONE 2018, 13, e0208513. [CrossRef]
17. Cha, Y.J. The economic burden of stroke based on South Korea’s national health insurance claims database. Int. J. Health PolicyManag. 2018, 7, 904–909. [CrossRef]
18. Ganapathy, V.; Graham, G.D.; Dibonaventura, M.D.; Gillard, P.J.; Goren, A.; Zorowitz, R.D. Caregiver burden, productivity loss,and indirect costs associated with caring for patients with poststroke spasticity. Clin. Interv. Aging 2015, 10, 1793–1802. [CrossRef]
19. Içagasıoglu, A.; Baklacıoglu, H.S.; Mesci, E.; Yumusakhuylu, Y.; Murat, S.; Mesci, N. Economic burden of stroke. Turk. Fiz. Tip.Rehabil. Derg. 2017, 63, 155–159. [CrossRef] [PubMed]
20. Jennum, P.; Iversen, H.K.; Ibsen, R.; Kjellberg, J. Cost of stroke: A controlled national study evaluating societal effects on patientsand their partners. BMC Health Serv. Res. 2015, 15, 466. [CrossRef] [PubMed]
21. Joo, H.; Wang, G.; Yee, S.L.; Zhang, P.; Sleet, D. Economic Burden of Informal Caregiving Associated With History of Stroke andFalls Among Older Adults in the U.S. Am. J. Prev. Med. 2017, 53, S197–S204. [CrossRef] [PubMed]
22. Lekander, I.; Willers, C.; Von Euler, M.; Lilja, M.; Sunnerhagen, K.S.; Pessah-Rasmussen, H.; Borgström, F. Relationship betweenfunctional disability and costs one and two years post stroke. PLoS ONE 2017, 12, e0174861. [CrossRef]
23. Maredza, M.; Chola, L. Economic burden of stroke in a rural South African setting. eNeurol. Sci. 2016, 3, 26–32. [CrossRef]24. Persson, J.; Levin, L.Å.; Holmegaard, L.; Redfors, P.; Svensson, M.; Jood, K.; Forsberg-Wärleby, G. Long-term cost of spouses’
informal support for dependent midlife stroke survivors. Brain Behav. 2017, 7, 1–8. [CrossRef]25. Van Eeden, M.; Van Heugten, C.; Van Mastrigt, G.A.P.G.; Van Mierlo, M.; Visser-Meily, J.M.A.; Evers, S.M.A.A. The burden of
stroke in the Netherlands: Estimating quality of life and costs for 1 year poststroke. BMJ Open 2015, 5. [CrossRef] [PubMed]26. Vieira, L.G.D.R.; Safanelli, J.; Araujo, T.D.; Schuch, H.A.; Kuhlhoff, M.H.R.; Nagel, V.; Cabral, N.L. The cost of stroke in private
hospitals in Brazil: A one-year prospective study. Arq. Neuropsiquiatr. 2019, 77, 393–403. [CrossRef]27. Zhang, H.; Yin, Y.; Zhang, C.; Zhang, D. Costs of hospitalization for stroke from two urban health insurance claims data in
Guangzhou City, southern China. BMC Health Serv. Res. 2019, 19, 671. [CrossRef] [PubMed]28. Salvatore, F.P.; Spada, A.; Fortunato, F.; Vrontis, D.; Fiore, M. Identification of health expenditures determinants: A model to
manage the economic burden of cardiovascular disease. Int. J. Environ. Res. Public Health 2021, 18, 4652. [CrossRef]29. Gochi, T.; Matsumoto, K.; Amin, R.; Kitazawa, T.; Seto, K.; Hasegawa, T. Cost of illness of ishchemic heart disease in Japan: A time
trend and future projections. Environ. Health Prev. Med. 2018, 13, 1–7. [CrossRef]30. Banefelt, J.; Hallberg, S.; Fox, K.M.; Mesterton, J.; Paoli, C.J.; Johansson, G.; Gandra, S.R. Work productivity loss and indirect costs
associated with new cardiovascular events in high-risk patients with hyperlipidemia: Estimates from population-based registerdata in Sweden. Eur. J. Health Econ. 2016, 17, 1117–1124. [CrossRef] [PubMed]
31. Warlow, C.P. Epidemiology of Stroke; Elsevier: Amsterdam, The Netherlands, 1998; Volume 354. [CrossRef]32. Indrayathi, P.A.; Noviyanti, R. Bahan Ajar Cost of Illness; Universitas Udayana: Bali, Indonesia, 2016.33. Voda, A.I.; Bostan, I. Public health care financing and the costs of cancer care: A cross-national analysis. Cancers 2018, 10, 117.
[CrossRef] [PubMed]34. Curtain, J.P.; Yu, M.; Clark, A.B.; Gollop, N.D.; Bettencourt-Silva, J.H.; Metcalf, A.K.; Myint, P.K. Determinants of length of stay
following total anterior circulatory stroke. Geriatrics 2017, 2, 26. [CrossRef]35. Saxena, R.; Kishore, P.; Saxena, S. To compare surgically induced astigmatism in SICS using two different incision sites–“superior
vs. temporal”. Indian J. Clin. Exp. Ophthalmol. 2017, 3, 470–475. [CrossRef]36. Hoogervorst-Schilp, J.; Langelaan, M.; Spreeuwenberg, P.; De Bruijne, M.C.; Wagner, C. Excess length of stay and economic
consequences of adverse events in Dutch hospital patients. BMC Health Serv. Res. 2015, 15, 531. [CrossRef]37. Lubis, I.K.; Susilawati, S. Analisis Length Of Stay (Los) Berdasarkan Faktor Prediktor Pada Pasien DM Tipe II di RS PKU
Muhammadiyah Yogyakarta. J. Kesehat. Vokasional. 2018, 2, 161. [CrossRef]38. Wartawan, I.W. Analisis Lama Hari Rawat Pasien Yang Menjalani Pembedahan di Ruang Rawat Inap Bedah Kelas III RSUP Sanglah
Denpasar Tahun 2011; Universitas Indonesia: Jakarta, Indonesia, 2012.

Int. J. Environ. Res. Public Health 2021, 18, 7552 16 of 16
39. Segel, J.E. Cost-of-Illness Studies—A Primer; RTI-UNC Center of Excellence in Health Promotion Economics. 2006. Availableonline: https://pdfs.semanticscholar.org/3bbf/0a03079715556ad816a25ae9bf232b45f2e6.pdf (accessed on 29 January 2021).
40. Munawwaroh, A. Perhitungan Cost of Illness (COI) Pada Pasien Rawat Inap Penderita Stroke Peserta BPJS Di RSUD Dr. Mohamad SalehKota Probolinggo; Universitas Jember: Jawa Timur, Indonesia, 2019.
41. Ye, Z.; Ritchey, M.; MacLeod, K.; Wang, G. A Literature Review of the Direct Medical Costs of Stroke Across the Care Continuumin the US. Circ. Cardiovasc. Qual. Outcomes 2020, 13 (Suppl. 1), A265. [CrossRef]
42. Jo, C. Cost-of-illness studies: Concepts, scopes, and methods. Clin. Mol. Hepatol. 2014, 20, 327–337. [CrossRef] [PubMed]43. Ibrahim, N.; Pozo-Martin, F.; Gilbert, C. Direct non-medical costs double the total direct costs to patients undergoing cataract
surgery in Zamfara state, Northern Nigeria: A case series. BMC Health Serv. Res. 2015, 15, 1–7. [CrossRef] [PubMed]44. Alvarez-Sabín, J.; Quintana, M.; Masjuan, J.; Oliva-Moreno, J.; Mar, J.; Gonzalez-Rojas, N.; Yebenes, M. Economic impact of
patients admitted to stroke units in Spain. Eur. J. Health Econ. 2017, 18, 449–458. [CrossRef]45. Girotra, T.; Lekoubou, A.; Bishu, K.G.; Ovbiagele, B. A contemporary and comprehensive analysis of the costs of stroke in the
United States. J. Neurol. Sci. 2020, 410, 116643. [CrossRef]46. Belarmino, A.D.C.; Rodrigues, M.E.N.G.; Anjos, S.D.J.S.B.D.; Ferreira Júnior, A.R. Collaborative practices from health care teams
to face the covid-19 pandemic. Rev. Bras. Enferm. 2020, 73 (Suppl. 6), e20200470. [CrossRef]47. Shamseer, L.; Moher, D.; Clarke, M.; Ghersi, D.; Liberati, A.; Petticrew, M.; Shekelle, P.; Stewart, L.A.; PRISMA-P Group. Preferred
reporting items for systematic review and meta-analysis protocols (prisma-p) 2015: Elaboration and explanation. BMJ 2015, 349,g7647. [CrossRef]
Copyright © 2022 FDOKUMEN