Decreasing the Burden of Injury from Violence
131
Western Cape Burden of Disease Reduction Project Volume 5 of 7 Decreasing the Burden of Injury from Violence R Matzopolous S Mathews B Bowman J Myers Decreasing the Burden of Traffic-related Injury R Matzopolous R Jobanputra J Myers Final Report 2007
Transcript of Decreasing the Burden of Injury from Violence

Western Cape Burden of Disease Reduction Project
Volume 5 of 7
Decreasing the Burden of Injury from Violence
R Matzopolous S MathewsB BowmanJ Myers
Decreasing the Burden of Traffic-related Injury
R MatzopolousR JobanputraJ Myers
Final Report 2007
Injury Prevention
Working Group
Violence Risk Factor:
Review and Intervention
Analysis
Richard Matzopoulos Shanaaz Mathews
Brett Bowman Jonny Myers
June 2007
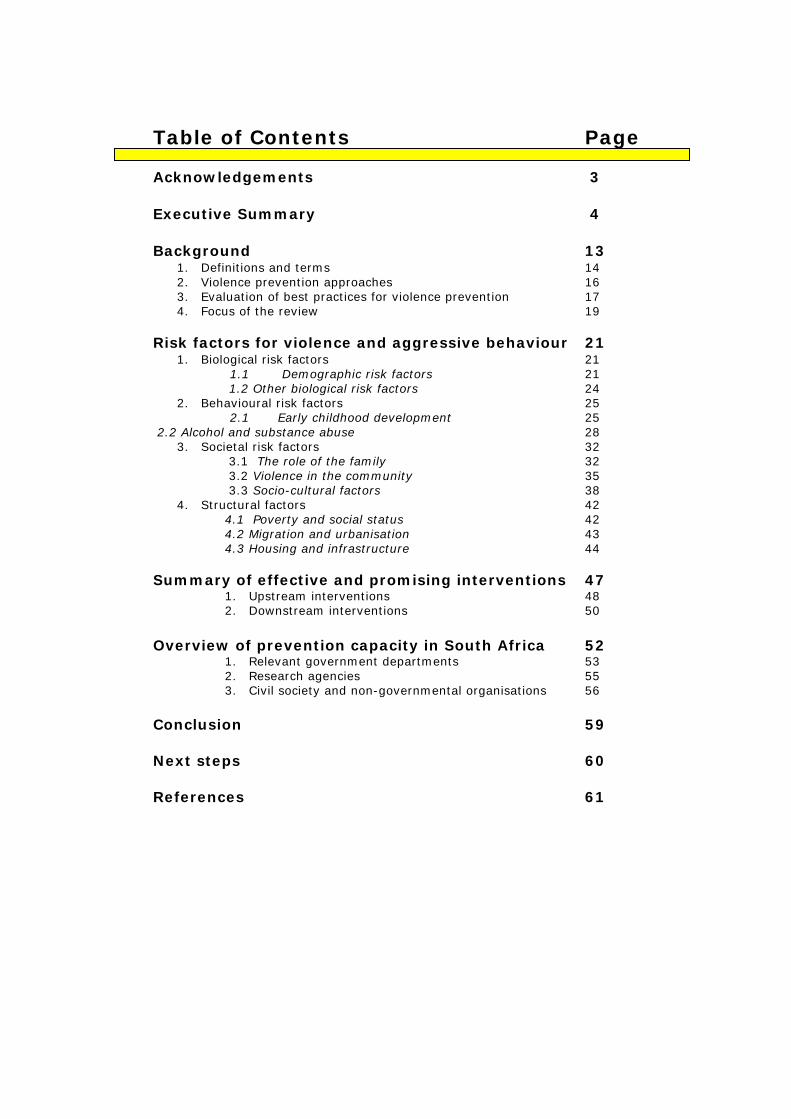
Table of Contents Page Acknowledgements 3 Executive Summary 4 Background 13
1. Definitions and terms 2. Violence prevention approaches 3. Evaluation of best practices for violence prevention 4. Focus of the review
14 16 17 19
Risk factors for violence and aggressive behaviour 21 1. Biological risk factors
1.1 Demographic risk factors 1.2 Other biological risk factors
2. Behavioural risk factors 2.1 Early childhood development
2.2 Alcohol and substance abuse 3. Societal risk factors
3.1 The role of the family 3.2 Violence in the community 3.3 Socio-cultural factors
4. Structural factors 4.1 Poverty and social status 4.2 Migration and urbanisation 4.3 Housing and infrastructure
21 21 24 25 25 28 32 32 35 38 42 42 43 44
Summary of effective and promising interventions 1. Upstream interventions 2. Downstream interventions
47 48 50
Overview of prevention capacity in South Africa 1. Relevant government departments 2. Research agencies 3. Civil society and non-governmental organisations
Conclusion
52 53 55 56 59
Next steps
60
References 61

Acknowledgements Soul City for informing the content and structure of this review. Members of the expert working group for their insights and comments. Dr Joanne Corrigall School of Public Health, University of Cape Town Prof Charles Parry MRC – Alcohol and Drug Research Unit Dr Tracey Naledi Public Health Directorate, PGWC Dr Sandra Marais MRC – Crime, Violence and Injury Mr Willem Basson Department of Community Safety, PGWC Prof Shabir Wadee Forensic Medicine, University of Stellenbosch Dr David Pienaar School of Public Health, University of Cape Town Prof Sebastian van As Red Cross Children’s Hospital Ms Barbara Holtman CSIR
3
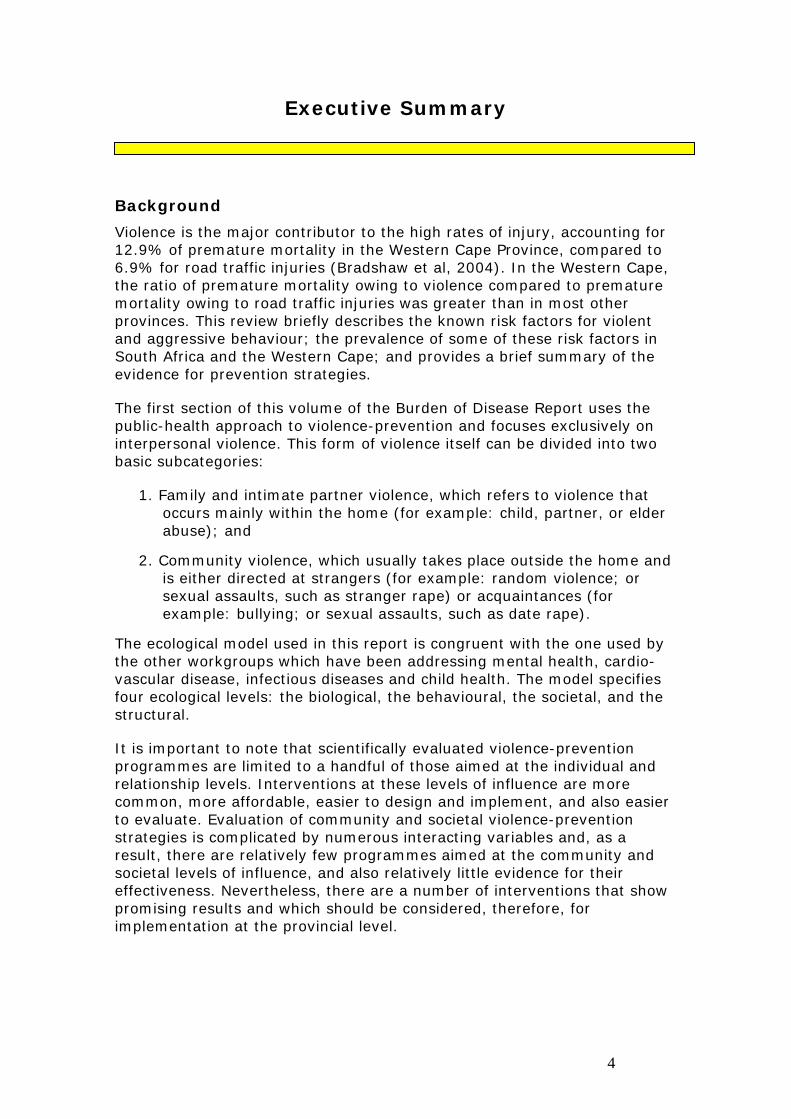
Executive Summary
Background
Violence is the major contributor to the high rates of injury, accounting for 12.9% of premature mortality in the Western Cape Province, compared to 6.9% for road traffic injuries (Bradshaw et al, 2004). In the Western Cape, the ratio of premature mortality owing to violence compared to premature mortality owing to road traffic injuries was greater than in most other provinces. This review briefly describes the known risk factors for violent and aggressive behaviour; the prevalence of some of these risk factors in South Africa and the Western Cape; and provides a brief summary of the evidence for prevention strategies.
The first section of this volume of the Burden of Disease Report uses the public-health approach to violence-prevention and focuses exclusively on interpersonal violence. This form of violence itself can be divided into two basic subcategories:
1. Family and intimate partner violence, which refers to violence that occurs mainly within the home (for example: child, partner, or elder abuse); and
2. Community violence, which usually takes place outside the home and is either directed at strangers (for example: random violence; or sexual assaults, such as stranger rape) or acquaintances (for example: bullying; or sexual assaults, such as date rape).
The ecological model used in this report is congruent with the one used by the other workgroups which have been addressing mental health, cardio-vascular disease, infectious diseases and child health. The model specifies four ecological levels: the biological, the behavioural, the societal, and the structural.
It is important to note that scientifically evaluated violence-prevention programmes are limited to a handful of those aimed at the individual and relationship levels. Interventions at these levels of influence are more common, more affordable, easier to design and implement, and also easier to evaluate. Evaluation of community and societal violence-prevention strategies is complicated by numerous interacting variables and, as a result, there are relatively few programmes aimed at the community and societal levels of influence, and also relatively little evidence for their effectiveness. Nevertheless, there are a number of interventions that show promising results and which should be considered, therefore, for implementation at the provincial level.
4

Risk factors
The risk and protective factors that determine both the likelihood of exposure to violence and the predisposition to aggressive or violent behaviour can be listed according to the different ecological levels, as follows.
Biological risk factors Demographic factors, such as age and sex.
Other biological factors: an abnormal heart rate, or neurological damage that results in psychological or personality disorders.
Behavioural risk factors
Problems in early childhood development: hyperactivity; impulsiveness; poor behavioural and attention problems; the early onset of negative conduct (such as aggressive, oppositional, disruptive, and destructive behaviours); and poor diet.
Alcohol and substance abuse.
Societal risk factors Family environment: the number of children in a family; mothers
having a child at a young age; low levels of family cohesion; single-parent households; low socio-economic status; harsh physical punishment; parental aggression towards children; parental conflict monitoring and supervision; and intimate partner violence.
Community environment: violent friends; violent neighbourhoods; witnessing violence; activities relating to gangs, guns, and drugs; the level of unemployment; population density and mobility; the carrying of weapons; social integration; and a lack of social capital.
Socio-cultural factors: the endorsement of violence to resolve conflict; traditional gender and social norms of oppression; the ineffectiveness of political structures; and the destructive and misleading role of media.
Structural factors Poverty and social status: low socio-economic status; relative
deprivation and social inequality; low educational attainment; and high rates of unemployment.
Recent migration and urbanisation.
Inadequate housing and infrastructure.
5

Interventions
Effective (underlined) and promising interventions are summarised below, according to key violence-prevention themes:
Upstream
Investing in early interventions
Lead monitoring and toxin removal;
Increased access to pre- and post-natal care for children aged 0 to 3 years;
Multi-context, long-term interventions that impact on multiple dimensions of a child's environment; and
School-feeding schemes to ensure adequate nutrition in all grades throughout the schooling years.
Increasing positive adult involvement Incentives for young adults and high-risk youths to complete high
school and post-secondary education or vocational training.
Strengthening communities
Alcohol Implement a coherent liquor-outlet policy which brings informal
outlets into the regulated market; Encourage community mobilisation against alcohol misuse; Establish norms and guidelines for school-based programmes, based
on best practices; Implement product restrictions, including restrictions on the size of
packaging and clearer, legible labels regarding content; Restrict products that appeal to youth; Reduce alcohol availability for ages 12 years to 19 years; and Establish integrated programmes that address alcohol and substance
abuse alongside other violence-prevention initiatives.
Education and childcare Implement programmes which provide youths with incentives to
complete secondary schooling; Implement school-based prevention programmes which are aimed at
reducing date-related violence; Introduce child-protection service programmes; Improve school settings for children; and Install metal detectors in schools for children aged 3 to 19 years.
Firearms Enforce longer waiting periods for firearm purchases; Hold gun-owners liable for damage caused by gunfire; Promote the safe storage of firearms and other lethal weapons; and Enforce laws which prohibit the illegal transfers of guns to youth.
6

Changing cultural norms
Conduct campaigns to increase public awareness of child maltreatment;
“Name and shame” intimate-partner violence offenders; Establish adult recreational programmes; Prioritise community policing; Reduce the glorification of violence by the media, especially on
television and film; Introduce public information campaigns for children aged 9 to 11
years to promote pro-social norms; Change cultural norms that support violence, such as those that
support male dominance over females; parental dominance over children; and violence as a means of conflict resolution;
Mobilise community women’s networks to challenge the prevailing aggressive norms and beliefs, in order to reduce the tolerance of violence, and to teach perpetrators to fear the consequences of their destructive behaviour; and
Work with young men to change their own attitudes towards, and their behaviour with regard to, gender-based violence and violence in general.
Reducing income inequality Establish job-creation programmes for the chronically unemployed
for ages 20 and older; Strengthen police and judicial systems for all ages to ensure more
equitable access, protection, and legal recourse. In South Africa, this would include better services for victims, witnesses and suspects, as well as more streamlined and efficient investigation and judicial procedures;
Reduce poverty — for all ages; Address housing density and residential mobility programmes; and Implement micro-finance projects for women.
Improving the criminal justice and social welfare systems Facilitate easier access to social support for women and families; Introduce further legislation to criminalise the maltreatment of
children, intimate-partner violence, and elder abuse; Introduce mandatory arrest for intimate-partner violence; Improve services for the identification and treatment of elder abuse; Train health-care professionals in the identification and referral of
high-risk youth, battered women, victims of elder abuse, child maltreatment, and sexual violence;
Improve services for children who witness violence; Create safe havens for children on high-risk routes to and from
school upstream; and Increase shelters and crisis centres for battered women and victims
of elder abuse.
7

Downstream
Investing in early interventions
Introduce therapeutic foster care for children aged 0 to 3 years; Implement preschool enrichment programmes for children aged 3 to
11 years; Provide mentoring for children aged 3 to 11 years; Implement school-based child-maltreatment prevention programmes
for children aged 3 to 11 years; Introduce home visitation aimed at reducing violence directed at
children aged 0 to 3 years; and
Provide training for young parents aimed at reducing violence among children aged 0 to 5 years.
Hospital-based, parent education programme to reduce the incidence of abusive head injuries among infants and children.
Increasing positive adult involvement Provide mentoring for children aged 12-19 years; Provide family mentoring for families with children aged 12-19 years; Introduce home-school partnership programmes to promote parental
involvement for children aged 3 to 11 years; and Provide after-school programmes to extend adult supervision for
children such as wilderness programmes and other outdoor programmes for youth at risk.
Strengthening communities Alcohol
Pilot and implement brief interventions for high-risk and hazardous drinkers. Education and childcare
Introduce social development programmes for children between the ages of 3 and 19 years;
Encourage academic enrichment programmes for children aged 12 to 19 years; and
Introduce temporary foster-care programmes for chronic delinquents for children aged 12 to 19 years.
Changing cultural norms Reduce unintended pregnancies (aimed at preventing violence
against children aged 0 to 3 years); Introduce peer mediation or peer counselling for children aged 12 to
19 years; Encourage and expand life-skills training programmes; and Recreational programmes for children aged 3 to 19 years.
8

Improving the criminal justice and social welfare systems. Introduce treatment programmes for victims of maltreatment for
children aged 0 to 3 years; Introduce services for adults who were abused as children, and for
ages 20 and older; Introduce treatment for child and intimate-partner abuse offenders
for ages 20 and older; and Introduce screening by health-care providers for maltreatment of
children. Scientifically evaluated violence-prevention programmes are limited to a handful aimed at the individual and relationship levels, as these are easier to evaluate and tend to be more common (Dahlberg and Butchart 2005). Dahlberg and Butchart (2005) identified several levels of effectiveness for the evaluation of violence-prevention programmes. The most stringent criteria include:
evaluations using a strong research design; evidence of a significant prevention effect; evidence of a sustained effect (i.e. the effect extends beyond the
duration of the programme); and replication of a programme with demonstrated preventive effects
across different settings.
The small number of effective interventions relates to the difficulty in measuring actual reductions in physical violence: a relatively rare occurrence, and which may result from a complex web of factors that influence individuals and relationships over a long period of time. Internationally, the evaluation of violence-prevention programmes has frequently considered their effectiveness in changing knowledge and attitudes — such as peer-education programmes — rather than their behaviour or the reduction in the incidence of injuries, which would provide more important outcomes (Dahlberg and Butchart. 2005). The synergy between the interventions (with evidence of effectiveness) and the Provincial Growth and Development Strategy are shown in Table 1 below. It is clear that there is a particular resonance with three of the key areas, namely: growth, equity and empowerment.
9

Table 1: The impact of recommended violence-prevention
interventions on the four principles of Shared Growth and Integrated Development
Interventions Growth Equity Empowerment Environmental
Integrity Lead monitoring and toxin removal √ √ √ √
Completing secondary schooling √ √ √
School-based prevention to reduce dating violence
√ √ √
Mobilising women’s networks to challenge norms and beliefs
√ √ √
Changing young men’s attitudes and behaviours on violence and gender-based violence
√ √ √
Therapeutic foster care for children 0-3 years
√ √ √
Preschool enrichment programmes
for children 3-11 years √ √ √
Home visitation to reduce violence for children 0-3 years
√ √ √
Training in parenting aimed to reduce violence for children 0-5 years
√ √ √
Mentoring for children aged 12-19 years
√ √ √
Family mentoring for families with children aged 12-19 years
√ √ √
Social development programmes for children between the ages of 3 and 19 years
√ √ √
Academic enrichment programmes for children aged 12-19 years
√ √ √
Life-skills training programmes √ √ √
10

In relation to the eight strategies of iKapa Elihlumayo it is clear that there is a clear congruence with strategies 4,5,7 and 8 (Table 2).
Table 2: The impact of recommended interventions
on the eight strategies of iKapa Elihlumayo
Interventions Strategy 1
Economic participation
Strategy 2 Connectivity infrastructures
Strategy 3 Effective transport
Strategy 4 Liveable communities
Strategy 5 Resilient communities
Strategy 6 Spatial integration
Strategy 7 Tolerance, respect for diversity
Strategy 8 Effective governance institutions
Lead monitoring and toxin removal √ √ √ Completing secondary schooling √ √ √ √ School-based prevention to reduce dating violence
√ √ √
Mobilising women’s networks to challenge norms and beliefs
√ √
Changing young men’s attitudes and behaviours on violence and gender-based violence
√ √
Therapeutic foster care for children 0-3 years
√ √
Preschool enrichment programmes for children 3-11 years
√ √
Home visitation to reduce violence for children 0-3 years
√ √ √ √
Training in parenting aimed to reduce violence for children 0-5 years
√ √
Mentoring for children aged 12-19 years √ √ √ √ Family mentoring for families with children aged 12-19 years
√ √ √
Social development programmes for children 3-19 years
√ √ √ √
Academic enrichment programmes for children 12-19 years
√ √ √
Life-skills training programmes √ √ √ √
Prevention capacity
Violence prevention requires comprehensive intervention strategies involving all sectors of society to address core sets of underlying causes and risk factors, including governments, NGOs and civil society, as well as the general public and the private sector.
Government departments
Departments and ministries with a stake in violence prevention span all five of the Government’s communication clusters. Research agencies
There are numerous departments within tertiary education and academic research institutions address issues relating to violence.
11

Civil society and Non-Governmental Organisations
There are a number of Civil society and Non-Governmental Organisations working to intervene and prevent violent behaviour: from those that span the disciplines of human security and social justice to those which actively promote the implementation of interventions for specific typologies and aspects of violence. Government would be well advised to work in close co-operation with these structures. Conclusion It is clear that efforts to address the burden of violence in the Western Cape Province require a multi-sectoral approach that spans the criminal justice, health, infrastructure, and policy domains. There is also a need to balance achievable short-term targets with those of a more long-term nature among many of the strategies that are most needed to affect fundamental shifts in socio-cultural attitudes and the propensity towards aggressive and violent behaviour. Thus, if the typical perpetrator in the Western Cape is a young male, dependent on alcohol, and living in an area with severe structural and social problems — including unemployment, poverty, poor services (schools, health care, transport, and so on) — and among numerous armed gangs that support a drug trade, the Provincial Government may wish to provide certain “quick-fix” solutions, through improving criminal justice, for example, while investing heavily in those programmes most likely to affect a fundamental and lasting change in the long term. It is also clear that any Provincial strategies arising from these reviews will need to be underpinned by accurate and reliable reporting systems that will assist in targeting communities most in need of intervention, as well as assisting with the ongoing evaluation and monitoring of key strategies. Hence, there is an urgent need to develop violence prevention strategies in the local context, but one of the key challenges is the current absence of research information and documentation. In order to assess and replicate successful strategies, each needs to include:
appropriate theoretical underpinnings;
comprehensive documentation
specific measured outcomes; and
a detailed monitoring and evaluation strategy that should be established prior to the onset of the project and that will also include non-governmental agencies such as universities, NGOs and research institutes.
12

Background Injuries arising from violence, road-traffic collisions, and other miscellaneous causes, present part of a quadruple burden of disease (in combination with the HIV/AIDS pandemic, persistent infectious diseases, and emerging chronic conditions), that is being imposed on South Africa’s under-resourced public health sector. Violence is the major contributor to the high rates of injury, accounting for 12.9% of premature mortality in the Western Cape Province, compared to 6.9% for road-traffic injuries (Bradshaw et al, 2004). In the Western Cape, the ratio of premature mortality due to violence as opposed to that caused by road traffic injuries was greater than in most other provinces, except in the Northern Cape and Gauteng, where the ratios are comparable. It is the second leading cause of years of life lost (YLLs) in the province, after HIV/AIDS, which accounted for 14.1% of YLLs (Bradshaw et al, 2004) and mortality rates were higher than in other provinces for both males (129 per 100,000 compared to a national average of 115) and females (25 per 100,000 compared to 21) (Bradshaw et al, 2004). Compared to the global average, provincial rates are nearly ten times greater among males and seven times greater among females, hence the inclusion of an injury-prevention workgroup in the Provincial Government of the Western Cape’s Burden of Disease Project (Norman et al, in press). This review briefly describes the known risk factors for violent and aggressive behaviour, the prevalence of some of these risk factors in South Africa and the Western Cape Province, and provides a brief summary of the evidence for all formally documented prevention strategies. Although this study focuses on acts of physical violence, it should be noted that aggressive behaviour that manifests in public spaces is also a contributory factor for several deleterious mental-health outcomes and even other injury types . For example, a study of more than 1,000 drivers in KwaZulu-Natal reported that between 64% and 84% of drivers had experienced aggressive driving behaviours by another motorist, such as verbal or gestural expressions of anger, and that 18% had experienced direct confrontation in the form of an argument or assault. The same study also reported a number of high-risk and aggressive driving behaviours on the part of the respondents, including 53% admitting that they had exceeded the speed limit when they had been able to, and 48% admitting to having accelerated through yellow, or driving through, red traffic lights (Sukhai et al, 2005). The problem is not likely to abate of its own accord, as technological development and urbanisation are usually accompanied by increasing per capita injury rates (Butchart and Peden, 1997; Mercy et al, 2002). Data from the National Injury Mortality Surveillance System (NIMSS), as well as from the South African Police Services, suggest that the homicide rate has
13

decreased in recent years. This decrease could be due mainly to a decline in firearm deaths. As such, the mortality rate may have decreased due to the reduced injury severity of the external cause of injuries1 due to gunshots, but this does not necessarily point to a reduction in violent or aggressive behaviour (Matzopoulos and Bowman, 2006). Commonly cited risk factors and determinants include economic inequality and poverty, high unemployment, rapid social change, corruption and poor application of the rule of law, gender inequalities, high firearm availability and community violence, many of which are a legacy of our apartheid past (Norman et al, in press). Substance abuse is another important risk factor with 53% of fatal (Harris and Van Niekerk, 2002) and up to 73% of non-fatal (Plüddemann et al, 2004) interpersonal violence injuries testing positive for alcohol in urban areas of South Africa in 2001.
1. Definitions and terminology
As this review makes extensive use of the public health approach to violence prevention, the most relevant definition of violence arises from the WHO, which defines it as:
“The intentional use of physical force or power, threatened or actual, against oneself, another person, or against a group or community, that either results in or has a high likelihood of resulting in, injury, death, psychological harm, mal-development or deprivation.”
(WHO Global Consultation on Violence and Health, 1996)
The inclusion of the term “power” in the definition incorporates the use of intimidation or threats that may result from a power relationship, as well as the more commonly perceived physically violent actions. Notwithstanding the complex permutations of “intentionality” — the perpetrator may not intend to cause an injury through the use of force, or cultural beliefs may not regard certain injurious practices as being violent such as rites of passage or initiation rituals that involve deprivation or physically harmful acts — the definition relates to the affects or health implications of a violent act on an individual (Dahlberg and Krug, 2002)
The effects of violence are typically equated with injuries and trauma, resulting from the physical nature of assaults and sexual violence. Other negative outcomes include: diverse psychological responses that can lead to behavioural and emotional problems, for example, post-traumatic stress disorder. Such psychological outcomes have also been implicated as enablers for continued cycles of violence by studies that suggest that victims of violence are likely to become perpetrators of violence themselves. Injuries and sexual violence also expose victims to infectious diseases or chronic conditions arising from their injuries. The WHO also
1 Widely utilised in injury classification systems such as ICD and ICECI, the “external cause” of injury refers to the agent or energy that gives rise to the injury. Common external causes for violence related injuries include firearms, sharp force (e.g. stabbing), blunt force (e.g. assault and battery).
14

includes the terms “mal-development or deprivation” in their definition (see Figure 1), which encompass a wide range of psycho-social outcomes.
The WHO also utilises a typology for violence that provides a useful tool with which to describe the complex patterns of violence and to delineate and develop different prevention strategies (Dahlberg and Krug, 2002). The typology is divided into three broad categories, as shown in Figure 1 below:
1. Self-directed, including self-abuse and suicidal behaviour;
2. Collective, including warfare, political violence, terrorism and other means to advance specific social agendas; and
3. Interpersonal, which includes family and intimate-partner violence and community violence directed at unrelated individuals.
The typology also specifies the nature of violence, whether physical, sexual, psychological or involving deprivation or neglect.
Figure 1: A typology of violence
(Source: Dahlberg and Krug 2002)
Many of the categories of violence straddle more than one of these blocks. For example: gang violence and mob violence are generally seen as a manifestation of community violence between strangers. Within both, there are aspects of collective violence, yet this category typically refers to violence with more macro-societal manifestations.
15

2. Violence prevention approaches There are numerous theories to explain why certain individuals and groups are more likely to engage in violent behaviour. Some are commonly understood and intuitively logical, such as explanations revolving around biological factors such as age and sex. More complicated are the theories that explain violent behaviour by examining the interaction of these biological factors with social and environmental factors and their formative effects at key stages in human development. Developmental science attributes the predisposition towards aggressive or violent behaviour to key differences in an individual’s competencies, skills, activities, sense of self, connectedness to others, and ability to learn from others. These differences are affected by external influences across the life course, not only in the physical and cognitive, but also in the socio-emotional domains (Rosenberg and Knox, 2005). For example, Guerra and Williams (2002) identify five core developmental competencies that are important for healthy social and emotional development among youth:
1. Formation of a positive identity;
2. Self-sufficiency;
3. Self-regulation;
4. Social relationship skills; and
5. Formation of a positive belief system. Violence prevention strategies grounded in development science aim to address and modify these competencies rather than the biological factors on which they hinge.
The public health approach to violence prevention, which is concisely summarised in the World Report on Violence and Health provides a framework within which many existing theories can be incorporated, including medicine, sociology, epidemiology, psychology, criminology, education and economics (Dahlberg and Krug, 2002). It is used extensively by the Global Campaign for Violence Prevention undertaken by the Violence Prevention Alliance, a network of WHO Member State governments, nongovernmental and community-based organisations, and private, international and intergovernmental agencies (Check et al, 2005). This approach is also congruent with the health promotion approach outlined in the Ottawa Charter, which shifts the responsibility of health from the individual to the creation of an enabling environment that supports healthy behaviour (Ottawa Charter for Health Promotion, 1986). Within the public health approach are three levels of prevention, typically described as primary, secondary and tertiary, which refer to the timing of the prevention response. Primary prevention attempts to prevent violence before it occurs and can target potential perpetrators by curbing tendencies towards violent behaviour, or potential victims by reducing the factors and characteristics that predispose them to victimisation. Secondary prevention focuses on the immediate response to violence, such as emergency medicine including pre-hospital care for victims, and retribution through the criminal justice system. Tertiary prevention is aimed at mitigating the long-
16

term effects of violence-related trauma and the rehabilitation and re-integration of offenders and victims (Dahlberg and Krug, 2002). Another approach that has particular relevance in South Africa, owing to the long struggle against apartheid and the prominent role played by human rights activists, is the human-rights approach to violence prevention. This approach recognises violence as a human-rights issue and focuses on the state’s responsibility and legal obligation to address its prevention and effects, which requires that national laws, policies and practices take into account factors such as gender relations, religious beliefs, homophobia, and racism (Gruskin and Butchart 2003). Among the more obvious rights invoked are the right to bodily integrity; the right of a person to safety and security, and freedom from violence, but broader implications include gender equality, self-determination, social, economic and cultural rights. By showing how risk factors are distributed through the ecological context and linking violence with risk factors such as economic, social and gender inequalities, unemployment and inadequate social protection and educational opportunities, the human-rights approach is frequently used to drive law reform. Notwithstanding varying cultural and societal norms from country to country, acts of violence are usually criminal offences and so crime prevention is also equated with violence prevention efforts. Strategies to contain violence through policing fall within the categories of primary prevention (such as visible policing to curtail criminal acts), or secondary prevention (such as the arrest and prosecution of suspects following acts of violence). Yet, in a review of recent policies and responses to crime prevention, Van der Spuy (2001) describes several disparate strategies that draw from competing principles. For example, in South Africa, rehabilitation and restorative justice is considered for young offenders, whereas a more punitive approach is advocated for perpetrators of gender violence or child abuse. There is a similar vacillation about theories on crime causation and the enforcement response, from more empathic policing to “zero-tolerance” and Van der Spuy asserts that this is by no means unique to South Africa. It is clear that comprehensive crime-prevention strategies should include a primary prevention focus. For example, a primary prevention focus would place the emphasis on thorough security planning before major public events to reduce the risk of conflict, as opposed to more reactive strategies such as crowd control, which may pre-empt violent interactions. 3. Evaluation of best practices for violence prevention The World Report on Violence and Health lists numerous strategies and programmes for the prevention of violence that span the different ecological contexts and typologies of violence, as well as personal developmental stages. Many of these programmes are still too early in their stages of development, to provide clear evidence, however, primarily due to the complex linkages of the underlying risk factors and the causes of violence and aggressive behaviour. To quote from the Multi-site Violence Prevention Project (2004):
17

Prevention is, by necessity, big science.... Youth violence is a good example. It requires complex theories that can incorporate multiple influences, multiple levels of causal factors, and elaborate considerations of the roles of time (development) and place (ecological and community differences).
The complex relationship between the many risk factors for violence poses several challenges for the evaluation of best practices. In their review of international violence-prevention efforts, Dahlberg and Butchart (2005) noted that most programmes for sexual violence, intimate-partner violence, child maltreatment, and elder abuse were geared towards secondary and tertiary prevention (that is, treatment and rehabilitation) rather than primary prevention, which contradicts the public-health ideal. The exception was in youth-violence prevention, where most efforts focused on curbing violent behaviour before it occurs (Howell and Hawkins 1998; Mercy et al, 2002). Despite the myriad violence-prevention programmes documented in the World Report, those with evidence of effectiveness are limited to a handful aimed at the individual and relationship levels (Mercy et al, 2002; Dahlberg and Butchart 2005). Interventions at these levels of influence are more common, as they are not only more affordable and easier to design and implement, but they are also easier to evaluate (Dahlberg and Butchart, 2005). In contrast, the broad scope of community and societal violence-prevention strategies complicates evaluation research, particularly if evidence of effectiveness requires the establishment of a causal relationship between intervention strategies and actual injury reduction. As a result, there are relatively few programmes aimed at the community and societal levels of influence (Dahlberg and Butchart, 2005) and also relatively little evidence for their being effective or ineffective (Mercy et al, 2002; Dahlberg and Butchart, 2005).
Another challenge is which outcome to study. Internationally, the evaluation of violence-prevention programmes has frequently considered their effectiveness in changing knowledge and attitudes, such as peer-education programmes, rather than behaviour or the reduction in the incidence of injuries, which are more important outcomes (Dahlberg and Butchart, 2005). Dahlberg and Butchart (2005) identify several levels of effectiveness for the evaluation of violence-prevention programmes. The most stringent criteria include: evaluations using a strong research design;
evidence of a significant prevention effect; evidence of a sustained effect (in which the effect extends beyond
the duration of the programme); and replication of a programme with demonstrated preventive effects
across different settings.
18

4. Focus of the review The public-health approach, as described by Dahlberg and Krug (2002), informed the structure upon which this review is based and is widely cited. This review focuses exclusively on interpersonal violence, which can be divided into two basic subcategories:
1. Family and intimate partner violence, which refers to violence that occurs mainly within the home (such as child, domestic, or elder abuse); and
2. Community violence, which usually takes place outside the home and is either directed at strangers (as with random violence, for example, or sexual assaults such as stranger rape), or acquaintances (as with bullying, for example, or sexual assaults such as date rape).
(Dahlberg and Krug, 2002). The ecological model used in this report is congruent with the one used by the other workgroups addressing mental health, cardio-vascular disease, infectious diseases and child health that specifies four ecological levels: biological, behavioural, societal and structural. This differs slightly from the model used by WHO (as shown in Figure 2 below), which utilises individual, relationship, community, and societal levels. Nevertheless, the models are interchangeable, as the WHO’s individual level includes the biological and behavioural levels specified in this Report. The WHO’s relationship level forms the proximal societal level of the Report, whereas the WHO’s community level falls under the Report’s distal societal level. The WHO’s societal level is interchangeable with the Report’s structural level.
Figure 2. Ecological model with risk factors for
interpersonal violence (WHO)
19

(Source: Butchart et al, 2004)
The brief for the workgroups is to focus on the upstream (or distal), rather than the downstream (or proximal), risk and protective factors. As this volume in the Report describes violence and road-traffic injury prevention, it will encompass many primary prevention strategies — especially those relying on environmental and infrastructural changes — and will typically engage Government departments in the social cluster other than the Department of Health. Nevertheless, as with the other working groups, the downstream risk factors are inextricably linked with their upstream drivers. To address this impasse, this review describes the risk factors for violence in their entirety according to the ecological model, and relevant interventions (both upstream and downstream) relevant to the specific risk factor. Suggested upstream interventions pertinent to the situation in the Western Cape Province will be summarised at the end of the review. For example, alcohol has already been highlighted as a major risk factor for injury in the Western Cape and will be a focal area for intervention. The abuse of alcohol is essentially a downstream risk factor, but the interventions proposed by the workgroup will focus on upstream factors — such as the liquor laws and advertising, the availability of alcohol, and the culture of recreational drinking — rather than programmes directed at individuals.
20

Risk factors for violent and aggressive behaviour Within the different ecological levels there are numerous risk factors and protective factors that determine both the likelihood of exposure to violence and the predisposition to aggressive or violent behaviour. This section briefly describes the risk and protective factors for victims and perpetrators of violence at four ecological levels: biological, behavioural, societal and structural. Their relative importance in the Western Cape is described through the use of available data and relevant studies and each section concludes with a brief discussion of the evidence base for various prevention approaches. 1. Biological Risk Factors 1.1. Demographic factors
Age and sex are important risk factors for aggressive behaviour, with boys being more likely to engage in physical acts of violence, particularly during adolescence and young adulthood. Not only are males more frequently the perpetrators of violence directed at men, women and children, but they are also at greater risk of being killed or injured as a result of violence. Sex is also an important determinant for the risk of being a victim. Fatal abuse is highest among young infants (Kirschner and Wilson, 2001) particularly among girls, whereas the risk for non-fatal abuse peaks in different age groups from country to country and sexual abuse peaks after puberty. Risk of sexual abuse is higher among girls, whereas boys are more at risk of injuries from harsh physical punishment (Runyan et al, 2002). The gender distribution of fatal violence in South Africa shows considerable variation among different age groups. In younger children, fatal violence is fairly evenly distributed between the sexes (Norman et al, in press). With non-fatal injuries gender differences are more apparent, with boys more frequently the victims of physical abuse and girls of sexual abuse. This is supported by data from the Red Cross Children’s Hospital in Cape Town, which reported in 2000 that girls accounted for 37% of non-fatal trauma cases. Of these, 48% were the survivors of sexual abuse, compared to only 3% of the boys that presented to the hospital for violence-related injuries. Of the child-specific crimes reported by the South African Police Services, the child-abuse rate and the rate for neglect and ill-treatment were both 14 per 100,000 population for 2004 (SAPS 2004). More telling information, which showed children over-represented among crimes of a sexual nature (rape and indecent assault), was released to parliament by the Minister of Safety and Security (See Table 3 on the following page).
21

Table 3: Crimes against Children as Percentages of Overall Crime Reporting Totals
Crime Category Reported Crimes against Children
Total Crimes Reported
Crimes against Children as a percentage of Total Crimes
Murder 1 128 18 793 6% Attempted Murder 1 569 24 516 6.4% Assault (GBH) 24 189 249 369 9.7% Common Assault 31 607 267 857 11.8% Rape 22 486 55 514 40.8% Indecent Assault 4 289 10 123 47.4%
(Source: Crimes of a serious nature reported during the period 1 April 2004 and 31 March
2005. Released by Minister Charles Nqakula on 21 September 20051.)
Moreover, the majority of reported assaults against children were commited in the Western Cape for the years 1998–2000, as shown in Table 4 below.
Table 4: Reported assaults against children by year and province
Province 1996 1997 1998 1999 2000 E Cape 2,847 2,486 2,243 1,998 2,338 Free State 999 984 874 834 991 Gauteng 2,184 2,028 1,938 2,150 2,421 KZN 1,564 1,756 1,871 1,986 2,313 Mpumalanga 1,021 986 868 1,042 1,169 NW Province 1,124 1,208 1,232 1,146 1,400 N Cape 1,118 1,134 1,056 1,186 1,267 N Province 2,938 2,217 2,042 1,492 1,474 W Cape 2,312 2,238 2,362 2,414 2,814 RSA 16,107 15,037 14,486 14,248 16,187
(Source: Crime, Information and Analysis Centre)
In the Western Cape Province, males were disproportionately affected by fatal violence, with 5.2 male deaths due to interpersonal violence for every female death (Bradshaw et al, 2004). This ratio was marginally higher than the average in other provinces, but 60% higher than the world average of 3.2 male deaths for every female death (WHO, no date). In South Africa, males also account for a greater proportion of non-fatal cases presenting to health facilities. Nevertheless, the male:female ratio is not as pronounced as for fatalities (Violence and Injury Surveillance Consortium, 2000; Norman, 2002), as women are more frequently the targets of other types of violence, such as sexual assaults and domestic abuse, that have a larger proportion of non-fatal outcomes.
1 www.info.gov.za/speeches/2005/05092313151002.htm
22

The age-histograms of deaths due to interpersonal violence in Cape Town for males and females (given in Figures 3 and 4 below) clearly show sharp increases in fatal violence from the age of 15 years. The distribution among males, with a peak in the 25- to 29-year age category is also typical internationally, but the concentration of deaths in this age range is not as pronounced (Prinsloo, 2004).
Figure 3: Violence-related deaths among males by age in Cape Town, 2003 (N =1886)
0
50
100
150
200
250
300
350
400
450
<1 1-4
5-9
10-14
15-19
20-24
25-29
30-34
35-39
40-44
45-49
50-54
55-59
60-64 65
+
Age in years
Num
ber o
f dea
ths
(Source: Prinsloo, 2004) The median age for female homicides in 1999 was 33 years, which does not significantly differ from intimate femicide deaths (30.4 years) (Mathews et al, 2004). Generally speaking, violent deaths among women was more equitably distributed across the age strata. Female fatalities in Cape Town peaked in the 35- to 39-year age category and the age profile in Figure 4 below shows a disproportionately high number of fatalities among women in the 60+ age group. (Prinsloo, 2004). The elderly are also more likely to die as a result of blunt-force injuries and strangulation. Data from the Medical Research Council female homicide study shows that older females are more likely to be strangled, with the majority of these deaths related to housebreakings and theft (Mathews et al, in press). The study suggests that a different dynamic exists in the murder of the elderly, with this group being particularly vulnerable to becoming victims of crime.
23

Figure 4: Violence-related deaths among females by age in Cape Town, 2003 (N =225)
0
5
10
15
20
25
30
35
40
45
<1 1-4
5-9
10-14
15-19
20-24
25-29
30-34
35-39
40-44
45-49
50-54
55-59
60-64 65
+
Age in years
Num
ber o
f dea
ths
Prevention: In responding to the important role that demographic factors play in determining the rate of fatal violence, it is possible to provide purely technical interventions that address the demographic profile of the province, sometimes called “social engineering”. An example of such misguided interventions would be attempting to affect an increase in the number of girl children, to control the migration patterns of young men, or to introduce a “man-tax” cover the cost of violence against women in the home. Similarly, Levitt and Dubner (2005) posit the introduction of abortion in the United States in 1973 as the single greatest contributor to the reduction in violent crime some 16 years later. Such interventions are not only ethically challenging, however, but are highly inappropriate in a constitutional democracy such as South Africa. Nevertheless, programmes to reduce unwanted pregnancies may have important implications for violence prevention. It follows that programmes aimed at reducing violent behaviour among males should be the priority for the primary prevention of violence and these will be discussed below in the review under the behavioural and societal factors.
1.2 Other biological factors
An abnormal heart rate can act as either a risk or protective factor for aggressive or violent behaviour. For youths, a low heart rate is associated with sensation-seeking and risk-taking behaviour (Raine 1993) and among younger children, high heart rates are associated with anxiety, fear and inhibition (Kagan 1989), which are believed to be protective factors against aggressive or violent behaviour (Mercy et al, 2002). Neurological damage that results in psychological or personality disorders predisposing individuals to violent or aggressive behaviour can be the result of biological
24

factors. This is a bi-directional relationship, as head injuries caused by violence that lead to unconsciousness may in turn lead to epilepsy or more violent behaviour. Prevention: The risk factors for these other biological factors are largely beyond the scope of this review. They fall more comfortably within the ambit of the other workgroups, such as the Mental Health Workgroup or, in the case of neurological damage arising due to complications associated with pregnancy or child delivery, in the Child Health Workgroup. The exception is in the area of neurological damage caused by foetal alcohol syndrome, but as the risk is largely dependent on the behaviour of the mother, it will discussed along with other interventions to reduce alcohol dependence and abuse in the following section. 2. Behavioural Risk Factors The risks for aggressive behaviour or becoming a perpetrator of violence may be influenced by numerous behavioural factors. Some of these may relate to individual behavioural characteristics that have manifested during the course of an individual’s personal development, while others are more pertinent to the interaction between individuals. This section therefore describes behavioural factors arising from early childhood development and the abuse of dependence-inducing substances. Interpersonal behavioural characteristics are included among the proximal societal risk factors described in the following section under the headings “Family” and “Community”. 2.1 Early childhood development
Problems experienced in early childhood are among the numerous psychological and behavioural factors that may predispose youths and young adulthoods to display violent and aggressive behaviour (Karr-Morse and Wiley 1997). These childhood problems include hyperactivity, impulsiveness, poor conduct, and attention problems, and may also include the early onset of behavioural problems, such as aggression, and oppositional, disruptive or destructive behaviours. Monbiot (2005) points to the role of diet in increasing aggressiveness and risk-taking behaviour. This was shown by a nutritional intervention among jailed male chronic offenders between the ages of 13 and 17 that supplemented deficient nutrients such as iron, magnesium, zinc, and vitamins, and included a dietary counselling component. Decreases in violent and non-violent antisocial behavior were reported in both the intervention group that received the supplement (80%) and the placebo group (56%), due to the counselling intervention and consequent dietary changes. The net difference between the group that received the supplements and the placebo was 28% (95% CI: 15 - 41%). Correspondingly there was no difference in violent and non-violent antisocial behavior among the group that elected not to change their diets (Schoenthaler et al, 1997). A similar intervention of vitamin, mineral and fatty-acid supplements among young adult prisoners found a 26%
25

reduction (95% CI: 8 - 44%) in offences in the intervention group (Gesch, 2002). Prevention: Rosenberg and Knox (2005) describe a “child well-being matrix” developed by the Task Force for Child Survival that combines public health and developmental science, as shown in Figure 5 below. This framework integrates the risk-reduction focus from public health prevention models with the promotion of positive development from youth developmental science to maximise opportunities for violence prevention. They also recognise the importance of education in realising the four key steps for effective prevention programmes among youth:
1. Programmes should start early in a young person’s life;
2. They should extend throughout childhood and adolescence;
3. They should engage the family, the peer group, the school, and the community; and
4. They should not only reduce risk and increase protection, but also promote positive development and core developmental competencies.
26

Figure 5: Child well-being matrix
(Source: Rosenberg and Knox 2005)
The tabulation below summarises the evidence for effectiveness from three sources — Mercy et al, (2002), Dahlberg and Butchart (2005) and Butchart et al, (2004)2 — and it is clear that prevention programmes targeting children show greater potential than those that aimed at adults (Butchart et al, 2004).
a) Effective strategies
Lead monitoring and toxin removal for children aged 0 to 3 years;
Social development programmes for children between the ages of 3 and19 years;
Therapeutic foster care for children aged 0 to 3 years;
2 Where there is disagreement between the different sources as to the strength of evidence, the most recent source is favoured.
27

Mentoring for children aged 12-19 years;
Preschool enrichment programmes for children aged 3 to 11 years;
Academic enrichment programmes for children aged 12 to 19 years; and
Life skills training programmes (from Dahlberg and Butchart – age group not specified).
b) Ineffective strategies
Individual counselling for children aged 12 to 19 years;
Programmes modelled on basic military training for children aged 12 to 19 years; and
Boot camps for children aged 12 to 19 years.
c) Promising strategies3
Increasing access to pre- and post-natal care aimed at preventing violence against children aged 0 to 3 years;
Treatment programmes for victims of maltreatment to reduce consequences for children aged 0 to 3 years;
Temporary foster-care programmes for chronic delinquents for children aged 12 to 19 years
Mentoring for children aged 3 to 11 years;
School-based child maltreatment prevention programmes for children aged 3 to 11 years;
Incentives for post-secondary education or vocational training for ages 20 and older;
Services for adults abused as children for ages 20 and older;
Treatment for child and intimate partner abuse offenders for ages 20 and older; and
School feeding schemes to ensure adequate nutrition.
2.2. Alcohol and substance abuse
Essentially a cross-cutting risk factor as it manifests at various ecological levels, the association between alcohol use and all types of trauma is well-documented. It is well known, for example, as an important situational risk factor that can precipitate violence (Krug et al, 2002). Three meta-analyses of the association between alcohol use and violence described by Parry and Dewing (2006) found that between 27% and 47% of intentional injuries were related to the use of alcohol (Schulz and Rice 1991; Single et al, 1998; English et al, 1995). In South Africa, where high consumption per capita and binge-drinking is rife, particularly among the victims and perpetrators of violence, the contribution of alcohol may be even greater.
3 ‘Promising’ interventions were defined as those that had been evaluated with a strong design
and had some evidence of effectiveness, but required further testing.
28

Several studies have found a link between alcohol dependence and child abuse (Strauss and Gelles 1986; Golding 1996) and excessive drinking by men is significantly associated with intimate-partner violence across different settings (Black et al, 1996). Women who live with heavy drinkers as partners have a far greater risk of physical abuse (Rodgers 1994; Johnson 1996). Never-theless, although there is general agreement that intimate-partner violence is likely to occur in relationships where men are heavy drinkers , the causal link remains a topic of much debate. Some argue that it merely serves as an excuse for aggression, while others argue that alcohol abuse may cause conflict in relationships, which then leads on to interpersonal violence. Certainly, the evidence with regard to this association is repeatedly found (Lipsky et al 2005; Kyriaco et al, 1999; Grisso et al, 1999), after taking into other associated factors into consideration. A study of three provinces in South Africa found that conflict over the male partner’s drinking was a risk factor for intimate partner violence and more important than his drinking (Jewkes et al, 2002a). The study by Abrahams and Jewkes (2006) also found that men who use violence against and intimate partner where more likely to report problematic alcohol use. However the reasons why men beat their partner’s when drunk are complex, some men use alcohol and gain courage to beat their partners when inebriated as this is socially expected of them (Jewkes et al, 2002b). With regard to the misuse of alcohol and aggressive driving, Sukhai et al (2005) found that more than half of the drivers who admitted to driving while drunk also reported becoming more aggressive when they drove under the influence of alcohol. The study also showed that drinking and driving was a strong predictor of two types of aggressive behaviour on the road, namely: verbal or gesticulatory expressions of anger, and direct confrontations with other motorists. Similarly, the misuse of other substances has been linked to child abuse in a number of different settings (Frias-Armenta and McCloskey 1998; Hunter et al, 2000; Klevens et al, 2000); youth violence (Mercy et al, 2002); and elder abuse (Swiss et al, 1998). As suggested in the World Report on violence and health, however, further research is required to separate out the independent effects of substance abuse from related issues such as poverty, overcrowding, mental disorders, and other health problems (Runyan et al, 2002). There are several indications that alcohol and substance abuse play an important role in driving the high levels of violence in South Africa. The Demographic and Health Survey data suggest that alcohol use significantly increased the risk of being exposed to violence (Doolan, 2006). A study of patients presenting to trauma units in Cape Town, Durban and Port Elizabeth found that — on average — more than half of the patients presenting for injuries owing to violence tested positive for alcohol usage (Plüddemann et al, 2004). Similarly, a study conducted among arrestees in eight police stations in Cape Town, Durban and Johannesburg found that between 6% and 23% were under the influence of alcohol when the crime
29

for which they were arrested took place (Parry et al, 2004). Table 5 below shows that more than half of the victims of fatal violence were alcohol positive, with the highest percentage of alcohol-positive cases among deaths resulting from sharp-force injuries (72%). Cape Town had the most distinct peak in weekend incidence and recorded the highest percentage of alcohol-positive deaths. (Matzopoulos, 2005b).
Table 5: Blood alcohol levels (g/100 ml) by external cause of violent death, 2004
External cause (no. of cases)
BAC analysis N (%)
BAC-positive N (%)
Mean BAC units
Std dev.
Firearm (5387) 3244 (60.2) 1241 (38.2) 0.14 0.09
Sharp (3220) 2105 (65.4) 1524 (72.4) 0.19 0.08
Blunt (1461) 584 (40.0) 274 (46.9) 0.18 0.09
Strangulation (199) 99 (49.7) 33 (33.3) 0.19 0.11
Burns (67) 14 (20.9) 8 (57.1) 0.15 0.10
Total (10429) 6099 3101 (50.8) 0.17 0.09
As drug testing is not performed routinely during post-mortem investigations, information on the use of other substances of abuse in relation to violence is more difficult to obtain. Nevertheless, one local study showed self-reported cannabis use at between 22% and 28% of arrestees who committed violent offences (Taylor et al, 2003), and another conducted among arrestees across eight police stations in Cape Town, Durban and Johannesburg (Parry et al, 2004) confirmed a high prevalence of drug usage, as shown in Table 6 on the following page.
Table 6: Percent positive for selected drugs, by offence category (Metros combined) – weighted data
Violent offence Cannabis Mandrax Cocaine Any drug
Murder* 45.8 20.8 0.0 45.8
Assault* 30.6 12.8 1.2 38.8
Robbery 37.9 18.5 4.5 42.4
30

Weapons 43.1 20.0 5.9 49.0
Rape* 42.3 12.0 0.0 50.0
Family violence 25.0 16.1 1.8 26.8
* Includes attempted crimes (Source: Parry et al, 2004)
Urinalysis from a hospital-based study of trauma victims in three South African cities between 1999 and 2001 found a high prevalence of drug usage among cases that presented for injuries including a high of 66% in Cape Town in 2001 (Parry et al, 2005). Parry et al (2004) found a higher percentage of arrestees testing positive for Mandrax, which is firmly rooted in Cape Town’s gang activities (Legget, 2001). Prevention: In reviewing the applicability of international best practices to address alcohol abuse, Parry (2005) recommends:
the piloting and implementation of brief interventions for high-risk and hazardous drinkers;
implementing a coherent liquor outlet policy that includes the integration of informal outlets into the regulated market;
encouraging community mobilisation against alcohol misuse that challenges the role of alcohol in the community as a social norm;
accrediting school-based programmes that follow best practice; and
implementing product restrictions, including restrictions on the size of packaging, clear labels regarding content, and restricting products that appeal to youth.
The draft Liquor Act, which will include measures to address access and sale of alcohol, is currently being considered for implementation in the Western Cape Province. It envisages a designated liquor officer in each police station and procedures for liquor licensing include: the training of licence holders and people serving alcohol; regulations governing the sale of liquor in residential areas; and measures to restrict noise and the sale of liquor to children (SMART, unpublished document). In the Western Cape, Non-Governmental Organisations, such as the South African National Council on Alcoholism and Drug Dependence, and the Cape Town Drug Counselling Centre have initiated a sensible-drinking programme in the socio-economically deprived areas of Athlone and Nyanga (Rendall-Mkosi et al, 2003). Another measure which has been mooted, and which may find popular support, proposes the establishment of an alcohol-injury fund that will compensate victims of alcohol-related trauma, as many victims are from marginalised communities with little recourse to legal action or compensation (Van As et al, 2003). It should be noted that, among the strategies listed in Mercy et al (2002), Dahlberg and Butchart (2005), and Butchart et al (2004), programmes providing information about drug abuse for children aged 6 to 19 years
31

have been shown to be ineffective in preventing violence, whereas reducing alcohol availability for ages 12 years and older has been suggested as a more promising strategy. One important consideration is that — while alcohol and substance abuse are risk factors for violence — a history of violence or abuse is also strongly associated with a later dependence on alcohol or other substances. A need therefore exists for programmes that address alcohol and substance abuse. Programmes are also needed to address issues that destabilise individuals and family structures: child, elder and intimate-partner abuse; youth violence; or teenage pregnancies. These suggested interventions are outlined elsewhere in this Report. Central to this integrated response, however, will be the development of capacity for monitoring and evaluating those strategies which have been designed to reduce alcohol misuse (SMART, unpublished document). 3. Societal risk factors 3.1. The role of the family
The influence of family relationships plays an important role during early childhood, whereas relationships with friends and peers have a greater effect during adolescence (Dahlberg, 1998). The risk factors at the family level for a child’s development of aggressive or violent behaviour include:
a family having a large number of children;
a mother having a child at a young age;
a low level of family cohesion;
family structure (single-parent households, for example); and
low socio-economic status of the family.
(Mercy et al, 2002) As well as inducing injuries (e.g. shaken infant or shaken impact syndrome is considered a potentially devastating form of child abuse), harsh physical is a strong driver of aggressive behaviour among children. Others include punishment, parental aggression towards children, and parental conflict during early childhood (McCord, 1979; Eron et al, 1991; Farrington, 1998). Poor monitoring and supervision are also strong predictors of violence and aggression and, conversely, are strong protective factors when parents are vigilant. Similarly, parents that were more aware of dangers in the community were significantly more likely to enforce firmer discipline (Earls et al, 1994). Among parents, abusive behaviour is linked to low self-esteem, poor control of impulses, mental-health problems and anti-social behaviour, and parents who have unrealistic expectations about child development (National Research Council, 1993; Klevens et al, 2000). Abusive parents tend to be more irritable and less supportive in response to their children’s behaviour and are more controlling and hostile (National Research Council, 1993).
32

Some studies have shown strong linkages between the risk of intimate-partner violence and child abuse (National Research Council, 1993; Madu and Peltzer 2000, Klevens et al, 2000). More recently the work by Dunkle et al (2004a) explored the prevalence and pattern of re-victimisation among women attending the Chris Hani Baragwanath Hospital in Johannesburg. This study found a history of child sexual abuse to increase the risk of physical or sexual intimate-partner violence (IPV) by 2.43 with a lifetime prevalence of IPV at 55.5%. Men are predominantly the perpetrators of sexual abuse among children (Finkelhor, 1994; McIntyre and Carr, 1999), whereas parents who are young, single, poor, unemployed, and with less education, are more likely to be physically abusive towards their children (Runyan et al, 2002). Single mothers are among those particularly at risk for this type of behaviour (National Research Council, 1993; Zununegui, 1997). There are also indications that domestic violence has direct effects on children, with one study suggesting that the high proportion of cases in which young children were injured unintentionally may be attributed to their becoming shields in assaults committed by adults (Fieggen et al, 2004). There are numerous relationship factors associated with a man’s risk for abusing his partner. These include young age, heavy drinking, depression, personality disorders, low academic achievement, low income, witnessing or experiencing violence as a child, marital conflict, marital instability, male dominance in the family, economic stress and poor family functioning, (Heise and Garcia-Moreno, 2002). Problems within relationships have been cited as reasons for abuse, including the denial of sexual favours as a reason for beatings (Wood and Jewkes, 1997). One important risk among males is their having witnessed domestic violence as children, as some studies have shown that boys who are exposed to conflict in early childhood are at increased risk to becoming violent as adults. South African children frequently witness intimate-partner violence within the home. Abrahams et al (2005) found that 23.5% of men from three municipalities in the Western Cape had witnessed abuse of their mothers, and this was found to be associated with later use of intimate-partner violence (OR2.61), and other forms of violence, such as direct involvement in conflicts in the community and at their workplace, and arrest for possession of an illegal firearm. In South Africa, local studies and data sources provide several indications of abusive power relationships affecting women in the home. A recent Medical Research Council study found that, in 2001, approximately half of all women murdered were killed by an intimate partner at a rate of 8.8 per 100 000 women aged 14 and older, which was the highest in the world (Mathews et al, 2004). According to the NIMSS data, a disproportionately high percentage of women are killed as a result of blunt-force injuries and strangulation, and a higher percentage of female deaths are owing to violence in private homes: 42% as opposed to 32% among males. The study of female homicides found a strong association between the perpetrator’s legal gun ownership and women being killed by an intimate partner: women were found to be at a ten times greater risk of being killed
33

when the perpetrator owned a legal gun (Mathews et al, 2004). As well as the direct impact of domestic violence, the high incidence in many community also places a considerable burden on police services, who are ill-equipped to intervene (Altbeker, no date). Prevention: Easier access to social support for women and families has been cited as an important factor in mitigating the risk of abusive behaviour (Zununegui, 1997). Social-cognitive theory, however, maintains that only multi-context, long-term interventions which affect the multiple dimensions of a child's environment are likely to be effective in preventing childhood, adolescent, and adult interpersonal violence (Huesmann and Eron, 1986; Butchart et al, 2004). Mercy et al (2002), Dahlberg and Butchart (2005), and Butchart et al, (2004) summarise the evidence for effectiveness as follows:
a) Effective strategies
Home visitation aimed at reducing violence directed at children aged
0 to 3 years;
Training in parenting aimed at reducing violence among children aged
0 to 5 years;
Family mentoring for families with children aged 12-19 years;
Community mobilisation of women’s networks to challenge prevailing norms and beliefs in order to reduce the tolerance of violence and to induce perpetrators to fear the consequences of their behaviour; and
Working with young men to change their attitudes towards, and behaviour with regard to, gender-based violence and violence in general.
Hospital-based, parent education programme to reduce the incidence of abusive head injuries among infants and children (Dias et al. 2005)
b) Ineffective strategies Establishing peer group norms
c) Promising strategies
Reducing unintended pregnancies (aimed at preventing violence against children aged 0 to 3 years);
Criminal justice reforms to criminalise child maltreatment, intimate-partner violence, and elder abuse for ages 20 and older;
Mandatory arrest policies for intimate-partner violence for ages 20 and older;
Public shaming of intimate-partner violence offenders for ages 20 and older;
Services for identifying and treating elder abuse;
34
Training health-care professionals in the identification and referral of battered women, victims of elder abuse, and victims of sexual violence;
Prevention and educational campaigns to increase awareness of child maltreatment for all ages;
Child-protection service programmes for all ages;
Peer mediation or peer counselling for children aged 12-19 years; and
Home-school partnership programmes to promote parental involvement for children aged 3 to 11 years.
3.2 Violence in the community
The risk factors for violence among adolescents and young people outside the family usually relate to having violent friends. This may influence the likelihood of a young person engaging in violence (Butchart et al, 2004), as well as increasing the risk of engaging in other delinquent behaviours, such as alcohol and substance abuse and risk-taking. Within urban areas, residents of neighbourhoods with high rates of violence are themselves more likely to act violently (Farrington, 1998; Thornberry et al, 1995). Activities relating to gangs, guns, and drugs tend to drive increases in the rate of violence within neighbourhoods and the psychological imprint of these experiences expose children to a range of severe negative mental-health outcomes such as post-traumatic stress disorder, dysthymia and major depression (Ensink et al, 1997). This may have a uniquely detrimental effect in South Africa, where there are a large number of child-headed households. Within communities, risk factors for violence may include the level of unemployment, population density and mobility, and the existence of a local drug or gun trade (Butchart et al, 2004). The carrying of weapons presents a risk not only of engaging in violent and criminal acts, but also in increasing the severity of injuries resulting from violence. Another important contributor is social integration within the community. As well as experiencing more psychological or behavioural problems, children in areas with less social capital are also at greater risk of abuse (Runyan et al, 1998). Reduced social capital, manifesting in low social cohesion and interpersonal mistrust, has been linked with an increase in higher violence rates and economic inequality (Wilkinson et al, 1998). Conversely, Earls (1999) recognises a strong relationship between high levels of civic engagement and low levels of crime. The community factors associated with a man’s risk for abusing his partner are weak community sanctions against domestic violence, poverty, and low social capital (Heise and Garcia-Moreno, 2002). Again, there are numerous indicators of the high levels of community violence in South Africa and the Western Cape. Police crime statistics on rape and indecent assaults (shown above in Table 4 on page 22) hide the true extent of the problem as these crimes are typically underreported.
35

Jewkes and Abrahams (2002) revealed that there were 210 reported rape cases per 100,000 population in South Africa in 1990, compared to 80 per 100 000 in the United States. Wood and Jewkes (1997) assert that South Africa has the highest rate of violence against women in the world, excluding countries at war. A study of women attending antenatal clinics in Soweto found that 55% had been victims of physical or sexual violence (Dunkle et al, 2004b) and Swart et al (2000) found that one-third of women presenting to medico-legal clinics for rape in Johannesburg had been gang-raped. The 1998 Demographic and Health Survey found that 10% of 15-19 year old females had had sex against their will and that half had been physically forced (Medical Research Council, 2003). Another study in Cape Town reported that 32% of pregnant adolescents and 18% of matched controls had been forced into their first sexual experience (Jewkes et al, 2001a). In the Lavender Hill and Steenberg area in Cape Town, over 70% of a sample of primary school children reported exposure to violence (Van der Merwe and Dawes, 2000). There is also clear evidence of risk-taking behaviour and a culture of aggression among youths. In their study of high-school dropouts in Cape Town, Flisher and Chalton (1995) found that dropouts were at an increased risk of engaging in risk-taking behaviour. The Medical Research Council’s Youth Risk Behaviour Study revealed that in the Western Cape approximately 38% of male learners and 8% of female learners had carried a weapon in the past six months (MRC 2002). In South Africa it is estimated that there are currently 3.7 million guns in personal hands. The most troubling aspect of it all, however, is the readiness of South Africans to use these weapons. Not only are firearm fatality rates per 100,000 population among the world’s highest, but also rates per 100,000 licensed firearms: 302 per 100,000 in South Africa versus 4 per 100,000 in the United States (Keegan, 2006). Firearms were the leading external cause of fatal violence across all age groups from the age of five years. Of the 6,167 firearm deaths recorded by the NIMSS in 2003, 87% were violence-related and the rest were mainly suicide-related, except for 20 unintentional deaths (less than 1%). Gunshot injuries accounted for 53% of male and 41% of female homicides. The 46 recorded firearm deaths among children aged 0–14 years in Cape Town, Durban, Johannesburg and Pretoria/Tshwane were all violence-related, except for one unintentional injury death in Johannesburg. Although men are usually the victims of firearm violence (95% of guns are owned by men) a study by the Centre for the Study of Violence and Reconciliation (cited by Keegan, 2006) observed that there had been a 78% increase in the use of guns in intimate femicide in Gauteng between 1990 and 1999. The Western Cape also has a history of social problems associated with street crime and gangs, which comprise an estimated 90 000 members in the province (Cerda, 2002). Street gangs are implicated in drugs and the weapons trade in many different settings, as indicated by the spatial distribution of firearm violence in Cape Town. As well as the high rates of
36

gun violence in the sub-districts4 already noted for high homicide rates (such as Nyanga and Khayelitsha), a disproportionately large percentage of firearm homicides were recorded in the Athlone and Mitchells Plain sub-districts (Groenewald et al, in press), which include large areas with active gang-affiliated populations.
Figure 6. Leading external causes of violence-related deaths, 2003 (N = 10 499)
1480
67
199
1461
3220
5387
0 1000 2000 3000 4000 5000 6000
Other
Burns
Strangulation
Blunt force injury
Sharp force injury
Firearms
Number of deaths
Source: Harris et al, 2004
With regard to aggressive driving, Sukhai et al, (2005) found that carrying a weapon while driving (most often a firearm) was a strong predictor of direct confrontation with other motorists. This was confirmed by a study in Arizona, which found that drivers with firearms in their vehicles were three times more likely to engage in this type of behaviour than motorists who never drove with a firearm (Miller et al, 2002). Prevention: Mercy et al (2002), Dahlberg and Butchart (2005), and Butchart et al (2004) summarise the evidence for the effectiveness of prevention programmes at the community level of intervention as follows:
a) Effective strategies
Programmes encouraging youths aged 12 to 19 years at high risk for violence to complete secondary schooling; and
Implementing school-based prevention programmes aimed at reducing dating violence for children aged 12 to 19 years.
b) Ineffective strategies
Trying young offenders in adult courts for children aged 12 to 19 years;
Training in the safe use of guns for children aged 12 to 19 years;
Residential programmes in psychiatric or correctional institutions for children aged 12 to 19 years;
4 This report makes use of the old city sub-districts, which better indicate inequalities within the city.
37
Probation or parole programmes that include meetings with prison inmates describing the brutality of prison life for children aged 12 to 19 years;
Gang-prevention programmes for children aged 12 to 19 years;
Buying back guns from children and young adults aged 12 to 29 years; and
Laws permitting gun carrying in public.
c) Promising strategies
Services for children aged 0 to 3 years who have witnessed violence;
Waiting periods for firearm purchases for ages 20 and older;
Owner liability for damage by guns for ages 20 and older;
Screening by health-care providers for the maltreatment of children aged 0 to 3 years;
Safe havens for children on high-risk routes to and from school for children aged 3 to 11 years;
After-school programmes to extend adult supervision for children aged 3 to 11 years;
Recreational programmes for children aged 3 to 19 years;
Improving school settings for children aged 3 to 19 years;
Training health-care professionals in the identification and referral of high-risk youth and victims of sexual violence;
Metal detectors in schools for children aged 3 to 19 years;
Shelters and crisis centres for battered women and victims of elder abuse for ages 20 and older;
Establishing adult recreational programmes for ages 20 and older;
Community policing for all ages;
Training health-care providers in the detection and reporting of child maltreatment;
Promoting the safe storage of firearms and other lethal weapons
Services for incarcerated perpetrators; and
Gun control legislation that decreases the number of guns in society (Chapman et al. 2006).
3.3. Socio-cultural factors The culture of a society determines the extent to which violence is endorsed as a response to conflict. Social cultures that are lacking in non-violent alternatives to the resolution of conflict have higher rates of youth violence (Mercy et al, 2002). It would seem that in countries such as South Africa, this translates into the readiness to engage in violent acts in response to a number of conflict situations. Recent examples include the
38
reports of violence by striking security workers across the country and the periodic outbreak of taxi violence in the Western Cape Province. The societal factors associated with a man’s risk for abusing his partner are traditional gender and social norms supportive of violence (Heise and Garcia-Moreno, 2002). For example, cross-cultural studies indicate that intimate-partner violence is more likely in societies where violence has become an everyday occurrence, such as may be found in conflict areas (Counts et al, 1992; Moore 1994). Butchart et al (2004) maintain that gender and social inequities are related to many of the major risk factors for interpersonal violence and can exacerbate other risk factors, whereas increased equality and equity multiply the effects of protective factors. This is a complex process, however. Henriettta Moore (1994), a feminist anthropologist, maintains that challenges to the male identity results in violence as an expression of power in order to restore a sense of manliness. The construction of the South African male identity is further influenced by our colonial past, while the low-intensity civil war brought on by the Apartheid regime made the experience of armed combat a key component behind the socialisation of most South African men over the age of 30 (Morrel, 2001). The effectiveness of political structures in applying social protection and crime and violence-prevention strategies is also an important factor in determining rates of violence. In an investigation of 45 high- and middle- to low-income countries between 1965 and 1995, Fajnzylber et al (1999) found that arrest rates for murders had a significant effect in reducing violence. Conversely, a lack of protection by the State prompts communities to apply unofficial methods of justice, as witnessed in South African townships in recent months, which further increases the incidence of violence. The State can also provide institutions for social protection and make substantial investment in welfare. Both of these strategies seem to affect a reduction in rates of violence (Pampel and Gartner, 1995; Messner and Rosenfeld, 1997). Three important pieces of legislation currently under review in South Africa are:
1. The Domestic Violence Act;
2. The Criminal Law (Sexual Offences) Amendment Bill; and
3. The Child Justice Bill.
The Domestic Violence Act represents a progressive step forward in that it recognises a wide range of co-habitation relationships and abusive behaviour, such as sexual or emotional distress and the use of weapons. The Act should further make it easier for victims of abuse to obtain protection orders, while provision has been made for the applicants to be informed of the relevant rights that are applicable. Yet Rama (2006) observes that, although the Act is progressive, it was passed with no budget attached, and that the necessary resources are not yet in place to address the many needs with regard to domestic violence. In particular, places of safety and shelters are mainly based in urban areas and have insufficient capacity. Only five Thuthuzela Rape Crisis Centres exist across
39

the country, for example, and collectively they see less than 5% of projected rape cases. Another important piece of legislation is the Criminal Law (Sexual Offences) Amendment Bill, which was tabled in 1996 but which has yet to be promulgated. Among the positive aspects of this Bill are:
the broader definitions of rape, whereby men are included in the definition of rape victims;
a wider range in the definition of forceful sexual acts, such as anal penetration; and
the inclusion of a range of coercive or abusive uses of power that take advantage of a victim’s vulnerable position (such as the use of alcohol and drugs).
The negative aspects of the Bill include a reduction of post-event provisions for rape victims, such as counselling, and reduced protection of witnesses and victims (Mills, 2006). The Child Justice Bill is one of the world’s most progressive pieces of child-centred justice legislation with a restorative, community justice-based approach. This includes:
community and victim involvement;
the protection of young people after arrest; and
diversion programmes that would provide alternative values and role models.
(Pinnock 2007).
Unfortunately, however, although this Bill was initially tabled in 1994, it has yet to pass into law.
Recent concerns have also centred on the role of media in changing cultural norms and values. There is some evidence to suggest that exposure to violence on television increases the immediate likelihood of aggressive behaviour (Paik and Comstock, 1994), although the long-term effects are unclear. Violence is but one of several areas where the role of the media is subject to scrutiny. Although beyond the scope of this review, it should also be recognised that the reinforcement of gender stereotypes and the projection of bad lifestyles (such as risk-taking behaviour) may also have an indirect correlation with risk factors for violence across the different ecological levels. Prevention: Mercy et al (2002), Dahlberg and Butchart (2005) and Butchart et al (2004) summarise the evidence for effectiveness as follows:
a) Effective strategies None identified.
b) Ineffective strategies None identified.
40

c) Promising strategies
Reducing media violence for children aged 3 to 19 years;
Public information campaigns to promote pro-social norms for children aged 3 to 11 years;
Changing cultural norms that support violence and abuse for ages 12 and older; and
Gun-control legislation that changes perceptions about the acceptability of guns in society.
Even media campaigns have an important role to play in informing and modifying the socio-cultural norms and behaviours that increase the tendency of men to use violence. As primary prevention requires an integrated long-term approach, community media strategies lend themselves to changing the cultural landscape and altering public perceptions and responses to violence. In South Africa there are several public-information campaigns, although evidence of the effectiveness of these strategies is difficult to gauge. The initial Sixteen Days of Activism Against Violence Against Women and Children campaign solicited support from a number of high-profile politicians and celebrities. Reminiscent of the annual mass media campaign to raise awareness co-ordinated by women’s groups in Nicaragua during the 1990s (Ellsberg et al, 1997) and the United Nations Development Fund for Women’s regional campaigns against gender violence (Mehrotra, 2000) the “16 days” included innovative offerings such as a daily hour-long web-based chatroom with a gender violence theme and a number of multi-purpose centres to facilitate access to victims of violence across the country. Yet despite its popularity, it seems that rates of violence against women and children continue to increase (Rama, 2006). Another example is the social mobilisation around gun control. Following the introduction of the Gun Control Charter, a gun hand-in campaign was initiated in 1994. The Gun Control Alliance then embarked on mixed strategies from 1995 that included regular use of the media to motivate for stricter gun control measures and the mobilisation of civil society through a “one message, many voices” advocacy strategy. The Gun Control Alliance currently comprises 200 organisations and 5000 individuals including mothers, men, youth, children, safety and security organisations and members of faith communities, who participate in co-ordinated advocacy campaigns (Keegan, 2006). One campaign that has received acclaim not only for its innovative public messaging, but also for its development processes (Coulson, 2002) and its focus on documentation and evaluation (Heise and Garcia-Moreno, 2002) is Soul City. Evaluations of the television series have found increased knowledge and awareness, and shifts in attitudes and social norms concerning domestic violence and gender relations, as well as significant increase in the willingness to change behaviour and to take action against violence, both in urban and rural areas among both men and women (Heise and Garcia-Moreno 2002; Parks et al, 2002; Soul City, 2001).
41

Nevertheless, effects on behaviour change and reductions in injury rates due to violence have not yet been established (Soul City, 2001). 4. Structural Factors Major social changes and demographic shifts resulting from migration, urbanisation or modernisation have been linked with increased rates of violence among youth (Mercy et al, 2002). Some of this may be due to the effects of poverty and increased income inequality, which has been linked with increasing rates of violence (Messner 1988; Fajnzylber et al, 1999). Yet it is clear that social and cultural factors determine whether violence is encouraged or inhibited. These include economic and social policies that maintain or reduce socio-economic inequalities, the availability of weapons, and social and cultural norms. They might also include the prevalence of a male-dominated society, or cultural norms that endorse the use of violence to resolve conflict (Butchart et al, 2004).
4.1. Poverty and social status
The relationship between socio-economic status and violence has been shown to exist in many high-income countries (Sampson et al, 1997; Krahn et al, 1986). It is understood internationally that violence is more concentrated in areas of poverty and deprivation (Butchart et al, 2004). South Africa is beset by huge disparities in socio-economic status and income and these are mirrored in crime and violence patterns. To cite one example, the spatial distribution of the rates of fatal violence within Cape Town show that the highest rates were recorded in the relatively impoverished sub-districts of Nyanga (132 per 100,000 population) and Khayelitsha (120 per 100,000 population) (Groenewald, et al, in press). Another important factor is relative deprivation or social inequality, which is said to breed social tensions (Fajnzylber et al, 2004). Thus homogenous, poor populations typically have lower rates of violence than heterogeneous populations comprising rich and poor and this social inequality has a stronger association with violence than mean income (Kawachi et al, 1997; Szwarcwald et al, 2000). Two important indicators of socio-economic position are employment and education. The primary and high school drop-out rates for Blacks has been estimated as being as high as 72%, while 24% of Black adults have never attended school at all (Cape Times 1990. cited in Flisher and Chalton, 1995). Flisher and Chalton (1995) summarise some of the adverse consequences of not completing schooling for the individual as:
1. having low levels of academic skills;
2. reduced probability of steady employment or receiving adequate income;
3. poorer mental and physical health; and
4. increased use of psychiatric and mental health services due to drug-related problems;
42

and at a societal level as:
5. forgone tax revenues;
6. increased demand for social services; and
7. increased crime rates.
The net result of low educational attainment and high rates of unemployment is that the traditional components of socio-economic position are not always applicable in South Africa (Myer et al, 2004). This is demonstrated by research conducted in Chile, Egypt, India and the Philippines, which showed that female education and household wealth were protective factors against intimate-partner violence (Bangdiwala et al, 2004). In South Africa, a cross-sectional study in three provinces indicated that, although education was a protective factor, other measures of socio-economic position were not (Jewkes et al, 2001b). Although race is inextricably linked with socio-economic status, owing to the country’s apartheid past, multi-variate analysis of the Demographic and Health Survey data confirms that race is not associated with the experience of violence. The data suggest that (unlike that found in developed country settings and outside of the wealthiest quintile, which had a protective effect), exposure to violence was significantly correlated with being male, increasing age, alcohol use, increasing education, living in an informal settlement, and being unemployed (Doolan, 2006). One important structural intervention that may assist in reducing poverty and income inequality, empowering participants and hence in improving health, is micro-finance (Goldberg 2005, Wright 2000). A recent micro-finance programme in Limpopo, which included a gender and HIV training curriculum, also resulted in significant decreases in reported intimate-partner violence among participants (Pronyk et al, 2006). The study complements a growing body of evidence which suggests that an increase in women’s economic participation tends to decrease gender inequity and violence (Cheston and Kuhn, 2002; Shrestha, 1998). Similarly, in South Africa, efforts to address gender-based violence are integral to interventions aimed at reducing HIV infection and promoting safer sexual behaviour (Jewkes et al. 2006). 4.2. Migration and urbanisation
Urbanisation is seen as a key factor in driving high rates of violent crime (UNODC, 2005; Burton et al, 2003) and the substantial variation in the provincial injury profiles is partly explained by the extent of urbanisation. In South Africa, provinces with more urban-based populations have higher injury rates and it is understandable that the 20 police stations reporting the most murders comprised a mixture of inner city and township stations with most also being in and around Johannesburg, Cape Town and Durban (Altbeker, in press). The Medical Research Council’s provincial estimates of mortality in 2000 also indicated a higher concentration of fatal violence in cities, with the Western Cape Province and Gauteng — the two most
43

developed provinces — reporting the highest rates of fatal violence (Bradshaw et al, 2004). The effect of migration is an important factor when considering the relationship between urbanisation and high rates of violence. In South African cities, mass migration from rural areas coincided with the relaxation of the Apartheid regime’s Influx Control and Group Areas Acts and the country’s transition to a multi-racial democracy. The resulting hardships in securing dwellings, services and scarce resources, competition for jobs and rising unemployment, as well as the inability of Apartheid-era infrastructure to cope with this rapid urbanisation, are all well-documented in the social-science literature and therefore beyond the scope of this review. The NIMSS data reveal substantial differences between the different cities in the patterns of fatal violence. In 2003, fatal injuries due to violence accounted for a higher percentage of non-natural deaths in Cape Town (55%) and Durban (54%) than in Johannesburg (47%) and Pretoria/Tshwane (31%). The male:female ratio was highest in Cape Town (8.5:1), followed by Durban (7.5:1), Johannesburg (7.2:1) and Pretoria/Tshwane (5.1:1). The highest rate of fatal violence directed at females was reported for Cape Town (7.7 per 100,000 population), followed by Johannesburg, Durban and Pretoria/Tshwane at 7.6, 7.3 and 4.5 per 100,000 population respectively (Matzopoulos, R 2005a). In 2004, age standardised rates for fatal violence from the NIMSS in 2004 confirmed that Durban (55 per 100 000 population) and Cape Town (54 per 100 000) had higher rates than Johannesburg (40) and Pretoria (26). It should be noted, however, that the first wave of migrants from South Africa’s rural areas has been that of young men seeking employment, which has dramatically altered the demographic profile of South Africa’s major cities and towns. Gauteng in particular has a much larger male population in the 20- to 44-year age group than the national average, and this group is also the most at-risk group for violence, either as perpetrators or as victims1.
4.3. Housing and infrastructure
Urbanisation in turn affects an increase in population density and the delivery of basic infrastructure and services. It has also been shown that areas with lower population density present fewer homicides, even in the presence of deprived socio-economic conditions (Santosa et al, 2006) Living in economically disadvantaged neighborhoods is associated with adults’ exposure to violence (Buka, et al, 2001). Overcrowding and sub-standard housing are important factors in social disorganisation theory, which postulates a complex interrelationship of factors affecting societies in transition that lead to a range of socio-pathological conditions.
1 Note that the age standardised rates from the NIMSS adjust the age profiles of the different cities to a common standard. As a result, the age standardised rate for a city like Johannesburg with a large proportion of young adults, is somewhat lower than the crude or actual rate.
44
For example, deterioration of housing stock is one of several infrastructural factors associated with a vulnerability to mental illness at a neighbourhood level (Ahern et al, 2004). Green spaces within neighbourhoods may also be a factor, as residents living in relatively barren buildings report more aggression, violence and mental fatigue than counterparts in greener buildings (Kuo and Sullivan, 2001) Prevention: As mentioned in Section 1.3 above, the broad scope of community and societal violence-prevention strategies complicates evaluation research and hence there is limited information as to the effectiveness of these strategies. Mercy et al, (2002), Dahlberg and Butchart (2005) and Butchart et al, (2004) summarise the evidence for effectiveness as follows: a) Effective strategies
none identified b) Ineffective strategies
none identified c) Promising strategies
Enforcing laws which prohibit the illegal transfer of guns to youth for children aged 12 to 19 years
Establishing job-creation programmes for the chronically unemployed for ages 20 and older;
Promoting the safe storage of firearms;
Strengthening police and judicial systems for all ages;
Reducing poverty for all ages;
Reducing income inequality by promoting a more equitable distribution of resources and infrastructure — for all ages;
Improving emergency response and trauma care for all ages;
Greening neighbourhoods;
Programmes to decrease housing density;
Programmes to decrease residential mobility; and
Microfinancing projects for women
(Pronyk et al, 2006)
Nevertheless, a lack of available evidence should not be equated with evidence of ineffectiveness. Despite the fact that most prevention efforts and also the evidence of effectiveness is focused on single interpersonal violence subtypes (sexual violence, youth violence, and so on), evidence of the effectiveness of broader interventions is emerging. The following case study describes the broad ranging multi-dimensional public health
45
interventions that were instrumental in reducing violence in the Colombian cities of Cali and Bogota.
Case study - Bogota and Cali
In Cali the elected major, who was a public health specialist, initiated a programme called DESEPAZ that aimed to prevent violence and improve social citizenry through social development, political empowerment and enhanced social cohesion (Concha et al, 1994). According to Guerrero (2006), the programme embraced the following guiding principles: (1) As violence is a multi-causal problem, it requires multiple and comprehensive
interventions; (2) Interventions should be based on scientific research and underpinned by reliable
injury surveillance; (3) Primary prevention should be the priority; (4) Responsibility for civil security should be shared by the government, police and
citizens; and (5) The foundations for peace and safety are: a culture of tolerance; the promotion of
social development to redress inequity; and the promotion of human rights. A similar approach in Bogota, which also included substantial investment in the enhancement of public spaces, saw the mayor institutionalising its programme through the establishment of a sub-secretariat in the local council, the Programme of Security and Congruous Living (Guerrero 2006). In both cities, partnerships between local government and academic institutes realised reliable information systems on crime, violence and injury to identify risk factors and inform prevention strategies. Among the interventions, strategies to reduce alcohol sales at high risk periods and the carrying of firearms were common to both cities, as well as investment in police and judicial systems, and public education campaigns. Although, according to Guerrero (2006), the evidence of effectiveness cannot be attributed to the interventions absolutely, as they were not designed as controlled experiments and were not independent of the social and cultural changes taking place in the country, several that were evaluated did show positive results. However, the collective effectiveness of these strategies was evident in the dramatic decreases in rates of interpersonal violence at the city level. In Cali, rates of fatal violence declined from a peak of 126 per 100,000 population in 1994 to rates of about 100 per 100,000 since 1998. In Bogota, the decline was more dramatic, from the 1994 peak of 82 to 23 per 100,000 over a ten-year period. Guerrero (2006) attributes the comparative success of the Bogota programme to several key factors. These included the duration of the programme, which was not affected by the changes in local government that negated some of the interventions that had been implemented in Cali, as well as the prioritisation of social infrastructural projects in Bogota such as investment in public spaces and transportation and a larger budgetary allocation to policing and the criminal justice system.
46

Summary of effective and promising interventions
In South Africa the Right to Safety is implied through the Right to Life in the Bill of Rights (Constitution of the Republic of South Africa, Act 108 of 1996) and within the Bill of Rights are numerous provisions that outline the type of environments, services and support that the Constitution advocates. For example, provisions that may have a bearing on violence against children include Section 24 (the right to live in an environment that is not harmful to the child’s health or well-being); Section 27 (the right to health care services and the right not to be refused emergency medical treatment respectively); and Section 28 (the right of the child to be protected against abuse and neglect). Furthermore, South Africa has also been a signatory to numerous international treaties and established various offices to ensure that basic rights are applied, such as the National Children’s Rights Committee and the National Programme of Action for Children (Van der Merwe and Dawes, in press). Nevertheless, the Right to Safety is only included implicitly and, if South Africa is to realise significant improvements in public safety, it needs to embrace policies that support safer environments. Butchart et al, (2004) maintain that violence prevention requires comprehensive intervention strategies involving all sectors of society to address core sets of underlying causes and risk factors, including Government, NGOs and civil society, as well as the general public and the private sector. In their guide to implementing the recommendations of the World Report on violence and health Butchart et al (2004) highlight several key strategies for promoting primary prevention:
Investing in the early development stages of childhood show greater promise than those directed at adults;
Increasing positive adult involvement in the monitoring and supervision of children and adolescents as a warm, supportive relationship with parents or other adults is protective against anti-social behaviour;
Strengthening communities, for example through reducing the availability of alcohol or improving childcare facilities;
Changing cultural norms in order to promote such positive norms as equality for women or respect for the elderly, and to challenge such negative norms as those which associate violent behaviour with masculinity, or which seek to foster racism, classism, and sexism;
Reducing income inequality; and Improving the efficiency and resource base of the criminal justice
and social welfare systems.
47

Upstream interventions
In devising key upstream interventions to improve safety in the Western Cape the framework proposed by Butchart et al (2004) can be applied to the review of risk factors and interventions in the preceding section as follows: Investing in early interventions
Lead monitoring and toxin removal; Increasing access to pre- and post-natal care for children aged 0 to 3
years; and Multi-context, long-term interventions that impact on multiple
dimensions of a child's environment. Increasing positive adult involvement
Incentives for young adults and high risk youths to complete high school and post-secondary education or vocational training.
Strengthening communities
Alcohol
Implementing a coherent liquor outlet policy that includes the integration of informal outlets into the regulated market;
Encouraging community mobilisation against alcohol misuse;
Establishing norms and guidelines for school-based programmes based on best practices;
Implementing product restrictions, including restrictions on the size of packaging, and promoting the use of clear labels regarding content;
Restricting products that appeal to youth;
Reducing alcohol availability for ages 12 years and older; and
Establishing integrated programmes that address alcohol and substance abuse alongside other violence-prevention initiatives.
Education and childcare
Encouraging youths to complete secondary schooling;
Implementing school-based prevention programmes aimed at reducing dating violence;
Child-protection service programmes;
Improving school settings for children; and
Metal detectors in schools for children aged 3 to 19 years.
Firearms
Longer waiting periods for firearm purchases;
Owner liability for damage by guns;
48
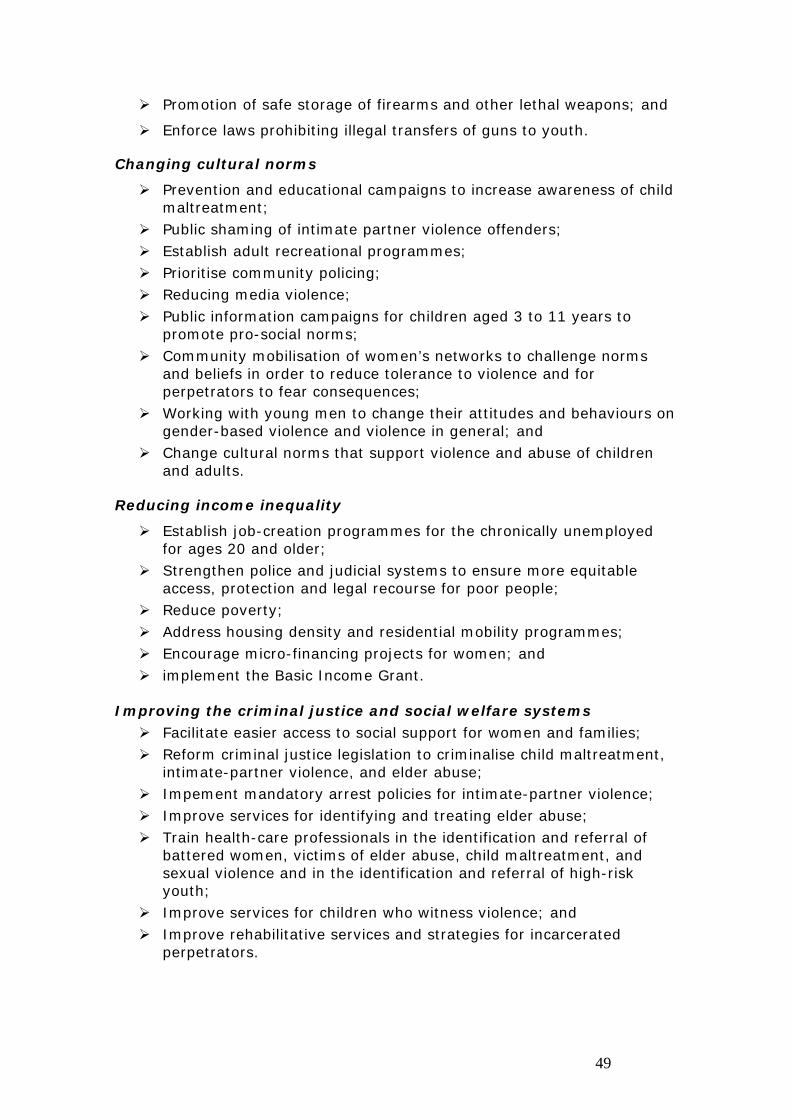
Promotion of safe storage of firearms and other lethal weapons; and
Enforce laws prohibiting illegal transfers of guns to youth.
Changing cultural norms
Prevention and educational campaigns to increase awareness of child maltreatment;
Public shaming of intimate partner violence offenders; Establish adult recreational programmes; Prioritise community policing; Reducing media violence; Public information campaigns for children aged 3 to 11 years to
promote pro-social norms; Community mobilisation of women’s networks to challenge norms
and beliefs in order to reduce tolerance to violence and for perpetrators to fear consequences;
Working with young men to change their attitudes and behaviours on gender-based violence and violence in general; and
Change cultural norms that support violence and abuse of children and adults.
Reducing income inequality
Establish job-creation programmes for the chronically unemployed for ages 20 and older;
Strengthen police and judicial systems to ensure more equitable access, protection and legal recourse for poor people;
Reduce poverty; Address housing density and residential mobility programmes; Encourage micro-financing projects for women; and implement the Basic Income Grant.
Improving the criminal justice and social welfare systems Facilitate easier access to social support for women and families; Reform criminal justice legislation to criminalise child maltreatment,
intimate-partner violence, and elder abuse; Impement mandatory arrest policies for intimate-partner violence; Improve services for identifying and treating elder abuse; Train health-care professionals in the identification and referral of
battered women, victims of elder abuse, child maltreatment, and sexual violence and in the identification and referral of high-risk youth;
Improve services for children who witness violence; and Improve rehabilitative services and strategies for incarcerated
perpetrators.
49
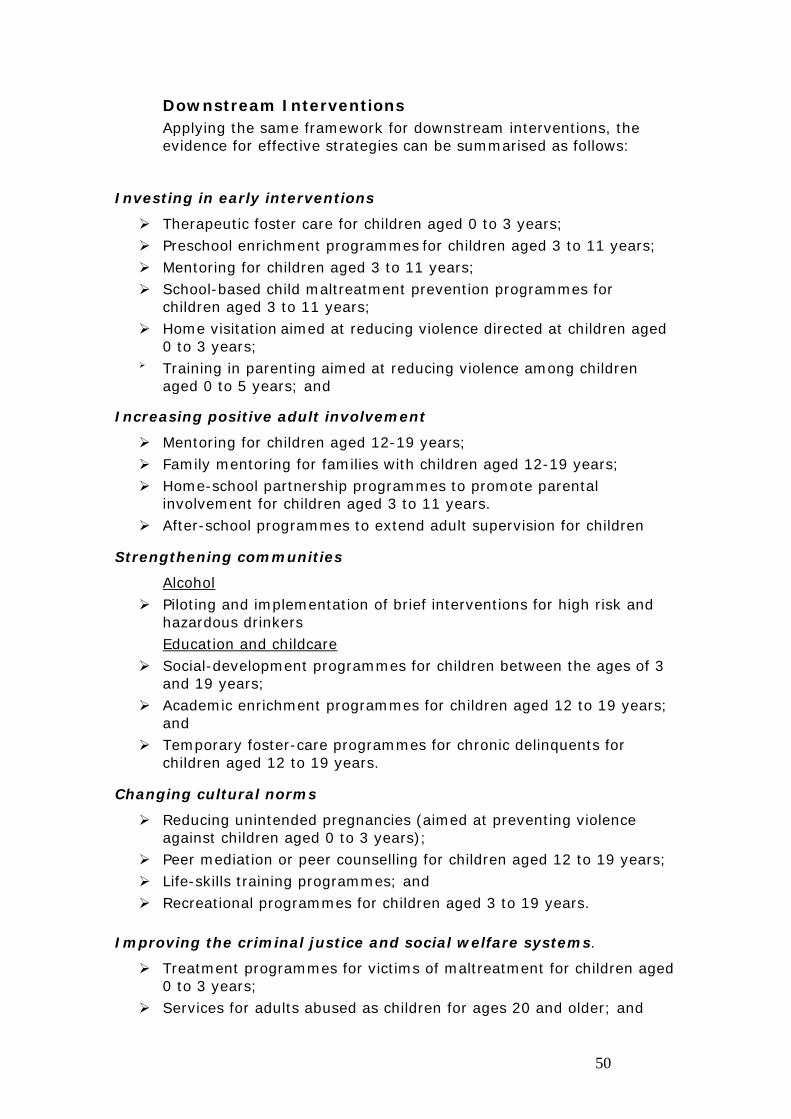
Downstream Interventions Applying the same framework for downstream interventions, the evidence for effective strategies can be summarised as follows:
Investing in early interventions
Therapeutic foster care for children aged 0 to 3 years; Preschool enrichment programmes for children aged 3 to 11 years; Mentoring for children aged 3 to 11 years; School-based child maltreatment prevention programmes for
children aged 3 to 11 years; Home visitation aimed at reducing violence directed at children aged
0 to 3 years; Training in parenting aimed at reducing violence among children
aged 0 to 5 years; and
Increasing positive adult involvement
Mentoring for children aged 12-19 years; Family mentoring for families with children aged 12-19 years; Home-school partnership programmes to promote parental
involvement for children aged 3 to 11 years. After-school programmes to extend adult supervision for children
Strengthening communities
Alcohol Piloting and implementation of brief interventions for high risk and
hazardous drinkers Education and childcare
Social-development programmes for children between the ages of 3 and 19 years;
Academic enrichment programmes for children aged 12 to 19 years; and
Temporary foster-care programmes for chronic delinquents for children aged 12 to 19 years.
Changing cultural norms
Reducing unintended pregnancies (aimed at preventing violence against children aged 0 to 3 years);
Peer mediation or peer counselling for children aged 12 to 19 years; Life-skills training programmes; and Recreational programmes for children aged 3 to 19 years.
Improving the criminal justice and social welfare systems.
Treatment programmes for victims of maltreatment for children aged 0 to 3 years;
Services for adults abused as children for ages 20 and older; and
50

Treatment for child and intimate partner abuse offenders for ages 20 and older;
Screening by health-care providers for maltreatment of children; Safe havens for children on high-risk routes to and from school; and Shelters and crisis centres for battered women and victims of elder
abuse for ages 20 and older.
51

Overview of prevention capacity in South Africa Butchart et al, (2004) maintain that violence prevention requires comprehensive intervention strategies involving all sectors of society to address core sets of underlying causes and risk factors, including governments, NGOs and civil society, as well as the general public and the private sector. This section discusses some of the major stakeholders for violence prevention in South Africa, relevant policy and legislative provisions, violence-prevention initiatives with a focus on primary prevention strategies, and barriers to implementation. The African Union was one of several international organisations to adopt the recommendations of the World report on violence and health, along with the World Health Assembly, the Human Rights Commission and the World Medical Association (Krug 2004), and 2005 was declared “African Year of Violence Prevention”. Nevertheless, the sector is in its infancy in Africa and the “First global meeting of health ministry violence and injury prevention focal points” from countries in the Southern African Develop-ment Community was held in April 2006 (Kobusingye, 2005). The situation in South Africa is much the same as in the rest of Africa. Although the country is a signatory to various instruments that relate to safety such as the United Nations Convention on the Rights of the Child (CRC) and the African Charter on the Rights and Welfare of the Child (AC), most legislative and policy documents only address violence prevention indirectly. For example, a recent scoping exercise of public-health interventions in the Western Cape Province identified 12 interventions directed at violence prevention, of which nine (75%) were conducted by NGOs and only three (25%) by Government departments. Similarly, an audit and analysis of violence-prevention responses and infrastructure in the city of Tshwane found that more than three quarters of the violence prevention were located in the NGO sector. A total of 20 intervention programmes were identified, even though the study was restricted to organisations registered with the Department of Social Services and those available in the community service directory. Nevertheless, one of the strengths of the violence-prevention sector in South Africa is that, although there is limited capacity, there is a demonstrated willingness to establish partnerships and mobilise around key issues (Draper and Corrigall 2006; Kirsten 2006). While it is beyond the scope of this review to describe all processes and strategies that may impact on violence prevention, particularly those with indirect influences, the activities of several key Government, research and Non-Governmental Organisations are described below.
52

1. Relevant Government Departments
Departments and ministries with a stake in violence prevention span all five of the Government’s communication clusters. Agencies within the Justice, Crime Prevention and Security Cluster include: the South African Police Services; the Departments of Correctional Services, and Justice and Constitutional Development; the National Prosecuting Authority and the Secretariat for Safety and Security. In the Social Sector Cluster, the most likely participants in strategies to reduce violence might include: the Departments of Correctional Services2, Education, Health, Housing, Land Affairs, Public Works and Social Development. Within the Economic, Investment and Employment Cluster there are also several departments that engage in a broad range of projects for social upliftment and poverty alleviation that might address some of the underlying causes of violence. These include: the Departments of Trade and Industry, Housing, Land Affairs, Public Works, and Labour. Several of these agencies and departments are also included in the Governance and Administration Cluster and the International Relations, Peace and Security Cluster. The Department of Health’s web-page describes two relevant areas, namely: “violence prevention” and “violence against women and children” (Republic of South Africa, no date a). The violence-prevention activities have two major components. One is the training of primary health-care professionals to provide victim empowerment and trauma support; the other comprises the advanced training of health-care professionals for the management of complicated cases of violence and violence-prevention programmes in certain schools, in collaboration with the Department of Education. Activities relating to the prevention of violence against women and children include the promulgation of the Domestic Violence Act (described in the following section) and the adoption of the Sexual Assault Policy and Clinical Management Guidelines for the management of sexual-assault cases. The Department concentrates mainly on secondary prevention through its curative services and emergency medical services and, although it acts as a focal point for violence prevention, it is clear that the scope of interests around this important health issue is wide. Much of the response to violence is the ambit of other Government departments and agencies. In response to developments internationally and in Africa, the Department of Health has created a sub-directorate for violence and injury prevention, known as the Non-natural Death Prevention Sub-Directorate. Previously the prevention of violence and injuries fell under the Department’s Directorate of Mental Health and Substance Abuse. Although the new Sub-Directorate at the time of writing was staffed by only one person who was appointed at the beginning of 2006, its proposed strategy framework identifies several important primary approaches to violence prevention, as follows:
the inclusion of educational programmes directed at parents to enable parenting that enhances the emotional and physical well-being of children. This may include ante-natal and perinatal clinics
2 Several departments such as Correctional Services, Housing, Public Works, etc are included in more than one cluster.
53

for mothers, as well as early childhood development programmes that include skills such as problem solving, basic safety, appropriate forms of discipline, child supervision, and role modelling;
the training of educators to identify learning and behavioural difficulties; and
the introduction of life-skills programmes at schools which include safety-related topics (Christian, 2005).
Following a strategic-planning workshop with a broad range of stakeholders in the injury-prevention field in March and July 2005, the Department of Health developed a draft strategy document on the prevention of non-natural deaths to be tabled in Cabinet. This included a list of proposed interventions (a summary of which is included in Appendix II) in the short term (with immediate effect), medium term (over the next three years) and long-term (longer than three years), as well as the suggested lead and support agencies from within Government structures (Christian, 2005). Under the Department of Safety and Security, the South African Police Services includes several initiatives that focus not only on responding to incidents of crime and violence, but also in the introduction of primary prevention strategies aimed at reducing the risk of criminal activity (and hence crime). The Crime Prevention Division, includes among its aims the reduction of opportunities to commit crime by optimising visible policing and preventing crime “by addressing its root causes, e.g. socio-economic factors, and by uplifting the community through rural-development and urban-renewal projects” (Republic of South Africa no date b). The Social Crime Prevention Unit focuses on community policing and community-based partnerships with government and civil society stakeholders for crime prevention and has a strong focus on the prevention of community violence (Nel et al, 2000). It includes among its aims:
Primary prevention goals such as building capacity for local crime-prevention-strategy development within the framework of rural development and urban renewal, and developing strategies to deal with factors contributing to crime; and
Secondary and tertiary strategies, such as improving victim support and assistance services, particularly for victims of domestic violence and rape, and building skills for resilience and resistance to crime among young people (Republic of South Africa no date b).
Whereas the Department of Justice’s main role in violence prevention is the sentencing of violent offenders to prison terms, it has also made strides in primary prevention in the form of diversion programmes for young offenders, which are offered in collaboration with NGOs such as NICRO, and other Government services. The Department of Education is engaged in Safe Schools projects in some provinces in collaboration with the Department of Health, while the recently drafted Education Bill prioritises safety in schools. Proposed changes to the legislation include the provision of adequate security measures and ensuring that all schools are fenced, as well as stricter
54

measures to reduce the carrying of weapons (for example, through the random checking of learners). Some of the measures may be in response to several recent incidents in which children were assaulted and sometimes killed on school premises either by other learners or intruders, particularly in the Western Cape Province. Recent events, such as the gun battle between police and armed robbers in Jeppestown, Johannesburg, have highlighted the role of foreign nationals in cross-border crime and violence. This has not only brought attention to South Africa’s porous borders, but also prompted xenophobic reactions in the popular media. Although these issues present nationally, it is seen as a particular problem in Johannesburg, as observed in the study by Parry et al (2004) where a greater percentage of arrestees in Gauteng were related to immigration offences. The Department of Home Affairs has a dual role to play in effectively administering immigration procedures, as well as ensuring that refugees and legitimate immigrants are accorded appropriate respect and dignity. Their recent efforts have included radio and television placements designed to address xenophobia, in which South African citizens have been encouraged to be more accommodating and considerate towards those refugees who have fled conflict from other parts of the continent. 2. Research Agencies
Several texts highlight the importance of research in driving violence prevention policies and practices (Krug et al, 2002; Butchart et al, 2004). In South Africa, numerous departments within tertiary education and academic research institutions address issues relating to violence. The MRC /UNISA Crime, Violence and Injury Lead Programme and the affiliated UNISA Institute for Social and Health Sciences, which both follow a public-health approach to injury prevention. The have been included among the violence-prevention initiatives on the Government’s web page and are cited in Butchart et al (2004) as important sources of information and research to inform prevention initiatives. The Lead Programme produces the annual NIMSS reports and was also a co-host of the 8th World Conference and Safety Promotion in Durban in April, 2006. Its web page describes its objectives as:
Conducting and disseminating public-health oriented research into the extent, causes and consequences of injuries due to crime, violence and accidents in South Africa;
Conducting and encouraging research that will serve to identify, support and develop best practice examples for primary prevention and injury control;
Demonstrating and documenting how research may be applied to facilitate, influence, support and develop best practice examples for primary prevention and injury control at the levels of service delivery, planning, health and social policy;
Building capacity among South African researchers, including historically marginalised groups, to conduct research into the extent,
55
causes, consequences and prevention of injuries arising from crime, violence and accidents; and
Establishing a global reputation as a Lead Programme of excellence in the field of crime, violence and injury prevention research policy (CVILP 2006).
There are also a number of programmes focussing on specific typologies and aspects of violence within universities and science councils, such as the Sexual Violence Research Initiative, an initiative of the Global Forum for Health Research, which is hosted in South Africa by the MRC’s Gender and Health Research Group. The MRC also houses several cross-cutting programmes such as the Alcohol and Drug Research Group and the Burden of Disease Research Unit that provide important indicators and information about risk factors for violence. The Human Sciences Research Council houses a Child, Youth, Family and Social Development Programme, which conducts applied research relating to children, youth, families and vulnerable populations, including older people and people with disabilities. This programme includes violence, social inequality and poverty among the challenges that it aims to address (HSRC, no date). Departments of Criminology at various universities also produce a considerable range of research outputs, but the focus is primarily on criminal behaviour and strategies to combat crime, rather than on the prevention of violence. Other university programmes with an interest in injury include the University of Cape Town’s Children’s Institute through its Child Survival Project (Abrahams, 2006) and Wits University’s Centre for Applied Legal Studies, which has a particular interest in issues pertaining to gender equality and sexual violence (CALS, no date).
3. Civil Society and Non-Governmental Organisations
The Centre for the Study of Violence and Reconciliation comprises a multi-disciplinary team of psychologists, sociologists, political scientists, historians, lawyers, criminologists, and community development practitioners. Its mission is defined as the development and implementation of human security interventions for vulnerable groups, based on social justice and fundamental rights. Most of its work centres on secondary and tertiary prevention efforts, such as reconciliation and transitional justice, criminal justice transformation, and victim empowerment, but it does address primary prevention through its work in youth and gender-based violence and through its human rights-based approach (CSVR no date). The Institute for Security Studies embraces a wide range of security-related topics as a legacy of its earlier role in the field of defence policy and the Institute's subsequent transition to include additional focus areas pertaining to human security. This newer focus is directed more towards crime prevention than violence prevention, but it does embrace several
56
relevant focus areas such as human rights, justice, refugee movement, and personal and community security. Through its Crime and Justice Programme it monitors and analyses crime and justice trends (ISS no date a). Its Gender and Security Programme conducts research into the extent of gender-based violence (ISS no date, b) and its Arms Control and Disarmament Programme has been involved in the gun-control movement in South Africa (ISS no date, c).
There are also several civil society agencies focussing on specific typologies and aspects of violence. Many comprise groups relating to violence directed at children or carried out by children, such as: Resources Aimed at the Prevention of Child Abuse and Neglect (RAPCAN) and Childline as well as the Child Accident Prevention Foundation of South Africa (CAPFSA), which despite its focus on unintentional (accidental) injuries, frequently participates in forums addressing injuries arising from violence and abuse.
RAPCAN focuses on the development of prevention strategies for child abuse and includes the training of adults; informing children; developing materials; dissemination; and advocacy among its activities, and it has developed a range of educational strategies. Educational material for children focuses on the development of self-esteem and a positive self-concept. RAPCAN also provides education to children focusing on their rights by utilising the United Nations Convention on the Rights of the Child and the Organisation of African Unity's Charter on the Rights of the African Child. For young people, RAPCAN’s workshops present a range of issues that arise at the beginning of their sexual lives including rape, date rape, sexual harassment, HIV/AIDS, negotiating safe sex, socialisation, gender violence and male and female roles. For adults, the organisation offers workshops to raise awareness about child abuse, positive discipline and alternatives to corporal punishment. At a structural level, RAPCAN works with government departments and academic departments to ensure that relevant materials form part of training curricula. The organisation also offers programmes at the secondary and tertiary levels of prevention such as counselling for victims of child abuse; a rehabilitation programme for juvenile sex offenders; and the Child Witness Project that prepares children and their care-givers for the court experience (RAPCAN, no date). Childline focuses on protecting children from violence and enhancing the rights culture for children. It receives more than 50 000 calls per month through a 24-hour helpline that directs child victims of violence and their families to supportive therapeutic social services and conducts education and awareness-raising programmes on a such topics as offender rehabilitation; the management of child protection; and children’s issues for prosecutors. It also conducts research into the management of sexual assault of young children of pre-school age and has provided inputs into the development of legislation and policy, including the National Child Protection Strategy and the Sexual Offences and Child Justice Bills. Childline also runs programmes for child perpetrators of violence, particularly in relation to sexual violence, and advises on appropriate placements and diversion programmes (Childline, 2005).
57

Genderlinks, an NGO promoting gender equality in the media and in governance was at the forefront of the Sixteen Days of Activism Against Violence Against Women and Children campaign (Rama, 2006). The campaign has enjoyed considerable coverage and popular support to the extent that it is now being mooted as a year-round campaign (or the 365 Days of Activism). The National Institute for Crime Prevention and the Reintegration of Offenders (NICRO) offers services to victims of crime, offenders and communities. It runs an Offender Reintegration Programme for prisoners and former offenders, as well as a diversion programme for young offenders. For victims of crime, their families and witnesses the Victim Support Project provides support through police stations, magistrates' courts and community centres and also assists women who are locked into violent relationships. At a primary level, NICRO is piloting a crime-prevention programme in schools (NICRO, no date). At a broader societal level, the Gun Control Alliance currently comprises 200 organisations and 5,000 individuals. including mothers, men, youth, children, safety and security organisations, and members of faith-based communities, who participate in co-ordinated advocacy campaigns (Keegan, 2006). Two popular public education and media campaigns have also provided violence-prevention content. Soul City has included several, such as interpersonal violence, bullying, gang violence, domestic violence, rape, and sexual harassment and loveLife has addressed sexual violence in its HIV/AIDS prevention work, as it asserts that “Rape, violence and coercion are common features of adolescent sexual behaviour” (loveLife, 2000, cited in Parker, 2003). In 2004, it included an episode on “The culture of violence and how we create positive role models” in its SABC TV1 offering, Future Positive…what now? (loveLife, 2004). One positive aspect in South Africa is the willingness of Government departments to enter into partnerships with NGOs with regard to health interventions. Draper and Corrigall (2006), and Nethavhani and Bowman (unpublished) report that more than a third of NGOs engaged in violence and traffic-injury prevention receive their funding from Government. At the community level, the Social Crime Prevention Unit actively engages with community-based organisations and individual members of the public to establish “neighbourhood watch” programmes as part of its neighbourhood policing strategies.
58

Conclusion
It is clear that efforts to address the burden of violence in the Western Cape require a multi-sectoral approach that spans the criminal justice, health, infrastructure, and policy domains. There is also a need to balance achievable short-term targets to offset the long-term nature of many of the strategies most needed to affect fundamental shifts in socio-cultural attitudes and the propensity towards aggressive and violent behaviour. Thus, if the typical perpetrator in the Western Cape is a young male dependent on alcohol and living in an area with severe structural and social problems including unemployment, poverty, poor services (schools, healthcare, transport, etc) and numerous armed gangs that support a drug trade, the Provincial Government may wish to provide certain “quick-fix” solutions (for example, through improving the criminal justice system), while investing heavily in those programmes most likely to affect a fundamental and lasting change in the long-term. These approaches also underpin the advice of the Injury Prevention Workgroup at their initial meeting, which suggested that the following topics be considered as key drivers in the high incidence of violence in the Western Cape Province and that they ought to be earmarked for more detailed reviews: the cycle of violence and alcohol abuse.
The Provincial Government in the Western Cape may wish to consider strategies, for example, to reduce alcohol dependence. For, although alcohol manifests ecologically as a downstream risk factor for violence (as well as other causes of trauma such as road traffic collisions, burns and drowning), there are a number of interventions relating to the sale and distribution of alcohol that are primarily upstream, such as alcohol advertising and “drinking hours” (times when alcohol can be sold). Interventions aimed at addressing the cycle of violence are more likely to involve multi-dimensional programmes to alter the social fabric of our society and will out of necessity adopt a longer-term approach. It is also clear that any provincial strategies arising from these reviews will need to be underpinned by accurate and reliable reporting systems that will assist in targeting communities most in need of intervention, as well as assisting with the ongoing evaluation and monitoring of key strategies. Ideally, information on non-fatal injuries should be used, as it has the potential to provide information not only about the victim, but also the perpetrator. In the interim, the brief review of risk factors and interventions outlined in this Volume 5 of the Report provides a useful starting point for Government agencies considering violence-prevention initiatives, and the imminent collection of province-wide injury mortality data will provide the foundation for an evidence–based approach to violence and injury prevention.
59

There is an urgent need to develop violence-prevention strategies in the local context, but one of the key challenges is the current absence of research information and documentation. Despite evidence from multiple sources that confirm the almost epidemic proportions of violence, very little research has focused on establishing and documenting “best-practices” for prevention in the local context. In Cape Town, for example, Draper and Corrigall (2006) observed that — while input and processes were well documented — outcomes were not easily measurable. In order to assess and replicate successful strategies, each needs to include:
appropriate theoretical underpinnings;
comprehensive documentation;
specific measured outcomes; and
a detailed monitoring and evaluation strategy that should be established prior to the onset of the project and that will also include non-governmental agencies such as universities, NGOs and research institutes.
Next steps Proposals to implement and research some of the interventions discussed in this document will be tabled with the Provincial Government of the Western Cape within the months following after initial publication. Appropriate investment in programme documentation and evaluation will be important factors in driving long-term investment, ensuring effectiveness and enabling replication of successful programmes. Evaluation should, wherever possible, include the measurement of behaviour change or actual changes in injury rates.
60
References
Abrahams, K 2006, Making a case for child survival in South Africa’s ‘Age of Hope’. A Children’s Institute Working Paper Number 4. Children’s Institute, University of Cape Town, Cape Town.
Abrahams, N, Jewkes, R, Laubsher, R, and Hoffman, M 2005, ‘Intimate Partner Violence: Prevalence and Risk Factors for men in Cape Town, South Africa’, Violence and Victims, vol. 21, no.2, pp.247 -264. Abrahams, N, Jewkes, R 2006, ‘Effects of South African men's having witnessed abuse of their mothers during childhood on their levels of violence in adulthood’, American Journal of Public Health, vol. 95, no. 10, pp. 1811- 1816.
Altbeker, A in press, ‘Murder and robbery in SA: A tale of two trends’, Crime, Violence and Injury Prevention in South Africa: Data to Action’, Medical Research Council and University of South Africa Crime, Violence and Injury Lead Programme, Cape Town.
Altbeker, A no date, ‘Policing Domestic Violence: the sympathy gap’, Presentation to the 10CJS. Retrieved: July 20, 2006, from http://www.csvr.org.za/confpaps/altbeker2.pdf
Bangdiwala, SI, Ramiro, L, Sadowski, LS, Bordin, IA, Hunter, W and Shankar, V 2004, ‘Intimate partner violence and the role of socioeconomic indicators in WorldSAFE communities in Chile, Egypt, India and the Philippines’, International Journal of Injury Control and Safety Promotion, vol. 11, no. 2, pp. 101-109.
Black, DA, Schumacher, JA, Smith Slep, AM and Heyman, RE 1999, ‘Partner, child abuse risk factors literature review’ [monograph online]. National Network of Family Resiliency, National Network for Health. Retrieved: June 29, 2006, from www.nnh.org/risk
Bradshaw, D, Nannan, N, Laubscher, R, Groenewald, P, Joubert, J, Nojilana, B, Pieterse, D and Schneider M 2004, South African National Burden of Disease Study 2000: estimates of provincial mortality, Medical Research Council, Cape Town.
Buka, SL, Stichick, TL, Birdthistle, I, and Earls, FJ 2001, ‘Youth exposure to violence: Prevalence, risks, and consequences. American Journal of Orthopsychiatry, vol. 71, no. 3, pp. 298–310.
Burton, P, Du Plessis, A, Leggett, T, Louw, A, Mistry, D and Van Vuuren, H 2004, National Victims of Crime Survey: South Africa 2003, Institute for Security Studies, Pretoria.
Butchart, A and Peden, M 1997, ‘Injury and Trauma’ in P Barron and L Franklin (eds.), South African Health Review 1997, Health Systems Trust, Durban, pp. 213-221.
61

Butchart, A, Phinney, A, Check, P and Villaveces, A 2004, Preventing violence: a guide to implementing the recommendations of the World Report on Violence and Health, World Health Organization, Geneva.
Cape Times 2006. ‘Whingers comment ‘was blown out of proportion’. 28 June, p6
Centre for Applied Legal Studies, no date, ‘Gender Research Project : research and advocacy’. Retrieved: July 20, 2006, from www.law.wits.ac.za/cals/gender/index.htm
Centre for the Study of Violence and Reconciliation no date, The Centre for the Study of Violence and Reconciliation: evolution of our vision and mission, CSVR, Johannesburg. Retrieved: July 20, 2006, from www.csvr.org.za/aims.htm
Cerda, M 2002, ‘A profile of gangs’, in EG Krug, LL Dahlberg, JA Mercy, AB Zwi and R Lozano (eds.), World report on violence and health, World Health Organization, Geneva.
Chapman, S, Alpers, P, Agho, K, Jones, M 2006, ‘Australia’s 1996 gun law reforms: faster falls in firearm deaths, firearm suicides, and a decade without mass shootings’, Injury Prevention, vol. 12, pp. 365–372.
Check, P, Butchart, A and Sminckley, L (eds) 2005. Milestones of a global campaign for violence prevention 2005: changing the face of violence prevention, World Health Organization, Geneva. Retrieved: June 16, 2006, from whqlibdoc.who.int/publications/2005/9241593555_eng.pdf
Cheston S, Kuhn L. Empowering women through microfinance. In: Daley-Harris S, ed. Pathways out of poverty: Innovations in microfinance for the poorest families. Bloomfield, Connecticut: Kumarian Press, 2002: 167–228.
Childline 2005, Childline South Africa Annual Report: 1st April 2004 to 31st March 2005, Childline, Johannesburg. Retrieved: July 21, 2006, from www.childlinesa.org.za/whoweareAnnualReport.htm
Christian R 2005, ‘Draft strategic framework: prevention of non-natural deaths’, Unpublished manuscript, Department of Health, Pretoria.
Concha, A, Carrion, F and Cobo G (eds) 1994. Ciudad y violencias en America Latina, (Cities and violence in Latin America), Program de Gestion Urbana, Quito (Ecuador).
Coulson, N 2002, Developments in the use of the mass media at the national level for HIV/AIDS prevention in South Africa. Retrieved: July, 1, 2006, from www.comminit.com/strategicthinking/stcoulson/sld-1544.html
Counts, DA, Brown, J, and Campbell, C 1992, Sanctions and sanctuary. Westview Press, Boulder.
Crime, Violence and Injury Lead Programme 2006, ‘About the programme’. Retrieved: July 17, 2006, from www.mrc.ac.za/crime/about.htm
Dahlberg, L 1998, ‘Youth violence in the United States: major trends, risk factors, and prevention approaches’, American Journal of Preventive Medicine, vol. 14, pp. 259–272.
62

Dahlberg, LL and Butchart, A 2005, ‘State of the science: violence-prevention efforts in developing and developed countries’, International Journal of InjuryControl and Safety Promotion, vol. 12, no. 2, pp. 93-104.
Dahlberg, LL and Krug, EG 2002, ‘Violence – a global public health problem’, in EG Krug, LL Dahlberg, JA Mercy, AB Zwi and R Lozano (eds.), World report on violence and health, World Health Organization, Geneva.
Dias, MS, Smith, K, de Guehery, K, Mazur, P, Li, V and Shaffer, ML 2005, ‘Preventing Abusive Head Trauma Among Infants and Young Children: A Hospital-Based, Parent Education Program’, Pediatrics; vol. 115, pp. 470-477.
Doolan, K 2006, ‘A quantitative analysis of socio-economic position and violence in South Africa’, unpublished Masters dissertation, University of Cape Town, Cape Town.
Draper, B and Corrigall, J 2006, Report on the scoping exercise to deliver the existing intervention profile that addresses the provincial burden of disease, Provincial Burden of Disease Project, Department of Health of the Western Cape, Cape Town.
Dunkle, KL, Jewkes, RK, Brown, HC, Gray, GE, McIntyyre, JA and Harlow, S 2004b, ‘Gender-based violence, relationship power, and risk of HIV infection in women attending antenatal clinics in South Africa’, The Lancet, vol. 363, pp. 1412-1421.
Dunkle, KL, Jewkes, RK, Brown, HC, Yoshihama, M, Gray, GE, McIntyre, JA, and Harlow, SD 2004a, "Prevalence and patterns of gender-based violence and revictimization among women attending antenatal clinics in Soweto, South Africa", Am.J.Epidemiol., vol. 160, no. 3, pp. 230-239.
Earls, F 1999, ‘Early childhood public engagement campaign network conference call: summary’. Retrieved: July, 1, 2006 from www.familiesandwork.org/forums/library/f11/cc9969.pdf
Earls, F, McGuire, J and Shay, S 1994, ‘Evaluating a community intervention to reduce the risk of child abuse: Methodological strategies in conducting neighborhood surveys’, Child Abuse and Neglect, vol. 18, no. 5, pp. 473-485.
Earls, FJ 1994, ‘Violence and today’s youth’, Critical health issues for children and youth, vol. 4, no. 3, pp. 4-12.
Ellsberg, M, Liljestrand, J and Winkvist, A 1997, ‘The Nicaraguan Network of Women Against Violence: using research and action for change’, Reproductive Health Matters, vol. 10, pp. 82–92.
English, DR, Holman, CDJ, Milne, E, Hulse, G, Winter, MG 1995, The quantification of drug caused morbidity and mortality in Australia, 1995 edition, Commonwealth Department of Human Services and Health, Canberra.
Ensink, K. Robertson, B., Zissis, C. and Leger, P. (1997). Posttraumatic Stress Disorder in Children Exposed to Violence. South African Medical Journal, 87(11), 1533-1537.
63

Eron, LD, Huesmann, LR and Zelli, A 1991, ‘The role of parental variables in the learning of aggression’, in DJ Pepler and KJ Rubin (eds.), The development and treatment of childhood aggression, Lawrence Erlbaum, Hillsdale.
Fajnzylber, P, Lederman, D and Loayza, N 1999, Inequality and violent crime, World Bank, Washington.
Farrington, DP 1998, ‘Predictors, causes, and correlates of male youth violence’, in M Tonry and MH Moore (eds.), Youth violence, University of Chicago Press, Chicago.
Fieggen, AG, Weimann, M, Brown, C, Van As, AB, Swingler, GH and Peter, JC 2004, ‘Inhuman shields – children caught in the crossfire of domestic violence’, South African Medical Journal, vol. 94, no 4, pp. 293-296.
Finkelhor, D 1994, ‘The international epidemiology of child sexual abuse’, Child Abuse and Neglect, vol. 18, pp. 409–417.
Flisher, AJ and Chalton, DO 1995, ‘High-school dropouts in working-class South Africa: selected characteristics and risk-taking behaviour’, Journal of Adolescence, vol. 18, pp. 105-121.
Frias-Armenta M, McCloskey LA 1998, ‘Determinants of harsh parenting in Mexico’, Journal of Abnormal Child Psychology, vol. 26, pp. 129–139.
Gesch, CB, Hammond, SM, Hampson, SE, Eves, A, and Crowder, MJ. 2002, ‘Influence of Supplementary Vitamins, Minerals and Essential Fatty Acids on the Antisocial Behaviour of Young Adult Prisoners’, The British Journal of Psychiatry, vol. 181, pp. 22-28.
Goldberg, N 2005, Measuring the impact of microfinance: taking stock of what we know, Washington, DC: Grameen Foundation.
Golding, JM 1996, ‘Sexual assault history and limitations in physical functioning in two general population samples’, Research in Nursing and Health, vol. 19, pp. 33–44.
Grisso, JA, Schwarz, DF, Hirschinger, N, Sammel, M, Brensinger, C, Santanna, J, Lowe, RA, Anderson, E, Shaw, LM, Bethel, CA and Teeple, L1999, ‘Violent Injuries among women in an urban area’, New England Journal of Medicine, vol. 341, no. 25, pp. 1899-1905.
Groenewald, P, Bradshaw, D, Daniels, J, Matzopoulos, R, Bourne, D, Shaikh, N, Blease, D, Naledi, NT in press, ‘Cause of death and premature mortality in Cape Town, 2001-2004’, PGWC BOD project.
Gruskin, S and Butchart, A 2003, ‘Violnce prevention: bringing health and human rights together’, Health and Human Rights, vol. 6, n. 2, pp. 1-10.
Guerra, N and Williams, K 2002, ‘Youth development and violence prevention: core competencies’, in L Knox (ed.), Connecting the dots to prevent youth violence: a training and outreach guide for physicians and other health professionals, American Medical Association, Chicago.
Guerrero, R 2006. ‘Violence prevention through multi-sectoral partnerships: the cases of Cali and Bogota, Colombia’, African Safety Promotion: a journal of injury and violence prevention, vol. 4, no. 2, pp. 88-98.
64

Harris, C and Van Niekerk, A 2002, ‘Homicide’, in RG Matzopoulos (ed.), A profile of fatal injuries in South Africa 2001: third annual report of the National Injury Mortality Surveillance System (NIMSS), Medical Research Council and University of South Africa Crime, Violence and Injury Lead Programme, Cape Town.
Harris, C, Sukhai, A, Matzopoulos, R 2005, ‘National fatal injury profile’, in R Matzopoulos (ed.), A profile of fatal injuries in South Africa 2003: Fifth annual report of the National Injury Mortality Surveillance System, MRC/UNISA Crime, Violence and Injury Lead Programme, Cape Town.
Heise, L and Garcia-Moreno, C 2002, ‘Violence by intimate partners’ in EG Krug, LL Dahlberg, JA Mercy, AB Zwi and R Lozano (eds.), World report on violence and health, World Health Organization, Geneva.
Howell, JC and Hawkins, JD 1998, ‘Prevention of youth violence’, in MH Moore and M Tonry (eds.), Youth violence, crime and justice: a review of research, University of Chicago Press, Chicago, pp. 263-315.
Huesmann, LR and Eron, LD (eds.) 1986, Television and the aggressive child: a cross-national comparison, Lawrence Erlbaum, Hillsdale.
Human Sciences Research Council no date, Research Programmes : Child, Youth, Family and Social Development. Retrieved : July 20, 2006, from www.hsrc.ac.za/research/programmes/CYFD/index.html
Hunter, WM et al, 2000, ‘Risk factors for severe child discipline practices in rural India’, Journal of Pediatric Psychology, vol. 25, pp. 435–447.
Institute for Security Studies no date(a), ‘Crime and criminal justice’. Retrieved: July 20, 2006, from http://www.iss.org.za/index.php?link_id=24andlink_type=12andtmpl_id=2
Institute for Security Studies no date(b), ‘Gender and security’. Retrieved: July 20, 2006, from http://www.iss.org.za/index.php?link_id=26andlink_type=12andtmpl_id=2
Institute for Security Studies no date(c), ‘Arms control and disarmament’. Retrieved: July 20, 2006, from http://www.iss.org.za/index.php?link_id=20andlink_type=12andtmpl_id=2
Jewkes R, Levin J, Bradshaw D, Mbananga N 2002a, ‘Rape of girls in South Africa’, The Lancet, vol. 359, pp. 319-320.
Jewkes, R and Abrahams, N 2002, ‘The epidemiology of sexual coercion in South Africa: an overview’, Social Science and Medicine, vol. 55, pp. 1231-1244.
Jewkes, R, Levin, J, Penn-Kakana, L 2002b, ‘Risk factors for domestic violence: findings from a South African cross-sectional study’, Social Science and Medicine, vol. 55, no 9, pp. 1603-1617.
Jewkes, R, Nduna, M, Levin, J, Jama, N, Dunkle, K, Khuzwayo, N, Koss, M, Puren, A, Wood, K and Duvvury, N 2006, ‘A cluster randomized-controlled trial to determine the effectiveness of Stepping Stones in preventing HIV infections and promoting safer sexual behaviour
65

amongst youth in the rural Eastern Cape, South Africa: trial design, methods and baseline findings’, Tropical Medicine and International Health, vol. 11, no. 1, pp 3-16.
Jewkes, R, Penn-Kekana, L, Levin, J, Ratsaka, M, and Schrieber, M 2001b, ‘The prevalence of physical, sexual and emotional violence against women in three South African provinces’, South African Medical Journal, vol. 91, pp. 421–428
Jewkes, R, Vundule, C, Maforah, F and Jordaan, E 2001a, ‘Relationship dynamics and adolescent pregnancy in South Africa’, Social Science and Medicine, vol. 52, no. 5, pp. 733-744.
Johnson, H 1996, Dangerous domains: violence against women in Canada, International Thomson Publishing, Ontario.
Kagan, J 1989, ‘Temperamental contributions to social behavior’, American Psychologist, vol. 44, pp. 668–674.
Kandel, E and Mednick, SA 1991, ‘Perinatal complications predict violent offending’, Criminology, vol. 29, pp. 519–529.
Karr-Morse, R and Wiley M 1997, Ghosts from the nursery: tracing the roots of violence, Atlantic Monthly Press, New York.
Kawachi, I, Kennedy, BB, Lochner,, K, Pothrow-Smith, D 1997, ‘Social capital, income inequality and mortality’, American Journal of Public Health, vol. 87, no. 9, pp. 1491–1498.
Keegan, M 2006, ‘Legislative responses to violence’, Prevention of violence against women and children: a data to action workshop, Johannesburg, 27-29 June 2006
Kirschner, RH and Wilson, H 2001, ‘Pathology of fatal child abuse’, in RM Reece, S Ludwig (eds.), in Child abuse: medical diagnosis and management: 2nd ed, Lippincott Williams and Wilkins, Philadelphia.
Kirsten, A 2006, ‘The role of social movements in safety promotion: comparative lessons from Brazil, South Africa and Australia’, African Safety Promotion: a journal of injury and violence prevention, vol. 4, no. 2, pp. 99-119.
Klevens, J and Bayon, MC and Sierra, M 2000, ‘Risk factors and the context of men who physically abuse in Bogota, Colombia’, Child Abuse and Neglect, vol. 24, pp. 323–332.
Kobusingye, O 2005, ‘Views on violence prevention from around the world: WHO Regional Office for Africa’, in P Check, A Butchart and L Sminckley (eds) 2005. Milestones of a global campaign for violence prevention 2005: changing the face of violence prevention, World Health Organization, Geneva. Retrieved: June 16, 2006, from whqlibdoc.who.int/publications/2005/9241593555_eng.pdf
Krahn, H, Hartnagel TF and Gartrell, JW 1986, ‘Income inequality and homicide rates: cross-national data and criminological theories’, Criminology, vol. 24, pp. 269-295.
Krug, E 2004, ‘Foreword’, in Butchart, A, Phinney, A , Check, P and Villaveces A, Preventing violence: a guide to implementing the
66

recommendations of the World Report on Violence and Health, World Health Organization, Geneva.
Krug, EG, Dahlberg, LL, Mercy, JA, Zwi, AB and Lozano, R (eds.) 2002, World report on violence and health, World Health Organization, Geneva.
Kuo, FE, and Sullivan, WC 2001, ‘Aggression and violence in the inner city: Impacts of environment via mental fatigue’, Environment and Behavior, vol. 33, no. 4, pp. 543-571.
Kyriaco, DN, Anglin, D, Taliaferro, E, Stone, S, Tubb, T, Linden, JA, Muelleman, R, Barton, E, and Kraus JF 1999, ’Risk Factors for injury to women from domestic violence against women’ New England Journal of Medicine, vol. 341, no. 25, pp. 1892 – 1898.
Legget, T 2001, Rainbow vice: the drugs and sex industries in the New South Africa, Zed Books, New York.
Levitt, SD and Dubner, SJ 2005, Freakonomics: a rogue economist explores the hidden side of everything, William Morrow.
Lipsky, S, Caetano, R, Field, CA, Larkin, GL 2005, ‘Psychosocial and substance-use risk factors for intimate partner violence’, Drug and Alcohol Dependence, vol. 78, pp. 39-47.
loveLife 2000, loveLife (brochure), loveLife, Johannesburg.
loveLife 2004, Report on activities and progress, loveLife, Johannesburg.
MacIntyre, D and Carr, A 1999, ‘The epidemiology of child sexual abuse’, Journal of Child Centred Practice, vol. 6, no. 1, pp. 57–86.
Madu, SN and Peltzer, K 2000, ‘Risk factors and child sexual abuse among secondary students in the Northern Province (South Africa)’, Child Abuse and Neglect, vol. 24, pp. 259–268.
Matthews, S, Abrahams, N, Martin, LJ, Van der Merwe, L and Jewkes, R 2004, ‘Every six hours a woman is killed by her intimate partner: a national study on female homicide in South Africa’, MRC Policy Brief, Medical Research Council, Cape Town.
Matzopoulos, R and Bowman, B 2006, ‘Violence and children in South Africa’, in AB van As, S Naidoo (eds.), Paediatric Trauma and Child Abuse Handbook, Oxford University Press, Cape Town.
Matzopoulos, R 2005a, ‘Violent deaths in South Africa: the 2003 National Injury Mortality Surveillance System’, SA Crime Quarterly, vol. 13, pp. 29-36.
Matzopoulos, R 2005b, ‘Editorial. Alcohol and injuries – a clear link’, Southern African Journal of Epidemiology and Infection, vol. 20, pp. 114-115.
Matzopoulos, R, Norman, R, Bradshaw, D 2004, ‘The burden of injury in South Africa: Fatal injury trends and international comparisons’, in S Suffla, A van Niekerk, N Duncan (eds.), Crime, Violence and Injury Prevention in South Africa: Developments and Challenges, Medical Research Council and University of South Africa Crime, Violence and Injury Lead Programme, Cape Town,.
67

McCord, J 1979, ‘Some child-rearing antecedents of criminal behavior in adult men’, Journal of Personality and Social Psychology, vol. 37, pp. 1477–1486.
Medical Research Council 2002, Umthente Uhlaba Usamila: The 1st South African National Youth Risk Behaviour Survey, Medical Research Council, Cape Town.
Medical Research Council 2003, South African Demographic and Health Survey, 1998: Full Report. Medical Research Council, Cape Town.
Mehrotra, A et al 2000, A life free of violence: it’s our right, United Nations Development Fund for Women, New York.
Mercy, JA, Butchart, A, Farrington, D and Cerda M 2002, ‘Youth violence’, in EG Krug, LL Dahlberg, JA Mercy, AB Zwi and R Lozano (eds.), World report on violence and health, World Health Organization, Geneva.
Messner, SF and Rosenfeld, R 1997, ‘Political restraint of the market and levels of criminal homicide: a crossnational application of institutional-anomie theory’, Social Forces, vol. 75, pp. 1393–1416.
Messner, SF 1988, ‘Research on cultural and socioeconomic factors in criminal violence’, Psychiatric Clinics of North America, vol. 11, pp. 511–525.
Miller, M, Azrael, D, Hemenway, D and Solop, FI 2002, ‘‘Road rage’ in Arizona: armed and dangerous’, Accident Analysis and Prevention, vol. 34, pp. 807-814.
Mills, S 2006, ‘Using the law to protect the Human Rights of women and children’, Prevention of violence against women and children: a data to action workshop, Johannesburg 27-29 June 2006
Monbiot, G 2006, ‘Food and crime: why should a link between diet and behaviour be surprising?’, noseweek, vol 80, pp26-27.
Moore, H. 1994, "The problem of explaining violence in the social sciences.," in Sex and Violence, P. Harvey and P. Gow, eds., Routledge, London, pp. 138-155. Morrell, R 2001, Changing men in Southern Africa. University of Natal Press, Pietermaritzburg.
Multisite Violence Prevention Project 2004, ’Lessons learned in the Multisite Violence Prevention Project Collaboration: big questions require large efforts’, American Journal of Preventive Medicine, vol. 26, pp. 62-71.
Myer, L, Ehrlich, RI and Susser, ES 2004, ‘Social epidemiology in South Africa’, Epidemiologic Reviews, vol. 26, pp. 112-123
National Institute for Crime Prevention and the Reintegration of Offenders no date, NICRO: programmes, NICRO, Cape Town. Retrieved: July 21, 2006, from http://www.nicro.org.za/Programmes/
National Research Council 1993, Understanding child abuse and neglect, National Academy of Sciences Press, Washington.
68

Nel P, Liebermann S, Landman K, Louw, A and Robertshaw R 2000, Making South Africa safe: a manual for community-based crime prevention, National Crime Prevention Centre, Pretoria.
Nethavhani, M and Bowman, B unpublished, ‘Analysis of the current City-level injury prevention initiatives: the case of City of Tshwane’, draft paper, UNISA Institute for Social and Health Sciences, Johannesburg.
Norman, R 2002, Estimates of Injury mortality and disability based on the Cape Metropole Study, Medical Research Council, Cape Town.
Norman, R, Matzopoulos, R, Groenewald, P and Bradshaw, D in press, ‘The high burden of injuries in South Africa’, WHO Bulletin..
Ottawa Charter for Health Promotion 1986, First International Conference on Health Promotion, Ottawa, Canada, 21 November 1986. (document WHO/HPR/HEP/95.1).
Paik, H and Comstock, G 1994, ‘The effects of television violence on antisocial behavior: a meta-analysis’, Communication Research, vol. 21, pp. 516–546.
Pampel, FC and Gartner, R 1995, ‘Age structure, socio-political institutions, and national homicide rates’, European Sociological Review, vol. 11, pp. 243–260.
Parker W 2003, ‘Re-appraising youth prevention in South Africa: the case of loveLife’, Presented at the South African AIDS Conference in Durban, August 2003.
Parks, T, Usdin, S and Goldstein S 2002, ’Health promotion, violence prevention and the media: the Soul City campaign’, in EG Krug, LL Dahlberg, JA Mercy, AB Zwi and R Lozano (eds.), World report on violence and health, World Health Organization, Geneva.
Parry, CDH and Dewing, S 2006, ‘A public health approach to addressing alcohol-related crime in South Africa’ African Journal of Drug and Alcohol Studies.
Parry, CDH 2005, ‘A review of policy-relevant strategies and interventions to address the burden of alcohol and society in South Africa’, South African Psychiatry Review, vol. 8, pp. 20-24.
Parry, CDH, Plüddemann, A, Donson, H, Sukhai, A, Marais, S, Lombard, C 2005, ‘Cannabis and other drug use among trauma patients in three South African cities, 1999-2001’, South African Medical Journal; vol. 95, no. 6, pp. 429-432.
Parry, CDH, Plüddemann, A, Louw, A, Legget, T 2004, ‘The 3-metros study of drugs and crime in South Africa: findings and policy implications’, American Journal of Drug and Alcohol Abuse, vol. 30, pp. 167-185.
Pinnock, D 2007, ‘The big stick won’t solve crime’, The Sunday Independent, 11 February 2007.
Plüddemann, A, Parry, C, Donson, H and Sukhai, A 2004, ‘Alcohol use and trauma in Cape Town, Durban and Port Elizabeth, South Africa: 1999-2001’, Injury Control and Safety Promotion; vol. 11, pp. 265-267.
Prinsloo, M 2004, ‘Cape Town’, in RG Matzopoulos (ed.), A profile of fatal
69

injuries in South Africa 2003: fifth annual report of the National Injury Mortality Surveillance System (NIMSS), Medical Research Council and University of South Africa Crime, Violence and Injury Lead Programme, Cape Town.
Pronyk, PM, Hargreaves, JR, Kim, JC, Morison, LA, Phetla, G, Watts, C, Busza, J, Porter, JDH 2006, ‘Effect of a structural intervention for the prevention of intimate-partner violence and HIV in rural South Africa: a cluster randomised trial’, Lancet 2006; vol. 368, pp. 1973-1983.
Raine, A 1993, The psychopathology of crime: criminal behavior as a clinical disorder, Academic Press, San Diego.
Rama, K 2006, ‘365 days of action to end violence against women and children’, Prevention of violence against women and children: a data to action workshop, Johannesburg 27-29 June 2006
Rendall-Mkosi, KM, Siegfried, N, Allen, S 2003, ‘Sensible drinking project: evaluation of health worker training’, African Journal of Drug and Alcohol Studies, vol. 2, pp. 31-45.
Republic of South Africa no date (a), ‘About SA: Health’, in South African Government Information. Retrieved: July 18, 2006, from www.info.gov.za/aboutsa/health.htm
Republic of South Africa no date (b) ‘The Department of Justice and the National Crime Prevention Strategy’. Retrieved: July 18, 2006, from http://www.pmg.org.za/briefings/ncps.htm
Resources Aimed at the Prevention of Child Abuse and Neglect no date, RAPCAN: activities, RAPCAN, Cape Town. Retrieved: July 21, 2006, from http://www.rapcan.org.za/activities.htm
Rodgers, K 1994, ‘Wife assault: the findings of a national survey’, Juristat Service Bulletin, vol. 14, pp. 1–22.
Rosenberg, M and Knox, LM 2005, ‘The matrix comes to youth violence prevention: a strengths-based, ecologic, and developmental framework’, American Journal of Preventive Medicine, vol. 29, pp. 185-190.
Runyan, D, Wattam, C, Ikeda, R, Hassan, F and Ramiro L 2002, ’Child abuse and neglect by parents and other caregivers’, in EG Krug, LL Dahlberg, JA Mercy, AB Zwi and R Lozano (eds.), World report on violence and health, World Health Organization, Geneva.
Runyan, DK, Hunter, WM, Socolar, RRS, Amaya-Jackson, L, English, D, Landsverk, J, Dubowitz, H, Browne, DH, Bangdiwala, SI and Mathew RM 1998, ‘ Children who prosper in unfavorable environments: the relationship to social capital’, Pediatrics, vol. 101, pp. 12–18.
Sampson, RJ, Raudenbush, SW and Earls, F 1997, ‘Neighbourhoods and violent crime: a multievel study of collective efficacy’, Science, vol. 277, pp. 918-924.
Santosa, SM,_Barcellosa, C, Sa´ Carvalhob, M 2006, ‘Ecological analysis of the distribution and socio-spatial context of homicides in Porto Alegre, Brazil’, Health and Place, vol. 12, pp. 38–47.
70

Schoenthaler SJ, Amos S, Doraz W, Kelly M, Muedeking G,Wakefield J, 1997. The Effect of Randomized Vitamin-Mineral Supplementation on Violent and Non-violent Antisocial Behavior Among Incarcerated Juveniles. Journal of Nutritional and Environmental Medicine, vol 7 pp343-352.
Shrestha, Milan. Report on Self-help Banking Program and Women’s Empowerment. Nepal, 1998.
Shultz, JM and Rice, DP 1991, ‘Quantifying the disease impact of alcohol with ARDI software’, Public Health Reports, vol. 106, pp. 443-450.
Single, E, Robson, L, Xie, X and Rehm, J 1998, ‘The economic costs of alcohol, tobacco and illicit drugs in Canada in 1992’, Addiction, vol. 93, pp. 983-98.
Soul City 2001, Soul City 4: Theory and Impact, pp. 10. Retrieved: June 27, 2006, from www.soulcity.org.za/downloads/SC4%20Theory%20and%20Impact%20(synopsis).pdf
South African Police Service 2004. Crime statistics per category: murder in the RSA for the financial years 1994/1995 to 2003/2004. Crime in the RSA for the period April to March 1994/1995 to 2003/2004.
Strauss M and Gelles, RJ 1986, ‘Societal change and change in family violence from 1975 to 1985 as revealed by two national surveys’, Journal of Marriage and the Family, vol. 48, pp. 465–479.
Substance Misuse: Advocacy Research and Training unpublished document. Western Cape Alcohol Abuse Reduction Strategy. Department of Community Safety Liquor Control Project.
Sukhai, A., Seedat, M., Jordaan, E. and Jackson, D. (2005). A city-level study of aggressive road behaviours: Magnitude, predictors and implications for traffic safety. South African Journal of Psychology, 35(2), 244-269.
Swart, L, Gilchrist, A, Butchart, A, Seedat, M and Martin, L 2000, ‘Rape surveillance through district surgeons’ offices in Johannesburg, 1996–1998: findings, evaluation and prevention implications’, South African Journal of Psychology, vol. 30, pp. 1–10.
Swiss S et al, 1998. ‘Violence against women during the Liberian civil conflict’, Journal of the American Medical Association, vol. 279, pp. 625–629.
Szwarcwald CL, Leal MC. In: National Commission on Population and Development (vol. 1). Youths and public policies. The threat in Brazilian youth lives: the dimension of the mortality by firearms. Brasilia, Brazil: National Commission on Population and Development, 1998:363--93.
Taylor, B, Brownstein, HH, Parry, CDH, Plüddemann, A, Makkai, T, Bennet, T andHolloway, K 2003, ‘Monitoring the use of illicit drugs in four countries through the International Arrestee Drug Abuse Monitoring program’, Criminal Justice, vol. 3, no. 3, pp. 269-286.
Thornberry, TP, Huizinga, D and Loeber, R 1995, ‘The prevention of serious delinquency and violence: implicationsfrom the program of research on
71

the causes and correlates of delinquency’, in JC Howell, JD Hawkins, and J Wilson (eds.), Sourcebook on serious, violent, and chronic juvenile offenders, Sage, Thousand Oaks.
United Nations Office on Drugs and Crime 2005, Why Fighting Crime Can Assist the Development of Africa: Rule of law and the protection of the most vulnerable, UNODC, Vienna, p20.
Van As, AB, Parry, CDH and Blecher, M 2003 ‘The alcohol injury fund’, South African Medical Journal, vol. 93, no. 11, pp. 828-829.
Van der Merwe, AP and Dawes, A in press, ‘Monitoring child unintentional and violence-related morbidity and mortality’, in A Dawes, R Bray, and AP van der Merwe (eds.), Monitoring child well-being: a South African rights based-approach, HSRC Press, Cape Town.
Van der Merwe, AP and Dawes, AD 2000, ‘Prosocial and antisocial tendencies in children exposed to community violence’, Southern African Journal of Child and Adolescent Mental Health, vol. 12, pp. 19-27.
Van der Spuy, E 2001, ‘Crime and its Discontent: recent South African Responses and Policies’, Crime and Policing in Transitional Societies: Seminar Report 8, South African Institute of International Affairs, Johannesburg, pp. 167-175.
Violence and Injury Surveillance Consortium 2000, National Non-Fatal Injury Surveillance System: pilot study report, Medical Research Council, Cape Town.
WHO Global Consultation on Violence and Health 1996, Violence: a public health priority, World Health Organization, Geneva. (document WHO/EHA/SPI.POA.2).
WHO no date, ‘Global Burden of Disease study for 2000: Version 1’ Retrieved: August 16, 2005, from www3.who.int/whosis/menu.cfm?path=whosis,burden,burden_estimates,burden_estimates_2000,burden_estimates_2000_V1andlanguage=english
Wilkinson, RG, Kawachi, I and Kennedy, BP 1998, ‘Mortality, the social environment, crime and violence’, Sociology of Health and Illness, vol. 20, pp. 578–597.
Wood, K, Jewkes, R 1997, ‘Violence, rape, and sexual coercion: everyday love in a South African township’, Gender and Development, vol. 5, pp. 41–46.
Wright GAN. Microfinance systems: designing quality financial services for the poor. London, New York: Zed Books Ltd and Dhaka: The University Press Limited, 2000.
Zununegui, MV, Morales, JM and Martınez, V 1997, ‘Child abuse: socioeconomic factors and health status’, Anales Espanoles de Pediatria, vol. 47, pp. 33–41.
72

Injury Prevention
Working Group
Road transport injury:
Risk factor review and
intervention analysis
Richard Matzopoulos
Rahul Jobanputra
Jonny Myers
June 2007
73

Acknowledgements
The authors of this section of Volume 5 of the Burden of Disease Report would like to thank the following: Members of the Expert Workgroup for their insights and comments Dr Marianne Vanderschuren Department of Civil Engineering and the Built Environment, UCT
Dr Roger Behrens
Department of Civil Engineering and the Built Environment, UCT
Mr Gerrie Botha
Road Traffic Management Corporation
Prof Christo Bester
Civil Engineering Department, University of Stellenbosch
Mr Andrew Wheeldon
Bicycle Empowerment Network
Table of Contents Page Acknowledgements……………………………………………………..74
Executive Summary…………………………………………………….75
Background……………………………………………………………….. 85
Aims and Objectives …………………………………………………..87
Prevention approaches……………………………………………….88
Risk Factors………………………………………………………………….92
1. Biological risk factors ……………………………………...92 2. Behavioural risk factors …………………………………...93 3.Societal risk factors…………………………………………….95 4. Structural factors ……………………………………………..96 5. Summary of risk factors……………………………….…..97
Preventive strategies ………………………………………………..104 1. Current National & Local Safety …………………...104
Strategies 1.1 Road to Safety 2000-2005 1.2 National Road Safety Strategy 2006- 1.3 National Road Safety Initiatives 1.4 Preparations for 2010 1.5 The demerit system 1.6 Confiscation of motor vehicles 1.7 Global partnerships 1.8 The Road Traffic Management corporation 1.9 Provincial initiatives
2. International Best Practice…………………………….108
2.1 Sweden 2.2 South America 2.3 Australia 2.4 International strategy 2.5 WHO strategy
3. How has South Africa addressed ………………..114
the WHO strategy? Recommended specific interventions……………………..116
Conclusions …………………………………………………………….122
References……………………………………………………………….123 Glossary……………………………………………………………………125 Appendix A: Data flows……………………………………………129

Executive Summary
Traffic-related Injury
Background
Internationally, the contribution of road traffic injuries to the burden of injury is an emerging priority, since their contribution to the global burden of disease was expected to rise to 5.1% of DALYs lost by 2020 (Murray and Lopez, 1995). In South Africa, the contribution for YLL is already at 5% and in 2000 the Western Cape was ahead of the trend at 6.9% (Bradshaw et al, 2004). Within the City of Cape Town, where the National Injury Mortality Surveillance System provides full coverage of fatalities, the following patterns were characteristic:
1 A high percentage of male deaths (78%);
2 A high percentage of pedestrian deaths (>60%);
3 High alcohol-relatedness of deaths among both drivers (>50% of deaths) and pedestrians (>60%); and
4 Distinct peaks over weekends among adults and among children of school-going age in the mornings and early afternoons.
(Prinsloo, 2004) As detailed in the World Report on Road Traffic Injury Prevention, road traffic injury is largely preventable and predictable. Caused only by humans themselves, it is amenable to rational analysis and counter-measure and is both a multi-sectoral issue and a public health issue. All agencies acting in the public interest, therefore — including health — need to be fully engaged in responsibility, activity and advocacy in order to prevent road crash injuries. Furthermore, it is a social equity issue. Because those who do not possess motor vehicles bear a disproportionate share of road injury and risk, all road users ought to be offered equal protection. By its very nature, the vulnerability of the human body demands a limiting design parameter for the traffic system, while the management of excessive speeds is crucial. Conventional driving errors and pedestrian behaviour ought not to produce such regular deaths and serious injury, and the traffic system should rather help users to cope with increasingly demanding conditions. If the authorities further seek technology transfer from high-income to low-income countries, the proposed design solutions need to accommodate local conditions and should address local needs that have been well researched and understood. (Peden et al. 2004).
There is no disputing the importance of road crashes as a national and provincial priority, because of their negative contribution not only to the burden of disease, but also to the economy. Apart from physical injuries, road crashes also damage personal property, and can severely inconvenience other commuters, thus impacting negatively overall on
75

productivity. According to the Arrive Alive campaign, for example, the estimated cost of road crashes in 2002 was in the region of R42.5 billion (Department of Transport, March 2004). Given this state of affairs, a separate review on road-traffic injuries was commissioned as part of the Provincial Government of the Western Cape’s Burden of Disease Project. This second section of Volume 5 —
explores the risk factors for public and private transport;
examines those interventions which have sought to reduce the incidence of death and disability in the Province;
considers the latest thinking nationally and internationally about road traffic injury prevention; and
lists those existing or proposed measures within their appropriate settings.
The section further —
reviews the known risk factors;
examines the best practices and interventions for road traffic injuries; describes the risk factors and groups at risk in the Western Cape, based on currently available data; and
provides policy makers with an initial basket of feasible interventions that meet the specific needs of the province.
Risk factors and interventions
One of the theoretical challenges that runs throughout this Report is to embed the risk factors and interventions in an ecological framework that is congruent with the assumptions behind the Burden of Disease Project itself. Most other road injury studies use the public-health triad, or the systems approach, which normally divides the factors into three influential vectors:
1. Exposure to risk;
2. Crash involvement; and
3. Inury severity.
Factors influencing exposure to risk tend to comprise mainly infrastructural and social upstream factors. Risk factors influencing crash involvement, however, are usually individual biological or behavioural, and hence considered as downstream factors, but with two notable exceptions:
inadequate visibility, owing to environmental factors; and
defects in road design, which are infrastructural in nature.
Since these factors are only “downstream”, in the sense of their being more proximal to the driver, they are considered relevant to the Burden of Disease Project. Similarly, risk factors influencing injury severity are a mix of proximal and distal interventions in terms of our ecological model. These would include actual health department-related downstream measures,
76

such as the response time of emergency services, and the quality and quantity of hospital services for injury victims.
Biological risk factors
Demographic factors, such as: age (young for aggression, old for decreased alertness); and gender (for aggression); and
Other biological factors, including a variety of acute and chronic conditions that may pose a risk to the driver passengers and other road users, such as: epilepsy, neurological disorders, heart disease, or poor eyesight.
Suggested interventions
A graduated driver licensing system for new drivers ;
Restricted licences for young drivers (especially young males) ;
An improved licensing system which is geared to health and behavioural problems, and based on a thorough examination; and
The continued monitoring and evaluation of process, output and outcome indicators.
Behavioural risk factors
Alcohol and substance abuse;
Aggressive driving behaviour, which includes speeding and moving violations among drivers, and risk–taking behaviour by all road users;
Fatigue;
The use of hand-held cell-phones while driving;
Failure to use seat-belts and child restraints; and
Crash helmets not being worn by users of two-wheeled vehicles.
Suggested interventions
Vigorous and regular random breath testing;
Stricter enforcement with more severe penalties, not just fines;
Better administration and follow-up of fines (at the time of writing only 17% of fines were being paid);
A “no-nonsense” approach to fine recovery and enforcement;
Compulsory courses and training for substance abusers;
The visible enforcement of moving and other violations;
Education campaigns at various locations and using various media that are integrated with current enforcement priorities; and
The monitoring and evaluation of process, output and outcome indicators.
77
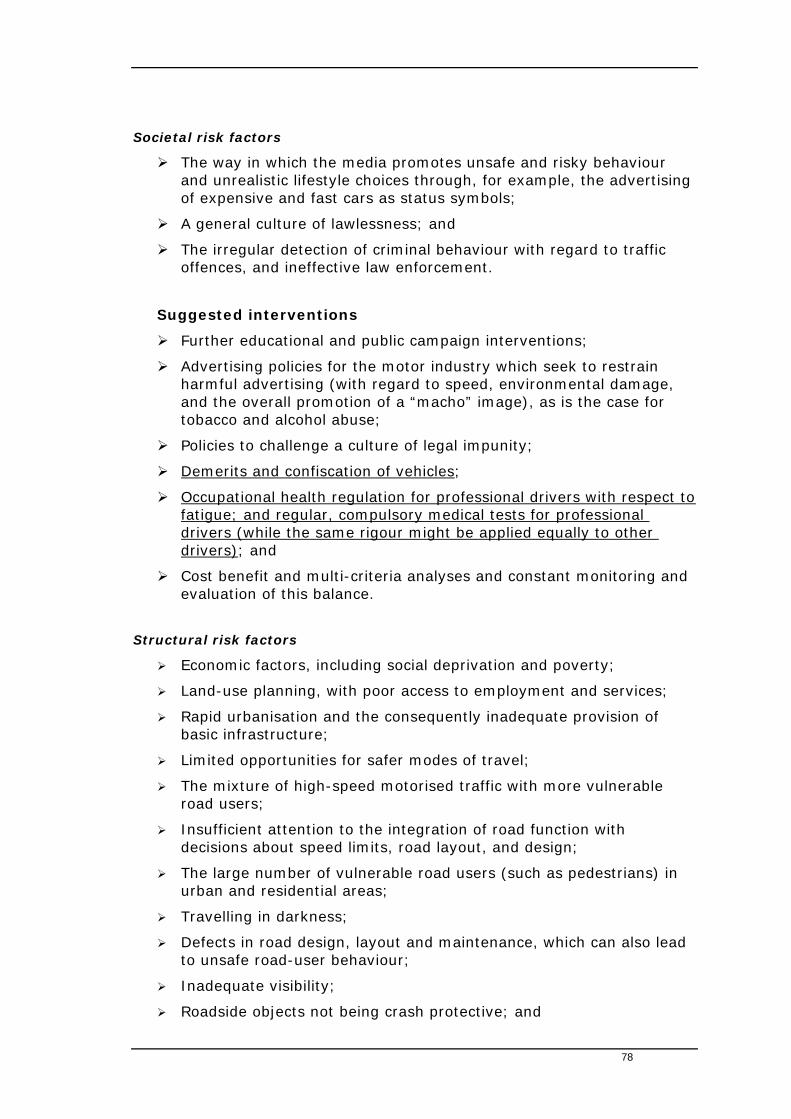
Societal risk factors
The way in which the media promotes unsafe and risky behaviour and unrealistic lifestyle choices through, for example, the advertising of expensive and fast cars as status symbols;
A general culture of lawlessness; and
The irregular detection of criminal behaviour with regard to traffic offences, and ineffective law enforcement.
Suggested interventions
Further educational and public campaign interventions;
Advertising policies for the motor industry which seek to restrain harmful advertising (with regard to speed, environmental damage, and the overall promotion of a “macho” image), as is the case for tobacco and alcohol abuse;
Policies to challenge a culture of legal impunity;
Demerits and confiscation of vehicles;
Occupational health regulation for professional drivers with respect to fatigue; and regular, compulsory medical tests for professional drivers (while the same rigour might be applied equally to other drivers); and
Cost benefit and multi-criteria analyses and constant monitoring and evaluation of this balance.
Structural risk factors
Economic factors, including social deprivation and poverty;
Land-use planning, with poor access to employment and services;
Rapid urbanisation and the consequently inadequate provision of basic infrastructure;
Limited opportunities for safer modes of travel;
The mixture of high-speed motorised traffic with more vulnerable road users;
Insufficient attention to the integration of road function with decisions about speed limits, road layout, and design;
The large number of vulnerable road users (such as pedestrians) in urban and residential areas;
Travelling in darkness;
Defects in road design, layout and maintenance, which can also lead to unsafe road-user behaviour;
Inadequate visibility;
Roadside objects not being crash protective; and
78

Policies that permit fast cars yet provide insufficient vehicle crash protection for occupants, pedestrians, and cyclists.
Suggested interventions
Spatial development and planning policies with respect to: reducing the need for travel (more efficient land-use)• ; the segregation of 4-wheel, 2-wheel and pedestrian • pathways;
• multiple carriageways; • speed controls and traffic calming; • crash prevention structures at “hotspots” (by introducing
compulsory medians, for example); and • prioritising public mass transit over private vehicle use;
Policy and law regarding motor vehicle design: • intelligent speed devices; • alcohol-detection ignition locks; • crash safety design for different collision types (such as car-
on-car and car-pedestrian – no bull-bars); • reduction in the car-on-car light intensity of headlamps, high-
mounted rear stoplights; • audible seat-belt alarms; and
• tax benefits for sensors to tighten seatbelts immediately before an crash takes place;
Independent safety audits of infrastructure;
Policies to increase visibility:
• lights-on for daytime travel and street lighting for night-travel to increase visibility; and
• retro-reflective components in school wear;
Vehicle safety and operation standards rigorously maintained by law (also providing a boost to the motor-maintenance industry); and
The regulation of those media advertising campaigns which emphasise speed and aggression, and the general restriction of roadside advertising which serves to distract drivers.
Table 1 on page 81 below postulates interventions for a range of risk factors and assesses their feasibility in the Western Cape Province. It is clear that these strategies broadly interface with the strategic priorities of the Provincial Growth and Development Strategy, namely: growth, equity, empowerment and environmental integrity. With regard to the eight strategies of iKapa Elihlumayo, there is a particular congruence with strategies 1, 2, 3, 4 and 6, namely: Economic participation, connectivity infrastructure, effective transport, liveable communities, and spatial integration.
79

Conclusion
It is unclear to what extent the numerous strategies outlined in this Report (of which many are included in existing South African road-safety strategies) are being implemented, nor what effect they are having. What is clear, however, is that these strategies need to be underpinned by a rigorous information system to monitor and evaluate key process, output and outcome indicators. This should include cost-benefit analyses and the constant monitoring and evaluation of this balance. Such a process should utilise an integrated multi-disciplinary team that is independent of implementing agencies in order to ensure an unbiased and optimum adherence to best practices for safety promotion and injury prevention. Studies to assess the effectiveness of interventions which are process-related — such as: the behavioural impact of changes in vehicle technology; worldwide experience of education campaigns; better enforcement; and so on — should be undertaken, along with the proper analysis of pre-crash conditions. Integration of the Engineering and Health Care professions are seen as key to the beneficial outcome of such studies.
80
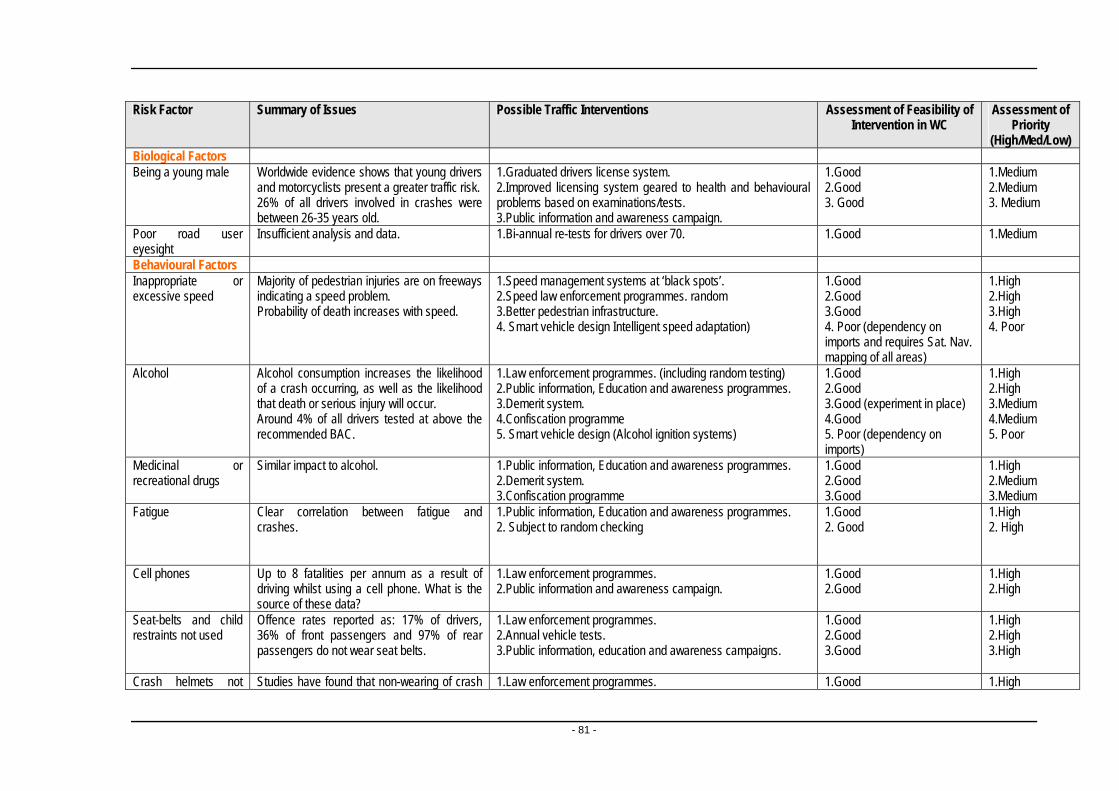
Risk Factor Summary of Issues Possible Traffic Interventions Assessment of Feasibility of Assessment of Intervention in WC Priority
(High/Med/Low) Biological Factors Being a young male Worldwide evidence shows that young drivers
and motorcyclists present a greater traffic risk. 1.Graduated drivers license system. 1.Good 1.Medium 2.Improved licensing system geared to health and behavioural problems based on examinations/tests.
2.Good 2.Medium 26% of all drivers involved in crashes were between 26-35 years old.
3. Good 3. Medium 3.Public information and awareness campaign.
Poor road user eyesight
Insufficient analysis and data. 1.Bi-annual re-tests for drivers over 70. 1.Good 1.Medium
Behavioural Factors 1.High Inappropriate or
excessive speed Majority of pedestrian injuries are on freeways indicating a speed problem.
1.Speed management systems at ‘black spots’. 1.Good 2.High 2.Speed law enforcement programmes. random 2.Good 3.High Probability of death increases with speed. 3.Better pedestrian infrastructure. 3.Good 4. Poor 4. Smart vehicle design Intelligent speed adaptation) 4. Poor (dependency on
imports and requires Sat. Nav. mapping of all areas)
1.High Alcohol Alcohol consumption increases the likelihood of a crash occurring, as well as the likelihood that death or serious injury will occur.
1.Law enforcement programmes. (including random testing) 1.Good 2.High 2.Public information, Education and awareness programmes. 2.Good 3.Medium 3.Demerit system. 3.Good (experiment in place) 4.Medium Around 4% of all drivers tested at above the
recommended BAC. 4.Confiscation programme 4.Good
5. Poor 5. Smart vehicle design (Alcohol ignition systems) 5. Poor (dependency on imports)
Medicinal or recreational drugs
Similar impact to alcohol. 1.Public information, Education and awareness programmes. 1.Good 1.High 2.Demerit system. 2.Good 2.Medium 3.Confiscation programme 3.Good 3.Medium
Fatigue Clear correlation between fatigue and crashes.
1.Public information, Education and awareness programmes. 1.Good 1.High 2. Subject to random checking 2. Good 2. High
Cell phones Up to 8 fatalities per annum as a result of driving whilst using a cell phone. What is the source of these data?
1.Law enforcement programmes. 1.Good 1.High 2.Public information and awareness campaign. 2.Good 2.High
Seat-belts and child restraints not used
Offence rates reported as: 17% of drivers, 36% of front passengers and 97% of rear passengers do not wear seat belts.
1.Law enforcement programmes. 1.Good 1.High 2.Annual vehicle tests. 2.Good 2.High 3.Public information, education and awareness campaigns. 3.Good 3.High
Crash helmets not Studies have found that non-wearing of crash 1.Law enforcement programmes. 1.Good 1.High
- 81 -

worn by users of two-wheeled vehicles
helmets can lead to up to 3 times as many head injuries in riders.
2.Public information, education and awareness campaigns. 2.Good 2.High
1. Law enforcement programmes. 1. Good 1. High Aggressive driving behaviour/ risk taking by all road users
Worldwide evidence shows that young drivers and motorcyclists present a greater traffic risk. Thrill seeking and over confidence rated high amongst contributory factors towards risk of crashes.
2. Graduated driving license system 2. Good 2. High 3. Public awareness programme 3. Good 3. High
Societal Factors Socio-cultural factors: role of the media
Media currently thought to glamorise fast driving and inappropriate lifestyle choices.
1. Educational programmes to create awareness. 1. Good 1. High 2. Advertising policies for the motor industry restraining harmful advertising (speed, environmental damage, macho image) similar to tobacco and alcohol.
2. Good 2. Medium
Culture of lawlessness Culture of impunity. 1. Policy to prevent culture of impunity. 1. Medium 1.High 2. Demerit system and confiscation of vehicles. 2. Good (currently on trial) 2. High 3. Occupational health regulation for professional drivers in respect of fatigue and driver medicals at certain ages and conditions.
3. Good 3. High
Poor rule of law and ineffective enforcement
Deterrents to lawlessness not strict enough and enforcement is poor.
1. Create meaningful deterrents 1. Good 1. High 2. Enforcement levels to be high so perceived level of apprehension is high.
2. Good 2. High 3. Good 3. High
3. Apprehension to be followed by swift adjudication. 4. Good 4. High 4. Improve automated offence enforcement e.g. cameras
Structural Factors Economic factors, including social deprivation
Main form of travel – by foot and minibus taxis.
1.Improve pedestrian infrastructure. 1.Good. 1.High. 2.Shorter pedestrian routes. 2.Good. 2.Medium.
About 60% of total fatalities are pedestrians. 3.More affordable public transport mass transit. 3.Unknown. 3.Medium. Children and young over-represented.
Demographic factors Majority of crashes in urban areas. Majority of pedestrian injuries in Cape Town are on the major freeways.
As above. As Above As above
Land use planning practices
Location of centres of employment at large distances from centres of population leading to increased mobility.
As above. As Above As Above
Mixture of high-speed motorized traffic with vulnerable road users
Infrastructure inadequate and unsafe (almost no lighting)
1.Independent safety audits. 1.Good 1.High 2.Segregation of users. 2.Medium 2.High 3.Education and awareness campaigns. 3.Good 3.High 4.Better crash protection measures 4.Good 4.High
- 82 -
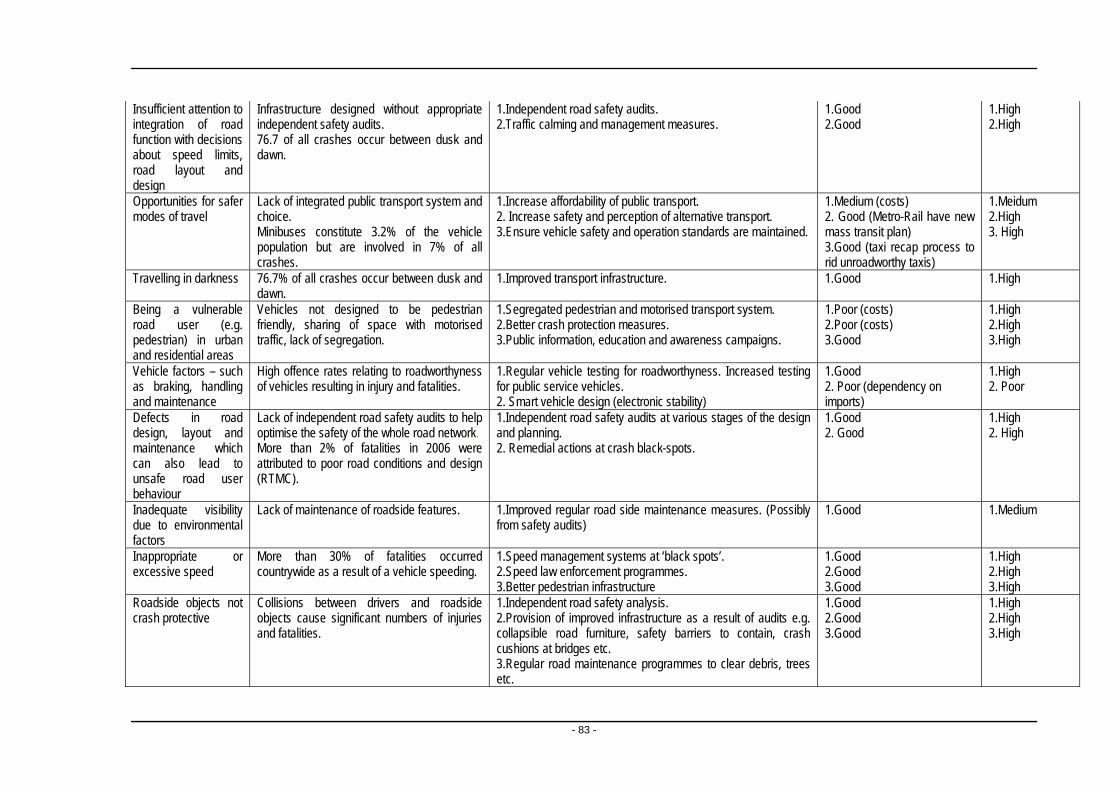
Insufficient attention to integration of road function with decisions about speed limits, road layout and design
Infrastructure designed without appropriate independent safety audits.
1.Independent road safety audits. 1.Good 1.High 2.Traffic calming and management measures. 2.Good 2.High
76.7 of all crashes occur between dusk and dawn.
Opportunities for safer modes of travel
Lack of integrated public transport system and choice.
1.Increase affordability of public transport. 1.Medium (costs) 1.Meidum 2. Increase safety and perception of alternative transport. 2. Good (Metro-Rail have new
mass transit plan) 2.High
Minibuses constitute 3.2% of the vehicle population but are involved in 7% of all crashes.
3.Ensure vehicle safety and operation standards are maintained. 3. High 3.Good (taxi recap process to rid unroadworthy taxis)
Travelling in darkness 76.7% of all crashes occur between dusk and dawn.
1.Improved transport infrastructure. 1.Good 1.High
Being a vulnerable road user (e.g. pedestrian) in urban and residential areas
Vehicles not designed to be pedestrian friendly, sharing of space with motorised traffic, lack of segregation.
1.Segregated pedestrian and motorised transport system. 1.Poor (costs) 1.High 2.Better crash protection measures. 2.Poor (costs) 2.High 3.Public information, education and awareness campaigns. 3.Good 3.High
Vehicle factors – such as braking, handling and maintenance
High offence rates relating to roadworthyness of vehicles resulting in injury and fatalities.
1.Regular vehicle testing for roadworthyness. Increased testing for public service vehicles.
1.Good 1.High 2. Poor (dependency on imports)
2. Poor 2. Smart vehicle design (electronic stability)
Defects in road design, layout and maintenance which can also lead to unsafe road user behaviour
Lack of independent road safety audits to help optimise the safety of the whole road network.
1.Independent road safety audits at various stages of the design and planning.
1.Good 1.High 2. Good 2. High
More than 2% of fatalities in 2006 were attributed to poor road conditions and design (RTMC).
2. Remedial actions at crash black-spots.
Inadequate visibility due to environmental factors
Lack of maintenance of roadside features. 1.Improved regular road side maintenance measures. (Possibly from safety audits)
1.Good 1.Medium
Inappropriate or excessive speed
More than 30% of fatalities occurred countrywide as a result of a vehicle speeding.
1.Speed management systems at ‘black spots’. 1.Good 1.High 2.Speed law enforcement programmes. 2.Good 2.High 3.Better pedestrian infrastructure 3.Good 3.High
Roadside objects not crash protective
Collisions between drivers and roadside objects cause significant numbers of injuries and fatalities.
1.Independent road safety analysis. 1.Good 1.High 2.Provision of improved infrastructure as a result of audits e.g. collapsible road furniture, safety barriers to contain, crash cushions at bridges etc.
2.Good 2.High 3.Good 3.High
3.Regular road maintenance programmes to clear debris, trees etc.
- 83 -

Insufficient vehicle crash protection for occupants, pedestrians, cyclists
Vehicles not crashworthy, ageing fleet, lack of regular testing, visibility of vehicles, design of vehicles to reduce impact on other road users.
1. Implement improved vehicle design standards 1. Poor (dependency on overseas market)
1. Medium 2. Regular roadworthy testing regime 2. High 3. Daytime running lights for all vehicles 2. Good 3. High 4. Modify vehicle fronts to protect vulnerable road users. 3. Good 4. Medium
4. Poor (as 1 above) Table 1: Feasibility of potential interventions in the Western Cape for a range of risk factors
- 84 -

Background Motor vehicle crashes have until recently been viewed as random events that happen to others and as an inevitable outcome of road transport. The term “accident”, in particular, can give the impression of inevitability and unpredictability — an event that cannot be managed, but this belief is unfounded. Roads in South Africa provide a mixture of First- and Third-World traffic conditions. This creates variations in the population's awareness of road-safety hazards and its capacity to cope with the different traffic conditions. Road conditions vary: from well designed and developed dual-carriageway motorways that run between the major cities and tourist attractions, to non-paved and poorly maintained rural roads. A major road-safety concern is that many pedestrians use or cross over the highways inappropriately.1 Road traffic injuries therefore remain a major, but neglected, public-health challenge that requires concerted efforts for effective and sustainable prevention. Of all the systems people have to deal with every day, road traffic systems are the most complex and the most dangerous. (WHO, 2004). Worldwide, an estimated 1.2 million people are killed in road crashes each year and as many as 50 million are injured. Projections indicate that these figures will increase by about 65% over the next 20 years, unless there is a renewed commitment to prevention. Moreover, many of these deaths and injuries are known to be preventable. More than 85% of road deaths occur in middle- to low-income countries and it is in these very countries that road safety has been ignored as an issue pertaining to sustainable development. (WHO, 2004) The contribution of road traffic injuries to the burden of injury is an emerging priority internationally, with their contribution to the global burden of disease expected to rise to 5.1% of DALYs lost by 2020 (Murray and Lopez, 1995). In South Africa, the contribution for YLL is already at 5% and in 2000, the Western Cape Province was ahead of the trend at 6.9% (Bradshaw et al, 2004). Within the City of Cape Town, where the National Injury Mortality Surveillance System provides full coverage of fatalities, the following patterns were characteristic: a high percentage of male deaths (78%); a high percentage of pedestrian deaths (>60%); high alcohol-relatedness of deaths among both drivers (> 50% of deaths) and pedestrians (>60%); and distinct peaks over weekends among adults and among children of school going age in the mornings and early afternoons (Prinsloo, 2004).
2A summary of the national crash statistics are drawn from the RTMC are reproduced in Table 1 below.
1 http://www.gprs.org
Interim Road Traffic and Fatal Crash Report for the year 2006, RTMC 2
- 85 -

Table 1: Summary of National Traffic and Crash statistics for 2006
% Increase 2005 2006 (Decrease)
No. of vehicles registered 7,971,187 8,544,982 7.2%
No. of driving licences issued
7,513,530 7,818,171 4.05%
No. of professional driving permits issued
627,826 666,193 6.11%
(for public service and heavy vehicles)
Number of fatal crashes 11,736 12,454 6.12%
Number of fatalities 14,135 15,393 8.9%
Driver fatalities 3,867 4,466 15.49%
Passenger fatalities 4,358 5,151 18.2%
Pedestrian fatalities 5,910 5,776 (2.26%)
No. of fatalities per 10.97 11.75 7.1% 100 million vehicle-km
Estimated cost of fatal crashes
R10.33 billion R10.96 billion 6.12%
There is no disputing the importance of traffic inuries as a national and provincial priority, both in terms of its contribution to the burden of disease, but also to the economy. As well as physical injuries, accicdents also damage personal property and can severely inconvenience other commuters and hence productivity. According to Arrive Alive, the estimated cost of crashes in 2002 was in the region of R42.5 billion (Department of Transport March 2004). Following an initiative from the Director General of the Western Cape Provincial Department of Health, a Project Task Team was appointed to delineate the extent of the burden of disease (BoD) in the Province, along with its associated causes and risks and to develop an optimal approach to reducing this burden in the Province, focussing particularly on interventions targeting upstream3 determinants of health.
This document assumes that road traffic crashes are events that are amenable to rational analysis and remedial action. It seeks to contribute to those efforts which are intended to reduce death, disease and disability in the Western Cape Province by: comparing existing risk factors for public and private transport; examining the latest thinking nationally and internationally about road traffic injury prevention; and considers existing evidence and proposed measures with due consideration for the appropriate context. 3 The term “upstream” refers to the structural and societal determinants of health that may act either indirectly or directly to cause disease and/or disability.
- 86 -
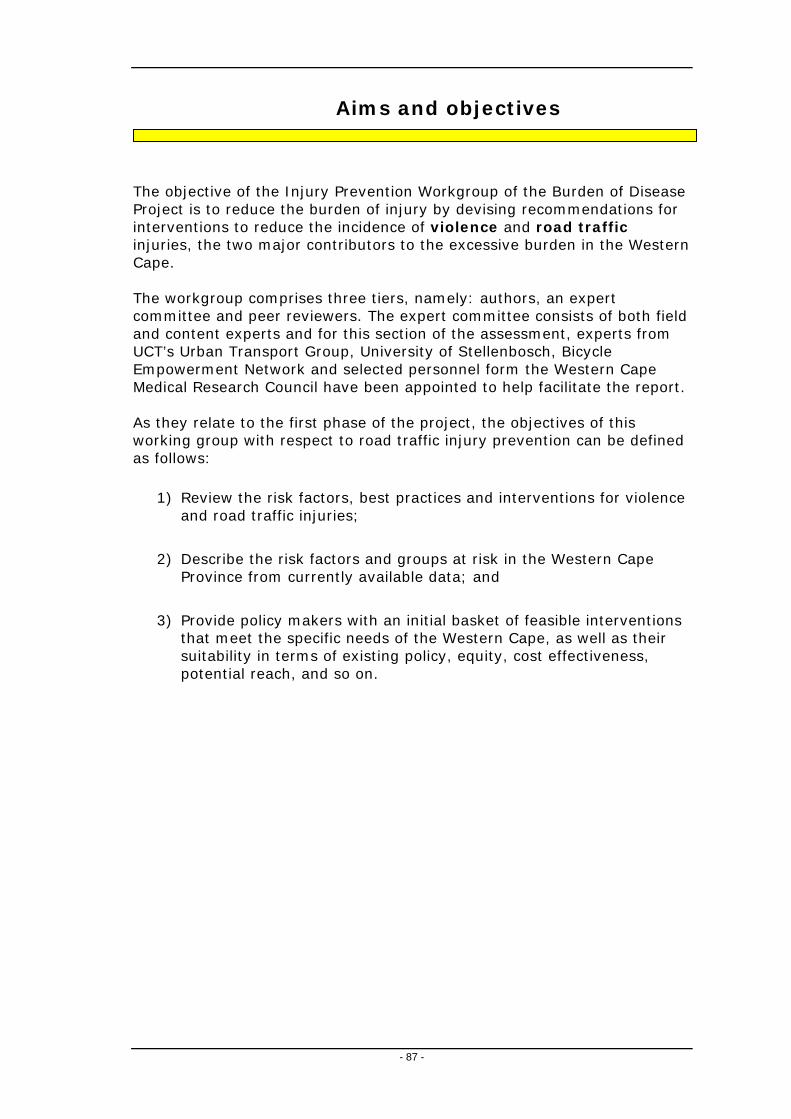
Aims and objectives The objective of the Injury Prevention Workgroup of the Burden of Disease Project is to reduce the burden of injury by devising recommendations for interventions to reduce the incidence of violence and road traffic injuries, the two major contributors to the excessive burden in the Western Cape. The workgroup comprises three tiers, namely: authors, an expert committee and peer reviewers. The expert committee consists of both field and content experts and for this section of the assessment, experts from UCT’s Urban Transport Group, University of Stellenbosch, Bicycle Empowerment Network and selected personnel form the Western Cape Medical Research Council have been appointed to help facilitate the report. As they relate to the first phase of the project, the objectives of this working group with respect to road traffic injury prevention can be defined as follows:
1) Review the risk factors, best practices and interventions for violence and road traffic injuries;
2) Describe the risk factors and groups at risk in the Western Cape
Province from currently available data; and
3) Provide policy makers with an initial basket of feasible interventions that meet the specific needs of the Western Cape, as well as their suitability in terms of existing policy, equity, cost effectiveness, potential reach, and so on.
- 87 -

Prevention approaches for road traffic injuries The public-health approach to traffic-injury prevention considers traffic injuries in the same light as any other disease or health problem: they have a human host with an inherent risk profile. Tthere are mechanisms that cause or aggravate injuries (such as the vehicles themselves); and a number of environmental factors (social as well as physical) that either act as protective barriers or increase the risk of exposure. Injuries resulting from traffic are predictable rather than random events and the incidence of road traffic injuries can be reduced by using a combination of three strategies, popularly known as the “Three Es”:
1) Education;
2) Enforcement (legislation and policing, as well as related policy formulation); and
3) Engineering (the social and physical environment), More recently, the WHO categorised road traffic injuries according to various types of risk associated (WHO, 2004). This “systems approach” equally defines three sets of factors:
1) factors influencing exposure to risk;
2) factors influencing crash occurence; and
3) factors influencing crash severity.
Exposure to risk is determined by:
economic and demographic factors;
the level and quality of motorisation;
the road environment;
modes of travel;
the volume of unnecessary trips; and
land-use planning policies and practices.
Crash occurrence risk factors include:
excessive speed and aggressive behaviour;
drinking and driving;
unsafe vehicles (for example 4x4’s with bull-bars) and equipment;
unsafe road design;
the lack of effective law enforcement; and
safety regulations.
- 88 -
Crash severity has the following risk factors:
the non-use of seat-belts, child restraints and crash helmets;
the lack of “forgiving” vehicle fronts to protect pedestrians in a collision; roadside infrastructure that is not protective in a crash; and
human tolerance factors.
Post-crash injury outcomes are also influenced by:
delays in detecting crashes and the provision of life-saving measures and psychological assistance;
the lack of, or delayed, emergency care on the spot and transport to a health facility;
traffic congestion; and
the availability and quality of trauma care and rehabilitation.
Data sources in South Africa still tend to categorise the risk factors in terms of their human, vehicular and road-factor components, as opposed to the WHO-favoured systems approach. Furthermore, the workgroups in the Burden of Injury Project have applied an ecological approach to the five disease priorities in the province. In this section of Volume 5 of the Report, therefore, we have attempted to map the public health and systems approaches to the four ecological levels of risk: biological, behavioural, societal and structural. For the most part, factors influencing exposure to risk tend to comprise mainly infrastructural and social upstream factors, whereas risk factors influencing crash involvement are usually individual biological or behavioural and hence downstream with two exceptions: inadequate visibility due to environmental factors and defects in road design (which are infrastructural). The factors are only downstream, however, in the sense of their being more proximal to the driver — not truly applying to health services and the Provincial Department of Health — and hence these factors are relevant to the Burden of Disease Project. Similarly, risk factors influencing crash severity are a mix of proximal and distal interventions in terms of our ecological model, including actual health-department services, where the response time of emergency services and the quality and quantity of hospital services for crash victims are equally important.
- 89 -

Component with regard Risk Factor Risk Factor to intervention Category
Factors influencing exposure to risk
1 Economic factors, including social deprivation Upstream TE
2 Demographic factors Upstream TE
3 Land use planning practices Upstream TE
4 Mixture of high-speed motorized traffic with vulnerable road users Upstream TE/RU/H
5 Insufficient attention to integration of road function with decisions about speed limits, road layout and design
Upstream H/RU/Enf
6 Opportunities for safer modes of travel Upstream TE/V
Risk factors influencing crash involvement
7 Inappropriate or excessive speed Upstream H/RU/V
8 Alcohol Upstream H
9 Medicinal or recreational drugs Upstream H
10 Fatigue Upstream H
11 Being a young male Downstream H
12 Cell phones Downstream H
13 Being a vulnerable road user (e.g. pedestrian) in urban and residential areas
Upstream H/RU/TE/Ed
14 Travelling in darkness Upstream H/RU
15 Vehicle factors – such as braking, handling and maintenance Upstream V/Enf
16 Defects in road design, layout and maintenance which can also lead to unsafe road user behaviour
Upstream RU/H/TE
17 Inadequate visibility due to environmental factors Upstream RU
18 Poor road user eyesight Downstream H/Enf
- 90 -

Table 2: Translating the systems approach to the ecological approach to risk factors
Component with regard Risk Factor Risk Factors To intervention Category
Risk factors influencing crash severity
19 Human tolerance factors Downstream H
20 Inappropriate or excessive speed Downstream H/Enf/VEd
21 Seat-belts and child restraints not used Downstream V/Enf/Ed
22 Crash helmets not worn by users of two-wheeled vehicles Downstream V/Enf/Ed
23 Roadside objects not crash protective Downstream RU
24 Insufficient vehicle crash protection for occupants, pedestrians, cyclists Downstream V/Enf
25 Presence of alcohol and other drugs Downstream H/Enf
Downstream
Risk factors influencing severity of post-crash injuries Downstream
26 Delay in detecting crash Downstream IM/RU/TE
27 Presence of fire resulting from collision Downstream V/IM/Enf
28 Leakage of hazardous materials Downstream V/im/Enf/Ed
29 Presence of alcohol and other drugs Downstream H/Enf/Ed
30 Difficulty rescuing and extracting people from vehicles Downstream IM/V/Ed
31 Difficulty evacuating people from buses and coaches involved in crash Downstream IM/V/RU/TE
32 Lack of appropriate pre-hospital care Downstream IM/Ed
33 Lack of appropriate care in the hospital emergency rooms Downstream Ed
Key to Abbreviations: H - Human Factors V - Vehicular Factors RU - Road Use Factors
TE – Transport Environment Enf - Enforcement IM – Incident Management Ed - Education
- 91 -

Risk factors
This section elaborates on the risk factors for road traffic injury prevention as they pertain to the four ecological levels. Apart from some biological factors (such as epilepsy, old age, and eyesight) and behavioural factors (such as alcohol and substance abuse, and risk-taking behaviour), most risk factors and interventions for crashes are mainly upstream in relation to health, since transport matters are by definition upstream from a heath perspective. Hence this report makes no further distinction in this regard. 1. Biological factors
These include the individual’s ability to hear, see, evaluate and react to information which influences traffic safety. Age and sex are two important demographic factors, as young people, and males tend to be more aggressive, whereas older people are less alert. Other biological factors include a variety of acute and chronic conditions that may pose a risk to the driver passengers and other road users (such as epilepsy, neurological disorders, heart disease, and poor eyesight). Young children and adolescents are particularly at risk because of their lack of physical and emotional developmental, maturity, gender, inexperience, and youth-related lifestyle. Various risks associated with age-related immaturity (mainly males) often interact with inexperience among young drivers, increasing in turn the chances of a crash occurring. Risky driving leads young people into hazardous situations and their inexperience makes handling these situations more difficult.
There is evidence from around the world which shows that young drivers and motorcyclists have a higher crash risk than older, more experienced drivers.
As with adolescent pedestrians or cyclists, young drivers are more likely to take risks and be susceptible to peer pressure, while there are other factors that increase their risk of a crash that relate more to their lack of experience in driving. To give one example, they are less able to accurately perceive hazards, control the vehicle, and make appropriate decisions on the road. This risk is reflected in fatality rates of young road users.
This observation is borne out by local data. The Arrive Alive campaign reports that around 49% of all fatalities are in the 20 to 35 age group, reflecting the most economically active age group. Childhood injuries among children 0-19 years accounted for approximately 10% of all pedestrian and passenger deaths. More than one-third of child traffic deaths (37%) occurred on weekends. More child traffic deaths occurred on Saturday than any other day, but this was mainly due to the large number of deaths in the 15-19 year age group (67). The 5-9 and 10-14 year age groups recorded the highest number of deaths on Fridays (40 and 25 deaths respectively). In the 5-9 year age group there were noticeable
- 92 -
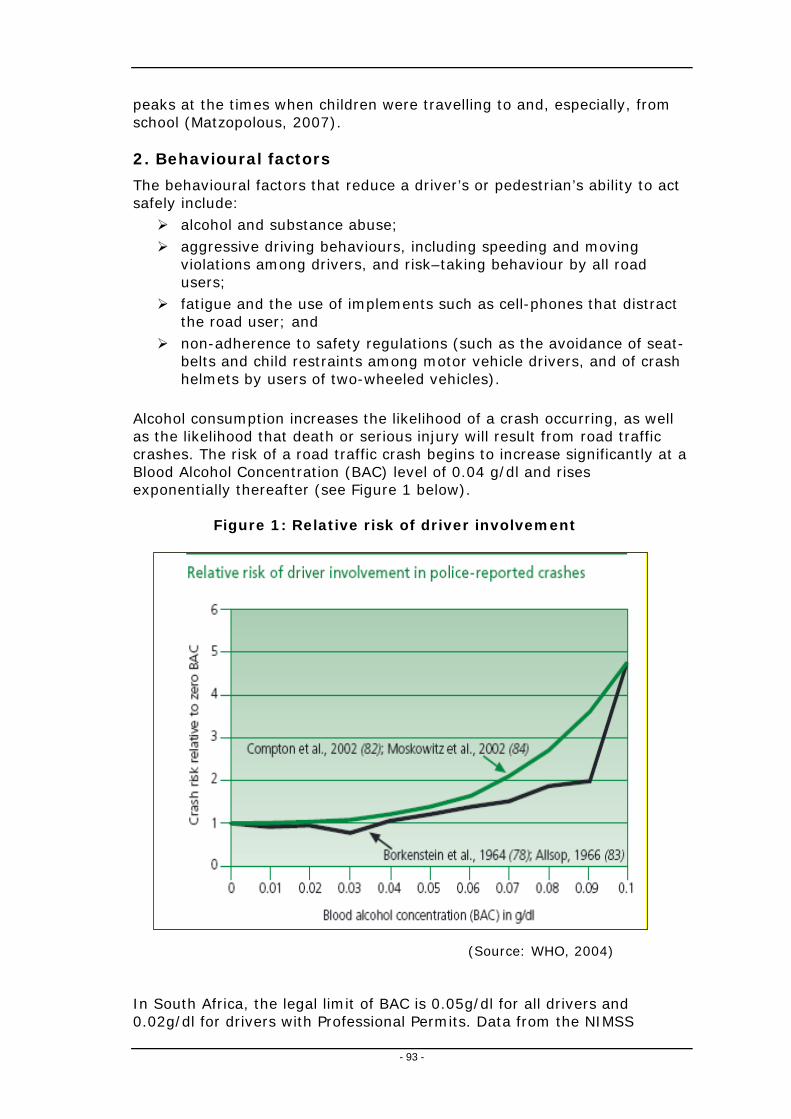
peaks at the times when children were travelling to and, especially, from school (Matzopolous, 2007). 2. Behavioural factors
The behavioural factors that reduce a driver’s or pedestrian’s ability to act safely include:
alcohol and substance abuse; aggressive driving behaviours, including speeding and moving
violations among drivers, and risk–taking behaviour by all road users;
fatigue and the use of implements such as cell-phones that distract the road user; and
non-adherence to safety regulations (such as the avoidance of seat-belts and child restraints among motor vehicle drivers, and of crash helmets by users of two-wheeled vehicles).
Alcohol consumption increases the likelihood of a crash occurring, as well as the likelihood that death or serious injury will result from road traffic crashes. The risk of a road traffic crash begins to increase significantly at a Blood Alcohol Concentration (BAC) level of 0.04 g/dl and rises exponentially thereafter (see Figure 1 below).
Figure 1: Relative risk of driver involvement
(Source: WHO, 2004) In South Africa, the legal limit of BAC is 0.05g/dl for all drivers and 0.02g/dl for drivers with Professional Permits. Data from the NIMSS
- 93 -

indicate the high alcohol-relatedness of deaths in Cape Town among both drivers (>50% of deaths) and pedestrians (>60%) (Prinsloo, 2004). Aggressive behaviour on the roads is an emerging concern. In a study of more than 1,000 drivers in KwaZulu Natal, between 64% and 84% of drivers had experienced aggressive driving behaviours by another motorist, such as verbal or gesticulatory expressions of anger and 18% had experienced direct confrontation in the form of an argument or assault. Of the respondents themselves, more than half of the drivers who had admitted to driving while drunk also reported becoming more aggressive when they drove under the influence of alcohol. The study also showed that drinking and driving was a strong predictor of two types of aggressive behaviour on the road: verbal or gesticulatory expressions of anger, and direct confrontations with other motorists (Sukhai et al, 2005). The relationship between speed and mortality is well documented. As indicated in Figure 2, it is a proportional relationship and there is a natural association with aggressive behaviour. Of the respondents in the survey by Sukhai et al (2005), 53% admitted that they exceeded the speed limit when able to and 48% admitting to speeding through yellow or driving through red traffic lights (Sukhai et al, 2005). Nevertheless, speed is also a function of the road environment, vehicle design, traffic rules and enforcement of these rules, and not only of driver behaviour. Poor enforcement is a constant problem in South Africa. As at December 2005, The total number of unroadworthy vehicles (based upon the number of owners that fail to get their vehicle tested for fitness upon transfer, and not testing) was 197,924.
Figure 2: Relationship between speed and probability of death
(Source WHO, 2004)
The average age of sedan cars is 10 years, minibuses 13 years and buses and trucks from 11-12 years;
- 94 -

A total of R85,365,340 in fines was outstanding as at December 2005 (including towed vehicles); only 17% of fines were recovered (M Vanderschuren; personal communication)
Similarly, “jaywalking” which is often explained as an “unsafe” or risky behaviour, is also determined by infrastructural factors such as poor urban planning that limits the number of crossing points, provides inadequate means of access to amenities for pedestrians, and neglects to separate pedestrians from the road system adequately. Another consideration is that these behaviours may be learned rather than inherent. These are influenced by gender issues, personal levels of stress and aggression, sensation seeking among the young and adolescent youth, and by the culture of impunity among both taxi drivers and drivers of luxury vehicles. 3. Societal risk factors
The societal factors that reduce a road user’s ability to act safely include:
Socio-cultural factors, particularly the role of the media in promoting a glamorous attitude towards unsafe behaviour and unrealistic lifestyles;
Culture of lawlessness;
Poor observance of the Rule of Law; and
Ineffective enforcement.
One of the manifestations of this culture of lawlessness is the lack of road-worthiness among vehicles on our roads. As at December 2005, risk factors that influenced crashes included vehicles that were not road-worthy; poor vehicle design features that allow excessive speeding and afford little protection to vulnerable road users; defective tyres; and overloading. The Department Of Transport estimates from surveys that defective tyres are the cause of 21% of vehicle-related traffic crashes and that 3.5% of crashes were due to defective lights. Vehicles that are not road-worthy can clearly contribute further to risks, owing to poor functioning or inadequate seat belts, for example. An indication of the low observance of the Rule of Law is represented in the poor rate of fine recovery, currently estimated at 17% (M. Vanderschuren – personal communication).
- 95 -

A recent report in the Cape Times (2006-12-19) indicated that there is
a huge influx of cheap sub-standard tyres; and that unscrupulous dealers were re-cycling tyres that were beyond their useful life.
4. Structural factors
There are numerous structural factors that impact on road safety. These include:
Economic factors, including social deprivation and poverty;
Land-use planning with poor access to employment and services;
Urbanisation and inadequate basic infrastructure;
Limited opportunities for safer modes of travel; and
The mixture of high-speed motorised traffic with vulnerable road users:
Insufficient attention to the integration of road function with decisions about speed limits, road layout and design;
Large number of vulnerable road users (especially pedestrians) in urban and residential areas;
Travelling in darkness;
Defects in road design, layout and maintenance which can also lead to unsafe road-user behaviour;
Inadequate visibility;
Roadside objects that are not crash protective; and
Policies that allow fast cars, yet provide insufficient vehicle-crash protection for occupants, pedestrians, and cyclists.
Road-usage factors include:
road-surface type;
slippery roads due to inadequate drainage;
poor visibility;
inappropriate design (such as the absence of medians or multiple carriageways that separate traffic); and
inadequate safety fencing.
According to the Department of Transport, (National Road Safety Strategy, 2006), poor visibility, inadequate lighting and inappropriate design were the main risk factors for incidents.
- 96 -

It is not clear from the data whether poor visibility is referred to as an inadequate road-design function, or the weakness of the actual luminance available on the road system itself. Strategies worldwide address both through road-safety audits, while research by the Department of Transport suggests that an increase in road-lighting luminance by 1 candela/m2 would help to reduce the number of night-time incidents by up to 65%. Road-safety audits in developing countries commonly recommend that roads ought to be designed with adequate storm-water drainage in order to reduce the level of standing surface water and thus the risk of skidding. They further recommend that approaches to all intersections ought to be paved with skid-resistant surfacing in order to reduce rear-end shunts. The absence of adequate public transport services also imposes on the road traffic system. The 2003 National Household Travel Survey (NHTS) showed that 74% of all households lack access to a car and are hence dependent on public transport and walking. Statistics from Arrive Alive indicate that approximately 80% of the population depend upon public transport. Even in the six metropolitan areas, 2.3 million workers (49% of workers) use public transport, compared to the 1.85 million workers (39.5%) who use a car. Currently, nearly 50% of South African households use public transport to access police stations and municipal offices; 40% of households use public transport to access medical services and post offices; 55% of households use public transport to access welfare offices; and 64% use public transport to access shops. The key NHTS findings in relation to public transport usage levels include:
3.85 million workers use public transport, while 3.15 million workers use cars;
64% of workers who use public transport use a taxi, while 22% use a bus and 15% use a train;
Walking times to trains are greater than 15 minutes in the case of 87 per cent of metropolitan or urban households and beyond 30 minutes in the case of 98 per cent of rural households;
Walking times to buses are greater than 15 minutes in the case of 52 per cent of metropolitan or urban households and 30 minutes in the case of 43 per cent of urban households; and
Walking times to taxis are greater than 15 minutes in the case of 18 per cent of metropolitan or urban households and 30 minutes in the case of 20 per cent of rural households.
5. Summary of risk factors according to the Ecological model The following risk factors have been drawn from the available data, both local and international and have been deployed in terms of the ecological framework that is congruent with the Burden of Disease project (See Table 2 on the following page).
- 97 -

Table 3: Analysis of Risk Factors
Risk Factor SA/WC Evidence International Evidence Discussion
Biological Risk Factors
Gender/ Age - Male pedestrians casualties outnumber female casualties by 1.8:1
- In 2002, Males accounted for 73% of deaths and 70% of DALY’s lost because of road traffic injuries
The definition of the risk factor is seen as being aggression in terms of the youth and decreased alertness for the old as well as sex for aggression.
- In 2003, 35% of all pedestrian related injuries in Western Province were to children below the age of 17. Drivers under 21 accounted for about 8% of all crashes in the Province.
- Death rates per 100,000 population of people aged over 60 were highest of all age categories in low/ middle income countries.
Other (acute and chronic conditions, e.g. epilepsy heart disease poor eyesight etc.)
- In 2003, people aged 75 and over accounted for approximately 1% of all pedestrian fatalities and drivers over 60 accounted for more than 5% of all road crashes in the Western Province.
- Death rates per 100,000 population of people aged over 60 were highest of all age categories in low/ middle income countries.
There is no clear evidence of health related crashes or injuries in the available statistics therefore the evidence reported is general.
Behavioural Risk Factors Alcohol/ Substance abuse
- 4.3% of drivers surveyed exceed the legal alcohol limit
-The risk of a road traffic crash begins to increase significantly at a Blood Alcohol Concentration (BAC) level of 0.04 g/dl and rises exponentially thereafter.
In SA the legal limit of BAC is 0.05g/dl for all drivers and 0.02g/dl for drivers with Professional Permits - 1.9% of all fatal crashes were as a
result of the driver being intoxicated
Fatigue -76.7% of all fatal crashes in Cape Town occur at dusk/dawn/night
- Studies in the United States have found that fatigue was a factor in 30% of fatal
Many countries have laws restricting the number of hours that commercial drivers can drive in one stretch as research shows that the risk of being involved in crashes doubles after 11 hours of driving. It is also 10 times as great during the night.
-1.5% of all fatal crashes Nationally were reported to be as a result of fatigue
crashes involving heavy commercial vehicles and in 52% of all single-vehicle crashes involving trucks. In the latter case, 18% of the drivers admitted having fallen asleep
Non-usage of seat belts
- About 67% of all motorists do not wear seat belts
- Several studies on the benefits of seat-belts for drivers and front-seat passengers have found that seat-belts
Seat belts are mandatory for drivers and front seat passengers but not for the rear occupants of a vehicle. The
- 98 -

can reduce the risk of all injuries by 40–50%; of serious injuries by 43–65%; and of fatal injuries by 40–60%.
effectiveness of belts for front users is reduced if rear passengers do not use restraints or if there are unrestrained items such as luggage.
- Research shows that reaction times of drivers increase by up to 1.5 seconds when using a hand held talking device
Cell Phones -cell phone use increases safety risk fourfold
Despite the imposition of a fine on drivers using hand-held phones in SA, observation indicates that there is a widespread use of hand held devices and thus the lack of enforcement of laws is apparent.
4
Non- wearing of crash helmets by users of two-wheeled vehicles
- Of admissions to the Red Cross Childrens Hospital, only 1 in 5 children were found to have been wearing suitable restraints
- Less than 10% of motorcyclists wear helmets in most countries that do not require the use of helmets by law
‘Among moped and motorcycle riders, head injuries account for about 75% of deaths in Europe and 55–88% in Malaysia. One study found that riders without helmets were three times more likely to sustain head injuries than those with helmets. Another found that helmets reduced fatal and serious head injuries by 20–45%.’ (WHO 2004)
Societal Risk Factors Socio-cultural factors: role of the media
No specific data available - Research shows that public education and information campaigns have proven to be highly effective when they accompany laws and law enforcement.
Media glamorises unsafe behaviour and unrealistic lifestyle choices e.g. fast cars. In isolation, education and public awareness campaigns do not deliver tangible results, however their role in affecting consciousness and behaviour is clear.
Culture of lawlessness
Speeding statistics as above. - In the EU it is estimated that improving enforcement of current laws could reduce the number of serious road traffic injuries and deaths by up to 50%
Culture of impunity is prevalent in Western Cape due to poor enforcement.
4 www.sasits.com accessed 10/3/2007
- 99 -

Poor rule of law and ineffective enforcement
Speeding statistics as above give an indication of the ineffective enforcement of law.
As above. Driving at excess or inappropriate speeds, while under the influence of alcohol, while sleepy or fatigued and without protective gear (such as seatbelts, child restraints and helmets) for all vehicle occupants are major contributors to road crashes, deaths and serious injuries. Laws alone are not enough to discourage these errors. Enforced compliance is the key
Structural Factors Road Layout - The majority of all crashes are on
tarmac roads - Increased level of motorisation and its link to increase in road traffic injuries clear from many studies
No requirement for formal independent safety audits. Current Occupational Health and Safety regulations require designer to submit Health and Safety Plan, however it is not clear how stringently this is applied.
- About 1% of all fatal injuries occurred as a result of poor road conditions as well as 1% due to sharp bends -76.7% of all fatal crashes in Cape Town occur at dusk/dawn/night
It is not clear from the evidence whether crashes occurred as a result of driver errors or poor vehicle condition or road layout. An increase in lighting is shown to reduce crash numbers (see section 5). Roadside objects are not crash protective
Vehicle factors – Tyres
Survey data since 2003 does not differentiate between categories of crashes.
- 21.3% of vehicles surveyed had defective tyres, approx. 2.5% of all fatal crashes were as a result of tyre bursts
- the contribution to crashes as a result of vehicle defects is reported to be between 3-5% worldwide
Brakes Roadworthyness Survey data indicates that a large
proportion of vehicles tested in random are not roadworthy and thus vehicular factors could be the cause of a greater number of crashes.
- if all cars in the European Union were designed to be equal in standard to the best car available in each class, an estimated 50% of all fatal and disabling injuries could be prevented.
- about 5% of all fatal crashes in 2006 were as a result of vehicular factors -76.7% of all fatal crashes reported in 2003 in Cape Town occur at dusk/dawn/night
Inadequate visibility
- About 7% of all fatal crashes due to poor visibility nationally and for
-Daytime running lights for cars, though not required in many
The figures do not account for hit-and-run type crashes which may well
- 100 -
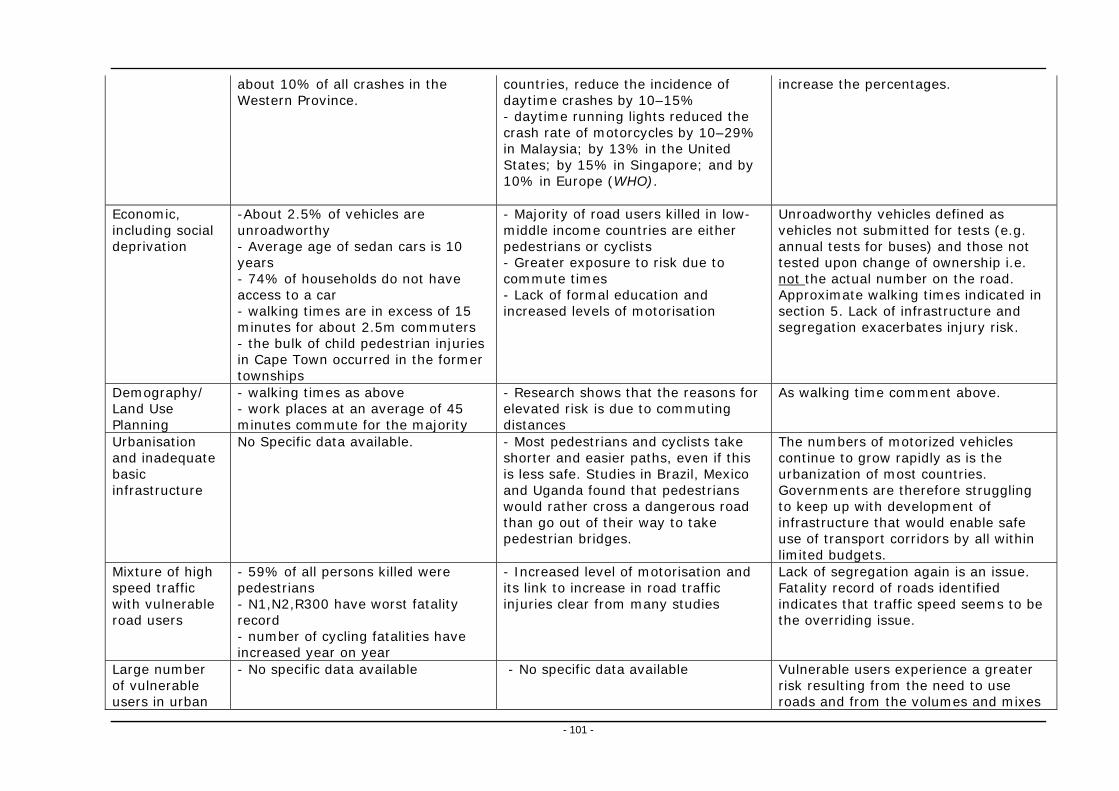
about 10% of all crashes in the Western Province.
countries, reduce the incidence of daytime crashes by 10–15%
increase the percentages.
- daytime running lights reduced the crash rate of motorcycles by 10–29% in Malaysia; by 13% in the United States; by 15% in Singapore; and by 10% in Europe (WHO).
Economic, including social deprivation
-About 2.5% of vehicles are unroadworthy
- Majority of road users killed in low-middle income countries are either pedestrians or cyclists
Unroadworthy vehicles defined as vehicles not submitted for tests (e.g. annual tests for buses) and those not tested upon change of ownership i.e. not
- Average age of sedan cars is 10 years - Greater exposure to risk due to
commute times - 74% of households do not have access to a car
the actual number on the road. Approximate walking times indicated in section 5. Lack of infrastructure and segregation exacerbates injury risk.
- Lack of formal education and increased levels of motorisation - walking times are in excess of 15
minutes for about 2.5m commuters - the bulk of child pedestrian injuries in Cape Town occurred in the former townships
Demography/ Land Use Planning
- walking times as above - Research shows that the reasons for elevated risk is due to commuting distances
As walking time comment above. - work places at an average of 45 minutes commute for the majority
Urbanisation and inadequate basic infrastructure
No Specific data available. - Most pedestrians and cyclists take shorter and easier paths, even if this is less safe. Studies in Brazil, Mexico and Uganda found that pedestrians would rather cross a dangerous road than go out of their way to take pedestrian bridges.
The numbers of motorized vehicles continue to grow rapidly as is the urbanization of most countries. Governments are therefore struggling to keep up with development of infrastructure that would enable safe use of transport corridors by all within limited budgets.
Mixture of high speed traffic with vulnerable road users
- 59% of all persons killed were pedestrians
- Increased level of motorisation and its link to increase in road traffic injuries clear from many studies
Lack of segregation again is an issue. Fatality record of roads identified indicates that traffic speed seems to be the overriding issue.
- N1,N2,R300 have worst fatality record - number of cycling fatalities have increased year on year
Large number of vulnerable users in urban
- No specific data available - No specific data available Vulnerable users experience a greater risk resulting from the need to use roads and from the volumes and mixes
- 101 -

areas of traffic on the roads. Without new safety measures, all road users may be exposed to ever greater risk as the volumes of traffic increase, especially when different types of motor vehicle, some travelling at high speeds, share roads with each other and with pedestrians and cyclists.
Alternative modes of transport
- 6% of all Provincial vehicular crashes involved minibus taxis and 1% involved buses.
- A European study found that, compared with a person in a car, a person on a motorized two-wheeler is 20 times more likely to be killed for each kilometre travelled; a person on foot 9 times more likely; and a person on a bicycle 8 times more likely. A person in a car, however, is 10 times more likely to be killed than a
Of the 4 main modes of travel – road, rail, air and marine, travel by road is the most dangerous. Strategies to encourage safer modes of travel as well as reduction of travel by road would help mitigate the risk of road traffic crashes.
- Nationally, 3.85 million workers use public transport, of these 64% use taxis, 33% use buses and 15% use a train _ The number of fatalities per 100 million vehicle kilometres travelled by buses was the largest of all road going modes of transport at
passenger in a bus or coach and 20 times more likely to be killed than a passenger in a train. (WHO 2004)
Roadside objects not crash protective
No Specific data available - According to research in Australia and several European Union countries, collisions between vehicles and solid roadside objects contribute to 18–42% of
Design of roadside objects such as collapsible lighting columns and signs as well as safety barriers which are designed to contain motor vehicles would reduce the risk of injury as a result of crashes with roadside objects. all fatal crashes (WHO 2004)
Insufficient vehicle crash protection for occupants, pedestrians or cyclists
No specific data available. - A study found that occupants in cars manufactured before 1984 have about 3
Safety of vehicles moving towards a common international standard, but implementation in lower income countries not happening due to lack of roadworthy tests.
times the risk of crash injury of occupants of recently manufactured cars. Lower-limb trauma is the most common
type of pedestrian injury, and head trauma is the most common cause of death. Tests show that, in general, new cars do not protect pedestrians
- A UK study shows that improving vehicles could result in a 15.4% reduction in the number of fatal or serious injuries
- 102 -

Prevention strategies South Africa is different from many other developing countries in that a sophisticated First-World infrastructure exists alongside underdeveloped poor communities in the urban centres and particularly on the urban periphery. Yet many of the specific challenges are not unique. This section briefly describes some of the strategies that are being planned and implemented by local prevention and enforcement agencies, alongside some of the international best-practice examples. 1. Current national and local safety strategies
The Road to Safety 2001- 2005 1.1.
The “Road to Safety’ strategy was launched in November 2001 to try to reduce crashes, deaths and injuries on South Africa’s roads by 5% year-on-year until the year 2005. The strategy encompassed a plan of action, and identified key deliverables, which should have ensured timeous delivery on the commitments made. Four areas for action were defined:
i. Traffic law enforcement and compliance;
ii. Operator, vehicle and driver fitness;
iii. Infrastructure, management and information systems; and
iv. Communication, public education and participation.
Nine project teams were identified to ensure that the Road to Safety Strategy is implemented, including Arrive Alive, Driver Fitness, Vehicle Safety, Pedestrian Safety, Fraud and Corruption. With the exception of Arrive Alive and the NaTIS system, however, it is not clear which of these teams still exist. It is also clearly not possible to assess the impact that these teams had on the objectives identified.
The National Road Safety Strategy 2006 - 1.2.
The document was subsequently replaced with one entitled, “National Road Safety Strategy, 2006 onwards”, and led further to the “Road to Safety Strategy”, which covers the period 2006-2009. This last strategy document focuses on clusters of projects and on service delivery through the implementation of the principles of “Batho Pele” across all spheres of Transport. The following areas of delivery have been identified:
Public transport infrastructure and operations for 2010 and beyond; Public Transport (minibus-taxi recapitalisation and the re-structuring
of passenger rail); Freight (including the introduction of an Independent Port
authority);
104

Roads (Network integration and Expanded Public Works Programme); and
Transport Regulation (Establishing RTMC, vehicle licensing and testing).
Some of the strategic objectives expressed in this document are:
“co-ordinating several interventions to curb the number of road accidents through [a] focus on intensified and integrated traffic law enforcement, road safety and communication programmes;” and
“releasing a new road safety strategy, which is integrated, and [which] prioritises interventions aimed at reducing the carnage on our roads, including incentives and disincentives to improve driver behaviour, and [which aims to] reduce drunken driving and pedestrian fatalities”
1.3 National Road Safety Initiatives The Minister of Transport has indicated that the following are imperatives to achieving the goal of Road Safety (Arrive Alive):
The reinforcement of the Road to Safety Strategy imperatives;
The implementation of the Administrative Adjudication of Road Traffic Offences (AARTO) Act, and its system of demerit points, improved fine collection, parity of fines and easier fine payments;
A completed tender for a feasibility study into periodic vehicle testing, which should be implemented during 2007;
Discussions with organised labour and industry regarding more appropriate and realistic driving hours;
Improved enforcement through the co-ordination bodies of the Road Traffic Management Corporation, and an increased number of officers being trained and deployed throughout the country, and;
The Taxi Recapitalisation Program, taking out the oldest and least roadworthy of the fleet, and replacing them with new vehicles with set safety standards.
1.4 Preparations for 2010
An operational and resource plan for all aspects of the 2010 FIFA World Cup has also been completed. 1.5 Demerit system The Demerit System was signed into law in September 1998 as part of the Administrative Adjudication of Road Traffic Offences (AARTO) Act, Act 46 of 1998. This system, based on similar systems in Australia and the United Kingdom, has been adapted to meet local needs. Its implementation has been delayed pending a pilot study in Tshwane in 2007 (Arrive Alive). At the time of writing, the confiscation of vehicles succeeded in raising intense public interest and may well have served already to modify the behaviour of some drivers.
105
1.6 Confiscation of the vehicles of drunk drivers Following a recent ruling by the Cape High Court, the Asset Forfeiture Unit has been empowered to confiscate the cars of drunken drivers and high-speed drivers by means of a Preservation of Property Order, in terms of sections of the Prevention of Organised Crime Act 121 of 1998 (Arrive Alive). The judgement was sought after a campaign to reduce the level of drunk drivers in the wake of the many deaths, as well as countrywide surveys during 2003 which revealed that, of all drivers stopped before 18h00, their breath alcohol of 2% was more than that which was then legally permissible. After 18h00, the percentage increased to five percent Yet the low probability of being caught, owing to a lack of enforcement, means that — despite the existence of stricter penalties — many drivers will still drive over the limit. 1.7 Global Road Safety Partnership The Global Road Safety Partnership (GRSP) South Africa National Committee was established in July 2000. Partners in or collaborating within GRSP South Africa are: Automobile Association of SA, Arrive Alive, Drive Alive (NGO), 3M, BP SA, Daimler Chrysler SA, CSIR and provincial Departments. The Partnership’s aim and mission is to bring together government and civil society to address road safety issues in low to middle income countries. They do this through a series of coordinated and identified projects, either physical or education and awareness programmes. 1.8 Road Traffic Management Corporation (RTMC)
The RTMC has been operational since 2005 and has been tasked by the Department of Transport with compiling and researching crash statistics in South Africa. It operates at arms' length from the Department and is charged with forming an effective partnership between national, provincial and local spheres of Government in the management of road traffic matters (Arrive Alive). Recognising the importance of the regulation of public transport and road traffic to the development, safety and quality of life of all South Africans, the purpose for which the RTMC was established is to:
Enhance the overall quality of road traffic management and service provision;
Strengthen the cooperation and coordination between the national, provincial and local spheres of government in the management of road traffic;
Maximize the effectiveness of provincial and local government efforts, particularly in road traffic law enforcement;
Create business opportunities, particularly for the previously disadvantaged sectors, to supplement public sector capacity;
Guide and sustain the expansion of private sector investment in road traffic management.
106

The treasury said government was amending the National Land Transport Transition Act to enable municipalities to take full control of taxi ranks and allow them to decide on which routes taxis and buses could operate.
Although most taxi ranks in the country are owned by municipalities, the taxi industry has taken full control of them, effectively rendering municipalities powerless to intervene. The proposed changes to the legislation forms part of a broader government strategy to integrate the taxi industry into the formal public transport system.
(Source: Business Day 22/02/07)
The overriding aim of the RTMC is to overcome the current fragmentation of traffic management functions across provincial and local jurisdictions, and to bring a new professional coherence and improved morale into the entire system. 1.9 Provincial Initiatives (including the Western Cape Province) Several provinces have already planned extensively towards addressing Road Safety and the 2010 World Cup contained in the Road to Safety Strategic Plan. These are the stated aims of the strategies which include:
improving tourist safety; planning and coordinating the implementation of road safety
programmes by all agencies in the provinces on provincial, metropolitan, district and local authority levels;
clamping down on unroadworthy public and private vehicles, unfit drivers, speeding in excess of speed limits, drivers and pedestrians under the influence, offenders disobeying the rules of the road and those with a disregard for the payment of traffic fines;
significant increases in visible policing, road blocks and road side check points;
an increased focus on traffic education, combining government’s traffic education programmes with private sector initiatives to enhance safe schools, junior and adult pedestrian education and driver education;
increased overload control to protect road infrastructure; addressing the capacity of traffic law enforcement to enforce the law, to
restore the road discipline and change the behaviour of road users to acceptable levels;
acquisition and application of intelligent traffic management technology and equipment to enhance the effectiveness and productivity of traffic management; This should include speed governors (intelligent speed adaptation) and breathalyser immobilisers .
improved crash information and traffic management systems; evaluation of traffic management programmes and operations to ensure
continuous improvement and sharing of learning amongst all traffic agencies at different levels of government and geographically;
supporting the National Minister of Transport’s programmes to improve road safety through sustainable and effective co-operation between all spheres of government and in partnership with the private sector.
107

2. International Best Practice The risk factor analysis indicates that most road systems are highly complex and hazardous to human health. The various elements of the system include motor vehicles, roads and road users and their physical, social and economic environments. Making such a system less hazardous therefore requires a systems approach – understanding the system as a whole and the interaction between elements and identifying where there are hazards and thus potential interventions. Particularly it means recognising that humans make mistakes (the designers and users) and that the users are vulnerable to injury (WHO 2004). International practices therefore assess both upstream and downstream factors and appropriate interventions are designed to tackle both factors, usually in combination as it is the interaction of these that seems to deliver the required benefits. Examples of some international practices using this type of systems approach and suggested guidelines that could be incorporated within an intervention strategy for the Province follow along with a summary of recommendations from the WHO’s ‘World Report on Road Traffic Injury Prevention’. Sweden Box 1 outlines Sweden’s “Vision” Zero policy. It is so called because its aim is no fatalities or severe injuries due to road traffic crashes. Public health is its underlying premise and it has a road safety policy that puts the most vulnerable users at its centre. It should be noted that the Swedes view Vision Zero as relevant to any country. The Swedish tolerances constitute a very important reason for much more stringent speed limits. The same philosophy can be applied in South Africa in that the “providers and enforcers of the road transport system are responsible to citizens and must guarantee their safety in the long term” (Adv Hoffman personal communication).
108

Vision Zero
Vision Zero is a traffic safety policy, developed in Sweden in the late 1990s and based on four elements: ethics, responsibility, a philosophy of safety, and creating mechanisms for change. The Swedish parliament voted in October 1997 to adopt this policy and since then several other countries have followed suit. Ethics Human life and health are paramount. According to Vision Zero, life and health should not be allowed in the long run to be traded off against the benefits of the road transport system, such as mobility. Mobility and accessibility are therefore functions of the inherent safety of the system, not vice versa as it is generally today. Responsibility Until recently, responsibility for crashes and injuries was placed principally on the individual road user. In Vision Zero, responsibility is shared between the providers of the system and the road users. The system designers and enforcers – such as those providing the road infrastructure, the car-making industry and the police – are responsible for the functioning of the system. At the same time, the road user is responsible for following basic rules, such as obeying speed limits and not driving while under the influence of alcohol. If the road users fail to follow such rules, the responsibility falls on the system designers to redesign the system, including rules and regulations. Safety philosophy In the past, the approach to road safety was generally to put the onus on the road user. In Vision Zero, this is replaced by an outlook that has been used with success in other fields. Its two premises are that: human beings make errors; there is a critical limit beyond which survival and recovery from an injury are not possible. It is clear that a system that combines human beings with fast-moving, heavy machines will be very unstable. It is sufficient for a driver of a vehicle to lose control for just a fraction of a second for a human tragedy to occur. The road transport system should therefore be able to take account of human failings and absorb errors in such a way as to avoid deaths and serious injuries. Crashes and even minor injuries, on the other hand, need to be accepted. The important point is that the chain of events that leads to a death or disability must be broken, and in a way that is sustainable, so that over the longer time period loss of health is eliminated. The limiting factor of this system is the human tolerance to mechanical force.
(Reproduced from WHO Report 2004)
109
The chain of events leading to a death or serious injury can be broken at any point. However, the inherent safety of the system – and that of the road user – is determined by people not being exposed to forces that go beyond human tolerance. The components of the road transport system – including road infrastructure, vehicles and systems of restraint – must therefore be designed in such a way that they are linked to each other. The amount of energy in the system must be kept below critical limits by ensuring that speed is restricted. Driving mechanisms for change To change the system involves following the first three elements of the policy. While society as a whole benefits from a safe road transport system in economic terms, Vision Zero relates to the citizen as an individual and his or her right to survive in a complex system. It is therefore the demand from the citizen for survival and health that is the main driving force. In Vision Zero, the providers and enforcers of the road transport system are responsible to citizens and must guarantee their safety in the long term. In so doing, they are necessarily required to cooperate with each other, for simply looking after their own individual components will not produce a safe system. At the same time, the road user has an obligation to comply with the basic rules of road safety. In Sweden, the main measures undertaken to date include:
setting safety performance goals for various parts of the road traffic system;
a focus on vehicle crash protection, and support for the consumer information programme of the European New Car Assessment Programme (EuroNCAP);
securing higher levels of seat-belt use and fitting smart, audible seat-belt reminders in new cars;
installing crash-protective central barriers on single-carriageway rural roads;
encouraging local authorities to implement 30 km/h zones;
wider use of speed camera technology;
an increase in the number of random breath tests;
the promotion of safety as a competitive variable in road transport contracts.
While the Vision Zero does not say that the ambitions on road safety historically have been wrong, the actions that would have to be taken are partly different. The main differences probably can be found within how safety is being promoted; there are also some innovations that will come out as a result of the vision, especially in infrastructure and speed management. A tool for all Vision Zero is relevant to any country that aims to create a sustainable road transport system, and not just for the excessively ambitious or wealthy ones. Its basic principles can be applied to any type of road transport system, at any stage of development. Adopting Vision Zero means avoiding the usual costly process of trial and error, and using from the start a proven and effective method.
110

South America The experience in Bogota (see Box below) shows the utility of routinely collected information to monitor and apply interventions such as the implementation of mass transport systems.
Reducing traffic fatalities in Bogotá, Colombia
Over an eight-year period from 1995 to 2002, the Colombian capital, Bogotá, with a population of seven million, implemented a range of policies to reduce fatal and non-fatal injuries from external causes. As a result, the number of traffic-related deaths fell over the period by almost a half – from 1387 in 1995 to 697 in 2002.
The first measure was to set up a unified data system on violence and crime, designed by the Institute of Forensic Medicine and Science to gather data on deaths from violence, and in particular from traffic crashes. Using the statistics on road traffic crashes in Bogotá, the interagency Committee for Epidemiological Surveillance of Injuries from External Causes then produced a set of public policies aimed at reducing the number of crashes, improving mobility around the city and increasing the safety of road users.
Improving the performance and image of traffic police
The following year, 2000 traffic police who had failed to enforce traffic regulations and, in many cases, were guilty of corruption were replaced. Responsibility for regulating traffic and enforcing rules was transferred to the Metropolitan Police, which assigned more than 1000 officers and 500 auxiliaries to traffic duties. This police force now has a positive public image and concentrates exclusively on enforcing traffic discipline. Officers found acting corruptly are dismissed.
Since 1996, spot checks have been carried out for drunken driving. Drivers failing the test have their vehicles
impounded and are fined around US$ 150. The media are closely involved with these checks, conducted on weekends at crash black spots. Speed cameras have also been set up on the city’s main roads.
In 1998, the Colombian National University was commissioned to carry out research into traffic crashes. Based on their findings, further decisions to increase road safety were taken, including the construction of highways, pavements and pedestrian bridges. The study also identified individual behaviour that increased the risk of traffic injuries, and from this drew up civic education programmes on traffic safety.
111
Attempts to change behaviour
One of these programmes, launched by the city’s mayor, was aimed at changing people’s behaviour on the roads. Measures promoted included the wearing of safety belts and observing pedestrian crossings. While the Highway Code already included these rules and people were generally aware of them, most people had failed to observe them and the authorities had generally failed to enforce them. In the programme, mime was used on numerous sites throughout Bogotá. The mime actors working for the programme used sign language to point out to drivers that they were not wearing seat-belts, or that they had failed to give way at pedestrian crossings. At first, drivers were simply warned and told to change their behaviour. If this failed, a traffic policeman stepped in and handed out a fine, to the applause of onlookers. Nowadays, over 95% of drivers have been found to observe these rules.
Converting space into pedestrian areas
Since 1996, radical steps have been taken to win back areas from street traders and seasonal vendors. Large public spaces that had been taken over by vendors or vehicles have been converted into pedestrian areas, with new pavements and pedestrian bridges constructed. In addition to the traffic police, the administration employs some 500 guides in its Bogotá Mission programme – young people trained in traffic regulations, first aid, preventive safety measures and the detailed layout of the city. Their task is to encourage safe behaviour on public roads.
Mass transport system A new mass transport system, known as the TransMilenio, has not only improved urban transport and mobility, but has also reduced the number of traffic injuries along its routes, with the construction of infrastructure to ensure the safety of pedestrians and other road users. Surrounding areas have also been improved with better lighting and other equipment to make the system safer, more user-friendly and more efficient.
(Reproduced from WHO Report, 2004)
112
Victoria, Australia “The Australian state of Victoria has developed a strong partnership between traffic law enforcement and traffic injury compensation schemes, underpinned by the use of research to provide evidence for new policies and practices. “A series of controlled enforcement and education programmes was undertaken, each subject to scientific evaluation. An example is Victoria’s approach to the enforcement of speed limits using speed cameras. In most other places, speed cameras are generally sited at crash “black spots”, with signs and other overt signals maximizing the focus on the specific site. In Victoria, the objective, at least in urban areas, is to cover the whole road network. The strategy is thus covert and random – and, to the motorist, unpredictable. The link here between research and road safety policy-making is strong – making the intervention more effective. Since the potential benefits of the programme are scientifically researched and publicized, there is public support for the programme. This support may not otherwise have been forthcoming, as the seemingly draconian levels of enforcement might have led to public opposition. “The Victorian model has been adapted and implemented in KwaZulu-Natal province – an example of a successful transfer of technology from a high-income country.” (WHO 2004). International Road Safety Association A World Road Safety Experts meeting in Apeldoorn in the Netherlands in May 2006 agreed on the following principles of road safety5: “To provide the correct environment by ensuring:
“Governments (national and local) strategy involving all departments (health, education, justice, transport etc.);
“Budget to be spent proportionately on education, enforcement, engineering and emergency care with each area open to evaluation and validation;
“Build and improve roads and infrastructure suitable for all road users;
“Understand the causes of collisions; “Coordinate the work of all agencies (licensing, regulating,
enforcement, education, etc.). “To develop proper educational road safety programs for:
- “The public, the schools, in the home, on the road and at work focused on better behavior;
- “All agencies concerned with road safety training (include rescue, justice and education).
International Road Safety Association, New Road to Saving Lives, 5
Strategic Plan 2006-2008.
113

“To empower all stakeholders concerned to deliver road safety outcomes.
“To be sensitive and to ensure careful attention to the issues of: o “Developing acceptable standards; o “Make regular monitoring processes; o “Integrate solutions with poverty relief, health issues and
family life; Recognising diversity, cultural differences, local customs and beliefs,
behavior, operating procedures and training; o Find and encourage local champions; o That any effort be open and flexible (Asian model).
To collect, disseminate and use DATA which will meet minimum international standards, taking into consideration local needs.
WHO Recommendations The following 6-step action plan is recommended by WHO in their report to governments. They advise that recommendations should be addressed across a wide range of sectors and disciplines if they are to achieve success. 1. Identify a lead agency in government to guide the national road safety
effort. 2. Assess the problem, policies and institutional settings relating to road
traffic injury and the capacity for road traffic injury prevention. 3. Prepare a national road safety strategy and plan of action. 4. Allocate adequate and appropriate financial and human resources to
address the problem. 5. Implement specific actions to prevent road traffic crashes, minimise
injuries and their consequences and evaluate the impact of these actions.
6. Support the development of national capacity and international cooperation.
Many of the above-mentioned broad strategic actions have been addressed by the Department of Transport: Item 1 has been addressed via the formation of the RTMC and, it is understood to a limited extent the RTMC is also charged with addressing Item 2 as some of their functions have not been fully handed over by the Department of Transport and Provinces have the ability to set local policies in regard to road safety. This needs fully unpacking and expansion with a provincial focus. Item 3 has been addressed by the DoT via the formulation of their Road Safety Strategy. Items 4&6 are beyond the scope of this report and item 5 is being addressed albeit at a Provincial level in this report.
114

Additionally, the Western Cape has planned safety strategies in the ‘Road Safety and the 2010 World Cup’ listed in section 7. However, details of the actual extent and impact of these interventions is not known. Therefore a more thorough and rigorous analysis of the current practices would be beneficial in the recommendation of appropriate interventions. Accurate data capture for mortality, morbidity and crashes as well as accurate spatial information is clearly at the centre of this action. Detailed research on the level of reporting of traffic crashes and its accuracy as well as the possibility of standardising data capture with internationally recognised and used norms would be required to ensure data integrity.
115

Recommended specific interventions
In reviewing the various risk factors and strategies that are being implemented, the Injury Prevention working group has devised the following list of interventions that may be applicable in the Western Cape (Table 4).
116

Table 4: Risk Factors, Summary of issues and Intervention Analysis for Western Cape Risk Factor Summary of Issues Possible Traffic Interventions Assessment of Assessm
Feasibility of ent of Intervention in WC Priority
(High/Med/Low)
Biological Factors 1.Medium 1.Good 1.Graduated drivers license system. Being a young male Worldwide evidence shows that young
drivers and motorcyclists present a greater traffic risk.
2.Medium 2.Improved licensing system geared to health and behavioural problems based on examinations/tests.
2.Good 3. Medium 3. Good
26% of all drivers involved in crashes were between 26-35 years old. 3.Public information and awareness
campaign. Poor road user eyesight Insufficient analysis and data. 1.Bi-annual re-tests for drivers over
70. 1.Good 1.Medium
Behavioural Factors 1.High 1.Good 1.Speed management systems at
‘black spots’. Inappropriate or excessive speed
Majority of pedestrian injuries are on freeways indicating a speed problem. 2.High 2.Good
3.High 2.Speed law enforcement programmes. random
3.Good Probability of death increases with speed. 4. Poor 4. Poor (dependency
on imports and requires Sat. Nav. mapping of all areas)
3.Better pedestrian infrastructure. 4. Smart vehicle design Intelligent speed adaptation)
1.High Alcohol Alcohol consumption increases the likelihood of a crash occurring, as well as the likelihood that death or serious injury will occur.
1.Law enforcement programmes. (including random testing)
1.Good 2.High 2.Good 3.Medium 3.Good (experiment in
place) 2.Public information, Education and awareness programmes. 4.Medium
5. Poor 4.Good 3.Demerit system. Around 4% of all drivers tested at above the recommended BAC. 5. Poor (dependency 4.Confiscation programme
117

5. Smart vehicle design (Alcohol ignition systems)
on imports)
1.High 1.Good Medicinal or recreational drugs
Similar impact to alcohol. 1.Public information, Education and awareness programmes. 2.Medium 2.Good
3.Medium 3.Good 2.Demerit system. 3.Confiscation programme
1.Good 1.High Fatigue Clear correlation between fatigue and crashes.
1.Public information, Education and awareness programmes. 2. Good 2. High 2. Subject to random checking
1.Good 1.High 1.Law enforcement programmes. Cell phones Up to 8 fatalities per annum as a result of driving whilst using a cell phone. What is the source of these data?
2.Good 2.High 2.Public information and awareness campaign.
1.High 1.Good 1.Law enforcement programmes. Seat-belts and child restraints not used
Offence rates reported as: 17% of drivers, 36% of front passengers and 97% of rear passengers do not wear seat belts.
2.High 2.Good 2.Annual vehicle tests. 3.High 3.Good 3.Public information, education and
awareness campaigns. 1.Good 1.High 1.Law enforcement programmes. Crash helmets not worn by
users of two-wheeled vehicles
Studies have found that non-wearing of crash helmets can lead to up to 3 times as many head injuries in riders.
2.Good 2.High 2.Public information, education and awareness campaigns.
1. High 1. Good Aggressive driving behaviour/ risk taking by all road users
Worldwide evidence shows that young drivers and motorcyclists present a greater traffic risk. Thrill seeking and over confidence rated high amongst contributory factors towards risk of crashes.
1. Law enforcement programmes. 2. High 2. Good 2. Graduated driving license system 3. High 3. Good 3. Public awareness programme
Societal Factors
Socio-cultural factors: role Media currently thought to glamorise fast 1. Educational programmes to create 1. Good 1. High
118
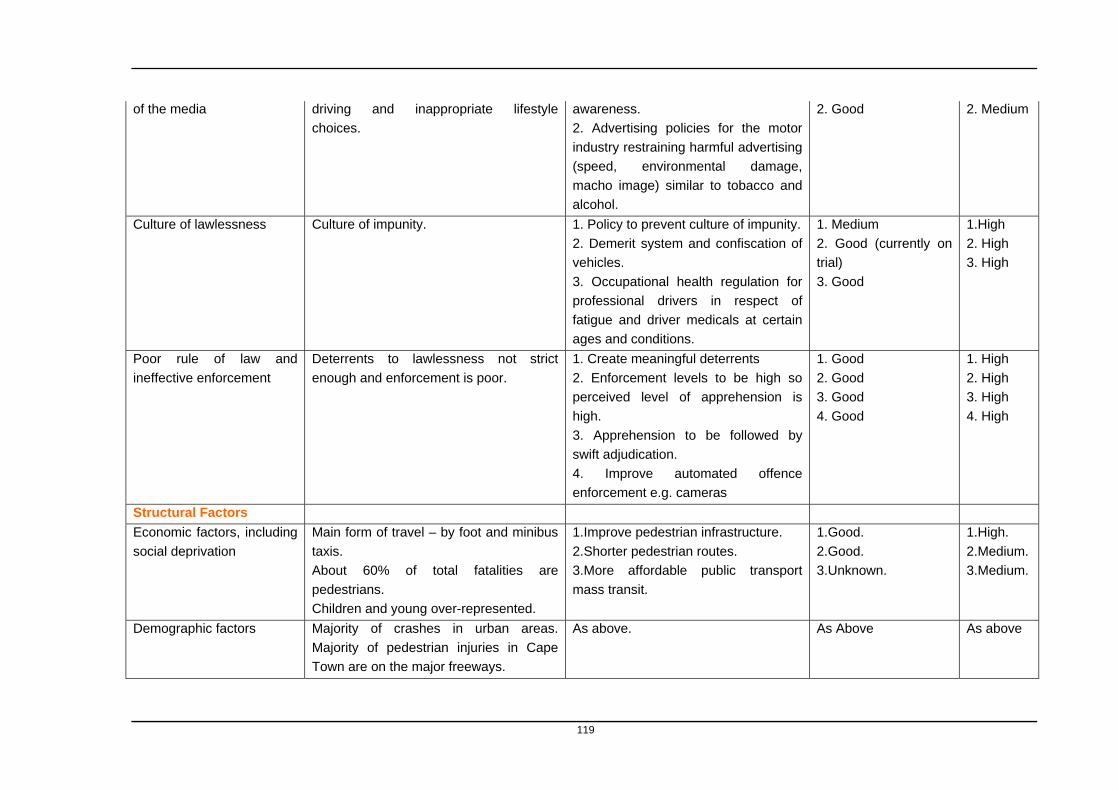
2. Good 2. Medium of the media driving and inappropriate lifestyle choices.
awareness. 2. Advertising policies for the motor industry restraining harmful advertising (speed, environmental damage, macho image) similar to tobacco and alcohol.
1.High 1. Medium Culture of lawlessness Culture of impunity. 1. Policy to prevent culture of impunity. 2. High 2. Good (currently on
trial) 2. Demerit system and confiscation of vehicles. 3. High
3. Good 3. Occupational health regulation for professional drivers in respect of fatigue and driver medicals at certain ages and conditions.
1. High 1. Good Poor rule of law and ineffective enforcement
Deterrents to lawlessness not strict enough and enforcement is poor.
1. Create meaningful deterrents 2. High 2. Good 2. Enforcement levels to be high so
perceived level of apprehension is high.
3. High 3. Good 4. High 4. Good
3. Apprehension to be followed by swift adjudication. 4. Improve automated offence enforcement e.g. cameras
Structural Factors 1.High. 1.Good. 1.Improve pedestrian infrastructure. Economic factors, including
social deprivation Main form of travel – by foot and minibus taxis. 2.Medium. 2.Good. 2.Shorter pedestrian routes.
3.Medium. 3.Unknown. About 60% of total fatalities are pedestrians.
3.More affordable public transport mass transit.
Children and young over-represented. As above. As Above As above Demographic factors Majority of crashes in urban areas.
Majority of pedestrian injuries in Cape Town are on the major freeways.
119

Land use planning practices
Location of centres of employment at large distances from centres of population leading to increased mobility.
As above. As Above As Above
1.High 1.Good Mixture of high-speed motorized traffic with vulnerable road users
Infrastructure inadequate and unsafe (almost no lighting)
1.Independent safety audits. 2.High 2.Medium 2.Segregation of users. 3.High 3.Education and awareness
campaigns. 3.Good
4.High 4.Good 4.Better crash protection measures
1.Good 1.High Insufficient attention to integration of road function with decisions about speed limits, road layout and design
Infrastructure designed without appropriate independent safety audits.
1.Independent road safety audits. 2.Good 2.High 2.Traffic calming and management
measures. 76.7 of all crashes occur between dusk and dawn.
1.Meidum 1.Increase affordability of public transport.
1.Medium (costs) Opportunities for safer modes of travel
Lack of integrated public transport system and choice. 2.High 2. Good (Metro-Rail
have new mass transit plan)
3. High 2. Increase safety and perception of alternative transport.
Minibuses constitute 3.2% of the vehicle population but are involved in 7% of all crashes. 3.Good (taxi recap
process to rid unroadworthy taxis)
3.Ensure vehicle safety and operation standards are maintained.
Travelling in darkness 76.7% of all crashes occur between dusk and dawn.
1.Improved transport infrastructure. 1.Good 1.High
1.High 1.Segregated pedestrian and motorised transport system.
1.Poor (costs) Vehicles not designed to be pedestrian friendly, sharing of space with motorised traffic, lack of segregation.
Being a vulnerable road user (e.g. pedestrian) in urban and residential areas
2.High 2.Poor (costs) 3.High 3.Good 2.Better crash protection measures.
3.Public information, education and awareness campaigns.
1.High Vehicle factors – such as braking, handling and maintenance
High offence rates relating to roadworthyness of vehicles resulting in injury and fatalities.
1.Regular vehicle testing for roadworthyness. Increased testing for public service vehicles.
1.Good 2. Poor 2. Poor (dependency
on imports)
120

2. Smart vehicle design (electronic stability)
1.Good 1.High 1.Independent road safety audits at various stages of the design and planning.
Defects in road design, layout and maintenance which can also lead to unsafe road user behaviour
Lack of independent road safety audits to help optimise the safety of the whole road network.
2. Good 2. High
2. Remedial actions at crash black-spots.
More than 2% of fatalities in 2006 were attributed to poor road conditions and design (RTMC).
Inadequate visibility due to environmental factors
Lack of maintenance of roadside features.
1.Improved regular road side maintenance measures. (Possibly from safety audits)
1.Good 1.Medium
1.High 1.Good 1.Speed management systems at ‘black spots’.
Inappropriate or excessive speed
More than 30% of fatalities occurred countrywide as a result of a vehicle speeding.
2.High 2.Good 3.High 2.Speed law enforcement
programmes. 3.Good
3.Better pedestrian infrastructure 1.High 1.Good 1.Independent road safety analysis. Roadside objects not crash
protective Collisions between drivers and roadside objects cause significant numbers of injuries and fatalities.
2.High 2.Provision of improved infrastructure as a result of audits e.g. collapsible road furniture, safety barriers to contain, crash cushions at bridges etc.
2.Good 3.High 3.Good
3.Regular road maintenance programmes to clear debris, trees etc.
1. Medium 1. Poor (dependency on overseas market)
1. Implement improved vehicle design standards
Vehicles not crashworthy, ageing fleet, lack of regular testing, visibility of vehicles, design of vehicles to reduce impact on other road users.
Insufficient vehicle crash protection for occupants, pedestrians, cyclists
2. High 3. High 2. Good 2. Regular roadworthy testing regime 4. Medium 3. Good 3. Daytime running lights for all
vehicles 4. Poor (as 1 above) 4. Modify vehicle fronts to protect vulnerable road users.
121

Conclusion
From the above, it seems clear that there are a range of strategies and initiatives in place, both at a Provincial and National level, which aim to increase road traffic safety and reduce the BoD. What is not clear is the extent to which these strategies have been implemented or, if they have, how successful they have been. Hence there is a need for the strategies to be underpinned by a rigorous information system to monitor and evaluate key process, output and outcome indicators. This should include cost benefit analyses and the constant monitoring and evaluation of this balance. It is also clear that these processes should also comprise an integrated multi-disciplinary team that is independent of implementing agencies in order to ensure an unbiased and optimum adherence to best practices for safety promotion and injury prevention. Studies to assess the effectiveness of interventions which are process related such as the behavioural impact of changes in vehicle technology, worldwide experience of education, better enforcement etc. should be undertaken along with analysis of pre-crash conditions. Integration of the Engineering and Health Care professions are seen as key to these aspects.
122

References
Department of Transport, 2006, National Road Safety Strategy: 2006
onwards, Traffic Offence rates. Peden, M, Scurfield, R, Sleet, D, et al (eds.) 2004, World report on road
traffic injury prevention, WHO, Geneva. Road Traffic Management Corporation, January 2007, Interim Road Traffic
and Fatal Crash Report 2006. Department of Transport, South Africa, Arrive Alive web site,
www.arrivealive.co.za, Road Safety in South Africa, accessed January 2007.
City of Cape Town, 2003, Traffic Accident Statistics 2003. Fatal Road Crashes, contributory factors and the level of lawlessness,
Gerrie Botha and Hannes van der Walt. Proceedings of the 25th Southern African Transport Conference 2006.
Department of Transport, 2006, Road to Safety Strategic Plan 2006-2009. CSIR, 2004, The estimation of unit costs of road traffic accidents in South
Africa, Estimate of traffic Injury costs, National Department of Transport.
Norman, R, Matzopoulos, R, Groenewald, P & Bradshaw, D in press, ‘The high burden of injuries in South Africa’, WHO Bulletin..
Bradshaw, D, Nannan, N, Laubscher, R, Groenewald, P, Joubert, J, Nojilana, B, Pieterse, D & Schneider M 2004, South African National Burden of Disease Study 2000: estimates of provincial mortality, Medical Research Council, Cape Town.
Matzopoulos, R (ed.) 2005. A profile of fatal injuries in South Africa: 6th annual report of the National Injury Mortality Surveillance System, 2004, Crime, Violence and Injury Lead Programme, Medical Research Council/University of South Africa, Cape Town.
Bradshaw, D, Nannan, N, Laubscher, R, Groenewald, P, Joubert, J, Nojilana, B, Pieterse, D & Schneider M 2004, South African National Burden of Disease Study 2000: estimates of provincial mortality, Medical Research Council, Cape Town.
Prinsloo, M 2004, ‘Cape Town’, in RG Matzopoulos (ed.), A profile of fatal injuries in South Africa 2003: fifth annual report of the National Injury Mortality Surveillance System (NIMSS), Medical Research Council and University of South Africa Crime, Violence and Injury Lead Programme, Cape Town.
Prinsloo, M. 2005, ‘Cape Town’, in R Matzopoulos (ed.), A profile of fatal injuries in South Africa 2003: Fifth annual report of the National Injury Mortality Surveillance System, MRC/UNISA Crime, Violence and Injury Lead Programme, Cape Town.
International Road Safety Association, 2006, New Road to Saving Lives, Strategic Plan, The Approach 2006-2008.
Burrows S, Matzopoulos R, Bradshaw D, Seedat M. Injury mortality validation study: preliminary phase situational analysis. Prepared for
123

National Department of Health, Directorate of Mental Health and Substance Abuse. Parow: Medical Research Council, April 2004.
Sukhai, A., Seedat, M., Jordaan, E. & Jackson, D. (2005). A city-level study of aggressive road behaviours: Magnitude, predictors and implications for traffic safety. South African Journal of Psychology, 35(2), 244-269.
124

Glossary
WHO – World Health Organisation
YLL - Years Life Lost
BoD - Burden of Disease
OAR - Officers Accident Report
NAR - National Accident Register
RTMC - Road Traffic Management Corporation
NaTIS - National Traffic InformationSystem
NIMSS - National Injury Mortality Surveillance System
GIS - Geographical Information System
DALY - Disability Adjusted Life Years
DoT- Department of Transport
125

APPENDIX A
MOVEMENT OF DATA FOR INJURY DEATHS ACROSS AGENCIES
126

127�
Accident Report Form (ARF)
Completed @ scene by SAPS / Traffic Official
Inquest docket
Murder docket
Culpable homicide docket
Evidence that no crime was committed
Possible murder ie, no clear evidence that it is
not a murder
Non-RTC culpable homicide
RTC deaths, ie, culpable homicide, immediate or within
6 days
Local capturing authority
Provincial capturing authority
SAPS Head Office (Crime Prevention) compiles & sends
list of fatal RTC CAS numbers (with date
& SAPS station name) on daily basis
Data captured @ station in area of injury occurrence:
CR/SAP6, if no computer CR number
CAS if computer CAS number
Arrive Alive National Fatal
Accident Information Centre
SAPS office in area of RTC occurence CAS/CR number added to ARF SAP 76 number added to ARF Original ARF stored in accident report file. Copy 1 in case docket, Copy 2 to Traffic / capturing authorities
NaTIS RTMC (Statistics
available over a year later)
SAP 76 Accident Register Occurence Book
Fatal Crash Report (FCR) Completed @ SAPS station in area of RTA occurence CAS number per RTA Sent daily via fax/phone
Injury deaths
Murder & culpable homicide cases entered into new database once/month &
frozen from this point onwards, even if they are
amended in CAS
Inquest cases remain in system
Sent to area office @ end of each month, captured electronically in Crime Management Information System(CMIS)
CAS & CMIS merged
Once finalised, murder & inquests cases are
checked for accuracy
Annual report produced
Statistics available within 24 hrs
1
7
6
8
9
3
5
Maintained at SAPS station
4
2
1
10
Movement of Injury Mortality data through Departmental, Administrative and Statistical Systems.

128�
Department of Home Affairs Page 1 ⌫ population register Page 2
Arrival on scene: SAPS Mortuary attendent Forensic pathologist for serious crimes Traffic officials for RTCs
SAP180 completed for all deaths by SAPS or mortuary attendent @ scene Post-mortem number Victim’s ID number
Medico-legal investigation of death History Crime scene investigation Post-mortem Special investigation
Medico.legal docket Post-mortem number
Death certificate Victim’s ID number
Injury death
DPPs office for prosecution in regional or high court
Inquests Court Inquest magistrate determines whether prima facie evidence of act or omission contributing to death. Three findings: 1. No, no-one else is responsible ⌫ filed 2. Yes, X is responsible 3. Yes, someone responsible but unidentified Inquests form J56
Stats SA Microfilm extracted into format similar to original Death Certificate. Cause of death coded for ICD-10
Cause of death reports
Microfilm NIMSS form completed @
selected mortuaries Captured
electronically using Epi Info 6
Post-mortem number
Epi file to local office for analysis
Local reports produced bi-annually
All files to MRC head office, Cape Town
Annual report for all participating mortuaries
12
11
1314
Movement of Injury Mortality data through the medico-legal and judiciary system
Key
1 Description of weakness or possible data loss
Area of weakness or possible data loss
Information available later than 24 hrs
Information collected within 24 hrs / before SAPS or traffic officer goes off duty
Feedback mechanism
Procedure is in transition