Ecological Risk Assessment (ERA) for Effects of Fishing
177
i R04/1072 l 29/06/2007 Ecological Risk Assessment (ERA) for Effects of Fishing REPORT FOR THE MIDWATER TRAWL SUB-FISHERY OF THE SMALL PELAGIC FISHERY Authors Ross Daley Jo Dowdney Cathy Bulman Miriana Sporcic Mike Fuller Scott Ling Alistair Hobday
Transcript of Ecological Risk Assessment (ERA) for Effects of Fishing

i
R04/1072 l 29/06/2007
Ecological Risk Assessment (ERA) for Effects of Fishing
REPORT FOR THE MIDWATER TRAWL SUB-FISHERY OF THE SMALL PELAGIC FISHERY
Authors Ross Daley Jo Dowdney Cathy Bulman Miriana Sporcic Mike Fuller Scott Ling Alistair Hobday

This work is copyright. Except as permitted under the Copyright Act 1968 (Commonwealth), no part of this publication may be reproduced by any process, electronic or otherwise, without prior written permission from either CSIRO Marine and Atmospheric Research or AFMA. Neither may information be stored electronically in any form whatsoever without such permission. This fishery ERA report should be cited as Daley, R., Dowdney, J., Bulman, C, Sporcic, M., Fuller, M., Ling, S. and Hobday, A (2007). Ecological Risk Assessment for the Effects of Fishing. Report for the midwater trawl sub-fishery of the Small Pelagic Fishery. Report for the Australian Fisheries Management Authority. Canberra, Australia. Notes to this document: This fishery ERA report document contains figures and tables with numbers that correspond to the full methodology document for the ERAEF method:
Hobday, A. J., A. Smith, H. Webb, R. Daley, S. Wayte, C. Bulman, J. Dowdney, A. Williams, M. Sporcic, J. Dambacher, M. Fuller, T. Walker. (2007) Ecological Risk Assessment for the Effects of Fishing: Methodology. Report R04/1072 for the Australian Fisheries Management Authority, Canberra
Thus, table and figure numbers within the fishery ERA report document are not sequential as not all are relevant to the fishery ERA report results. Additional details on the rationale and the background to the methods development are contained in the ERAEF Final Report:
Smith, A., A. Hobday, H. Webb, R. Daley, S. Wayte, C. Bulman, J. Dowdney, A. Williams, M. Sporcic, J. Dambacher, M. Fuller, D. Furlani, T. Walker. (2007) Ecological Risk Assessment for the Effects of Fishing: Final Report R04/1072 for the Australian Fisheries Management Authority, Canberra.

i
Executive Summary This assessment of the ecological impacts of the Small Pelagic Fishery - Midwater Trawl sub-fishery was undertaken using the ERAEF method version 9.2. ERAEF stands for “Ecological Risk Assessment for Effect of Fishing”, and was developed in a research program sponsored by CSIRO Marine and Atmospheric Research and the Australian Fisheries Management Authority. ERAEF provides a hierarchical framework for a comprehensive assessment of the ecological risks arising from fishing, with impacts assessed against five ecological components – target species; by-product and by-catch species; threatened, endangered and protected (TEP) species; habitats; and (ecological) communities. ERAEF proceeds through four stages of analysis: scoping; an expert judgement based Level 1 analysis (SICA – Scale Intensity Consequence Analysis); an empirically based Level 2 analysis (PSA – Productivity Susceptibility Analysis); and a model based Level 3 analysis. This hierarchical approach provides a cost-efficient way of screening hazards, with increasing time and attention paid only to those hazards that are not eliminated at lower levels in the analysis. Risk management responses may be identified at any level in the analysis. Application of the ERAEF methods to a fishery can be thought of as a set of screening or prioritization steps that work towards a full quantitative ecological risk assessment. At the start of the process, all components are assumed to be at high risk. Each step, or Level, potentially screens out issues that are of low concern. The Scoping stage screens out activities that do not occur in the fishery. Level 1 screens out activities that are judged to have low impact, and potentially screens out whole ecological components as well. Level 2 is a screening or prioritization process for individual species, habitats and communities at risk from direct impacts of fishing. The Level 2 methods do not provide absolute measures of risk. Instead they combine information on productivity and exposure to fishing to assess potential risk – the term used at Level 2 is risk. Because of the precautionary approach to uncertainty, there will be more false positives than false negatives at Level 2, and the list of high risk species or habitats should not be interpreted as all being at high risk from fishing. Level 2 is a screening process to identify species or habitats that require further investigation. Some of these may require only a little further investigation to identify them as a false positive; for some of them managers and industry may decide to implement a management response; others will require further analysis using Level 3 methods, which do assess absolute levels of risk. This assessment of the SPF midwater trawl sub-fishery includes the following:
• Scoping • Level 1 results for all components • Level 2 results for the three species components, and for habitats

ii
Fishery Description Gear: Midwater otter trawl Area: Queensland border south around Tasmania, to 31S along the west
coast of Western Australia, from 3-200 nm, and including waters inside 3 nm around Tasmania. Divided into 4 zones.
Depth range: 35 to ~ 357 m of bottom depth Fleet size: Two active permits, one in Zone A, one in Zone B. Effort: Search time of vessels: 1372 hours in 2005 Landings: 5000 to 12,000 tones from 2001-2005 Discard rate: very low, bycatch less than 1% Main target species: redbait (Emmelichthys nitidus) Management: No management plan, limited entry by permit Observer program: Dedicated program over the 5-year history of this sub-fishery –
Equal to best practice for sub-fishery assessed under ERAEF. Ecological Units Assessed Target species: 1 By-product and bycatch species: 16 and 2 TEP species: 218 Habitats: 24 benthic habitats in region of fishery 2 pelagic in area of current effort Communities: 8 benthic habitats in region of fishery 2 pelagic in area of current effort Level 1 Results One ecological component was eliminated at Level 1 (Habitats); there was at least one risk score of 3 – moderate – or above for the other four components. All but one hazard (fishing activities) was eliminated at Level 1 (risk scores 1 or 2). The remaining hazard was:
• Fishing (direct impacts on four ecological components) Significant external hazards included other fisheries in the region and coastal development. Impacts from fishing on all species components were assessed in more detail at Level 2. Community impacts should also be examined in future iterations; time was insufficient to complete this analysis following development of the ERAEF Level 2 community analysis. Level 2 Results Species Of the 237 species assessed at Level 2 using the PSA analysis, expert/observer over-rides were used on 95 species. A total of 26 species were found to be at high risk. Of these, 1 species had more than 3 missing attributes.

iii
The, 26 species assessed to be at high risk, included 0 target species, 0 by-product species, 0 by-catch species, and 26 TEP species. By taxa, the high risk species comprised 3 marine birds, and 23 marine mammals. Of the 26 TEP species assessed to be at high risk, 2 of the bird species that are at high risk are common in the area fished and, although there are no records of mortalities in this fishery, there are records of warp strike mortality for these species in other domestic trawl fisheries and interactions with midwater trawl fisheries. The other bird species had missing information and is potentially a false positive. The 23 marine mammals of high risk are difficult to exclude because they are most often underwater and the way they interact with the gear fishing gear is difficult to document. Captures of at least two mammal species has resulted in mortality in this fishery (Browne et al, 2005, Observer Reports). Habitats Habitats were eliminated at the end of Level 1 Communities The community component was not assessed at Level 2 for this sub-fishery, but should be considered in future assessments when the methods to do this are fully developed. Summary Only one issue emerges from the ERAEF analysis of the SPF midwater trawl fishery. This is the direct impact of fishing on two groups of TEP species; birds and marine mammals. There have been recent observations of mortality of seals and dolphins in this sub-fishery, and mitigating this risk remains a challenge for the fishery. While the populations of these marine mammals may not be at risk from this mortality, under Australian legislation, these interactions require intervention and have in some case resulted in the temporary closure of the fishery. Managing identified risks Using the results of the ecological risk assessment, the next steps for each fishery will be to consider and implement appropriate management responses to address these risks. To ensure a consistent process for responding to the ERA outcomes, AFMA has developed an Ecological Risk Management (ERM) framework.


TABLE OF CONTENTS
Executive Summary..............................................................................................................i 1. Overview...........................................................................................................................1
Ecological Risk Assessment for the Effects of Fishing (ERAEF) Framework ...........1 The Hierarchical Approach....................................................................................... 1 Conceptual Model..................................................................................................... 1 ERAEF stakeholder engagement process ................................................................. 3 Scoping ..................................................................................................................... 3 Level 1. SICA (Scale, Intensity, Consequence Analysis) ........................................ 4 Level 2. PSA (Productivity Susceptibility Analysis) ............................................... 4 Level 3 ...................................................................................................................... 5 Conclusion and final risk assessment report............................................................. 5 Subsequent risk assessment iterations for a fishery.................................................. 5
2. Results ...............................................................................................................................6 2.1 Stakeholder engagement ............................................................................................6
2.2 Scoping............................................................................................................................8 2.2.1 General Fishery Characteristics (Step 1). ........................................................ 8 2.2.2 Unit of Analysis Lists (Step 2) ...................................................................... 19 2.2.3 Identification of Objectives for Components and Sub-components (Step 3) 36 2.2.4 Hazard Identification (Step 4) ...................................................................... 43 Fishing Activity ...................................................................................................... 44 2.2.5 Bibliography (Step 5) .................................................................................... 49 2.2.6 Decision rules to move to Level 1(Step 6) .................................................... 49
2.3 Level 1 Scale, Intensity and Consequence Analysis (SICA) .................................50 2.3.1 Record the hazard identification score (absence (0) presence (1) scores) identified at step 3 in the scoping level onto the SICA Document (Step 1)........... 50 2.3.2 Score spatial scale of activity (Step 2)........................................................... 51 2.3.3 Score temporal scale of activity (Step 3) ....................................................... 51 2.3.4 Choose the sub-component most likely to be affected by activity (Step 4) .. 52 2.3.5 Choose the unit of analysis most likely to be affected by activity and to have highest consequence score (Step 5) ........................................................................ 52 2.3.6 Select the most appropriate operational objective (Step 6) ........................... 52 2.3.7 Score the intensity of the activity for the component (Step 7) ...................... 52 2.3.8 Score the consequence of intensity for that component (Step 8)................... 53 2.3.9 Record confidence/uncertainty for the consequence scores (Step 9) ............ 53 2.3.10 Document rationale for each of the above steps (Step 10) .......................... 54 2.3.11 Summary of SICA results ............................................................................ 94 2.3.12 Evaluation/discussion of Level 1................................................................. 97 2.3.13 Components to be examined at Level 2....................................................... 98
2.4 Level 2 Productivity and Susceptibility Analysis (PSA) .......................................99 2.4.1 Units excluded from analysis and document the reason for exclusion (Step 1).............................................................................................................................. 103 2.4.2 and 2.4.3 Level 2 PSA (steps 2 and 3)......................................................... 103 2.4.4 PSA Plot for individual units of analysis (Step 4) ....................................... 119 2.4.5 Uncertainty analysis ranking of overall risk (Step 5) .................................. 122 2.4.6 Evaluation of the PSA results (Step 6) ........................................................ 126 2.4.7 Decision rules to move from Level 2 to Level 3 (Step 7)............................ 129
ii
2.4.8 High/Medium risk categorisation (Step 8) ...................................................130 2.5 Level 3 ..................................................................................................................... 132
3. General discussion and research implications.......................................................... 133 3.1 Level 1 ..................................................................................................................... 133 3.2 Level 2 ..................................................................................................................... 133
3.2.1 Species at risk...............................................................................................133 3.2.2 Habitats at risk..............................................................................................135 3.2.3 Communities at risk .....................................................................................135
3.3 Key Uncertainties / Recommendations for Research and Monitoring ............. 135 References ........................................................................................................................ 137 Glossary of Terms ........................................................................................................... 145 Appendix A: General summary of stakeholder feedback ........................................... 147 Appendix B: PSA results summary of stakeholder discussions.................................. 151 Appendix C: SICA consequence scores for ecological components ........................... 152

Fishery ERA report documents to be completed
List of Summary documents 2.1 Summary Document SD1. Summary of stakeholder involvement for fishery ........... 6 List of Scoping documents Scoping Document S1 General Fishery Characteristics ................................................... 8 Scoping Document S2A Species list. ............................................................................. 19 Scoping Document S2B1. Benthic Habitats ................................................................... 31 Scoping Document S2B2. Pelagic Habitats.................................................................... 32 Scoping Document S2C1. Demersal communities......................................................... 33 Scoping Document S2C2. Pelagic communities ............................................................ 34 Scoping Document S2C2. Pelagic communities ............................................................ 35 Scoping Document S3 Components and Sub-components Identification of Objectives 37 Scoping Document S4. Hazard Identification Scoring Sheet ......................................... 44 List of Level 1 (SICA) documents 2.3.1 Level 1 (SICA) Documents L1.1 - Target Species Component ............................ 55 Level 1 (SICA) Document L1.6. Summary table of consequence scores for all
activity/component combinations. .......................................................................... 94 List of Level 2 (PSA) documents Level 2 (PSA) Document L2.1. Summary table of stakeholder discussion regarding PSA
results.. .................................................................................................................. 147
List of Figures Figure 1. Overview of ERAEF showing focus of analysis for each level. ....................... 1 Figure 2. Generic conceptual model used in ERAEF....................................................... 2 Figure 13. The axes on which risk to the ecological units is plotted............................ 102 Figure 17. Overall risk values in the PSA plot. ............................................................ 121

iv
List of Tables
Table 4. Examples of fishing activities (Modified from Fletcher et al. 2002)................46 Table 5A. Target Species. Description of consequences for each component and each
sub-component. Use table as a guide for scoring the level of consequence for target species (Modified from Fletcher et al. 2002)........................................................152
Table 5B. Bycatch and Byproduct species. Description of consequences for each component and each sub-component. Use table as a guide for scoring the level of consequence for bycatch/byproduct species (Modified from Fletcher et al. 2002)...............................................................................................................................155
Table 5C. TEP species. Description of consequences for each component and each sub-component. Use table as a guide for scoring the level of consequence for TEP species (Modified from Fletcher et al. 2002)........................................................158
Table 5D. Habitats. Description of consequences for each component and each sub-component. Use table as a guide for scoring the level of consequence for habitats. Note that for sub-components Habitat types and Habitat structure and function, time to recover from impact scales differ from substrate, water and air. Rationale: structural elements operate on greater timeframes to return to pre-disturbance states (Modified from Fletcher et al. 2002) ..........................................................161
Table 5E. Communities. Description of consequences for each component and each sub-component. Use table as a guide for scoring the level of consequence for communities (Modified from Fletcher et al. 2002)...............................................164

Overview
1
1. Overview Ecological Risk Assessment for the Effects of Fishing (ERAEF) Framework The Hierarchical Approach
The Ecological Risk Assessment for the Effects of Fishing (ERAEF) framework involves a hierarchical approach that moves from a comprehensive but largely qualitative analysis of risk at Level 1, through a more focused and semi-quantitative approach at Level 2, to a highly focused and fully quantitative “model-based” approach at Level 3 (Figure 1). This approach is efficient because many potential risks are screened out at Level 1, so that the more intensive and quantitative analyses at Level 2 (and ultimately at Level 3) are limited to a subset of the higher risk activities associated with fishing. It also leads to rapid identification of high-risk activities, which in turn can lead to immediate remedial action (risk management response). The ERAEF approach is also precautionary, in the sense that risks will be scored high in the absence of information, evidence or logical argument to the contrary.
SCOPINGEstablish scope and context
Identify and document objectivesHazard identification
Risk Assessment Level 1Qualitative assessment (SICA)
Uncertainty analysis
Medium, high orextreme risk
Negligible or lowrisk
Risk Assessment Level 2 Semi-quantitative (PSA)
Uncertainty analysis
Medium, high orextreme risk
Negligible or lowrisk
Risk Assessment Level 3Quantitative assessment
Uncertainty analysis
Riskmanagement
reponse
Medium, high orextreme risk
Negligible or lowrisk
Analysis: Fishery/subfishery
Analysis: most vulnerableelement in each component(species, habitat, community)Screen out: low consequenceactivities and (potentially) lowrisk components
Analysis: selectedelements (species,habitat, community);spatial and temporaldynmaics
Analysis: full set ofelements for eachcomponentScreen out: lowrisk elements
Figure 1. Overview of ERAEF showing focus of analysis for each level at the left in italics. Conceptual Model
The approach makes use of a general conceptual model of how fishing impacts on ecological systems, which is used as the basis for the risk assessment evaluations at each level of analysis (Levels 1-3). For the ERAEF approach, five general ecological

Overview
2
components are evaluated, corresponding to five areas of focus in evaluating impacts of fishing for strategic assessment under EPBC legislation. The five components are:
• Target species • By-product and by-catch species • Threatened, endangered and protected species (TEP species) • Habitats • Ecological communities
This conceptual model (Figure 2) progresses from fishery characteristics of the fishery or sub-fishery, → fishing activities associated with fishing and external activities, which may impact the five ecological components (target, byproduct and bycatch species, TEP species, habitats, and communities); → effects of fishing and external activities which are the direct impacts of fishing and external activities; → natural processes and resources that are affected by the impacts of fishing and external activities; → sub-components which are affected by impacts to natural processes and resources; → components, which are affected by impacts to the sub-components. Impacts to the sub-components and components in turn affect achievement of management objectives.
Target, Byproduct and Bycatch, TEP Species, Habitats, Communities
Positiveimpact
Negativeimpact Pathway
Naturalprocesses &Resources
Fishingactivities
Subcomponents
ComponentsScoping
Step 2Identificationof core andoperationalobjectives
Fishery/Sub-Fishery
Externalactivities
Fisherycharacteristics
Direct impactof
fishingactivity
ScopingStep 3Hazard
identification
ScopingStep 1
Key aspectsof fishery
RiskevaluationLevels 1-3
Figure 2. Generic conceptual model used in ERAEF. The external activities that may impact the fishery objectives are also identified at the Scoping stage and evaluated at Level 1. This provides information on the additional impacts on the ecological components being evaluated, even though management of the external activities is outside the scope of management for that fishery.

Overview
3
The assessment of risk at each level takes into account current management strategies and arrangements. A crucial process in the risk assessment framework is to document the rationale behind assessments and decisions at each step in the analysis. The decision to proceed to subsequent levels depends on
• Estimated risk at the previous level • Availability of data to proceed to the next level • Management response (e.g. if the risk is high but immediate changes to
management regulations or fishing practices will reduce the risk, then analysis at the next level may be unnecessary).
A full description of the ERAEF method is provided in the methodology document (Hobday et al 2007). This fishery report contains figures and tables with numbers that correspond to this methodology document. Thus, table and figure numbers within this fishery ERAEF report are not sequential, as not all figures and tables are relevant to the fishery risk assessment results. ERAEF stakeholder engagement process
A recognized part of conventional risk assessment is the involvement of stakeholders involved in the activities being assessed. Stakeholders can make an important contribution by providing expert judgment, fishery-specific and ecological knowledge, and process and outcome ownership. The ERAEF method also relies on stakeholder involvement at each stage in the process, as outlined below. Stakeholder interactions are recorded. Scoping
In the first instance, scoping is based on review of existing documents and information, with much of it collected and completed to a draft stage prior to full stakeholder involvement. This provides all the stakeholders with information on the relevant background issues. Three key outputs are required from the scoping, each requiring stakeholder input.
1. Identification of units of analysis (species, habitats and communities) potentially impacted by fishery activities (section 2.2.2; Scoping Document S2A, S2B and S2C).
2. Selection of objectives (section 2.2.3; Scoping Document S3) is a challenging part of the assessment, because these are often poorly defined, particularly with regard to the habitat and communities components. Stakeholder involvement is necessary to agree on the set of objectives that the risks will be evaluated against. A set of preliminary objectives relevant to the sub-components is selected by the drafting authors, and then presented to the stakeholders for modification. An agreed set of objectives is then used in the Level 1 SICA analysis. The agreement of the fishery management advisory body (e.g. the MAC, which contains representatives from industry, management, science, policy and conservation) is considered to represent agreement by the stakeholders at large.
3. Selection of activities (hazards) (section 2.2.4; Scoping Document S4) that occur in the sub-fishery is made using a checklist of potential activities provided. The checklist was developed following extensive review, and allows repeatability between fisheries. Additional activities raised by the stakeholders can be

Overview
4
included in this checklist (and would feed back into the original checklist). The background information and consultation with the stakeholders is used to finalize the set of activities. Many activities will be self-evident (e.g. fishing, which obviously occurs), but for others, expert or anecdotal evidence may be required.
Level 1. SICA (Scale, Intensity, Consequence Analysis)
The SICA analysis evaluates the risk to ecological components resulting from the stakeholder-agreed set of activities. Evaluation of the temporal and spatial scale, intensity, sub-component, unit of analysis, and credible scenario (consequence for a sub-component) can be undertaken in a workshop situation, or prepared ahead by the draft fishery ERA report author and debated at the stakeholder meeting. Because of the number of activities (up to 24) in each of five components (resulting in up to 120 SICA elements), preparation before involving the full set of stakeholders may allow time and attention to be focused on the uncertain or controversial or high risk elements. The rationale for each SICA element must be documented and this may represent a challenge in the workshop situation. Documenting the rationale ahead of time for the straw-man scenarios is crucial to allow the workshop debate to focus on the right portions of the logical progression that resulted in the consequence score. SICA elements are scored on a scale of 1 to 6 (negligible to extreme) using a “plausible worst case” approach (see ERAEF Methods Document for details). Level 1 analysis potentially result in the elimination of activities (hazards) and in some cases whole components. Any SICA element that scores 2 or less is documented, but not considered further for analysis or management response. Level 2. PSA (Productivity Susceptibility Analysis)
The semi-quantitative nature of this analysis tier should reduce but not eliminate the need for stakeholder involvement. In particular, transparency about the assessment will lead to greater confidence in the results. The components that were identified to be at moderate or greater risk (SICA score > 2) at Level 1 are examined at Level 2. The units of analysis at Level 2 are the agreed set of species, habitat types or communities in each component identified during the scoping stage. A comprehensive set of attributes that are proxies for productivity and susceptibility have been identified during the ERAEF project. Where information is missing, the default assumption is that risk will be set high. Details of the PSA method are described in the accompanying ERAEF Methods Document. Stakeholders can provide input and suggestions on appropriate attributes, including novel ones, for evaluating risk in the specific fishery. The attribute values for many of the units (e.g. age at maturity, depth range, and mean trophic level) can be obtained from published literature and other resources (e.g. scientific experts) without full stakeholder involvement. This is a consultation of the published scientific literature. Further stakeholder input is required when the preliminary gathering of attribute values is completed. In particular, where information is missing, expert opinion can be used to derive the most reasonable conservative estimate. For example, if the species attribute values for annual fecundity have been categorized as low, medium and high on the set [<5, 5-500, >500], estimates for species with no data can still be made. Estimated fecundity of a species such as a broadcast-spawning fish with unknown fecundity, is still likely greater than the cutoff for the high fecundity categorization (>500).

Overview
5
Susceptibility attribute estimates, such as “fraction alive when landed”, can also be made based on input from experts such as scientific observers. The final PSA is completed by scientists because access to computing resources, databases, and programming skills is required. Feedback to stakeholders regarding comments received during the preliminary PSA consultations is considered crucial. The final results are then presented to the stakeholder group before decisions regarding Level 3 are made. The stakeholder group may also decide on priorities for analysis at Level 3. Level 3
This stage of the risk assessment is fully-quantitative and relies on in-depth scientific studies on the units identified as at medium or greater risk in the Level 2 PSA. It will be both time and data-intensive. Individual stakeholders are engaged as required in a more intensive and directed fashion. Results are presented to the stakeholder group and feedback incorporated, but live modification is not considered likely. Conclusion and final risk assessment report
The conclusion of the stakeholder consultation process will result in a final risk assessment report for the individual fishery according to the ERAEF methods. It is envisaged that the completed assessment will be adopted by the fishery management group and used by AFMA for a range of management purposes, including addressing the requirements of the EPBC Act as evaluated by Department of the Environment and Heritage. Subsequent risk assessment iterations for a fishery
The frequency at which each fishery must revise and update the risk assessment is not fully prescribed. As new information arises or management changes occur, the risks can be re-evaluated, and documented as before. The fishery management group or AFMA may take ownership of this process, or scientific consultants may be engaged. In any case the ERAEF should again be based on the input of the full set of stakeholders and reviewed by independent experts familiar with the process. Each fishery ERA report will be revised at least every four years or as required by Strategic Assessment. However, to ensure that actions in the intervening period do not unduly increase ecological risk, each year certain criteria will be considered. At the end of each year, the following trigger questions should be considered by the MAC for each sub-fishery. • Has there been a change in the spatial distribution of effort of more than 50%
compared to the average distribution over the previous four years? • Has there been a change in effort in the fishery of more than 50% compared to the
four year average (e.g. number of boats in the fishery)? • Has there been an expansion of a new gear type or configuration such that a new
sub-fishery might be defined? Responses to these questions should be tabled at the relevant fishery MAC each year and appear on the MAC calendar and work program. If the answer to any of these trigger questions is yes, then the sub-fishery should be re-evaluated.

Overview
6
2. Results The focus of analysis is the fishery as identified by the responsible management authority. The assessment area is defined by the fishery management jurisdiction within the AFZ. The fishery may also be divided into sub-fisheries on the basis of fishing method and/or spatial coverage. These sub-fisheries should be clearly identified and described during the scoping stage. Portions of the scoping and analysis at Level 1 and beyond, is specific to a particular sub-fishery. The fishery is a group of people carrying out certain activities as defined under a management plan. Depending on the jurisdiction, the fishery/sub-fishery may include any combination of commercial, recreational, and/or indigenous fishers. The results presented below are for Small Pelagic Fishery – Midwater Trawl 2.1 Stakeholder engagement 2.1 Summary Document SD1. Summary of stakeholder involvement for fishery
SMALL PELAGIC FISHERY – MIDWATER TRAWL Fishery ERA report stage
Type of stakeholder interaction
Date of stakeholder interaction
Composition of stakeholder group (names
or roles)
Summary of outcome
Scoping Workshop Feb 27, 2004, Canberra
SPRAT. See minutes for this meeting
New Strategic Assessment document made available to ERA team. Hazards agreed on. Species list comments to be included.
Phone call and email comments on draft materials sent to meeting
March 23, 2004
Denis Brown Comments to be incorporated.
Level 1 (SICA)
Workshop Feb 27, 2004, Canberra
SPRAT. See minutes for this meeting
Presented the scenarios as an overview of the preliminary outcomes. Agreed to distribute out of session once modified with some of the feedback
Level 2 (PSA)
Workshop February 27, 2004. Canberra
SPRAT. See minutes for this meeting
Draft Level 2 presented. Additional sources for biological attributes identified. Papers sent through by Jeremy Lyle with additional species data.
Level 2 (PSA)
Meeting at TAFI September 2005
Ross Daley, Jeremy Lyle, Dirk Welsford
Comments mainly on TEP species and need to improve mapping/availability of these species. Feedback incorporated prior to workshop[
Level 2 (PSA)
Workshop September 2005
AFMA, fishers, and Scientists (TAFI, SARDI),
Review of updated methodology and level 2. Problems with lack of PS observer data highlighted. AFMA staff undertake to obtain observer data from state PS Fisheries
Level 2 (PSA)
E-Mails April 2006 AFMA/CMAR AFMA indicate they are unable to provide any additional observer

Overview
7
Fishery ERA report stage
Type of stakeholder interaction
Date of stakeholder interaction
Composition of stakeholder group (names
or roles)
Summary of outcome
data. The consequence of this data gap (namely higher scores for TEP species) were made clear in an e-mail from Ross Daley to AFMA.
Scoping updates
E-mails 25 May 2005 TAFI/CMAR Check with Jeremy Lyle if jurisdictional arrangements have been resolved for zone A. Not resolved yet. Noted in scoping
Scoping updates
E-mails 26 May 2006 TAFI/AFMA Clarification on updated management arrangements. Specific questions answered, Waiting for general comments on General Fishery Characteristics re-draft.

Scoping
8
2.2 Scoping The aim in the Scoping stage is to develop a profile of the fishery being assessed. This provides information needed to complete Levels 1 and 2 and at stakeholder meetings. The focus of analysis is the fishery, which may be divided into sub-fisheries on the basis of fishing method and/or spatial coverage. Scoping involves six steps:
Step 1 Documenting the general fishery characteristics Step 2 Generating “unit of analysis” lists (species, habitat types, communities) Step 3 Selection of objectives Step 4 Hazard identification Step 5 Bibliography Step 6 Decision rules to move to Level 1
2.2.1 General Fishery Characteristics (Step 1).
The information used to complete this step may come from a range of documents such as the Fishery’s Management Plan, Assessment Reports, Bycatch Action Plans, and any other relevant background documents. The level and range of information available will vary. Some fisheries/sub-fisheries will have a range of reliable information, whereas others may have limited information. Scoping Document S1 General Fishery Characteristics
Fishery Name: Small Pelagic Fishery – Midwater Trawl Date of assessment: 28 May 2006 Assessor: Ross Daley General Fishery Characteristics Fishery Name
Small Pelagics Fishery
Sub-fisheries Identify sub-fisheries on the basis of fishing method/area Permits in the Fishery allow two methods of fishing: purse seine and mid water trawl. This report covers the midwater trawl sub-fishery.
Sub-fisheries assessed
The sub-fisheries to be assessed on the basis of fishing method/area in this report. This report deals only with midwater trawl sub-fishery. A separate ERAEF report covers the purse-seine sub-fishery
Start date/history
Provide an indication of the length of time the fishery has been operating. The SPF has had a long history, beginning in 1936 when CSIRO surveys located large schools of small pelagics along the wester edge of the GAB and off eastern Tasmania. In the 1940’s and 1950’s purse seining was trialled off NSW and eastern Tasmania. The fist catch comprised 4 t of Jack mackerel taken near Hobart and from then until to 2002, the SPF was dominated by the purse seine sub-fishery targeting surface schools of jack mackerel off eastern Tasmania (Zone A) In 1979, Australia declared the 200 mile Australian Fishing Zone. This gave the States responsibility for management of fisheries resources out to 3 nm and the Commonwealth responsibility for resources from 3 – 200 miles. For resources that occurred both inside 3 m as well as offshore in Commonwealth waters - licensing, management and enforcement

Scoping
9
became complicated. In 1983, the Offshore Constitutional Settlement came into effect. This arrangement between the state and the Commonwealth allows for the exchange of powers for controlling resources that cross jurisdictional boundaries (the ‘3-mile line’). This process is still not finalised for Zone A (off Tasmania) but the fishery has been co-managed by the State and Federal Governments since 1984, The Midwater Trawl sub-fishery of the SPF commenced in 2001/2002 when the first significant catches of redbait were taken in zone A. In 2002, two midwater trawling licences were granted and by 2003 and 2004 midwater trawling took the vast majority (>90%) of the SPF total annual catch. Most of the catch has been redbait (Emmelichthys nitidus), sold whole (not mealed) to feed farmed Tuna in Port Lincoln. With most of the market for the fishery in Port Lincoln, there was a clear potential for the fishery to expand into other areas, particularly the GAB and areas closer to the market than Tasmania. In 2001, the AFMA board pre-emptively began developed a Management Policy for remaining areas within the jurisdictional boundaries (Zones B, C, D). Under the new management policy framework, AFMA announced, plans to restructure management of most zones of the fishery in 2004. An investment warning and a freeze on permits followed. A discussion paper on management of zones B, C, D was developed. An Independent Allocation Advisory Panel (IAAP) was established to investigate how TAC management could be developed for the fishery. In December 2005, The AFMA Board accepted most of the advice from the Independent Allocation Advisory Panel and finalised the allocation formula to be used in allocating statutory fishing rights under the management plan for the fishery. The Board lifted the freeze on boat nominations and expects to finalise management policy into a detailed Management Plan for the fishery in 2006. Looking forward, the fishery is likely to face a number of challenges for managing the target species. Output controls are to be the preferred method for managing Commonwealth Fisheries but his may be problematic. Output controls are normally set against some reference point based on the initial biomass of the stock. Setting reference points for the SPF will be a challenge for the future because the initial biomass is not known. The fishery is also responding to challenges in managing TEP species. A number of dolphins have been captured in the sub-fishery. As a response, the fishery has established a Cetacean Mitigation Working Group. Cetacean catches are carefully monitored by observer programs using innovative techniques. Catch levels recorded to date appear to have been at sustainable levels.
Geographic extent of fishery
The geographic extent of the managed area of the fishery. Maps of the managed area and distribution of fishing effort should be included in the detailed description below, or appended to the end of this table. The jurisdictional boundary of the fishery extends from waters south of the Queensland border on the east coast, across southern Australia to 31° S on the west coast, north of Perth. It includes waters from 3 – 200 miles and waters inside 3 nautical miles around Tasmania.

Scoping
10
Regions or Zones within the fishery
Any regions or zones used within the fishery for management purposes and the reason for these zones if known. The fishery is divided into four zones. From 2001 – 2004 almost all midwater trawl effort in the SPF was off eastern Tasmania in both Commonwealth and state waters of zone A. The 2005 and 2006 logbook data sets have not been analysed to date, but there are anecdotal reports of some targeting of redbait in the Great Australian Bight during 2006.
Map of the Small Pelagic Fishery including Zones, © Commonwealth of Australia 2005

Scoping
11
Distribution of Midwater trawl effort in the SPF based on 2001-2004 logbook data mapped in 1 km squares
Fishing season
Species targeted and where known, stock status. Fishing occurs throughout most of the year with most catches in the warmer months and a peak in April-May
Target species and stock status
Species targeted and where known, stock status. The main species targeted with midwater trawl is redbait: (Emmelichthys nitidus). However this species may form mixed schools with four other species which are effectively targeted: Jack mackerel (Trachurus declivis) Peruvian mackerel (Trachurus murphyi) Yellowtail scad (Trachurus novaezelandiae) Blue mackerel (Scomber australasicus) The stock status of the four target species is uncertain; potentially underfished in zone B (Caton 2001). Jack mackerel is discussed in related documents for the purse seine sub-fishery.
Bait Collection and usage
Identify bait species and source of bait used in the sub-fishery. Describe methods of setting bait and trends in bait usage. Not applicable because the fishery only uses nets to capture the target species and there is no chum.

Scoping
12
Current entitlements
The number of current entitlements in the fishery. Note latent entitlements. Licences/ permits/ boats and number active There are 37 concession authorising fishing for SPF species using midwater trawl. Some are restricted to particular zones. Currently only two permits are active, one in zone A, and one in zone B
Current and recent TACs, quota trends by method
The most recent catch quota levels in the fishery by fishing method (sub-fishery). Summary of the most recent catch quota levels in the fishery by fishing method (sub-fishery) in table form. There are currently no Commonwealth TACs in the SPF but AFMA is committed to introducing SFRs (Statutory Fishing Rights), in the form of Individual Transferable Quota’s into the fishery and expects to grant Statutory Fishing Rights under the proposed management plan in 2006. In the interim, Trigger Catch Limits (TCL) are in place for zones B, C, and D. If catches reach these triggers then a management response is required. TCLs have been set on a species specific basis for blue mackerel, yellowtail scad and redbait. A combined species TAC/TCL will be set for the various jack mackerel species (Trachurus spp). TACs or TCLs are reviewed annually by the Small Pelagics Research and Assessment Team (SPRAT),
Zone B Zone C Zone D Blue mackerel 5,000 3,500 3,500 Jack mackerel group 4,000 2,500 2,500 Redbait 1,000 1,000 1,000 Yellowtail Scad 100 100 100
There is no OCS arrangement for SPF species in Tasmanian State waters. There was agreement to form a formal Joint Authority to manage Zone A but this agreement was not gazetted and therefore did not take effect. Presently Zone A is managed cooperatively, with Tasmania having responsibility for setting annual TACs. The current TAC for all species and gears is 34 000t.
Current and recent fishery effort trends by method
The most recent estimate of effort levels in the fishery by fishing method (sub-fishery). There has been significant effort in the fishery from 2002 – 2005. Effort in 2001 was exploratory. There was no midwater trawling in the SPF prior to 2001.
Year Search time (hours) for midwater trawl vessels in
SPF (Logbook data) 2000 0 2001 77 2002 777 2003 1,724 2004 2,446 2005 1,372
Current and recent fishery catch trends by method
Summary of the most recent estimate of catch levels in the fishery by fishing method (sub-fishery). In table form The first significant catches were taken in 2001. From 2001 – 2005 annual catches have been 5,000 t – 12 000 t, putting the SPF among the highest volume fisheries in Australia Total catches for the purse seine method in the SPF Based on logbook data
Year Total catch (t) 2000 0 2001 723 2002 4,862
Scoping
13
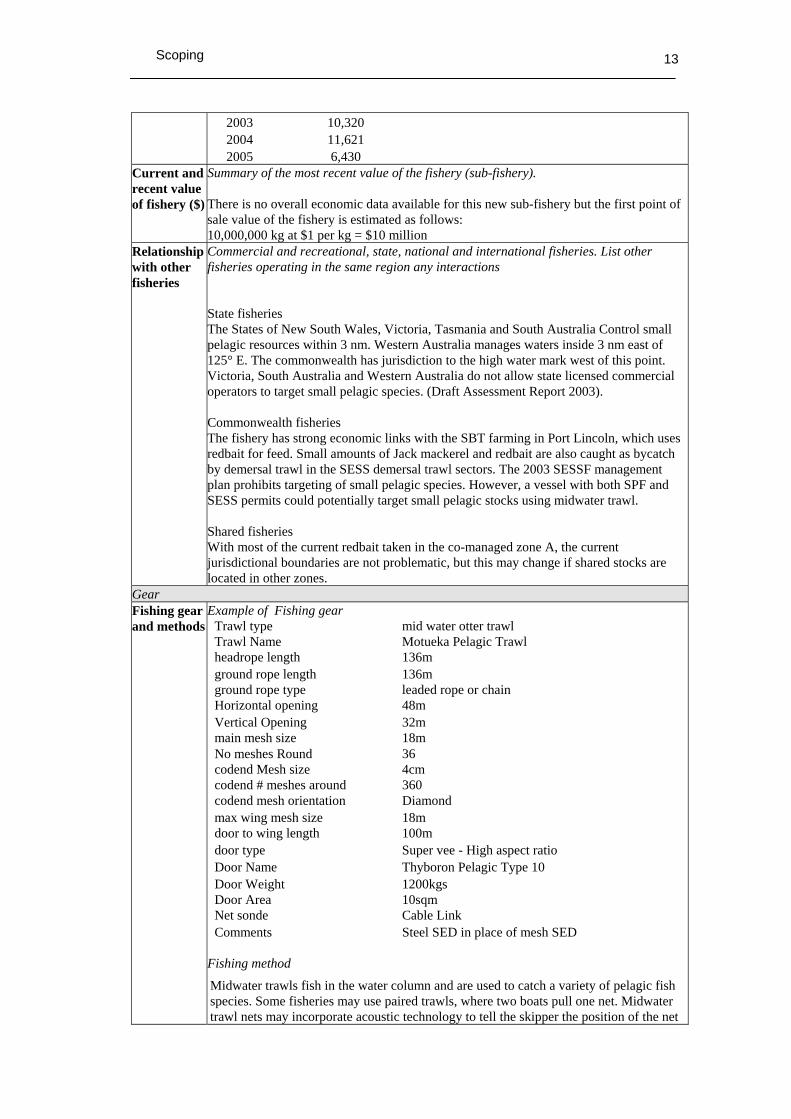
2003 10,320 2004 11,621 2005 6,430
Current and recent value of fishery ($)
Summary of the most recent value of the fishery (sub-fishery). There is no overall economic data available for this new sub-fishery but the first point of sale value of the fishery is estimated as follows: 10,000,000 kg at $1 per kg = $10 million
Relationship with other fisheries
Commercial and recreational, state, national and international fisheries. List other fisheries operating in the same region any interactions State fisheries The States of New South Wales, Victoria, Tasmania and South Australia Control small pelagic resources within 3 nm. Western Australia manages waters inside 3 nm east of 125° E. The commonwealth has jurisdiction to the high water mark west of this point. Victoria, South Australia and Western Australia do not allow state licensed commercial operators to target small pelagic species. (Draft Assessment Report 2003). Commonwealth fisheries The fishery has strong economic links with the SBT farming in Port Lincoln, which uses redbait for feed. Small amounts of Jack mackerel and redbait are also caught as bycatch by demersal trawl in the SESS demersal trawl sectors. The 2003 SESSF management plan prohibits targeting of small pelagic species. However, a vessel with both SPF and SESS permits could potentially target small pelagic stocks using midwater trawl. Shared fisheries With most of the current redbait taken in the co-managed zone A, the current jurisdictional boundaries are not problematic, but this may change if shared stocks are located in other zones.
Gear Fishing gear and methods
Example of Fishing gear Trawl type mid water otter trawl Trawl Name Motueka Pelagic Trawl headrope length 136m ground rope length 136m ground rope type leaded rope or chain Horizontal opening 48m Vertical Opening 32m main mesh size 18m No meshes Round 36 codend Mesh size 4cm codend # meshes around 360 codend mesh orientation Diamond max wing mesh size 18m door to wing length 100m door type Super vee - High aspect ratio Door Name Thyboron Pelagic Type 10 Door Weight 1200kgs Door Area 10sqm Net sonde Cable Link Comments Steel SED in place of mesh SED
Fishing method
Midwater trawls fish in the water column and are used to catch a variety of pelagic fish species. Some fisheries may use paired trawls, where two boats pull one net. Midwater trawl nets may incorporate acoustic technology to tell the skipper the position of the net

Scoping
14
in the water column, the opening/spread of the net and the volume of fish entering the net. Additional instruments on the net can record the speed at which the net is traveling. Both demersal and midwater trawls use otterboards to keep the mouth of the net open.
Fishing gear restrictions
Any restrictions on gear Minimum mesh size is 40mm. Some permits allow the use of a 20mm codend mesh liner.
Selectivity of gear and fishing methods
Description of the selectivity of the sub-fishery methods Midwater trawls target midwater fish aggregations identified from using echo sounders. The catch is almost entirely redbait with only small traces of other species such as flathead and a few other teleosts.
Spatial gear zone set
Description where gear set i.e. continental shelf, shelf break, continental slope (range nautical miles from shore) The gear is generally set in areas of high productivity over the shelf and along the edge of the shelf.
Depth range gear set
Depth range gear set at in meters The gear is set in waters where the bottom is 35 – 357 m from the surface
How gear set Description how set, pelagic in water column, benthic set (weighted) on seabed The gear is set in the middle third of the water column. Potentially the gear can come into contact with the bottom but this does not occur frequently
Area of gear impact per set or shot
Description of area impacted by gear per set (square meters) Horizontal opening: 48 m Vertical Opening: 32 m Area of opening = 48 x 32 m=1,538 m The area does not normally come into contact with the bottom
Capacity of gear
Description number hooks per set, net size weight per trawl shot The largest shots recorded in observer records are around 65 t. The vessels can carry up to 800 t

Scoping
15
Effort per annum all boats
Description effort per annum of all boats in fishery by shots or sets and hooks, for all boats See Current and recent fishery effort trends by method (above)
Lost gear and ghost fishing
Description of how gear is lost, whether lost gear is retrieved, and what happens to gear that is not retrieved, and impacts of ghost fishing. The gear is designed to fly midwater and not prone to snagging. Potentially the gear could be snagged when trialling new or unfamiliar gear. The gear is expensive and economics and career prospects for skippers provide powerful incentives to prevent gear loss and recover any lost gear.
Issues Target species issues
List any issues, including biological information such as spawning season and spawning location, major uncertainties about biology or management, interactions etc There are no estimates of original biomass for the target species. In line with the Ministerial Direction of 2005, a harvest strategy is being developed for the fishery. The harvest strategy will be used to determine appropriate TACs. James Findlay from BRS is preparing draft harvest strategy for SPFRAG and SPFMAC to consider later this year. Much of the fisheries biology of redbait is poorly defined. Key research needs include spatio-temporal patterns in population structure, reproductive biology and early life history, validation of ageing studies, further analysis of trophic interactions (see Community Issues, below), early life history and biomass estimates (Welsford and Lyle 2003). Redbait (Emmelichthys nitidus, Emmelichthyidae) are distributed from New South Wales to South Australia, including Tasmania. The also occur in Southern Africa and New Zealand Waters. The form surface or midwater schools over the continental shelf. Spawning in redbait takes place between October and January in Tasmanian waters (Kailola et al 1993, Welsford and Lyle2003.). Little is know about early life history stages (Welsford and Lyle 2003). The juveniles of closely related ruby fish are associated with drift algae off northeastern New Zealand (Kingsford 1992). Redbait are thought to mature at 2 – 3 years and grow to a maximum age of 8.5 years. However, uncertainties in age estimates include variability in how spawning date affects growth, seasonal and inter0-annual variability in growth, low precision in ageing estimates and variation in size at age (Welsford and Lyle 2003). Worldwide there have been few assessments of species of the family Emmelichthyidae. In New Zealand, an assessment of rubyfish (Plagiogeneion rubiginosum, Emmelichthyidae) was undertaken in 1997 and then updated in 1999 and 2002 (Paul 1997, Annala et al. 2002). In Australia, there is large-scale variation in catches of target species and this makes assessment of Target Catch Limits difficult. These catches are likely to be influenced by seasonal and inter-annual variability in physical oceanography of water masses of the east coast of Tasmania (Harris et al. 1987, Harris et al 1988).
Byproduct and bycatch issues and interactions
List any issues, as for the target species above The fishery is highly targeted and the volume of bycatch less than 1% of the total catch in a shot. Bycatch rates in midwater trawl are much lower than in demersal trawls (up to 50%). Midwater trawling targets highly aggregated schools of the target species The volume of bycatch is so small relative to the overall catch in a shot that it can be difficult to measure or even detect. A 30 t shot of redbait may contain 300 kg of barracouta and spotted warehou. (Observer data)
TEP issues and
List any issues. This section should consider all TEP species groups: marine mammals, chondrichthyans (sharks, rays etc.), marine reptiles, seabirds, teleosts (bony fishes),

Scoping
16
interactions include any key spawning/breeding/aggregation locations that might overlap with the fishery/sub-fishery. SPF species play an important ecological role as food for many marine birds and mammals (see community issues below). It is important the harvest strategies contain reference points for the target species that allow a viably functioning ecosystem that can support birds and mammals higher in the food chain. There have been a small number of dolphins captured in the fishery. These catches are reported in detail and reports are evaluated by The Cetacean Mitigation Working Group.
Habitat issues and interactions
List any issues for any of the habitat units identified in Scoping Document S1.2. This should include reference to any protected, threatened or listed habitats None identified. The gear is designed to fly just above the bottom and, although the gear does come into contact with the bottom occasionally, the impact on benthic habitats is likely to be minimal compared to demersal trawling.
Community issues and interactions
List any issues for any of the community units identified in Scoping Document S1.2. Off south-eastern Australia, redbait prey on pelagic crustaceans and invertebrates (Bulman et al. 2001). Off south Africa, they prey on pelagic invertebrates as well as fish and squid which migrate vertically in the food chain (Meyer and Smale 1991). Redbait in turn are preyed on by marine birds, such as the Australasian Gannet, Shy albatrosses and mammals such as the Australian fur seal (Brothers et. al. 1993, Gales and Pemberton 1994, Hedd and Gales 2001). The fishery has removed 34 k t of redbait from the food chain which will affect the production and/or structure of the food chain to an unknown extent. There are likely to be indirect impacts on predatory species such as dolphins, beaked whales and tunas. Any indirect effects of fishing may be difficult to evaluate and distinguish from natural variability. Production and structure of the food chain is also linked to seasonal and inter-annual variability in the physical processes in the water masses of f Tasmania. (Harris et al. 1991). The shared nature of this migratory resource, its ecological importance within the broader marine environment, and its trophic importance in supporting other more valuable fisheries, make the species of the SPF a valuable component of Australia's marine ecosystem that need further examination
Discarding Summary of discarding practices by sub-fishery, including bycatch, juveniles of target species, high-grading, processing at sea. There is no discarding of the target species. The largest recorded discard volume from a single shot was 1 t of barracouta.
Management: planned and those implemented Management Objectives
The management objectives from the most recent management plan The management objectives from AFMA’s SPF management policy are:
• Ensuring management arrangements facilitate the Ecologically Sustainable Development of the SPF, and promote the productivity and efficient conduct of the commercial, recreational, and ecological components of the fishery;
• Adopting a strategic approach to management of the SPF, developing and maintaining fisheries management best practice, including recognising and embracing the need for ecosystem based management;
• Managing the SPF resource on behalf of the Australian community, and in doing so ensuring that management arrangements are consistent with the requirements of key stakeholders, including other management jurisdictions; and,
• Within the life of this policy, developing a set of performance criteria by which the effectiveness of SPF management arrangements can be measured.

Scoping
17
(Management Policy for the Commonwealth Small Pelagics Fishery; AFMA webpage, 10-Feb-04)
Fishery management plan
Is there a fisheries management plan is it in the planning stage or implemented what are the key features Currently there is no management plan in place for the fishery but a management policy has been in place since 2002. A harvest strategy framework is being developed by SPFRAG and SPFMAC in 2006. The Harvest Strategy Plan will be reviewed by experts and AFMA will report on the HSP to the Minister by 30 June 2006.
Input controls
Summary of any input controls in the fishery, e.g. limited entry, area restrictions (zoning), vessel size restrictions and gear restrictions. Primarily focused on target species as other species are addressed below. Limited entry will apply on a zone by zone basis under the new management plan (see current entitlements above) Under the proposed management arrangements, operators may be required to hold Commonwealth trawl entitlements when midwater trawling for small pelagics in the area of other Commonwealth trawl fisheries.
Output controls
Summary of any output controls in the fishery, e.g. quotas. Effort days at sea. Primarily focused on target species as other species are addressed below. See TAC trends (above)
Technical measures
Summary of any technical measures in the fishery, e.g. size limits, bans on females, closed areas or seasons. Gear mesh size, mitigation measures such as TEDs. Primarily focused on target species as other species are addressed below. None identified. There are currently no spatial closures in the fishery and none have been proposed or considered to date. However, SPFRAG and SPFMAC may consider the role of spatial management in future.
Regulations Regulations regarding species (bycatch and byproduct, TEP), habitat, and communities; MARPOL and pollution; rules regarding activities at sea such as discarding offal and/ or processing at sea. Under the new management plan, all interactions with TEP species need to be recorded on the monthly catch returns.
Initiatives and strategies
BAPs; TEDs; Industry codes of conduct In December 2005 the AFMA board approved a new Bycatch Action plan for the Fishery
Enabling processes
Monitoring, logbooks, observer data, scientific surveys); assessment stock assessments); performance indicators (decision rules, processes, compliance; education; consultation process. An Independent Allocation Advisory Panel (IAAP), established by the AFMA board, provides advice on the allocation of Statutory Fishing Rights in the fishery The Small Pelagic Fishery Cetacean Mitigation Working Group was established to minimise cetacean interactions. Its first meeting was held in April 2005 SPFRAG - Assesses research for the fishery SPFMAC - Provides advice to the AFMA Board on management of the fishery
Other initiatives or agreements
State, national or international conventions or agreements that impact on the management of the fishery/sub-fishery being evaluated. Electronic monitoring using vessel mounted cameras is being developed to reduce costs and improve data quality
Data Logbook data Verified logbook data; data summaries describe program

Scoping
18
Catch and effort data are recorded on a shot by shot basis in logbooks. Data has been compiled into a centralised database by AFMA and been made available to CMAR for the ERAEF assessment
Observer data Purpose: There is no stated objective for the observer program in the midwater trawl sub-fishery. Objectives may vary between observer trips but recently the priorities have been
1. Monitor interactions with marine mammals giving priority to dolphins 2. Maintain shot logs and catch compositions for all components and collect
biological data on the retained components of the catch. 3. Monitor interactions with seabirds
Data collection: Experimental design: to date there has been no statistical design of data collection. Scope: In line with the Ministerial direction, the fishery is expected to review it observer coverage. Objectives for a revised program are still under consideration under the developing Harvest Strategy Framework but are likely to include: Measuring discards and bycatch Validating logbooks Identifying TEP interactions Collecting scientific data Monitoring and compliance Coverage: Observer data has been collected off Tasmania but not in the GAB. Experience and Education: Observers have included Mick Baron who has one of the longest and broadest backgrounds in fishery observer work in Australia. Dirk Welsford (Previously TAFI) has collected biological data first hand and undertaken detailed analysis and reporting. Dirk has recently joined the AAD and is unlikely to be available to undertake future observer work in the SPF. Training & Resources: AFMA is likely to recruit additional observers to its expanding program. It is not clear what resources and training will be provided Data collation: Observer data has been collated in AFMA's centralised database Data communication: The data has been made available outside AFMA in the form of observer trip reports and as raw data. There is no annual data summary Data checking: The data has been analysed and reviewed by CMAR.
Other data TAFI collects detailed biological data on the target species.

Scoping
19
2.2.2 Unit of Analysis Lists (Step 2)
The units of analysis for the sub-fishery are listed by component: • Species Components (target, byproduct/discards and TEP components). [Scoping document S2A Species] • Habitat Component: habitat types. [Scoping document S2B Habitats] • Community Component: community types. [Scoping document S2C Communities]
The number of units of analysis examined in this report is shown by component in the following Table.
Target By-product By-catch TEP Habitats Communities 1 16 2 218 26 10
Scoping Document S2A Species list for the Target (TA), Byproduct and Bycatch (BP, DI) and TEP components.
Each species identified during the scoping is added to the ERAEF database used to run the Level 2 analyses. A CAAB code (Code for Australian Aquatic Biota) is required to input the information. The CAAB codes for each species may be found at http://www.marine.csiro.au/caab/ Target species This list is obtained by reviewing all available fishery literature, including logbooks, observer reports and discussions with stakeholders. Target species are as agreed by the fishery.
ERAEF species
ID
Role in fishery
(Component) Taxa Family name Scientific name Common Name CAAB code Source 155 TA Teleost Emmelichthyidae Emmelichthys nitidus Redbait 37345001 Don Bromhead

Scoping
20
Byproduct species Byproduct refers to any part of the catch which is kept or sold by the fisher but which is not a target species. This list is obtained by reviewing all available fishery literature, including logbooks, observer reports and discussions with stakeholders.
ERAEF species
ID
Role in fishery
(Component) Taxa Family name Scientific name Common Name CAAB code Reference 11 BP Invertebrate Ommastrephidae Nototodarus gouldi Arrow Squid 23636004 Don Bromhead
982 BP Teleost Merluciidae Macruronus novaezelandiae Blue Grenadier 37227001 Don Bromhead 69 BP Teleost Berycidae Centroberyx lineatus swallowtail 37258005 Don Bromhead
214 BP Teleost Zeidae Cyttus australis Silver dory 37264002 Don Bromhead 1097 BP Teleost Zeidae Zenopsis nebulosus Mirror Dory 37264003 Don Bromhead 1037 BP Teleost Platycephalidae Neoplatycephalus richardsoni Flathead 37296001 Don Bromhead 1088 BP Teleost Carangidae Trachurus declivis Jack Mackerel 37337002 Don Bromhead 150 BP Teleost Carangidae Pseudocaranx dentex Silver Trevally 37337062 Don Bromhead
1087 BP Teleost Gempylidae Thyrsites atun Barracouta 37439001 Don Bromhead 210 BP Teleost Scombridae Scomber australasicus Blue Mackerel 37441001 Don Bromhead 958 BP Teleost Centrolophidae Hyperoglyphe antarctica Blue Eye Trevalla 37445001 Don Bromhead 215 BP Teleost Centrolophidae Centrolophus niger Rudderfish 37445004 Don Bromhead
1068 BP Teleost Centrolophidae Seriolella brama Blue Warehou 37445005 Don Bromhead 1069 BP Teleost Centrolophidae Seriolella punctata Spotted Warehou 37445006 Don Bromhead 233 BP Teleost Monacanthidae Nelusetta ayraudi Chinaman-Leatherjacket 37465006 Don Bromhead 252 BP Teleost Molidae Mola mola ocean sunfish 37470002 Don Bromhead

Scoping
21
Discard species Bycatch as defined in the Commonwealth Policy on Fisheries Bycatch 2000 refers to:
• that part of a fisher’s catch which is returned to the sea either because it has no commercial value or because regulations preclude it being retained; and
• that part of the ‘catch’ that does not reach the deck but is affected by interaction with the fishing gear However, in the ERAEF method, the part of the target or byproduct catch that is discarded is included in the assessment of the target or byproduct species. The list of bycatch species is obtained by reviewing all available fishery literature, including logbooks, observer reports and discussions with stakeholders.
ERAEF species
ID
Role in fishery
(Component) Taxa Family name Scientific name Common Name CAAB code Reference 106 DI Teleost Triglidae Lepidotrigla vanessa butterfly gurnard 37288003 Don Bromhead 208 DI Teleost Trichiuridae Lepidopus caudatus Southern Frostfish 37440002 Don Bromhead
Scoping
22
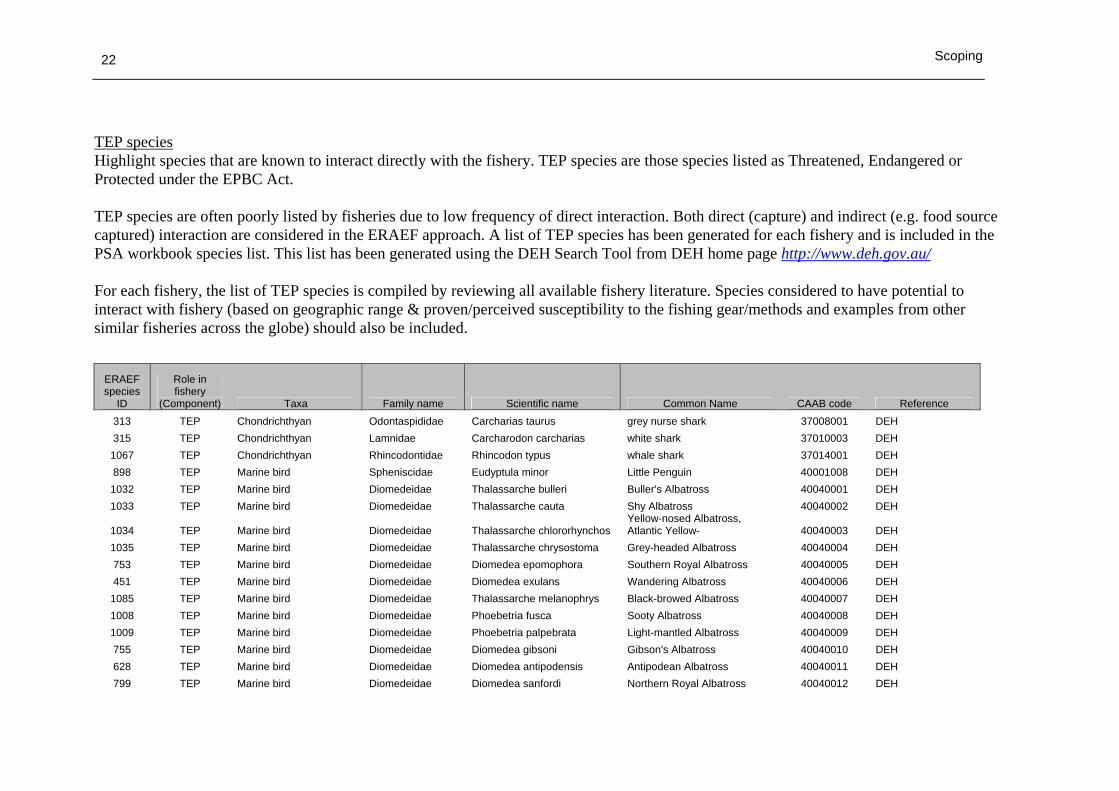
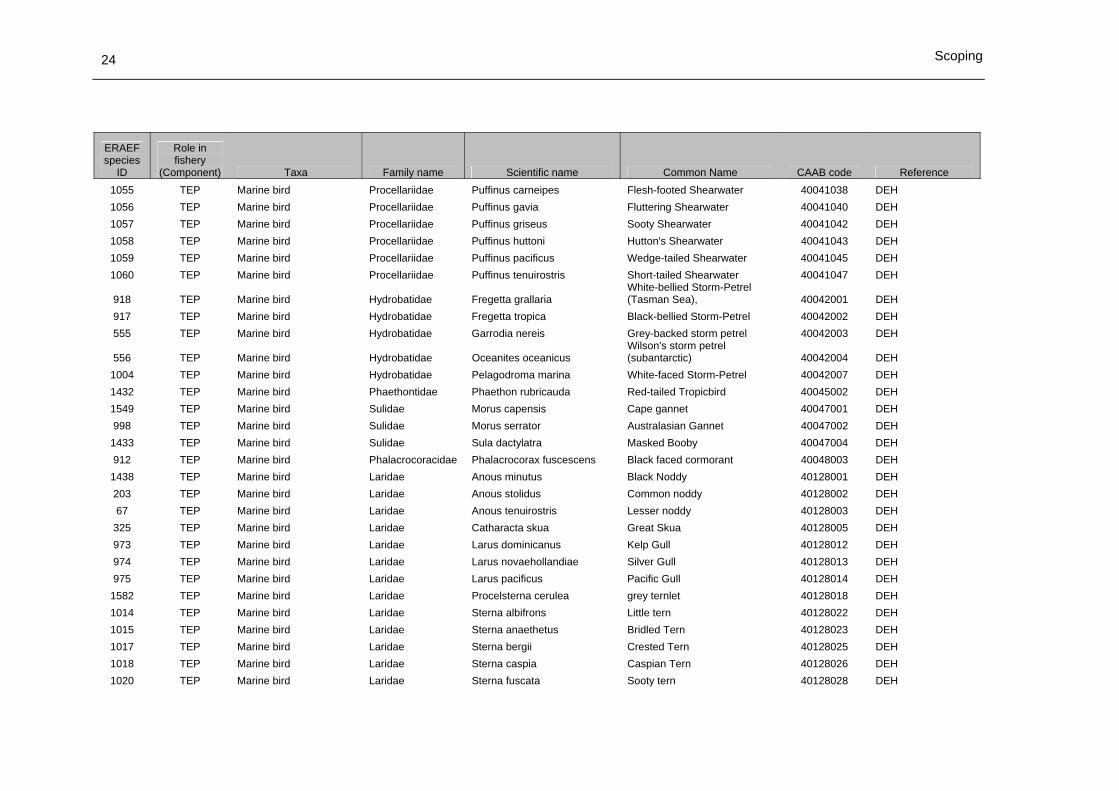
TEP species Highlight species that are known to interact directly with the fishery. TEP species are those species listed as Threatened, Endangered or Protected under the EPBC Act. TEP species are often poorly listed by fisheries due to low frequency of direct interaction. Both direct (capture) and indirect (e.g. food source captured) interaction are considered in the ERAEF approach. A list of TEP species has been generated for each fishery and is included in the PSA workbook species list. This list has been generated using the DEH Search Tool from DEH home page http://www.deh.gov.au/ For each fishery, the list of TEP species is compiled by reviewing all available fishery literature. Species considered to have potential to interact with fishery (based on geographic range & proven/perceived susceptibility to the fishing gear/methods and examples from other similar fisheries across the globe) should also be included.
ERAEF species
ID
Role in fishery
(Component) Taxa Family name Scientific name Common Name CAAB code Reference 313 TEP Chondrichthyan Odontaspididae Carcharias taurus grey nurse shark 37008001 DEH 315 TEP Chondrichthyan Lamnidae Carcharodon carcharias white shark 37010003 DEH 1067 TEP Chondrichthyan Rhincodontidae Rhincodon typus whale shark 37014001 DEH 898 TEP Marine bird Spheniscidae Eudyptula minor Little Penguin 40001008 DEH 1032 TEP Marine bird Diomedeidae Thalassarche bulleri Buller's Albatross 40040001 DEH 1033 TEP Marine bird Diomedeidae Thalassarche cauta Shy Albatross 40040002 DEH
1034 TEP Marine bird Diomedeidae Thalassarche chlororhynchos Yellow-nosed Albatross, Atlantic Yellow- 40040003 DEH
1035 TEP Marine bird Diomedeidae Thalassarche chrysostoma Grey-headed Albatross 40040004 DEH 753 TEP Marine bird Diomedeidae Diomedea epomophora Southern Royal Albatross 40040005 DEH 451 TEP Marine bird Diomedeidae Diomedea exulans Wandering Albatross 40040006 DEH 1085 TEP Marine bird Diomedeidae Thalassarche melanophrys Black-browed Albatross 40040007 DEH 1008 TEP Marine bird Diomedeidae Phoebetria fusca Sooty Albatross 40040008 DEH 1009 TEP Marine bird Diomedeidae Phoebetria palpebrata Light-mantled Albatross 40040009 DEH 755 TEP Marine bird Diomedeidae Diomedea gibsoni Gibson's Albatross 40040010 DEH 628 TEP Marine bird Diomedeidae Diomedea antipodensis Antipodean Albatross 40040011 DEH 799 TEP Marine bird Diomedeidae Diomedea sanfordi Northern Royal Albatross 40040012 DEH

Scoping
23
ERAEF species
ID
Role in fishery
(Component) Taxa Family name Scientific name Common Name CAAB code Reference 1084 TEP Marine bird Diomedeidae Thalassarche impavida Campbell Albatross 40040013 DEH 1031 TEP Marine bird Diomedeidae Thalassarche carteri Indian Yellow-nosed Albatross 40040014 DEH 894 TEP Marine bird Diomedeidae Thalassarche salvini Salvin's albatross 40040016 DEH 889 TEP Marine bird Diomedeidae Thalassarche eremita Chatham albatross 40040017 DEH 1428 TEP Marine bird Diomedeidae Diomedea amsterdamensis Amsterdam Albatross 40040018 DEH 1429 TEP Marine bird Diomedeidae Diomedea dabbenena Tristan Albatross 40040019 DEH 1580 TEP Marine bird Procellariidae Calonectris leucomelas streaked shearwater 40041002 DEH 595 TEP Marine bird Procellariidae Daption capense Cape Petrel 40041003 DEH 314 TEP Marine bird Procellariidae Fulmarus glacialoides Southern fulmar 40041004 DEH 939 TEP Marine bird Procellariidae Halobaena caerulea Blue Petrel 40041005 DEH 1052 TEP Marine bird Procellariidae Lugensa brevirostris Kerguelen Petrel 40041006 DEH 73 TEP Marine bird Procellariidae Macronectes giganteus Southern Giant-Petrel 40041007 DEH
981 TEP Marine bird Procellariidae Macronectes halli Northern Giant-Petrel 40041008 DEH 1003 TEP Marine bird Procellariidae Pachyptila turtur Fairy Prion 40041013 DEH 1006 TEP Marine bird Procellariidae Pelecanoides urinatrix Common Diving-Petrel 40041017 DEH 1041 TEP Marine bird Procellariidae Procellaria aequinoctialis White-chinned Petrel 40041018 DEH 494 TEP Marine bird Procellariidae Procellaria cinerea Grey petrel 40041019 DEH 1042 TEP Marine bird Procellariidae Procellaria parkinsoni Black Petrel; Parkinsons Petrel 40041020 DEH 1043 TEP Marine bird Procellariidae Procellaria westlandica Westland Petrel 40041021 DEH 1691 TEP Marine bird Procellariidae Pseudobulweria rostrata Tahiti Petrel 40041022 DEH 1045 TEP Marine bird Procellariidae Pterodroma cervicalis White-necked Petrel 40041025 DEH 504 TEP Marine bird Procellariidae Pterodroma lessoni White-headed petrel 40041029 DEH 1046 TEP Marine bird Procellariidae Pterodroma leucoptera Gould's Petrel 40041030 DEH 1047 TEP Marine bird Procellariidae Pterodroma macroptera Great-winged Petrel 40041031 DEH 1048 TEP Marine bird Procellariidae Pterodroma mollis Soft-plumaged Petrel 40041032 DEH 1049 TEP Marine bird Procellariidae Pterodroma neglecta Kermadec Petrel (western) 40041033 DEH 1050 TEP Marine bird Procellariidae Pterodroma nigripennis Black-winged Petrel 40041034 DEH 1051 TEP Marine bird Procellariidae Pterodroma solandri Providence Petrel 40041035 DEH
1053 TEP Marine bird Procellariidae Puffinus assimilis Little Shearwater (Tasman Sea) 40041036 DEH
1054 TEP Marine bird Procellariidae Puffinus bulleri Buller's Shearwater 40041037 DEH
Scoping
24
ERAEF species
ID
Role in fishery
(Component) Taxa Family name Scientific name Common Name CAAB code Reference 1055 TEP Marine bird Procellariidae Puffinus carneipes Flesh-footed Shearwater 40041038 DEH 1056 TEP Marine bird Procellariidae Puffinus gavia Fluttering Shearwater 40041040 DEH 1057 TEP Marine bird Procellariidae Puffinus griseus Sooty Shearwater 40041042 DEH 1058 TEP Marine bird Procellariidae Puffinus huttoni Hutton's Shearwater 40041043 DEH 1059 TEP Marine bird Procellariidae Puffinus pacificus Wedge-tailed Shearwater 40041045 DEH 1060 TEP Marine bird Procellariidae Puffinus tenuirostris Short-tailed Shearwater 40041047 DEH
918 TEP Marine bird Hydrobatidae Fregetta grallaria White-bellied Storm-Petrel (Tasman Sea), 40042001 DEH
917 TEP Marine bird Hydrobatidae Fregetta tropica Black-bellied Storm-Petrel 40042002 DEH 555 TEP Marine bird Hydrobatidae Garrodia nereis Grey-backed storm petrel 40042003 DEH
556 TEP Marine bird Hydrobatidae Oceanites oceanicus Wilson's storm petrel (subantarctic) 40042004 DEH
1004 TEP Marine bird Hydrobatidae Pelagodroma marina White-faced Storm-Petrel 40042007 DEH 1432 TEP Marine bird Phaethontidae Phaethon rubricauda Red-tailed Tropicbird 40045002 DEH 1549 TEP Marine bird Sulidae Morus capensis Cape gannet 40047001 DEH 998 TEP Marine bird Sulidae Morus serrator Australasian Gannet 40047002 DEH 1433 TEP Marine bird Sulidae Sula dactylatra Masked Booby 40047004 DEH 912 TEP Marine bird Phalacrocoracidae Phalacrocorax fuscescens Black faced cormorant 40048003 DEH
1438 TEP Marine bird Laridae Anous minutus Black Noddy 40128001 DEH 203 TEP Marine bird Laridae Anous stolidus Common noddy 40128002 DEH 67 TEP Marine bird Laridae Anous tenuirostris Lesser noddy 40128003 DEH
325 TEP Marine bird Laridae Catharacta skua Great Skua 40128005 DEH 973 TEP Marine bird Laridae Larus dominicanus Kelp Gull 40128012 DEH 974 TEP Marine bird Laridae Larus novaehollandiae Silver Gull 40128013 DEH 975 TEP Marine bird Laridae Larus pacificus Pacific Gull 40128014 DEH
1582 TEP Marine bird Laridae Procelsterna cerulea grey ternlet 40128018 DEH 1014 TEP Marine bird Laridae Sterna albifrons Little tern 40128022 DEH 1015 TEP Marine bird Laridae Sterna anaethetus Bridled Tern 40128023 DEH 1017 TEP Marine bird Laridae Sterna bergii Crested Tern 40128025 DEH 1018 TEP Marine bird Laridae Sterna caspia Caspian Tern 40128026 DEH 1020 TEP Marine bird Laridae Sterna fuscata Sooty tern 40128028 DEH

Scoping
25
ERAEF species
ID
Role in fishery
(Component) Taxa Family name Scientific name Common Name CAAB code Reference 1021 TEP Marine bird Laridae Sterna hirundo Common tern 40128029 DEH 1023 TEP Marine bird Laridae Sterna paradisaea Arctic tern 40128032 DEH 1024 TEP Marine bird Laridae Sterna striata White-fronted Tern 40128033 DEH 1025 TEP Marine bird Laridae Sterna sumatrana Black-naped tern 40128034 DEH 1086 TEP Marine bird Diomedeidae Thalassarche steadi White-capped Albatross 0 DEH 1673 TEP Marine bird Thalassarche Thalassarche nov. sp. Pacific Albatross 0 DEH 896 TEP Marine mammal Balaenidae Eubalaena australis Southern Right Whale 41110001 DEH 289 TEP Marine mammal Balaenidae Caperea marginata Pygmy Right Whale 41110002 DEH 256 TEP Marine mammal Balaenopteridae Balaenoptera acutorostrata Minke Whale 41112001 DEH 261 TEP Marine mammal Balaenopteridae Balaenoptera borealis Sei Whale 41112002 DEH 262 TEP Marine mammal Balaenopteridae Balaenoptera edeni Bryde's Whale 41112003 DEH 265 TEP Marine mammal Balaenopteridae Balaenoptera musculus Blue Whale 41112004 DEH 268 TEP Marine mammal Balaenopteridae Balaenoptera physalus Fin Whale 41112005 DEH 984 TEP Marine mammal Balaenopteridae Megaptera novaeangliae Humpback Whale 41112006 DEH 1439 TEP Marine mammal Balaenidae Balaenoptera bonaerensis Antarctic Minke Whale 41112007 DEH 612 TEP Marine mammal Delphinidae Delphinus delphis Common Dolphin 41116001 DEH 902 TEP Marine mammal Delphinidae Feresa attenuata Pygmy Killer Whale 41116002 DEH 934 TEP Marine mammal Delphinidae Globicephala macrorhynchus Short-finned Pilot Whale 41116003 DEH 935 TEP Marine mammal Delphinidae Globicephala melas Long-finned Pilot Whale 41116004 DEH 937 TEP Marine mammal Delphinidae Grampus griseus Risso's Dolphin 41116005 DEH 970 TEP Marine mammal Delphinidae Lagenodelphis hosei Fraser's Dolphin 41116006 DEH 832 TEP Marine mammal Delphinidae Lagenorhynchus cruciger Hourglass dolphin 41116007 DEH 971 TEP Marine mammal Delphinidae Lagenorhynchus obscurus Dusky Dolphin 41116008 DEH 61 TEP Marine mammal Delphinidae Lissodelphis peronii Southern Right Whale Dolphin 41116009 DEH
1002 TEP Marine mammal Delphinidae Orcinus orca Killer Whale 41116011 DEH 1007 TEP Marine mammal Delphinidae Peponocephala electra Melon-headed Whale 41116012 DEH 1044 TEP Marine mammal Delphinidae Pseudorca crassidens False Killer Whale 41116013 DEH
1076 TEP Marine mammal Delphinidae Sousa chinensis Indo-Pacific Humpback Dolphin 41116014 DEH
1080 TEP Marine mammal Delphinidae Stenella attenuata Spotted Dolphin 41116015 DEH 1081 TEP Marine mammal Delphinidae Stenella coeruleoalba Striped Dolphin 41116016 DEH

Scoping
26
ERAEF species
ID
Role in fishery
(Component) Taxa Family name Scientific name Common Name CAAB code Reference 1082 TEP Marine mammal Delphinidae Stenella longirostris Long-snouted Spinner Dolphin 41116017 DEH 1083 TEP Marine mammal Delphinidae Steno bredanensis Rough-toothed Dolphin 41116018 DEH 1091 TEP Marine mammal Delphinidae Tursiops truncatus Bottlenose Dolphin 41116019 DEH
1494 TEP Marine mammal Delphinidae Tursiops aduncus Indian Ocean bottlenose dolphin 41116020 DEH
968 TEP Marine mammal Physeteridae Kogia breviceps Pygmy Sperm Whale 41119001 DEH 969 TEP Marine mammal Physeteridae Kogia simus Dwarf Sperm Whale 41119002 DEH 1036 TEP Marine mammal Physeteridae Physeter catodon Sperm Whale 41119003 DEH 269 TEP Marine mammal Ziphiidae Berardius arnuxii Arnoux's Beaked Whale 41120001 DEH 959 TEP Marine mammal Ziphiidae Hyperoodon planifrons Southern Bottlenose Whale 41120002 DEH 985 TEP Marine mammal Ziphiidae Mesoplodon bowdoini Andrew's Beaked Whale 41120004 DEH 986 TEP Marine mammal Ziphiidae Mesoplodon densirostris Blainville's Beaked Whale 41120005 DEH 987 TEP Marine mammal Ziphiidae Mesoplodon gingkodens Gingko Beaked Whale 41120006 DEH 988 TEP Marine mammal Ziphiidae Mesoplodon grayi Gray's Beaked Whale 41120007 DEH 989 TEP Marine mammal Ziphiidae Mesoplodon hectori Hector's Beaked Whale 41120008 DEH 990 TEP Marine mammal Ziphiidae Mesoplodon layardii Strap-toothed Beaked Whale 41120009 DEH 991 TEP Marine mammal Ziphiidae Mesoplodon mirus True's Beaked Whale 41120010 DEH
1030 TEP Marine mammal Ziphiidae Tasmacetus shepherdi Tasman Beaked Whale 41120011 DEH 1098 TEP Marine mammal Ziphiidae Ziphius cavirostris Cuvier's Beaked Whale 41120012 DEH 216 TEP Marine mammal Otariidae Arctocephalus forsteri New Zealand Fur-seal 41131001 DEH
253 TEP Marine mammal Otariidae Arctocephalus pusillus doriferus Australian Fur Seal 41131003 DEH
263 TEP Marine mammal Otariidae Arctocephalus tropicalis Subantarctic fur seal 41131004 DEH 1000 TEP Marine mammal Otariidae Neophoca cinerea Australian Sea-lion 41131005 DEH 295 TEP Marine mammal Phocidae Hydrurga leptonyx Leopard seal 41136001 DEH 993 TEP Marine mammal Phocidae Mirounga leonina Elephant seal 41136004 DEH 813 TEP Marine mammal Dugongidae Dugong dugon Dugong 41206001 DEH 324 TEP Marine reptile Cheloniidae Caretta caretta Loggerhead 39020001 DEH 541 TEP Marine reptile Cheloniidae Chelonia mydas Green turtle 39020002 DEH 822 TEP Marine reptile Cheloniidae Eretmochelys imbricata Hawksbill turtle 39020003 DEH 613 TEP Marine reptile Dermochelyidae Dermochelys coriacea Leathery turtle 39021001 DEH

Scoping
27
ERAEF species
ID
Role in fishery
(Component) Taxa Family name Scientific name Common Name CAAB code Reference 1408 TEP Marine reptile Hydrophiidae Acalyptophis peronii Horned Seasnake 39125001 DEH 254 TEP Marine reptile Hydrophiidae Astrotia stokesii Stokes' seasnake 39125009 DEH
1530 TEP Marine reptile Hydrophiidae Disteira kingii spectacled seasnake 39125010 DEH 957 TEP Marine reptile Hydrophiidae Hydrophis elegans Elegant seasnake 39125021 DEH
1423 TEP Marine reptile Hydrophiidae Hydrophis ornatus seasnake 39125028 DEH 1005 TEP Marine reptile Hydrophiidae Pelamis platurus yellow-bellied seasnake 39125033 DEH
1074 TEP Teleost Solenostomidae Solenostomus cyanopterus Blue-finned Ghost Pipefish, Robust Ghost 37281001 DEH
1075 TEP Teleost Solenostomidae Solenostomus paradoxus Harlequin Ghost Pipefish, Ornate Ghost Pipefish 37281002 DEH
1010 TEP Teleost Syngnathidae Phycodurus eques Leafy Seadragon 37282001 DEH
1011 TEP Teleost Syngnathidae Phyllopteryx taeniolatus Weedy Seadragon, Common Seadragon 37282002 DEH
320 TEP Teleost Syngnathidae Solegnathus guentheri Indonesian Pipefish, Gunther's Pipehorse 37282003 DEH
1072 TEP Teleost Syngnathidae Solegnathus robustus Robust Spiny Pipehorse, Robust Pipehorse 37282004 DEH
549 TEP Teleost Syngnathidae Hippocampus angustus Western Spiny Seahorse 37282005 DEH
1089 TEP Teleost Syngnathidae Trachyrhamphus bicoarctatus Bend Stick Pipefish, Short-tailed Pipefish 37282006 DEH
1092 TEP Teleost Syngnathidae Urocampus carinirostris Hairy Pipefish 37282008 DEH 980 TEP Teleost Syngnathidae Lissocampus runa Javelin Pipefish 37282009 DEH 946 TEP Teleost Syngnathidae Hippocampus bleekeri pot bellied seahorse 37282010 DEH
953 TEP Teleost Syngnathidae Histiogamphelus briggsii Briggs' Crested Pipefish, Briggs' Pipefish 37282011 DEH
961 TEP Teleost Syngnathidae Hypselognathus rostratus Knife-snouted Pipefish 37282012 DEH 978 TEP Teleost Syngnathidae Leptoichthys fistularius Brushtail Pipefish 37282013 DEH 966 TEP Teleost Syngnathidae Kaupus costatus Deep-bodied Pipefish 37282014 DEH 995 TEP Teleost Syngnathidae Mitotichthys semistriatus Half-banded Pipefish 37282015 DEH
979 TEP Teleost Syngnathidae Lissocampus caudalis Australian Smooth Pipefish, Smooth Pipefish 37282016 DEH
1026 TEP Teleost Syngnathidae Stigmatopora argus Spotted Pipefish 37282017 DEH
1027 TEP Teleost Syngnathidae Stigmatopora nigra Wide-bodied Pipefish, Black Pipefish 37282018 DEH
1028 TEP Teleost Syngnathidae Stipecampus cristatus Ring-backed Pipefish 37282019 DEH

Scoping
28
ERAEF species
ID
Role in fishery
(Component) Taxa Family name Scientific name Common Name CAAB code Reference 1061 TEP Teleost Syngnathidae Pugnaso curtirostris Pug-nosed Pipefish 37282021 DEH 994 TEP Teleost Syngnathidae Mitotichthys mollisoni Mollison's Pipefish 37282022 DEH 1094 TEP Teleost Syngnathidae Vanacampus phillipi Port Phillip Pipefish 37282023 DEH
1095 TEP Teleost Syngnathidae Vanacampus poecilolaemus
Australian Long-snout Pipefish, Long-snouted Pipefish 37282024 DEH
996 TEP Teleost Syngnathidae Mitotichthys tuckeri Tucker's Pipefish 37282025 DEH
947 TEP Teleost Syngnathidae Hippocampus breviceps Short-head Seahorse, Short-snouted Seaho 37282026 DEH
952 TEP Teleost Syngnathidae Hippocampus whitei white's seahorse 37282027 DEH 1073 TEP Teleost Syngnathidae Solegnathus spinosissimus spiny pipehorse 37282029 DEH 938 TEP Teleost Syngnathidae Halicampus grayi Mud Pipefish, Gray's Pipefish 37282030 DEH
949 TEP Teleost Syngnathidae Hippocampus taeniopterus Spotted Seahorse, Yellow Seahorse 37282033 DEH
105 TEP Teleost Syngnathidae Acentronura australe Southern Pygmy Pipehorse 37282034 DEH 114 TEP Teleost Syngnathidae Acentronura breviperula Hairy Pygmy Pipehorse 37282035 DEH 287 TEP Teleost Syngnathidae Campichthys galei Gale's Pipefish 37282039 DEH 288 TEP Teleost Syngnathidae Campichthys tryoni Tryon's Pipefish 37282041 DEH 389 TEP Teleost Syngnathidae Choeroichthys suillus Pig-snouted Pipefish 37282046 DEH
563 TEP Teleost Syngnathidae Corythoichthys amplexus Fijian Banded Pipefish, Brown-banded Pipefish 37282047 DEH
578 TEP Teleost Syngnathidae Corythoichthys ocellatus Orange-spotted Pipefish, Ocellated Pipefish 37282050 DEH
401 TEP Teleost Syngnathidae Cosmocampus banneri Roughridge Pipefish 37282053 DEH 580 TEP Teleost Syngnathidae Cosmocampus howensis Lord Howe Pipefish 37282055 DEH 569 TEP Teleost Syngnathidae Doryrhamphus melanopleura Bluestripe Pipefish 37282058 DEH 904 TEP Teleost Syngnathidae Festucalex cinctus Girdled Pipefish 37282061 DEH 321 TEP Teleost Syngnathidae Festucalex scalaris Ladder Pipefish 37282063 DEH 914 TEP Teleost Syngnathidae Filicampus tigris Tiger Pipefish 37282064 DEH 54 TEP Teleost Syngnathidae Halicampus brocki Brock's Pipefish 37282065 DEH
1592 TEP Teleost Syngnathidae Halicampus macrorhynchus [a pipefish] 37282067 DEH 942 TEP Teleost Syngnathidae Heraldia nocturna Upside-down Pipefish 37282071 DEH
943 TEP Teleost Syngnathidae Hippichthys cyanospilos Blue-speckled Pipefish, Blue-spotted Pipefish 37282072 DEH

Scoping
29
ERAEF species
ID
Role in fishery
(Component) Taxa Family name Scientific name Common Name CAAB code Reference 944 TEP Teleost Syngnathidae Hippichthys heptagonus Madura Pipefish 37282073 DEH
945 TEP Teleost Syngnathidae Hippichthys penicillus Beady Pipefish, Steep-nosed Pipefish 37282075 DEH
951 TEP Teleost Syngnathidae Hippocampus planifrons Flat-face Seahorse 37282078 DEH
954 TEP Teleost Syngnathidae Histiogamphelus cristatus Rhino Pipefish, Macleay's Crested Pipefish 37282081 DEH
960 TEP Teleost Syngnathidae Hypselognathus horridus Shaggy Pipefish, Prickly Pipefish 37282082 DEH
967 TEP Teleost Syngnathidae Kimblaeus bassensis Trawl Pipefish, Kimbla Pipefish 37282083 DEH 390 TEP Teleost Syngnathidae Lissocampus fatiloquus Prophet's Pipefish 37282084 DEH 983 TEP Teleost Syngnathidae Maroubra perserrata Sawtooth Pipefish 37282085 DEH
992 TEP Teleost Syngnathidae Micrognathus andersonii Anderson's Pipefish, Shortnose Pipefish 37282086 DEH
1604 TEP Teleost Syngnathidae Micrognathus pygmaeus [a pipefish] 37282087 DEH
798 TEP Teleost Syngnathidae Microphis manadensis Manado River Pipefish, Manado Pipefish 37282091 DEH
1243 TEP Teleost Syngnathidae Mitotichthys meraculus Western Crested Pipefish 37282092 DEH 1242 TEP Teleost Syngnathidae Nannocampus subosseus Bony-headed Pipefish 37282094 DEH 1001 TEP Teleost Syngnathidae Notiocampus ruber Red Pipefish 37282095 DEH 1070 TEP Teleost Syngnathidae Solegnathus dunckeri Duncker's Pipehorse 37282098 DEH
1071 TEP Teleost Syngnathidae Solegnathus sp. 1 [in Kuiter, 2000] Pipehorse 37282099 DEH
1029 TEP Teleost Syngnathidae Syngnathoides biaculeatus Double-ended Pipehorse, Alligator Pipefish 37282100 DEH
1093 TEP Teleost Syngnathidae Vanacampus margaritifer Mother-of-pearl Pipefish 37282102 DEH 1096 TEP Teleost Syngnathidae Vanacampus vercoi Verco's Pipefish 37282103 DEH 950 TEP Teleost Syngnathidae Hippocampus minotaur Bullneck Seahorse 37282105 DEH
1591 TEP Teleost Syngnathidae Halicampus boothae [a pipefish] 37282107 DEH
948 TEP Teleost Syngnathidae Hippocampus queenslandicus Kellogg's Seahorse 37282110 DEH
1602 TEP Teleost Syngnathidae Hippocampus tristis [a pipefish] 37282117 DEH
1664 TEP Teleost Syngnathidae Hippocampus abdominalis Big-bellied / southern potbellied seahorse 37282120 DEH
548 TEP Teleost Syngnathidae Hippocampus subelongatus West Australian Seahorse 37282123 DEH
1548 TEP Teleost Syngnathidae Heraldia sp. 1 [in Kuiter, 2000] Western upsidedown pipefish 37282130 DEH

Scoping
30
ERAEF species
ID
Role in fishery
(Component) Taxa Family name Scientific name Common Name CAAB code Reference 308 TEP Teleost Clinidae Heteroclinus perspicillatus Common weedfish 37416013 DEH
1666 TEP Teleost Syngnathidae Hippocampus kelloggi Kellogg's Seahorse NA DEH
1667 TEP Teleost Syngnathidae Hippocampus kuda Spotted Seahorse, Yellow Seahorse NA DEH
1668 TEP Teleost Syngnathidae Hippocampus subelongatus West Australian Seahorse NA DEH 1699 TEP Teleost Syngnathidae Idiotropiscis australe Southern Pygmy Pipehorse NA DEH
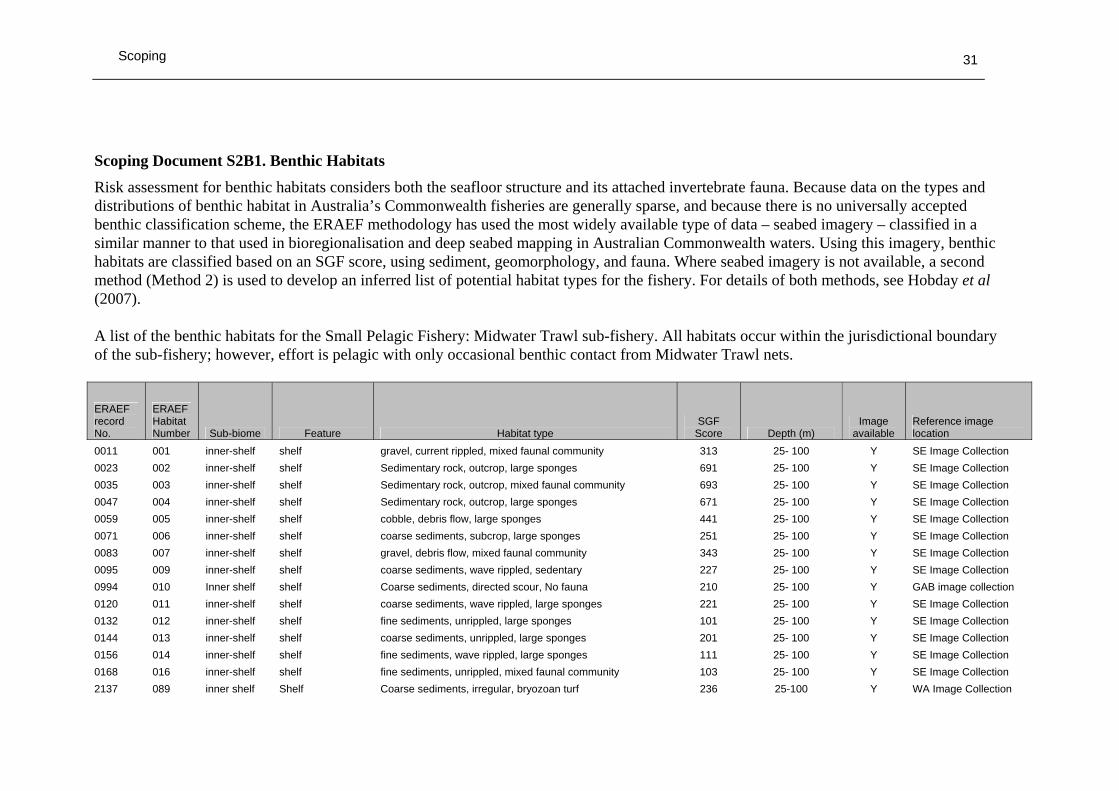
Scoping
31
Scoping Document S2B1. Benthic Habitats
Risk assessment for benthic habitats considers both the seafloor structure and its attached invertebrate fauna. Because data on the types and distributions of benthic habitat in Australia’s Commonwealth fisheries are generally sparse, and because there is no universally accepted benthic classification scheme, the ERAEF methodology has used the most widely available type of data – seabed imagery – classified in a similar manner to that used in bioregionalisation and deep seabed mapping in Australian Commonwealth waters. Using this imagery, benthic habitats are classified based on an SGF score, using sediment, geomorphology, and fauna. Where seabed imagery is not available, a second method (Method 2) is used to develop an inferred list of potential habitat types for the fishery. For details of both methods, see Hobday et al (2007). A list of the benthic habitats for the Small Pelagic Fishery: Midwater Trawl sub-fishery. All habitats occur within the jurisdictional boundary of the sub-fishery; however, effort is pelagic with only occasional benthic contact from Midwater Trawl nets.
ERAEF record No.
ERAEF Habitat Number Sub-biome Feature Habitat type
SGF Score Depth (m)
Image available
Reference image location
0011 001 inner-shelf shelf gravel, current rippled, mixed faunal community 313 25- 100 Y SE Image Collection 0023 002 inner-shelf shelf Sedimentary rock, outcrop, large sponges 691 25- 100 Y SE Image Collection 0035 003 inner-shelf shelf Sedimentary rock, outcrop, mixed faunal community 693 25- 100 Y SE Image Collection 0047 004 inner-shelf shelf Sedimentary rock, outcrop, large sponges 671 25- 100 Y SE Image Collection 0059 005 inner-shelf shelf cobble, debris flow, large sponges 441 25- 100 Y SE Image Collection 0071 006 inner-shelf shelf coarse sediments, subcrop, large sponges 251 25- 100 Y SE Image Collection 0083 007 inner-shelf shelf gravel, debris flow, mixed faunal community 343 25- 100 Y SE Image Collection 0095 009 inner-shelf shelf coarse sediments, wave rippled, sedentary 227 25- 100 Y SE Image Collection 0994 010 Inner shelf shelf Coarse sediments, directed scour, No fauna 210 25- 100 Y GAB image collection 0120 011 inner-shelf shelf coarse sediments, wave rippled, large sponges 221 25- 100 Y SE Image Collection 0132 012 inner-shelf shelf fine sediments, unrippled, large sponges 101 25- 100 Y SE Image Collection 0144 013 inner-shelf shelf coarse sediments, unrippled, large sponges 201 25- 100 Y SE Image Collection 0156 014 inner-shelf shelf fine sediments, wave rippled, large sponges 111 25- 100 Y SE Image Collection 0168 016 inner-shelf shelf fine sediments, unrippled, mixed faunal community 103 25- 100 Y SE Image Collection 2137 089 inner shelf Shelf Coarse sediments, irregular, bryozoan turf 236 25-100 Y WA Image Collection

Scoping
32
ERAEF record No.
ERAEF Habitat Number Sub-biome Feature Habitat type
SGF Score Depth (m)
Image available
Reference image location
0868 090 inner-shelf shelf coarse sediments, current rippled, bioturbators 219 25- 100 N SE Image Collection 0880 091 inner-shelf shelf fine sediments, irregular, large sponges 131 25- 100 N SE Image Collection 0892 092 inner-shelf shelf fine sediments, irregular, small sponges 132 25- 100 N SE Image Collection 0904 093 inner-shelf shelf fine sediments, unrippled, bioturbators 109 25- 100 N SE Image Collection 0916 094 inner-shelf shelf fine sediments, unrippled, small sponges 102 25- 100 N SE Image Collection 2133 095 inner shelf Shelf Fine sediments, Wave rippled, No fauna 120 25-100 Y WA Image Collection 0941 096 inner-shelf shelf fine sediments, wave rippled, small sponges 122 25- 100 N SE Image Collection 0953 097 inner-shelf shelf gravel, wave rippled, bioturbators 329 25- 100 Y SE Image Collection 0965 098 inner-shelf shelf gravel, wave rippled, no fauna 320 25- 100 Y SE Image Collection
Scoping Document S2B2. Pelagic Habitats
A list of the pelagic habitats for the Small Pelagic Fishery: Midwater Trawl. Shading denotes habitats occurring within the jurisdictional boundary of the sub-fishery that are not subject to effort from Midwater Trawling.
ERAEF Habitat Number Pelagic Habitat type Depth (m) Comments Reference P1 Eastern Pelagic Province - Coastal 0 – 200 dow167A1, A2, A4 P2 Eastern Pelagic Province - Oceanic 0 – > 600 this is a compilation of the range covered by Oceanic Community (1) and (2) dow167A1, A2, A4 P7 Southern Pelagic Province - Coastal 0 – 200 this is a compilation of the range covered by Coastal pelagic Tas and GAB dow167A1, A2, A4 P8 Southern Pelagic Province - Oceanic 0 – > 600 this is a compilation of the range covered by Oceanic Communities (1), (2), and (3) dow167A1, A2, A4
P9 Southern Pelagic Province - Seamount Oceanic 0 – > 600 this is a compilation of the range covered by Seamount Oceanic Communities (1), (2), and (3) dow167A1, A2, A4
P12 Eastern Pelagic Province - Seamount Oceanic 0 – > 600 this is a compilation of the range covered by Seamount Oceanic Communities (1) and (2) dow167A1, A2, A4

Scoping
33
Scoping Document S2C1. Demersal communities
In ERAEF, communities are defined as the set of species assemblages that occupy the large scale provinces and biomes identified from national bioregionalisation studies. The biota includes mobile fauna, both vertebrate and invertebrate, but excludes sessile organisms such as corals that are largely structural and are used to identify benthic habitats. The same community lists are used for all fisheries, with those selected as relevant for a particular fishery being identified on the basis of spatial overlap with effort in the fishery. The spatial boundaries for demersal communities are based on IMCRA boundaries for the shelf, and on slope bioregionalisation for the slope (IMCRA 1998; Last et al. 2005). The spatial boundaries for the pelagic communities are based on pelagic bioregionalisation and on oceanography (Condie et al. 2003; Lyne and Hayes 2004). Fishery and region specific modifications to these boundaries are described in detail in Hobday et al. (2007) and briefly outlined in the footnotes to the community Tables below. .
Demersal community Cap
e
Nor
th E
aste
rn
Tran
sitio
n
Nor
th E
aste
rn
Cen
tral E
aste
rn
Tran
sitio
n
Cen
tral E
aste
rn
Sou
th E
aste
rn
Tran
sitio
n
Cen
tral B
ass
Tasm
ania
n
Wes
tern
Tas
Tr
ansi
tion
Sout
hern
Sou
th W
este
rn
Tran
sitio
n
Cen
tral
Wes
tern
Cen
tral
Wes
tern
Tr
ansi
tion
Nor
th W
este
rn
Nor
th W
este
rn
Tran
sitio
n
Tim
or
Tim
or
Tran
sitio
n
Hea
rd &
M
cDon
ald
Is
Mac
quar
ie Is
Inner Shelf 0 – 110m 1,2 Outer Shelf 110 – 250m 1,2, x x Upper Slope 250 – 565m 3 x x Mid–Upper Slope 565 – 820m3 x x Mid Slope 820 – 1100m3 x x Lower slope/ Abyssal > 1100m6 Reef 0 -110m7, 8 Reef 110-250m8 Seamount 0 – 110m Seamount 110- 250m Seamount 250 – 565m Seamount 565 – 820m Seamount 820 – 1100m Seamount 1100 – 3000m

Scoping
34
Demersal community Cap
e
Nor
th E
aste
rn
Tran
sitio
n
Nor
th E
aste
rn
Cen
tral E
aste
rn
Tran
sitio
n
Cen
tral E
aste
rn
Sou
th E
aste
rn
Tran
sitio
n
Cen
tral B
ass
Tasm
ania
n
Wes
tern
Tas
Tr
ansi
tion
Sout
hern
Sou
th W
este
rn
Tran
sitio
n
Cen
tral
Wes
tern
Cen
tral
Wes
tern
Tr
ansi
tion
Nor
th W
este
rn
Nor
th W
este
rn
Tran
sitio
n
Tim
or
Tim
or
Tran
sitio
n
Hea
rd &
M
cDon
ald
Is
Mac
quar
ie Is
Plateau 0 – 110m Plateau 110- 250m4 Plateau 250 – 565m4 Plateau 565 – 820m5 Plateau 820 – 1100m5 Demersal communities which underlie the pelagic communities in the Small Pelagic midwater trawl sub-fishery (x). Shaded cells indicate all communities within the province. 1 Four inner shelf communities occur in the Timor Transition (Arafura, Groote, Cape York and Gulf of Carpentaria) and three inner shelf communities occur in the Southern (Eyre, Eucla and South West Coast). At Macquarie Is: 2inner & outer shelves (0-250m), and 3upper and midslope communities combined (250-1000m). At Heard/McDonald Is: 4outer and upper slope plateau communities combined to form four communities: Shell Bank, inner and outer Heard Plateau (100-500m) and Western Banks (200-500m), 5mid and upper plateau communities combined into 3 trough, southern slope and North Eastern plateau communities (500-1000m), and 6 3 groups at Heard Is: Deep Shell Bank (>1000m), Southern and North East Lower slope/abyssal, 7Great Barrier Reef in the North Eastern Province and Transition and 8 Rowley Shoals in North Western Transition

Scoping
35
Scoping Document S2C2. Pelagic communities Pelagic communities in which fishing activity occurs in Small Pelagic midwater trawl sub-fishery (x). Shaded cells indicate all communities that exist in the province.
Pelagic community Nor
thea
ster
n
Eas
tern
Sou
ther
n
Wes
tern
Nor
ther
n
Nor
thw
este
rn
Hea
rd a
nd
McD
onal
d Is
2
Mac
quar
ie Is
Coastal pelagic 0-200m1,2 x Oceanic (1) 0 – 600m Oceanic (2) >600m Seamount oceanic (1) 0 – 600m Seamount oceanic (2) 600-3000m Oceanic (1) 0 – 200m x Oceanic (2) 200-600m Oceanic (3) >600m Seamount oceanic (1) 0 – 200m Seamount oceanic (2) 200 – 600m Seamount oceanic (3) 600-3000m Oceanic (1) 0-400m Oceanic (2) >400m Oceanic (1) 0-800m Oceanic (2) >800m Plateau (1) 0-600m Plateau (2) >600m Heard Plateau 0-1000m3 Oceanic (1) 0-1000m Oceanic (2) >1000m Oceanic (1) 0-1600m Oceanic (2) >1600m
1 Northern Province has five coastal pelagic zones (NWS, Bonaparte, Arafura, Gulf and East Cape York) and Southern Province has two zones (Tas, GAB). 2 At Macquarie Is: coastal pelagic zone to 250m. 3 At Heard and McDonald Is: coastal pelagic zone broadened to cover entire plateau to maximum of 1000m.

Scoping
36
2.2.3 Identification of Objectives for Components and Sub-components (Step 3)
Objectives are identified for each sub-fishery for the five ecological components (target, bycatch/byproduct, TEP, habitats, and communities) and sub-components, and are clearly documented. It is important to identify objectives that managers, the fishing industry, and other stakeholders can agree on, and that scientists can quantify and assess. The criteria for selecting ecological operational objectives for risk assessment are that they:
• be biologically relevant; • have an unambiguous operational definition; • be accessible to prediction and measurement; and • that the quantities they relate to be exposed to the hazards.
For fisheries that have completed ESD reports, use can be made of the operational objectives stated in those reports. Each ‘operational objective’ is matched to example indicators. Scoping Document S3 provides suggested examples of operational objectives and indicators. Where operational objectives are already agreed for a fishery (Existing Management Objectives), those should be used (e.g. Strategic Assessment Reports). The objectives need not be exactly specified, with regard to numbers or fractions of removal/impact, but should indicate that an impact in the sub-component is of concern/interest to the sub-fishery. The rationale for including or discarding an operational objective is a crucial part of the table and must explain why the particular objective has or has not been selected for in the (sub) fishery. Only the operational objectives selected for inclusion in the (sub) fishery are used for Level 1 analysis (Level 1 SICA Document L1.1).

Scoping
37
Scoping Document S3 Components and Sub-components Identification of Objectives
Table (Note: Operational objectives that are eliminated should be shaded out and a rationale provided as for the retained operational objectives) Component Core Objective Sub-component Example Operational
Objectives Example Indicators
Rationale
“What is the general goal?”
"What you are specifically trying to achieve"
"What you are going to use to measure performance"
Rationale flagged as ‘EMO’ where Existing Management Objective in place
1. Population size
1.1 No trend in biomass 1.2 Maintain biomass above a specified level 1.3 Maintain catch at specified level 1.4 Species do not approach extinction or become extinct
Biomass, numbers, density, CPUE, yield
1.1 EMO – Catch levels set to ensure a high probability the population is maintained. 1.2 EMO - set Total Allowable Catch (TAC) for target species. Trigger catch limits of target species is being used to manage fishing effort in each zone. 1.3 EMO – Current catch levels set to ensure it should not fall below 50% of TAC
2. Geographic range
2.1 Geographic range of the population, in terms of size and continuity does not change outside acceptable bounds
Presence of population across space
2.1 Fishery managed in four zones and there are trigger catch limits for target species in each zone.
3- Genetic structure
- Genetic diversity does not change outside acceptable bounds
Frequency of genotypes in the population, effective population size (Ne), number of spawning units
3.1- Not currently monitored in this fishery, difficult and expected to respond at a slower rate than some of the other indicators.
Target species
Avoid recruitment failure of the target species Avoid negative consequences for species or population sub-components
4. Age/size/sex structure
4.1 Age/size/sex structure does not change outside acceptable bounds (e.g. more than X% from reference structure)
Biomass, numbers or relative proportion in age/size/sex classes Biomass of spawners Mean size, sex ratio
4.1 Maintain population size and age structure. Fishery catches can be dominated by few age classes. Need to ensure this does not adversely impact on the entire population
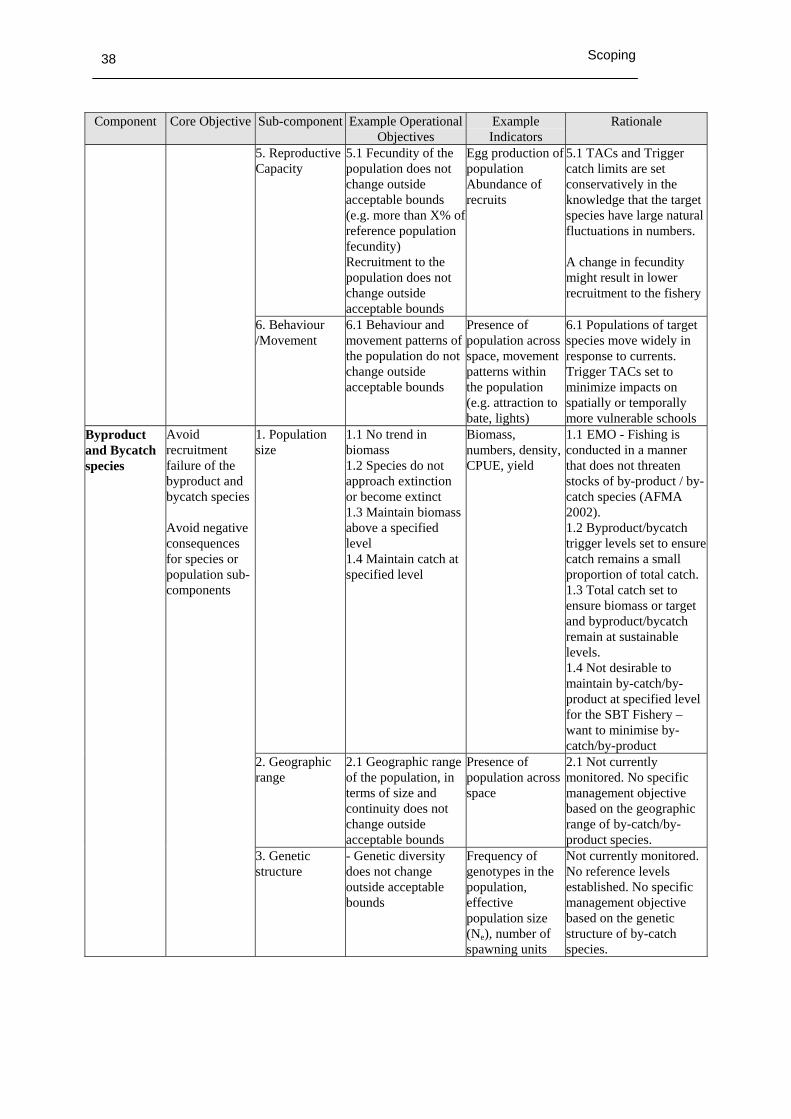
Scoping
38
Component Core Objective Sub-component Example Operational Objectives
Example Indicators
Rationale
5. Reproductive Capacity
5.1 Fecundity of the population does not change outside acceptable bounds (e.g. more than X% of reference population fecundity) Recruitment to the population does not change outside acceptable bounds
Egg production of population Abundance of recruits
5.1 TACs and Trigger catch limits are set conservatively in the knowledge that the target species have large natural fluctuations in numbers. A change in fecundity might result in lower recruitment to the fishery
6. Behaviour /Movement
6.1 Behaviour and movement patterns of the population do not change outside acceptable bounds
Presence of population across space, movement patterns within the population (e.g. attraction to bate, lights)
6.1 Populations of target species move widely in response to currents. Trigger TACs set to minimize impacts on spatially or temporally more vulnerable schools
1. Population size
1.1 No trend in biomass 1.2 Species do not approach extinction or become extinct 1.3 Maintain biomass above a specified level 1.4 Maintain catch at specified level
Biomass, numbers, density, CPUE, yield
1.1 EMO - Fishing is conducted in a manner that does not threaten stocks of by-product / by-catch species (AFMA 2002). 1.2 Byproduct/bycatch trigger levels set to ensure catch remains a small proportion of total catch. 1.3 Total catch set to ensure biomass or target and byproduct/bycatch remain at sustainable levels. 1.4 Not desirable to maintain by-catch/by-product at specified level for the SBT Fishery – want to minimise by-catch/by-product
2. Geographic range
2.1 Geographic range of the population, in terms of size and continuity does not change outside acceptable bounds
Presence of population across space
2.1 Not currently monitored. No specific management objective based on the geographic range of by-catch/by-product species.
Byproduct and Bycatch species
Avoid recruitment failure of the byproduct and bycatch species Avoid negative consequences for species or population sub-components
3. Genetic structure
- Genetic diversity does not change outside acceptable bounds
Frequency of genotypes in the population, effective population size (Ne), number of spawning units
Not currently monitored. No reference levels established. No specific management objective based on the genetic structure of by-catch species.
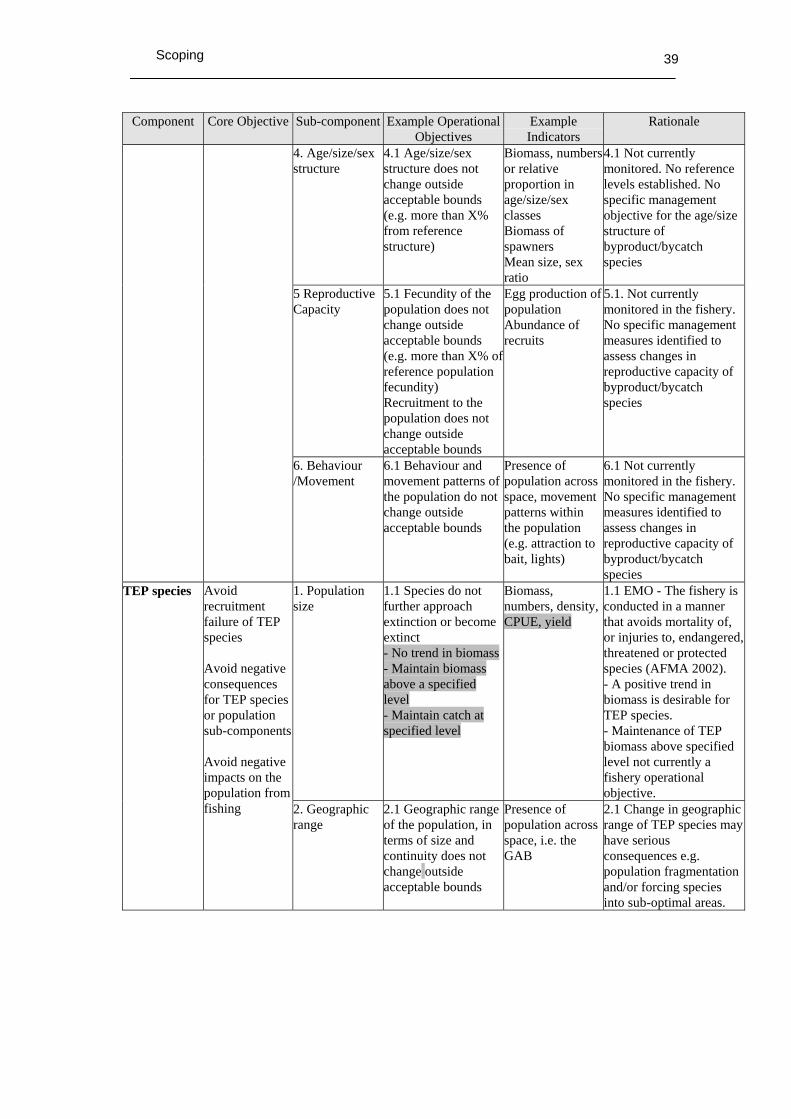
Scoping
39
Component Core Objective Sub-component Example Operational Objectives
Example Indicators
Rationale
4. Age/size/sex structure
4.1 Age/size/sex structure does not change outside acceptable bounds (e.g. more than X% from reference structure)
Biomass, numbers or relative proportion in age/size/sex classes Biomass of spawners Mean size, sex ratio
4.1 Not currently monitored. No reference levels established. No specific management objective for the age/size structure of byproduct/bycatch species
5 Reproductive Capacity
5.1 Fecundity of the population does not change outside acceptable bounds (e.g. more than X% of reference population fecundity) Recruitment to the population does not change outside acceptable bounds
Egg production of population Abundance of recruits
5.1. Not currently monitored in the fishery. No specific management measures identified to assess changes in reproductive capacity of byproduct/bycatch species
6. Behaviour /Movement
6.1 Behaviour and movement patterns of the population do not change outside acceptable bounds
Presence of population across space, movement patterns within the population (e.g. attraction to bait, lights)
6.1 Not currently monitored in the fishery. No specific management measures identified to assess changes in reproductive capacity of byproduct/bycatch species
1. Population size
1.1 Species do not further approach extinction or become extinct - No trend in biomass- Maintain biomass above a specified level - Maintain catch at specified level
Biomass, numbers, density, CPUE, yield
1.1 EMO - The fishery is conducted in a manner that avoids mortality of, or injuries to, endangered, threatened or protected species (AFMA 2002). - A positive trend in biomass is desirable for TEP species. - Maintenance of TEP biomass above specified level not currently a fishery operational objective.
TEP species Avoid recruitment failure of TEP species Avoid negative consequences for TEP species or population sub-components Avoid negative impacts on the population from fishing 2. Geographic
range 2.1 Geographic range of the population, in terms of size and continuity does not change outside acceptable bounds
Presence of population across space, i.e. the GAB
2.1 Change in geographic range of TEP species may have serious consequences e.g. population fragmentation and/or forcing species into sub-optimal areas.

Scoping
40
Component Core Objective Sub-component Example Operational Objectives
Example Indicators
Rationale
3. Genetic structure
3.1 Genetic diversity does not change outside acceptable bounds
Frequency of genotypes in the population, effective population size (Ne), number of spawning units
3.1 Because population size of TEP species is often small, TEPs are sensitive to loss of genetic diversity. Genetic monitoring may be an effective approach to measure possible fishery impacts.
4. Age/size/sex structure
4.1 Age/size/sex structure does not change outside acceptable bounds (e.g. more than X% from reference structure)
Biomass, numbers or relative proportion in age/size/sex classes Biomass of spawners Mean size, sex ratio
4.1 Monitoring the age/size/sex structure of TEP populations may be a useful management tool allowing the identification of possible fishery impacts and that cross-section of the population most at risk.
5. Reproductive Capacity
5.1 Fecundity of the population does not change outside acceptable bounds (e.g. more than X% of reference population fecundity) 5.2 Recruitment to the population does not change outside acceptable bounds
Egg production of population Abundance of recruits
5.1 & 5.2 The reproductive capacity of TEP species is of concern to the Small Pelagics Fishery because potential fishery induced changes in reproductive ability (e.g. reduction in bait fish reduction in seabird brooding success) may have immediate impact on the population size of TEP species.
6. Behaviour /Movement
6.1 Behaviour and movement patterns of the population do not change outside acceptable bounds
Presence of population across space, movement patterns within the population (e.g. attraction to bait, lights)
6.1 Purse seine capture methods may attract TEP species and alter behaviour and movement patterns, resulting in the attraction of offshore species to inshore areas e.g. great white shark. The overall effect may be to further fragment the population. Fishing operations may also influence the behaviour of calving whales by visual/sound stimuli.

Scoping
41
Component Core Objective Sub-component Example Operational Objectives
Example Indicators
Rationale
7. Interactions with fishery
7.1 Interactions between TEP and the fishery are minimised. 7.2 Survival after interactions is maximised 7.3 Interactions do not affect the viability of the population or its ability to recover
Number of interactions Survival rate of species after interactions Number of interactions, biomass or numbers in population
7.1, 7.2, 7.3 EMO - The fishery is conducted in a manner that avoids mortality of, or injuries to, endangered, threatened or protected species (AFMA 2002).
1. Water quality 1.1 Water quality does not change outside acceptable bounds
Water chemistry, noise levels, debris levels, turbidity levels, pollutant concentrations, light pollution from artificial light
1.1 Few water quality issues because of the dispersed nature of the fishery and low levels in fishing effort.
- Air quality - Air quality does not change outside acceptable bounds
Air chemistry, noise levels, visual pollution, pollutant concentrations, light pollution from artificial light
- Not currently perceived as an important habitat sub-component, purse seine operations not believed to strongly influence air quality.
- Substrate quality
- Sediment quality does not change outside acceptable bounds
Sediment chemistry, stability, particle size, debris, pollutant concentrations
- Purse-seining and midwater trawling do not impact on the substrate so there is not perceived effects from this fishery.
- Habitat types - Relative abundance of habitat types does not vary outside acceptable bounds
Extent and area of habitat types, % cover, spatial pattern, landscape scale
- Purse seine operations not perceived to result in change of habitat frequency.
Habitats Avoid negative impacts on the quality of the environment Avoid reduction in the amount and quality of habitat
2. Habitat structure and function
2.1 Size, shape and condition of habitat types does not vary outside acceptable bounds
Size structure, species composition and morphology of biotic habitats
2.1 Purse seining and midwater trawling activities may result in local disruption to pelagic processes
Communities Avoid negative impacts on the composition/ function/ distribution/ structure of the community
1. Species composition
1.1 Species composition of communities does not vary outside acceptable bounds
Species presence/absence, species numbers or biomass (relative or absolute) Richness Diversity indices Evenness indices
1.1 EMO - The fishery is conducted, in a manner that minimises the impact of fishing operations on ecological communities (AFMA 2002).

Scoping
42
Component Core Objective Sub-component Example Operational Objectives
Example Indicators
Rationale
2. Functional group composition
2.1 Functional group composition does not change outside acceptable bounds
Number of functional groups, species per functional group (e.g. autotrophs, filter feeders, herbivores, omnivores, carnivores)
2.1 The presence/abundance of ‘functional group’ members may fluctuate widely, however in terms of maintenance of ecosystem processes it is important that the aggregate effect of a functional group is maintained.
3. Distribution of the community
3.1 Community range does not vary outside acceptable bounds
Geographic range of the community, continuity of range, patchiness
3.1 There may be changes to the geographic extent of pelagic community components due to associated fishing activities.
4. Trophic/size structure
4.1 Community size spectra/trophic structure does not vary outside acceptable bounds
Size spectra of the community Number of octaves, Biomass/number in each size class Mean trophic level Number of trophic levels
4.1 Extraction of Small Pelagics may reduce the prey of the higher level predator functional group in the Zone 4 potentially resulting in migratory or behavioural shifts in predator species like SBT and seals.
5 Bio- and geo-chemical cycles
5.1 Cycles do not vary outside acceptable bounds
Indicators of cycles, salinity, carbon, nitrogen, phosphorus flux
5.1 Purse seine and midwater trawl operations not perceived to have a measurable effect on bio and geochemical cycles.

Scoping
43
2.2.4 Hazard Identification (Step 4)
Hazards are the activities undertaken in the process of fishing, and any external activities, which have the potential to lead to harm. The effects of fishery/sub-fishery specific hazards are identified under the following categories:
• capture • direct impact without capture • addition/movement of biological material • addition of non biological material • disturbance of physical processes • external hazards
These fishing and external activities are scored on a presence/absence basis for each fishery/sub-fishery. An activity is scored as a zero if it does not occur and as a one if it does occur. The rationale for the scoring is also documented in detail and must include if/how the activity occurs and how the hazard may impact on organisms/habitat.

Scoping
44
Scoping Document S4. Hazard Identification Scoring Sheet
Fishery Name: Small Pelagics Fishery Sub-fishery Name: Midwater trawl sub-fishery Date: 29 May 2006 Direct impact of Fishing
Fishing Activity
Score (0/1)
Documentation of Rationale
Bait collection 0 Bait not required by fishery. Fishing 1 Actual fishing, i.e. capture of small pelagic species
resulting from deployment and retrieval of midwater trawl net including target, bycatch, byproduct and TEP species caught but not landed.
Capture
Incidental behaviour
0
Bait collection 0 Not required by fishery. Fishing 1 Disorientation/injury/mortality as a result of
momentary entanglement in net but animal may free itself, e.g. dolphin, escaping target species. Birds may strike trawl warps.
Incidental behaviour
0
Gear loss 1 Minor components: occasionally lost. Potential lost items could entangle animals includes netting, ropes, buoys, etc. – Observer data needed. Major component gear loss: Midwater trawl nets are extremely expensive and simple commercial considerations predicate cautious deployment. Major gear loss is likely to be infrequent.
Anchoring/ mooring
0 Fishery only operates in deep water; boats do not anchor at night, when not fishing.
Direct impact without capture
Navigation/steaming
1 Steaming/navigation to find aggregations of fish may result in collisions (e.g. seabirds or whales vessel interactions), seabird collisions with night-time lights/navigation lights.
Translocation of species (boat launching, reballasting)
0 No bait used. Vessels do not launch or travel inter-state to fish
On board processing
0
Discarding catch 1 Discarding is limited, but may attract predators. Stock enhancement
0
Provisioning 0
Addition/ movement of biological material
Organic waste disposal
1 Disposal of organic wastes (food scraps, sewage) occurs as a result of general fishing vessel operations, may affect behaviour/ movement of animals.
Addition of non-biological material
Debris 1 Debris generated during general fishing vessel operations, debris may entangle animals causing damage or mortality or may disrupt behaviour, volume of debris generated by SP fishery unknown requires monitoring.

Scoping
45
Direct impact of Fishing
Fishing Activity
Score (0/1)
Documentation of Rationale
Chemical pollution
1 Exhaust from diesel engines occurs during fishing activities and steaming.
Exhaust 1 Occurs Gear loss 1 See comments under above entry for gear loss.
Potential lost items includes netting, ropes, buoys etc. Navigation/ steaming
1 Purse seine operations involve vessels navigating to and from fishing grounds.
Activity/ presence on water
1 Purse seine operations involve the presence of several vessels on the fishing grounds –introducing noise and visual stimuli into the environment.
Bait collection 0 Bait not required by fishery. Fishing 1 Purse seine fishing activities may disturb/disrupt local
physical water flow patterns, e.g. vertical mixing. Interaction with benthic habitat occurs but does not cause significant alteration of benthic habitats.
Boat launching 0 Not applicable. Vessels in fishery come from designated ports.
Anchoring/ mooring
0 Does not occur on fishing grounds.
Disturb physical processes
Navigation/ steaming
1 Purse seine operations involve vessels navigating to and from fishing grounds.
Other capture fishery methods
1 Target Species may be captured by purse-seine methods. Byproduct species in the SPF are targeted in other fisheries (e.g. blue eye).
Aquaculture 0 Fishery offshore. Coastal development
1 Unlikely to have significant impact with current distribution of effort which is mainly offshore.
Other extractive activities
1 Offshore fishery but offshore petroleum exploration occurs in Bass Strait.
Other non-extractive activities
1 Use by military, munitions testing, disposal, cable laying not suggested. Coastal shipping may disrupt feeding schools.
External Hazards (specify the particular example within each activity area)
Other anthropogenic activities
1 Whale watching and charter fishing occurs.

Scoping
46
Table 4. Examples of fishing activities (Modified from Fletcher et al. 2002).
Direct Impact of Fishing
Fishing Activity Examples of Activities Include
Capture Activities that result in the capture or removal of organisms. This includes cryptic mortality due to organisms being caught but dropping out prior to the gear’s retrieval (i.e. They are caught but not landed)
Bait collection Capture of organisms due to bait gear deployment, retrieval and bait fishing. This includes organisms caught but not landed. Fishing Capture of organisms due to gear deployment, retrieval and actual fishing. This includes organisms caught but not landed. Incidental
behaviour Capture of organisms due to crew behaviour incidental to primary fishing activities, possible in the crew’s down time; e.g. crew may line or spear fish while anchored, or perform other harvesting activities, including any land-based harvesting that occurs when crew are camping in their down time.
Direct impact, without capture
This includes any activities that may result in direct impacts (damage or mortality) to organisms without actual capture.
Bait collection Direct impacts (damage or mortality) to organisms due to interactions (excluding capture) with bait gear during deployment, retrieval and bait fishing. This includes: damage/mortality to organisms through contact with the gear that doesn’t result in capture, e.g. Damage/mortality to benthic species by gear moving over them, organisms that hit nets but aren’t caught.
Fishing Direct impacts (damage or mortality) to organisms due to interactions (excluding capture) with fishing gear during deployment, retrieval and fishing. This includes: damage/mortality to organisms through contact with the gear that doesn’t result in capture, e.g. Damage/mortality to benthic species by gear moving over them, organisms that hit nets but are not caught.
Incidental behaviour
Direct impacts (damage or mortality) without capture, to organisms due to behaviour incidental to primary fishing activities, possibly in the crew’s down time; e.g. the use of firearms on scavenging species, damage/mortality to organisms through contact with the gear that the crew uses to fish during their down time. This does not include impacts on predator species of removing their prey through fishing.
Gear loss Direct impacts (damage or mortality), without capture on organisms due to gear that has been lost from the fishing boat. This includes damage/mortality to species when the lost gear contacts them or if species swallow the lost gear.
Anchoring/ mooring
Direct impact (damage or mortality) that occurs and when anchoring or mooring. This includes damage/mortality due to physical contact of the anchor, chain or rope with organisms, e.g. An anchor damaging live coral.
Navigation/ steaming
Direct impact (damage or mortality) without capture may occur while vessels are navigating or steaming. This includes collisions with marine organisms or birds.
Addition/ movement of biological material
Any activities that result in the addition or movement of biological material to the ecosystem of the fishery.
Translocation of species (boat movements,
The translocation and introduction of species to the area of the fishery, through transportation of any life stage. This transport can occur through movement on boat hulls or in ballast water as boats move throughout the fishery or from outside areas into the fishery.

Scoping
47
Direct Impact of Fishing
Fishing Activity Examples of Activities Include
reballasting) On board
processing The discarding of unwanted sections of target after on board processing introduces or moves biological material, e.g. heading and gutting, retaining fins but discarding trunks.
Discarding catch The discarding of unwanted organisms from the catch can introduce or move biological material. This includes individuals of target and byproduct species due to damage (e.g. shark or marine mammal predation), size, high grading and catch limits. Also includes discarding of all non-retained bycatch species. This also includes discarding of catch resulting from incidental fishing by the crew. The discards could be alive or dead.
Stock enhancement
The addition of larvae, juveniles or adults to the fishery or ecosystem to increase the stock or catches.
Provisioning The use of bait or berley in the fishery. Organic waste
disposal The disposal of organic wastes (e.g. food scraps, sewage) from the boats.
Addition of non-biological material
Any activities that result in non-biological material being added to the ecosystem of the fishery, this includes physical debris, chemicals (in the air and water), lost gear, noise and visual stimuli.
Debris Non-biological material may be introduced in the form of debris from fishing vessels or mother ships. This includes debris from the fishing process: e.g. cardboard thrown over from bait boxes, straps and netting bags lost. Debris from non-fishing activities can also contribute to this e.g. Crew rubbish – discarding or food scraps, plastics or other rubbish. Discarding at sea is regulated by MARPOL, which forbids the discarding of plastics.
Chemical pollution
Chemicals can be introduced to water, sediment and atmosphere through: oil spills, detergents other cleaning agents, any chemicals used during processing or fishing activities.
Exhaust Exhaust can be introduced to the atmosphere and water through operation of fishing vessels Gear loss The loss of gear will result in the addition of non-biological material, this includes hooks, line, sinkers, nets, otter boards, light
sticks, buoys etc. Navigation
/steaming The navigation and steaming of vessels will introduce noise and visual stimuli into the environment. Boat collisions and/or sinking of vessels. Echo-sounding may introduce noise that may disrupt some species (e.g. whales, orange roughy)
Activity /presence on water
The activity or presence of fishing vessels on the water will noise and visual stimuli into the environment.
Disturb physical processes
Any activities that will disturb physical processes, particularly processes related to water movement or sediment and hard substrate (e.g. boulders, rocky reef) processes.
Bait collection Bait collection may disturb physical processes if the gear contacts seafloor-disturbing sediment, or if the gear disrupts water flow patterns.

Scoping
48
Direct Impact of Fishing
Fishing Activity Examples of Activities Include
Fishing Fishing activities may disturb physical processes if the gear contacts seafloor-disturbing sediment, or if the gear disrupts water flow patterns.
Boat launching Boat launching may disturb physical processes, particularly in the intertidal regions, if dredging is required, or the boats are dragged across substrate. This would also include foreshore impacts where fishers drive along beaches to reach fishing locations and launch boats. Impacts of boat launching that occurs within established marinas are outside the scope of this assessment.
Anchoring /mooring
Anchoring/mooring may affect the physical processes in the area that anchors and anchor chains contact the seafloor.
Navigation /steaming
Navigation /steaming may affect the physical processes on the benthos and the pelagic by turbulent action of propellers or wake formation.
External hazards Any outside activities that will result in an impact on the component in the same location and period that the fishery operates. The particular activity as well as the mechanism for external hazards should be specified.
Other capture fishery methods
Take or habitat impact by other commercial, indigenous or recreational fisheries operating in the same region as the fishery under examination
Aquaculture Capture of feed species for aquaculture. Impacts of cages on the benthos in the region Coastal
development Sewage discharge, ocean dumping, agricultural runoff
Other extractive activities
Oil and gas pipelines, drilling, seismic activity
Other non-extractive activities
Defence, shipping lanes, dumping of munitions, submarine cables
Other anthropogenic activities
Recreational activities, such as scuba diving leading to coral damage, power boats colliding with whales, dugongs, turtles. Shipping, oil spills

Scoping
49
2.2.5 Bibliography (Step 5)
All references used in the scoping assessment are included in the References section. Key documents can be found on the AFMA web page at www.afma.gov.au and include the following: • Assessment Report • Management Plan • Management Regulations • Management Plan and Regulation Guidelines • AFMA At a glance web page
http://www.afma.gov.au/fisheries/etbf/at_a_glance.php • Bycatch Action Plans • Data Summary Reports (logbook and observer)
Other publications that may provided information include • BRS Fishery Status Reports • Strategic Plans
2.2.6 Decision rules to move to Level 1(Step 6)
Any hazards that are identified at Step 4 Hazard Identification as occurring in the fishery are carried forward for analysis at Level 1. In this case, 14 out of 26 possible internal activities were identified as occurring in this fishery. Five out of 6 external activities were identified. Thus, a total of 19 activity-component scenarios will be considered at Level 1. This results in 95 total scenarios (of 160 possible) to be developed and evaluated using the unit lists (species, habitats, communities).

Level 1
50
2.3 Level 1 Scale, Intensity and Consequence Analysis (SICA) Level 1 aims to identify which hazards lead to a significant impact on any species, habitat or community. Analysis at Level 1 is for whole components (target; bycatch and byproduct; TEP species; habitat; and communities), not individual sub-components. Since Level 1 is used mainly as a rapid screening tool, a “worst case” approach is used to ensure that elements screened out as low risk (either activities or components) are genuinely low risk. Analysis at Level 1 for each component is accomplished by considering the most vulnerable sub-component and the most vulnerable unit of analysis (e.g. most vulnerable species, habitat type or community). This is known as credible scenario evaluation (Richard Stocklosa e-systems Pty Ltd (March 2003) Review of CSIRO Risk Assessment Methodology: ecological risk assessment for the effects of fishing) in conventional risk assessment. In addition, where judgments about risk are uncertain, the highest level of risk that is still regarded as plausible is chosen. For this reason, the measures of risk produced at Level 1 cannot be regarded as absolute. At Level 1 each fishery/sub-fishery is assessed using a scale, intensity and consequence analysis (SICA). SICA is applied to the component as a whole by choosing the most vulnerable sub-component (linked to an operational objective) and most vulnerable unit of analysis. The rationale for these choices must be documented in detail. These steps are outlined below. Scale, intensity, and consequence analysis (SICA) consists of thirteen steps. The first ten steps are performed for each activity and component, and correspond to the columns of the SICA table. The final three steps summarise the results for each component.
Step1: Record the hazard identification score (absence (0) presence (1) scores) identified at step 3 at the scoping level (Scoping Document S3) onto the SICA table
Step 2: Score spatial scale of the activity Step 3: Score temporal scale of the activity Step 4: Choose the sub-component most likely to be affected by activity Step 5: Choose the most vulnerable unit of analysis for the component e.g. species,
habitat type or community assemblage Step 6: Select the most appropriate operational objective Step 7: Score the intensity of the activity for that sub-component Step 8: Score the consequence resulting from the intensity for that subcomponent Step 9: Record confidence/uncertainty for the consequence scores Step 10. Document rationale for each of the above steps Step 11. Summary of SICA results Step 12. Evaluation/discussion of Level 1 Step 13. Components to be examined at Level 2
2.3.1 Record the hazard identification score (absence (0) presence (1) scores) identified at step 3 in the scoping level onto the SICA Document (Step 1)
Record the hazard identification score absence (0) presence (1) identified at Step 3 at the scoping level onto the SICA sheet. A separate sheet will be required for each

Level 1
51
component (target, bycatch and byproduct, and TEP species, habitat, and communities). Only those activities that scored a 1 (presence) will be analysed at Level 1 2.3.2 Score spatial scale of activity (Step 2)
The greatest spatial extent must be used for determining the spatial scale score for each identified hazard. For example, if fishing (e.g. capture by longline) takes place within an area of 200 nm by 300 nm, then the spatial scale is scored as 4. The score is then recorded onto the SICA Document and the rationale documented. Spatial scale score of activity
<1 nm:
1-10 nm:
10-100 nm: 100-500 nm: 500-1000 nm: >1000 nm:
1 2 3 4 5 6 Maps and graphs may be used to supplement the information (e.g. sketches of the distribution of the activity relative to the distribution of the component) and additional notes describing the nature of the activity should be provided. The spatial scale score at Step 2 is not used directly, but the analysis is used in making judgments about level of intensity at Step 7. Obviously, two activities can score the same with regard to spatial scale, but the intensity of each can differ vastly. The reasons for the score are recorded in the rationale column of the SICA spreadsheet. 2.3.3 Score temporal scale of activity (Step 3)
The highest frequency must be used for determining the temporal scale score for each identified hazard. If the fishing activity occurs daily, the temporal scale is scored as 6. If oil spillage occurs about once per year, then the temporal scale of that hazard scores a 3. The score is then recorded onto the SICA Document and the rationale documented. Temporal scale score of activity
Decadal (1 day every
10 years or so)
Every several years
(1 day every several years)
Annual (1-100 days
per year)
Quarterly (100-200 days
per year)
Weekly (200-300 days
per year)
Daily (300-365 days
per year)
1 2 3 4 5 6 It may be more logical for some activities to consider the aggregate number of days that an activity occurs. For example, if the activity “fishing” was undertaken by 10 boats during the same 150 days of the year, the score is 3. If the same 10 boats each spend 30 non-overlapping days fishing, the temporal scale of the activity is a sum of 300 days, indicating that a score of 6 is appropriate. In the case where the activity occurs over many days, but only every 10 years, the number of days by the number of years in the cycle is used to determine the score. For example, 100 days of an activity every 10 years averages to 10 days every year, so that a score of 3 is appropriate. The temporal scale score at Step 3 is not used directly, but the analysis is used in making judgments about level of intensity at Step 7. Obviously, two activities can score

Level 1
52
the same with regard to temporal scale, but the intensity of each can differ vastly. The reasons for the score are recorded in the rationale column. 2.3.4 Choose the sub-component most likely to be affected by activity (Step 4)
The most vulnerable sub-component must be used for analysis of each identified hazard. This selection must be made on the basis of expected highest potential risk for each ‘direct impact of fishing’ and ‘fishing activity’ combination, and recorded in the ‘sub-component’ column of the SICA Document. The justification is recorded in the rationale column. 2.3.5 Choose the unit of analysis most likely to be affected by activity and to have highest consequence score (Step 5)
The most vulnerable ‘unit of analysis’ (i.e. most vulnerable species, habitat type or community) must be used for analysis of each identified hazard. The species, habitats, or communities (depending on which component is being analysed) are selected from Scoping Document S2 (A – C). This selection must be made on the basis of expected highest potential risk for each ‘direct impact of fishing’ and ‘fishing activity’ combination, and recorded in the ‘unit of analysis’ column of the SICA Document. The justification is recorded in the rationale column. 2.3.6 Select the most appropriate operational objective (Step 6)
To provide linkage between the SICA consequence score and the management objectives, the most appropriate operational objective for each sub-component is chosen. The most relevant operational objective code from Scoping Document S3 is recorded in the ‘operational objective’ column in the SICA document. Note that SICA can only be performed on operational objectives agreed as important for the (sub) fishery during scoping and contained in Scoping Document S3. If the SICA process identifies reasons to include sub-components or operational objectives that were previously not included/eliminated then these sub-components or operational objectives must be re-instated. 2.3.7 Score the intensity of the activity for the component (Step 7)
The score for intensity of an activity considers the direct impacts in line with the categories shown in the conceptual model (Figure 2) (capture, direct impact without capture, addition/movement of biological material, addition of non-biological material, disturbance to physical processes, external hazards). The intensity of the activity is judged based on the scale of the activity, its nature and extent. Activities are scored as per intensity scores below.

Level 1
53
Intensity score of activity (Modified from Fletcher et al. 2002) Level Score Description Negligible 1 remote likelihood of detection at any spatial or temporal scale Minor 2 occurs rarely or in few restricted locations and detectability even at these
scales is rare Moderate 3 moderate at broader spatial scale, or severe but local Major 4 severe and occurs reasonably often at broad spatial scale Severe 5 occasional but very severe and localized or less severe but widespread and
frequent Catastrophic 6 local to regional severity or continual and widespread
This score is then recorded on the Level 1 (SICA) Document and the rationale documented. 2.3.8 Score the consequence of intensity for that component (Step 8)
The consequence of the activity is a measure of the likelihood of not achieving the operational objective for the selected sub-component and unit of analysis. It considers the flow on effects of the direct impacts from Step 7 for the relevant indicator (e.g. decline in biomass below the selected threshold due to direct capture). Activities are scored as per consequence scores below. A more detailed description of the consequences at each level for each component (target, bycatch and byproduct, TEP species, habitats, and communities) is provided as a guide for scoring the consequences of the activities in the description of consequences table (see Table 5 Appendix C). Consequence score for ERAEF activities (Modified from Fletcher et al. 2002).
Level Score Description Negligible 1 Impact unlikely to be detectable at the scale of the stock/habitat/community Minor 2 Minimal impact on stock/habitat/community structure or dynamics Moderate 3 Maximum impact that still meets an objective (e.g. sustainable level of
impact such as full exploitation rate for a target species). Major 4 Wider and longer term impacts (e.g. long-term decline in CPUE) Severe 5 Very serious impacts now occurring, with relatively long time period likely
to be needed to restore to an acceptable level (e.g. serious decline in spawning biomass limiting population increase).
Intolerable 6 Widespread and permanent/irreversible damage or loss will occur-unlikely to ever be fixed (e.g. extinction)
The score should be based on existing information and/or the expertise of the risk assessment group. The rationale for assigning each consequence score must be documented. The conceptual model may be used to link impact to consequence by showing the pathway that was considered. In the absence of agreement or information, the highest score (worst case scenario) considered plausible is applied to the activity. 2.3.9 Record confidence/uncertainty for the consequence scores (Step 9)
The information used at this level is qualitative and each step is based on expert (fishers, managers, conservationists, scientists) judgment. The confidence rating for the consequence score is rated as 1 (low confidence) or 2 (high confidence) for the activity/component. The score is recorded on the SICA Document and the rationale

Level 1
54
documented. The confidence will reflect the levels of uncertainty for each score at steps 2, 3, 7 and 8. Description of Confidence scores for Consequences. The confidence score appropriate to the rationale is used, and documented on the SICA Document.
Confidence Score Rationale for the confidence score Low 1 Data exists, but is considered poor or conflicting
No data exists Disagreement between experts
High 2 Data exists and is considered sound Consensus between experts Consequence is constrained by logical consideration
2.3.10 Document rationale for each of the above steps (Step 10)
The rationale forms a logical pathway to the consequence score. It is provided for each choice at each step of the SICA analysis

Level 1
55
2.3.1 Level 1 (SICA) Documents L1.1 - Target Species Component
Direct impact of Fishing Fishing Activity Pr
esen
ce (1
) A
bsen
ce (0
)
Spat
ial s
cale
of H
azar
d (1
-6)
Tem
pora
l sca
le o
f Haz
ard
(1-6
)
Sub-component Unit of analysis Ope
ratio
nal o
bjec
tive
(f
rom
S2.
1)
Inte
nsity
Sco
re
(1-6
)
Con
sequ
ence
Sco
re
(1-6
)
Con
fiden
ce sc
ore
(1-2
)
Rationale Bait collection 0 Fishing 1 4 6 Population size Redbait 1.2 2 3 1 Fishing effort is almost entirely restricted to waters along the edge
of the continental shelf off the east coast of Tasmania. Fishing occurs daily. Trigger limits on catch size. Intense fishing effort off E. Tasmania. Sustainable exploitation rate off Tas. Confidence was considered low because there is no formal stock assessment.
Capture
Incidental behaviour
0
Bait collection 0 Fishing 1 4 6 Behaviour/
movement Redbait 6.1 2 2 1 Fishing effort is almost entirely restricted to waters along the edge
of the continental shelf off the east coast of Tasmania. Fishing occurs daily Fishing known to disrupt target species schools and hence is expected to have highest potential risk for the Behaviour/ movement sub-component . Consequence considered minor as ‘school’ impacts would be localised and change not detectable at the scale of the fishery. Confidence low because no data exists on non-capture fishing impacts on small pelagics.
Incidental behaviour
0
Gear loss 1 4 4 Population size Redbait 1.2 2 1 2 Fishing effort is almost entirely restricted to waters along the edge of the continental shelf off the east coast of Tasmania. Fishing occurs daily. Gear loss may occur quarterly. Lost gear resulting in damage/ mortality most likely to effect population size of small pelagic species. Intensity was scored as Minor because lost gear – small pelagic species interactions (if they occur) are considered to be rare Consequence considered Negligible - unlikely to be detectable at the scale of the small pelagic stocks Confidence was scored as low because of a lack of data on interactions between small pelagic species and lost purse seine fishing gear.
Direct impact without capture
Anchoring/ mooring
0

Level 1
56
Direct impact of Fishing Fishing Activity Pr
esen
ce (1
) A
bsen
ce (0
)
Spat
ial s
cale
of H
azar
d (1
-6)
Tem
pora
l sca
le o
f Haz
ard
(1-6
)
Sub-component Unit of analysis Ope
ratio
nal o
bjec
tive
(f
rom
S2.
1)
Inte
nsity
Sco
re
(1-6
)
Con
sequ
ence
Sco
re
(1-6
)
Con
fiden
ce sc
ore
(1-2
)
Rationale Navigation/ steaming
1 4 6 Behaviour/ movement
Redbait 6.1 2 1 2 Fishing effort is almost entirely restricted to waters along the edge of the continental shelf off the east coast of Tasmania. Fishing occurs daily. Direct impact without capture due to Navigation/steaming was considered most likely to affect behaviour/ movement of small pelagic species. Most fishing effort, hence Navigation/ steaming, is concentrated off eastern Tasmania in Zone A and so the intensity of the activity is local (Minor). Consequence was considered Negligible – any impact unlikely to result in detectable change to behaviour and movement, time taken to recover to pre-disturbed state on the scale of hours. Confidence was scored as high because it was considered (within logical constraints) unlikely for there to be strong negative interactions between Navigation/steaming and small pelagic species.
Translocation of species
0
On board processing
0
Discarding catch
1 4 6 Behaviour/ movement
Redbait 6.1 2 2 1 Fishing effort is almost entirely restricted to waters along the edge of the continental shelf off the east coast of Tasmania. Discarding occurs daily. Addition of biological material due to onboard processing was considered most likely to affect Behaviour/ movement of small pelagic species => Discarding catch could cause local Behavioural/ movement impacts indirectly via attraction of predators. Intensity: Minor – very small proportion of catch Consequence Minor – possible detectable change, time to return to original behaviour/ movement on the scale of days to weeks. Confidence low because there is no observational data on impacts of discarding on behaviour
Stock enhancement
0
Addition/ movement of biological material
Provisioning 0

Level 1
57
Direct impact of Fishing Fishing Activity Pr
esen
ce (1
) A
bsen
ce (0
)
Spat
ial s
cale
of H
azar
d (1
-6)
Tem
pora
l sca
le o
f Haz
ard
(1-6
)
Sub-component Unit of analysis Ope
ratio
nal o
bjec
tive
(f
rom
S2.
1)
Inte
nsity
Sco
re
(1-6
)
Con
sequ
ence
Sco
re
(1-6
)
Con
fiden
ce sc
ore
(1-2
)
Rationale Organic waste disposal
1 4 6 Behaviour/ movement
Redbait 6.1 1 1 2 Fishing effort is almost entirely restricted to waters along the edge of the continental shelf off east coast Tasmania. Discarding occurs daily. Disposal of organic waste is expected to pose greatest potential risk for the Behaviour/movement of target species resulting in either attraction e.g. food scraps or repulsion e.g. raw sewage Intensity was scored as negligible because although the hazard was considered over a large range/scale, each disposal event was considered to only effect a small < 1 nm area and because small pelagic species are highly mobile strong avoidance ability was expected at the scale of 1 nm Consequence was also considered negligible i.e. any consequence on the small pelagic species in the four fishing zones are unlikely to be measurable Confidence in the consequence score was high because general fishing waste disposal was considered unlikely to impact on behaviour/movement of the mobile Small Pelagic species..
Debris 1 4 6 Behaviour/ movement
Redbait 6.1 2 1 2 Fishing effort is almost entirely restricted to waters along the edge of the continental shelf off the east coast of Tasmania. Discarding occurs daily. Floating marine debris may attract small pelagic species to shelter beneath it affecting behaviour and movement. considered Minor – occurs rarely or in few isolated incidences. Consequence scored negligible – unlikely to be measurable against background variability for population. Confidence high – no dumping
Addition of non-biological material
Chemical pollution
1 4 6 Population size Redbait 1.2 2 2 2 Fishing effort is almost entirely restricted to waters along the edge of the continental shelf off the east coast of Tasmania. Discarding occurs daily. Possible detectable change in behaviour/ movement but minimal impact on population, time to return to behaviour on the scale of days to weeks Intensity Minor - Chemical pollution occurs infrequently and on local scale . Chemical pollution likely to have measurable consequences if large-scale event occurs in a sensitive area, the scale of an event will be limited by the amount of chemicals carried by the fishing vessels). Consequence considered Minor – Possible detectable change in behaviour/ movement but minimal impact on population, time to return to behaviour on the scale of days to weeks.
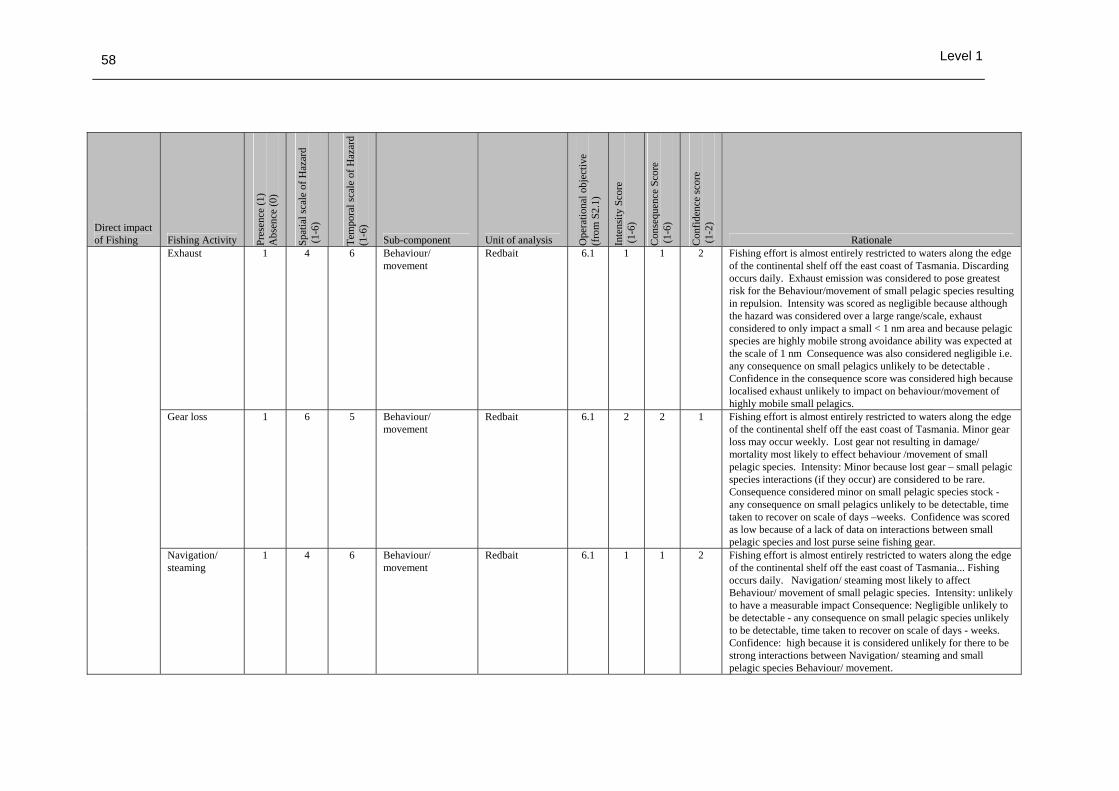
Level 1
58
Direct impact of Fishing Fishing Activity Pr
esen
ce (1
) A
bsen
ce (0
)
Spat
ial s
cale
of H
azar
d (1
-6)
Tem
pora
l sca
le o
f Haz
ard
(1-6
)
Sub-component Unit of analysis Ope
ratio
nal o
bjec
tive
(f
rom
S2.
1)
Inte
nsity
Sco
re
(1-6
)
Con
sequ
ence
Sco
re
(1-6
)
Con
fiden
ce sc
ore
(1-2
)
Rationale Exhaust 1 4 6 Behaviour/
movement Redbait 6.1 1 1 2 Fishing effort is almost entirely restricted to waters along the edge
of the continental shelf off the east coast of Tasmania. Discarding occurs daily. Exhaust emission was considered to pose greatest risk for the Behaviour/movement of small pelagic species resulting in repulsion. Intensity was scored as negligible because although the hazard was considered over a large range/scale, exhaust considered to only impact a small < 1 nm area and because pelagic species are highly mobile strong avoidance ability was expected at the scale of 1 nm Consequence was also considered negligible i.e. any consequence on small pelagics unlikely to be detectable . Confidence in the consequence score was considered high because localised exhaust unlikely to impact on behaviour/movement of highly mobile small pelagics.
Gear loss 1 6 5 Behaviour/ movement
Redbait 6.1 2 2 1 Fishing effort is almost entirely restricted to waters along the edge of the continental shelf off the east coast of Tasmania. Minor gear loss may occur weekly. Lost gear not resulting in damage/ mortality most likely to effect behaviour /movement of small pelagic species. Intensity: Minor because lost gear – small pelagic species interactions (if they occur) are considered to be rare. Consequence considered minor on small pelagic species stock - any consequence on small pelagics unlikely to be detectable, time taken to recover on scale of days –weeks. Confidence was scored as low because of a lack of data on interactions between small pelagic species and lost purse seine fishing gear.
Navigation/ steaming
1 4 6 Behaviour/ movement
Redbait 6.1 1 1 2 Fishing effort is almost entirely restricted to waters along the edge of the continental shelf off the east coast of Tasmania... Fishing occurs daily. Navigation/ steaming most likely to affect Behaviour/ movement of small pelagic species. Intensity: unlikely to have a measurable impact Consequence: Negligible unlikely to be detectable - any consequence on small pelagic species unlikely to be detectable, time taken to recover on scale of days - weeks. Confidence: high because it is considered unlikely for there to be strong interactions between Navigation/ steaming and small pelagic species Behaviour/ movement.

Level 1
59
Direct impact of Fishing Fishing Activity Pr
esen
ce (1
) A
bsen
ce (0
)
Spat
ial s
cale
of H
azar
d (1
-6)
Tem
pora
l sca
le o
f Haz
ard
(1-6
)
Sub-component Unit of analysis Ope
ratio
nal o
bjec
tive
(f
rom
S2.
1)
Inte
nsity
Sco
re
(1-6
)
Con
sequ
ence
Sco
re
(1-6
)
Con
fiden
ce sc
ore
(1-2
)
Rationale Activity/ presence on water
1 4 6 Behaviour/ movement
Redbait 6.1 1 1 2 Fishing effort is almost entirely restricted to waters along the edge of the continental shelf off the east coast of Tasmania. Minor gear loss may occur weekly. Activity/presence on water of fishing vessels was expected to pose greatest potential risk for the Behaviour/movement of small pelagic species resulting in disruption to feeding and/or movement. Intensity was scored as negligible because although the hazard was considered over a large range/scale, vessel presence considered to only impact a small < 1 nm area and because small pelagic species are highly mobile strong avoidance ability was expected at the scale of 1 nm. Consequence was also considered negligible with any consequence of vessel presence impacts unlikely to be detectable for small pelagic species. Confidence in the consequence score was high because localised vessel presence/activity considered unlikely to impact and have consequences for the behaviour/movement of highly mobile small pelagic species.
Bait collection 0 Fishing 1 4 6 Behaviour/
movement Redbait 6.1 1 1 2 Fishing effort is almost entirely restricted to waters along the edge
of the continental shelf off the east coast of Tasmania. Fishing occurs daily. Disturbance of physical processes via fishing was expected to pose greatest potential risk for the Behaviour/ movement of small pelagic species resulting in momentary disruption to feeding and/or movement Intensity: negligible - although the hazard was considered over a large range/scale, fishing considered to only impact physical processes over a small < 1 nm area. Consequence was also considered negligible with any consequence of water column disturbance unlikely to be detectable for small pelagic species. Confidence in consequence score was considered high because localised disruption of water column unlikely to impact and have consequences for the behaviour/movement of highly mobile pelagic species.
Boat launching 0
Disturb physical processes
Anchoring/ mooring
0
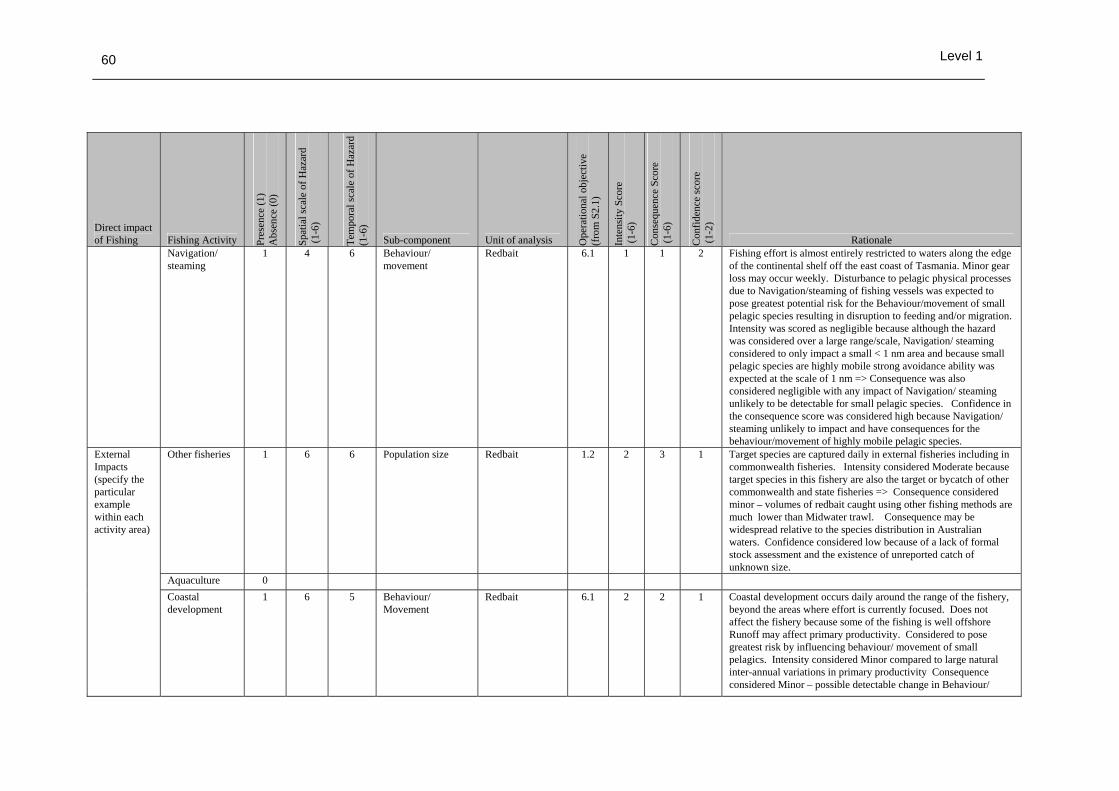
Level 1
60
Direct impact of Fishing Fishing Activity Pr
esen
ce (1
) A
bsen
ce (0
)
Spat
ial s
cale
of H
azar
d (1
-6)
Tem
pora
l sca
le o
f Haz
ard
(1-6
)
Sub-component Unit of analysis Ope
ratio
nal o
bjec
tive
(f
rom
S2.
1)
Inte
nsity
Sco
re
(1-6
)
Con
sequ
ence
Sco
re
(1-6
)
Con
fiden
ce sc
ore
(1-2
)
Rationale Navigation/ steaming
1 4 6 Behaviour/ movement
Redbait 6.1 1 1 2 Fishing effort is almost entirely restricted to waters along the edge of the continental shelf off the east coast of Tasmania. Minor gear loss may occur weekly. Disturbance to pelagic physical processes due to Navigation/steaming of fishing vessels was expected to pose greatest potential risk for the Behaviour/movement of small pelagic species resulting in disruption to feeding and/or migration. Intensity was scored as negligible because although the hazard was considered over a large range/scale, Navigation/ steaming considered to only impact a small < 1 nm area and because small pelagic species are highly mobile strong avoidance ability was expected at the scale of 1 nm => Consequence was also considered negligible with any impact of Navigation/ steaming unlikely to be detectable for small pelagic species. Confidence in the consequence score was considered high because Navigation/ steaming unlikely to impact and have consequences for the behaviour/movement of highly mobile pelagic species.
Other fisheries 1 6 6 Population size Redbait 1.2 2 3 1 Target species are captured daily in external fisheries including in commonwealth fisheries. Intensity considered Moderate because target species in this fishery are also the target or bycatch of other commonwealth and state fisheries => Consequence considered minor – volumes of redbait caught using other fishing methods are much lower than Midwater trawl. Consequence may be widespread relative to the species distribution in Australian waters. Confidence considered low because of a lack of formal stock assessment and the existence of unreported catch of unknown size.
Aquaculture 0
External Impacts (specify the particular example within each activity area)
Coastal development
1 6 5 Behaviour/ Movement
Redbait 6.1 2 2 1 Coastal development occurs daily around the range of the fishery, beyond the areas where effort is currently focused. Does not affect the fishery because some of the fishing is well offshore Runoff may affect primary productivity. Considered to pose greatest risk by influencing behaviour/ movement of small pelagics. Intensity considered Minor compared to large natural inter-annual variations in primary productivity Consequence considered Minor – possible detectable change in Behaviour/

Level 1
61
Direct impact of Fishing Fishing Activity Pr
esen
ce (1
) A
bsen
ce (0
)
Spat
ial s
cale
of H
azar
d (1
-6)
Tem
pora
l sca
le o
f Haz
ard
(1-6
)
Sub-component Unit of analysis Ope
ratio
nal o
bjec
tive
(f
rom
S2.
1)
Inte
nsity
Sco
re
(1-6
)
Con
sequ
ence
Sco
re
(1-6
)
Con
fiden
ce sc
ore
(1-2
)
Rationale movement, time to return to original behaviour/ movement on the scale of days to weeks. Confidence low because of a lack of data.
Other extractive activities
1 5 6 Behaviour /movement
Redbait 6.1 2 2 1 Oil exploration occurs daily, beyond the main effort in the fishery across a wide geographic range, particularly in Bass Strait. Target species would avoid any spills. Intensity: spills are rare Consequence: minor, unlikely to affect a population Confidence low. No data
Other non extractive activities
1 6 6 Behaviour/ movement
Redbait 6.1 1 1 2 Shipping activity occurs daily across the full range of the fishery, and outside areas of current effort. Greatest potential risks are to the Behaviour/movement of small pelagic species resulting in disruption to feeding and/ or migration Intensity: negligible because although the hazard was considered over a large range/scale, the shipping track is narrow - impact a < 1 nm wide and because small pelagic species are highly mobile strong avoidance ability was expected at the scale of 1 nm. Consequence: negligible with any consequence of shipping impacts unlikely to be detectable for small pelagic species Confidence: high shipping unlikely to impact and have consequences for the behaviour/movement of highly mobile small pelagic species.
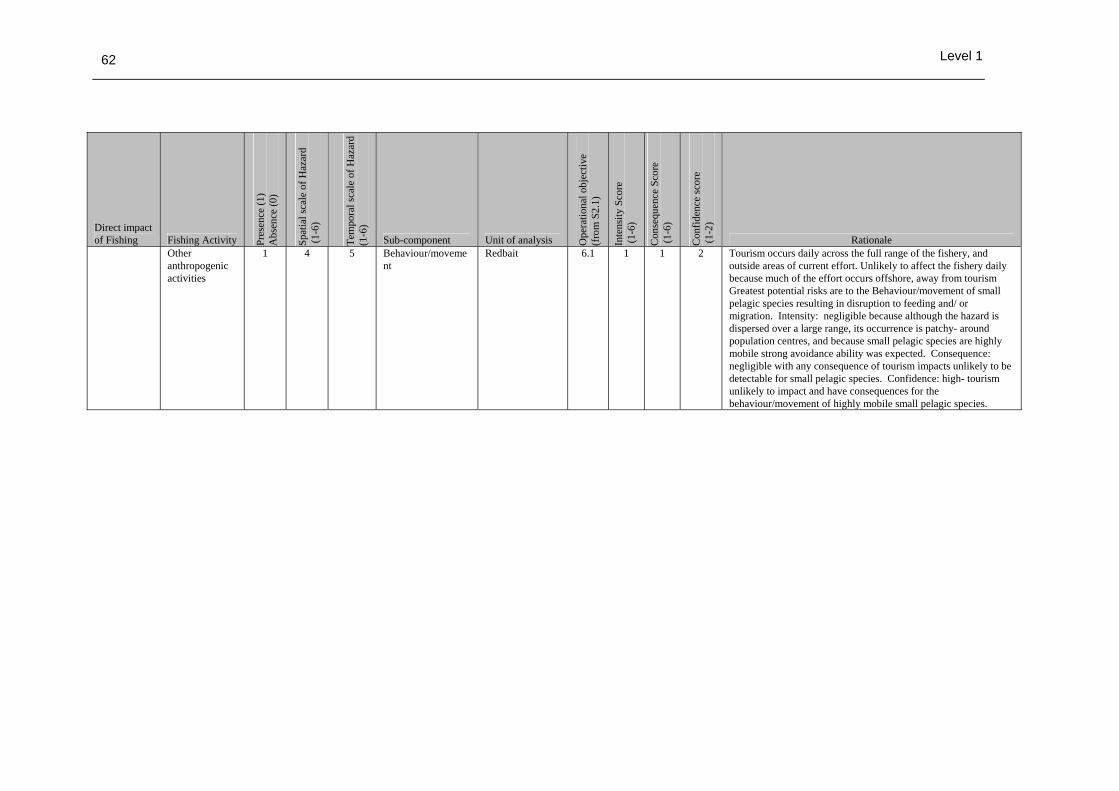
Level 1
62
Direct impact of Fishing Fishing Activity Pr
esen
ce (1
) A
bsen
ce (0
)
Spat
ial s
cale
of H
azar
d (1
-6)
Tem
pora
l sca
le o
f Haz
ard
(1-6
)
Sub-component Unit of analysis Ope
ratio
nal o
bjec
tive
(f
rom
S2.
1)
Inte
nsity
Sco
re
(1-6
)
Con
sequ
ence
Sco
re
(1-6
)
Con
fiden
ce sc
ore
(1-2
)
Rationale Other anthropogenic activities
1 4 5 Behaviour/movement
Redbait 6.1 1 1 2 Tourism occurs daily across the full range of the fishery, and outside areas of current effort. Unlikely to affect the fishery daily because much of the effort occurs offshore, away from tourism Greatest potential risks are to the Behaviour/movement of small pelagic species resulting in disruption to feeding and/ or migration. Intensity: negligible because although the hazard is dispersed over a large range, its occurrence is patchy- around population centres, and because small pelagic species are highly mobile strong avoidance ability was expected. Consequence: negligible with any consequence of tourism impacts unlikely to be detectable for small pelagic species. Confidence: high- tourism unlikely to impact and have consequences for the behaviour/movement of highly mobile small pelagic species.

Level 1
63
2.3.1 Level 1 (SICA) Documents L1.2 - Byproduct and Bycatch Component
Direct impact of Fishing
Fishing Activity Pr
esen
ce (1
) A
bsen
ce (0
)
Spat
ial s
cale
of H
azar
d (1
-6)
Tem
pora
l sca
le o
f Haz
ard
(1-6
)
Sub-component Unit of analysis Ope
ratio
nal o
bjec
tive
(f
rom
S2.
1)
Inte
nsity
Sco
re
(1-6
)
Con
sequ
ence
Sco
re
(1-6
)
Con
fiden
ce sc
ore
(1-2
)
Rationale Bait collection 0 Fishing 1 4 6 Population size Blue eye Trevalla 1.3 3 3 1 Fishing effort is almost entirely restricted to waters along the edge
of the continental shelf off the east coast of Tasmania. Fishing occurs daily. Byproduct species include benthopelagic SEF quota species which have comprehensive management plans and detailed assessments e.g. blue eye Intense fishing effort of E. Tasmania. Stock fully exploited off Tas. Consequence: moderate, need to consider impacts on other fisheries Confidence: low – hard to determine the impact on SEF quota species because the volume of SEF species is difficult to evaluate during the pumping out of the target species.
Capture
Incidental behaviour
0
Bait collection 0 Fishing 1 4 6 Behaviour/
movement Blue eye Trevalla 6.1 2 2 1 Fishing effort is almost entirely restricted to waters along the edge
of the continental shelf off the east coast of Tasmania. Fishing occurs daily. Fishing known to disrupt target species schools and hence is expected to have highest potential risk for the Behaviour/ movement sub-component. Consequence considered minor as ‘school’ impacts would be localised and change not detectable at the scale of the fishery. Confidence: low - no data on non-capture fishing is sparse.
Direct impact without capture
Incidental behaviour
0

Level 1
64
Direct impact of Fishing
Fishing Activity Pr
esen
ce (1
) A
bsen
ce (0
)
Spat
ial s
cale
of H
azar
d (1
-6)
Tem
pora
l sca
le o
f Haz
ard
(1-6
)
Sub-component Unit of analysis Ope
ratio
nal o
bjec
tive
(f
rom
S2.
1)
Inte
nsity
Sco
re
(1-6
)
Con
sequ
ence
Sco
re
(1-6
)
Con
fiden
ce sc
ore
(1-2
)
Rationale Gear loss 1 4 4 Population size Blue eye Trevalla 1.3 2 1 2 Lost gear resulting in damage/ mortality most likely to effect
population size of demersal teleosts – may occur quarterly. Intensity was scored as Minor because lost gear – demersal teleost interactions (if they occur) are considered to be rare . Consequence considered Negligible - unlikely to be a detectable impact on stocks. Confidence was scored as low because of a lack of data on interactions between demersal teleosts and lost fishing gear.
Anchoring/ mooring
0
Navigation/ steaming
1 4 6 Behaviour/ movement
Spotted warehou 6.1 1 1 2 Fishing effort is almost entirely restricted to waters along the edge of the continental shelf off the east coast of Tasmania. Fishing occurs daily. Direct impact without capture due to Navigation/steaming was considered most likely to affect behaviour/ movement of spotted warehou which move up into the water column Most fishing effort, hence Navigation/ steaming, is concentrated off eastern Tasmania in Zone A and so the intensity of the activity is local (Minor) . Consequence was considered Negligible – any impact unlikely to result in detectable change to behaviour and movement, time taken to recover to pre-disturbed state on the scale of hours Confidence was scored as high because it was considered (within logical constraints) unlikely for there to be strong negative interactions between Navigation/steaming and demersal teleost species.
Translocation of species
0 Addition/ movement of biological material
On board processing
0

Level 1
65
Direct impact of Fishing
Fishing Activity Pr
esen
ce (1
) A
bsen
ce (0
)
Spat
ial s
cale
of H
azar
d (1
-6)
Tem
pora
l sca
le o
f Haz
ard
(1-6
)
Sub-component Unit of analysis Ope
ratio
nal o
bjec
tive
(f
rom
S2.
1)
Inte
nsity
Sco
re
(1-6
)
Con
sequ
ence
Sco
re
(1-6
)
Con
fiden
ce sc
ore
(1-2
)
Rationale Discarding catch
1 4 6 Behaviour/ movement
Blue eye Trevalla 6.1 2 2 1 Fishing effort is almost entirely restricted to waters along the edge of the continental shelf off the east coast of Tasmania. Fishing occurs daily. Addition of biological material due to onboard processing was considered most likely to effect Behaviour/ movement of Byproduct/ bycatch species => Discarding catch could cause local Behavioural/ movement impacts indirectly via attraction of predators Intensity considered Minor as discard volume is low Consequence Minor – possible detectable change, time to return to original behaviour/ movement on the scale of days to weeks. Confidence low – no data on behavioural impacts of discarding on bycatch.
Stock enhancement
0
Provisioning 0 Organic waste disposal
1 4 6 Behaviour/ movement
spotted warehou 6.1 1 1 2 Fishing effort is almost entirely restricted to waters along the edge of the continental shelf off the east coast of Tasmania. Fishing occurs daily. Disposal of organic waste is expected to pose greatest potential risk for the Behaviour/movement of spotted warehou which move up into the water column resulting in either attraction e.g. food scraps or repulsion e.g. raw sewage.
Intensity was scored as negligible because although the hazard was considered over a large range/scale, each disposal event was considered to only effect a small < 1 nm area and because the byproduct and bycatch are all mobile and so strong avoidance ability was expected at the scale of 1 nm => Consequence was also considered negligible i.e. any consequence on the byproduct and bycatch species in the four fishing zones are unlikely to be measurable. Confidence in consequence score was high as waste disposal from general fishing activities was considered unlikely to impact on behaviour/movement of these species.

Level 1
66
Direct impact of Fishing
Fishing Activity Pr
esen
ce (1
) A
bsen
ce (0
)
Spat
ial s
cale
of H
azar
d (1
-6)
Tem
pora
l sca
le o
f Haz
ard
(1-6
)
Sub-component Unit of analysis Ope
ratio
nal o
bjec
tive
(f
rom
S2.
1)
Inte
nsity
Sco
re
(1-6
)
Con
sequ
ence
Sco
re
(1-6
)
Con
fiden
ce sc
ore
(1-2
)
Rationale Debris 1 4 6 Behaviour/
movement spotted warehou 6.1 1 1 2 Fishing effort is almost entirely restricted to waters along the edge
of the continental shelf off the east coast of Tasmania. Fishing occurs daily. Floating marine debris may affect spotted warehou which move up into the water column to shelter beneath it affecting behaviour and movement Intensity considered Minor – occurs rarely or in few isolated incidences Consequence scored negligible – unlikely to be measurable against background variability for population. Confidence high – no dumping
Addition of non-biological material
Chemical pollution
1 4 3 Behaviour/ movement
spotted warehou 6.1 2 1 2 Fishing effort is almost entirely restricted to waters along the edge of the continental shelf off the east coast of Tasmania. Fishing occurs daily but significant spills are unlikely to occur more than once per year. . Chemical pollution most likely to affect behaviour of spotted warehou which move up into the water column. - repulsion Possible detectable change in behaviour/ movement but minimal impact on population, time to return to behaviour on the scale of days to weeks. Intensity Minor - Chemical pollution occurs infrequently and on local scale
Chemical pollution likely to have measurable consequences if large-scale event occurs in a sensitive area, the scale of an event will be limited by the amount of chemicals carried by the fishing vessels). Consequence considered Minor – Possible detectable change in behaviour/ movement but minimal impact on population, time to return to behaviour on the scale of hours Confidence high because chemical spill considered to quickly disperse in the pelagic environment (note the likelihood of large event, e.g. sinking and oil slick, considered very rare).

Level 1
67
Direct impact of Fishing
Fishing Activity Pr
esen
ce (1
) A
bsen
ce (0
)
Spat
ial s
cale
of H
azar
d (1
-6)
Tem
pora
l sca
le o
f Haz
ard
(1-6
)
Sub-component Unit of analysis Ope
ratio
nal o
bjec
tive
(f
rom
S2.
1)
Inte
nsity
Sco
re
(1-6
)
Con
sequ
ence
Sco
re
(1-6
)
Con
fiden
ce sc
ore
(1-2
)
Rationale Exhaust 1 4 6 Behaviour/
movement spotted warehou 6.1 1 1 2 Fishing effort is almost entirely restricted to waters along the edge
of the continental shelf off the east coast of Tasmania. Fishing occurs daily. Exhaust emission was considered to pose greatest risk for the Behaviour/movement of spotted warehou which move up into the water column. - repulsion Intensity was scored as negligible because although the hazard was considered over a large range/scale, exhaust considered to only impact a small < 1 nm area and because benthopelagic teleosts are highly mobile strong avoidance ability was expected at the scale of 1 nm .
Consequence was also considered negligible i.e. any consequence unlikely to be detectable. Confidence in the consequence score was considered high because localised exhaust unlikely to impact on behaviour/movement.
Gear loss 1 4 5 Behaviour/ movement
blue eye 6.1 1 1 2 Fishing effort is almost entirely restricted to waters along the edge of the continental shelf off east coast of Tasmania. Fishing occurs daily. Gear is expensive and major gear loss more than four times per year would not be commercially viable but minor gear loss may occur more often. Lost gear not resulting in damage/mortality most likely to effect behaviour /movement of benthopelagic teleosts e.g. blue eye Intensity scored as Minor as lost gear – benthopelagic teleost interactions (if they occur) are considered to be rare Consequence considered minor on stocks - any consequence unlikely to be detectable, time taken to recover on scale of days -weeks Confidence: low – no data.
Navigation/ steaming
1 4 6 Behaviour/ movement
spotted warehou 6.1 1 1 2 Fishing effort is almost entirely restricted to waters along the edge of the continental shelf off the east coast of Tasmania.. Fishing occurs daily. Navigation/ steaming most likely to effect Behaviour/ movement of spotted warehou which move up into the water column. Intensity: unlikely to have a measurable impact Consequence: Negligible unlikely to be detectable - any consequence unlikely to be detectable , time taken to recover on scale of days - weeks Confidence: high because it is considered unlikely for there to be strong interactions between Navigation/ steaming and demersal teleost Behaviour/ movement.

Level 1
68
Direct impact of Fishing
Fishing Activity Pr
esen
ce (1
) A
bsen
ce (0
)
Spat
ial s
cale
of H
azar
d (1
-6)
Tem
pora
l sca
le o
f Haz
ard
(1-6
)
Sub-component Unit of analysis Ope
ratio
nal o
bjec
tive
(f
rom
S2.
1)
Inte
nsity
Sco
re
(1-6
)
Con
sequ
ence
Sco
re
(1-6
)
Con
fiden
ce sc
ore
(1-2
)
Rationale Activity/ presence on water
1 4 6 Behaviour/ movement
spotted warehou 6.1 1 1 2 Fishing effort is almost entirely restricted to waters along the edge of the continental shelf off the east coast of Tasmania.. Fishing occurs daily. Activity/presence on water of fishing vessels was expected to pose greatest potential risk for the Behaviour/movement of spotted warehou which move up into the water column Intensity was scored as negligible because although the hazard was considered over a large range/scale, vessel presence considered to only impact a small < 1 nm. area and because benthopelagic teleosts are highly mobile strong avoidance ability was expected at the scale of 1 nm => Consequence was also considered negligible with any consequence of vessel presence impacts unlikely to be detectable benthopelagic teleosts Confidence in the consequence score was high because localised vessel presence/activity considered unlikely to impact and have consequences for the behaviour/movement of highly mobile benthopelagic teleosts .
Bait collection 0 Fishing 1 4 6 Behaviour/
movement spotted warehou 6.1 2 1 2 Fishing effort is almost entirely restricted to waters along the edge
of the continental shelf off the east coast of Tasmania. Fishing occurs daily. Disturbance of physical processes via was expected to pose greatest potential risk for the Behaviour/movement of spotted warehou which move up into the water column resulting in momentary disruption to feeding and/or movement . Intensity was scored as negligible because although the hazard was considered over a large range/scale, fishing considered to only impact physical processes over a small < 1 nm area . Consequence was also considered negligible with any consequence of water column disturbance unlikely to be detectable for benthopelagic teleosts. Confidence in consequence score was considered high as localised disruption of water column unlikely to impact and have consequences for the behaviour/movement of benthopelagic teleosts.
Boat launching 0
Disturb physical processes
Anchoring/ 0

Level 1
69
Direct impact of Fishing
Fishing Activity Pr
esen
ce (1
) A
bsen
ce (0
)
Spat
ial s
cale
of H
azar
d (1
-6)
Tem
pora
l sca
le o
f Haz
ard
(1-6
)
Sub-component Unit of analysis Ope
ratio
nal o
bjec
tive
(f
rom
S2.
1)
Inte
nsity
Sco
re
(1-6
)
Con
sequ
ence
Sco
re
(1-6
)
Con
fiden
ce sc
ore
(1-2
)
Rationale mooring Navigation/steaming
1 4 6 Behaviour/ movement
spotted warehou 6.1 1 1 2 Fishing effort is almost entirely restricted to waters along the edge of the continental shelf off the east coast of Tasmania.. Fishing occurs daily. Disturbance to physical processes due to Navigation/steaming of fishing vessels was expected to pose greatest potential risk for the Behaviour/movement of spotted warehou which move up into the water column resulting in disruption to feeding and/or migration . Intensity was scored as negligible because although the hazard was considered over a large range/scale, Navigation/ steaming considered to only impact a small < 1 nm area and because benthopelagic teleosts are highly mobile strong avoidance ability was expected at the scale of 1 nm => Consequence was also considered negligible with any impact of Navigation/ steaming unlikely to be detectable for benthopelagic teleosts. Confidence in the consequence score was considered high because Navigation/ steaming unlikely to impact and have consequences for the behaviour/movement of highly mobile benthopelagic teleosts
Other fisheries 1 6 6 Population size Blue eye 1.3 3 3 2 Byproduct species are targeted daily in external fisheries e.g. blue eye targeted in GHATF. Intensity considered Moderate because byproduct species in this fishery are also the target or bycatch of other commonwealth and state fisheries.
Consequence considered Moderate (full exploitation rate but long term recruitment dynamics not adversely damaged) because byproduct species are already fully exploited in other fisheries e.g. blue eye. Confidence: high – SEF quota species have detailed stock assessments.
Aquaculture 0
External Impacts (specify the particular example within each activity area)
Other extractive activities
1 5 6 Behaviour/ movement
Spotted warehou 6.1 2 2 1 Oil exploration occurs daily, beyond the main effort in the fishery across a wide geographic range, particularly in Bass Strait.
Demersal byproduct species would avoid any spills – most likely to affect spotted warehou which move up into the water column. Intensity: spills are rare Consequence: minor, unlikely to affect a population Confidence low. No data

Level 1
70
Direct impact of Fishing
Fishing Activity Pr
esen
ce (1
) A
bsen
ce (0
)
Spat
ial s
cale
of H
azar
d (1
-6)
Tem
pora
l sca
le o
f Haz
ard
(1-6
)
Sub-component Unit of analysis Ope
ratio
nal o
bjec
tive
(f
rom
S2.
1)
Inte
nsity
Sco
re
(1-6
)
Con
sequ
ence
Sco
re
(1-6
)
Con
fiden
ce sc
ore
(1-2
)
Rationale Other non extractive activities
1 6 6 Behaviour/ movement
Byproduct and bycatch
6.1 1 1 1 Shipping activity occurs daily across the full range of the fishery, and outside areas of current effort. Greatest potential risks are to the Behaviour/movement of benthopelagic teleost species resulting in disruption to feeding and/ or migration Intensity: negligible because although the hazard was considered over a large range/scale, the shipping track is narrow - impact a < 1 nm wide and because benthopelagic teleosts are highly mobile strong avoidance ability was expected at the scale of 1 nm.
Consequence: negligible with any consequence of shipping impacts unlikely to be detectable for benthopelagic teleosts Confidence: high shipping unlikely to impact and have consequences for the behaviour/movement of highly mobile small pelagic species.
Other anthropogenic activities
1 4 5 Behaviour/ movement
Byproduct and bycatch
6.1 1 1 2 Tourism occurs across the full range of the fishery, and outside areas of current effort. Impacts are unlikely to occur daily because much of the effort is offshore. Greatest potential risks are to the Behaviour/movement of affect spotted warehou which move up into the water column resulting in disruption to feeding and/ or migration. Intensity: negligible because although the hazard is dispersed over a large range, its occurrence is patchy- around population centres, and because small pelagic species are highly mobile strong avoidance ability was expected. Consequence: negligible with any consequence of tourism impacts unlikely to be detectable for benthopelagic teleosts. Confidence: high- tourism unlikely to impact and have consequences for the behaviour/movement.

Level 1
71
2.3.1 Level 1 (SICA) Documents L1.3 - TEP Species Component
Direct impact of Fishing
Fishing Activity Pr
esen
ce (1
) A
bsen
ce (0
)
Spat
ial s
cale
of H
azar
d (1
-6)
Tem
pora
l sca
le o
f Haz
ard
(1-6
)
Sub-component Unit of analysis Ope
ratio
nal o
bjec
tive
(f
rom
S2.
1)
Inte
nsity
Sco
re
(1-6
)
Con
sequ
ence
Sco
re
(1-6
)
Con
fiden
ce sc
ore
(1-2
)
Rationale Bait collection 0
Fishing 1 4 6 Population size Bottle-nose dolphins
1 2 3 1 Fishing effort is almost entirely restricted to waters along the edge of the continental shelf off the east coast of Tasmania. Fishing occurs daily Intesity moderate: Species is protected. Catches have been reported in this fishery. Consequence: moderate. Any significant catches would be publicly unacceptable.
Capture
Incidental behaviour
0
Bait collection 0 Fishing 1 4 6 Behaviour /
movement Bottle-nose dolphins
6 2 2 2 Fishing effort is almost entirely restricted to waters along the edge of the continental shelf off the east coast of Tasmania. Fishing occurs daily =>Direct impact of fishing without capture would be expected to impact dolphins by modifying their behaviour and attracting them to regions they would not normally occur in high abundances, could lead to dependency and possible flow-on population effects if fishing patterns change => At current levels of fishing the intensity was considered Minor - activity occurs in a few restricted locations over the scale of the total area of the fishery. Consequence considered Minor - no detectable change in behaviour/ movement, time to return to original behaviour/ movement on the scale of hours => The number of dolphins-fishing interactions in the purse-seine sub-fishery has not been monitored so confidence score is high.
Direct impact without capture
Incidental behaviour
0
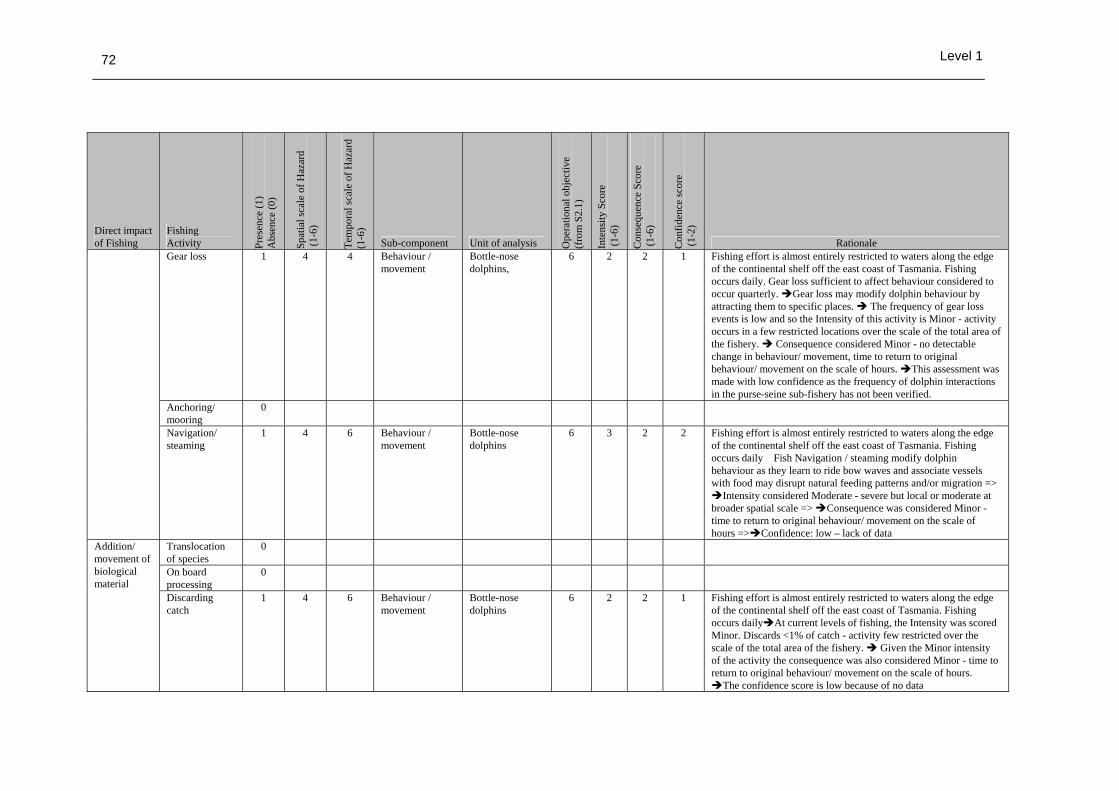
Level 1
72
Direct impact of Fishing
Fishing Activity Pr
esen
ce (1
) A
bsen
ce (0
)
Spat
ial s
cale
of H
azar
d (1
-6)
Tem
pora
l sca
le o
f Haz
ard
(1-6
)
Sub-component Unit of analysis Ope
ratio
nal o
bjec
tive
(f
rom
S2.
1)
Inte
nsity
Sco
re
(1-6
)
Con
sequ
ence
Sco
re
(1-6
)
Con
fiden
ce sc
ore
(1-2
)
Rationale Gear loss 1 4 4 Behaviour /
movement Bottle-nose dolphins,
6 2 2 1 Fishing effort is almost entirely restricted to waters along the edge of the continental shelf off the east coast of Tasmania. Fishing occurs daily. Gear loss sufficient to affect behaviour considered to occur quarterly. Gear loss may modify dolphin behaviour by attracting them to specific places. The frequency of gear loss events is low and so the Intensity of this activity is Minor - activity occurs in a few restricted locations over the scale of the total area of the fishery. Consequence considered Minor - no detectable change in behaviour/ movement, time to return to original behaviour/ movement on the scale of hours. This assessment was made with low confidence as the frequency of dolphin interactions in the purse-seine sub-fishery has not been verified.
Anchoring/ mooring
0
Navigation/ steaming
1 4 6 Behaviour / movement
Bottle-nose dolphins
6 3 2 2 Fishing effort is almost entirely restricted to waters along the edge of the continental shelf off the east coast of Tasmania. Fishing occurs daily Fish Navigation / steaming modify dolphin behaviour as they learn to ride bow waves and associate vessels with food may disrupt natural feeding patterns and/or migration =>
Intensity considered Moderate - severe but local or moderate at broader spatial scale => Consequence was considered Minor - time to return to original behaviour/ movement on the scale of hours => Confidence: low – lack of data
Translocation of species
0
On board processing
0
Addition/ movement of biological material
Discarding catch
1 4 6 Behaviour / movement
Bottle-nose dolphins
6 2 2 1 Fishing effort is almost entirely restricted to waters along the edge of the continental shelf off the east coast of Tasmania. Fishing occurs daily At current levels of fishing, the Intensity was scored Minor. Discards <1% of catch - activity few restricted over the scale of the total area of the fishery. Given the Minor intensity of the activity the consequence was also considered Minor - time to return to original behaviour/ movement on the scale of hours.
The confidence score is low because of no data

Level 1
73
Direct impact of Fishing
Fishing Activity Pr
esen
ce (1
) A
bsen
ce (0
)
Spat
ial s
cale
of H
azar
d (1
-6)
Tem
pora
l sca
le o
f Haz
ard
(1-6
)
Sub-component Unit of analysis Ope
ratio
nal o
bjec
tive
(f
rom
S2.
1)
Inte
nsity
Sco
re
(1-6
)
Con
sequ
ence
Sco
re
(1-6
)
Con
fiden
ce sc
ore
(1-2
)
Rationale Stock enhancement
0
Provisioning 0
Organic waste disposal
1 4 6 Behaviour / movement
Bottle-nose dolphins
6 2 2 2 Fishing effort is almost entirely restricted to waters along the edge of the continental shelf off the east coast of Tasmania.. Fishing occurs daily Organic waste disposal will initially impact on seabird behaviour by attracting them to the offal for food => At current levels of fishing, the Intensity was scored Minor - activity occurs in a few restricted locations over the scale of the total area of the fishery => Given the Minor intensity of the activity the consequence was also considered Minor - time to return to original behaviour/ movement on the scale of hours => The confidence score is high because the attraction toward this food is conceivably less than other sources e.g. discards/ onboard processing.
Debris 1 4 6 Behaviour / movement
Species – Seabirds, mainly smaller species of terns
6 2 2 1 Fishing effort is almost entirely restricted to waters along the edge of the continental shelf off the east coast of Tasmania.. Fishing occurs daily Floating debris will initially impact on seabird behaviour by attracting them to the debris for food because Debris generates new habitat for surface-schooling fish that seabirds would be attracted to for food => Intensity considered Minor because Debris considered to occur rarely => Given the Minor intensity of the activity the Consequence was also considered Minor - time to return to original behaviour/ movement considered to occur on the scale of hours => Low confidence – no data
Addition of non-biological material
Chemical pollution
1 4 3 Population size Species – Seabirds, in particular little penguins
1 2 2 1 Fishing effort is almost entirely restricted to waters along the edge of the continental shelf off the east coast of Tasmania. Fishing occurs daily but chemical pollution sufficient to impact on the population size of birds is unlikely to occur more than annually The direct impact of chemical pollution considered to lead to highest consequence was impact on seabirds in particular little penguins that would be immersed in the spill, Population size was selected as the sub-component => Intensity Minor - Chemical pollution occurs infrequently and on local scale => Consequence also scored Minor - insignificant change to population growth rate, unlikely to be detectable against

Level 1
74
Direct impact of Fishing
Fishing Activity Pr
esen
ce (1
) A
bsen
ce (0
)
Spat
ial s
cale
of H
azar
d (1
-6)
Tem
pora
l sca
le o
f Haz
ard
(1-6
)
Sub-component Unit of analysis Ope
ratio
nal o
bjec
tive
(f
rom
S2.
1)
Inte
nsity
Sco
re
(1-6
)
Con
sequ
ence
Sco
re
(1-6
)
Con
fiden
ce sc
ore
(1-2
)
Rationale background variability for this population => The confidence score is low because there is a lack of data on the extent that chemical pollution occurs in the fishery.
Exhaust 1 4 6 Behaviour/ movement
Species – Seabirds
6 1 2 2 Fishing effort is almost entirely restricted to waters along the edge of the continental shelf off the east coast of Tasmania.. Fishing occurs daily Exhaust emission was considered to pose greatest risk for the Behaviour/movement of Seabirds resulting in repulsion => Intensity was scored as negligible because although the hazard was considered over a large range/scale, exhaust considered to only impact a small < 1 nm area and because Seabird species are mobile hence strong avoidance ability was expected at the scale of 1 nm => Consequence considered Minor i.e. any consequence on seabirds unlikely to be detectable. Confidence in the consequence score was considered high because localised exhaust unlikely to impact on behaviour/movement of mobile seabirds.
Gear loss 1 6 4 Behaviour / Movement
Bottle nosed dolphins
6 2 2 1 Fishing effort is almost entirely restricted to waters along the edge of the continental shelf off the east coast of Tasmania.. Fishing occurs daily Gear loss is likely to attract dolphins to the food, hence lost gear not resulting in damage/mortality most likely to effect behaviour . Intensity was scored as Minor because lost gear – dolphin entangelement in lost gear, if it occurs, is infrequent.
Consequence considered Minor on dolphin behaviour/ movement - any consequence on turtles unlikely to be detectable, time taken to recover on scale of days - weeks => Confidence was scored as low because of a lack of data on interactions between dolphins and fishing gear.

Level 1
75
Direct impact of Fishing
Fishing Activity Pr
esen
ce (1
) A
bsen
ce (0
)
Spat
ial s
cale
of H
azar
d (1
-6)
Tem
pora
l sca
le o
f Haz
ard
(1-6
)
Sub-component Unit of analysis Ope
ratio
nal o
bjec
tive
(f
rom
S2.
1)
Inte
nsity
Sco
re
(1-6
)
Con
sequ
ence
Sco
re
(1-6
)
Con
fiden
ce sc
ore
(1-2
)
Rationale Navigation/ steaming
1 4 6 Behaviour / Movement
Species - Seabirds
6 1 2 2 Fishing effort is almost entirely restricted to waters along the edge of the continental shelf off the east coast of Tasmania.. Fishing occurs daily Navigation and steaming would have the greatest effect on seabird behaviour by encouraging the birds to follow the ships in the expectation of obtaining food. Navigation/steaming is a large component of the small pelagic species fishing operations, however there is remote likelihood of impact on Seabirds over the spatial scale of the fishery . Consequence Minor - no detectable change in behaviour/ movement. Time to return to original behaviour/ movement on the scale of hours. Confidence was recorded as high because it is considered unlikely for there to be strong interactions between Navigation/ steaming and Seabird Behaviour/ movement.
Activity/ presence on water
1 4 6 Behaviour / Movement
Species - Seabirds
6 1 1 2 Fishing effort is almost entirely restricted to waters along the edge of the continental shelf off the east coast of Tasmania.. Fishing occurs daily The presence of vessels on the water would have the greatest effect on seabird behaviour by attracting birds to the vessel in the expectation of obtaining food=> Intensity was scored as Negligible because although the hazard was considered over a large range/scale, vessel presence considered to only impact a small < 1 nm area => Consequence was considered Minor with any impacts of vessel presence unlikely to be detectable for highly mobile Seabirds, expected to return to normal Behaviour/ movement on the scale of hours . Confidence in the consequence score was high because localised vessel presence/activity considered unlikely to have measurable impact on populations.
Disturb Bait collection 0

Level 1
76
Direct impact of Fishing
Fishing Activity Pr
esen
ce (1
) A
bsen
ce (0
)
Spat
ial s
cale
of H
azar
d (1
-6)
Tem
pora
l sca
le o
f Haz
ard
(1-6
)
Sub-component Unit of analysis Ope
ratio
nal o
bjec
tive
(f
rom
S2.
1)
Inte
nsity
Sco
re
(1-6
)
Con
sequ
ence
Sco
re
(1-6
)
Con
fiden
ce sc
ore
(1-2
)
Rationale Fishing 1 4 6 Behaviour/
movement Seabirds 6 1 1 2 Fishing effort is almost entirely restricted to waters along the edge
of the continental shelf off the east coast of Tasmania.. Fishing occurs daily Disturbance of physical processes via fishing was expected to pose greatest potential risk for the Behaviour/movement of Seabirds resulting in momentary disruption to feeding and/or movement => Intensity was scored as negligible because although the hazard was considered over a large range/scale, fishing considered to only impact physical processes over a small < 1 nm area => Consequence was also considered Negligible with any consequence of water column disturbance unlikely to have detectable effects on Seabird foraging behaviour => Confidence in the consequence score was considered high because localised disruption of water column unlikely to impact and have consequences for the behaviour/movement of highly mobile Seabirds (can be evaluated without data).
Boat launching 0
Anchoring/ mooring
0
physical processes
Navigation/steaming
1 4 6 Behaviour / Movement
Species - Seabirds
6 1 1 2 Fishing effort is almost entirely restricted to waters along the edge of the continental shelf off the east coast of Tasmania.. Fishing occurs daily Disturbance of physical processes via navigation and steaming was expected to pose greatest potential risk for the Behaviour/movement of Seabirds resulting in momentary disruption to feeding and/or movement => Intensity was scored as negligible because although the hazard was considered over a large range/scale, the activity was considered to only impact physical processes over a small < 1 nm area => Consequence was also considered Negligible with any consequence of water column disturbance unlikely to have detectable effects on Seabird foraging behaviour => Confidence in the consequence score was considered high because localised disruption of water column unlikely to impact and have consequences for the behaviour/movement of highly mobile Seabirds (can be evaluated without data).

Level 1
77
Direct impact of Fishing
Fishing Activity Pr
esen
ce (1
) A
bsen
ce (0
)
Spat
ial s
cale
of H
azar
d (1
-6)
Tem
pora
l sca
le o
f Haz
ard
(1-6
)
Sub-component Unit of analysis Ope
ratio
nal o
bjec
tive
(f
rom
S2.
1)
Inte
nsity
Sco
re
(1-6
)
Con
sequ
ence
Sco
re
(1-6
)
Con
fiden
ce sc
ore
(1-2
)
Rationale Other fisheries 1 6 6 Population size Species –
Albatross species 1 4 4 2 Commercial fisheries impacting on albatross extend across southern
Australian waters and beyond, fishing occurs daily. Other capture fishery methods were considered to pose greatest risk to the population size sub-component for TEP species, several albatross species are known to interact with long-line tuna fisheries and strike warps in demersal trawl fisheries. Long-line impact on albatrosses was considered a Major impact on population size that occurs reasonably often at broad spatial scale => Consequence was scored as Major because serious consequences are believed to be now occurring => Confidence was recorded as high because of extensive observational data on albatross long-line fishery interactions.
Aquaculture 0
Coastal development
1 6 5 Behaviour / Movement
Species - Seabirds
6 1 1 1 Coastal development occurs daily around the range of the fishery, beyond the areas where effort is currently focused. Impacts on the SPF do not occur daily because much of the effort is offshore.
Intensity considered Negligible – occurs rarely at small spatial scale Coastal development was not considered to change behaviour and movement so the consequence scored negligible =>
Confidence low – no data Other extractive activities
1 5 6 Behaviour/ Movement
Bottle nose dolphins
6 2 2 1 Oil exploration occurs daily, beyond the main effort in the fishery across a wide geographic range, particularly in Bass Strait.
Dolphins species would avoid any spills other than a large oil slick caused by a sinking or stranding. Intensity: spills are rare Consequence: minor, unlikely to affect a population Confidence low. Little data
External Impacts (specify the particular example within each activity area)
Other non extractive activities
1 6 6 Behaviour / Movement
Species - Seabirds
6 1 1 2 Shipping activity occurs daily across the full range of the fishery, and outside areas of current effort. Greatest potential risks are to the Behaviour/movement of seabird species resulting in disruption to feeding and/ or migration. Seabirds may be attracted to ships expecting food Intensity: negligible because although the hazard was considered over a large range/scale, the shipping track is narrow - impact a < 1 nm wide. Consequence: negligible with any consequence of shipping impacts unlikely to be detectable for seabirds Confidence: high - shipping unlikely to impact and have

Level 1
78
Direct impact of Fishing
Fishing Activity Pr
esen
ce (1
) A
bsen
ce (0
)
Spat
ial s
cale
of H
azar
d (1
-6)
Tem
pora
l sca
le o
f Haz
ard
(1-6
)
Sub-component Unit of analysis Ope
ratio
nal o
bjec
tive
(f
rom
S2.
1)
Inte
nsity
Sco
re
(1-6
)
Con
sequ
ence
Sco
re
(1-6
)
Con
fiden
ce sc
ore
(1-2
)
Rationale significant negative consequences for the behaviour/movement of seabirds (can be evaluated without data).
Other anthropogenic activities
1 6 6 Behaviour/ movement
Bottle nose dolphins
6 2 2 1 Tourism occurs daily across the full range of the fishery, and outside areas of current effort. Greatest potential risks are to the Behaviour/movement of dolphin species resulting in disruption to feeding and/ or migration. Intensity: minor because although the hazard is dispersed over a large range, its occurrence is patchy- around population centres. Consequence: minor with any consequence of tourism impacts likely to be detectable for dolphins. Confidence: low – no data

Level 1
79
2.3.1 Level 1 (SICA) Documents L1.4 - Habitat Component
Direct impact of Fishing Fishing Activity Pr
esen
ce (1
) A
bsen
ce (0
)
Spat
ial s
cale
of H
azar
d (1
-6)
Tem
pora
l sca
le o
f H
azar
d (1
-6)
Sub-component Unit of analysis Ope
ratio
nal o
bjec
tive
(f
rom
S2.
1)
Inte
nsity
Sco
re
(1-6
)
Con
sequ
ence
Sco
re
(1-6
)
Con
fiden
ce sc
ore
(1-2
)
Rationale Bait collection 0 Fishing 1 4 6 Habitat structure
and Function Southern coastal pelagic Province
5.1 3 1 1 Most fishing activity occurs along on the east coast of Tasmania over a range of 200 n miles, in AFMA management Zone A. Mid water trawling for small pelagic species is mainly likely to affect pelagic habitat structure and function transiently as the shot passes through the water. Intensity: moderate, relatively localised. Consequence: Negligible, as water column expected to resume state rapidly. Confidence: low because of insufficient knowledge of pelagic habitat processes.
Capture
Incidental behaviour 0 Bait collection 0 Fishing 1 4 6 Habitat structure
and Function fine sediments, subcrop, large sponges, outer-shelf
5.1 2 2 1 Most fishing activity occurs along on the east coast of Tasmania over a range of 200 n miles, in AFMA management Zone A. Mid water trawl shots occasionally contact the benthos during deployment. Where nets contact the bottom, direct impact will be sustained by habitat (substratum and faunal communities) within the vicinity of the contact. Subsequent degree of disturbance, damage or mortality of substratum and associated faunal assemblages, will depend on size of net (footprint), contact force, extent of area dragged before net lifted. Recovery capacity of habitat is species and depth related (deeper =slower). Intensity: minor, the impact of non-capture damage or mortality was considered to occur infrequently. Consequence: negligible if shelf waters <60m, however one event likely to cause severe localised effect in fragile shelf break habitats (e.g. bryozoan, octocorals), however over the entire scale of the effort is likely to be minor, unless frequency increases. Confidence: low due to unvalidated record of frequency of this occurrence.
Direct impact without capture
Incidental behaviour 0

Level 1
80
Direct impact of Fishing Fishing Activity Pr
esen
ce (1
) A
bsen
ce (0
)
Spat
ial s
cale
of H
azar
d (1
-6)
Tem
pora
l sca
le o
f H
azar
d (1
-6)
Sub-component Unit of analysis Ope
ratio
nal o
bjec
tive
(f
rom
S2.
1)
Inte
nsity
Sco
re
(1-6
)
Con
sequ
ence
Sco
re
(1-6
)
Con
fiden
ce sc
ore
(1-2
)
Rationale Gear loss 1 4 4 Habitat structure
and Function sedimentary rock, outcrop, mixed faunal community,Inner shelf
5.1 2 1 2 Gear loss possible over entire range of the sub-fishery, but more likely to occur in the area of greatest fishing effort. Gear loss considered to occur a few times a year during the calendar fishing year, perhaps quarterly. Lost gear may be irretrievable in deeper waters, may impact benthos in process of balling up and retrieval, or snag on higher relief reefs, potentially damaging habitat in the vicinity, eventually becoming habitat. Intensity: minor, considered a rare event. Consequence: negligible, habitat modification likely to be undetectable. Confidence: high, though effects not visually documented for this fishery, and there is a lack of verified data on rates and types of gear loss.
Anchoring/ mooring 0 Navigation/steaming 1 4 6 Habitat structure
and Function Southern coastal pelagic Province
5.1 1 1 2 Navigation/ steaming may occur daily during fishing season. The pelagic water quality of the Southern Coastal Pelagic habitat may change with increased turbulence and changes in water mixing that could occur from movement of vessels through water. Intensity and Consequence: negligible due to remote likelihood of detection at any spatial or temporal scale, and interactions that may be occurring are not detectable against natural variation. Confidence scored high because of logical constraints.
Translocation of species
0
On board processing 1
Addition/ movement of biological material
Discarding catch 1 4 6 Substrate quality fine sediments, subcrop, large sponges, outer-shelf
5.1 2 2 1 Discarding byproduct species known to occur during fishing trips. Most discards will be opportunistically taken up by the increased relative abundance of predators attracted by this process i.e. sharks and TEP species. Some discards may reach the benthos, where they could be expected to be taken up rapidly by demersal species, depending on volume. Localized accumulation unlikely, but if occurs leads to anoxic bottom sediments, particularly if fine, which alters substratum biogeochemistry for burrowing infauna. Large, erect habitat could be damaged however, Intensity considered minor, as

Level 1
81
Direct impact of Fishing Fishing Activity Pr
esen
ce (1
) A
bsen
ce (0
)
Spat
ial s
cale
of H
azar
d (1
-6)
Tem
pora
l sca
le o
f H
azar
d (1
-6)
Sub-component Unit of analysis Ope
ratio
nal o
bjec
tive
(f
rom
S2.
1)
Inte
nsity
Sco
re
(1-6
)
Con
sequ
ence
Sco
re
(1-6
)
Con
fiden
ce sc
ore
(1-2
)
Rationale thought to occur rarely. Consequence: minor because only short term changes in benthos structure, function and quality likely to occur. Confidence low: because of a lack of insufficient knowledge on trophic dynamics.
Stock enhancement 0 Provisioning 0 Organic waste disposal
1 4 6 Water Quality Pelagic: Southern coastal pelagic Province
1.1 1 1 2 Organic waste disposal possible over the entire scale of fishing effort. Boats subject to MARPOL. Water quality of pelagic habitats is considered to experience greatest impact of organic waste disposal. Overall volume of waste likely to be too small to reach benthos, or accumulate even if it does. Intensity: moderate. Consequence: Minor, addition of high nutrient material is realistically expected to cause short term peaks in productivity or scavenging species interactions, with minimal detectability within minutes to hours. Confidence: high logical constraints.
Addition of non-biological material
Debris 1 4 6 Habitat structure and Function
Southern coastal pelagic province
5.1 2 2 1 Fishing activity occurs over a small spatial scale, generation of debris possible over this scale, and may occur on a daily basis during fishing season. Greatest effort within the Southern Coastal Pelagic province habitat, therefore considered the most likely habitat to accumulate floating plastics, and inadvertent losses from fishing operations. All boats subject to MARPOL rules, which means losses should be unintentional, and retrieved if possible. Debris considered to reduce water quality, and alter habitat structure with the addition of ingestible materials putting susceptible species at risk e.g. seabirds, dolphins or seals. Intensity: minor if adherence to MARPOL regulations. Consequence: minor to habitat as dispersal and small volumes. Consequence: low
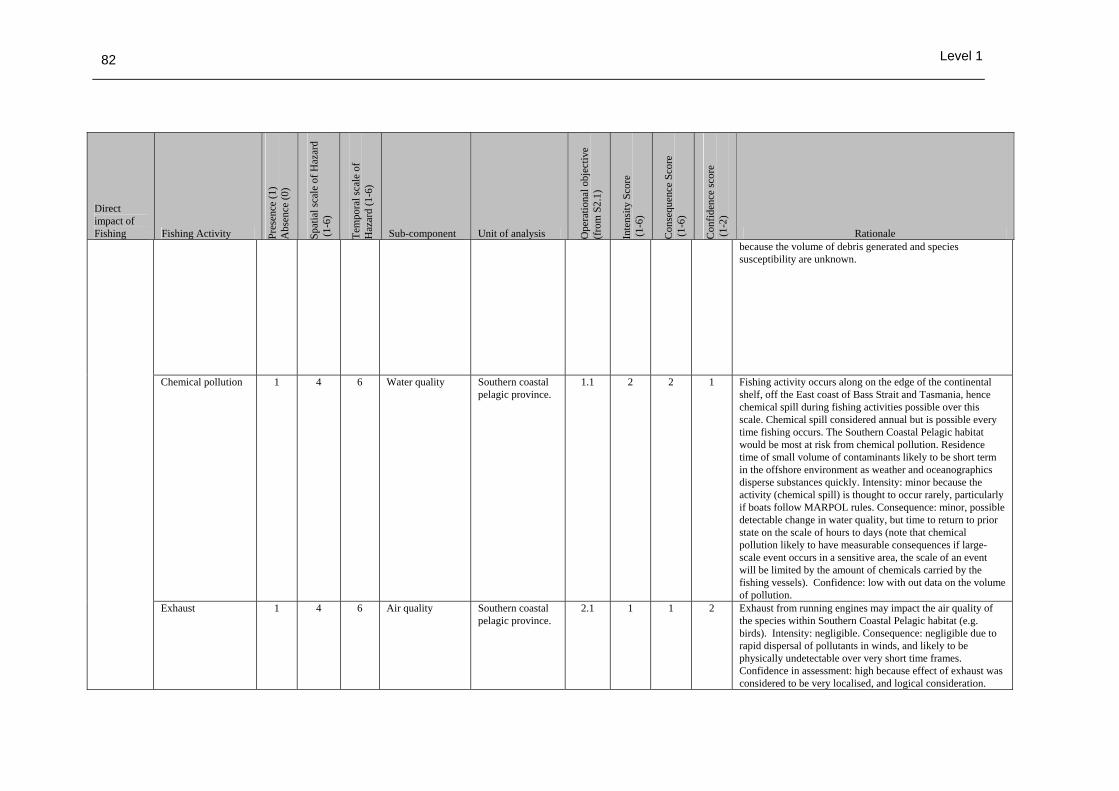
Level 1
82
Direct impact of Fishing Fishing Activity Pr
esen
ce (1
) A
bsen
ce (0
)
Spat
ial s
cale
of H
azar
d (1
-6)
Tem
pora
l sca
le o
f H
azar
d (1
-6)
Sub-component Unit of analysis Ope
ratio
nal o
bjec
tive
(f
rom
S2.
1)
Inte
nsity
Sco
re
(1-6
)
Con
sequ
ence
Sco
re
(1-6
)
Con
fiden
ce sc
ore
(1-2
)
Rationale because the volume of debris generated and species susceptibility are unknown.
Chemical pollution 1 4 6 Water quality Southern coastal pelagic province.
1.1 2 2 1 Fishing activity occurs along on the edge of the continental shelf, off the East coast of Bass Strait and Tasmania, hence chemical spill during fishing activities possible over this scale. Chemical spill considered annual but is possible every time fishing occurs. The Southern Coastal Pelagic habitat would be most at risk from chemical pollution. Residence time of small volume of contaminants likely to be short term in the offshore environment as weather and oceanographics disperse substances quickly. Intensity: minor because the activity (chemical spill) is thought to occur rarely, particularly if boats follow MARPOL rules. Consequence: minor, possible detectable change in water quality, but time to return to prior state on the scale of hours to days (note that chemical pollution likely to have measurable consequences if large-scale event occurs in a sensitive area, the scale of an event will be limited by the amount of chemicals carried by the fishing vessels). Confidence: low with out data on the volume of pollution.
Exhaust 1 4 6 Air quality Southern coastal pelagic province.
2.1 1 1 2 Exhaust from running engines may impact the air quality of the species within Southern Coastal Pelagic habitat (e.g. birds). Intensity: negligible. Consequence: negligible due to rapid dispersal of pollutants in winds, and likely to be physically undetectable over very short time frames. Confidence in assessment: high because effect of exhaust was considered to be very localised, and logical consideration.
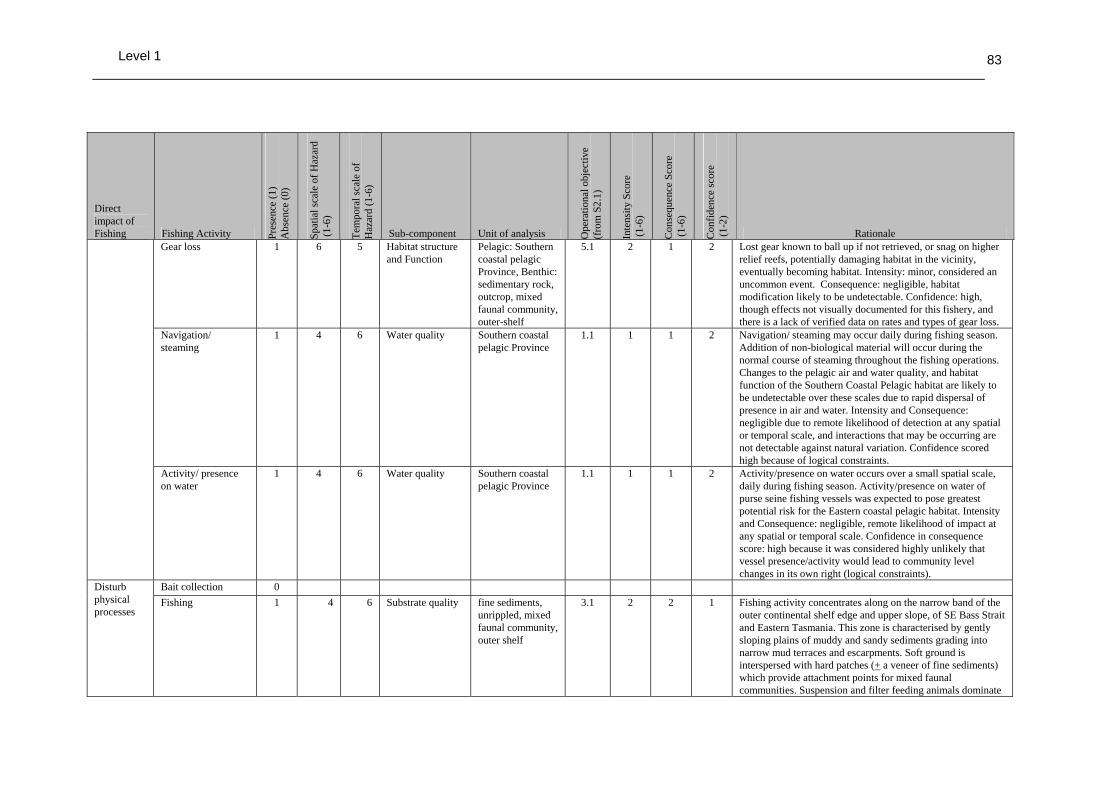
Level 1
83
Direct impact of Fishing Fishing Activity Pr
esen
ce (1
) A
bsen
ce (0
)
Spat
ial s
cale
of H
azar
d (1
-6)
Tem
pora
l sca
le o
f H
azar
d (1
-6)
Sub-component Unit of analysis Ope
ratio
nal o
bjec
tive
(f
rom
S2.
1)
Inte
nsity
Sco
re
(1-6
)
Con
sequ
ence
Sco
re
(1-6
)
Con
fiden
ce sc
ore
(1-2
)
Rationale Gear loss 1 6 5 Habitat structure
and Function Pelagic: Southern coastal pelagic Province, Benthic: sedimentary rock, outcrop, mixed faunal community, outer-shelf
5.1 2 1 2 Lost gear known to ball up if not retrieved, or snag on higher relief reefs, potentially damaging habitat in the vicinity, eventually becoming habitat. Intensity: minor, considered an uncommon event. Consequence: negligible, habitat modification likely to be undetectable. Confidence: high, though effects not visually documented for this fishery, and there is a lack of verified data on rates and types of gear loss.
Navigation/ steaming
1 4 6 Water quality Southern coastal pelagic Province
1.1 1 1 2 Navigation/ steaming may occur daily during fishing season. Addition of non-biological material will occur during the normal course of steaming throughout the fishing operations. Changes to the pelagic air and water quality, and habitat function of the Southern Coastal Pelagic habitat are likely to be undetectable over these scales due to rapid dispersal of presence in air and water. Intensity and Consequence: negligible due to remote likelihood of detection at any spatial or temporal scale, and interactions that may be occurring are not detectable against natural variation. Confidence scored high because of logical constraints.
Activity/ presence on water
1 4 6 Water quality Southern coastal pelagic Province
1.1 1 1 2 Activity/presence on water occurs over a small spatial scale, daily during fishing season. Activity/presence on water of purse seine fishing vessels was expected to pose greatest potential risk for the Eastern coastal pelagic habitat. Intensity and Consequence: negligible, remote likelihood of impact at any spatial or temporal scale. Confidence in consequence score: high because it was considered highly unlikely that vessel presence/activity would lead to community level changes in its own right (logical constraints).
Bait collection 0 Disturb physical processes
Fishing 1 4 6 Substrate quality fine sediments, unrippled, mixed faunal community, outer shelf
3.1 2 2 1 Fishing activity concentrates along on the narrow band of the outer continental shelf edge and upper slope, of SE Bass Strait and Eastern Tasmania. This zone is characterised by gently sloping plains of muddy and sandy sediments grading into narrow mud terraces and escarpments. Soft ground is interspersed with hard patches (+ a veneer of fine sediments) which provide attachment points for mixed faunal communities. Suspension and filter feeding animals dominate

Level 1
84
Direct impact of Fishing Fishing Activity Pr
esen
ce (1
) A
bsen
ce (0
)
Spat
ial s
cale
of H
azar
d (1
-6)
Tem
pora
l sca
le o
f H
azar
d (1
-6)
Sub-component Unit of analysis Ope
ratio
nal o
bjec
tive
(f
rom
S2.
1)
Inte
nsity
Sco
re
(1-6
)
Con
sequ
ence
Sco
re
(1-6
)
Con
fiden
ce sc
ore
(1-2
)
Rationale these communities. Disturbance of physical processes via midwater trawling will occur if nets contact benthos. Sediments will be resuspended, potentially smothering filter feeding animals. Shallow infaunal bioturbators will be dislodged, settling elsewhere. Recovery capacity of sessile species removed by the net is unknown for many groups. Intensity: minor because net contact with bottom not a usual part of deployment. Consequence: minor with current level of effort, however this would need review if effort increases. Disturbance of water column unlikely to be detectable for pelagic communities. Confidence: low for benthos, inadequate documentation of frequency of this occurrence.
Boat launching 0 Anchoring/ mooring 0 Navigation/ steaming
1 4 6 Habitat structure and function
Southern coastal pelagic Province
5.1 1 1 2 Navigation/ steaming may occur daily during fishing season. Disturbance of physical processes will occur during the normal course of steaming throughout the fishing zone. Turbulence and disturbance of pelagic water quality is unlikely to affect normal water column processes for long. Any disruption to these processes can therefore be expected to alter habitat function only briefly for macroscopic fauna. Intensity and Consequence: negligible due to remote likelihood of detection at any spatial or temporal scale, and interactions that may be occurring are not detectable against natural variation. Confidence scored high because of logical constraints.

Level 1
85
Direct impact of Fishing Fishing Activity Pr
esen
ce (1
) A
bsen
ce (0
)
Spat
ial s
cale
of H
azar
d (1
-6)
Tem
pora
l sca
le o
f H
azar
d (1
-6)
Sub-component Unit of analysis Ope
ratio
nal o
bjec
tive
(f
rom
S2.
1)
Inte
nsity
Sco
re
(1-6
)
Con
sequ
ence
Sco
re
(1-6
)
Con
fiden
ce sc
ore
(1-2
)
Rationale Other fisheries 1 6 6 Habitat structure
and function Southern coastal pelagic Province
5.1 3 4 1 Fishery covers a small spatial area in which other fisheries occur, using different targeting methods and gears. Fishing activity of these fisheries occurs over a large spatial range, over which there can be daily fishing activity. Other fisheries most likely to effect benthic habitats include those using bottom gears i.e. SET Danish seine, and otter trawl, GHAT gillnet, autolongline, (and to a lesser degree) demersal longlines, dropline, trap. Intensity: moderate, the impact was considered to be potentially severe at local scales but moderate at broader spatial scale. Consequence: major to severe, because the cumulative effects of fishing are likely to have measurable changes to structure, function, extent, quality and regeneration capacity of vulnerable habitats. Loss of habitat results in short and long term loss of species, as habitats play a keystone role in ecosystem stability. Confidence: low because of insufficient knowledge of habitat dynamics, and ecosystem connectivity
Aquaculture 0 Coastal development
1 6 5 Habitat structure and function
fine sediments, unrippled, mixed faunal community, outer shelf
5.1 3 3 1 Coastal development occurs within an area on the scale of 10 nm Frequent, local impacts at small spatial scales are likely to have most obvious impact on the habitat composition, structure and function, including for pelagic types, water quality and for benthic types, substratum state. Intensity: moderate at broader spatial scale, or severe but localized within the areas affected. Consequence: moderate, greatest impacts likely to be inshore including waters less than 25m, extending in some cases further out onto the inner shelf Southern Coastal Pelagic and benthic habitats. Confidence: low because of a lack of data.
External Impacts (specify the particular example within each activity area)
Other extractive activities
1 5 6 Habitat structure and function
Southern coastal pelagic Province
5.1 2 2 1 Oil and gas industry occur in the broad area (e.g. Bass Strait). There may be pollution from the petrochemical industry in both shallow and deep water and associated stimuli. Intensity: minor as direct and indirect impact(s) on community likely to be low, but linkages need to be better understood. Consequence: Cumulative impacts may exist, but considered minor as commercial fishing restricted within these zones.

Level 1
86
Direct impact of Fishing Fishing Activity Pr
esen
ce (1
) A
bsen
ce (0
)
Spat
ial s
cale
of H
azar
d (1
-6)
Tem
pora
l sca
le o
f H
azar
d (1
-6)
Sub-component Unit of analysis Ope
ratio
nal o
bjec
tive
(f
rom
S2.
1)
Inte
nsity
Sco
re
(1-6
)
Con
sequ
ence
Sco
re
(1-6
)
Con
fiden
ce sc
ore
(1-2
)
Rationale Confidence: low, due to limited information available.
Other non extractive activities
1 6 6 Habitat structure and function
Southern coastal pelagic Province
5.1 2 1 1 Shipping may occur in the area of fishing effort (predominantly AFMA management Zone A) and may occur daily. Most shipping considered to occur in the Southern Coastal Pelagic environment and impact bio- and geo-chemical cycles of pelagic waters by disturbing mixed depth layer, and addition of non biological materials. Intensity: minor because natural levels of mixing and re-mixing considered high in Eastern Coastal Pelagic and benthic impacts localised over scale of fishery area. Consequence: negligible - Interactions which affect bio- & geochemical cycling unlikely to be detectable against natural variation. Benthic detection decreases with time and object forms basis of reef structure which will be colonized over time (more rapidly in waters < 200m. Confidence: low because of a lack of information on shipping-animal interactions plus insufficient knowledge on effects of ships on bio- and geo-chemical cycling
Other anthropogenic activities
1 4 5 Habitat structure and function
Southern coastal pelagic Province
5.1 2 2 1 Habitats may be disturbed by charter boats associated with general recreational activities, and tourism (e.g. whale watching, fishing tours, anchoring, recreational diving etc). Intensity: Assumed to have minor direct and indirect impacts on pelagic habitat, and un measured on benthos. Consequence: Until there is better information, difficult to score therefore low confidence.

Level 1
87
2.3.1 Level 1 (SICA) Documents L1.5 - Community Component
Direct impact of Fishing Fishing Activity Pr
esen
ce (1
) A
bsen
ce (0
)
Spat
ial s
cale
of H
azar
d (1
-6)
Tem
pora
l sca
le o
f H
azar
d (1
-6)
Sub-component Unit of analysis Ope
ratio
nal o
bjec
tive
(f
rom
S2.
1)
Inte
nsity
Sco
re
(1-6
)
Con
sequ
ence
Sco
re
(1-6
)
Con
fiden
ce sc
ore
(1-2
)
Rationale Bait collection 0 Fishing 1 4 6 Functional group
composition Southern coastal pelagic
2 3 3 1 Most of the current fishing effort in the sub-fishery is restricted to the east coast of Tasmania in AFMA management Zone A over a range of approximately 200 nm. Fishing occurs daily over the fishing season. Mid water trawling for small pelagic species most likely to effect functional group composition, i.e. removal of the small pelagic species functional group from the Southern Coastal Pelagic community. Intensity: moderate 6–i.e. the impact was considered to be potentially severe at local scales but moderate at broader spatial scale => Consequence: moderate, i.e. it was considered that fishing would have measurable changes to the ecosystem without a major change in function => Confidence: low because of insufficient knowledge of trophic interactions.
Capture
Incidental behaviour 0 Bait collection 0 Fishing 1 4 6 Functional group
composition Southern coastal pelagic
2 2 1 1 Most of the current fishing effort in the sub-fishery is restricted to the east coast of Tasmania in AFMA management Zone A over a range of approximately 200 nm. Mid water trawling (not resulting in capture) most likely to effect functional group composition => damage or mortality to the small pelagic functional group from the Southern Coastal Pelagic community. Intensity: minor – i.e. the impact of non-capture damage or mortality was considered to occur rarely because mechanics of purse seine fishing unlikely to strongly impact fish not captured. Consequence: negligible because it was considered that damage or mortality to non-caught small pelagic species is unlikely to have strong impacts on the small pelagic functional group in its own right => Confidence: low because of insufficient knowledge on effects of mid water trawling on non-captured individuals.
Direct impact without capture
Incidental behaviour 0

Level 1
88
Direct impact of Fishing Fishing Activity Pr
esen
ce (1
) A
bsen
ce (0
)
Spat
ial s
cale
of H
azar
d (1
-6)
Tem
pora
l sca
le o
f H
azar
d (1
-6)
Sub-component Unit of analysis Ope
ratio
nal o
bjec
tive
(f
rom
S2.
1)
Inte
nsity
Sco
re
(1-6
)
Con
sequ
ence
Sco
re
(1-6
)
Con
fiden
ce sc
ore
(1-2
)
Rationale Gear loss 1 4 4 Functional group
composition Tasmanian outer shelf
2 1 1 1 Gear is most likely to be lost off eastern Tasmania. It is unlikely that even minor gear loss occurs daily. Gear loss was considered to have greatest community level impact by effecting predators such as tunas and large sharks => Impact: negligible –i.e. the likelihood of impact was considered remote. Consequence: negligible for the tuna/ shark predatory functional group => Confidence in the consequence score: low because of a lack of verified data on rates and types of gear loss and insufficient knowledge of trophic interactions.
Anchoring/ mooring 0 Navigation/ steaming 1 4 6 Species
composition Southern coastal pelagic
1 1 1 2 Navigation/ steaming occurs daily during fishing season, mainly off eastern Tasmania. The species composition of the autotrophs of the Southern Coastal Pelagic community may change with increased turbulence and changes in water mixing that could occur from high levels of fishing activity => Intensity: negligible - remote likelihood of detection at any spatial or temporal scale => Consequence: negligible as interactions may be occurring which affect the internal dynamics of communities leading to change in species composition but not detectable against natural variation => Confidence scored high because of logical constraints.
Translocation of species
0 Redbait sold as aquaculture but potential impact of potential pathogens would not occur in this fishery
On board processing 0
Addition/ movement of biological material
Discarding catch 1 4 6 Species composition
Southern coastal pelagic
1 2 2 1 Discarding is most likely to occur off eastern Tasmania, daily during the fishing season. Discard species include southern frostfish (Lapidopus caudatus) and butterfly gurnard (Lepidotrigla vanessa). The Southern Coastal Pelagic community is most at risk to discarded catch because discarded catch is considered to have greatest community level impact on species composition by increasing relative abundance of large, rare top order predators i.e. sharks and TEP species. Intensity: minor – i.e. thought to occur rarely. Consequence: minor because only minor changes in relative abundance of constituents perceived to occur => Confidence

Level 1
89
Direct impact of Fishing Fishing Activity Pr
esen
ce (1
) A
bsen
ce (0
)
Spat
ial s
cale
of H
azar
d (1
-6)
Tem
pora
l sca
le o
f H
azar
d (1
-6)
Sub-component Unit of analysis Ope
ratio
nal o
bjec
tive
(f
rom
S2.
1)
Inte
nsity
Sco
re
(1-6
)
Con
sequ
ence
Sco
re
(1-6
)
Con
fiden
ce sc
ore
(1-2
)
Rationale in consequence score: low because of a lack of insufficient knowledge on trophic dynamics.
Stock enhancement 0 Provisioning 0 Organic waste disposal
1 4 6 Species composition
Southern coastal pelagic
1 1 1 1 Organic waste disposal is most likely to occur of eastern Tasmania, daily during the fishing season. Boats subject to MARPOL. The pelagic community is where organic waste was considered to have greatest community level impact. This impact would be on species composition by increasing relative abundance of scavenging species e.g. large, rare top order predators or seabirds. Impact: negligible – i.e. thought to occur rarely => Consequence: negligible as only negligible changes in relative abundance of constituents perceived to occur => Confidence in consequence score: low because of a lack of insufficient knowledge on trophic dynamics.
Addition of non-biological material
Debris 1 4 6 Species composition
Southern coastal pelagic
1 2 2 1 Fishing activity occurs mainly off eastern Tasmania. 2Debris generated daily during fishing season => The Southern Coastal Pelagic community considered most likely to accumulate debris (e.g. floating plastics), debris was considered to have greatest community level impact on species composition by decreasing relative abundance of susceptible species e.g. seabirds, dolphins or seals => Intensity: minor – i.e. thought to occur rarely, if MARPOL rules followed. Consequence: minor because considered only a minor change to relative abundance of seabird species – unlikely to change outside natural variation => Confidence in the consequence score: low because the volume of debris generated and species susceptibility are unknown.

Level 1
90
Direct impact of Fishing Fishing Activity Pr
esen
ce (1
) A
bsen
ce (0
)
Spat
ial s
cale
of H
azar
d (1
-6)
Tem
pora
l sca
le o
f H
azar
d (1
-6)
Sub-component Unit of analysis Ope
ratio
nal o
bjec
tive
(f
rom
S2.
1)
Inte
nsity
Sco
re
(1-6
)
Con
sequ
ence
Sco
re
(1-6
)
Con
fiden
ce sc
ore
(1-2
)
Rationale Chemical pollution 1 4 3 Distribution of the
community Southern coastal pelagic
3 2 2 1 Highest potential for pollution off eastern Tasmania. Possible chemical spill. The Southern Coastal Pelagic community would be most at risk from chemical pollution from fishing vessels, the most obvious effect would be to force species to move either offshore or along shore to avoid contaminants. Intensity: minor because the activity (chemical spill) is thought to occur rarely. Consequence: minor - possible detectable change in community distribution but minimal impact on communities, time to return to prior distribution on the scale of days to weeks (note that chemical pollution likely to have measurable consequences if large-scale event occurs in a sensitive area, the scale of an event will be limited by the amount of chemicals carried by the fishing vessels). Confidence: low with out data on the volume of pollution.
Exhaust 1 4 6 Distribution of the community
Southern coastal pelagic
3 1 1 2 Most exhaust fumes released off eastern Tasmania. Exhaust occurs daily and may impact the distribution of the Southern coastal pelagic community. Intensity: negligible. Consequence: negligible because considered low impact on communities. Confidence: high because effect of exhaust was considered to be very local, and disperse rapidly and therefore unlikely to impact community.
Gear loss 1 4 5 Functional group composition
Tasmanian outer shelf
2 1 1 1 Gear loss most likely to occur off eastern Tasmania. It is unlikely that even minor gear loss occurs on a daily basis. The Tasmanian outer shelf community was considered most likely to interact with lost gear, gear loss was considered to have greatest community level impact by creating new benthic habitat or potential risk of entanglement. Intensity: negligible – i.e. the likelihood of impact was considered remote. Consequence: negligible. Confidence in the consequence score: low because of a lack of verified data on rates and types of gear loss and insufficient knowledge of trophic interactions.

Level 1
91
Direct impact of Fishing Fishing Activity Pr
esen
ce (1
) A
bsen
ce (0
)
Spat
ial s
cale
of H
azar
d (1
-6)
Tem
pora
l sca
le o
f H
azar
d (1
-6)
Sub-component Unit of analysis Ope
ratio
nal o
bjec
tive
(f
rom
S2.
1)
Inte
nsity
Sco
re
(1-6
)
Con
sequ
ence
Sco
re
(1-6
)
Con
fiden
ce sc
ore
(1-2
)
Rationale Navigation/ steaming 1 4 6 Species
composition Southern coastal pelagic
1 1 1 2 Most Navigation and steaming in the purse-seine sub-fishery occur off eastern Tasmania, daily during the fishing season. The species composition of the Southern Coastal Pelagic community is likely to be affected by changes in turbulence and water movement due to navigation/ steaming, some species will not be able to survive in these environments. Intensity: negligible - Navigation/steaming is a large component of small pelagic species purse seine operations, however there is remote likelihood of impact on small pelagic species over the spatial scale of the fishery. Consequence: negligible since unlikely to be detectable - any consequence on small pelagics unlikely to be detectable, time taken to recover on scale of days – weeks. Confidence: high as direct impacts are unlikely to be detectable (i.e. logical constraints).
Activity/ presence on water
1 4 6 Distribution of community
Southern coastal pelagic
3.1 1 1 2 Activity/presence on water concentrates along on the edge of the continental shelf and covers an area of over 4700 km 2. Activity/presence on water of mid water trawling vessels was expected to impact the Distribution of the Southern Coastal pelagic community. Intensity: negligible – i.e. remote likelihood of impact at any spatial or temporal scale. Consequence: negligible. Confidence in consequence score: high because it was considered highly unlikely that vessel presence/activity would lead to community level changes in its own right (logical constraints).
Bait collection 0 Disturb physical processes
Fishing 1 4 6 Distribution of community
Southern coastal pelagic
3 1 1 2 Most fishing occurs along the east coast of Tasmania, daily during the fishing season. Disturbance of physical processes via midwater trawling was expected to impact the Distribution of the Southern Coastal Pelagic community. Intensity: negligible. Consequence: negligible with any consequence of water column disturbance unlikely to be detectable for pelagic communities. Confidence in the consequence score: high because localized disruption of water column unlikely to impact and have consequences for the distribution of highly mobile pelagic communities.

Level 1
92
Direct impact of Fishing Fishing Activity Pr
esen
ce (1
) A
bsen
ce (0
)
Spat
ial s
cale
of H
azar
d (1
-6)
Tem
pora
l sca
le o
f H
azar
d (1
-6)
Sub-component Unit of analysis Ope
ratio
nal o
bjec
tive
(f
rom
S2.
1)
Inte
nsity
Sco
re
(1-6
)
Con
sequ
ence
Sco
re
(1-6
)
Con
fiden
ce sc
ore
(1-2
)
Rationale Boat launching 0 Anchoring/ mooring 0 Navigation/steaming 1 4 6 Species
composition Southern coastal pelagic
1 1 1 2 Navigation /steaming concentrates along the east coast of Tasmania, daily during the fishing season. The species composition of the Southern Coastal Pelagic community is likely to be affected by changes in turbulence and water movement due to navigation/steaming. Some species will not be able to survive in these environments. Intensity: negligible - navigation/steaming is a large component of the small pelagic species mid water trawling operations, however there is remote likelihood of impact on small pelagic species over the spatial scale of the fishery. Consequence: negligible as unlikely to be detectable - any consequence unlikely to be detectable. Confidence: high because direct impacts are unlikely to be detectable (i.e. logical constraints).
Other fisheries e.g. South East Fishery – otter trawl; GHAT – auto-longline
1 6 6 Functional group composition
Southern coastal pelagic
2 3 3 1 Other fisheries capture the target and byproduct species across the full area of the fishery, beyond the range of current effort in the SPF. Other fisheries most likely to effect functional group composition. Intensity: moderate – i.e. the impact was considered to be potentially severe at local scales but moderate at broader spatial scale. Consequence: moderate, i.e. it was considered that fishing would have measurable changes to the ecosystem without a major change in function. Confidence: low because of insufficient knowledge of trophic dynamics.
Aquaculture 0
External Impacts (specify the particular example within each activity area)
Coastal development 1 6 5 Species composition
Southern coastal pelagic
1 3 2 1 Coastal development occurs across the range of the fishery, beyond the boundaries of current effort but not in all areas (e.g. central Bass Strait) => Frequent, local impacts at small spatial scales should have most obvious impact on the species composition of the areas affected, the impacts should be local and their consequences only minor to the entire Southern Coastal Pelagic community. Intensity: moderate - moderate at broader spatial scale, or severe but local. Consequence: minor - impacted species do not play a keystone role – only

Level 1
93
Direct impact of Fishing Fishing Activity Pr
esen
ce (1
) A
bsen
ce (0
)
Spat
ial s
cale
of H
azar
d (1
-6)
Tem
pora
l sca
le o
f H
azar
d (1
-6)
Sub-component Unit of analysis Ope
ratio
nal o
bjec
tive
(f
rom
S2.
1)
Inte
nsity
Sco
re
(1-6
)
Con
sequ
ence
Sco
re
(1-6
)
Con
fiden
ce sc
ore
(1-2
)
Rationale minor changes in relative abundance of other constituents. Confidence: low because of a lack of data.
Other extractive activities
1 5 6 Distribution of community
Eastern coastal pelagic
3 2 2 1 Oil and gas industry occur in the broad area (e.g. Bass Strait). There may be pollution from the petrochemical industry in both shallow and deep water and associated stimuli. Intensity: minor as direct and indirect impact(s) on community likely to be low, but linkages need to be better understood. Consequence: Cumulative impacts may exist, but considered minor. Confidence: low, due to limited information available.
Other non extractive activities
1 6 6 Bio- and geo-chemical cycles
Southern coastal pelagic
5 2 1 1 Shipping may occur in the area of fishing effort (predominantly AFMA management Zone A) and may occur daily. Most shipping considered to occur in the Southern Coastal Pelagic community and impact bio- and geo-chemical cycles of pelagic waters by disturbing mixed depth layer. Intensity: minor because natural levels of mixing and re-mixing considered high in Southern Coastal Pelagic and community level impact considered rarely detectable. Consequence: negligible - Interactions which affect bio- & geochemical cycling unlikely to be detectable against natural variation. Confidence in consequence score: low because of a lack of information on shipping-animal interactions plus insufficient knowledge on effects of ships on bio- and geo-chemical cycling.
Other anthropogenic activities
1 4 5 Distribution of community
Eastern coastal pelagic
3 2 2 1 Community may be disturbed by tourism (e.g. whale watching) due to charter boats. Intensity: Assumed to have minor direct and indirect impacts on community. Consequence: Until there is better information, difficult to score therefore low confidence.

Level 1
94
2.3.11 Summary of SICA results
The report provides a summary table (Level 1 (SICA) Document L1.6) of consequence scores for all activity/component combinations and a table showing those that scored 3 or above for consequence, and differentiating those that did so with high confidence (in bold). Level 1 (SICA) Document L1.6. Summary table of consequence scores for all activity/component combinations.
Direct impact of
fishing Fishing Activity Target Bycatch Byproduct TEP Habitat Communities Bait collection 0 0 0 0 0
Fishing 3 3 3 1 3
Capture
Incidental behaviour 0 0 0 0 0
Bait collection 0 0 0 0 0
Fishing 2 2 2 2 1
Incidental behaviour 0 0 0 0 0
Gear loss 1 1 2 1 1
Anchoring/ mooring 0 0 0 0 0
Direct impact without capture
Navigation/ steaming 1 1 2 1 1 Translocation of species 0 0 0 0 0
On board processing 0 0 0 0 0
Discarding catch 2 2 2 2 2
Stock enhancement 0 0 0 0 0
Provisioning 0 0 0 0 0
Addition/ movement of biological material
Organic waste disposal 1 1 2 1 1
Debris 1 1 2 2 2
Chemical pollution 2 1 2 2 2
Exhaust 1 1 2 1 1
Gear loss 2 1 2 1 1
Navigation/ steaming 1 1 2 1 0
Addition of non-biological material
Activity/ presence on water 1 1 1 1 1
Bait collection 0 0 0 0 0
Fishing 1 1 1 2 1
Boat launching 0 0 0 0 0
Anchoring/ mooring 0 0 0 0 0
Disturb physical processes
Navigation/steaming 1 1 1 1 1
Other fisheries 3 3 4 4 3 Aquaculture 0 0 0 0 0
Coastal development 2 0 1 3 2 Other extractive activities 2 2 2 2 2
Other non-extractive activities 1 1 1 1 1
External Impacts (specify the particular example within each activity area)
Other anthropogenic activities 1 1 2 2 2

Level 1
95
Target species: Frequency of consequence score differentiated between high and low confidence.
SPF - MWT Target Component
0
2
4
6
8
10
12
14
16
0 1 2 3 4 5 6Consequence score
Freq
uenc
y
High conf idence (external)Low conf idence (external)Low conf idence (f ishery)High conf idence (f ishery)
Byproduct and bycatch species: Frequency of consequence score differentiated between high and low confidence
SPF - MWT Bycatch/Byproduct Component
0
2
4
6
8
10
12
14
16
0 1 2 3 4 5 6
Consequence score
Freq
uenc
y
High confidence (external)Low confidence (external)Low confidence (f ishery)High confidence (f ishery)

Level 1
96
TEP species: Frequency of consequence score differentiated between high and low confidence (SICA excel workbook)
SPF - MWT TEP Species Component
0
2
4
6
8
10
12
14
16
0 1 2 3 4 5 6
Consequence score
Freq
uenc
y
High confidence (external)Low confidence (external)Low confidence (f ishery)High confidence (f ishery)
Habitats: Frequency of consequence score differentiated between high and low confidence
SPF MWT Habitat Component
0
2
4
6
8
10
12
14
16
0 1 2 3 4 5 6
Consequence score
Freq
uenc
y
High confidence (external)Low confidence (external)Low confidence (f ishery)High confidence (f ishery)

Level 1
97
Communities: Frequency of consequence score differentiated between high and low confidence (SICA excel workbook)
SPF MWT Community Component
0
2
4
6
8
10
12
14
16
0 1 2 3 4 5 6
Consequence score
Freq
uenc
y
High confidence (external)Low confidence (external)Low confidence (f ishery)High confidence (f ishery)
2.3.12 Evaluation/discussion of Level 1
This section provides a brief discussion of the results of the Level 1 analysis. Full details and rationale for the scores are provided in the SICA tables earlier in this section. There were 19 of the 32 possible activity scenarios identified as leading to some form of impact in the SPF midwater trawl sub-fishery (i.e., activities occurred in the sub-fishery). Of the 19 ‘impact causing activities’ across five components (95 scenarios), only four scenarios (plus five out of 30 external to the fishery) were identified as having an impact of moderate or above (see Level 1 (SICA) Document L1.6). These four internal scenarios occurred across four components (one each); target species, bycatch and byproduct species, TEP species and communities. The only impact-causing activity involved was
• Fishing (direct impacts) The significant external hazards to the components relevant to the SPF midwater trawl sub-fishery were external fishing (all five components) and coastal development (habitats) This analysis did not yield any surprises; the low level of fishing currently occurring means that the impact of just about all activities was minor. The apparently large capture volume of the target species, together with some identified issues about direct capture and mortality of TEP species, as well as indirect impacts caused by the removal of the an important prey species for the ecological community. Potential capture of a

Level 1
98
heavily fished (in other fisheries) byproduct species (Blue eye trevalla) is a concern that should be considered in more detail. Evaluation of these components at Level 2 allows the risks to be considered in more detail, and they may subsequently be eliminated with greater analysis effort. 2.3.13 Components to be examined at Level 2
As a result of the preliminary SICA analysis, the components that are to be examined at Level 2 are those with any consequence scores of 3 or above. These components are:
• Target species • Bycatch and byproduct species • TEP species • Communities
The SICA has removed some components from further analysis, as these are judged to be impacted with low consequence by the set of activities considered. Those components excluded are
• Habitats

Level 2
2.4 Level 2 Productivity and Susceptibility Analysis (PSA) When the risk of an activity at Level 1 (SICA) on a component is moderate or higher and no planned management interventions that would remove this risk are identified, an assessment is required at Level 2. The PSA approach is a method of assessment which allows all units within any of the ecological components to be effectively and comprehensively screened for risk. The units of analysis are the complete set of species habitats or communities identified at the scoping stage. The PSA results in sections 2.4.2 and 2.4.3 of this report measure risk from direct impacts of fishing only. In all assessments to date, this has been the hazard with the greatest risks identified at Level 1. Future iterations of the methodology will include PSAs modified to measure the risk due to other activities, such as gear loss. The PSA approach is based on the assumption that the risk to an ecological component will depend on two characteristics of the component units: (1) the extent of the impact due to the fishing activity, which will be determined by the susceptibility of the unit to the fishing activities (Susceptibility) and (2) the productivity of the unit (Productivity), which will determine the rate at which the unit can recover after potential depletion or damage by the fishing. It is important to note that the PSA analysis essentially measures potential for risk, hereafter noted as ‘risk’. A measure of absolute risk requires some direct measure of abundance or mortality rate for the unit in question, and this information is generally lacking at Level 2. The PSA approach examines attributes of each unit that contribute to or reflect its productivity or susceptibility to provide a relative measure of risk to the unit. The following section describes how this approach is applied to the different components in the analysis. Full details of the methods are described in Hobday et al. (2007). Species The following Table outlines the seven attributes that are averaged to measure productivity, and the four aspects that are multiplied to measure susceptibility for all the species components.
Attribute Average age at maturity Average size at maturity Average maximum age Average maximum size Fecundity Reproductive strategy
Productivity
Trophic level Availability considers overlap of fishing effort with a species distribution Encounterability considers the likelihood that a species will encounter fishing gear that is deployed within the geographic range of that species (based on two attributes: adult habitat and bathymetry) Selectivity considers the potential of the gear to capture or retain species
Susceptibility
Post capture mortality considers the condition and subsequent survival of a species that is captured and released (or discarded)

Level 2
100
The productivity attributes for each species are based on data from the literature or from data sources such as FishBase. The four aspects of susceptibility are calculated in the following way: Availability considers overlap of effort with species distribution. For species without distribution maps, availability is scored based on broad geographic distribution (global, southern hemisphere, Australian endemic). Where more detailed distribution maps are available (e.g. from BIOREG data or DEH protected species maps), availability is scored as the overlap between fishing effort and the portion of the species range that lies within the broader geographical spread of the fishery. Overrides can occur where direct data from independent observer programs are available. Encounterability is the likelihood that a species will encounter fishing gear deployed within its range. Encounterability is scored using habitat information from FishBase, modified by bathymetric information. Higher risk corresponds to the gear being deployed at the core depth range of the species. Overrides are based on mitigation measures and fishery independent observer data. For species that do encounter gear, selectivity is a measure of the likelihood that the species will be caught by the gear. Factors affecting selectivity will be gear and species dependent, but body size in relation to gear size is an important attribute for this aspect. Overrides can be based on body shape, swimming speed and independent observer data. For species that are caught by the gear, post capture mortality measures the survival probability of the species. Obviously, for species that are retained, survival will be zero. Species that are discarded may or may not survive. This aspect is mainly scored using independent filed observations or expert knowledge. Overall susceptibility scores for species are a product of the four aspects outlined above. This means that susceptibility scores will be substantially reduced if any one of the four aspects is considered to be low risk. However the default assumption in the absence of verifiable supporting data is that all aspects are high risk. Habitats Similar to species, PSA methods for habitats are based around a set of attributes that measure productivity and susceptibility. Productivity attributes include speed of regeneration of fauna, and likelihood of natural disturbance. The susceptibility attributes for habitats are described in the following Table.

Level 2
Aspect Attribute Concept Rationale
Susceptibility
Availability General depth range (Biome)
Spatial overlap of subfishery with habitat defined at biomic scale
Habitat occurs within the management area
Encounterability Depth zone and
feature type
Habitat encountered at the depth and location at which fishing activity occurs
Fishing takes place where habitat occurs
Ruggedness (fractal dimension of substratum and seabed slope)
Relief, rugosity, hardness and seabed slope influence accessibility to different sub-fisheries
Rugged substratum is less accessible to mobile gears. Steeply sloping seabed is less accessible to mobile gears
Level of disturbance Gear footprint and intensity
of encounters
Degree of impact is determined by the frequency and intensity of encounters (inc. size, weight and mobility of individual gears)
Selectivity Removability/
mortality of fauna/ flora
Removal/ mortality of structure forming epifauna/ flora (inc. bioturbating infauna)
Erect, large, rugose, inflexible, delicate epifauna and flora, and large or delicate and shallow burrowing infauna (at depths impacted by mobile gears) are preferentially removed or damaged.
Areal extent How much of each habitat is present
Effective degree of impact greater in rarer habitats: rarer habitats may maintain rarer species.
Removability of substratum
Certain size classes can be removed
Intermediate sized clasts (~6 cm to 3 m) that form attachment sites for sessile fauna can be permanently removed
Substratum hardness Composition of substrata Harder substratum is intrinsically more resistant
Seabed slope Mobility of substrata once dislodged; generally higher levels of structural fauna
Gravity or latent energy transfer assists movement of habitat structures, e.g. turbidity flows, larger clasts. Greater density of filter feeding animals found where currents move up and down slopes.
Productivity
Productivity Regeneration of
fauna Accumulation/ recovery of fauna
Fauna have different intrinsic growth and reproductive rates which are also variable in different conditions of temperature, nutrients, productivity.
Natural disturbance
Level of natural disturbance affects intrinsic ability to recover
Frequently disturbed communities adapted to recover from disturbance
Communities PSA methods for communities are still under development. Consequently, it has not yet been possible to undertake level 2 risk analyses for communities. During the Level 2 assessment, each unit of analysis within each ecological component (species or habitat) is scored for risk based on attributes for productivity and susceptibility, and the results are plotted as shown in Figure 13.

Level 2
102
Figure 13. The axes on which risk to the ecological units is plotted. The x-axis includes attributes that influence the productivity of a unit, or its ability to recover after impact from fishing. The y-axis includes attributes that influence the susceptibility of the unit to impacts from fishing. The combination of susceptibility and productivity determines the relative risk to a unit, i.e. units with high susceptibility and low productivity are at highest risk, while units with low susceptibility and high productivity are at lowest risk. The contour lines divide regions of equal risk and group units of similar risk levels. There are seven steps for the PSA undertaken for each component brought forward from Level 1 analysis.
Step 1 Identify the units excluded from analysis and document the reason for exclusion
Step 2 Score units for productivity Step 3 Score units for susceptibility Step 4 Plot individual units of analysis onto a PSA Plot Step 5 Ranking of overall risk to each unit Step 6 Evaluation of the PSA analysis Step 7 Decision rules to move from Level 2 to Level 3

Level 2
103
2.4.1 Units excluded from analysis and document the reason for exclusion (Step 1)
Species lists for PSA analysis are derived from recent observer data where possible or, for fisheries with no observer programs, from logbook and scientific data. In some logbook data, there may only be family level identifications. Where possible these are resolved to species level by cross-checking with alternative data sources and discussion with experts. In cases where this is not possible (mainly invertebrates) the analysis may be based on family average data. No species were eliminated from the Level 2 analyses; however, two taxa that are identified in the logbooks at a high taxonomic level were removed as the species within these taxa are already present in the assessment.
ERA_SPECIES_ID ERA_SUB_FISHERY_ID TAXA_NAME SCIENTIFIC_NAME CAAB_CODE FAMILY_NAME COMMON_NAME Explanation for why taxa excluded
2136 38 Teleost Emmelichthys spp 37345901 Emmelichthyidae redbait Duplicate of redbait
1998 38 Invertebrate Order Teuthoidea - undifferentiated 23615000 Order Teuthoidea squid Duplicate of arrow squid
Invertebrate Scyllaridae - undifferentiated Scyllaridae Slipper lobster Erroneus data
2.4.2 and 2.4.3 Level 2 PSA (steps 2 and 3)
Summary of Species PSA results
The results in the Tables below provide details of the PSA assessments for each species, separated by role in the fishery, and by taxa where appropriate. These assessments are limited to direct impacts from fishing, and the operational objective is to avoid over-exploitation due to fishing, either as over-fishing or becoming over-fished. The risk scores and categories (high, medium or low) reflect potential rather than actual risk using the Level 2 (PSA) method. For species assessed at Level 2, no account is taken of the level of catch, the size of the population, or the likely exploitation rate. To assess actual risk for any species requires a Level 3 assessment which does account for these

Level 2
104
factors. However, recent fishing effort distributions are considered when calculating the availability attribute for the Level 2 analysis, whereas the entire jurisdictional range of the fishery is considered at Level 1. The PSA analyses do not fully take account of management actions already in place in the fishery that may mitigate for high risk species. Some management actions or strategies, however, can be accounted for in the analysis where they exist. These include spatial management that limits the range of the fishery (affecting availability), gear limits that affect the size of animals that are captured (selectivity), and handling practices that may affect the survival of species after capture (post capture mortality). Management strategies that are not reflected in the PSA scores include limits to fishing effort, use of catch limits (such as TACs), and some other controls such as seasonal closures. It should be noted that the PSA method is likely to generate more false positives for high risk (species assessed to be high risk when they are actually low risk) than false negatives (species assessed to be low risk when they are actually high risk). This is due to the precautionary approach to uncertainty adopted in the PSA method, whereby attributes are set at high risk levels in the absence of information. It also arises from the nature of the PSA method assessing potential rather than actual risk, as discussed above. Thus some species will be assessed at high risk because they have low productivity and are exposed to the fishery, even though they are rarely if ever caught and are relatively abundant. In the PSA Tables below, the “Comments” column is used to provide information on one or more of the following aspects of the analysis for each species: use of overrides to alter susceptibility scores (for example based on use of observer data, or taking account of specific management measures or mitigation); data or information sources or limitations; and information that supports the overall scores. The use of over-rides is explained more fully in Hobday et al (2007). The PSA Tables also report on “missing information” (the number of attributes with missing data that therefore score at the highest risk level by default). There are seven attributes used to score productivity and four aspects (availability, encounterability, selectivity and post capture mortality) used to score susceptibility (though encounterability is the average of two attributes). An attribute or aspect is scored as missing if there are no data available to score it, and it has defaulted to high risk for this reason. For some species, attributes may be scored on information from related species or other supplementary information, and even though this information is indirect and less reliable than if species specific information was available, this is not scored as a missing attribute. There are differences between analyses for TEP species and the other species components. In particular, target, by-product and by-catch species are included on the basis that they are known to be caught by the fishery (in some cases only very rarely). However TEP species are

Level 2
105
included in the analysis on the basis that they occur in the area of the fishery, whether or not there has ever been an interaction with the fishery recorded. For this reason there may be a higher proportion of false positives for high vulnerability for TEP species, unless there is a robust observer program that can verify that species do not interact with the gear. Observer data and observer expert knowledge are important sources of information in the PSA analyses, particularly for the bycatch and TEP components. Observer data has been collected by the agencies that co-manage the fishery. There are no stated objectives of the program and objectives have varied between trips. Objectives for a revised program are still under consideration under the developing Harvest Strategy Framework. Additional information is given in the scoping section. A summary of the species considered at Level 2 is presented below, sorted by component, by taxa within components, and then by the overall risk score [high (>3.18), medium (2.64-3.18), low<2.64)], together with categorisation of risk (refer to section 2.4.8). Target species Small Pelagic Fishery
ER
A species ID
Scientific name Common name Average logbook
catch (kg)
(2001-04)
Missing > 3 attributes (Y
/N)
Num
ber of missing
productivityattributes
(outof
Missing susceptibility
attributes (out of 5)
Productivity (additive) 1- low
risk, 3 - high risk
Susceptibility (m
ult) 1- low
risk, 3 - high risk
2D risk value (P
&S
) 1.41- low
risk, 4.24 - high risk
Susceptibility override used?
2D P
&S
risk category
High/M
ed risk category (R
efer 2.4.8)
Comments
Teleost 155 Emmelichthys nitidus redbait 0 N 1 0 1.57 1.67 2.29 N Low
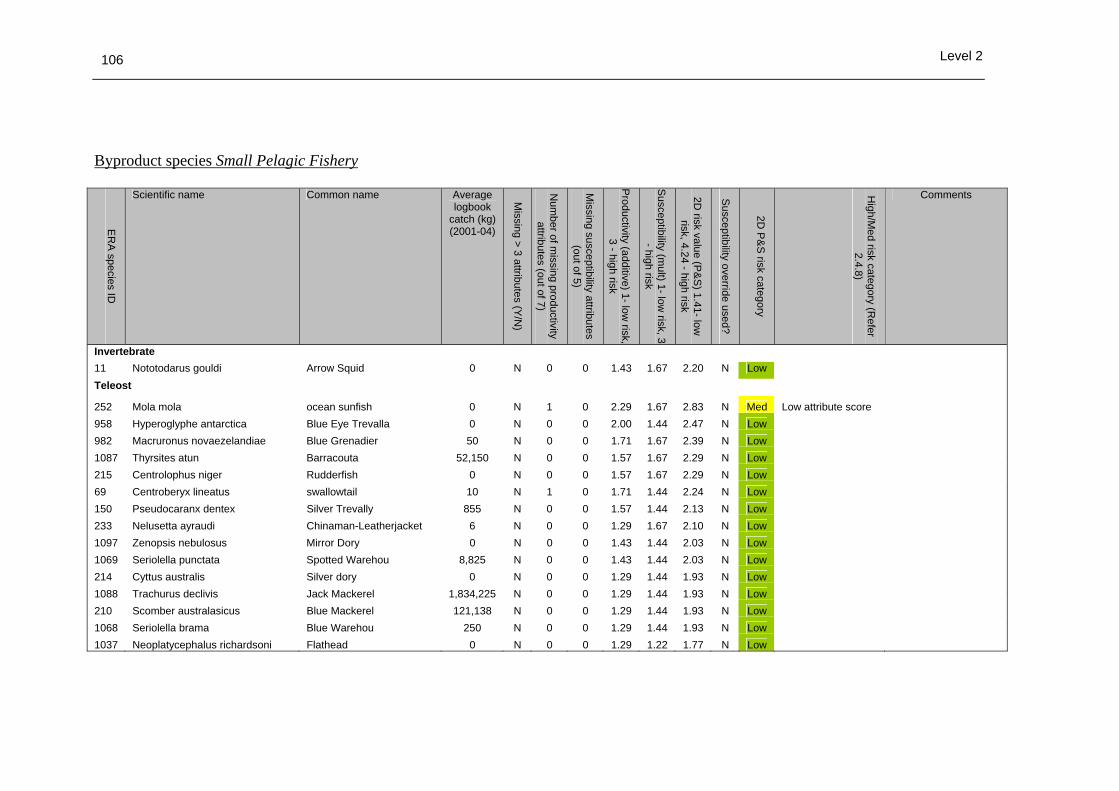
Level 2
106
Byproduct species Small Pelagic Fishery
ER
A species ID
Scientific name Common name Average logbook
catch (kg) (2001-04)
Missing > 3 attributes (Y
/N)
Num
ber of missing productivity
attributes (out of 7)
Missing susceptibility attributes
(out of 5)
Productivity (additive) 1- low
risk, 3 - high risk
Susceptibility (m
ult) 1- low risk, 3
- high risk
2D risk value (P
&S
) 1.41- low
risk, 4.24 - high risk
Susceptibility override used?
2D P
&S
risk category
High/M
ed risk category (Refer
2.4.8)
Comments
Invertebrate 11 Nototodarus gouldi Arrow Squid 0 N 0 0 1.43 1.67 2.20 N Low Teleost
252 Mola mola ocean sunfish 0 N 1 0 2.29 1.67 2.83 N Med Low attribute score 958 Hyperoglyphe antarctica Blue Eye Trevalla 0 N 0 0 2.00 1.44 2.47 N Low 982 Macruronus novaezelandiae Blue Grenadier 50 N 0 0 1.71 1.67 2.39 N Low 1087 Thyrsites atun Barracouta 52,150 N 0 0 1.57 1.67 2.29 N Low 215 Centrolophus niger Rudderfish 0 N 0 0 1.57 1.67 2.29 N Low 69 Centroberyx lineatus swallowtail 10 N 1 0 1.71 1.44 2.24 N Low 150 Pseudocaranx dentex Silver Trevally 855 N 0 0 1.57 1.44 2.13 N Low 233 Nelusetta ayraudi Chinaman-Leatherjacket 6 N 0 0 1.29 1.67 2.10 N Low 1097 Zenopsis nebulosus Mirror Dory 0 N 0 0 1.43 1.44 2.03 N Low 1069 Seriolella punctata Spotted Warehou 8,825 N 0 0 1.43 1.44 2.03 N Low 214 Cyttus australis Silver dory 0 N 0 0 1.29 1.44 1.93 N Low 1088 Trachurus declivis Jack Mackerel 1,834,225 N 0 0 1.29 1.44 1.93 N Low 210 Scomber australasicus Blue Mackerel 121,138 N 0 0 1.29 1.44 1.93 N Low 1068 Seriolella brama Blue Warehou 250 N 0 0 1.29 1.44 1.93 N Low 1037 Neoplatycephalus richardsoni Flathead 0 N 0 0 1.29 1.22 1.77 N Low
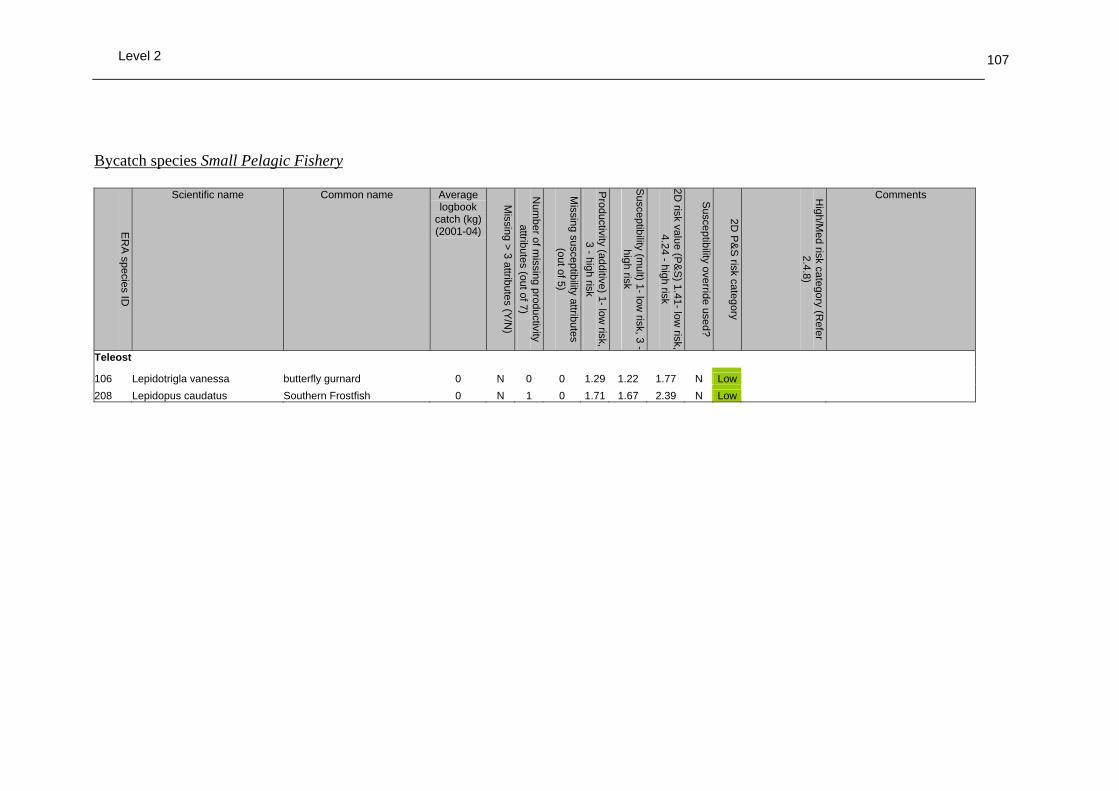
Level 2
107
Bycatch species Small Pelagic Fishery
ER
A species ID
Scientific name Common name Average logbook
catch (kg) (2001-04)
Missing > 3 attributes (Y
/N)
Num
ber of missing productivity
attributes (out of 7)
Missing susceptibility attributes
(out of 5)
Productivity (additive) 1- low
risk, 3 - high risk
Susceptibility (m
ult) 1- low risk, 3 -
high risk
2D risk value (P
&S
) 1.41- low risk,
4.24 - high risk
Susceptibility override used?
2D P
&S
risk category
High/M
ed risk category (Refer
2.4.8)
Comments
Teleost
106 Lepidotrigla vanessa butterfly gurnard 0 N 0 0 1.29 1.22 1.77 N Low 208 Lepidopus caudatus Southern Frostfish 0 N 1 0 1.71 1.67 2.39 N Low

Level 2
108
TEP species Small Pelagic Fishery
ER
A species ID
Scientific name Common name Average logbook
catch (kg) (2001-04)
Missing > 3 attributes (Y
/N)
Num
ber of missing productivity
attributes (out of 7)
Missing susceptibility attributes
(out of 5)
Productivity (additive) 1- low
risk, 3 - high risk
Susceptibility (m
ult) 1- low risk, 3 -
high risk
2D risk value (P
&S
) 1.41- low risk,
4.24 - high risk
Susceptibility override used?
2D P
&S
risk category
High/M
ed risk category (Refer
2.4.8)
Comments
Chondrichthyan 315 Carcharodon carcharias white shark 0 N 0 0 2.86 1.22 3.11 Y Med Low overlap Observer over-ride,
Encounterability reduced from, 3 to 1, Not captured in any mid-water fisheries (observer workshop August 2005)
1067 Rhincodon typus whale shark 0 N 0 0 2.71 1.44 3.07 N Med Widely distributed Observer over-ride,:Availability reduced from, 3 to 1. No detailed mapping analysis available for pelagic species. Mainly tropical, migratory, and unlikely to form a separate stock around Tasmania where effort was focussed from 01-04 (Expert comment from John Stevens, Logbook data, stock structure proxy table from Methodology document)

Level 2
109
313 Carcharias taurus grey nurse shark 0 N 0 0 2.71 1.22 2.98 Y Med Widely distributed Observer over-ride, Encounterability reduced from, 3 to 1, Not captured in any mid-water fisheries (observer workshop August 2005)
Marine bird 1033 Thalassarche cauta Shy Albatross 0 N 1 0 2.43 2.33 3.37 Y High Spatial
uncertainty Observer over-ride: Encounterability reduced from 3 to 2. Birds are not caugh in the nets but albatross with large wing-span can strike trawl warps which has resulted in bird mortality in other Australian trawl fisheries (Observer workshop August 2005).
1085 Thalassarche melanophrys Black-browed Albatross 0 N 1 0 2.43 2.33 3.37 Y High Spatial uncertainty
see shy albatross
889 Thalassarche eremita Chatham albatross 0 Y 3 1 2.86 1.44 3.20 Y High Missing data see shy albatross 1673 Thalassarche nov. sp. Pacific Albatross 0 N 1 1 2.71 1.22 2.98 Y Med Low attribute
score see shy albatross
753 Diomedea epomophora Southern Royal Albatross 0 N 1 0 2.57 1.44 2.95 Y Med Low attribute score
see Pacific albatross
451 Diomedea exulans Wandering Albatross 0 N 1 0 2.57 1.44 2.95 Y Med Low attribute score
see Pacific albatross
755 Diomedea gibsoni Gibson's Albatross 0 N 1 0 2.57 1.44 2.95 Y Med Low attribute score
see Pacific albatross
628 Diomedea antipodensis Antipodean Albatross 0 N 1 0 2.57 1.44 2.95 Y Med Low attribute score
see Pacific albatross
799 Diomedea sanfordi Northern Royal Albatross 0 N 1 0 2.57 1.44 2.95 Y Med Low attribute score
see Pacific albatross
1084 Thalassarche impavida Campbell Albatross 0 N 1 0 2.57 1.44 2.95 Y Med Low attribute score
see Pacific albatross
1031 Thalassarche carteri Indian Yellow-nosed Albatross
0 N 1 0 2.57 1.44 2.95 Y Med Low attribute score
see Pacific albatross
894 Thalassarche salvini Salvin's albatross 0 N 3 0 2.57 1.44 2.95 Y Med Low attribute score
see Pacific albatross
1428 Diomedea amsterdamensis Amsterdam Albatross 0 N 1 0 2.57 1.44 2.95 Y Med Low attribute score
see Pacific albatross
1429 Diomedea dabbenena Tristan Albatross 0 N 1 0 2.57 1.44 2.95 Y Med Low attribute score
see Pacific albatross

Level 2
110
1580 Calonectris leucomelas streaked shearwater 0 N 3 0 2.57 1.44 2.95 Y Med Low attribute score
Observer over-ride, Availability reduced from, 3 to 1, rare or not present on grounds, Encounterability reduced from, 3 to1, not captured in this fishery (AFMA observer data)
1003 Pachyptila turtur Fairy Prion 0 N 3 0 2.43 1.67 2.95 Y Med Low attribute score
see streaked shearwater
1060 Puffinus tenuirostris Short-tailed Shearwater 0 N 1 0 2.43 1.67 2.95 Y Med Low attribute score
Observer over-ride: Encounterability reduced from, 3 to 1, not captured in this fishery (AFMA observer data)
1045 Pterodroma cervicalis White-necked Petrel 0 N 3 0 2.57 1.22 2.85 Y Med Low attribute score
see streaked shearwater
1051 Pterodroma solandri Providence Petrel 0 N 3 0 2.57 1.22 2.85 Y Med Low attribute score
see streaked shearwater
1054 Puffinus bulleri Buller's Shearwater 0 N 3 0 2.57 1.22 2.85 Y Med Low attribute score
see streaked shearwater
912 Phalacrocorax fuscescens Black faced cormorant 0 N 1 0 2.57 1.22 2.85 Y Med Low attribute score
see streaked shearwater
1086 Thalassarche steadi White-capped Albatross 0 N 2 0 2.57 1.22 2.85 Y Med Low attribute score
see streaked shearwater
1041 Procellaria aequinoctialis White-chinned Petrel 0 N 1 0 2.29 1.67 2.83 Y Med Low attribute score
See short-tailed shearwater
1032 Thalassarche bulleri Buller's Albatross 0 N 1 0 2.43 1.44 2.83 Y Med Low attribute score
see pacific albatross
1035 Thalassarche chrysostoma Grey-headed Albatross 0 N 1 0 2.43 1.44 2.83 Y Med Low attribute score
see pacific albatross
1009 Phoebetria palpebrata Light-mantled Albatross 0 N 1 0 2.43 1.44 2.83 Y Med Low attribute score
see Pacific albatross
314 Fulmarus glacialoides Southern fulmar 0 N 1 0 2.43 1.44 2.83 Y Med Low attribute score
see streaked shearwater
939 Halobaena caerulea Blue Petrel 0 N 3 0 2.43 1.44 2.83 Y Med Low attribute score
see streaked shearwater
1052 Lugensa brevirostris Kerguelen Petrel 0 N 3 0 2.43 1.44 2.83 Y Med Low attribute score
see streaked shearwater
1042 Procellaria parkinsoni Black Petrel; Parkinsons Petrel
0 N 2 0 2.43 1.22 2.72 Y Med Low attribute score
see streaked shearwater
1043 Procellaria westlandica Westland Petrel 0 N 2 0 2.43 1.22 2.72 Y Med Low attribute score
see streaked shearwater
1046 Pterodroma leucoptera Gould's Petrel 0 Y 4 0 2.43 1.22 2.72 Y Med Missing data see streaked shearwater

Level 2
111
1047 Pterodroma macroptera Great-winged Petrel 0 N 2 0 2.43 1.22 2.72 Y Med Low attribute score
see streaked shearwater
1048 Pterodroma mollis Soft-plumaged Petrel 0 N 3 0 2.43 1.22 2.72 Y Med Low attribute score
see streaked shearwater
1050 Pterodroma nigripennis Black-winged Petrel 0 N 3 0 2.43 1.22 2.72 Y Med Low attribute score
see streaked shearwater
1053 Puffinus assimilis Little Shearwater (Tasman Sea)
0 N 3 0 2.43 1.22 2.72 Y Med Low attribute score
see streaked shearwater
1055 Puffinus carneipes Flesh-footed Shearwater 0 N 1 0 2.43 1.22 2.72 Y Med Low attribute score
see streaked shearwater
1059 Puffinus pacificus Wedge-tailed Shearwater 0 N 1 0 2.43 1.22 2.72 Y Med Low attribute score
see streaked shearwater
918 Fregetta grallaria White-bellied Storm-Petrel (Tasman Sea),
0 N 3 0 2.43 1.22 2.72 Y Med Low attribute score
see streaked shearwater
917 Fregetta tropica Black-bellied Storm-Petrel 0 N 3 0 2.43 1.22 2.72 Y Med Low attribute score
see streaked shearwater
555 Garrodia nereis Grey-backed storm petrel 0 N 3 0 2.43 1.22 2.72 Y Med Low attribute score
see streaked shearwater
325 Catharacta skua Great Skua 0 N 1 0 2.43 1.22 2.72 Y Med Low attribute score
see streaked shearwater
1034 Thalassarche chlororhynchos
Yellow-nosed Albatross, Atlantic Yellow-
0 N 1 0 2.29 1.44 2.70 Y Med Low attribute score
see Pacific albatross
1008 Phoebetria fusca Sooty Albatross 0 N 1 0 2.29 1.44 2.70 Y Med Low attribute score
see Pacific albatross
595 Daption capense Cape Petrel 0 N 1 0 2.29 1.44 2.70 Y Med Low attribute score
see streaked shearwater
73 Macronectes giganteus Southern Giant-Petrel 0 N 1 0 2.29 1.22 2.59 Y Low see streaked shearwater 981 Macronectes halli Northern Giant-Petrel 0 N 1 0 2.29 1.22 2.59 Y Low see streaked shearwater 494 Procellaria cinerea Grey petrel 0 N 1 0 2.29 1.22 2.59 Y Low see streaked shearwater 1691 Pseudobulweria rostrata Tahiti Petrel 0 N 1 1 2.29 1.22 2.59 Y Low see streaked shearwater 504 Pterodroma lessoni White-headed petrel 0 N 1 0 2.29 1.22 2.59 Y Low see streaked shearwater 1049 Pterodroma neglecta Kermadec Petrel
(western) 0 N 2 0 2.29 1.22 2.59 Y Low see streaked shearwater
1057 Puffinus griseus Sooty Shearwater 0 N 1 0 2.29 1.22 2.59 Y Low see streaked shearwater 1432 Phaethon rubricauda Red-tailed Tropicbird 0 N 1 0 2.29 1.22 2.59 Y Low see streaked shearwater 1549 Morus capensis Cape gannet 0 N 1 0 2.29 1.22 2.59 Y Low see streaked shearwater 998 Morus serrator Australasian Gannet 0 N 1 0 2.29 1.22 2.59 Y Low see streaked shearwater 1433 Sula dactylatra Masked Booby 0 N 1 0 2.29 1.22 2.59 Y Low see streaked shearwater 203 Anous stolidus Common noddy 0 N 1 0 2.29 1.22 2.59 Y Low see streaked shearwater 975 Larus pacificus Pacific Gull 0 N 1 0 2.29 1.22 2.59 Y Low see streaked shearwater

Level 2
112
1017 Sterna bergii Crested Tern 0 N 1 0 2.29 1.22 2.59 Y Low see streaked shearwater 1018 Sterna caspia Caspian Tern 0 N 1 0 2.29 1.22 2.59 Y Low see streaked shearwater 898 Eudyptula minor Little Penguin 0 N 1 0 2.14 1.22 2.47 Y Low see streaked shearwater 1056 Puffinus gavia Fluttering Shearwater 0 N 2 0 2.14 1.22 2.47 Y Low see streaked shearwater 1058 Puffinus huttoni Hutton's Shearwater 0 N 2 0 2.14 1.22 2.47 Y Low see streaked shearwater 1438 Anous minutus Black Noddy 0 N 1 0 2.14 1.22 2.47 Y Low see streaked shearwater 67 Anous tenuirostris Lesser noddy 0 N 2 0 2.14 1.22 2.47 Y Low see streaked shearwater 973 Larus dominicanus Kelp Gull 0 N 1 0 2.14 1.22 2.47 Y Low see streaked shearwater 974 Larus novaehollandiae Silver Gull 0 N 3 0 2.14 1.22 2.47 Y Low see streaked shearwater 1582 Procelsterna cerulea grey ternlet 0 N 1 0 2.14 1.22 2.47 Y Low see streaked shearwater 1020 Sterna fuscata Sooty tern 0 N 1 0 2.14 1.22 2.47 Y Low see streaked shearwater 1021 Sterna hirundo Common tern 0 N 1 0 2.14 1.22 2.47 Y Low see streaked shearwater 1023 Sterna paradisaea Arctic tern 0 N 1 0 2.14 1.22 2.47 Y Low see streaked shearwater 1025 Sterna sumatrana Black-naped tern 0 N 2 0 2.14 1.22 2.47 Y Low see streaked shearwater 556 Oceanites oceanicus Wilson's storm petrel
(subantarctic) 0 N 1 0 2.00 1.22 2.34 Y Low see streaked shearwater
1004 Pelagodroma marina White-faced Storm-Petrel 0 N 1 0 2.00 1.22 2.34 Y Low see streaked shearwater 1014 Sterna albifrons Little tern 0 N 1 0 2.00 1.22 2.34 Y Low see streaked shearwater 1015 Sterna anaethetus Bridled Tern 0 N 1 0 2.00 1.22 2.34 Y Low see streaked shearwater 1024 Sterna striata White-fronted Tern 0 N 1 0 2.00 1.22 2.34 Y Low see streaked shearwater 1006 Pelecanoides urinatrix Common Diving-Petrel 0 N 1 0 1.86 1.22 2.22 Y Low see streaked shearwater Marine mammal 253 Arctocephalus pusillus
doriferus Australian Fur Seal 0 N 0 0 2.29 3.00 3.77 N High Spatial
uncertainty
902 Feresa attenuata Pygmy Killer Whale 0 N 0 0 2.86 1.67 3.31 N High Low attribute score
934 Globicephala
macrorhynchus Short-finned Pilot Whale 0 N 0 0 2.86 1.67 3.31 N High Low attribute
score
935 Globicephala melas Long-finned Pilot Whale 0 N 0 0 2.86 1.67 3.31 N High Low attribute score
937 Grampus griseus Risso's Dolphin 0 N 0 0 2.86 1.67 3.31 N High Low attribute
score
1044 Pseudorca crassidens False Killer Whale 0 N 1 0 2.86 1.67 3.31 N High Low attribute score
1091 Tursiops truncatus Bottlenose Dolphin 0 N 0 0 2.86 1.67 3.31 N High Low attribute
score
1494 Tursiops aduncus Indian Ocean bottlenose dolphin
0 N 1 0 2.86 1.67 3.31 N High Low attribute score

Level 2
113
985 Mesoplodon bowdoini Andrew's Beaked Whale 0 N 1 0 2.86 1.67 3.31 N High Low attribute score
986 Mesoplodon densirostris Blainville's Beaked Whale 0 N 0 0 2.86 1.67 3.31 N High Low attribute
score
987 Mesoplodon gingkodens Gingko Beaked Whale 0 N 1 0 2.86 1.67 3.31 N High Low attribute score
989 Mesoplodon hectori Hector's Beaked Whale 0 N 0 0 2.86 1.67 3.31 N High Low attribute
score
991 Mesoplodon mirus True's Beaked Whale 0 N 0 0 2.86 1.67 3.31 N High Low attribute score
959 Hyperoodon planifrons Southern Bottlenose
Whale 0 N 1 0 2.86 1.44 3.20 N High Low attribute
score
988 Mesoplodon grayi Gray's Beaked Whale 0 N 1 0 2.86 1.44 3.20 N High Low attribute score
990 Mesoplodon layardii Strap-toothed Beaked
Whale 0 N 1 0 2.86 1.44 3.20 N High Low attribute
score
1098 Ziphius cavirostris Cuvier's Beaked Whale 0 N 0 0 2.86 1.44 3.20 N High Low attribute score
970 Lagenodelphis hosei Fraser's Dolphin 0 N 1 0 2.71 1.67 3.19 N High Low attribute
score
832 Lagenorhynchus cruciger Hourglass dolphin 0 N 1 1 2.71 1.67 3.19 N High Low attribute score
61 Lissodelphis peronii Southern Right Whale
Dolphin 0 N 1 0 2.71 1.67 3.19 N High Low attribute
score
1081 Stenella coeruleoalba Striped Dolphin 0 N 0 0 2.71 1.67 3.19 N High Low attribute score
295 Hydrurga leptonyx Leopard seal 0 N 0 0 2.71 1.67 3.19 N High Low attribute
score
993 Mirounga leonina Elephant seal 0 N 0 0 2.71 1.67 3.19 N High Low attribute score
1002 Orcinus orca Killer Whale 0 N 0 0 2.86 1.22 3.11 Y Med Low attribute
score Observer over-ride, Encounterability reduced from, 3 to 1, does not feed on small pelagics (Observer workshop August 2005)
269 Berardius arnuxii Arnoux's Beaked Whale 0 N 0 0 2.86 1.22 3.11 N Med Low attribute score
1030 Tasmacetus shepherdi Tasman Beaked Whale 0 N 1 0 2.86 1.22 3.11 N Med Low attribute
score

Level 2
114
256 Balaenoptera acutorostrata Minke Whale 0 N 0 0 2.86 1.15 3.08 Y Med Low attribute score
Observer over-ride, Encounterability reduced from, 3 to 1, a plankton feeder not attracted to schooling redbait pelagics (Observer workshop August 2005)
1007 Peponocephala electra Melon-headed Whale 0 N 1 0 2.57 1.67 3.06 N Med Low attribute score
1080 Stenella attenuata Spotted Dolphin 0 N 1 0 2.57 1.67 3.06 N Med Low attribute
score
261 Balaenoptera borealis Sei Whale 0 N 0 0 2.86 1.07 3.05 Y Med Low attribute score
see minke whale
262 Balaenoptera edeni Bryde's Whale 0 N 0 0 2.86 1.07 3.05 Y Med Low attribute score
see minke whale
268 Balaenoptera physalus Fin Whale 0 N 0 0 2.86 1.07 3.05 Y Med Low attribute score
see minke whale
1439 Balaenoptera bonaerensis Antarctic Minke Whale 0 N 1 0 2.86 1.07 3.05 Y Med Low attribute score
see minke whale
968 Kogia breviceps Pygmy Sperm Whale 0 N 0 0 2.86 1.07 3.05 Y Med Low attribute score
Observer over-ride, Encounterability reduced from, 3 to 1, feeds deep, not atracted to schooling fish (Observer workshop August 2005)
1036 Physeter catodon Sperm Whale 0 N 0 0 2.86 1.07 3.05 Y Med Low attribute score
see pygmy sperm whale
984 Megaptera novaeangliae Humpback Whale 0 N 0 0 2.71 1.22 2.98 Y Med Low attribute score
see minke whale
1076 Sousa chinensis Indo-Pacific Humpback Dolphin
0 N 0 0 2.71 1.22 2.98 N Med Low attribute score
1083 Steno bredanensis Rough-toothed Dolphin 0 N 0 0 2.71 1.22 2.98 N Med Low attribute
score
969 Kogia simus Dwarf Sperm Whale 0 N 0 0 2.71 1.22 2.98 Y Med Low attribute score
see pygmy sperm whale
813 Dugong dugon Dugong 0 N 1 0 2.71 1.22 2.98 N Med Low attribute score
289 Caperea marginata Pygmy Right Whale 0 N 1 0 2.71 1.15 2.95 Y Med Low attribute
score see minke whale
1082 Stenella longirostris Long-snouted Spinner Dolphin
0 N 0 0 2.43 1.67 2.95 N Med Low attribute score
216 Arctocephalus forsteri New Zealand Fur-seal 0 N 0 0 2.43 1.67 2.95 N Med Low attribute
score

Level 2
115
1000 Neophoca cinerea Australian Sea-lion 0 N 0 0 2.43 1.67 2.95 N Med Low attribute score
896 Eubalaena australis Southern Right Whale 0 N 0 0 2.71 1.07 2.92 Y Med Low attribute
score see minke whale
612 Delphinus delphis Common Dolphin 0 N 0 0 2.29 1.67 2.83 N Med Low attribute score
263 Arctocephalus tropicalis Subantarctic fur seal 0 N 0 0 2.29 1.67 2.83 N Med Low attribute
score
265 Balaenoptera musculus Blue Whale 0 N 0 0 2.57 1.07 2.79 Y Med Low attribute score
see minke whale
971 Lagenorhynchus obscurus Dusky Dolphin 0 N 0 0 2.29 1.22 2.59 N Low Marine reptile 1530 Disteira kingii spectacled seasnake 0 Y 3 1 2.71 1.44 3.07 Y Med Missing data Expert over-rided:
Encounterability reduced from 3 to 2. Breathes on the surface and feed on the bottom. Not encountered mid-water (Wassenberg et al. 1994).
613 Dermochelys coriacea Leathery turtle 0 N 1 0 2.57 1.67 3.06 N Med Low attribute score
1408 Acalyptophis peronii Horned Seasnake 0 N 3 0 2.71 1.22 2.98 N Med Low attribute
score
254 Astrotia stokesii Stokes' seasnake 0 N 3 0 2.71 1.22 2.98 N Med Low attribute score
1423 Hydrophis ornatus seasnake 0 N 3 0 2.71 1.22 2.98 N Med Low attribute
score
1005 Pelamis platurus yellow-bellied seasnake 0 N 3 0 2.71 1.22 2.98 N Med Low attribute score
324 Caretta caretta Loggerhead 0 N 1 0 2.43 1.67 2.95 N Med Low attribute
score
541 Chelonia mydas Green turtle 0 N 1 0 2.43 1.67 2.95 N Med Low attribute score
822 Eretmochelys imbricata Hawksbill turtle 0 N 1 0 2.43 1.67 2.95 N Med Low attribute
score
957 Hydrophis elegans Elegant seasnake 0 N 2 0 2.14 1.22 2.47 N Low Teleost 308 Heteroclinus perspicillatus Common weedfish 0 N 3 0 2.29 1.22 2.59 N Low 1074 Solenostomus cyanopterus Blue-finned Ghost
Pipefish, Robust Ghost 0 N 3 0 2.14 1.22 2.47 N Low
1075 Solenostomus paradoxus Harlequin Ghost Pipefish, Ornate Ghost Pipefish
0 N 3 0 2.14 1.22 2.47 N Low

Level 2
116
1667 Hippocampus kuda Spotted Seahorse, Yellow Seahorse
0 N 0 0 1.57 1.67 2.29 N Low 1548 Heraldia sp. 1 [in Kuiter,
2000] Western upsidedown pipefish
0 N 0 0 1.43 1.67 2.20 N Low 1666 Hippocampus kelloggi Kellogg's Seahorse 0 N 0 0 1.43 1.67 2.20 N Low 1668 Hippocampus subelongatus West Australian Seahorse 0 N 0 0 1.43 1.67 2.20 N Low 1699 Idiotropiscis australe Southern Pygmy
Pipehorse 0 N 0 0 1.43 1.67 2.20 N Low
1010 Phycodurus eques Leafy Seadragon 0 N 0 0 1.57 1.22 1.99 N Low 1011 Phyllopteryx taeniolatus Weedy Seadragon,
Common Seadragon 0 N 0 0 1.57 1.22 1.99 N Low
949 Hippocampus taeniopterus Spotted Seahorse, Yellow Seahorse
0 N 0 0 1.57 1.22 1.99 N Low 569 Doryrhamphus melanopleura Bluestripe Pipefish 0 N 0 0 1.57 1.22 1.99 N Low 983 Maroubra perserrata Sawtooth Pipefish 0 N 0 0 1.57 1.15 1.95 N Low 320 Solegnathus guentheri Indonesian Pipefish,
Gunther's Pipehorse 0 N 0 0 1.43 1.22 1.88 N Low
1072 Solegnathus robustus Robust Spiny Pipehorse, Robust Pipehorse
0 N 0 0 1.43 1.22 1.88 N Low 549 Hippocampus angustus Western Spiny Seahorse 0 N 0 0 1.43 1.22 1.88 N Low 1089 Trachyrhamphus
bicoarctatus Bend Stick Pipefish, Short-tailed Pipefish
0 N 0 0 1.43 1.22 1.88 N Low 1092 Urocampus carinirostris Hairy Pipefish 0 N 0 0 1.43 1.22 1.88 N Low 980 Lissocampus runa Javelin Pipefish 0 N 0 0 1.43 1.22 1.88 N Low 946 Hippocampus bleekeri pot bellied seahorse 0 N 0 0 1.43 1.22 1.88 N Low 953 Histiogamphelus briggsii Briggs' Crested Pipefish,
Briggs' Pipefish 0 N 0 0 1.43 1.22 1.88 N Low
961 Hypselognathus rostratus Knife-snouted Pipefish 0 N 0 0 1.43 1.22 1.88 N Low 978 Leptoichthys fistularius Brushtail Pipefish 0 N 0 0 1.43 1.22 1.88 N Low 966 Kaupus costatus Deep-bodied Pipefish 0 N 0 0 1.43 1.22 1.88 N Low 995 Mitotichthys semistriatus Half-banded Pipefish 0 N 0 0 1.43 1.22 1.88 N Low 979 Lissocampus caudalis Australian Smooth
Pipefish, Smooth Pipefish 0 N 0 0 1.43 1.22 1.88 N Low
1026 Stigmatopora argus Spotted Pipefish 0 N 0 0 1.43 1.22 1.88 N Low 1027 Stigmatopora nigra Wide-bodied Pipefish,
Black Pipefish 0 N 0 0 1.43 1.22 1.88 N Low
1028 Stipecampus cristatus Ring-backed Pipefish 0 N 0 0 1.43 1.22 1.88 N Low 1061 Pugnaso curtirostris Pug-nosed Pipefish 0 N 0 0 1.43 1.22 1.88 N Low
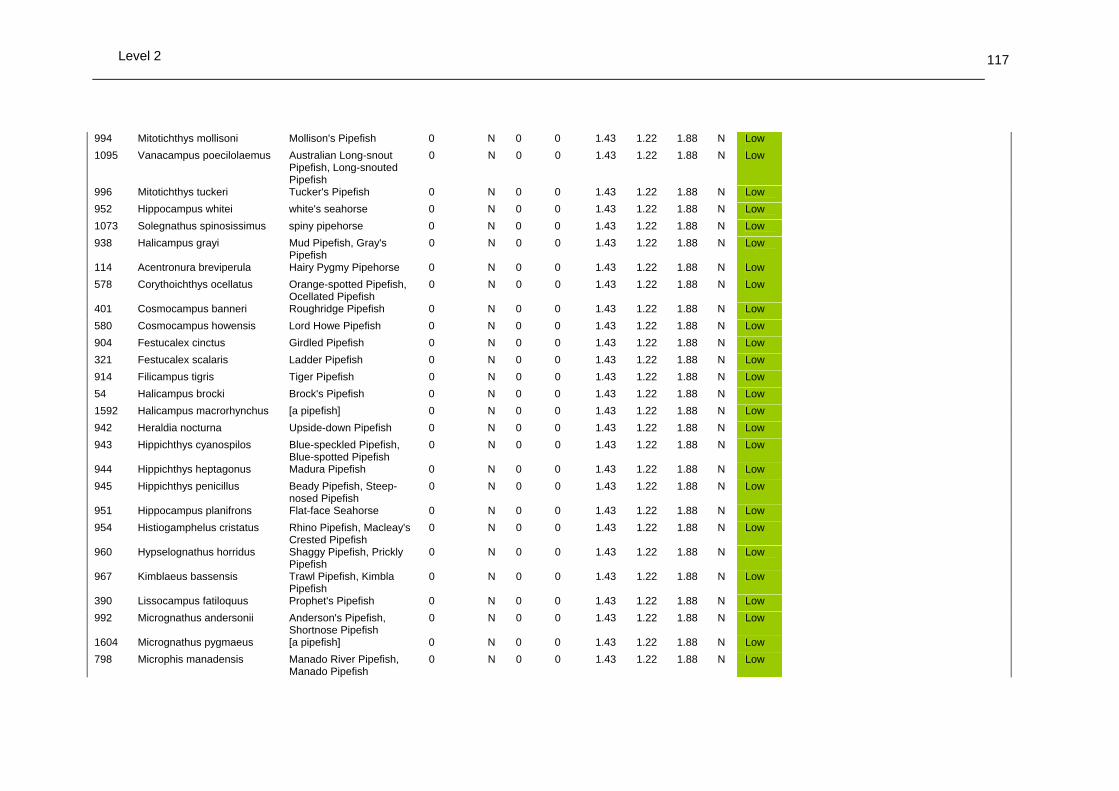
Level 2
117
994 Mitotichthys mollisoni Mollison's Pipefish 0 N 0 0 1.43 1.22 1.88 N Low 1095 Vanacampus poecilolaemus Australian Long-snout
Pipefish, Long-snouted Pipefish
0 N 0 0 1.43 1.22 1.88 N Low
996 Mitotichthys tuckeri Tucker's Pipefish 0 N 0 0 1.43 1.22 1.88 N Low 952 Hippocampus whitei white's seahorse 0 N 0 0 1.43 1.22 1.88 N Low 1073 Solegnathus spinosissimus spiny pipehorse 0 N 0 0 1.43 1.22 1.88 N Low 938 Halicampus grayi Mud Pipefish, Gray's
Pipefish 0 N 0 0 1.43 1.22 1.88 N Low
114 Acentronura breviperula Hairy Pygmy Pipehorse 0 N 0 0 1.43 1.22 1.88 N Low 578 Corythoichthys ocellatus Orange-spotted Pipefish,
Ocellated Pipefish 0 N 0 0 1.43 1.22 1.88 N Low
401 Cosmocampus banneri Roughridge Pipefish 0 N 0 0 1.43 1.22 1.88 N Low 580 Cosmocampus howensis Lord Howe Pipefish 0 N 0 0 1.43 1.22 1.88 N Low 904 Festucalex cinctus Girdled Pipefish 0 N 0 0 1.43 1.22 1.88 N Low 321 Festucalex scalaris Ladder Pipefish 0 N 0 0 1.43 1.22 1.88 N Low 914 Filicampus tigris Tiger Pipefish 0 N 0 0 1.43 1.22 1.88 N Low 54 Halicampus brocki Brock's Pipefish 0 N 0 0 1.43 1.22 1.88 N Low 1592 Halicampus macrorhynchus [a pipefish] 0 N 0 0 1.43 1.22 1.88 N Low 942 Heraldia nocturna Upside-down Pipefish 0 N 0 0 1.43 1.22 1.88 N Low 943 Hippichthys cyanospilos Blue-speckled Pipefish,
Blue-spotted Pipefish 0 N 0 0 1.43 1.22 1.88 N Low
944 Hippichthys heptagonus Madura Pipefish 0 N 0 0 1.43 1.22 1.88 N Low 945 Hippichthys penicillus Beady Pipefish, Steep-
nosed Pipefish 0 N 0 0 1.43 1.22 1.88 N Low
951 Hippocampus planifrons Flat-face Seahorse 0 N 0 0 1.43 1.22 1.88 N Low 954 Histiogamphelus cristatus Rhino Pipefish, Macleay's
Crested Pipefish 0 N 0 0 1.43 1.22 1.88 N Low
960 Hypselognathus horridus Shaggy Pipefish, Prickly Pipefish
0 N 0 0 1.43 1.22 1.88 N Low 967 Kimblaeus bassensis Trawl Pipefish, Kimbla
Pipefish 0 N 0 0 1.43 1.22 1.88 N Low
390 Lissocampus fatiloquus Prophet's Pipefish 0 N 0 0 1.43 1.22 1.88 N Low 992 Micrognathus andersonii Anderson's Pipefish,
Shortnose Pipefish 0 N 0 0 1.43 1.22 1.88 N Low
1604 Micrognathus pygmaeus [a pipefish] 0 N 0 0 1.43 1.22 1.88 N Low 798 Microphis manadensis Manado River Pipefish,
Manado Pipefish 0 N 0 0 1.43 1.22 1.88 N Low

Level 2
118
1243 Mitotichthys meraculus Western Crested Pipefish 0 N 0 0 1.43 1.22 1.88 N Low 1242 Nannocampus subosseus Bony-headed Pipefish 0 N 0 0 1.43 1.22 1.88 N Low 1001 Notiocampus ruber Red Pipefish 0 N 0 0 1.43 1.22 1.88 N Low 1070 Solegnathus dunckeri Duncker's Pipehorse 0 N 0 0 1.43 1.22 1.88 N Low 1071 Solegnathus sp. 1 [in Kuiter,
2000] Pipehorse 0 N 0 0 1.43 1.22 1.88 N Low
1029 Syngnathoides biaculeatus Double-ended Pipehorse, Alligator Pipefish
0 N 0 0 1.43 1.22 1.88 N Low 1093 Vanacampus margaritifer Mother-of-pearl Pipefish 0 N 0 0 1.43 1.22 1.88 N Low 1096 Vanacampus vercoi Verco's Pipefish 0 N 0 0 1.43 1.22 1.88 N Low 950 Hippocampus minotaur Bullneck Seahorse 0 N 0 0 1.43 1.22 1.88 N Low 1591 Halicampus boothae [a pipefish] 0 N 0 0 1.43 1.22 1.88 N Low 948 Hippocampus
queenslandicus Kellogg's Seahorse 0 N 0 0 1.43 1.22 1.88 N Low
1602 Hippocampus tristis [a pipefish] 0 N 0 0 1.43 1.22 1.88 N Low 1664 Hippocampus abdominalis Big-bellied / southern
potbellied seahorse 0 N 0 0 1.43 1.22 1.88 N Low
548 Hippocampus subelongatus West Australian Seahorse 0 N 0 0 1.43 1.22 1.88 N Low 947 Hippocampus breviceps Short-head Seahorse,
Short-snouted Seaho 0 N 0 0 1.43 1.15 1.83 N Low
105 Acentronura australe Southern Pygmy Pipehorse
0 N 0 0 1.43 1.15 1.83 N Low 287 Campichthys galei Gale's Pipefish 0 N 0 0 1.43 1.15 1.83 N Low 288 Campichthys tryoni Tryon's Pipefish 0 N 0 0 1.43 1.15 1.83 N Low 389 Choeroichthys suillus Pig-snouted Pipefish 0 N 0 0 1.43 1.15 1.83 N Low 563 Corythoichthys amplexus Fijian Banded Pipefish,
Brown-banded Pipefish 0 N 0 0 1.43 1.15 1.83 N Low
1094 Vanacampus phillipi Port Phillip Pipefish 0 N 0 0 1.29 1.22 1.77 N Low
Summary of Habitat PSA results
Habitats were eliminated at the end of Level 1 Summary of Community PSA results
The Community component was not examined in this version; it remains a future task.

Level 2
2.4.4 PSA Plot for individual units of analysis (Step 4)
The average productivity and susceptibility scores for each unit of analysis (e.g. for each species) are then used to place the individual units of analysis on 2D plots (as below). The relative position of the units on the plot will determine relative risk at the unit level as per PSA plot below. The overall risk value for a unit is the Euclidean distance from the origin of the graph. Units that fall in the upper third of the PSA plots are deemed to be at high risk. Units with a PSA score in the middle are at medium risk, while units in the lower third are at low risk with regard to the productivity and susceptibility attributes. The divisions between these risk categories are based on dividing the area of the PSA plots into equal thirds. If all productivity and susceptibility scores (scale 1-3) are assumed to be equally likely, then 1/3rd of the Euclidean overall risk values will be greater than 3.18 (high risk), 1/3rd will be between 3.18 and 2.64 (medium risk), and 1/3rd will be lower than 2.64 (low risk). Results of the PSA plot from PSA workbook ranking worksheet PSA plot for target species in the SPF midwater trawl fishery. The magenta dot in the centre of the blue diamonds is the average risk for this component.
SPF MWT PSA- Target Species
1.00
1.67
2.34
1.00 1.67 2.34
(<-High Productivity (Low->)
(<- L
ow) S
usce
ptib
ility
(Hig
h ->
)

Level 2
120
PSA plot for byproduct species in the SPF midwater trawl fishery. The magenta dot in the centre of the blue diamonds is the average risk for this component.
SPF MWT PSA- Byproduct Species
1.0
1.7
2.3
1.0 1.7 2.3
(<-High Productivity (Low->)
(<- L
ow) S
usce
ptib
ility
(Hig
h ->
)
PSA plot for bycatch species in the SPF midwater trawl fishery. The magenta dot in the centre of the blue diamonds is the average risk for this component.
SPF MWT PSA- Bycatch Species
1.0
1.7
2.3
1.0 1.7 2.3
(<-High Productivity (Low->)
(<- L
ow) S
usce
ptib
ility
(Hig
h ->
)

Level 2
PSA plot for TEP species in the SPF midwater trawl fishery. The magenta dot in the centre of the blue diamonds is the average risk for this component.
SPF MWT PSA-TEP Species
1.0
1.7
2.3
1.0 1.7 2.3
(<-High Productivity (Low->)
(<- L
ow) S
usce
ptib
ility
(Hig
h ->
)
The overall risk value for each unit is the Euclidean distance from the origin to the location of the species on the PSA plot. The units are then divided into three risk categories, high, medium and low, according to the risk values (Figure 17). The cut-offs for each category are thirds of the total distribution of all possible risk values (Figure 17).
Figure 17. Overall risk values in the PSA plot. Left panel. Colour map of the distribution of the Euclidean overall risk values. Right panel. The PSA plot contoured to show the low (blue) risk, medium (orange) risk and high (red) risk values. The PSA output allows identification and prioritization (via ranking the overall risk scores) of the units (e.g. species, habitat types, communities) at greatest risk to fishing

Level 2
122
activities. This prioritisation means units with the lowest inherent productivity or highest susceptibility, which can only sustain the lowest level of impact, can be examined in detail. The overall risk to an individual unit will depend on the level of impact as well its productivity and susceptibility. 2.4.5 Uncertainty analysis ranking of overall risk (Step 5)
The final PSA result for a species is obtained by ranking overall risk value resulting from scoring the productivity and susceptibility attributes. Uncertainty in the PSA results can arise when there is imprecise, incorrect or missing data, where an average for a higher taxonomic unit was used (e.g. average genera value for species units), or because an inappropriate attribute was included. The number of missing attributes, and hence conservative scores, is tallied for each unit of analysis. Units with missing scores will have a more conservative overall risk value than those species with fewer missing attributes, as the highest score for the attribute is used in the absence of data. Gathering the information to allow the attribute to be scored may reduce the overall risk value. Identification of high-risk units with missing attribute information should translate into prioritisation of additional research (an alternative strategy). A second measure of uncertainty is due to the selection of the attributes. The influence of particular attributes on the final result for a unit of analysis (e.g. a habitat unit) can be quantified with an uncertainty analysis, using a Monte Carlo resampling technique. A set of productivity and susceptibility scores for each unit is calculated by removing one of the productivity or susceptibility attributes at a time, until all attribute combinations have been used. The variation (standard deviation) in the productivity and susceptibility scores is a measure of the uncertainty in the overall PSA score. If the uncertainty analysis shows that the unit would be treated differently with regard to risk, it should be the subject of more study. The validity of the ranking can also be examined by comparing the results with those from other data sources or modelling approaches that have already been undertaken in specific fisheries. For example, the PSA results of the individual species (target, byproduct and bycatch and TEP) can be compared against catch rates for any species or against completed stock assessments. These comparisons will show whether the PSA ranking agrees with these other sources of information or more rigorous approaches. Availability of information The ability to score each species based on information on each attribute varied slightly between the attributes (as per summary below). With regard to the productivity attributes, trophic level was missing in 42% of species, and so the most conservative score was used, while information on reproductive strategy could be found or calculated for all but one species (the slipper lobster family). The current method of scoring the susceptibility attributes provides a value for each attribute for each species – some of these are based on good information, whereas others are merely sensible default values.

Level 2
Summary of the success of obtaining information on the set of productivity and susceptibility attributes for the species. Where information on an attribute was missing the highest score was used in the PSA.
Productivity Attributes Average age at
maturity Average max age Fecundity
Average max size
Average size at
Maturity Reproductive
strategy
Trophic level
(FishBase)Total species scores for attribute 214 201 225 236 236 237 138 n species scores with attribute unknown, (conservative score used) 24 37 13 2 2 1 100 % unknown information 10 16 5 1 1 0 42 Susceptibility Attributes
Availability Encounter
ability Selectivity PCM
Bathymetry overlap Habitat
Total species scores for attribute
238 238 238 238 238
n species scores with attribute unknown, (conservative score used)
0 0 0 0 0
% unknown information 0.0 0.0 0.0 0.0 0.0 Each species considered in the analysis had information for an average of 6.25 (out of 7) productivity attributes and 5 susceptibility attributes. This meant that, on average, conservative scores were used for less than 0.79 of the attributes for a single species. Species had missing information for between 0 and 10 of the combined 12 productivity and susceptibility attributes.
Overall Uncertainty Distribution
0
10
20
30
40
50
60
70
80
1 2 3 4 5 6 7 8 9 10 11 12 13 14
Uncertainty (number of missing attributes)
Freq
uenc
y
Species: Overall uncertainty distribution - frequency of missing information for the combined productivity and susceptibility attributes Correlation between attributes: Species component: The attributes selected for productivity were often strongly correlated (as per correlation matrix below for productivity). The strongest productivity attribute correlation was between reproductive strategy and fecundity (0.90). This is why the attributes for productivity are averaged, as they are all correlated with the intrinsic rate of increase (see ERAEF: Methodology document for more details). In contrast the susceptibility attributes were less correlated, which is to be expected as they measure independent

Level 2
124
aspects of this dimension, and are multiplied to obtain the overall susceptibility score. The susceptibility correlations were very weak (see matrix below). Correlation matrix for the species productivity attributes. The correlation (r) is based on the scores within each attribute pair. Results from PSA workbook ranking graphs worksheet. Age at
maturity Max age Fecundit
y Max size Min size
at maturity
Reproductive strategy
Trophic level
Age at maturity X Max age 0.65 X Fecundity 0.49 0.62 X Max size 0.34 0.48 0.32 X Min size at maturity 0.44 0.65 0.53 0.85 X Reproductive strategy 0.47 0.63 0.90 0.34 0.56 X Trophic level 0.53 0.80 0.75 0.40 0.61 0.77 X
Correlation matrix for the four species susceptibility attributes. The correlation (r) is based on the scores within each attribute pair. Results from PSA workbook ranking graphs worksheet. Correlations with the post-capture mortality could not be calculated, as this attribute was scored as 3 for all species. Availability Encounterability Selectivity Post-capture
mortality Availability X Encounterability -0.07 X Selectivity 0.08 -0.02 X Post-capture mortality NA NA NA X Productivity and susceptibility values for Species The average productivity score for all species was 2.09 ± 0.11 (mean ± SD of scores calculated using n-1 attributes) and the mean susceptibility score was 1.35 (as per summary of average productivity and susceptibility scores as below). Individual scores are shown in Summary of Species PSA results (Section 2.4.2). The small variation in the average of the boot-strapped values (using n-1 attributes), indicates the productivity scores are robust to elimination or mis-estimation of a single attribute. Information for a single attribute does no have a disproportionately large effect on the productivity scores. Uncertainty cannot be calculated in the same way for susceptibility, as this is a multiplicative approach, and so dropping one variable to estimate uncertainty is less straight-forward. Overall Risk Values for Species The overall risk values (Euclidean distance on the PSA plot) could fall between 1 and 4.24 (scores of 1&1 and 3&3 for both productivity and susceptibility respectively). The mean observed overall risk score was 2.51, with a range of 1.8-3.8. The actual values for each species are shown in Summary of PSA results (above). A total of 27 species (11%) were classed as high risk, 79 (33%) were in the medium risk category, and 132 (59%) as low risk.

Level 2
Results: Frequency distribution of the overall PSA risk values
Frequency distribution of the overall risk values generated for the 238 species in the SPF midwater trawl sub-fishery PSA.
Overall risk value distribution
0
10
20
30
40
50
60
70
1.5 1.6 1.7 1.8 1.9 2.0 2.1 2.2 2.3 2.4 2.5 2.6 2.7 2.8 2.9 3 3.1 3.2 3.3 3.4 3.5 3.6 3.7 3.8 3.9 4.0 4.1 4.2 4.3
Risk value
Freq
uenc
y
The distribution of the overall risk values of all species is shown on the PSA plot below. The species are distributed in the lower left and lower right parts of the plot, indicating that there are clusters of low susceptibility, high productivity species (lower left), and low susceptibility, low productivity (lower right) in the purse-seine sub-fishery. PSA plot for all species in the SPF midwater trawl sub-fishery. Species in the upper right of the plot are at highest risk.
SPF MWT PSA - ALL SPECIES
1.0
1.7
2.3
1.0 1.7 2.3
(<-High) Productivity (Low ->)
(<- L
ow)
Sus
cept
ibili
ty (H
igh
->)

Level 2
126
The number of attributes with missing information is of particular interest, because the conservative scoring means these units may be scored at higher risk than if all the information was known. This relationship between the overall risk score and the number of missing attributes shows that an increase in the number of missing attributes (and hence conservative scores used) results in a skew to higher risk values. This suggests that as information becomes available on those attributes, the risk values may decline for some units. All attributes are treated equally in the PSA; however, information on some attributes may be of low quality. There was a lack of data on the foraging range of birds and their trophic level. The single high risk byproduct species was missing all the biological information, as it was only resolved at the family level. 2.4.6 Evaluation of the PSA results (Step 6)
Species Components: The PSA analysis of the midwater trawl was presented to industry and management during September 2005. The PSA methodology has since been reviewed and revised. The following results reflect the revised methodology (as at 10 April 2006 See Appendix B Table L2.1). Overall Of the 237 species assessed at Level 2 using the PSA analysis, expert/observer over-rides were used on 95 species. A total of 26 species were found to be at high risk. Of these, 1 species had more than 3 missing attributes. For most species there was little missing data. The average number of missing attributes was 0.82 out of a possible 12. There were only 30 high risk species. None of the target, byproduct or discard species were high risk, apart from one byproduct invertebrate with missing attributes. The high risk species (29) included 23 species of small beaked and whales and dolphins. There were 3 species of birds that were evaluated as high risk. One species of marine reptile was scored high risk because of missing attributes. Summary of average productivity, susceptibility and overall risk scores.
Component Measure All species Number of species 237 Average of productivity total 2.09 Average of susceptibility total 1.35 Average of overall risk value (2D) 2.51 Average number of missing attributes 0.82 Target species Number of species 1 Average of productivity total 1.57 Average of susceptibility total 1.67 Average of overall risk value (2D) 2.29 Average number of missing attributes 1.00 Byproduct species Number of species 16

Level 2
Average of productivity total 1.61 Average of susceptibility total 1.52 Average of overall risk value (2D) 2.23 Average number of missing attributes 0.71 Bycatch species Number of species 2 Average of productivity total 1.50 Average of susceptibility total 1.44 Average of overall risk value (2D) 2.08 Average number of missing attributes 0.50 TEP species Number of species 218 Average of productivity total 2.14 Average of susceptibility total 1.33 Average of overall risk value (2D) 2.54 Average number of missing attributes 0.83
PSA 2D (productivity and susceptibility) risk categories for each species component.
Risk category High Medium Low Total Target species 1 1 Byproduct species 1 15 16 Bycatch species 2 2 TEP species 26 79 113 218 Total 26 80 131 237
PSA 2D (productivity and susceptibility) risk categories for each taxon.
Risk category High Medium Low Total Chondrichthyan 3 3 Invertebrate 1 1 Marine bird 3 42 33 78 Marine mammal 23 25 1 49 Marine reptile 9 1 10 Teleost 1 95 96 Total 26 80 131 237
Discussion
Target species The single target species, redbait, was classified as low risk. The low risk score reflects the distribution of this species widely outside the range of the sub-fishery. However, some caution is needed. The analysis assumes most of the populations are outside the range of effort at any given time. For some migratory schooling species, there is the potential for the range of a stock to be restricted in its range during seasonal migrations, resulting higher than expected availability to targeting. Byproduct species One byproduct species, Ocean sunfish, was evaluated as medium risk but this species is widely distributed outside the fishery. With the exception of ocean sunfish, all other byproduct species taken were evaluated as low risk. The largest catches of byproduct were barracouta – averaging over 50 t per year from 2001 – 2004. Byproduct species
Level 2
128
include a number of demersal species managed by quota in the SESS. Among these, spotted warehou catches are largest, averaging 9 t per year from 2001-2004. Bycatch species There were only two discard species: southern frostfish and butterfly gurnard. Both species were evaluated as low risk. Butterfly gurnard is a bottom dweller. Frostfish move up into the water column but have high productivity and occur widely outside the range of current effort in the fishery. TEP species Chondrichthyans The three chondrichthyans were evaluated as medium risk. No captures have been recorded in observer data to date. Marine birds Only three species of birds were evaluated as high risk, mainly because detailed species specific observer data has reduced the risk scores for the other species. Two of the high risk bird species are large species observed in high numbers on the fishing grounds: black-browed albatross and shy albatross. No captures of these birds have been recorded in the SPF but albatross have been killed in other Commonwealth mid-water trawl fisheries through warp strikes which are a concern overseas, particularly in New Zealand and other southern hemisphere countries. There are no estimates of what a sustainable mortality rate is likely to be for these species. The remaining bird species that scored high risk (Chatham albatross) had 4 missing attributes. Marine mammals Most of the high risk TEP species (23/26) were marine mammals and most of these species (20/23) were small whales. There are concerns that dolphins and small beaked whales can be attracted to the catch of small pelagic fishes which are the natural diet of some of these species (See 2.5 below). The remaining three high risk TEP marine mammals were seals: Australian fur seal, leopard seal, and elephant seal. Australian fur seals are observed on the grounds in significant numbers and there have been a small number of recent captures (~10 in last 12 months; Lyle et al, unpublished); current effort in the fishery is close to the Bass Strait breeding grounds for this species and these seals have been caught in other trawl fisheries around Tasmania. Leopard seals and elephant seals breed in the Antarctic region but both are regular visitors to Australian continental waters and both have been captured in commonwealth fisheries around southern Tasmania.
Habitat Component: Excluded at Level 1

Level 2
2.4.7 Decision rules to move from Level 2 to Level 3 (Step 7)
For the PSA overall risk values, units that fall in the upper third (risk value > 3.18) and middle third (2.64 < risk value < 3.18) of the PSA plots are deemed to be at high and medium risk respectively. These need to be the focus of further work, either through implementing a management response to address the risk to the vulnerable species or be further examined for risk within the particular ecological component at Level 3. Units at low risk, in the lower third (risk value <2.64), will be deemed not at risk from the sub-fishery and the assessment is concluded for these units. For example, if in a Level 2 analysis of habitat types, two of seven habitat types were determined to have risk from the sub-fishery, only those two habitat types would be considered at Level 3. The output from the Level 2 analysis will result in four options:
• The risk of fishing on a unit of analysis within a component (e.g. single species or habitat type) is not high, the rationale is documented, and the impact of the fishing activity on this unit need not be assessed at a higher level unless management or the fishery changes.
• The risk of fishing on a unit is high but management strategies are introduced rapidly that will reduce this risk, this unit need not be assessed further unless the management or the fishery changes.
• The risk of fishing on a unit is high but there is additional information that can be used to determine if Level 3, or even a new management action is required. This information should be sought before action is taken
• The risk of fishing on a unit is high and there are no planned management interventions that would remove this risk, therefore the reasons are documented and the assessment moves to Level 3.
At level 2 analysis, a fishery can decide to further investigate the risk of fishing to the species via a level 3 assessment or implement a management response to mitigate the risk. To ensure all fisheries follow a consistent process in responding to the results of the risk assessment, AFMA has developed an ecological risk management framework. The framework (see Figure x below) makes use of the existing AFMA management structures to enable the ERAs to become a part of normal fisheries management, including the involvement of fisheries consultative committees. A separate document, the ERM report, will be developed that outlines the reasons why species are at high risk and what actions the fishery will implement to respond to the risks.

Level 2
130
*TSG – Technical Support Group - currently provided by CSIRO. 2.4.8 High/Medium risk categorisation (Step 8)
Following the Level 2 PSA scoring of target, bycatch and byproduct, and TEP species, the high and medium risk species have been divided into five categories that highlight potential reasons for the higher risk scores. These categories should also help identify areas of uncertainty and assist decisions regarding possible management responses for these species. The categories are independent and species are allocated to each category in the order the categories are presented below. Thus, while in principle a species could qualify for both Category 1 and 2, it will only appear in Category 1 because that was scored first. The five categories are programmed into the PSA excel spreadsheets for each fishery according to the following algorithms: • Category 1: Missing data (>3 missing attributes in either Productivity or
Susceptibility estimation). Rationale: A total of more than 3 missing attributes (out of 12 possible) could lead to a change in risk score if the information became known. This is because where information is missing for an attribute, that attribute is automatically scored as high risk. The choice of 3 attributes was identified using sensitivity analysis.
• Category 2: Spatial overlap • 2A. Widely distributed (More than 80% of the full range of a species is
outside the jurisdictional boundary of the fishery). Rationale: These species may have refuge outside the fishery.
• 2B. Low overlap (<20% overlap between effort and the species distribution inside the fishery). Refers to the preferred Availability attribute used to

Level 2
calculate Susceptibility. Rationale: This cutoff (20%) has no strong rationale, other than being a low percentage overlap. Additional work to determine what threshold might be applicable is required. However, the categories are to be used as a guide for management, and additional effort to decide on cutoffs may be misplaced if the categories are just used as a guide. A similar analysis could be undertaken for the encounterability and selectivity attributes, but there is more information available for availability (overlap) for most species and overlap may be more informative about risk. A subtle change in fishing practice could modify encounterability or selectivity, while to change availability requires a major change in fleet location, which will be easier to detect.
• Category 3: Low (susceptibility) attribute score (One of the susceptibility attribute scores = 1). Rationale: These species may be scored high risk based on productivity risk alone, even if their susceptibility is very low.
• Category 4: Spatial uncertainty (No detailed distributional data available) Availability was calculated using less reliable mapping data or distributional categories: Global/Southern Hemisphere/Australia, with stock likelihood overrides where necessary. Rationale: the absence of fine scale catch and species distribution data (e.g. TEP species) means that the substitute attribute (precautionary) was used. Spatial data should be sought.
• Category 5 Other: risk score not affected by 1-4 considered above Categorisation results - High risk species Detailed species by species results of the categorisation are presented for medium and high risk species in the Tables in section 2.4.2 of this report. The following is a brief summary of the results for species classified as high risk from the PSA analyses. Of the 26 species classified as high risk in the SPF MWT fishery, 1 had missing data (Category 1), 22 were scored low on one susceptibility attribute (Category 3), and 3 had spatial uncertainty (Category 4). There were no Other high risk species.
Risk Category Description Total
Category 1 High risk - Missing data 1
Category 2A High risk - Widely distributed outside fishery 0
Category 2B High risk - Low overlap inside fishery 0
Category 3 High risk – One susceptibility attribute scored low 22
Category 4 High risk - Spatial uncertainty 3
Category 5 High risk - Other 0
Total High risk 26
It is important to stress that this categorization does not imply a down-grading of risk. It is intended as a tool to focus subsequent discussions on risk treatment and identify needs for further data. Sensitivity analysis to the particular cutoffs has not been undertaken in a formal sense, and may not be required, as these categories are intended as guides to focus further consideration of the high risk species. These categories may

Level 2
132
also indicate the presence of false positives in the high risk species category, but only further analysis or data can determine this. 2.5 Level 3 A number of studies have been undertaken that might support Level 3 analyses, however, at present these are only suggested for species identified at high risk at Level 2. These species were all in the TEP component. For completeness, some other Level 3 type information for species that were not at risk that is also available will be summarized here. In particular, for the community component that has not been evaluated, there are some pertinent studies. This research is also relevant to the other SPF sub-fishery, the midwater trawl. Full citations for these studies are provided at the end of the references section. With regard to the biology of the target species, there has been a synopsis of the small pelagic fishery (purse seine and mid-water trawl) and biological data (Welsford and Lyle 2003). In the southeast a number of studies in the late 1980’s documented the influence of the environment on the recruitment and distribution of some of the target species (e.g. Harris et al. 1987, Harris et al. 1988, Harris et al. 1991; Harris et al. 1992. Although the community component was not assessed at Level 2 in this report there is some relevant information that would inform both Level 3 and Level 2 analysis of this component. These studies include
• Diet of redbait – Meyer and Smale1991 • Trophic links to shy albatross – Hedd and Gales 2001 • Trophic links to fur seals – Gales and Pemberton 1994 • Trophic links to seabirds – Brothers et al. 1993 1994 • Trophic links to commercial teleosts – Meyer and Smale 1991 • Trophic role of redbait – Young and Davis (1992), Young et al (1993, 1997),
Bulman et al 2001 With regard to the TEP species and direct impacts, there are no studies that can estimate the sustainable level of take, although this may be important if there are demonstrated interactions that result in the death of the TEP species identified at Level 2. There has been detailed study of the Australian fur seals, and estimates of sustainable take could be made based on this research. Research into the behaviour of seals and dolphins around the gear and the effectiveness of seal excluder devices occurred in 2005, and the results of that analysis have been presented to AFMA (Browne et al 2005). The study showed that some gear modifications may further reduce mortality, but also that seal behaviour may be very difficult to moderate, and they were increasingly attracted to vessels as they fished in an area (Browne et al 2005).

References
133
3. General discussion and research implications 3.1 Level 1 The results of the Level 1 analysis for the purse seine sub-fishery were discussed in Section 2.3.12. A total of 19 out of 32 impact activities were considered across the five components, and only four scenarios generated risk scores of moderate (3). There were no major risks identified at Level 1 (scores of 4 or above). The Level 1 SICA showed that the impacts of this fishery as it is currently practiced are limited to the direct effect of fishing, and this activity was identified across four components. Habitat was the only component eliminated. 3.2 Level 2 The Level 2 results were presented in detail in Section 2.4.6.; results are briefly recapped here. The three species components that Level 1 analyses suggested were at risk from fishing were target species, bycatch and byproduct, and TEP species. This assessment then considered 237 species in the Level 2 analyses, and a number (26) of species in the TEP component were found to be at high risk. 3.2.1 Species at risk
Of the list of species rated as high risk from the PSA analyses, the authors consider that 23 species need further evaluation or management response. This expert judgment is based on taxonomy/identification, distribution, stock structure, movements, conservation status and overlap with this/other fisheries as discussed below (sorted by taxa). These species are discussed further below.
Species Risk Category Role Marine birds
• Shy albatross Low overlap TEP • Black-browed Albatross Low attribute score TEP
Marine mammals
• Pygmy Killer Whale Low attribute score TEP • Short-finned Pilot Whale Low attribute score TEP • Long-finned Pilot Whale Low attribute score TEP • False Killer Whale Low attribute score TEP • Andrew's Beaked Whale Low attribute score TEP • Blainville's Beaked Whale Low attribute score TEP • Gingko Beaked Whale Low attribute score TEP • Hector's Beaked Whale Low attribute score TEP • True's Beaked Whale Low attribute score TEP • Southern Bottlenose Whale Low attribute score TEP • Gray's Beaked Whale Low attribute score TEP • Strap-toothed Beaked Whale Low attribute score TEP • Cuvier's Beaked Whale Low attribute score TEP • Risso's Dolphin Low attribute score TEP

References
134
• Bottlenose Dolphin Low attribute score TEP • Indian Ocean bottlenose Dolphin Low attribute score TEP • Fraser's Dolphin Low attribute score TEP • Hourglass Dolphin Low attribute score TEP • Southern Right Whale Dolphin Low attribute score TEP • Striped Dolphin Low attribute score TEP • Australian Fur Seal Low attribute score TEP
Of the 26 TEP species found to be at high risk, three of these were albatross species. Two of these species (shy albatross and black-browed albatross) are known from the fishing grounds, have records of mortalities in domestic fisheries with similar gear, and are likely to suffer similar low mortality rates in this fishery. The third albatross (Chatham) was missing some biological information, and may be eliminated with more data. Most of the high risk TEP species (23/26) were marine mammals and most of these species (20/23) were small whales or dolphins. There are concerns that dolphins and small beaked whales can be attracted to the catch of small pelagic fishes which are the natural diet of some of these species. In other fisheries, dolphins have been killed in significant numbers, and in this midwater trawl fishery, dolphin mortality was recorded in 2005. Of the remaining three TEP species all were seals. Two species, the leopard and elephant seals, are rare within the range of current effort in the fishery, although they have been captured in other fisheries around Tasmania. Seals of a number of species are known to be caught in significant numbers by trawling around the world. The SPF sub-fishery is working to develop effective mitigation for marine mammals. A recent camera survey in this SPF sub-fishery found that Australian fur seals were present in the vicinity of the nets in 89% of observed shots (17/19), and that two seals were killed following entrapment (Browne et al, 2005). Growing seal populations are likely to represent an ongoing challenge to trawl fishermen in avoiding capture of this protected species. Although explicit population models of seals have not been developed, this may be important if this fishery is to demonstrate that any take is not detrimental to the seal populations. Residual risk As discussed elsewhere in this report (Section 1), the ERAEF methods are both hierarchically structured and precautionary. The Level 1 (SICA) analyses are used to identify potential hazards associated with fishing and which broad components of the ecological system they apply to. The Level 2 (PSA) analyses consider the direct impacts of fishing on individual species and habitats (rather than whole components), but the large numbers of species that need to be assessed and the nature of the information available for most species in the PSA analyses limits these analyses in several important respects. These include that some existing management measures are not directly accounted for, and that no direct account is taken of the level of mortality associated with fishing. Both these factors are taken into account in the ERAEF framework at Level 3, but the analyses reported here stop at Level 2. This means that the risk levels

References
135
for species must be regarded as identifying potential rather than actual risk, and due to the precautionary assumptions made in the PSA analyses, there will be a tendency to overestimate absolute levels of risk from fishing. In moving from ERA to ERM, AFMA will focus scarce resources on the highest priority species and habitats (those likely to be most at risk from fishing). To that end, and because Level 3 analyses are not yet available for most species, AFMA (with input from CSIRO and other stakeholders) has developed guidelines to assess “residual risk” for those species identified as being at high potential risk based on the PSA analyses. The residual risk guidelines will be applied on a species by species basis, and include consideration of existing management measures not currently accounted for in the PSA analyses, as well as additional information about the levels of direct mortality. These guidelines will also provide a transparent process for including more precise or missing information into the PSA analysis as it becomes available. CSIRO and AFMA will continue to work together to include the broad set of management arrangements in Level 2 analyses, and these methods will be incorporated in future developments of the ERAEF framework. CSIRO has also undertaken some preliminary Level 3 analyses for bycatch species for several fisheries, and these or similar methods will also form part of the overall ERAEF framework into the future. 3.2.2 Habitats at risk
Not relevant; eliminated at Level 1 3.2.3 Communities at risk
Communities not evaluated as methods not complete. 3.3 Key Uncertainties / Recommendations for Research and Monitoring In assessing risk to byproduct, bycatch and TEP species, it is not possible to assess absolute risk without supplementary information on either abundance or total mortality rates, and such data are not available for the vast majority of such species. However it may be possible to draw inferences from information that may be available for some species, either from catch records of occurrence from other fisheries, from fishery independent survey data, or from examination of trends in CPUE from observer data. Such data should be sought and examined for the high risk species identified in this analysis. This sub-fishery has been extremely proactive in developing a research and observer program that will allow these risks to be identified and potentially mitigated. In the preparation of the ERAEF reports for fisheries around Australia, the observer data available from this fishery was second to none. Research needs Specific recommendations arising from this assessment include:

References
136
• Continue the high coverage and observation set collected in recent years on vessels in this fishery. Expand the programs to include operations in the Great Australian Bight if midwater trawl effort expands there. The information about the interactions with the gear may offer a solution to mitigate the known impact on marine mammals. In particular, the collection of underwater video data on the behaviour of marine mammals around the fishing gear may be the way forward.
• The relationship between the number of shots and the association of marine mammals with the vessels should be further investigated; this offers the chance to mitigate via restriction of the number of shots per trip.
• Further research and data collection for determining marine mammal distribution in the area of the fishery is required.
• Develop trophic models to ensure that removal of current catches of small pelagics will not have an unsustainable impact on predatory birds and mammals including shy albatross and the Australian fur seal.
• Determine the impact of Australian fur seal mortality on the viability of the seal population. This may allow an acceptable take to be specified, along with triggers if these levels are exceeded.

References
137
References Ecological Risk Assessment References (specific for each Sub fishery) Annala, J. H., Sullivan, K. J., O'Brien, C. J., Smith, N. W. M. and Varian, S. J. A.
(2002). Unpublished report from the Fishery Assessment Plenary, May 2002: Stock assessments and yield estimates. Part 2: Orange roughy to Yellow-eyed mullet. New Zealand Ministry of Fisheries, Wellington.
Anon (1991). Small Pelagic Fishery Management Zones (map). Australian Fisheries
Management Authority, Canberra. Anon. (2001). FAO Yearbook of Fishery Statistics - Capture Production 1999. FAO
Fishery Information, Data and Statistics Unit, Rome. Anon. (2001). Management policy for the Commonwealth Small Pelagics Fishery [For
zones B, C, and D]. Australian Fisheries Management Authority, Canberra Anon (2002). Jack Mackerel Assessment Workshop 2002 minutes. Australian Fisheries
Management Authority, Canberra Brothers, N., Gales, R. and Pemberton, D. (1993). Prey harvest of the Australasian
Gannet (Sula serrator) in Tasmania. Wildlife Research, 20: 777–773. Browne. A., Welsford, D., and Lyle, J. Monitoring marine mammal interactions in the
small pelagics fishery: stage one pilot study. Report to AFMA, October 2005. Bulman, C., Althaus, F., He, X., Bax, N. and Williams, A. (2001). Diets and trophic
guilds of demersal fishes of the south-eastern Australian shelf. Marine and Freshwater Research: 52, 537–548.
Caton, A. (2001). Fishery Status Reports. Bureau of Rural Sciences, Canberra. 252 pp. Commonwealth Baitfish management objectives. Provided to NSW Fisheries Baitfish
Working Group. Gales, R. and Pemberton, D. (1994). Diet of the Australian fur seal in Tasmania.
Australian Journal of Marine and Freshwater Research 45, 653-664. Glaister, J. P., and J. H. Diplock. [1993]. Baitfish and the East Coast Tuna and Billfish
Fishery - Species, status and situation. Harris, G. P., Davies, P., Nunez, M. and Meyers, G. (1988). Interannual variability in
climate and fisheries in Tasmania. Nature 333, 754-757. Harris, G. P., Griffiths, F. B., Clementson, L. A. Climate and the Fisheries off Tasmania
– Interactions of Physics, food chains and fish. IN Payne, A. A. L., Brink, K. H.,

References
138
Mann, K. H. and Hilborn, R. (Eds.) (1992). Benguela Trophic Functioning, South African Journal of Marine Science, 12: 585 – 587.
Harris, G. P., Griffiths, F. B., Clementson, L. A., Lyne, V. and Van der Doe, H.
(1991). Seasonal and interannual variability in physical processes, nutrient cycling and the structure of the food chain in Tasmanian shelf waters. Journal of Plankton Research 13 Supplement S, 109-131.
Harris, G., Nilsson, C., Clementson, L. and Thomas, D. (1987). The water masses of
the east coast of Tasmania: seasonal and interannual variability and the influence on phytoplankton biomass and productivity. Australian Journal of Marine and Freshwater Research 38, 569-590.
Hedd, A. and Gales, R. (2001). The diet of shy albatrosses (Thalassarche cauta) at
Albatross Island, Tasmania. Journal of Zoology 253, 69-90. Heemstra, P. C. and Randall, J. E. (1977). A revision of the Emmelichthyidae (Pisces:
Perciformes). Australian Journal Marine and Freshwater Research 28, 361-396. Hsieh, C.-H. and Chiu, T.-S. (2002). Summer spatial distribution of copepods and fish
larvae in relation to hydrography in the northern Taiwan Strait. Zoological Studies 41, 85-98.
Jordan, A. R. (1994). Age, growth and back-calculated birthdate distributions of larval
jack mackerel, Trachurus declivis (Pisces: Carangidae), from eastern Tasmanian coastal waters. Australian Journal of Marine and Freshwater Research 45, 19-33.
Jordan, A. R., Pullen, G., Marshall, J. A. and Williams, H. (1995). The temporal and
spatial patterns of spawning in jack mackerel, Trachurus declivis (Pisces: Carangidae), during 1988-1991 in eastern Tasmanian waters. Marine and Freshwater Research 46, 831-842.
Jordan, A. R., Pullen, G. and Williams, H. (1992). Jack mackerel resource assessment in
south eastern Australian: Final report to the Fishing Industry and Development Council, Project DFT2Z. Tasmanian Department of Primary Industry, Fisheries and Energy. Sea fisheries Research Laboratories, Crayfish Point, Taroona.
Kailola, P., Williams, M. J., Stewart, P. C., Reichelt, R. E., McNee, A. and Grieve, C.
eds.). (1993). Australian Fisheries Resources. Bureau of Resource Sciences, Department of Primary Industries and Energy and the Fisheries Research and Development Corporation, Canberra.
Kingsford, M. J. (1992). Drift algae and small fish in coastal waters of northeastern
New Zealand. Marine Ecology Progress Series 80, 41-55. Last, P. R., Scott, E. O. G. and Talbot, F. H. (1983). Fishes of Tasmania. Tasmanian
Fisheries Development Authority, Hobart.

References
139
Lyle, J. M., K. Krusic-Golub, and A. K. Morison. 2000. Age and growth of jack mackerel and the age structure of the jack mackerel purse seine catch. 49 p FRDC project 1995/034. Hobart, Tas.: Tasmanian Aquaculture and Fisheries Institute, University of Tasmania.
Markina, N. P. and Boldryev, V. Z. (1980). Feeding of the redbait on the underwater
elevations of the Southwest Pacific. Marine Biology Vladivostok 4, 40-45. Marshall, J. A., Pullen, G. and Jordan, A. R. (1993). Reproductive biology and sexual
maturity of female jack mackerel, Trachurus declivis (Jenyns) in eastern Tasmanian waters. Australian Journal of Marine and Freshwater Research 44, 799-809.
May, J. L. and Maxwell, J. G. H. (1986). Field guide to trawl fish from temperate
waters of Australia. CSIRO Division of Fisheries Research. Meléndez, R. C. and Céspedes, R. M. (1986). Emmelichthys nitidus cyanescens
(Guichenot, 1848) in the Chilean southern fisheries. Investigacion Pesquera (Chile) 33, 111-114.
Mel'nikov, Y. S. and Ivanin, H. A. (1995). Age-size composition and mortality of
Plagiogeneion rubiginosum (Emmelichthyidae) in west Indian submarine ridge. Journal of Ichthyology 35, 20-27.
Meyer, M. and Smale, M. J. Predation patterns of demersal teleost from the cape south
and west coasts of south Africa. 1. Pelagic predators. South African Journal of Marine Science, 10: 173 – 191.
Nor, L. A., Kykharev, N. N. and Zaytiev, A. K. (1985). The biology of Erythrocles
schlegelii (Richardson) (Emmelichthyidae) of the south China Sea. Journal of Ichthyology 25, 146-149.
O'Grady, A. 2002. Assessing the ecological sustainability of the Northern Territory
Spanish Mackerel Fishery. A report prepared for Environment Australia as required for assessment under the Environment Protection and Biodiversity Conservation Act 1999, Northern Territory. Dept. of Business, Industry & Resource Development.
Oyarzún, C. and Arriaza, M. (1993). Emmelichthys nitidus nitidus Richardson, 1845
and Emmelichthys nitidus cyanescens (Guichenot, 1848), (Perciformes; Emmelichthyidae). Are they really different subspecies? Revista de Biologia Marina 28, 341-348.
Parin, N. V. (1991). Three new species of the bentho-pelagic fish genus Plagiogeneion
from the southern Pacific and Indian oceans (Teleostei: Emmelichthyidae). Proceedings of the Biological Society of Washington 104, 459-467.

References
140
Parin, N. V., Mironov, A. N. and Nesis, K. N. (1997). Biology of the Nazca and Sala y Gómez submarine ridges, and outpost of the Indo-west Pacific fauna in the eastern Pacific ocean: composition and distribution of the fauna, its communities and history. Advances in Marine Biology 32, 145-242.
Paul, L. J. (1997). A summary of the biology and commercial landings, and a stock
assessment of rubyfish Plagiogeneion rubiginosum (Hutton, 1875) (Percoidei: Emmelichthyidae). Wellington: Ministry of Fisheries. New Zealand Fisheries Research Document 97/27.
Paul, L. J., Horn, P. L. and Francis, M. P. (2000). Development of an ageing
methodology, and first estimates of growth parameters and natural mortality for rubyfish (Plagiogeneion rubiginosum) off the east coast of the North Island (QMA 2). Fisheries Assessment Report 2000/22. Ministry of Fisheries, New Zealand.
Pullen, G. (1994a). Fishery status report: Purse seine (The Tasmanian jack mackerel
fishery). Internal Report 13.Department of Primary Industry and Fisheries, Tasmania.
Pullen, G. (1994b). Jack mackerel (Trachurus declivis). In: Species status report: Key
scalefish species, (ed. Anonymous). Internal Report 14. Department of Primary Industry and Fisheries, Tasmania.
Roschin, E. A. (1985). Some biological properties of redbait, Emmelichthys nitidus
(Emmelichthyidae), from a seamount in the notal zone of the Indian Ocean. Journal of Ichthyology 25, 44-50.
Smith, K. [2001]. 2001. Purse Seine Fishery report. NSW Fisheries Status Report
2000/01: pp 120-127 Smith, M. M. and Heemstra, P. C. (eds.). (1986). Smith’s Sea Fishes. MacMillan. Staunton-Smith, J., and T. Ward. 2000. Stock assessment of pelagic bait fishes in
Southern Queensland with reference to pilchards (Sardinops sagax). 126 p FRDC projects 95/043 & 98/130. Brisbane, Qld: Queensland. Dept. of Primary Industries/FRDC.
Tasmania. Dept. of Primary Industries, Water and Environment. 2002. Zone A Mackerel
Fishery discussion paper. Ward, P., T. Timmiss, and B Wise. (2000). A review of biology and fisheries for
mackerel. Updated report to the Fisheries Resources Research Fund, Australia. Bureau of Rural Sciences, Kingston, ACT.
Wassenberg, T. J., Salini, J. P., Heatwole, H. and Kerr, J. D. (1994). Incidental capture
of sea-snakes (Hydrophiidae) by Prawn Trawlers in the Gulf of Carpentaria, Australia. Australian Journal of Marine and Freshwater Research 45: 429 – 443.

References
141
Welsford, D. C. and Lyle, J. M. 2003. Redbait (Emmelichthys nitidus): synopsis of fishery and biological data. TAFI Technical Report Series 20, Tasmanian Aquaculture and Fisheries Institute Tasmania, Hobart
Williams, H. and Pullen, G. (1986). A synopsis of biological data on the jack mackerel
Trachurus declivis Jenyns. Technical Report 10. Department of Sea Fisheries, Tasmania.
Williams, H. and Pullen, G. (1993). Schooling behaviour of jack mackerel, Trachurus
declivis (Jenyns), observed in the Tasmanian purse seine fishery. Australian Journal of Marine and Freshwater Research 44, 577-587.
Williams, H., Pullen, G., Kucerans, G. and Waterworth, C. (1987). The jack mackerel
purse seine fishery in Tasmania, 1986-87. Technical Report 19. Department of Sea Fisheries, Tasmania.
Young, J. W. and Davis, T. L. O. (1992). Feeding ecology, and interannual variations in
diet of larval jack mackerel, Trachurus declivis (Pisces: Carangidae) from coastal waters of eastern Tasmania. Marine Biology 113, 11-20.
Young, J. W, Jordan, A. R., Bobbi, C., Johannes, R. E., Haskard, K. and Pullen, G.
(1993). Seasonal and interannual variability in krill (Nyctiphanes australis) stocks and their relationship to the fishery for jack mackerel (Trachurus declivis) off eastern Tasmania, Australia. Marine Biology 116, 9-18.
Young, J. W., Lamb, T. D., Le, D., Bradford, R., Whitelaw, A. W. (1997) Feeding
ecology and interannual variations in diet of southern bluefin tuna, Thunnus maccoyii, in relation to coastal and oceanic waters off eastern Tasmania, Australia. Environmental Biology of Fishes 50: 275-291.
General Methodology References Fletcher, W. (2005) The application of qualitative risk assessment methodology to
prioritize issues for fisheries management. ICES Journal of Marine Science 62:1576-1587.
Fletcher, W. J., Chesson, J., Fisher, M., Sainsbury, K. J., Hundloe, T., Smith, A.D.M.
and Whitworth, B. 2002. National ESD reporting framework for Australian Fisheries: The how to guide for wild capture fisheries. FRDC Report 2000/145, Canberra, Australia.
Hobday, A. J., A. Smith and I. Stobutzki (2004). Ecological risk Assessment for
Australian Commonwealth Fisheries. Final Report Stage 1. Hazard identification and preliminary risk assessment. Report Number R01/0934, CSIRO Marine Research.

References
142
Stobutzki, I., Miller, M., Brewer, D., 2001. Sustainability of fishery bycatch: a process for assessing highly diverse and numerous bycatch. Environmental Conservation 28, 167-181.
Walker, T. (2004). Elasmobranch fisheries management techniques. Chapter 13.
Management measures. Technical manual for the management of elasmobranchs. J. A. Musick and R. Bonfil, Asia Pacific Economic Cooperation: (in press).
Species Methodology References Bax, N. J. and Knuckey, I. 1996. Evaluation of selectivity in the South-East fishery to
determine its sustainable yield. Final Report to the Fisheries Development Corporation. Project 1996/40.
Daley, R. K., last, P. R., Yearsley, G. K. and Ward, R. D. 1997. South East Fishery
Quota Species – an Identification Guide. (CSIRO Division of Marine Research, Hobart.) 91 pp.
Gomon, M. F., Glover, J. C. M. and Kuiter, R. H. (Eds.) 1994. The Fishes of Australia’s
South Coast. (State Print, Adelaide.) 992 pp. Last, P., V. Lyne, G. Yearsley, D. Gledhill, M. Gomon, T. Rees and W. White. (2005).
Validation of national demersal fish datasets for the regionalisation of the Australian continental slope and outer shelf (>40 m depth). Final Report to the National Oceans Office. (National Oceans Office, Hobart.) 99pp.
Milton, D. A. 2000. Assessing the susceptibility to fishing of rare trawl bycatch: sea
snakes caught by Australia’s Northern Prawn Fishery. Biological Conservation. 101: 281 – 290.
Walker, T. I., Hudson, R. J. and Gason, A. S. 2005. Catch evaluation of target,
byproduct and bycatch species taken by gillnets and longlines in the shark fishery of south-eastern Australia. Journal of Northwest Atlantic Fisheries Science 35: 505 – 530.
Yearsley, G. K., Last, P. R. and Ward, R. D. 1999. Australian Seafood Handbook –
Domestic species. (CSIRO Marine Research, Hobart.) 461 pp. Habitat Methodology References Althaus F.A. and Barker B. 2005. Lab Guide to Habitat scoring (unpublished). Bax N., Kloser R., Williams A., Gowlett-Holmes K., Ryan T. 1999. Seafloor habitat
definition for spatial management in fisheries: a case study on the continental shelf of southeast Australia. Oceanologica Acta 22: 705-719.

References
143
Bax N. and Williams A. 2001. Seabed habitat on the south-eastern Australian continental shelf: context, vulnerability and monitoring. Marine and Freshwater Research 52: 491-512.
Bulman C., Sporcic M., Dambacher J. 2005 (in prep). Ecological Risk Assessment for
Communities Methodology Report. Commonwealth of Australia 2005. National Marine Bioregionalisation of Australia.
Summary. (Department of Environment and Heritage, Canberra, Australia.) Greene H.G., Yoklavich M.M., Starr R.M., O’Connell V.E., Wakefield W.W., Sullivan
D.E., McRea J.E. Jr., Cailliet G.M. 1999. A classification scheme for deep seafloor habitats. Oceanologica Acta 22: 663-678.
Heap A.D., Harris P.T., Last P., Lyne V., Hinde A., Woods M. 2005. Draft Benthic
Marine Bioregionalisation of Australia’s Exclusive Economic Zone. Geoscience Australia Report to the National Oceans Office. (Geoscience Australia, Canberra.)
Harris P., Heap A.D., Passlow V., Sbaffi L., Fellows M., Porter-Smith R., Buchanan C.,
Daniell J (2003). Geomorphic Features of the Continental Margin of Australia. (Geoscience Australia, Canberra.)
Kloser R., Williams A., Butler A. 2000. Assessment of Acoustic Mapping of Seabed
Habitats: Phase 1 Surveys April-June 2000, Progress Report 1. Marine Biological and Resource Surveys South-East Region.
Kostylev V.E., Todd B.J., Fader G.B.J., Courtney R.C., Cameron G.D.M., Pickrill R.A.
2001. Benthic habitat mapping on the Scotian Shelf based on multibeam bathymetry, surficial geology and sea floor photographs. Marine Ecology Progress Series 219: 121-137.
Roff J.C., and Taylor M.E. 2000. National Frameworks for marine conservation – a
hierarchical geophysical approach. Aquatic Conservation: Marine and Freshwater Ecosystems 10: 209- 223
Community Methodology References Condie, S., Ridgway, K., Griffiths, B., Rintoul, S. and Dunn, J. (2003). National
Oceanographic Description and Information Review for National Bioregionalisation. Report for National Oceans Office.(CSIRO Marine Research: Hobart, Tasmania, Australia.)
Interim Marine and Coastal Regionalisation for Australia Technical Group (1998).
Interim Marine and Coastal Regionalisation for Australia: an ecosystem-based classification for marine and coastal environments. Version 3.3 (Environment Australia, Commonwealth Department of the Environment: Canberra, Australia.)

References
144
Last, P., Lyne, V., Yearsley, G., Gledhill, D., Gomon, M., Rees, T., and White, W. (2005). Validation of national demersal fish datasets for the regionalisation of the Australian continental slope and outer shelf (>40m depth). (National Oceans Office, Department of Environment and Heritage and CSIRO Marine Research, Australia.)
Lyne, V. and Hayes, D. (2004). Pelagic Regionalisation. National Marine
Bioregionalisation Integration Project. 137 pp. (CSIRO Marine Research and NOO: Hobart, Australia.)
Meyer, L., Constable, A. and Williams, R. (2000). Conservation of marine habitats in
the region of Heard Island and McDonald Islands. Final Report to Environment Australia. (Australian Antarctic Division, Kingston, Tasmania.)
Rees, A.J.J., Yearsley, G.K., and Gowlett-Holmes, K. (2005). Codes for Australian
Aquatic Biota (on-line version). CSIRO Marine Research, World Wide Web electronic publication, 1999 onwards. Available at: http://www.marine.csiro.au/caab/

Glossary
145
Glossary of Terms Assemblage A subset of the species in the community that can be
easily recognized and studied. For example, the set of sharks and rays in a community is the Chondrichthyan assemblage.
Attribute A general term for a set of properties relating to the productivity or susceptibility of a particular unit of analysis.
Bycatch species A non-target species captured in a fishery, usually of low value and often discarded (see also Byproduct).
Byproduct species A non-target species captured in a fishery, but it may have value to the fisher and be retained for sale.
Community A complete set of interacting species. Component A major area of relevance to fisheries with regard to
ecological risk assessment (e.g. target species, bycatch and byproduct species, threatened and endangered species, habitats, and communities).
Component model A conceptual description of the impacts of fishing activities (hazards) on components and sub-components, linked through the processes and resources that determine the level of a component.
Consequence The effect of an activity on achieving the operational objective for a sub-component.
Core objective The overall aim of management for a component. End point A term used in risk assessment to denote the object of the
assessment; equivalent to component or sub-component in ERAEF
Ecosystem The spatially explicit association of abiotic and biotic elements within which there is a flow of resources, such as nutrients, biomass or energy (Crooks, 2002).
External factor Factors other than fishing that affect achievement of operational objectives for components and sub-components.
Fishery method A technique or set of equipment used to harvest fish in a fishery (e.g. long-lining, purse-seining, trawling).
Fishery A related set of fish harvesting activities regulated by an authority (e.g. South-East Trawl Fishery).
Habitat The place where fauna or flora complete all or a portion of their life cycle.
Hazard identification The identification of activities (hazards) that may impact the components of interest.
Indicator Used to monitor the effect of an activity on a sub-component. An indicator is something that can be measured, such as biomass or abundance.
Likelihood The chance that a sub-component will be affected by an activity.

Glossary
146
Operational objective A measurable objective for a component or sub-component (typically expressed as “the level of X does not fall outside acceptable bounds”)
Precautionary approach The approach whereby, if there is uncertainty about the outcome of an action, the benefit of the doubt should be given to the biological entity (such as species, habitat or community).
PSA Productivity-Susceptibility Analysis. Used at Level 2 in the ERAEF methodology.
Scoping A general step in an ERA or the first step in the ERAEF involving the identification of the fishery history, management, methods, scope and activities.
SICA Scale, Impact, Consequence Analysis. Used at Level 1 in the ERAEF methodology.
Sub-component A more detailed aspect of a component. For example, within the target species component, the sub-components include the population size, geographic range, and the age/size/sex structure.
Sub-fishery A subdivision of the fishery on the basis of the gear or areal extent of the fishery. Ecological risk is assessed separately for each sub-fishery within a fishery.
Sustainability Ability to be maintained indefinitely Target species A species or group of species whose capture is the goal of
a fishery, sub-fishery, or fishing operation. Trophic position Location of an individual organism or species within a
food web. Unit of analysis The entities for which attributes are scored in the Level 2
analysis. For example, the units of analysis for the Target Species component are individual “species”, while for Habitats, they are “biotypes”, and for Communities the units are “assemblages”.

Appendices
147
Appendix A: General summary of stakeholder feedback Date Format received Comment from stakeholder Action/explanation Sept 28 2006
Written comment 1 from AFMA specific to midwater trawl
The group questioned the species lists and the roles and where this information has come from.
Action MWT1 Explanation: BRS, AFMA, DEH. Details given on a species by species basis in scoping documents
Sept 28 2006
Written comment 2 from AFMA
There are more discards. The report indicates that there are 2. Ocean sunfish is not a by-product it is a discard. The are also ~4-5 shark species
Explanation: See MWT1. Would be prepared to consider adding additional species if supporting data or sources could be provided Action 2: Role for sunfish changed
Sept 28 2006
Written comment 3 from AFMA specific to midwater trawl
Report refers to redbait as the only target species. This is not true. It has not been targeted for years. There is actually more, Jack Mackerel, blue mackerel
Action MWT3: Five observer reports from the 2005 fishery were reviewed that give redbait as the only target species. Not e added that there is some targeting of other species
Sept 28 2006
Written comment 4 from AFMA specific to midwater trawl
Lot of observer data for the midwater trawl – why so many TEP still high?
Action MWT4: Explanation: The report considers 218 TEP species. Observer over-rides have reduced the scores for most of these. One or two of the dolphin and one of the seal species have been captured in the fishery. There are about 20 other species of dolphins and beaked whales that potentially could interact with the fishery in the same way because they have similar size, morphology and are likely to be attracted to schools of small fish. For this reason, over-rides were not applied to some species of small cetaceans. For birds - see below
Sept 28 2006
Written comment 5 from AFMA
Why 3 birds remaining when all others removed? Action MWT 5: Explained in the summary and discussion
Sept 28 2006
Written general comment 1 from AFMA on SPF
Check for grammatical errors and readability. Eg Scoping doc S1 General Fishery characteristics under “How gear is set” gear is spelt gar. Under Community issues and interactions it says “The fishery has removed34 k t of redbait. This unit requires fixing.
Action G1: Document checked.’gar’ changed to gear. 34 K t of redbait replaced with 34,000 t redbait. Spelling/grammatical checked and corrected as appropriate
Sept 28 2006
Written general comment 2 from AFMA on SPF
Why are slipper lobsters in the assessment? ActionG2: See deleted taxa and Action MWT1 (top of table)
Sept 28 2006
Written general comment 3 from AFMA on SPF
The results do not pick up on seasonal variations or diurnal migrations. This should be included somewhere to put fishery into context.
No Action G3: Assessment of temporal variation is part of level 3 assessment process
Sept 28 Written general Blue Mackerel attributes not correct No action G4: No alternative values or sources provided.
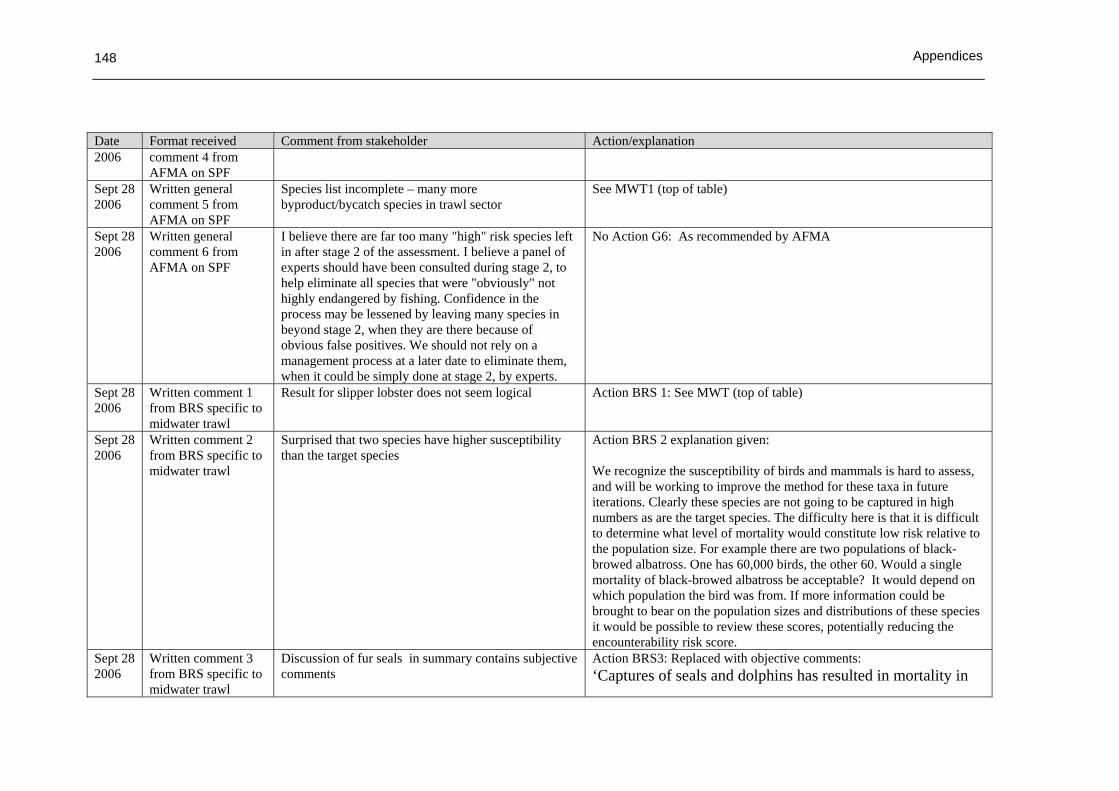
Appendices
148
Date Format received Comment from stakeholder Action/explanation 2006 comment 4 from
AFMA on SPF Sept 28 2006
Written general comment 5 from AFMA on SPF
Species list incomplete – many more byproduct/bycatch species in trawl sector
See MWT1 (top of table)
Sept 28 2006
Written general comment 6 from AFMA on SPF
I believe there are far too many "high" risk species left in after stage 2 of the assessment. I believe a panel of experts should have been consulted during stage 2, to help eliminate all species that were "obviously" not highly endangered by fishing. Confidence in the process may be lessened by leaving many species in beyond stage 2, when they are there because of obvious false positives. We should not rely on a management process at a later date to eliminate them, when it could be simply done at stage 2, by experts.
No Action G6: As recommended by AFMA
Sept 28 2006
Written comment 1 from BRS specific to midwater trawl
Result for slipper lobster does not seem logical Action BRS 1: See MWT (top of table)
Sept 28 2006
Written comment 2 from BRS specific to midwater trawl
Surprised that two species have higher susceptibility than the target species
Action BRS 2 explanation given: We recognize the susceptibility of birds and mammals is hard to assess, and will be working to improve the method for these taxa in future iterations. Clearly these species are not going to be captured in high numbers as are the target species. The difficulty here is that it is difficult to determine what level of mortality would constitute low risk relative to the population size. For example there are two populations of black-browed albatross. One has 60,000 birds, the other 60. Would a single mortality of black-browed albatross be acceptable? It would depend on which population the bird was from. If more information could be brought to bear on the population sizes and distributions of these species it would be possible to review these scores, potentially reducing the encounterability risk score.
Sept 28 2006
Written comment 3 from BRS specific to midwater trawl
Discussion of fur seals in summary contains subjective comments
Action BRS3: Replaced with objective comments: ‘Captures of seals and dolphins has resulted in mortality in
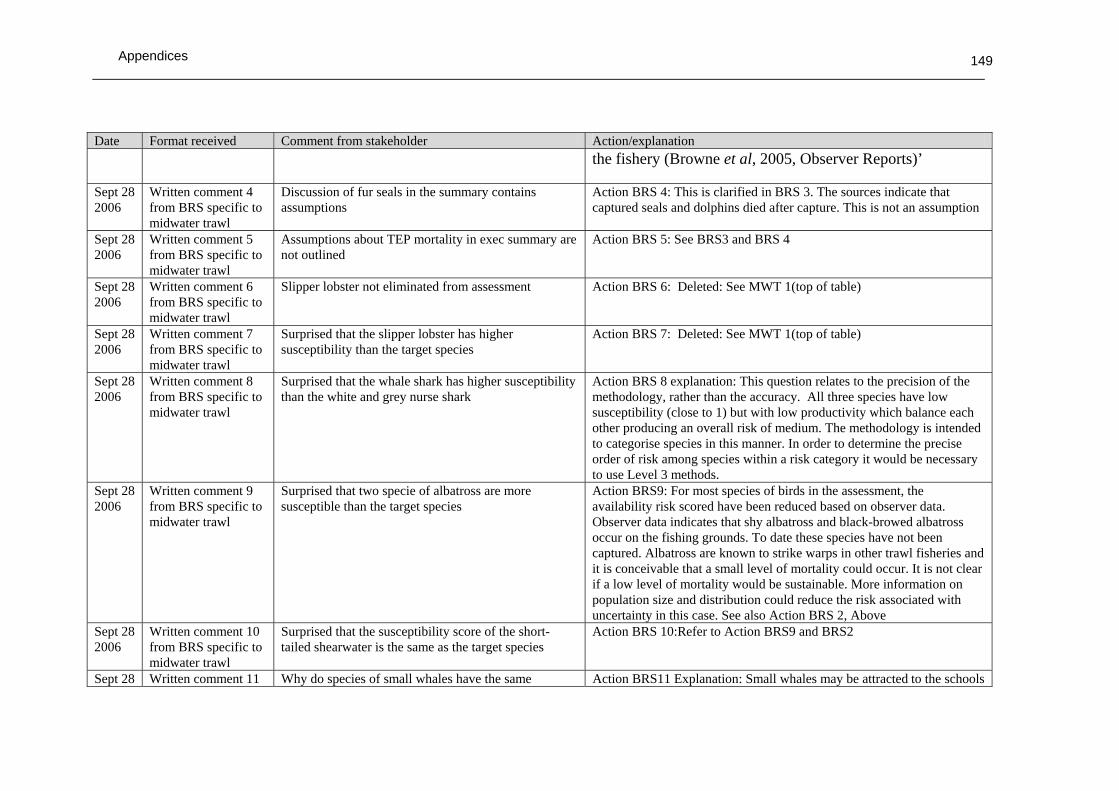
Appendices
149
Date Format received Comment from stakeholder Action/explanation the fishery (Browne et al, 2005, Observer Reports)’
Sept 28 2006
Written comment 4 from BRS specific to midwater trawl
Discussion of fur seals in the summary contains assumptions
Action BRS 4: This is clarified in BRS 3. The sources indicate that captured seals and dolphins died after capture. This is not an assumption
Sept 28 2006
Written comment 5 from BRS specific to midwater trawl
Assumptions about TEP mortality in exec summary are not outlined
Action BRS 5: See BRS3 and BRS 4
Sept 28 2006
Written comment 6 from BRS specific to midwater trawl
Slipper lobster not eliminated from assessment Action BRS 6: Deleted: See MWT 1(top of table)
Sept 28 2006
Written comment 7 from BRS specific to midwater trawl
Surprised that the slipper lobster has higher susceptibility than the target species
Action BRS 7: Deleted: See MWT 1(top of table)
Sept 28 2006
Written comment 8 from BRS specific to midwater trawl
Surprised that the whale shark has higher susceptibility than the white and grey nurse shark
Action BRS 8 explanation: This question relates to the precision of the methodology, rather than the accuracy. All three species have low susceptibility (close to 1) but with low productivity which balance each other producing an overall risk of medium. The methodology is intended to categorise species in this manner. In order to determine the precise order of risk among species within a risk category it would be necessary to use Level 3 methods.
Sept 28 2006
Written comment 9 from BRS specific to midwater trawl
Surprised that two specie of albatross are more susceptible than the target species
Action BRS9: For most species of birds in the assessment, the availability risk scored have been reduced based on observer data. Observer data indicates that shy albatross and black-browed albatross occur on the fishing grounds. To date these species have not been captured. Albatross are known to strike warps in other trawl fisheries and it is conceivable that a small level of mortality could occur. It is not clear if a low level of mortality would be sustainable. More information on population size and distribution could reduce the risk associated with uncertainty in this case. See also Action BRS 2, Above
Sept 28 2006
Written comment 10 from BRS specific to midwater trawl
Surprised that the susceptibility score of the short-tailed shearwater is the same as the target species
Action BRS 10:Refer to Action BRS9 and BRS2
Sept 28 Written comment 11 Why do species of small whales have the same Action BRS11 Explanation: Small whales may be attracted to the schools

Appendices
150
Date Format received Comment from stakeholder Action/explanation 2006 from BRS specific to
midwater trawl susceptibility as the target species of bait fish being targeted – as noted in the discussion which is cross
referenced to Level 3 references. Sept 28 2006
Written comment 12 from BRS specific to midwater trawl
Why does the dugong have a susceptibility score of 1.2 Action BRS12 Explanation: This is a tropical species. The lowest possible susceptibility score is 1. There is no current effort in the tropics, hence the score is close to the minimum
Sept 28 2006
Written comment 13 from BRS specific to midwater trawl
Is the susceptibility of the blue whale realistic Action BRS13 Explanation: The susceptibility score was 1.07 which is close to the minimum score of 1. This score is relative and can not be zero or less than one. A medium risk score overall. Low productivity prevents it from having a low overall score
Sept 28 2006
Written comment 14 from BRS specific to midwater trawl
Is the leathery turtle really as susceptible as the target species
Action BRS14 Explanation: Most of the turtles examined had lower encounterability scores than the target species because they are restricted to the inner shelf whereas effort is in deeper waters. The leathery turtle is distributed from the inner shelf to oceanic waters. This turtle does dive into the water column but is unlikely spend as much time there as the target species. Application of expert knowledge could probably eliminate risk associated with uncertainty in this case to reduce the risk score
Sept 28 2006
Written comment 15 from BRS specific to midwater trawl
How can five species of seahorse have the same susceptibility as the target species
Action BRS15 Explanation: It could be assumed that seahorses only occur in shallow water and that mid-water gear never contacts the bottom. In fact some seahorses occur as deep as 180 m and observer data indicates the gear does contact the bottom, as does the capture of benthic species including flathead. Such assumptions are avoided in the assessment. However, with clarification of the species captured in the fishery and the frequency of interaction with the bottom the risk scores of a number of species could be reduced without making assumptions.
Sept 28 2006
Written comment 16 from BRS specific to midwater trawl
Concerns that the susceptibility criteria are not working properly in the case of the mid-water fishery
Action BRS16 Explanation: This issue is confounded by the original inclusion of slipper lobster in the AFMA data - see G2 and MWT1
Sept 28 2006
Written comment 17 from BRS specific to midwater trawl
There is a need for decision rules to determine when observer information is included in susceptibility or overrides
Action BRS17 Explanation: Decision rules are outlined in the methodology. Observer coverage is described in General Fishery Characteristics
Sept 28 2006
Written comment 18 from BRS -MWT
Repeats 17 except that it relates specifically to birds Action BRS17 Explanation: Refer to Action BRS17

Appendices
151
Appendix B: PSA results summary of stakeholder discussions Level 2 (PSA) Document L2.1. Summary table of stakeholder discussion regarding PSA results.
The following species were discussed at the Small Pelagic Fishery meeting on INSERT DATE and LOCATION. Selected high risk species were discussed. Taxa name
Scientific name
Common name
Role in fishery
PSA risk ranking (H/M/L)
Comments from meeting, and follow-up
Action Outcome Possible management response

Appendices
152
Appendix C: SICA consequence scores for ecological components Table 5A. Target Species. Description of consequences for each component and each sub-component. Use table as a guide for scoring the level of consequence for target species (Modified from Fletcher et al. 2002)
Score/level Sub-component 1
Negligible 2 Minor
3 Moderate
4 Major
5 Severe
6 Intolerable
Population size 1. Population size Insignificant change to population size/growth rate (r). Unlikely to be detectable against background variability for this population.
1. Population size Possible detectable change in size/growth rate (r) but minimal impact on population size and none on dynamics.
1. Population size Full exploitation rate but long-term recruitment dynamics not adversely damaged.
1. Population size Affecting recruitment state of stocks and/or their capacity to increase
1. Population size Likely to cause local extinctions if continued in longer term
1. Population size Local extinctions are imminent/immediate
Geographic range 2. Geographic range No detectable change in geographic range. Unlikely to be detectable against background variability for this population.
2. Geographic range Possible detectable change in geographic range but minimal impact on population range and none on dynamics, change in geographic range up to 5 % of original.
2. Geographic range Change in geographic range up to 10 % of original.
2. Geographic range Change in geographic range up to 25 % of original.
2. Geographic range Change in geographic range up to 50 % of original.
2. Geographic range Change in geographic range > 50 % of original.
Genetic structure 3. Genetic structure No detectable change in genetic structure. Unlikely to be detectable against background variability for this population.
3. Genetic structure Possible detectable change in genetic structure. Any change in frequency of genotypes, effective population size or number of spawning units up to
3. Genetic structure Change in frequency of genotypes, effective population size or number of spawning units up to 10%.
3. Genetic structure Change in frequency of genotypes, effective population size or number of spawning units up to 25%.
3. Genetic structure Change in frequency of genotypes, effective population size or number of spawning units, change up to 50%.
3. Genetic structure Change in frequency of genotypes, effective population size or number of spawning units > 50%.

Appendices
153
Score/level Sub-component 1
Negligible 2 Minor
3 Moderate
4 Major
5 Severe
6 Intolerable
5%. Age/size/sex structure 4. Age/size/sex
structure No detectable change in age/size/sex structure. Unlikely to be detectable against background variability for this population.
4. Age/size/sex structure Possible detectable change in age/size/sex structure but minimal impact on population dynamics.
4. Age/size/sex structure Impact on population dynamics at maximum sustainable level, long-term recruitment dynamics not adversely affected.
4. Age/size/sex structure Long-term recruitment dynamics adversely affected. Time to recover to original structure up to 5 generations free from impact.
4. Age/size/sex structure Long-term recruitment dynamics adversely affected. Time to recover to original structure up to 10 generations free from impact.
4. Age/size/sex structure Long-term recruitment dynamics adversely affected. Time to recover to original structure > 100 generations free from impact.
Reproductive capacity 5. Reproductive capacity No detectable change in reproductive capacity. Unlikely to be detectable against background variability for this population.
5. Reproductive capacity Possible detectable change in reproductive capacity but minimal impact on population dynamics.
5. Reproductive capacity Impact on population dynamics at maximum sustainable level, long-term recruitment dynamics not adversely affected.
5. Reproductive capacity Change in reproductive capacity adversely affecting long-term recruitment dynamics. Time to recovery up to 5 generations free from impact.
5. Reproductive capacity Change in reproductive capacity adversely affecting long-term recruitment dynamics. Time to recovery up to 10 generations free from impact.
5. Reproductive capacity Change in reproductive capacity adversely affecting long-term recruitment dynamics. Time to recovery > 100 generations free from impact.
Behaviour/movement 6. Behaviour/ movement No detectable change in behaviour/ movement. Unlikely to be detectable against background variability for this population. Time taken to recover to pre-disturbed state on the scale of hours.
6. Behaviour/ movement Possible detectable change in behaviour/ movement but minimal impact on population dynamics. Time to return to original behaviour/ movement on the scale of days to weeks.
6. Behaviour/ movement Detectable change in behaviour/ movement with the potential for some impact on population dynamics. Time to return to original behaviour/ movement on the scale of weeks to months.
6. Behaviour/ movement Change in behaviour/ movement with impacts on population dynamics. Time to return to original behaviour/ movement on the scale of months to years.
6. Behaviour/ movement Change in behaviour/ movement with impacts on population dynamics. Time to return to original behaviour/ movement on the scale of years to decades.
6. Behaviour/ movement Change to behaviour/ movement. Population does not return to original behaviour/ movement.

Appendices
154

Appendices
155
Table 5B. Bycatch and Byproduct species. Description of consequences for each component and each sub-component. Use table as a guide for scoring the level of consequence for bycatch/byproduct species (Modified from Fletcher et al. 2002)
Score/level Sub-component 1
Negligible 2 Minor
3 Moderate
4 Major
5 Severe
6 Intolerable
Population size 1. Population size Insignificant change to population size/growth rate (r). Unlikely to be detectable against background variability for this population.
1. Population size Possible detectable change in size/growth rate (r) but minimal impact on population size and none on dynamics.
1. Population size No information is available on the relative area or susceptibility to capture/ impact or on the vulnerability of life history traits of this type of species Susceptibility to capture is suspected to be less than 50% and species do not have vulnerable life history traits. For species with vulnerable life history traits to stay in this category susceptibility to capture must be less than 25%.
1. Population size Relative state of capture/susceptibility suspected/known to be greater than 50% and species should be examined explicitly.
1. Population size Likely to cause local extinctions if continued in longer term
1. Population size Local extinctions are imminent/immediate
Geographic range 2. Geographic range No detectable change in geographic range. Unlikely to be detectable against background variability for this
2. Geographic range Possible detectable change in geographic range but minimal impact on population range and none on dynamics, change in
2. Geographic range Change in geographic range up to 10 % of original.
2. Geographic range Change in geographic range up to 25 % of original.
2. Geographic range Change in geographic range up to 50 % of original.
2. Geographic range Change in geographic range > 50 % of original.

Appendices
156
Score/level Sub-component 1
Negligible 2 Minor
3 Moderate
4 Major
5 Severe
6 Intolerable
population. geographic range up to 5 % of original.
Genetic structure 3. Genetic structure No detectable change in genetic structure. Unlikely to be detectable against background variability for this population.
3. Genetic structure Possible detectable change in genetic structure. Any change in frequency of genotypes, effective population size or number of spawning units up to 5%.
3. Genetic structure Detectable change in genetic structure. Change in frequency of genotypes, effective population size or number of spawning units up to 10%.
3. Genetic structure Change in frequency of genotypes, effective population size or number of spawning units up to 25%.
3. Genetic structure Change in frequency of genotypes, effective population size or number of spawning units up to 50%.
3. Genetic structure Change in frequency of genotypes, effective population size or number of spawning units > 50%.
Age/size/sex structure 4. Age/size/sex structure No detectable change in age/size/sex structure. Unlikely to be detectable against background variability for this population.
4. Age/size/sex structure Possible detectable change in age/size/sex structure but minimal impact on population dynamics.
4. Age/size/sex structure Detectable change in age/size/sex structure. Impact on population dynamics at maximum sustainable level, long-term recruitment dynamics not adversely damaged.
4. Age/size/sex structure Long-term recruitment dynamics adversely affected. Time to recover to original structure up to 5 generations free from impact.
4. Age/size/sex structure Long-term recruitment dynamics adversely affected. Time to recover to original structure up to 10 generations free from impact.
4. Age/size/sex structure Long-term recruitment dynamics adversely affected. Time to recover to original structure > 100 generations free from impact.
Reproductive capacity 5. Reproductive capacity No detectable change in reproductive capacity. Unlikely to be detectable against background variability for this population.
5. Reproductive capacity Possible detectable change in reproductive capacity but minimal impact on population dynamics.
5. Reproductive capacity Detectable change in reproductive capacity, impact on population dynamics at maximum sustainable level, long-term
5. Reproductive capacity Change in reproductive capacity adversely affecting long-term recruitment dynamics. Time to recovery up to 5 generations free from
5. Reproductive capacity Change in reproductive capacity adversely affecting long-term recruitment dynamics. Time to recovery up to 10
5. Reproductive capacity Change in reproductive capacity adversely affecting long-term recruitment dynamics. Time to recovery > 100 generations free from impact.
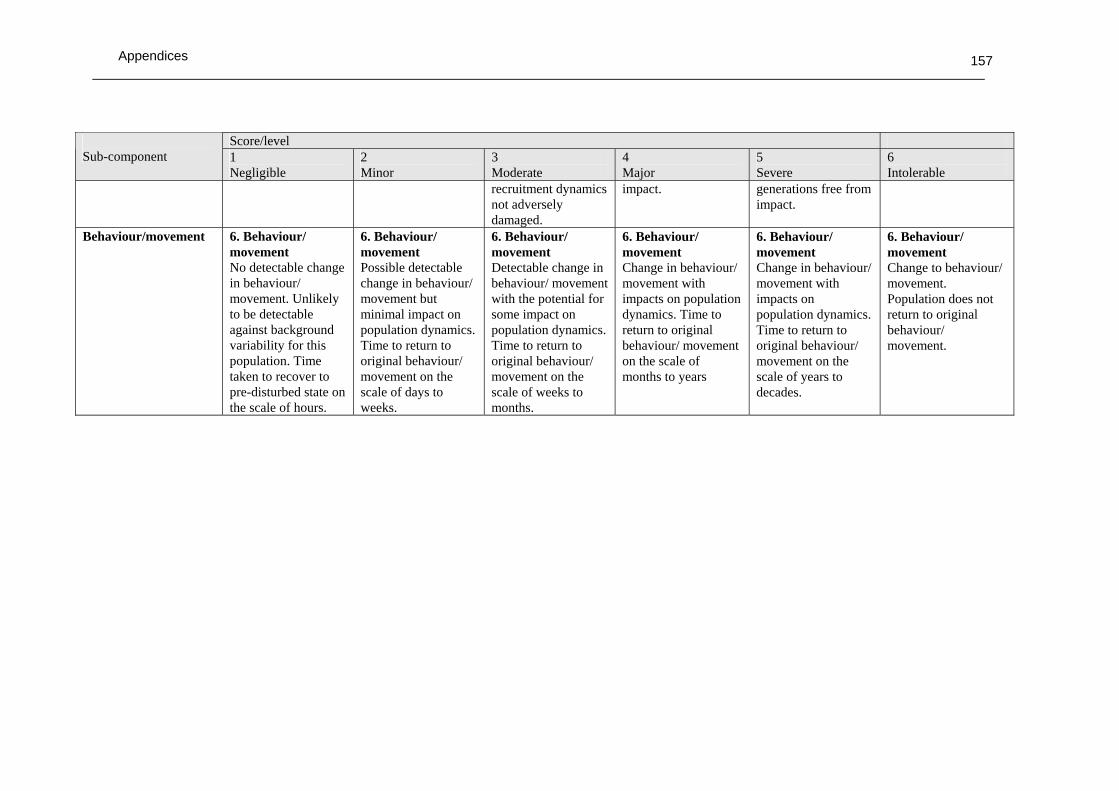
Appendices
157
Score/level Sub-component 1
Negligible 2 Minor
3 Moderate
4 Major
5 Severe
6 Intolerable
recruitment dynamics not adversely damaged.
impact. generations free from impact.
Behaviour/movement 6. Behaviour/ movement No detectable change in behaviour/ movement. Unlikely to be detectable against background variability for this population. Time taken to recover to pre-disturbed state on the scale of hours.
6. Behaviour/ movement Possible detectable change in behaviour/ movement but minimal impact on population dynamics. Time to return to original behaviour/ movement on the scale of days to weeks.
6. Behaviour/ movement Detectable change in behaviour/ movement with the potential for some impact on population dynamics. Time to return to original behaviour/ movement on the scale of weeks to months.
6. Behaviour/ movement Change in behaviour/ movement with impacts on population dynamics. Time to return to original behaviour/ movement on the scale of months to years
6. Behaviour/ movement Change in behaviour/ movement with impacts on population dynamics. Time to return to original behaviour/ movement on the scale of years to decades.
6. Behaviour/ movement Change to behaviour/ movement. Population does not return to original behaviour/ movement.
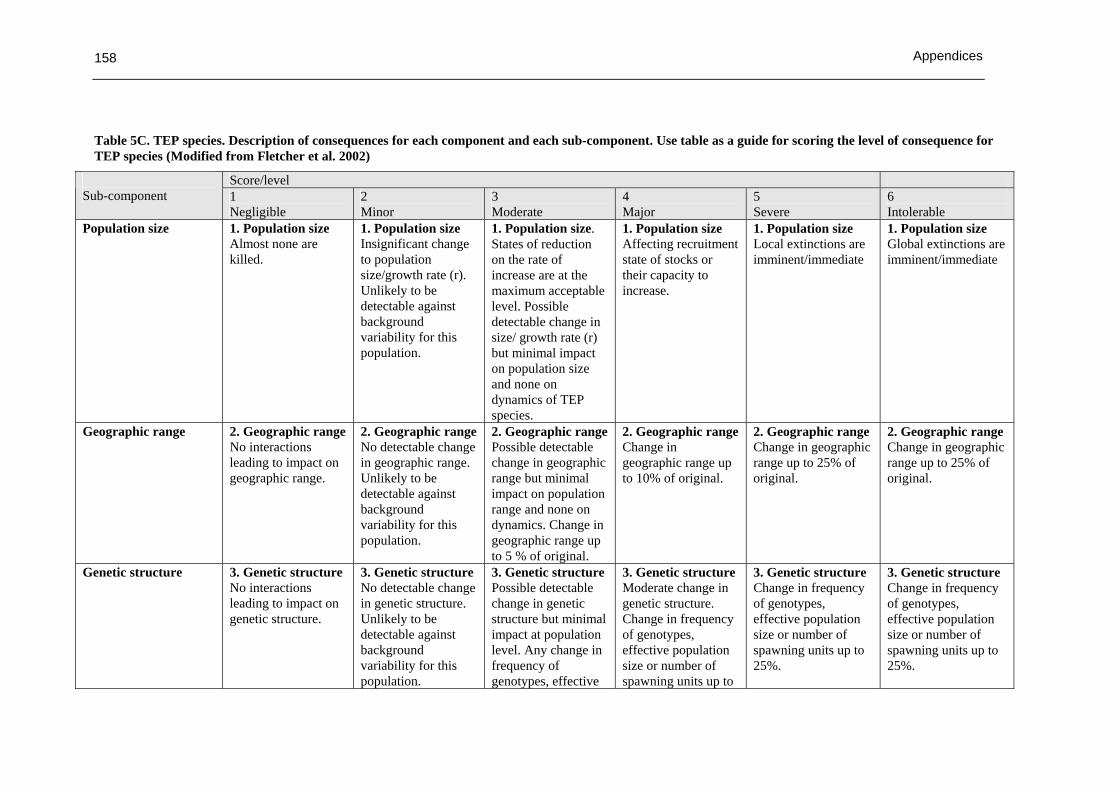
Appendices
158
Table 5C. TEP species. Description of consequences for each component and each sub-component. Use table as a guide for scoring the level of consequence for TEP species (Modified from Fletcher et al. 2002)
Score/level Sub-component 1
Negligible 2 Minor
3 Moderate
4 Major
5 Severe
6 Intolerable
Population size 1. Population size Almost none are killed.
1. Population size Insignificant change to population size/growth rate (r). Unlikely to be detectable against background variability for this population.
1. Population size. States of reduction on the rate of increase are at the maximum acceptable level. Possible detectable change in size/ growth rate (r) but minimal impact on population size and none on dynamics of TEP species.
1. Population size Affecting recruitment state of stocks or their capacity to increase.
1. Population size Local extinctions are imminent/immediate
1. Population size Global extinctions are imminent/immediate
Geographic range 2. Geographic range No interactions leading to impact on geographic range.
2. Geographic range No detectable change in geographic range. Unlikely to be detectable against background variability for this population.
2. Geographic range Possible detectable change in geographic range but minimal impact on population range and none on dynamics. Change in geographic range up to 5 % of original.
2. Geographic range Change in geographic range up to 10% of original.
2. Geographic range Change in geographic range up to 25% of original.
2. Geographic range Change in geographic range up to 25% of original.
Genetic structure 3. Genetic structure No interactions leading to impact on genetic structure.
3. Genetic structure No detectable change in genetic structure. Unlikely to be detectable against background variability for this population.
3. Genetic structure Possible detectable change in genetic structure but minimal impact at population level. Any change in frequency of genotypes, effective
3. Genetic structure Moderate change in genetic structure. Change in frequency of genotypes, effective population size or number of spawning units up to
3. Genetic structure Change in frequency of genotypes, effective population size or number of spawning units up to 25%.
3. Genetic structure Change in frequency of genotypes, effective population size or number of spawning units up to 25%.

Appendices
159
Score/level Sub-component 1
Negligible 2 Minor
3 Moderate
4 Major
5 Severe
6 Intolerable
population size or number of spawning units up to 5%.
10%.
Age/size/sex structure 4. Age/size/sex structure No interactions leading to change in age/size/sex structure.
4. Age/size/sex structure No detectable change in age/size/sex structure. Unlikely to be detectable against background variability for this population.
4. Age/size/sex structure Possible detectable change in age/size/sex structure but minimal impact on population dynamics.
4. Age/size/sex structure Detectable change in age/size/sex structure. Impact on population dynamics at maximum sustainable level, long-term recruitment dynamics not adversely damaged.
4. Age/size/sex structure Severe change in age/size/sex structure. Impact adversely affecting population dynamics. Time to recover to original structure up to 5 generations free from impact
4. Age/size/sex structure Impact adversely affecting population dynamics. Time to recover to original structure > 10 generations free from impact
Reproductive capacity 5. Reproductive capacity No interactions resulting in change to reproductive capacity.
5. Reproductive capacity No detectable change in reproductive capacity. Unlikely to be detectable against background variability for this population.
5. Reproductive capacity Possible detectable change in reproductive capacity but minimal impact on population dynamics.
5. Reproductive capacity Detectable change in reproductive capacity, impact on population dynamics at maximum sustainable level, long-term recruitment dynamics not adversely damaged.
5. Reproductive capacity Change in reproductive capacity, impact adversely affecting recruitment dynamics. Time to recover to original structure up to 5 generations free from impact
5. Reproductive capacity Change in reproductive capacity, impact adversely affecting recruitment dynamics. Time to recover to original structure > 10 generations free from impact
Behaviour/movement 6. Behaviour/ movement No interactions resulting in change to behaviour/ movement.
6. Behaviour/ movement No detectable change in behaviour/ movement. Time to return to original
6. Behaviour/ movement Possible detectable change in behaviour/ movement but minimal impact on
6. Behaviour/ movement Detectable change in behaviour/ movement with the potential for some impact on
6. Behaviour/ movement Change in behaviour/ movement, impact adversely affecting population dynamics.
6. Behaviour/ movement Change in behaviour/ movement. Impact adversely affecting population dynamics.

Appendices
160
Score/level Sub-component 1
Negligible 2 Minor
3 Moderate
4 Major
5 Severe
6 Intolerable
behaviour/ movement on the scale of hours.
population dynamics. Time to return to original behaviour/ movement on the scale of days to weeks
population dynamics. Time to return to original behaviour/ movement on the scale of weeks to months
Time to return to original behaviour/ movement on the scale of months to years.
Time to return to original behaviour/ movement on the scale of years to decades.
Interaction with fishery
7. Interactions with fishery No interactions with fishery.
7. Interactions with fishery Few interactions and involving up to 5% of population.
7. Interactions with fishery Moderate level of interactions with fishery involving up to10 % of population.
7. Interactions with fishery Major interactions with fishery, interactions and involving up to 25% of population.
7. Interactions with fishery Frequent interactions involving ~ 50% of population.
7. Interactions with fishery Frequent interactions involving the entire known population negatively affecting the viability of the population.

Appendices
161
Table 5D. Habitats. Description of consequences for each component and each sub-component. Use table as a guide for scoring the level of consequence for habitats. Note that for sub-components Habitat types and Habitat structure and function, time to recover from impact scales differ from substrate, water and air. Rationale: structural elements operate on greater timeframes to return to pre-disturbance states (Modified from Fletcher et al. 2002)
Score/level Sub-component 1
Negligible 2
Minor 3
Moderate 4
Major 5
Severe 6
Intolerable Substrate quality 1. Substrate quality
Reduction in the productivity (similar to the intrinsic rate of increase for species) on the substrate from the activity is unlikely to be detectable. Time taken to recover to pre-disturbed state on the scale of hours.
1. Substrate quality Detectable impact on substrate quality. At small spatial scale time taken to recover to pre-disturbed state on the scale of days to weeks, at larger spatial scales recovery time of hours to days.
1. Substrate quality More widespread effects on the dynamics of substrate quality but the state are still considered acceptable given the percent area affected, the types of impact occurring and the recovery capacity of the substrate. For impacts on non-fragile substrates this may be for up to 50% of habitat affected, but for more fragile habitats, e.g. reef substrate, to stay in this category the % area affected needs to be smaller up to 25%.
1. Substrate quality The level of reduction of internal dynamics of habitats may be larger than is sensible to ensure that the habitat will not be able to recover adequately, or it will cause strong downstream effects from loss of function. Time to recover from local impact on the scale of months to years, at larger spatial scales recovery time of weeks to months.
1. Substrate quality Severe impact on substrate quality with 50 - 90% of the habitat affected or removed by the activity which may seriously endanger its long-term survival and result in changes to ecosystem function. Recovery period measured in years to decades.
1. Substrate quality The dynamics of the entire habitat is in danger of being changed in a major way, or > 90% of habitat destroyed.
Water quality 2. Water quality No direct impact on water quality. Impact unlikely to be detectable. Time taken to recover to pre-disturbed state on
2. Water quality Detectable impact on water quality. Time to recover from local impact on the scale of days to weeks, at larger spatial scales
2. Water quality Moderate impact on water quality. Time to recover from local impact on the scale of weeks to months, at larger spatial scales
2. Water quality Time to recover from local impact on the scale of months to years, at larger spatial scales recovery time of weeks to months.
2. Water quality Impact on water quality with 50 - 90% of the habitat affected or removed by the activity which may seriously endanger its
2. Water quality The dynamics of the entire habitat is in danger of being changed in a major way, or > 90% of habitat destroyed.
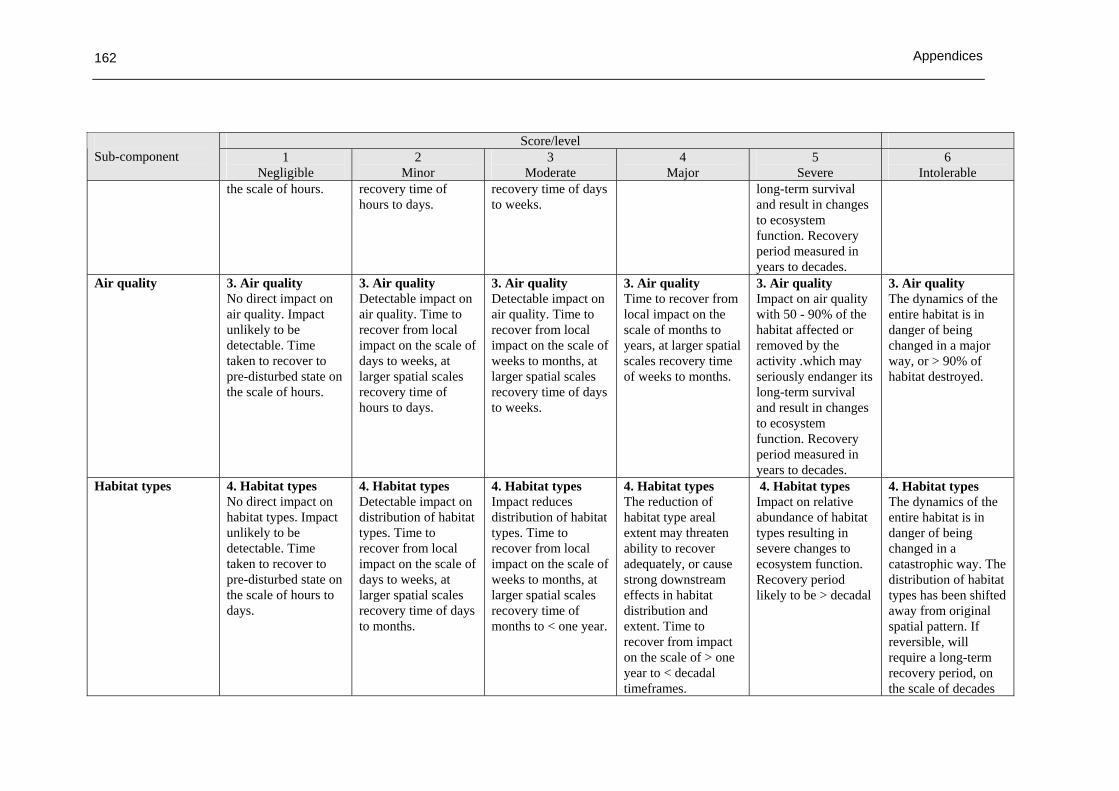
Appendices
162
Score/level Sub-component 1
Negligible 2
Minor 3
Moderate 4
Major 5
Severe 6
Intolerable the scale of hours. recovery time of
hours to days. recovery time of days to weeks.
long-term survival and result in changes to ecosystem function. Recovery period measured in years to decades.
Air quality 3. Air quality No direct impact on air quality. Impact unlikely to be detectable. Time taken to recover to pre-disturbed state on the scale of hours.
3. Air quality Detectable impact on air quality. Time to recover from local impact on the scale of days to weeks, at larger spatial scales recovery time of hours to days.
3. Air quality Detectable impact on air quality. Time to recover from local impact on the scale of weeks to months, at larger spatial scales recovery time of days to weeks.
3. Air quality Time to recover from local impact on the scale of months to years, at larger spatial scales recovery time of weeks to months.
3. Air quality Impact on air quality with 50 - 90% of the habitat affected or removed by the activity .which may seriously endanger its long-term survival and result in changes to ecosystem function. Recovery period measured in years to decades.
3. Air quality The dynamics of the entire habitat is in danger of being changed in a major way, or > 90% of habitat destroyed.
Habitat types 4. Habitat types No direct impact on habitat types. Impact unlikely to be detectable. Time taken to recover to pre-disturbed state on the scale of hours to days.
4. Habitat types Detectable impact on distribution of habitat types. Time to recover from local impact on the scale of days to weeks, at larger spatial scales recovery time of days to months.
4. Habitat types Impact reduces distribution of habitat types. Time to recover from local impact on the scale of weeks to months, at larger spatial scales recovery time of months to < one year.
4. Habitat types The reduction of habitat type areal extent may threaten ability to recover adequately, or cause strong downstream effects in habitat distribution and extent. Time to recover from impact on the scale of > one year to < decadal timeframes.
4. Habitat types Impact on relative abundance of habitat types resulting in severe changes to ecosystem function. Recovery period likely to be > decadal
4. Habitat types The dynamics of the entire habitat is in danger of being changed in a catastrophic way. The distribution of habitat types has been shifted away from original spatial pattern. If reversible, will require a long-term recovery period, on the scale of decades
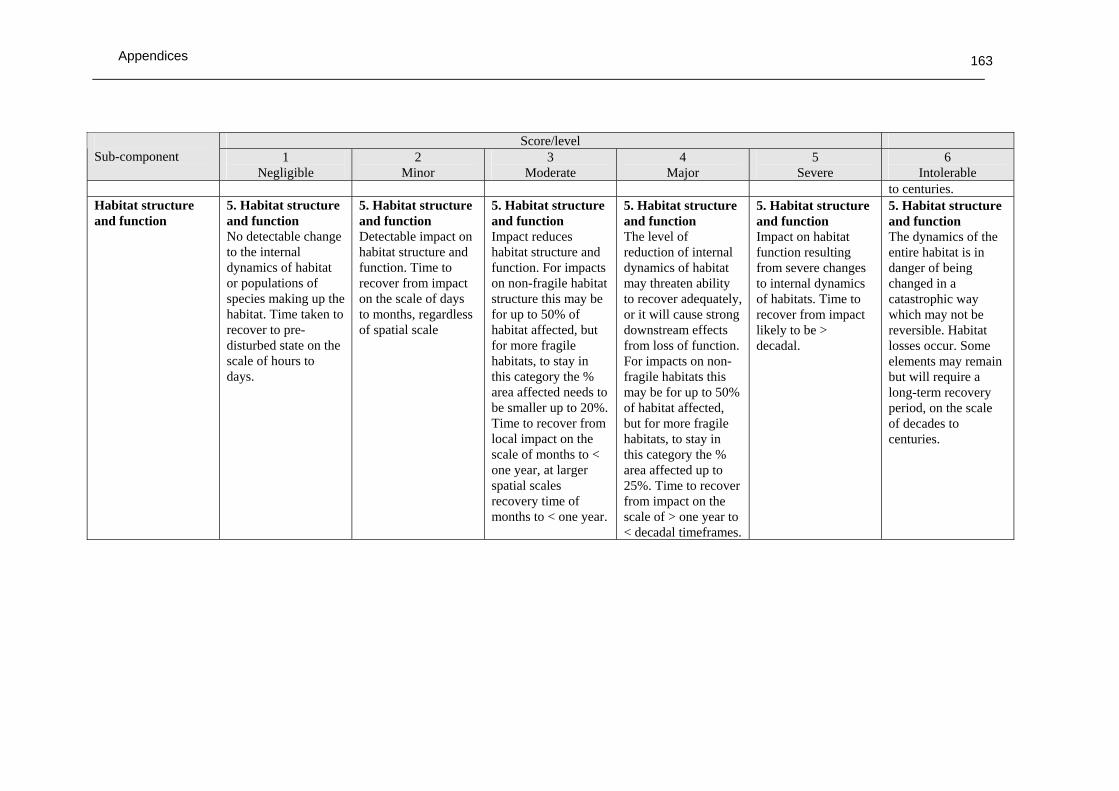
Appendices
163
Score/level Sub-component 1
Negligible 2
Minor 3
Moderate 4
Major 5
Severe 6
Intolerable to centuries.
Habitat structure and function
5. Habitat structure and function No detectable change to the internal dynamics of habitat or populations of species making up the habitat. Time taken to recover to pre-disturbed state on the scale of hours to days.
5. Habitat structure and function Detectable impact on habitat structure and function. Time to recover from impact on the scale of days to months, regardless of spatial scale
5. Habitat structure and function Impact reduces habitat structure and function. For impacts on non-fragile habitat structure this may be for up to 50% of habitat affected, but for more fragile habitats, to stay in this category the % area affected needs to be smaller up to 20%. Time to recover from local impact on the scale of months to < one year, at larger spatial scales recovery time of months to < one year.
5. Habitat structure and function The level of reduction of internal dynamics of habitat may threaten ability to recover adequately, or it will cause strong downstream effects from loss of function. For impacts on non-fragile habitats this may be for up to 50% of habitat affected, but for more fragile habitats, to stay in this category the % area affected up to 25%. Time to recover from impact on the scale of > one year to < decadal timeframes.
5. Habitat structure and function Impact on habitat function resulting from severe changes to internal dynamics of habitats. Time to recover from impact likely to be > decadal.
5. Habitat structure and function The dynamics of the entire habitat is in danger of being changed in a catastrophic way which may not be reversible. Habitat losses occur. Some elements may remain but will require a long-term recovery period, on the scale of decades to centuries.

Appendices
164
Table 5E. Communities. Description of consequences for each component and each sub-component. Use table as a guide for scoring the level of consequence for communities (Modified from Fletcher et al. 2002)
Score/level Sub-component 1
Negligible 2 Minor
3 Moderate
4 Major
5 Severe
6 Intolerable
Species composition 1. Species composition Interactions may be occurring which affect the internal dynamics of communities leading to change in species composition not detectable against natural variation.
1. Species composition Impacted species do not play a keystone role – only minor changes in relative abundance of other constituents. Changes of species composition up to 5%.
1. Species composition Detectable changes to the community species composition without a major change in function (no loss of function). Changes to species composition up to 10%.
1. Species composition Major changes to the community species composition (~25%) (involving keystone species) with major change in function. Ecosystem function altered measurably and some function or components are locally missing/declining/increasing outside of historical range and/or allowed/facilitated new species to appear. Recovery period measured in years.
1. Species composition Change to ecosystem structure and function. Ecosystem dynamics currently shifting as different species appear in fishery. Recovery period measured in years to decades.
1. Species composition Total collapse of ecosystem processes. Long-term recovery period required, on the scale of decades to centuries
Functional group composition
2. Functional group composition Interactions which affect the internal dynamics of communities leading to change in functional group composition not detectable against natural variation.
2. Functional group composition Minor changes in relative abundance of community constituents up to 5%.
2. Functional group composition Changes in relative abundance of community constituents, up to 10% chance of flipping to an alternate state/ trophic cascade.
2. Functional group composition Ecosystem function altered measurably and some functional groups are locally missing/declining/increasing outside of historical range and/or allowed/facilitated new species to appear. Recovery period measured in months to years.
2. Functional group composition Ecosystem dynamics currently shifting, some functional groups are missing and new species/groups are now appearing in the fishery. Recovery period measured in years to decades.
2. Functional group composition Ecosystem function catastrophically altered with total collapse of ecosystem processes. Recovery period measured in decades to centuries.
Distribution of the community
3. Distribution of the community
3. Distribution of the community
3. Distribution of the community
3. Distribution of the community
3. Distribution of the community
3. Distribution of the community

Appendices
165
Score/level Sub-component 1
Negligible 2 Minor
3 Moderate
4 Major
5 Severe
6 Intolerable
Interactions which affect the distribution of communities unlikely to be detectable against natural variation.
Possible detectable change in geographic range of communities but minimal impact on community dynamics change in geographic range up to 5 % of original.
Detectable change in geographic range of communities with some impact on community dynamics Change in geographic range up to 10 % of original.
Geographic range of communities, ecosystem function altered measurably and some functional groups are locally missing/declining/increasing outside of historical range. Change in geographic range for up to 25 % of the species. Recovery period measured in months to years.
Change in geographic range of communities, ecosystem function altered and some functional groups are currently missing and new groups are present. Change in geographic range for up to 50 % of species including keystone species. Recovery period measured in years to decades.
Change in geographic range of communities, ecosystem function collapsed. Change in geographic range for >90% of species including keystone species. Recovery period measured in decades to centuries.
Trophic/size structure
4. Trophic/size structure Interactions which affect the internal dynamics unlikely to be detectable against natural variation.
4. Trophic/size structure Change in mean trophic level, biomass/ number in each size class up to 5%.
4. Trophic/size structure Changes in mean trophic level, biomass/ number in each size class up to 10%.
4. Trophic/size structure Changes in mean trophic level. Ecosystem function altered measurably and some function or components are locally missing/declining/increasing outside of historical range and/or allowed/facilitated new species to appear. Recovery period measured in years to decades.
4. Trophic/size structure Changes in mean trophic level. Ecosystem function severely altered and some function or components are missing and new groups present. Recovery period measured in years to decades.
4. Trophic/size structure Ecosystem function catastrophically altered as a result of changes in mean trophic level, total collapse of ecosystem processes. Recovery period measured in decades to centuries.
Bio-geochemical cycles
5. Bio- and geochemical cycles Interactions which affect bio- &
5. Bio- and geochemical cycles Only minor changes in relative
5. Bio- and geochemical cycles Changes in relative abundance of other
5. Bio- and geochemical cycles Changes in relative abundance of constituents
5. Bio- and geochemical cycles Changes in relative abundance of
5. Bio- and geochemical cycles Ecosystem function catastrophically

Appendices
166
Score/level Sub-component 1
Negligible 2 Minor
3 Moderate
4 Major
5 Severe
6 Intolerable
geochemical cycling unlikely to be detectable against natural variation.
abundance of other constituents leading to minimal changes to bio- & geochemical cycling up to 5%.
constituents leading to minimal changes to bio- & geochemical cycling, up to 10%.
leading to major changes to bio- & geochemical cycling, up to 25%.
constituents leading to Severe changes to bio- & geochemical cycling. Recovery period measured in years to decades.
altered as a result of community changes affecting bio- and geo- chemical cycles, total collapse of ecosystem processes. Recovery period measured in decades to centuries.

Appendices
167