Diel horizontal migration of zooplankton: costs and benefits of inhabiting the littoral

RESEARCH Open Access
Ecological characterization of soil-inhabiting andhypolithic soil crusts within the Knersvlakte,South AfricaBettina Weber1,2*, Dirk CJ Wessels3, Kirstin Deutschewitz4, Stephanie Dojani1, Hans Reichenberger1
and Burkhard Büdel1
Abstract
Introduction: Within the Knersvlakte, cyanobacteria occur hypolithically underneath translucent quartz stones inareas with quartz pavement and, outside pavement areas, they are soil-inhabiting within the uppermost millimetersof the soil. Both habitats were characterized in terms of biomass and growth patterns of cyanobacteria. Long-termmicroclimatic conditions were determined.
Methods: Biomass of organisms within both habitats was determined by means of chlorophyll analyses. A transectapproach was used to determine the frequency of hypolithic growth depending on the size, weight, andembedding depth of the quartz pebbles. Organisms were identified by means of microscopic analyses of thesamples. Microclimatic conditions within both habitats, i.e., temperature, light intensity, air humidity, and soilmoisture, were recorded bi-hourly from September 23, 2004 through September 7, 2006.
Results: The biomass of hypolithic and soil-inhabiting crusts was almost identical, 88 vs. 86 mg Chla/m2 and 136 vs.
134 mg Chla+b/m2. Within the quartz fields, 46.8% of the surface area was covered by quartz stones with 69% of
translucent quartz stones colonized by hypolithic cyanobacteria and algae. Colonized quartz stones weresignificantly thicker, heavier, and more deeply embedded in the soil than uncolonized ones. Whereas the annualmean temperature on top of quartz stones was nearly identical to that underneath thin and thick quartz stones,daily temperature amplitudes were largest on the stone surface (up to 48.1K), compared to the hypolithic habitats(up to 39.4K). Light intensity in the hypolithic habitat was between 15 and 30% of the ambient light intensityduring daytime. Water condensation in the absence of rain occurred during 50% of the nights on the quartz stonesurface, but only during 34% of the nights on the soil surface during winter months within 1 year. Soil moisturebeneath quartz layers was greater and less variable than beneath soil-inhabiting crusts.
Conclusions: In spite of the large differences in the microclimatic conditions, both habitats seem to be similarlywell suited for cyanobacterial growth, resulting in equal biomass values but some differences in taxonomiccomposition.
Keywords: Hypolithic, Quartz, Temperature, Microclimate
* Correspondence: [email protected] of Biology, University of Kaiserslautern, Plant Ecology andSystematics, PO Box 3049, Kaiserslautern 67653, Germany2Now at: Department of Multiphase Chemistry, Max Planck Institute forChemistry, Hahn-Meitner-Weg 1, Mainz 55128, GermanyFull list of author information is available at the end of the article
© 2013 Weber et al.; licensee Springer. This is an Open Access article distributed under the terms of the Creative CommonsAttribution License (http://creativecommons.org/licenses/by/2.0), which permits unrestricted use, distribution, and reproductionin any medium, provided the original work is properly cited.
Weber et al. Ecological Processes 2013, 2:8http://www.ecologicalprocesses.com/content/2/1/8

IntroductionBiological soil crusts (BSC) are well known to occur in hotand cold deserts and semi-deserts throughout the world.They comprise cyanobacteria, algae, lichens, and bryo-phytes as well as bacteria and fungi in variable proportionsgrowing within the uppermost millimeters of the soil(Belnap et al. 2003). Based on the successionally mostadvanced organism group present, they are coarsely de-fined as cyanobacteria-, lichen-, and bryophyte-dominatedsoil crusts (Büdel et al. 2009). In addition to these moregeneral types of soil-inhabiting crusts, Büdel et al. (2009)define two additional types of BSC for southern Africa: theNamib lichen fields, which are restricted to this fog desertenvironment, and the hypolithic crusts. The latter aremostly dominated by cyanobacteria, often accompanied bygreen algae, diatoms, fungi, and bacteria (Cameron 1960;Cameron and Blank 1967; Friedmann et al. 1967;Friedmann and Galun 1974; Broady 1981; Rummrich et al.1989; Büdel and Wessels 1991; Schlesinger et al. 2003;Galun and Garty 2003; Ullmann and Büdel 2003; Cockelland Stokes 2004; Bhatnagar and Bhatnagar 2005). Lichens(Büdel and Schultz 2003), bryophytes (Müller 2009;Cowan et al. 2010), and even red-colored chloroflexi bac-teria (Lacap et al. 2011) have also been reported to formthe dominant organism group on the bottoms and sides ofstones which are tightly embedded into the substrate.Hypolithic growth has been recorded on the soil-embedded sides and underneath quartz (e.g., Vogel 1955;Pointing et al. 2007; Schlesinger et al. 2003), limestone(Friedmann et al. 1967), dolomite (Cockell and Stokes2006), marble (Cowan et al. 2010), flint stone (Friedmannet al. 1967; Berner and Evenari 1978), prehnite and agate(Tracy et al. 2010), and even calcareous material oforganic origin such as bivalve shells and recently deadsnails (Friedmann et al. 1967), all of which are somewhattranslucent, allowing enough light to reach the niche-inhabiting organisms.
The hypolithic habitat is known to be characterized bydifferent ecological conditions compared to those occur-ring on the soil surface, i.e., it experiences lower intensitiesof overall light and UV radiation (Vogel 1955; Berner andEvenari 1978; Schlesinger et al. 2003; Cowan et al. 2010),buffered thermal conditions (Broady 1981; Warren-Rhodes et al. 2006), and enhanced moisture availabilitycompared to the surrounding soil (Warren-Rhodes et al.2006). In contrast to that, Schlesinger et al. (2003) also ob-served lower light and improved water conditions, buthigher temperature amplitudes and absolute temperaturevalues and described that as a modest greenhouse effectfor the hypolithic community of the Mojave Desert.
At our study site in the Knersvlakte, we observedwidely developed hypolithic growth of cyanobacterial or-ganisms (Figure 1A, C; Weber et al. 2010), but also well-developed cyanobacteria-dominated soil-inhabiting BSC
in regions without quartz stone coverage (Figure 1B, D).In order to analyze the utilization of both ecologicalniches by cyanobacteria and algae, we identified cyano-bacterial genera of major relevance and determined thebiomass of photosynthetically active organisms by meansof chlorophyll analyses. Utilization of the hypolithic habi-tat was characterized through quantification and meas-urement of hypolithic growth parameters. By means oflong-term meso- and microclimate measurements, weanalyzed and compared the conditions within both habi-tats. The effects of these microclimatic differences onlong-term carbon fixation patterns are discussed herein.
MethodsStudy siteThis study was conducted on the farm Goedehoop, nextto the BIOTA South Observatory Goedehoop (No. 26)in the Van Rhynsdorp District, Western Cape Province,South Africa. The farm lies in a semiarid area known asthe Knersvlakte, characterized by an extensive gentlyrolling gravely plain. The vegetation and other character-istics of the Knersvlakte have been reported by Cowlinget al. (1999). Large tracts of the Knersvlakte are coveredby a layer of quartz stones (Figure 1A), within which adistinct quartz field flora occurs (Schmiedel 2002). Theimportance of these quartz fields, which vary in size, wasstressed by Schmiedel (2002), who pointed out that theyrepresent a biodiversity hotspot with 150 taxa (speciesand subspecies), 121 (80.7%) of them being endemic andoccurring obligatorily in quartz fields. The quartz fieldsare interspersed with locally confined distinct dwarfshrubbery. The Knersvlakte experiences cool wintersand hot summers, with daily air temperatures that rangefrom maximum values of 47.9°C in February to mini-mum values of 1.1°C in June (BIOTA meteorological sta-tion readings from 2001 to 2009; Jürgens et al. 2010).Although rainfall occurs throughout the year, the bulk ofthe annual rainfall occurs during the cool winter months(July–August), with smaller peaks occurring duringApril (autumn) and October (early summer). The meantotal annual rainfall for the period of measurement atthe BIOTA meteorological station at Ratelgat (31.283°S,18.603°E, height 240 m a.s.l.) was 125.7 mm, rangingfrom 69.2 mm (in 2003) to 175.4 mm (in 2008). Detailedmesoclimatic conditions of the study site, which weremeasured by us, are described in the Results section.
Microscopical determinationFor determination of the most common genera of cyano-bacteria, samples of soil-inhabiting crust (belonging to thefollowing crust types: 1: light cyanobacterial crust, 2: well-established cyanobacterial crust, and 6: hypolithic crust;Büdel et al. 2009) were randomly collected in Petri disheswithin the study area. Light microscopy was used to
Weber et al. Ecological Processes 2013, 2:8 Page 2 of 13http://www.ecologicalprocesses.com/content/2/1/8

determine the soil crust material, based on Geitler (1932)and Komárek and Anagnostidis (1998, 2005).
BiomassFor chlorophyll determination of the soil-inhabiting crust,one Petri dish sample (covering 57 cm2) was collectedfrom each of five independent randomly chosen soil crustsampling points. For determination of the hypolithic com-munity, 11 Petri dish samples were randomly collectedwithin the quartz field areas. Quartz pebbles were smallenough to allow for this sampling procedure. The lowerpart of a Petri dish was lined with cellulose paper, pressedupside down into the substrate and then carefully re-moved from the underlying soil with a trowel. Surplus soilwas removed, and Petri dishes were then closed with theupper lid and sealed. Additionally, the hypolithic crust offive randomly chosen squares within the quartz fields,each covering an area of 19.7 × 19.7 cm, was sampled to adepth of about 3 cm and transported in double-lined poly-ethylene bags. In both types of samples, the completesoil surface together with the quartz gravel was col-lected in a dry state for later analysis in the laboratory.Chlorophyll (Chl) was extracted two times in 100%DMSO (dimethylsulfoxide) for 90 min at 65°C accor-ding to the method described by Ronen and Galun(1984). Mg2(OH)2CO3 was added to avoid acidification
and concomitant pheophytinization of chlorophyll.After spectrophotometry, the Chla content was calcu-lated according to Arnon et al. (1974). The Chla+b con-tent was calculated according to Lange, Bilger, andPfanz (pers. comm.) as follows:
Chlaþb μg½ � ¼ 20:2 � E648–E700ð Þ þ 8:02 � E665–E700ð Þ½ �� a
ð1Þ
and
Chla μg½ � ¼ 12:19 � E665–E700ð Þ½ � � a ð2Þ
whereChla+b[μg], Chla[μg] is the chlorophyll content of the
sample in micrograms, E648, E665, E700 are the absorp-tions at the given wavelengths, and a is the amount ofDMSO used in milliliters.
The chlorophyll content per surface area was calculatedby dividing the Chl value by the surface area of the sample.Chl contents of both habitats proved to be normally dis-tributed, as checked by the Kolgomorov-Smirnov andShapiro-Wilk tests. A T-test was used to analyze differ-ences in Chl contents between the two habitats.
Figure 1 The Knersvlakte and its habitats for cryptogamic organisms. (A) Overview of the Knersvlakte with extended quartz fields and thecharacteristic flora, which comprises highly diverse succulent plants and dwarf shrubs. (B) Within the Knersvlakte, large tracts of quartz fields withhypolithic growth occur next to soil surfaces, facilitating epedaphic growth of biological soil crusts. (C) Quartz pebbles of the Knersvlakte withhypolithic cyanobacterial growth on the formerly embedded part of the quartz stone. (D) Cyanobacteria-dominated biological soil crustsoccurring in quartz-free regions within the Knersvlakte.
Weber et al. Ecological Processes 2013, 2:8 Page 3 of 13http://www.ecologicalprocesses.com/content/2/1/8

Quartz stone coverage and size-dependent colonizationNorth of the Goedehoop observatory (31.2750°S, 18.6003°W), the quartz stone coverage and size-dependentcolonization were determined along a 300 m transect with30 sampling points. At each sampling point, all pebblesalong a 1 m line were collected, separated into stones withand without hypolithic growth, and packaged for lateranalysis in the laboratory. At each point a digital image of1 m2 soil surface was taken for later analysis of quartzstone density.
All colonized and uncolonized quartz stones per sam-pling point were counted, weighed, and their thicknessand depth of embedding measured with a digital caliper.Irregularly shaped stones were measured at their thickestand widest points. Embedded depth was measured at thedeepest point, thus determining the deepest possible pointof colonization by hypoliths. A Kruskal-Wallis one-wayanalysis of variance on ranks (SigmaStat Ver. 3.1) was usedto determine the significance of differences between thethickness, mass, and embedded depth of colonized anduncolonized quartz stones.
Quartz stone density analysis was done by digital ana-lysis of the 1 m2 images using Adobe Photoshop soft-ware. In a first step, all vascular plants with clear bounds(e.g., Agyroderma sp.) were masked and saved as anextra image. The remaining image was displayed withmaximum contrast as a black and white image, the soilbeing shown in black and the pebbles in white. Thecoverage of each color was analyzed with ArcView 3.2(ESRI Inc., Redlands, WA, USA) software and the SpatialAnalyst application. All images were converted intogrids, in which black pixels were assigned the value 0and white ones the value 1. The number of pixels witheach value was extracted from the attribute table andconverted into percentages. The images with the vascu-lar plants were processed in the same manner and theirpercentage subtracted from the total pixel number perimage, yielding the percentages of quartz pebbles andbare soil. In order to validate this digital method, three25 × 25 cm areas of one sampling image were printed incolor, and on each print, two 5 × 5 cm areas were ran-domly covered with transparent scale paper. On an illu-minated screen, the edges of the quartz pebbles weretraced with a pen onto the 5 × 5 cm scale papers, which
were then enlarged and the quartz pebble pixels werecounted. A comparison of the two methods revealed amaximum difference of 3.8%.
Generally, only images that were taken before 4 p.m.could be included in the analysis, as shadows in theimage distorted the results in those taken later. Imageswith shrubs were also excluded from the analysis since itwas not possible to mask them out in a detailed manner.Consequently, ten 1 m2 plots could be used for thequartz pebble density analysis.
Meso- and microclimateThe meso- and microclimate weather station was in-stalled at 31.275°S, 18.598°E, (height 196.5 m a.s.l.), adja-cent to the northern edge of the BIOTA observatoryGoedehoop (Observatory No. 26), between an area whosesoil surface is totally covered by quartz stones (quartzfield) and an area whose soil surface is either bare or cov-ered by a biological soil crust. A number of Argyrodermapearsonii (N.E. Brown) Schwantes (Aizoaceae) plants growin the studied quartz field, with numerous other plantspecies, all dwarf in habit, occurring in soil without aquartz stone cover adjacent to the quartz field. At theweather station the following mesoclimatic parameterswere assessed: air temperature and air humidity at a heightof 100 cm, protected from direct insolation by an inhouse-built radiation shield; precipitation (Davis Rain CollectorII, Davis Instruments, Hayward, CA, USA); and ambientphotosynthetically active radiation (PAR; LI-190, Li-COR,Lincoln, NE, USA).
TemperatureMicroclimatic thermal conditions within the quartz fieldwere determined through the placement of one smallthermistor (NTC, close tolerance R/T curve matchedthermistors) per location set out below (Table 1).Temperature changes within a quartz stone were deter-mined by placing a thermistor snugly within a 5 mm deephole drilled into the stone. The opening of the hole wassealed off with Pratley® Quickset Putty.
LightA light sensor (G1116, Hamamatsu, Hamamatsu City,Japan) was installed under each of two quartz stones
Table 1 Location of small thermistors determining the thermal conditions on the soil surface and withinthe quartz field
Probe location (all stones with hypolithic communities) Stone size [length × width × thickness (mm)] Abbreviation
Below a thin quartz stone 32.57 × 20.16 × 12.01 Thin stone
Below a thicker quartz stone 33.98 × 44.45 × 21.69 Thick stone
Within a quartz stone 34.51 × 22.50 × 20.50 Inside stone
Upper surface of a quartz stone Stone surface
Surface of biological soil crust Crust surface
Weber et al. Ecological Processes 2013, 2:8 Page 4 of 13http://www.ecologicalprocesses.com/content/2/1/8

(length × width × height: stone 1: 35 × 28 × 10 mm;stone 2: 26 × 20 × 9 mm). Both stones were colonizedby hypolithic cyanobacteria, thus representative of theprevailing hypolithic habitat. The organisms were thenremoved from the lower portion of the stones, and sen-sors were glued onto the undersides of these stones tomeasure the amount of light reaching the hypolithicallygrowing organisms. Unfortunately, one sensor degradedafter 6 months of measurements (due to muddy waterleaking into the sensor on October 21, 2005). The sec-ond sensor remained intact and stable for the wholemeasuring time.
CondensationThe potential condensation time on the surface of quartzstones and on the soil surface was estimated for the timespan from May 13 to October 19, 2005. Calculations werebased on a rule of thumb for calculating the saturatingvapor pressure, the so-called Magnus equation (eq. 3). Thevapor pressure is defined as the product of air humidityand saturating vapor pressure (eq. 4). The dew pointtemperature can thus be calculated from the relative airhumidity and the present temperature (eq. 5). Potentialcondensation conditions occurred if the quartz pebble sur-face temperature or soil crust surface temperature fellbelow this dew point temperature.
SVP Tð Þ ¼ 6:1078 � 10 a � Tð Þ= b þ Tð Þð Þ ð3Þ
VP r;Tð Þ ¼ r=100 � SVP Tð Þ ð4Þ
TD r;Tð Þ ¼ b � va−vð Þ where v r;Tð Þ
¼ log10 VP r:Tð Þ=6:1078ð Þ ð5Þwhere
r = relative air humidityT = temperature in°CTD = dew point temperature in°CVP = vapor pressure in hPaSVP = saturating vapor pressure in hPa
Parameters:
a = 7.5, b = 237.3 at T ≥ 0a = 7.6, b = 240.7 at T < 0 over water (dew point)a = 9.5, b = 265.5 at T < 0 over ice (frost point)
The latter two sets of parameters were not used, sincetemperatures always remained above 0°C.
In a first approach, the total duration of potential con-densation conditions within the hypolithic and the soil-
inhabiting crust habitats was calculated. In a second ap-proach, only condensation conditions at least 1 h afterthe last precipitation event were considered. These datawere then used to calculate the number of nights (fromdawn to dusk) when condensation conditions occurred.
Soil moistureSoil moisture was measured with two humidity sensors(ECH2O EC-10, Decagon Devices, Pullman, WA, USA)at a depth of 30 mm within the soil. One sensor wasinstalled below a soil crust surface, and the second onewas placed below a quartz layer with hypolithically grow-ing cyanobacteria.
Signals from all sensors were recorded every half hourby an in-house-built data logger from September 23, 2004through September 7, 2006.
ResultsMicroscopical determinationWithin the Knersvlakte, Chroococcidiopsis, Leptolyngbya,Lyngbya, Microcoleus, Nostoc, Oscillatoria, Phormidium,Pseudanabaena, Pseudophormidium, Schizothrix, Scytonema,Tolypothrix, and Trichocoleus were found to be the dom-inant cyanobacterial genera. The genus Chroococcidiopsiswas observed to occur exclusively in the hypolithic envir-onment, whereas Microcoleus and Nostoc were mainlyfound in soil-inhabiting crust samples.
BiomassWithin the soil-inhabiting crust and hypolithic habitat,nearly identical biomass values were present with Chlacontents of 86.1 mg Chla/m
2 (SD = 37.8; n = 5) and 87.7mg Chla/m
2 (SD = 38.8; n = 16), respectively. Chla+b
contents were about 2/3 larger at 133.7 mg Chla+b/m2
(SD = 59.9; n = 5) in soil crusts and 136.2 mg Chla+b/m2
(SD = 52.4; n = 16) in hypolithic crusts. There were nosignificant differences in the Chl values between the twohabitats.
Quartz stone coverage and size-dependent colonizationWithin the quartz fields of Goedehoop, on average 46.8%(SD: 2.6, n = 10) of the soil surface was covered by quartzstones. Hypolithic communities were present beneath 69%of the sampled quartz stones (n = 682).
Colonized quartz stones were significantly thicker thanuncolonized ones (P < 0.001) with a mean thickness of9.5 mm (median = 8.8 mm, SD = 4.2, n = 363) comparedto 5.7 mm (median = 5.3 mm, SD = 2.5, n = 319) foruncolonized pebbles. The largest number of colonizedstones had a thickness of 9 mm (Figure 2A), whereas thelargest number of uncolonized pebbles were 6 mm thick.The colonized quartz stones were up to 29.8 mm thick;uncolonized stones only reached a maximum thicknessof 18.3 mm. The mean thickness of all quartz stones
Weber et al. Ecological Processes 2013, 2:8 Page 5 of 13http://www.ecologicalprocesses.com/content/2/1/8
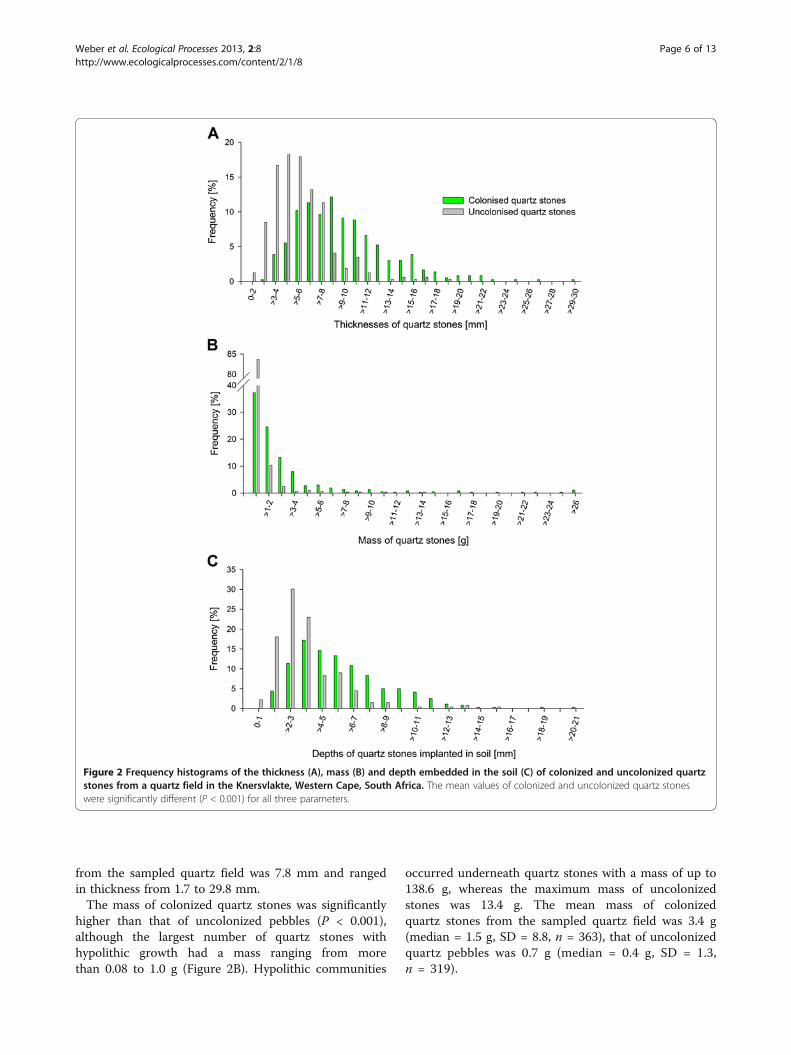
from the sampled quartz field was 7.8 mm and rangedin thickness from 1.7 to 29.8 mm.
The mass of colonized quartz stones was significantlyhigher than that of uncolonized pebbles (P < 0.001),although the largest number of quartz stones withhypolithic growth had a mass ranging from morethan 0.08 to 1.0 g (Figure 2B). Hypolithic communities
occurred underneath quartz stones with a mass of up to138.6 g, whereas the maximum mass of uncolonizedstones was 13.4 g. The mean mass of colonizedquartz stones from the sampled quartz field was 3.4 g(median = 1.5 g, SD = 8.8, n = 363), that of uncolonizedquartz pebbles was 0.7 g (median = 0.4 g, SD = 1.3,n = 319).
Figure 2 Frequency histograms of the thickness (A), mass (B) and depth embedded in the soil (C) of colonized and uncolonized quartzstones from a quartz field in the Knersvlakte, Western Cape, South Africa. The mean values of colonized and uncolonized quartz stoneswere significantly different (P < 0.001) for all three parameters.
Weber et al. Ecological Processes 2013, 2:8 Page 6 of 13http://www.ecologicalprocesses.com/content/2/1/8

Colonized quartz stones were embedded significantlydeeper in the soil than uncolonized quartz stones (P < 0.001)with a mean depth of 5.8 mm (median = 5.2 mm, SD =3.0, n = 358) for colonized and 3.5 mm (median = 3.0mm, SD = 2.1, n = 268) for uncolonized quartz stones.The colonized quartz stones reached up to a maximumdepth of 20.1 mm within the soil, whereas uncolonizedpebbles were embedded up to 15.9 mm (Figure 2C). Thelargest numbers of both colonized and uncolonized quartzstones were embedded 4 mm into the soil, ranging from aminimum of 0.4 mm to a maximum of 20.1 mm.
MesoclimateThe mesoclimatic characteristics at the Knersvlakte sitefrom September 1, 2005 to August 31, 2006 revealed a typ-ical southern hemispherical climate with the highest dailymean temperature (32.3°C) being reached on February 1and the lowest (9.2°C) on July 22 (Figure 3). The maximumair temperature recorded during that year was 44.8°C(February 1); the absolute minimum of −1.2°C was mea-sured on June 6. Highest light intensities were measuredduring the summer months from November throughFebruary (Figure 3) with maximum light intensities of2,251 μmol PAR m-2 s-1 being recorded on February 7;lowest values were recorded from June through July withthe lowest daily maximum (433 μmol PAR m-2 s-1) occur-ring on August 24. The total amount of precipitation was151.8 mm with the highest monthly precipitation amountsin May (65.2 mm), June (20.2 mm), July (12.8 mm), andAugust (21.4 mm), and the lowest amounts during summer
in November (2 mm) and December (0.2 mm; Figure 3).There were no months without any rain during that year.
MicroclimateMicroclimate sensors were installed in various locationsto explore the microclimatic conditions within the soil-inhabiting crust and hypolithic habitat.
TemperatureTemperature conditions experienced by soil-inhabitingand hypolithically growing BSC were analyzed over thecourse of 1 year from September 1, 2005 to August 31,2006. Temperatures on the surface of quartz stones(Figure 4A) and at the soil surface (Figure 4B) werehighest during the day and lowest at night during mostsummer days. Temperature conditions within a quartzstone, under thin and thick quartz stones, and at a depthof 30 mm underneath the quartz field were increasinglymoderated by the insulating effect of stone and soil. Airtemperatures were almost always lower than soil/quartztemperatures, except for a few short events, as inthe late evening of January 3, 2006 between 10:30 and11:00 p.m. (quartz surface temperature higher than airtemperature; Figure 4A).
During winter, the same insulating effect of stone andsoil was present (Figure 5). The differences between airand soil/quartz pebble temperatures, however, were farless extreme. During early morning and late eveninghours, air temperatures were frequently higher than soil/quartz pebble temperatures and sometimes they were
Figure 3 Mesoclimatic conditions in the Knersvlakte, Western Cape, South Africa. Daily light intensity maxima, daily mean air temperatures,and daily amounts of precipitation, from September 1, 2005 to August 31, 2006.
Weber et al. Ecological Processes 2013, 2:8 Page 7 of 13http://www.ecologicalprocesses.com/content/2/1/8

even higher during the day and night (e.g., June 24–26,2006, Figure 5). Over the course of the whole year,highest daily maxima and lowest daily minima werereached at the soil surface and the quartz stone surface(Table 2). Thus, the highest daily amplitudes of 48.1 and47.5 K were also reached at the quartz stone surface andsoil surface, respectively, whereas under the thin andthick quartz stones, amplitudes of only 39.4 and 36.0 Kwere recorded, respectively (Table 2).
Temperatures on the bottom of the thin and thickquartz stones were up to 4.0 and 4.2 K higher thanat the quartz stone surface (on November 6, 2005,4:30 p.m. and September 20, 2005, 6:30 p.m., respect-ively) and up to 15.4 and 15.7 K lower (on October 2,2005, 10:00 a.m. and October 14, 2005, 11:00 a.m.,respectively). Over the course of the year, temperatures
under the thin and thick stones were higher thanthose at the quartz surface on 220.8 and 224.6 days,equal for 7.8 and 3.4 days, and lower for 136.2 and136.8 days, respectively. Over the whole year, themean temperature values under the thin and thickquartz stones were 0.3 and 0.5 K lower, respectively.During the summer months (December throughFebruary) mean temperatures under the thin and thickstones were 0.2 and 0.6 K lower than at the quartzsurface, whereas during winter months, temperaturedifferences were 0.5 and 0.4 K lower temperatures,respectively.
LightAmbient light intensities reached values up to 2,273μmol PAR m-2 s-1 during summer, whereas under the
Figure 4 Summer temperatures measured at different locationsduring a characteristic time span, January 3–7, 2006.(A) Temperatures measured at a height of 1.80 m (ambient airtemperature), at the quartz pebble surface, inside a quartz pebble,under a thick quartz pebble, and at a depth of 30 mm underneath aquartz field. (B) Temperatures measured at the surface of epigaeicsoil crusts and under a thin and a thick quartz pebble. Fordimensions of quartz pebbles, see Table 1.
Figure 5 Winter temperatures measured at different locationsduring a characteristic time span, June 22–26, 2006.(A) Temperatures measured at a height of 1.80 m (ambient airtemperature), at the quartz pebble surface, inside a quartz pebble,under a thick quartz pebble, and at a depth of 30 mm underneath aquartz field. (B) Temperatures measured at the surface of epigaeicsoil crusts and under a thin and a thick quartz pebble. Fordimensions of quartz pebbles, see Table 1.
Weber et al. Ecological Processes 2013, 2:8 Page 8 of 13http://www.ecologicalprocesses.com/content/2/1/8

quartz pebbles the maximum light intensity was only586 μmol PAR m-2 s-1. The course of light intensity dur-ing daylight closely followed the ambient light (Figure 6),reaching 15–30% of the ambient light intensity withhigher percentages in the afternoon hours.
CondensationPotential condensation conditions occurred almost ex-clusively from the late evening until the early morninghours (from dawn to dusk). During the time span fromMay 13 until October 19, 2005, potential water conden-sation occurred on the quartz surface during 98 of the160 nights (61%), whereas on the soil surface potential
condensation conditions were only present on 74 nights(46%). On some nights, these conditions coincided withrain events. Considering only nights without rain at least1 h prior to or during condensation conditions, therewere still 80 nights (50%) with condensation conditionson quartz, but only 54 nights (34%) with these condi-tions on the soil crust surface.
On an hourly basis, potential condensation conditionson the surface of the quartz pebbles occurred for 538 hin total, corresponding to 14.0% of the time, whereas onthe soil surface comparable conditions occurred for only355 h or 9.2% of the total time. When condensation con-ditions within 1 h of the last rain event were eliminated,
Table 2 Daily temperature maxima, minima, and amplitudes on the quartz stone surface, underneath a thin and athick quartz stone and at the soil crust surface
Surface of quartz stone Under thin quartz stone Under thick quartz stone At soil crust surface
Daily maximum Max. value [°C] 63.5 59.7 56.8 65.6
Date 12/30/05 12/30/05 12/30/05 02/06/06
Daily maximum Min. value [°C] 15.6 15.0 14.8 14.4
Date 07/31/06 07/31/06 07/31/06 07/31/06
Daily minimum Max. value [°C] 24.6 25.7 26.0 24.7
Date 02/06/06 02/02/06 02/02/06 02/06/06
Daily minimum Min. value [°C] 3.4 4.2 5.0 4.1
Date 06/23/06 06/23/06 06/23/06 06/23/06
Daily amplitude Max. value [K] 48.1 39.4 36.0 47.5
Date 10/14/05 12/30/05 12/30/05 10/31/05
Daily amplitude Min. value [K] 5.3 4.6 4.0 3.7
Date 07/31/06 07/31/06 07/31/06 08/24/06
Figure 6 Light intensity measured underneath two translucent quartz stones as compared to the ambient light intensity fromSeptember 30–October 5, 2004. Fluctuations of the ambient light intensity are closely resembled by light intensities within thehypolithic habitat.
Weber et al. Ecological Processes 2013, 2:8 Page 9 of 13http://www.ecologicalprocesses.com/content/2/1/8

there were still 498 h (corresponding to 13.0% of thetime) on quartz pebbles and 316 h (8.2%) on the soilcrust surface.
Soil moistureSoil moisture contents were analyzed for a time span fromSeptember 1, 2005 to August 31, 2006. During that year,soil moisture at a depth of 30 mm revealed large differ-ences, depending on whether the sensor was placed belowthe surface of a soil-inhabiting crust or a hypolithic crust(Figure 7). The soil moisture below the soil-inhabitingcrust was almost always close to zero from Octoberthrough April, and only larger rain events, as on October17, 2005 (5.4 mm) and January 26, 2006 (3.2 mm) led to ashort-term increase in soil moisture. Under the quartz sur-face, soil moisture always remained somewhat higher andthe “period of dry soil” only lasted for approximately 6weeks from the beginning of December to January 21.Smaller rain events during the dry season, as on January21 (2 mm), February 6 (2.6 mm), and March 2 (1.2 mm),led to much larger soil moisture values under the quartzsurface, which lasted for 81, 124, and 106 h, respectively,whereas under the soil crust, such small events only led toa short-term increase in soil moisture or caused noincrease at all.
An intense rain event at the end of the dry season onMay 1 (16.8 mm) caused a substantial increase in soilmoisture below both crust types. The water content belowthe soil-inhabiting crust was still lower than that under thequartz layer and it decreased much quicker. Soil moistureunder the quartz layer remained high with values above 0.3m3/m3 almost continuously from April 28 to August 31.
DiscussionEvaluation of the two biological soil crust habitats—soil-inhabiting and hypolithic crusts—revealed obviousmicroclimatic differences, i.e., moderated temperaturevariation, lower light intensities, and wetter soil conditionswithin the latter habitat. Nevertheless, almost identicalbiomass values were measured in both habitats, suggestingthat the two habitats are occupied by stable communitiesof photoautotrophic organisms. In addition to a set ofwidely occurring genera, we observed Chroococcidiopsis tobe restricted to the hypolithic habitat, whereas Microcoleusand Nostoc occurred almost exclusively in the soil habitat.
Chlorophyll values of 86.1 and 87.7 mg Chla/m2 and
133.7 and 136.2 mg Chla+b/m2 measured in the soil and
hypolithic habitat, respectively, are well within the rangereported by Broady (1981), who observed Chla values of64 mg/m2 (SD = 40) for sublithic communities withinmoist mineral soil and 120 mg/m2 (SD = 60) within drymineral soil in Antarctica. Büdel et al. (2009), who stud-ied biological soil crusts along a transect in southernAfrica, measured very similar values in late successionallichen- and bryophyte-dominated crusts with values of86.3 mg Chla/m
2 and 135.8 mg Chla+b/m2, whereas for
initial, light cyanobacterial crusts (31.8 mg Chla/m2 and
49.3 mg Chla+b/m2) and well-developed cyanobacterial
crusts (67.9 mg Chla/m2 and 112.5 mg Chla+b/m
2) lowerbiomass values were reported. On a biome-basis, higherbiomass values were only reached within the NamibDesert (141.5 mg Chla/m
2 and 230.1 mg Chla+b/m2),
whereas in the Dry Forest, Dry Savanna, Nama Karoo, andKalahari, values were clearly lower (Büdel et al. 2009).
As a first assumption, one might expect higher bio-mass values in the hypolithic environment, and we couldimagine two potential causes for our equal values. First,the hypolithic habitat is limited in space, i.e., all favor-able stones are fully colonized, and biomass could reachhigher values if more suitable hypolithic habitat wasavailable (e.g., at higher quartz stone density). Second,when activated by water, the soil-inhabiting crusts reacha far higher net photosynthesis rate due to the higherlight intensities at the soil surface. Unfortunately, CO2
gas exchange measurements do not serve as a reliablemethod here, since bare Knersvlakte soils have been ob-served to release CO2.
An estimation of biomass values by means of chloro-phyll values has to be considered with care, since chloro-phyll contents of autotrophic organisms are known tovary, e.g., with changing nutrient status of the organisms(Kruskopf and Flynn 2006). Nevertheless, chlorophylldetermination represents the most appropriate methodto assess the biomass of the photosynthetically activeparts of BSC. Since nutrient distributions within ourstudy area are considered to be fairly homogeneous, thismethod is estimated to be well suited to meet our task.
Figure 7 Soil moisture at a depth of 30 mm measured belowbiological soil crust and below a quartz layer from September2005 through July 2006. Precipitation values are shown fordata interpretation.
Weber et al. Ecological Processes 2013, 2:8 Page 10 of 13http://www.ecologicalprocesses.com/content/2/1/8

For the coverage of quartz stones, almost identicalvalues were determined by Vogel (1955), who found 43%versus 46% determined by us. The frequency of hypolithicphotoautotrophs has been determined in a variety of hotand cold deserts to range from 0 to 100% (Table 3).Annual precipitation seems to be one factor influencingthe frequency of hypoliths and rock type also has animpact, as Berner and Evenari (1978) showed with dif-ferent colonization frequencies on light and dark flint inthe Negev Desert. On the mainland and islands of BajaCalifornia, frequency of hypoliths on quartz pebblesreached about half the values observed by us at about halfthe amount of annual precipitation (Heckman et al. 2006).In cold deserts, large ranges in the colonization rates wereobserved depending on the impact of fog (Azúa-Bustoset al. 2011) and snowmelt (Pointing et al. 2009) in additionto the precipitation influence (Azúa-Bustos et al. 2011).With decreasing precipitation and fog, frequency ap-proached zero (Warren-Rhodes et al. 2006). Extraordinar-ily high frequencies of 95 and 94% were documented byCockell and Stokes (2006) on Devon and CornwallisIsland, respectively. Schlesinger et al. (2003) even reportedthat 100% of all quartz pebbles in the southern Mojave
Desert are colonized by photoautotrophs, despite the factthat the annual precipitation rate is even lower than in ourstudy area. It also is striking that the smallest pebbles theyfound had a thickness of 5 mm and were all colonized,whereas we found only 26% of the pebbles between 4 and5 mm to be colonized by cyanobacteria.
We observed the colonized stones to be significantlythicker (mean thickness: 9.5 mm) than uncolonized ones(mean thickness: 5.7 mm), which is in accordance withAzúa-Bustos et al. (2011), who also found increasingcolonization rates with increasing quartz rock size. Incontrast, Berner and Evenari (1978) reported larger meanstone thickness values for uncolonized light and darkflint stones (16–20 mm) as compared to colonized ones(11–15 mm).
Our data revealed colonized quartz stones to be signifi-cantly heavier (mean value: 3.4 g) than uncolonized ones(mean value: 0.7 g). Despite the fact that the mass of stonesis an essential factor influencing stability of the hypolithichabitat, no comparable data could be found in the literature.
Unfortunately, our microclimate sensors were not in-stalled in sufficient numbers to allow for statistical ana-lyses. Nevertheless, we believe that our data may serve
Table 3 Frequency of hypolithic photoautotrophs within different hot and cold deserts
Location Frequency of hypolithicphotoautotrophs (%)
Rock type Annual precipitation(mm)
Reference
Hot deserts
Mojave Desert, USA 100 Quartz 83 Schlesinger et al.(2003)
Knersvlakte, South Africa 69 Quartz 126 This study
Negev Desert, Israel 46.8 Dark flint 76 Berner and Evenari(1978)
Mainland of Baja California,Mexico
38 Quartz 53 Heckman et al. 2006
Islands of Baja California, Mexico 26 Quartz 53 Heckman et al. 2006
Negev Desert, Israel 20.9 Light flint 76 Berner and Evenari(1978)
Cold deserts
Alexander Island, Antarctica 86–100 “Opaque rocks” - Cockell and Stokes2006
Devon and Cornwallis Island,Canada
95 and 94 “Opaque rocks” - Cockell and Stokes2006
Atacama Desert, Chile 80 Quartz - (Fog input) Azúa-Bustos et al. 2011
High altitude tundra, centralTibet
36 Quartz - Wong et al. 2010
Copiapó, Atacama Desert, Chile 27.6 Quartz andquartzite
~ 110 Warren-Rhodes et al.2006
McMurdo Dry Valleys, Antarctica 22 Quartz - (Snowmelt influence) Pointing et al. 2009
McMurdo Dry Valleys, Antarctica 4.9 Quartz - Pointing et al. 2009
Yungay, Atacama Desert, Chile 0 Quartz andquartzite
~ 5 Warren-Rhodes et al.2006
Additional information is given on the colonized rock type, the annual precipitation within the region (as far as available), and the reference of the data.
Weber et al. Ecological Processes 2013, 2:8 Page 11 of 13http://www.ecologicalprocesses.com/content/2/1/8

as an important resource, as we are the first to describethe long-term microclimatic conditions within the soilcrust and hypolithic habitat in the Knersvlakte.
Our measurements clearly revealed that temperatureconditions under the quartz stones were less extremecompared to the quartz stone and soil surface. This find-ing was also reported by Azúa-Bustos et al. (2011) for theAtacama Desert and is generally expected for both hotand cold deserts (Chan et al. 2012). However, Schlesingeret al. (2003) measured larger temperature amplitudes andhigher temperature maxima under the quartz stones ascompared to the stone surface. They describe this phe-nomenon, which is puzzling to us and contradictory to allthe other data, as a modest greenhouse effect under thequartz stones. Absolute temperatures measured by us inthe hypolithic environment ranged from 4.2 to 59.7°C,which is surprisingly similar to the values observed byBerner and Evenari (1978) in the Negev Desert (about 2 to50°C) and by Tracy et al. (2010) in northern Australia(about 9 to 60°C).
We observed light intensities under the quartz rocksto be clearly lower, but still reaching about 15–30% ofthe ambient light intensities, which were closely tracked.This is somewhat higher than the measurements ofVogel (1955), who found a transmission of about 9.4% ofthe ambient light at a stone thickness of 10 mm. Ourhigher values may be caused by a somewhat shallowerembedding of the quartz pebbles after installation of thelight sensors as compared to their original position inthe soil. On the other hand, Vogel (1955) described hislab measurements as an estimation that did not accountfor scattered light coming in from the sides, which mayagain increase the amount of incoming light. In contrastto that, Berner and Evenari (1978) measured only 0.005%of the incident light at a depth of 10 mm, Schlesinger et al.(2003) observed 2.8% of the incident light at a depth of 12mm (wavelength: 680 nm), and Broady (1981) found that2.7% of the incident light reached the bottom of a 13 mmthick stone. A major drawback of all these measurements(including ours) is that only light descending from theupper part of the rock was measured. Due to light scatter-ing and reflectance within the stone and the surroundingsoil layer, light most probably also reaches the organismsfrom the sides and even from underneath. In order tomeasure this, especially adapted scalar irradiance sensorshave to be applied (Kühl et al. 1994).
We calculated condensation to occur much more fre-quently on the quartz stone surface as compared to thesoil surface (538 vs. 355 h corresponding to 14.0 vs. 9.2%of the time from May 13 to October 19, 2005). If the in-fluence of precipitation, which may cool down thequartz or soil surface, was excluded, there were still 498vs. 316 h of condensation conditions. Condensation con-ditions without rain influence were observed during 50%
of the nights on quartz pebble surfaces, but only 34% ofthe nights on soil crust surfaces. This difference is mostprobably caused by the higher heat transfer rates ofquartz stones as compared to the soil surface, causingthe quartz pebbles to cool down more quickly. The con-densed water trickles along the quartz stone sides andinfiltrates deeper into the soil, as Vogel (1955) observedin an experimental approach. During drying he foundthat, due to the blocked evaporation, the soil under thestone remained wet for a longer time. This perfectlyagrees with our measurements of far higher and alsomore balanced humidity values under the quartz field ascompared to the soil-inhabiting crust. The lower max-imum soil moisture may also be caused by a lower porespace of soil below soil-inhabiting crusts as compared tohypolithic crusts. Higher moisture contents under thequartz stones as compared to the surrounding soil werealso found by Smith et al. (2000), and in the absence ofrain, Azúa-Bustos et al. (2011) observed humidity valuesabove 90% in the early morning hours.
ConclusionsOur measurements revealed that, in spite of large micro-climatic differences, almost identical biomass values werereached by the soil-inhabiting and hypolithic communi-ties. Whereas the soil habitat was characterized by moreextreme temperatures, short infrequent precipitation-,fog-, and dewfall events, and high light intensities, thetemperatures in the hypolithic environment were morebalanced and water conditions were much more favorable,while light intensities were clearly lower.
Microscopical studies revealed that Chroococcidiopsisonly occurred in the hypolithic habitat, whereas Microcoleusand Nostoc were almost exclusively observed in the soilhabitat. In further studies it would be interesting to inves-tigate the physiological preferences, adaptation, and accli-matization of these communities.
AbbreviationsBSC: Biological soil crust; Chl: Chlorophyll; PAR: Photosynthetically activeradiation.
Competing interestsThe authors declare that they have no competing interests.
Authors’ contributionsBW, KD, SD, DW, and BB designed the project; DW designed the climatestation setup; SD and BB conducted taxonomic determinations; BW, DW, KD,HR, and BB established the climate station in the field; BW, DW, KD and BBevaluated quartz stone colonization; DW KD and BW analyzed the field data;and DW and BW wrote the manuscript. All authors carefully read andapproved the final manuscript.
AcknowledgementsVarious forms of assistance from the Universities of Limpopo (South Africa)and Kaiserslautern (Germany) are gratefully acknowledged. We would like tothank Douw Venter, Rudi Wetterman, and Martin Potgieter (University ofLimpopo) for their help during the design and installation of the climatestations. Research in the Knersvlakte, South Africa, was conducted with
Weber et al. Ecological Processes 2013, 2:8 Page 12 of 13http://www.ecologicalprocesses.com/content/2/1/8

Northern Cape research permits (No. 10/2005, ODB 052/2006) and theappending export permits. This project was financed by the German Ministryfor Education and Research (BmBF) in the framework of BIOTA South(promotion number 01 LC 0024A).
Author details1Department of Biology, University of Kaiserslautern, Plant Ecology andSystematics, PO Box 3049, Kaiserslautern 67653, Germany. 2Now at:Department of Multiphase Chemistry, Max Planck Institute for Chemistry,Hahn-Meitner-Weg 1, Mainz 55128, Germany. 3Department of Biodiversity,School of Molecular and Life Sciences, University of Limpopo, TurfloopCampus, Private Bag X106, Sovenga 0727, South Africa. 4URS DeutschlandGmbH, Europaallee 3-5, Kaiserslautern 67657, Germany.
Received: 11 February 2013 Accepted: 25 March 2013Published: 24 April 2013
ReferencesArnon DI, McSwain BD, Tsuijmoto HY, Wada K (1974) Photochemical activity and
components of membrane preparations from blue-green algae. I.Coexistence of two photosystems in relation to chlorophyll a and removal ofphycocyanin. Biochim Biophys Acta 357:231–245
Azúa-Bustos A, González-Silva C, Mancilla RA, Salas L, Gómez-Silva B, McKay CP,Vicuña R (2011) Hypolithic cyanobacteria supported mainly by fog in theCoastal Range of the Atacama Desert. Microb Ecol 61:568–581
Belnap J, Büdel B, Lange OL (2003) Biological soil crusts: characteristics anddistribution. In: Belnap J, Lange OL (eds) Ecological studies 150: biologicalsoil crusts: structure, function, and management. Springer, Berlin, Heidelberg,New York, pp 3–30
Berner T, Evenari M (1978) The influence of temperature and light penetration onthe abundance of the hypolithic algae in the Negev Desert of Israel.Oecologia 33:255–260
Bhatnagar A, Bhatnagar M (2005) Microbial diversity in desert ecosystems. CurrSci India 1:91–100
Broady PA (1981) The ecology of sublithic terrestrial algae at the Vestfold Hills,Antarctica. Brit Phycol J 16:231–240
Büdel B, Schultz M (2003) A way to cope with high irradiance and drought:inverted morphology of a new cyanobacterial lichen, Peltula inversa sp. nov.,from the Nama Karoo, Namibia. Bibl Lichenol 86:225–232
Büdel B, Wessels DCJ (1991) Rock inhabiting blue-green algae/cyanobacteriafrom hot arid regions. Arch Hydrobiol Suppl Algol Stud 64:385–398
Büdel B, Darienko T, Deutschewitz K, Dojani S, Friedl T, Mohr K, Salisch M, ReisserW, Weber B (2009) Southern African biological soil crusts are ubiquitous andhighly diverse in drylands, being restricted by rainfall frequency. Microb Ecol57(2):229–247
Cameron RE (1960) Communities of soil algae occurring in the Sonoran desert inArizona. J Ariz-Nev Acad Sci 1:85–88
Cameron RE, Blank GB (1967) Soil studies: microflora of desert regions, VIII.Distribution and abundance of desert microflora. JPL Space ProgramsSummary No 37–44 4:193–201, Pasadena, CA
Chan Y, Lacap DC, Lau MCY, Ha KY, Warren-Rhodes KA, Cockell CS, Cowan DA,McKay CP, Pointing SB (2012) Hypolithic microbial communities: between arock and a hard place. Environ Microbiol 14(9):2272–2282
Cockell CS, Stokes MD (2004) Widespread colonization by polar hypoliths. Nature431:414
Cockell CS, Stokes MD (2006) Hypolithic colonization of opaque rocks in theArctic and Antarctic Polar Desert. Arct Antarct Alp Res 38(3):335–342
Cowan DA, Khan N, Pointing SB, Cary SC (2010) Diverse hypolithic refugecommunities in the McMurdo Dry Valleys. Antarct Sci 22(6):714–720
Cowling M, Esler KJ, Rundel PW (1999) Namaqualand, South Africa—an overviewof a unique winter-rainfall desert ecosystem. Plant Ecol 142:3–21
Friedmann EI, Galun M (1974) Desert algae, lichens, and fungi. In: Brown GW (ed)Desert biology, vol II. Academic, London, pp 165–212
Friedmann EI, Lipkin Y, Ocampo-Paus R (1967) Desert algae of the Negev (Israel).Phycologia 6:185–196
Galun M, Garty J (2003) Biological soil crusts of the Middle East. In: Belnap J,Lange OL (eds) Biological soil crusts: structure, function, and management.Springer, Berlin, Heidelberg, New York, pp 95–106
Geitler L (1932) Cyanophyceae von Europa unter Berücksichtigung der anderenKontinente. Akademische Verlagsgesellschaft, Leipzig
Heckman KA, Anderson WB, Wait DA (2006) Distribution and activity of hypolithicsoil crusts in a hyperarid desert (Baja California, Mexico). Biol Fertil Soils43:263–266
Jürgens N, Haarmeyer DH, Luther-Mosebach J, Dengler J, Finckh M, Schmiedel U(2010) Biodiversity in southern Africa. Volume 1: Patterns at local scale—theBIOTA Observatories. , Klaus Hess, Göttingen
Komárek J, Anagnostidis K (1998) Cyanoprocaryota 1. Teil Chroococcales, GustavFischer, Jena
Komárek J, Anagnostidis K (2005) Cyanoprocaryota 2. Teil Oscillatoriales, Elsevier,München
Kühl M, Lassen C, Jørgensen BB (1994) Light penetration and light intensity insandy marine sediments measured with irradiance and scalar irradiance fiber-optic microprobes. Mar Ecol Prog Ser 105:139–148
Kruskopf M, Flynn KJ (2006) Chlorophyll content and fluorescence responsescannot be used to gauge reliably phytoplankton biomass, nutrient status orgrowth rate. New Phytol 169:525–536
Lacap DC, Warren-Rhodes KA, McKay CP, Pointing SB (2011) Cyanobacteria andchloroflexi-dominated hypolithic colonization of quartz at the hyper-aridcore of the Atacama Desert, Chile. Extremophiles 15:31–38
Müller G (2009) Hypolithic plants from Carruthers Peak, Snowy Mountains, NewSouth Wales, Australia. Geogr Res 47(4):449–453
Pointing SB, Warren-Rhodes KA, Lacap DC, Rhodes KL, McKay CP (2007)Hypolithic community shifts occur as a result of liquid water availabilityalong environmental gradients in China’s hot and cold hyperarid deserts.Environ Microbiol 9(2):414–424
Pointing SB, Chan Y, Lacap DC, Lau MCY, Jurgens JA, Farrell RL (2009) Highlyspecialized microbial diversity in hyper-arid polar desert. Proc Natl Acad SciUSA 106:19964–19969
Ronen R, Galun M (1984) Pigment extraction from lichens with dimethylsulfoxide (DMSO) and estimation of chlorophyll degradation. Environ Exp Bot24(3):239–245
Rummrich U, Rummrich M, Lange-Bertalot H (1989) Diatomeen als “Fensteralgen”in der Namib-Wüste und anderen ariden Gebieten von SWA/Namibia.Dinteria 20:23–29
Schlesinger WH, Pippen JS, Wallenstein MD, Hofmockel KS, Klepeis DM, Mahall BE(2003) Community composition and photosynthesis by photoautotrophsunder quartz stones, southern Mojave Desert. Ecology 84:3222–3231
Schmiedel U (2002) The quartz fields of southern Africa. Flora, phytogeography,vegetation and habitat ecology. PhD Dissertation, University of Cologne,Cologne
Smith MC, Bowman JP, Scott FJ, Line MA (2000) Sublithic bacteria associatedwith Antarctic quartz stones. Antarct Sci 12(2):177–184
Tracy CR, Streten-Joyce C, Dalton R, Nussear KE, Gibb KS, Christian KA (2010)Microclimate and limits to photosynthesis in a diverse community ofhypolithic cyanobacteria in northern Australia. Environ Microbiol12(3):592–607
Ullmann I, Büdel B (2003) Biological soil crusts of Africa. In: Belnap J, Lange OL(eds) Biological soil crusts: structure, function, and management. Springer,Berlin, Heidelberg, New York, pp 107–118
Vogel S (1955) Niedere “Fensterpflanzen” in der südafrikanischen Wüste. Eineökologische Sondierung. Beitr Biol Pflanz 31:45–135
Warren-Rhodes KA, Rhodes KL, Pointing SB, Ewing SA, Lacap DC, Gómez-Silva B,Amundson R, Friedmann EI, McKay CP (2006) Hypolithic bacteria, dry limit ofphotosynthesis and microbial ecology in the hyperarid Atacama Desert.Microb Ecol 52:389–398
Weber B, Deutschewitz K, Dojani S, Friedl T, Darienko T, Mohr K, Büdel B (2010)Goedehoop (S26): Biological soil crusts. In: Jürgens N, Haarmeyer DH, Luther-Mosebach J, Dengler J, Finckh M, Schmiedel U (eds) Biodiversity in southernAfrica. Volume 1: Patterns at local scale—the BIOTA Observatories. , KlausHess, Göttingen
Wong FKY, Lacap DC, Lau MCY, Aitchison JC, Cowan DA, Pointing SB (2010)Hypolithic microbial community of quartz pavement in the high-altitudetundra of central Tibet. Microb Ecol 60:730–739
doi:10.1186/2192-1709-2-8Cite this article as: Weber et al.: Ecological characterization of soil-inhabiting and hypolithic soil crusts within the Knersvlakte, SouthAfrica. Ecological Processes 2013 2:8.
Weber et al. Ecological Processes 2013, 2:8 Page 13 of 13http://www.ecologicalprocesses.com/content/2/1/8
Copyright © 2022 FDOKUMEN