Easy and Efficient Disk I/O Workload Characterization in VMware ESX Server
11
Sponsored by IEEE Computer Society and the Technical Committee on Computer Architecture Boston, MA Proceedings of the 2007 IEEE International Symposium on Workload Characterization IISWC - 2007 September 27-29, 2007 IISWC-2007: IEEE International Symposium on Workload Characterization IEEE Cataalog Number: 07EX2006 ISBN: 1-4244-1561-6
-
Upload
independent -
Category
Documents
-
view
0 -
download
0
Transcript of Easy and Efficient Disk I/O Workload Characterization in VMware ESX Server
Sponsored by IEEE Computer Society andthe Technical Committee on Computer Architecture
Boston, MA
Proceedings of the 2007
IEEE International Symposiumon Workload Characterization
IISWC - 2007
September 27-29, 2007IIS
WC
-2007:IE
EE
Intern
ation
alSym
po
sium
on
Wo
rkload
Ch
aracterization
IEE
EC
ataalog
Nu
mb
er:07E
X2006
ISB
N:
1-4244-1561-6
36721_ieeeiswc_covers_nk.qxp 8/6/07 11:05 AM Page 1

Easy and Efficient Disk I/O Workload Characterization in VMware ESX Server
Irfan Ahmad VMware Inc.
Palo Alto, CA 94304 USA [email protected]
Abstract
Collection of detailed characteristics of disk I/O for workloads is the first step in tuning disk subsystem performance. This paper presents an efficient implementation of disk I/O workload characterization using online histograms in a virtual machine hypervisor—VMware ESX Server. This technique allows transparent and online collection of essential workload characteristics for arbitrary, unmodified operating system instances running in virtual machines. For analysis that cannot be done efficiently online, we provide a virtual SCSI command tracing framework. Our online histograms encompass essential disk I/O performance metrics including I/O block size, latency, spatial locality, I/O interarrival period and active queue depth. We demonstrate our technique on workloads of Filebench, DBT-2 and large file copy running in virtual machines and provide an analysis of the differences between ZFS and UFS filesystems on Solaris. We show that our implementation introduces negligible overheads in CPU, memory and latency and yet is able to capture essential workload characteristics.
1. Introduction Understanding disk I/O workload characteristics for enterprise applications is of high importance to IT organizations because application performance can be very sensitive to the parameters of the underlying disk subsystem. For example, optimizing RAID stripe size for a particular application requires the knowledge of the size distribution of I/Os generated by the application [1]. Vendors of enterprise application software don’t always inform users about their workload characteristics. This is because the same application may generate different workload patterns depending upon the user’s configuration. As a result, enterprise IT administrators need tools to perform workload analysis in the field.
Detailed disk workload characterization has been performed at various levels of the system hierarchy:
within an operating system (OS) using instrumented device or filter drivers to collect I/O or system call traces [2], [3], [4], [5], [6], [7], [8], [9], within an OS using native support the OS distribution might include [10], and outside the system using hardware. In each case, distributions of various metrics, or histograms as approximations, are an essential tool in workload characterization.
The first aforementioned technique involves installing an instrumented device driver or a filter driver to collect I/O or system call traces since commodity OS distributions typically don’t include I/O tracing facilities. In many enterprise environments, this will be considered too intrusive for anything but preproduction testing. If a data center has a number of operating systems and service packs installed, this method requires compatible tracers for all of those versions. The second technique is useful if the OS distribution already has support for collecting online I/O workload characteristics [10]. However, it is uncommon for OSes to ship with comprehensive online disk workload characterization support. In some cases, patches are available for open source operating systems to collect online histograms [11], [12]. The last technique mentioned, hardware-based tracing, has its own challenges including requiring an expensive regime of non-commodity hardware interfaces. These techniques may also suffer from the problems associated with analysis of data coming from different sources (e.g., traces from different operating systems) that may use different formats and data fields.
The reason for collecting the aforementioned traces is to post-process them to derive exact workload characteristics. Previous work has established the practice of analyzing traces and generating histograms offline to detect workload properties like spatial locality (or lack thereof). Other important properties include ratio of reads to writes, size of I/O generated, active queue depth, I/O interarrival time and latency of I/O completion. These properties are important in designing a storage system since different workloads require different disk striping designs [1]. Other
1491-4244-1562-4/07/$25.00 ©2007 IEEE
previous work has used statistics [13] or histograms [10], [11], [12] at runtime for a subset of these metrics.
Since workloads may change over time, it is important to continually monitor workload characteristics and to optimize the storage subsystem with the aim of providing full performance throughout the software lifecycle of the application. Interestingly, workload characterization is also useful for application developers to help them optimize their I/O routines or to document best practices based on such analysis.
This paper presents an efficient implementation of disk I/O workload characterization using histograms in a virtual machine hypervisor—VMware ESX Server. This technique allows transparent and online collection of essential workload characteristics for arbitrary, unmodified operating system instances running in virtual machines. These histograms encompass essential disk I/O performance metrics mentioned earlier. By detecting these properties at the hypervisor layer, we are able to characterize arbitrary OS instances running arbitrary applications. By using online histograms, we are able to collect this data in a highly efficient manner without introducing significant workload-changing perturbations and without collecting traces. As such, we are able to support collection of this data at arbitrary intervals over time to help system administrators monitor and then optimize for changing workload characteristics. Delivering these capabilities in a widely deployed hypervisor brings disk workload characterization within the grasp of IT administrators thus lowering the bar on its complexity. For the purposes of this paper we deal with the SCSI protocol but the technique is not exclusive to SCSI.
We demonstrate our technique on workloads of several benchmarks including Filebench, DBT-2 and large file copy running in virtual machines. We show that the technique introduces negligible overhead in CPU, memory and latency and yet is able to capture essential workload characteristics.
More thorough analysis may still require an I/O trace so we provide a simple virtual SCSI command tracing framework. Since our instrumentation is available at the hypervisor, we are able to collect command traces for arbitrary, unmodified guest OSes and applications.
The rest of this paper is organized as follows. Section 2 presents an overview of the ESX Server architecture. Section 3 describes our design for efficient online workload characterization using histograms and then section 4 presents some interesting results that we have obtained. The performance evaluation of our approach is covered in section 5. We present related work in section 6 and our conclusions and future work in section 7.
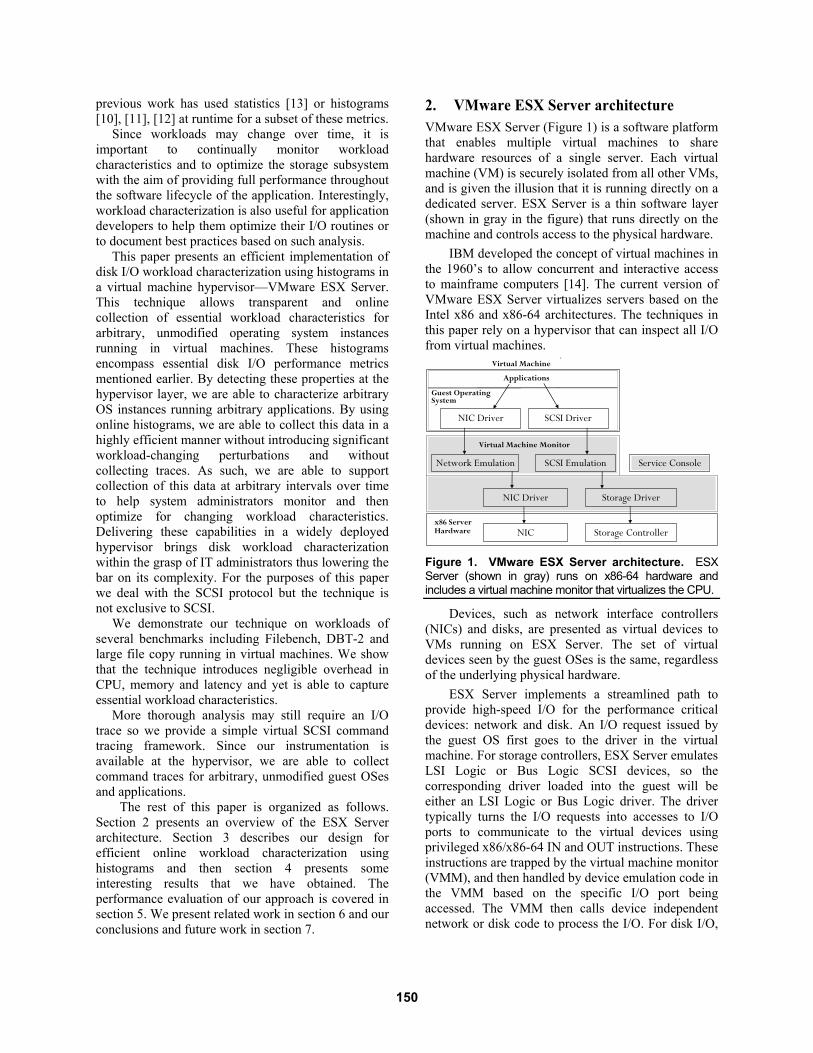
2. VMware ESX Server architecture VMware ESX Server (Figure 1) is a software platform that enables multiple virtual machines to share hardware resources of a single server. Each virtual machine (VM) is securely isolated from all other VMs, and is given the illusion that it is running directly on a dedicated server. ESX Server is a thin software layer (shown in gray in the figure) that runs directly on the machine and controls access to the physical hardware.
IBM developed the concept of virtual machines in the 1960’s to allow concurrent and interactive access to mainframe computers [14]. The current version of VMware ESX Server virtualizes servers based on the Intel x86 and x86-64 architectures. The techniques in this paper rely on a hypervisor that can inspect all I/O from virtual machines.
1.
NIC Storage Controller
NIC Driver Storage Driver
Service ConsoleSCSI EmulationNetwork Emulation
SCSI DriverNIC Driver
x86 ServerHardware
Guest Operating System
Applications
Virtual Machine
Virtual Machine Monitor
Figure 1. VMware ESX Server architecture. ESX Server (shown in gray) runs on x86-64 hardware and includes a virtual machine monitor that virtualizes the CPU.
Devices, such as network interface controllers (NICs) and disks, are presented as virtual devices to VMs running on ESX Server. The set of virtual devices seen by the guest OSes is the same, regardless of the underlying physical hardware.
ESX Server implements a streamlined path to provide high-speed I/O for the performance critical devices: network and disk. An I/O request issued by the guest OS first goes to the driver in the virtual machine. For storage controllers, ESX Server emulates LSI Logic or Bus Logic SCSI devices, so the corresponding driver loaded into the guest will be either an LSI Logic or Bus Logic driver. The driver typically turns the I/O requests into accesses to I/O ports to communicate to the virtual devices using privileged x86/x86-64 IN and OUT instructions. These instructions are trapped by the virtual machine monitor (VMM), and then handled by device emulation code in the VMM based on the specific I/O port being accessed. The VMM then calls device independent network or disk code to process the I/O. For disk I/O,
150
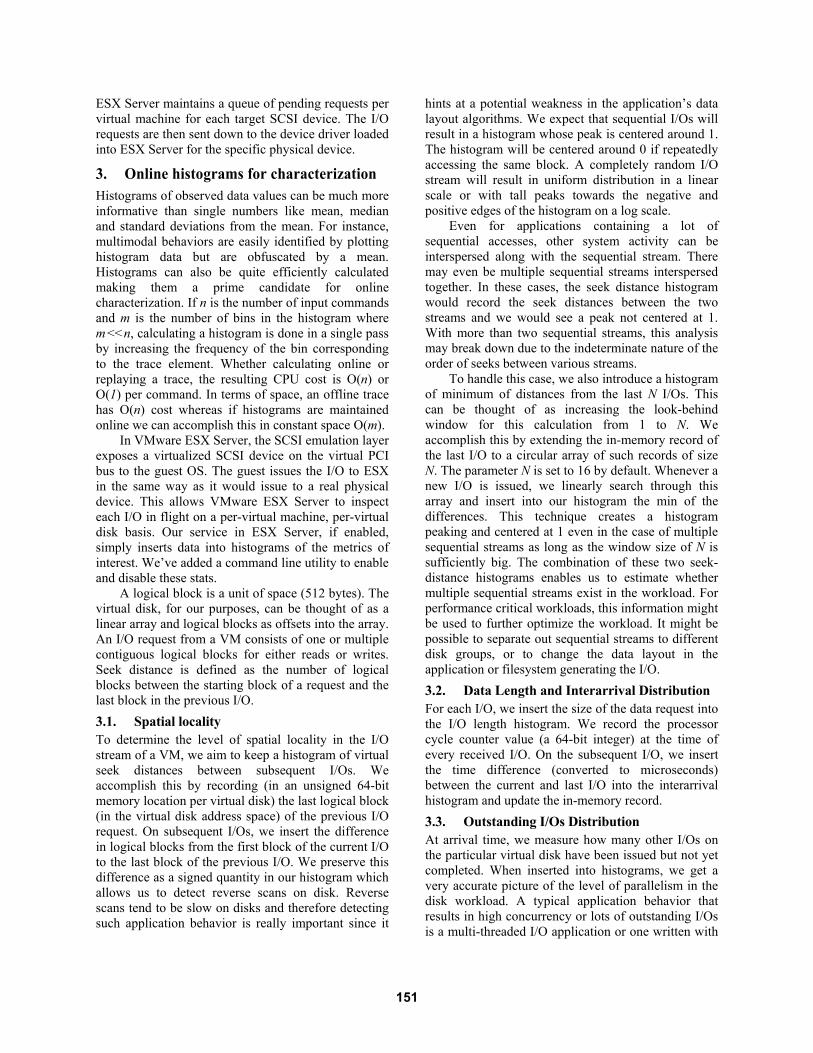
ESX Server maintains a queue of pending requests per virtual machine for each target SCSI device. The I/O requests are then sent down to the device driver loaded into ESX Server for the specific physical device.
3. Online histograms for characterization Histograms of observed data values can be much more informative than single numbers like mean, median and standard deviations from the mean. For instance, multimodal behaviors are easily identified by plotting histogram data but are obfuscated by a mean. Histograms can also be quite efficiently calculated making them a prime candidate for online characterization. If n is the number of input commands and m is the number of bins in the histogram where m << n, calculating a histogram is done in a single pass by increasing the frequency of the bin corresponding to the trace element. Whether calculating online or replaying a trace, the resulting CPU cost is O(n) or O(1) per command. In terms of space, an offline trace has O(n) cost whereas if histograms are maintained online we can accomplish this in constant space O(m).
In VMware ESX Server, the SCSI emulation layer exposes a virtualized SCSI device on the virtual PCI bus to the guest OS. The guest issues the I/O to ESX in the same way as it would issue to a real physical device. This allows VMware ESX Server to inspect each I/O in flight on a per-virtual machine, per-virtual disk basis. Our service in ESX Server, if enabled, simply inserts data into histograms of the metrics of interest. We’ve added a command line utility to enable and disable these stats.
A logical block is a unit of space (512 bytes). The virtual disk, for our purposes, can be thought of as a linear array and logical blocks as offsets into the array. An I/O request from a VM consists of one or multiple contiguous logical blocks for either reads or writes. Seek distance is defined as the number of logical blocks between the starting block of a request and the last block in the previous I/O. 3.1. Spatial locality To determine the level of spatial locality in the I/O stream of a VM, we aim to keep a histogram of virtual seek distances between subsequent I/Os. We accomplish this by recording (in an unsigned 64-bit memory location per virtual disk) the last logical block (in the virtual disk address space) of the previous I/O request. On subsequent I/Os, we insert the difference in logical blocks from the first block of the current I/O to the last block of the previous I/O. We preserve this difference as a signed quantity in our histogram which allows us to detect reverse scans on disk. Reverse scans tend to be slow on disks and therefore detecting such application behavior is really important since it
hints at a potential weakness in the application’s data layout algorithms. We expect that sequential I/Os will result in a histogram whose peak is centered around 1. The histogram will be centered around 0 if repeatedly accessing the same block. A completely random I/O stream will result in uniform distribution in a linear scale or with tall peaks towards the negative and positive edges of the histogram on a log scale.
Even for applications containing a lot of sequential accesses, other system activity can be interspersed along with the sequential stream. There may even be multiple sequential streams interspersed together. In these cases, the seek distance histogram would record the seek distances between the two streams and we would see a peak not centered at 1. With more than two sequential streams, this analysis may break down due to the indeterminate nature of the order of seeks between various streams.
To handle this case, we also introduce a histogram of minimum of distances from the last N I/Os. This can be thought of as increasing the look-behind window for this calculation from 1 to N. We accomplish this by extending the in-memory record of the last I/O to a circular array of such records of size N. The parameter N is set to 16 by default. Whenever a new I/O is issued, we linearly search through this array and insert into our histogram the min of the differences. This technique creates a histogram peaking and centered at 1 even in the case of multiple sequential streams as long as the window size of N is sufficiently big. The combination of these two seek-distance histograms enables us to estimate whether multiple sequential streams exist in the workload. For performance critical workloads, this information might be used to further optimize the workload. It might be possible to separate out sequential streams to different disk groups, or to change the data layout in the application or filesystem generating the I/O. 3.2. Data Length and Interarrival Distribution For each I/O, we insert the size of the data request into the I/O length histogram. We record the processor cycle counter value (a 64-bit integer) at the time of every received I/O. On the subsequent I/O, we insert the time difference (converted to microseconds) between the current and last I/O into the interarrival histogram and update the in-memory record. 3.3. Outstanding I/Os Distribution At arrival time, we measure how many other I/Os on the particular virtual disk have been issued but not yet completed. When inserted into histograms, we get a very accurate picture of the level of parallelism in the disk workload. A typical application behavior that results in high concurrency or lots of outstanding I/Os is a multi-threaded I/O application or one written with
151
async I/O issuing and processing models. Examples include database managements systems, fileservers and web servers. 3.4. Separate Read/Write Distributions We also separate out histograms for read and write commands which permits analysis specific to operation type. As an example, if only the writes in a workload are sequential and not reads we would be able to detect that using our histograms. Another compelling example: if write I/O latencies against a RAID array are much higher than reads that might point to problems with the write-back cache strategy or cache capacity at the disk subsystem. This also provides an accurate ratio of reads and writes. 3.5. Device Latency Distribution Similarly, we track device I/O latencies in a histogram. Latencies are a function of not just the I/O generated by the application but also the underlying disk subsystem. In particular, the external load on the disk subsystem from other applications may have an impact on I/O completion times. As such, latency histograms are useful for evaluating whether the storage devices are performing in line with expectations. For example, if other workloads are also operating on the same storage device, the device latencies reported will be different. 3.6. Limits of the approach Further analysis along the lines of correlating the aforementioned metrics may also be of interest. For example, it might be interesting to correlate seek distance with latency. Such correlations are possible using online techniques including with the use of 2d histograms. Our current work only deals with 1d histograms so we cannot answer those questions. Such analysis, for now, requires using SCSI traces.
Online histograms do have their limits. In particular, any metric that cannot be computed efficiently or in constant time and space per input command is not a good candidate for this technique. For example, online temporal locality estimation is difficult to obtain in constant time and is not implemented. We could estimate temporal locality under a max reuse distance by keeping logical addresses of recent commands up to that value. Assuming the guest OS has a buffer cache, reuse distances will be non-trivially long making them expensive to search and maintain online.
It is worth repeating that the locality estimate captured in our histograms is that of the stream of I/O from a VM to a virtual disk. When this I/O is actually issued to the storage device, other factors might disturb the translation of this locality to the real disks. Examples include multiple hosts or virtual machines
issuing I/O to the same storage device or resource utilization, scheduling or QoS constraints specified by the administrator and imposed by the hypervisor.
Since our online histograms are on a per virtual disk basis, certain complex workloads where trends may not be easily discernable may benefit from splitting the workload between multiple virtual disks. This might make the analysis easier by separating out different parts of it. Furthermore, if allocated on different underlying disk groups it might improve overall performance if each virtual disk is placed on a group optimized for its access pattern. 3.7. Multi-VM behavior If multiple VMs perform I/O to the same physical device, the workloads will tend to interfere resulting in potentially more disk seeks. Similarly, cache read ahead hit rates are sensitive to multiple streams. Therefore a higher end-to-end latency is experienced for the VM under measurement which in turn can affect I/O interarrival time. Therefore, analysis based on these two metrics needs to be carefully considered since it may be affected by other VMs on the same disk. Several points are worthy of mention here.
This effect is observed whenever multiple clients issue requests to a shared resource e.g. a storage array, NFS server or Web server and the multi-VM scenario is no exception. Client-side characterization (as with our work) can capture the full effect of other clients in terms of the changed latencies observed but this may not yield further insights. In our case, whereas latency and interarrival time are clearly affected, a larger subset of metrics including distributions of I/O size, spatial locality, read/write ratios and active queue sizes are not sensitive to I/O load from unrelated but collocated VMs. It must be noted that even if only one VM is loaded up on an ESX host, isolation cannot be guaranteed since the target storage might be busy servicing requests from unrelated (perhaps non-virtualized) initiator hosts.
Furthermore, latency and interarrival times are essential metrics to close the feedback loop after optimizations are done by storage administrators even in shared environments. Of course, if highly accurate characterization is the sole aim, the workload can be run in an isolated ESX and storage setup.
Previous work in computer architecture workload characterization differentiates between architecture dependent and independent characteristics [15]. Similarly, virtual-disk relative spatial locality, request size, outstanding I/Os and read/write ratio distributions can be thought of as environment independent whereas latency and interarrival time are environment dependent characteristics.
152

4. Results In this section, we review some of the interesting results that we have encountered using our online histograms. We performed our experiments on a commodity AMD-based system from Hewlett Packard connected to an EMC Symmetrix array. See Table 1 for setup details. We provide data for multiple different OSes running in virtual machines on VMware ESX Server. To our knowledge, no disk workload explicitly checks whether it is being run in a virtual machine to modify its behavior. We believe that most characteristics that we discover running these workloads in virtual machines also apply to native systems.
To make the histogram data practical, we have chosen the bin sizes for each of the histograms on rather irregular scales. For example, the I/O length histogram in Figure 2(a) has, among others, the following bin ranges: 2048, 4095, 4096, 8191, 8192. These are really odd sizes in that some buckets are big and others are as small as just 1. However, when analyzing disk I/O, certain block sizes are really special since the underlying storage subsystems may optimize for them. We want to single those out right from the start because once inserted into the histogram, we’ll lose that precise information. For example, it is important to know if the I/O was 16KB or some other size in the interval (8KB,16KB). A post-processing script could easily compress ranges back into powers of two or some other desired scheme.
Table 1. Machine / storage specifications
Machine Model HP DL 585 G2 CPU 8 CPUs (4 socket, dual-core) @2.4 GHz Total Memory 8 GB Hypervisor VMware ESX Server 3 Disk Subsystem (4Gb SAN)
• EMC Symmetrix 500GB RAID-5 • Qlogic 2340 (4Gb Fibre Channel)
4.1. Filebench OLTP (Solaris—ZFS v. UFS) Filebench is a model based workload generator for file systems developed by Sun Microsystems [16]. The input to this program is a model file that specifies processes and threads in a workflow. These flows could be open or synchronized. An example of open flow is an unconditional sequential read of a file with some think times specified. A synchronized flow might be multiple threads that do some I/O and think time but must synchronize before proceeding. The model specification language is rich and allows different request types including read, write, create, delete and append. Rate and throughput limits can be specified as well as I/O size, probabilities and I/O patterns. Several model files are included with the Filebench distribution.
The Filebench OLTP “personality” is a model that tries to emulate an Oracle database server generating I/Os under an online transaction processing workload. We ran Filebench on Solaris 5.11 (build 55) using two different filesystems (UFS and ZFS) to look at what effect a filesystem can have on I/O characteristics. Only three parameters were changed from their default values: total filesize is 10GB, logfilesize is 1GB and memperthread is 3MB.
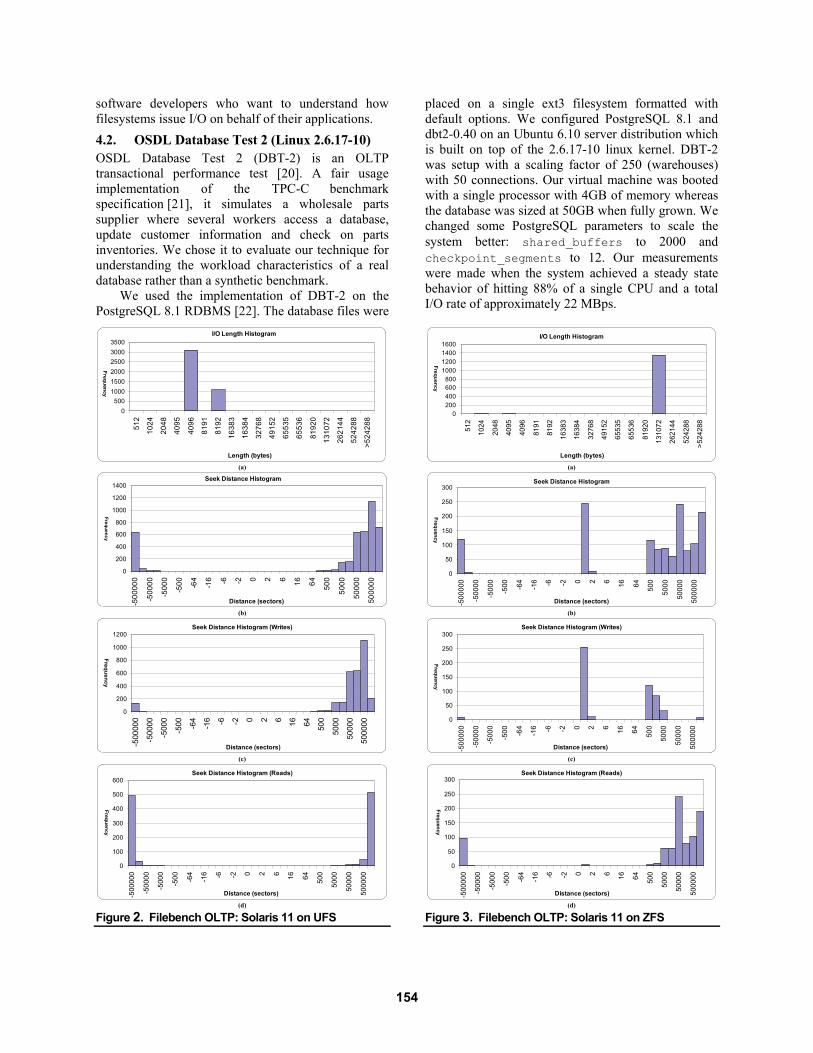
Histograms for UFS and ZFS (Figures 2 and 3 respectively) highlight many surprising differences between the two cases. Comparing I/O lengths, (a) in both figures, it immediately becomes apparent that ZFS is employing very aggressive optimizations. Note that Filebench OLTP is configured to issue approximately 4KB sized I/Os. Our data shows that ZFS is issuing I/Os of sizes between 80KB and 128KB whereas UFS is issuing I/Os of sizes 4KB and 8KB which is closer to the original data stream from Filebench OLTP. As a result of this, the performance of OLTP on ZFS is significantly higher than on UFS.
Another interesting observation is the great discrepancy in seek distance which is a measure of how sequential a workload is. As expected, the OLTP workload is quite random (Figure 2(b)). Table space reads and updates are intermixed with log writes resulting in a lot of randomness in the I/O stream (spikes at the right and left edges of graph). However, ZFS is implementing an optimization, see Figure 3(b), which is creating a lot of sequential I/O. Since our histograms are also broken down by read and write I/Os, we can drill down further to detect patterns (see parts (c) and (d) in both figures). Notice that UFS isn’t doing anything special since the workload shows randomness for both reads and writes. ZFS, for the same OLTP workload, is generating random reads (expected, see Figure 3(d)) but also a lot of sequential writes as apparent from Figure 3(c) implying that it is turning random writes into sequential I/O. In fact, a large proportion of the writes are sequential (the x-axis histogram bin ranges are more or less log scale).
While investigating this behavior, we came across documentation [17][18] which confirmed that, in addition to aggressive I/O scheduling, ZFS is employing a copy-on-write (COW) technique similar to log structured filesystems [19]. In other words, the blocks on disk containing data are never modified in place. Rather, the changes resulting from an application write are written to alternate locations on the disk. The behavior we observe in Figure 3(c) is consistent with this: ZFS is streaming the otherwise random data writes to a sequential pattern on disk.
As in this example, our online histograms technique is very good at showing I/O characteristics useful not only to the system administrator but also to
153
software developers who want to understand how filesystems issue I/O on behalf of their applications. 4.2. OSDL Database Test 2 (Linux 2.6.17-10) OSDL Database Test 2 (DBT-2) is an OLTP transactional performance test [20]. A fair usage implementation of the TPC-C benchmark specification [21], it simulates a wholesale parts supplier where several workers access a database, update customer information and check on parts inventories. We chose it to evaluate our technique for understanding the workload characteristics of a real database rather than a synthetic benchmark.
We used the implementation of DBT-2 on the PostgreSQL 8.1 RDBMS [22]. The database files were
placed on a single ext3 filesystem formatted with default options. We configured PostgreSQL 8.1 and dbt2-0.40 on an Ubuntu 6.10 server distribution which is built on top of the 2.6.17-10 linux kernel. DBT-2 was setup with a scaling factor of 250 (warehouses) with 50 connections. Our virtual machine was booted with a single processor with 4GB of memory whereas the database was sized at 50GB when fully grown. We changed some PostgreSQL parameters to scale the system better: shared_buffers to 2000 and checkpoint_segments to 12. Our measurements were made when the system achieved a steady state behavior of hitting 88% of a single CPU and a total I/O rate of approximately 22 MBps.
I/O Length Histogram
0500
100015002000250030003500
512
1024
2048
4095
4096
8191
8192
1638
3
1638
4
3276
8
4915
2
6553
5
6553
6
8192
0
1310
72
2621
44
5242
88
>524
288
Length (bytes)
Frequency
(a)
Seek Distance Histogram
0
200
400
600
800
1000
1200
1400
-500
000
-500
00
-500
0
-500 -6
4
-16 -6 -2 0 2 6 16 64 500
5000
5000
0
5000
00
Distance (sectors)
Frequency
(b)
Seek Distance Histogram (Writes)
0
200
400
600
800
1000
1200
-500
000
-500
00
-500
0
-500 -64
-16 -6 -2 0 2 6 16 64 500
5000
5000
0
5000
00
Distance (sectors)
Frequency
(c)
Seek Distance Histogram (Reads)
0
100
200
300
400
500
600
-500
000
-500
00
-500
0
-500 -6
4
-16 -6 -2 0 2 6 16 64 500
5000
5000
0
5000
00
Distance (sectors)
Frequency
(d)
Figure 2. Filebench OLTP: Solaris 11 on UFS
I/O Length Histogram
0200400600800
1000120014001600
512
1024
2048
4095
4096
8191
8192
1638
3
1638
4
3276
8
4915
2
6553
5
6553
6
8192
0
1310
72
2621
44
5242
88
>524
288
Length (bytes)
Frequency
(a)
Seek Distance Histogram
0
50
100
150
200
250
300
-500
000
-500
00
-500
0
-500 -64
-16 -6 -2 0 2 6 16 64 500
5000
5000
0
5000
00
Distance (sectors)
Frequency
(b)
Seek Distance Histogram (Writes)
0
50
100
150
200
250
300
-500
000
-500
00
-500
0
-500 -6
4
-16 -6 -2 0 2 6 16 64 500
5000
5000
0
5000
00
Distance (sectors)
Frequency
(c)
Seek Distance Histogram (Reads)
0
50
100
150
200
250
300
-500
000
-500
00
-500
0
-500 -6
4
-16 -6 -2 0 2 6 16 64 500
5000
5000
0
5000
00
Distance (sectors)
Frequency
(d)
Figure 3. Filebench OLTP: Solaris 11 on ZFS
154

Figure 4 illustrates workload characteristics of the DBT-2/PostgreSQL workload. For space reasons, only some of the more interesting attributes are graphed. Figure 4(a) graphs the seek distance for writes. Notice that although the workload is primarily random (big spikes towards the right and left edges of the graph), many I/Os that are within 500 sectors (20%) or within 5000 sectors (33%) of the previous command indicating some bursts of spatial locality. The workload is almost exclusively 8K for both reads and writes (Figure 4(b)). The number of outstanding I/Os in Figure 4(c) are very different in this workload between reads and writes—PostgreSQL is always issuing around 32 writes simultaneously. Finally, we can see that I/O rate from this workload varying by as much as 15% over a 2 min period in Figure 4(d). 4.3. Microsoft Windows file copy (NTFS) Previous work has shown that large files are increasingly consuming higher proportions of available space on filesystems [23]. Thus it is useful to study the large file copy workload. See Figure 5 for a comparison of large file copy between Microsoft Windows XP Professional and the newer Microsoft Vista Enterprise operating systems.
For the same usage scenario (file copy), the two OSes are behaving very differently. The copy application in Microsoft Windows XP Pro is issuing I/Os of size 64K whereas in Microsoft Vista Enterprise, I/Os are primarily 1MB in size (Figure 5(b)). Larger I/Os means less seeking in Figure 5(c). Latencies, as seen in Figure 5(a), are correspondingly longer for the larger sized I/Os in Vista.
5. Evaluation In this section, we present results for disk micro benchmarks run on our reference test system with and without our histogram instrumentation. In this section we are primarily interested in evaluating the CPU and latency cost of our implementation. 5.1. Micro benchmark software
We used Iometer [24] (version dated 2006.10.31) for the measurement and characterization of native and virtual machine disk subsystems. Iometer is an I/O subsystem measurement and characterization tool for single and clustered systems. It can be used both as a workload generator (it performs I/O operations in order to stress the system) and a measurement tool (it examines and records the performance of its I/O operations and their impact on the system). It is a standard industry open source benchmark. We used Iometer for the performance evaluation of our work because it can be used to generate a purely synthetic workload that will saturate the storage subsystem and allow us to accurately measure the impact of our
service. In our experiment, we used the 4KB Sequential Read workload pattern
We picked a small I/O size because it represents the most realistic worst case scenario. Small sizes are the worst case since the disk array is able to complete a very large number of I/O operations per second in those cases and our overhead is per I/O. Since most filesystems have an allocation unit size of at least 4KB, we pick this as our realistic worst case.
Seek Distance Histogram (Writes)
0
50
100
150
200
250
300
-500
000
-500
00
-500
0
-500 -6
4
-16 -6 -2 0 2 6 16 64 500
5000
5000
0
5000
00
Distance (sectors)Frequency
(a)
I/O Length Histogram
0200400600800
10001200140016001800
512
1024
2048
4095
4096
8191
8192
1638
3
1638
4
3276
8
4915
2
6553
5
6553
6
8192
0
1310
72
2621
44
5242
88
> 52
4288
Length (bytes)
Frequency
(b)
Outstanding I/Os Histogram (Reads, Writes)
0100200300400500600700800900
1000
1 2 4 6 8 12 16 20 24 28 32 64
> 64
I/Os Outstanding at Arrival time
Frequency
ReadsWrites
(c)
1 4 8 16 24 32 > 64S1
S6
S11
S16
0
200
400
600
800
1000
1200
Frequency
I/Os Outstandingat Arrival time
Time (in 6 sec
intervals)
Outstanding I/Os Histogram over Time
1000-1200800-1000600-800400-600200-4000-200
(d)
Figure 4. DBT-2: Linux 2.6.17 on ext3 filesystem. DBT-2 is an OLTP workload using PostgreSQL as database
155
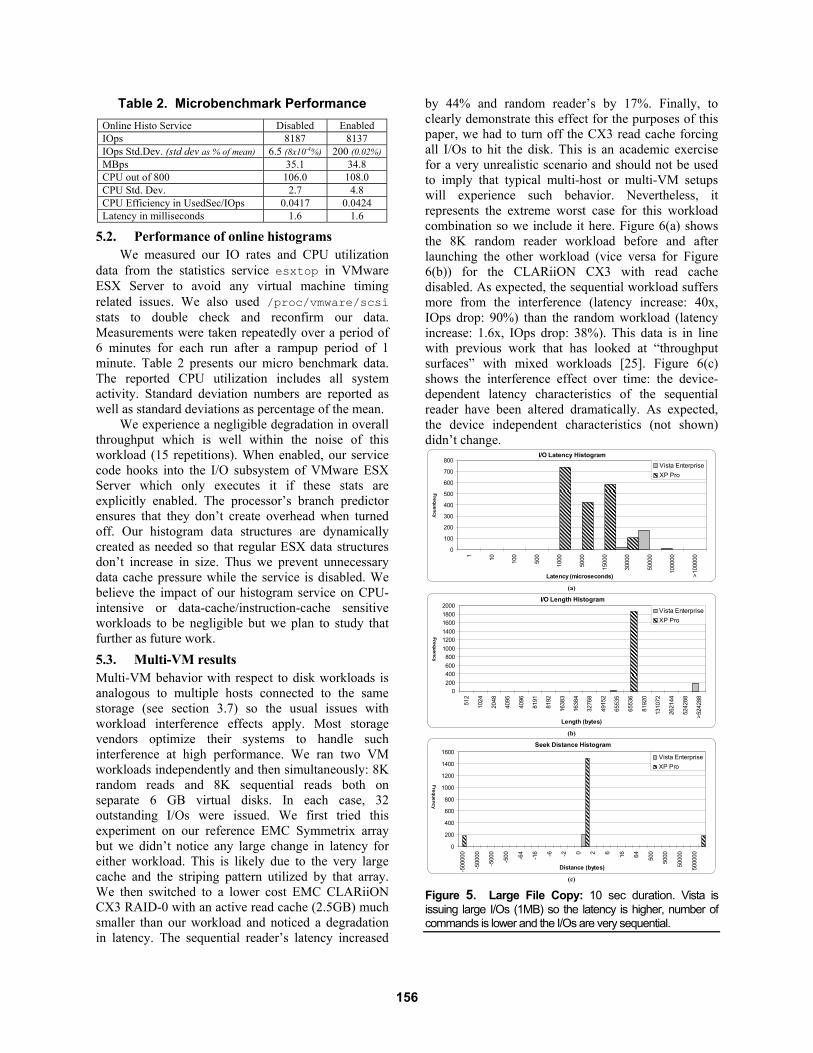
Table 2. Microbenchmark Performance Online Histo Service Disabled Enabled IOps 8187 8137 IOps Std.Dev. (std dev as % of mean) 6.5 (8x10⁻⁴%) 200 (0.02%)MBps 35.1 34.8 CPU out of 800 106.0 108.0 CPU Std. Dev. 2.7 4.8 CPU Efficiency in UsedSec/IOps 0.0417 0.0424 Latency in milliseconds 1.6 1.6
5.2. Performance of online histograms We measured our IO rates and CPU utilization
data from the statistics service esxtop in VMware ESX Server to avoid any virtual machine timing related issues. We also used /proc/vmware/scsi stats to double check and reconfirm our data. Measurements were taken repeatedly over a period of 6 minutes for each run after a rampup period of 1 minute. Table 2 presents our micro benchmark data. The reported CPU utilization includes all system activity. Standard deviation numbers are reported as well as standard deviations as percentage of the mean.
We experience a negligible degradation in overall throughput which is well within the noise of this workload (15 repetitions). When enabled, our service code hooks into the I/O subsystem of VMware ESX Server which only executes it if these stats are explicitly enabled. The processor’s branch predictor ensures that they don’t create overhead when turned off. Our histogram data structures are dynamically created as needed so that regular ESX data structures don’t increase in size. Thus we prevent unnecessary data cache pressure while the service is disabled. We believe the impact of our histogram service on CPU-intensive or data-cache/instruction-cache sensitive workloads to be negligible but we plan to study that further as future work. 5.3. Multi-VM results Multi-VM behavior with respect to disk workloads is analogous to multiple hosts connected to the same storage (see section 3.7) so the usual issues with workload interference effects apply. Most storage vendors optimize their systems to handle such interference at high performance. We ran two VM workloads independently and then simultaneously: 8K random reads and 8K sequential reads both on separate 6 GB virtual disks. In each case, 32 outstanding I/Os were issued. We first tried this experiment on our reference EMC Symmetrix array but we didn’t notice any large change in latency for either workload. This is likely due to the very large cache and the striping pattern utilized by that array. We then switched to a lower cost EMC CLARiiON CX3 RAID-0 with an active read cache (2.5GB) much smaller than our workload and noticed a degradation in latency. The sequential reader’s latency increased
by 44% and random reader’s by 17%. Finally, to clearly demonstrate this effect for the purposes of this paper, we had to turn off the CX3 read cache forcing all I/Os to hit the disk. This is an academic exercise for a very unrealistic scenario and should not be used to imply that typical multi-host or multi-VM setups will experience such behavior. Nevertheless, it represents the extreme worst case for this workload combination so we include it here. Figure 6(a) shows the 8K random reader workload before and after launching the other workload (vice versa for Figure 6(b)) for the CLARiiON CX3 with read cache disabled. As expected, the sequential workload suffers more from the interference (latency increase: 40x, IOps drop: 90%) than the random workload (latency increase: 1.6x, IOps drop: 38%). This data is in line with previous work that has looked at “throughput surfaces” with mixed workloads [25]. Figure 6(c) shows the interference effect over time: the device-dependent latency characteristics of the sequential reader have been altered dramatically. As expected, the device independent characteristics (not shown) didn’t change.
I/O Latency Histogram
0
100
200
300
400
500
600
700
8001 10 100
500
1000
5000
1500
0
3000
0
5000
0
1000
00
>100
000
Latency (microseconds)
Frequency
Vista EnterpriseXP Pro
(a)
I/O Length Histogram
0200400600800
100012001400160018002000
512
1024
2048
4095
4096
8191
8192
1638
3
1638
4
3276
8
4915
2
6553
5
6553
6
8192
0
1310
72
2621
44
5242
88
>524
288
Length (bytes)
Frequency
Vista EnterpriseXP Pro
(b)
Seek Distance Histogram
0
200
400
600
800
1000
1200
1400
1600
-500
000
-500
00
-500
0
-500 -64
-16 -6 -2 0 2 6 16 64 500
5000
5000
0
5000
00
Distance (bytes)
Frequency
Vista EnterpriseXP Pro
(c)
Figure 5. Large File Copy: 10 sec duration. Vista is issuing large I/Os (1MB) so the latency is higher, number of commands is lower and the I/Os are very sequential.
156

6. Related work There have been a number of papers that have characterized the file system behavior of workloads. Many papers [2], [3], [4], [5], [6], [7], [8], [9] have focused on trace-based analysis for workload characterization. Analysis is done offline and histograms are useful in this context. Our approach is to perform the workload analysis online without requiring traces. We do this efficiently using online histograms. Using synthetic workloads, such as Iometer, to model applications is another well-known technique [25], [26]. However, that requires detailed knowledge of the characteristics of the workload being simulated. In this paper, we have demonstrated the utility of online histograms rather than trace-based analysis for this purpose.
Online workload analysis has also been studied before. Moilanen [13] tracks read/write ratios, average size and infers an average seek distance in Linux with the aim of creating a workload specific fingerprint useful for automatically tuning filesystem parameters under a genetic algorithm. With respect to online measurements in that paper, our work is more comprehensive both in terms of breadth of metrics as well as detail (histograms). The online tuning aspect of Moilanen is complementary to our work. Falk [11] provides an implementation of request size and completion time histograms for block devices in the Linux kernel. The goal of the patch is similar but our work tracks more metrics and is applicable to any OS that can be run in ESX Server. As of Linux kernel 2.6.21, this patch wasn’t part of the mainline Linux kernel. Our work was first released as a statistics service in ESX Server 3.0 predating this patch. The Pablo Physical I/O Facility tool [12] has a patch for the Linux kernel which captures histograms of request size, time spent in device queue and latency of overall I/O. Our work captures a more comprehensive set of disk workload characteristics as seen by the disk than the Pablo tool but one thing that is not visible to the hypervisor is the time spent in the guest OS queues. IBM’s Resource analysis tools for Linux on System z [10] can keep track of histograms of sizes, detailed latencies and number of queued requests. In addition to these histograms, our work provides spatial locality estimation, read/write ratios and breakdown of each of our metrics for reads and writes which are all fundamentally important in disk workload characterization.
Virtual machines were first developed in the 1960's and there is a wealth of literature describing their implementation and performance, for example [27], [28], [29]. Another paper looked at virtualizing I/O devices on VMware's Workstation product [30]
and focused on the networking path. VMware Workstation takes advantage of an underlying commodity OS for its I/O calls; in contrast, ESX Server manages the server's hardware devices directly allowing ESX to achieve higher I/O performance and more predictable I/O behavior closely mimicking how a native system would perform [25].
(a)
(b)
(c)
Figure 6. Multi-VM Interference Effect on Latency
7. Conclusion and future work Disk I/O technology continues to be a bottleneck in the performance of workloads all across the spectrum. There exists a significant data gap in terms of information available to system administrators trying to tune and optimize their storage subsystems. There hasn’t been an easy and manageable way to characterize disk performance for the duration of an application’s software lifecycle.
Our work improves upon comprehensive online disk workload characterization with distributions of spatial locality, read/write ratios, I/O sizes, outstanding I/Os, device latency and interarrival times. The overhead of our implementation is within the noise allowing these stats to remain on all the time. Our work lowers the bar on the complexity involved in disk workload characterization. This should allow IT
I/O Latency Histogram (8K Random Reader)
0
500
1000
1500
2000
2500
1 10 100
500
1000
5000
1500
0
3000
0
5000
0
1000
00
>100
000
Latency (microseconds)
Frequency
Solo VMDual VM
Dual-VM: 91% of I/Os had latency in (15ms,30ms]
Solo-VM: 82% of I/Os had latency in (5ms,15ms]
38% loss in IOps
I/O Latency Histogram (8K Sequential Reader)
02000400060008000
10000120001400016000
1 10 100
500
1000
5000
1500
0
3000
0
5000
0
1000
00
>100
000
Latency (microseconds)
Frequency
Solo VMDual VM
Dual-VM: 86% of I/Os had latency in (15ms,30ms] Solo-VM:
94% of I/Os had latency in (100us,500us]
90% loss in IOps
1500
15000
100000S1
S4
S7
S10S13
S16S19
0
2000
4000
6000
8000
10000
12000
14000
16000
18000
Frequency
Latency (microseconds) Time (in 6 sec intervals)
I/O Latency Histogram over Time (8K Seqn Reader)
16000-18000
14000-16000
12000-14000
10000-12000
8000-10000
6000-8000
4000-6000
2000-4000
0-2000
Phase during which other VM performed random I/O to the same storage device causing a shift in the latency histogram and lowering throughput for this VM's virtual disk. The array read cache is turned off so this is an extreme worst case. Typical user or server application workloads don’t suffer such large interference effects.
157
system administrators and application developers to readily choose, fine tune and optimize their storage subsystems, applications and filesystems with accurate and detailed data.
In this paper, we focused primarily on using online histograms to understand and analyze the performance of disk workloads running in virtual machines on VMware ESX Server.
We then applied our online histograms service to characterize Filebench OLTP, DBT-2 and large file copy workloads. We demonstrated how the choice of filesystems has dramatic effect on the disk workload characteristics of an application by comparing UFS and ZFS on Solaris. Using our tool, one can easily decipher otherwise complex I/O patterns.
The work presented is part of a project to analyze the performance of applications running in virtual machines for various workloads, operating systems and hardware configurations. We plan to investigate automatic categorization of workloads and generation of recommendations for virtual disk placement and storage subsystem optimization.
8. Acknowledgements Many thanks to Mateen Ahmad, Jennifer Anderson, Ken Barr, Anne Holler, John Janakiraman, Devaki Kulkarni, John Liang, Priti Mishra, Alex Protopopescu, Abhishek Rai, Reza Taheri, Rosie Wacha and the anonymous reviewers for their support and helpful suggestions.
9. References [1] P. Chen, E. K. Lee, “Striping in a RAID level 5 disk array”, Proc of the 1995 ACM SIGMETRICS joint international conference on Measurement and modeling of computer systems.
[2] A. Aranya, C. P. Wright, E. Zadok2 “Tracefs: A File System to Trace Them All”, Proc of the Third USENIX Conference on File and Storage Technologies (FAST 2004).
[3] K. Keeton, A. Veitch, D. Obal and J. Wilkes, “I/O Characterization of Commercial Workloads”, Proc. Third Workshop on Computer Architecture Evaluation Using Commerical Workloads, Jan 2000.
[4] J.K. Ousterhout, H. Da Costa, D. Harrison, J.A. Kunze, M. Kupfer and J.G. Thompson, “A Trace-driven Analysis of the UNIX 4.2BSD File System”, Proc. 10th Symposium on Operating Systems Principles, pp. 15-24, Dec 1985.
[5] K.K. Ramakrishnan, P. Biswas and R. Karedla, “Analysis of File I/O Traces in Commercial Computing Environments”, Proc. 1992 ACM SIGMETRICS and PERFORMANCE '92 Intl. Conf. on Measurement and Modeling of Computer Systems, Jun 1992.
[6] D. Roselli, J. Lorch, and T. Anderson, “A Comparison of File System Workloads”, Proc. 2000 USENIX Annual Technical Conference, pp. 41-54, Jun 2000.
[7] C. Ruemmler and J. Wilkes, “UNIX Disk Access Patterns”, Proc. Winter '93 USENIX Conference, pp. 405-420, Jan 1993.
[8] M.E. Gomez and V. Santonja, “Self-similarity in I/O Workloads: Analysis and Modeling”, Proc. First Workshop on Workload Characterization, Nov 1998.
[9] A. Veitch and K. Keeton. “The Rubicon workload characterization tool”, Technical report, HP Laboratories, Apr 2001.
[10] IBM, “Linux on System Z, Resource analysis tools: DASD statistics”, http:// ibm.com/developerworks/linux/linux390/perf/tuning_how_tools_dasd.html
[11] E. Falk, “Patch: Introduce block I/O performance histograms”, http://lwn.net/Articles/209770/
[12] “Physical I/O Characterization: Pablo Physical I/O Tracing Facility”, http://www.renci.org/projects/cadre/CADRETraceLibraries/CADREPhysicalIOLibrary.htm
[13] J. Moilanen, “I/O Workload Fingerprinting in the Genetic-Library”, Ottawa Linux Symposium Proceedings (OLS2006)
[14] R. J. Creasy, “The Origin of the VM/370 Time-Sharing System”, IBM Journal of Research and Development, 25(5), Sep 1981.
[15] L. John, P. Vasudevan and J. Sabarinathan, “Workload Characterization: Motivation, Goals and Methodolgy”, Workload Characterization : Methodology and Case Studies, IEEE Computer Society, edited by L. John and A. M. G. Maynard, 1999.
[16] R. McDougal, “FileBench: A Prototype Model Based Workload for File Systems, Work in Progress” http://www.solarisinternals.com/si/tools/filebench/filebench_nasconf.pdf, pp. 17-19
[17] J. Bonwick, “ZFS The Last Word in File Systems” http://www.opensolaris.org/os/community/zfs/docs/zfs_last.pdf
[18] A. Rich, “ZFS, Sun's Cutting-Edge File System (Part 1)”, http://www.sun.com/bigadmin/features/articles/zfs_part1.scalable.html, Aug 2006.
[19] M. Rosenblum, J.K. Ousterhout, “The Design and Implementation of a Log-Structured File System”, ACM Transactions on Computer Systems, Vol. 10 Issue 1, Feb 1992.
[20] http://osdldbt.sourceforge.net/
[21] http://www.tpc.org/tpcc
[22] http://www.postgresql.org/docs/techdocs
[23] N. Agrawal, W. J. Bolosky, J.R. Douceur, and J.R. Lorch, “A Five-Year Study of File-System Metadata”, Proc. of 5th Conference on File and Storage Technologies (FAST ‘07), Feb 2007.
[24] http://sourceforge.net/projects/iometer
[25] I. Ahmad, J. M. Anderson, A. M. Holler, R. Kambo, V. Makhija, “An analysis of disk performance in VMware ESX server virtual machines”, IEEE International Workshop on Workload Characterization (WWC-6), Oct. 2003.
[26] K. Keeton and D. Patterson, "Towards a Simplified Database Workload for Computer Architecture Evaluations," Proc. Second Workshop on Workload Characterization, Oct 1999.
[27] R.P. Goldberg, "Survey of Virtual Machine Research", IEEE Computer, 7(6), Jun 1974.
[28] E. Bugnion, S. Devine, K. Govil and M. Rosenblum, "Disco: Running Commodity Operating Systems on Scalable Multiprocessors", ACM Trans on Computer Systems, Nov 1997.
[29] B. Ford, M. Hibler, J. Lepreau, P. Tullman, G. Back and S. Clawson, "Microkernels Meet Recursive Virtual Machines", Proc. Symp. on Operating System Design and Implementation, Oct 1996.
[30] J. Sugerman, G.Venkitachalam and B.-H. Lim, "Virtualizing I/O Devices on VMware Workstation's Hosted Virtual Machine Monitor", Proc. of Usenix Annual Technical Conference, pp. 1-14, Jun 2001.
158