EASTSPRING INVESTMENTS TARGET INCOME FUND 4
66
FOR THE SIX MONTHS FINANCIAL PERIOD ENDED 31 MARCH 2020 INTERIM REPORT EASTSPRING INVESTMENTS TARGET INCOME FUND 4
-
Upload
khangminh22 -
Category
Documents
-
view
1 -
download
0
Transcript of EASTSPRING INVESTMENTS TARGET INCOME FUND 4

FOR THE SIX MONTHS FINANCIAL PERIOD ENDED 31 MARCH 2020
INTERIM REPORT
EASTSPRING INVESTMENTSTARGET INCOME FUND 4
Eastspring Investments Berhad 200001028634 (531241-U)
Level 22, Menara Prudential, Persiaran TRX Barat55188 Tun Razak Exchange, Kuala LumpurT: (603) 2778 3888 F: (603) 2789 7220eastspring.com/my
Client ServicesT: (603) 2778 1000 [email protected]

Dear Valued Investor,
Greetings from Eastspring Investments Berhad!
First and foremost, we would like to take this opportunity to thank you for choosing to invest with Eastspring Investments Berhad.
We are pleased to enclose a copy of the Annual/Interim/Quarterly Fund Reports of Eastspring Investments Berhad’s fund(s) for the reporting period ended 31 March 2020.
You may also download these reports from our website at www.eastspring.com/my
Should you require any assistance, please do not hesitate to contact our Client Services at 03-2778 1000.
Yours sincerely,
Raymond Tang Chee Kin Non-Independent, Executive Director and Chief Executive Officer

TABLE OF CONTENTS
Fund Information 1
Key Performance Data 3
Manager’s Report 5
Market Review 9
Rebates and Soft Commissions 9
Statement by the Manager 12
Trustee’s Report to the Unit Holders of
Eastspring Investments Target Income Fund 4 13
Unaudited Statement of Comprehensive Income 14
Unaudited Statement of Financial Position 15
Unaudited Statement of Changes in Equity 16
Unaudited Statement of Cash Flows 17
Summary of Significant Accounting Policies 18
Notes to the Unaudited Financial Statements 28
Corporate Directory 61

FUND INFORMATION
Name of Fund Eastspring Investments Target* Income Fund 4 (the “Fund“)
* The Fund aims (i.e. Target) to distribute income on an annual basis from the coupon payments received from the bonds investment.
Fund Category/ Type
Bond (close-ended)/income
Fund Objective The Fund endeavours to provide regular income* during the tenure of the Fund.
* Income declared will be paid out either by way of E-payment according to Unit Holders’ instructions in the account opening form or by cheque.
Termination Date 7 October 2020
Duration of the Fund
Five (5) years close-ended bond.
Performance Benchmark
5-year Maybank fixed deposit rate as at Commencement Date.
Please note that investors may obtain information on the benchmark from the Manager upon request.
As the Fund will invest in local and foreign markets across various bonds of different ratings, the risk profile of the Fund is not the same as the risk profile of the performance benchmark.
Fund Income Distribution Policy
Distribution of income, if any, will be on annual basis, after deduction of taxation and expenses.
1Client Services : 03-2778 1000
Interim Report

Breakdown of Unit Holdings by Size
As at 31 March 2020, the size of Eastspring Investments Target Income Fund 4 stood at 85.620 million units.
Fund Size
Breakdown of Unit Holdings
Unit Holdings
No. of Unit
Holders %
No. of Units* (‘000) %
5,000 units and below 45 22.73 161 0.19 5,001 to 10,000 units 53 26.77 510 0.60 10,001 to 50,000 units 61 30.81 1,963 2.29 50,001 to 500,000 units 34 17.17 3,570 4.17 500,001 units and above 5 2.52 79,415 92.75
Total 198 100.00 85,619 100.00
* excludes units held by the Manager.
FUND INFORMATION (CONTINUED)
Un
its
(Mill
ion
)100
80
60
40
20
0Oct
2019Nov2019
Dec2019
Jan2020
Feb2020
Mar2020
Client Services : 03-2778 10002
Eastspring Investments Target Income Fund 4
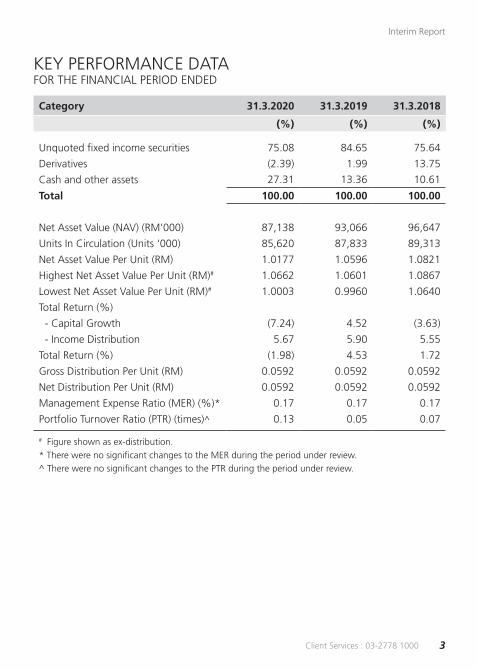
KEY PERFORMANCE DATAFOR THE FINANCIAL PERIOD ENDED
Category 31.3.2020 31.3.2019 31.3.2018
(%) (%) (%)
Unquoted fixed income securities 75.08 84.65 75.64
Derivatives (2.39) 1.99 13.75
Cash and other assets 27.31 13.36 10.61
Total 100.00 100.00 100.00
Net Asset Value (NAV) (RM'000) 87,138 93,066 96,647
Units In Circulation (Units '000) 85,620 87,833 89,313
Net Asset Value Per Unit (RM) 1.0177 1.0596 1.0821
Highest Net Asset Value Per Unit (RM)# 1.0662 1.0601 1.0867
Lowest Net Asset Value Per Unit (RM)# 1.0003 0.9960 1.0640
Total Return (%)
- Capital Growth (7.24) 4.52 (3.63)
- Income Distribution 5.67 5.90 5.55
Total Return (%) (1.98) 4.53 1.72
Gross Distribution Per Unit (RM) 0.0592 0.0592 0.0592
Net Distribution Per Unit (RM) 0.0592 0.0592 0.0592
Management Expense Ratio (MER) (%)* 0.17 0.17 0.17
Portfolio Turnover Ratio (PTR) (times)^ 0.13 0.05 0.07
# Figure shown as ex-distribution.* There were no significant changes to the MER during the period under review.^ There were no significant changes to the PTR during the period under review.
3Client Services : 03-2778 1000
Interim Report

Bases of calculation and assumptions made in calculating returns:
Percentage growth =
NAVt = NAV at the end of the period
NAV0 = NAV at the beginning of the period Performance annualised = (1 + Percentage Growth)1/n - 1
Adjusted for unit split and distribution paid out for the period
n = Number of years
Past performance is not necessarily indicative of future performance and unit prices and investment returns may go down, as well as up.
NAVt -1NAV0
KEY PERFORMANCE DATA (CONTINUED)
1 year1.4.2019 to
31.3.2020
3 years1.4.2017 to
31.3.2020
Since commencement
7.10.2015 to31.3.2020
(%) (%) (%)
Average total return 1.52 3.90 5.46
Year ended1.10.2018 to
30.9.20191.10.2017 to
30.9.20181.10.2016 to
30.9.2017
Since commencement
7.10.2015 to30.9.2016
(%) (%) (%) (%)
Annual total return 8.26 0.88 6.96 10.88
Source: The above total return of the Fund was sourced from Lipper for Investment Management.
Client Services : 03-2778 10004
Eastspring Investments Target Income Fund 4

MANAGER’S REPORT
Fund Performance Since inception, the Fund registered a return of 26.96%, outperforming the benchmark return of 16.54% by 10.42%.
For the period under review, the Fund registered a return of -1.98%, underperforming the benchmark return of 1.60% by 3.58%.
Over the period, the Fund’s investments in Asian USD-denominated credits weighed on performance, as the selloff in spreads overshadowed the fall in US risk-free rates. The holdings in Indonesian corporates and the Sri Lanka sovereign, in particular, were notable detractors, given the underperformance of high yield credits versus investment grade credits in the risk-averse backdrop. However, this was mitigated by the positive contribution from the Chinese corporate bond holdings.
The performance is calculated on NAV-to-NAV basis withgross income or dividend reinvested.
Benchmark: 5-year Maybank fixed deposit rate as atCommencement Date.
Fund performance is sourced from Lipper for InvestmentManagement, 31 March 2020 and the benchmarkis obtainable from Eastspring Investments Berhad uponrequest.
Past performance of the Fund is not necessarily indicativeof its future performance.
Eastspring Investments Target Income Fund 4 Benchmark
Eastspring Investments Target Income Fund 4- Since Inception (SI) Return Vs Benchmark
Oct2015
-5%
0%
5%
10%
15%
20%
30%
40%
35%
25%
-5%
0%
5%
10%
15%
20%
30%
40%
35%
25%
Feb2016
Jul2016
Nov2016
Apr2017
Aug2017
Dec2017
Sep2018
Feb2019
Nov2019
SI%
Ch
ang
e
May2018
Jun2019
Mar2020
5Client Services : 03-2778 1000
Interim Report

Analysis of Fund Performance
For the financial period ended 31 March 2020:
Income Return
Capital Return*
Total Return
Total Return of Benchmark
(%) (%) (%) (%)
5.67 (7.24) (1.98) 1.60 * Capital return components (NAV per unit to NAV per unit).
Distribution/ Unit Split
Ex-Date 24-Oct-19
Distribution Per Unit (RM)
Gross 0.0592
Net 0.0592
Unit Split Nil
Impact on NAV arising from distribution for the financial period ended 31 March 2020.
Ex-Date 24-Oct-19
(RM per Unit)
Net Asset Value before distribution 1.1032
Less: distribution (0.0592)
Net Asset Value after distribution 1.0440
MANAGER’S REPORT (CONTINUED)
Client Services : 03-2778 10006
Eastspring Investments Target Income Fund 4

MANAGER’S REPORT (CONTINUED)
Investment Strategy During the Period Under Review
As this is a close-ended bond fund, the Fund will be managed primarily with a semi-active management strategy. The Fund’s bond investments will be typically held to maturity. At the maturity of these debt securities, issuers of the debt securities held by the Fund will be obligated to pay the face value provided there is no occurrence of credit default by the issuer.
Nevertheless, the Fund Manager continues to monitor the Fund’s investments and may trade and rebalance its investments under the following scenarios:
• Increased default risk and/or from uptrend interest rate concerns;
• Hedging transactions in the event that the sale of the security at risk is not possible; and
• Reinvesting proceeds from maturing securities
7Client Services : 03-2778 1000
Interim Report
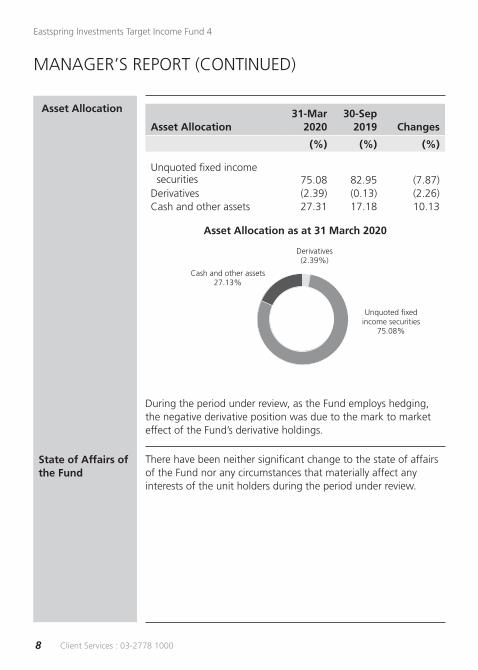
Asset Allocation
Asset Allocation31-Mar
202030-Sep
2019 Changes
(%) (%) (%)
Unquoted fixed income securities 75.08 82.95 (7.87)Derivatives (2.39) (0.13) (2.26)Cash and other assets 27.31 17.18 10.13
Asset Allocation as at 31 March 2020
During the period under review, as the Fund employs hedging, the negative derivative position was due to the mark to market effect of the Fund’s derivative holdings.
State of Affairs ofthe Fund
There have been neither significant change to the state of affairs of the Fund nor any circumstances that materially affect any interests of the unit holders during the period under review.
MANAGER’S REPORT (CONTINUED)
Unquoted fixedincome securities
75.08%
Cash and other assets 27.13%
Derivatives (2.39%)
Client Services : 03-2778 10008
Eastspring Investments Target Income Fund 4

MARKET REVIEW
Despite a positive start, Asian credit markets posted weaker returns in USD terms over the half year under review, with wider credit spreads overshadowing the fall in US risk-free rates. Progress in China-US trade talks and improving risk appetite had buoyed credit markets at first, along with upbeat data that underscored the health of the US economy. The positive backdrop supported the Federal Reserve‘s (“Fed’s”) decision to stay its hand following a well-telegraphed rate cut in October. But sentiment turned in the latter half of the period as the Covid-19 outbreak that started in China evolved into a global pandemic. As global economic activity was disrupted by government lockdown measures, the outlook for corporate earnings and credit ratings deteriorated. The Fed, along with other global central banks, resumed monetary policy aggressively, while governments everywhere introduced massive stimulus packages. However, this failed to appease investors. Market volatility spiked even in safe haven assets. The US Treasury 10-year yield fell by 100 bps to end the period at 0.67%, after touching a historical low of 0.32% in early March.
Liquidity concerns were particularly acute in global credit markets as risk aversion resulted in significant spread widening and heightened worries about corporates’ funding access. In Asia, USD credit spreads widened by 155 bps in aggregate, with more pronounced widening seen in high yield credits. The key laggard was high yield sovereigns, notably Sri Lanka, as investors preferred quality assets in the risk-averse environment. High yield corporate bonds were pressured by the double-digit decline in the metals-and-mining sector amid concerns over weaker demand. Conversely, bucking the regional downtrend was investment grade corporate bonds, which posted a higher overall return, led by strength in the TMT and financials sector.
REBATES AND SOFT COMMISSIONS
During the period under review, the Manager and its delegates (if any) did not receive any soft commissions from stockbrokers.
9Client Services : 03-2778 1000
Interim Report

Client Services : 03-2778 100010
Eastspring Investments Target Income Fund 4
This page is intentionally left blank.

EASTSPRING INVESTMENTS TARGET INCOME FUND 4UNAUDITED FINANCIAL STATEMENTSFOR THE SIX MONTHS FINANCIAL PERIOD ENDED 31 MARCH 2020
11Client Services : 03-2778 1000
Interim Report

STATEMENT BY THE MANAGER
We, Tang Chee Kin and Iskander Bin Ismail Mohamed Ali, being two of the Directors of Eastspring Investments Berhad, do hereby state that, in the opinion of the Manager, the accompanying unaudited financial statements set out on pages 14 to 60 are drawn up in accordance with the provisions of the Deed and give a true and fair view of the financial position of the Fund as at 31 March 2020 and of its financial performance, changes in equity and cash flows for the six months financial period ended on that date in accordance with the Malaysian Financial Reporting Standards and International Financial Reporting Standards.
For and on behalf of the Manager,EASTSPRING INVESTMENTS BERHAD
TANG CHEE KINExecutive Director/Chief Executive Officer
ISKANDER BIN ISMAIL MOHAMED ALI Independent, Non-Executive Director
Kuala LumpurDate: 5 June 2020
Client Services : 03-2778 100012
Eastspring Investments Target Income Fund 4

TRUSTEE’S REPORT TO THE UNIT HOLDERS OF EASTSPRING INVESTMENTS TARGET INCOME FUND 4
We have acted as Trustee for Eastspring Investments Target Income Fund 4 (the “Fund”) for financial period ended to 31 March 2020. To the best of our knowledge, for the financial period under review, Eastspring Investments Berhad (the “Manager”) has operated and managed the Fund in accordance with the following:-
a. limitations imposed on the investment powers of the Manager under the Deed(s), the Securities Commission’s Guidelines on Unit Trust Funds, the Capital Markets and Services Act 2007 and other applicable laws;
b. valuation and pricing for the Fund is carried out in accordance with the Deed(s) of the Fund and any regulatory requirements; and
c. creation and cancellation of units for the Fund are carried out in accordance with the Deed(s) of the Fund and any regulatory requirements.
We are of the view that the distribution made during financial period ended 31 March 2020 by the Manager is not inconsistent with the objectives of the Fund.
For Deutsche Trustees Malaysia Berhad
Ng Hon Leong Richard Lim Hock Seng
Head, Trustee Operations Chief Executive Officer
Kuala LumpurDate: 5 June 2020
13Client Services : 03-2778 1000
Interim Report

UNAUDITED STATEMENT OF COMPREHENSIVE INCOME FOR THE SIX MONTHS FINANCIAL PERIOD ENDED 31 MARCH 2020
Note
6-month financial
period ended 31.3.2020
6-month financial
period ended 31.3.2019
RM RM
INVESTMENT (LOSS)/INCOMEInterest income from deposits with licensed financial institutions 47,803 126,648Interest income from unquoted fixed income securities 2,012,048 2,335,852Exit fee income 28,914 36,037Net (loss)/gain on financial assets at fair value through profit or loss 6 (3,115,047) 589,545Net loss on forward foreign currency contracts (630,042) (5,124,802)Net foreign currency exchange gain 98,943 6,178,780
(1,557,381) 4,142,060EXPENSESManagement fee 3 (91,107) (90,717)Trustee fee 4 (27,332) (27,215)Audit fee (6,250) (6,234)Tax agent fee (6,249) (1,696)Other expenses (21,438) (24,499)
(152,376) (150,361)
(LOSS)/PROFIT BEFORE TAXATION (1,709,757) 3,991,699
TAXATION 5 - -
(LOSS)/PROFIT AFTER TAXATION AND TOTAL COMPREHENSIVE (LOSS)/INCOME (1,709,757) 3,991,699
(Loss)/profit after taxation is made up of the following: Realised amount 1,750,693 8,877,274 Unrealised amount (3,460,450) (4,885,575)
(1,709,757) 3,991,699
The accompanying summary of significant accounting policies and notes to the unaudited financial statements form an integral part of these unaudited financial statements.
Client Services : 03-2778 100014
Eastspring Investments Target Income Fund 4
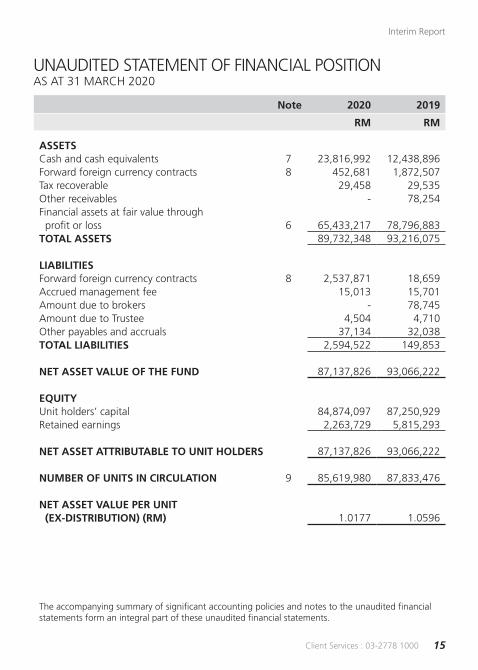
UNAUDITED STATEMENT OF FINANCIAL POSITION AS AT 31 MARCH 2020
Note 2020 2019
RM RM
ASSETSCash and cash equivalents 7 23,816,992 12,438,896Forward foreign currency contracts 8 452,681 1,872,507Tax recoverable 29,458 29,535Other receivables - 78,254Financial assets at fair value through profit or loss 6 65,433,217 78,796,883TOTAL ASSETS 89,732,348 93,216,075
LIABILITIESForward foreign currency contracts 8 2,537,871 18,659Accrued management fee 15,013 15,701Amount due to brokers - 78,745Amount due to Trustee 4,504 4,710Other payables and accruals 37,134 32,038TOTAL LIABILITIES 2,594,522 149,853
NET ASSET VALUE OF THE FUND 87,137,826 93,066,222
EQUITYUnit holders’ capital 84,874,097 87,250,929Retained earnings 2,263,729 5,815,293
NET ASSET ATTRIBUTABLE TO UNIT HOLDERS 87,137,826 93,066,222
NUMBER OF UNITS IN CIRCULATION 9 85,619,980 87,833,476
NET ASSET VALUE PER UNIT (EX-DISTRIBUTION) (RM) 1.0177 1.0596
The accompanying summary of significant accounting policies and notes to the unaudited financial statements form an integral part of these unaudited financial statements.
15Client Services : 03-2778 1000
Interim Report

Note
Unit holders’
capitalRetained earnings Total
RM RM RM
Balance as at 1 October 2019 85,889,263 9,098,713 94,987,976
Movement in unit holders’ contribution:Cancellation of units (1,015,166) - (1,015,166)Total comprehensive loss for the financial period - (1,709,757) (1,709,757)Distribution (Gross/Net: 5.92 sen) 10 - (5,125,227) (5,125,227)
Balance as at 31 March 2020 84,874,097 2,263,729 87,137,826
Balance as at 1 October 2018 88,279,069 7,076,047 95,355,116
Movement in unit holders’ contribution:Cancellation of units (1,028,140) - (1,028,140)Total comprehensive income for the financial period - 3,991,699 3,991,699Distribution (Gross/Net: 5.92 sen) 10 - (5,252,453) (5,252,453)
Balance as at 31 March 2019 87,250,929 5,815,293 93,066,222
The accompanying summary of significant accounting policies and notes to the unaudited financial statements form an integral part of these unaudited financial statements.
UNAUDITED STATEMENT OF CHANGES IN EQUITYFOR THE SIX MONTHS FINANCIAL PERIOD ENDED 31 MARCH 2020
Client Services : 03-2778 100016
Eastspring Investments Target Income Fund 4

UNAUDITED STATEMENT OF CASH FLOWSFOR THE SIX MONTHS FINANCIAL PERIOD ENDED 31 MARCH 2020
Note
6-month financial
period ended 31.3.2020
6-month financial
period ended 31.3.2019
RM RM
CASH FLOWS FROM OPERATING ACTIVITIESProceeds from sale of investments 39,983,502 8,722,501Payments for purchase of investments (21,303,086) (3,686,249)Interest income received from deposits with licensed financial institutions 47,803 126,648Interest income received from unquoted fixed income securities 2,197,746 2,327,446Exit fee income received 28,914 36,037Management fee paid (91,683) (90,662) Trustee fee paid (27,505) (27,199)Payment for other fees and expenses (35,222) (36,750) Tax paid (14,251) (6,228)Net foreign exchange gain 98,943 6,178,780Net cash generated from operating activities 20,885,161 13,544,324
CASH FLOWS FROM FINANCING ACTIVITIESPayments for cancellation of units (1,020,482) (1,046,040)Distribution paid (5,125,227) (5,252,453)Net cash used in financing activities (6,145,709) (6,298,493)
NET INCREASE IN CASH AND CASH EQUIVALENTS 14,739,452 7,245,831
CASH AND CASH EQUIVALENTS AT THE BEGINNING OF THE FINANCIAL PERIOD 9,077,540 5,193,065
CASH AND CASH EQUIVALENTS AT THE END OF THE FINANCIAL PERIOD 7 23,816,992 12,438,896
The accompanying summary of significant accounting policies and notes to the unaudited financial statements form an integral part of these unaudited financial statements.
17Client Services : 03-2778 1000
Interim Report

The following accounting policies have been used in dealing with items which are considered material in relation to the financial statements.
A. BASIS OF PREPARATION OF THE FINANCIAL STATEMENTS
The financial statements have been prepared under the historical cost convention, as modified by financial assets and financial liabilities (including derivatives instruments) at fair value through profit or loss, except as disclosed in this summary of significant accounting policies, and in accordance with Malaysian Financial Reporting Standards (“MFRS”) and International Financial Reporting Standards (“IFRS”).
The preparation of financial statements in conformity with the MFRS and IFRS requires the use of certain critical accounting estimates and assumptions that affect the reported amounts of assets and liabilities and disclosure of contingent assets and liabilities at the date of the financial statements, and the reported amounts of revenues and expenses during the reported financial period. It also requires the Manager to exercise their judgment in the process of applying the Fund’s accounting policies. Although these estimates and judgment are based on the Manager’s best knowledge of current events and actions, actual results may differ.
The areas involving a higher degree of judgement or complexity, or areas where assumptions and estimates are significant to the financial statements are disclosed in Note L.
a. Standards, amendments to published standards and interpretations that are effective:
The Fund has applied the following amendments for the first time for the financial year beginning on 1 October 2019:
• Amendments to MFRS 112 ‘Income Taxes’ (effective from 1 January 2019) clarify that where income tax consequences of dividends on financial instruments classified as equity is recognised (either in profit or loss, other comprehensive income or equity) depends on where the past transactions that generated distributable profits were recognised.
Accordingly, the tax consequences are recognised in profit or loss when an entity determines payments on such instruments are distribution of profits (that is, dividends). Tax on dividend should not be recognised in equity merely on the basis that it is related to a distribution to owners.
SUMMARY OF SIGNIFICANT ACCOUNTING POLICIESFOR THE SIX MONTHS FINANCIAL PERIOD ENDED 31 MARCH 2020
Client Services : 03-2778 100018
Eastspring Investments Target Income Fund 4

This standard is not expected to have a significant impact on the Fund’s financial statements.
b. Standards, amendments that have been issued but not yet effective:
Amendments to the definition of material (Amendments to MFRS 101 and MFRS 108) effective 1 January 2020.
The amendments clarify the definition of materiality and use a consistent definition throughout MFRSs and the Conceptual Framework for Financial Reporting.
The definition of ‘material’ has been revised as “Information is material if omitting, misstating or obscuring it could reasonably be expected to influence decisions that the primary users of general purpose financial statements make on the basis of those financial statements, which provide financial information about a specific reporting entity.”
The amendments also:
• clarify that an entity assess materiality in the context of the financial statements as a whole.
• explain the concept of obscuring information in the new definition. Information is obscured if it have the effect similar as omitting or misstating of that information. For example, material transaction is scattered throughout the financial statements, dissimilar items are inappropriately aggregated, or material information is hidden by immaterial information.
• clarify the meaning of ‘primary users of general purpose financial statements’ to whom those financial statements are directed, by defining them as ‘existing and potential investors, lenders and other creditors’ that must rely on general purpose financial statements for much of the financial information they need.
The amendments shall be applied prospectively.
19Client Services : 03-2778 1000
Interim Report

B. INCOME RECOGNITION
Interest income from short term deposits is recognised on the accrual basis using the effective interest method.
Interest income from unquoted fixed income securities including amortisation of premium and accretion of discount are recognised using the effective interest method.
Interest income is calculated by applying the effective interest rate to the gross carrying amount of a financial asset except for financial assets that subsequently become credit-impaired. For credit-impaired financial assets the effective interest rate is applied to the net carrying amount of the financial asset (after deduction of the loss allowance).
Realised gain or loss on disposal of unquoted fixed income securities is accounted for as the difference between the net disposal proceeds and the carrying amount of the investments, determined on cost adjusted for accretion of discount or amortisation of premium. Exit fee income is a redemption fee charged to unit holders on cancellation of units before the maturity date and is recognised upon cancellation of units.
C. TAXATION
Current tax expense is determined according to the Malaysian tax laws at the current rate based upon the taxable income earned during the financial period.
Tax on interest income from foreign unquoted fixed income securities is based on the tax regime of the respective countries that the Fund invests in.
D. FUNCTIONAL AND PRESENTATION CURRENCY
Items included in the financial statements of the Fund are measured using the currency as the primary economic environment in which the Fund operates (the “functional currency”). The financial statements are presented in Ringgit Malaysia (“RM”), which is the Fund’s functional and presentation currency.
Client Services : 03-2778 100020
Eastspring Investments Target Income Fund 4

E. FOREIGN CURRENCY TRANSLATION
Foreign currency transactions in the Fund are translated into the functional currency using the exchange rates prevailing at the transaction dates. Foreign exchange gains and losses resulting from the settlement of such transactions and from the translation at period-end exchange rates of monetary assets and liabilities denominated in foreign currencies are recognised in the statement of comprehensive income, except when deferred in other comprehensive income as qualifying cash flow hedges.
F. FINANCIAL ASSETS AND FINANCIAL LIABILITIES
i. Classification
The Fund classify its financial assets in the following measurement categories:
• those to be measured subsequently at fair value (either through other comprehensive income (“OCI”) or through profit or loss), and
• those to be measured at amortised cost
The Fund classifies its investments based on both the Fund’s business model for managing those financial assets and the contractual cash flow characteristics of the financial assets. The portfolio of financial assets is managed and performance is evaluated on a fair value basis. The Fund is primarily focused on fair value information and uses that information to assess the assets’ performance and to make decisions. The Fund has not taken the option to irrevocably designate any equity securities as fair value through other comprehensive income. Consequently, all investments are measured at fair value through profit or loss.
The Fund classifies cash and cash equivalents as financial assets at amortised cost as these financial assets are held to collect contractual cash flows consisting of the amount outstanding.
The Fund classifies accrued management fee, amount due to Trustee and other payables and accruals as financial liabilities measured at amortised cost.
21Client Services : 03-2778 1000
Interim Report

ii. Recognition and measurement
Regular purchases and sales of financial assets are recognised on the trade date, the date on which the Fund commits to purchase or sell the asset. Investments are initially recognised at fair value. Transaction costs are expensed in the statement of comprehensive income.
Financial assets are derecognised when the rights to receive cash flows from the investments have expired or have been transferred and the Fund has transferred substantially all risks and rewards of ownership.
Financial liabilities are recognised in the statement of financial position when, and only when, the Fund becomes a party to the contractual provisions of the financial instruments.
Financial liabilities are derecognised when the obligation under the liabilities are extinguished, i.e. when the obligation specified in the contract is discharged or cancelled or expired.
Unrealised gains or losses arising from changes in the fair value of the “financial assets at fair value through profit or loss” category are presented in the statement of comprehensive income within “net gain/(loss) on financial assets at fair value through profit or loss” in the financial period in which they arise. Any unrealised gains however are not distributable.
Foreign exchange gains and losses on the derivative financial instrument are recognised in statement of comprehensive income when settled or at date of the statement of financial position at which time they are included in the measurement of the derivative financial instrument.
Deposits with licensed financial institutions are stated at cost plus accrued interest calculated on the effective interest rate method over the period from the date of placement to the date of maturity of the respective deposits.
Unquoted fixed income securities are carried at cost and adjusted for any amortisation of premium or accretion of discount from acquisition date to maturity date. The carrying cost is revalued to reflect its fair value on a daily basis using the net present value method based on fair value prices quoted by a bond
Client Services : 03-2778 100022
Eastspring Investments Target Income Fund 4

pricing agency (“BPA”) registered with the Securities Commission as per the Securities Commission’s Guidelines on Unit Trust Funds. Where such quotations are not available or where the Manager is of the view that the price quoted by the BPA for a specific unquoted fixed income securities differs from the market price by more than 20 basis points, the Manager may use the market price, provided that the Manager:
i. records its basis for using a non-BPA price;ii. obtains necessary internal approvals to use the non-BPA price; andiii. keeps an audit trail of all decisions and basis for adopting the market yield.
Unquoted fixed income securities denominated in foreign currencies are revalued on a daily basis by reference to the price obtained from at least three financial institutions. However, if such quotations are not available or should the gaps of the quotations provided by the financial institutions differ by more than 20 basis points, the valuation shall be determined by reference to the value of such debt securities quoted by Reuters.
Loans and receivables and other financial liabilities are subsequently carried at amortised cost using the effective interest rate method.
iii. Impairment for assets carried at amortised costs
The Fund measures credit risk and expected credit losses using probability of default, exposure at default and loss given default. Management considers both historical analysis and forward looking information in determining any expected credit loss. Management consider the probability of default to be close to zero as these instruments have a low risk of default and the counterparties have a strong capacity to meet their contractual obligations in the near term. As a result, no loss allowance has been recognised based on 12 months expected credit losses as any such impairment would be wholly insignificant to the Fund.
Significant increase in credit risk
A significant increase in credit risk is defined by management as any contractual payment which is more than 30 days past due.
23Client Services : 03-2778 1000
Interim Report

Definition of default and credit-impaired financial assets
Any contractual payment which is more than 90 days past due is considered credit impaired.
Write-off
The Fund writes off financial assets, in whole or in part, when it has exhausted all practical recovery efforts and has concluded there is no reasonable expectation of recovery. The assessment of no reasonable expectation of recovery is based on unavailability of debtor’s sources of income or assets to generate sufficient future cash flows to repay the amount. The Fund may write-off financial assets that are still subject to enforcement activity. Subsequent recoveries of amounts previously written off will result in impairment gains. There are no write-offs/recoveries during the financial period.
G. CASH AND CASH EQUIVALENTS
For the purpose of the statement of cash flows, cash and cash equivalents comprise bank balances and deposit with a licensed financial institution that are readily convertible to known amounts of cash and which are subject to an insignificant risk of changes in value.
H. UNIT HOLDERS’ CAPITAL
The unit holders’ contributions to the Fund meet the criteria to be classified as equity instruments under MFRS 132 “Financial Instruments: Presentation”. Those criteria include:
• the units entitle the holder to a proportionate share of the Fund’s net assets value;• the units are the most subordinated class and class features are identical;• there is no contractual obligations to deliver cash or another financial asset other
than the obligation on the Fund to repurchase; and• the total expected cash flows from the units over its life are based substantially on
the profit or loss of the Fund.
The outstanding units are carried at the redemption amount that is payable at each financial year if unit holder exercises the right to put the unit back to the Fund.
Client Services : 03-2778 100024
Eastspring Investments Target Income Fund 4

Units are created and cancelled at prices based on the Fund’s net asset value (“NAV”) per unit at the time of creation or cancellation. The Fund’s NAV per unit is calculated by dividing the net assets attributable to unit holders with the total number of outstanding units.
I. DERIVATIVE FINANCIAL INSTRUMENTS
A derivative financial instrument is any contract that gives rise to both a financial asset of one enterprise and a financial liability or equity instrument of another enterprise.
A financial asset is any asset that is cash, a contractual right to receive cash or another financial asset from another enterprise, a contractual right to exchange financial instruments with another enterprise under conditions that are potentially favourable, or an equity instrument of another enterprise.
A financial liability is any liability that is a contractual obligation to deliver cash or another financial asset to another enterprise, or to exchange financial instruments with another enterprise under conditions that are potentially unfavourable.
The Fund’s derivative financial instruments comprise forward foreign currency contracts. Derivatives are initially recognised at fair value on the date a derivative contract is entered into and are subsequently re-measured at their fair value.
The method of recognising the resulting gain or loss depends on whether the derivative is designated as a hedging instrument, and the nature of the item being hedged. Derivatives that do not qualify for hedge accounting are classified as held-for-trading and accounted for in accordance with the accounting policy set out in Note F to the financial statements.
J. AMOUNT DUE FROM/(TO) BROKERS
Amounts due from and to brokers represent receivables for securities sold and payables for securities purchased that have been contracted for but not yet settled or delivered on the statement of financial position date respectively.
These amounts are recognised initially at fair value and subsequently measured at amortised cost using the effective interest method, less provision for impairment for amounts due from brokers. A provision for impairment of amounts due from brokers
25Client Services : 03-2778 1000
Interim Report

is established when there is objective evidence that the Fund will not be able to collect all amounts due from the relevant broker. Significant financial difficulties of the broker, probability that the broker will enter bankruptcy or financial reorganisation, and default in payments are considered indicators that the amount due from brokers is impaired. Once a financial asset or a group of similar financial assets has been written down as a result of an impairment loss, interest income is recognised using the rate of interest used to discount the future cash flows for the purpose of measuring the impairment loss.
The effective interest method is a method of calculating the amortised cost of a financial asset or financial liability and of allocating the interest income or interest expense over the relevant period. The effective interest rate is the rate that exactly discounts estimated future cash payments or receipts throughout the expected life of the financial instrument, or, when appropriate, a shorter period, to the net carrying amount of the financial asset or financial liability. When calculating the effective interest rate, the Fund estimates cash flows considering all contractual terms of the financial instrument but does not consider future credit losses. The calculation includes all fees and points paid or received between parties to the contract that are an integral part of the effective interest rate, transaction costs and all other premiums or discounts.
K. DISTRIBUTION
A distribution to the Fund’s unit holders is accounted for a deduction from realised reserves. A proposed distribution is recognised as a liability in the financial period in which it is approved.
L. CRITICAL ACCOUNTING ESTIMATES AND JUDGMENTS IN APPLYING ACCOUNTING POLICIES
The Fund makes estimates and assumptions concerning the future. The resulting accounting estimates will, by definition, rarely equal the related actual results. To enhance the information contents on the estimates, certain key variables that are anticipated to have material impacts to the Funds’ results and financial position are tested for sensitivity to changes in the underlying parameters.
Client Services : 03-2778 100026
Eastspring Investments Target Income Fund 4

Estimates and judgments are continually evaluated by the Manager and are based on historical experience and other factors, including expectations of future events that are believed to be reasonable under the circumstances.
a. Estimate of fair value of unquoted fixed income securities
The Fund uses significant judgment in determining whether an investment is impaired. The Fund evaluates, among other factors, the duration and extent to which the fair value of the investment is less than cost, and the financial health and near-term business outlook for the investee, including factors such as industry and sector performance, macroeconomic factors and speculation.
In undertaking any of the Fund’s investment, the Manager will ensure that all assets of the Fund under management will be valued appropriately, that is at fair value.
However, the Manager is of the opinion that in applying the accounting policies, no significant judgment was required.
Unquoted fixed income securities are valued using fair value prices quoted by a bond pricing agency (“BPA”). Where the Manager is of the view that the price quoted by BPA for a specific bond differs from the market price by more than 20 basis points, the Manager may use the market price, provided that the Manager records its basis for using a non-BPA price, obtains necessary internal approvals to use the non-BPA price, and keeps an audit trail of all decisions and basis for adopting the use of non-BPA price.
Unquoted fixed income securities denominated in foreign currencies are revalued on a daily basis by reference to the price obtained from at least three financial institutions. However, if such quotations are not available or should the gaps of the quotations provided by the financial institutions differ by more than 20 basis points, the valuation shall be determined by reference to the value of such debt securities quoted by Reuters.
27Client Services : 03-2778 1000
Interim Report

1. INFORMATION ON THE FUND
Eastspring Investments Target Income Fund 4 (the “Fund”) was constituted pursuant to the execution of a Deed dated 26 January 2015 (the “Deed”) entered into between Eastspring Investments Berhad (the “Manager”) and Deutsche Trustees Malaysia Berhad (the “Trustee”).
The Fund was launched on 23 August 2015 and will continue its operations until terminated by the Trustee or the Manager as provided under Part 12 of the Deed.
The Fund seeks to achieve its objective by investing in local and/or foreign debt securities. The Fund will invest a minimum of 70% of its NAV in local and/or foreign debt securities. Not more that 40% of the Fund’s NAV may be invested either in non-rated debt securities and/or debt securities rated below investment grade rating by RAM, MARC, Standard & Poor’s, Moody’s, Fitch or other rating agencies (i.e. lower than BBB3 rating by RAM or below investment grade rating by other rating agencies) while the remainder will be invested in investment grade bonds. Additionally, up to 30% of the Fund’s NAV may be invested in liquid assets. All investments will be subjected to the Securities Commission’s (the “SC”) Guidelines on Unit Trust Funds, the Deed and the objective of the Fund.
The main objective of the Fund is to provide regular income during the tenure of the Fund.
The Manager is a company incorporated in Malaysia and is related to Prudential Plc., a public listed company in the United Kingdom. The principal activity of the Manager is the establishment and management of unit trust funds and asset management.
2. FINANCIAL RISK MANAGEMENT OBJECTIVES AND POLICIES
The Fund is exposed to market risk (inclusive of price risk, interest rate risk and foreign exchange/currency risk), country risk, fund management risk, liquidity risk, non-compliance risk, capital risk and credit/default risk.
Financial risk management is carried out through internal control processes adopted by the Manager and adherence to the investment restrictions as stipulated in the Deed.
NOTES TO THE UNAUDITED FINANCIAL STATEMENTSFOR THE SIX MONTHS FINANCIAL PERIOD ENDED 31 MARCH 2020
Client Services : 03-2778 100028
Eastspring Investments Target Income Fund 4

Financial instruments of the Fund are as follows:
Note
Financial assets at
amortised cost
Financial assets/
(liabilities)at fair value
through profit or loss Total
RM RM RM
2020
Cash and cash equivalents 7 23,816,992 - 23,816,992Unquoted fixed income securities 6 - 65,433,217 65,433,217Forward foreign currency contracts 8 - (2,085,190) (2,085,190)
23,816,992 63,348,027 87,165,019
2019Cash and cash equivalents 7 12,438,896 - 12,438,896Other receivables 78,254 - 78,254Unquoted fixed income securities 6 - 78,796,883 78,796,883Forward foreign currency contracts 8 - 1,853,848 1,853,848
12,517,150 80,650,731 93,167,881
All liabilities except for forward foreign currency contracts are financial liabilities which are carried at amortised cost.
29Client Services : 03-2778 1000
Interim Report

Market risk
i. Price risk
This risk refers to changes and developments in regulations, politics and the economy of the country. The very nature of a Unit Trust Fund, however, helps mitigate this risk because a Fund would generally hold a well-diversified portfolio of securities from different market sectors so that the collapse of any one security or any one market sector would not impact too greatly on the value of the Fund.
The table below shows assets of the Fund as at 31 March which are exposed to price risk:
2020 2019
RM RM
Unquoted fixed income securities designated at fair value through profit or loss* 65,433,217 78,796,883
* Includes interest receivable of RM895,192 (2019: RM1,094,692).
Derivatives
Forward foreign currency contracts financial (liabilities)/assets at fair value through profit or loss (2,085,190) 1,853,848
Client Services : 03-2778 100030
Eastspring Investments Target Income Fund 4

The following table summarises the sensitivity of the Fund’s net asset value and (loss)/profit after tax to movements in prices of unquoted fixed income securities and derivatives at the end of the reporting financial period. The analysis is based on the assumptions that the market price of the unquoted fixed income securities and derivatives increased by 5% and decreased by 5% with all other variables held constant. This represents management’s best estimate of a reasonable possible shift in the unquoted fixed income securities and derivatives, having regard to the historical volatility of the prices.
% Change in priceMarket
value
Increase/(decrease)
in (loss)/profit after tax and
net asset value
RM RM
2020+5% 65,575,477 3,122,642-5% 59,330,193 (3,122,642)
2019+5% 83,533,841 3,977,802-5% 75,578,237 (3,977,802)
ii. Interest rate risk
Cash flow interest rate risk is the risk that the future cash flows of a financial instrument will fluctuate because of changes in market interest rates.
Fair value interest rate risk is the risk that the value of a financial instrument will fluctuate due to changes in market interest rates.
In general, when interest rates rise, unquoted fixed income securities prices will tend to fall and vice versa. Therefore, the NAV of the Fund may also tend to fall when interest rates rise or are expected to rise. However, investors should be aware that should the Fund holds an unquoted fixed income securities till maturity, such price fluctuations would dissipate as it approaches maturity, and thus the growth of the NAV shall not be affected at maturity. In order to mitigate
31Client Services : 03-2778 1000
Interim Report

interest rates exposure of the Fund, the Manager will manage the duration of the portfolio via shorter or longer tenured assets depending on the view of the future interest rate trend of the Manager, which is based on its continuous fundamental research and analysis.
Investors should note that the movement in prices of unquoted fixed income
securities and money market instruments are benchmarked against interest rates. As such, the investments are exposed to the movement of the interest rates.
Such investments may be subject to unanticipated rise in interest rates which may impair the ability of the issuers to make payments of interest income and principal, especially if the issuers are highly leveraged. An increase in interest rates may therefore increase the potential for default by an issuer.
The Fund’s investments in deposit with a licensed financial institution are short
term in nature. Therefore, exposure to interest rate fluctuations is minimal.
The table below summarises the sensitivity of the Fund’s (loss)/profit after tax and NAV to movements in prices of unquoted fixed income securities and money market instruments held by the Fund at the end of the reporting period as a result of movement in interest rate. The analysis is based on the assumptions that the interest rate changed by 1% with all other variables held constant. This represents management’s best estimate of a reasonable possible shift in the interest rate, having regard to the historical volatility of the interest rate.
2020 2019
% Change in interest rate of unquoted fixed income securities
Impact onloss after tax/
change in net asset value
Impact onprofit after tax/
change in net asset value
RM RM
+1% (76,538) (116,645)- 1% 76,881 117,034
Client Services : 03-2778 100032
Eastspring Investments Target Income Fund 4

iii. Foreign exchange/Currency risk
As the Fund may invest its assets in unquoted fixed income securities denominated in a wide range of currencies other than Ringgit Malaysia, the net asset value of the Fund expressed in Ringgit Malaysia may be affected favourably or unfavourably by exchange control regulations or changes in the exchange rates between Ringgit Malaysia and such other currencies. The risk is minimised through investing in a wide range of foreign currencies denominated assets and thus, diversifying the risk of single currency exposure.
In the normal course of investment, the Fund Manager will usually not hedge foreign currency exposure. The Fund Manager may however depending on prevailing market circumstances at particular point in time, choose to use forward or swap contracts for hedging and risk reduction purposes.
The following table sets out the foreign exchange/currency risk concentrations and counterparties of the Fund.
Financialassets at fair
value throughprofit or loss
Forwardforeign
currencycontracts
Cash andcash
equivalents Total
RM RM RM RM
2020
SGD 6,969,385 9,228 1,631,378 8,609,991USD 48,366,615 (2,537,871) 7,409,029 53,237,773
55,336,000 (2,528,643) 9,040,407 61,847,764
2019
SGD 11,273,319 385,482 204,038 11,862,839USD 67,523,564 1,468,366 2,626,462 71,618,392
78,796,883 1,853,848 2,830,500 83,481,231
33Client Services : 03-2778 1000
Interim Report
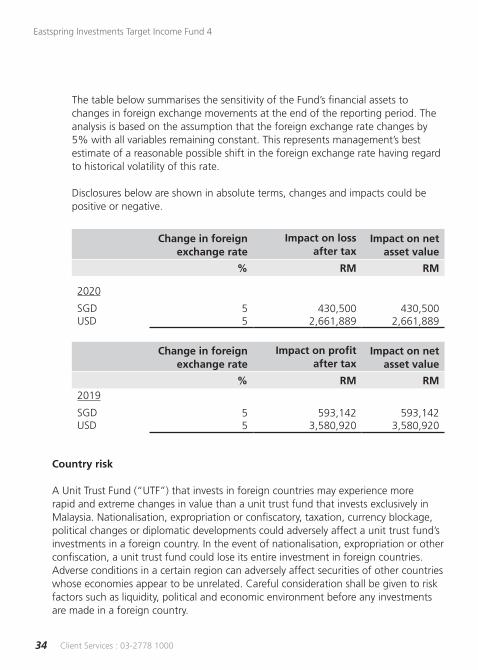
The table below summarises the sensitivity of the Fund’s financial assets to changes in foreign exchange movements at the end of the reporting period. The analysis is based on the assumption that the foreign exchange rate changes by 5% with all variables remaining constant. This represents management’s best estimate of a reasonable possible shift in the foreign exchange rate having regard to historical volatility of this rate.
Disclosures below are shown in absolute terms, changes and impacts could be positive or negative.
Change in foreign exchange rate
Impact on lossafter tax
Impact on net asset value
% RM RM
2020
SGD 5 430,500 430,500USD 5 2,661,889 2,661,889
Change in foreign exchange rate
Impact on profitafter tax
Impact on net asset value
% RM RM2019
SGD 5 593,142 593,142USD 5 3,580,920 3,580,920
Country risk
A Unit Trust Fund (“UTF”) that invests in foreign countries may experience more rapid and extreme changes in value than a unit trust fund that invests exclusively in Malaysia. Nationalisation, expropriation or confiscatory, taxation, currency blockage, political changes or diplomatic developments could adversely affect a unit trust fund’s investments in a foreign country. In the event of nationalisation, expropriation or other confiscation, a unit trust fund could lose its entire investment in foreign countries. Adverse conditions in a certain region can adversely affect securities of other countries whose economies appear to be unrelated. Careful consideration shall be given to risk factors such as liquidity, political and economic environment before any investments are made in a foreign country.
Client Services : 03-2778 100034
Eastspring Investments Target Income Fund 4

Fund management risk
There is the risk that the management company may not adhere to the investment mandate of the respective Fund. With close monitoring by the investment committee, back office system being incorporated with limits and controls, and regular reporting to the senior management team, the management company is able to manage such risk. The Trustee has an oversight function over management of the Fund by the management company to safeguard the interests of unit holders.
Liquidity risk
Liquidity risk is the risk that the Fund will encounter difficulty in meeting its financial obligations. Generally, all investments are subject to a certain degree of liquidity risk depending on the nature of the investment instruments, market, sector and other factors. For the purpose of the Fund, the Fund Manager will attempt to balance the entire portfolio by investing in a mix of assets with satisfactory trading volume and those that occasionally could encounter poor liquidity. This is expected to reduce the risks for the entire portfolio without limiting the Fund’s growth potentials.
The Fund maintains sufficient level of liquid assets, after consultation with the Trustee,
to meet anticipated payments and cancellations of units by unit holders. Liquid assets comprise bank balances, deposit with a licensed financial institution and other instruments which are capable of being converted into cash within 7 days.
35Client Services : 03-2778 1000
Interim Report

The table below summarises the Fund’s financial liabilities into relevant maturity groupings based on the remaining period as at the statement of financial position date to the contractual maturity date. The amounts in the table are the contractual undiscounted cash flows.
Less than1 month
Between1 monthto 1 year Total
RM RM RM
2020
Forward foreign currency contracts 1,776,084 761,787 2,537,871Accrued management fee 15,013 - 15,013Amount due to Trustee 4,504 - 4,504Other payables and accruals - 37,134 37,134Contractual cash outflows 1,795,601 798,921 2,594,522
2019
Forward foreign currency contracts 18,659 - 18,659Accrued management fee 15,701 - 15,701Amount due to Trustee 4,710 - 4,710Amount due to brokers 78,745 - 78,745Other payables and accruals - 32,038 32,038Contractual cash outflows 117,815 32,038 149,853
Non-compliance risk
Non-compliance risk arises when the Manager and others associated with the Fund do not comply to the rules set out in the Fund’s constitution or the law that governs the Fund or applicable internal control procedures, or act fraudulently or dishonestly.
The non-compliance may expose the Fund to higher risks which may result in a fall in the value of the Fund which in turn may affect its investment goals. However, the risk can be mitigated by the internal controls and compliance monitoring undertaken by the Manager.
Client Services : 03-2778 100036
Eastspring Investments Target Income Fund 4

Capital risk
The capital of the Fund is represented by equity consisting of unit holders’ capital of RM84,874,097 (2019: RM87,250,929) and retained earnings of RM2,263,729 (2019: RM5,815,293). The amount of equity can change significantly on a daily basis as the Fund is subject to daily subscriptions and redemptions at the discretion of unit holders. The Fund’s objective when managing capital is to safeguard the Fund’s ability to continue as a going concern in order to provide returns for unit holders and benefits for other stakeholders and to maintain a strong capital base to support the development of the Shariah-compliant investment activities of the Fund.
Credit/Default risk
Credit risk refers to the ability of an issuer or a counter party to make timely payments of interest, principals and proceeds from realisation of investments. In the case of the Fund, both the Manager and the External Fund Manager regularly review the ratings assigned to the Issuer so that the necessary steps can be taken if the ratings fall below those prescribed by the Securities Commission.
The credit risk arising from placements of deposits in licensed financial institutions is managed by ensuring that the Fund will only place deposits in reputable licensed financial institutions.
The Fund seeks to mitigate credit/default risk by investing in high quality fixed income securities and entering into forward foreign currency contracts with reputable counterparties.
37Client Services : 03-2778 1000
Interim Report

The following table sets out the credit risk concentrations and counterparties of the Fund.
Cash andcash
equivalents
Financial assets at fair
value through profit or loss
Other receivables Total
RM RM RM RM
2020
Finance- AAA 14,001,771 - - 14,001,771- AA1 9,815,221 - - 9,815,221Unquoted fixed income securities- A- - 4,189,985 - 4,189,985- AAA (S) - 10,097,216 - 10,097,216 - B- - 1,313,433 - 1,313,433- B - 3,052,639 - 3,052,639 - B+ - 3,463,363 - 3,463,363 - B3 - 839,339 - 839,339 - Baa1 - 2,091,678 - 2,091,678 - Baa2 - 877,893 - 877,893 - Baa3 - 6,975,118 - 6,975,118 - BB - 7,809,937 - 7,809,937 - BB- - 2,945,033 - 2,945,033 - BBB - 2,022,656 - 2,022,656- BBB- - 3,863,856 - 3,863,856- NR - 15,891,071 - 15,891,071Forward foreign currency contracts- AAA - 452,681 - 452,681Others- NR - - - -
23,816,992 65,885,898 - 89,702,890
Client Services : 03-2778 100038
Eastspring Investments Target Income Fund 4

Cash andcash
equivalents
Financial assets at fair
value through profit or loss
Other receivables Total
RM RM RM RM
2019
Finance- AA1 12,438,896 - - 12,438,896Unquoted fixed income securities- A - 2,069,728 - 2,069,728 - A- - 6,513,522 - 6,513,522 - B - 6,946,879 - 6,946,879 - B- - 821,861 - 821,861 - B+ - 2,876,525 - 2,876,525- Ba2 - 2,060,060 - 2,060,060 - Baa3 - 9,604,805 - 9,604,805 - BB - 3,320,861 - 3,320,861 - BB- - 6,303,560 - 6,303,560 - BB+ - 2,551,229 - 2,551,229 - BBB - 11,744,400 - 11,744,400 - BBB- - 9,280,565 - 9,280,565 - NR - 14,702,888 - 14,702,888Forward foreign currency contracts- AAA - 1,872,507 - 1,872,507Others- NR - - 78,254 78,254
12,438,896 80,669,390 78,254 93,186,540
None of these assets are past due or impaired.
39Client Services : 03-2778 1000
Interim Report

Fair value estimation
Fair value is defined as the price that would be received to sell an asset or paid to transfer a liability in an orderly transaction between market participants at the measurement date (i.e. an exit price).
The fair value of financial assets traded in active market (such as traded derivatives and trading securities) are based on quoted market prices at the close of trading on the period end date. The Fund utilises the last traded market price for financial assets where the last traded price falls within the bid-ask spread. In circumstances where the last traded price is not within the bid-ask spread, the Fund Manager will determine the point within the bid-ask spread that is representative of the fair value.
An active market is a market in which transactions for the asset or liability take place with sufficient frequency and volume to provide pricing information on an ongoing basis.
The fair value of financial assets that are not traded in an active market is determined
by using valuation techniques. The Fund uses a variety of methods and makes assumptions that are based on market conditions existing at each period end date. Valuation techniques used for non-standardised financial instruments such as options, currency swaps and other over-the-counter derivatives, include the use of comparable recent arm’s length transactions, reference to other instruments that are substantially the same, discounted cash flow analysis, option pricing models and other valuation techniques commonly used by market participants making the maximum use of market inputs and relying as little as possible on entity-specific inputs.
Client Services : 03-2778 100040
Eastspring Investments Target Income Fund 4

Fair value hierarchy
i. The table below analyses financial instruments carried at fair value by valuation method. The different levels have been defined as follows:
• Level 1: Quoted prices (unadjusted) in active market for identical assets or liabilities.
• Level 2: Inputs other than quoted prices included within Level 1 that are observable for the asset or liability, either directly (that is, as prices) or indirectly (that is, derived from prices).
• Level 3: Inputs for the asset and liability that are not based on observable market data (that is, unobservable inputs).
The level in the fair value hierarchy within which the fair value measurement is categorised in its entirety is determined on the basis of the lowest level input that is significant to the fair value measurement in its entirety. For this purpose, the significance of an input is assessed against the fair value measurement in its entirety. If a fair value measurement uses observable inputs that require significant adjustment based on unobservable inputs, that measurement is a Level 3 measurement.
Assessing the significance of a particular input to the fair value measurement in its entirety requires judgement, considering factors specific to the asset or liability.
The determination of what constitutes ‘observable’ requires significant judgement by the Fund. The Fund considers observable data to be that market data that is readily available, regularly distributed or updated, reliable and verifiable, not proprietary, and provided by independent sources that are actively involved in the relevant market.
41Client Services : 03-2778 1000
Interim Report

The following table analyses within the fair value hierarchy the Fund’s financial assets (by class) measured at fair value:
Level 1 Level 2 Level 3 Total
RM RM RM RM
2020
Financial assets at fair value through profit or loss: Unquoted fixed income securities - 65,433,217 - 65,433,217 Forward foreign currency contracts - 452,681 - 452,681
- 65,885,898 - 65,885,898Financial liabilities at fair value through profit or loss: Forward foreign currency contracts - 2,537,871 - 2,537,871
2019
Financial assets at fair value through profit or loss: Unquoted fixed income securities - 78,796,883 - 78,796,883 Forward foreign currency contracts - 1,872,507 - 1,872,507
- 80,669,390 - 80,669,390Financial liabilities at fair value through profit or loss: Forward foreign currency contracts - 18,659 - 18,659
Client Services : 03-2778 100042
Eastspring Investments Target Income Fund 4
Financial instruments that trade in markets that are considered to be active but are valued based on quoted market prices, dealer quotations or alternative pricing sources supported by observable inputs are classified within Level 2, these include unquoted fixed income securities and derivatives.
As Level 2 instruments include positions that are not traded in active markets and/or are subject to transfer restrictions, valuations may be adjusted to reflect illiquidity and/or non-transferability, which are generally based on available market information. The Fund’s policies on valuation of these financial assets are stated in Note F to the financial statements.
ii. The carrying value of cash and cash equivalents and all liabilities are a reasonable approximation of their fair values due to their short term nature.
3. MANAGEMENT FEE
In accordance with the Deed, the Manager is entitled to a management fee at a rate not exceeding 0.20% per annum of the net asset value of the Fund accrued and calculated on a daily basis.
For the financial period ended 31 March 2020, the Management fee is recognised at a rate of 0.20% (2019: 0.20%) per annum on the net asset value of the Fund, excluding foreign custodian charges, calculated on daily basis.
There will be no further liability to the Manager in respect of the management fee other than the amounts recognised above.
4. TRUSTEE FEE
In accordance with the Deed, the Trustee is entitled to an annual fee at a rate not exceeding 0.06% per annum of the net asset value of the Fund, subject to a minimum fee of RM15,000 per annum excluding foreign custodian fees and charges.
For the financial period ended 31 March 2020, the Trustee fee is recognised at a rate of 0.06% (2019: 0.06%) per annum on the net asset value of the Fund, excluding foreign custodian charges, calculated on daily basis.
There will be no further liability to the Trustee in respect of the trustee fee other than the amounts recognised above.
43Client Services : 03-2778 1000
Interim Report

5. TAXATION
6-month financial
period ended 31.3.2020
6-month financial
period ended 31.3.2019
RM RM
Tax charged for the financial period: Current taxation – local - -
The numerical reconciliation between (loss)/profit before taxation multiplied by the Malaysian statutory tax rate and tax expense of the Fund is as follows:
6-month financial
period ended 31.3.2020
6-month financial
period ended 31.3.2019
RM RM
(Loss)/profit before taxation (1,709,757) 3,991,699
Tax at Malaysian statutory rate of 24% (2019: 24%) (410,342) 958,008
Tax effects of: Investment loss not deductible for tax purpose/ (investment income exempt from tax) 373,772 (994,094) Expenses not deductible for tax purposes 13,205 12,818 Restriction on tax deductible expenses for Unit Trust Funds 23,365 23,268
Taxation - -
Client Services : 03-2778 100044
Eastspring Investments Target Income Fund 4

6. FINANCIAL ASSETS AT FAIR VALUE THROUGH PROFIT OR LOSS
2020 2019
RM RM
Designated at fair value through profit or loss: Unquoted fixed income securities 65,433,217 78,796,883
Net (loss)/gain on financial assets at fair value through profit or loss: Realised (loss)/gain on disposals (1,619,380) 350,320 Change in unrealised fair value (loss)/gain (1,495,667) 239,225
(3,115,047) 589,545
45Client Services : 03-2778 1000
Interim Report

Unquoted fixed income securities
Name of counterNominal
valueAggregate
cost
Fair valueas at
31.3.2020
Percentage of net asset
value ofthe Fund
RM RM RM %
Bond
3.25% Avenue International Holding Limited 25.10.2020 (NR) 1,300,000 5,500,806 5,693,376 6.53 4.50% CCB Life Insurance Company Limited 21.04.2022 (BBB) 500,000 2,248,150 2,022,656 2.323.876% Chong Hing Bank Limited 26.07.2022 (BBB-) 200,000 862,840 884,349 1.017.625% CIFI Holdings (Group) Co. Ltd 02.03.2021 (BB) 200,000 854,731 865,065 0.994.875% Commerzbank AG 01.03.2022 (BBB-) 500,000 1,588,276 1,527,270 1.750.25% Ezion Holdings Limited 20.11.2022 (NR) 750,000 2,290,342 1,812,582 2.084.50% GENM Capital Berhad 24.08.2020 (AAA (S)) 10,000,000 10,063,145 10,097,216 11.594.25% GOHL Capital 24.01.2027 (Baa1) 600,000 2,679,386 2,091,678 2.404.55% Greentown China Holdings Limited 10.11.2020 (NR) 200,000 842,161 858,744 0.995.875% Greentown China Holdings Limited 14.04.2020 (B+) 400,000 1,710,175 1,723,843 1.98
Client Services : 03-2778 100046
Eastspring Investments Target Income Fund 4

Unquoted fixed income securities (continued)
Name of counterNominal
valueAggregate
cost
Fair valueas at
31.3.2020
Percentage of net asset
value ofthe Fund
RM RM RM %
Bond (continued)
3.375% Hong Kong Red Star Macalline Universal Home Furnishings Ltd 21.09.2022 (BB) 300,000 1,254,050 1,140,374 1.314.70% HSBC Holdings Plc 06.08.2022 (Baa3) 250,000 785,348 769,249 0.88 7.00% Lippo Malls Indonesia Retail Trust 27.09.2021 (NR) 500,000 1,521,903 1,323,187 1.526.125% Logan Property Holdings Company Limited 16.04.2020 (BB) 250,000 783,137 786,069 0.905.625% Minejesa Capital B.V. 10.08.2037 (Baa3) 300,000 1,294,916 1,164,039 1.344.625% Minejesa Capital B.V. 10.08.2030 (Baa3) 300,000 1,293,082 1,144,198 1.315.50% Nan Fung Treasury (II) Limited 29.05.2020 (Baa3) 900,000 3,935,184 3,897,632 4.474.00% New China Life Insurance Co Ltd 03.07.2020 (A-) 1,000,000 4,249,505 4,189,985 4.815.75% NWD Finance (BVI) Ltd 05.10.2021 (NR) 1,300,000 5,582,708 5,388,660 6.185.95% Powerlong Real Estate Holdings Limited 19.07.2020 (B) 200,000 837,519 857,088 0.98
47Client Services : 03-2778 1000
Interim Report

Unquoted fixed income securities (continued)
Name of counterNominal
valueAggregate
cost
Fair valueas at
31.3.2020
Percentage of net asset
value ofthe Fund
RM RM RM %
Bond (continued)
4.85% PT Ciputra Development TBK 20.09.2021 (BB-) 250,000 779,333 751,027 0.865.23% PT Indonesia Asahan Aluminium (Persero) 15.11.2021 (Baa2) 200,000 849,434 877,893 1.0111.50% Ronshine China Holdings Limited 03.07.2020 (BB-) 300,000 1,277,808 1,308,236 1.505.875% Royal Capital B.V. 05.05.2022 (NR) 200,000 817,562 814,522 0.937.75% SSMS Plantation Holdings Pte Ltd 23.01.2021 (B3) 300,000 1,233,215 839,339 0.968.625% Sunac China Holdings Limited 27.07.2020 (B+) 400,000 1,668,731 1,739,520 2.005.25% TBG Global Pte Ltd 13.04.2020 (BB) 400,000 1,726,810 1,663,325 1.915.50% The Bank of East Asia Limited 31.12.2020 (BB) 800,000 3,436,359 3,355,104 3.856.20% The Democratic Socialist Republic of Sri Lanka 11.05.2027 (B) 200,000 887,808 496,537 0.57
Client Services : 03-2778 100048
Eastspring Investments Target Income Fund 4

Unquoted fixed income securities (continued)
Name of counterNominal
valueAggregate
cost
Fair valueas at
31.3.2020
Percentage of net asset
value ofthe Fund
RM RM RM %
Bond (continued)
9.375% Trade and Development Bank of Mongolia LLC 19.05.2020 (B) 400,000 1,744,192 1,699,014 1.955.00% Westpac Banking Corporation 21.09.2027 (BBB-) 400,000 1,678,397 1,452,237 1.675.75% Yancoal International Resources Development Co., Limited 13.04.2020 (BB-) 200,000 909,857 885,770 1.0210.50% Zhenro Properties Group Limited 28.06.2020 (B-) 300,000 1,270,787 1,313,433 1.51
24,300,000 68,457,657 65,433,217 75.08
ACCUMULATED UNREALISED LOSS ON FINANCIAL ASSETS AT FAIR VALUE THROUGH PROFIT OR LOSS (3,024,440)
FAIR VALUE OF FINANCIAL ASSETS AT FAIR VALUE THROUGH PROFIT OR LOSS 65,433,217
49Client Services : 03-2778 1000
Interim Report

Unquoted fixed income securities
Name of counterNominal
valueAggregate
cost
Fair valueas at
31.3.2019
Percentage of net asset
value ofthe Fund
RM RM RM %
Bond
4.50% CCB Life Insurance Company Limited 21.04.2022 (BBB) 500,000 2,245,800 1,946,854 2.096.50% Chong Hing Bank Limited 25.09.2019 (Ba2) 500,000 2,119,768 2,060,060 2.213.876% Chong Hing Bank Limited 26.07.2022 (BBB-) 200,000 862,511 805,081 0.874.875% Commerzbank AG 01.03.2022 (BBB-) 1,000,000 3,176,469 3,029,630 3.263.625% Double Rosy Ltd 18.11.2019 (A) 500,000 2,139,018 2,069,728 2.22 0.25% Ezion Holdings Limited 20.11.2022 (NR) 750,000 2,238,319 1,548,297 1.660.00% Ezion Holdings Limited 20.11.2027 (NR) 26,613 78,745 80,145 0.094.25% GOHL Capital 24.01.2027 (A-) 600,000 2,677,473 2,454,829 2.64 5.875% Greentown China Holdings Limited 11.08.2019 (B+) 400,000 1,730,719 1,657,557 1.783.375% Hong Kong Red Star Macalline Universal Home Furnishings Ltd 21.09.2022 (BB+) 300,000 1,252,676 1,087,448 1.174.70% HSBC Holdings Plc 06.08.2022 (BBB) 500,000 1,570,354 1,550,605 1.676.375% HSBC Holdings Plc 17.09.2024 (Baa3) 1,500,000 6,244,646 6,226,973 6.69
Client Services : 03-2778 100050
Eastspring Investments Target Income Fund 4

Unquoted fixed income securities (continued)
Name of counterNominal
valueAggregate
cost
Fair valueas at
31.3.2019
Percentage of net asset
value ofthe Fund
RM RM RM %
Bond (continued)
5.625% HSBC Holdings Plc 17.01.2020 (BBB) 2,000,000 8,480,916 8,246,941 8.86 6.875% Islamic Republic of Pakistan 05.12.2027 (B-) 200,000 835,577 821,861 0.887.00% Lippo Malls Indonesia Retail Trust 27.09.2021 (NR) 500,000 1,521,894 1,247,196 1.346.125% Logan Property Holdings Company Limited 16.04.2020 (BB-) 1,000,000 3,078,459 3,072,706 3.304.625% Minejesa Capital B.V. 10.08.2030 (BBB-) 300,000 1,292,620 1,194,027 1.28 5.625% Minejesa Capital B.V. 10.08.2037 (BBB-) 300,000 1,294,354 1,225,345 1.32 6.95% Modernland Overseas Pte Ltd 13.04.2021 (B) 800,000 3,710,143 3,259,702 3.505.50% Nan Fung Treasury (II) Limited 29.05.2020 (Baa3) 900,000 3,931,242 3,377,832 3.635.15% National Savings Bank 10.09.2019 (B) 500,000 2,129,453 2,036,234 2.194.00% New China Life Insurance Co Ltd 03.07.2020 (A-) 1,000,000 4,220,971 4,058,693 4.364.50% New Rose 19.01.2020 (NR) 500,000 2,045,751 2,038,307 2.19
51Client Services : 03-2778 1000
Interim Report

Unquoted fixed income securities (continued)
Name of counterNominal
valueAggregate
cost
Fair valueas at
31.3.2019
Percentage of net asset
value ofthe Fund
RM RM RM %
Bond (continued)
5.75% NWD Finance (BVI) Ltd 05.10.2021 (NR) 1,500,000 6,452,772 6,011,988 6.464.85% PT Ciputra Development TBK 20.09.2021 (BB-) 250,000 779,325 744,740 0.80 5.23% PT Indonesia Asahan Aluminium (Persero) 15.11.2021 (BBB-) 200,000 846,763 866,802 0.935.25% PT Pertamina (Persero) 23.05.2021 (BBB-) 500,000 2,171,699 2,159,680 2.325.875% Royal Capital B.V. 05.05.2022 (NR) 200,000 816,442 795,662 0.857.50% SMC Global Power Holdings Corp. 07.11.2019 (NR) 700,000 3,051,592 2,981,293 3.207.75% SSMS Plantation Holdings Pte Ltd 23.01.2021 (B+) 300,000 1,213,185 1,218,968 1.318.625% Sunac China Holdings Limited 27.07.2020 (B) 200,000 824,112 849,932 0.915.25% TBG Global Pte Ltd 13.04.2019 (BB-) 400,000 1,748,404 1,644,138 1.775.50% The Bank of East Asia Limited 31.12.2020 (BB) 800,000 3,432,941 3,320,861 3.576.20% The Democratic Socialist Republic of Sri Lanka 11.05.2027 (B) 200,000 886,675 801,011 0.86
Client Services : 03-2778 100052
Eastspring Investments Target Income Fund 4

Unquoted fixed income securities (continued)
Name of counterNominal
valueAggregate
cost
Fair valueas at
31.3.2019
Percentage of net asset
value ofthe Fund
RM RM RM %
Bond (continued)
5.00% Westpac Banking Corporation 21.09.2027 (BB+) 400,000 1,678,267 1,463,781 1.575.75% Yancoal International Resources Development Co., Limited 13.04.2020 (BB-) 200,000 908,596 841,976 0.90
20,626,613 83,688,651 78,796,883 84.65
ACCUMULATED UNREALISED LOSS ON FINANCIAL ASSETS AT FAIR VALUE THROUGH PROFIT OR LOSS (4,891,768)
FAIR VALUE OF FINANCIAL ASSETS AT FAIR VALUE THROUGH PROFIT OR LOSS 78,796,883
The effective weighted average rate of return of unquoted fixed income securities per
annum as at the date of the statement of financial position is as follows:
2020 2019
% %
Unquoted fixed income securities 8.05 6.35
53Client Services : 03-2778 1000
Interim Report

7. CASH AND CASH EQUIVALENTS
2020 2019
RM RM
Bank balances with a licensed bank 9,815,221 4,433,373Deposit with a licensed financial institution 14,001,771 8,005,523
23,816,992 12,438,896
The currency exposure profile of cash and cash equivalents is as follows:
2020 2019
RM RM
MYR 14,776,585 9,608,396SGD 1,631,378 204,038USD 7,409,029 2,626,462
23,816,992 12,438,896
The effective weighted average interest rate of short term deposit with a licensed financial institution per annum as at the date of the statement of financial position is as follows:
2020 2019
% %
Deposit with a licensed financial institution 2.82 3.60
The deposit has an average maturity of 6 days (2019: 7 days).
Client Services : 03-2778 100054
Eastspring Investments Target Income Fund 4

8. FORWARD FOREIGN CURRENCY CONTRACTS
As at the date of statement of financial position, there are 7 (2019: 8) forward foreign currency contracts outstanding. The notional principal amount of the outstanding forward foreign currency contracts amounted to RM452,681 (receivable) and RM2,537,871 (payable) (2019: RM1,872,507 (receivable) and RM18,659 (payable)). The forward foreign currency contracts entered into during the financial period were for hedging against the currency exposure arising from the investment in the foreign unquoted fixed income securities denominated in SGD and USD. As the Fund has not adopted hedge accounting during the financial period, the change in the fair value of the forward foreign currency contract is recognised immediately in the statement of comprehensive income.
9. UNITS IN CIRCULATION
2020 2019
No. of units No. of units
At the beginning of the financial period 86,579,816 88,828,823Cancellation of units during the financial period (959,836) (995,347)
At the end of the financial period 85,619,980 87,833,476
55Client Services : 03-2778 1000
Interim Report

10. DISTRIBUTION
2020 2019
RM RM
Distribution to unit holders is from the following sources: Exit fee income (net of tax) 43,605 29,289 Interest income 3,901,992 3,191,623 Net realised gain on sale of investments 1,420,595 2,229,725
Gross realised income 5,366,192 5,450,637Less: Expenses (240,965) (198,184)
5,125,227 5,252,453
Gross distribution per unit (sen) 0.0592 0.0592
Net distribution per unit (sen) 0.0592 0.0592
Ex-date 24 October 2019 31 October 2018
Gross distribution is derived using total income less total expenses. The distribution is made from current and prior period’s realised income.
Gross distribution per unit is derived from gross realised income less expenses divided by the number of units in circulation, while net distribution per unit is derived from gross realised income less expenses and taxation divided by the number of units in circulation.
There are unrealised losses of RM3,460,450 (2019: RM4,885,575) arising during the financial period.
Client Services : 03-2778 100056
Eastspring Investments Target Income Fund 4

11. TRANSACTIONS WITH DEALERS
Details of transactions with the top 10 dealers are as follows:
Name of dealersValue of
trades
Percentage of total trades
Brokerage fees
Percentage of total
brokerage fees
RM % RM %
2020Malayan Banking Berhad 10,028,200 41.29 - -Standard Chartered Bank 4,177,914 17.21 - -BNP Paribas S.A. France 1,257,476 5.18 - -Citigroup Global Markets Limited 1,248,075 5.14 - -Societe Generale Paris Branch 1,240,190 5.11 - -Goldman Sachs International London 855,945 3.52
- -
Morgan Stanley and Co. 838,960 3.45 - -Nomura International Plc 829,326 3.42 - -Credit Suisse Securities (Europe) London 827,000 3.41 - -DBS Bank Ltd 780,695 3.21 - -Others 2,201,012 9.06 - -
24,284,793 100.00 - -
2019Mizuho Securities Aisa Ltd 3,730,745 38.21 - -Oversea-Chinese Banking Corporation Limited 2,856,807 29.26 - -Standard Chartered Bank 2,346,419 24.03 - -Citibank N.A. 829,442 8.50 - -
9,763,413 100.00 - -
All dealers highlighted above are not related to the Manager.
57Client Services : 03-2778 1000
Interim Report

12. UNITS HELD BY THE MANAGER
The related party of and its relationship with the Fund are as follows:
Related party Relationship
Eastspring Investments Berhad The Manager
2020 2019
No. of units RM No. of units RM
Eastspring Investments Berhad 1,000 1,018 1,000 1,059
The above units were transacted at the prevailing market price.
The units are held legally by the Manager and are within the prescribed limit allowed by SC’s Guidelines on Unit Trust Funds. Other than above, there were no units held by the Directors or parties related to the Manager.
Client Services : 03-2778 100058
Eastspring Investments Target Income Fund 4

13. MANAGEMENT EXPENSE RATIO (“MER”)
2020 2019
% %
MER 0.17 0.17
MER is derived from the following calculation:
MER = (A + B + C + D + E)X 100
F
A = Management fee
B = Trustee fee
C = Audit fee
D = Tax agent fee
E = Other expenses
F = Average net asset value of the Fund calculated on a daily basis
The average net asset value of the Fund for the financial period calculated on a daily basis is RM91,106,582 (2019: RM90,965,915).
59Client Services : 03-2778 1000
Interim Report

14. PORTFOLIO TURNOVER RATIO (“PTR”)
2020 2019
PTR (times) 0.13 0.05
PTR is derived from the following calculation:
(Total acquisitions for the financial period + total disposals for the financial period) ÷ 2Average net asset value of the Fund for the financial period calculated on a daily basis
where: total acquisitions for the financial period = RM21,303,085 (2019: RM3,686,249) total disposals for the financial period = RM2,981,708 (2019: RM6,077,164)
15. SIGNIFICANT EVENT DURING THE FINANCIAL PERIOD The worsening macro-economic outlook as a result of Covid-19, both domestically
and globally, has resulted in the deterioration of the Fund’s Net Asset Value/unit as of the date of this report. This is mainly due to the decrease in fair value of the Fund’s investments at fair value through profit or loss.
The Manager is monitoring the situation closely and will be actively managing the
portfolio to achieve the Fund’s objective.
16. APPROVAL OF FINANCIAL STATEMENTS
The financial statements have been approved for issue by the Manager on 5 June 2020.
Client Services : 03-2778 100060
Eastspring Investments Target Income Fund 4

61Client Services : 03-2778 1000
Interim Report
THE MANAGERNAME
EASTSPRING INVESTMENTS BERHAD
COMPANY NO.
200001028634 (531241-U)
REGISTERED OFFICE
Level 25, Menara Hong Leong
No. 6, Jalan Damanlela
Bukit Damansara
50490 Kuala Lumpur
BUSINESS OFFICE
Level 22, Menara Prudential
Persiaran TRX Barat
55188 Tun Razak Exchange
Kuala Lumpur
TELEPHONE NO.
603-2778 3888
FAX NO.
603-2789 7220
WEBSITE
www.eastspring.com/my
TRUSTEENAME
DEUTSCHE TRUSTEES MALAYSIA BERHAD
COMPANY NO.
763590-H
REGISTERED OFFICE & BUSINESS OFFICE
Level 20, Menara IMC
No. 8, Jalan Sultan Ismail
50250 Kuala Lumpur
TELEPHONE NO.
603-2053 7522
FAX NO.
603-2053 7526
SALE & PURCHASE OF UNITSEastspring Investments BerhadLevel 22, Menara Prudential
Persiaran TRX Barat
55188 Tun Razak Exchange
Kuala Lumpur
TELEPHONE NO.
603-2778 1000
CORPORATE DIRECTORY

Client Services : 03-2778 100062
Eastspring Investments Target Income Fund 4
BRANCHESPetaling JayaEastspring Investments Berhad
A-17-P1 & M
Block A, Jaya One
72A, Jalan Universiti
46200 Petaling Jaya, Selangor
TELEPHONE NO.
603-7948 1288
Kota KinabaluEastspring Investments Berhad
Suite E3, 9th Floor
CPS Tower, Centre Point Sabah
No. 1, Jalan Centre Point
88000 Kota Kinabalu, Sabah
TELEPHONE NO.
6088-238 613
ENQUIRIESCLIENT SERVICES
603-2778 1000

FOR THE SIX MONTHS FINANCIAL PERIOD ENDED 31 MARCH 2020
INTERIM REPORT
EASTSPRING INVESTMENTSTARGET INCOME FUND 4
Eastspring Investments Berhad 200001028634 (531241-U)
Level 22, Menara Prudential, Persiaran TRX Barat55188 Tun Razak Exchange, Kuala LumpurT: (603) 2778 3888 F: (603) 2789 7220eastspring.com/my
Client ServicesT: (603) 2778 1000 [email protected]