La distribution de l'offre de santé en France : des disparités géographiques notables
Upload
khangminh22Category
view
1download
0
La Revue de Santé de la Méditerranée orientale
Eastern Mediterranean Health Journal
Volume 26 / No. 9September/Septembre
املجلد السادس والعرشون / عدد 92020 سبتمرب / أيلول
Eastern Mediterranean H
ealth Journal Vol. 26 No. 9 – 2020
The COVID-19 pandemic continues to pose multiple health challenges in the Eastern Mediterranean Region and is the focus of discussion at the 67th Session of the Regional Committee for the Eastern Mediterranean, examining how to mitigate the impacts of the pandemic and improve Member State preparedness and response.

Eastern Mediterranean Health Journal
IS the official health journal published by the Eastern Mediterranean Regional Office of the World Health Organization. It is a forum for the presentation and promotion of new policies and initiatives in public health and health services; and for the exchange of ideas, concepts, epidemiological data, research findings and other information, with special reference to the Eastern Mediterranean Region. It addresses all members of the health profession, medical and other health educational institutes, interested NGOs, WHO Collaborating Centres and individuals within and outside the Region.
املجلة الصحية لرشق املتوسط هى املجلة الرسمية التى تصدر عن املكتب اإلقليمى لرشق املتوسط بمنظمة الصحة العاملية. وهى منرب لتقديم السياسات واملبادرات اجلديدة يف الصحة العامة واخلدمات الصحية والرتويج هلا، ولتبادل اآلراء واملفاهيم واملعطيات الوبائية ونتائج األبحاث وغري ذلك من املعلومات، وخاصة ما يتعلق منها بإقليم رشق املتوسط. وهى موجهة إىل كل أعضاء املهن الصحية، والكليات الطبية وسائر املعاهد التعليمية، وكذا املنظامت غري احلكومية املعنية، واملراكز املتعاونة مع منظمة
الصحة العاملية واألفراد املهتمني بالصحة ىف اإلقليم وخارجه.
La Revue de Santé de la Méditerranée Orientale
EST une revue de santé officielle publiée par le Bureau régional de l’Organisation mondiale de la Santé pour la Méditerranée orientale. Elle offre une tribune pour la présentation et la promotion de nouvelles politiques et initiatives dans le domaine de la santé publique et des services de santé ainsi qu’à l’échange d’idées, de concepts, de données épidémiologiques, de résultats de recherches et d’autres informa-tions, se rapportant plus particulièrement à la Région de la Méditerranée orientale. Elle s’adresse à tous les professionnels de la santé, aux membres des instituts médicaux et autres instituts de formation médico-sanitaire, aux ONG, Centres collaborateurs de l’OMS et personnes concernés au sein et hors de la Région.
EMHJ is a trilingual, peer reviewed, open access journal and the full contents are freely available at its website: http://www/emro.who.int/emhj.htm
EMHJ information for authors is available at its website: http://www.emro.who.int/emh-journal/authors/
EMHJ is abstracted/indexed in the Index Medicus and MEDLINE (Medical Literature Analysis and Retrieval Systems on Line), ISI Web of knowledge, the Cumulative Index to Nursing and Allied Health Literature (CINAHL), Embase, Lexis Nexis, Scopus and the Index Medicus for the WHO Eastern Mediterranean Region (IMEMR).
© World Health Organization (WHO) 2020. Some rights reserved.This work is available under the CC BY-NC-SA 3.0 IGO licence (https://creativecommons.org/licenses/by-nc-sa/3.0/igo).
Disclaimer The designations employed and the presentation of the material in this publication do not imply the expression of any opinion whatsoever on the part of WHO concerning the legal status of any country, territory, city or area or of its authorities, or concerning the delimitation of its frontiers or boundaries. Dotted and dashed lines on maps represent approximate border lines for which there may not yet be full agreement.
The mention of specific companies or of certain manufacturers’ products does not imply that they are endorsed or recommended by WHO in preference to others of a similar nature that are not mentioned. Errors and omissions excepted, the names of proprietary products are distinguished by initial capital letters.
All reasonable precautions have been taken by WHO to verify the information contained in this publication. However, the published material is being distributed without warranty of any kind, either expressed or implied. The responsibility for the interpretation and use of the material lies with the reader. In no event shall WHO be liable for damages arising from its use.
The authors alone are responsible for the views expressed in this publication and they do not necessarily represent the views, decisions or policies of the institutions with which they are affiliated.
If authors are staff members of the World Health Organization, the authors alone are responsible for the views expressed in this publication and do not necessarily represent the decisions, policy or views of the World Health Organization.
ISSN 1020-3397
Cover photo: © WHO / Blink Media: Saiyna Bashir

Vol. 26.09 – 2020
La Revue de Santé de la Méditerranée orientale
Eastern Mediterranean Health Journal
Editorial
Coming together in the Region to tackle COVID-19Ahmed Al-Mandhari .........................................................................................................................................................................................................992
Commentary
Models of maternity care for pregnant women during the COVID-19 pandemicMona Larki, Farangis Sharifi and Robab Latifnejad Roudsari ...........................................................................................................................994
Short research communications
Blood coagulation parameters in patients with severe COVID-19 from Kermanshah Province, Islamic Republic of Iran Babak Sayad and Zohreh Rahimi ..................................................................................................................................................................................999
COVID-19 in the Eastern Mediterranean Region: testing frequency, cumulative cases and mortality analysisPascale Salameh .................................................................................................................................................................................................................1005
Educational perspective for the identification of essential competencies required for approaching patients with COVID-19Mayssoon Dashash, Bashar Almasri, Eman Takaleh, Alaa Abou Halawah and Amal Sahyouni ............................................................1011
Engagement of medical specialty trainees in research: experience at a Lebanese medical schoolFouad Fayad, Ouidade Aitisha Tabesh, Tamara Lotfi, Fadi Haddad and Elie Nemr .....................................................................................1018
Research articles
An analysis of financial protection before and after the Iranian Health Transformation PlanZhaleh Abdi, Justine Hsu, Elham Ahmadnezhad, Reza Majdzadeh and Iraj Harirchi................................................................................1025
Prevalence of hypohydration in adolescents during the school day in Cyprus: seasonal variationsPinelopi S. Stavrinou, Christoforos D. Giannaki, Eleni Andreou and George Aphamis .............................................................................1034
Medical management of pneumonia in children aged under 5 years in Alexandria, Egypt: mothers’ perspectiveNoha Fadl, Ayat Ashour and Yasmine Muhammed ...............................................................................................................................................1042
Audit of antibiotic prophylaxis and adherence of surgeons to standard guidelines in common abdominal surgical proceduresZakir Khan, Naveed Ahmed, Shaista Zafar, Asim ur Rehman, Faiz Ullah Khan, Muhammad Saqlain, Sohail Kamran and Hazir Rahman .....................................................................................................................................................................................................................1052
Comparison of validity of the Food Frequency Questionnaire and the Diet History Questionnaire for assessment of energy and nutrients intakes in an Iranian populationFatemeh Toorang, Bahareh Sasanfar, Ahmad Esmaillzadeh, Soraiya Ebrahimpour-Koujan and Kazem Zendehdel ......................1062
Adherence to the Mediterranean diet of school-age children in Moroccan oases, Draa-Tafilalet RegionKarima Azekour, Zahra Outaleb, Mohamed Eddouks, Farid Khallouki and Bachir El Bouhali ...............................................................1070
Dentist availability in Egypt: a 20-year study of supply, potential demand and economic factorsMaha El Tantawi, Nourhan M. Aly, Dina Attia, Hams Abdelrahman and Mohamed Mehaina ..............................................................1078

Malnutrition and food insecurity in child labourers in Sindh, Pakistan: a cross-sectional studyMeesha Iqbal, Zafar Fatmi, Kausar Khan, Yusra Jumani, Neelma Amjad and Asaad Nafees ..................................................................1087
The epidemiology of cholera in the Islamic Republic of Iran, 1965–2014Hossein Masoumi-Asl, Goodarz Kolifarhood and Mohammad Mehdi Gouya ............................................................................................1097
Reviews
Regional disparities in the distribution of Sudan’s health resourcesMohamed Ismail ................................................................................................................................................................................................................1105
Landscape analysis of family planning research, programmes and policies targeting young people in Jordan: stakeholder assessment and systematic reviewJewel Gausman, Areej Othman, Abeer Dababneh, Iqbal Hamad, Maysoon Dabobe, Insaf Daas and Ana Langer ...........................1115
Report
Mobile-aided diagnosis systems are the future of health careDonia Ben Hassen..............................................................................................................................................................................................................1135
WHO events addressing public health priorities
Meeting of the Eastern Mediterranean Regional Technical Advisory Group (RTAG) on immunization .....................1141
Obituaries
Dr Mohammad Haytham Al-Khayat (1937-2020) .........................................................................................................................................1143
Dr Ramez Khairi Mahaini (1959-2020) ...............................................................................................................................................................1144

Ahmed Al-Mandhari Editor-in-ChiefArash Rashidian Executive EditorAhmed Mandil Deputy Executive EditorPhillip Dingwall Managing Editor
Editorial Board Zulfiqar Bhutta Mahmoud Fahmy Fathalla Rita Giacaman Ahmed Mandil Ziad Memish Arash Rashidian Sameen Siddiqi Huda Zurayk
International Advisory Panel Mansour M. Al-Nozha Fereidoun Azizi Rafik Boukhris Majid Ezzati Hans V. Hogerzeil Mohamed A. Ghoneim Alan Lopez Hossein Malekafzali El-Sheikh Mahgoub Hooman Momen Sania Nishtar Hikmat Shaarbaf Salman Rawaf
Editorial assistantsNadia Abu-Saleh, Suhaib Al Asbahi (graphics), Diana Tawadros (graphics)
Editorial supportGuy Penet (French editor)Eva Abdin, Fiona Curlet, Cathel Kerr, Marie-France Roux (Technical editors)Ahmed Bahnassy, Abbas Rahimiforoushani, Manar El Sheikh Abdelrahman (Statistics editors)
Administration Iman Fawzy, Marwa Madi
Web publishingNahed El Shazly, Ihab Fouad, Hazem Sakr
Library and printing supportHatem Nour El Din, Metry Al Ashkar, John Badawi, Ahmed Magdy, Amin El Sayed
Cover and internal layout designed by Diana Tawadros and Suhaib Al Asbahi Printed by WHO Regional Office for the Eastern Mediterranean, Cairo, Egypt

992
EMHJ – Vol. 26 No. 9 – 2020Editorial
Coming together in the Region to tackle COVID-19
1Regional Director, World Health Organization Regional Office for the Eastern Mediterranean, Cairo, Egypt.
Citation: Al-Mandhari A. Coming together in the Region to tackle COVID-19. East Mediterr Health J. 2020;26(9):992-993 https://doi.org/10.26719/2020.26.9.992
Copyright © World Health Organization (WHO) 2020. Open Access. Some rights reserved. This work is available under the CC BY-NC-SA 3.0 IGO license (https://creativecommons.org/licenses/by-nc-sa/3.0/igo)
The COVID-19 pandemic continues to pose multiple health challenges in the Eastern Mediterranean Region. Morbidity and mortality from the disease remain a serious cause for concern. As of 31 August 2020, a total of 1 924 511 laboratory-confirmed cases of SARS-CoV-2 virus infection had been reported in the Region, including 51 019 deaths (1). Moreover, there are worrying signs that cases are now rising again in some countries after a period of decline (2) and the indirect impact of the pandemic on health care is arguably even more troubling. Access to essential health services is being compromised as scarce resources are diverted to fight the pandemic, social restriction measures such as lockdowns disrupt service provision, while fear and rumour deter people from approaching health facilities. Initial studies indicate that services such as immunization, elective surgery and chronic disease management have been severely affected (1). The long-term consequences threaten to be grave indeed.
Therefore, it is no surprise that assessing and mitigating the impacts of the pandemic are prominent on the agenda for the upcoming 67th session of the Regional Committee for the Eastern Mediterranean (3), WHO’s governing body in the Region. The Committee’s annual meeting is a crucial formal mechanism for ensuring the Organization’s accountability to our Member States in the Region; the core of each year’s session is delegates’ discussion, scrutiny and approval of reports and proposals regarding technical programmes of work. No less importantly, it also provides an opportunity for informal discussions among WHO staff, Member State policy-makers and technical experts, and valued partners including WHO’s sister United Nations agencies, nongovernmental organizations and other stakeholders. Through side meetings, exhibitions and social events, experiences and ideas are shared to the great mutual benefit of participants.
Unfortunately, that broader interaction is going to be diminished this year, as the Regional Committee session has itself been impacted by the pandemic. In place of the normal three to four days of face-to-face meetings, which be both imprudent and logistically challenging at present, the 67th session will be a virtual event held through an online platform. To minimize the risk of connectivity problems and accommodate different time zones, the duration will be limited to two five-hour sessions held on 12 and 13 October. The agenda has been pared down to a minimum of essential
items, and some of those items will not be discussed during the Committee meeting itself, but instead circulated as documents for Member States’ consideration (4,5). With time at a premium, participants will be encouraged to submit written or video statements on agenda items in advance, rather than intervening during the session, and the WHO Secretariat is holding informal consultations with Member States in advance of the meeting to help ensure that technical proposals reflect a broad consensus.
Member States will be considering some bold new initiatives. COVID-19 has highlighted concerns about the limited availability of medicines and vaccines in the Region. There have been long-standing and deep-seated issues in this regard in most countries of the Region, but the pandemic has brought them into sharp relief. Countries rely heavily on imports of medicines, so the disruption of international supply lines has led to severe shortages, making policy-makers even more anxious to ensure that adequate stocks of any eventual COVID-19 vaccine can be delivered promptly to their populations in good time. In response, WHO has developed a regional strategy to improve access to medicines and vaccines in the Eastern Mediterranean Region, 2020–2030 (6). The new strategy is based on a comprehensive analysis of gaps and challenges in the Region, and specifies comprehensive actions for both national governments and WHO’s technical staff to address them. In spurring its development, the pandemic may yet prove to have a very substantial silver lining.
There is also a proposal to establish a new regional Subcommittee on Polio Eradication and Outbreaks (7). Eradication of wild poliovirus from WHO’s African region was formally certified in August 2020 (8), making the Eastern Mediterranean Region the only part of the world in which it remains endemic. Indeed, there has been an alarming spike in cases recently (9). It is hoped that the new subcommittee, to be comprised of ministers of health from countries of the Region and other senior figures, can help galvanize efforts to finally end this disease. The subcommittee will also work to ensure that the experience, reach and other assets of the polio programme benefit other immunization campaigns and public health projects as well.
Current circumstances are certainly not ideal but thanks to the engagement of WHO staff, our Member States and partners, we are looking forward to a constructive and productive Regional Committee session.
Ahmed Al-Mandhari1
EMHJ – Vol. 26 No. 9 – 2020Editorial
993
References1. The COVID-19 pandemic in the Eastern Mediterranean Region (EM/RC67/7). Technical paper to be presented to the 67th session of
the WHO Regional Committee for the Eastern Mediterranean, 2020 (forthcoming).
2. Eastern Mediterranean Regional Office COVID-19 Dashboard [website]. Cairo: WHO Regional Office for the Eastern Mediterrane-an; 2020 (https://app.powerbi.com/view?r=eyJrIjoiN2ExNWI3ZGQtZDk3My00YzE2LWFjYmQtNGMwZjk0OWQ1MjFhIiwidCI6I-mY2MTBjMGI3LWJkMjQtNGIzOS04MTBiLTNkYzI4MGFmYjU5MCIsImMiOjh9, accessed 19 September, 2020).
3. Regional Committee for the Eastern Mediterranean, 67th session, provisional agenda (EM/RC67/1). (forthcoming).
4. Special procedures for the virtual 67th session of the WHO Regional Committee for the Eastern Mediterranean (EM/RC67/2). Draft decision to be presented to the 67th session of the WHO Regional Committee for the Eastern Mediterranean, 2020 (forthcoming).
5. The written silence procedure (EM/RC67/3). Draft decision to be presented to the 67th session of the WHO Regional Committee for the Eastern Mediterranean, 2020 (forthcoming).
6. Regional strategy to improve access to medicines and vaccines in the Eastern Mediterranean, 2020–2030, including lessons from the COVID-19 pandemic (EM/RC67/6). Technical paper to be presented to the 67th session of the WHO Regional Committee for the Eastern Mediterranean, 2020 (forthcoming).
7. Establishment of a Regional Subcommittee for Polio Eradication and Outbreaks (EM/RC67/17). Technical paper to be presented to the 67th session of the WHO Regional Committee for the Eastern Mediterranean, 2020 (forthcoming).
8. Global polio eradication initiative applauds WHO African region for wild polio-free certification (news release, 25 August 2020). In: WHO newsroom [website]. Geneva: World Health Organization; 2020 (https://www.who.int/news-room/detail/25-08-2020-glob-al-polio-eradication-initiative-applauds-who-african-region-for-wild-polio-free-certification, accessed 19 September 2020).
9. Progress report on eradication of poliomyelitis (EM/RC67/INF.DOC.1). Report to be presented to the 67th session of the WHO Regional Committee for the Eastern Mediterranean, 2020 (forthcoming).

994
Commentary EMHJ – Vol. 26 No. 9 – 2020
Models of maternity care for pregnant women during the COVID-19 pandemic Mona Larki,1 Farangis Sharifi2 and Robab Latifnejad Roudsari1,2
1School of Nursing and Midwifery; 2Nursing and Midwifery Care Research Center, Mashhad University of Medical Sciences, Mashhad, Islamic Repub-lic of Iran. (Correspondence to: Mona Larki: [email protected]).
Citation: Larki M; Sharifi F; Roudsari RL. Models of maternity care for pregnant women during the COVID-19 pandemic. East Mediterr Health J. 2020;26(9):994-998. https://doi.org/10.26719/emhj.20.097Received: 03/06/20; accepted: 20/07/20Copyright © World Health Organization (WHO) 2020. Open Access. Some rights reserved. This work is available under the CC BY-NC-SA 3.0 IGO license (https://creativecommons.org/licenses/by-nc-sa/3.0/igo)
Introduction COVID-19 was declared as a pandemic by the World Health Organization (WHO) in 2020 (1). The majority of countries in the Eastern Mediterranean Region (EMR) have crossed the initial three phases of transmission (as characterized by WHO) and are now heading towards the community/local transmission phase of the virus. Numerous countries within the Region have followed WHO’s guidelines on containment by prioritizing the de-velopment of testing, isolation, treatment, contact trac-ing, and isolating close contacts (2).
As the disease evolves rapidly, new information is appearing that suggests pregnant women diagnosed as having coronavirus disease are likely to suffer high levels of morbidity (1). They are susceptible to respiratory infections due to reduced lung function, increased oxygen consumption, and alteration in immunological function due to pregnancy. The evidence indicates that if women do not attend antenatal services then they are at risk of maternal death, stillbirth and other adverse perinatal outcomes (3,4). In addition, all pregnant women, together with those with confirmed or suspected COVID-19 infections, have the right to high-quality care before, during and after childbirth (3).
However, pregnant women and their families are likely to encounter greater tension and stress due to the COVID-19 pandemic within the community (5), therefore maternity services should be prioritized as fundamental core health service (3). Antenatal care (ANC) is the most cost-effective approach for the prevention of neonatal deaths; if 90% of women receive ANC, 14% of neonatal deaths could be avoided (6). The United Nations Population Fund (UNFPA) emphasized the development of a sustainable ANC service delivery model according to the context of different countries, which defines how services will be organized to deliver a core ANC package. It focuses, specifically, on which set of interventions by whom (cadre), where (system level), and how (platform) should be provided at each ANC contact (2). Also, during the current COVID-19 pandemic, care planning needs to take into consideration the risk factors identified, the context and the woman’s preferences (7).
Support models of care that provide maximum level of continuity of care are “midwifery continuity of care,
case management, as well as models of cares provided by midwife navigator, general practitioner (GP), private practice midwives, also cultural support models of care such as supports by healthcare workers or a community organization” (7,8). Maternity systems need a process to triage women to the most appropriate models of care based on low risk and high-risk criterion. Models of care in low risk cases is limited to midwifery care only, however, in high risk cases is could be provided by GPs, obstetricians or obstetricians and midwifery Group Practice, if available(7,8). Maternity care experts (including midwives and all other health care workers providing pregnancy and infant care), whether based in health centers or within the community, are basic health care providers and must be protected and prioritized to continue providing of care to childbearing women and their infants (8).
Models of care in pandemic crisis, like the pandemic of COVID- 19, for pregnant women include: home visiting, Self-quarantine/ Isolation, community clinics and hybrid models.
Home visiting In relation to home visits, it should be considered wheth-er visits are necessary or can be delayed. The home vis-it is planned based on the risk management for women and staff. Also, consultations using telehealth, SMS and phone should be taken into account. It may be prefera-ble, as providing care for the woman and everyone in her household is ideal (3,7-9) .General principles in home vis-iting during COVID-19 pandemic include: preparing the cares which likely to be required during the home visit, minimizing equipment to be taken into the home and maintaining infection prevention and control standards (e.g. hand hygiene, disposal of consumables, equipment cleaning, social distancing) (5). The required schedule and mode of care should be reassessed at each visit ac-cording to individual needs and current risks (7).
Health care experts attending homes should be mindful of exposure to COVID-19 in a home visit and should adhere to strict infection control procedures when entering and leaving homes. It has been declared that the coronavirus can survive on surfaces for up to 17 days. Health care providers should be provided with

995
Commentary EMHJ – Vol. 26 No. 9 – 2020
convenient personal protection equipment (PPE) based on relevant guidelines when providing care for women with suspected infection or when entering homes, where other family members of pregnant women have Covid-19 symptoms (9).
Self-quarantineSelf-quarantine means that pregnant women must be isolated as much as possible and not go out, except for seeking medical care. This model is recommended when hospitalization or other clinical care of pregnant women is not required according to current recommendations. It is also recommended when pregnant women have had close contact with a confirmed or suspected case with-in the past 14 days. Close contact means more than 15 minutes face-to-face contact and more than 2 hours in a closed space (including households) (7,8). Self-isolation is defined as strictly avoiding contact, or residing only with other positive cases. It is recommended if positive COVID-19 is confirmed (7,8). Women with suspected or confirmed COVID-19 should be advised not to attend in clinics. In cases of self-quarantine and self-isolation, rou-tine antenatal care should be postponed fortwo weeks if it is safe to do so (7,9,10).
For pregnant women who are self-quarantine at home, it should be guarantee that they remain well hydrated and are mobile during this period. Additionally, women with some chronic diseases such as diabetes and deep vein thrombosis should be identified as ‘extremely vulnerable’ to the severe effects of COVID-19 and be ‘shielded’. Shielding refers to adults with co-morbidities stay at home at all times and should be supported to do so by members of family, friends and the local community. Pregnant women who fall into this group are advised to attend only those GPs and hospital visits, which are necessary (10). Also, if necessary, their prescriptions should be sent through the post along with a video link of how to self-inject drugs, or a video appointment following receipt (9,10). Records should be made electronically, making them accessible for future care (10).
Community clinicsIn community clinics appointment scheduling, avoid-ance of patients awaiting and also ensuring of main-taining social distance (1.5-metre distance from others) should be considered. In this model, it should be encour-aged to women to arrive on time (not early) for appoint-ment and women with suspected or affirmed COVID-19 to not attend (9). In these clinics, social distancing rule need to be observed in the consulting room using ap-propriate technology and the obstetricians and physi-cians need not be in the same room (10). This reduces the chance of Covid-19 transmission to the maternity care providers and other women attending for care (4). Phy-sicians rapidly become involved into acute or intensive care medicine and their availability will be increasingly limited (8). Women who have symptoms of COVID-19 and are suffering from pregnancy complications need to be seen separately in an isolated room or at the beginning
or end of clinic when no other patients remain (8). The details of the antenatal care (ANC) models are shown in Table 1 (3,7,9).
Hybrid models Hybrid models of care delivery refers to a combination of elements of community health services building, phone or Video Call (VC) and home visit. It is also may assist to minimize contact duration (3,7,9). Telehealth and telemed-icine were integrated into maternity practices early on, in response to the needs of pregnant female for prenatal appointments outside of traditional health-care facilities in the COVID-19 outbreak (3). Subject to determining the most appropriate models for providing medical services, health care providers should use clinical judgment and consider the individual circumstances of pregnant wom-en (3,7,9). It should be noted that, the required schedule and the models of care should be reassessed at each visit according to the individual needs and current risks. In hy-brid models results of test should be given over the phone or by secure messaging and abnormal results should be given face-to-face or via secure video. Booking in and risk definition process for pregnant women have to achieved with a clinician (e.g. midwife) (3,7,9). One gainful result of this model could be that pregnant females frightful of entering health care centers could now get the care they required outside of the health facilities.
Schedule appointmentsGiven that, most instances of COVID-19 have result-ed from human-to-human transmission, so decreased schedule of antenatal consideration visits at the facili-ty is proper to minimize overcrowding in facilities and therefore the risk of virus transmission (3,4). In general, low risk pregnant women should have a minimum of six antenatal visits (8). Health department of some countries noted that visits in 28 weeks, 37 weeks and 40-41 weeks to be face-to-face and other visits could be done by phone or video call (3,7). During every face-to-face contact usual clinical assessment (e.g. measuring blood pressure, fun-dal height, fetal heart rate, weight, as well as urinalysis) should be done. Also fetal movements, mental wellbeing and domestic violence should be checked (8). In cases that ANC is not provided in pregnant women at the clinic, it can be undertaken on the phone, via what’s app, skype, facetime (where available). It is best utilized for occa-sions when the person does not require physical clinical assessments and/or tests/investigations (3).
At present, additional face-to-face visits take place when there are significant risk factors in pregnant women (7). It is recommended that face to face visits be limited to less than 15 minutes and conducted with attendance of minimum number of people (preferably woman only), which could lead to minimizing time in appointment waiting areas (8). Some women with co-morbidities (e.g. obesity, gestational diabetes, and preeclampsia) have a condition or complication that may increase their risk for severe COVID-19 disease. Also, they may need to additional visits or multi-disciplinary care in pregnancy

996
Commentary EMHJ – Vol. 26 No. 9 – 2020
(10,11). Those visits that do not need measure of fundal height, blood or urine tests, or ultrasonography, should be performed remotely by video or teleconferencing. It is suggested that the hybrid models be considered in the management of prenatal care sessions based on women’s needs and available health facilities (3,10,11). Current WHO guidance advises at least of eight antenatal care for low risk pregnant women. Because there is a shortage of evidence about rationalizing visit numbers, but evidence from lower and middle income countries suggests that attendance at five visits or less is associated with an increased risk of perinatal mortality (RR 1.15; 95% CI 1.01 to 1.32, three trials) (12).
Therefore, the number of visits and interval between them has not changed and only the method of delivery care has altered. Where efficient technology and facilities are available, some of these visits could be done through a remote contact. It is also recommended based on the guidelines WHO and UNFPA that the hybrid models could be considered in the management of prenatal care sessions based on women’s needs and available health facilities (3,8). This guidance does not support disruption or reduction of care but different ways should be considered for women to have access to evidence-based prenatal care during the current COVID-19 pandemic (3). If necessary, services should develop a process for integrating remote contact documentation in women’s
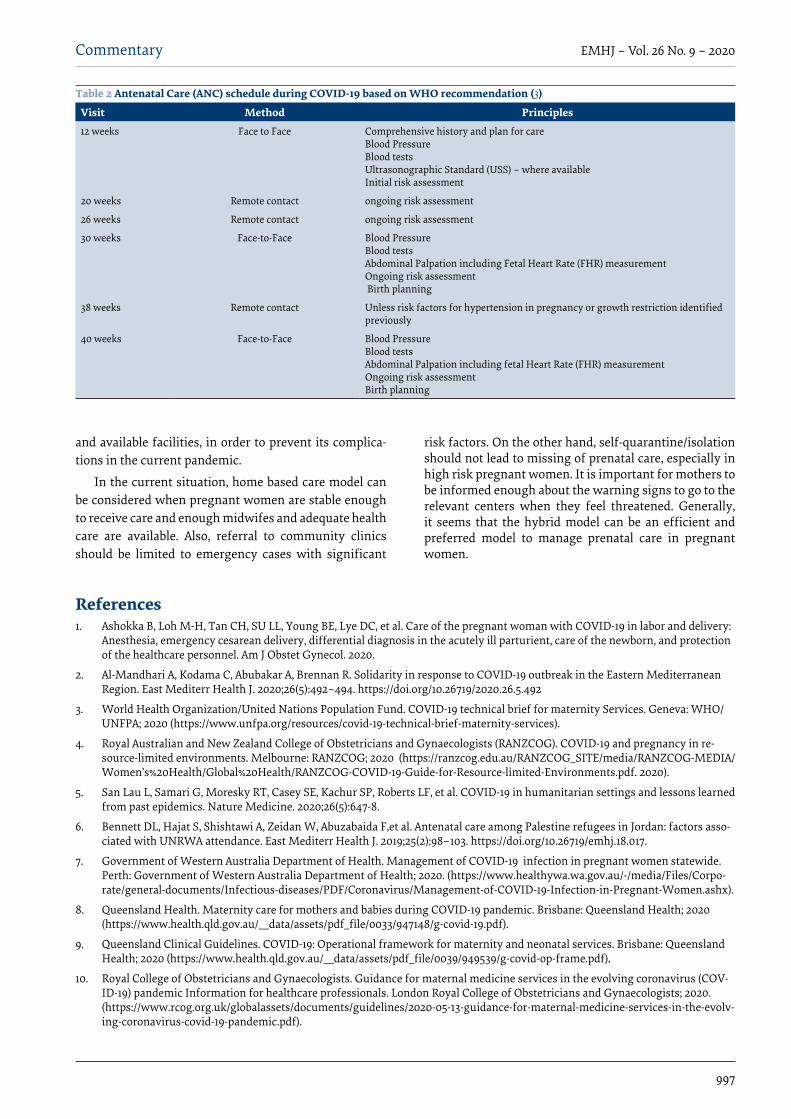
hand-held records (3). The model expressed by WHO is also a hybrid model, because methods of care delivery are combined. Table 2 according to a statement from WHO shows the schedule of prenatal care including three face to face and three remote visits during the COVID-19 pandemic (3).
The general content of the ANC remains unchanged in the context of COVID-19. However, maternity care providers need to be aware of the increased risk of antenatal anxiety and depression and domestic violence due to the economic and social impacts of the COVID19 pandemic. These issues add to the normal stresses of pregnancy so that maternity care providers need to have guidance/referral mechanisms in place to support these women (3,7).
ConclusionThe long-term effects of maternal morbidity and mortal-ity on families and communities should not be underes-timated. Currently, concentrating on COVID-19 would possibly distract pregnant women from routine antena-tal care. Also, it is important that they take precautions to protect themselves against COVID-19 and report symp-toms of infection to healthcare workers. Therefore, it is necessary to provide appropriate antenatal care models for pregnant women depending on their circumstances
Table 1 Models of ANC during COVID-19 pandemic(6)
Common considerations Specific ConsiderationsModels of care
Assessment for danger signs in pregnancy
Antenatal education
Psychosocial screening
Routine ultrasound
Vaccination
Screening tests
Supply of Iron; Folic Acid; Calcium; and other context-specific recommended supplements
Plan home visits based on risk management for woman and personnel involved If COVID-19 risk identified during or after home visiting, advise patient regarding the use of PPE and other procedures (self-quarantine) to minimize the risk of transmissionPrior to entering the woman’s home, assess the clinical status and social circumstances for both woman and any support persons at home Use standard home visiting risk assessment toolsIf risk of transmission or safety concerns identified, postpone the home visitMaintain physical (social) distancing (1.5 meter from the woman) during the visit where possible
Home visiting
If face-to-face contact throughout self-isolation/quarantine is important, use droplet, contact and standard precautions.Resume scheduled healthcare when self-quarantine/isolation complete Provide data concerning infection prevention and management practices which will stop prevent transmission of COVID-19Ventilate rooms by opening windows
Self-quarantine/isolation
Consider appointment scheduling to avoid groups of patients waitingAdvise women to arrive on time (not early) for appointmentAdvise to call ahead and present for care at hospital as advised by doctor or midwife
Community clinics
Assess needs as well as history taking and explanation for physical examination process on the day prior to visit by phone or video call (VC)For hospital visits, advise patients to wait outside the building until to be called in (e.g. in personal car or safe social distance in grounds) Limit face to face visits to 15 minutes just for physical examinationDo the follow-up after visit using phone or VCSchedule face-to-face visit for cares that needs physical association /care (e.g. vaccination)
Hybrid
997
Commentary EMHJ – Vol. 26 No. 9 – 2020
References 1. Ashokka B, Loh M-H, Tan CH, SU LL, Young BE, Lye DC, et al. Care of the pregnant woman with COVID-19 in labor and delivery:
Anesthesia, emergency cesarean delivery, differential diagnosis in the acutely ill parturient, care of the newborn, and protection of the healthcare personnel. Am J Obstet Gynecol. 2020.
2. Al-Mandhari A, Kodama C, Abubakar A, Brennan R. Solidarity in response to COVID-19 outbreak in the Eastern Mediterranean Region. East Mediterr Health J. 2020;26(5):492–494. https://doi.org/10.26719/2020.26.5.492
3. World Health Organization/United Nations Population Fund. COVID-19 technical brief for maternity Services. Geneva: WHO/UNFPA; 2020 (https://www.unfpa.org/resources/covid-19-technical-brief-maternity-services).
4. Royal Australian and New Zealand College of Obstetricians and Gynaecologists (RANZCOG). COVID-19 and pregnancy in re-source-limited environments. Melbourne: RANZCOG; 2020 (https://ranzcog.edu.au/RANZCOG_SITE/media/RANZCOG-MEDIA/Women’s%20Health/Global%20Health/RANZCOG-COVID-19-Guide-for-Resource-limited-Environments.pdf. 2020).
5. San Lau L, Samari G, Moresky RT, Casey SE, Kachur SP, Roberts LF, et al. COVID-19 in humanitarian settings and lessons learned from past epidemics. Nature Medicine. 2020;26(5):647-8.
6. Bennett DL, Hajat S, Shishtawi A, Zeidan W, Abuzabaida F,et al. Antenatal care among Palestine refugees in Jordan: factors asso-ciated with UNRWA attendance. East Mediterr Health J. 2019;25(2):98–103. https://doi.org/10.26719/emhj.18.017.
7. Government of Western Australia Department of Health. Management of COVID-19 infection in pregnant women statewide. Perth: Government of Western Australia Department of Health; 2020. (https://www.healthywa.wa.gov.au/-/media/Files/Corpo-rate/general-documents/Infectious-diseases/PDF/Coronavirus/Management-of-COVID-19-Infection-in-Pregnant-Women.ashx).
8. Queensland Health. Maternity care for mothers and babies during COVID-19 pandemic. Brisbane: Queensland Health; 2020 (https://www.health.qld.gov.au/__data/assets/pdf_file/0033/947148/g-covid-19.pdf).
9. Queensland Clinical Guidelines. COVID-19: Operational framework for maternity and neonatal services. Brisbane: Queensland Health; 2020 (https://www.health.qld.gov.au/__data/assets/pdf_file/0039/949539/g-covid-op-frame.pdf).
10. Royal College of Obstetricians and Gynaecologists. Guidance for maternal medicine services in the evolving coronavirus (COV-ID-19) pandemic Information for healthcare professionals. London Royal College of Obstetricians and Gynaecologists; 2020. (https://www.rcog.org.uk/globalassets/documents/guidelines/2020-05-13-guidance-for-maternal-medicine-services-in-the-evolv-ing-coronavirus-covid-19-pandemic.pdf).
and available facilities, in order to prevent its complica-tions in the current pandemic.
In the current situation, home based care model can be considered when pregnant women are stable enough to receive care and enough midwifes and adequate health care are available. Also, referral to community clinics should be limited to emergency cases with significant
risk factors. On the other hand, self-quarantine/isolation should not lead to missing of prenatal care, especially in high risk pregnant women. It is important for mothers to be informed enough about the warning signs to go to the relevant centers when they feel threatened. Generally, it seems that the hybrid model can be an efficient and preferred model to manage prenatal care in pregnant women.
Table 2 Antenatal Care (ANC) schedule during COVID-19 based on WHO recommendation (3)
Visit Method Principles 12 weeks Face to Face Comprehensive history and plan for care
Blood Pressure Blood tests Ultrasonographic Standard (USS) – where available Initial risk assessment
20 weeks Remote contact ongoing risk assessment
26 weeks Remote contact ongoing risk assessment
30 weeks Face-to-Face Blood PressureBlood tests Abdominal Palpation including Fetal Heart Rate (FHR) measurement Ongoing risk assessment Birth planning
38 weeks Remote contact Unless risk factors for hypertension in pregnancy or growth restriction identified previously
40 weeks Face-to-Face Blood PressureBlood tests Abdominal Palpation including fetal Heart Rate (FHR) measurementOngoing risk assessment Birth planning

998
Commentary EMHJ – Vol. 26 No. 9 – 2020
11. Zaigham MAO. Maternal and perinatal outcomes with COVID‐19: A systematic review of 108 pregnancies. Acta Obstet Gynecol Scand 2020;00:1–7 2020.
12. Dowswell T, Carroli G, Duley L, Gates S, Gülmezoglu AM, Khan‐Neelofur D, et al. Alternative versus standard packages of ante-natal care for low‐risk pregnancy. Cochrane Database Syst Rev. 2010 Oct 6;(10):CD000934. doi: 10.1002/14651858.CD000934.pub2

999
Short research communication EMHJ – Vol. 26 No. 9 – 2020
Blood coagulation parameters in patients with severe COVID-19 from Kermanshah Province, Islamic Republic of Iran Babak Sayad1 and Zohreh Rahimi2,3
1Infectious Diseases Research Center, Kermanshah University of Medical Sciences, Kermanshah, Islamic Republic of Iran. 2Fertility and Infertility Research Center, Health Technology Institute, Kermanshah University of Medical Sciences, Kermanshah, Islamic Republic of Iran. 3Department of Clinical Biochemistry, Kermanshah University of Medical Sciences, Kermanshah, Islamic Republic of Iran. (Correspondence to: Zohreh Rahimi: [email protected]; [email protected]).
AbstractBackground: Infection with coronavirus disease 2019 (COVID-19) could be complicated with coagulopathy and high risk of thromboembolic events. Aims: The main aim of the present study was to find the coagulation profile of intensive care unit (ICU) admitted patients with COVID-19 from Kermanshah, Islamic Republic of Iran.Methods: Coagulation parameters were analyzed using appropriate methods in 74 patients (24 patients aged <60 years and 50 patients ≥60 years) and were compared with 35 survivors (severe COVID-19) and 39 non-survivors (severe COVID-19) historically admitted to the ICU.Results: Forty-two percent of patients had abnormal prothrombin time and international normalized ratio. The rates of mortality and comorbidity in patients aged ≥ 60 years were 73.7% and 78.4% compared to 26.3% and 21.6%, respectively, in patients aged < 60 years. Conclusion: We found an abnormal pattern of coagulation parameters and association of advanced age and comorbidi-ties with a high rate of mortality in severe COVID-19 patients, which should be taken into consideration in their hospital management.Keywords: COVID-19, coagulation, prothrombin time, international normalized ratio, D-dimer, mortalityCitation: Sayad B; Rahimi Z. Blood coagulation parameters in patients with Severe COVID-19 from Kermanshah Province, Islamic Republic of Iran. East Mediterr Health J. 2020;26(9):999-1004. https://doi.org/10.26719/emhj.20.105Received: 13/06/20; accepted: 20/07/20Copyright © World Health Organization (WHO) 2020. Open Access. Some rights reserved. This work is available under the CC BY-NC-SA 3.0 IGO license (https://creativecommons.org/licenses/by-nc-sa/3.0/igo)
IntroductionThe severe acute respiratory syndrome coronavirus 2 (SARS-CoV-2) that is responsible for coronavirus dis-ease 2019 (COVID-19) resulted in systemic inflammatory response and imbalance between homeostatic mecha-nisms of procoagulant and anticoagulant. Moreover, it is complicated with thrombotic complications (1). In re-sponse to COVID-19 infection, activation of T cells along with massive production and release of cytokines occur with subsequent damage to internal organs, and primari-ly the lungs (2). Around 40% of hospitalized patients with COVID-19 are at a high risk of development of venous thromboembolism (VTE) (3). Among non-intensive care unit (ICU) COVID-19 French patients receiving thrombo-prophylaxis, the incidence of VTE and pulmonary embo-lism were 22.5% and 10%, respectively (4). Abnormal coag-ulation factors in Chinese patients with COVID-19 were associated with poor prognosis (5). In a number of studies (but not all) in-hospital death was associated with high level of D-dimer (> 1µg/ml) on admission (6).
There is an association between age and clinical severity of COVID-19 in patients aged ≥ 60 years, who demonstrate heavier clinical manifestations, higher severity and longer disease courses compared to patients aged < 60 years (7). The rate of mortality among ICU-
admitted patients with COVID-19 has been reported to be from 10% to around 44%, varying according to age and the presence of comorbidities that resulted in multi-organ failure (8-11).
There is no available study related to the evaluation of coagulation parameters in COVID-19 patients from the Islamic Republic of Iran. Kermanshah Province in the west of the country borders Iraq and has extensive communication with the Iraqi Kurdistan region, which could be a challenge in disease control. More comparison of reports from various populations related to the clinical course, outcome of COVID-19 and blood coagulation profile in these patients are necessary to help the management and treatment of the disease.
AimsThe aims of the present study were to find the coagula-tion profile of 74 consecutive ICU-admitted patients with COVID-19 from Kermanshah Province, Islamic Republic of Iran, and to determine the influence of age and comor-bidities on the level of these parameters. In addition, we aimed to compare coagulation parameters between sur-vivors and non-survivors to detect their effects on the severity and outcome of the disease.
1000
Short research communication EMHJ – Vol. 26 No. 9 – 2020
MethodsWe studied 74 consecutive patients with confirmed COV-ID-19 admitted to the ICU of Farabi Hospital of Kerman-shah University of Medical Sciences, being the second referral centre of COVID-19 in Kermanshah Province, from 7 March to 12 May 12, 2020. Patients consisted of 44 males and 30 females with a mean age of 65.1±17.1 years. There were 50 patients (67.6%) aged 60 years or older and 24 patients (32.4%) aged less than 60 years. Diagnosis of COVID-19 was made according to the chest CT scan and/or real time PCR. The samples for coagulation tests were collected at hospital admission. The prothrombin time (PT), aPTT, fibrinogen, and international normalized ra-tio (INR) were measured using Coatron M2 coagulation analyzer (TECO Medical Instruments, Germany). D-dim-er was measured by a Siemens device (Germany) using chemiluminescence method. Although our research was an observational study, verbal consent was obtained from patients or from next-of-kin.
A two-tailed student’s t-test and ANOVA were used to compare quantitative data between groups. Using the χ2 test the categorical variables were compared between groups. The quantitative data were expressed as Mean±SD. P-value < 0.05 was considered as statistically significant. SPSS statistical software package version 16.0 (SPSS Inc., Chicago, IL, USA) was used for statistical analysis.
Ethics approvalThe Ethics Committee of Kermanshah University of Medical Sciences approved the study (Ethics code: IR.KUMS.REC.1399.049) and the study was in accordance with the principles of the Declaration of Helsinki II.
Results Twenty-six out of 74 patients (35.1%) required tracheal intubation (64.1% non-survivors and 2.9% survivors, P < 0.001). Fifty-one out of 74 patients (around 69%) had co-morbidities (hypertension, diabetes mellitus, coronary
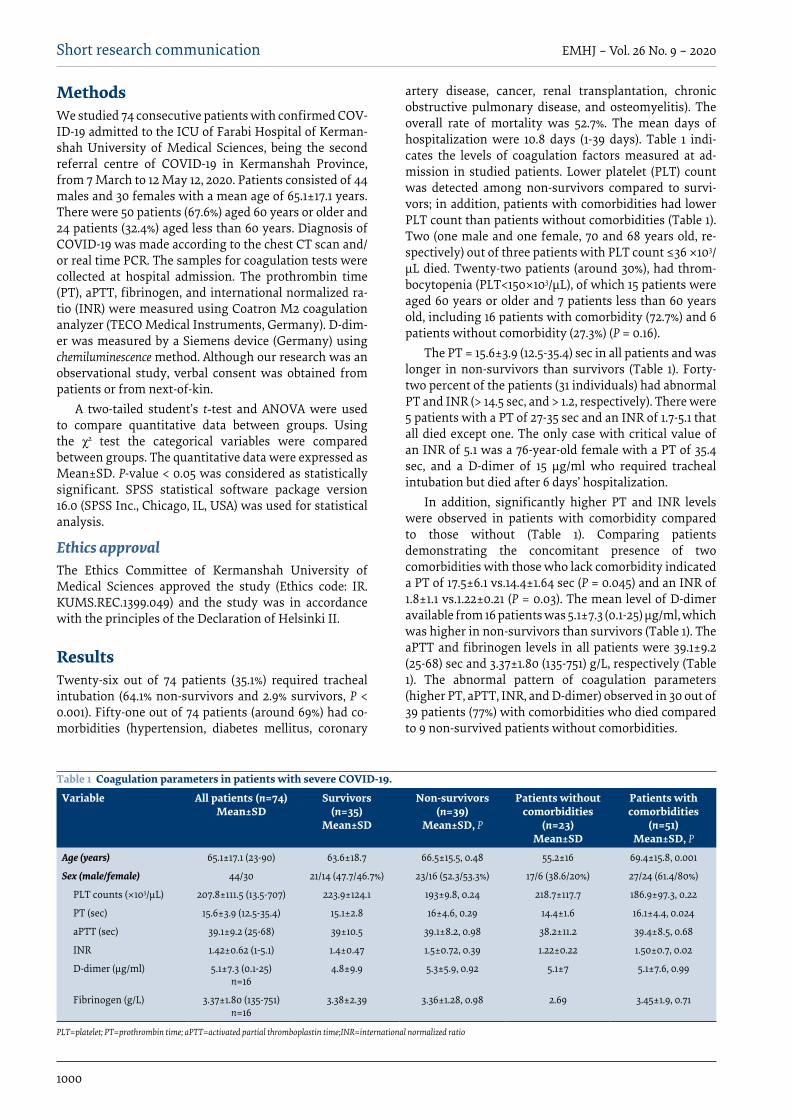
artery disease, cancer, renal transplantation, chronic obstructive pulmonary disease, and osteomyelitis). The overall rate of mortality was 52.7%. The mean days of hospitalization were 10.8 days (1-39 days). Table 1 indi-cates the levels of coagulation factors measured at ad-mission in studied patients. Lower platelet (PLT) count was detected among non-survivors compared to survi-vors; in addition, patients with comorbidities had lower PLT count than patients without comorbidities (Table 1). Two (one male and one female, 70 and 68 years old, re-spectively) out of three patients with PLT count ≤36 ×103/µL died. Twenty-two patients (around 30%), had throm-bocytopenia (PLT<150×103/µL), of which 15 patients were aged 60 years or older and 7 patients less than 60 years old, including 16 patients with comorbidity (72.7%) and 6 patients without comorbidity (27.3%) (P = 0.16).
The PT = 15.6±3.9 (12.5-35.4) sec in all patients and was longer in non-survivors than survivors (Table 1). Forty-two percent of the patients (31 individuals) had abnormal PT and INR (> 14.5 sec, and > 1.2, respectively). There were 5 patients with a PT of 27-35 sec and an INR of 1.7-5.1 that all died except one. The only case with critical value of an INR of 5.1 was a 76-year-old female with a PT of 35.4 sec, and a D-dimer of 15 µg/ml who required tracheal intubation but died after 6 days’ hospitalization.
In addition, significantly higher PT and INR levels were observed in patients with comorbidity compared to those without (Table 1). Comparing patients demonstrating the concomitant presence of two comorbidities with those who lack comorbidity indicated a PT of 17.5±6.1 vs.14.4±1.64 sec (P = 0.045) and an INR of 1.8±1.1 vs.1.22±0.21 (P = 0.03). The mean level of D-dimer available from 16 patients was 5.1±7.3 (0.1-25) µg/ml, which was higher in non-survivors than survivors (Table 1). The aPTT and fibrinogen levels in all patients were 39.1±9.2 (25-68) sec and 3.37±1.80 (135-751) g/L, respectively (Table 1). The abnormal pattern of coagulation parameters (higher PT, aPTT, INR, and D-dimer) observed in 30 out of 39 patients (77%) with comorbidities who died compared to 9 non-survived patients without comorbidities.
Table 1 Coagulation parameters in patients with severe COVID-19.
Variable All patients (n=74)Mean±SD
Survivors (n=35)
Mean±SD
Non-survivors (n=39)
Mean±SD, P
Patients without comorbidities
(n=23)Mean±SD
Patients with comorbidities
(n=51)Mean±SD, P
Age (years) 65.1±17.1 (23-90) 63.6±18.7 66.5±15.5, 0.48 55.2±16 69.4±15.8, 0.001
Sex (male/female) 44/30 21/14 (47.7/46.7%) 23/16 (52.3/53.3%) 17/6 (38.6/20%) 27/24 (61.4/80%)
PLT counts (×103/µL) 207.8±111.5 (13.5-707) 223.9±124.1 193±9.8, 0.24 218.7±117.7 186.9±97.3, 0.22
PT (sec) 15.6±3.9 (12.5-35.4) 15.1±2.8 16±4.6, 0.29 14.4±1.6 16.1±4.4, 0.024
aPTT (sec) 39.1±9.2 (25-68) 39±10.5 39.1±8.2, 0.98 38.2±11.2 39.4±8.5, 0.68
INR 1.42±0.62 (1-5.1) 1.4±0.47 1.5±0.72, 0.39 1.22±0.22 1.50±0.7, 0.02
D-dimer (µg/ml) 5.1±7.3 (0.1-25)n=16
4.8±9.9 5.3±5.9, 0.92 5.1±7 5.1±7.6, 0.99
Fibrinogen (g/L) 3.37±1.80 (135-751)n=16
3.38±2.39 3.36±1.28, 0.98 2.69 3.45±1.9, 0.71
PLT=platelet; PT=prothrombin time; aPTT=activated partial thromboplastin time;INR=international normalized ratio

1001
Short research communication EMHJ – Vol. 26 No. 9 – 2020
In Table 2 the coagulation parameters have been compared between two age groups: patients aged ≥ 60 years old (n=50) and those below 60 years old (n=24). There were 50 patients (68%) aged 60-90 years (75.4±8.5 years) a PT of 16.1±4.4 sec and an INR of 1.51±0.71, which compared to 24 patients (32%) aged below 60 years with a mean age of 44.2±8.9 years and a PT level of 14.6±1.9 sec (P = 0.059) and an INR of 1.26±0.29 (P = 0.056). Among patients ≥ 60 years 80% needed a ventilator and 78.4% had comorbidities. The mortality rate was 73.7% compared to patients aged <60 years of whom 20% required a ventilator (P = 0.09), 21.6% (P = 0.002) had comorbidities, and the death rate was 26.3% (P = 0.2) (Table 2).
DiscussionThe overall rate of mortality in severely affected patients in this study was 52.7%. Patients were mostly aged 60 years or older with a high rate of comorbidity (69%) and a mortality rate of 73.7%. The high mortality rate among ICU-admitted patients from the present study was due increased age and a high rate of comorbidities. In a re-ferral centre for COVID-19 in Tehran, the two-week mor-tality rate was 25% among 72 ICU-admitted patients with COVID-19. However, the age of these patients had not been reported (12). Three studies from Italy reported a difference in mortality rate; in one study the ICU and the hospital mortality rate of COVID-19 patients with a mean age of 61 years were 10% and 12.5%, respectively (8). In a second study among patients with a mean age of 70 years the tracheal intubation rate was 8.5% and the overall mor-tality was 12.8%. All patients who died were on ventilation and had multiple comorbidities. Alterations in coagula-tion parameters were observed in 41% of cases (10). In a third study 43.7% of ICU-admitted patients with a mean age of 61 years did not recover and died due to hypoxia and multi-organ failure (11).
However, in one study from the Netherlands the mortality rate among ICU-admitted patients was 22% (9). It was noted that in older adults immune senescence and enhanced inflammatory responses associated with aging might increase the risk of infection and dysregulation of immune response to SARS-CoV-2 (13,14); in addition, comorbidities increase with aging (13). In a study from Mexico, higher age was found to be a predictor of
disease mortality, but comorbidities and determinants of structural health had a greater role in the severity of disease in older patents (13).
Thus, there is an age-based exponential increase in the mortality rate. Around 80% and 90% of deaths due to COVID-19 occurred in patients aged > 70 years and ≥ 60 years in Korea and Italy, respectively. In Korea the overall case fatality rate was 2.37%, which was much higher in older patients (15).
Thrombocytopenia was detected in around 30% of mostly older patients with comorbidities and in non-survivors. The longer PT and higher INR was found in 42% of patients, especially in patients > 60 years with increased comorbidities and mortality, compared to patients < 60 years, also the PT >27 sec was fatal. Thrombocytopenia and abnormal coagulation parameters (PT, INR, D-dimer) could be considered as important indicators of severe COVID-19 associated with mortality. Using the cut-off value of D-dimer 1.5µg/mL for prediction of VTE, 8 out of 16 (50%) our patients had VTE. In a report from 81 severe COVID-19 ICU-admitted Chinese patients there were 20 (25%) with VTE (16).
Various reports have been published regarding the levels of D-dimer and the severity of COVID-19. While in some studies in-hospital mortality was associated with a high level of D-dimer (> 1µg/ml) on admission, other studies found no significant difference in D-dimer level between severe and non-severe patients (4,5,6). It should be considered that D-dimer assays are not necessarily comparable due to different calibrators, detection antibodies and methods (6). High levels of D-dimer have been associated with 28-day mortality among patients with infection or sepsis. The systemic pro-inflammatory cytokines contribute to plaque rupture through local inflammation, induced procoagulant pathway at multiple levels, such as induction of coagulation activation by proinflammatory cytokines of TNF, IL-1, IL-6 and IL-12, and haemodynamic alterations are mechanisms involved in predisposition to ischaemia and thrombosis (17). The most haemostatic abnormalities in patients with COVID-19 requiring greater mechanical ventilation, ICU admission, or death, were mild thrombocytopenia and increased levels of D-dimer, indicating the presence of some forms of coagulopathy with increased risk of thrombotic events (3).
Table 2 Coagulation parameters in patients with severe COVID-19 according to age
Variable Less than 60 years (n=24)Mean±SD
60 years or more (n=50)Mean±SD
P value
PLT counts (×103/µL) 229±144.2 196.9±92.2 0.32
PT (sec) 14.6±1.9 16.1±4.4 0.059
aPTT (sec) 37.8±7.4 39.6±10 0.42
INR 1.26±0.29 1.5±0.71 0.056
D-dimer (µg/ml) 7.65±9.5 n=7
3.2±4.7n=9
0.28
Fibrinogen (g/L) 4.9±1.90 n=6
2.4±0.6n=10
0.08
1002
Short research communication EMHJ – Vol. 26 No. 9 – 2020
No prolonged aPTT (more than 70 sec) was observed in patients for this study, which might explain the absence of disseminated intravascular coagulation (DIC) bleeding in patients. In some patients with COVID-19 there was an associated coagulopathy, but even in those patients with DIC, bleeding was not manifested since these abnormalities could be the result of a profound inflammatory response that did not result in bleeding (18).
In Caucasian patients with COVID-19 and extended thrombo-prophylaxis with low molecular weight heparins, overt DIC rarely developed. However, in those patients with COVID-19 who developed DIC, this complication appeared during a late stage of the disease. A term of pulmonary intravascular coagulopathy was suggested for bilateral pulmonary inflammation observed in COVID-19 patients to discern from DIC (19).
Based on recommendations from the International Society on Thrombosis and Haemostasis, patients with markedly increased D-dimer (three to four-fold increase), should be considered for hospital admission even in the absence of other symptoms. In addition, all hospitalized COVID-19 patients with this elevation should receive
thromboprophylaxis or full therapeutic-intensity antico-agulation (20).
ConclusionThe overall mortality rate in patients with severe COV-ID-19 was 52.7%. However, the rate of mortality was 73.7% in patients ≥ 60 years compared to 26.3% in patients aged <60 years. This study indicated that ages > 60 years were associated with high rate of comorbidities, abnormal lev-el of coagulation parameters and poor prognosis. In ad-dition, we detected a high rate of coagulopathy (42%) in severely affected patients with COVID-19. Furthermore, severe COVID-19 patients had low levels of PLT, high PT and INR that were associated with poor prognosis. The abnormal pattern of coagulation parameters was highly associated with comorbidities and mortality. Coagula-tion tests such as PLT, PT, PTT, D-dimer, and fibrinogen should be performed at hospital admission stage in pa-tients suspected or confirmed to have COVID-19 infec-tion in order to provide useful prognostic information. These patients should be treated with pharmacologic VTE prophylaxis unless there were specific contra-indi-cations.
AcknowledgementWe thank all patients involved in the study.
Funding: None.
Competing interests: None declared.
Paramètres de coagulation sanguine chez des patients atteints de COVID-19 sévère dans la province de Kermanshah (République islamique d’Iran) RésuméContexte : L’infection par la COVID-19 peut être compliquée par une coagulopathie et un risque élevé d’événements thromboemboliques. Objectifs : L’objectif principal de la présente étude était de déterminer le profil de coagulation des patients atteints de COVID-19 admis en soins intensifs à Kermanshah (République islamique d’Iran).Méthodes : Les paramètres de coagulation ont été analysés chez 74 patients (24 patients âgés de moins de 60 ans et 50 patients âgés de 60 ans et plus) à l’aide de méthodes appropriées et ont été comparés aux paramètres de 35 survivants (COVID-19 sévère) et 39 non-survivants (COVID-19 sévère) qui avaient été admis en soins intensifs.Résultats : Pour quarante-deux pour cent (42 %) des patients, le temps de prothrombine et le rapport normalisé international étaient anormaux. Les taux de mortalité et de comorbidité chez les patients âgés de 60 ans et plus étaient de 73,7 % et 78,4 %, contre à 26,3 % et 21,6 %, respectivement, chez les patients âgés de moins de 60 ans. Conclusions : Nous avons trouvé un schéma anormal des paramètres de coagulation et une association entre un âge avancé et des comorbidités avec un taux de mortalité élevé chez les patients atteints de COVID-19 sévère, qui devraient être pris en compte dans leur prise en charge à l’hôpital.

1003
Short research communication EMHJ – Vol. 26 No. 9 – 2020
References1. Giannis D, Ziogas IA, Gianni R. Coagulation disorders in coronavirus infected patients: COVID-19, SARS-CoV-1, MERS-CoV and
lessons from the past. J Clin Virol. 2020;127:104362.
2. Ebrahimi A, Sayad B, Rahimi Z. COVID-19 and psoriasis: biologic treatment and challenges. J Dermatol Treat. 2020 doi:10.1080/09546634.2020.1789051.
3. Bikdeli B, Madhavan MV, Jimenez D, Chuich T, Dreyfus I, Driggin E, et al. COVID-19 and thrombotic or thromboembolic disease: implications for prevention, antithrombotic therapy, and follow-up. J Am Coll Cardiol. 2020 Jun 16;75(23):2950-2973 doi:10.1016/j.jacc.2020.04.031.
4. Artifoni M, Danic G, Gautier G, Gicquel P, Boutoille D, Raffi F, et al. Systematic assessment of venous thromboembolism in COVID-19 patients receiving thromboprophylaxis: incidence and role of D-dimer as predictive factors. J Thromb Thromboly-sis. 2020 Jul;50(1):211-216 doi:10.1007/s11239-020-02146-z.
5. Tang N, Li D, Wang X, Sun Z. Abnormal coagulation parameters are associated with poor prognosis in patients with novel coro-navirus pneumonia. J Thromb Haemost. 2020;18(4):844–847.
6. Favaloro EJ, Thachil J. Reporting of D-dimer data in COVID-19: some confusion and potential for misinformation. Clin Chem Lab Med. 2020;58(8):1191–1199.
7. Liu Y, Mao B, Liang S, Yang JW, Lu HW, Chai YH ,et al. Association between age and clinical characteristics and outcomes of COVID-19. Eur Respir J. 2020;55(5):2001112 doi:10.1183/13993003.01112-2020.
8. Pavoni V, Gianesello L, Pazzi M , Stera C, Meconi T, Frigieri FC. Evaluation of coagulation function by rotation thromboelas-tometry in critically ill patients with severe COVID-19 pneumonia. J Thromb Thrombolysis. 2020 Aug;50(2):281-286 doi:10.1007/s11239-020-02130-7.
9. Klok FA, Kruip MJHA, van der Meer NJM, Arbous MS, Gommers D, Kant KM, Kaptein FHJ, et al. Confirmation of the high cu-mulative incidence of thrombotic complications in critically ill ICU patients with COVID-19: An updated analysis. Thromb Res. 2020;191:148–150.
10. Annunziata A, Imitazione P, Polistina GE. Pulmonary embolism in Covid-19. coagulation parameters, close monitoring to pre-vent? Turk Thorac J. 2020;21:287-288. doi:10.5152/TurkThoracJ.2020.20067
11. Ranucci M, Ballotta A, Di Dedda U, Bayshnikova E, Poli MD, Resta M, et al. The procoagulant pattern of patients with COVID-19 acute respiratory distress syndrome. J Thromb Haemost 2020;18(7):1747-1751
12. Jamaatia H , Dastana F, Tabarsic P, Marjanic M , Saffaeid A, Hashemiana MR. A fourteen-day experience with Coronavirus Disease 2019 (COVID-19) induced acute respiratory distress syndrome (ARDS): an Iranian treatment protocol. Iran J Pharma Res. 2020;19(1):31-36.
13. Bello-Chavolla OY, González-Díaz A, Antonio-Villa NE, Fermín-Martínez CA, Márquez-Salinas A, Vargas-Vázquez A, et al. Unequal impact of structural health determinants and comorbidity on COVID-19 severity and lethality in older Mexican adults: Considerations beyond chronological aging. J Gerontol Series A, glaa163, doi:10.1093/gerona/glaa163
14. Nikolich-Zugich J, Knox KS, Rios CT, Natt B, Bhattacharya D, Fain MJ. et al. SARS-CoV-2 and COVID-19 in older adults: what we may expect regarding pathogenesis, immune responses, and outcomes. GeroScience. 2020;42(2):505–514.
متثابتات ختثر الدم لدى احلاالت الوخيمة ملرىض كوفيد19- من مقاطعة كرمانشاه، مجهورية إيران اإلسالميةبابك سياد، زهرة رحيمي
اخلالصةاخللفية: يمكن أن تتفاقم العدوى بمرض الفريوس التاجي 2019 )كوفيد-19( يف وجود اعتالل التخثر ويرتفع خطر حدوث االنسداد التجلطي.األهداف: اهلدف الرئييس من هذا البحث هو الكشف عن مرتسم التخثر يف املرىض بكوفيد-19 الذين أدخلوا يف وحدة العناية املركزة من كرمانشاه
يف مجهورية إيران اإلسالمية.طرق البحث: حللت متثابتات التخثر بطرق مناسبة يف 74 مريضا )24 مريضا قلت أعامرهم عن 60 عاما ، و50 مريضا زادت عمرهم عن 60 عاما أو ساوته( وقورنت مع 35 ناجيا )من مرض كوفيد-19 الوخيم( و39 من غري الناجني )من مرض كوفيد-19 الوخيم( من الذين أدخلوا
تارخييا يف وحدة العناية املركزة.النتائج: كان اثنان وأربعون يف املائة من املرىض لدهيم مستوى غري طبيعي يف زمن الربوثرومبني والنسبة املعيارية الدولية. وكانت معدالت الوفيات واالعتالل املشرتك للمرىض يف عمر أكرب من 60 عاما أو يساويه 73.7٪ و78.4٪ مقارنة بنسبة 26.3٪ و21.6٪ عىل التوايل يف املرىض الذين تقل
أعامرهم عن 60 عاما.االستنتاجات: لقد وجدنا نمطا غري طبيعي ملتثابتات التخثر وارتباطا بني تقدم العمر واالعتالالت املشرتكة مع ارتفاع معدل الوفيات يف احلاالت
الوخيمة لكوفيد-19، وجيب مراعاة ذلك أثناء التدبري العالجي يف املستشفى.

1004
Short research communication EMHJ – Vol. 26 No. 9 – 2020
15. Kang SJ, Jung SI. Age-related morbidity and mortality among patients with COVID-19. Infect Chemother. 2020;52(2):154-164.
16. Cui S, Chen S, Li X, Liu S, Wang F. Prevalence of venous thromboembolism in patients with severe novel coronavirus pneumo-nia. J Thromb Haemost. 2020;18:1421–1424
17. Zhou F, Yu T, Du R, Fan G, Liu Y, Liu Z, et al. Clinical course and risk factors for mortality of adult inpatients with COVID-19 in Wuhan, China: a retrospective cohort study. Lancet 2020; 395:1054–62.
18. Conners JM, Levy JH. COVID-19 and its implications for thrombosis and anticoagulation. Blood. 2020;135(23):2033–2040.
19. Fogarty H, Townsend L, Cheallaigh CN, Bergin C, Martin-Loeches I, Browne P, et al. COVID-19 coagulopathy in Caucasian pa-tients. Br J Haematol. 2020;189:1044–1049.
20. Kollias A, Kyriakoulis KG, Dimakakos E, Poulakou G , Stergiou GS , Syrigos K. Thromboembolic risk and anticoagulant therapy in COVID-19 patients: Emerging evidence and call for action. Br J Haematol. 2020;189(5):846-847.

1005
Short research communication EMHJ – Vol. 26 No. 9 – 2020
COVID-19 in the Eastern Mediterranean Region: testing frequency, cumulative cases and mortality analysisPascale Salameh1,2,3
1Faculty of Public Health, Lebanese University, Fanar, Lebanon. 2Faculty of Medicine, Lebanese University, Hadat, Lebanon. 3INSPECT-LB: Institut National de Santé Publique, Epidémiologie Clinique et Toxicologie, Beirut, Lebanon. (Correspondence to: Pascale Salameh: [email protected]).
AbstractBackground: COVID-19 is now well documented in the Eastern Mediterranean Region; however, the incidence, mortality and fatality rates differ by country. Aims: The study aimed to describe the COVID-19 pandemic in the Eastern Mediterranean Region, assessing the inci-dence, mortality-related and fatality rate in different countries, in comparison with the worldwide mean. Methods: Data were sourced from the Worldometer surveillance page and from governmental reporting channels. Data were exported and analyzed using Statistical Package for Social Sciences (SPSS, version 23.0).Results: In the Eastern Mediterranean Region, the testing frequency is heterogeneous between countries, in addition to the reported cases and death. Very few data are available from countries with political instability and security problems (Yemen, Syrian Arab Republic and Sudan), particularly for the testing frequency. Overall, despite similar rates of testing, there was a significantly lower incidence in the Eastern Mediterranean Region versus the rest of the world, in addition to a lower mortality per million-population, particularly in countries with low to moderate testing rates. However, in coun-tries with higher testing than the world average, there is a higher incidence, a lower mortality, but an unexpected higher fatality rate. Conclusion: The overall testing frequency was similar in the Eastern Mediterranean Region compared to the rest of the world; this would be expected to lead to a similar cumulative incidence and case fatality rate. Nevertheless, the average incidence was 70% lower than the rest of the world, and mortality per million-population was lower (90%). Moreover, in Gulf Cooperation Council high-testing countries, a similar case-fatality rate to other countries in the Region was noted, but was higher than the world average, although expected to be lower. Further studies are necessary to explain discrep-ancies in incidence, mortality and fatality rates among countries; principally, environmental, genetic and managerial reasons should be investigated.Keywords: COVID-19; testing rate; fatality; Middle East; incidenceCitation: Salameh P. COVID-19 in the Eastern Mediterranean Region: testing frequency, cumulative cases and mortality analysis. East Mediterr Health J. 2020;26(9):1005-1010. https://doi.org/10.26719/emhj.20.110Received: 21/05/20; accepted: 18/08/20Copyright © World Health Organization (WHO) 2020. Open Access. Some rights reserved. This work is available under the CC BY-NC-SA 3.0 IGO license (https://creativecommons.org/licenses/by-nc-sa/3.0/igo)
IntroductionA newly discovered virus (SARS-CoV2) and its related disease (COVID-19) started in China in December 2019; it caused a pandemic that reached mainly high-income countries, but also a number of low and middle-income countries (1). COVID-19 was declared a pandemic by the World Health Organization (WHO) and has resulted in 2 500 448 cases and 171 504 deaths (as of 21 April 2020) (2). There have been recorded cases in the Eastern Mediter-ranean Region (EMR) countries, but so far at a relatively lower rate.
The EMR Member States are Arab nations (3), in addition to Afghanistan, the Islamic Republic of Iran, and Pakistan. From a cultural perspective, the Region is primarily Islamic (90% of the population), and the vast majority of the population lives in low- to middle-income countries, with the notable exception of the high-income Gulf Cooperation Council (GCC) countries. Health care systems vary from one country to another according to gross domestic product and the size of the private
versus public health sector (3). Although conditions in low- to middle-income countries theoretically increase the risk of exposure to the highly infectious coronavirus (overcrowding, low socioeconomic status and health care system preparedness), it appears there are in fact lower incidences of related infections (4). However, under-testing and/or under-reporting to international instances might offer possible explanations for this anomaly.
To date, it would appear no analytic work has been conducted concerning the magnitude of the COVID-19 pandemic in the Region, although data are available for all the countries (http://www.emro.who.int/health-topics/corona-virus/index.html). Some recent articles analyzed and/or forecasted COVID-19 in individual countries such as Pakistan (5), Egypt (6), Gaza (7) and Sudan (8), but none did comparisons between the countries.
The objective of this study was to describe the COVID-19 pandemic in the EMR and assess the incidence, mortality-related and fatality rate in different EMR countries in comparison with the worldwide mean.

1006
Short research communication EMHJ – Vol. 26 No. 9 – 2020
MethodsCountry data were taken from the Worldometer sur-veillance page – a data source that is run by an interna-tional team of developers, researchers and volunteers with the goal of making world statistics available in a thought-provoking and time relevant format to a wide audience around the world (2). COVID-19 data were col-lected via the site from official reports, government communication channels, and local media sources when deemed reliable.
Data were exported and analyzed using Statistical Package for Social Sciences (SPSS, version 23.0). To establish a basic concept, regression analysis was conducted on worldwide data, taking the case fatality rate as a dependent variable, while testing frequency and cumulative cases were used as independent variables; regression assumptions were checked.
For the EMR a descriptive analysis was conducted; means and standard deviations were reported, in addition to medians and interquartile ranges. Reporting results per million-population allowed a better comparison with global figures. t-tests were used to compare between the Region mean and the rest of the world mean incidence, mortality, fatality and testing frequency per million, after checking homoscedasticity assumption (in case of heterogeneous variances, the corrected t-test was used). In addition, the testing frequency of the Region was divided into tertiles, allowing to compare the mean incidence and mortality between countries with high, moderate and low testing frequency, using the Kruskal-Wallis non parametric test, since the homoscedasticity assumption for using ANOVA was not met. Comparison with the world average was also conducted. A P-value <0.05 was considered significant.
ResultsWorldwide dataOn 21 April 2020 the mean cumulative number of cas-es was 681.53 cases per million persons (SD=1566.84), while the mean case fatality rate was 4.82% (SD=4.35). In addition, the mean number of tests per million/pop-ulation was 9973.93 (SD=18405.75). The median [IQR] for these variables were respectively: 114.00[19.00;607.00], 3.51[1.71;6.31] and 3866[530.75; 11410.25].
However, the regression analysis applied to the world data showed that the case fatality rate could be represented using the following equation: Case fatality rate = 0.048 + 8.056.10-6 *cumulative cases/million-population – 1.061*10-6*Tests/Million-population. The adjusted R square of this regression model was 0.121, while the P-value for both factors was <0.001; the normality plots of residues were considered appropriate. The regression shows that the case-fatality rate was positively associated with reported cumulative cases (cumulative incidence), but negatively associated with testing frequency in the population. This result suggested that the higher the testing frequency, the lower the fatality rate.
The Eastern Mediterranean RegionThe WHO EMR includes 22 countries: Afghanistan, Bah-rain, Djibouti, Egypt, Islamic Republic of Iran, Iraq, Jor-dan, Kuwait, Lebanon, Libya, Morocco, Oman, Pakistan, Palestine, Qatar, Saudi Arabia, Somalia, Sudan, Syrian Arab Republic, Tunisia, the United Arab Emirates (UAE), and Yemen. The COVID-19 distribution in the Region is presented in Table 1. The highest numbers of cases were reported in the Islamic Republic of Iran, Saudi Arabia and Pakistan, while the lowest numbers were reported in Bahrain, Syrian Arab Republic and Yemen. As for case fatality numbers, Bahrain, Sudan and the Syrian Arab Re-public reported the highest rates, while the lowest rates were shown in Kuwait, Djibouti and Qatar. Data for test-ing frequency were not available for all countries, name-ly Kuwait, Oman, Somalia, Sudan, Syrian Arab Republic and Yemen. Testing frequency was lowest for Afghani-stan and Libya (<200 tests per million-population), and highest for Bahrain, Qatar and UAE (>20.000 tests/mil-lion-population) (Table 1).
Comparison between Eastern Mediterranean Region and worldwide dataTable 2 indicates comparison between EMR data and the rest of the world. Despite similar rates of testing, there was a significantly lower incidence in the EMR versus the rest of the world (cases per million-population), in addition to lower mortality per million-population and similar case-fatality rates (Table 2). It was noted that the ratios between the global and EMR figures were not pro-portionate; the incidence ratio was 2.90, the mortality ra-tio 8.95 and the case fatality ratio was 1.24.
Comparison between Eastern Mediterranean Region countries and the rest of the world according to testing frequencyTertiles of testing frequency were the following: T1<1463 tests/million for Afghanistan, Libya, Egypt, Morocco, Pa-kistan, Tunisia (low testing rate); 1464<T2<4203 tests/million for Islamic Republic of Iran, Iraq, Jordan, Leba-non and Palestine (moderate testing rate); and T3>4204 test/million for Bahrain, Djibouti, Qatar, Saudi Arabia, and UAE (high testing rate).
Figure 1 presents the mean results of incidence, mortality and fatality rates according to the tertiles of testing frequency: P-value was 0.008 for incidence rates (higher cases/million were associated with higher testing frequency), while P-values were non-significant for mortality and fatality rates between EMR countries. It was noted that the mean case-fatality ratio is slightly but significantly higher than the world average (7.73 vs 6.86; P <0.001).
Note: Kruskall-Wallis test was used. P-value=0.008 for incidence rates (higher cases/million were associated with higher testing frequency); P-values non-significant for mortality (P=0.289) and fatality rates (P=0.193) between EMRO countries. Case fatality rate significantly

1007
Short research communication EMHJ – Vol. 26 No. 9 – 2020
different between high testing countries and worldwide average (P<0.001).
DiscussionIn the Region the testing frequency is heterogeneous between countries, in addition to the reported cases and mortality rates. Data from individual countries were sim-ilar to that described by Dil et al. (5). Limited data were available from countries with political instability and security problems (Yemen, Syrian Arab Republic and Su-dan), particularly for the testing frequency.
In this analysis, it is shown that globally the case-fatality rate is positively associated with reported cumulative cases (cumulative incidence), but negatively associated with testing frequency in the population. However, in the Region the testing frequency was similar on average to that reported in the rest of the world; this would be expected to lead to a similar cumulative incidence and case fatality rate. Nevertheless, the incidence in the EMR versus the rest of the world was lower by two thirds, whereas mortality per million-population was lower by 90%; only case-fatality rate
Table 1 COVID-19 cases and mortality in Eastern Mediterranean Region, 21 April 2020
Country Total cases
Total deaths
Total recovered
Active cases
Serious critical
Cases/M
Death/M
Total test
Test/M Millions population
ReportedFatality
rate
Bahrain 1907 7 769 1131 2 1121 4 89 225 52 437 1.70156568 0.0037
Sudan 107 12 8 87 2 0.3 0.1121
Syrian Arab Republic 39 3 5 31 2 0.2 0.0769
Egypt 3333 250 821 2262 33 2 55 000 537 102.4208566 0.0750
Islamic Republic of Iran
83 505 5209 59 273 19 023 3389 994 62 353 012 4203 83.99048299 .0624
Iraq 1574 82 1043 449 39 2 59 055 1468 40.22820163 0.0521
Morocco 3046 143 350 2553 1 83 4 16 386 444 36.90540541 0.0469
Tunisia 884 38 148 698 34 75 3 17 287 1,463 11.81613124 0.0430
Somalia 237 8 4 225 2 15 0.5 0.0338
Afghanistan 1092 36 150 906 7 28 0.9 6422 165 38.92121212 0.0330
Yemen 1 1 0.03 0.0330
Lebanon 677 21 103 553 27 99 3 20 929 3,066 6.82615786 0.0310
Pakistan 9216 192 2066 6958 46 42 0.9 111 806 506 220.9604743 0.0208
Libya 51 1 15 35 7 0.1 808 118 6.847457627 0.0196
Jordan 425 7 282 136 5 42 0.7 33 000 3234 10.20408163 0.0165
Saudi Arabia 10 484 103 1490 8891 88 301 3 180 000 5170 34.81624758 0.0098
Palestine 461 4 71 386 90 0.8 17 329 3397 5.101265823 0.0087
United Arab Emirates 7265 43 1360 5862 1 735 4 790 000 79 875 9.890453834 0.0059
Oman 1,508 8 238 1262 3 295 2 0.0053
Kuwait 1995 9 367 1619 39 467 2 0.0045
Djibouti 846 2 102 742 856 2 8144 8243 0.98798981 0.0024
Qatar 6015 9 555 5451 37 2088 3 64 620 22 429 2.881091444 0.0015
Table 2 COVID-19 cases cumulative incidence, mortality and testing comparison between Eastern Mediterranean Region and the rest of the world (average)
Region Total population in
million
Total cases Total deaths
Mean cases per million
Mean death per
million
Mean reported
fatality rate (%)
Reported totaltests
Mean reportedtests per thousand
Eastern Mediterranean Region
700 125 108 6252 251.27 4.73 4.00 1 606 714 8.45
Rest of the World 7779 2 205 685 154 391 727.56 42.35 4.96 18 240 910 10.16
P-value 0.002* 0.001* 0.733** 0.347***P-value was calculated using corrected Student testing (variances were heterogeneous). **P-value was calculated using Student testing (variances were homogeneous).

1008
Short research communication EMHJ – Vol. 26 No. 9 – 2020
was similar. These results could be explained by high heterogeneity in terms of testing frequency.
In fact, when dividing the countries into tertiles of testing, results became clearer. In high-testing countries (higher than the world average testing rate), there was a higher incidence and similar mortality, which is expected according to the regression model. In addition, high-testing rates were expected to decrease overall fatality rate; the examples of Germany and South Korea are striking in this regard (9). Higher testing should generally lead to better identification of cases and to their early isolation, in addition to their contact tracing, which are related to lower fatality rate (10). Nevertheless, the fatality rate that was found in these countries was expected to be lower than other countries; however, this was not the case and was significantly higher than that of the world average.
This finding was intriguing, particularly knowing that these nations are high-income countries in general (GCC countries), with reported stricter confinement measures and an expected better health system (11). It is noted that some of these countries still witness community cases and hospital-acquired infections of Middle East Respiratory Syndrome coronavirus (MERS-CoV). This could present a significant challenge to dealing effectively with both coronaviruses, especially with the lack of standardized and approved point of care testing (12). Further studies are suggested to explain this unexpected result of higher fatality rate in high-testing Middle Eastern countries, looking at specific factors such as chronic diseases prevalence (cardiovascular or respiratory) (13), viral mutation, genetic variability, discrepancies in COVID-19 related death definition, and possible inappropriate tertiary care management (14).
In countries with moderate testing rates (close to the world average testing rates), there were lower
incidence, mortality and fatality rates; these figures were significantly higher in countries with low testing rates. These results could denote either true lower incidence (and subsequent mortality) versus the world average; the Region might have conditions that favour a lower incidence of the disease; climatic factors (currently hotter than European and North American countries); more conservative social behaviours; viral mutation; or ethnic/genetic variations. Another more probable explanation would be under-notification of cases due to under testing in these countries, particularly under-notification of COVID-19 related death. Improvement in testing and notification is required to better judge the epidemic situation in these countries.
LimitationsThe study took into account cases from the beginning of the pandemic until 21 April 2020; figures, case reporting, tests and many parameters may change with time. The study also relied on cumulative numbers of cases, death and testing rates, without taking time and the duration of the epidemics in specific countries into account. Thus, a change in testing rates could change the interpretation of epidemic curves (15). In addition, the study did not take into account the prevention measures applied by every country (16) and their effect on the epidemic curve. Se-curity issues prevented availability of all data; thus, the results could underestimate the true burden of COVID-19 in the Region.
ConclusionThe overall testing frequency was similar in the EMR compared to the rest of the world. This would be expected to lead to a similar cumulative incidence and case fatali-ty rate. However, the average incidence was 70% lower than the rest of the world, and mortality per million-pop-
Figure 1 Comparison between Eastern Mediterranean Region countries and the rest of the world according to testing frequency
1 200
1 000
800
600
400
200
044.67
252.8
1020
321
1.82 13.7 3.2 22.1 3.97 3.41 7.73 6.86
Low frequency testing
Cases/millon Death/millon Death/case
Moderate frequency testing High frequency testing World average

1009
Short research communication EMHJ – Vol. 26 No. 9 – 2020
ulation was lower (90%). Moreover, in GCC high-testing countries, a strikingly similar case-fatality rate to other countries in the world – and even higher than the world average – was indicated, although expected to be lower. Increasing the frequency of testing and improving noti-fication of cases and of death is a necessity in order to
better assess the situation in the EMR. In addition, taking into account country specificities would also offer great-er insight into the COVID-19 situation in the Region.
Funding: None.
Competing interests: None declared.
La COVID-19 dans la Région de la Méditerranée orientale : fréquence des tests, cas cumulés et analyse de la mortalitéRésuméContexte : La COVID-19 est maintenant bien documentée dans la Région de la Méditerranée orientale ; cependant, les taux d'incidence, de mortalité et de létalité diffèrent selon les pays. Objectifs : La présente étude avait pour objectif de décrire la pandémie de COVID-19 dans la Région de la Méditerranée orientale, en évaluant les taux d’incidence, de mortalité et de létalité dans différents pays, en comparaison avec la moyenne mondiale. Méthodes : Les données proviennent de la page de surveillance de Worldometer et des canaux de communication gouvernementaux. Elles ont été exportées et analysées au moyen du logiciel Statistical Package for Social Sciences (SPSS, version 23.0).Résultats : Dans la Région de la Méditerranée orientale, outre les cas notifiés et les décès, la fréquence des tests est hétérogène entre les pays. Très peu de données sont disponibles pour les pays connaissant une instabilité politique et des problèmes de sécurité (République arabe syrienne, Soudan et Yémen), en particulier pour la fréquence des tests. Globalement, malgré des taux de dépistage similaires, on a observé une incidence considérablement plus faible dans la Région de la Méditerranée orientale par rapport au reste du monde, en plus d’une mortalité plus faible par million d’habitants, en particulier dans les pays où les taux de dépistage sont faibles à modérés. Cependant, dans les pays où le dépistage est plus fréquent que la moyenne mondiale, on observe une incidence plus élevée, une mortalité plus faible, mais un taux de létalité plus élevé, de manière inattendue. Conclusion : La fréquence globale des tests était similaire dans la Région de la Méditerranée orientale par rapport au reste du monde, ce qui devrait entraîner une incidence cumulée et un taux de létalité similaires. Néanmoins, l’incidence moyenne était inférieure de 70 % à celle du reste du monde ainsi que la mortalité par million d’habitants (90 %). En outre, dans les pays du Conseil de Coopération du Golfe ayant une fréquence de tests élevée, un taux de létalité similaire à celui d’autres pays de la Région a été constaté ; toutefois, ce taux était supérieur à la moyenne mondiale, même s’il était inférieur aux prévisions. Des études plus approfondies sont nécessaires pour expliquer les différences des taux d'incidence, de mortalité et de létalité entre les pays ; il convient principalement d’étudier les raisons environnementales, génétiques et administratives.
كوفيد-19 يف إقليم رشق املتوسط: تواتر االختبار، واحلاالت الرتاكمية، وحتليل الوفياتباسكال سالمة
اخلالصةاخللفية: لقد جرى توثيق كوفيد-19 اآلن توثيقا جيدا يف إقليم رشق املتوسط؛ لكن معدالت احلدوث والوفيات و الوفيات بني
احلاالت ختتلف حسب البلد.والوفيات احلدوث معدالت وتقييم املتوسط، رشق إقليم يف "كوفيد-19" جائحة وصف إىل الدراسة هذه هدفت األهداف:
والوفيات بني احلاالت يف خمتلف البلدان، مقارنة باملتوسط العاملي.البالغات احلكومية. وجرى تصدير قنوات العامل )ورلد ميرتز( ومن مقياس مراقبة البيانات من صفحة جعت البحث: طرق
البيانات وحتليلها باستخدام برنامج احلزمة اإلحصائية للعلوم االجتامعية )SPSS ، اإلصدار 23.0(.النتائج: يف إقليم رشق املتوسط، يتباين تواتر االختبار بني البلدان، باإلضافة إىل احلاالت والوفيات املبلغ عنها. وال يتوفر سوى العربية واجلمهورية )كاليمن، األمنية واملشاكل السيايس االستقرار عدم من تعاين التي البلدان من البيانات من جدا القليل السورية، والسودان(، ال سيام فيام يتعلق بمعدل تواتر االختبار. وعموما، وبرغم تشابه معدالت االختبار، كان معدل احلدوث أقل يف إقليم رشق املتوسط مقارنة ببقية العامل بدرجة يعتد هبا، باإلضافة إىل انخفاض معدل الوفيات لكل مليون نسمة، ال سيام يف البلدان ذات معدالت االختبار املنخفضة إىل املتوسطة. ومع ذلك، يف البلدان التي لدهيا اختبارات أعىل من املتوسط العاملي، وجد
معدل وقوع أعىل، ومعدل وفيات أقل، وكان معدل الوفيات بني احلاالت أعىل عىل نحو غري متوقع.

1010
Short research communication EMHJ – Vol. 26 No. 9 – 2020
References1. Sohrabi C, Alsafi Z, O’Neill N, Khan M, Kerwan A, Al-Jabir A, et al. World Health Organization declares global emergency: A
review of the 2019 novel coronavirus (COVID-19). Int J Surg Lond Engl. 2020 Feb 26;76:71–6.
2. Worldometer. April 2020. (https://www.worldometers.info/coronavirus/).
3. Alsharif, NZ, Khanfar NM, Brennan LF, Chahine EB, Al-Ghananeem AM, Retallick J, et al. 2019. Cultural Sensitivity and Global Pharmacy Engagement in the Arab World. Am J Pharm Educ 2019;83(4):7228. doi: 10.5688/ajpe7228.
4. Guo Y, Huang YM, Huang J, Jin YZ, Jiang W, Liu PL, et al. COVID-19 pandemic: global epidemiological trends and China’s subsequent preparedness and responses. Zhonghua Liu Xing Bing Xue Za Zhi Zhonghua Liuxingbingxue Zazhi. 2020 May 10;41(5):642-647. doi: 10.3760/cma.j.cn112338-20200301-00222
5. Dil S, Dil N, Maken ZH. COVID-19 trends and forecast in the Eastern Mediterranean Region with a Particular Focus on Pakistan. Cureus. 2020;12(6):e8582. 2020 Jun 12. doi:10.7759/cureus.8582
6. Radwan GN. Epidemiology of SARS-CoV-2 in Egypt. East Mediterr Health J. 2020 Jul 1;26(7):768-73. https://doi.org/10.26719/emhj.20.084
7. Alser O, AlWaheidi S, Elessi K, Meghari H. COVID-19 in Gaza: a pandemic spreading in a place already under protracted lock-down. East Mediterr Health J. 2020 Jul 1;26(7):762-3. https://doi.org/10.26719/emhj.20.089
8. Gasmelseed YA, Mohamed Y, Adulhameed R, Ishag M, Elzubair AG. Controlling the spread of COVID-19 in Sudan with limited resources: a unique community-engaged approach. East Mediterr Health J. 2020;26(6). https://doi.org/10.26719/emhj.20.072
9. Jee Y. WHO International Health Regulations emergency committee for the COVID-19 outbreak. Epidemiol Health. 2020;42:e2020013. doi:10.4178/epih.e2020013
10. Salathé M, Althaus CL, Neher R, Stringhini S, Hodcroft E, Fellay J, et al. COVID-19 epidemic in Switzerland: on the importance of testing, contact tracing and isolation. Swiss Med Wkly. 2020 Mar 19;150:w20225. doi: 10.4414/smw.2020.20225
11. Briefs VI, Books VI. COVID-19: Developments in West Asia. (https://www.vifindia.org/article/2019/april/03/covid-19-develop-ments-in-west-asia?slide=$slideshow$).
12. Barry M, Al Amri M, Memish ZA. COVID-19 in the shadows of MERS-CoV in the Kingdom of Saudi Arabia. J Epidemiol Glob Health. 2020;10(1):1–3. doi:10.2991/jegh.k.200218.003
13. Alshaikh MK, Filippidis FT, Al-Omar HA, Rawaf S, Majeed A, Salmasi AM. The ticking time bomb in lifestyle-related diseases among women in the Gulf Cooperation Council countries; review of systematic reviews. BMC public health. 2017 Dec;17(1):536.
14. Ram P. Management of healthcare in the Gulf Cooperation Council (GCC) countries with special reference to Saudi Arabia. IJARBSS. 2014 Dec 1;4(12):24.
15. Omori R, Mizumoto K, Chowell G. Changes in testing rates could mask the novel coronavirus disease (COVID-19) growth rate [published online ahead of print, 2020 Apr 19]. Int J Infect Dis. 2020;S1201-9712(20)30236-8. doi:10.1016/j.ijid.2020.04.021
16. Güner R, Hasanoğlu I, Aktaş F. COVID-19: Prevention and control measures in community. Turk J Med Sci. 2020;50(SI-1):571–577. Published 2020 Apr 21. doi:10.3906/sag-2004-146
االستنتاج: كان معدل تواتر االختبار اإلجايل مماثال يف إقليم رشق املتوسط مقارنة ببقية العامل؛ ومن املتوقع أن يؤدي ذلك إىل حدوث معدالت تراكمية متامثلة للحدوث و الوفيات بني احلاالت . ومع ذلك، كان متوسط معدل احلدوث أقل بنسبة ٪70 من بقية العامل، وكان معدل الوفيات لكل مليون نسمة أقل )90٪(. وعالوة عىل ذلك، لوحظ يف البلدان التي لدهيا اختبارات عالية يف جملس التعاون اخلليجي، أن هناك معدال مماثال للوفيات بني احلاالت كام يف البلدان األخرى يف اإلقليم، ولكنه كان أعىل من املتوسط العاملي، مع أن املتوقع أن يكون أقل. ومن الرضوري إجراء مزيد من الدراسات لتفسري التباينات يف معدالت
احلدوث والوفيات و الوفيات بني احلاالت بني البلدان؛ وجيب بصفة رئيسية استقصاء األسباب البيئية والوراثية واإلدارية.

1011
Short research communication EMHJ – Vol. 26 No. 9 – 2020
Educational perspective for the identification of essential competencies required for approaching patients with COVID-19Mayssoon Dashash,1,2 Bashar Almasri, 2 Eman Takaleh,2 Alaa Abou Halawah2 and Amal Sahyouni2
1Damascus University, Damascus, Syrian Arab Republic. 2Syrian Virtual University, Damascus, Syrian Arab Republic. (Correspondence to: Mayssoon Dashash: [email protected], [email protected])
AbstractBackground: Health professionals are at the frontline of the COVID-19 pandemic and are directly exposed to infection hazards. Therefore, they should have the essential competencies for approaching patients. Aims: The study aimed to identify essential competencies required for approaching patients with COVID-19.Methods: All postgraduate health professionals at the Syrian Virtual University SVU (n=28) were invited to participate in the study during the Covid-19 lockdown in 2020, resulting in 20 postgraduates accepting. The Delphi technique was adopted for identifying competencies in medical education and a virtual meeting was undertaken through the University Management System in order to provide instruction and create a list of competencies. Competency domains were divided into ‘knowledge’, ‘skills’, and ‘attitudes’ and were classified into four categories: etiology, assessment and diagnosis, man-agement, and prognosis.Results: Fifty-two essential competencies were identified; 7 competencies on etiology, 7 related to assessment and diag-nosis, 34 related to management, and 4 related to prognosisConclusion: It is hoped that the identified competencies would help health professionals to deliver the best health care for COVI-19 patients, as well as help policy-makers to support comprehensive training programmes that can equip health professionals with the required competencies to fight the pandemic.Keywords: COVID-19, competencies, health professional, education, SyriaCitation: Dashash M; Bashar A; Takaleh E; Halawah AA; Sayouni A. Educational perspective for the identification of essential competencies required for approaching patients with COVID-19. East Mediterr Health J. 2020;26(9):1011-1017. https://doi.org/10.26719/emhj.20.111Received: 06/06/20; accepted: 22/07/20 Copyright © World Health Organization (WHO) 2020. Open Access. Some rights reserved. This work is available under the CC BY-NC-SA 3.0 IGO license (https://creativecommons.org/licenses/by-nc-sa/3.0/igo)
IntroductionOn December 12, 2019, health professionals started to in-vestigate patients who developed viral pneumonia, after visiting the Human Seafood Wholesale Market (1). On December 31, 2019, the report published by the Wuhan Municipal Health Commission about viral pneumonia indicated that 27 patients were infected (1). In the first week of January 2020, Chinese officials identified a novel type of coronavirus called SARS-COV-2, which was spread outside of China the following week. On March 2020, the WHO announced COVID-19 as a pandemic (1–3).
It is currently believed that the virus’s route of transmission is respiratory droplets (4). Infected patients may have symptoms such as fever (90%), fatigue and dry cough (80%), dyspnea (20%), sore throat, headache, or loss of smelling and taste (5). Disease manifestations range from asymptomatic cases to severe pneumonia accompanied by severe respiratory distress and septic shock, followed by multi-organ failure leading often to death (1). According to global statistics, 81% of patients have a mild infection that spontaneously recovers; 14% have a severe infection; and 5% are critical cases that need intensive care and mechanical ventilation (6,7).
Health professionals are directly responsible for facing infected patients and suspected persons. They are at the frontline of the COVID-19 pandemic and are
exposed to hazards that put them at risk of infection (8). As of 23 August 2020, there were 23 408 376 confirmed cases of COVID-19 globally and 809 098 deaths; 8499 recorded infections per day, and 15 941 566 recovered cases (9). Moreover, a recent publication (6 May 2020) by the International Council of Nurses (10) indicated that more than 90 000 health-care workers around the world were infected with COVID-19, of which 260 nurses had died, amounting to 2.195% of total confirmed COVID-19 cases (10). In addition, the World Health Organization (WHO) indicated that 194 member states are not providing comprehensive figures on health worker infections while dealing with the unprecedented crisis (11).
It is clear that health professionals should be appropriately prepared to ensure that all necessary preventive and protective measures are taken to minimize occupational safety and health risks. In addition, they should be properly trained to provide the best health care during assessment, triage, and treatment (11). Health professionals should also be successful role performers, since they must possess performance abilities that allow them to operate across a broad range of situations over an extended period of time (12).
Today, competency-based medical education has emerged as a priority issue that should be adopted to overcome the COVID-19 pandemic. The traditional approach that begins with the question “what do health

1012
Short research communication EMHJ – Vol. 26 No. 9 – 2020
professionals need to know about COVID-19?” should be modified to the question “what abilities are needed by health professionals to face COVID-19?” In this regard, an organized framework of competencies should be designed in which the observable abilities of health professionals, integrating multiple components such as knowledge, skills, values and attitudes, can be identified (13–15).
MethodsThis study was undertaken by a research team in the Medical Education Program (MEP), Syrian Virtual Uni-versity. The MEP is a distance-learning programme de-signed to enable health professionals to obtain a Master’s degree in medical education at the same time as practic-ing medicine, dentistry, pharmacy or nursing in Syrian health centres or hospitals, which are related to the Syr-ian Ministry of Health, Ministry of Higher Education, Ministry of Defense or Ministry of Interior. Ethical ap-proval was obtained from the Ethical Committee of the Syrian Virtual University, Damascus, Syrian Arab Repub-lic April 2020.
The Delphi Technique is considered one of the most useful techniques for identifying competencies in medical education (16,17). It has many advantages over other decision-making methods, since it facilitates ownership and increases acceptance of the generated consensus rather than possible bias developed by dominant individuals (17,18). Therefore, the technique was employed to develop consensus about essential competencies required for approaching COVID-19 patients.
All MEP students were invited to take part in this study (n=28). Twenty postgraduates who represent different faculties in the Syrian Arab Republic and different health specializations accepted to participate in this study. During the lockdown, participants were virtually instructed, using the Virtual University Management System to study all recently published protocols and guidelines on COVID-19 by recognized health bodies such as WHO, Centers for Disease Control and Prevention, the UK National Health Service, and Cochrane collaboration (19–22). Advice was also received concerning the methodology for writing competencies and vocabulary to be used to describe functions (18) in order to create the initial list of competencies related to essential knowledge, skills and attitudes required for approaching patients with COVID-19.
To develop a general plan of competencies, partici-pants were divided into three groups corresponding to knowledge, skills, and attitudes domains that can iden-tify competencies for appropriate and safe practice when dealing with COVID-19 (23). To unify the work and style, responses were gathered, reviewed, and modified for each domain by the team leader. Repeated and inappropriate competencies were also deleted or reformulated. A sec-ond virtual meeting was undertaken to discuss switch-ing any competency from its domain to another. It was
also agreed to cross-match these groups with the classi-fication of required competencies according to etiology, assessment and diagnosis, management, and prognosis of COVID-19. Each member in the meeting was asked to revise the list of competencies in each major group and under each classification separately.
The revised list was then sent to the participants to suggest any additional items or modification that should be considered and to rate each competency on a 4- point Likert scale: 0, 1, 2 and 3 corresponding to ‘not important’, ‘less important’, ‘important’, and ‘essential’, respectively (23,24).
In the third stage, the resulted list was sent again to all participants. Competencies suggested by at least 80% of participants were combined and merged. To obtain the weighted response for each competency, the number of responses in each level and the mean score for each competency (0.0–3.0) were calculated (18,23,24). All competencies required for COVID-19 were ranked and the relative importance for each competency was determined.
Results The response rate was 71.4% for invited participants (n=20). The findings indicated 52 essential competen-cies suggested by at least 80% of participants required for approaching COVID-19 patients. The competencies for each domain were organized under three major catego-ries including knowledge, skills and attitude, as outlined in Figure 1, which presents the ‘Ability’ with its purpose, process and commitment as previously documented (25). In addition, four subheadings including etiology, assess-ment and diagnosis, management, and prognosis were also outlined in Table 1.
The final identified competencies were as follows: 12 knowledge competencies, 20 skills competencies, and 20 competencies related to attitudes. According to competencies classification, 7 competencies were related to etiology, 7 competencies related to assessment and diagnosis, 34 competencies related to management, and 4 competencies related to prognosis.
DiscussionThere is an extensive global effort to provide effective treatment and research for a vaccine to combat COV-ID-19. For this purpose, numerous scientific papers are published daily (1); however, efforts targeting health professionals exposed daily to the hazards of COVID-19 infection are still limited. To rectify this, it is important that occupational health and safety become a priority and health professionals should be equipped with all es-sential competencies before duties on the front line of COVID-19 disease response.
This is where the role of medical education needs to be highlighted. It can ensure that all health professionals directly involved in prevention or treatment of COVID-19 pandemic, whether patient intake, screening, inspection,

1013
Short research communication EMHJ – Vol. 26 No. 9 – 2020
Table 1 Essential competencies required for approaching patients with COVID-19
Domain Competency
Knowledge 1. Recognize COVID-19 Epidemiology
Etiology
2. Differentiate between epidemic, outbreak and pandemic of COVID-19
3. Recognize the virus etiology, origin, incubation period and transmission models
4. Apply the principles of isolation, quarantine, contacts, and contacts tracing
Assessment & Diagnosis
5. Identify high- risk groups of COVID-19 patients
6. Recognize types of different diagnostic tests
7. Identify signs and symptoms of COVID-19
Management
8. Apply infection control and prevention strategies
9. Recognize health and safety of medical equipments
10. Discuss isolation and quarantine periods, isolation conditions
11. Apply therapeutic protocols and empirical drugs
12. List indications and contraindications of medications and procedures
Skills 13. Take accurate clinical history
Etiology 14. Assess the readiness of health facility
Assessment & Diagnosis
15. Perform appropriate medical examination
16. Draw blood samples, nasal swaps and bronchial lavage safely and correctly
17. Screen and triage at all points of access to the health system
18. Interpret results of laboratory tests and radiographic images correctly
19. Provide correct differential diagnosis in each medical case
Management
20. Apply health and safety procedures
21. Educate patients to the extent that they can understand
22. Calculate therapeutic doses accurately
23. Apply treatment in the correct way and time and make appropriate adjustments for each case
24. Use medical equipment and devices for managing patients with COVID-19
25. Appraise and assimilate scientific evidence
26. Provide accurate diagnosis of COVID-19
27. Decide the right time for initiating and finishing treatment
28. Appraise the scientific publications about COVID-19
Prognosis
29. Perform triage and control origin of infection
30. Manage clinical cases according to development and stage and complications
31. Start and terminate isolation precautions when necessary
32. Perform a plan to monitor health care staff who were in contact with definite cases of COVID-19
Attitude 33. Provide protection measurements for health care workers
Management
34. Demonstrate Professionalism to peers, staff, patients and patient’s families
35. Work with health care professional including other disciplines
36. Keep patient safe and protect him/her from harm
37. Demonstrate respect to patients' privacy and confidentiality
38. Maintain patients' dignity during providing health care
39. Show sympathy and compassion to patients
40. Explain all information regarding COVID-19 to community
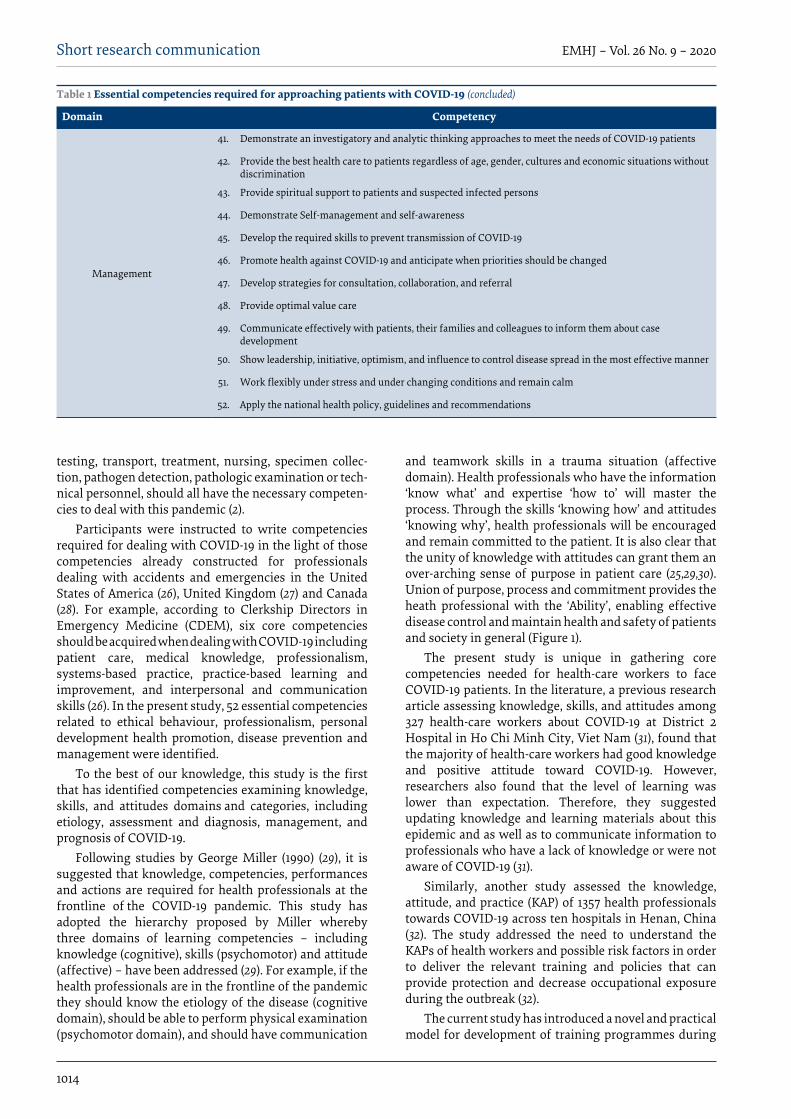
1014
Short research communication EMHJ – Vol. 26 No. 9 – 2020
testing, transport, treatment, nursing, specimen collec-tion, pathogen detection, pathologic examination or tech-nical personnel, should all have the necessary competen-cies to deal with this pandemic (2).
Participants were instructed to write competencies required for dealing with COVID-19 in the light of those competencies already constructed for professionals dealing with accidents and emergencies in the United States of America (26), United Kingdom (27) and Canada (28). For example, according to Clerkship Directors in Emergency Medicine (CDEM), six core competencies should be acquired when dealing with COVID-19 including patient care, medical knowledge, professionalism, systems-based practice, practice-based learning and improvement, and interpersonal and communication skills (26). In the present study, 52 essential competencies related to ethical behaviour, professionalism, personal development health promotion, disease prevention and management were identified.
To the best of our knowledge, this study is the first that has identified competencies examining knowledge, skills, and attitudes domains and categories, including etiology, assessment and diagnosis, management, and prognosis of COVID-19.
Following studies by George Miller (1990) (29), it is suggested that knowledge, competencies, performances and actions are required for health professionals at the frontline of the COVID-19 pandemic. This study has adopted the hierarchy proposed by Miller whereby three domains of learning competencies – including knowledge (cognitive), skills (psychomotor) and attitude (affective) – have been addressed (29). For example, if the health professionals are in the frontline of the pandemic they should know the etiology of the disease (cognitive domain), should be able to perform physical examination (psychomotor domain), and should have communication
and teamwork skills in a trauma situation (affective domain). Health professionals who have the information ‘know what’ and expertise ‘how to’ will master the process. Through the skills ‘knowing how’ and attitudes ‘knowing why’, health professionals will be encouraged and remain committed to the patient. It is also clear that the unity of knowledge with attitudes can grant them an over-arching sense of purpose in patient care (25,29,30). Union of purpose, process and commitment provides the heath professional with the ‘Ability’, enabling effective disease control and maintain health and safety of patients and society in general (Figure 1).
The present study is unique in gathering core competencies needed for health-care workers to face COVID-19 patients. In the literature, a previous research article assessing knowledge, skills, and attitudes among 327 health-care workers about COVID-19 at District 2 Hospital in Ho Chi Minh City, Viet Nam (31), found that the majority of health-care workers had good knowledge and positive attitude toward COVID-19. However, researchers also found that the level of learning was lower than expectation. Therefore, they suggested updating knowledge and learning materials about this epidemic and as well as to communicate information to professionals who have a lack of knowledge or were not aware of COVID-19 (31).
Similarly, another study assessed the knowledge, attitude, and practice (KAP) of 1357 health professionals towards COVID-19 across ten hospitals in Henan, China (32). The study addressed the need to understand the KAPs of health workers and possible risk factors in order to deliver the relevant training and policies that can provide protection and decrease occupational exposure during the outbreak (32).
The current study has introduced a novel and practical model for development of training programmes during
Domain Competency
Management
41. Demonstrate an investigatory and analytic thinking approaches to meet the needs of COVID-19 patients
42. Provide the best health care to patients regardless of age, gender, cultures and economic situations without discrimination
43. Provide spiritual support to patients and suspected infected persons
44. Demonstrate Self-management and self-awareness
45. Develop the required skills to prevent transmission of COVID-19
46. Promote health against COVID-19 and anticipate when priorities should be changed
47. Develop strategies for consultation, collaboration, and referral
48. Provide optimal value care
49. Communicate effectively with patients, their families and colleagues to inform them about case development
50. Show leadership, initiative, optimism, and influence to control disease spread in the most effective manner
51. Work flexibly under stress and under changing conditions and remain calm
52. Apply the national health policy, guidelines and recommendations
Table 1 Essential competencies required for approaching patients with COVID-19 (concluded)

1015
Short research communication EMHJ – Vol. 26 No. 9 – 2020
the pandemic. In addition, the consensus of participants upon all points through the Delphi technique increases the reliability and confidence of results, drawing from previous studies used the Delphi method to develop curriculum for undergraduate medical education. For example, Almoallim (2011) (18) determined competencies in undergraduate internal medicine curriculum in Saudi Arabia using the Delphi technique, identifying competencies based on a group (20 clinicians) utilizing textbooks (18). Similarly, Shah et al. (2019) (33) developed
a national competency-based diabetes curriculum in undergraduate medical education.
LimitationsSample size (n=20) was a limiting factor and an increase in the number of participants would be of critical im-portance to support our findings. Comprehensive un-derstanding about COVID-19 is still not possible. Spe-cific agreed treatments for COVID-19 patients are not yet fully available. Thus, there remains a concern that these competencies identified might require continuous revi-sion in light of the ongoing understanding of the etiol-ogy, assessment and treatment to address the COVID-19 pandemic. Therefore, the present findings should be con-sidered as a baseline for future work that aims to clearly identify competencies that can influence the process of curriculum reform in the Region adopted by schools, and the methods of assessment that can measure the knowl-edge, skills and attitude of health professionals.
It is hoped that the identified competencies would direct policy-makers to support and organize ad hoc comprehensive training programmes that can equip health professionals with the required knowledge, attitudes and skills competencies to enable them to effectively deal with the pandemic.
ConclusionFuture training development for health care profession-als dealing with COVID-19 patients should consider uti-lizing the designed list of competencies highlighted in this study to assess and improve competencies.
Funding: None.
Competing interests: None declared.
Figure 1 Three components (knowledge, skills and attitudes) that enable competency in health professionals (purpose, process and commitment) when approaching patients with COVID-19
13
Perspective pédagogique concernant l'identification des compétences essentielles requises pour aborder les patients atteints de COVID-19RésuméContexte : Les professionnels de santé sont en première ligne dans la lutte contre la pandémie de COVID-19 et sont directement exposés aux risques d'infection. Ils doivent donc posséder les compétences essentielles pour aborder les patients. Objectifs : La présente étude visait à identifier les compétences essentielles requises pour aborder les patients atteints de COVID-19.Méthodes : Tous les professionnels de santé postuniversitaires de la Syrian Virtual University (Université virtuelle syrienne) (n = 28) ont été invités à participer à l’étude lors du confinement pour la COVID-19 en 2020, ; 20 diplômés ont accepté l’invitation. La méthode Delphi a été adoptée pour identifier les compétences en matière d’éducation médicale et une réunion virtuelle a été organisée par le biais du système de gestion universitaire afin de fournir une instruction et de créer une liste de compétences. Les domaines de compétence ont été divisés en « connaissances », « compétences » et « attitudes » et ont été classés en quatre catégories : étiologie, évaluation et diagnostic, prise en charge et pronostic.Résultats : Cinquante-deux compétences essentielles ont été identifiées : sept compétences sur l'étiologie, sept sur l'évaluation et le diagnostic, 34 sur la prise en charge et quatre sur le pronostic.Conclusion : Nous espérons que les compétences identifiées aideront les professionnels de santé à fournir les meilleurs soins de santé aux patients atteints de COVID-19, ainsi que les responsables de l’élaboration des politiques à soutenir des programmes de formation complets susceptibles de doter les professionnels de santé des compétences nécessaires pour lutter contre la pandémie.

1016
Short research communication EMHJ – Vol. 26 No. 9 – 2020
References1. Kamps BS, Hoffman C. COVID Reference, Steinhäuser Verlag, 3-2020 third edition. (https://amedeo.com/CovidReference03.pdf).
2. Zhu N, Zhang D, Wang W, Li X, Yang B, Song J, et al. A novel coronavirus from patients with pneumonia in China, 2019. N Engl J Medicine 2020;382:727-733. doi:10.1056/nejmoa2001017
3. World health Organization. Virtual press conference on COVID-19. Geneva: World Health Organization; 2020 (https://www.who.int/docs/default-source/coronaviruse/transcripts/who-audio-emergencies-coronavirus-press-conference-full-and-final-11mar2020.pdf?sfvrsn=cb432bb3_2, accessed 10 March 10,2020).
4. World health Organization. Modes of transmission of virus causing COVID-19: implications for IPC precaution recommenda-tions. Geneva: World Health Organization; 2020 (https://www.who.int/news room/commentaries/detail/modes-of-transmis-sion-of-virus-causing-covid-19-implications-for-ipc-precaution-recommendations).
5. Chen N, Zhou M, Dong, X, Qu J, Gong F, Qiu YHY, et al. Epidemiological and clinical characteristics of 99 cases of 2019 novel coronavirus pneumonia in Wuhan, China: A descriptive study. Lancet 2020;395:507-513. doi:10.1016/s0140-6736(20)30211-7
6. Wu Z, McGoogan JM. Characteristics of and important lessons from the coronavirus disease 2019 (COVID-19) outbreak in China. JAMA 2020;323:1239-1242. doi:10.1001/jama.2020.2648
7. Jamil S, Mark N, Carlos G. Diagnosis and management of COVID-19 disease. Am J Respir Crit Care Med. 2020;201:P19–P20 doi:10.1164/rccm.2020c1
8. World health Organization. Coronavirus disease (COVID-19) outbreak: rights, roles and responsibilities of health workers, in-cluding key considerations for occupational safety and health: Interim guidance. Geneva: World Health Organization; 19 March 2020.
9. Corona virus Worldometer (https://www.worldometers.info/coronavirus/, accessed 23 August, 2020).
10. Mantovani C. Over 90,000 health workers infected with COVID-19 worldwide: nurses group. Reuters, 6 May 2020 (https://www.reuters.com/article/us-health-coronavirus-nurses/over-90000-health-workers-infected-with-covid-19-worldwide-nurses-group-idUSKBN22I1XH, accessed 15 May 2020).
11. World Health Organization. Coronavirus disease 2019 (COVID-19): situation report, 121. Geneva: World Health Organi-zation; 2020 (https://www.who.int/docs/default-source/coronaviruse/situation-reports/20200520-covid-19-sitrep-121.pdf?sfvrsn=c4be2ec6_2, accessed 15 May 2020).
12. Harden RM, Crosby JR, Davis MH. AMEE Guide No. 14: Outcome-based education: Part 1-An introduction to outcome-based education. Med Teach. 1999;21:1.
13. Hand JS. Identification of competencies for effective dental faculty. J Dent Educ;70:937-946.
14. Tonni I, Oliver R. A Delphi approach to define learning outcomes and assessment, Eur J Dent Educ. 2012:1-8.
منظور تعليمي لتحديد الكفاءات االساسية للتعامل مع مرىض كوفيد-19 ميسون دشاش، بشار املرصي، آالء أبو حالوة، إيامن تقالة، أمل صهيوين
اخلالصةاخللفية: يواجه املهنيون الصحيون يف اخلطوط األوىل ملجاهبة جائحة كوفيد-19 خماطر العدوى مبارشة. ومن ثم جيب أن يكون
لدهيم الكفاءات األساسية للتعامل مع املرىض.األهداف: هدفت هذه الدراسة إىل حتديد الكفاءات األساسية املطلوبة للتعامل مع مرىض كوفيد-19
طرق البحث: دعي مجيع املهنيني الصحيني بعد خترجهم يف اجلامعة االفرتاضية السورية )عددهم = 28( للمشاركة يف الدراسة خالل فرتة اإلغالق يف عام 2020 بسبب كوفيد-19، وكانت النتيجة قبول 20 طالبا من طالب الدراسات العليا املشاركة. وقد اعتمدت تقنية »دلفي« لتحديد الكفاءات يف التعليم الطبي. وعقد اجتامع افرتايض من خالل نظام إدارة اجلامعة للتوجيه مت جماالت الكفاءة إىل " املعلومات" و"املهارات" و"املواقف" وصنفت إىل أربع فئات: املسببات، وإعداد قائمة بالكفاءات. وقس
والتقييم والتشخيص، واإلنذار لتصبح: والعالج واإلنذار.النتائج: حددت 52 كفاءة أساسية؛ 7 كفاءات تتعلق باملسببات، وسبعة تتعلق بالتقييم والتشخيص، و34 تتعلق بالعالج ، و4
تتعلق باإلنذار.االستنتاج: من املأمول أن تساعد الكفاءات التي حددت املهنيني الصحيني عىل تقديم أفضل رعاية صحية ملرىض كوفيد-19، املطلوبة بالكفاءات الصحيني املهنيني تزود التي الشاملة التدريب برامج دعم عىل السياسات واضعي مساعدة عن فضال
ملكافحة اجلائحة.

1017
Short research communication EMHJ – Vol. 26 No. 9 – 2020
15. Jason R. Frank, Linda S. Competency-based medical education: theory to practice, Med Teach. 2010;32:638-645, doi:10.3109/0142159X.2010.501190
16. De Villiers MR, de Villiers PJ, Kent AP. The Delphi technique in health sciences education research. Med Teach. 2005;27:639–643.
17. Dunn WR, Hamilton DD, Harden RM. Techniques of identifying competencies needed of doctors. Med Teach. 1985;7:15–25.
18. Almoallim H. Determining and prioritizing competencies in the undergraduate internal medicine curriculum in Saudi Arabia. East Mediterr Health J. 2011;17:656-662. https://doi.org/10.26719/2011.17.8.656
19. World Health Organization. Coronavirus disease (COVID-19) pandemic. Geneva: World Health Organization; 2020 (https://www.who.int/emergencies/diseases/novel-coronavirus-2019, accessed 15 May 2020).
20. NHS England and NHS Improvement Coronavirus, Specialty guides for patient management secondary care (https://www.england.nhs.uk/coronavirus/secondary-care/other-resources/specialty-guides/, accessed 15 May 2020).
21. Centers for Disease Control and Prevention (CDC). Information for healthcare professionals about coronavirus (COVID-19). Atlanta: CDC; 2020 (https://www.cdc.gov/coronavirus/2019-nCoV/hcp/index.html, accessed 15 May 2020).
22. Cochrane. Coronavirus (COVID-19) - Cochrane resources and news (https://www.cochrane.org/coronavirus-covid-19-cochrane-resources-and-news#healthcareworkers, accessed 15 May 2020).
23. Dashash M. Identifying and assessing competencies for an entry level graduate in the faculty of dentistry, Damascus university: Approaches, lessons learned and evidence provided. IJCMPR;2:708-711.
24. Dunn WR, Hamilton DD, Harden RM. Techniques of identifying competencies needed of doctors. Med Teach. 1985;7:15-25, doi: 10.3109/01421598509036787
25. Combining skills, attitude and knowledge into ability. (https://www.shutterstock.com/image-illustration/combining-skills-attitude-knowledge-into-ability-1258390324, accessed 15 May 2020.
26. Clerkship Directors in Emergency Medicine (CDEM). Introduction to the core competencies (https://www.saem.org/cdem/edu-cation/online-education/m3-curriculum/communication/introduction-to-the-core-competencies , accessed 12 July 2020).
27. The Royal College of Emergency Medicine (RCEM). Curriculum and assessment systems For training in emergency medicine, The Royal College of Emergency Medicine. London: RCEM; 2015 (https://www.gmc-uk.org//media/documents/RCEM_curricu-lum_05_03_15_for_August_2015__FINAL___AMENDED_05_06_15_.pdf_61270597.pdf, accessed 12 July 2020.
28. Penciner R, Woods RA, McEwen J, Lee R, Langhan T, Bandiera G, et al. Core competencies for emergency medicine clerkships: results of a Canadian consensus initiative. CJEM 2013;15:24-33.
29. Miller GE. The assessment of clinical skills/competence/performance. Acad Med. 1990;65 (9Suppl):S63-S67. doi:10.1097/00001888-199009000-00045
30. Bajammal S, Zaini R, Abuznadah W, Al-Rukban M, Aly SM, Bokeret A, et al. The need for national medical licensing examina-tion in Saudi Arabia. BMC Med Educ. 2008;8:53. https://doi.org/10.1186/1472-6920-8-53.
31. Huynh G, Nguyen TN, Tran VK, Vo KN, Vo VT, Pham LA. Knowledge and attitude toward COVID-19 among healthcare workers at District 2 Hospital, Ho Chi Minh City. Asian Pac J Trop Med. 2020;13:260-5.
32. Zhang M, Zhou M, Tang F, Wang Y, Nie H, Zhang L, et al. Knowledge, attitude, and practice regarding COVID-19 among health-care workers in Henan, China. J Hosp Infect. 2020;105:183–187. https://doi.org/10.1016/j.jhin.2020.04.012
33. Shah S, McCann M, Yu C. Developing a national competency-based diabetes curriculum in undergraduate medical education: A Delphi study. Can J Diabetes. 2020;44:30-36.e2. doi:10.1016/j.jcjd.2019.04.019

1018
Short research communication EMHJ – Vol. 26 No. 9 – 2020
Engagement of medical specialty trainees in research: experience at a Lebanese medical schoolFouad Fayad,1 Ouidade Aitisha Tabesh,1 Tamara Lotfi,2 Fadi Haddad3 and Elie Nemr4
1Department of Rheumatology, Hotel Dieu de France Hospital and Saint Joseph University of Beirut, Beirut, Lebanon. 2Department of Internal Medicine, Faculty of Medicine, American University of Beirut, Beirut, Lebanon; The Global Evidence Synthesis Initiative (GESI) Secretariat, American University of Beirut. 3Department of Internal Medicine, Hotel Dieu de France Hospital and Saint Joseph University of Beirut, Beirut, Lebanon. 4Depart-ment of Urology, Hotel Dieu de France Hospital and Saint Joseph University of Beirut, Beirut, Lebanon. (Correspondence to: Fouad Fayad: [email protected]).
AbstractBackground: Many challenges exist to engaging medical students and postgraduate trainees in research in low and middle-income countries.Aims: This study aimed to assess the motivation of and opportunities for postgraduate medical specialty trainees to en-gage in medical research, and the perceived obstacles to undertaking research in Lebanon. Methods: A questionnaire-based survey of all postgraduate clinical trainees was conducted at Saint Joseph University of Beirut medical school, Lebanon. Logistic regression analysis was used to determine factors associated with engaging in research. Odds ratios (OR) and 95% confidence intervals (CI) are presented.Results: Of 290 trainees, 252 (87%) completed the questionnaire; 40.1% were specializing in medicine, 25.8% in surgery and 34.1% in other fields. A total of 122 trainees had participated in research projects: 85.2% in data collection, 83.6% in writing of abstracts, 69.7% in writing papers for publication, 58.2% in project design and 57.4% in data analysis. Most trainees had produced considerable research output (82.0%), with an average of 2.5 publications. Enhancing their curriculum vitae (OR = 1.90, 95% CI 0.84–4.30) and enjoying research (OR = 2.05, 95% CI 0.94–4.44) were not motivational factors for en-gaging in research. Trainees were frustrated by the limited research opportunities, citing lack of time as a main factor.Conclusion: There is a need for additional formal and informal support programmes to encourage postgraduate trainees to engage more in research.Keywords: biomedical research, medical schools, publications, postgraduate training, LebanonCitation: Fayad F; Aitisha Tabesh O; Lotfi T; Haddad F; Nemr E. Engagement of medical specialty trainees in research: experience at a Lebanese medical school. East Mediterr Health J. 2020;26(9):1018-1024. https://doi.org/10.26719/emhj.20.038Received: 29/05/18; accepted: 08/04/19Copyright © World Health Organization (WHO) 2020. Open Access. Some rights reserved. This work is available under the CC BY-NC-SA 3.0 IGO license https://creativecommons.org/licenses/by-nc-sa/3.0/igo
IntroductionAn active clinical research culture has clear benefits to health care delivery (1,2). Patients benefit from the development of new therapies and the practice of ev-idence-based medicine, departments benefit from en-hancement of their academic profile and clinicians ben-efit from career advancement. Involvement of clinicians in medical research as early as possible in their careers, even as medical students, is likely to maximize these benefits (3). Although many countries include research training as a formal part of medical training, this is not universal and there are many challenges to engaging medical student in research (4). Similar arguments apply to postgraduate trainees, who benefit from and contrib-ute to research activity also.
Many barriers to undertaking medical research in developing countries exist, such as lack of funds and facilities, and inadequate training. In addition, little is known about the research needs of trainees in these countries during their specialization, as the opportunities for engaging in research have been less well studied. The
aim of this study, therefore, was to assess the motivation of and opportunities for postgraduate specialty trainees to engage in medical research, the perceived obstacles to undertaking research, and the outcomes of their participation in medical research in Lebanon.
MethodsParticipants and settingSaint Joseph University of Beirut is one of the largest Leb-anese medical schools, with postgraduate training that spans 4 to 6 years. This training consists of four semes-ters of general training followed by four to six semesters of medical specialization, and two semesters of general training followed by eight semesters of specialty train-ing for surgical specialties. For paediatrics, anaesthetics, histopathology, radiology and other specialties, trainees start specializing immediately in their chosen field. All 290 postgraduate trainees from all specialties at Saint Jo-seph University of Beirut were invited to participate in the study during September and October 2015.

1019
Short research communication EMHJ – Vol. 26 No. 9 – 2020
QuestionnaireA modified version of a previously developed question-naire (4) was used (Appendix 1). The questionnaire was in English and consisted of multiple-choice questions with free text comments where applicable. Two questions ad-dressed barriers to involvement in research with answers on a 5-point Likert scale. The questionnaire was validated by distribution to 25 trainees at Saint Joseph University of Beirut and modified according to their responses.
Statistical analysisSPSS, version 22.0 was used for data analysis. To evalu-ate the relationship between the outcome of interest (in-volvement in research) and categorical covariates (year and type of specialization, type of hospital, reasons for engaging in research and usefulness of research), we used the chi-squared or Fisher exact tests as appropri-ate. We used logistic regression analysis to determine the association between the covariates and the outcome. Variables with P-value < 0.2 in the bivariate analysis were included in the logistic regression analysis. Odds ratios (OR) and 95% confidence intervals (CI) are presented. A Poisson regression approach was used to assess the re-lationship between number of publications and the fol-lowing variables: year of specialization, type of specialty and place of work (central teaching hospital, peripheral hospital, or other institutions). An alpha level of 0.05 was considered statistically significant. Free text responses were analysed by the first author. Responses on a Likert scale are reported as: 1–2 = disagree with the statement; 3 = neither agree nor disagree; 4–5 = agree with the state-ment. Complete-case analysis was performed when deal-ing with missing data .
Ethical considerationsThe research ethics committee of Saint Joseph University of Beirut approved the study. Participation was optional, and consent was assumed by completion of the question-naire. Data were anonymized after collection to ensure confidentiality.
ResultsThe response rate was 87% (252/290). Most of the post-graduate participants (101, 40.1%) were trainees in medi-cal specialties, 65 (25.8%) were surgical trainees, the rest (86, 34.1%) were trainees in nine other specialties (Table 1). All postgraduate years were represented (Table 1). Al-though 250 (99.2%) of the postgraduate trainees had been involved in research before their graduation in medicine, only 122 (48.4%) were engaged in research during their specialization. The rates of research engagement varied among specialties, with trainees in family medicine hav-ing the lowest rate (2/15, 13%); the differences, however, did not reach statistical significance (P = 0.054) (Table 1).
Year of specialization was significantly correlated with being involved in research (P < 0.001) and the number of publications (P < 0.001) (Table 1), with trainees
in higher postgraduate years having more research experience and publications.
MotivationMost trainees stated that research experience was useful (281, 86.5%) or that it depends (26, 10.3%), though this was not associated with engagement in research (P = 0.937). Some trainees (189) chose only one option as reasons for engaging in research: 140 (55.6%) said that they would un-dertake research solely to improve their curriculum vitae (CV), 35 (13.9%) solely because they would enjoy it, and 14 (5.6%) solely because it is mandatory.
Univariate analysis showed that enjoying research (n = 73, P = 0.190) and perceiving research as mandatory to obtain the diploma (n = 42, P = 0.523) were not associated with engagement in research or not (P = 0.523); building a better curriculum vitae, however, was (n = 190, P = 0.028). Three variables were used in the multivariable logistic regression analysis (year of specialisation, improving the CV, enjoying research), which showed that building a better curriculum vitae (n = 190; OR = 1.90, 95% CI: 0.84–4.30; P = 0.123) and enjoying research (n = 73; OR = 2.05, 95% CI 0.94–4.44; P = 0.070) were not motivational factors for engaging in research.
Table 1 Specialties and academic year the trainees, according to engagement in medical research
Variable Engaged in postgraduate
research (n = 252)
Publications per traineeb
(n = 252)
Yes No Median (min–max)
Specialty
Medicinea 43 58 0 (0–25)
Surgerya 37 28 0 (0–13)
Anaesthesiaa 8 11 0 (0–0)
Radiologya 8 9 0 (0–7)
Family medicinea 2 13 0 (0–0)
Paediatricsa 8 6 0 (0–1)
Obstetrics/gynaecology 8 2 1 (0–2)
Psychiatry 5 1 1 (0–1)
Radiotherapy 1 1 0 (0–0)
Histopathology 1 1 0.5 (0–1)
Paediatric surgery 1 0 0
Year of training
1st 5 48 0 (0–0)
2nd 17 36 0 (0–3)
3rd 24 26 0 (0–2)
4th 32 18 0 (0–8)
5th 39 2 1 (0–16)
6th 5 0 13 (1–25)There was no correlation between specialty and engagement in research (P = 0.054). Year of specialization was significantly correlated with engagement in research (P < 0.001) and number of publications (P < 0.001). aChi-squared test; Fisher exact test for other comparisons. bExcludes presentations, abstracts and thesis.

1020
Short research communication EMHJ – Vol. 26 No. 9 – 2020
Year of specialisation was still significantly correlated with engagement in research (n = 47; OR = 2.80, 95% CI: 1.26–3.63). Most respondents did not think that lack of personal motivation was an important obstacle to being involved in research: 129 (51.2%) of the trainees disagreed that it was an obstacle and 69 (27.4%) neither agreed nor disagreed. Many trainees (164, 65.1%) had approached a potential supervisor for research opportunities.
OpportunitiesMost trainees had research experience (undergrad-uate or postgraduate) in central teaching hospi-tals (216/252, 85.7%); only a very few had research ex-perience in peripheral hospitals (12/252, 4.8%) or in other institutions (24/252, 9.5%). Postgraduate-only research had similar distribution (central teaching hos-pital: 101/122, 82.8%; peripheral hospital: 5/122, 4.1%; oth-er: 16/122, 13.1%). Reviewing patient notes and collecting data, and writing abstracts were the most usual forms of participation in research (83.6% and 83.6% of trainees, re-spectively; Table 2).
Out of the 122 trainees who had participated in post-graduate research, 100 (82.0%) generated output: publications (64, 52.4%), oral presentations (41, 33.6%), poster presentations (34, 27.9%), thesis (27, 22.1%) or abstracts (24, 19.7%). Trainees had published on average 2.5 papers (range: 1–25); 45 trainees had only one publication each and three trainees had more than 10 publications each. Only 27 (44.3%) trainees has published as the first author and 34 (55.7%) as co-authors (data missing for three participants). No significant difference was found in the number of publications generated by trainees working in different specialties or places of work.
Perceived obstacles to engaging in researchTrainees felt frustrated by the lack of opportunities to en-gage with research: 136 (54.0%) agreed that they felt frus-trated while 80 (31.7%) neither agreed nor disagreed. Lack of research within their respective departments was an-other main concern, with 119 (47.2%) respondents agree-ing that there was a lack of research in their department.
Many trainees (110, 43.7%) felt there was a lack of competent advisers, although 80 (31.7%) thought there were competent advisers available. About half of the trainees (127, 50.4%) thought that supervisors were not interested in involving trainees in research. Lack of time for research was the commonest obstacle reported by the trainees (176, 69.8%).
Suggestions on how to increase engagement in research included more time for research (35.1%), more funding (26.0%), implementation of a mandatory research course (23.4%), more competent and motivated advisers (18.2%) and creation of a research department (14.3%) (Table 3).
DiscussionInstitutions and individuals benefit greatly when clinical staff, including medical students, are involved in active research (3,5,6). We examined perceptions of postgrad-uate trainees about research opportunities in a medical school in Lebanon. Although trainees were motivated to participate in research, fewer than half had the opportu-nity to do so because of lack of opportunities, time and support.
A study in Pakistani medical universities found comparable results to ours regarding the value of research and being actively involved in research; only 41.5% of junior faculty in Pakistan were currently involved in research (7) compared with 48.4% of our trainees. A report from Saudi Arabia found more respondents recognized the value of research (97.9%) than our trainees (86.5%) but only 30.4% were involved in any research activity (8). The Saudi study reported the same barriers as our study (8).
Engagement in research as an undergraduate was associated with greater engagement with academia after graduation (9–11). Medical students in Lebanon have to complete a thesis to graduate, as in other countries such as Peru, Germany and some universities in the United States of America (9), and our trainees had positive attitude towards the value of research. However, this attitude did not translate into high levels of involvement in research in our study. Evidence on the relationship
Table 2 Participating roles in postgraduate medical research project
Research role No. (%) (n = 122)
Reviewing patient notes and collecting data 104 (85.2)
Writing abstracts 102 (83.6)
Analysing data 70 (57.4)
Writing papers for publication 85 (69.7)
Designing research project protocol 71 (58.2)
Handing out questionnaires 52 (42.6)
Conceiving research project idea 56 (45.9)
Undertaking laboratory work 19 (15.6)
Table 3 Trainees’ suggestions on how to increase postgraduate involvement in medical research
Suggestion No.a (%)More time dedicated to research 27 (35.1)
Providing funds for research 20 (26.0)
Implementing a (mandatory) course for research in medical school
18 (23.4)
More competent and motivated advisers 14 (18.2)
Creating a research department 11 (14.3)
Enhancing the value of research 3 (3.9)
Having statisticians available 2 (2.6)
Creating computerized database in each department 1 (1.3)a77 trainees responded to this free text question. Some respondents gave more than one suggestion.

1021
Short research communication EMHJ – Vol. 26 No. 9 – 2020
between mandatory thesis submission for graduation and future participation in research is lacking and it would be useful to evaluate this relationship further.
The most frequently cited barrier to research in our study was lack of time, which is similar to other studies (4,12–14). Lack of funds and facilities, inadequate training and a lack of recognition of the value of academic activity are also commonly reported barriers to engagement in research in developing countries (12,15). The complex process of securing funding is not limited to developing countries (16) as it is also reported as a major obstacle in developed countries (17). Informal support programmes, such as journal clubs and research interest groups, benefit undergraduates (18) and could be useful in postgraduate training.
Trainees did not think that their own lack of motivation was a barrier to engaging in research, but
thought that a lack of interest of potential supervisors was a particular problem. However, only 65.1% had approached a potential supervisor to get involved in research and 55.6% said they would undertake research just to improve their curriculum vitae. These attitudes risk demotivating potential supervisors in investing their time and support for such trainees.
Maintaining an active environment conducive to research is important. This environment is possibly lacking in Lebanon as suggested by the trainees’ concerns about lack of competent advisors and research carried out in their department. It appears that there is a need for additional formal and informal support programmes to encourage postgraduate trainees to engage more in research.
Funding: None.
Competing interests: None declared.
Participation des étudiants des spécialités médicales à la recherche : expérience dans une école de médecine au LibanRésuméContexte : Il existe de nombreux défis à relever pour inciter les étudiants en médecine et les étudiants de cycle supérieur à participer à la recherche dans les pays à revenu faible et intermédiaireObjectifs : La présente étude avait pour objectif d’évaluer la motivation et les opportunités des étudiants de cycle supérieur dans les spécialités médicales pour s’engager dans la recherche médicale, ainsi que les obstacles perçus dans l’accès à la recherche au Liban. Méthodes : Une enquête basée sur un questionnaire et incluant tous les étudiants de cycle supérieur en médecine clinique a été menée à l’école de médecine de l’Université Saint-Joseph de Beyrouth (Liban). L’analyse de régression logistique a été utilisée pour déterminer les facteurs associés à un engagement dans la recherche. Les odds ratios (OR) et les intervalles de confiance (IC) à 95 % sont présentés ci-dessous.Résultats : Sur un total de 292 étudiants, 252 (87 %) ont rempli le questionnaire. Parmi eux, 40,1 % étaient des étudiants en médecine, 25,8 % en chirurgie et 34,1 % dans d’autres disciplines. Au total, 122 étudiants avaient participé à des projets de recherche : 85,2 % avaient contribué à la collecte de données, 83,6 % à la rédaction de résumés, 69,7 % à la rédaction d’articles de recherche destinés à la publication, 58,2 % à la conception de projet et 57,4 % à l’analyse de données. La majorité des étudiants (82 %) avaient produit un travail de recherche considérable, avec en moyenne 2,5 publications. L’implication dans la recherche de ces étudiants n’était motivée ni par l’amélioration de leur curriculum vitae (OR = 1,90 ; IC à 95 % : 0,84–4,30), ni par un goût pour la recherche (OR = 2,05; IC à 95 % : 0,94–4,44). Les étudiants étaient frustrés par la limitation des opportunités de recherche, principalement due, selon eux, à un manque de temps.Conclusion : Il est nécessaire de mettre en place des programmes de soutien supplémentaires, formels et informels, pour encourager les étudiants de cycle supérieur à s’engager davantage dans la recherche.
إرشاك املتدربني يف التخصصات الطبية يف إجراء البحوث: جتربة يف إحدى كليات الطب يف لبنانفؤاد فياض وداد ايتصحا طبش، متارا لطفي، فادي حداد، إييل نمر
اخلالصةاخللفية: يواجه املتدربون من طالب كليات الطب واألطباء املسجلني يف الدراسات العليا عدة حتديات بشأن إرشاكهم يف إجراء البحوث يف البلدان
النامية.يف إرشاكهم أجل من الطبية التخصصات يف العليا الدراسات ملتدريب املتاحة والفرص التحفيز سبل تقييم إىل الدراسة هذه هدفت األهداف:
البحوث الطبية، وحتديد العقبات التي حتول دون إجراء البحوث يف لبنان.
يس يوسف طرق البحث: أجري مسح قائم عىل استبيان وشمل مجيع املتدربني من األطباء الرسيريني يف الدراسات العليا يف كلية الطب بجامعة القد

1022
Short research communication EMHJ – Vol. 26 No. 9 – 2020
References1. The role of the clinical academic. London: British Medical Association; 2014.
2. NHS England research plan. London: NHS England; 2017 (https://www.england.nhs.uk/wp-content/uploads/2017/04/nhse-re-search-plan.pdf, accessed 24 May 2019).
3. Gonzalo JD, Dekhtyar M, Hawkins RE, Wolpaw DR. How can medical students add value? Identifying roles, barriers, and strate-gies to advance the value of undergraduate medical education to patient care and the health system. Acad Med. 2017;92(9):1294–301. http//:doi.org/10.1097/ACM.0000000000001662
4. Nikkar-Esfahani A, Jamjoom AA, Fitzgerald JE. Extracurricular participation in research and audit by medical students: opportu-nities, obstacles, motivation and outcomes. Med Teach. 2012;34(5):e317–24. http//:doi.org/10.3109/0142159X.2012.670324
5. Saint S, Flanders SA. Hospitalists in teaching hospitals: opportunities but not without danger. J Gen Intern Med. 2004;19(4):392–3. http//:doi.org/10.1111/j.1525-1497.2004.42002.x
6. Schexnayder S, Starring H, Fury M, Mora A, Leonardi C, Dasa V. The formation of a medical student research committee and its impact on involvement in departmental research. Med Educ Online. 2018;23(1):1424449. http//:doi.org/10.1080/10872981.2018.1424449
7. Sabzwari S, Kauser S, Khuwaja AK. Experiences, attitudes and barriers towards research amongst junior faculty of Pakistani medical universities. BMC Med Educ. 2009;9:68. http//:doi.org/10.1186/1472-6920-9-68
8. Mitwalli HA, Al Ghamdi KM, Moussa NA. Perceptions, attitudes, and practices towards research among resident physicians in training in Saudi Arabia. East Mediterr Health J. 2014;20(2):99–104.
9. Amgad M, Man Kin Tsui M, Liptrott SJ, Shash E. Medical student research: an integrated mixed-methods systematic review and meta-analysis. PLoS ONE. 2015;10(6):e0127470. http//:doi.org/10.1371/journal.pone.0127470
10. Straus SE, Straus C, Tzanetos K, International Campaign to Revitalise Academic Medicine. Career choice in academic medicine: systematic review. J Gen Intern Med. 2006;21(12):1222–9. http//:doi.org/10.1111/j.1525-1497.2006.00599.x
11. Dorrance KA, Denton GD, Proemba J, La Rochelle J, Nasir J, Argyros G, et al. An internal medicine interest group research pro-gram can improve scholarly productivity of medical students and foster mentoring relationships with internists. Teach Learn Med. 2008;20(2):163–7. http//:doi.org/10.1080/10401330801991857
12. Habineza H, Nsanzabaganwa C, Nyirimanzi N, Umuhoza C, Cartledge K, Conard, C, et al. Perceived attitudes of the importance and barriers to research amongst Rwandan interns and pediatric residents – a cross-sectional study. BMC Med Educ. 2019;19(4). https://doi.org/10.1186/s12909-018-1425-6
13. Amin TT, Kaliyadan F, Al Qattan EA, Al Majed MH, Al Khanjaf HS, Mirza M. Knowledge, attitudes and barriers related to partici-pation of medical students in research in three Arab universities. Educ Med J. 2012;4(1):e43–56. http//:doi.org/10.5959/eimj.v4i1.7
14. Clancy AA, Posner G. Attitudes toward research during residency: a survey of Canadian residents in obstetrics and gynecology. J Surg Educ. 2015;72(5):836–43. http//:doi.org/10.1016/j.jsurg.2015.02.007
15. Pallamparthy S, Basavareddy A. Knowledge, attitude, practice, and barriers toward research among medical students: A cross-sectional questionnaire-based survey. Perspect Clin Res. 2019;10(2):73–8. http//:doi.org/10.4103/picr.PICR_1_18
16. Alemayehu C, Mitchell G, Nikles J. Barriers for conducting clinical trials in developing countries- a systematic review. Int J Equi-ty Health. 2018;17(1):37. http//:doi.org/10.1186/s12939-018-0748-6
17. Moses H, Matheson DHM, Cairns-Smith S, George BP, Palisch C, Dorsey ER. The anatomy of medical research: US and interna-tional comparisons. JAMA. 2015;313(2):174–89. http//:doi.org/10.1001/jama.2014.15939
18. Chang Y, Ramnanan CJ. A review of literature on medical students and scholarly research: experiences, attitudes, and outcomes. Acad Med. 2015;90(8):1162–73. http//:doi.org/10.1097/ACM.0000000000000702.
يف بريوت، لبنان. واستخدم حتليل االنحدار اللوجستي لتحديد العوامل املرتبطة باملشاركة يف البحوث. واحتسبت نسبة األرجحية وفواصل الثقة بنسبة 95 %.
بنسبة العام الطب يف متخصصني العدد هذا وشمل االستبيان؛ 252 (%87) استكمل متدربا، 292 عددهم البالغ املتدربني بني من النتائج: 122 بحثية مرشوعات يف شاركوا الذين املتدربني جمموع وبلغ .%34.1 بنسبة أخرى وختصصات ،%25.8 بنسبة اجلراحة ويف ،%40.1يف و%58.2 لنرشها، األوراق كتابة يف و%69.7 اخلالصات، كتابة يف و%83.6 البيانات، مجع يف %85.2 كالتايل: دورهم وكان متدربا، .2.5 املنشورات متوسط وبلغ ،(% 82.0) مهمة بحثية مرجات املتدربني معظم م قد وقد البيانات. حتليل يف و%57.4 املرشوعات، تصميم البحوث بإجراء واالستمتاع (OR = 1.90, %95 CI: 0.84–4.30) للمتدربني الذاتية السرية حتسني أن اللوجستي االنحدار حتليل وبني
لقلة نظرا باإلحباط املتدربون يشعرون البحوث. وكان التحفيزية للمشاركة يف العوامل (OR = 2.05, %95 CI: 0.94–4.44) مل يكونا من فرص مشاركتهم يف البحوث، وأرجعوا ذلك بشكل أسايس إىل ضيق الوقت.
االستنتاجات: هناك حاجة إىل املزيد من برامج الدعم الرسمية وغري الرسمية لتشجيع متدريب الدراسات العليا عىل املشاركة بصورة أكرب يف البحوث.
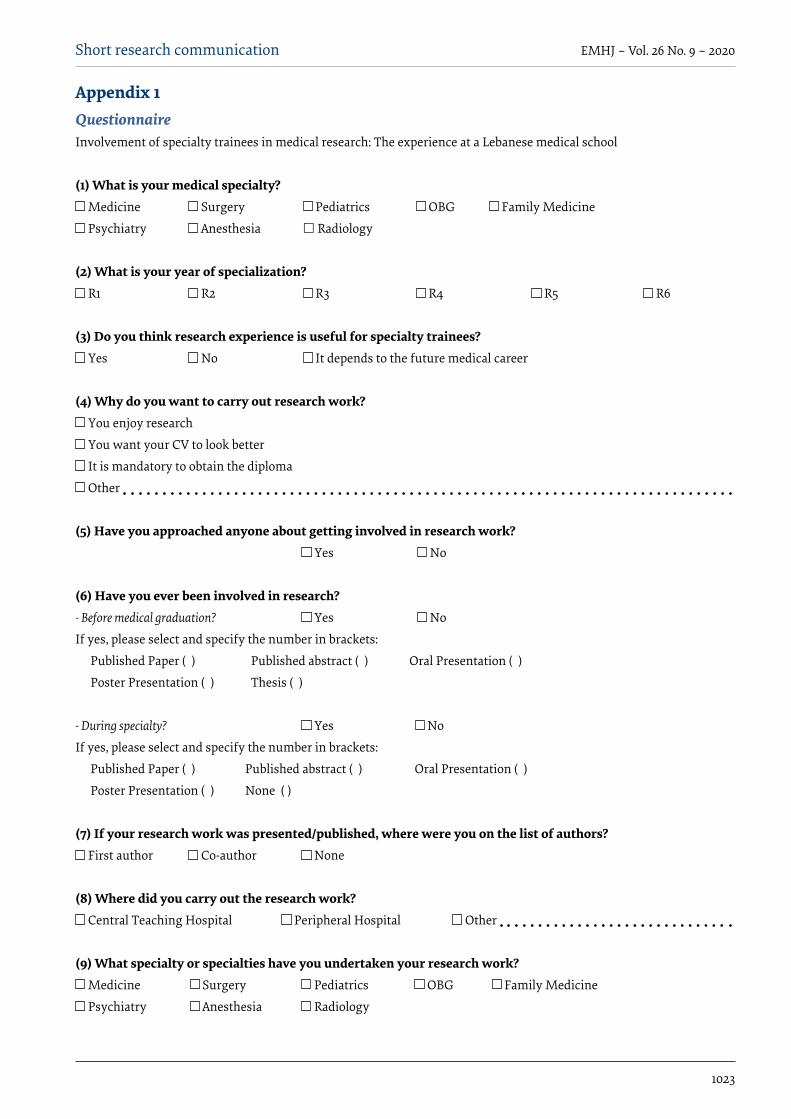
1023
Short research communication EMHJ – Vol. 26 No. 9 – 2020
Appendix 1QuestionnaireInvolvement of specialty trainees in medical research: The experience at a Lebanese medical school
(1) What is your medical specialty? Medicine Surgery Pediatrics OBG Family Medicine
Psychiatry Anesthesia Radiology
(2) What is your year of specialization? R1 R2 R3 R4 R5 R6
(3) Do you think research experience is useful for specialty trainees? Yes No It depends to the future medical career
(4) Why do you want to carry out research work? You enjoy research
You want your CV to look better
It is mandatory to obtain the diploma
Other
(5) Have you approached anyone about getting involved in research work? Yes No
(6) Have you ever been involved in research?- Before medical graduation? Yes No
If yes, please select and specify the number in brackets:
Published Paper ( ) Published abstract ( ) Oral Presentation ( )
Poster Presentation ( ) Thesis ( )
- During specialty? Yes No
If yes, please select and specify the number in brackets:
Published Paper ( ) Published abstract ( ) Oral Presentation ( )
Poster Presentation ( ) None ( )
(7) If your research work was presented/published, where were you on the list of authors? First author Co-author None
(8) Where did you carry out the research work? Central Teaching Hospital Peripheral Hospital Other
(9) What specialty or specialties have you undertaken your research work? Medicine Surgery Pediatrics OBG Family Medicine
Psychiatry Anesthesia Radiology
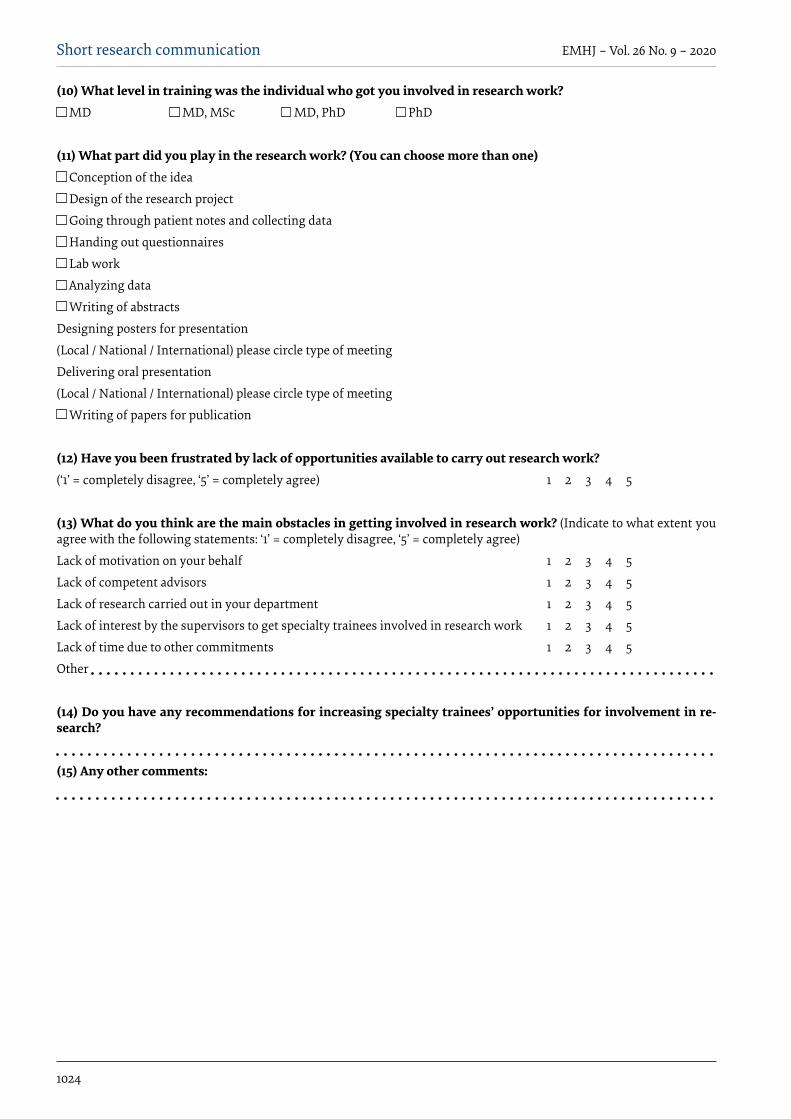
1024
Short research communication EMHJ – Vol. 26 No. 9 – 2020
(10) What level in training was the individual who got you involved in research work? MD MD, MSc MD, PhD PhD
(11) What part did you play in the research work? (You can choose more than one) Conception of the idea
Design of the research project
Going through patient notes and collecting data
Handing out questionnaires
Lab work
Analyzing data
Writing of abstracts
Designing posters for presentation
(Local / National / International) please circle type of meeting
Delivering oral presentation
(Local / National / International) please circle type of meeting
Writing of papers for publication
(12) Have you been frustrated by lack of opportunities available to carry out research work? (‘1’ = completely disagree, ‘5’ = completely agree) 1 2 3 4 5
(13) What do you think are the main obstacles in getting involved in research work? (Indicate to what extent you agree with the following statements: ‘1’ = completely disagree, ‘5’ = completely agree)
Lack of motivation on your behalf 1 2 3 4 5
Lack of competent advisors 1 2 3 4 5
Lack of research carried out in your department 1 2 3 4 5
Lack of interest by the supervisors to get specialty trainees involved in research work 1 2 3 4 5
Lack of time due to other commitments 1 2 3 4 5
Other
(14) Do you have any recommendations for increasing specialty trainees’ opportunities for involvement in re-search?
(15) Any other comments:

1025
Research article EMHJ – Vol. 26 No. 9 – 2020
An analysis of financial protection before and after the Iranian Health Transformation PlanZhaleh Abdi,1 Justine Hsu,2 Elham Ahmadnezhad,1 Reza Majdzadeh1,3 and Iraj Harirchi4
1National Institute of Health Research; 3Department of Epidemiology and Biostatistics, School of Public Health; 4Cancer Research Centre of Cancer Institute, Tehran University of Medical Sciences, Tehran, Islamic Republic of Iran (Correspondence to: Zhaleh Abdi: [email protected]). 2Depart-ment of Health Systems Governance and Financing, World Health Organization, Geneva, Switzerland.
AbstractBackground: Protecting people against the financial consequences of health-care payments is a key objective of health systems.Aims: We carried out a descriptive analysis of changes in health spending associated with the implementation of the latest health sector reform in the Islamic Republic of Iran, the Health Transformation Plan (HTP).Methods: The study relied on 2 rounds of data from the Household Expenditure and Income Survey (2014 and 2015). Key indicators of financial protection in health expenditure were estimated. The Kakwani index was used for out-of-pocket (OOP) health expenditure to measure the degree of progressivity in the distribution of such payments.Results: Total OOP per capita health expenditure showed a 2.5% relative decrease in real terms in 2015 compared to 2014. Estimation of the Kakwani index suggested OOP spending became slightly more progressive over the time period of HTP reform. The share of the population facing catastrophic health expenditure also decreased significantly from 2.9% to 2.1% at the national level. However, the incidence of impoverishment due to OOP payments increased slightly between pre- and post-HTP, from 0.2% to 0.5%. Conclusion: Our findings suggest that the new policies have a positive association in improving financial protection against health costs among Iranians, albeit slightly less so for the poor. Future efforts to increase public spending for fi-nancial protection would be challenging and should rely on efficiency gains such as a move from fee-for-service to perfor-mance-based payment systems and more organized OOP collection mechanisms involving prepayment and risk pooling.Keywords: health expenditure, health equity, health policy, health transformation plan, IranCitation: Abdi Z; Hsu J Ahmadnezhad E; Majdzadeh R; Harirchi I. An analysis of financial protection before and after the Iranian Health Transforma-tion Plan. East Mediterr Health J. 2019;26(9):1025-1033. https://doi.org/10.26719/emhj.19.026Received: 01/03/18; accepted: 14/11/18Copyright © World Health Organization (WHO) 2020. Some rights reserved. This work is available under the CC BY-NC-SA 3.0 IGO license https://creativecommons.org/licenses/by-nc-sa/3.0/igo
IntroductionThe design of health systems has a fundamental impact on population access to health services and thus their health status. Unfortunately, accessing these services can sometimes lead to some individuals having to pay catastrophic proportions of their available income and/or push many into poverty (1–4). Globally it has been estimated that 150 million people suffer financial ca-tastrophe each year due to health care payments and 100 million are pushed into poverty because of out-of-pocket (OOP) payments (5).
One of the main goals of a health system is fair financing, i.e. providing financial protection against the costs of ill-health. This concept of fairness or equity in health financing promotes the idea that the burden must be shared across society, and that individuals should be protected against financial hardship that threatens their living standards as a result of paying for health care (6,7). Empirical evidence highlights that OOP payment is not only the most inequitable but also the least efficient means of financing health care (8). A more equitable and efficient health financing system requires effective health financing strategies that shift
from a reliance on OOP payments at the time of service to more organized forms of revenue collection involving pre-payment and risk pooling mechanisms (8,9). With the goals of financial protection and equity in mind, a number of countries have implemented health sector reforms and have reported promising results in reducing OOP payments. For instance, in Thailand, universal coverage was launched in 2001 to ensure equitable access to health care for the entire population. Since its introduction, the policy had a major impact on reducing the overall incidence of catastrophic expenditure among population (10). In Turkey, following the implementation of the health transformation programme in 2003, which aimed at reducing total OOP expenditure and increasing access to health care, there was a diminishing trend in catastrophic and impoverishing health expenditures (11). Similarly, Indonesia implemented a reform to restructure its health care financing system and improve access to health services by establishing several health insurance programmes, which were relatively successful in providing financial protection for their members against the cost of medical services (12).
In the Islamic Republic of Iran, major sources of financing the health sector are OOP health expenditures

1026
Research article EMHJ – Vol. 26 No. 9 – 2020
and government expenditures, which respectively represented 47.0% and 38.9% of total health spending in 2013 (13). Social health insurance accounted for 19.7% of total health spending. In recognition of the Iranian health system being predominantly financed by OOP payments, the country’s fifth 5-year development plan has mandated the government to decrease the share of such payments in total health expenditures to 30% or less (14). In addition, with the aim of ensuring that health care is more accessible and its provision more equitable to the population, the 11th government launched the health transformation plan (HTP) in May 2014 (15). One of the major aims of this plan is to reduce OOP payments, a target which is mainly supported by a substantial increase in the budget of the Ministry of Health and Medical Education (i.e. 59% increase in annual budget), financed from a targeted energy subsidies law and an earmarked 1% of value added tax, together contributing an additional US$ 3 billion (16).
Protecting the population against the impact of high OOP payments is an important goal of the HTP. First, insurance coverage was extended for approximately 10 million people (17). Recognising that spending on inpatient services and medicines are the main components of total OOP expenditure, the Ministry of Health and Medical Education also took major steps to reduce inpatient costs by reducing co-payments for hospitals affiliated with the Ministry of Health and Medical Education to a maximum of 10% for residents of large and medium cities and a maximum of 5% for residents of rural areas. These co-payment rates were reduced to 6% and 3% respectively at the end of 2014. In addition, modification of the tariffs paid for medical services started in November 2014. The main objective of revising health tariffs was to regulate physicians’ payments and reduce informal payments, which are estimated to be high (18). The HTP also reduced the shortage of essential drugs stemming from international sanctions against the Islamic Republic of Iran, and reduced the price of medicines at the beginning of 2014.
In this study, we aimed to analyse preliminary changes observed around the time of the implementation of the HTP, particularly in regard to changes in the level and distribution of OOP payments and catastrophic and impoverishing health expenditures by comparing 1 year before and after implementation. Equity in the distribution of such payments was also examined to understand the degree of progressivity.
MethodsData are from 2 rounds of the Household Expenditure and Income Survey, which is conducted 4 times a year by the Iranian Statistics Centre. Each round is nationally representative, and our analysis relied on data from the Persian calendar’s winter season, corresponding to Gre-gorian calendar months January–April 2013 (sample size 9535 households) and from January–April 2015 (sample size 9543 households). Since the HTP was initiated in
April 2014, and with expenditure recall periods of a max-imum of 1 year, the majority of data thus represents the period of a year before and a year after the implementa-tion of reforms.
Health expenditures refer to OOP payments made by individuals to health providers at the time of service use. They include direct payments (including gratuities and payments in kind) to formal medical professionals, informal traditional or alternative healers, clinics, health centres and pharmacies and exclude prepayment for health services (e.g. in the form of taxes or specific insurance premiums or contributions) and, where possible, are net of any reimbursements to the individual who made the payments. All expenditure variables were annualized and baselined to 2011, adjusting for urban and rural inflation rates based on an annual average of quarterly consumer price indices.
Key indicators of financial protection in health spending concern catastrophic and impoverishing health expenditures, where the former is concerned with the impact of health expenditures causing a person to forego spending on other necessities and the latter is concerned with health expenditures pushing a person below the poverty line. Indicators were constructed following established methods. For catastrophic health expenditures, the methodology developed by the World Health Organization (WHO) was applied when catastrophic health expenditures were equal to or exceeded 40% of a household’s capacity to pay (19). The WHO approximates capacity-to-pay as total expenditure net of nondiscretionary food spending. The latter is estimated as the average food expenditure per equivalent adult across households in the 45th−55th percentile of the food budget share distribution. When actual food spending is below this amount, capacity-to-pay is defined as total expenditure net of actual food spending. Health expenditures are considered impoverishing when they push a person below the poverty line, i.e. expenditures gross of spending on health are above the poverty line but expenditures net of health spending are below the line. In this analysis, the international poverty line of US$ 1.90 (2011 purchasing power parity) per capita, per day was used. Population headcount ratios were estimated for both indicators and t-tests conducted to assess whether changes were significant or not.
Equity in the distribution of OOP payments was also analysed by estimating the Kakwani index. This index is based on the Gini coefficient of income and the concentration index of OOP expenditures (20). A Gini index ranks income distribution on a scale between 0 and 1, where 0 indicates perfect equality and 1 indicates perfect inequality. We proxied income using total consumption expenditure. A concentration index assesses the distribution of OOP payments across the population taking a value between –1 and 1, where a negative value suggests OOP is concentrated in the poor and a positive value suggests OOP is concentrated in the rich. The Kakwani index is then the difference between the Gini coefficient and the concentration index for OOP

1027
Research article EMHJ – Vol. 26 No. 9 – 2020
health payments, and ranges from −2 (indicating severe regressivity) to +1 (indicating strong progressivity). If OOP payments are a progressive way to finance the health services, the Kakwani index will have a positive value. This research analysed changes in the degree of progressivity in OOP financing in the 2 time periods associated with the HTP reform.
ResultsOne of the main objectives of the HTP is to reduce OOP health payments, especially those due to inpatient costs in public hospitals, across the Iranian population. Table 1 shows total OOP and OOP payments on inpatient ser-vices before and after HTP implementation. The results indicate a positive association with a relative decrease in total OOP per capita expenditure of 2.5% in real terms at the national level (from 2 099 569 rials to 2 047 120 rials). Almost all subpopulation groups benefited from the re-duction in total OOP expenditure except for the richest quintile and those living in urban areas. The more vulner-able groups of the population, those living in rural areas and the poorest, benefitted from the greatest relative re-duction in total OOP expenditure.
The Iranian HTP had an initial focus on reducing inpatient costs in public hospitals. The Household Expenditure and Income Survey collected data on spending on inpatient health services (covering both public and private sectors). Table 1 also shows that OOP on inpatient services per capita decreased in the year after HTP compared with the year before HTP at the national level, from 429 323 rials to 288 310 rials, representing a 32.8% relative reduction. All subnational population groups saw a decrease, with the greatest relative change observed for middle socioeconomic status populations: quintile 3 (–39.7%) and quintile 4 (–46.8%), followed by those in rural areas (–38.8%).
Examining OOP payments reveals that the positive impact of the HTP on inpatient spending seems to be counter-balanced by the opposite effect on other outpatient fees and services (Figure 1). The focus of the HTP on inpatient services and medicines saw a reduction in related OOP expenditures. However, OOP on outpatient fees increased, as did such payments for ancillary services and dentistry.
This increase, however, was not observed for all subnational population groups. Figure 1b shows that for the poorest quintile OOP payments for services (with the exception of ancillary services) decreased,
Table 1 Out-of-pocket (OOP) payments on health (Iranian rials) per capita, 2011 terms
Area or quintile
Total OOP Inpatient OOP
Population mean; (confidence interval)
Relative change
(%)
Absolute change
Population mean; (confidence interval)
Relative change
(%)
Absolute change
2014 2015 2014 2015
National 2 099 569; (1 991 382–2 207 755)
2 047 120; (1 841 276–2 252 963)
–2.5–52 448
429 323; (387 962–470 683)
288 309; (250 610–326 008)
–32.8 –141 013***
Urban 2 408 992; (2 241 114–2 576 871)
2 431 556; (2 090 422–
2 772691)
0.9 22 563 485 648; (422 187–549 109)
332 273; (272 244–392 303)
31.6 –153 374**
Rural 1 311 841; (1 204 820–1 418 862)
1 055 955; (980 911.3–1 130 999)
–19.5 –255 886** 285 930; (241 443–330 418)
174 959; (143 877–206 042)
–38.8 –110 971***
Q1 438 865.2; (409 112.6–468 617.9)
369 734; (342 403–397 064.9)
–15.8 –69 131* 83 593; (69 476–97 710)
57 278; (43 934–70 621)
–31.5 –26 315
Q2 812 659.5; (760 721.4–864 597.7)
764 072.3; (709 819.5–818 325.1)
–6.0 –48 587 160 437; (131 542–189 332)
137 876; (109 626–166 127)
–14.1 –22 560
Q3 1 312 266; (1 227 578–1 396 954)
1 127 601; (1 040 901–1 214 302)
–14.1 –184 664* 297 044; (251 250–342 838)
179 241; (136 798–221 685)
–39.7 –117 802**
Q4 2 223 898; (2 049 588–2 398 208)
1 888 749; (1 744 725–2 032 773)
–15.1 –335 148 541 328; (434 074–648 582)
287 844; (227 972–347 717)
–46.8 –253 483*
Q5 5 716 025; (5 164 361–6 267 689)
6 095 431; (4 920 629–7 270 232)
6.6 379 405 1 065 280; (867 278–1 263 282)
780 481; (580 108–980 854)
–26.7 –284 798
Expenditure variables were annualized and baselined to 2011, adjusting for urban and rural inflation rates based on an annual average of quarterly consumer price indices. Quintiles are constructed based on per capita consumption expenditure. *P < 0.05, **P < 0.01, ***P < 0.001.

1028
Research article EMHJ – Vol. 26 No. 9 – 2020
Type of spending
Iran
ian
rial
s (00
0)
2015 % change2014
700 ooo
600 000
500 000
400 000
300 000
200 000
100 000
0
40
30
20
10
0
-10
-20
-30
-40
%
Inpatient Outpatient Medicines Ancillary Dentistry Other
Iran
ian
ria
ls (0
00)
Num
ber o
f cas
es
Type of spending
20152014
200 00
180 000
160 000
140 000
120 000
100 000
80 000
60 000
40 000
20 000
0Inpatient Outpatient Medicines Ancillary Dentistry Other
Num
ber o
f cas
es
a. National averages
b. Quintile 1
c. Quintile 5
Figure 1 Out-of-pocket payments in the Islamic Republic of Iran according to type of health spending
Type of spending
Iran
ian
rial
s (00
0)
20152014
1 800 ooo
1 600 000
1 400 000
1 200 000
1 000 000
800 000
600 000
400 000
200 000
0Inpatient Outpatient Medicines Ancillary Dentistry Other

1029
Research article EMHJ – Vol. 26 No. 9 – 2020
whereas Figure 1c shows that for the richest quintile OOP payments increased for outpatient fees, ancillary services and dentistry during the same period.
To understand the impact of OOP health spending on living standards, catastrophic health expenditures was calculated following the WHO capacity-to-pay approach. Comparison of the share of the population experiencing catastrophic health expenditures showed there was a statistically significant reduction after the implementation of the HTP (Table 2), decreasing from 2.9% to 2.1%. More importantly, all population groups benefitted from this reduction, although the richest 40% of the population and those in urban areas benefitted the most with greater absolute decreases. In terms of impoverishing health expenditure using the US$ 1.90 international poverty line in 2011 purchasing power parity, the incidence of impoverishment due to OOP payments increased slightly.
Table 3 shows the distributional analysis with estimations for the Gini coefficient for total expenditure, the concentration index for OOP payments and the Kakwani index. The Gini coefficient for total expenditure
was estimated as 0.38 in 2014 and 0.39 in 2015, suggesting that the distribution generally remained the same after the implementation of the HTP. The concentration index for OOP payments was estimated as 0.49 in 2014 and rose to 0.55 in 2015, suggesting that such payments were more concentrated in the wealthy than in the poor. The Kakwani index is the difference between the two and was estimated to be 0.12 in 2014, rising to 0.15 in 2015. The positive index indicates OOP was already a progressive source of financing pre-reforms, and the slight increase suggests an increase in the degree of progressivity of OOP as a source of financing.
DiscussionThis analysis presents preliminary results observed during the implementation of the Iranian HTP, includ-ing changes in the level and distribution of OOP and catastrophic and impoverishing health expenditures across the population. Preliminary results indicate that the HTP is associated with reductions in OOP and cata-strophic health expenditures. Our results are consistent with those of similar studies that reported a reduction in
Table 2 Key indicators of financial protection in health spending, Islamic Republic of Iran
Area or quintile Catastrophic health expendituresa (%) Impoverishing health expendituresb (%)
Headcount ratio Absolute changec Headcount ratio Absolute changec
2014 2015 2014 2015
Area
National 2.9 2.1 –0.8* 0.2 0.5 0.3**
Urban 2.6 1.7 –0.9* 0.1 0.1 0.0
Rural 3.8 3.2 –0.5 0.6 1.5 0.9***
Quintile
Q1 2.3 2.2 –0.1 1.1 2.2 1.1**
Q2 2.1 1.5 –0.6 0.0 0.1 0.1
Q3 2.1 1.7 –0.4 0.0 0.0
Q4 3.4 2.2 –1.3 0.0 0.0
Q5 4.9 3.3 –1.6 0.0 0.0*P < 0.05, **P < 0.01, ***P < 0.001. aDefined as 40% or more of nonsubsistence food expenditure. bUsing the 2011 international poverty line of US$ 1.90 purchasing power parity. cSubject to rounding.
Table 3 Distributional analyses of out-of-pocket payments
Year and index Estimate Standard error P > t 95% CI2014
Gini coefficient 0.38 0.0053 0.0001 0.366–0.387
Concentration index 0.49 0.0182 0.0001 0.459–0.530
Kakwani index 0.12 0.0179 0.0001 0.083–0.153
2015
Gini coefficient 0.39 0.0065 0.0001 0.381–0.406
Concentration index 0.55 0.0442 0.0001 0.459–0.632
Kakwani index 0.15 0.0403 0.0002 0.073–0.231

1030
Research article EMHJ – Vol. 26 No. 9 – 2020
the proportion of households experiencing catastroph-ic health expenditure following the implementation of health reforms (10–12). Distributional analyses also sug-gest that there were progressive changes in the nature of OOP financing. Impoverishing health expenditures increased slightly, but general poverty levels did as well (21).
These initial positive results can be linked with a number of interventions of the HTP. One of the main interventions was the extension of free basic health insurance to all uninsured Iranians by the Iranian Health Insurance Organization. Government reports and household surveys suggest an increase in population coverage from 83.2% to 90.1% (22). During the first year of HTP, co-payments for inpatient services were reduced for hospitals affiliated with the Ministry of Health and Medical Education from 10% to 6% for urban areas and from 5% to 3% for rural areas. In terms of purchasing health services, tariffs paid by the Iranian Health Insurance Organization to health facilities for the provision of health services were increased in November 2014 to better reflect the cost of services provided. The main objectives of such initiatives were to regulate provider payments and reduce informal payments, which had been estimated to be high (18). These reforms in provider payments along with the tighter regulation of what public hospitals could charge patients all aimed to reduce OOP and informal (under-the-table) payments in public hospitals.
Our analyses further demonstrated that the decrease in OOP payments for inpatient services was partially counterbalanced by a slight increase for OOP payments on various outpatient services. Considering the fact that most of the HTP interventions targeted the inpatient sector in the first year of HTP implementation, this initial trend was expected. Relatively higher OOP spending on outpatient care was observed for wealthier population groups and on services related to ancillary and dentistry care.
The distributional analyses of OOP spending showed this to be a progressive source of financing in the country and with OOP payments mainly concentrated among the rich. A similar study conducted in Turkey found that OOP payment was progressive in the first year of the health reform and it tended to be regressive 6 years afterwards (11). In countries of the Organisation for Economic Co-operation and Development (OECD), the analysis of progressivity using the Kakwani index revealed that, although health care payments were almost proportional to ability to pay, private payments included, OOP payments and private insurance premiums were highly regressive (23). Several studies in low- to middle-income countries reported that OOP payments were a regressive financing mechanism (24–26). Given the Iranian health system is predominantly financed by OOP payments, it would be important to explore mechanisms to transform the collection of such resources from individuals at the time of service use to more organized collection forms involving pre-payment and risk-pooling.
In this study, the share of the population experiencing catastrophic health expenditures decreased from 2.9% to 2.1% over 2 time periods. More importantly, all population groups benefitted from this reduction, although the richest 40% of the population and those in urban areas benefitted the most with greater absolute decreases, suggesting that the observed reductions in OOP payments in the poor were not as effective in reducing their levels of catastrophic health expenditures in comparison with those population. Strategies aimed at improving financial access for the poor should pursue equity gains by improving financial protection for those harder to reach population groups. The increase in the incidence of impoverishment before and after HTP might be a reflection of the general poverty levels in the Islamic Republic of Iran, which also slightly increased over the same period, from 1.7% to 3.4% (21). As expected, impoverishment was only observed in the poorest quintiles.
Key strengths and limitations of this study are worth noting. First, the study relied on a robust and comprehensive national household survey conducted by the Iranian Statistics Centre. Second, the methods used for analysing financial protection are well established, dating back to the 1990s and used in several other country studies (27–29). Some limitations to note are that the study could not isolate the impact of the HTP, which would have required either a randomized control study or a quasi-experimental model. Working with policy-makers to conduct more rigorous impact evaluations in the future would be welcome. Additionally, the relatively short time period covered by the study does not allow for full understanding of the impact of the reform and thus, regular monitoring and evaluation are strongly recommended. Nevertheless, this study still presents important preliminary findings of changes associated with reforms. It provides timely insight to inform the future direction of HTP.
ConclusionThis study provides preliminary evidence regarding the level and distribution of OOP payments, as well as their catastrophic and impoverishing effects during a period before and after implementation of the latest health sec-tor reform in the Islamic Republic of Iran. Results sug-gest that the new policies are associated with a positive impact in reducing total OOP expenditure. Catastrophic health expenditures also decreased for all subnational population groups, albeit slightly less so for the poor. In addition, impoverishing health expenditures slightly increased for the poor and near-poor. The results thus suggest efficiency rather than equity improvement was made as the reduction in OOP was less effective in ex-tending financial protection for these more vulnerable groups. The distribution of OOP was progressive pre-HTP and slightly increased post-HTP.
Funding: None.
Competing interests: None declared.

1031
Research article EMHJ – Vol. 26 No. 9 – 2020
حتليل احلامية املالية قبل خطة التحول الصحي يف مجهورية إيران اإلسالمية وبعدهاجاله عبدی، جاستنی سو، اهلام امحدنجاد، رضا جمدزاده، ایرج حریرشی
اخلالصةاخللفية: تعترب محایة الناس من التعرض للعواقب املالية التي ترتتب عىل املدفوعات يف جمال الرعایة الصحية أحد األهداف الرئيسية للنظم الصحية.
األهداف: هدفت هذه الدراسة إىل إجراء حتليل وصفي للتغريات التي حتدث يف اإلنفاق عىل الصحة، والتي تقرتن بتنفيذ أحدث إصالح يف قطاع الصحة يف مجهوریة إیران اإلسالمية، أال وهو خطة التحول الصحي.
رت املؤرشات طرق البحث: استندت الدراسة إىل جولتنی جلمع البيانات من املسح اخلاص بإنفاق األرسة ودخلها )عامي 2014 و2015(. وقدد من خالل الدفع الرئيسية للحامیة املالية يف اإلنفاق عىل الصحة. كام استخدم مؤرش كاكواين لقياس نسبة التدرجية يف توزیع املدفوعات التي تسد
املبارش لإلنفاق عىل الصحة.بعام مقارنة ،2015 عام 2.5% يف بنسبة الفعلية بالقيمة نسبي انخفاض حدوث للفرد الصحة لإلنفاق عىل املبارش الدفع إمجايل أظهر النتائج: 2014. وأشار تقدیر مؤرش كاكواين إىل أن اإلنفاق بالدفع املبارش قد أصبح متدرجا بشكل أكرب بعض اليشء خالل الفرتة الزمنية لإلصالح وفقا خلطة التحول الصحي. كام انخفض بصورة كبرية نصيب السكان من النفقات الصحية الباهظة عىل املستوى الوطني حيث بلغ 2.1% بعد أن كان 2.9%. وعىل الرغم مما سبق، فقد زاد معدل حدوث اإلفقار زیادة طفيفة بسبب املدفوعات املبارشة يف الفرتة السابقة عىل خطة التحول الصحي
وبعدها، حيث ارتفع من 0.2% إىل %0.5. النتائج التي توصلنا إليها إىل أن السياسات اجلدیدة ارتبطت ارتباطا إجيابيا بتحسنی احلامیة املالية من التكاليف الصحية عىل تشري االستنتاجات: مستوى اإلیرانينی، وإن كان ذلك قد حتقق بقدر أقل بعض اليشء بالنسبة للفقراء. ولكن ستواجه جهود زیادة اإلنفاق العام لتحقيق احلامیة املالية قة من حيث الكفاءة مثل، التحول من نظم الرسوم مقابل تقدیم اخلدمات إىل نظم الدفع استنادا إىل األداء حتدیا، وینبغي أن تعتمد عىل املكاسب املحق
وآليات حتصيل املدفوعات املبارشة عىل نحو أكثر تنظيام، ومنها الدفع املسبق وجتميع املخاطر.
Analyse de la protection financière avant et après le plan national de transformation du secteur de la santé en République islamique d’IranRésuméContexte : La protection de la population contre les conséquences financières des paiements de soins de santé est un objectif essentiel des systèmes de santé.Objectifs : Nous avons mené une analyse descriptive des changements dans les dépenses de santé liés à la mise en œuvre de la dernière réforme du secteur de la santé en République islamique d’Iran, connu sous le nom de plan national de transformation du secteur de la santé.Méthodes : La présente étude s’est appuyée sur deux séries de données issues de l’enquête sur les dépenses et les revenus des ménages (2014 et 2015). Les principaux indicateurs de la protection financière en matière de dépenses de santé ont été évalués. L’indice de Kakwani a été utilisé pour les dépenses de santé à la charge des patients afin de mesurer le degré de progressivité dans la distribution de ces paiements.Résultats : En 2015, le montant total des dépenses de santé non remboursées par habitant a enregistré une diminution en valeur réelle de 2,5 % par rapport à 2014. D’après l’estimation de l’indice de Kakwani, les dépenses de santé non remboursées sont devenues légèrement plus progressives sur la période du plan national de transformation du secteur de la santé. Au niveau national, la part de la population confrontée à des dépenses de santé catastrophiques a également diminué de manière significative, de 2,9 % à 2,1 %. Cependant, l’incidence de l’appauvrissement dû aux dépenses de santé directement à la charge des patients a légèrement augmenté, de 0,2 % à 0,5 % avant et après le plan national de transformation du secteur de la santé, respectivement. Conclusion : D’après nos observations, les nouvelles politiques ont participé à l’amélioration de la protection financière contre le coût des soins de santé dans la population iranienne, bien que l’effet soit moins marqué chez les habitants les plus pauvres. À l’avenir, les efforts d’augmentation des dépenses publiques en faveur de la protection financière devraient être ambitieux et s’appuyer sur des gains d’efficacité, par exemple en passant d’un système de paiement à l’acte à un système axé sur le rendement, ou en améliorant l’organisation des mécanismes de recouvrement des dépenses de santé non remboursées grâce au paiement anticipé et à la répartition des risques.

1032
Research article EMHJ – Vol. 26 No. 9 – 2020
References1. Van Doorslaer E, O’Donnell O, Rannan-Eliya RP, Somanathan A, Adhikari SR, Garg CC, et al. Effect of payments for health
care on poverty estimates in 11 countries in Asia: an analysis of household survey data. Lancet. 2006;368(9544):1357–64. PMID:17046468
2. McIntyre D, Thiede M, Dahlgren G, Whitehead M. What are the economic consequences for households of illness and of paying for health care in low-and middle-income country contexts? Soc Sci Med. 2006;62(4):858–65. PMID:16099574
3. Garg CC, Karan AK. Reducing out-of-pocket expenditures to reduce poverty: a disaggregated analysis at rural-urban and state level in India. Health Policy Plan. 2009;24(2):116–28. PMID:19095685
4. Kruk ME, Goldmann E, Galea S. Borrowing and selling to pay for health care in low-and middle-income countries. Health aff. 2009;28(4):1056–66. PMID:19597204
5. Xu K, Evans DB, Carrin G, Aguilar-Rivera AM, Musgrove P, Evans T. Protecting households from catastrophic health spending. Health aff. 2007;26(4):972–83. PMID:17630440
6. Murray CJL, Xu K, Klavus J, Kawabata K, Hanvoravongchai P, Zeramdini R, et al. Assessing the distribution of household financial contributions to the health system: concepts and empirical application, Ch. 38. In: Murray CJL, Evans DB, eds. Health systems performance assessment: debates, methods and empiricism. Geneva: World Health Organization; 2003: 513–31.
7. Ekman B. Catastrophic health payments and health insurance: Some counterintuitive evidence from one low-income country. Health policy. 2007;83(2):304–13. PMID:17379351
8. The world health report 2000: health systems: improving performance. Geneva: World Health Organization; 2000.
9. Kutzin J. A descriptive framework for country-level analysis of health care financing arrangements. Health Policy. 2001;56(3):171–204. PMID:11399345
10. Limwattananon S, Tangcharoensathien V, Prakongsai P. Catastrophic and poverty impacts of health payments: results from national household surveys in Thailand. Bull World Health Organ. 2007;85(8):600–6. PMID:17768518
11. Yardim MS, Cilingiroglu N, Yardim N. Financial protection in health in Turkey: the effects of the Health Transformation Pro-gramme. Health Policy Plan. 2014;29(2):177–92. PMID:23411120
12. Aji B, De Allegri M, Souares A, Sauerborn R. The impact of health insurance programs on out-of-pocket expenditures in Indone-sia: an increase or a decrease? Environ Res Public Health. 2013;10(7):2995–3013. PMID:23873263
13. National Health Accounts Report, 2013. Tehran: National Statistics Center; 2014.
14. The fifth five-year developmental plan of I.R. of Iran (2011–2015). Tehran: Islamic Parliament of Iran; 2016 (http://parliran.ir/index.aspx?siteid=1&siteid=1&pageid=3362.%20Accessed%20December%2010,%202015, accessed 2 July 2016).
15. Moradi-Lakeh M, Vosoogh-Moghaddam A. Health sector evolution plan in Iran; equity and sustainability concerns. Int J Health Policy Manag. 2015;4(10):637. PMID:26673172
16. Assessment of national annual budget of health sector. Islamic Parliament Research Center (IPRC); 2015.( http://rc.majlis.ir/fa/report/show/916417, accessed July 5 2016).
17. MP hails government’s national health plan. Islamic Republic News Agency (IRNA). (http://www.irna.ir/en/News/82128592, accessed 20 April 2016).
18. Nekoeimoghadam M, Esfandiari A, Ramezani F, Amiresmaili M. Informal payments in healthcare: a case study of Kerman prov-ince in Iran. Int J Health Policy Manag. 2013;1(2):157. PMID:24596856
19. Xu K. Distribution of health payments and catastrophic expenditures methodology. Geneva: World Health Organization; 2005.
20. Kakwani NC. Measurement of tax progressivity: an international comparison. The Economic J. 1977;87(345):71–80.
21. Poverty and equity data (Iran’s profile). Washington DC: World Bank; (http://povertydata.worldbank.org/poverty/country/IRN, accessed 20 June 2016).
22. Ali Akbari Saba R, Safakish M, Rezaie Ghahroodi Z, Khabiri Nemati R, Zahedian AR, Khosravi A, et al. Utilization of health servic-es in 2014.Tehran: Ministry of Health and Medical Education Press; 2017.
23. De Graeve D, Van Ourti T. The distributional impact of health financing in Europe: A review. World Economy. 2003;26(10):1459–1479.
24. Makinen M, et al. Inequalities in health care use and expenditures: empirical data from eight developing countries and coun-tries in transition. Bull World Health Organ. 2000;78 (1):55–65. PMID:10686733
25. Leive A, Xu K. Coping with out-of-pocket health payments: empirical evidence from 15 African countries. Bull World Health Organ, 2008. 86 (11): 849–56C. PMID:19030690
26. Akazili J, et al. Progressivity of health care financing and incidence of service benefits in Ghana. Health Policy Plan. 2012; 27(sup-pl 1):i13–i22. PMID:22388496
27. Li Y, Wu Q, Liu C, Kang Z, Xie X, Yin H, et al. Catastrophic health expenditure and rural household impoverishment in China: what role does the new cooperative health insurance scheme play? PLoS One. 2014;9(4):e93253. PMID:24714605

1033
Research article EMHJ – Vol. 26 No. 9 – 2020
28. Buigut S, Ettarh R, Amendah DD. Catastrophic health expenditure and its determinants in Kenya slum communities. Int J Equity Health. 2015;14(1):1. PMID:25971679
29. Gotsadze G, Zoidze A, Rukhadze N. Household catastrophic health expenditure: evidence from Georgia and its policy implica-tions. BMC Health Serv Res. 2009;9(1):1. PMID:19400939

1034
Research article EMHJ – Vol. 26 No. 9 – 2020
Prevalence of hypohydration in adolescents during the school day in Cyprus: seasonal variationsPinelopi S. Stavrinou,1 Christoforos D. Giannaki,1 Eleni Andreou1 and George Aphamis1
1Department of Life and Health Sciences, University of Nicosia, Nicosia, Cyprus. (Correspondence to: Pinelopi S. Stavrinou: [email protected]).
AbstractBackground: Evidence on the hydration status of adolescents and seasonal and time variations is scarce.Aims: This study aimed to assess variations in the hydration status and total water intake of adolescents in Cyprus be-tween winter and summer and between the morning and end of the school day. Subjective feelings and cognitive func-tion associated with hypohydration were also examined.Methods: Fifty-three adolescents (39 boys) with a mean age (standard deviation, SD) of 15.1 (1.9) years were included in the study. Participants provided urine samples and completed a cognitive function test and a questionnaire on subjective feelings upon arrival at school and at the end of the school day. Data were collected in winter and summer in 2016–2017. Hydration level was determined by urine specific gravity and cognitive function was assessed with a symbol cancellation test. Total water intake was estimated from a food and fluid record kept by the participants.Results: A high prevalence of hypohydration was found in both seasons ranging from 72% to 94%. Hypohydration was associated with perceptions of lower concentration and alertness (P = 0.008 and P = 0.047, respectively). Adolescents had significantly higher mean urine specific gravity in winter than in summer: 1.026 (SD 0.007) versus 1.023 (SD 0.007), re-spectively (P = 0.002). Hydration status was not associated with cognitive function or total water intake.Conclusions: The high prevalence of hypohydration and the associated feelings of lower concentration and alertness in adolescents suggests that educational measures are needed to promote good drinking behaviour and improve hydration. Keywords: adolescents, cognitive function, hydration, water intake, CyprusCitation: Stavrinou SP; Giannaki DC; Andreou E; Aphamis G. Prevalence of hypohydration in adolescents during the school day in Cyprus: seasonal variations. East Mediterr Health J. 2020;26(9):1034-1041. https://doi.org/10.26719/emhj.20.014Received: 27/03/19; accepted: 19/08/19Copyright © World Health Organization (WHO) 2020. Open Access. Some rights reserved. This work is available under the CC BY-NC-SA 3.0 IGO license (https://creativecommons.org/licenses/by-nc-sa/3.0/igo)
IntroductionBody water is tightly regulated and daily fluctuations are maintained around 0.5% of body mass even in hot weath-er conditions. Water is essential for cellular homeostasis as well as for thermoregulation of the human body (1). Hydration status reflects the balance between water in-take and loss (2). Body water content deficit beyond the normal fluctuation is called hypohydration (3) and is associated with a number of negative effects on health (4). Fluid restriction leading to hypohydration has been shown to be associated with increased feelings of fatigue, decreased alertness and concentration, and lower levels of vigour/activity (5,6). Cognitive function has also been shown to be negatively affected by low hydration status (7), especially when combined with heat stress (8). Chil-dren with hypohydration living in a warm climate have been shown to perform more poorly in cognitive tests (9), while children’s performance in cognitive tasks appears to improve after drinking water (10).
Many children appear to have a low hydration status at some point during a typical school day (11,12). Water intake and drinking behaviour of children and adolescents varies substantially between countries and most studies have been done in countries with a temperate climate, or outside summer months (12,13). In addition, data on hydration in adolescents are scarce.
Living in a hot climate increases water loss and the risk of dehydration (14). Adolescents living in the eastern Mediterranean may face a higher risk of water loss and dehydration, as this area is characterized by mild winters and hot summers. School in Cyprus starts early in the morning and ends at 13:30 when the temperature exceeds 30 °C from April–May onwards. If adolescents fail to maintain a normal level of hydration (euhydration), their overall health, concentration and cognitive performance at school could be adversely affected (9,11,15,16).
The primary aims of our study were to compare hydration status of adolescents and total water intake from fluids and solid food during school hours between winter and summer. Our secondary aim was to investigate the relationship between hydration status and cognitive function and subjective feelings relevant to hypohydration.
MethodsFifty-three adolescents from three main cities of Cy-prus (39 boys) volunteered for the study. Their mean age and standard deviation (SD) was 15.1 (1.9) years, mean height was 165 (SD 10) cm, mean body mass was 55.7 (SD 13.1) kg and mean body mass index was 20.4 (SD 3.4) kg/m2. The study was carried out between
1035
Research article EMHJ – Vol. 26 No. 9 – 2020
2016 and 2017. Data were collected on two occasions, once in the winter time (February) and once in the sum-mer time (during the first two weeks of June – the end of the school year), in random order to avoid any poten-tial learning effect. Half of the participants provided data first in winter and then in summer, and the other half gave data first in the summer and then in the winter. This way we aimed to avoid potential learning effect on the cognitive tests, and any changes in drinking behaviour following the first set of data collection. On each occasion data were collected in the morning, at the beginning of the school day (about 07:30) and at the end of the school day (about 13:30). The outdoor temperature was meas-ured to the nearest 0.1 °C using a portable hygro ther-mometer (Radiance Instruments Ltd, Hong Kong). The temperature ranged between 10 °C and 15 °C from morn-ing to 13:30 during the winter period, and between 26 °C and 30 °C during the summer period.
Hydration level assessmentHydration level was assessed by urine specific gravity from the first morning void and from one sample at the end of the school day, before leaving the school premises. Urine collection bottles (60 mL) were given to the partic-ipating students at the appropriate time. Urine specific gravity was determined shortly after urine collection and the remaining urine samples were immediately disposed of by the researchers. Urine specific gravity was assessed using a urine refractometer (DIGIT 0-12, Medline Sci-entific Limited, United Kingdom of Great Britain and Northern Ireland). The participants were then assigned into three groups according to their urine specific gravity level: euhydrated (urine specific gravity < 1.020), slightly hypohydrated (urine specific gravity 1.020–1.029) and very hypohydrated (urine specific gravity ≥ 1.030) (3).
Total water intake assessmentTotal water intake was estimated from both solid food and fluid intake. Upon arrival at school, the participants were provided with a food-and-fluid record on which they were asked to record in detail all solid food and all fluid intakes from the time they woke up until the end of the school day. Before the data collection day, all par-ticipants had attended an educational session on how to keep a detailed food-and-fluid record, which was or-ganized and delivered by a registered dietitian. Morning water intake at home (before coming to school) and total water intake (from waking up and during the time that the students were at school) was estimated using Diet-Plan6 software (Forestfield Software Ltd, Horsham, Unit-ed Kingdom), which accesses food tables from multiple sources. This software allows insertion of additional data from any source, any recipe, menu or personal food diary without restriction.
Subjective feelings assessmentThe participants completed a subjective feelings ques-tionnaire as described in detail elsewhere (5). Partici-pants self-graded their feelings on an arbitrary linear scale ranging from 0 (not at all) to 100 mm (very much),
to questions such as – how thirsty do you feel now? We assessed the following subjective feelings: thirst, dry mouth, fatigue, head numbness, ability to concentrate and alertness. The reliability and validity of visual an-alogue scales in assessment of subjective feelings have been previously shown (17).
Cognitive function assessmentWe assessed cognitive function with a symbol cancella-tion test (18), where the participants were asked to identi-fy 60 target stimuli that were embedded in a background of over 300 distractor stimuli. The participants were al-lowed 45 s to cross through as many targets as they could, while ignoring distractors. We marked each target omis-sion or incorrectly identified distractor as 1 error point. The test was scored on the number of errors/omissions.
Statistical analysisWe used two-way repeated-measures ANOVA (sea-son × time) and post-hoc tests with the Bonferroni cor-rection to compare the variables measured. We compared hydration groups using one-way ANOVA with Tukey post-hoc test. We used SPSS, version 20 for all statistical analyses. All data are reported as mean (SD). Statistical significance was set at P < 0.05.
Ethical considerationsWe conducted our study according to the guidelines laid down in the Declaration of Helsinki (as revised in 2013). We obtained ethical approval for the study from the na-tional bioethics committee (EEBK/E∏/2016/12). We ob-tained parental approval and written informed consent from the adolescents.
ResultsSubjective feelings, water intake and cognitive function With regard to urine specific gravity, the two-way repeat-ed measures ANOVA showed significant differences be-tween season (P = 0.002) and time (P = 0.046). A post-hoc Bonferroni analysis showed a higher urine specific gravi-ty in the morning in winter compared with the end of the school day (P = 0.030) and compared with the morning in the summer period (P = 0.001) (Figure 1).
Subjective feelings and water intake during the winter and summer periods in the morning and at the end of the school day are shown in Table 1. Participants felt less thirsty (P = 0.039) and less fatigued (P = 0.022) in the winter compared with the summer. Participants felt more fatigued at the end of the school day than in the morning (P = 0.031); the post-hoc tests showed that the participants felt more fatigued at the end of the school day than in the morning in winter (P = 0.043). We found no significant difference in cognitive function between seasons. However, the participants performed better on cognitive function tests at the end of the school day than in the morning in both seasons (P < 0.001). We found no significant seasonal effect for total water intake.

1036
Research article EMHJ – Vol. 26 No. 9 – 2020
However total water intake was significantly higher at the end of the school day than in the morning in both seasons (P < 0.001).
Hydration statusDuring the winter period, more adolescents were very hypohydrated and fewer adolescents were hydrated than the summer period in the morning and at the end of the school day (Table 2).
Table 3 shows the effect of hydration status on subjective feelings and cognitive function. Hydration status significantly affected concentration and alertness, with participants who were euhydrated having better scores (P < 0.05). Euhydrated participants also had lower scores for feelings of dry mouth. Cognitive function did not differ between the categories of hydration status (P > 0.05). No significant difference was found between the total water intake and the hydration status
categories in the morning and at the end of the school day, independently of season (Table 4).
DiscussionThe main finding of our study was that adolescents had a higher urine specific gravity during the winter period compared with the summer period, with no difference in total water intake between the seasons. We found a high prevalence of raised urine specific gravity in both sea-sons. In addition, hydration status had a significant neg-ative affect on perceived feelings of concentration and alertness. However, we found no association between hydration status and cognitive function.
The evaluation of seasonal variations on urine specific gravity was one of the main aims of our study. In the literature, data on seasonal variations are scarce and we aimed to add to the available knowledge. Cyprus has a Mediterranean climate with mild winters and hot summers and one would assume that the hot weather would induce more dehydration (19). Moreover, the high temperatures in Cyprus during the summer could lead to greater water loss through sweating and more thermal stress which would be expected to lead to higher fluid intake. However, our results show that adolescents in Cyprus had a higher urine specific gravity – indicating potentially more hypohydration – during the winter period than the summer period, as well as similar total water intake. Physiologically, dehydration occurs through passive exposure to a hot environment, exercise, or water restriction (20). It could be hypothesized that children were more physically active during school time in the winter, when the temperature is around 15 °C, and physical activity could decline in hot weather (21), especially in the Middle East (22). Despite this hypothesis, the etiology behind the higher urine specific gravity in the winter needs to be investigated. However, the above finding should be interpreted with caution, as urine specific gravity in both seasons indicated
Figure 1 Urine specific gravity (USG) during winter and summer in the morning and at the end of the school day. Difference in the morning in winter compared with in summer (P = 0.001). Difference in the morning in winter compared with the end of the school day (P = 0.030).
TimeWinter Summer
USG
1.04
1.035
1.03
1.025
1.02
1.015
1.01Morning End of school day
Table 1 Subjective feelings, water intake and cognitive function in winter and summer, in the morning and at the end of the school day
Variable Winter Summer Seasonal effect Time effect
Morning End of school day
Morning End of school day
P-valuea P-valuea
Subjective feeling of
Thirst 3.7 (1.8) 3.0 (2.2) 4.1 (2.3) 4.1 (3.0) 0.039 0.369
Dry mouth 3.7 (2.3) 3.4 (1.8) 3.7 (2.1) 3.8 (3.0) 0.495 0.814
Head numbness 1.5 (1.6) 1.6 (1.9) 1.8 (2.0) 2.6 (2.7) 0.062 0.222
Concentration 5.7 (1.9) 6.3 (2.5) 6.4 (2.5) 6.0 (2.5) 0.568 0.745
Fatigue 2.7 (2.2) 3.6 (2.2) 3.6 (2.5) 4.3 (2.9) 0.022 0.031
Alertness 5.5 (2.4) 6.6 (2.2) 5.8 (2.2) 5.7 (2.1) 0.372 0.150
Water intake (mL) 203.0 (199.2) 856.0 (524.7) 174.1 (175.6) 891.8 (524.8) 0.950 < 0.001
Cognitive function (no. of errors)
10 (9) 6 (5) 11 (10) 6 (5) 0.729 < 0.001
aP-values in bold indicate significant seasonal and time effects at P < 0.05.Values shown are means (standard deviations).

1037
Research article EMHJ – Vol. 26 No. 9 – 2020
slight hypohydration, and the statistical finding on urine specific gravity might not translate into a real physiological or clinical finding.
Our results clearly indicate a high prevalence of raised urine specific gravity; most of the adolescents had raised urine specific gravity in both winter and summer, in the morning and at the end of the school day, with nearly half of them having extremely high urine specific gravity and being potentially very hypohydrated. The prevalence of dehydration in children has been shown to be high in many countries regardless of the climate (9,11,12). However, data on adolescent dehydration are scarce compared with other populations (23,24). Evaluating hydration status, especially in children and adolescents, is important because dehydration has been suggested to have adverse effects on general health (4). More specifically in adolescents, acute dehydration may negatively affect brain function (13). Therefore, more studies are needed to evaluate adolescent health in relation to their hydration status.
According to our study, many adolescents arrive at school hypohydrated and remain so for the duration of the school day, both in winter and summer. These findings are in agreement with previous findings from countries where climate conditions are similar to Cyprus (9,11). One could argue that urine specific gravity measured at the
end of the school day could have been affected by food and fluid intake both at breakfast and during school hours. Research has shown that 600 mL of water can restore urine specific gravity to < 1.020 within 40 min (25). Our participants had 174 and 203 mL of water intake in the morning in summer and winter, respectively, and less than 1 L of water during the school day. This was apparently inadequate to restore urine specific gravity as evidenced by the high urine specific gravity at the end of the school day. Even though a statistically significant reduction in urine specific gravity was found at the end of the school day compared with the morning, urine specific gravity values remained high and indicated slight hypohydration status. Therefore it appears that adolescents do not drink enough to restore euhydration during their time at school.
Most people rely on the sensation of thirst to prompt them to drink fluids (26). However, even though our participants had an increased feeling of thirst during the summer period, this perception was insufficient and did not lead to higher total water intake. It has been suggested that ratings of thirst perception do not always show predictable patterns of voluntary drinking following dehydration (26); this is probably because the sense of thirst is not an adequate reflection of the water
Table 2 Distribution of participants (n = 53) according to hydration status in winter and summer, in the morning and at the end of the school day
Hydration statusa Winter Summer
Morning End of the school day
Morning End of the school day
No. No. No. No.
Euhydrated 3 9 11 15
Slightly hypohydrated 26 21 35 26Very hypohydrated 24 23 7 12
aEuhydrated: urine specific gravity < 1.020; slightly hypohydrated: urine specific gravity 1.020–1.029; very hypohydrated: urine specific gravity ≥ 1.030.
Table 3 Urine specific gravity, subjective feelings and cognitive function according to hydration status, independent of season and time
Variable Euhydrateda Slightly hypohydrateda Very hypohydrateda P-valueb
Urine specific gravity 1.013 (0.005)cd 1.025 (0.003)d 1.032 (0.002) < 0.001
Subjective feelings
Thirst 3.2 (2) 3.7 (2.7) 4.4 (2.5) 0.069
Dry mouth 2.8 (1.9)d 3.5 (2.6)d 4.5 (2.5) 0.009
Head numbness 2.2 (2.6) 1.7 (2) 2.2 (2.3) 0.246
Concentration 7.4 (2.1)cd 5.9 (2.5) 5.8 (2.4) 0.008
Fatigue 3.2 (2.4) 3.4 (2.7) 4.2 (2.7) 0.164
Alertness 6.8 (2.2)d 6.2 (2.4) 5.5 (2.2) 0.047
Cognitive function (no. of errors) 8.6 (8.0) 8.7 (8.2) 6.9 (5.9) 0.325
aEuhydrated: urine specific gravity < 1.020; slightly hypohydrated: urine specific gravity 1.020–1.029; very hypohydrated: urine specific gravity ≥ 1.030. bP-values in bold indicate significant differences between all groups at P < 0.05. cCompared with the slightly hypohydrated group. dCompared with the very hypohydrated group). Values shown are means (standard deviations).

1038
Research article EMHJ – Vol. 26 No. 9 – 2020
needs (27) and relying on thirst alone may not be enough to ensure adequate total water intake and body hydration.
Although it has been suggested that children living in hot environments are prone to chronic hypohydration (9), our data do not support or suggest chronic voluntary hypohydration. However, data from other studies suggest that day-to-day intrapersonal variability in water intake is probably quite low (28) and morning values of urine specific gravity have very good repeatability over 5 consecutive days (25). Therefore, it cannot be totally rejected that the data collected in our study may provide an indication of fluid drinking behaviour over time. Furthermore, our results can provide a stimulus for design and implementation of effective school-based interventions to promote appropriate drinking behaviour, especially in warm weather. For instance, it has been reported that children drink more water if they are allowed water bottles on their desk (29). Moreover, intervention programmes or school-based education campaigns have been found to be effective in modifying drinking behaviour and improving hydration status (23,30).
Hypohydration in our study was associated with effects on subjective feelings. Hypohydrated students felt less alert and less able to concentrate during school time. These results agree with the findings of a previous study in men (5). It has also been reported that dehydration may affect mood state with high levels of hydration linked with high levels of vigour in children (11) and adults (31).These findings are important because negative feelings may have an adverse effect on the ability of adolescents to concentrate during class time and to perform well at school.
The impairment of these important aspects of cognitive function such as concentration and alertness, due to hypohydration, indicate that they may alter cognitive performance. Previous studies in children, reported a beneficial effect of hydration on short-term memory (9,11). However, our results did not show any difference between hydrated and hypohydrated students in cognitive performance. This could be attributed either to the significant difference in group size (we had very few euhydrated students compared with many hypohydrated
students), or to a lack of sensitivity of the test used in the study. However, other studies have also shown a lack of association between hydration status and cognitive test scores (11,32). It has been suggested that the relationship between hydration levels and cognitive outcomes may not be totally linear, since hypohydration seems to affect some cognitive performance but not others (11).
We based hydration status on measured urine specific gravity. Although urine specific gravity is not the gold standard to assess hydration, it can be easily measured and is not invasive as is plasma osmolality. For practical reasons, plasma osmolality could not be measured in a school environment. Urine specific gravity data can provide useful and valuable information on hydration status in free-living conditions (33), which was pertinent to the aim of our study. The participants provided a sample of first morning urine which is well accepted for setting urine concentration threshold to assess hydration status (34). The second sample was obtained at the end of the school day before lunch. This time point has been shown to have a good diagnostic ability for detecting hypohydration in children (35).
A limitation of our study was that we did not measure physical activity during the school day. Therefore, we do not know if there were seasonal variations in physical activity levels during the school hours and how these variations could affect the hydration status of the adolescents. Another limitation is that the total water intake was based on self-reported food-and-fluid record. We do not know if the students were able to accurately self-assess, even though the procedure was fully explained.
Future research should focus on demonstrating effective measures to improve the hydration status of students during school time. Educational measures should be taken to promote proper drinking behaviour and improve hydration in adolescents both in Cyprus and internationally, which can positively affect not only concentration and school performance, but overall health as well.
Funding: This study was funded by the European Hydra-tion Institute.
Competing interests: None declared.
Table 4 Total water intake according to hydration status, independently of season
Time of day Total water intake (mL) P-valueb
Euhydrateda Slightly hypohydrateda Very hypohydrateda
Morning 299 (338) 176 (155) 165 (147) 0.163
End of the school day 1119 (667) 834 (490) 758 (402) 0.086aEuhydrated: urine specific gravity < 1.020; slightly hypohydrated: urine specific gravity 1.020–1.029; very hypohydrated: urine specific gravity ≥ 1.030. bP-values are for differences between all groups. Values shown are means (standard deviations) for total water intake.

1039
Research article EMHJ – Vol. 26 No. 9 – 2020
References1. Jéquier E, Constant F. Water as an essential nutrient: the physiological basis of hydration. Eur J Clin Nutr. 2010;64(2):115–23.
https://doi.org/10.1038/ejcn.2009.111
2. Malisova O, Athanasatou A, Pepa A, Husemann M, Domnik K, Braun H, et al. Water intake and hydration indices in healthy uropean adults: The European Hydration Research Study (EHRS). Nutrients. 2016;8(4):204. https://doi.org/10.3390/nu8040204
3. Sawka MN, Burke LM, Eichner ER, Maughan RJ, Montain SJ, Stachenfeld NS. American College of Sports Medicine position stand. Exercise and fluid replacement. Med Sci Sports Exerc. 2007;39(2):377–90. https://doi.org/10.1249/mss.0b013e31802ca597
Variations saisonnières dans la prévalence de l’hypohydratation chez les adolescents au cours de la journée d’école à ChypreRésuméContexte : Il existe peu de données factuelles sur l’état d’hydratation des adolescents et ses variations au cours des saisons et de la journée.Objectifs : La présente étude avait pour objectif d’évaluer les variations dans l’état d’hydratation et les apports en eau chez les adolescents à Chypre, entre l’hiver et l’été et entre le matin et la fin de la journée d’école. Les ressentis subjectifs et les fonctions cognitives liés à l’hypohydratation ont également été examinés.Méthodes : 53 adolescents (39 garçons) d’âge moyen 15,1 ans (écart type : 1,9) ont été inclus dans l’étude. Les participants ont fourni des échantillons d’urine, passé un test de fonctions cognitives et rempli un questionnaire sur leurs ressentis subjectifs, à l’arrivée à l’école et à la fin de la journée. Les données ont été recueillies en hiver et en été en 2016-2017. Le niveau d’hydratation a été déterminé par la mesure de la densité de l’urine. Les fonctions cognitives ont été évaluées au moyen d’un test de barrage de symboles. Les apports totaux en eau ont été estimés à partir d’un journal où les participants notaient leur prise d’aliments et de liquides.Résultats : Une forte prévalence de l’hypohydratation, allant de 72 % à 94 %, a été observée aux deux saisons. L’hypohydratation allait de pair avec des ressentis de concentration et de vigilance diminuées (p = 0,008 et p = 0,047, respectivement). La densité de l’urine chez les adolescents était significativement plus élevée en hiver qu’en été : 1,026 (écart type : 0,007) contre 1,023 (écart type : 0,007), respectivement (p = 0,002). L’état d’hydratation n’était corrélé ni avec les fonctions cognitives, ni avec les apports totaux en eau.Conclusions : Les liens entre la forte prévalence de l’hypohydratation et les ressentis de diminution de la concentration et de la vigilance chez les adolescents portent à croire que des mesures sont nécessaires en milieu scolaire afin d’encourager des apports en liquides satisfaisants et d’améliorer l’hydratation.
انتشار اجلفاف يف صفوف املراهقني أثناء اليوم الدرايس يف قربص: التغريات املوسميةبينولبي ستافرينو، كريستفورس جيانكي، إليني آندرو، جورج آفاميس
اخلالصةاخللفية: ال يوجد سوى قدر قليل من الدالئل بشأن حالة اإلماهة يف املراهقني والتغريات املوسمية والزمنية.
األهداف: هدفت هذه الدراسة إىل تقييم التغريات يف حالة اإلماهة وإمجايل مدخول املاء للمراهقني يف قربص يف الفرتتني بني الشتاء والصيف، وبني الصباح وهناية اليوم الدرايس. كام خضعت املشاعر الذاتية والوظيفة املعرفية املرتبطة باجلفاف للدراسة والفحص.
15.1 )1.9( عام. وقدم املشاركون طرق البحث: شملت الدراسة ثالثة ومخسني مراهقا )39 من الفتيان( بمتوسط عمري )انحراف معياري( الدرايس. اليوم هناية ويف املدرسة إىل الوصول عند الذاتية املشاعر استبيان حول وأجابوا عن املعرفية، الوظيفة الختبار وخضعوا بول، عينات ومجعت البيانات يف موسمي الشتاء والصيف يف الفرتة بني عامي 2017-2016. كام حتدد مستوى اإلماهة عن طريق الثقل النوعي للبول، وقيمت
الوظيفة املعرفية باستخدام اختبار إلغاء الرموز. وقدر إمجايل مدخول املاء من سجل األغذية والسوائل الذي احتفظ به املشاركون.النتائج: تبني ارتفاع نسبة انتشار اجلفاف يف كال املوسمني بام يرتاوح بني 72% إىل 94%. وارتبطت اإلماهة بنسبة أقل من الرتكيز واالنتباه )القيمة االحتاملية = 0.008، والقيمة االحتاملية = 0.047 عىل التوايل(. كام كان متوسط الثقل النوعي للبول أعىل بنسبة كبرية لدى املراهقني يف الشتاء عنه يف الصيف: 1.026 )انحراف معياري 0.007( مقابل 1.023 )انحراف معياري 0.007(، عىل التوايل )القيمة االحتاملية = 0.002(. ومل تكن
حالة اإلماهة مرتبطة بالوظيفة املعرفية أو إمجايل مدخول املاء.االستنتاجات: يتبني من ارتفاع نسبة انتشار اجلفاف والشعور املرتبط به من انخفاض الرتكيز واالنتباه يف املراهقني رضورة اختاذ تدابري تثقيفية لتعزيز
السلوكيات اجليدة لرشب املاء وحتسني اإلماهة.

1040
Research article EMHJ – Vol. 26 No. 9 – 2020
4. Maughan RJ. Impact of mild dehydration on wellness and on exercise performance. Eur J Clin Nutr. 2003;57(S2):S19–23. https://doi.org/10.1038/sj.ejcn.1601897
5. Shirreffs SM, Merson SJ, Fraser SM, Archer DT. The effects of fluid restriction on hydration status and subjective feelings in man. Br J Nutr. 2004 ;91(6):951–8. https://doi.org/10.1079/BJN20041149
6. Pross N, Demazières A, Girard N, Barnouin R, Santoro F, Chevillotte E, et al. Influence of progressive fluid restriction on mood and physiological markers of dehydration in women. Br J Nutr. 2013;109(02):313–21. https://doi.org/10.1017/S0007114512001080
7. Wittbrodt MT, Millard-Stafford M. Dehydration impairs cognitive performance. Med Sci Sport Exerc. 2018;50(11):2360–8. http//:-doi.org/10.1249/MSS.0000000000001682
8. Piil JF, Lundbye-Jensen J, Christiansen L, Ioannou L, Tsoutsoubi L, Dallas CN, et al. High prevalence of hypohydration in oc-cupations with heat stress – perspectives for performance in combined cognitive and motor tasks. PLoS One. 2018;13(10):1–20. http//:doi.org/10.1371/journal.pone.0205321
9. Bar-David Y, Urkin J, Kozminsky E. The effect of voluntary dehydration on cognitive functions of elementary school children. Acta Paediatr. 2005;94(11):1667–73. http//:doi.org/10.1080/08035250500254670
10. Edmonds CJ, Burford D. Should children drink more water? The effects of drinking water on cognition in children. Appetite. 2009;52(3):776–9. http//:doi.org/10.1016/j.appet.2009.02.010
11. Fadda R, Rapinett G, Grathwohl D, Parisi M, Fanari R, Calò CM, et al. Effects of drinking supplementary water at school on cog-nitive performance in children. Appetite. 2012;59(3):730–7. http//:doi.org/10.1016/j.appet.2012.07.005
12. Bonnet F, Lepicard EM, Cathrin L, Letellier C, Constant F, Hawili N, et al. French children start their school day with a hydration deficit. Ann Nutr Metab. 2012;60(4):257–63. http//:doi.org/ 10.1159/000337939
13. Kempton MJ, Ettinger U, Foster R, Williams SCR, Calvert GA, Hampshire A, et al. Dehydration affects brain structure and func-tion in healthy adolescents. Hum Brain Mapp. 2011;32(1):71–9. http//:doi.org/ 10.1002/hbm.20999
14. Maughan RJ, Watson P, Shirreffs SM. Implications of active lifestyles and environmental factors for water needs and conse-quences of failure to meet those needs. Nutr Rev. 2015;73 (Suppl 2):130–40. http//:doi.org/ 10.1093/nutrit/nuv051
15. Edmonds CJ, Crosbie L, Fatima F, Hussain M, Jacob N, Gardner M. Dose–response effects of water supplementation on cogni-tive performance and mood in children and adults. Appetite. 2017;108:464–70. http//:doi.org/ 10.1016/j.appet.2016.11.011
16. Aphamis G, Stavrinou PS, Andreou E, Giannaki CD. Hydration status, total water intake and subjective feelings of adoles-cents living in a hot environment, during a typical school day. Int J Adolesc Med Health. 2019;0(0):2–8. http//:doi.org/10.1515/ijamh-2018-0230 .
17. Flint A, Raben A, Blundell JE, Astrup A. Reproducibility, power and validity of visual analogue scales in assessment of appetite sensations in single test meal studies. Int J Obes Relat Metab Disord. 2000;24(1):38–48. http//:doi.org/10.1038/sj.ijo.0801083
18. Lowery N, Ragland JD, Gur RC, Gur RE, Moberg PJ. Normative data for the symbol cancellation test in young healthy adults. Appl Neuropsychol. 2004;11(4):218–21. http//:doi.org/ 10.1207/s15324826an1104_8
19. Malisova O, Bountziouka V, Panagiotakos DΒ, Zampelas A, Kapsokefalou M. Evaluation of seasonality on total water intake, water loss and water balance in the general population in Greece. J Hum Nutr Diet. 2013;26(SUPPL.1):90–6. http//:doi.org/ 10.1111/jhn.12077
20. Armstrong L, Johnson E, Armstrong LE, Johnson EC. Water intake, water balance, and the elusive daily water requirement. Nu-trients. 2018;10(12):1928. http//:doi.org/ 10.3390/nu10121928
21. Henry CJK, Lightowler HJ, Al-Hourani HM. Physical activity and levels of inactivity in adolescent females ages 11–16 years in the United Arab Emirates. Am J Hum Biol. 2004;16(3):346–53. http//:doi.org/ 10.1002/ajhb.20022
22. Al-Mohannadi AS, Moahhed GA. The effect of weather conditions on the seasonal variation of physical activity. Aspetar Sport Med J. 2015;4:228–31.
23. Carter JM, Loney T, Blacker SD, Nicholson GF, Wilkinson DM. Hydration status of Arabic adolescents and young men: measure-ment, evaluation, and a school-based initiative to improve drinking behavior. Int J Sport Nutr Exerc Metab. 2012;22(4):257–66. http//:doi.org/ 10.1123/ijsnem.22.4.257
24. Gordon RE, Kassier SM, Biggs C. Hydration status and fluid intake of urban, underprivileged South African male adolescent soccer players during training. J Int Soc Sports Nutr. 2015;12(1):21. http//:doi.org/ 10.1186/s12970-015-0080-0
25. Logan-Sprenger HM, Spriet LL. The acute effects of fluid intake on urine specific gravity and fluid retention in a mildly dehy-drated state. J Strength Cond Res. 2013;27(4):1002–8. http//:doi.org/ 10.1519/JSC.0b013e31826052c7
26. Millard-Stafford M, Wendland DM, O’Dea NK, Norman TL. Thirst and hydration status in everyday life. Nutr Rev. 2012;70 Suppl 2:S147-51. http//:doi.org/ 10.1111/j.1753-4887.2012.00527.x
27. Arnaoutis G, Kotsis YP, Tsekouras YE, Makrillos M, Bardis CN, Kavouras SA. Ad libitum fluid intake does not prevent dehydra-tion in suboptimally hydrated young soccer players during a training session of a summer camp. Int J Sport Nutr Exerc Metab. 2013;23(3):245–51. http//:doi.org/ 10.1123/ijsnem.23.3.245
28. Gibson S, Shirreffs SM. Beverage consumption habits “24/7” among British adults: association with total water intake and ener-gy intake. Nutr J. 2013;12(42):9. http//:doi.org/ 10.1186/1475-2891-12-9

1041
Research article EMHJ – Vol. 26 No. 9 – 2020
29. Kaushik A, Mullee MA, Bryant TN, Hill CM. A study of the association between children’s access to drinking water in pri-mary schools and their fluid intake: Can water be “cool” in school? Child Care Health Dev. 2007;33(4):409–15. http//:doi.org/ 10.1111/j.1365-2214.2006.00721.x
30. Kavouras SA, Arnaoutis G, Makrillos M, Garagouni C, Nikolaou E, Chira O, et al. Educational intervention on water intake im-proves hydration status and enhances exercise performance in athletic youth. Scand J Med Sci Sport. 2012;22(5):684–9. http//:doi.org/ 10.1111/j.1600-0838.2011.01296.x
31. D’anci KE, Vibhakar A, Kanter JH, Mahoney CR, Taylor HA. Voluntary dehydration and cognitive performance in trained college athletes. Percept Mot Skills. 2009;109(1):251–69. http//:doi.org/ 10.2466/PMS.109.1.251-269
32. Trinies V, Chard AN, Mateo T, Freeman MC. Effects of water provision and hydration on cognitive function among prima-ry-school pupils in Zambia: a randomized trial. PLoS One. 2016;11(3):e0150071. http//:doi.org/ 10.1371/journal.pone.0150071
33. Perrier E, Vergne S, Klein A, Poupin M, Rondeau P, Le Bellego L, et al. Hydration biomarkers in free-living adults with different levels of habitual fluid consumption. Br J Nutr. 2013;109(9):1678–87. http//:doi.org/ 10.1017/S0007114512003601
34. Cheuvront SN, Kenefick RW, Zambraski EJ. Spot Urine concentrations should not be used for hydration assessment: a method-ology review. Int J Sport Nutr Exerc Metab. 2015;25(3):293–7. http//:doi.org/ 10.1123/ijsnem.2014-0138
35. Kavouras SA, Johnson EC, Bougatsas D, Arnaoutis G, Panagiotakos DB, Perrier E, et al. Validation of a urine color scale for assess-ment of urine osmolality in healthy children. Eur J Nutr. 2016;55(3):907–15. http//:doi.org/ 10.1038/ejcn.2016.218

1042
Research article EMHJ – Vol. 26 No. 9 – 2020
Medical management of pneumonia in children aged under 5 years in Alexandria, Egypt: mothers’ perspectiveNoha Fadl,1 Ayat Ashour1 and Yasmine Muhammed1
1Family Health Department, High Institute of Public Health, Alexandria University, Alexandria, Egypt (Correspondence to: [email protected]).
AbstractBackground: Pneumonia is among the top causes of morbidity and mortality among the under-fives worldwide. Aims: A cross-sectional study was conducted to assess health-seeking behaviour and first medical management of pneu-monia among children aged under 5 years in Alexandria, Egypt from the mothers’ perspectives. Methods: Using a pre-designed questionnaire, we interviewed 507 mothers of pneumonic children aged under 5 years who had been admitted at 4 governmental children’s hospitals. The study was conducted during August–November 2017. Results: We found that 57.2% of children received home treatment before seeking medical advice. Around 26% of mothers waited ≥ 2 days before seeking medical advice; insufficient knowledge about the disease was their main contention (89%). Factors significantly associated with the delay were: rural residence (P = 0.006); low income (P = 0.002); home treatment given before seeking medical advice (P < 0.001) and previous episodes of pneumonia (P = 0.002). Diagnosis of pneumonia had not been made by more than half of the first consulted sources (52.7%). Conclusion: There is an urgent need to improve mothers’ knowledge and train physicians for appropriate management of pneumonia in children under 5 years.Keywords: pneumonia, management, under-fives, EgyptCitation: Fadl N; Ashour A; Muhammed Y. Medical management of pneumonia in children aged under 5 years in Alexandria, Egypt: mothers’ perspec-tive. East Mediterr Health J. 2020;26(9):1042-1051. https://doi.org/10.26719/emhj.20.013Received: 28/10/18; accepted: 12/05/19Copyright © World Health Organization (WHO) 2020. Open Access. Some rights reserved. This work is available under the CC BY-NC-SA 3.0 IGO license (https://creativecommons.org/licenses/by-nc-sa/3.0/igo)
IntroductionAcute respiratory tract infection (ARI) is one of the lead-ing causes of morbidity and mortality among children under 5 years in developing countries. ARI is classified into upper and lower respiratory tract infections (1). Pneumonia, a common and severe lower respiratory tract infection, is recognized as “the forgotten killer of children” (2), killing 1.1–1.4 million children every year and accounting for 17–19% of all deaths among children under 5 years of age (3). Most of these deaths occur in low- and middle-income countries (4). A recent systemat-ic review indicated 0.22 pneumonia episodes per child–year in low- and middle-income countries, with nearly 1 in 8 cases progressing to severe disease (5).
In the Eastern Mediterranean Region (EMR), reduction of under‐five mortality remains an unfinished agenda, with 923 000 children under‐five year still dying every year in the Region, with pneumonia as the major killer (20%) (6). The Child Health Epidemiology Reference Group (CHERG) estimated 0.28 episodes per child-year for the EMR. These estimates translate into about 20 million cases of childhood pneumonia each year, with approximately 10% of cases requiring hospitalization (7). In Egypt, children under 5 years account for nearly 13.4% of the total population (8), and pneumonia constitutes 19% of under-five mortality (9). The incidence of pneumonia
in Egypt has been estimated at 0.11–0.20 pneumonia episodes per child-year (7).
Given the frequency of this illness among children under 5 years, the care that must be provided for them imposes a significant burden on parents and health services. In addition, the care provided by the family and the health services is not always the most efficient way to treat this illness (1). Effective antibiotic treatment for pneumonia exists, thus timely recognition of the signs and symptoms by primary care givers and subsequent care-seeking for treatment from appropriate providers can prevent many of these deaths (10). Yet, worldwide, only 3 in 5 children receive the necessary help and care (11).
According to the Egypt Demographic and Health Survey 2014, 68% of children under 5 years with suspected pneumonia sought care from a health provider (8). This implies that many children with potential pneumonia remain untreated (12). Therefore, it is imperative to identify barriers in seeking and receiving the appropriate health care to manage children under 5 years with pneumonia. The aim of the current study was to address mothers’/primary care givers’ health-seeking behaviours for children under 5 years with suspected pneumonia and first medical management received from the mothers’ perspective.

1043
Research article EMHJ – Vol. 26 No. 9 – 2020
MethodsStudy designA cross-sectional descriptive study design was used. The study was conducted over a 4-month period, August–No-vember 2017. The study was conducted in the inpatient departments of the following hospitals in Alexandria; El-Shatby Univerity Hospital, Al-Raml Paediatric Hos-pital, Al-Anfoshy Paediatric Hospital and Fawzy Moaz General Hospital. The sampled hospitals are the main government hospitals providing low-cost health servic-es to the paediatric population from Alexandria and sur-rounding rural areas.
Study populationThe study population included mothers/primary care givers of all children aged 2–59 months with estab-lished diagnosis of pneumonia admitted to the sampled hospitals. Hospital records were checked first to ensure that pneumonia was diagnosed according to WHO di-agnostic criteria (i.e. cough and/or difficulty breathing with at least one of the following signs: fast breathing, ≥ 50 breaths/minute in a child aged 2–11 months, ≥ 40 breaths/minute in a child aged 12–59 months; or lower chest indrawing) (13).
Exclusion criteria were:
• children with confirmed diagnosis of congenital mal-formation, tuberculosis, HIV, cardiac or other chronic conditions that might be complicated by pneumonia;
• children with reported cough because of a recent his-tory of aspiration of a liquid or a foreign body;
• mothers or primary care givers refusing to participate in the study.
Sample sizeBased on a prevalence rate of 13.6% for ARIs among chil-dren under 5 years in Egypt (8) and using degree of pre-cision 5%, the minimum required sample size was 362. The sample size was calculated using EpiInfo, version 7. All sampled hospitals were visited at least twice weekly to cover all cases of pneumonia during the study period. The total sample size was 507 cases fulfilling the prede-termined inclusion criteria. No one refused to participate in the present study and only 10 children were not accom-panied by their mothers/primary care givers to complete the questionnaire; these were excluded from the study.
Data collectionMothers/primary care givers were interviewed by trained data collectors using a pre-designed question-naire to collect data on sociodemographic characteristics, child’s health status, mother’s knowledge, health-seeking behaviour and first management received before hospi-tal admission from the mother’s perspective. The ques-tionnaire was designed based on data from other similar studies (10,14,15). For content validity, the questionnaire was revised by an expert paediatrician. Then, the ques-tionnaire was translated from English to Arabic by
trained bilingual staff. A pilot test (n = 10) was conducted on a different group to assure clarity of the questions and check for language errors. Digital scales appropriate for the child age were used for weight measurement.
Definition of measured variables• Diagnosis of pneumonia was based on hospital re-
cords in which pneumonia was diagnosed according to WHO criteria (13) with or without radiological findings.
• Child’s nutritional status was assessed according to WHO child growth standards weight for age. Chil-dren below the 5th percentile were categorized as un-derweight; those plotted above 95th percentile were considered to be overweight (16).
• Exclusive breastfeeding was defined as no other food or drink, not even water, except breast milk (includ-ing milk expressed or from a wet nurse) for the first 6 months of life, but allowing the infant to receive oral rehydration salts, drops and syrups (vitamins, miner-als and medicines) (17).
• Inappropriate health- seeking behaviours includ-ed self-administered treatment, delay in seeking medical advice, seeking advice from inappropriate providers, and noncompliance with the prescribed treatment. Appropriate providers included govern-ment and private health providers, but not traditional healers and pharmacists.
• Delay in seeking medical advice was considered if mother/primary care giver of a pneumonic child sought medical help ≥ 2 days after onset of symp-toms.
Statistical analysisCollected data was reviewed for completeness and accu-racy, coded, computed, cleaned and analysed using SPSS, version 21.0. Descriptive statistics (mean and standard deviation for normally distributed data and median for skewed data) were used for quantitative data and fre-quency for qualitative data. The Chi squared test was used to test for association in qualitative variables while independent t-test was used for quantitative variables. Statistical significance was set at P < 0.05.
Ethical considerationsBefore recruiting participants for the study, approvals were obtained from the ethics committee of the High In-stitute of Public Health, the director of El-Shatby Univer-sity Hospital and the Ministry of Health and Population. After explaining the purpose of the study, informed con-sent was obtained from every mother/primary care giver in her own right and on behalf of her child. Participation in the study was entirely voluntary. All information was handled with strict confidentiality.
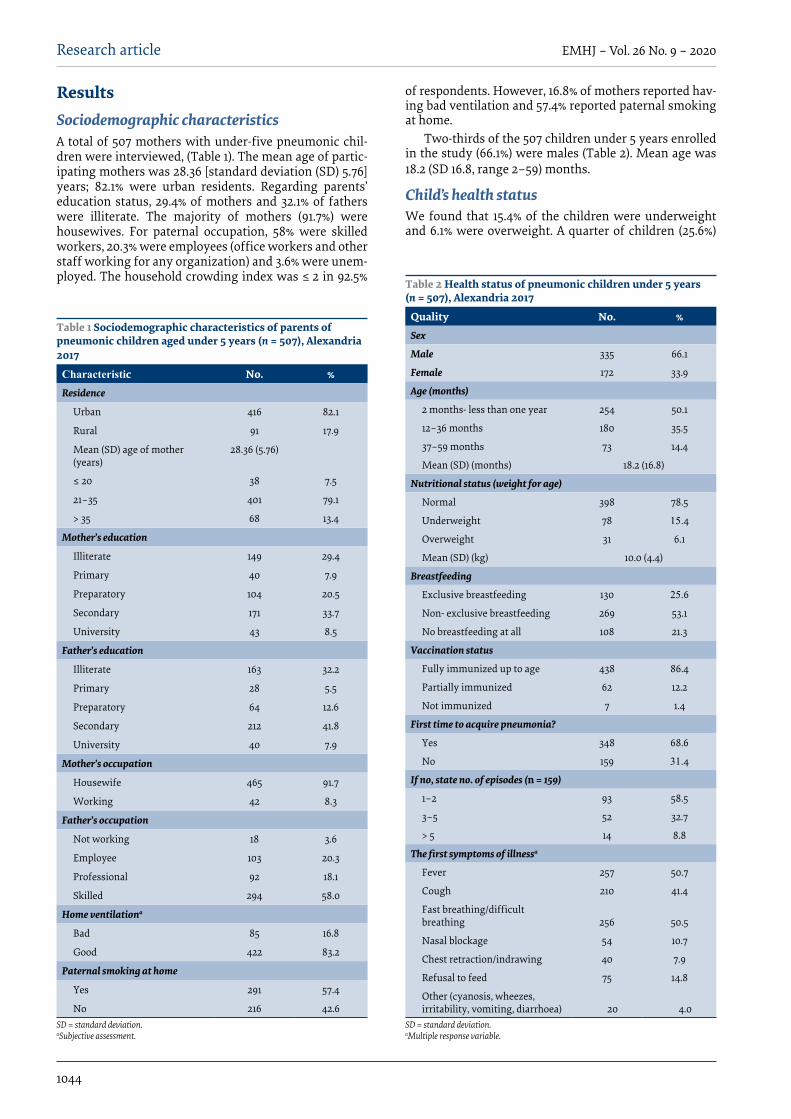
1044
Research article EMHJ – Vol. 26 No. 9 – 2020
Results Sociodemographic characteristicsA total of 507 mothers with under-five pneumonic chil-dren were interviewed, (Table 1). The mean age of partic-ipating mothers was 28.36 [standard deviation (SD) 5.76] years; 82.1% were urban residents. Regarding parents’ education status, 29.4% of mothers and 32.1% of fathers were illiterate. The majority of mothers (91.7%) were housewives. For paternal occupation, 58% were skilled workers, 20.3% were employees (office workers and other staff working for any organization) and 3.6% were unem-ployed. The household crowding index was ≤ 2 in 92.5%
Table 1 Sociodemographic characteristics of parents of pneumonic children aged under 5 years (n = 507), Alexandria 2017
Characteristic No. %Residence
Urban 416 82.1
Rural 91 17.9
Mean (SD) age of mother (years)
28.36 (5.76)
≤ 20 38 7.5
21–35 401 79.1
> 35 68 13.4
Mother’s education
Illiterate 149 29.4
Primary 40 7.9
Preparatory 104 20.5
Secondary 171 33.7
University 43 8.5
Father’s education
Illiterate 163 32.2
Primary 28 5.5
Preparatory 64 12.6
Secondary 212 41.8
University 40 7.9
Mother’s occupation
Housewife 465 91.7
Working 42 8.3
Father’s occupation
Not working 18 3.6
Employee 103 20.3
Professional 92 18.1
Skilled 294 58.0
Home ventilationa
Bad 85 16.8
Good 422 83.2
Paternal smoking at home
Yes 291 57.4
No 216 42.6SD = standard deviation. aSubjective assessment.
Table 2 Health status of pneumonic children under 5 years (n = 507), Alexandria 2017
Quality No. %Sex
Male 335 66.1
Female 172 33.9
Age (months)
2 months- less than one year 254 50.1
12–36 months 180 35.5
37–59 months 73 14.4
Mean (SD) (months) 18.2 (16.8)
Nutritional status (weight for age)
Normal 398 78.5
Underweight 78 15.4
Overweight 31 6.1
Mean (SD) (kg) 10.0 (4.4)
Breastfeeding
Exclusive breastfeeding 130 25.6
Non- exclusive breastfeeding 269 53.1
No breastfeeding at all 108 21.3
Vaccination status
Fully immunized up to age 438 86.4
Partially immunized 62 12.2
Not immunized 7 1.4
First time to acquire pneumonia?
Yes 348 68.6
No 159 31.4
If no, state no. of episodes (n = 159)
1–2 93 58.5
3–5 52 32.7
> 5 14 8.8
The first symptoms of illnessa
Fever 257 50.7
Cough 210 41.4
Fast breathing/difficult breathing 256 50.5
Nasal blockage 54 10.7
Chest retraction/indrawing 40 7.9
Refusal to feed 75 14.8
Other (cyanosis, wheezes, irritability, vomiting, diarrhoea) 20 4.0
SD = standard deviation. aMultiple response variable.
of respondents. However, 16.8% of mothers reported hav-ing bad ventilation and 57.4% reported paternal smoking at home.
Two-thirds of the 507 children under 5 years enrolled in the study (66.1%) were males (Table 2). Mean age was 18.2 (SD 16.8, range 2–59) months.
Child’s health statusWe found that 15.4% of the children were underweight and 6.1% were overweight. A quarter of children (25.6%)

1045
Research article EMHJ – Vol. 26 No. 9 – 2020
were exclusively breastfed, and the majority (86.4%) were vaccinated up to their age.
Around one-third of the children in the study had acquired pneumonia previously; 32.7% of these had experienced 3–5 episodes and 8.8% had experienced > 5 episodes (Table 2). About half of the mothers reported fast breathing/difficult breathing and fever as the first symptoms of illness followed by cough (41.1%) and refusal to feed (14.8%).
Knowledge and health-seeking behaviour of mothers About half of the mothers (49.3%) had heard of pneumo-nia before the onset of their children’s recent pneumonia (Table 3); in 60.8% of those who knew about pneumonia, this was because of their previous experience with their child. Pneumonia was perceived as a serious illness by nearly 70% of mothers. The most commonly recognized symptoms reported by the mothers were fast breathing/difficult breathing, fever and cough (46.7%, 21.1% and 20.0% respectively). Weather changes/cold weather, poor immunity and smoking were thought to be responsible for pneumonia by 24.1%, 17.0% and 10.8% of the mothers, respectively. Only 12.0% stated that infectious agents caused pneumonia. On the other hand, about 38% had no idea about causes.
On reviewing the mothers’ health-seeking behaviour, 57.2% of the children were given home treatment before seeking medical advice. Antipyretics, cough-relieving drugs and herbs were the most frequently given medications (39.6%, 19.7% and 13.0% respectively) (Table 3). Antibiotics were given by only 4.9% of the mothers. With reference to timing of the first consultation, 26.8% of mothers waited for ≥ 2 days before seeking medical advice. Insufficient knowledge about the signs and symptoms of pneumonia/waiting until their child got better (89.0%) was the main stated reason for delay, followed by cost of health services/transportation (17.6%), unavailability of a nearby health facility (10.3%), inappropriate clinic appointments (7.3%) and previous negative experiences (6.6%).
Sociodemographic characteristics, mother’s health-seeking behaviours and child’s health status were compared with care-seeking timing for pneumonia. Factors that were significantly associated with delay in seeking medical care for suspected pneumonia were: living in a rural area (P = 0.006); low income (P = 0.002); treatment given at home before seeking medical advice (P < 0.001) and repeated episodes of pneumonia (P = 0.002) (Table 4).
Government hospitals/general health care units were the first source consulted by 62.7% of the mothers followed by private hospitals/clinics (35.1%) (Table 3). Only 2.2% sought help from inappropriate providers (pharmacists). In terms of mothers’ compliance to the first consulted source, the majority of mothers reported high compliance practices, only 5.6% of were not compliant with the prescribed treatment (Table 5).
Table 3 Knowledge and health-seeking behaviour of mothers of pneumonic children under 5 years (n = 507), Alexandria 2017
Knowledge and health-seeking behaviour No. %Previous knowledge about pneumonia
Yes 250 49.3
No 257 50.7
If yes, what was their source of knowledge?a (n = 250)
Previous experience 152 60.8
Relatives/neighbourhoods 89 35.6
TV/media 11 4.4
Perceived seriousness of pneumonia
I don’t know 91 18.0
Not dangerous 70 13.8
Dangerous 346 68.2
Knowledge of pneumonia symptomsa
I don’t know 197 38.8
Fast breathing/difficult breathing 237 46.7
Fever 107 21.1
Cough/common cold 101 20.0
Other (cyanosis, vomiting) 15 3.0
Knowledge of possible causes of pneumoniaa
I don’t know 195 38.5
Malnutrition 14 2.8
Air pollution 42 8.3
Smoking 55 10.8
Overcrowding 24 4.7
Poor immunity 86 17.0
Weather changes/cold weather 122 24.1
Infection 61 12.0
Other (ice cream, cold water, neglect, perfumes) 27 5.3
Treatment given at home before seeking medical helpa
None 217 42.8
Antipyretic 201 39.6
Antibiotic 25 4.9
Herbs 66 13.0
Cough-relief drugs 100 19.7
Other (bronchodilator, antihistaminic) 37 7.3
Timing of first consultation
First day of child illness 371 73.2
2–3 days after child illness 105 20.7
4–5 days after child illness 21 4.1
6 days or more after child illness 10 2.0
Causes of delay in seeking medical advicea (n = 136)
Insufficient knowledge of signs and symptoms of pneumonia/waiting until child got better
121 89.0
Cost of health services/transportation 24 17.6
Unavailability of a nearby health facility 14 10.3
Clinic appointments are not appropriate 10 7.3
Previous negative experience 9 6.6

1046
Research article EMHJ – Vol. 26 No. 9 – 2020
First medical management of pneumonia from mothers’ perspective Diagnosis of pneumonia had not been made by more than half of the first consulted sources (52.7%). Around 60% of the first consulted sources did not request inves-
tigation (Table 5). Chest X-ray was the most common re-quest (37.1%) followed by blood tests (17.5%).
In terms of treatment prescribed by the first consulted source, two-thirds of the children (63.7%) received home treatment: antipyretics, antibiotics and cough-relieving drugs were the most commonly prescribed treatments (78.0%, 70.0% and 53.9% respectively) (Table 5). About one-quarter of the children (23.5%) were admitted directly to the hospitals in our sample and received hospital treatment; for 11% of the sample, the first consulted source referred them to a specialized hospital without prescribing treatment. Only 1.8% did not receive any treatment at all. The majority of mothers reported high compliance practices: only 5.6% did not comply with the prescribed treatment.
DiscussionThis study highlighted mothers’ perceived barriers in seeking and receiving the proper management of their pneumonic children. We found that nearly one-third of
Knowledge and health-seeking behaviour No. %Social norms 2 1.5
Others 6 4.4
Source of first consultation
Government hospital/general health care unit 318 62.7
Private hospital/private clinic 178 35.1
Pharmacy 11 2.2aMultiple response variable.
Table 3 Knowledge and health-seeking behaviour of mothers of pneumonic children under 5 years (n = 507), Alexandria 2017 (continued)
Table 4 Factors associated with mother’s health care-seeking timing, Alexandria 2017
Independent variable Seeking medical advice after first day of illness (n = 371)
Delay in seeking medical advice (n = 136)
P-value
Mean (SD) Mean (SD)Age of mother (years) 28.44 (5.97) 28.21 (5.48) 0.682
Age of child (months) 18.93 (17.32) 16.34 (15.24) 0.124
Child order 1.94 (0.73) 2.01 (0.71) 0.303
No. % No. %
Sex of child 0.277
Male 240 71.6 95 28.4
Female 131 76.2 41 23.8
Place of residence 0.006
Urban 315 75.7 101 24.3
Rural 56 61.5 35 38.5
Income 0.002
Not enough & borrow 84 64.6 46 35.4
Not enough 57 67.8 27 32.2
Enough only 218 79.0 58 21.0
Enough and saving 12 70.5 5 29.5
Mother’s education 0.358
Illiterate 112 75.2 37 24.8
Primary 24 60.0 16 40.0
Preparatory 75 72.1 29 27.9
Secondary 129 75.4 42 24.6
University 31 72.1 12 27.9
Treatment given at home before seeking medical help < 0.001
No 190 87.6 27 12.4
Yes 181 62.4 109 37.6
First time to have pneumonia? 0.002
No 102 64.2 57 35.8
Yes 269 77.3 79 22.7
SD = standard deviation.

1047
Research article EMHJ – Vol. 26 No. 9 – 2020
mothers had no idea about the symptoms, causes and seriousness of pneumonia. This lack of knowledge and poor perceived seriousness may be related to the high number of mothers without any formal education or any awareness about pneumonia. In accordance with our findings, poor knowledge about pneumonia (71%) has been reported in another developing country, Bangla-desh (18). A UNICEF/WHO report showed that only 1 in 5 care givers knew the 2 tell-tale or indicative symptoms of pneumonia: fast breathing and difficult breathing (2).
More than half of the mothers were reluctant to seek medical advice and they tended to give treatment at home before seeking medical advice, which agrees with findings that health care in developing countries occurs at home (19). Most of the home treatments were related to symptomatic relief (antipyretics, cough relief drugs, herbs), which can be beneficial are but not sufficient for improving health outcomes in pneumonic children. It may imply poor perceived seriousness of the disease among the mothers.
Unexpectedly, antibiotics were used before seeking medical help by only 5% of the mothers in our study.
Mothers were aware of antibiotics but expressed limited experience of handling these drugs at home without a prescription from a health provider, especially during this critical young age. This might be related to the large number of mothers with limited income, low education level and poor knowledge. However, home treatment with antibiotics has been reported in a variety of previous studies (14,20).
Reviewing health care-seeking timing, nearly one-quarter of the mothers reported a delay in seeking medical care. Previous studies have reported delay in the decision to seek care of 2 or 3 days (21,22). In the present study, the main claim for delay was mothers’ insufficient knowledge about signs and symptoms of pneumonia. Similarly, Hill et al. report that, in addition to poor maternal recognition, health beliefs may also act as barriers to care-seeking for childhood illnesses; for example, some illnesses are categorized as “not for hospital”, and past experience with similar illnesses can motivate mothers to play a waiting game to see if the illness subsides on its own (23).
Table 5 Medical management of pneumonia: mothers’ perspective (n = 507), Alexandria 2017
Medical management of pneumonia No. %Diagnosis by the first consulted source
Pneumonia 240 47.3
Common cold 202 39.9
Others (asthma, bronchiolitis) 65 12.8
Investigation requested by the first consulted sourcea
No 305 60.1
Chest X-ray 188 37.1
Blood test 89 17.5
Other 4 0.8
Type of medical treatment received at the first consulted source
Home treatment 323 63.7
Directly admitted to hospital and received hospital treatment (the study setting was their first consulted source)
119 23.5
Referral to specialized hospital without treatment 56 11.0
No prescribed treatment 9 1.8
Prescribed home treatment (n = 323)a
Antipyretics 252 78.0
Antibioticsb 226 70.0
Cough-relieving drugs 174 53.9
Fluid intake 11 3.4
Others (anti-histaminic, bronchodilator, nebulizer) 69 21.4
Explanation of prescribed treatment by the first consulted source (n = 323)
Yes 302 93.5
No 21 6.5
Mothers’ compliance with prescribed treatment (n = 323)
Yes 305 94.4
No 18 5.6aMultiple response variable. bMedian duration of prescribed antibiotics = 3 days.

1048
Research article EMHJ – Vol. 26 No. 9 – 2020
It was further noted that mothers from rural areas or those with low incomes were more likely to postpone visiting health professionals. This may be explained by poorer accessibility to health care facilities (cost of health services/transportation or unavailability of a nearby health facility). Similarly, an Ethiopian study showed that more care givers in urban areas (75.0%) sought medical care for children with ARI compared with those in rural areas (34.4%) (24). Additionally, Noordam et al. stated that there is a strong association between wealth and care-seeking in Ethiopia, Tanzania, Nigeria and Burkina Faso (10).
It is not unexpected that mothers giving home treatment were more likely to delay seeking an outside health provider. Our results were similar to the findings of Pajuelo et al. and Källander et al. in Peru and Uganda (21,25). The latter study indicated that giving treatment at home was a risk factor for the delay in seeking medical care for fatal pneumonia (25).
Mothers of children with recurrent episodes of pneumonia tended to defer their health care visits. This might be related to the mothers’ poor perception of the seriousness of the disease and/or using previous prescriptions at home. It is worth noting that repeated pneumonia in a child was not uncommon in the present study. Similar findings have been reported in Bangladesh and Peru (18,21); this may be attributed to persistent exposure to environmental risk factors such as exposure to tobacco smoke (26,27), overcrowding (28) or indoor and outdoor pollution (29,30).
In terms of compliance, the vast majority of the mothers (94.4%) were compliant with the health provider’s instructions. This is further strengthened by the finding of Onwunaka et al in a study in Nigeria (31). The reason for the high compliance practices among mothers in our study could be a result of the excellent attention given by health care providers to mothers or the perceived seriousness of the disease.
Reviewing medical management, there was a lack of recognition of pneumonic children by nearly half of the first consulted sources, although most of these were medical providers. In accordance to our finding, previous studies have shown that many developing countries still face significant challenges in the provision of effective health care in the diagnosis and treatment of pneumonia (21,32). The diagnostic challenge of childhood pneumonia lies in the broad range of presenting features. Children can present with pneumonia at different stages of illness and with clinical features that might be difficult to discriminate from other common paediatric conditions (33).
Although chest X-ray is the most commonly used diagnostic tool for childhood pneumonia, nearly two-thirds of the first consulted sources did not ask for any investigation. The use of chest X-ray in the clinical context is controversial, with recent guidelines advocating that chest X-ray for the diagnosis of pneumonia in the community setting are warranted. Its use should be confined to children with clinical signs suggesting severe pneumonia who require hospitalization (34).
A recent UNICEF report states that only 39% of children with suspected pneumonia received antibiotics (35). In contrast, our findings showed that antibiotics were prescribed by nearly three-quarters of first consulted sources, with a median duration of 3 days. However, children were not improved and were referred to the sampled hospitals; questioning the appropriateness of the prescribed antibiotics and their efficacy.
The findings from the current study should be interpreted in light of the following limitations. The study was hospital-based, so we recruited only individuals who had actually made it to the hospital. Also, the retrospective nature of the questionnaire might have resulted in some reporting bias. Finally, the current study was susceptible to social desirability bias.
Despite these limitations, the present study indicated that the main barriers that hinder proper management of pneumonia among children under 5 years in Egypt are delay in health care-seeking, mainly due to mothers’ poor knowledge about pneumonia, combined with delay in reaching the proper diagnosis and prescribing appropriate treatment by the health provider. Community-based health education campaigns complementing clinic-based Integrated Management of Childhood Illness programmes can reinforce mothers’ abilities to recognize childhood pneumonia, raise awareness regarding causes, predisposing factors and preventive measures of the disease, appreciate seriousness of the disease and subsequently enhance mothers’ health-seeking behaviour. Media also could play an important role in raising mothers’ awareness about the disease. We believe it is imperative to embark on continuous training for health providers to improve their capability to accurately identify, diagnose and treat fast breathing and chest indrawing pneumonia with proper antibiotics and thus avoid antibiotic misuse.
Funding: The underlying research has received financial support from WHO Regional Office for the Eastern Med-iterranean under the EMRPPH grant scheme, project number RPPH 16-105.
Competing interests: None declared.

1049
Research article EMHJ – Vol. 26 No. 9 – 2020
References1. Abdel Khalek E, Abdel-Salam D. Acute respiratory tract infections in children under 5 years of age in Upper Egypt. Int J Commu-
nity Med Public Health. 2016;3(5):1161–6. doi:10.18203/2394-6040.ijcmph20161377
2. Wardlaw TM, Johansson EW, Hodge M. Pneumonia: the forgotten killer of children. New York: UNICEF, World Health Organi-zation; 2006.
3. Bhutta ZA, Das JK, Walker N, Rizvi A, Campbell H, Rudan I, et al. Interventions to address deaths from childhood pneumonia and diarrhoea equitably: what works and at what cost? Lancet. 2013;381(9875):1417–29. doi:10.1016/S0140-6736(13)60648-0
4. Nair H, Simões E, Rudan I, Gessner B, Azziz-Baumgartner E, Zhang J, et al. Global and regional burden of hospital admissions for severe acute lower respiratory infections in young children in 2010: a systematic analysis. Lancet. 2013;381:1380–90. doi:10.1016/S0140-6736(12)61901-1
Prise en charge de la pneumonie chez les enfants de moins de 5 ans à Alexandrie (Égypte) : le point de vue des mèresRésuméContexte : La pneumonie est l’une des causes principales de morbidité et de mortalité chez les moins de 5 ans au niveau mondial. Objectifs : Une étude transversale a été menée pour examiner le comportement de recours aux soins et la prise en charge initiale de la pneumonie chez les enfants âgés de moins de 5 ans à Alexandrie (Égypte), du point de vue des mères. Méthodes : Au moyen d’un questionnaire conçu à cet effet, nous avons interrogé 507 mères d’enfants atteints de pneumonie de moins de 5 ans qui avaient été admis dans quatre hôpitaux pédiatriques publics. La présente étude a été réalisée entre août et novembre 2017. Résultats : D’après nos observations, 57,2 % des enfants avaient reçu un traitement à domicile avant de consulter un médecin. Près de 26 % des mères avaient attendu deux jours ou plus avant de consulter un médecin. Dans la majorité des cas (89 %), elles estimaient manquer de connaissances sur la maladie. Les facteurs associés de manière significative à ce retard à la consultation étaient les suivants : vie en milieu rural (p = 0,006), faibles revenus (p = 0,002), administration d’un traitement à domicile avant la consultation d’un médecin (p < 0,001) et épisodes précédents de pneumonie (p = 0,002). Le diagnostic de pneumonie n’avait pas été établi par plus de la moitié (52,7 %) des sources initialement consultées. Conclusion : Afin de prendre en charge la pneumonie chez les enfants âgés de moins de 5 ans de manière satisfaisante, il est urgent d’améliorer les connaissances des mères et de mieux former les médecins.
العالج الطبي لاللتهاب الرئوي يف األطفال الذين تقل أعامرهم عن 5 سنوات يف اإلسكندرية، مرص: من منظور األمهات
هنى فضل، ياسمني حممد، آيات عاشور
اخلالصةاخللفية: يعترب االلتهاب الرئوي من أهم أسباب املراضة والوفيات يف األطفال الذين تقل أعامرهم عن 5 سنوات عىل مستوى العامل.
األهداف: هدفت هذه الدراسة إىل تقييم سلوك التامس الرعاية الصحية والعالج الطبي األول حلاالت االلتهاب الرئوي بني األطفال الذين تقل أعامرهم عن 5 سنوات يف اإلسكندرية، مرص، من منظور األمهات.
طرق البحث: استخدم استبيان مصمم مسبقا لعقد مقابالت مع 507 أمهات ألطفال مصابني بااللتهاب الرئوي وتقل أعامرهم عن 5 سنوات، والذين كانوا موجودين يف 4 مستشفيات حكومية لألطفال. وقد أجريت الدراسة يف الفرتة من أغسطس/آب إىل نوفمرب/ترشين الثاين 2017.
النتائج: تبني من نتائج الدراسة أن 57.2% من األطفال قد تلقوا عالجا منزليا قبل التامس املشورة الطبية. وانتظرت 26% من األمهات ملدة يومني أو أكثر قبل التامس املشورة الطبية؛ ويرجع ذلك يف األساس يف 89% من احلاالت إىل عدم إملام األمهات بطبيعة املرض. وقد تضمنت العوامل التي ارتبطت ارتباطا وثيقا بتأخر التامس املشورة الطبية ما ييل: اإلقامة يف الريف )P=0.006(، وانخفاض الدخل )P=0.002(، وإعطاء عالج يف املنزل قبل التامس املشورة الطبية )< P=0.001(، واإلصابة السابقة بنوبات من االلتهاب الرئوي )P=0.002(. ومل يتمكن أكثر من نصف املصادر التي
متت مشاورهتا أوال من تشخيص اإلصابة بااللتهاب الرئوي ) 52.7 %(. االستنتاجات: هناك حاجة ماسة إىل حتسني معلومات األمهات، وتدريب األطباء عىل تقديم العالج املناسب حلاالت االلتهاب الرئوي يف األطفال
الذين تقل أعامرهم عن 5 سنوات.

1050
Research article EMHJ – Vol. 26 No. 9 – 2020
5. Rudan I, O’Brien KL, Nair H, Liu L, Theodoratou E, Qazi S, et al. Epidemiology and etiology of childhood pneumonia in 2010: esti-mates of incidence, severe morbidity, mortality, underlying risk factors and causative pathogens for 192 countries. J Glob Health. 2013;3:010401. doi:10.7189/jogh.03.010401
6. Saving the lives of mothers and children: rising to the challenge. Background document for the High Level Meeting on Saving the Lives of Mothers and Children: Accelerating Progress Towards Achieving MDGs 4 and 5 in the Region, Dubai, United Arab Emirates, 29–30 January 2013. Geneva: World Health Organization; 2013.
7. Rudan I, Boschi-Pinto C, Biloglav Z, Mulholland K, Campbell H. Epidemiology and etiology of childhood pneumonia. Bull World Health Org. 2008;86:408–16. PMCID: PMC2647437
8. Egypt Demographic and Health Survey 2014. Cairo, Egypt and Rockville, Maryland, USA: Ministry of Health and Population and ICF International; 2015.
9. Liu L, Johnson HL, Cousens S, Perin J, Scott S, Lawn JE, et al. Global, regional, and national causes of child mortality: an updated systematic analysis for 2010 with time trends since 2000. Lancet. 2012;379(9832):2151–61. doi:10.1016/S0140-6736(12)60560-1
10. Noordam A, Carvajal-Velez L, Sharkey A, Young M, Cals J. Care seeking behaviour for children with suspected pneumonia in countries in Sub-Saharan Africa with high pneumonia mortality. PLoS One. 2015;10(2). doi:10.1371/journal.pone.0117919
11. Childhood diseases. New York: UNICEF; 2017 (https://www.unicef.org/health/index_91917.html, accessed 23 February 2020).
12. Mosites EM, Matheson AI, Kern E, Manhart LE, Morris SS, Hawes SE. Careseeking and appropriate treatment for childhood acute respiratory illness: an analysis of Demographic and Health Survey and Multiple Indicators Cluster Survey datasets for high-mortality countries. BMC Public Health. 2014;14(1):1–8. doi:10.1186/1471-2458-14-446.
13. Pocket book of hospital care for children: guidelines for the management of common illnesses with limited resources, 2nd ed. Geneva: World Health Organization; 2013.
14. Ndu IK, Ekwochi U, Osuorah CD, Onah KS, Obuoha E, Odetunde OI, et al. Danger signs of childhood pneumonia: caregiver awareness and care seeking behavior in a developing country. Int J Pediatr. 2015;2015:1–7. doi:10.1155/2015/167261
15. Emery DP, Milne T, Gilchrist CA, Gibbons MJ, Robinson E, Coster GD, et al. The impact of primary care on emergency depart-ment presentation and hospital admission with pneumonia: a case–control study of preschool-aged children. NPJ Primary Care Respirat Med. 2015;25:14113. doi:10.1038/npjpcrm.2014.113
16. WHO Multicentre Growth Reference Study Group. WHO child growth standards: length/height-for-age, weightforage, weight-for-length, weight-for-height and body mass index-for-age: methods and development. Geneva: World Health Organization; 2006a.
17. Indicators for assessing infant and young child feeding practices: conclusion of a consensus meeting held 6–8 November 2007 in Washington DC, USA. Geneva: World Health Organization; 2008.
18. Ferdous F, Farzana F D, Ahmed S, Das SK, Abdul Malek M, Das J, et al. Mothers’ perception and healthcare seeking behavior of pneumonia children in rural Bangladesh. ISRN Family Med. 2014;2014. doi:10.5402/2014/690315
19. WCountdown to 2015 decade report 2000–2010: taking stock of maternal, newborn and child survival. Geneva: World Health Organization and UNICEF; 2010.
20. Tuhebwe D, Tumushabe E, Leontsini E, Wanyenze RK. Pneumonia among children under five in Uganda: symptom recognition and actions taken by caretakers. African Health Sci. 2014;14(4):993–1000. doi:10.4314/ahs.v14i4.31
21. Pajuelo MJ, Anticona Huaynate C, Correa M, Mayta Malpartida H, Ramal Asayag C, Seminario JR, et al. Delays in seeking and receiving health care services for pneumonia in children under five in the Peruvian Amazon: a mixed-methods study on caregiv-ers’ perceptions. BMC Health Serv Res. 2018;18:149. doi:10.1186/s12913-018-2950-z
22. Onyango D, Kikuvi G, Amukoye E, Omolo J. Risk factors of severe pneumonia among children aged 2–59 months in western Kenya: a case control study. Pan African Med J. 2012;13:45. PMCID:PMC3542783
23. Hill Z KC, Arthur P, Kirkwood B, Adjei E. Recognizing childhood illnesses and their traditional explanations: exploring op-tions for care-seeking interventions in the context of the IMCI strategy in rural Ghana. Trop Med Int Health. 2003;8:668–76. PMID:12828551
24. Assefa T, Belachew T, Tegegn A, Deribew A. Mothers’ health careseeking behaviour for childhood illnesses in Derra district, Northshoa Zone, Oromia Regional State, Ethopia. Ethiopian J Health Sci. 2008;18(3):87–94.
25. Källander K, Hildenwall H, Waiswa P, Galiwango E, Peterson S, Pariyo G. Delayed care seeking for fatal pneumonia in children aged under five years in Uganda: a case-series study. Bull World Health Org. 2008;86(5):321–416. doi:10.2471/BLT.07.049353
26. Cheraghi M, Salvi S. Environmental tobacco smoke (ETS) and respiratory health in children. Eur J Pediatr. 2009;168:897–905. doi:10.1007/s00431-009-0967-3
27. Polanska K, Hanke W, Ronchetti R, van den Hazel P, Zuurbier M, Koppe J G, et al. Enviromental tobacco smoke exposure and children’s health. Acta Paediatr Suppl. 2006;95(453):86–92. doi:10.1080/08035320600886562
28. Savitha MR, Nandeeshwara SB, Pradeep Kumar MJ, ul-Haque F, Raju CK. Modifiable risk factors for acute lower respiratory tract infections. Indian J Pediatr. 2007;74:477–82. PMID:17526960
29. Searing D A, Rabinovitch N. Environmental pollution and lung effects in children. Curr Opin Pediatr. 2011;23:314–18. doi:10.1097/MOP.0b013e3283461926.

1051
Research article EMHJ – Vol. 26 No. 9 – 2020
30. Vieira SE, Stein RT, Ferraro AA, Pastro LD, Pedro SSC, Lemos M, et al. Urban air pollutants are significant risk factors for asthma and pneumonia in children:the influence of location on the measurement of pollutants. Arch Broncopneumol. 2012;48(11):389–95. doi:10.1016/j.arbres.2012.05.005
31. Onwunaka C, Nwimo IO, Ilo CI, Okafor JO. Maternal compliance practices during childhood pneumonia in Imo State, Nigeria. J Health Med Nurs. 2015;15:72–9.
32. Bagonza J, Rutebemberwa E, Eckmanns T, Ekirapa-Kiracho E. What influences availability of medicines for the community management of childhood illnesses in central Uganda? Implications for scaling up the integrated community case management programme. BMC Public Health. 2015;15:1180. doi:10.1186/s12889-015-2525-4.
33. Rodrigues CMC, Groves H. Community-acquired pneumonia in children: the challenges of microbiological diagnosis. J Clin Microbiol. 2018;56(3):e01318-17. doi:10.1128/JCM.01318-17.
34. O’Grady KAF, Torzillo PJ, Frawley K, Chang AB. The radiological diagnosis of pneumonia in children. Pneumonia. 2014;5(1):38–51. doi:10.15172/pneu.2014.5/482
35. Committing to child survival: a promise renewed, progress report. New York: UNICEF; 2015 (http://www.apromiserenewed.org/wp-content/uploads/2015/09/APR_2015_8_Sep_15.pdf, accessed 26 September 2018).

1052
Research article EMHJ – Vol. 26 No. 9 – 2020
Audit of antibiotic prophylaxis and adherence of surgeons to standard guidelines in common abdominal surgical proceduresZakir Khan1,3 Naveed Ahmed,1 Shaista Zafar,2 Asim ur Rehman1, Faiz Ullah Khan1,4 Muhammad Saqlain,1 Sohail Kamran1 and Hazir Rahman5
1Department of Pharmacy, Quaid-i-Azam University, Islamabad, Pakistan (Correspondence to: Z. Khan: [email protected]). 2Department of Surgery, Pakistan Institute of Medical Sciences, Islamabad, Pakistan. 3Institute of Health Sciences, Department of Pharmacology (Pharmacovigilance), Çukurova University, Adana, Turkey. 4Department of Pharmacy Administration and Clinical Pharmacy, School of Pharmacy, Health Science Centre, Xi’an Jiaotong University, China. 5Department of Microbiology, Faculty of Chemical and Life Sciences, Abdul Wali Khan University, Mardan, Pakistan
AbstractBackground: Prophylactic use of antibiotics before surgery is evidence-based practice for prevention of surgical site infections (SSIs). Aims: To investigate adherence to and surgeons’ perception of antibiotic prophylaxis guidelines.Methods: A two-phase, cross-sectional prospective study conducted in two teaching hospitals. Phase 1: 6-month audit of prescriptions to investigate adherence rate to evidence-based guidelines. The important information was collected from medical charts through a predesigned proforma. Phase 2: self-administration questionnaire was used to investigate the surgeons’ perception. Descriptive statistics, independent-sample Kruskal–Wallis test and multivariate linear regression analysis were performed using SPSS version 21.0.Results: A total of 866 eligible surgical cases (acute appendectomy; n = 418; 48.2%), laparoscopic cholecystectomy (n = 278; 32.1%) and inguinal hernia (n = 170; 19.7%) were investigated. Surgical antibiotic prophylaxis was prescribed in 97.5% of procedures. Out of these, 9.5% adhered to guidelines with respect to correct choice, 40% for timing, and 100% for dose and route (optimal value 100%). Most patients received ceftriaxone (n = 503; 59.5%) as prophylactic antibiotic. The question-naire (good internal consistency; α ≥ 0.7) was filled out by 200 surgeons. More than half (69%) of participants thought that antibiotics were overused. Most surgeons perceive that poor adherence to treatment guidelines is due to poor awareness, underestimation of infection, lack of consensus, and disagreement with guidelines recommendations. Conclusions: Surgeons have positive perception that antibiotics should be used according to guidelines recommenda-tions. However, we found poor treatment adherence to antibiotic prophylaxis guidelines.Keywords: abdominal surgery, adherence, antibiotic prophylaxis, surgeons’ perception, treatment guidelinesCitation: Khan Z; Ahmed N; Zafar S; ur Rehman A; Ullah Khan F; Saqlain M et al. Audit of antibiotic prophylaxis and adherence of surgeons to standard guidelines in common abdominal surgical procedures. East Mediterr Health J. 2020;26(9):1052-1061. https://doi.org/10.26719/emhj.20.025Received : 11/05/19; accepted: 18/09/19 Copyright © World Health Organization (WHO) 2020. Open Access. Some rights reserved. This work is available under the CC BY-NC-SA 3.0 IGO license (https://creativecommons.org/licenses/by-nc-sa/3.0/igo)
Introduction
Globally, every year > 200 million individuals undergo surgical procedures (1). About 70% of the world’s popula-tion belongs to low- and middle-income countries, and most of them have surgery-associated disorders (2). Post-operative infections are a major public health concern and account for ~7 million complications around the world (2,3). The most common cause of hospital-acquired infections in surgical patients is surgical site infections (SSIs), and surgical antibiotic prophylaxis (SAP) is used as standard practice to combat SSIs (4).
Per capita consumption of antibiotics is generally higher in high-income countries, but the greatest increase in antibiotic use between 2000 and 2010 was in low-income countries, where use continues to rise, and often, heavy use of antibiotics substitutes for infection control (3). It is reported that antibiotics constitute one third of all drugs used in hospitals and 80% of antibiotics are used in surgery-associated cases (5). Appropriate use of antibiotics provides optimal benefits, when administered
for an appropriate indication, with correct choice, dose, time and duration (4,6,7). The antibiotic stewardship programme focuses on the appropriate use of antibiotics. Prevention of misuse, fighting against resistance, and promotion of appropriate use of antibiotics are the main goals of the stewardship programme (8). Various approaches being tried to tackle this health threat, such as understanding the factors that influence prescribing behaviour. Behaviour changes during prescribing are effective (8,9).
Despite the availability of guidelines, compliance rates with appropriate selection, timing, duration and use of antibiotics in surgical procedures are low among surgeons (6,10). Such practices in the healthcare system ultimately lead to increases in adverse events, antibiotic resistance, and costs of treatment (4,6,7). Due to the increased use of antibiotics in surgical procedures, it is necessary to address the compliance of SAP with evidence-based guidelines and investigate the perceptions of surgeons about determinants of antibiotic use.
1053
Research article EMHJ – Vol. 26 No. 9 – 2020
The main objectives of this study were to compare current antibiotic prophylaxis practices with international standard treatment guidelines and evaluate the perception of surgeons in 2 tertiary care teaching hospitals in Islamabad, Pakistan.
MethodsPhase 1: observational study phaseStudy design and settings
A 6-month prospective, observational, medical re-cord-based study from January 1, 2017 to June 30, 2017 was conducted to investigate adherence of SAP practices with treatment guidelines. The study was conducted in national referral hospitals with 600 beds, providing med-ical facilities to Islamabad, Khyber Pakhtunkhwa, Azad Jammu and Kashmir, and Punjab.
Sample size, sampling technique and patient characteristics
According to the National Population Census 2017, the population of Pakistan was 207 776 954 and that of Islam-abad 2 001 579 (https://www.citypopulation.de/php/paki-stan-admin.php?adm1id=5). The minimum obligatory sample size calculated was 601 based on 95% confidence interval and 4% margin of error using the formula [n = N x/((N — 1) E2 + x)]; where N is the population size and E the margin of error. Rao soft sample size calculator was used to estimate sample size (http://www.raosoft.com/samplesize.html).
We aimed to highlight current prescribing practice; therefore, the minimum required sample size was calculated according to the World Health Organization (WHO)/International Network of Rational Use of Drugs methodology, which states a sample size of at least 600 encounters/prescriptions of patients are required to conduct a cross-sectional prospective study describing current treatment practice (11). Rather than specifying the number of patients, a time period was selected and all the patients who underwent 1 of 3 types of surgery in that period were enrolled according to the inclusion and exclusion criteria. A universal random sampling technique was used and patients who underwent 1 of the 3 most commonly performed abdominal surgical procedures (appendectomy, laparoscopic cholecystectomy and inguinal hernia repair) were assessed during the study period. Inpatients who met the inclusion criteria during the study period were invited to participate. After explaining the purpose and nature of the study, patients gave verbal and written consent to participate. The inclusion criteria were as follows: patients who underwent the selected abdominal surgeries; age > 16 years; and no previous infection or surgery. We excluded patients who did not give their consent and those undergoing palliative care.
Data collection tool
Medical records of selected patients were obtained and the desired information was collected on a predesigned
standardized data collection form (Additional File 2 ). The type of surgery, details of antibiotic prophylaxis (anti-biotic agents, administration route, dosage, time), and length of hospital stay were recorded.
Appropriateness and adherence to prescription guidelines
SAP was judged as appropriate if the antibiotic, dose, route and timing were in accordance with the recom-mendations of international guidelines (4,12). These guidelines emphasize the following aspects: (1) use of in-expensive narrow-spectrum antibiotics; (2) intravenous single dose prophylaxis; (3) administration of SAP within 1 hour before the first incision; (4) cefazolin as the first drug of choice; however, if there is allergy to beta-lactams then vancomycin or clindamycin are appropriate alterna-tives (metronidazole should be added against anaerobic bacteria); and (6) dose of SAP. A prescription was con-firmed to be adherent to guidelines if SAP was admin-istered as per the guidelines. All the prescriptions were evaluated against each aforementioned recommendation and adherence rate for each recommendation, that is, in-dication, choice, timing, route and dose, was calculated by dividing the adherent cases by total cases. A simplified scheme for reviewing the prescription of SAP to investi-gate adherence to the guidelines is presented in Figure 1. WHO Anatomical Therapeutic Classification was also used to report antibiotic utilization (13).
Phase 2: Questionnaire-based studyStudy design, and study population
After completion of Phase 1, a 2-month prospective ques-tionnaire-based survey was carried out to assess sur-geons’ perception regarding antibiotic use, guidelines ad-herence and other factors related to antibiotic practices. Surgeons working at the selected hospitals were recruit-ed on a daily basis, using a simple random sampling tech-nique, on their ward rounds by the principal investigator from July 1 to August 30, 2017. A participant information leaflet was provided to all surgeons before the study.
Data collection tool
Investigators systematically and thoroughly reviewed the available literature (8,14) for development of a self-ad-ministered questionnaire (Additional File 2). The ques-tionnaire was modified through content and face va-lidity. The content was further validated by 2 academic experts. For modification, feasibility, and adjustment, the questionnaire was administered to a small group of 20 prescribers (10 from each hospital). After that, the rec-ommended modifications were included in the question-naire.
Reliability coefficients and internal consistency were measured by Cronbach’s α in SPSS version 21.0. Cronbach’s α was set at 0.76. The questionnaire was divided into 2 main sections: the first included questions regarding demographic characteristics, and the second was divided into three subsections: (a) included questions regarding antibiotic use in surgical procedures; (b) included items regarding guideline adherence; and (c) included questions about the hospital pharmacist’s role.

1054
Research article EMHJ – Vol. 26 No. 9 – 2020
The responses were recorded on a 14-item Likert scale. Each item was scored separately as 1 (strongly disagree) to 5 (strongly agree); thus, total score ranged from 14 to 70, with higher scores indicating more positive perception.
Statistical analysisDescriptive statistics were calculated as frequency and percentages for categorical variables and mean and standard deviation for numerical variables. Likert scale response often provides non-normally distributed data; therefore ,independent-sample Kruskal–Wallis tests were performed to find difference in surgeons’ response to each item in the questionnaire according to demo-graphic characteristics. Multivariate linear regression analysis was performed to find factors that affected sur-geons’ overall perception of antibiotic guideline adher-ence. P ≤ 0.05 was defined as statistically significant. Sta-tistical analysis was performed using SPSS version 22.0.
Ethical approvalThe study was carried out in accordance with Declaration of Helsinki and approved by the Institutional Review Boards and Ethics Committees of Hospital A (Pakistan In-stitute of Medical Sciences, Islamabad, Pakistan: No. F.1-1/2015/ERB/SZABMU/), Hospital B (Shifa international hospital Islamabad, Pakistan: No. IRB-637-085-2016) and the Bioethical Committee of the Quaid-i-Azam Universi-ty, Islamabad, Pakistan: No. DFBS/2016-623) (Additional File 3).
Results
Phase 1Pattern of surgical procedures
A total of 1015 patients underwent common abdominal surgery. Among these, 149 (14.7%) were excluded due to incomplete medical records (n = 62), having previous sur-gery (n = 34) and age < 16 years (n = 53). Finally, 866 cases were recruited for the present study. Appendectomy (n = 418; 48.2%) was the most commonly performed operation followed by laparoscopic cholecystectomy (n = 278; 32.1%) and inguinal hernia repair (n = 170; 19.7%).
SAP practice according to guidelines
SAP was prescribed in 845 (97.5%) surgical procedures (Table 1). However, appropriate antibiotics according to evidence-based guidelines were given to only 80 (9.5%) patients. Seven hundred and sixty-five (90.5%) patients received the wrong antibiotics with respect to guidelines, and they were not included in the calculation of the cor-rect dose. Of the 80 patients to whom the correct antibi-otic was administered, the right dose was administered in all cases. The route of administration was correct and according to recommendations. The timing of SAP was according to guidelines in 40% of patients (within 1 hour before surgical incision).
Figure 1 Steps for reviewing the prescription of surgical antibiotic prophylaxis (SAP) to assess adherence with guidelines
SAP prescribed SAP not administered
Is there an indication Over-prescribing
Prescribe according toguidelines Inappropriate prescribing
Is choice of SAP appropriate? Inappropriate choice
Check the appropriatenessof timing of administration
Inappropriate timing of administration
Are dose and route ofadministration appropriate
according to guidelines?
Inappropriate route and dose
Overall adherence to guidelines
End
Start No
No
No
No
No
No
Yes
Yes
Yes
Yes
Yes
Yes
Yes
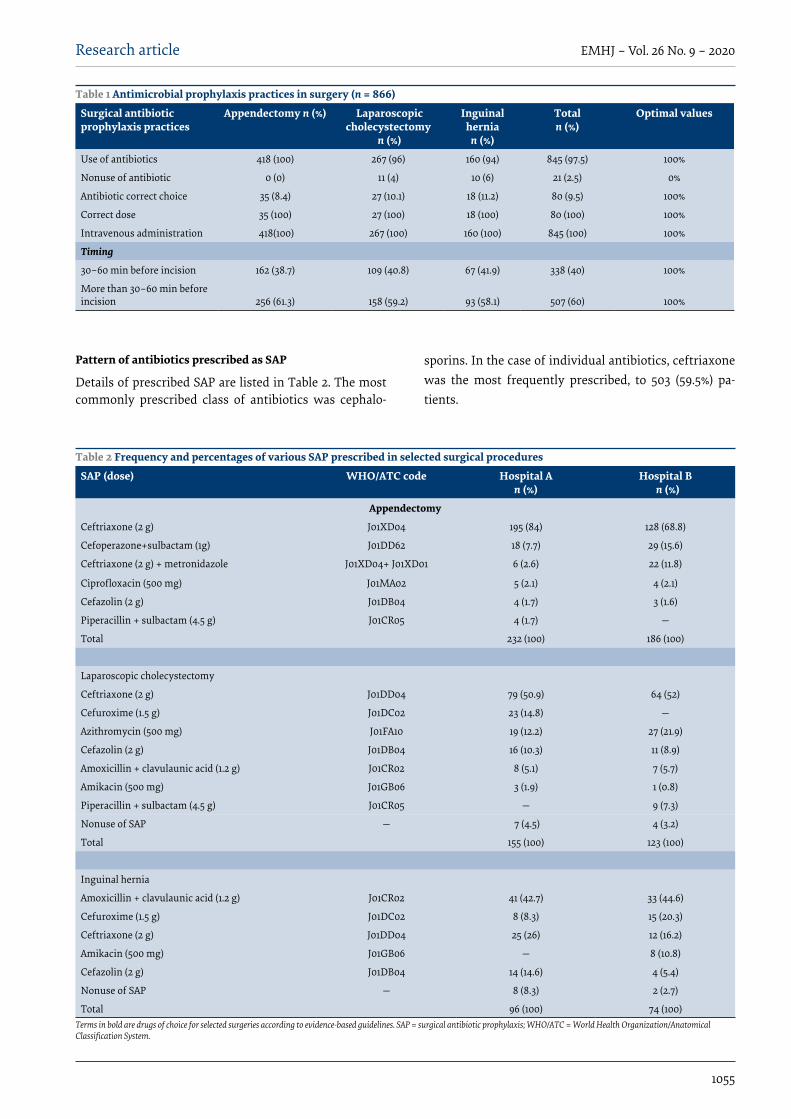
1055
Research article EMHJ – Vol. 26 No. 9 – 2020
Pattern of antibiotics prescribed as SAP
Details of prescribed SAP are listed in Table 2. The most commonly prescribed class of antibiotics was cephalo-
sporins. In the case of individual antibiotics, ceftriaxone was the most frequently prescribed, to 503 (59.5%) pa-tients.
Table 1 Antimicrobial prophylaxis practices in surgery (n = 866)
Surgical antibiotic prophylaxis practices
Appendectomy n (%) Laparoscopic cholecystectomy
n (%)
Inguinal hernia
n (%)
Totaln (%)
Optimal values
Use of antibiotics 418 (100) 267 (96) 160 (94) 845 (97.5) 100%
Nonuse of antibiotic 0 (0) 11 (4) 10 (6) 21 (2.5) 0%
Antibiotic correct choice 35 (8.4) 27 (10.1) 18 (11.2) 80 (9.5) 100%
Correct dose 35 (100) 27 (100) 18 (100) 80 (100) 100%
Intravenous administration 418(100) 267 (100) 160 (100) 845 (100) 100%
Timing
30–60 min before incision 162 (38.7) 109 (40.8) 67 (41.9) 338 (40) 100%
More than 30–60 min before incision 256 (61.3) 158 (59.2) 93 (58.1) 507 (60) 100%
Table 2 Frequency and percentages of various SAP prescribed in selected surgical procedures
SAP (dose) WHO/ATC code Hospital An (%)
Hospital B n (%)
Appendectomy
Ceftriaxone (2 g) J01XD04 195 (84) 128 (68.8)
Cefoperazone+sulbactam (1g) J01DD62 18 (7.7) 29 (15.6)
Ceftriaxone (2 g) + metronidazole J01XD04+ J01XD01 6 (2.6) 22 (11.8)
Ciprofloxacin (500 mg) J01MA02 5 (2.1) 4 (2.1)
Cefazolin (2 g) J01DB04 4 (1.7) 3 (1.6)
Piperacillin + sulbactam (4.5 g) J01CR05 4 (1.7) —
Total 232 (100) 186 (100)
Laparoscopic cholecystectomy
Ceftriaxone (2 g) J01DD04 79 (50.9) 64 (52)
Cefuroxime (1.5 g) J01DC02 23 (14.8) —
Azithromycin (500 mg) J01FA10 19 (12.2) 27 (21.9)
Cefazolin (2 g) J01DB04 16 (10.3) 11 (8.9)
Amoxicillin + clavulaunic acid (1.2 g) J01CR02 8 (5.1) 7 (5.7)
Amikacin (500 mg) J01GB06 3 (1.9) 1 (0.8)
Piperacillin + sulbactam (4.5 g) J01CR05 — 9 (7.3)
Nonuse of SAP — 7 (4.5) 4 (3.2)
Total 155 (100) 123 (100)
Inguinal hernia
Amoxicillin + clavulaunic acid (1.2 g) J01CR02 41 (42.7) 33 (44.6)
Cefuroxime (1.5 g) J01DC02 8 (8.3) 15 (20.3)
Ceftriaxone (2 g) J01DD04 25 (26) 12 (16.2)
Amikacin (500 mg) J01GB06 — 8 (10.8)
Cefazolin (2 g) J01DB04 14 (14.6) 4 (5.4)
Nonuse of SAP — 8 (8.3) 2 (2.7)
Total 96 (100) 74 (100)Terms in bold are drugs of choice for selected surgeries according to evidence-based guidelines. SAP = surgical antibiotic prophylaxis; WHO/ATC = World Health Organization/Anatomical Classification System.
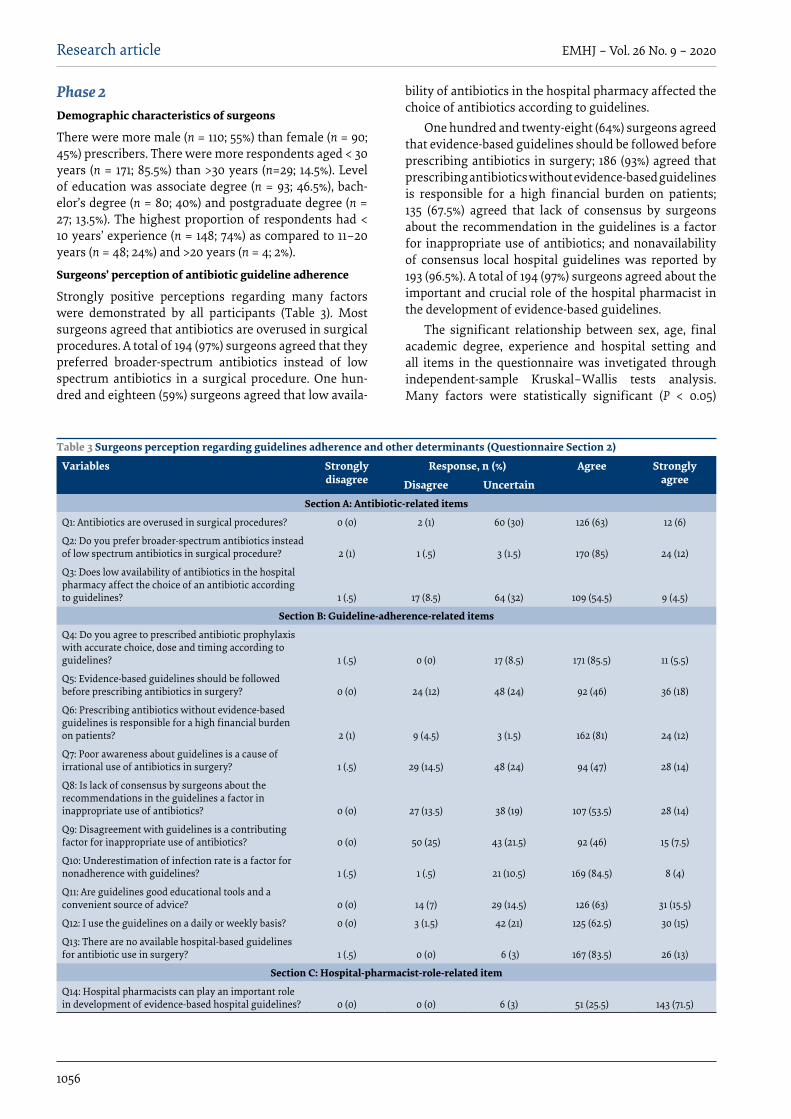
1056
Research article EMHJ – Vol. 26 No. 9 – 2020
Phase 2Demographic characteristics of surgeons
There were more male (n = 110; 55%) than female (n = 90; 45%) prescribers. There were more respondents aged < 30 years (n = 171; 85.5%) than >30 years (n=29; 14.5%). Level of education was associate degree (n = 93; 46.5%), bach-elor’s degree (n = 80; 40%) and postgraduate degree (n = 27; 13.5%). The highest proportion of respondents had < 10 years’ experience (n = 148; 74%) as compared to 11–20 years (n = 48; 24%) and >20 years (n = 4; 2%).
Surgeons’ perception of antibiotic guideline adherence
Strongly positive perceptions regarding many factors were demonstrated by all participants (Table 3). Most surgeons agreed that antibiotics are overused in surgical procedures. A total of 194 (97%) surgeons agreed that they preferred broader-spectrum antibiotics instead of low spectrum antibiotics in a surgical procedure. One hun-dred and eighteen (59%) surgeons agreed that low availa-
bility of antibiotics in the hospital pharmacy affected the choice of antibiotics according to guidelines.
One hundred and twenty-eight (64%) surgeons agreed that evidence-based guidelines should be followed before prescribing antibiotics in surgery; 186 (93%) agreed that prescribing antibiotics without evidence-based guidelines is responsible for a high financial burden on patients; 135 (67.5%) agreed that lack of consensus by surgeons about the recommendation in the guidelines is a factor for inappropriate use of antibiotics; and nonavailability of consensus local hospital guidelines was reported by 193 (96.5%). A total of 194 (97%) surgeons agreed about the important and crucial role of the hospital pharmacist in the development of evidence-based guidelines.
The significant relationship between sex, age, final academic degree, experience and hospital setting and all items in the questionnaire was invetigated through independent-sample Kruskal–Wallis tests analysis. Many factors were statistically significant (P < 0.05)
Table 3 Surgeons perception regarding guidelines adherence and other determinants (Questionnaire Section 2)
Variables Stronglydisagree
Response, n (%) Agree Strongly agreeDisagree Uncertain
Section A: Antibiotic-related items
Q1: Antibiotics are overused in surgical procedures? 0 (0) 2 (1) 60 (30) 126 (63) 12 (6)
Q2: Do you prefer broader-spectrum antibiotics instead of low spectrum antibiotics in surgical procedure? 2 (1) 1 (.5) 3 (1.5) 170 (85) 24 (12)
Q3: Does low availability of antibiotics in the hospital pharmacy affect the choice of an antibiotic according to guidelines? 1 (.5) 17 (8.5) 64 (32) 109 (54.5) 9 (4.5)
Section B: Guideline-adherence-related items
Q4: Do you agree to prescribed antibiotic prophylaxis with accurate choice, dose and timing according to guidelines? 1 (.5) 0 (0) 17 (8.5) 171 (85.5) 11 (5.5)
Q5: Evidence-based guidelines should be followed before prescribing antibiotics in surgery? 0 (0) 24 (12) 48 (24) 92 (46) 36 (18)
Q6: Prescribing antibiotics without evidence-based guidelines is responsible for a high financial burden on patients? 2 (1) 9 (4.5) 3 (1.5) 162 (81) 24 (12)
Q7: Poor awareness about guidelines is a cause of irrational use of antibiotics in surgery? 1 (.5) 29 (14.5) 48 (24) 94 (47) 28 (14)
Q8: Is lack of consensus by surgeons about the recommendations in the guidelines a factor in inappropriate use of antibiotics? 0 (0) 27 (13.5) 38 (19) 107 (53.5) 28 (14)
Q9: Disagreement with guidelines is a contributing factor for inappropriate use of antibiotics? 0 (0) 50 (25) 43 (21.5) 92 (46) 15 (7.5)
Q10: Underestimation of infection rate is a factor for nonadherence with guidelines? 1 (.5) 1 (.5) 21 (10.5) 169 (84.5) 8 (4)
Q11: Are guidelines good educational tools and a convenient source of advice? 0 (0) 14 (7) 29 (14.5) 126 (63) 31 (15.5)
Q12: I use the guidelines on a daily or weekly basis? 0 (0) 3 (1.5) 42 (21) 125 (62.5) 30 (15)
Q13: There are no available hospital-based guidelines for antibiotic use in surgery? 1 (.5) 0 (0) 6 (3) 167 (83.5) 26 (13)
Section C: Hospital-pharmacist-role-related item
Q14: Hospital pharmacists can play an important role in development of evidence-based hospital guidelines? 0 (0) 0 (0) 6 (3) 51 (25.5) 143 (71.5)
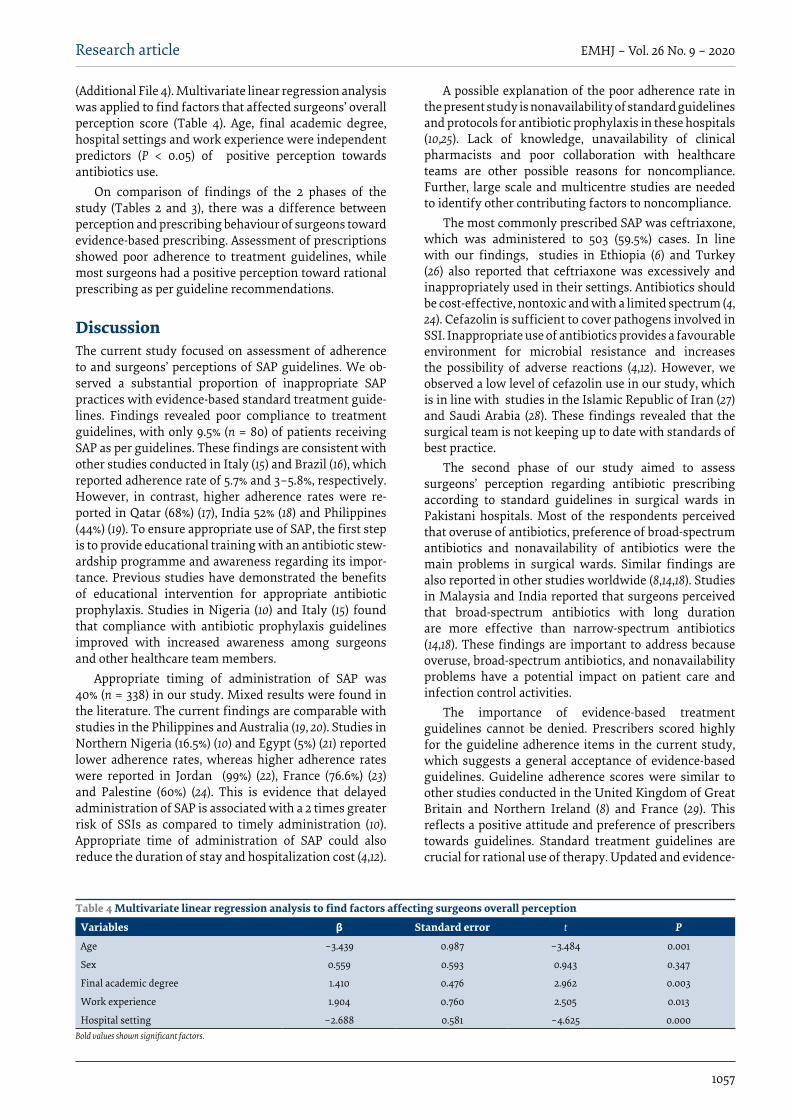
1057
Research article EMHJ – Vol. 26 No. 9 – 2020
(Additional File 4). Multivariate linear regression analysis was applied to find factors that affected surgeons’ overall perception score (Table 4). Age, final academic degree, hospital settings and work experience were independent predictors (P < 0.05) of positive perception towards antibiotics use.
On comparison of findings of the 2 phases of the study (Tables 2 and 3), there was a difference between perception and prescribing behaviour of surgeons toward evidence-based prescribing. Assessment of prescriptions showed poor adherence to treatment guidelines, while most surgeons had a positive perception toward rational prescribing as per guideline recommendations.
DiscussionThe current study focused on assessment of adherence to and surgeons’ perceptions of SAP guidelines. We ob-served a substantial proportion of inappropriate SAP practices with evidence-based standard treatment guide-lines. Findings revealed poor compliance to treatment guidelines, with only 9.5% (n = 80) of patients receiving SAP as per guidelines. These findings are consistent with other studies conducted in Italy (15) and Brazil (16), which reported adherence rate of 5.7% and 3–5.8%, respectively. However, in contrast, higher adherence rates were re-ported in Qatar (68%) (17), India 52% (18) and Philippines (44%) (19). To ensure appropriate use of SAP, the first step is to provide educational training with an antibiotic stew-ardship programme and awareness regarding its impor-tance. Previous studies have demonstrated the benefits of educational intervention for appropriate antibiotic prophylaxis. Studies in Nigeria (10) and Italy (15) found that compliance with antibiotic prophylaxis guidelines improved with increased awareness among surgeons and other healthcare team members.
Appropriate timing of administration of SAP was 40% (n = 338) in our study. Mixed results were found in the literature. The current findings are comparable with studies in the Philippines and Australia (19, 20). Studies in Northern Nigeria (16.5%) (10) and Egypt (5%) (21) reported lower adherence rates, whereas higher adherence rates were reported in Jordan (99%) (22), France (76.6%) (23) and Palestine (60%) (24). This is evidence that delayed administration of SAP is associated with a 2 times greater risk of SSIs as compared to timely administration (10). Appropriate time of administration of SAP could also reduce the duration of stay and hospitalization cost (4,12).
A possible explanation of the poor adherence rate in the present study is nonavailability of standard guidelines and protocols for antibiotic prophylaxis in these hospitals (10,25). Lack of knowledge, unavailability of clinical pharmacists and poor collaboration with healthcare teams are other possible reasons for noncompliance. Further, large scale and multicentre studies are needed to identify other contributing factors to noncompliance.
The most commonly prescribed SAP was ceftriaxone, which was administered to 503 (59.5%) cases. In line with our findings, studies in Ethiopia (6) and Turkey (26) also reported that ceftriaxone was excessively and inappropriately used in their settings. Antibiotics should be cost-effective, nontoxic and with a limited spectrum (4, 24). Cefazolin is sufficient to cover pathogens involved in SSI. Inappropriate use of antibiotics provides a favourable environment for microbial resistance and increases the possibility of adverse reactions (4,12). However, we observed a low level of cefazolin use in our study, which is in line with studies in the Islamic Republic of Iran (27) and Saudi Arabia (28). These findings revealed that the surgical team is not keeping up to date with standards of best practice.
The second phase of our study aimed to assess surgeons’ perception regarding antibiotic prescribing according to standard guidelines in surgical wards in Pakistani hospitals. Most of the respondents perceived that overuse of antibiotics, preference of broad-spectrum antibiotics and nonavailability of antibiotics were the main problems in surgical wards. Similar findings are also reported in other studies worldwide (8,14,18). Studies in Malaysia and India reported that surgeons perceived that broad-spectrum antibiotics with long duration are more effective than narrow-spectrum antibiotics (14,18). These findings are important to address because overuse, broad-spectrum antibiotics, and nonavailability problems have a potential impact on patient care and infection control activities.
The importance of evidence-based treatment guidelines cannot be denied. Prescribers scored highly for the guideline adherence items in the current study, which suggests a general acceptance of evidence-based guidelines. Guideline adherence scores were similar to other studies conducted in the United Kingdom of Great Britain and Northern Ireland (8) and France (29). This reflects a positive attitude and preference of prescribers towards guidelines. Standard treatment guidelines are crucial for rational use of therapy. Updated and evidence-
Table 4 Multivariate linear regression analysis to find factors affecting surgeons overall perception
Variables β Standard error t PAge –3.439 0.987 –3.484 0.001
Sex 0.559 0.593 0.943 0.347
Final academic degree 1.410 0.476 2.962 0.003
Work experience 1.904 0.760 2.505 0.013
Hospital setting –2.688 0.581 –4.625 0.000Bold values shown significant factors.

1058
Research article EMHJ – Vol. 26 No. 9 – 2020
based guidelines should be provided to prescribers that ultimately enhance effective and quicker appropriate use of antibiotics (30). Most of the participants in our study reported that they used guidelines on a daily basis but also reported nonavailability of hospital-based local guidelines. Similar results were reported in the Philippines (31). Although positive attitudes towards guidelines were shown in our study they had a limited impact on practice. However, the reasons behind nonadherence to guidelines in our study may be lack of awareness of appropriate guidelines, lack of consensus by the surgeons with the guidelines, ineffective distribution system for the latest version of guidelines, and lack of regular educational training sessions (14).
The current findings of alarmingly low adherence rates to treatment guidelines imply that serious practical measures should be taken by hospital administrators and policy-makers to improve prescribing practice. Poor prescribing practice results in poor treatment outcomes and serious consequences such as higher incidence of adverse reactions, waste of resources and increased treatment costs. Most surgeons perceived that local hospital-based treatment guidelines are a prerequisite to improve prescribing practice and ultimately patient care. Also, measures should be taken to fill the gap between prescribers’ perception and practice. Pharmacists could play a vital role in the development of evidence-based hospital guidelines and antibiotic stewardship programmes (32–34). Most of the participants in our study agreed about the important role of hospital pharmacists in the development of guidelines. However, in our setting, the pharmacists’ role was mainly confined to dispensing drugs and not development of guidelines and decision-making. There is an urgent need for policies to be implemented by governments, hospital administrations and clinical teams of surgeons to acknowledge and support the vital role of hospital pharmacists. Prolonged working time, decreased workload and increased numbers of hospital pharmacists may be important strategies to monitor antibiotic use and development of guidelines for surgical patients. Such interventions are the key to success of antimicrobial stewardship programmes (33).
The current study had access to well-reported data on SAP and was adequately powered; however, some limitations must be acknowledged. First, the present study only focused on compliance rate of SAP in 3 common surgical procedures. Second, we used published
recommendations of evidence-based international guidelines to measure against the appropriate use of SAP in selected operations because there were no local consensus guidelines available in both hospitals. However, the possibility exists that recommendations given by the guidelines were not practicable in our patients or for the situation in Pakistan. Third, the study did not monitor postoperative infection rate. Therefore, we do not know if nonadherence to the guidelines had any clinical consequences. Moreover, the questionnaire was only distributed to 2 tertiary care hospitals in Islamabad. Therefore, these findings cannot be generalized for the whole country. However, these findings do add useful information, particularly around appropriate antibiotic use, adherence to standard guidelines, perception of surgeons, and factors that affect antibiotic prescribing in surgery and health systems in developing countries.
ConclusionsOur findings indicates poor adherence to evidenced-based guidelines for administration of SAP. Surgeons have pos-itive perception that antibiotics should be used according to guideline recommendations. Most surgeons perceive that poor adherence to treatment guidelines is due to poor awareness, underestimation of infection, lack of consensus and disagreement with guideline recommen-dations. The results provide evidence that healthcare pro-viders should be aware of their larger role in reducing in-appropriate antibiotic prescription prior to surgery. Good prescribing practices are crucial for patient safety and better health outcomes, although prescribers still rely on their own personal experiences while prescribing thera-peutic agents. Compliance with guidelines by surgeons remains a challenge, as reported by previous studies worldwide and in the present study. Nonadherence with guidelines may have increased antibiotic resistance and healthcare-associated infection rates. Real actions are ur-gently needed for the implementation of guidelines and to address the related factors of such practices. Continu-ous educational training, availability of appropriate anti-microbials, and implementation of local and internation-al treatment guidelines and antimicrobial stewardship programmes are required for appropriate utilization of SAP. Furthermore, our findings suggest that large-scale multicentre studies should be conducted to evaluate the factors that affect antibiotic prescribing across the prov-inces of Pakistan.
AcknowledgementWe would like to thank the administration of both hospitals for their help and cooperation during data collection.
Funding: None.
Competing interests: None declared.

1059
Research article EMHJ – Vol. 26 No. 9 – 2020
Audit de l’antibioprophylaxie et de l’observance des lignes directrices standard par les chirurgiens dans les actes courants de chirurgie abdominaleRésuméContexte : L’usage prophylactique des antibiotiques préalablement à un acte chirurgical est une pratique fondée sur des données probantes, qui permet de prévenir les infections du site opératoire (ISO). Objectifs : Étudier l’observance des lignes directrices en matière d’antibioprophylaxie et le point de vue des chirurgiens sur cette pratique.Méthodes : Une étude prospective transversale en deux phases, a été menée dans deux hôpitaux universitaires. Phase 1 : Audit des ordonnances sur six mois, afin d’évaluer le taux de d’observance des lignes directrices fondées sur des données probantes. Les informations importantes ont été recueillies à partir des dossiers médicaux au moyen d’un formulaire conçu à cet effet. Phase 2 : un auto-questionnaire a été utilisé pour étudier le point de vue des chirurgiens. Des statistiques descriptives ont été produites, un test de Kruskal-Wallis sur échantillons indépendants et une analyse de régression linéaire multivariée ont été réalisés à l’aide du logiciel SPPS, version 21.0.Résultats : Au total, 866 cas chirurgicaux répondant aux critères de l’étude ont été examinés : appendicectomies aiguës, (n = 418, soit 48,2 %), cholécystectomies laparoscopiques, (n = 278, soit 32,1 %) et hernies inguinales (n = 170, soit 19,7 %). Une antibioprophylaxie chirurgicale a été prescrite dans 97,5 % des interventions. Parmi ces dernières, le respect des lignes directrices était de 9,5 % pour le choix de l’antibiotique, de 40 % pour le moment de l’administration et de 100 % pour la dose et la voie d’administration, la valeur optimale étant 100 %. La majorité des patients ont reçu de la ceftriaxone (n = 503, soit 59,5 %) comme antibiotique prophylactique. Le questionnaire a été rempli par 200 chirurgiens, avec une cohérence interne satisfaisante (α ≥ 0,7). Plus de la moitié (69 %) des participants estimaient que les antibiotiques étaient surutilisés. La majorité des chirurgiens pensent que l’observance médiocre des lignes directrices de traitement est due à un manque de sensibilisation, à une sous-estimation de l’infection, à l’absence d’un consensus et à un désaccord avec les recommandations de ces lignes directrices. Conclusions : Les chirurgiens approuvent l’usage des antibiotiques conformément aux recommandations des lignes directrices de traitement. Cependant, notre étude révèle une observance médiocre de ces textes dans les traitements d’antibioprophylaxie.
مراجعة استعامل املضادات احليوية الوقائية ومدى امتثال اجلراحني للمبادئ التوجيهية القياسية يف اإلجراءات اجلراحية املعتادة يف منطقة البطن
ذاكر خان، نافيد أمحد، شايستا ظفار، عاصم الرمحن، فايز اهلل خان، حممد صقالن، سهيل قامران، حارض رمحن.
اخلالصةاخللفية: يعترب استعامل املضادات احليوية عىل سبيل الوقاية قبل اجلراحة من املامرسات املسندة بالبينات للوقاية من حدوث عدوى املواضع اجلراحية. األهداف: هدفت هذه الدراسة إىل حتري مدى االمتثال للمبادئ التوجيهية اخلاصة باستعامل املضادات احليوية الوقائية ومنظور اجلراحني يف هذا
الشأن.طرق البحث: أجريت دراسة استباقية مقطعية عىل مرحلتني يف اثنني من املستشفيات اجلامعية. املرحلة 1: مراجعة الوصفات الطبية التي حررت عىل مدار 6 أشهر لتحري معدل االمتثال باملبادئ التوجيهية املسندة بالبينات. وجعت املعلومات املهمة من املخططات الطبية للمرىض باستخدام استامرة ي منظور اجلراحني يف هذا الشأن. وقد استخدم اإلصدار 21.0 من مة مسبقا هلذا الغرض. املرحلة 2: استخدام استبيان يستكمل ذاتيا لتحر مصم
برنامج SPSS إلجراء إحصاءات وصفية، واختبار كروسكال واليس القائم عىل العينات املستقلة، وحتليل االنحدار اخلطي املتعدد املتغريات.النتائج: بلغ جمموع احلاالت اجلراحية التي تصلح للخضوع هلذه الدراسة 866 حالة، تراوحت بني استئصال الزائدة الدودية امللتهبة التهابا حادا املضادات 19.7%(. وقد وصفت )العدد=170؛ األريب 32.1%(، والفتق 278؛ )العدد= باملنظار املرارة 48.2%(، واستئصال )العدد=418؛ احليوية الوقائية يف 97.5% من اإلجراءات اجلراحية. ومن بني هذه اإلجراءات اجلراحية، كانت نسبة االمتثال للمبادئ التوجيهية من حيث االختيار سيفرتياكسون دواء املرىض معظم وتلقى .)%100 املثىل )القيمة التوايل عىل و%100 و%40، ،%9.5 واملسار واجلرعة والتوقيت، الصحيح، )العدد= 503؛ 59.5%(، بوصفه أحد املضادات احليوية الوقائية. وقد أجاب عن االستبيان 200 جراح )اتساق داخيل جيد؛ α ≤ 0.7(. ورأى أكثر من نصف اجلراحني املشاركني يف االستبيان )69 %( أن هناك زيادة يف استعامل املضادات احليوية. كام رأى معظم اجلراحني أن السبب وراء ضعف االمتثال باملبادئ التوجيهية للعالج يرجع إىل ضعف الوعي، وعدم تقدير احلجم احلقيقي للعدوى، وغياب التوافق يف اآلراء، واالختالف
مع التوصيات اخلاصة باملبادئ التوجيهية. لدى اجلراحني منظور إجيايب بشأن رضورة استعامل املضادات احليوية وفقا ملا ورد يف التوصيات اخلاصة باملبادئ التوجيهية، لكن االستنتاجات:
لوحظ ضعف االمتثال للمبادئ التوجيهية اخلاصة بالعالج باملضادات احليوية الوقائية.

1060
Research article EMHJ – Vol. 26 No. 9 – 2020
References
1. Zafar SN, McQueen KK. Surgery, public health, and Pakistan. World J Surg. 2011;35(12):2625–34. http://dx.doi.org/10.1007/s00268-011-1304-3 PMID:21964819
2. Weiser TG, Regenbogen SE, Thompson KD, Haynes AB, Lipsitz SR, Berry WR, et al. An estimation of the global volume of sur-gery: a modelling strategy based on available data. Lancet. 2008;372(9633):139-44. http://dx.doi.org/10.1016/S0140-6736(08)60878-8 PMID:18582931
3. The state of the world’s antibiotics 2015. Center for Disease Dynamics, Economics & Policy; 2015.
4. Bratzler DW, Dellinger EP, Olsen KM, Perl TM, Auwaerter PG, Bolon MK, et al. Clinical practice guidelines for antimicrobial prophylaxis in surgery. Am J Health Syst Pharm. 2013 Feb 1;70(3):195–283. doi: 10.2146/ajhp12056 PMID:23327981
5. Hansen S, Sohr D, Piening B, Pena Diaz L, Gropmann A, Leistner R, et al. Antibiotic usage in German hospitals: results of the second national prevalence study. J Antimicrob Chemother. 2013 Dec;68(12):2934–9. http://dx.doi.org/10.1093/jac/dkt292 PMID:23873646
6. Alemkere G. Antibiotic usage in surgical prophylaxis: a prospective observational study in the surgical ward of Nekemte referral hospital. PloS One. 2018 Sep 13;13(9):e0203523. http://dx.doi.org/10.1371/journal.pone.0203523 PMID:30212477
7. Khan Z, Ahmed N, Rehman AU, Khan FU, Karataş Y. Utilization pattern of antibiotics and patient care indicators in the teaching hospitals, Islamabad, Pakistan. SN Comprehens Clin Med. 2019;1:812–6. https://doi.org/10.1007/s42399-019-00131-z.
8. Parker HM, Mattick K. The determinants of antimicrobial prescribing among hospital doctors in England: a framework to inform tailored stewardship interventions. British journal of clinical pharmacology. 2016 Aug;82(2):431–40. http;//dx.doi.org/10.1111/bcp.12953 PMID:27038778
9. Davey P, Brown E, Charani E, Fenelon L, Gould IM, Holmes A, et al. Interventions to improve antibiotic prescribing practices for hospital inpatients. Cochrane Database Syst Rev. 2017 Feb 9;2:CD003543. http://dx.doi.org/10.1002/14651858.CD003543.pub4 PMID:28178770
10. Abubakar U, Sulaiman SS, Adesiyun A. Utilization of surgical antibiotic prophylaxis for obstetrics and gynaecology surgeries in Northern Nigeria. Inte J Clin Pharm. 2018;40(5):1037–43. http://dx.doi.org/10.1007/s11096-018-0702-0 PMID:30054786
11. Lwanga SK, Lemeshow S. Sample size determination in health studies: a practical manual. Geneva: World Health Organization; 1991 (https://apps.who.int/iris/handle/10665/40062, accessed 10 March 2020).
12. Ban KA, Minei JP, Laronga C, Harbrecht BG, Jensen EH, Fry DE, et al. American College of Surgeons and Surgical Infection Society: surgical site infection guidelines, 2016 update. J Am Coll Surg. 2017 Jan;224(1):59–74. http://dx.doi.org/10.1016/j.jamcoll-surg.2016.10.029 PMID:27915053
13. ATC/DDD methodology [website]. World Health Organization; 2018 (https://www.who.int/medicines/regulation/medicines/safety/toolkit_methodology/en/,accessed 10 December 2018).
14. Ng RS, Chong CP. Surgeons’ adherence to guidelines for surgical antimicrobial prophylaxis – a review. Australas Med J. 2012;5(10):534–40. http://dx.doi.org/10.4066/AMJ.2012.1312 PMID:23173017
15. Giordano M, Squillace L, Pavia M. Appropriateness of surgical antibiotic prophylaxis in pediatric patients in Italy. Infect Control Hosp Epidemiol. 2017;38(7):823–31. http://dx.doi.org/10.1017/ice.2017.79 PMID:28580893
16. Schmitt C, Lacerda RA, Padoveze MC, Turrini RNT. Applying validated quality indicators to surgical antibiotic prophylaxis in a Brazilian hospital: learning what should be learned. Am J Infect Control. 2012 Dec;40(10):960–2. http://dx.doi.org/10.1016/j.ajic.2012.01.016 PMID:22622512
17. Tourmousoglou C, Yiannakopoulou EC, Kalapothaki V, Bramis J, Papadopoulos JS. Adherence to guidelines for antibiotic proph-ylaxis in general surgery: a critical appraisal. J Antimicrob Chemother. 2007 Jan;61(1):214–8. http://dx.doi.org/10.1093/jac/dkm406 PMID:17999981
18. Parulekar L, Soman R, Singhal T, Rodrigues C, Dastur F, Mehta A. How good is compliance with surgical antibiotic prophylax-is guidelines in a tertiary care private hospital in India? A prospective study. Indian J Surg. 2009 Feb;71(1):15–8. http://dx.doi.org/10.1007/s12262-009-0004-9 PMID:23133102
19. Nabor MIP, Buckley BS, Lapitan MCM. Compliance with international guidelines on antibiotic prophylaxis for elective sur-geries at a tertiary-level hospital in the Philippines. Healthcare Infection. 2015 Sep–Dec;20(3–4):145–51. https://doi.org/10.1071/HI15018
20. Jaber S, Rogers C, Sunderland B, Parsons R, MacKenzie S, Seet J, et al. Appropriateness of surgical antibiotic prophylaxis for breast surgery procedures. Int J Clin Pharm. 2017 Apr;39(2):483–6. http://dx.doi.org/10.1007/s11096-017-0434-6 PMID:28205064
21. Saied T, Hafez SF, Kandeel A, El-Kholy A, Ismail G, Aboushady M, et al. Antimicrobial stewardship to optimize the use of anti-microbials for surgical prophylaxis in Egypt: A multicenter pilot intervention study. Am J infect Control. 2015 Nov;43(11):e67–71. http://dx.doi.org/10.1016/j.ajic.2015.07.004 PMID:26315059
22. Al-Momany NH, Al-Bakri AG, Makahleh ZM, Wazaify MM. Adherence to international antimicrobial prophylaxis guidelines in cardiac surgery: a Jordanian study demonstrates need for quality improvement. J Managed Care Pharm. 2009 Apr;15(3):262–71. http://dx.doi.org/10.18553/jmcp.2009.15.3.262 PMID:19326957

1061
Research article EMHJ – Vol. 26 No. 9 – 2020
23. Miliani K, L’hériteau F, Astagneau P, Group INS. Non-compliance with recommendations for the practice of antibiotic proph-ylaxis and risk of surgical site infection: results of a multilevel analysis from the INCISO Surveillance Network. J Antimicrob Chemother. 2009 Dec;64(6):1307–15. http://dx.doi.org/10.1093/jac/dkp367 PMID:19837713
24. Musmar SM, Baba H. Adherence to guidelines of antibiotic prophylactic use in surgery: a prospective cohort study in North West Bank, Palestine. BMC Surg. 2014 Sep 9;14(1):69. http://dx.doi.org/10.1186/1471-2482-14-69 PMID:25204205
25. Ayele Y, Taye H. Antibiotic utilization pattern for surgical site infection prophylaxis at Dil Chora Referral Hospital Surgical Ward, Dire Dawa, Eastern Ethiopia. BMC Res Notes. 2018;11(1):537. https://doi.org/10.1186/s13104-018-3629-6
26. Erbay A, Çolpan A, Bodur H, Çevik MA, Samore MH, Ergönül Ö. Evaluation of antibiotic use in a hospital with an antibiotic re-striction policy. Int J Antimicrob Agents. 2003 Apr;21(4):308–12. http://dx.doi.org/10.1016/s0924-8579(02)00392-8 PMID:12672575
27. Nabovati E, Vakili-Arki H, Taherzadeh Z, Hasibian MR, Abu-Hanna A, Eslami S. Drug-drug interactions in inpatient and outpa-tient settings in Iran: a systematic review of the literature. Daru. 2014 Jun 25;22(1):52. http://dx.doi.org/10.1186/2008-2231-22-52 PMID:24965959
28. Mohajer KA, Al-Yami SM, Al-Jeraisy MI, Abolfotouh MA. Antibiotic prescribing in a pediatric emergency setting in central Saudi Arabia. Saudi Med J. 2011 Feb;32(2):197–8. PMID:21301771
29. Pulcini C, Williams F, Molinari N, Davey P, Nathwani D. Junior doctors’ knowledge and perceptions of antibiotic resistance and prescribing: a survey in France and Scotland. Clin Microbiol Infect. 2011 Jan;17(1):80–7. http://dx.doi.org/10.1111/j.1469-0691.2010.03179.x PMID:20132254
30. Amabile-Cuevas C. Antibiotic resistance in Mexico: a brief overview of the current status and its causes. J Infect Dev Ctries. 2010 Mar 29;4(3):126–31. http://dx.doi.org/10.3855/jidc.427 PMID:20351451
31. Matti PRA, Querol RC, Antonio-Velmonte M, de Vera RL, Alejandria M. Prescribing practices of surgeons and factors that limit adherence to the Philippine College of Surgeons Clinical Practice Guidelines on antimicrobial prophylaxis for elective surgical procedures at the UP-PGH surgical wards. Philipp J Microbiol Infect Dis. 2002;31(3):107–24. http://www.herdin.ph/index.php/herdin-home?view=research&cid=35136
32. Zhang H-X, Li X, Huo H-Q, Liang P, Zhang J-P, Ge W-H. Pharmacist interventions for prophylactic antibiotic use in urological inpatients undergoing clean or clean-contaminated operations in a Chinese hospital. PloS One. 2014 Feb 25;9(2):e88971. http://dx.doi.org/10.1371/journal.pone.0088971 PMID:24586465
33. Brink AJ, Messina AP, Feldman C, Richards GA, van den Bergh D, Alliance NASS. From guidelines to practice: a pharmacist-driv-en prospective audit and feedback improvement model for peri-operative antibiotic prophylaxis in 34 South African hospitals. J Antimicrob Chemother. 2016 Apr 1;72(4):1227–34. http://dx.doi.org/10.1093/jac/dkw523 PMID:27999061
34. Weller T, Jamieson C. The expanding role of the antibiotic pharmacist. J Antimicrob Chemother. 2004 Sep;54(2):295–8. http://dx.doi.org/10.1093/jac/dkh327
1062
Research article EMHJ – Vol. 26 No. 9 – 2020
Comparison of validity of the Food Frequency Questionnaire and the Diet History Questionnaire for assessment of energy and nutrients intakes in an Iranian populationFatemeh Toorang,1,2 Bahareh Sasanfar,1 Ahmad Esmaillzadeh,2,3,4 Soraiya Ebrahimpour-Koujan2 and Kazem Zendehdel1,5,6
1Cancer Research Center; 5Cancer Biology Research Center; 6Breast Diseases Research Center, Cancer Institute of Iran; 2Department of Community Nutrition, School of Nutritional Sciences and Dietetics; 3Obesity and Eating Habits Research Center, Endocrinology and Metabolism Molecular-Cellu-lar Sciences Institute, Tehran University of Medical Sciences, Tehran, Islamic Republic of Iran (Correspondence to: Kazem Zendehdel: [email protected]). 4Department of Community Nutrition, School of Nutrition and Food Science, Isfahan University of Medical Sciences, Isfahan, Islamic Republic of Iran.
AbstractBackground: Dietary intakes are important for development and prevention of chronic disease. The Food Frequency Questionnaire (FFQ) has been suggested as an acceptable feasible method for assessing the association of dietary intake and disease. However, FFQs are sensitive to dietary habits and culture and should be valid in the study population.Aims: We investigated the validity of the Diet History Questionnaire (DHQ) and the Food Frequency Questionnaire in healthy Iranians.Methods: Participants were healthy relatives of cancer patients in the Cancer Institute of Iran. They participated in face-to-face interviews. We took telephone based 24-hour recalls every 2 months over a 1-year period. Assuming the mean intakes of 24-hour recalls as the gold standard, we estimated Pearson correlation coefficients to measure the reliability of the FFQ and the DHQ. We investigated how the FFQ or DHQ categorized individuals in different intake groups compar-ing with the 24-hour recalls.Results: Overall, 102 subjects took part in our study. Deattenuated Spearman correlations were ≥ 0.5 for energy, carbo-hydrate, protein, carotene, niacin, folate, vitamin B12, biotin, vitamin C, iron, zinc and selenium in both DHQ and FFQ. Level of agreement with 24-hour recall in classifying individuals into different categories of intakes ranged from 0.81 for riboflavin and carotene to 0.92 for carbohydrate and zinc in the DHQ and from 0.75 for riboflavin to 0.96 for carbohydrate in the FFQ.Conclusions: Both DHQ and FFQ were valid in assessing most nutrient intakes and classifying individuals in different categories of intakes in the Iranian population. Keywords: food frequency questionnaire, diet history questionnaire, validationCitation: Toorang F; Sasanfar B; Esmaillzadeh A; Ebrahimpour-Koujan S; Zendehdel K. Comparison of validity of the Food Frequency Questionnaire and the Diet History Questionnaire for assessment of energy and nutrients intakes in an Iranian population. East Mediterr Health J. 2020;26(9):1062-1069. https://doi.org/10.26719/emhj.19.099Received: 25/04/18; accepted: 04/12/18Copyright © World Health Organization (WHO) 2020. Open Access. Some rights reserved. This work is available under the CC BY-NC-SA 3.0 IGO li-cense (https://creativecommons.org/licenses/by-nc-sa/3.0/igo)
IntroductionDietary intakes are increasingly recognized as key con-tributing factors in the development of several chronic diseases (1). However, assessment of long-term dietary intakes in epidemiologic studies is always challenging (2,3).
The Food Frequency Questionnaire (FFQ) has been suggested as an acceptable (and the most feasible) method for collecting usual dietary intake data in epidemiologic studies (4). Several valid FFQs are available in the Islamic Republic of Iran, however, most have been designed for special groups or were used for assessing only a few nutrients or food groups. Two of these FFQs were used in the Golestan Cohort Study and the Tehran Lipid and Glucose Study (5,6). Both were designed to examine usual dietary intakes that are related to the risk of cancer or cardiovascular disease. The validity of the FFQ in the Golestan Cohort Study has been examined only in
Golestan province, a small state in the northern part of the country (5); the one in the Tehran Lipid and Glucose Study has been validated for people living in Tehran (6), however, FFQs are sensitive to the dietary habits and dietary culture of the studied population (7). It seems that these FFQs are not appropriate for capturing dietary data from a socioeconomically diverse population with a wide range of variations in dietary intake. It must also be borne in mind that these FFQs do not have information on cooking methods, which might be an important contributing factor to disease incidence (4).
We developed a new FFQ for finding dietary determinants of cancer, based on the one suggested by American National Cancer Institute, in which we incorporated a food list along with questions about dietary habits and cooking methods. Its innovative ability to measure added fats and cooking methods makes it superior to available FFQs (8). However, its validity needs
1063
Research article EMHJ – Vol. 26 No. 9 – 2020
to be examined before application in large-scale studies in the country.
This study aimed to examine the validity of a newly developed Diet History Questionnaire (DHQ) against 24-hour recall to assess energy and nutrient intakes in healthy Iranian participants. We also compared the accuracy of the DHQ and the Golestan FFQ for estimating nutrient intakes in this study.
MethodsStudy participantsWe recruited 102 apparently healthy adults aged 20+ years who were selected from relatives of patients ad-mitted to the Cancer Institute in Tehran between April 2011 and February 2012. According to Willet, the number of participants required to detect validation of a food fre-quency questionnaire is 110; a sample size larger than 150 subjects provides little additional precision and precision level in validation studies with less than 30 subjects is unacceptable (3). We initiated the study with larger sam-ple size as we expected a sizable number would be lost to fallow-up. We recruited individuals from different age groups in 5-year strata. The participants were recruited after evaluation of the study criteria and signing written informed consent. Required information on demograph-ic variables and medical history was obtained via a ques-tionnaire. Exclusion criteria were pregnancy or lactation among women or being on a special diet for any reason.
Developing food questionnairesThe DHQ was developed by a group of nutritionists based on the Diet History Questionnaire of the American National Cancer Institute. Initially, a comprehensive list of food and mixed dishes was prepared based on earli-er studies in the country (5,6). Then, those with greater nutrient density and the highest frequency consumption were included in the questionnaire. We also considered foods that contributed to between-person variations. Ul-timately, this DHQ comprised 146 main questions related to mixed dishes and food items. For each food item in the questionnaire, multiple choice frequency response cate-gories along with specified portion sizes were included. Frequency response categories were not the same for all items, varying from never to every day, and the number of choices was increased for more frequent foods like bread. Portion sizes were chosen based on normal por-tion size of that food item in the community. We also included questions along with every food item about di-etary habits, including some information on fat content and cooking methods.
The FFQ was a 116-item semi-quantitative question-naire asking about average frequency and portion size. It is based on food items rather than mixed dishes. Both the FFQ and the DHQ probe information related to aver-age consumption during the previous 12 months.
Study protocolThe study was approved by the ethical committee of Tehran University of Medical Sciences. The interviewer explained the study procedures and obtained written in-formed consent from all participants. Face-to-face inter-views were conducted to complete the DHQ. These were carried out by interviewers who had a degree in public health from the Cancer Institute of Iran. Subsequently, the participants were asked to take part in an additional interview to complete the FFQ one week after the first interview. It took about 45 minutes to complete the DHQ and 35 for the FFQ.
After this, participants were called by trained nutritionists every 2 months for one year to report their 24-hour food recalls. Each recalls interview took around 40 minutes. In all, 105 participants completed all the recalls. The participants provided detailed descriptions of each food, including the method of preparation and recipe for mixed dishes. All DHQ, FFQ and 24-hour recalls were checked by a trained nutritionist and incomplete questionnaires were rechecked through a phone call.
We used home measures such as spoon, ladle, platter, plate or bowl to help people remember the amount they ate. For mixed dishes, we asked women about how much of each ingredient they used to make the dish and how much they ate from it. For men, we asked questions related to the cooking methods and ingredients of mixed dishes from the person who was responsible for preparing the food.
Calculation of food and nutrient intakesAll questionnaires and recalls were checked by a trained nutritionist. Recalls were converted to grams/day and proper codes from a food composition table were allo-cated to each food by trained nutritionists in accordance with uniform procedures. As the Iranian food compo-sition table is only for raw foods and covers limited nutrients and foods, we used the translated version of McCance and Widdowson’s food composition table (9). However, we used the Iranian food composition table for some traditional Iranian foods such as kashk (10). For analysing mixed dishes, the ingredients reported by the participants were considered. For the DHQ, mixed dish-es were analysed based on a standard recipe, modified based on recalls.
Data from the FFQ and DHQ were converted into grams/day in separate programs devised by the authors in STATA statistical software. Consumption of seasonal foods like fruits were asked based on their use in season and daily intakes were estimated according to the season these foods were available. For example, we asked. “How many times are you eating a given fruit (for instance peach) when it is available”. The availability of each type of fruit was then discussed among a group of nutritionists and we determined the number of months each fruit was available in a given time, then we considered the frequency for 3 months of the year rather than whole year. For the DHQ, participants were asked 2

1064
Research article EMHJ – Vol. 26 No. 9 – 2020
questions about each food item, one about the season the food item was easily accessed in the market and another about other occasions. In both the DHQ and FFQ, we used the median portion size in cases where there was no answer to the portion size question. Based on grams of foods, we computed total energy and nutrient intakes for each participant.
Statistical analysisMean, median and standard deviation of intakes estimat-ed by DHQ, FFQ and 24-hour recalls were reported. The log transformed data was used to reduce skewedness. Data were re-checked and cleaned after initial entry and after each step of the analysis. We excluded data from en-ergy intakes outliers (3 persons) where the energy intake was > 2 standard deviations (SDs) from the mean. They constituted less than 5% of participants and correlations were not extremely affected by the exclusion. All statisti-cal analyses were performed in STATA, version 11.2.
The validity of FFQ and DHQ was estimated by comparing data with the average of 5 days of 24-hour recalls using Pearson correlation coefficients (11). Nutrient intakes were adjusted for energy intake and age using the residual method. Since reference methods like food records or 24-hour recalls are subject to day-to-day variations in dietary intake, the correlation between data from FFQs and dietary recall might be underestimated (12). Therefore, deattenuated correlation coefficients were estimated to modify the within-person variations in recalls (13,14). To estimate the attenuated correlations, we estimated within- and between-person variations by 1-way analysis of variance, then we used the formula suggested by Willet for the calculation of deattenuated correlation coefficients (13).
We also classified participants in terms of their dietary intakes into tertiles. Then, we investigated how FFQ or DHQ allocated individuals in different intake groups, considering the 24-hour recalls as the standard method. We reported the results as percentage disagreement, adjacent agreement, and complete agreement. Agreement was computed by summing adjacent agreement and complete agreement.
ResultsThe mean age of the 102 participants in our study was 43.2 (SD 12.2) years. There were 62 males and 40 females. Their characteristics are shown in Table 1.
Estimated intakes of energy and nutrients by the 3 methods are shown in Table 2. The average energy intake was higher using the FFQ (2943 kcal) than recall (2762 kcal) and DHQ (2027 kcal). Participants reported the highest intakes of carbohydrate and protein in their recalls. The highest fat intake was estimated based on data from the FFQ.
Crude Spearman correlation coefficients between DHQ and 24-hour recall ranged from 0.15 for riboflavin to 0.55 for carbohydrate (Table 3). Deattenuated Spearman correlation coefficients between DHQ and 24-hour recall
ranged from 0.31 for fat to 0.87 for biotin. Crude Spearman correlation coefficients between FFQ and 24-hour recall ranged from 0.02 for riboflavin to 0.61 for carbohydrate. Deattenuated Spearman correlation coefficients between DHQ and 24-hour recall ranged from 0.03 for riboflavin to 0.74 for iron.
Deattenuated Spearman correlation coefficients ≥ 0.5 were obtained for energy, carbohydrate, protein, fibre, vitamin A, carotene, niacin, folate, vitamin B12, biotin, vitamin C, sodium, magnesium, iron, zinc and selenium between DHQ and the average for 24-hour dietary recalls.
Comparing FFQ and the average of 24-hour dietary recalls, we found that the deattenuated Spearman correlation coefficients were > 0.5 for energy, carbohydrate, protein, carotene, niacin, vitamin B6, folate, vitamin B12, biotin, vitamin C, calcium, iron, zinc and selenium.
The fraction of participants classified into the correct or adjacent category, expressed as agreement, ranged from 0.81 for riboflavin and carotene to 0.92 for carbohydrate and zinc, comparing DHQ data with the 24-hour recall data (Table 4). The corresponding figures for FFQ ranged from 0.75 for riboflavin to 0.96 for carbohydrate.
DiscussionWe studied the validity of the DHQ and FFQ for assess-ment of dietary intakes among the Iranian population. We found that both DHQ and FFQ were valid instru-ments for assessing long-term dietary intakes of sever-al nutrients. There were slight differences between the DHQ and FFQ in assessing most of the nutrients; how-ever, DHQ had additional questions about food prepara-tion methods, which could be an advantage for studies on specific disease like cancer. The FFQ was slightly better
Table 1 Characteristic of Iranian adult participants (n = 102) in the validity study for the Food Frequency Questionnaire and the Diet History Questionnaire
Characteristic No. %Marital status
Single 20 19.6
Married 82 80.4
Sex
Male 62 60.8
Female 40 39.2
Education level
Illiterate 2 2.0
Lower than high school 34 35.1
High school 35 36.1
University 27 27.8
Mean SD
Age (years) 43.2 12.3
Body mass index (kg/m2) 25.3 0.5SD = standard deviation
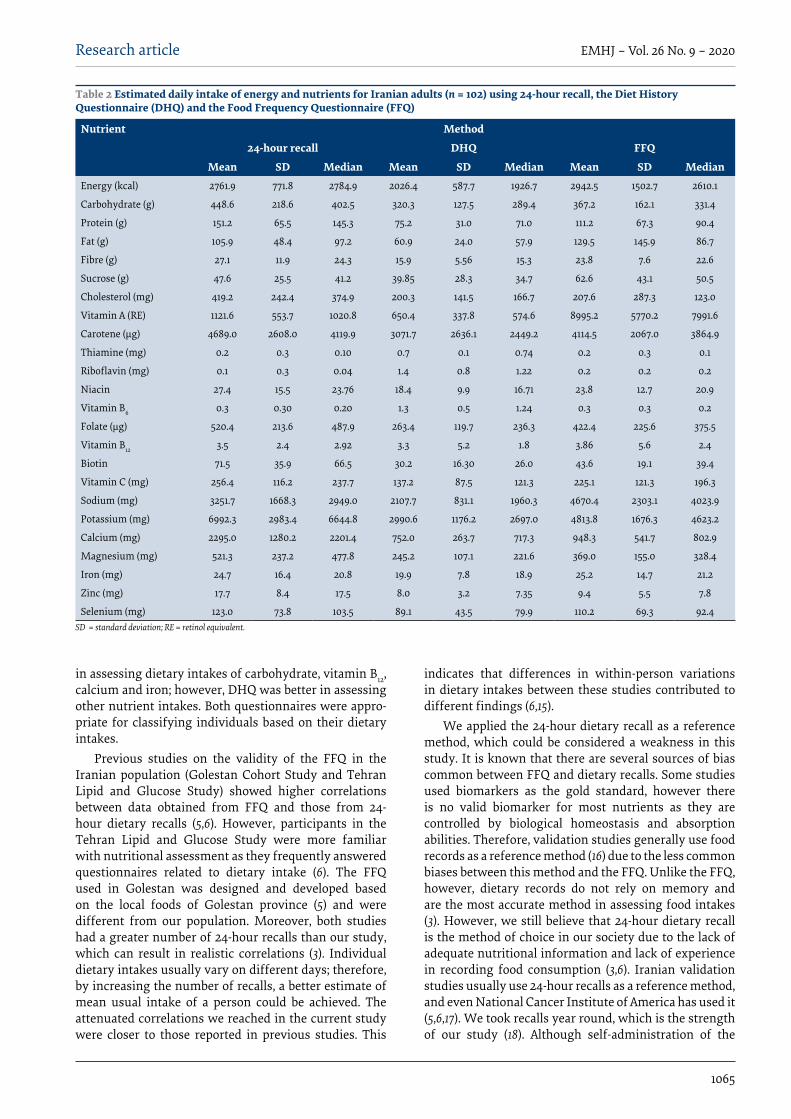
1065
Research article EMHJ – Vol. 26 No. 9 – 2020
in assessing dietary intakes of carbohydrate, vitamin B12, calcium and iron; however, DHQ was better in assessing other nutrient intakes. Both questionnaires were appro-priate for classifying individuals based on their dietary intakes.
Previous studies on the validity of the FFQ in the Iranian population (Golestan Cohort Study and Tehran Lipid and Glucose Study) showed higher correlations between data obtained from FFQ and those from 24-hour dietary recalls (5,6). However, participants in the Tehran Lipid and Glucose Study were more familiar with nutritional assessment as they frequently answered questionnaires related to dietary intake (6). The FFQ used in Golestan was designed and developed based on the local foods of Golestan province (5) and were different from our population. Moreover, both studies had a greater number of 24-hour recalls than our study, which can result in realistic correlations (3). Individual dietary intakes usually vary on different days; therefore, by increasing the number of recalls, a better estimate of mean usual intake of a person could be achieved. The attenuated correlations we reached in the current study were closer to those reported in previous studies. This
indicates that differences in within-person variations in dietary intakes between these studies contributed to different findings (6,15).
We applied the 24-hour dietary recall as a reference method, which could be considered a weakness in this study. It is known that there are several sources of bias common between FFQ and dietary recalls. Some studies used biomarkers as the gold standard, however there is no valid biomarker for most nutrients as they are controlled by biological homeostasis and absorption abilities. Therefore, validation studies generally use food records as a reference method (16) due to the less common biases between this method and the FFQ. Unlike the FFQ, however, dietary records do not rely on memory and are the most accurate method in assessing food intakes (3). However, we still believe that 24-hour dietary recall is the method of choice in our society due to the lack of adequate nutritional information and lack of experience in recording food consumption (3,6). Iranian validation studies usually use 24-hour recalls as a reference method, and even National Cancer Institute of America has used it (5,6,17). We took recalls year round, which is the strength of our study (18). Although self-administration of the
Table 2 Estimated daily intake of energy and nutrients for Iranian adults (n = 102) using 24-hour recall, the Diet History Questionnaire (DHQ) and the Food Frequency Questionnaire (FFQ)
Nutrient Method
24-hour recall DHQ FFQ
Mean SD Median Mean SD Median Mean SD MedianEnergy (kcal) 2761.9 771.8 2784.9 2026.4 587.7 1926.7 2942.5 1502.7 2610.1
Carbohydrate (g) 448.6 218.6 402.5 320.3 127.5 289.4 367.2 162.1 331.4
Protein (g) 151.2 65.5 145.3 75.2 31.0 71.0 111.2 67.3 90.4
Fat (g) 105.9 48.4 97.2 60.9 24.0 57.9 129.5 145.9 86.7
Fibre (g) 27.1 11.9 24.3 15.9 5.56 15.3 23.8 7.6 22.6
Sucrose (g) 47.6 25.5 41.2 39.85 28.3 34.7 62.6 43.1 50.5
Cholesterol (mg) 419.2 242.4 374.9 200.3 141.5 166.7 207.6 287.3 123.0
Vitamin A (RE) 1121.6 553.7 1020.8 650.4 337.8 574.6 8995.2 5770.2 7991.6
Carotene (μg) 4689.0 2608.0 4119.9 3071.7 2636.1 2449.2 4114.5 2067.0 3864.9
Thiamine (mg) 0.2 0.3 0.10 0.7 0.1 0.74 0.2 0.3 0.1
Riboflavin (mg) 0.1 0.3 0.04 1.4 0.8 1.22 0.2 0.2 0.2
Niacin 27.4 15.5 23.76 18.4 9.9 16.71 23.8 12.7 20.9
Vitamin B6 0.3 0.30 0.20 1.3 0.5 1.24 0.3 0.3 0.2
Folate (μg) 520.4 213.6 487.9 263.4 119.7 236.3 422.4 225.6 375.5
Vitamin B12 3.5 2.4 2.92 3.3 5.2 1.8 3.86 5.6 2.4
Biotin 71.5 35.9 66.5 30.2 16.30 26.0 43.6 19.1 39.4
Vitamin C (mg) 256.4 116.2 237.7 137.2 87.5 121.3 225.1 121.3 196.3
Sodium (mg) 3251.7 1668.3 2949.0 2107.7 831.1 1960.3 4670.4 2303.1 4023.9
Potassium (mg) 6992.3 2983.4 6644.8 2990.6 1176.2 2697.0 4813.8 1676.3 4623.2
Calcium (mg) 2295.0 1280.2 2201.4 752.0 263.7 717.3 948.3 541.7 802.9
Magnesium (mg) 521.3 237.2 477.8 245.2 107.1 221.6 369.0 155.0 328.4
Iron (mg) 24.7 16.4 20.8 19.9 7.8 18.9 25.2 14.7 21.2
Zinc (mg) 17.7 8.4 17.5 8.0 3.2 7.35 9.4 5.5 7.8
Selenium (mg) 123.0 73.8 103.5 89.1 43.5 79.9 110.2 69.3 92.4SD = standard deviation; RE = retinol equivalent.

1066
Research article EMHJ – Vol. 26 No. 9 – 2020
DHQ is easy and low cost, we preferred the interviewer-administered approach due to low literacy level in our study population.
ConclusionIn conclusion, we found that the DHQ was a valid tool for measurement of long-term nutrient intakes in epidemio-
logical studies in the Iranian population. Both question-naires were too long and time-consuming and, thus, the approach to administering these questionnaires should be chosen cautiously. The DHQ provides detailed infor-mation about cooking methods and seasoning habits of individuals, which is more appropriate for epidemiolog-ical studies on cancer and other noncommunicable dis-eases.
Table 3 Correlation coefficients of energy and nutrient intake between mean 24-hour recall and the Diet History Questionnaire (DHQ) and the Food Frequency Questionnaire (FFQ) among Iranian adults (n = 102)
Nutrient Method
DHQ FFQ
Crude Deattenuated Energy and age adjusted
Energy and age
adjusted and deatenuated
Crude Deattenuated Energy and age adjusted
Energy and age
adjusted and deatenuated
Energy 0.51 0.81 0.51 0.81 0.34 0.54 0.36 0.58
Carbohydrate 0.55 0.63 0.09 0.10 0.61 0.69 0.09 0.10
Protein 0.39 0.59 0.09 0.14 0.34 0.51 0.18 0.27
Fat 0.16 0.31 0.10 0.20 0.22 0.42 0.22 0.42
Fibre 0.35 0.70 0.22 0.44 0.11 0.22 0.06 0.11
Sucrose 0.31 0.43 0.20 0.28 0.23 0.33 0.07 0.09
Cholesterol 0.26 0.37 0.02 0.03 0.30 0.42 0.20 0.28
Vitamin A 0.29 0.77 0.25 0.67 0.12 0.31 0.08 0.20
Carotene 0.23 0.62 0.26 0.69 0.19 0.50 0.11 0.30
Thiamine 0.35 0.41 0.42 0.50 0.18 0.22 0.07 0.08
Riboflavin 0.15 0.32 0.03 0.06 0.02 0.03 0.05 0.11
Niacin 0.46 0.61 0.17 0.22 0.38 0.50 0.23 0.31
Vitamin B6 0.28 0.49 0.23 0.41 0.30 0.52 0.11 0.19
Folate 0.31 0.68 0.31 0.68 0.25 0.54 0.08 0.17
Vitamin B12 0.20 0.50 0.15 0.38 0.25 0.64 0.19 0.48
Biotin 0.27 0.87 0.19 0.61 0.21 0.68 0.28 0.91
Vitamin C 0.20 0.52 0.14 0.37 0.19 0.50 0.07 0.19
Sodium 0.44 0.57 0.20 0.25 0.32 0.42 0.06 0.08
Potassium 0.36 0.44 0.26 0.31 0.20 0.25 0.07 0.09
Calcium 0.28 0.42 0.14 0.20 0.34 0.50 0.25 0.38
Magnesium 0.41 0.55 0.20 0.27 0.25 0.34 0.09 0.12
Iron 0.39 0.70 0.03 0.05 0.42 0.74 0.26 0.47
Zinc 0.30 0.84 0.03 0.09 0.22 0.61 0.08 0.21
Selenium 0.51 0.68 0.19 0.26 0.49 0.65 0.28 0.37
AcknowledgementWe are indebted to the participants for their cooperation.
Funding: This study was supported by a grant for research from Tehran University of Medical Sciences (No. 11360).
Competing interests: None declared.

1067
Research article EMHJ – Vol. 26 No. 9 – 2020
Comparaison de la validité du questionnaire de fréquence alimentaire et du questionnaire sur les habitudes alimentaires dans l’évaluation des apports en énergie et en nutriments dans une population iranienneRésuméContexte : Les apports alimentaires sont essentiels au développement, ainsi qu’à la prévention des maladies chroniques. Le questionnaire de fréquence alimentaire a été proposé comme une méthode acceptable et pratique pour évaluer le lien entre les apports alimentaires et les maladies. Cependant, les questionnaires de fréquence alimentaire sont soumis à l’influence des habitudes alimentaires et de la culture ; ils devraient donc être validés pour la population d’étude.Objectifs : Nous avons examiné la validité du questionnaire sur les habitudes alimentaires et du questionnaire de fréquence alimentaire chez des Iraniens en bonne santé.Méthodes : Les participants à cette étude étaient des proches en bonne santé de personnes touchées par le cancer, soignées au centre anticancéreux de la République islamique d’Iran. Ils ont participé à des entretiens en présentiel. Nous avons ensuite effectué des rappels de 24 heures par téléphone tous les deux mois sur une période d’un an. En prenant pour référence les apports moyens obtenus au moyen des rappels de 24 heures, nous avons estimé les coefficients de corrélation de Pearson afin de mesurer la fiabilité du questionnaire de fréquence alimentaire et du questionnaire sur les habitudes alimentaires. Nous avons examiné la manière dont les deux questionnaires répartissaient les participants en différentes catégories d’apports alimentaires, par comparaison avec les rappels de 24 heures.Résultats : Au total, 102 sujets ont participé à notre étude. Les corrélations de Spearman corrigées pour l’atténuation étaient supérieures ou égales à 0,5 pour l’énergie, les glucides, les protéines, le carotène, la niacine, le folate, la vitamine B12, la biotine, la vitamine C, le fer, le zinc et le sélénium dans les deux questionnaires. Le niveau de concordance avec le rappel des 24 heures pour la classification des sujets dans les différentes catégories d’apports alimentaires allait de
Table 4 Agreement, adjacent agreement and complete disagreement of the Food Frequency Questionnaire (FFQ)-, the Diet History Questionnaire (DHQ)-driven intakes and average 24-hour recall among Iranian adults (n = 102)
Nutrient Method
DHQ FFQ
Agreement Complete agreement
Adjacent agreement
Complete disagreement
Agreement Complete agreement
Adjacent agreement
Complete disagreement
Energy 0.90 0.50 0.40 0.09 0.86 0.44 0.43 0.14
Carbohydrate 0.92 0.48 0.44 0.07 0.96 0.61 0.35 0.04
Protein 0.88 0.43 0.45 0.11 0.87 0.51 0.36 0.13
Fat 0.83 0.38 0.45 0.17 0.77 0.46 0.32 0.18
Fibre 0.85 0.43 0.42 0.14 0.87 0.43 0.45 0.13
Sucrose 0.90 0.50 0.40 0.09 0.86 0.44 0.43 0.14
Cholesterol 0.86 0.40 0.46 0.13 0.85 0.44 0.42 0.15
Vitamin A 0.82 0.39 0.43 0.18 0.80 0.36 0.45 0.20
Carotene 0.81 0.36 0.45 0.18 0.82 0.42 0.41 0.18
Thiamine 0.83 0.36 0.47 0.16 0.83 0.34 0.49 0.17
Riboflavin 0.81 0.37 0.44 0.18 0.75 0.24 0.51 0.25
Niacin 0.87 0.45 0.42 0.12 0.88 0.48 0.41 0.12
Vitamin B6 0.86 0.45 0.42 0.13 0.84 0.40 0.45 0.16
Folate 0.80 0.37 0.43 0.19 0.88 0.38 0.50 0.12
Vitamin B12 0.85 0.43 0.41 0.15 0.84 0.49 0.36 0.16
Biotin 0.82 0.39 0.43 0.17 0.81 0.41 0.41 0.19
Vitamin C 0.90 0.45 0.45 0.09 0.85 0.44 0.42 0.15
Sodium 0.87 0.44 0.43 0.12 0.86 0.42 0.45 0.14
Potassium 0.85 0.46 0.39 0.14 0.87 0.47 0.41 0.13
Calcium 0.88 0.45 0.43 0.11 0.84 0.42 0.43 0.16
Magnesium 0.87 0.49 0.38 0.12 0.90 0.47 0.44 0.10
Iron 0.87 0.43 0.44 0.13 0.84 0.44 0.41 0.16
Zinc 0.92 0.51 0.41 0.08 0.89 0.45 0.45 0.11
Selenium 0.87 0.42 0.45 0.13 0.85 0.37 0.49 0.15

1068
Research article EMHJ – Vol. 26 No. 9 – 2020
التحقق من صحة استبيان تواتر الغذاء مقابل استبيان تاريخ النظام الغذائي لتقييم الطاقة ومدخوالت العنارص الغذائية لدى جمموعة من السكان اإليرانيني
فاطمة تورنج، هباريح ساسنفر، أمحد إسامعيل زاده، ثريا إبراهيم بور كوجان، كاظم زندهيدل
اخلالصةاخللفية: تعترب املدخوالت الغذائية رضورية للنامء والوقاية من األمراض املزمنة. وقد اقتح استخدام استبيان تواتر الغذاء بوصفه إحدى الطرق املجدية املقبولة لتقييم العالقة بني املدخول الغذائي واإلصابة باألمراض. ولكن نظرا ألن استبيانات تواتر الغذاء تتأثر بالعادات الغذائية والثقافة،
فينبغي أن تكون مالئمة لالستخدام مع السكان الذين تشملهم الدراسة.األهداف: هدفت هذه الدراسة إىل حتري صحة استبيان تاريخ النظام الغذائي، واستبيان تواتر الغذاء لتطبيقهام عىل مستوى اإليرانيني األصحاء.
طرق البحث: كان املشاركون من األقارب األصحاء لبعض مرىض الرسطان يف املعهد اإليراين للرسطان. وقد شاركوا يف مقابالت أجريت وجها وباعتبار كامل. عام ملدة شهرين كل املنرصمة ساعة وعرشين األربع مدار عىل الغذائي النظام الستعراض هاتفية مكاملات أجريت كام لوجه. لية املكاملات اخلاصة باستعراض النظام الغذائي عىل مدار األربع وعرشين ساعة املنرصمة مقياسا دقيقا، قدر معامل ارتباط بريسون لقياس مدى معواستبيان تواتر الغذاء واستبيان تاريخ النظام الغذائي. وقد حترينا كيفية تصنيف األفراد يف فئات املدخوالت املختلفة عن طريق استبيان تواتر الغذاء
واستبيان تاريخ النظام الغذائي مقارنة باستعراض النظام الغذائي عىل مدار األربع وعرشين ساعة املنرصمة.النتائج: كان إمجايل عدد املشاركني يف الدراسة 102 شخصا. وقد بلغت قيم ارتباط سبريمان الضعيفة ≤ 0.5 للطاقة، والكربوهيدرات، والربوتني، تاريخ استبيان والسيلينيوم، وذلك يف كل من والزنك، وفيتامني ج، واحلديد، والبيوتني، وفيتامني ب12، والفوالت، والنياسني، والكاروتني، النظام الغذائي واستبيان تواتر الغذاء. وتراوح معدل التوافق بالنسبة الستعراض النظام الغذائي عىل مدار األربع وعرشين ساعة املنرصمة لتصنيف األفراد إىل فئات خمتلفة حسب املدخوالت من 0.81 للريبوفالفني والكاروتني إىل 0.92 للكربوهيدرات والزنك يف استبيان تاريخ النظام الغذائي،
ومن 0.75 للريبوفالفني إىل 0.96 للكربوهيدرات يف استبيان تواتر الغذاء.االستنتاجات: كان كل من استبيان تاريخ النظام الغذائي واستبيان تواتر الغذاء صاحلني لالستخدام يف تقييم أغلب مدخوالت العنارص الغذائية يف
الفئات املختلفة للمدخوالت بني السكان اإليرانيني.
0,81 pour la riboflavine et le carotène à 0,92 pour les glucides et le zinc dans le questionnaire sur les habitudes alimentaires, et de 0,75 pour la riboflavine à 0,96 pour les glucides dans le questionnaire de fréquence alimentaire.Conclusions : Le questionnaire de fréquence alimentaire et le questionnaire sur les habitudes alimentaires convenaient tous deux pour évaluer la plupart des apports nutritionnels ainsi que pour classifier les participants en différentes catégories d’apports alimentaires dans la population iranienne.
References1. Amuna P, Zotor FB. Epidemiological and nutrition transition in developing countries: impact on human health and develop-
ment: the epidemiological and nutrition transition in developing countries: evolving trends and their impact in public health and human development. Proceedings of the Nutrition Society. 2008;67(1):82–90. https://doi.org/10.1017/S0029665108006058
2. Kaaks R. Biochemical markers as additional measurements in studies of the accuracy of dietary questionnaire measurements: conceptual issues. Am J Clin Nutr. 1997;65(4):1232S–9S. doi:10.1093/ajcn/65.4.1232S
3. Willett W. Nutritional epidemiology, 3rd ed. Oxford: Oxford University Press; 2012.
4. Subar AF, Thompson FE, Kipnis V, Midthune D, Hurwitz P, McNutt S, et al. Comparative validation of the Block, Willett, and Na-tional Cancer Institute food frequency questionnaires: the Eating at America’s Table Study. Am J Epidemiol. 2001;154(12):1089–99. doi:10.1093/aje/154.12.1089
5. Malekshah A, Kimiagar M, Saadatian-Elahi M, Pourshams A, Nouraie M, Goglani G, et al. Validity and reliability of a new food frequency questionnaire compared to 24 h recalls and biochemical measurements: pilot phase of Golestan cohort study of esophageal cancer. Eur J Clin Nutr. 2006;60(8):971. doi:10.1038/sj.ejcn.1602407
6. Mirmiran P, Esfahani FH, Mehrabi Y, Hedayati M, Azizi F. Reliability and relative validity of an FFQ for nutrients in the Tehran Lipid and Glucose Study. Public Health Nutr. 2010 May;13(5):654–62. doi:10.1017/S1368980009991698
7. Ngo J, Gurinovic M, Frost-Andersen L, Serra-Majem L. How dietary intake methodology is adapted for use in European immi-grant population groups–a review. Br J Nutr. 2009 Jul;101 Suppl 2:S86–94. doi:10.1017/S0007114509990614
8. Block G, Woods M, Potosky A, Clifford C. Validation of a self-administered diet history questionnaire using multiple diet re-cords. J Clin Epidemiol. 1990;43(12):1327–35. doi:10.1016/0895-4356(90)90099-b
9. Dorosti A, Tabatabaei M. Food composition table. Iran Nutr World J. 2007;16:15–20.

1069
Research article EMHJ – Vol. 26 No. 9 – 2020
10. Azar M, Sarkisian E. Food composition table of Iran. Tehran: National Nutrition and Food Research Institute, Shaheed Beheshti University; 1980;65.
11. Cade J, Thompson R, Burley V, Warm D. Development, validation and utilisation of food-frequency questionnaires–a review. Public Health Nutr. 2002 Aug;5(4):567–87. PMID:12186666
12. Boushey CJ, Coulston AM, Rock CL, Monsen E, eds. Nutrition in the prevention and treatment of disease. Boston: Elsevier; 2001.
13. Willet W. Correction for the effects of measurement error. In: Willet W, ed. Nutritional epidemiology, 2nd ed. Oxford: OUP; 1998. doi:10.1093/acprof:oso/9780199754038.003.0012
14. Rosner B, Willett W. Interval estimates for correlation coefficients corrected for within-person variation: implications for study design and hypothesis testing. Am J Epidemiol. 1988;127(2):377–86. doi:10.1093/oxfordjournals.aje.a114811
15. Ocke MC, Bueno-de-Mesquita HB, Pols MA, Smit HA, van Staveren WA, Kromhout D. The Dutch EPIC food frequency question-naire. II. Relative validity and reproducibility for nutrients. Int J Epidemiol . 1997;26(Suppl. 1):S49. doi:10.1093/ije/26.suppl_1.s49
16. Ahn Y, Kwon E, Shim JE, Park MK, Joo Y, Kimm K, et al. Validation and reproducibility of food frequency questionnaire for Kore-an genome epidemiologic study. Eur J Clin Nutr. 2007;61:1435. doi:10.1038/sj.ejcn.1602657
17. Subar AF, Thompson FE, Kipnis V, Midthune D, Hurwitz P, McNutt S, et al. Comparative Validation of the Block, Wil-lett, and National Cancer Institute food frequency questionnaires The Eating at America’s Table Study. Am J Epidemiol. 2001;154(12):1089–99. doi:10.1093/aje/154.12.1089
18. Serra-Majem L, Andersen LF, Henríque-Sánchez P, Doreste-Alonso J, Sánchez-Villegas A, Ortiz-Andrelluchi A, et al. Evaluating the quality of dietary intake validation studies. Br J Nutr. 2009 Dec;102 Suppl 1:S3-9. doi:10.1017/S0007114509993114.

1070
Research article EMHJ – Vol. 26 No. 9 – 2020
Adherence to the Mediterranean diet of school-age children in Moroccan oases, Draa-Tafilalet RegionKarima Azekour,1 Zahra Outaleb,1 Mohamed Eddouks,1 Farid Khallouki1 and Bachir El Bouhali1
1Department of Biology, Faculty of Sciences and Techniques, Moulay Ismail University, Errachidia, Morocco (Correspondence to: B. El Bouhali: [email protected])
AbstractBackground: Dietary patterns, eating behaviour and lifestyle are changing in Morocco. It would be interesting to identi-fy and evaluate this transition in its Mediterranean context.Aims: To assess adherence to the Mediterranean diet (MedDiet) and analyse associated factors in school-age children living in oasis environments. Methods: A cross-sectional survey was conducted among 3684 school-age children between May 2015 and November 2017 in Tafilalet Oasis. The mean age was 9.81 (2.13), 51.3% were girls, and 62.7% were from urban areas. Participants were recruited from public primary schools. Adherence to the MedDiet was evaluated by Mediterranean Diet Quality (KID-MED) index. Socioeconomic characteristics and anthropometric measurements were obtained.Results: Only 2.12% had a poor KIDMED index, 57.9% had an average index and 39.98% had a high index. Maternal eth-nicity was associated with degree of adherence to the MedDiet. Poor adherence was seen in 2.17% of urban participants compared with 2.04% of rural participants. Participants with high income were more likely to have good adherence to the MedDiet. Low levels of parental education were more likely to result in higher levels of poor adherence. There was no significant correlation between body weight and KIDMED index.Conclusions: Most of the study population had medium to good adherence to MedDiet, but low KIDMED index was ob-served. Interventions and strategies should be devised for preserving and promoting healthy eating habits in this target population.Keywords: Mediterranean diet, school-age children, oasis, Draa-Tafilalet, Morocco.Citation: Azekour K; Outaleb Z; Eddouks M; Khallouki F; El Bouhali B. Adherence to the Mediterranean diet of school-age children in Moroccan oases, Draa-Tafilalet Region. East Mediterr Health J. 2020;26(9):1070-1077. https://doi.org/10.26719/emhj.20.023Received: 24/04/19; accepted: 18/19/19Copyright © World Health Organization (WHO) 2020. Open Access. Some rights reserved. This work is available under the CC BY-NC-SA 3.0 IGO license (https://creativecommons.org/licenses/by-nc-sa/3.0/igo)
Introduction The Mediterranean diet (MedDiet) is widely studied and is considered to be the healthiest dietary model in the world. It incorporates the traditional healthy living habits of populations from the Mediterranean Region. In 2013, it was included on the United Nations Educational, Scientific and Cultural Organization Intangible Cultural Heritage list (1). The MedDiet varies among countries bordering the Mediterranean Sea, but in general, it is known by abundant consumption of vegetables, fresh or dried fruits, cereals, olive oil as the main source of fats; moderate intake of fish, meat and dairy products; and low intake of eggs and sweets (2). It is recognized as hav-ing several beneficial effects on health. Numerous stud-ies have concluded that the MedDiet is a protective factor against many chronic illnesses, such as diabetes, cancer and cardiovascular diseases (3,4). In a particular sample of 3042 participants, adherence to the MedDiet was asso-ciated with 15% lower incidence of cardiovascular disease (5). Nonetheless, data about children’s MedDiet adher-ence, especially in Morocco, are lacking.
Therefore, the aim of the present study was to investigate the level of adherence to the MedDiet among school-age children living in Tafilalet Oasis, which is
located far from major cities and considered to be the largest oasis in the world. It has several specific features that differ considerably from those in other Moroccan regions, such as low level of urbanization, high poverty and specific culinary habits based on high consumption of vegetables, in particular, dates, okra, collards and alfalfa. The study was carried out to investigate socioeconomic and anthropometric factors associated with adherence to the MedDiet. School-age children were selected because they developed in a poor and precarious context, and the impact of these conditions was more important in children than adults. Furthermore, childhood is a period of cognitive and physical development accompanied by increasing nutritional needs.
MethodsDescription of the study siteThe Drâa-Tafilalet Region is located in the Southeast of Morocco and consists of an area of 88 836 km2. According to the general census of the population and the habitat of 2014, the region had 1 635 008 inhabitants (4.83% of the national population); of whom, 34.30% were urban dwell-ers, which was significantly lower than the national rate

1071
Research article EMHJ – Vol. 26 No. 9 – 2020
of 60.36%. The region is dominated by oasis that occu-pies 88% of the surface area (46% of the Moroccan oases). At the administrative level, the Region is divided into 5 provinces (Figure 1) (6).
Study designThis cross-sectional study was conducted between May 2015 and November 2017 in Tafilalet Oasis. The random sample was produced to represent at least 1% of the tar-get population. We randomly selected 39 public primary schools from a total of 284 from urban and rural areas of the Oasis. Moreover, one class by level was chosen in each elementary school (1, 2, 3, 4, 5 and 6 levels). The number of students per classroom varied from 28 to 50, and 30–50% of the students per class were sampled. The study sample was taken from mixed-sex classes. Face-to-face interviews were conducted using an assisted ques-tionnaire, and anthropometric measurements noted. Authorization was obtained from the regional and local education authorities, and oral consents of parents or tu-tors was required.
Study populationThe study group included 3684 school-age children. There were 1890 (51.3%) girls and 1794 (48.7%) boys, with an av-erage age of 9.81 (2.13) years. Over the study period, only children with parents who had agreed to participate were included. Children whose parents/tutors did not consent to answer the questionnaire were excluded. All children included in the sampling were apparently healthy with no physical diseases or disabilities.
QuestionnaireThe questionnaire was divided into 2 sections: the first comprised questions for assessing socioeconomic sta-tus, and the second measured the degree of dietary ad-herence. Dates of birth of all children were noted from
the list given by the teachers. Education of parents was classified into 4 categories: university, secondary, pri-mary and illiterate. Other questions were: ethnicity of mother’s children (people who spoke Arabic were con-sidered Arab and those who spoke Amazigh were consid-ered Amazigh); urban or rural residence; occupation, em-ployed or not; school time (morning, afternoon or both); type of family (nuclear or joint); family size (3 or 4, 5 or 6, or ≥ 7 persons); and monthly family income: > 5000 Mo-roccan Dirham (MAD) was considered to be high, 2001–4999 MAD medium, and < 2000 MAD low.
The degree of adherence to the MedDiet was evaluated by the Mediterranean Diet Quality Index (KIDMED). It is one of the most recent methods, which is widely used to evaluate adherence to the MedDiet, and has proven reliability (7). The KIDMED questionnaire was translated into Arabic and Amazigh languages (reliability test was performed to ensure translations). It contains 16 items, and evaluates frequency of intake of 8 food groups: vegetables, beans, fruits, nuts, cereal, fish, dairy products and olive oil. Consumption of fast food, baked goods and sweets, and skipping breakfast are scored as 1 and remaining questions as +1. According to the KIDMED classification, a score of 0–3 reflects low adherence to the MedDiet, 4–7 average adherence that needs improvement, and 8–12 strong adherence that reflects optimal quality diet (higher scores indicating greater adherence) (8).
Pilot sampleBefore the survey, the questionnaire was administered to a pilot sample of 43 children from the same survey popu-lation with the same conditions as those for the total sur-vey, and they were not included in the study population.
Figure 1 Geographical location of the region Drâa-Tafilalet in Morocco
13
Commented [CK2]: We need to check whether the authors have permission to show this figure?

1072
Research article EMHJ – Vol. 26 No. 9 – 2020
Anthropometric measurementsMeasurements of weight and height were taken care-fully, as described previously (9). Children were weighed without shoes, wearing a few clothes, using a weight scale (seca 804). Height was measured standing upright, feet together using a height measuring board. The body mass index (BMI) for age was calculated for all children and z scores were determined using World Health Or-ganization (WHO) AnthroPlus software. Rates of obesity and overweight were assessed among children based on the new WHO standards of growth. Overweight was in-dicated by a z score > +1 standard deviation (SD), obesity by > +2 SD, underweight by < 2, and severe underweight < 3 SD (10).
Data analysisData were entered, coded, checked, and analysed using appropriate statistical software. A descriptive analysis of all variables was performed. Categorical variables were expressed as numbers and percentages. Associations and correlations between studied variables were assessed us-ing the χ2 test. P < 0.05 was considered significant. Mul-tiple regression analysis was performed to detect which of the socioeconomic characteristics or weight was the most associated with adherence to the MedDiet.
ResultsThe total study population was included in the analysis (Table 1). Children who refused to participate or were ab-sent were not included in the survey. The total sample in-cluded 3684 scholars (response rate, 94%) and 62.7% were from urban areas. For fathers’ occupation, 67.4% were un-employed, and 85.99% of the mothers were housewives. Concerning maternal education, 38.6% were illiterate compared with 21.9% of fathers. Only 16.56% of parents earned > 5000 MAD, 66.07% earned 2001–4999 MAD and 17.37% earned < 2000 MAD. The average family size was 6.4 (2.63) persons/household, and 82.4% of the families were nuclear. Concerning socioeconomic characteris-tics, only ethnicity of mothers (P=0.043) and schooltime (P=0.017) were significantly associated with sex (Table 1).
Table 2 shows the results of KIDMED according to sociodemographic and economic factors. KIDMED classification was good in 39.98% of the population, medium in 57.90% and poor in 2.12%. There was no significant correlation between KIDMED scores and sex, family size and maternal education. However, urban region showed a significant increase (2.17%) in poor adherence to MedDiet compared with rural region (2.04%) (P = 0.002). The percentage of the population with a low KIDMED score was 1.22% among those that spoke Arabic versus 2.57% among those that spoke Amazigh, and this correlation was highly significant (P < 0.001). Medium and low monthly family incomes were less likely to result in good adherence to the MedDiet (P < 0.001). Lower parental educational level had lower KIDMED scores. The association with school period was strongly significant, with children at school full
time tending to have lower MedDiet adherence (P < 0.001). Finally, significant differences were observed for KIDMED scores according to age group, occupation and type of family (P = 0.031, 0.015 and 0.019, respectively).
According to multiple logistic regression, adherence to the MedDiet was more associated with maternal ethnicity and school time (Table 3).
The associations between KIDMED scores and BMI classification are shown in Table 4. Two hundred and eighty-five (7.74%) children were underweight, 2930 (79.53%) had normal corpulence, 399 (10.83%) were overweight and 70 (1.90 %) were obese according to WHO growth reference for school-aged children and adolescents. There was no significant association between body weight and KIDMED score (P > 0.05). Consumption of fruit, vegetables, fish (at least 2 or 3 times per week), pulses/beans, pasta or rice (≥ 5 times per week), nuts/dry fruits (at least 2 or 3 times per week) were correlated with body weight of children (P = 0.004, 0.008, 0.004, 0.002, 0.040 and 0.025, respectively).
DiscussionThe main purposes of the present study were to evaluate the level of adherence to the MedDiet in school-age chil-dren in Tafilalet Oasis and to analyse associated factors such as socioeconomic characteristics and body weight. The degree of adherence to the MedDiet differs among Mediterranean countries and even within the same country. In the current study, 2.1% of school-age children had low adherence to the MedDiet. In national studies, despite their rarity, low adherence to the MedDiet was more frequent than in the present study at 29.90% in Fez (11) and 14.50% in Ouarzazate (12). These findings may be explained by the particular features of Tafilalet Oasis related to degree of urbanization, and food and culinary culture that may have an impact on food habits and food preparation rather than resistance to changes in dietary intake and nutritional transition. Our results also differ from other Mediterranean countries, especially the East-ern Mediterranean Region and Arab countries. A me-ta-analysis of 41 countries showed that most have tended to drift away from a Mediterranean-like dietary pattern (13). The Mediterranean European countries, especially Greece, experienced the greatest decrease in Mediterra-nean Adequacy Index value (an assessment of how close a diet is to the MedDiet (13). Poor adherence was noted at 46.8% in Greece among 4786 children aged 10–12 years (14); 32.8% in Italy in 1740 children aged 8–9 years (15); 42.7% in 354 Turkish medical school students (206 first year and 148 third year) with a mean age of 19.57 (1.65) years (16); and 21.8% in 193 students enrolled in public and private universities in Cyprus (17).
There was no significant association between adherence to the MedDiet and sex. The same result was found in other studies (15,18). This trend is more likely to be closer to the reality in this Oasis population, probably because of the chosen age of the participants. However, there was a significant correlation between age and

1073
Research article EMHJ – Vol. 26 No. 9 – 2020
MedDiet adherence, children aged > 9 years were more likely to have a good MedDiet score. Similar results were found in the study of Bibiloni et al. (19) but contrary to the studies of Farajian et al. (14) and Grosso et al. (20). There were significant differences in adherence to the MedDiet according to monthly family income and paternal education and occupation. Low standard of living and education were less likely to lead to good adherence to the MedDiet. This is in agreement with previous studies
that correlated high consumption of non-Mediterranean food with low socioeconomic status (21, 22) but contrasted with the results of El Rhazi et al. (11) who did not find any correlations. Regarding place of residence, lower adherence was associated with living in an urban area compared to rural area. Outcomes were in line with the findings of Grosso et al. (20) but were in disagreement with those reported by El Rhazi et al. (11). Significant differences in adherence to the MedDiet were noted with
Table 1 Sociodemographic and economic characteristics according to sex of school children (n = 3684).
Characteristics Girls n (%)
Boys n (%)
Totaln (%)
P
Place of residence 0.293
Urban 1200 (51.97) 1109 (48.03) 2309 (62.70)
Rural 690 (50.18) 685 (49.82) 1375 (37.30)
Age groups (years) 0.479
5–9 872 (52.28) 796 (47.72) 1668 (45.3)
10–12 841 (50.78) 815 (49.22) 1656 (45.0)
≥ 13 177 (49.17) 183 (50.83) 360 (9.80)
Father’s occupation 0.692
Employed 610 (50.83) 590 (49.17) 1200 (32.60)
Unemployed 1280 (50.12) 1204 (49.88) 2454 (67.40)
Ethnicity 0.043
Arab 659 (53.66) 569 (44.75) 1228 (33.30)
Amazigh 1231 (50.12) 1225 (49.88) 2456 (66.70)
Type of family 0.484
Nuclear 1550 (51.04) 1487 (48.96) 3037 (82.40)
Joint 340 (52.55) 307 (47.45) 647 (17.60)
Family size 0.651
3 or 4 306 (53.03) 271 (46.97) 577 (15.70)
5 or 6 928 (51.13) 887 (48.87) 1815 (49.30)
≥ 7 656 (50.77) 636 (49.23) 1292 (35.10)
School time 0.017
Morning 140 (44.16) 177 (55.84) 317 (8.60)
Afternoon 241 (54.28) 205 (45.72) 444 (12.10)
Full time 1509 (51.62) 1414 (48.38) 2923 (79.30)
Maternal education 0.245
University 122 (45.35) 147 (54.65) 269 (7.30)
Secondary 339 (51.75) 316 (48.25) 655 (17.80)
Primary 696 (51.98) 643 (40.02) 1339 (36.30)
Illiterate 733 (51.58) 688 (48.42) 1421 (38.60)
Paternal education 0.250
University 377 (48.77) 396 (51.23) 773 (21.00)
Secondary 498 (50.82) 482 (49.18) 980 (26.60)
Primary 600 (53.42) 523 (46.58) 1123 (30.50)
Illiterate 415 (51.36) 393 (48.64) 808 (21.90)
MFI (MAD) 0.072
High (≥ 5000) 290 (47.54) 320 (52.46) 610 (16.60)
Medium (2001–4999 ) 1255 (51.56) 1179 (48.44) 2434 (66.10)
Low (≤ 2000) 345 (53.91) 295 (46.09) 640 (17.40)MAD = Moroccan dirham; 1 US$ = 9.36 MAD; MFI = median family income.

1074
Research article EMHJ – Vol. 26 No. 9 – 2020
regard to maternal ethnicity. This may be explained by the effect of cultural differences in food preparation, food habits and consumption patterns. Body weight
was not associated with adherence to the MedDiet, but 9 components of KIDMED score were correlated with BMI of children, unlike the study conducted by
Table 2 KIDMED index in school children in Tafilalet Oasis according to sociodemographic and economic factors (n = 3684)
Characteristics MedDiet score category P
Good (≥ 8)n (%)
Average (4–7)n (%)
Poor (≤ 3)n (%)
Place of residence 0.002
Urban 973 (42.14) 1286 (55.69) 50 (2.17)
Rural 500 (36.36) 847 (61.60) 28 (2.04)
Sex 0.264
Female 778 (41.17) 1070 (56.61) 42 (2.22)
Male 695 (38.74) 1063(59.25) 36 (2.01)
Age groups (years) 0.031
5–9 623 (37.35) 1003 (60.13) 42 (2.52)
10–12 700 (42.27) 925 (55.86) 31 (1.87)
≥ 13 150 (41.67) 205 (56.94) 5 (1.39)
Father’s occupation 0.015
Employed 516 (43.00) 665 (55.42) 19 (1.58)
Unemployed 957 (38.53) 1468 (59.10) 59 (2.37)
Ethnicity <0.001
Arab 731 (59.53) 482 (39.25) 15 (1.22)
Amazigh 742 (30.21) 1651 (67.22) 63 (2.57)
Type of family 0.019
Nuclear 1188 (39.12) 1789 (58.91) 60 (1.97)
Joint 285 (44.05) 344 (53.17) 18 (2.78)
Family size 0.069
3 or 4 227 (39.34) 334 (57.89) 16 (2.77)
5 or 6 692 (38.13) 1087 (59.89) 36 (1.98)
≥ 7 554 (42.88) 712 (55.11) 26 (2.01)
School period <0.001
Morning 101 (31.86) 210 (66.25) 6 (1.89)
Afternoon 109 (24.55) 331 (74.55) 4 (0.90)
Full time 1263 (43.20) 1592 (54.46) 68 (2.34)
Maternal education 0.106
University 121(44.98) 143 (53.16) 5 (1.86)
Secondary 275 (41.99) 372 (56.79) 8 (1.22)
Primary 543 (40.55) 767 (57.28) 29 (2.17)
Illiterate 534 (37.58) 851 (59.89) 36 (2.53)
Paternal education 0.004
University 337 (43.60) 424 (54.85) 12 (1.55)
Secondary 418 (42.65) 540 (55.10) 22 (2.25)
Primary 440 (39.19) 658 (58.59) 25 (2.22)
Illiterate 278 (34.40) 511 (63.24) 19 (2.36)
MFI (MAD) <0.001
High (≥ 5000) 303 (49.67) 296 (48.52) 11 (1.81)
Medium (2001–4999) 923 (37.92) 1458 (59.90) 53 (2.18)
Low ( ≤ 2000) 247 (38.59) 379(59.22) 14 (2.19)
Total 1473 (39,98) 2133 (57.90) 78 (2,12) —MAD = Moroccan dirham; 1 US$ = 9.36 MAD; MFI = median family income.

1075
Research article EMHJ – Vol. 26 No. 9 – 2020
Anzid et al. (12) who found only one positive correlation with fish consumption. In fact, high consumption of Mediterranean food was associated with normal weight.
The present study had some limitations. First, the validity of the KIDMED questionnaire has not been previously assessed in Morocco. Second, children who had specific diets under certain conditions (e.g. low glycaemic diet for diabetes management) were not excluded.
Conclusion The level of low adherence to the MedDiet in the present study was lower than in other studies in Morocco and the Mediterranean Region, especially in the Eastern Region. High adherence to MedDiet by oasis children can be ex-plained by preserving eating habits. The socioeconomic factors were the most associated with adherence to the MedDiet, especially maternal ethnicity and school time.
Table 3 Results of logistic regression analysis
Variables B SE P OR 95% CIEthnicity Arab 0.860 0.293 0.003 2.364 1.331–4.199
Amazigh 0a
School time Morning 0.513 0.460 0.265 1.670 0.876–4.111
Afternoon 1.321 0546 0.016 3.749 1.285–10.935
Fulltime 0a
aThis parameter is set to 0 because it is redundant. B = β coefficient; CI= confidence interval; OR = odds ratio; SE = standard error.
Table 4 KIDMED scores according to BMI classification in school children in Tafilalet Oasis (n = 3684)
KIDMED test (16 questions) BMI class P*
Thinnessn (%)
Normaln (%)
Ov/Ob n (%)
Takes a fruit or fruit juice every day 233 (81.54) 2526 (86.21) 410 (87.42) 0.076
Has a second fruit every day 156 (54.74) 1827 (62.35) 314(66.95) 0.004
Has fresh or cooked vegetables regularly once a day 273 (95.79) 2765 (94.37) 427 (91.04) 0.008
Has fresh or cooked vegetables more than once a day 205 (71.93) 2111 (72.04) 329 (70.15) 0.697
Consumes fish regularly (at least 2 or 3 times/week) 79 (27.72) 1032 (35.22) 186 (39.66) 0.004
Goes more than once a week to a fast-food 47 (16.49) 486 (16.59) 117 (24.95) < 0.001
Likes pulses and eats them more than once a week 266 (93.33) 2620(89.42) 400 (85.28) 0.002
Consumes pasta or rice almost every day (≥ 5 times/week) 78 (27.37) 950(32.42) 170 (36.25) 0.040
Has cereals or grains (bread, etc.) for breakfast 259 (90.88) 2703 (92.25) 426 (90.83) 0.449
Consumes nuts regularly (at least 2 or 3 times/week) 148 (51.93) 1399(47.75) 253 (53.94) 0.025
Uses olive oil at home 265 (92.98) 2668(91.05) 423 (90.19) 0.421
Skips breakfast 97 (34.04) 1118(38.16) 193 (41.15) 0.148
Has a dairy product for breakfast (yoghurt, milk, etc.) 131 (45.96) 1447(49.39) 230 (49.04) 0.544
Has commercially baked goods or pastries for breakfast 26 (9.12) 329 (11.23) 83 (17.70) < 0.001
Takes two yoghurts and/or some cheese (40 g) daily 49(17.19) 626(21.37) 102 (21.75) 0.240
Takes sweets and candy several times every day 31(10.88) 328 (11.13) 76 (16.20) 0.007*Significance at 5%. BMI = body mass index; Ov/Ob = overweight and obesity.
AcknowledgementThe authors would like to thank the parents of the children who participated in this study, the school managers and teachers.
Funding: Grant N° UMI-2018.
Competing interests: None declared.

1076
Research article EMHJ – Vol. 26 No. 9 – 2020
Observance du régime méditerranéen chez les enfants d’âge scolaire dans les oasis au Maroc, région de Draa-TafilaletRésuméContexte : Au Maroc, les habitudes alimentaires, le comportement alimentaire et le mode de vie sont en train de changer. Il serait donc intéressant d’identifier et d’évaluer cette transition dans son contexte méditerranéen.Objectifs : Examiner l’observance du régime méditerranéen et analyser les facteurs associés chez les enfants d’âge scolaire résidant dans des environnements d’oasis. Méthodes : Une étude transversale a été menée auprès de 3 684 enfants d’âge scolaire entre mai 2015 et novembre 2017 dans l’oasis de Tafilalet. L’âge moyen des enfants était de 9,81 (2,13), dont 51,3 % de filles, et 62,7 % résidaient en zone urbaine. Les participants ont été recrutés dans des écoles primaires publiques. L’observance du régime méditerranéen a été évaluée au moyen de l’indice KIDMED, qui mesure la qualité du régime méditerranéen. Des caractéristiques socioéconomiques et des mesures anthropométriques ont également été obtenues.Résultats : Seulement 2,12 % des enfants avaient un indice KIDMED médiocre, 57,9 % avaient un indice moyen et 39,98 % avaient un indice élevé. L’appartenance ethnique de la mère était associée au degré d’observance du régime méditerranéen. Une observance médiocre a été notée chez 2,17 % des participants vivant en milieu urbain, contre 2,04 % en milieu rural. Les participants disposant de revenus élevés étaient plus susceptibles d’avoir une bonne observance du régime méditerranéen. En outre, les familles où les parents avaient de faibles niveaux d’éducation étaient plus susceptibles d’avoir des niveaux plus élevés d’observance médiocre. Il n’y avait pas de corrélation entre le poids des enfants et l’indice KIDMED.Conclusions : La majorité de la population d'étude avait une observance du régime méditerranéen comprise entre moyenne et bonne , mais nous avons également observé de faibles niveaux d’indice KIDMED. Des interventions et des stratégies devraient être mises au point afin de préserver et de promouvoir des habitudes alimentaires saines dans cette population cible.
التزام األطفال يف سن املدرسة بالنظام الغذائي املتوسطي يف الواحات املغربية، جهة درعة تافياللتكريمة أزقور، زهراء أبو طالب، حممد الدوقس، فريد خلوقي، بشري البوهايل
اخلالصةاخللفية: يشهد املغرب حاليا تغريا يف األنامط الغذائية، وسلوكيات تناول الطعام، وأنامط احلياة. وقد يكون من املهم حتديد هذا التحول يف السياق
املتوسطي وتقييمه.هدفت هذه الدراسة إىل تقييم االلتزام بالنظام الغذائي املتوسطي، وحتليل العوامل املرتبطة بذلك يف صفوف األطفال يف سن املدرسة األهداف:
الذين يعيشون يف بيئة الواحات. 2017 يف واحة الثاين نوفمرب/ترشين إىل 2015 مايو/أيار الفرتة من املدرسة يف 3684 طفال يف سن أجري مسح مقطعي عىل البحث: طرق تافياللت. وكان متوسط عمر األطفال الذين شملهم املسح 9.81 )2.13(، وشكلت الفتيات 51.3% من األطفال. وبلغت نسبة األطفال من املناطق احلرضية 62.7%. وقد تم اختيار املشاركني يف املسح من املدارس االبتدائية العامة. وقيم مدى االلتزام بالنظام الغذائي املتوسطي باستخدام
مؤرش جودة النظام الغذائي املتوسطي )KIDMED(. وحصل عىل اخلصائص االجتامعية واالقتصادية والقياسات األنثروبومرتية.النتائج: تراوحت نسب مؤرش جودة النظام الغذائي املتوسطي )KIDMED( بني منخفضة، ومتوسطة ومرتفعة يف 2.12%، و57.9%، و%39.98 االلتزام يف 2.17% من املتوسطي. ولوحظ ضعف الغذائي بالنظام االلتزام بدرجة العرقي لألمهات االنتامء وارتبط التوايل. املشاركني عىل من يتمتعون الذين املشاركني أن تبني ريفية. كام مناطق إىل ينتمون الذين املشاركني مناطق حرضية، مقابل 2.04% من إىل ينتمون الذين املشاركني بدخل أعىل من األرجح أن يلتزموا أكثر بالنظام الغذائي املتوسطي. ورجح أيضا ارتباط انخفاض املستوى التعليمي لألبوين بارتفاع مستويات عدم
.)KIDMED( االلتزام بالنظام الغذائي املتوسطي. ومل يكن هناك ترابط واضح بني وزن اجلسم ومؤرش جودة النظام الغذائي املتوسطياالستنتاجات: تراوح التزام السكان الذين شملهم املسح بالنظام الغذائي املتوسطي بني متوسط إىل جيد، ولكن لوحظ انخفاض مؤرش جودة النظام الغذائي املتوسطي )KIDMED(. وينبغي إعداد تدخالت واسرتاتيجيات للحفاظ عىل العادات الغذائية الصحية يف هذه الفئة السكانية املستهدفة
وتعزيزها.
1077
Research article EMHJ – Vol. 26 No. 9 – 2020
References1. United Nations Educational, Scientific and Cultural Organization Representative List of the Intangible Cultural Heritage of
Humanity; 2013 (http://www.unesco.org/culture/ich/en/RL/mediterranean-diet-00884, accessed 10 March 2020).
2. Davis C, Bryan J, Hodgson J, Murphy K. Definition of the Mediterranean Diet: a literature review. Nutrients. 2015 Nov 5; 7(11):9139–53. http://dx.doi.org/10.3390/nu7115459 PMID:26556369
3. Sofi F, Abbate R, Gensini GF, Casini A. Accruing evidence on benefits of adherence to the Mediterranean diet on health: an updated systematic review and meta-analysis. Am J Clin Nutr. 2010 Nov; 92(5):1189–96. http://dx.doi.org/10.3945/ajcn.2010.29673 PMID:20810976
4. Trichopoulou A, Corella D, Martinez‐Gonzalez MA, Soriguer F, Ordovas JM. The Mediterranean Diet and cardiovascular epide-miology. Nutr Rev. 2006, 64(s4), S13–9. http://dx.doi.org/10.1111/j.1753-4887.2006.tb00258.x.
5. Kastorini C-M, Panagiotakos DB, Chrysohoou C, Georgousopoulou E, Pitaraki E, Puddu PE et al. Metabolic syndrome, adherence to the Mediterranean diet and 10-year cardiovascular disease incidence: The ATTICA study. Atherosclerosis. 2016 Mar;246:87–93. http://dx.doi.org/10.1016/j.atherosclerosis.2015.12.025 PMID:26761772
6. Ministère de l’Intérieur Direction Générale des Collectivités Locales. La Région de Drâa-Tafilalet. Monographie générale; 2015 (http://www.fcs.ma/wp-content/uploads/2016/12/MONOGRAPHIE-DE-LA-REGION-DE-DRAA-TAFILALET-FR.pdf, accessed 10 March 2020) (in French).
7. Štefan L, Prosoli R, Juranko D, Čule M, Milinović I, Novak D et al. The reliability of the Mediterranean Diet Quality Index (KID-MED) Questionnaire. Nutrients. 2017 Apr 23;9(4). http:dx.doi.org/10.3390/nu9040419 PMID:28441742
8. Serra-Majem L, Ribas L, Ngo J, Ortega RM, García A, Pérez-Rodrigo C et al. Food youth and the Mediterranean diet in Spain. De-velopment of KIDMED, Mediterranean Diet Quality Index in children and adolescents. Public Health Nutr. 2004 Oct;7(7):931–5. http://dx.doi.org/10.1079/phn2004556 PMID:15482620.
9. Lohmann TG, Roche AF, Martorell R. Anthropometric standardization reference manual. 1988; Champaign, IL: Human Kinetics Books.
10. Growth reference 5–19 years. BMI-for-age (5–19 years) [website]. World Health Organization; 2007 (https://www.who.int/grow-thref/who2007_bmi_for_age/en/, accessed 10 March 2020).
11. El Rhazi K, Nejjari C, Romaguera D, Feart C, Obtel M, Zidouh A et al. Adherence to a Mediterranean diet in Morocco and its correlates: cross-sectional analysis of a sample of the adult Moroccan population. BMC Public Health. 2012;12:345. http://dx.doi.org/10.1186/1471-2458-12-345.
12. Anzid k. Diversité alimentaire et état nutritionnel des adolescents au Maroc: cas de la région d’Ouarzazate [thesis]. Marrakech: Université Cadi Ayyad; 2009 (in French).
13. da Silva R, Bach-Faig A, Raido Quintana B, Buckland G, Vaz de Almeida MD, Serra-Majem L. Worldwide variation of adherence to the Mediterranean diet, in 1961–1965 and 2000–2003. Public Health Nutr. 2009 Sep;12(9A):1676–84. http://dx.doi.org/10.1017/S1368980009990541 PMID:19689839
14. Farajian P, Risvas G, Karasouli K, Pounis GD, Kastorini CM, Panagiotakos D et al. Very high childhood obesity prevalence and low adherence rates to the Mediterranean diet in Greek children: the GRECO study. Atherosclerosis. 2011 Aug;217(2):525–30. http://dx.doi.org/10.1016/j.atherosclerosis.2011.04.003 PMID:21561621
15. Roccaldo R, Censi L, D’Addezio L, Toti E, Martone D, D’Addesa D et al. Adherence to the Mediterranean Diet in Italian school children (The ZOOM8 Study). Int J Food Sci Nutr. 2014 Aug;65(5):621–8. http://dx.doi.org/10.3109/09637486.2013.873887 PMID:24527679
16. Baydemir C, Ozgur EG, Balci S. Evaluation of adherence to Mediterranean diet in medical students at Kocaeli University, Tur-key. J. Int. Med. Res. 2018 Apr;46(4):1585–94. http://dx.doi.org/10.1177/0300060518757158 PMID:29444610
17. Hadjimbei E, Botsaris G, Gekas V, et al. Adherence to the Mediterranean diet and lifestyle characteristics of university students in Cyprus: a cross-sectional survey. J Nutr Metab 2016;2016:2742841 http://dx.doi.org/10.1155/2016/2742841 PMID:27293883
18. Mariscal-Arcas M, Rivas A, Velasco J, Ortega M, Caballero AM, Olea-Serrano F. Evaluation of the Mediterranean Diet Quality Index (KIDMED) in children and adolescents in Southern Spain. Public Health Nutr. 2009;12(9):1408–12. http://dx.doi.org/10.1017/S1368980008004126 PMID:19087384
19. Bibiloni MDM, González M, Julibert A, Llompart I, Pons A, Tur JA. Ten-year trends (1999–2010) of adherence to the Medi-terranean diet among the Balearic Islands’ adult population. Nutrients. 2017 Jul 14;9(7). http://dx.doi.org/10.3390/nu9070749 PMID:28708083
20. Grosso G, Marventano S, Galvano F, Pajak A, Mistretta A. Factors associated with metabolic syndrome in a Mediterranean popu-lation: role of caffeinated beverages. J Epidemiol. 2014;24(4):327–33. http://dx.doi.org/10.2188/jea.je20130166 PMID:24806662.
21. Rogers I, Emmett P, ALSPAC Study Team. The effect of maternal smoking status, educational level and age on food and nu-trient intakes in preschool children: results from the Avon Longitudinal Study of Parents and Children. Eur J Clin Nutr. 2003 Jul;57(7):854–64. http://dx.doi.org/10.1038/sj.ejcn.1601619 PMID:12821885
22. Sausenthaler S, Kompauer I, Mielck A, Borte M, Herbarth O, Schaaf B et al. Impact of parental education and income inequality on children’s food intake. Public Health Nutr. 2007;10(1):24–33. http://dx.doi.org/10.1017/S1368980007193940 PMID:17212839

1078
Research article EMHJ – Vol. 26 No. 9 – 2020
Dentist availability in Egypt: a 20-year study of supply, potential demand and economic factorsMaha El Tantawi,1 Nourhan M. Aly,1 Dina Attia,1 Hams Abdelrahman1 and Mohamed Mehaina2
1Department of Pediatric Dentistry and Dental Public Health, Faculty of Dentistry, Alexandria University, Egypt (Correspondence to: M. El Tantawi: [email protected]). 2Alexandria and Mediterranean Research Center, Bibliotheca Alexandrina, Egypt.
Abstract Background: Egypt is one of the most populated countries in the Eastern Mediterranean Region with historically large numbers of trained professionals providing services in and outside the country. Data about dentist availability are needed to plan for workforce production and training. Aims: We assessed dentist availability in Egypt including (1) changes over 20 years; (2) spatial distribution; and (3) associ-ation with supply, potential demand for care and economic conditions. Methods: In an ecological study (1995–2014), we used data from the Central Agency for Public Mobilization and Sta-tistics. The outcome variable was dentist availability (dentists per 1000 population). The explanatory variables were: (1) population size; (2) number of dental graduates; (3) previous dentist availability; (4) increase in wages; and (5) percentage of population migrating internally seeking jobs. We assessed variation in availability using statistical process control and spatial autocorrelation. The impact of explanatory variables was assessed using general linear models with partial η2 to measure effect size. Results: Dentists per 1000 population were randomly distributed over the country and the ratio reached 0.18 in 2014, indicating a shortage despite the increasing number of dental graduates since 1995 (667.1%). Previous dentist availability (η2 = 0.60) and increase in wages (η2 = 0.48) had the greatest impact on dentist availability. Conclusions: Egypt faces a problem of dentist shortage that has not been offset by the increase in dental graduates. Improving the economic conditions and incorporating health care into the national development plan may improve the situation.Keywords: Dentists/supply and distribution, Egypt, students, dental schools, dental economics.Citation: El Tantawi M; Aly N; Attia D; Abdelrahman H; Mehaina M. Dentist availability in Egypt: a 20-year study of supply, potential demand and economic factors. East Mediterr Health J. 2020;26(9):1078-1086. https://doi.org/10.26719/emhj.20.008Received: 17/12/18; accepted: 07/05/19Copyright © World Health Organization (WHO) 2020. Open Access. Some rights reserved. This work is available under the CC BY-NC-SA 3.0 IGO license (https://creativecommons.org/licenses/by-nc-sa/3.0/igo)
IntroductionDentist availability facilitates dental care provision and has a positive impact on demand for services (1), accord-ing to the theory of supplier-induced demand (2). Dentist to population ratio is one of the most commonly used methods to assess dentist availability (3), and to classify regions into those with adequate dentist availability and areas of shortage where dentist number may not meet population needs (4).
Macrolevel analysis at community level has shown that human healthcare resources are affected by the population ecology theory including: (1) structural attributes of the healthcare system, such as personnel supply, which determines growth; (2) demand for services where demographics determine consumption; and (3) economic profile as a determinant of resource availability (5). Previous studies have confirmed the effect of demographic factors, particularly population size and income, on healthcare provider availability (6).
Most studies assessing dentist availability were cross-sectional, focusing on a single point in time, and were conducted in developed countries with high numbers of dentists and high dentist to population ratios (1,6). Few
cross-sectional studies have assessed dentist availability in less-developed countries (7,8). One longitudinal study described the change in dental workforce in Oman and predicted future trends (9), whereas another in Austria followed dentist availability over time and assessed differences between public and private dentists (10). A longitudinal study in Taiwan, China investigated the impact of global budgeting on dental workforce distribution (11).
Egypt was the 14th most populated country in the world and the 7th among lower middle income countries in 2017 (12). It ranked 11th out of 47 in dentist to 1000 population among lower middle income countries (13). Over the last 2 decades, Egypt has witnessed economic challenges that became more pronounced after the political instability that started in 2011, with a large trade deficit, high rate of unemployment and rising prices (14). During this period, private dental schools were opened for the first time and by 2014, they were training 58.6% of all dental students (15). State-funded health insurance covered 58.2% of the population in 2015 for minimal fees with facilities all over the country (14). The complex
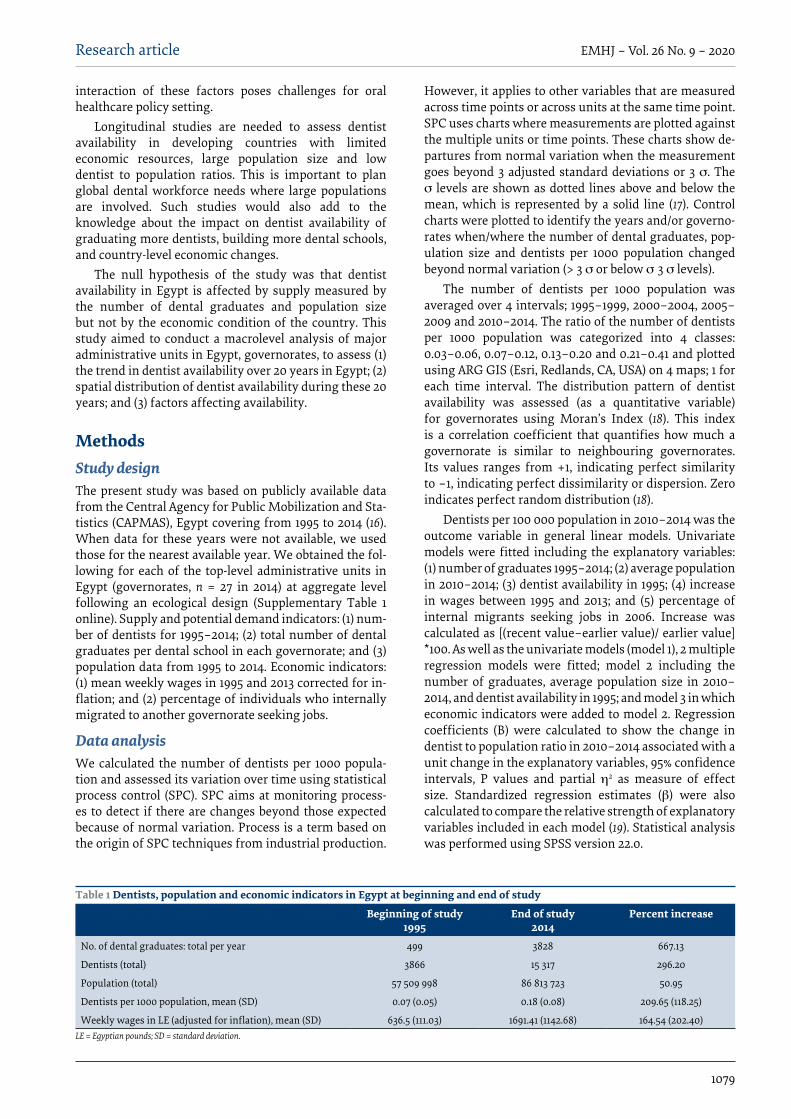
1079
Research article EMHJ – Vol. 26 No. 9 – 2020
interaction of these factors poses challenges for oral healthcare policy setting.
Longitudinal studies are needed to assess dentist availability in developing countries with limited economic resources, large population size and low dentist to population ratios. This is important to plan global dental workforce needs where large populations are involved. Such studies would also add to the knowledge about the impact on dentist availability of graduating more dentists, building more dental schools, and country-level economic changes.
The null hypothesis of the study was that dentist availability in Egypt is affected by supply measured by the number of dental graduates and population size but not by the economic condition of the country. This study aimed to conduct a macrolevel analysis of major administrative units in Egypt, governorates, to assess (1) the trend in dentist availability over 20 years in Egypt; (2) spatial distribution of dentist availability during these 20 years; and (3) factors affecting availability.
MethodsStudy designThe present study was based on publicly available data from the Central Agency for Public Mobilization and Sta-tistics (CAPMAS), Egypt covering from 1995 to 2014 (16). When data for these years were not available, we used those for the nearest available year. We obtained the fol-lowing for each of the top-level administrative units in Egypt (governorates, n = 27 in 2014) at aggregate level following an ecological design (Supplementary Table 1 online). Supply and potential demand indicators: (1) num-ber of dentists for 1995–2014; (2) total number of dental graduates per dental school in each governorate; and (3) population data from 1995 to 2014. Economic indicators: (1) mean weekly wages in 1995 and 2013 corrected for in-flation; and (2) percentage of individuals who internally migrated to another governorate seeking jobs.
Data analysisWe calculated the number of dentists per 1000 popula-tion and assessed its variation over time using statistical process control (SPC). SPC aims at monitoring process-es to detect if there are changes beyond those expected because of normal variation. Process is a term based on the origin of SPC techniques from industrial production.
However, it applies to other variables that are measured across time points or across units at the same time point. SPC uses charts where measurements are plotted against the multiple units or time points. These charts show de-partures from normal variation when the measurement goes beyond 3 adjusted standard deviations or 3 σ. The σ levels are shown as dotted lines above and below the mean, which is represented by a solid line (17). Control charts were plotted to identify the years and/or governo-rates when/where the number of dental graduates, pop-ulation size and dentists per 1000 population changed beyond normal variation (> 3 σ or below σ 3 σ levels).
The number of dentists per 1000 population was averaged over 4 intervals; 1995–1999, 2000–2004, 2005–2009 and 2010–2014. The ratio of the number of dentists per 1000 population was categorized into 4 classes: 0.03–0.06, 0.07–0.12, 0.13–0.20 and 0.21–0.41 and plotted using ARG GIS (Esri, Redlands, CA, USA) on 4 maps; 1 for each time interval. The distribution pattern of dentist availability was assessed (as a quantitative variable) for governorates using Moran’s Index (18). This index is a correlation coefficient that quantifies how much a governorate is similar to neighbouring governorates. Its values ranges from +1, indicating perfect similarity to –1, indicating perfect dissimilarity or dispersion. Zero indicates perfect random distribution (18).
Dentists per 100 000 population in 2010–2014 was the outcome variable in general linear models. Univariate models were fitted including the explanatory variables: (1) number of graduates 1995–2014; (2) average population in 2010–2014; (3) dentist availability in 1995; (4) increase in wages between 1995 and 2013; and (5) percentage of internal migrants seeking jobs in 2006. Increase was calculated as [(recent value–earlier value)/ earlier value] *100. As well as the univariate models (model 1), 2 multiple regression models were fitted; model 2 including the number of graduates, average population size in 2010–2014, and dentist availability in 1995; and model 3 in which economic indicators were added to model 2. Regression coefficients (B) were calculated to show the change in dentist to population ratio in 2010–2014 associated with a unit change in the explanatory variables, 95% confidence intervals, P values and partial η2 as measure of effect size. Standardized regression estimates (β) were also calculated to compare the relative strength of explanatory variables included in each model (19). Statistical analysis was performed using SPSS version 22.0.
Table 1 Dentists, population and economic indicators in Egypt at beginning and end of study
Beginning of study1995
End of study2014
Percent increase
No. of dental graduates: total per year 499 3828 667.13
Dentists (total) 3866 15 317 296.20
Population (total) 57 509 998 86 813 723 50.95
Dentists per 1000 population, mean (SD) 0.07 (0.05) 0.18 (0.08) 209.65 (118.25)
Weekly wages in LE (adjusted for inflation), mean (SD) 636.5 (111.03) 1691.41 (1142.68) 164.54 (202.40)LE = Egyptian pounds; SD = standard deviation.

1080
Research article EMHJ – Vol. 26 No. 9 – 2020
Results Table 1 shows that in 1995 there were 499 dental gradu-ates and 3866 dentists serving 57.5 million people, with a mean dentists per 1000 population ratio of 0.07. After 20 years, there was a 667.13% increase in the number of graduates, 296.20% increase in the number of dentists and 50.95% increase in the population, with a 209.65% in-crease in dentists per 1000 population. During these 20 years, 32 848 dentists graduated from 17 dental schools including 8 private schools (Supplementary Table 2 online). Weekly wages (adjusted for inflation) increased by 164.54% (Table 1). Of 4 769 497 persons migrating from one governorate to another, 22.2% were seeking jobs.
With reference to the changes over 20 years, the numbers of graduates and population size were significantly lower before 2001 and higher after 2009
compared to the numbers between 2001 and 2009 (Figure 1). The number of dentists per 1000 population followed a more or less similar pattern with significant increase after 2009. Figure 2 shows dentist availability from 1995 to 2014. For the 4 time periods, Moran’s Index indicated random distribution; in 1995–1999, Index = –0.05; in 2000–2004, Index = 0.002; in 2005–2009, Index = –0.013; and in 2010–2014, Index = 0.02 (all P > 0.05). During all 4 time periods, some governorates, such as Alexandria, consistently had the highest dentist to population ratio, whereas other governorates such as Fayoum and Qina consistently had the lowest ratio. Governorates that had dentist to population ratio significantly higher than all others are marked by red circles (Figure 3): South Sinai in 1995–1999, Cairo and New Valley in 2000–2004 and Alexandria in 2005–2014. In general, dentist to population
Figure 1 Control charts of number of dental graduates, population size and dentist availability, 1995- 2014
No. of dental graduates Population size
4000
3000
2000
1000
0
1995
1997
1998
2000
2001
2002
2004
2005
2006
2007
2008
2009
2011
2013
2014
90 000 000
80 000 000
70 000 000
60 000 000
50 000 000
1995
1997
1998
2000
2001
2002
2004
2005
2006
2007
2008
2009
2011
2013
2014
Control rule violation: No Yes
No. of dentists per 1000 population
0.20
0.15
0.10
0.05
0.00
-0.05
1995
1997
1998
2000
2001
2002
2004
2005
2006
2007
2008
2009
2011
2013
2014

1081
Research article EMHJ – Vol. 26 No. 9 – 2020
ratio increased over time until, in 2010–2014, 9 (33.3%) governorates had a ratio > 0.2.
In Model 1, dentist to population ratio in 1995 had the greatest association with dentist to population ratio in 2010–2014 (η2 = 0.41) followed by the percentage of internal migrants who were seeking jobs (η2 = 0.12) and the number of dental graduates (η2 = 0.10, Table 2). Model 2 shows less variation in dentist availability compared to Model 3 in which economic factors were added (adjusted R2= 0.40 and 0.66). When all factors were simultaneously considered in Model 3, higher dentist to population ratio in 2010–2014 was significantly associated with higher dentist to population ratio in 1995 (B = 150.44) and lower increase in weekly wages (B = –0.03). Internal migration to seek jobs (B = 0.22) and number of graduates (B = 0.00003) were associated with higher dentist to population ratio, whereas population size was associated with lower ratio (B = –0.0000004), although these were not significantly associated. Comparison of standardized regression coefficients (β) showed that the greatest effect on the outcome variable was for dentist to population ratio in 1995 (β = 0.97), followed by change in weekly wages (β = –0.62) and population size (β = –0.36) whereas the percentage of internal migrants seeking jobs (β = 0.15) and number of graduates (β = 0.15) had weaker effects.
DiscussionStarting from 2009, dentist availability in Egypt signif-icantly increased reaching the highest level in 2014 but that still indicated a national shortage. This shortage was randomly distributed, although some governorates had better availability, such as Alexandria, and others had inadequate availability, such as Qina and Fayoum. Past dentist availability was the strongest predictor of future availability. Economic factors explained more variation in dentist availability than supply and potential demand, so the null hypothesis can be rejected.
The number of graduates significantly increased after 2009 when 5 new private dental schools were opened (15), although only 46.6% of dental graduates were retained in the workforce over 20 years. Because of this high attrition rate, the national dentist to 1000 population ratio reached 0.18 in 2014, signifying a shortage of dentists (20) and placing 64.6 million (74.3%) Egyptians in areas of dentist shortage. The present study disagrees with a Chilean study that projected 77.5% dentist oversupply after increasing dental schools from 5 to 34 over 15 years (21), and with an Indian study reporting a surplus of 100 000 dentists after a 10-fold increase in dental schools over 25 years (22). This difference in attrition rate may be explained by dentists’ migration outside Egypt, which is supported by a previous study showing that the highest percentage of Arab expatriates working as dentists in 8 Arab countries were Egyptian (23), and a United Nations report showing brain drain in some Middle East and North Africa (MENA) countries, such as Egypt and Jordan, resulting from migration to the Gulf countries (24). The impact of mobility on dentist availability in source Ta
ble
2 D
emog
raph
ic, s
uppl
y an
d ec
onom
ic fa
ctor
s aff
ecti
ng d
enti
st p
er 10
0 00
0 po
pula
tion
in 2
010–
2014
Fact
or
Mod
el 1
Mod
el 2
Mod
el 3
B (9
5% C
I)P
η2
B (9
5% C
I)P
η2
B (9
5% C
I)P
η2
No.
of d
enta
l gra
duat
es (1
995–
2014
)0.
001 (
-0.0
003,
0.0
02)
0.11
0.10
0.00
1 (-0
.000
4, 0
.003
)0.
150.
090.
0000
3 (-0
.001
, 0.0
01)
0.97
< 0.
0001
Aver
age
popu
latio
n si
ze in
201
0–20
14-0
.000
0003
(-0.
0000
02,
0.00
0001
)0.
610.
01-0
.000
001 (
-0.0
0000
3,
0.00
0001
)0.
190.
08-0
.000
0004
(-0.
0000
02,
0.00
0001
)0.
510.
02
Den
tists
to 10
00 p
opul
atio
n in
1995
101.3
0 (5
0.45
, 152
.15)
<0.0
001*
0.41
80.0
3 (2
1.79,
138.
26)
0.01
*0.
2715
0.44
(93.
16, 2
07.7
2)<
0.00
01*
0.60
Incr
ease
in w
eekl
y w
ages
corr
ecte
d fo
r infl
atio
n (19
95–2
014)
-0.0
01 (-
0.02
, 0.0
2)0.
890.
001
-0.0
3 (-0
.04,
-0.0
2)<
0.00
1*0.
48
Perc
enta
ge o
f int
erna
l mig
rant
s see
king
jobs
in
200
60.
23 (-
0.03
, 0.4
9)0.
080.
120.
22 (-
0.01
, 0.4
5)0.
060.
17
Adju
sted
R2
0.40
0.66
Mod
el 1:
univ
aria
te li
near
regr
essio
n in
cludi
ng in
divi
dual
varia
bles
1 at
a tim
e. M
odel
2: M
ultiv
aria
ble m
odel
inclu
ding
num
ber o
f gra
duat
es (1
995–
2014
), av
erag
e pop
ulat
ion
size (
2010
–201
4) an
d de
ntist
s to 1
000
popu
latio
n in
1995
. M
odel
3: M
ultiv
aria
ble m
odel
inclu
ding
varia
bles
in M
odel
2 in
addi
tion
to th
e eco
nom
ic in
dica
tors
; incr
ease
in w
eekl
y wag
es, p
erce
ntag
e of p
opul
atio
n m
igra
ting t
o see
k job
s out
of al
l mig
ratio
n to
gove
rnor
ate i
n 20
06.
*Sta
tistic
ally
sign
ifica
nt at
P<
0.05
. B
= re
gres
sion
coeffi
cient
, CI =
confi
denc
e int
erva
l, η2 =
par
tial η
2 as m
easu
re of
effec
t size
.

1082
Research article EMHJ – Vol. 26 No. 9 – 2020
countries witnessing political and economic instability should be addressed by co-ordinated global efforts.
At governorate level, the number of dental graduates had a weak association with dentist availability. This disagrees with previous reports that the presence of a dental school had a positive effect on dentist availability at county level in the United States of America (1) and in Japanese prefectures (25). However, it agrees with a study assessing the relationship at the American state level (26); a larger unit that may be more similar to the areas in our study. The lack of association may also be explained by the clustering of 9/17 (52.9%) dental schools in the greater Cairo area.
In the current study, previous dentist availability had the strongest positive impact on future dentist availability. This agrees with research showing that scarcity of healthcare providers predicts their future scarcity, and that physicians are more likely to move into locations where physician availability is already high (27). This finding, however, disagrees with a previous report of negative correlation between the number of medical specialists and their previous number in the same location, suggesting competition among specialists (6).
The present study showed an association between dentist availability and the percentage of migrants seeking jobs. This may be attributed to the greater convenience of using dental services near workplaces
rather than at home towns, thus creating demand for dentists (1). It agrees with another study that reported an association between health worker to population ratio and emigration rates at country level (28).
In the present study, greater dentist availability was associated with lower increase in wages. Most dentists in Egypt work in the public sector (29), providing national health insurance whose coverage increased 10 times between 1995 and 2014 and included mainly employees (14). The dental care expenses of these employees were covered regardless of wages increase. Sixty percent of health expenditure in Egypt is out of pocket (14), and for this segment, increasing wages would help cover dental care costs. Thus, the negative association between increased wages and availability of mostly public sector dentists indicates a positive impact on the availability of private sector dentists. This disagrees with research reporting an association between dentist availability and higher income (6). Alternatively, this inverse relationship may be because the least increase in wages occurred in governorates that had the highest wages in 1995. Thus, dentists might have settled in governorates with established good economic conditions where other dentists have already settled, confirming the positive association between past and future dentist availability.
The present study was limited by data availability. Because of changes in CAPMAS definitions or units of
Figure 2 Spatial distribution of dentist availability in Egypt showing random distribution, 1995–2014
24

1083
Research article EMHJ – Vol. 26 No. 9 – 2020
reporting, it was not possible to split dentist availability by sector (public vs private) or specialty or urban/rural location, and this might have obscured some associations. The study was also liable to ecological fallacy since data were reported at aggregate level. Some of the nonsignificant associations may be explained by study power issues, which might have caused some false-negative associations. The inability to increase sample size because of the fixed number of governorates was addressed by reporting partial η2 as a measure of effect size to show the relative strength of the explanatory variables, even in the absence of statistical significance. Ecological studies demonstrate macrolevel associations and give insights into the impact of large-scale changes on healthcare systems. The strength of this study lay
in its duration, which allowed assessment of long-term effects of supply, potential demand and economic changes on dentist availability. The longitudinal design also made possible before and after study of changes in response to naturally occurring events, such as extending health insurance coverage, opening new dental schools, and major political changes. The present findings may apply to developing countries with economic challenges, large population size and shortage of dentists. These conditions may coexist to various degrees so that direct generalization to neighbouring countries should be avoided.
The present study has implications for oral health services research in Egypt and other MENA countries to assess the extent and impact of within-region
Figure 3 Governorates showing variation in number of dentists to 1000 population in 1995–1999, 2000–2004, 2005–2009 and 2010–2014
0.20
0.15
0.10
0.05
0.00 LuxorSouth SinaiN
orth SinaiRed SeaN
ew V
alleyM
atrouhAsw
anQ
inaSohagAsioutM
eniaFayoumBeni SouefG
izaBeheiraM
enofeiaG
harbeiaKafr el SheikhKaliobeiaSharkeiaD
akahleiaD
amietta
Ismailia
SuezPort SaidAlexandriaCairo
0.20
0.15
0.10
0.05
0.00 LuxorSouth SinaiN
orth SinaiRed SeaN
ew V
alleyM
atrouhAsw
anQ
inaSohagAsioutM
eniaFayoumBeni SouefG
izaBeheiraM
enofeiaG
harbeiaKafr el SheikhKaliobeiaSharkeiaD
akahleiaD
amietta
Ismailia
SuezPort SaidAlexandriaCairo
0.5
0.4
0.3
0.2
0.1
0.0 LuxorSouth SinaiN
orth SinaiRed SeaN
ew V
alleyM
atrouhAsw
anQ
inaSohagAsioutM
eniaFayoumBeni SouefG
izaBeheiraM
enofeiaG
harbeiaKafr el SheikhKaliobeiaSharkeiaD
akahleiaD
amietta
Ismailia
SuezPort SaidAlexandriaCairo
0.25
0.20
0.15
0.10
0.05
0.0 LuxorSouth SinaiN
orth SinaiRed SeaN
ew V
alleyM
atrouhAsw
anQ
inaSohagAsioutM
eniaFayoumBeni SouefG
izaBeheiraM
enofeiaG
harbeiaKafr el SheikhKaliobeiaSharkeiaD
akahleiaD
amietta
Ismailia
SuezPort SaidAlexandriaCairo
Control rule violation: No Yes
Dentists per 1000 population (1995–1999) South Sinai > 3 σ
Dentists per 1000 population (2000–2004) Cairo and New Valley > 3 σ
Dentists per 1000 population (2005–2009): Alexandria > 3 σ
Dentists per 1000 population (2010–2014): Alexandria > 3 σ
0.5
0.4
0.3
0.2
0.1
0.0 LuxorSouth SinaiN
orth SinaiRed SeaN
ew V
alleyM
atrouhAsw
anQ
inaSohagAsioutM
eniaFayoumBeni SouefG
izaBeheiraM
enofeiaG
harbeiaKafr el SheikhKaliobeiaSharkeiaD
akahleiaD
amietta
Ismailia
SuezPort SaidAlexandriaCairo
0.25
0.20
0.15
0.10
0.05
0.0 LuxorSouth SinaiN
orth SinaiRed SeaN
ew V
alleyM
atrouhAsw
anQ
inaSohagAsioutM
eniaFayoumBeni SouefG
izaBeheiraM
enofeiaG
harbeiaKafr el SheikhKaliobeiaSharkeiaD
akahleiaD
amietta
Ismailia
SuezPort SaidAlexandriaCairo
Control rule violation: No Yes

1084
Research article EMHJ – Vol. 26 No. 9 – 2020
dentist mobility on oral health outcomes. Research is needed to assess the number of dentists in the public and private sectors in addition to perceptions about dentist availability, how patients have their needs covered in dentist-shortage areas, and the impact of interventions aimed at workforce retention. The study also has healthcare policy implications. Some of the factors affecting dentist availability may be beyond the direct control of policy-makers but should be considered during workforce planning. For example, geopolitical factors limiting the development of some southern governorates, such as Qina and Fayoum, cannot be redressed only by health policy planners but need a holistic development framework. Similarly, the impact of unrest on the population size and number of dentists in North Sinai cannot be reversed within the healthcare system. Concerted efforts are needed to retain graduates in the national workforce and encourage them to settle in governorates with chronic shortage of dentists. There is a need to revisit the existing law of compulsory service for recent graduates and mandatory service in remote locations as a prerequisite for promotion (30). These laws do not seem to be enough to address the problem of shortage of dentists, although reports from Thailand, South Africa and Indonesia show that compulsory service supported by financial incentives may be successful (31–33).
In 2018, the Universal Health Care (UHC) law was enacted in Egypt. It includes dental care provided through the family health model (34). Previous research showed that dentists working in family health clinics expressed concerns about the availability and affordability of services to patients (35). If the new law can reduce the financial burden to patients, and the accompanying restructuring of the healthcare system provides adequate financial incentives to dentists, the economic constraints affecting the shortage of dentists may be addressed. Prospective and controlled studies assessing the impact of UHC and healthcare system restructuring are needed.
ConclusionDespite the increase in dental graduates in Egypt over 20 years, about 75% of the population live in governo-rates with a shortage of dentists. Our study suggests that the problem is related to high attrition rates. With the high rate of population growth in Egypt, differences between governorates in dentist availability were mostly explained by previous availability and economic condi-tions. Offering financial incentives to dentists to encour-age settling in areas of shortage and extending UHC to larger segments of the population may reduce the impact of economic constrains on providers and users of dental care, leading to better dentist availability.
Acknowledgement The authors thank the staff of CAPMAS for data collection.
Funding None.
Competing interests: None declared.
Disponibilité des dentistes en Égypte : étude sur 20 ans de l’offre, de la demande potentielle et des facteurs économiquesRésumé Contexte : L’Égypte est l’un des pays les plus peuplés de la Région de la Méditerranée orientale, avec des nombres historiquement élevés de professionnels qualifiés fournissant leurs services sur le territoire national et à l’étranger. Des données sur la disponibilité des dentistes sont nécessaires à la planification de la production et de la formation des professionnels. Objectifs : Nous avons examiné la disponibilité des dentistes en Égypte au moyen des paramètres suivants : 1) changements sur 20 ans ; 2) répartition territoriale ; et 3) liens avec l’offre, la demande potentielle de soins et les conditions économiques. Méthodes : Dans la présente étude écologique (1995-2014), nous avons utilisé des données de l’Agence centrale pour la mobilisation du public et la statistique. Le critère de jugement était la disponibilité des dentistes (nombre de dentistes pour 1 000 habitants). Les variables explicatives étaient les suivantes : 1) taille de la population ; 2) nombre de diplômés en médecine dentaire ; 3) disponibilité de dentistes précédente ; 4) augmentation des salaires ; et 5) pourcentage de la population se déplaçant dans le pays afin de trouver du travail. Pour évaluer la variation dans la disponibilité des dentistes, nous avons utilisé le contrôle statistique du processus et l’auto-corrélation spatiale. L’effet des variables explicatives a été évalué au moyen de modèles linéaires généraux avec η2 partiel pour mesurer la taille de l’effet. Résultats : Le nombre de dentistes pour 1 000 habitants était réparti de manière aléatoire sur le territoire national et atteignait 0,18 en 2014, ce qui indique une pénurie malgré un nombre de diplômés en médecine dentaire en augmentation depuis 1995 (667,1 %). La disponibilité des dentistes précédente (η2 = 0,60) et l’augmentation des salaires (η2
= 0,48) avaient les effets les plus importants sur la disponibilité des dentistes.

1085
Research article EMHJ – Vol. 26 No. 9 – 2020
References1. Rephann TJ, Wanchek TN. Filling the gaps: explanations for disparities in the distribution of dentists among U.S. counties. J Reg
Anal Policy. 2016;46(1):60–71.
2. Schulz M, Kunst AE, Brockmann H. High educational attainment moderates the association between dental health-care supply and utilization in Europe. Eur J Oral Sci. 2016 Feb;124(1):52–61. http://dx.doi.org/10.1111/eos.12237 PMID:26715618
3. World Health Organization (WHO). Global Health Observatory (GHO) data. Density of dentistry personnel (total number per 1000 population, latest available year) [website]. World Health Organization (http://origin.who.int/gho/health_workforce/den-tistry_density/en/, accessed 30 January 2020).
4. Guay AH. Access to dental care: solving the problem for underserved populations. J Am Dent Assoc. 2004 Nov;135(11):1599–605. http://dx.doi.org/10.14219/jada.archive.2004.0088 PMID:15622666
5. Jiang HJ, Begun JW. Dynamics of change in local physician supply: An ecological perspective. Soc Sci Med. 2002 May;54(10):1525–41. http://dx.doi.org/10.1016/S0277-9536(01)00132-0 PMID:12061486
6. Kuthy RA, McKernan SC, Pooley M, Zimmerman MB. Relationship between community-level variables and number of general dentists. J Am Dent Assoc. 2018 Apr;149(4):308–16. http://dx.doi.org/10.1016/j.adaj.2017.11.007 PMID:29478702
7. Abid A. Oral health in Tunisia. Int Dent J. 2004 Dec;54(6 Suppl 1):389–94. http://dx.doi.org/10.1111/j.1875-595x.2004.tb00016.x PMID:15631102
8. Behbehani JM, Scheutz F. Oral health in Kuwait. Int Dent J. 2004 Dec;54(6 Suppl 1):401–8. http://dx.doi.org/10.1111/j.1875-595x.2004.tb00018.x PMID:15631104
9. Gallagher JE, Manickam S, Wilson NHF. Sultanate of Oman: building a dental workforce. Hum Resour Health. 2015;13(1):50. http://dx.doi.org/10.1186/s12960-015-0037-z.
10. Gächter M, Schwazer P, Theurl E, Winner H. Regional density of private dentists: Empirical evidence from Austria. Community Dent Oral Epidemiol. 2014 Feb;42(1):20–9. http://dx.doi.org/10.1111/cdoe.12054 PMID:23725403
11. Hsueh Y-SA, Lee S-YD, Huang Y-TA. Effects of Global Budgeting on the Distribution of Dentists and Use of Dental Care in Tai-wan. Health Serv Res. 2004 Dec;39(6 Pt 2):2135–53. http://dx.doi.org/10.1111/j.1475-6773.2004.00336.x PMID:15544648
12. Population, total [website]. World Bank (https://data.worldbank.org/indicator/SP.POP.TOTL, accessed 30 January 2020).
توافر أطباء األسنان يف مرص: دراسة عىل مدى 20 عاما حول العرض والطلب املحتمل، والعوامل االقتصاديةمها الطنطاوي، نورهان عيل، دينا عطية، مهس عبد الرمحن، حممد مهينة
اخلالصة اخللفية: تعد مرص واحدة من أكرب البلدان من حيث الكثافة السكانية يف إقليم رشق املتوسط، وقد عرفت عىل مر التاريخ بأهنا غنية بأعداد كبرية من بني الذين يقدمون اخلدمات داخل مرص وخارجها. وكان من الرضوري احلصول عىل بيانات بشأن مدى توافر أطباء األسنان للتخطيط املهنيني املدر
بشأن إعداد القوى العاملة وتدريبها. رنا مدى توافر أطباء األسنان يف مرص، وشمل ذلك: )1( التغريات التي حدثت عىل مدار العرشين عاما املاضية، )2( التوزيع املكاين، األهداف: قد
)3( العالقة بني العرض والطلب املحتمل عىل الرعاية، باإلضافة إىل الظروف االقتصادية. متغري وبني واإلحصاء. العامة للتعبئة املركزي اجلهاز من الواردة البيانات استخدمنا ،)2014-1995( إيكولوجية دراسة يف البحث: طرق السكان، )2( عدد ييل: )1( حجم ما التفسريية يف املتغريات 1000 نسمة(. ومتثلت أطباء األسنان لكل أطباء األسنان )عدد توافر املخرجات الذين هياجرون داخليا بحثا عن خرجيي كليات طب األسنان، )3( مدى توافر أطباء األسنان يف املايض، )4( زيادة األجور، )5( نسبة السكان التفسريية املتغريات أثر وقدر املكاين. التلقائي والرتابط اإلحصائية العمليات مراقبة خالل من األسنان أطباء توافر يف التغري رنا وقد وظائف.
باستخدام نامذج خطية عامة مع مربع إيتا اجلزئي لقياس حجم التأثري. النتائج: تبني توزيع أطباء األسنان لكل 1000 نسمة بصورة عشوائية يف مجيع أنحاء مرص، بنسبة بلغت 0.18 يف عام 2014، مما يدل عىل عدم كفاية عددهم عىل الرغم من ارتفاع أعداد خرجيي كليات طب األسنان منذ عام 1995 )667.1%(. وقد كان لتوافر األطباء يف املايض )مربع إيتا= 0.60(
وزيادة األجور )مربع إيتا= 0.48( أكرب األثر عىل مدى توافر أطباء األسنان. االستنتاجات: تواجه مرص مشكلة تتمثل يف نقص أعداد أطباء األسنان، وهو ما مل تعوضه زيادة أعداد خرجيي كليات طب األسنان. وقد يساعد
حتسني الظروف االقتصادية ودمج الرعاية الصحية يف اخلطة الوطنية للتنمية يف حتسني الوضع.
Conclusions : L’Égypte est confrontée à un problème de pénurie de dentistes, qui n’a pas été compensé par l’augmentation du nombre de diplômés en médecine dentaire. La situation pourrait être améliorée par de meilleures conditions économiques ainsi que par l’intégration des soins de santé dans le plan de développement national.

1086
Research article EMHJ – Vol. 26 No. 9 – 2020
13. Global Health Observatory data repository, dentistry personnel [website]. World Health Organization (http://apps.who.int/gho/data/view.main.HWFDENv, accessed 30 January 2020).
14. Health sector cooperation planning survey in Arab Republic of Egypt. final report. Japan International Cooperation Agency; 2017 (http://open_jicareport.jica.go.jp/pdf/12285300.pdf, accessed 30 January 2020).
15. Ministry of Higher Education annual statistics (2014) [website]. Cairo: Ministry of Higher Education (http://portal.mohesr.gov.eg/ar-eg/Pages/statistics.aspx, accessed 30 January 2020) (in Arabic).
16. Central Agency for Public Mobilization and Statistics Records 1995–2014 [website]. Central Agency of Public Mobilization and Statistics (CAPMAS) (http://www.webcitation.org/73IAhXF2K, accessed 30 January 2020) (in Arabic).
17. van de Glind EMM, Willems HC, Eslami S, Abu-Hanna A, Lems WF, Hooft L et al. Estimating the time to benefit for preventive drugs with the statistical process control method: an example with alendronate. Drugs Aging. 2016 May;33(5):347–53. http://dx.doi.org/10.1007/s40266-016-0344-7 PMID:26884390
18. Goodchild MF. Spatial autocorrelation. Geo Books; 1986.
19. Rules of thumb on magnitudes of effect sizes [website]. MRC Cognition and Brain Sciences Unit, University of Cambridge. (http://imaging.mrc-cbu.cam.ac.uk/statswiki/FAQ/effectSize, accessed 30 January 2020).
20. Designated health professional shortage areas statistics. Bureau of Health Workforce, Health Resources and Services Admin-istration Services, US Department of Health and Human Services (https://ersrs.hrsa.gov/ReportServer?/HGDW_Reports/BCD_HPSA/BCD_HPSA_SCR50_Qtr_Smry_HTML&rc:Toolbar=fals, accessed 26 October 2018).
21. Cartes-Velasquez RA. Exponential growth of dental schools in Chile: effects on academic, economic and workforce issues. Braz Oral Res. 2013 Dec;27(6):471–7. http://dx.doi.org/10.1590/S1806-83242013000600005.
22. Vundavalli S. Dental manpower planning in India: current scenario and future projections for the year 2020. Int Dent J. 2014 Apr;64(2):62–7. http://dx.doi.org/10.1111/idj.12063 PMID:24180215
23. El Tantawi M, Gaffar B, Arheiam A, AbdelAziz W, Al-Batayneh OB, Alhoti MF, et al. Dentists’ intention to report suspected violence: a cross-sectional study in eight Arab countries. BMJ Open. 2018 Mar 30;8(3):e019786. http://dx.doi.org/10.1136/bmjop-en-2017-019786 PMID:29602845
24. Ozden C. United Nations expert group meeting on international migration and development in the Arab region: brain drain in Middle East & North Africa – the patterns under the surface. Beirut: Population Division, Department of Economic and Social Affairs, United Nations Secretariat; 2006 (https://www.un.org/en/development/desa/population/events/pdf/expert/11/P10_Ozden.pdf, accessed 30 January 2020).
25. Hirata S, Okawa Y, Sugito H, Mataki S, Sakayori T, Maki Y, et al. Does mandatory postgraduate clinical training worsen geo-graphic distribution of dentists in Japan? Bull Tokyo Dent Coll. 2013;54(3):141–8. http://dx.doi.org/10.2209/tdcpublication.54.141 PMID:24334627
26. Bailit HL, Beazoglou TJ. State financing of dental education: impact on supply of dentists. J Dent Educ. 2003 Dec;67(12):1278–85. PMID:14733258
27. Matsumoto M, Inoue K, Bowman R, Noguchi S, Kajii E. Physician scarcity is a predictor of further scarcity in US, and a predictor of concentration in Japan. Health Policy (New York). 2010 May;95(2–3):129–36. http://dx.doi.org/10.1016/j.healthpol.2009.11.012.
28. Squires A, Uyei SJ, Beltrán-Sánchez H, Jones SA. Examining the influence of country-level and health system factors on nursing and physician personnel production. Hum Resour Health. 2016;14: Article number 48. http://dx.doi.org/10.1186/s12960-016-0145-4.
29. Health Sytem Profile, Egypt 2006. World Health Organization; 2006 (http://apps.who.int/medicinedocs/documents/s17293e/s17293e.pdf, accessed 30 January 2020).
30. Physicians’ manual – compulsory Service March 2007. Ministry of Health and Population, Egypt (https://www.ems.org.eg/emsadmin/uploads/userfiles/file/%D8%AF%D9%84%D9%8A%D9%84%20%D8%A7%D8%B7%D8%A8%D8%A7%D8%A1%20%D8%A7%D9%84%D8%AA%D9%83%D9%84%D9%8A%D9%81%202007.pdf, accessed 10 April 2019).
31. Wiwanitkit V. Mandatory rural service for health care workers in Thailand. Rural Remote Health. 2011;11:1583. https://pdfs.semanticscholar.org/1257/0a7c939f58309b21ee015a7654cfa95cc84e.pdf
32. Hatcher AM, Onah M, Kornik S, Peacocke J, Reid S. Placement, support, and retention of health professionals: nation-al, cross-sectional findings from medical and dental community service officers in South Africa. Hum Resour Health. 2014 Feb 26;12:14. http://dx.doi.org/10.1186/1478-4491-12-14 PMID:24571826
33. Efendi F. Health worker recruitment and deployment in remote areas of Indonesia. Rural Remote Health. 2012;12:2008. PMID:22670640
34. Egypt: health systems strengthening towards universal health coverage [website]. World Health Organization (http://www.emro.who.int/egy/programmes/health-systems-strengthening.html, accessed 30 January 2020).
35. El Tantawi M, El-Din Hamza MA, Sabry MM. Dentists’ perception of primary health care services in family health and mother and child health clinics in Alexandria, Egypt. East Mediterr Health J. 2017 Mar 30;23(2):73–9. http://dx.doi.org/10.26719/2017.23.2.73 PMID:28383095
1087
Research article EMHJ – Vol. 26 No. 9 – 2020
Malnutrition and food insecurity in child labourers in Sindh, Pakistan: a cross-sectional studyMeesha Iqbal,1 Zafar Fatmi,1 Kausar Khan,1 Yusra Jumani,2 Neelma Amjad1 and Asaad Nafees1
1Department of Community Health Sciences, Aga Khan University, Karachi, Pakistan. 2Dow University of Health Sciences, Karachi, Pakistan. (Correspondence to: Meesha Iqbal: [email protected]; [email protected]).
AbstractBackground: Child labour is common in low- and middle-income countries. Although child labour is widespread in Paki-stan, no data are available on the health of child labourers. Aims: This study aimed to assess the food security, food intake and nutritional status of child labourers aged 5–14 years working in lower Sindh, Pakistan.Methods: Child labourers aged 5–14 years working in agriculture, manufacturing industry, hotels and restaurants, domestic work and migrant child labourers working in vegetable markets were recruited using a respondent-driven sampling technique. Sociodemographic and nutrition information was obtained by an interviewer questionnaire. The children’s height and weight were measured to assess stunting (height-for-age z scores less than –2) and wasting (weight-for-height z scores less than –2). Results: A total of 634 child labourers were included: 184 worked in agriculture, 120 in industry, 67 in hotels and restau-rants, 63 in domestic work and 200 were migrant child labourers. Overall, 15.5% of the children were stunted and 30.0% were wasted. The prevalence of stunting was highest in children working in agriculture (27.2%) and the prevalence of wasting was highest in migrant child workers (35.0%). About half the children (51.1%) were suffering from food insecurity. Food inadequacy was mainly in consumption of vegetables/potatoes (98% of the children had inadequate intake), legumes (97%), fruits (96%), meat/ poultry (95%) and milk/dairy products (82%).Conclusion: The nutritional status and food insecurity of the child labourers of Pakistan are comparable with the general population, highlighting the grave situation of the country with regard to food security. Keywords: child labour, nutritional status, food supply, PakistanCitation: Iqbal M; Fatmi Z; Khan K; Jumani Y; Amjad N; Nafees A. Malnutrition and food insecurity in child labourers in Sindh, Pakistan: a cross-sec-tional study. East Mediterr Health J. 2020;26(9):1087-1096. https://doi.org/10.26719/emhj.20.040Received: 13/11/18; accepted: 16/16/19Copyright © World Health Organization (WHO) 2020. Open Access. Some rights reserved. This work is available under the CC BY-NC-SA 3.0 IGO license https://creativecommons.org/licenses/by-nc-sa/3.0/igo
IntroductionThe International Labour Organization (ILO) classifies child labour as “work that deprives children of their childhood, their potential and their dignity, and that is harmful to physical and mental development” (1). Glob-ally, 152 million children (58% boys, 42% girls) aged 5–17 years were involved in child labour in 2016 (2). Migration, which may follow natural or man-made disasters or na-tional and international conflicts, is one of the important reasons why children work (3–5). Poverty, poor schooling systems and low literacy rates, and large family size are also important causes of child labour (6,7). Child labour-ers are estimated to contribute up to 10–20% of the family income in some low- and middle-income countries (8).
Labour has a significant effect on the lives of the children, including on their lifestyle, health, education and future job prospects (6,7). Adverse health effects of child labour include poor growth, malnutrition, skin diseases, musculoskeletal disorders, and behavioural and mental disorders which can lead to several chronic diseases (9,10). The decreased food availability and variety, combined with occupational hazards, puts the physical health and nutritional status of child labourers at greater
risk (11,12). We postulated a theoretical framework of child labour and malnutrition (Figure 1). Poverty leads to food insecurity forcing the children to start work at an early age. The harsh working environment offers less food and variety in food (they generally do not get meals at work) leading to food inadequacy and consequently malnutrition and the other effects outlined above.
Pakistan is the world’s fifth most populous country with an estimated population of 208 million people (13). According to the latest ILO report, the global burden of child labour is declining; however, the number of children in child labour has steadily increased in Pakistan, from 3.3 million in 1996 to an estimated 12.5 million in 2012 (14,15). In 2010–2011, many families migrated to the cities because of heavy floods that hit Pakistan. Migration is a push factor for child labour in the cities (16). Information on the health status of child labourers is scarce in Pakistan. Therefore, we conducted a survey in the cities of the lower part of Sindh province to assess nutrition in child labourers including: food availability, food intake and nutritional status. We included child labourers in the agricultural sector, manufacturing industry, hotel

1088
Research article EMHJ – Vol. 26 No. 9 – 2020
and restaurant sector, domestic work and migrants. The migrant children only worked in the vegetable market.
MethodsStudy design and settingThis analysis is part of a larger mixed-methods study de-signed to assess the health and social status of the child labourers in suburban areas of lower Sindh (Karachi, Hy-derabad and Thatta districts), Pakistan. The study was conducted from May to November 2017. We report the results of the cross-sectional survey to assess the phys-ical health, nutritional status and food insecurity of the child labourers.
We included children aged between 5 and 14 years who had been working for at least 9 months in the past year. Fourteen is the minimum legal age for work in Pakistan. We considered any sort of work – formal or informal, paid or unpaid, casual or regular, full time or part time, seasonal or year round, legal or illegal – as labour as per ILO convention 138 (17).
The 1996 National Labour Survey of Pakistan identified that child labourers in Sindh were employed in: agricultural sector (46%), manufacturing industry (18%), hotels and restaurants (16%), domestic work (10%), transport sector (8%), and construction sector (2%) (14). We therefore drew our sample proportionately according to the above working groups. However, the transport and construction sectors were not included as their representation was too small in the overall sample.
Children working in hotels, restaurants and domestic work were sampled from Karachi. Children working in the agricultural sector of Karachi, Thatta and Hyderabad districts were selected based on feasibility and ease of access. It is hard to reach child labourers in Pakistan because of gangs. We had links in these areas and hence knew people who connected us to the children and their community. Children for the manufacturing group were sampled from bangle and handicraft industries
of Hyderabad, which is well known for using child labourers, and from children working in warehouses and the fishery industry in the outskirts of Karachi.
We considered migration as a critical factor aggravating child labour; however, migrants were not considered in National Labour Survey of Pakistan. Migrants in Karachi form well defined communities. We selected migrant children from settlements along the so-called super highway (a road in Karachi), which are the largest migrant areas of the city.
Sample size and samplingThe sample size was calculated assuming a proportion of stunting in child labourers of 26%, relative precision of 25% and 95% confidence level (18). The minimum sample needed was 318 children after increasing based on a 10% refusal rate.
We used respondent-driven sampling, which is considered appropriate to sample hidden populations. Respondent-driven sampling is a form of snowball sampling but it is implemented in a way that uses mathematical modelling for the calculation of selection probabilities; thus qualifying as a probability sampling technique (19). Since the group of migrant children was clustered in certain areas of Karachi, the initial children were selected based on convenience sampling. They were given coupons and a monetary incentive to recruit other children working in the same group. Each recruited child was also given coupons and a monetary incentive to continue the chain until the sample size was reached.
Data collection tool We used a structured interview questionnaire to assess the food security (adapted and modified from National Health Interview Survey, 2016) and nutritional intake (20) (Appendix 1, Appendix 2). The tool used had been previ-ously validated in Pakistan and had also been used in the National Nutrition Survey of Pakistan. Interviews were conducted by the research team, including a research as-sociate, a resident medical officer and a volunteer med-
Figure 1 Child labour and malnutrition: a conceptual framework
Poverty
Food insecurity
Food inadequacy
Malnutrition
Child labour
Exposure to harsh working environment
School drop-out
Violence
Depression

1089
Research article EMHJ – Vol. 26 No. 9 – 2020
ical student. In addition, we measured the children’s height and weight. Food security was defined as access by all people at all times to enough food for an active and healthy life (20,21). The children were asked about their intake of the common food items in the past year (Ap-pendix 1, Appendix 2), which was compared with the Ma-laysian dietary guidelines for children and adolescents for adequate and inadequate intake (22). National level guidelines are not available for Pakistan and we select-ed the Malaysian guidelines because Malaysians’ eating habits are similar to Pakistani people.
Statistical analysisWHO Anthro plus was used to calculate the z-scores for height-for-age (stunting) and weight-for-height (wast-ing) to assess the nutritional status of children. Children having z-scores less than –2 were categorized as stunted (chronic malnutrition) or wasted (acute malnutrition). Proportions, frequencies and 95% confidence intervals (CI) were calculated. The Pearson chi-squared test and one-way analysis of variance (ANOVA) were used to de-termine the differences between the occupational groups in stunting, wasting and food security. Six questions were asked about food availability and a positive answer for just one question was considered as food insecurity (see Annex 1). Data were analysed using SPSS, version 23 and Stata, version 8.
Ethical considerationsThe Ethical Review Committee of the Aga Khan Universi-ty approved the study. Consent was taken from the chil-dren before the interview.
ResultsIn total, 634 children were included in our study: 184 from the agricultural sector, 120 from the manufactur-ing industry, 67 from hotels and restaurants, 63 domes-tic workers and 200 migrant child labourers. Almost a quarter of the children 148 (23.3%) were aged 5–9 years, while 486 (76.7%) were 10 years or older. Table 1 shows the socioeconomic and demographic characteristics of the children. The mean age and standard deviation (SD) of the children ranged from 10.2 (SD 2.2) years in the mi-grant children to 11.9 (SD 1.7) years in the children work-ing in the manufacturing industry. Of the children in our study, 322 (50.8%) were boys: most of the children working in hotels and restaurants were boys (66, 98.5%), whereas most of the children in domestic work were girls (55, 87.3%). The rest of the occupational groups had more equal gender distribution. Overall, the children worked for an average of 6.12 (SD 0.98) days a week and 6.81 (SD 3.09) hours a day. The children earned a mean of 4462.7 Pakistan rupees (Rs) a month (US$ 1 = 104.8 Rs in 2017), with the migrant children earning the most (Rs 5688.5 a month, US$ 54.3) and the agricultural workers the least (Rs 3077.3 a month, US$ 29.4). A good proportion of chil-dren (45.1%) said that they had previously attended the
Table 1 Socioeconomic and demographic characteristics of child labourers (5–14 years), by occupational group
Characteristic Total (n = 634)
Migrants (n = 200)a
Agriculture (n = 184)
Manufacturing industry (n = 120)
Hotels & restaurants
(n = 67)
Domestic work
(n = 63)Age (years), mean (SD) 10.9 (2.06) 10.2 (2.2) 10.8 (1.8) 11.9 (1.7) 11.1 (1.8) 11.1 (1.9)
Sex, no. (%)
Male 322 (50.8) 127 (63.5) 74 (40.2) 47 (39.2) 66 (98.5) 8 (12.7)
Female 312 (49.2) 73 (36.5) 110 (59.8) 73 (60.8) 1 (1.5) 55 (87.3)
Ethnicity, no. (%) (n = 434) (n = 173)
Sindhi 225 (51.8) – 161 (93.1) 29 (24.2) 17 (25.4) 18 (28.6)
Punjabi 122 (28.1) – 0 (0.0) 57 (47.5) 34 (50.7) 31 (49.2)
Other 87 (20.0) – 12 (6.9) 34 (28.3) 16 (23.9) 14 (22.2)
Income/month (Rs)b, mean (SD) 4462.7 (3850.0) 5688.5 (4683.7) 3077.3 (2912.6) 5045.3 (4118.2) 4240.9 (2247.9) 3338.1 (2051.5)
Type of housec, no. (%)
Pakka 153 (24.1) 3 (1.5) 10 (5.4) 75 (62.5) 27 (40.3) 38 (60.3)
Semi-pakka 190 (30.0) 3 (1.5) 91 (49.5) 39 (32.5) 38 (56.7) 19 (30.2)
Kacha 291 (45.9) 194 (97.0) 83 (45.1) 6 (5.0) 2 (3.0) 6 (9.5)
No. people living in house, mean (SD) 8.28 (3.49) 9.1 (3.3) 7.5 (2.4) 8.5 (4.7) 7.9 (3.6) 7.6 (3.1)
Currently going to school, no. (%) 174 (27.4) 59 (29.5) 34 (18.5) 55 (45.8) 7 (10.4) 19 (30.2)
Ever attended school, no. (%) 286 (45.1) 95 (47.5 55 (29.9) 61 (50.8) 43 (64.2) 32 (50.8)SD: standard deviation. aMigrant children worked in the vegetable markets. bUS$ 1 = 104.8 Pakistani rupees (Rs). cPakka is a house built of cement; kacha is made of mud; and semi-pakka has straw, mud, wood and bamboos and sometimes a tin roof but no cement is used. P < 0.01 for all the variables; Pearson chi-squared test and one-way ANOVA.
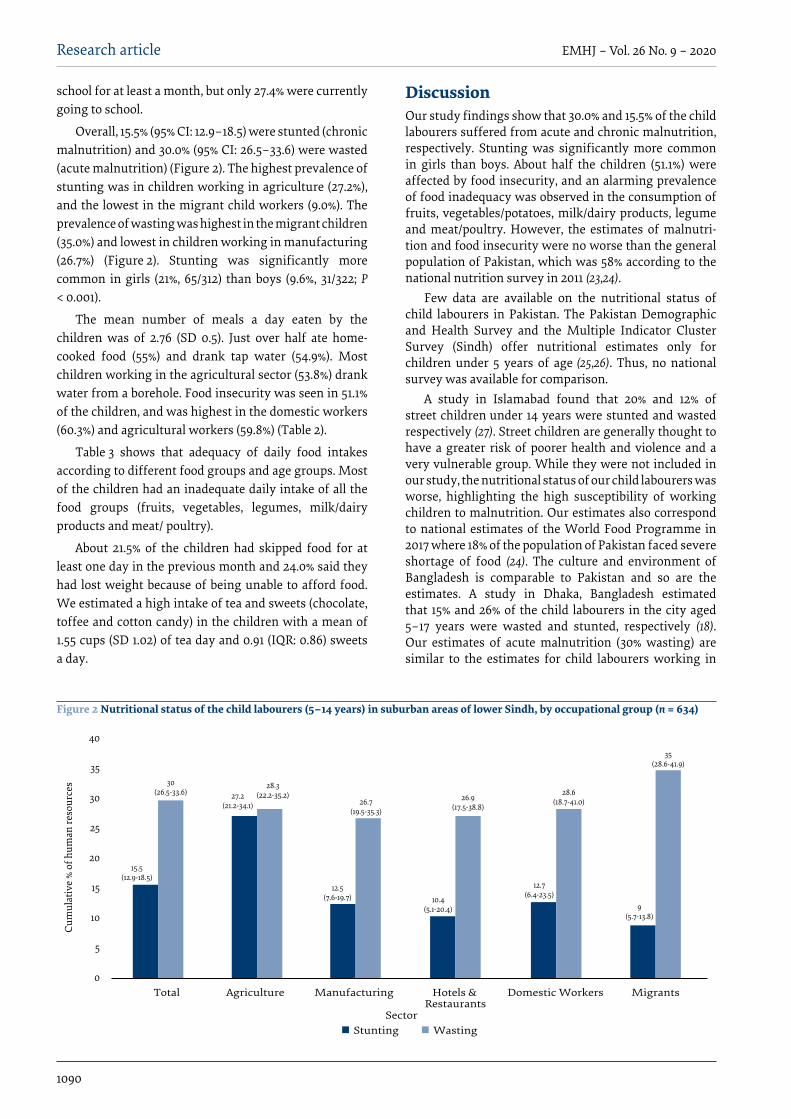
1090
Research article EMHJ – Vol. 26 No. 9 – 2020
school for at least a month, but only 27.4% were currently going to school.
Overall, 15.5% (95% CI: 12.9–18.5) were stunted (chronic malnutrition) and 30.0% (95% CI: 26.5–33.6) were wasted (acute malnutrition) (Figure 2). The highest prevalence of stunting was in children working in agriculture (27.2%), and the lowest in the migrant child workers (9.0%). The prevalence of wasting was highest in the migrant children (35.0%) and lowest in children working in manufacturing (26.7%) (Figure 2). Stunting was significantly more common in girls (21%, 65/312) than boys (9.6%, 31/322; P < 0.001).
The mean number of meals a day eaten by the children was of 2.76 (SD 0.5). Just over half ate home-cooked food (55%) and drank tap water (54.9%). Most children working in the agricultural sector (53.8%) drank water from a borehole. Food insecurity was seen in 51.1% of the children, and was highest in the domestic workers (60.3%) and agricultural workers (59.8%) (Table 2).
Table 3 shows that adequacy of daily food intakes according to different food groups and age groups. Most of the children had an inadequate daily intake of all the food groups (fruits, vegetables, legumes, milk/dairy products and meat/ poultry).
About 21.5% of the children had skipped food for at least one day in the previous month and 24.0% said they had lost weight because of being unable to afford food. We estimated a high intake of tea and sweets (chocolate, toffee and cotton candy) in the children with a mean of 1.55 cups (SD 1.02) of tea day and 0.91 (IQR: 0.86) sweets a day.
DiscussionOur study findings show that 30.0% and 15.5% of the child labourers suffered from acute and chronic malnutrition, respectively. Stunting was significantly more common in girls than boys. About half the children (51.1%) were affected by food insecurity, and an alarming prevalence of food inadequacy was observed in the consumption of fruits, vegetables/potatoes, milk/dairy products, legume and meat/poultry. However, the estimates of malnutri-tion and food insecurity were no worse than the general population of Pakistan, which was 58% according to the national nutrition survey in 2011 (23,24).
Few data are available on the nutritional status of child labourers in Pakistan. The Pakistan Demographic and Health Survey and the Multiple Indicator Cluster Survey (Sindh) offer nutritional estimates only for children under 5 years of age (25,26). Thus, no national survey was available for comparison.
A study in Islamabad found that 20% and 12% of street children under 14 years were stunted and wasted respectively (27). Street children are generally thought to have a greater risk of poorer health and violence and a very vulnerable group. While they were not included in our study, the nutritional status of our child labourers was worse, highlighting the high susceptibility of working children to malnutrition. Our estimates also correspond to national estimates of the World Food Programme in 2017 where 18% of the population of Pakistan faced severe shortage of food (24). The culture and environment of Bangladesh is comparable to Pakistan and so are the estimates. A study in Dhaka, Bangladesh estimated that 15% and 26% of the child labourers in the city aged 5–17 years were wasted and stunted, respectively (18). Our estimates of acute malnutrition (30% wasting) are similar to the estimates for child labourers working in
Figure 2 Nutritional status of the child labourers (5–14 years) in suburban areas of lower Sindh, by occupational group (n = 634)
40
35
30
25
20
15
10
5
0
Cum
ulat
ive
% of
hum
an re
sour
ces
Total Agriculture Manufacturing Hotels & Domestic Workers MigrantsRestaurants
SectorStunting Wasting
15.5 (12.9-18.5)
30(26.5-33.6) 27.2
(21.2-34.1)
28.3(22.2-35.2)
12.5(7.6-19.7)
26.7(19.5-35.3)
10.4(5.1-20.4)
26.9(17.5-38.8)
12.7(6.4-23.5)
28.6(18.7-41.0)
9(5.7-13.8)
35(28.6-41.9)

1091
Research article EMHJ – Vol. 26 No. 9 – 2020
Philippines, where 38.3% (mean age 14.3 years, SD: 2.0) suffered from wasting (28).
Our data show a high level of food insecurity (51.1%) which is in line with the National Nutrition Survey of Pakistan 2011, which reported that 58% of households were food insecure (23). The World Food Programme also reported that 43% of the population was food insecure with 18% facing a severe shortage (24). A high proportion of the children had food inadequacy in all the food groups. The intake of bread, rice, grains was not asked about in our study; we assumed their intake was high as these are the cheapest available staple foods. A reasonable intake of wheat and bread among the working children aged 8–18 years was also reported in a study in the Islamic Republic of Iran (29).
Our results highlight the variation in the nutritional status of children working in the different occupational sectors. The highest prevalence of food insecurity was in children working in the agricultural sector (60%) which reflected the higher prevalence chronic malnutrition (27%) in these children. Although most of the children working in agriculture were working in the family business, they were at greater risk of food insecurity and deteriorating physical health compared with other groups. At the same time, 60% of children doing domestic work also had food insecurity but only 12.7% were stunted. The reasons for this difference in the prevalence of stunting with the same prevalence of food insecurity warrant investigation.
Interestingly, our estimates of food insecurity and nutritional status of the child labourers were not worse than the general population of Pakistan, although we thought they would be. This lack of difference is probably
because many people in Pakistan are poor and hence cannot afford all the food they need. This might lead one to wonder if child labourers are better off compared with other children. We believe that the fact that the nutritional status of the child workers in our study was similar to the general population could also be attributed to the healthy worker effect; with more healthy children
Table 2 Food and water intake in child labourers (5–14 years), by occupational group
Variable Total (n = 634)
Migrants (n = 200)
Agriculture (n = 184)
Manufacturing industry (n = 120)
Hotels & restaurants
(n = 67)
Domestic work
(n = 63)No. of meals/day, mean (SD) 2.76 (0.50) 2.91 (0.32) 2.45 (0.55) 2.87 (0.36) 2.91 (0.38) 2.87 (0.33)
Source of food, no. (%)
Home only 349 (55.0) 108 (54.0) 101 (54.9) 98 (81.7) 7 (10.4) 35 (55.6)
Market/workplace and home 184 (29.0) 84 (42.0) 9 (4.9) 10 (8.3) 59 (88.1) 22 (34.9)
Does not eat at work 92 (14.5) 6 (3.0) 74 (40.2) 5 (4.2) 1 (1.5) 6 (9.5)
Other 9 (1.4) 2 (1.0) 0 (0.0) 7 (5.8) 0 (0.0) 0 (0.0)
Food insecurity, no. (%)
No 310 (48.9) 106 (53.0) 74 (40.2) 69 (57.5) 36 (53.7) 25 (39.7)
Yes 324 (51.1) 94 (47.0) 110 (59.8) 51 (42.5) 31 (46.3) 38 (60.3)
Source of drinking water at work, no. (%)
Tap water/pipe water 348 (54.9) 159 (79.5) 50 (27.2) 57 (47.5) 43 (64.2) 39 (61.9)
Borehole (hand pump/motor) 142 (22.4) 11 (5.5) 99 (53.8) 31 (25.8) 0 (0.0) 1 (1.6)
Well/pond/river/stream 39 (6.2) 7 (3.5) 32 (17.4) 0 (0.0) 0 (0.0) 0 (0.0)
Water filter (jerry can) 59 (9.3) 2 (1.0) 1 (0.5) 27 (22.5) 6 (9.0) 23 (36.5)
Water tanker 33 (5.2) 14 (7.0) 0 (0.0) 1 (0.8) 18 (26.9) 0 (0.0)
Don’t know 13 (2.1) 7 (3.5) 2 (1.1) 4 (3.3) 0 (0.0) 0 (0.0)SD: standard deviation. P < 0.01 for all the variables; Pearson chi-squared test.
Table 3 Adequacy of daily intake of different food groups of child labourers, by age group
Food group Age (years)
5–9 (n = 148) ≥ 10 (n = 486)
No. (%) No. (%)Fruit
Adequate 2 (1.4) 18 (3.7)
Inadequate 146 (98.6) 468 (96.3)
Vegetables/potatoes
Adequate 6 (4.1) 7 (1.4)
Inadequate 142 (95.9) 479 (98.6)
Legumes
Adequate 38 (25.7) 87 (17.9)
Inadequate 110 (74.3) 399 (82.1)
Milk/dairy products
Adequate 4 (2.7) 13 (2.7)
Inadequate 144 (97.3) 473 (97.3)
Meat/poultry
Adequate 38 (25.7) 24 (4.9)
Inadequate 110 (74.3) 462 (95.1)The mean intake was compared with the Malaysian dietary guidelines for children and adolescents (22). The guidelines are different for 5–9 year olds and those ≥ 10 years.

1092
Research article EMHJ – Vol. 26 No. 9 – 2020
being selected for work and being able to continue to work. This could also be the reason of higher proportions of acute compared to chronic malnutrition in this group. The effect of work on the health of these children over time has is yet to be studied and we believe that they might be at risk of deteriorating health in future due to inadequate availability of food. In addition, there is a need to evaluate if previous interventions to help alleviate the situation of child labour in Pakistan have been effective.
To the best of our knowledge, this is the first study to assess the nutritional status of child labourers in different occupational sectors in Pakistan. One of the major strengths of our study was its sampling technique as respondent-driven sampling is considered a good strategy to sample hidden populations (30). Migrants, who are generally neglected and not included among child labourers, were also included in our study. Moreover, the sample size was sufficient and validated tools followed by robust analysis were used to assess the outcomes. However, our study has some limitations.
Although respondent-driven sampling is the accepted technique to sample the hidden populations, some of the children in our study might not have been labourers and were brought by other children because of the monetary incentive. Furthermore, our sample did not have sufficient power to detect statistically significant differences between the working groups. The National Labour Survey of Pakistan does not consider children working on the streets, in carpet industries or cottage industries in the estimated cohort so they were not included in our study. However, we believe that these are important groups of child labour missed in our study. Our study did not capture data of children who left work because of disability, illness or death. Lastly, we also cannot eliminate the possibility of recall bias and reporting bias while interviewing the participants.
Further studies are needed to evaluate child labour and nutrition and to develop strategies and policies to tackle child labour and associated health and well-being problems.
AcknowledgementWe thank our research team and the children who took time to participate in our study.
Funding: World Health Organization, Regional Office for the Eastern Mediterranean: Research in priority areas of public health grant scheme, 2016–2017 (RPPH 16-104).
Competing interests: None declared.

1093
Research article EMHJ – Vol. 26 No. 9 – 2020
Appendix 1: Questionnaire to assess the food and water intake.
Ask the child if he/she eats the following. If the child says yes then ask him/her how many times a week he ate the following in the past 30 days.
0 1 2 3 4 5 6 7
1 Do you eat daal/chole/lobia? (any beans or lentils)
2 Do you eat vegetables? (Cooked or raw vegetables, except potatoes)
3 Do you eat potatoes? (Cooked/fried/any form)
4 Do you eat fruits?
5 Do you eat eggs?
6 Do you eat meat/chicken/fish? (Beef/mutton any animal meat)
7 Do you take Milk/Yogurt/Lassi/Cheese? (Any form of milk)
8 Do you eat butter/ghee/cream (balai)?
9 Do you drink tea?
10 Do you eat packed chips/slanty?
11 Do you eat toffees/chocolates/cotton candy?
12 Do you eat peanuts/almonds/seeds?(any seeds like watermelon/sunflower seeds or dry fruit)
13 What is your main source of drinking water during working hours?
1. Tap water/pipe water2. Boring (hand pump/motor)3. Well4. Pond/river/stream5. Refused6. Don’t know 7. Others__________________________________________________
14 What is your main source of drinking water after working hours?
8. Tap water/pipe water9. Boring(h and pump/motor)
10. Well11. Pond/river/stream12. Refused13. Don’t know 14. Others___________________________________________________
15 Do you purify water before drinking? 15. Yes16. No
Appendix 2Q1: In the last 30 days, did you ever skip meals because there wasn’t enough money for food? Q2: In the last 30 days, how many days did this happen? *Q3: In the last 30 days, did you ever eat less than you felt you should because there wasn’t enough money for food? Q4: In the last 30 days, did you lose weight because there wasn’t enough money for food?Q5: In the last 30 days, did you ever not eat for a whole day because there wasn’t enough money for food? Q6: In the last 30 days, how many days did this happen? *
*Greater or equal to 3 days was considered “yes” A single “yes” answer was considered as “food insecurity”

1094
Research article EMHJ – Vol. 26 No. 9 – 2020
Étude transversale de la malnutrition et de l’insécurité alimentaire chez les enfants travailleurs du Sindh (Pakistan)RésuméContexte : Le travail des enfants est courant dans les pays à revenu faible et intermédiaire. Bien que le travail des enfants soit répandu au Pakistan, aucune donnée n’est disponible sur la santé des enfants travailleurs. Objectifs : La présente étude avait pour objectif d’évaluer la sécurité alimentaire, les apports alimentaires et l’état nutritionnel d’enfants âgés de 5 à 14 ans et travaillant dans le bas Sindh (Pakistan).Méthodes : Des enfants âgés de 5 à 14 ans travaillant dans les secteurs de l’agriculture, de l’industrie de transformation, des hôtels et restaurants et du travail domestique, ainsi que des enfants de migrants travaillant sur les marchés de légumes, ont été recrutés au moyen de la méthode d'échantillonnage déterminé selon les répondants. Des informations sociodémographiques et nutritionnelles ont été recueillies à l’aide d’un questionnaire d’entretien. La taille et le poids des enfants ont été mesurés enfin d’évaluer le retard de croissance (score z de la taille-pour-l’âge inférieur à –2) et l’émaciation (score z du poids-pour-l’âge inférieur à –2). Résultats : Au total, 634 enfants travailleurs ont été inclus dans l’étude : 184 travaillaient dans l’agriculture, 120 dans l’industrie, 67 dans des hôtels et restaurants et 63 dans le travail domestique ; 200 étaient des enfants de migrants. Dans l’ensemble, un retard de croissance a été observé chez 15,5 % des enfants et une émaciation chez 30,0 % d’entre eux. La prévalence du retard de croissance était plus élevée chez les enfants travaillant dans l’agriculture (27,2 %), tandis que la prévalence de l’émaciation était plus élev ée chez les enfants de migrants (35,0 %). Près de la moitié des enfants (51,1 %) souffraient d’insécurité alimentaire. Les insuffisances alimentaires constatées concernaient principalement la consommation de légumes et de pommes de terre (98 % des enfants avaient des apports insuffisants), de légumineuses (97 %), de fruits (96 %), de viande et de volaille (95 %) et de lait et de produits laitiers (82 %).Conclusion : L’état nutritionnel et l’insécurité alimentaire chez les enfants travailleurs au Pakistan sont comparables avec ceux de la population générale, ce qui souligne la gravité de la situation de ce pays en matière de sécurité alimentaire.
سوءالتغذيةوانعداماألمنالغذائييفالعاملاألطفاليفالسند،باكستان:دراسةمقطعيةميشا إقبال، ظفار فاطمي، كوثر خان، يرسا جوماين، نيلام أجمد، أسعد نفيس
اخلالصةاخللفية:يشيع عمل األطفال يف البلدان املنخفضة واملتوسطة الدخل. وعىل الرغم من انتشار عمل األطفال يف باكستان عىل نطاق واسع، إال أنه ال
توجد بيانات بشأن صحة العامل األطفال. األهداف:هدفت هذه الدراسة إىل تقييم األمن الغذائي، واملدخول الغذائي، والوضع التغذوي للعامل األطفال الذين ترتاوح أعامرهم بني 5-14
عاما ويعملون يف السند السفيل، باكستان.طرقالبحث: شملت الدراسة العامل األطفال الذين ترتاوح أعامرهم بني 14-5 عاما الذين يعملون يف الزراعة، والصناعات، والفنادق واملطاعم، املستجيبني. وقد العينات من باستخدام أسلوب أخذ الذين يعملون يف أسواق اخلرضوات، وذلك املهاجرين املنزيل، والعامل األطفال والعمل حصل عىل البيانات االجتامعية-السكانية والتغذوية باستخدام استبيان لألشخاص الذين جرت معهم املقابلة، وقيس طول األطفال ووزهنم لتقييم
التقزم )الطول-مقابل-الوزن -2 نقطة من االنحراف املعياري( واهلزال )الوزن-مقابل-الطول -2 نقطة من االنحراف املعياري(. النتائج:بلغ جمموع العامل األطفال 634 طفال، توزيعهم كالتايل: 184 يف الزراعة، و120 يف الصناعة، و67 يف الفنادق واملطاعم، و63 يف العمل ز املنزيل، و200 كانوا من العامل األطفال املهاجرين. وبشكل عام، يعاين األطفال من التقزم واهلزال بنسبة 15.5% و30.0% عىل التوايل. وقد تركاملهاجرين العامل األطفال اهلزال يف تركز أعىل معدل النتشار بينام الزراعة )27.2 %(، الذين يعملون يف التقزم يف األطفال أعىل معدل النتشار )35.0 %(. وكان نصف األطفال تقريبا )51.1 %( يعاين من انعدام األمن الغذائي . وتركز نقص التغذية أساسا يف عدم استهالك مدخول كاف من الفواكه )96 %(، واخلرضوات/ البطاطس )98%(، واحلليب/ منتجات األلبان )82 %(، والبقوليات )97 %(، واللحوم/ الدواجن )95 %(. االستنتاجات:يتقارب الوضع التغذوي و انعدام األمن الغذائي للعامل األطفال يف باكستان مع السكان عموما، مما يلقي الضوء عىل خطورة الوضع
يف البلد يف ما يتعلق باألمن الغذائي.

1095
Research article EMHJ – Vol. 26 No. 9 – 2020
References1. Defining child labour. Geneva: International Labor Organization (http://www.ilo.org/ipec/facts/lang--en/index.htm, accessed 26
March 2018).
2. Global estimates of child labour: Results and trends, 2012–2016. Geneva: International Labour Organization; 2017 (https://www.ilo.org/wcmsp5/groups/public/@dgreports/@dcomm/documents/publication/wcms_575499.pdf, accessed 26 March 2018).
3. Briefing kit for Pakistan: Floods – Jul 2010. RekiefWeb; 30 Aug 2010 (http://ict4peace.pbworks.com/f/Pakistan_Floods__Jul_2010-OCHA-88TEV6.pdf, accessed 29 March 2018).
4. Zulfiqar H. Ravages of rain stories of monsoon 2011; disaster in Sindh. Karachi: Health and Nutrition Development Society (HANDS); 2011.
5. Chris T. In wake of the floods, malnutrition threatens thousands of children in Pakistan. UNICEF, Pakistan; 21 November 2011 (https://www.unicef.org/emerg/pakistan_60617.html, accessed 30 March 2018).
6. Nengroo AH, Bhat GM. Why child labour? Evidences from homebased carpet weaving industry of Kashmir. Child Youth Serv Rev. 2017;79(8):50–6. https://doi.org/10.1016/j.childyouth.2017.05.032
7. Rad EH, Gholampoor H, Jaafaripooyan E. Child labor and the influencing factors: evidence from less developed provinces of Iran. Iran J Public Health. 2015;44(9):1244.
8. Putnick DL, Bornstein MH. Is child labor a barrier to school enrollment in low- and middle-income countries? Int J Educ Dev. 2015;41:112–20. https://doi.org/10.1016/j.ijedudev.2015.02.001
9. Mohammed ES, Ewis AA, Mahfouz EM. Child labor in a rural Egyptian community: an epidemiological study. Int J Public Health. 2014;59(4):637–44. https://doi.org/10.1007/s00038-014-0559-5
10. Younger DS. Health care in Brazil: implications for public health and epidemiology. Neurol Clin. 2016;34(4):1071–83. https://doi.org/10.1016/j.ncl.2016.06.002
11. Ibrahim A, Abdalla SM, Jafer M, Abdelgadir J, de Vries N. Child labor and health: a systematic literature review of the impacts of child labor on child’s health in low-and middle-income countries. J Pub Health (Oxf). 2018;41(1):18–26. https://doi.org/10.1093/pubmed/fdy018
12. Tiwari RR, Saha A. Morbidity profile of child labor at gem polishing units of Jaipur, India. Int J Occup Environ Med. 2014;5(3):125–9.
13. Population Censes 2017. Pakistan: Pakistan Bureau of Statistics, Government of Pakistan; 2017 (http://www.pbs.gov.pk/content/population-census, accessed 30 March 2018).
14. Summary results of child labour survey in Pakistan. Islamabad: Federal Bureau of Statistics, Statistics Division Ministry of La-bour, Manpower and Overseas Pakistanis, International Labour Organization and International Programme on the Elimination of Child Labour; 1996 (https://www.ilo.org/wcmsp5/groups/public/---asia/---ro-bangkok/---sro-new_delhi/documents/publica-tion/wcms_436435.pdf, accessed 30 March 2018).
15. Child labour increases in Pakistan while numbers drop internationally. Dawn 16 January 2016 (https://www.dawn.com/news/1233219, accessed 25 February 2020).
16. Child in hazardous work: what we know, what we need to know. Geneva: International Labour Organization; 2011 (http://www.ilo.org/wcmsp5/groups/public/@dgreports/@dcomm/@publ/documents/publication/wcms_155428.pdf, accessed 19 April 2018).
17. Promoting jobs, protecting people. Ratifications for Pakistan. Geneva: International Labour Organization (http://www.ilo.org/dyn/normlex/en/f?p=NORMLEXPUB:11200:0::NO::P11200_COUNTRY_ID:103166, accessed 19 April 2018).
18. Rahman MN, Mistry SK, Hossain MI. Nutritional status of child labourers in Dhaka city of Bangladesh: findings from a cross sectional study. Bangladesh J Child Health. 2014;38(3):130–6. https://doi.org/10.3329/bjch.v38i3.22821
19. Magnani R, Sabin K, Saidel T, Heckathorn D. Review of sampling hard-to-reach and hidden populations for HIV surveillance. AIDS. 2005;19(Suppl 2):S67–72. https://doi.org/10.1097/01.aids.0000172879.20628.e1
20. National Health Interview Survey, 2016. Atlanta, GA: Centers for Disease Control and Prevention; 2016 (https://nhis.ipums.org/nhis/resources/surveys_pdf/survey_form_ih2016_fam.pdf, accessed 26 March 2018).
21. Napoli M, De Muro P, Mazziotta M. Towards a food insecurity multidimensional index. Rome: Roma Tre University/Human Development and Food Security; 2011 (http://www.fao.org/fileadmin/templates/ERP/uni/FIMI.pdf, accessed 9 September 2018).
22. Malaysian dietary guidelines. Kuala Lumpur: Ministry of Health Malaysia; 2010 (http://dg.cnsoc.org/upload/af-fix/20140818104029708.pdf, accessed 3 September 2018).
23. USAID. Key findings of the national nutrition survey of 2011. Islamabad: Research and Development Solutions; 2013 (http://www.resdev.org/files/policy_brief/41/Policy%20Brief%2041%20-%20Nutritional%20Status.pdf, accessed 5 May 2018).
24. Pakistan Food Security Bulletin, Issue 3. Pakistan: World Food Programme; Aug 2015 (https://reliefweb.int/sites/reliefweb.int/files/resources/wfp278089.pdf, accessed 4 February 2020).
25. Pakistan Demographic and Health Survey 2017–18. Islamabad and Rockville (MD): National Institute of Population Studies and ICF; 2019.
26. Sindh multiple indicator cluster survey 2014. Final report. Karachi: Sindh Bureau of Statistics and UNICEF; 2015.

1096
Research article EMHJ – Vol. 26 No. 9 – 2020
27. Ali M, Shahab S, Ushijima H, de Muynck A. Street children in Pakistan: a situational analysis of social conditions and nutritional status. Soc Sci Med. 2004;59(8):1707–17. https://doi.org/10.1016/j.socscimed.2004.01.031
28. Cardoso MD, Casiño JM. Child labor, nutritional status, and academic performance of Filipino children. US–China Educ Rev. 2015;5(9):604–12. https://doi.org/10.17265/2161-6248/2015.09.007
29. Pasdar Y, Darbandi M, Nachvak SM. Nutritional status of working children as a neglected group in Kermanshah. J Com Health Research. 2014;3(2):124–31.
30. Penrod J, Preston DB, Cain RE, Starks MT. A discussion of chain referral as a method of sampling hard-to-reach populations. J Transcult Nurs. 2003;14(2):100–7. https://doi.org/10.1177%2F1043659602250614

1097
Research article EMHJ – Vol. 26 No. 9 – 2020
The epidemiology of cholera in the Islamic Republic of Iran, 1965–2014Hossein Masoumi-Asl,1,2 Goodarz Kolifarhood3,4 and Mohammad Mehdi Gouya1
1Center for Communicable Diseases Control, Ministry of Health and Medical Education, Tehran, Islamic Republic of Iran (Correspondence to: Hossein Masoumi-Asl: [email protected]). 2Research Centre of Paediatric Infectious Diseases, Institute of Immunology and Infectious Diseases, Iran University of Medical Sciences, Tehran, Islamic Republic of Iran. 3Student Research committee, School of Public Health; 4Department of Epidemiology, School of Health and Safety, Shahid Beheshti University of Medical Sciences, Tehran, Islamic Republic of Iran.
AbstractBackground: Cholera is endemic in the Islamic Republic of Iran. According to surveillance system records and historical documents, cholera epidemics have led to thousands of deaths throughout the country in past centuries.Aims: The aim of this study was an overview of cholera disease during the last 5 decades (1965–2014) and the epidemio-logical features of the most recent large-scale outbreaks.Methods: In this descriptive study, cholera incidence data provided by the National Surveillance Database were extracted and significant fluctuating trends for 1965–2014 were tested using the Cochran–Armitage test. To identify the factors most associated with cholera incidence in the outbreaks, adjusted odds ratios were computed by ordinal logistic regres-sion.Results: Analysis of data has shown a tremendous decrease in incidence trends, from 19.7/100 000 to 0.01/100 000 over the 9 cholera epidemics that occurred at 5–6 year intervals during 1965–2014. Younger age groups (15–44 years) and inhabit-ants in urban areas have been more vulnerable to cholera in recent epidemics. The virulence of the pathogen and the case fatality rates have not changed during the last 3 epidemics. Conclusion: The burden of cholera in terms of case load has dramatically reduced during 1965–2014. Furthermore, the epidemiological feature of cholera with regard to transmission route, domicile, age, immigration, mortality and antimi-crobial resistance has changed considerably in recent epidemics. While the number of epidemic regions has diminished, some areas are still susceptible to cholera outbreaks.Keywords: cholera, epidemiology, outbreaks, epidemics, IranCitation: Masoumi-Asl H; Kolifarhood G; Gouya MM. The epidemiology of cholera in the Islamic Republic of Iran, 1965–2014. East Mediterr Health J. 2020;26(9):1097-1104. https://doi.org/10.26719/emhj.19.051Received: 20/05/18; accepted: 14/11/18Copyright © World Health Organization (WHO) 2020. Open Access. Some rights reserved. This work is available under the CC BY-NC-SA 3.0 IGO license https://creativecommons.org/licenses/by-nc-sa/3.0/igo
IntroductionCholera is a severe and acute diarrhoeal disease. The eti-ologic agent, Vibrio cholera, was identified by Robert Koch in 1883 (1). The association of the disease with drinking water supplies contaminated with sewage was discovered during an 1854 cholera outbreak in London (2). If dehydration and electrolyte imbalance are properly compensated for, the prognosis of the disease will be favourable in most patients, otherwise it results in potentially high mortality rates (3,4). Environmental investigation of the pathogen and its interaction with susceptible hosts as well as other organisms makes the dynamics of cholera extremely complex (5). According to a World Health Organization (WHO) report in 2018, an es-timated 95 000 people die due to cholera and 2.9 million are affected every year (3). Moreover, cholera epidem-ics have been recognized as a major health problem in recent decades, witness the large outbreaks in Haiti and the Dominican Republic in 2012 (6,7).
Emerging new pathogenic variants in many African and Asian countries, which have a mixture of phenotypic
and genotypic traits of classical and El Tor biotypes, are enormous challenges in the global fight against cholera (8). The Islamic Republic of Iran, as a middle-income country, is experiencing case notification of cholera on a small scale annually. Although 90% of cholera cases have been reported from Afghanistan and Pakistan and a more recent epidemic in Yemen in 2017 (9–11), cholera is still considered an endemic disease in the Islamic Republic of Iran. The National Cholera Surveillance System is one of the oldest data collecting programmes in the country and was originally planned after the substantial El Tor cholera epidemic in 1965. According to surveillance system records and historical documents, cholera epidemics have claimed thousands of lives over the past centuries throughout the country (12).
However, the epidemiological features of cholera have changed dramatically in the Islamic Republic of Iran since 1965 and this study aimed to address the sociodemographic characteristics and their relationship with variations in transmission routes through the past 3 epidemics in 1998, 2005 and 2011.

1098
Research article EMHJ – Vol. 26 No. 9 – 2020
Methods Study setting and population characteristicsThe Islamic Republic of Iran is located in the south-west region of Asia with an area landmass of 1 630 207 km2 and a population of approximately 80 million. This country borders Turkey, Iraq, Azerbaijan, Armenia, Turkmeni-stan, Afghanistan and Pakistan, and is divided into 31 provinces. At the time of this study, urban inhabitants made up 69% of the population (13).
Cholera surveillance systemThe Cholera Surveillance System is operated by the Iranian Department of Food and Waterborne Disease in the Center for Communicable Disease Control. Any suspicious case with mild to severe diarrhoea attending hospitals (public/private), clinics and health centres (ur-ban/rural) are included in a free-of-charge stool culture screening programme. In addition, all travellers arriving inro the country from neighbouring endemic countries to the east and west (based on WHO reports) by land or sea are screened for cholera at border health posts, es-pecially during July–December. Diagnostic as well as treatment centres are obliged to immediately notify the Department of Food and Waterborne Disease of any con-firmed case of cholera based on laboratory certification via the district health centre.
All confirmed cases are cross-checked by stool culture and serotyping in national reference laboratories. As part of the National Cholera Surveillance System, the sensitivity of V. cholerae to antimicrobials should be assessed annually. Furthermore, a round of active case investigation is conducted by health staff among people who have had a history of close contact with index cases, after which records are entered into a national electronic database. These records comprise demographic characteristics, domicile, nationality, date of onset of
signs and symptoms, date of diagnosis, date of entry to the Islamic Republic of Iran, questions about type and frequency of meals during the 5 days prior to diagnosis, and history of travelling outside the region.
Data source, statistical proceduresIn this descriptive study, cholera incidence data provided by the National Surveillance Database during the last 5 decades (1965–2014), and coverage data on accessibility to safe drinking water based on the WHO definition of san-itation (14) in the Center for Communicable Disease Con-trol were extracted for 1965–2014. The national census data for 6 periods over 1965–2011 were used to estimate incidence rates and consequential trends. For analysis of linear trend of cholera incidence rates, the Cochran–Armitage test for trend using Winpepi software was em-ployed. Any unexpected increase/departure from a linear trend based on the Cochran–Armitage test in number of cases of cholera incidents over this period was considered an outbreak. Data on the past 3 outbreaks were disaggre-gated by province. To realize the most important deter-minants of cholera incidence in the outbreaks, adjusted odds ratios were computed by ordinal logistic regression using STATA, version 11. This method takes into account the effect of exposure(s) over the 3 levels of an ordered outcome (outbreaks in 1998, 2005 and 2011), and yields an OR summarizing effect(s) across given exposure levels. P-value ≤ 0.05 was considered significant.
ResultsAnalysis of cholera incidence during 1965–2014 re-vealed a tremendous decrease in incidence trends from 19.7/100 000 in 1965 to 0.01/100 000 in 2014 (P = 0.0001), with 9 epidemics having occurred at 5–6 year inter-vals (Figure 1). The highest incidence was in 1970 at 66.7/100 000 population.
Figure 1 Trend of cholera in the Islamic Republic of Iran 1965–2014 (linear refers to the incident trend of cholera cases)
Num
ber o
f cas
es
Inci
den
ce r
ate
per
100
000
Number Linear (Number)Incidence/100000
25000
20000
15000
10000
5000
0
70
60
50
40
30
20
10
0
Num
ber o
f cas
es
162
221 75
057
7
344
322
55 304
3966
210
1083
6
1966
3
264
1856
1632
6107
343
270
576 18
8871 30
924
8552
2017
8 1889
142 14
3215
2148
6211
1497
5612
4534
510
511
8 96 9411
3324 57 22
018 15 11
8753 25
69
5073

1099
Research article EMHJ – Vol. 26 No. 9 – 2020
Figure 2 shows the frequency of cholera cases by province in the last 3 epidemics in the country: 21 provinces reported at least one outbreak during the period 1998–2014, and in the north and central plateau regions, 5 provinces experienced the last 3 outbreaks.
Figure 3 indicates coverage rate of accessibility to safe drinking water and sanitation in the past 4 decades. The number of households with access to safe drinking water and sanitation has increased dramatically, however the gradient of the slope for increasing accessibility to sanitation is dissimilar: and at least 20% of inhabitants in
the south-east regions did not have access to sanitation by 2011.
The incidence rate of cholera in the country has fallen since the 1998 outbreak, primarily in the provinces in the northern and south-eastern parts of the country: Figure 4 shows the distribution by province over the last 3 outbreaks. While inaccessibility of safe drinking water was prominent in the 1998 outbreak, consumption of raw vegetables that were cultivated using sewage was the main route for cholera transmission in the northern region in 2005 and 2011. The main route for disease
Figure 2 Distribution of cholera cases in the provinces of the Islamic Republic of Iran in the last three cholera epidemics (1998, 2005, 2011)
Figure 3 Accessibility to drinking water and sanitation in the Islamic Republic of Iran, 1976–2011
100
90
80
70
60
50
40
30
20
10
0
64
7094 95 96 97 97 98
777575717170
66
51
1976 1990 2006 2007 2008 2009 2010 2011
Year
Drinking water Sanitation
Cove
rage
Rat
e(%)
1998 20112005
0
300
600
900
1200
1500
Hormozg
an
Khorasan-shomali
Khorasan-jonoubi
Chaharmahal-B
akhtiari
Bushehr
Kohkiloye-Boyerahmad
Ilam
Kerman
FarsYazd
Azerbaijan-gharbi
Ardebil
Kermansh
ah
Lorestan
Azerbaijan-sh
arqi
Esfahan
Semnan
Zanjan
Khorasan-RazaviGila
n
Kurdestan
Qazvin
Sistan-Baluch
estan
Mazandaran
HamedanQom
Golestan
Alborz
Markazi
Khuzestan
Tehran
Num
ber o
f cas
es

1100
Research article EMHJ – Vol. 26 No. 9 – 2020
transmission in the south-eastern region in 2011 was the consumption of unsafe drinking water.
Cholera transmission season in the Islamic Republic of Iran begins in July and extends to December (Table 1). Comparison of the most recent epidemic (2011) against the previous 2 (1998 and 2005) shows that the incidence decreased from July to December, and in 2005 and 2011 this reduction in incidence occurred earlier (July–October) compared with 1998. Generally, the number of cholera cases decreased in the older age groups in the last 2 epidemics (2005, 2011) compared with 1998. Comparison of urban and rural populations showed the likelihood of cholera had decreased in rural areas to 37%, and urban populations were more likely to be affected in the past 2 epidemics compared with 1998. Iranians made up the majority of cholera patients in all 3 epidemics. There was no change in the hospitalization rates in all 3 epidemics, and in accordance with this, the cholera case fatality rates did not change either. Although there has been a switching pattern between Inaba and Ogawa as the dominant serotypes during the last 3 epidemics, Ogawa was isolated more often in the most recent epidemic.
DiscussionCholera incidence distribution during previous epidem-ics has been characteristically different over time. While the burden in terms of case load has been reduced in re-cent years and the number of epidemic regions has di-minished, 5 provinces have been susceptible in all 3 epi-demics. Evidence on the transmission mechanism in the past 3 epidemics has revealed different routes within and
between affected regions: inaccessibility of safe drinking water in affected areas in 1998 and in the south-east re-gion in 2011 was indicated as the main route of transmis-sion, while consumption of raw vegetables contaminated by sewage in the northern region was more prominent in the 2005 and 2011 epidemics. Women, younger age groups and inhabitants in urban areas were more vul-nerable to cholera disease in recent epidemics, neverthe-less, the case fatality rate has not differed over the last 3 epidemics. However, the epidemiological features of the disease have changed considerably.
The most important change seen in the epidemiological features of cholera in the Islamic Republic of Iran is the transmission route. In low- and middle-income countries and in non-sanitary environments without access to potable water, the main route of cholera transmission was water. However, in 2 recent epidemics (2005, 2011), the pathogen was isolated from sewage, raw vegetables and human samples simultaneously (15–17). Moreover, laboratory findings with genotyping and molecular techniques showed clonal dissemination of a single strain of V. cholerae throughout the country in 2005 (18).
In addition to raw vegetables, having a meal outside the home was associated with cholera occurrence in a 2005 meta-analysis (19). The annual incidence rate of typhoid fever, a waterborne/foodborne disease having a common transmission mechanism (oral–faecal) with cholera, was dramatically reduced from 133.4 to 0.52 per 100 000 population in the country between 1965 and 2011 (20).
The second important change is related to domicile. This change in the cholera transmission mechanism
Figure 4 Map showing incidence rate of cholera in the last three cholera epidemics (1998, 2005, 2011) in the Islamic Republic of Iran
15
<caption>Figure 4. Map showing incidence rate of cholera in the last three epidemics (1998, 2005, 2011) in the Islamic Republic of Iran

1101
Research article EMHJ – Vol. 26 No. 9 – 2020
in recent years is likely due to a significant expansion in the urban populations following huge migrations of people seeking better job opportunities from the villages to the marginal areas of cities, where no facilities were planned (13). Furthermore, increasing accessibility of safe drinking water in rural areas along with improvements in socioeconomic conditions in general may explain the decreasing slope of incident trend in rural areas.
However, as in other middle-income countries, there is an increasing trend towards having meals, especially fast food with salad, outside the home in urban areas, and this has played a significant role in the occurrence of diseases which have oral–faecal transmission routes in recent years compared with rural areas (17,19).
The third change is age distribution of the disease. Comparison of age groups the epidemics of 2005 and
Table 1 Characteristics of the last three cholera epidemics (1998, 2005, 2011) in the Islamic Republic of Iran
Attribute Year Adjusted OR (95% CI)1998 (n = 9752) 2005 (n = 1133) 2011 (n = 1187)
No. % No. % No. %Month
July 209 2.14 38 3.35 58 4.88 Reference
August 1503 15.41 586 51.72 182 15.33 0.52 (0.49–0.55)
September 5562 57.03 349 30.08 913 76.92
October 1321 13.54 125 11.03 32 2.69
November 1038 10.64 31 2.73 2 0.18
December 119 1.22 4 0.35 – –
Age (years)
< 1 273 2.79 24 2.11 15 1.26 Reference
1–4 446 4.57 60 5.29 57 4.80 0.82 (0.81–0.84)
5–9 234 2.39 49 4.32 45 3.79
10–14 254 2.60 49 4.32 60 5.05
15–24 1102 11.30 310 27.36 242 20.38
25–34 1122 11.50 275 24.27 268 22.57
35–44 986 10.11 132 11.56 207 17.44
45–54 1092 11.19 88 7.76 109 9.18
55–64 1199 12.29 69 6.09 58 4.88
≥ 64 3042 31.19 77 6.79 126 10.61
Sex
Male 5168 52.99 600 52.95 550 46.33 Reference
Female 4584 47.01 533 47.04 637 53.67 1.16 (1.06–1.27)
Domicile
Urban area 6086 62.41 895 78.99 802 67.56 Reference
Rural area 3666 37.59 238 21.01 385 32.44 0.63 (0.56–0.69)
Nationality
Iranian 9166 93.99 1102 97.27 1128 95.03 Reference
Afghan 507 5.19 26 2.29 54 4.54 0.68 (0.56–0.83)
Pakistani 79 0.82 5 0.44 5 0.43
Severity
Hospitalized 2555 26.19 227 20.04 386 32.52 Reference
Outpatient 7197 73.81 906 79.96 801 67.48 0.95 (0.85–1.48)
Serotype
Inaba 92 0.94 1122 99.03 12 1.01 Reference
Ogawa 9603 98.47 11 0.97 1175 98.99 0.08 (0.07–0.09)
Hikojima 57 0.59 – – – –
Treatment outcome
Cured 9642 98.88 1122 99.03 1175 98.99 Reference
Died 110 1.12 11 0.97 12 1.01 0.88 (0.56–1.38)

1102
Research article EMHJ – Vol. 26 No. 9 – 2020
2011 showed that older age groups were less affected than in 1998. A study on the effect of age on cholera morbidity in the Islamic Republic of Iran has indicated that partially acquired immunity in endemic areas acts as an important determinant of epidemics with 5–6 year intervals. Younger age groups with insufficient prior immunity against the cholera pathogen might be the outcome in recent epidemics (21).
The fourth change is the main challenge of controlling of cholera in the country in relation to illegal migration from neighbouring countries. Even though the role of foreign immigrants during the 3 epidemics we studied was not prominent, the number of cholera cases imported from outside Iranian borders is overrepresented in the interval years between epidemics. Accordingly, among 256 total confirmed cholera cases in the country during 2013, 211 (83%) were imported from Afghanistan (22,23).
An evaluation of cholera outbreaks in the south-east region during 2010–2013 showed 63.3% of all cases were imported from Afghanistan (24).
The fifth notable change in cholera epidemiology is in mortality. There was no significant difference in mortality: the case fatality rate was around 1% throughout the 3 epidemics. There have been fewer deaths in recent epidemics, mainly due to recent improvements in case management and access to treatment services (25).
The main challenge for cholera disease control in the next decade will depend on the prevalence of antimicrobial resistance. According to the latest report on V. cholerae sensitivity to antimicrobials and its susceptibility testing on the 60 samples of V. cholerae serotype Inaba showed all isolates were resistant to nalidixic acid, tetracyclin, and trimethoprim sulfamethoxazole, with intermediate resistance to erythromycin, while they were sensitive to ciprofloxacin, cefixime and ampicillin (22). Furthermore, while all isolates were sensitive to tetracyclin, ciprofloxacin, and erythromycin in 2005 (15), in 2013 they were resistant to tetracyclin with intermediate resistance to erythromycin (22). In 2005, a study in Tehran showed that 86%, 84%, 84%, and 82% of the isolates were resistant to streptomycin, chloramphenicol, co-trimoxazole, and tetracycline, respectively. All of the isolates were susceptible to 3 antimicrobial agents, including
ciprofloxacin, cefixime and ampicillin (18). In 2011, another Iranian study revealed that all of the isolates were susceptible to 3 antimicrobial agents, including ciprofloxacin, cefixime, and ampicillin, and the highest rate of resistance was seen to nalidixic acid (96.7 %) and co-trimoxazole (91.8 %) (26).
This is the first study in the Islamic Republic of Iran to use longitudinal data and describe the incidence trends of cholera disease over 5 decades (1965–2014), however there were some limitations in the study. Epidemiologic features and control of cholera disease based on related factors were investigated for the last 3 epidemics. While under-ascertainment of cholera cases due to mild or no symptoms of infections (90–95%) is common, under-reporting and variations in case definitions and methods of case finding in the communicable disease surveillance system in the country over 50 years should be indicated as the main limitation (27,28). However, in the case of cholera, under-ascertainment and under-reporting issues improved following intensified sensitivity of the communicable diseases surveillance system: it has been an urgent notifiable disease for at least 3 decades (29,30). Even though we analysed cholera outbreaks using logistic regression, it may be useful to consider time series analysis of the fluctuations of cholera incidence after adjustment for trend, periodicity and seasonality.
ConclusionThe burden of cholera disease in terms of case load has been reduced dramatically in the past 5 decades. Further, the epidemiological features of cholera in regard to trans-mission route, location, age, immigration, mortality and antimicrobial resistance have changed considerably in recent epidemics. While the number of epidemic regions has diminished, some areas throughout the country are still susceptible to outbreaks. Besides maintaining and strengthening the National Cholera Surveillance System, which focuses on changes in the epidemiologic features of cholera, well-designed control measures by communi-ty health authorities are recommended.
AcknowledgementThe authors are grateful for the kind collaboration of all staff in the Center for Communicable Diseases Control (Tehran), provincial and district health centres and laboratory technicians throughout the country for data collection.
Funding: None.
Competing interests: None declared.

1103
Research article EMHJ – Vol. 26 No. 9 – 2020
Épidémiologie du choléra en République islamique d’Iran (1965-2014)RésuméContexte : Le choléra est endémique en République islamique d’Iran. D’après les registres du système de surveillance et les documents publiés, les épidémies de choléra ont causé des milliers de décès à travers le pays au cours des siècles passés.Objectifs : L’objectif de la présente étude était d’établir une vue d’ensemble de l’épidémiologie du choléra au cours des cinq dernières décennies (1965-2014) et des caractéristiques épidémiologiques des dernières grandes flambées épidémiques.Méthodes : Dans cette étude descriptive, les données sur l’incidence du choléra fournies par la base de données nationale de surveillance ont été extraites et les tendances fluctuantes significatives pour 1965-2014 ont été évaluées au moyen du test de Cochran-Armitage. Pour identifier les facteurs les plus associés à l’incidence du choléra au cours des flambées épidémiques, des odds ratios ajustés ont été calculés par régression logistique ordinale.Résultats : L’analyse des données a révélé une diminution considérable dans les tendances d’incidence de la maladie. En effet, l’incidence du choléra est passée de 19,7 pour 100 000 à 0,01 pour 100 000 au cours des neuf épidémies de choléra qui se sont produites à cinq ou six ans d’intervalle entre 1965 et 2014. Les groupes d’âge les plus jeunes (15-44 ans) et les habitants des zones urbaines ont été plus vulnérables au choléra lors des épidémies récentes. La virulence de l’agent pathogène et le taux de létalité n’ont pas changé au cours des trois dernières épidémies. Conclusions : En termes de nombre de cas, le fardeau du choléra a diminué de manière manière considérable au cours de la période comprise entre 1965 et 2014. En outre, les caractéristiques épidémiologiques du choléra en ce qui concerne les voies de transmission, le domicile, l’âge, l’immigration, la mortalité et la résistance aux antimicrobiens ont notablement évolué au cours des dernières épidémies. Bien que le nombre de régions touchées par ces épidémies ait diminué, certaines zones sont toujours vulnérables aux flambées de choléra.
وبائيات الكولريا يف مجهورية إيران اإلسالمية، 1965-2014حسني معصومي اصل، غودارز كوليفرهود، حممد مهدي جويا
اخلالصةاخللفية: تتوطن الكولريا يف مجهورية إيران اإلسالمية. ووفقا لسجالت نظام الرتصد واملستندات السابقة، فقد تسببت الكولريا يف آالف الوفيات يف
مجيع أنحاء إيران عىل مدار القرون املاضية.الوبائية يتمثل اهلدف من هذه الدراسة يف استعراض مرض الكولريا عىل مدار العقود اخلمسة املاضية )1965-2014( واخلصائص األهداف:
آلخر الفاشيات التي حدثت عىل نطاق واسع.د األمراض، كام طرق البحث: يف هذه الدراسة الوصفية، استخرجت البيانات عن معدالت اإلصابة بالكولريا من قاعدة البيانات الوطنية لرتصفحصت االجتاهات املتذبذبة بصورة كبرية يف الفرتة من 1965-2014 باستخدام اختبار كوكران-أرميتاج. وحسبت نسب األرجحية باستخدام
االنحدار اللوجستي التتابعي لتحديد العوامل األكثر ارتباطا بحدوث اإلصابة بالكولريا أثناء الفاشيات.النتائج: أظهر حتليل البيانات انخفاضا هائال يف االجتاهات السائدة يف اإلصابة، حيث انخفضت النسبة من 19.7 لكل 100000 نسمة إىل 0.01 2014-1965. وكانت الفرتة من 5-6 سنوات خالل التي حدثت عىل فرتات ترتاوح بني التسعة الكولريا 100000 نسمة خالل أوبئة لكل الفئات العمرية األصغر سنا )15 -44 عاما( وسكان املناطق احلرضية أكثر عرضة لإلصابة بالكولريا أثناء األوبئة التي حدثت مؤخرا. ومل حيدث
تغري يف الشدة الفريوسية ملسببات مرض الكولريا ومعدالت إماتة احلاالت عىل مدار األوبئة الثالثة األخرية. االستنتاجات: انخفض عبء مرض الكولريا بصورة كبرية خالل الفرتة من 1965-2014. وعالوة عىل ذلك، فقد شهدت األوبئة التي حدثت ضني لإلصابة هبا، مؤخرا تغريا كبريا يف اخلصائص الوبائية للكولريا من حيث طريقة انتقال العدوى هبا، وأماكن توطنها، وعمر األشخاص املعرواهلجرة، والوفيات، ومقاومة مضادات امليكروبات. وعىل الرغم من انخفاض عدد املناطق الوبائية، إال أن بعض املناطق ال تزال عرضة حلدوث
فاشيات الكولريا هبا.
References 1. Ali M, Lopez AL, You YA, Kim YE, Sah B, Maskery B, et al. The global burden of cholera. Bull World Health Organ. 2012 Mar
1;90(3):209–18A. doi:10.2471/BLT.11.09342
2. Gangarosa EJ. The epidemiologic basis of cholera control. Bull Pan Am Health Organ. 1974;8(3):189–97. PMID:4419770

1104
Research article EMHJ – Vol. 26 No. 9 – 2020
3. Seventy-first World Health Assembly. Geneva: World Health Organization; 2018 (https://www.who.int/news-room/head-lines/24-05-2018-seventy-first-world-health-assembly-update-24-may, accessed 10 October 2019).
4. Guidelines for the collection of clinical specimens during field investigation of outbreaks. Geneva: World Health Organization; 2000.
5. Codeço CT. Endemic and epidemic dynamics of cholera: the role of the aquatic reservoir. BMC Infect Dis 2001;1:1. PMID:11208258
6. World Health Organization. Cholera, 2012. Weekly Epidemiological Record: relevé épidémiologique hebdomadaire. 2013;88(31):321–36.
7. Jutla A, Whitcombe E, Hasan N, Haley B, Akanda A, Huq A, et al. Environmental factors influencing epidemic cholera. Am J Trop Med Hyg. 2013 Sep;89(3):597–607. doi:10.4269/ajtmh.12-0721
8. Safa A, G Nair G, Kong R. Evolution of new variants of Vibrio cholerae O1. Trends Microbiol. 2010 Jan;18(1):46–54. doi:10.1016/j.tim.2009.10.003
9. World Health Organization. Weekly Epidemiological Record: relevé épidémiologique hebdomadaire. 2014;40:517–26.
10. World Health Organization. Weekly Epidemiological Record: relevé épidémiologique hebdomadaire. 2015;38:433–40.
11. Weekly update: cholera cases in Yemen, 23 January 2017. Geneva: World Health Organization; 2017 (http://www.emro.who.int/pandemic-epidemic-diseases/outbreaks/index.html, accessed 29 October 2019).
12. Azizi MH, Azizi F. History of cholera outbreaks in Iran during the 19th and 20th centuries. Middle East J Dig Dis. 2010;2(1):51–55. PMID:25197514
13. Census data. Tehran: Statistical Center of Iran, National Portal of Statistics; 2017 (https://nnt.sci.org.ir/sites/nnt/SitePages/re-port_90/gozaresh.aspx, accessed 22 June 2017).
14. Guidelines for drinking-water quality, 4th ed. Geneva: World Health Organization; 2017.
15. Rahbar M, Sabourian R, Saremi M, Abbasi M, Masoumi Asl H, Soroush M. [Epidemioloic and drug resistant pattern of Vibrio cholerae O1 Biotype El Tor, Serotype Inaba during the summer of 2005 outbreak in Iran]. J Ardabil Univ Med Sci. 2007;7:41–45 (in Farsi).
16. Jonaidi Jafari M, Radfar MH, Ghofrani H, Masoumi Asl H. Epidemiological and bacteriological Features of the Cholera Outbreak in Iran (2005). J. Med. Sci. 7(4):645–649.
17. Karami M, Masoumi Asl H, Mohammadin M, Raeofi H, Saghafipour A, Noroozi M, et al. [Qom cholera outbreak in 2011: influen-tial and determinant factors]. Iran J Epidemiol. 2012;8(3):84–92 (in Farsi).
18. Pourshafie M, Bakhshi B, Ranjbar R, Sedaghat M, Sadeghifard N, Yazdi JZ, et al. Dissemination of a single Vibrio cholerae clone in cholera outbreaks during 2005 in Iran. J Med Microbiol. 2007;56(2):1615–9. doi:10.1099/jmm.0.47218-0
19. Eshrati B, Zahraei S, Soroush M, Masoumi Asl H, Afshani A, Ramezian M, et al. [Use of meta-anaglysis to determining the associ-ated factors of an outbreak occurred in the summer 2005 in Iran]. J Arak Univ Med Sci 2008;11:99–108 (in Farsi).
20. Masoumi Asl H, Gouya MM, Nabavi M, Aghili N. Epidemiology of typhoid fever in Iran during last five decades from 1962–2011. Iran J Public Health. 2013;42:33. PMID:23513182
21. Masoumi Asl H, Esteghamati A, Zahraei SM. The effect of age group under 15 years on cholera morbidity during the past 10 years in Iran (1996–2005). Iran J Pediatr. 2008;18(Suppl. 1):9–14.
22. Masoumi-Asl H, Gouya MM, Rahbar M, Sabourian R. The epidemiology and antimicrobial resistance of cholera cases in Iran during 2013. Iran J Microbiol. 2016;8(4):232–7. PMID:28210461
23. World Health Organization. Weekly Epidemiological Record: relevé épidémiologique hebdomadaire. 2014;31:345–56.
24. Sargolzaie N, Kiani M. Cholera outbreaks evaluation in Sistan and Baluchestan province of Iran. Int J Infect 2014;1(1). doi:1:e19636 0.17795/iji.19636
25. Lankarani K, Alavian M, Payam P. Health in the Islamic Republic of Iran, challenges and progresses. Med J Islam Repub Iran. 2013 Feb;27(1):42–9. PMID:23479501
26. Hajia M, Rahbar M, Farzami MR, Masoumi Asl H, Dolatyar A, Imani M, et al. Assessing clonal correlation of epidemic Vibrio cholerae isolates during 2011 in 16 provinces of Iran. Curr Microbiol. 2015;70(3):408–14. doi:10.1007/s00284-014-0725-2
27. Fararouei M, Rezaee S, Raigan Shirazi A, Naghmachi M, Karimzadeh Shirazi K, Jamshidi A, et al. National guidelines for out-break investigation: an evaluation study. East Mediterr Health J. 2013;19(9):816–20. doi:10.26719/2013.19.9.816
28. Kazerooni PA, Fararouei M, Nejat M, Akbarpoor M, Sedaghat Z. Under-ascertainment, under-reporting and timeliness of Iranian communicable disease surveillance system for zoonotic diseases. Public Health. 2018;154:130–5. https://doi.org/10.1016/j.puhe.2017.10.029.
29. Food and Agriculture Organization, World Health Organization, Research Center for Gastroenterology and Liver Disease, Sha-heed Beheshti University of Medical Sciences, Tehran, National Research Council, Policy and Global Affairs, Office for Central Europe and Eurasia. Food safety and foodborne disease surveillance systems: proceedings of an iranian-american workshop. Washington DC: National Academies Press; 2006:10:46–7.
30. Ataei RA, Tavana A, Ghorbani GH. An analysis of recent cholera epidemic in Iran. J Mil Med. 2005;7:49–56.

1105
Research article EMHJ – Vol. 26 No. 9 – 2020
Regional disparities in the distribution of Sudan’s health resourcesMohamed Ismail1
1Institute of Public Administration, Riyadh, Saudi Arabia (Correspondence to: Mohamed Ismail: [email protected]).
AbstractBackground: Equal distribution of health resources has been a core objective of both long- and medium-term strategic plans for the health sector in Sudan. However, the targets of these plans have not yet been achieved, resulting in weak per-formance of the whole health system. The unequal distribution of the health resources has resulted in significant regional disparities in provision of health care services.Aims: This study aims to describe and analyse the inequality in geographic distribution of public sector’s physical and human health resources in Sudan. In addition, the study also aims to measure the relations between density of health resources and health outcomes.Methods: State-level data on health resources and health outcomes obtained from the Sudan Health Statistical Report of 2016 were used to calculate inequality indices, drawing Lorenz curves, and calculating Spearman’s correlation analysis between health resource density and health-related outcomes. Results: Our findings show that the distributions of health resources, based on population size, were highly unequal among the 18 states of Sudan.Conclusion: There is a crucial need to improve health status in the relatively under-resourced states, particularly in Dar-fur, South Kordofan and Blue Nile states. Moreover, the government needs to use health resource allocation models that take into account the population size and health outcomes variables in each state in future health strategies.Keywords: health resources, Gini coefficient, dissimilarity index, resource concentration index, Sudan Citation: Ismail M. Regional disparities in the distribution of Sudan’s health resources. East Mediterr Health J. 2020;26(9):1105-1114. https://doi.org/10.26719/emhj.20.056Received: 09/02/19; accepted: 04/06/19Copyright © World Health Organization (WHO) 2020. Open Access. Some rights reserved. This work is available under the CC BY-NC-SA 3.0 IGO license (https://creativecommons.org/licenses/by-nc-sa/3.0/igo)
IntroductionBackgroundInequality of health resources is a worldwide phenome-non but it is more predominant in developing countries (1). Maldistribution of health resources has been one of the leading health care problems in many countries (2). Several studies have shown that inequitable geograph-ical distribution of health resources is a major problem that hinders population access to health care services (3–5). Moreover, many studies show that there is a positive correlation between the availability of health resources and health outcomes represented by life expectancy and mortality rates (6,7). Therefore, equitable distribution of health resources in developing countries is of paramount importance, as many of these countries face severe short-ages in physical and human resources to provide essen-tial health care services (8,9).
In Sudan, inequitable regional distribution of wealth and resources has been the leading driver of political conflicts and violence since its independence in 1956 (9–11). Power sharing, equal distribution of national resources and provision of basic services to all citizens have been the main common goals for both political parties and armed movements (11). Many factors have cumulatively contributed to the inequality of resources in Sudan in the past decades. These factors include
political, economic and administrative polices adopted by the successive national governments (10).
Nonetheless, the government of Sudan strives to provide equitable health care services to the whole population. The long-term strategic plan for health sector (2003–2027) aims to provide equitable, accessible, affordable, efficient and quality health care services (12). In line with the long-term plan objectives, the national health sector medium-term plan (2012–2016) also marks equity in access and utilization of health services (13). However, the targets of these plans have not been achieved (14). As a result, the distributions of health resources have been highly unequal, reflecting significant regional disparities in provision of health care services (13–15). For example, recent statistics show that the number of physicians per 100,000 population varied between 1.8 and 28.5 physicians across the Sudan’s 18 administrative states in 2016 (16). The range is even wider for the nurse density rate, ranging from 6.6 to 90.2 nurses per 100 000 population (16).
Thus, it is immensely important to carry out research on the inequality of geographic distribution of health care resources in Sudan to enable the country to set strategies for improving population access to health care services.
Sudan’s health status The key national health indicators reveal that the overall Sudan’s health status is low (8,17). Moreover, the point es-

1106
Research article EMHJ – Vol. 26 No. 9 – 2020
timators of these indices disguise significant interstate and intrastate differences. There are marked disparities in the values of these indicators between the country’s states. For example, the percent of the population with no access to health services ranged between 20 to 40% (8). This is mainly due to security concerns in conflict-affect-ed states in Darfur, South Kordofan and Blue Nile, where most health care facilities are not accessible (8). About 45% of the population has no access to improved drink-ing water, particularly in the rural and conflict-affected areas, and more than 50% of selected essential medicines are not available (17). Moreover, the physician, nurse, and midwife densities are far below the minimum threshold of 230 doctors, nurses and midwives per 100 000 popu-lation that was recommended by WHO as necessary to deliver crucial maternal and child health services (18).
Despite the poor health status, the infant mortality rate (IMR) fell from 70 per 1000 live births in 2006 to 48 per 1000 live births in 2015, but still higher than the Millennium Development Goals (MDGs) target of 40 deaths per 1000 live births (17,19). Similarly, the under-5 years mortality rate (U5MR) also declined from 112.2 per 1000 live births in 2006 to 70 per 1000 live births in 2015, again still higher than the MDGs target of 53 deaths per 1000 live births in 2015 (17,19). Likewise, the maternal mortality rate (MMR) decreased from 509 per 100 000 live births in 2000 to 311 per 100 000 live births in 2015, still higher than the MDGs target of 134 deaths per 100 000 live births (17,19). The total life expectancy at birth also improved, from 58.0 years in 2007 to 63.7 years in 2015 (17,19).
This poor status of health is largely associated with low financial and human resources allocated to the health sector. In Sudan, the domestic general government health expenditure is extremely low, amounting to less than 2 % of the Gross Domestic Product (GDP) in 2015, far below the world level (20).The per capita government and private health expenditures in in 2015 were PPP US$ 86.3 and PPP US$ 185.4, respectively, which are also far below world level values (20).
Study objectivesDespite the unequal distribution of health care services and resources across Sudan’s regions, up to now it seems that no study has been carried out on the geographic dis-tribution of health resources. Therefore, this study aims to fill the existing research gap by analysing the level of inequality in geographic distribution of the public sec-tor’s health resources using 2016 data. In addition, the study also aims to measure the relationships between density of health human resources (physicians and nurse) and health outcomes.
MethodsStudy variables and data sourcesTo measure the level of health resources distribution be-tween states, 2 groups of variables were studied:
• health facilities, which includes hospitals, health units, health centres and beds;
• human resources, which includes specialist physi-cians, dentists, all physicians, nurses, public health officers, medical assistants, technicians, midwives, and health visitors.
The data for this study were obtained from the Sudan Health Statistical Report of 2016, published by the Fed-eral Ministry of Health (16). The report provides detailed health statistics for the 18 states of Sudan for 2016.
Inequality indicesThere are many indices for measuring inequality in the geographic distribution of health variables. The most common indices used in analysing inequality in the dis-tribution of health resources include the Lorenz curve, the Gini coefficient, the weighted coefficient of varia-tion and the dissimilarity index (21–24). In addition, the author has developed a resource concentration index to determine relatively under- and over-resourced regions/states.
Weighted coefficient of variation Like the ordinary coefficient of variation, weighted coef-ficient of variation (WCV) is a relative measure of disper-sion. Taking the impact of population share in each state into account, the population WCV for a variable y (e.g. health resource), given a sampling weight hw and size variable hs (population size), is defined as (24):
5
<h2>Inequality indices
<body1>There are many indices for measuring inequality in the geographic distribution of health
variables. The most common indices used in analysing inequality in the distribution of health
resources include the Lorenz curve, the Gini coefficient, the weighted coefficient of variation
and the dissimilarity index (21–24). In addition, the author has developed a resource
concentration index to determine relatively under- and over-resourced regions/states.
<h2>Weighted coefficient of variation
<body1>Like the ordinary coefficient of variation, weighted coefficient of variation (WCV) is a
relative measure of dispersion. Taking the impact of population share in each state into account,
the population WCV for a variable y (e.g. health resource), given a sampling weight hw and size
variable hs (population size), is defined as (24):<eqn>
[1]
<body>Where:<eqn>
<body>High WCV values indicate a higher degree of health resource inequality and vice versa.
As a relative measure of dispersion, WCV allows comparison of inequality levels for different
health variables.
<h2>Gini coefficient
<body1>The Gini coefficient (GC) is widely used to assess the inequality distribution of health
resources. For a sample of size n (e.g. number of regions), the GC for variable y (e.g. health
resource) given a sampling weight hw and size variable hs (population size) is estimated as
follows (24):<eqn>
221
12
12
100
nw yi i
inw i
iWCVµ
µ
å=
å=
-é ùê úê ú= ´ê úê úë û
!
!
n
i ii=1
n
ii=1
w y
i i iw
w =hw hs and µå
´ =å
!
Where:
5
<h2>Inequality indices
<body1>There are many indices for measuring inequality in the geographic distribution of health
variables. The most common indices used in analysing inequality in the distribution of health
resources include the Lorenz curve, the Gini coefficient, the weighted coefficient of variation
and the dissimilarity index (21–24). In addition, the author has developed a resource
concentration index to determine relatively under- and over-resourced regions/states.
<h2>Weighted coefficient of variation
<body1>Like the ordinary coefficient of variation, weighted coefficient of variation (WCV) is a
relative measure of dispersion. Taking the impact of population share in each state into account,
the population WCV for a variable y (e.g. health resource), given a sampling weight hw and size
variable hs (population size), is defined as (24):<eqn>
[1]
<body>Where:<eqn>
<body>High WCV values indicate a higher degree of health resource inequality and vice versa.
As a relative measure of dispersion, WCV allows comparison of inequality levels for different
health variables.
<h2>Gini coefficient
<body1>The Gini coefficient (GC) is widely used to assess the inequality distribution of health
resources. For a sample of size n (e.g. number of regions), the GC for variable y (e.g. health
resource) given a sampling weight hw and size variable hs (population size) is estimated as
follows (24):<eqn>
221
12
12
100
nw yi i
inw i
iWCVµ
µ
å=
å=
-é ùê úê ú= ´ê úê úë û
!
!
n
i ii=1
n
ii=1
w y
i i iw
w =hw hs and µå
´ =å
!
High WCV values indicate a higher degree of health resource inequality and vice versa. As a relative measure of dispersion, WCV allows comparison of inequality levels for different health variables.
Gini coefficient The Gini coefficient (GC) is widely used to assess the in-equality distribution of health resources. For a sample of size n (e.g. number of regions), the GC for variable y (e.g. health resource) given a sampling weight hw and size variable hs (population size) is estimated as follows (24):
6
[2]
<body>Where:<equ>
<body>The coefficient value ranges between 0 and 1. Lower values indicate less inequality in
the distribution of the resources, and higher values suggest greater inequality. A Gini coefficient
< 0.2 indicates absolute equality, 0.2–0.3 low inequality, 0.3–0.4 medium inequality, 0.4–0.5
high inequality and > 0.5 represents extreme inequality (25–27).
<h2>Dissimilarity index
<body1>The dissimilarity index (DI), also known as the Hoover Index, measures the proportion
of each health resource that would have to be redistributed in order to achieve even distribution
of the health resource between states or regions. The index takes the following form (28):<eqn>
[2]
<body>Where is the percentage of the population in region i to the total population in the
country, is the percent of resource j in region i to the total resource j in the country. The index
value ranges between 0 and 1; smaller values indicate greater equity in resource allocation, and
larger values show higher inequality in the distribution of the resource.
<h2>Lorenz curves
<body1>In addition to GC and DI indices, Lorenz curves (LCs) are widely used to represent
graphically the distribution of health resources (29,30). The diagonal line in the LC represents
perfect equality of the resource distribution among regions/states. The more the variable of
1I xµ
= -!
!
!
2 2n ni i+1
i i k k k k 1 2 n-1 n2i=1 k=i1
V -V y ; V = w ; w =hw hs ; and y y ...y yV
xé ù
= ´ ³ ³ ³ê úë û
å å!
n
i ii=1n
ii=1
w y
wµ
å=å
!
iji
.j
n yp1j 2 P. yi=1
H = -åiPP.
ij
.j
yy

1107
Research article EMHJ – Vol. 26 No. 9 – 2020
6
[2]
<body>Where:<equ>
<body>The coefficient value ranges between 0 and 1. Lower values indicate less inequality in
the distribution of the resources, and higher values suggest greater inequality. A Gini coefficient
< 0.2 indicates absolute equality, 0.2–0.3 low inequality, 0.3–0.4 medium inequality, 0.4–0.5
high inequality and > 0.5 represents extreme inequality (25–27).
<h2>Dissimilarity index
<body1>The dissimilarity index (DI), also known as the Hoover Index, measures the proportion
of each health resource that would have to be redistributed in order to achieve even distribution
of the health resource between states or regions. The index takes the following form (28):<eqn>
[2]
<body>Where is the percentage of the population in region i to the total population in the
country, is the percent of resource j in region i to the total resource j in the country. The index
value ranges between 0 and 1; smaller values indicate greater equity in resource allocation, and
larger values show higher inequality in the distribution of the resource.
<h2>Lorenz curves
<body1>In addition to GC and DI indices, Lorenz curves (LCs) are widely used to represent
graphically the distribution of health resources (29,30). The diagonal line in the LC represents
perfect equality of the resource distribution among regions/states. The more the variable of
1I xµ
= -!
!
!
2 2n ni i+1
i i k k k k 1 2 n-1 n2i=1 k=i1
V -V y ; V = w ; w =hw hs ; and y y ...y yV
xé ù
= ´ ³ ³ ³ê úë û
å å!
n
i ii=1n
ii=1
w y
wµ
å=å
!
iji
.j
n yp1j 2 P. yi=1
H = -åiPP.
ij
.j
yy
The coefficient value ranges between 0 and 1. Lower val-ues indicate less inequality in the distribution of the re-sources, and higher values suggest greater inequality. A Gini coefficient < 0.2 indicates absolute equality, 0.2–0.3 low inequality, 0.3–0.4 medium inequality, 0.4–0.5 high inequality and > 0.5 represents extreme inequality (25–27).
Dissimilarity indexThe dissimilarity index (DI), also known as the Hoover Index, measures the proportion of each health resource that would have to be redistributed in order to achieve even distribution of the health resource between states or regions. The index takes the following form (28):
6
[2]
<body>Where:<equ>
<body>The coefficient value ranges between 0 and 1. Lower values indicate less inequality in
the distribution of the resources, and higher values suggest greater inequality. A Gini coefficient
< 0.2 indicates absolute equality, 0.2–0.3 low inequality, 0.3–0.4 medium inequality, 0.4–0.5
high inequality and > 0.5 represents extreme inequality (25–27).
<h2>Dissimilarity index
<body1>The dissimilarity index (DI), also known as the Hoover Index, measures the proportion
of each health resource that would have to be redistributed in order to achieve even distribution
of the health resource between states or regions. The index takes the following form (28):<eqn>
[2]
<body>Where is the percentage of the population in region i to the total population in the
country, is the percent of resource j in region i to the total resource j in the country. The index
value ranges between 0 and 1; smaller values indicate greater equity in resource allocation, and
larger values show higher inequality in the distribution of the resource.
<h2>Lorenz curves
<body1>In addition to GC and DI indices, Lorenz curves (LCs) are widely used to represent
graphically the distribution of health resources (29,30). The diagonal line in the LC represents
perfect equality of the resource distribution among regions/states. The more the variable of
1I xµ
= -!
!
!
2 2n ni i+1
i i k k k k 1 2 n-1 n2i=1 k=i1
V -V y ; V = w ; w =hw hs ; and y y ...y yV
xé ù
= ´ ³ ³ ³ê úë û
å å!
n
i ii=1n
ii=1
w y
wµ
å=å
!
iji
.j
n yp1j 2 P. yi=1
H = -åiPP.
ij
.j
yy
Where iPP. is the percentage of the population in region
i to the total population in the country, ij
.j
yy is the percent
of resource j in region i to the total resource j in the country. The index value ranges between 0 and 1; smaller values indicate greater equity in resource allocation, and larger values show higher inequality in the distribution of the resource.
Lorenz curvesIn addition to GC and DI indices, Lorenz curves (LCs) are widely used to represent graphically the distribution of health resources (29,30). The diagonal line in the LC repre-sents perfect equality of the resource distribution among regions/states. The more the variable of interest curve deviates from the diagonal, the greater the degree of un-equal distribution of the variable between regions/states.
Resource concentration indexTo determine the resource concentration among the re-gions under study, the author developed the following formula:
7
interest curve deviates from the diagonal, the greater the degree of unequal distribution of the
variable between regions/states.
<h2>Resource concentration index
<body1>To determine the resource concentration among the regions under study, the author
developed the following formula:<eqn>
[3]
<body>The resource concentration index (RCI) determines the source of inequality with a value
≥ zero; ( ). An index value = 1 indicates that the percentage of the health resource
allocated to the state is exactly equal to the percentage of the population in the region; a value
< 1 means that the region receives relatively fewer health resources compared to its population
size, and a value > 1 shows that the region receives relatively higher health resources compared
to its population size.
<h2>Data analysis
<body1>The Distribution Analysis Stata Package was used to calculate inequality indices (WCV
and GC) and plot Lorenz curves for the health resources variables. Dissimilarity and resource
concentration indices were calculated using Excel. Spearman’s rho correlation was used to
compute the correlation coefficients between density of health human resources (physicians and
nurses) and health outcomes (IMR, U5MR, MMR, and life expectancy) using SPSS statistical
package. For all the methods used for data analysis, the unit of analysis is the “state”, as the
health data were aggregated to state level in the Health Statistical Report of 2016.
<h1>Results
<h2u>Weighted coefficient of variation, Gini coefficient, and dissimilarity index
<body1>Table 1 shows the WCV and GC values for the health resources based on the population
size, in addition to DI values. For health facilities, the WCV values show that hospitals beds is
the most unequally distributed resource among the 18 states with a value of 82.9%, followed by
( )( )ij
.j
i.
yy
i PP
RC =
iRC 0³
The resource concentration index (RCI) determines the source of inequality with a value ≥ zero; (RCi ≥ 0).
An index value = 1 indicates that the percentage of the health resource allocated to the state is exactly equal to the percentage of the population in the region; a value < 1 means that the region receives relatively fewer health resources compared to its population size, and a value > 1 shows that the region receives relatively higher health resources compared to its population size.
Data analysisThe Distribution Analysis Stata Package was used to calcu-late inequality indices (WCV and GC) and plot Lorenz curves for the health resources variables. Dissimilarity and resource concentration indices were calculated using Excel. Spearman’s rho correlation was used to compute the correlation coefficients between density of health human resources (physicians and nurses) and health out-comes (IMR, U5MR, MMR, and life expectancy) using SPSS statistical package. For all the methods used for data analysis, the unit of analysis is the “state”, as the health data were aggregated to state level in the Health Statisti-cal Report of 2016.
ResultsWeighted coefficient of variation, Gini coefficient, and dissimilarity indexTable 1 shows the WCV and GC values for the health re-sources based on the population size, in addition to DI values. For health facilities, the WCV values show that hospitals beds is the most unequally distributed resource among the 18 states with a value of 82.9%, followed by health units, health centres and hospitals with respec-tive WCV values of 76.6%, 66.0% and 62.8%. For human resources, the WCV values show that the most unequally distributed resources are dentists, specialists, total physi-cians, technicians and nurses, with extremely high WCV values of 145.0%, 129.4%, 124.6%, 113.9% and 95.9% respec-tively. The inequality distributions of the other human resources are relatively lower, with WCV values ranging between 33.1% for medical assistants and 75.4% for public health officers.
The GC values for the health facilities vary from 0.32 for hospitals to 0.43 for beds. Based on the GC interpretation, the inequality distribution of health facilities is medium except for beds, for which the inequality distribution level is high. The GC values for human resources vary considerably, ranging from 0.18 to 0.68. The GC values for specialists, dentists, total physicians and technicians vary range from 0.53 to 0.68, showing that the distributions of these resources exhibits extreme levels of inequality. The levels of inequality for nurses and public health officers are high, for midwives and health visitors medium, and for medical assistants very low.
6
[2]
<body>Where:<equ>
<body>The coefficient value ranges between 0 and 1. Lower values indicate less inequality in
the distribution of the resources, and higher values suggest greater inequality. A Gini coefficient
< 0.2 indicates absolute equality, 0.2–0.3 low inequality, 0.3–0.4 medium inequality, 0.4–0.5
high inequality and > 0.5 represents extreme inequality (25–27).
<h2>Dissimilarity index
<body1>The dissimilarity index (DI), also known as the Hoover Index, measures the proportion
of each health resource that would have to be redistributed in order to achieve even distribution
of the health resource between states or regions. The index takes the following form (28):<eqn>
[2]
<body>Where is the percentage of the population in region i to the total population in the
country, is the percent of resource j in region i to the total resource j in the country. The index
value ranges between 0 and 1; smaller values indicate greater equity in resource allocation, and
larger values show higher inequality in the distribution of the resource.
<h2>Lorenz curves
<body1>In addition to GC and DI indices, Lorenz curves (LCs) are widely used to represent
graphically the distribution of health resources (29,30). The diagonal line in the LC represents
perfect equality of the resource distribution among regions/states. The more the variable of
1I xµ
= -!
!
!
2 2n ni i+1
i i k k k k 1 2 n-1 n2i=1 k=i1
V -V y ; V = w ; w =hw hs ; and y y ...y yV
xé ù
= ´ ³ ³ ³ê úë û
å å!
n
i ii=1n
ii=1
w y
wµ
å=å
!
iji
.j
n yp1j 2 P. yi=1
H = -åiPP.
ij
.j
yy
Where:

1108
Research article EMHJ – Vol. 26 No. 9 – 2020
The Lorenz curves depicted in Figure 1 show that distribution of health facilities is unequal, as all the curves were far from the line of equality. The distribution of beds was the worst, followed by health centres, health units and hospitals. For human resources, the geographical distribution is highly unequal, with distribution of specialists, total physicians and dentists worst (Figure 2).
The DI values for health facilities vary from 16.3% for beds to 27.6% for health units (Table 1). The DI values for human resources range from 17.8% for nurses to 44.2% for dentists. For example, according to the DI values, 44.2% of
dentists in those states that have more dentists relative to their population size need to be transferred to states that have fewer dentists in order to achieve equal distribution across the states. The interpretation proceeds similarly for the other DI values.
Resource concentration indicesTables 2 and 3 show the values of RCI for health facili-ties and human resources for the 18 states. Based on these values, the states that have more hospitals relative to their populations were Northern, River Nile, Red Sea,
Figure 1 Lorenz curve for Sudan’s health facilities, 2016
1.0
0.9
0.8
0.7
0.6
0.5
0.4
0.3
0.2
0.1
0.00.0 0.1 0.2 0.3 0.4 0.5 0.6 0.7 0.8 0.9 1.0
Cum
ulat
ive
% of
hea
lth fa
cilit
ies
Cumulative % of population
Hospitals Health.units Health.centres Beds Line of equality
Figure 2 Lorenz curve for Sudan's health human resources, 2016
1.0
0.9
0.8
0.7
0.6
0.5
0.4
0.3
0.2
0.1
0.00.0 0.1 0.2 0.3 0.4 0.5 0.6 0.7 0.8 0.9 1.0
Cum
ulat
ive
% of
hum
an re
sour
ces
Cumulative % of population
Specialists Dentists Total physicians Nurses
Public health officers Medical assistants Technicians Midwives
Health visitors Line of equality

1109
Research article EMHJ – Vol. 26 No. 9 – 2020
Gezira and Sinnar. In contrast, Kassala, Khartoum, South Darfur, West Darfur and Eastern Darfur states have few-er hospitals relative to their populations. Regarding other health facilities, South Darfur, Eastern Darfur and Kassa-la states have the lowest RCI values, signifying the need of more health facilities in these states.
The RCI values for human resources show that number of physicians (specialists, dentists, total physicians) and nurses are relatively higher in Northern, River Nile, Khartoum and Gezira states, as RCI values
are greater than one. Conversely, the RCI values for other states, particularly Darfur, Kordofan and Blue Nile states, are much lessr than one, indicating that these states have a relatively low number of physicians and nurses compared with their populations. For allied health personnel (public health officers, medical assistants, technicians, midwives, health visitors), the RCI values show that their distributions are irregular but generally have similar patterns to those of physicians.
Table 1 Weighted coefficient of variation, Gini coefficient and dissimilarity index values for the distribution of the health facilities and human resources in Sudan, 2016
Variable Weighted coefficient of variation (%)
Gini coefficient Dissimilarity index (%)
Health facilities
Hospitals 62.8 0.32 20.1
Health units 76.6 0.37 27.6
Health centres 66.0 0.36 18.1
Beds 82.9 0.43 16.3
Human resources
Specialists 129.4 0.61 30.7
Dentists 145.0 0.68 44.2
Total physicians 124.6 0.60 29.3
Nurses 95.9 0.47 17.8
Public health officers 75.4 0.41 21.7
Medical assistants 33.1 0.18 21.4
Technicians 113.9 0.53 21.2
Midwives 60.3 0.33 25.6
Health visitors 65.5 0.37 25.6
Table 2 Resource concentration index values for health facilities in Sudan, 2016
State Hospitals Health units Health centres BedsNorthern 2.8 3.3 1.0 2.7
River Nile 1.6 0.8 3.5 2.0
Red Sea 1.6 1.4 1.0 1.2
Gadaerf 1.3 1.9 0.7 1.1
Kassala 0.7 0.5 0.9 0.7
Khartoum 0.5 0.3 0.7 1.2
Gezira 1.5 1.6 1.4 1.2
Sinnar 1.5 1.5 1.1 1.3
White Nile 1.1 1.3 1.0 0.8
Blue Nile 1.3 1.2 1.3 1.1
North Kordofan 1.1 1.3 1.5 0.9
South Kordofan 0.8 1.0 0.7 0.7
West Kordofan 0.9 0.9 1.1 0.9
North Darfur 1.0 0.6 0.7 0.6
South Darfur 0.4 0.2 0.4 0.4
West Darfur 0.5 0.7 1.0 0.6
Central Darfur 0.9 2.5 1.2 0.6
Eastern Darfur 0.4 1.0 0.6 0.3
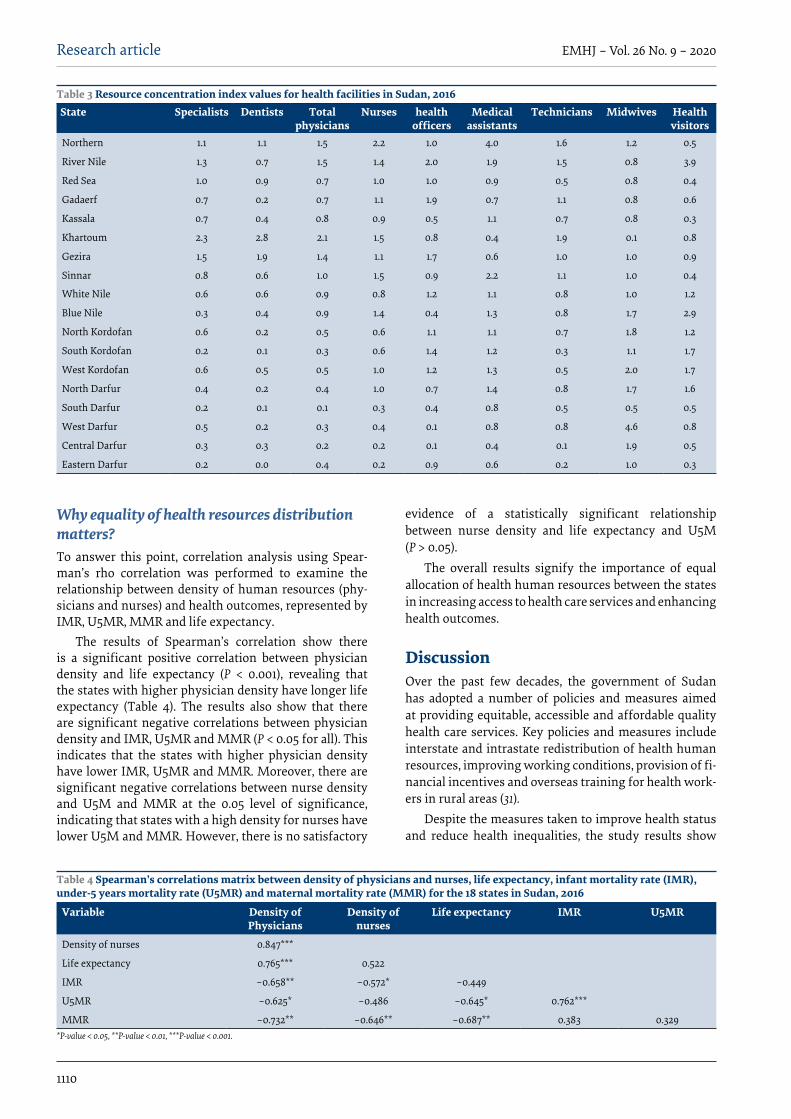
1110
Research article EMHJ – Vol. 26 No. 9 – 2020
Why equality of health resources distribution matters?To answer this point, correlation analysis using Spear-man’s rho correlation was performed to examine the relationship between density of human resources (phy-sicians and nurses) and health outcomes, represented by IMR, U5MR, MMR and life expectancy.
The results of Spearman’s correlation show there is a significant positive correlation between physician density and life expectancy (P < 0.001), revealing that the states with higher physician density have longer life expectancy (Table 4). The results also show that there are significant negative correlations between physician density and IMR, U5MR and MMR (P < 0.05 for all). This indicates that the states with higher physician density have lower IMR, U5MR and MMR. Moreover, there are significant negative correlations between nurse density and U5M and MMR at the 0.05 level of significance, indicating that states with a high density for nurses have lower U5M and MMR. However, there is no satisfactory
evidence of a statistically significant relationship between nurse density and life expectancy and U5M (P > 0.05).
The overall results signify the importance of equal allocation of health human resources between the states in increasing access to health care services and enhancing health outcomes.
DiscussionOver the past few decades, the government of Sudan has adopted a number of policies and measures aimed at providing equitable, accessible and affordable quality health care services. Key policies and measures include interstate and intrastate redistribution of health human resources, improving working conditions, provision of fi-nancial incentives and overseas training for health work-ers in rural areas (31).
Despite the measures taken to improve health status and reduce health inequalities, the study results show
Table 3 Resource concentration index values for health facilities in Sudan, 2016State Specialists Dentists Total
physiciansNurses health
officersMedical
assistantsTechnicians Midwives Health
visitorsNorthern 1.1 1.1 1.5 2.2 1.0 4.0 1.6 1.2 0.5
River Nile 1.3 0.7 1.5 1.4 2.0 1.9 1.5 0.8 3.9
Red Sea 1.0 0.9 0.7 1.0 1.0 0.9 0.5 0.8 0.4
Gadaerf 0.7 0.2 0.7 1.1 1.9 0.7 1.1 0.8 0.6
Kassala 0.7 0.4 0.8 0.9 0.5 1.1 0.7 0.8 0.3
Khartoum 2.3 2.8 2.1 1.5 0.8 0.4 1.9 0.1 0.8
Gezira 1.5 1.9 1.4 1.1 1.7 0.6 1.0 1.0 0.9
Sinnar 0.8 0.6 1.0 1.5 0.9 2.2 1.1 1.0 0.4
White Nile 0.6 0.6 0.9 0.8 1.2 1.1 0.8 1.0 1.2
Blue Nile 0.3 0.4 0.9 1.4 0.4 1.3 0.8 1.7 2.9
North Kordofan 0.6 0.2 0.5 0.6 1.1 1.1 0.7 1.8 1.2
South Kordofan 0.2 0.1 0.3 0.6 1.4 1.2 0.3 1.1 1.7
West Kordofan 0.6 0.5 0.5 1.0 1.2 1.3 0.5 2.0 1.7
North Darfur 0.4 0.2 0.4 1.0 0.7 1.4 0.8 1.7 1.6
South Darfur 0.2 0.1 0.1 0.3 0.4 0.8 0.5 0.5 0.5
West Darfur 0.5 0.2 0.3 0.4 0.1 0.8 0.8 4.6 0.8
Central Darfur 0.3 0.3 0.2 0.2 0.1 0.4 0.1 1.9 0.5
Eastern Darfur 0.2 0.0 0.4 0.2 0.9 0.6 0.2 1.0 0.3
Table 4 Spearman’s correlations matrix between density of physicians and nurses, life expectancy, infant mortality rate (IMR), under-5 years mortality rate (U5MR) and maternal mortality rate (MMR) for the 18 states in Sudan, 2016
Variable Density of Physicians
Density of nurses
Life expectancy IMR U5MR
Density of nurses 0.847***
Life expectancy 0.765*** 0.522
IMR –0.658** –0.572* –0.449
U5MR –0.625* –0.486 –0.645* 0.762***
MMR –0.732** –0.646** –0.687** 0.383 0.329*P-value < 0.05, **P-value < 0.01, ***P-value < 0.001.

1111
Research article EMHJ – Vol. 26 No. 9 – 2020
that the distributions of health resources were highly asymmetric, demonstrating substantial disparities among Sudan’s 18 states. Based on GC values, the inequalities in the distribution of health facilities ranged from moderate to high. Vis-à-vis human resources, the inequality was very high for physicians (specialists, dentists, total physicians) and varied from low to very high for allied health personnel. To achieve equal distribution of health resources among Sudan’s states, the study results show that 16–28% of the health facilities and 18–44% of the human resources need redistribution between regions. Furthermore, the findings strongly confirm the importance of equal geographical distribution of human resources between the regions as there were significant positive relationships between density of human resources and health outcomes.
The unequal distribution of health resources is a part of the macro-level problem of uneven development and maldistribution of wealth in Sudan. Moreover, the problem of uneven development is the main cause of the current political conflict between the government and the armed movements in Darfur, Kordofan and Blue Nile states and the non-ruling political parties (10,11).
The results of this study are consistent with the findings of some studies carried out in other developing countries. For example, Rabbanikhah et al. found that the distribution of general practitioners among Iran’s provinces during 2010–2016 were unequal (2): GC values ranged between 0.272 and 0.356. Geographic inequalities in the distribution of health care services and health outcomes were also reported in Ethiopia in 2011: GC values ranged from 0.047 for under-five deaths to 0.33 for skilled birth attendance (32). In China, Yang assessed the distribution of health resources during 2004–2009 and concluded that inequalities in health care were pervasive and favoured urban population (33). Regional inequalities in health care services and health outcomes have also been reported in Tunisia and Morocco (34,35).
However, the results of this study did not agree with some studies in other developing countries. For example, in Saudi Arabia, El-Farouk et al. found that health resources were equitably distributed among the administrative regions (36). Similarly, in Mongolia, Erdenee et al. found that the distributions of health care resources based on population in 2014 were adequate, but the distributions of these resources when based on geographic area were unequal (37). Additionally, research carried out by Wiseman et al. showed that the distribution of physicians based on population at the provincial level in Fiji in 2007 was relatively equal (38).
The results of the correlation analysis show that in general the Sudanese states with a greater density of human health resources have higher life expectancy and lower mortality rates, represented by the IMR, U5MR and MMR. These results are consistent with the results of a number of previous studies investigating
the link between human resources for health and health outcomes (39,40). Moreover, a great deal of research has found that unequal distribution of health resources has negative effects on access to health care services and, hence, on health-related outcomes (41).
Limitations and future researchState-level data obtained from the annual health statis-tical report of 2016 were used to describe and analyse the regional differences in health resources in Sudan. It would be interesting to perform further analyses on the geographical distribution health resources within each state to compare inter and intra-state distribution.
Furthermore, the data used were also aggregated at the variables level. The annual health report lacks detailed information on health facilities such as rural and tertiary hospitals, which provide different levels of health care services. The availability of detailed data on health variables would improve the level analysis and the results.
Based on the study findings and data restrictions, further research considering inter-state distribution of health resources and disaggregated health variables is highly recommended.
Conclusion There are distinct regional disparities in health resources in Sudan. Furthermore, it is also established that in the states with relatively better health resources, the popu-lations have longer life expectancy and lower mortality rates. In contrast, the populations in relatively under-re-sourced states have shorter life expectancy and higher mortality rates.
Based on these findings, the need to address the problem of disproportionate distribution of health resources, particularly human resources, is immensely important. Therefore, we recommend the following:
• There is a crucial need to improve health status in the relatively under-resourced states, particularly Darfur, South Kordofan and Blue Nile states.
• In future health strategies, there is a need to use re-source allocation models that take into account the population size and health outcome variables in each state.
• There is a need for the allocation of more funds for the health sector to implement equity-promoting strategies.
• Improving working conditions and offering greater incentives are important to attract, motivate and retain health workers in rural areas, particularly in Darfur and Kordofan states.
Funding: None.
Competing interests: None declared.

1112
Research article EMHJ – Vol. 26 No. 9 – 2020
References1. Zarrabi A, Shaykh Baygloo R. Classification of provinces of Iran by health indicators. Social Welfare Quarterly. 2011;11(42):107–28.
2. Rabbanikhah F, Moradi R, Mazaheri E, Shahbazi S, Barzegar L, Karyani, AK. Trends of geographic distribution of general practi-tioners in the public health sector of Iran. J Educ Health Promot. 2018 Jul 6;7:89. doi:10.4103/jehp.jehp_14_18
3. Ahmed Kiadaliri A, Najafi B, Haghparast-Bidgoli H. Geographic distribution of need and access to health care in rural population: an ecological study in Iran. Int J Equity Health. 2011 Sep 22;10:39. doi:10.1186/1475-9276-10-39
4. Hanson K, Ranson K, Oliveira-Cruz V, Mills A. Expanding access to priority health interventions: a framework for understand-ing the constraints to scaling-up. J Int Dev. 2003;15:1–14.
5. Maddox PJ. Administrative ethics and the allocation of scarce resources. J Issues Nurs. 1998(102):4–6.
Disparités régionales dans la répartition des ressources sanitaires du SoudanRésuméContexte : La répartition égale des ressources sanitaires est un objectif central des plans stratégiques à long et moyen terme pour le secteur de la santé au Soudan. Cependant, les cibles de ces plans n’ont pas encore été atteintes, ce qui se traduit par une faible performance du système de santé dans son ensemble. La répartition inégale des ressources sanitaires a entraîné d’importantes disparités régionales en matière de prestation de services de santé.Objectifs : La présente étude vise à décrire et à analyser l’inégalité dans la répartition géographique des ressources sanitaires physiques et humaines du secteur public au Soudan. En outre, l’étude vise également à mesurer les relations entre la densité des ressources de santé et les résultats sanitaires.Méthodes : Les données sur les ressources sanitaires et les résultats sanitaires au niveau des États obtenues à partir du Rapport sur les statistiques sanitaires du Soudan de 2016 ont été utilisées pour calculer des indices d’inégalité, tracer des courbes de Lorenz et calculer l’analyse de corrélation de Spearman entre la densité des ressources sanitaires et les résultats sanitaires. Résultats : Nos résultats montrent que la répartition des ressources sanitaires, basée sur la taille de la population, était très inégale entre les 18 États du Soudan.Conclusion : Il faut absolument améliorer la situation sanitaire dans les États qui disposent de ressources relativement insuffisantes, en particulier dans les États du Darfour, du Kordofan du Sud et du Nil bleu. En outre, le gouvernement doit utiliser des modèles d’allocation des ressources sanitaires qui tiennent compte de la taille de la population et des variables des résultats sanitaires dans chaque État dans les stratégies futures de santé.
التفاوتات اإلقليمية يف توزيع املوارد الصحية يف السودانحممد إسامعيل
اخلالصةاخللفية: ظل التوزيع املتكافئ للموارد الصحية هدفا أساسيا لكل من اخلطط االسرتاتيجية طويلة األمد ومتوسطة األمد للقطاع الصحي يف السودان. غري أن أهداف هذه اخلطط مل تتحقق، مما أدى إىل ضعف أداء النظام الصحي برمته. وقد أدى التوزيع غري املتكافئ للموارد الصحية إىل تفاوتات
إقليمية كبرية يف توفري خدمات الرعاية الصحية.األهداف: هدفت هذه الدراسة إىل وصف عدم املساواة وحتليلها يف التوزيع اجلغرايف للموارد الصحية املادية والبرشية للقطاع العام يف السودان.
وباإلضافة إىل ذلك، كام هدفت الدراسة أيضا إىل قياس العالقات بني كثافة املوارد الصحية والنتائج الصحية.للصحة اإلحصائي التقرير من مجعت التي الصحية واملخرجات الصحية املوارد بشأن الدولة مستوى عىل البيانات استخدمت البحث: طرق الصحية املوارد كثافة بني سبريمان ارتباط حتليل وحساب لورينز، منحنيات ورسم املساواة، عدم مؤرشات حلساب 2016 لعام السودانية
واملخرجات ذات الصلة بالصحة.النتائج: تبني النتائج التي توصلنا إليها أن توزيع املوارد الصحية، عىل أساس حجم السكان، كان غري متكافئ إىل حد كبري بني واليات السودان
البالغ عددها 18 والية.االستنتاجات: هناك حاجة ماسة لتحسني الوضع الصحي يف الواليات ذات املوارد املنخفضة نسبيا، وال سيام يف واليات دارفور وجنوب كردفان التي تأخذ يف االعتبار حجم السكان ومتغريات والنيل األزرق. وعالوة عىل ذلك، حتتاج احلكومة إىل استخدام نامذج ختصيص املوارد الصحية
املخرجات الصحية لكل والية يف االسرتاتيجيات الصحية املستقبلية.

1113
Research article EMHJ – Vol. 26 No. 9 – 2020
6. Shi L, Starfield B, Kennedy B, Kawachi I. Income inequality, primary care, and health indicators. J Fam Pract. 1999;48(4):275–84. PMID:10229252
7. Van Deurzen I, Van Oorschot W, Van Ingen E. The link between inequality and population health in low and middle-income countries: policy myth or social reality? PLoS ONE. 2014;9(12):e115109. doi:10.1371/journal.pone.0115109
8. Sudan health sector fact sheet. Geneva: World Health Organization; 2013 (http://www.who.int/hac/sudan_healthsector_fact-sheet.pdf, accessed 8 March 2020).
9. Atser J and Akpan PA. Spatial distribution and accessibility of health facilities in Akwa Ibom State, Nigeria. Ethiopian J Environ Studies Manage. 2009;2:49–57.
10. Sudan: Conflict analysis and options for systemic conflict transformation: a northern and a southern view. Berlin: Berghof Foundation for Peace Support; 2006.
11. Daw Elbiet, MS. Uneven development and conflict in Sudan a case study of North Darfur State [thesis]. Khartoum: University of Khartoum; 2007.
12. 25-year strategic plan for health sector. Khartoum: Federal Ministry of Health; 2003.
13. National health sector strategic plan II (2012–16). Khartoum: Federal Ministry of Health; 2012.
14. Health system profile: Sudan. Geneva: World Health Organization; 2006 (http://apps.who.int/medicinedocs/documents/s17310e/s17310e.pdf, accessed 8 March 2020).
15. El-Battahani, AE and Gadkarim, HA. Governance and fiscal federalism in Sudan, 1989–2015: exploring political and intergovern-mental fiscal relations in an unstable polity. Bergen: Chr. Michelsen Institute; 2017 (Sudan Report:1).
16. Annual statistical report. Khartoum. Federal Ministry of Health; 2016.
17. Framework for health information systems and core indicators for monitoring health situation and health system performance. Cairo: World Health Organization Region for the Eastern Mediterranean; 2017 (http://applications.emro.who.int/docs/EMRO-PUB_2017_EN_16766.pdf?ua=1, accessed 8 March 2020).
18. Achieving the health-related MDGs: it takes a workforce. Geneva: World Health Organization; 2010 (https://www.who.int/hrh/workforce_mdgs/en/, accessed 8 March 2020).
19. Ismail MA. Technical efficiency of Sudan’s health institutions: a state-level analysis. Sudanese J Public Health. 2010;5(3):122–9.
20. Domestic general government health expenditure (% of GDP). Washington DC: World Bank; 2016 (https://data.worldbank.org/indicator/SH.XPD.GHED.GD.ZS, accessed 21 March 2020).
21. Ahmad Kiadaliri A, Najafi B, Haghparast-Bidgoli H. Geographic distribution of need and access to health care in rural population: an ecological study in Iran. Int J Equity Health. 2011;10(1):39. PMID:21939511
22. Theodorakis PN, Mantzavinis GD, Rrumbullaku L, Lionis C, Trell E. Measuring health inequalities in Albania: a focus on the distribution of general practitioners. Hum Resource Health. 2006;4(1):5. PMID:16504028
23. Chang RKR, Halfon N. Geographic distribution of pediatricians in the United States: an analysis of the fifty states and Washing-ton, DC. Pediatrics. 1997 Aug;100(2 Pt 1):172–9. PMID:9240795
24. Araar, A and Duclos, JY. DASP: Distributive analysis STATA package. Washington: World Bank, UNDP and Université Laval; 2007.
25. Lin Y, Zhang Q, Chen W, Ling L. The social income inequality, social integration and health status of internal migrants in China. Int J Equity Health. 2017;16(1):1–11.
26. Chen R, Zhao Y, Du J, Wu T, Huang Y, Guo A. Health workforce equity in urban community health service of China. PLoS ONE. 2014;9(12):e115988. https://doi.org/10.1371/journal.pone.0115988.
27. Teng F, He J, Pan X, Zhang C. Metric of carbon equity: carbon Gini index based on historical cumulative emission per capita. Adv Climate Change Res. 2011;2(3):134–40.
28. Nijkamp P, Poot J, Bakens J, eds. The economics of cultural diversity. Cheltenham: Edward Elgar Publishing; 2015.
29. Corrreia I, Veiga P. Geographic distribution of physicians in Portugal. Eur J Health Econ. 2010 Aug;11(4):383–93. doi:10.1007/s10198-009-0208-8.
30. Theodorakis PN, Mantzavinis GD, Rrumbullaku L, Lionis C, Trell E. Measuring health inequalities in Albania: a focus on the distribution of general practitioners. Human Res Health. 2006;4(1):5–10. doi:10.1186/1478-4491-4-5
31. National human resources for health: strategic plan for Sudan, 2012–2016. Khartoum: Government of Sudan; 2019.
32. Skaftun EK, Ali M, Norheim OF. Understanding inequalities in child health in Ethiopia: health achievements are improving in the period 2000–2011. PLoS One. 2014 Aug 28;9(8):e106460. doi: 10.1371/journal.pone.0106460
33. Yang W. An analysis of inequities and inefficiencies in health and healthcare in China. [thesis]. London: London School of Eco-nomics; 2013.
34. Boutayeb A. Social inequalities and health inequity in Morocco. Int J Equity Health. 2006;5:1. PMID:16522204
35. What policies should be implemented to address inequalities in health care in Tunisia? Economic Brief. Abidjan: African Devel-opment Bank; 2014.
1114
Research article EMHJ – Vol. 26 No. 9 – 2020
36. El-Faroukl. Geographical distribution of health resources in the Kingdom of Saudi Arabia: is it equitable? Egypt J Environ Change. 2016;8(2):5–19. doi:10.12816/0038449
37. Erdenee O, Paramita SA, Yamazaki C, Koyama H. Distribution of health care resources in Mongolia using the Gini coefficient. Human Res Health. 2017;15:56. doi:10.1186/s12960-017-0232-1
38. WisemanV, Lagarde M, Batura N, Irava W, Roberts G. Measuring inequalities in the distribution of the Fiji health workforce. Int J Equity Health, 2017;16:115. doi:10.1186/s12939-017-0575-1
39. Anand S, Barnighausen T. Human resources and health outcomes cross-country econometric study. Lancet. 2004;264:1603–9. doi:10.1016/S0140-6736(04)17313-
40. Robinson J, Wharrad H. Invisible nursing: exploring health outcomes at a global level—relationships between infant and un-der-5 mortality rates and the distribution of health professionals, GNP per capita, and female literacy. J Adv Nurs. 2000;32:28–40. doi:10.1046/j.1365-2648.2000.01458.x
41. Speybroeck N, Kinfu Y, Dal Poz MR, Evans DB. Reassessing the relationship between human resources for health, intervention coverage and health outcomes. Background paper prepared for the World Health Report. Geneva: World Health Organization; 2006.

1115
Review EMHJ – Vol. 26 No. 9 – 2020
Landscape analysis of family planning research, programmes and policies targeting young people in Jordan: stakeholder assessment and systematic reviewJewel Gausman,1 Areej Othman,2 Abeer Dababneh,3 Iqbal Hamad,4 Maysoon Dabobe,4 Insaf Daas3 and Ana Langer1
1Women and Health Initiative, Department of Global Health and Population, Harvard TH Chan School of Public Health, Boston (MA), United States of America. 2Maternal and Child Health Nursing Department, School of Nursing, University of Jordan, Amman, Jordan. 3Center for Women’s Studies, University of Jordan, Amman, Jordan. 4Jordanian Hashemite Fund for Human Development, Amman, Jordan. (Correspondence to: Jewel Gausman: [email protected]).
Abstract Background: Reaching married and unmarried young people in Jordan with family planning information and services is a priority, especially considering Jordan’s large refugee populations. To date, dissemination of family planning research and programmatic experience targeting young people in Jordan has been limited.Aims: This study aimed to provide in-depth information on family planning intervention programmes, research and policies in Jordan that focus on young people aged 10–24 years. Methods: Data were gathered through a systematic review of peer-reviewed and grey literature related to reproductive health of young people, and focus groups discussions with stakeholders from 18 relevant governmental and nongovern-mental organizations.Results: The literature review included 37 documents produced since 2008, which provide information at the individual, family/community, service delivery and policy levels. Young people in Jordan have limited knowledge of family plan-ning methods and where to obtain family planning services. Little information is available on the availability of family planning services for young people. Several policy documents discuss family planning and reproductive health of young people in Jordan. Focus group discussions identified opportunities to integrate services and strengthen the development of future policies.Conclusions: The results of this study highlight key lessons learnt, opportunities for interventions and research gaps related to family planning among young people in Jordan. More attention should be paid to understanding and meeting the needs of Jordan’s most vulnerable populations of young people, including urban refugees and married adolescents, especially as these populations continue to grow. Future programmes should build from past evidence and explore new areas and interventions. Keywords: adolescents, youth, reproductive health, family planning services, JordanCitation: Gausman J; Othman A; Dababneh A; Hamad I; Dabobe M; Daas I; et al. Landscape analysis of family planning research, programmes and policies targeting young people in Jordan: stakeholder assessment and systematic review. East Mediterr Health J. 2020;26(9):1115-1134. https://doi.org/10.26719/emhj.20.018Received: 10/01/19; accepted: 04/08/19Copyright © World Health Organization (WHO) 2020. Open Access. Some rights reserved. This work is available under the CC BY-NC-SA 3.0 IGO license https://creativecommons.org/licenses/by-nc-sa/3.0/igo
IntroductionPreventing unintended pregnancy among young people is a global priority. Targeting young people in Jordan with family planning information and services is complicat-ed by the conservative social context that prohibits sex-ual activity outside of marriage; however, many young women in Jordan remain at risk of early and unintended pregnancy (1,2). While most sexual activity occurs within marriage, a study in Jordan found that 7% of university students reported premarital sexual activity, although data are limited (3). In recent years, marriage of women younger than 18 years has increased in Jordan from 13.7% to 18.1% (4). High pregnancy rates have been seen in mar-ried adolescents (5), and sexual assault and rape are a con-cern, especially among refugees (6).
The large influx of refugees in Jordan has stretched its limited health resources. Young people constitute
large proportions of Jordan’s refugee populations. About 30% of Jordan’s population is non-Jordanian and includes populations from across the Middle East. Only 16% of the 1.2 million Syrian refugees in Jordan live in official camps (7); those outside of camps are younger, poorer and less educated (8). More than 2 million registered Palestinians and 66 000 to 150 000 Iraqi refugees live in Jordan (9,10).
To date, there has been limited dissemination and collation of existing family planning research and programmatic experience among young people in Jordan between the ages of 10 and 24 years. Therefore, we aimed to (i): review and synthesize information from existing research and programmatic experiences that address family planning in young people in Jordan; (ii) examine which existing policies facilitate the provision of youth-friendly family planning services and which produce barriers, and; (iii) identify gaps in the research, policy

1116
Review EMHJ – Vol. 26 No. 9 – 2020
and programmatic environments that could strengthen the provision of youth-friendly family planning services in Jordan and increase family planning use among young people.
Our findings will serve as a resource for policy-makers and programme managers in Jordan and elsewhere in the Middle East in order to inform programme design and strategy development by documenting the current evidence base, past programmatic experiences, and existing policy environment, while identifying key gaps and opportunities.
MethodsWe undertook a literature review of published and un-published research, programmatic reports, and policy papers that address family planning in young people in Jordan, and conducted focus group discussions with key informants in the fields of research, policy and practice related to young people.
Systematic literature review Academic and peer-reviewed documents were obtained through structured searches on PubMed®, JSTOR, Em-base, MEDLINE®, Web of Science, CINAHL and Google Scholar. Our search terms included combinations of the following terms: family planning, reproductive health, birth spacing, contraceptive, fertility, unmet need and Jordan. We did not include terms related to youth because we wanted to find all studies that had our age range of in-terest regardless of whether the authors identified youth as a focus, given the sensitivity of the topic.
We accessed non-academic literature using four approaches: (i) searches of grey literature databases (OpenGrey, PopLine, USAID Development Experience Clearing House and Knowledge4Health), (ii) Internet searches, (iii) website review and (iv) consultation with experts. Hard-copy only documents were obtained by personal contact with organizations active in family planning in Jordan.
Documents were included if they focused on young people aged 10–24 years and on family planning, were published after 2008 in Arabic or English, and were conducted in Jordan. The year 2008 was selected as the cut-off to ensure current contextual relevance. Two researchers screened and reviewed each record for eligibility. Consensus was reached to identify a final list of relevant documents.
Focus group discussions Four focus group discussions were conducted with key informants representing 18 organizations between Au-gust and September 2018. Key informants were identi-fied through consultation with local experts and snow-ball sampling. Selection criteria for participation was based on an individual’s expertise in the topic and/or experience working on family planning- or youth-relat-ed issues. The following organizations were represent-ed: Ministry of Education, Ministry of Youth, Nation-
al Council for Family Affairs, National Committee for Women’s Affairs, Ministry of Health, Higher Population Council, Higher Health Council, United Nations High Commissioner for Refugees (UNHCR), United Nations Population Fund (UNFPA), United States Agency for In-ternational Development (USAID), Institute for Family Health, Royal Health Awareness Society, Jordanian As-sociation for Family Planning and Protection, Jordanian Communication, Advocacy and Policy Project, Health Ser-vice Delivery Project, Women Helping Women, Jordan Hashemite Charity Organization, and National Women’s Comprehensive Health Centre. Discussion centred on past programmatic experience, existing policies, barriers and challenges to providing services for young people, and recommendations to strengthen existing policies and programmes.
Data analysisThe social ecological model was used as a guiding frame-work for this analysis (11). Data from the literature review were abstracted and synthesized as being either directly pertinent to youth, indirectly relevant to youth (i.e. youth were included as part of the overall study population, but not considered a specific target population), or ap-plicable to the supportive environment, which included peers, family, school, community, and the service deliv-ery, policy, and legal environments. For the analysis of qualitative data from the focus group discussions, the discussions were recorded, transcribed and thematical-ly coded by two coders. Data were coded according to a priori themes based on the focus group discussion guide at the different levels of the ecological model (individual, family/community, service delivery and policy levels). The coders then inductively examined each level for emergent subthemes.
Ethical considerationsThis study was approved by the institutional review boards of Harvard T.H. Chan School of Public Health (ap-proval number: 18-0427) and University of Jordan School of Nursing.
ResultsLiterature reviewWe identified 1049 records, of which 37 documents were included as shown in the flow chart (Figure 1). Fourteen of the 37 documents were in peer-reviewed journals and 23 were retrieved from the grey literature (Table 1, availa-ble online at: ….). Fifteen documents specifically focused on young people, 16 included young people within the overall study population, programme or policy, and 15 documents targeted other levels of the ecological mod-el in ways that were relevant to young people. Based on ecological level, the themes derived from the literature review include knowledge, attitudes and practices re-lated to family planning in young people within a social context, the health service delivery environment and the policy landscape. Box 1 gives a summary of the key find-

1117
Review EMHJ – Vol. 26 No. 9 – 2020
ings and recommendations from the literature review to improve family planning programming targeting young people in Jordan.
Family planning: knowledge, attitudes and practicesMost of the research related to the family planning knowledge, attitudes and practices of young people in Jordan comes from secondary analysis of existing da-tasets (i.e. the Jordan Population and Family Health Surveys), relatively small project-based surveys and qualitative data from focus group discussions that are integrated in service delivery programmes. Few studies include unmarried young people and refugee young peo-ple outside of camps.
Jordanian, Syrian and Iraqi young people living in Jordan have limited knowledge of contraceptives (5,18,48), especially younger adolescents. In one study, nearly half of the women aged 15–19 years and 15.9% of women between 20 and 24 years did not know if modern or traditional family planning methods, such as withdrawal or periodic abstinence, were more effective (5). A study in Syrian refugees and two studies in Iraqi refugees found that knowledge of specific methods of family planning was almost non-existent among the young people in both populations (2,18,48).
Misinformation and concerns over negative side-effects of using family planning are especially prominent
among younger women. Married women between 15 and 24 years reported that concern about future fertility was one of the main reasons for not using a method (5,21,42). Similar concerns have been found among young Iraqi and Syrian refugees in Jordan (48,23).
Contraceptive use in young people in Jordan is low. Analysis of data from the 2012 Jordan Population and Family Health Survey found that 72.5% of married adolescents between 15 and 19 years were not using contraception (21). Unmet need for family planning was high; of the 40% of married adolescent girls who did not want a child in the next 2 years, only 35.2% were using a contraceptive (21). Pills and the lactational amenorrhoea method were the most commonly used modern methods among adolescent girls aged 15–19 years (11.4% and 4.1% of users, respectively). Half of all users in this age group were using a traditional method (21). Use of family planning was lower in married adolescents than older young people; 18.3% of women between 15 and 19 years used contraception compared with 40.1% of women aged 20–24 years (5). One study found that 6.5% of married Iraqi adolescents living in Amman between 15 and 24 years were using a method of contraception (2). Many young people indicated that social pressure to begin childbearing immediately after marriage is one of their main reasons for not using family planning (5,42).
Social expectations limit the role of men in family planning. One survey found that 70% of women aged
Iden
tifica
tion
Scre
ened
for e
ligib
ility
Incl
usio
n
Unique records identified through academic database and grey literature searches
(n = 1049)
Abstracts screened (n = 1049)
Full text articles assessed for eligibility(n = 69)
Documents included in the review (n = 37)
Peer-reviewed articles included in the review
(n = 14)
Grey literature documents included in the review
(n = 23)
Records excluded (n = 980)
Reasons: not conducted in Jordan, conducted before 2008, unrelated topic, or not relevant to young people 10–24 years
Records excluded (n = 32)
Reasons: not conducted in Jordan, conducted before 2008, unrelated topic, or not relevant to young people 10–24 years
Figure 1 Flow chart outlining the screening process to identify documents in peer-reviewed and grey literature on youth family planning and reproductive health in Jordan

1118
Review EMHJ – Vol. 26 No. 9 – 2020Ta
ble
1 Sum
mar
y of
pee
r-re
view
ed a
nd g
rey
liter
atur
e pu
blis
hed
betw
een
2008
and
201
8 re
late
d to
fam
ily p
lann
ing
amon
g yo
ung
peop
le in
Jord
an
Auth
ors
Year
Titl
eEc
olog
ical
le
vel o
f foc
usPo
pula
tion
and
sam
ple
size
Stud
y de
sign
/doc
umen
t de
scri
ptio
nK
ey re
sult
s
Akou
r A, e
t al.(
12)
2018
Impa
ct o
f a p
harm
acis
t-pr
ovid
ed in
form
atio
n bo
okle
t on
know
ledg
e an
d at
titud
es to
war
ds
oral
cont
race
ptio
n am
ong
Jord
ania
n w
omen
: an
inte
rven
tiona
l stu
dy
Yout
h;
supp
ortiv
e en
viro
nmen
t
160
mar
ried
wom
en; 3
3 w
ere
18–2
5 ye
ars
Des
ign:
rand
omiz
ed in
terv
entio
n st
udy
with
pre
and
pos
t m
easu
rem
ents
. Pur
pose
: to
asse
ss th
e im
pact
of a
boo
klet
on
awar
enes
s and
kno
wle
dge
of o
ral
cont
race
ptiv
e pi
lls
Chan
ge in
mea
n kn
owle
dge
scor
es im
prov
ed a
nd w
as
cons
tant
acr
oss a
ll ag
e gr
oups
Org
anis
atio
n fo
r Eco
nom
ic
Co-o
pera
tion
and
Dev
elop
men
t (13
)
2018
Yout
h w
ell-b
eing
pol
icy
revi
ew o
f Jor
dan
Yout
h;
supp
ortiv
e en
viro
nmen
t
Not
app
licab
leD
esig
n: C
ross
-sec
tora
l pol
icy
anal
ysis
•Re
prod
uctiv
e he
alth
of y
oung
peo
ple
has s
econ
dary
po
sitio
n in
the
Gov
ernm
ent o
f Jor
dan’
s pol
icy
agen
da.
Inte
rnat
iona
l org
aniz
atio
ns fi
ll th
e ga
p•
Curr
ent p
olic
ies m
entio
n ne
ed to
pro
vide
you
th-
frie
ndly
RH
serv
ices
, but
no
step
s tow
ards
im
plem
enta
tion
have
bee
n de
fined
•
The
Nat
iona
l Rep
rodu
ctiv
e H
ealth
/Fam
ily P
lann
ing
Stra
tegy
(201
3–20
17) d
oes n
ot d
efine
you
ng p
eopl
e as
a
popu
latio
n se
gmen
t with
spec
ific n
eeds
, and
focu
ses o
n th
ree
gene
ral p
rior
ities
•Aw
aren
ess-
rais
ing
prog
ram
mes
do
not t
arge
t ad
oles
cent
s und
er 18
yea
rs b
ecau
se o
f cul
tura
l co
nstr
aint
s
Clar
k CJ
, et a
l. (14
)20
17Th
e in
fluen
ce o
f fam
ily
viol
ence
and
child
m
arri
age
on u
nmet
nee
d fo
r FP
in Jo
rdan
Yout
hU
sed
Jord
an P
opul
atio
n an
d Fa
mily
Hea
lth S
urve
y.
Incl
uded
wom
en 15
–49
year
s str
atifi
ed b
y m
arri
age
befo
re 18
yea
rs o
r not
. No
age-
disa
ggre
gate
d pr
ovid
ed
Des
ign:
seco
ndar
y an
alys
is,
obse
rvat
iona
l stu
dy. P
urpo
se: t
o ex
amin
e th
e as
soci
atio
n be
twee
n in
timat
e pa
rtne
r vio
lenc
e, fa
mily
vi
olen
ce a
nd u
nmet
nee
d fo
r FP
Wom
en w
ho w
ere
mar
ried
bet
wee
n th
e ag
es o
f 15
and
18 y
ears
may
be
espe
cial
ly v
ulne
rabl
e to
hav
ing
unm
et
need
for F
P as
wom
en in
this
age
gro
up a
re le
ss li
kely
to
use
cont
race
ptio
n, h
ave
low
er a
uton
omy
and
expe
rien
ce
intim
ate
part
ner v
iole
nce.
Spin
dler
E, e
t al.
(15)
2017
Jord
an’s
2002
to 2
012
fert
ility
stal
l and
par
alle
l U
SAID
inve
stm
ents
in
fam
ily p
lann
ing:
less
ons
from
an
asse
ssm
ent
to g
uide
futu
re
prog
ram
min
g
Supp
ortiv
e en
viro
nmen
tU
sed
mul
tiple
dat
a so
urce
s, in
clud
ing
30 p
roje
ct
repo
rts,
42 e
xter
nal s
tudi
es
and
eval
uatio
ns a
nd 11
pr
ojec
t bri
efs,
as w
ell a
s ke
y in
form
ant i
nter
view
s
Des
ign:
pro
gram
me
and
polic
y re
view
. Pur
pose
: to
exam
ine
the
fact
ors t
hat c
ontr
ibut
ed st
alls
in
fert
ility
and
mod
ern
cont
race
ptiv
e us
e, th
e pr
ojec
ts U
SAID
supp
orte
d an
d th
eir i
mpa
ct, a
nd p
rogr
amm
atic
in
sigh
ts g
aine
d to
gui
de fu
ture
pr
ogra
mm
ing
•N
o re
sults
spec
ific t
o yo
uth
but e
xten
sive
ove
rvie
w o
f po
licy
and
prog
ram
mat
ic e
nvir
onm
ent
•Jo
rdan
’s lim
ited
met
hod
mix
, com
bine
d w
ith st
rong
so
cioc
ultu
ral d
eter
min
ants
aro
und
repr
oduc
tion
and
fert
ility
des
ires
, hav
e co
ntri
bute
d to
low
cont
race
ptiv
e us
e in
Jord
an•
Chal
leng
es to
impr
oved
use
of F
P se
rvic
es in
clud
e lim
ited
gove
rnm
ent i
nves
tmen
ts in
FP
prog
ram
mes
, in
fluen
tial s
ervi
ce p
rovi
der b
ehav
iour
and
bia
ses
that
lim
it in
form
ed ch
oice
and
coun
selli
ng, s
tron
g,
perv
asiv
e so
cial
nor
ms o
f fam
ily si
ze a
nd fe
rtili
ty, a
nd
limite
d av
aila
bilit
y of
diff
eren
t con
trac
eptiv
e m
etho
ds
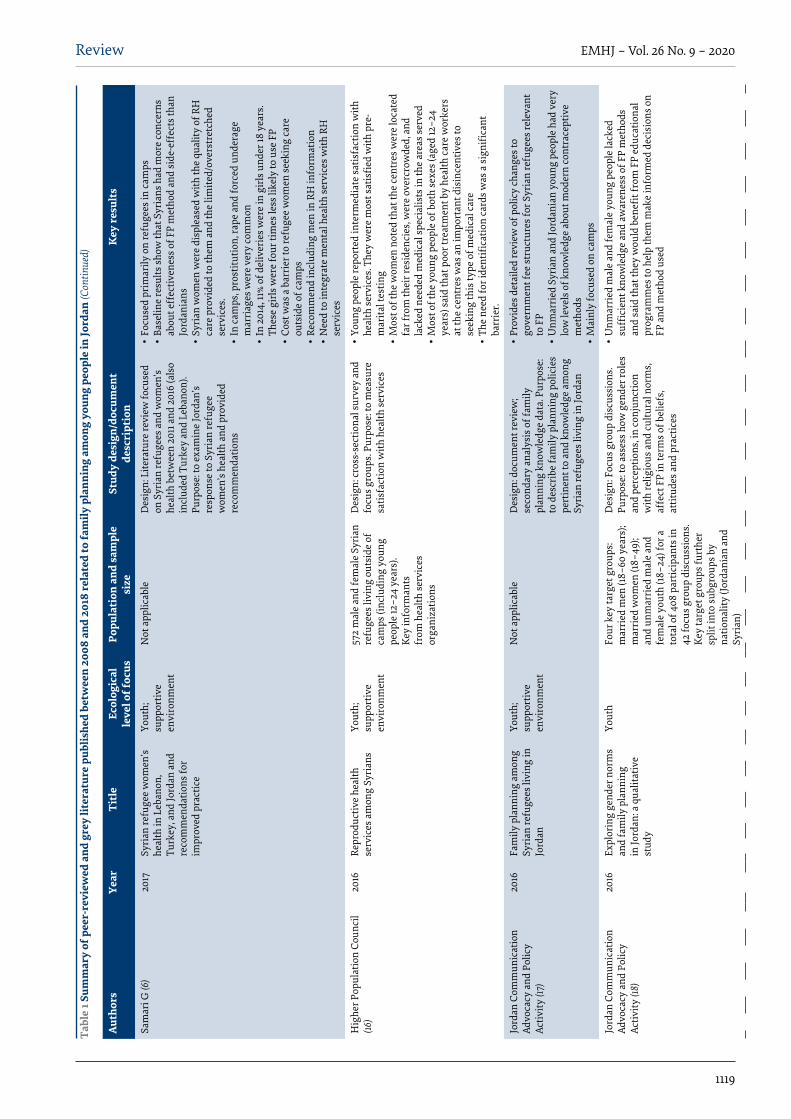
1119
Review EMHJ – Vol. 26 No. 9 – 2020
Auth
ors
Year
Titl
eEc
olog
ical
le
vel o
f foc
usPo
pula
tion
and
sam
ple
size
Stud
y de
sign
/doc
umen
t de
scri
ptio
nK
ey re
sult
s
Sam
ari G
(6)
2017
Syri
an re
fuge
e w
omen
’s he
alth
in L
eban
on,
Turk
ey, a
nd Jo
rdan
and
re
com
men
datio
ns fo
r im
prov
ed p
ract
ice
Yout
h;
supp
ortiv
e en
viro
nmen
t
Not
app
licab
leD
esig
n: L
itera
ture
revi
ew fo
cuse
d on
Syr
ian
refu
gees
and
wom
en’s
heal
th b
etw
een
2011
and
201
6 (a
lso
incl
uded
Tur
key
and
Leba
non)
. Pu
rpos
e: to
exa
min
e Jo
rdan
’s re
spon
se to
Syr
ian
refu
gee
wom
en’s
heal
th a
nd p
rovi
ded
reco
mm
enda
tions
•Fo
cuse
d pr
imar
ily o
n re
fuge
es in
cam
ps•
Base
line
resu
lts sh
ow th
at S
yria
ns h
ad m
ore
conc
erns
ab
out e
ffec
tiven
ess o
f FP
met
hod
and
side
-eff
ects
than
Jo
rdan
ians
•
Syri
an w
omen
wer
e di
sple
ased
with
the
qual
ity o
f RH
ca
re p
rovi
ded
to th
em a
nd th
e lim
ited/
over
stre
tche
d se
rvic
es.
•In
cam
ps, p
rost
itutio
n, ra
pe a
nd fo
rced
und
erag
e m
arri
ages
wer
e ve
ry co
mm
on•
In 2
014,
11%
of d
eliv
erie
s wer
e in
gir
ls u
nder
18 y
ears
. Th
ese
girls
wer
e fo
ur ti
mes
less
like
ly to
use
FP
•Co
st w
as a
bar
rier
to re
fuge
e w
omen
seek
ing
care
ou
tsid
e of
cam
ps•
Reco
mm
end
incl
udin
g m
en in
RH
info
rmat
ion
•N
eed
to in
tegr
ate
men
tal h
ealth
serv
ices
with
RH
se
rvic
es
Hig
her P
opul
atio
n Co
unci
l (16
)20
16Re
prod
uctiv
e he
alth
se
rvic
es a
mon
g Sy
rian
sYo
uth;
su
ppor
tive
envi
ronm
ent
572
mal
e an
d fe
mal
e Sy
rian
re
fuge
es li
ving
out
side
of
cam
ps (i
nclu
ding
you
ng
peop
le 12
–24
year
s).
Key
info
rman
ts
from
hea
lth se
rvic
es
orga
niza
tions
Des
ign:
cros
s-se
ctio
nal s
urve
y an
d fo
cus g
roup
s. Pu
rpos
e: to
mea
sure
sa
tisfa
ctio
n w
ith h
ealth
serv
ices
•Yo
ung
peop
le re
port
ed in
term
edia
te sa
tisfa
ctio
n w
ith
heal
th se
rvic
es. T
hey
wer
e m
ost s
atis
fied
with
pre
-m
arita
l tes
ting
•M
ost o
f the
wom
en n
oted
that
the
cent
res w
ere
loca
ted
far f
rom
thei
r res
iden
cies
, wer
e ov
ercr
owde
d, a
nd
lack
ed n
eede
d m
edic
al sp
ecia
lists
in th
e ar
eas s
erve
d •
Mos
t of t
he y
oung
peo
ple
of b
oth
sexe
s (ag
ed 12
–24
year
s) sa
id th
at p
oor t
reat
men
t by
heal
th ca
re w
orke
rs
at th
e ce
ntre
s was
an
impo
rtan
t dis
ince
ntiv
es to
se
ekin
g th
is ty
pe o
f med
ical
care
•Th
e ne
ed fo
r ide
ntifi
catio
n ca
rds w
as a
sign
ifica
nt
barr
ier.
Jord
an C
omm
unic
atio
n Ad
voca
cy a
nd P
olic
y Ac
tivity
(17)
2016
Fam
ily p
lann
ing
amon
g Sy
rian
refu
gees
livi
ng in
Jo
rdan
Yout
h;
supp
ortiv
e en
viro
nmen
t
Not
app
licab
leD
esig
n: d
ocum
ent r
evie
w;
seco
ndar
y an
alys
is o
f fam
ily
plan
ning
kno
wle
dge
data
. Pur
pose
: to
des
crib
e fa
mily
pla
nnin
g po
licie
s pe
rtin
ent t
o an
d kn
owle
dge
amon
g Sy
rian
refu
gees
livi
ng in
Jord
an
•Pr
ovid
es d
etai
led
revi
ew o
f pol
icy
chan
ges t
o go
vern
men
t fee
stru
ctur
es fo
r Syr
ian
refu
gees
rele
vant
to
FP
•U
nmar
ried
Syr
ian
and
Jord
ania
n yo
ung
peop
le h
ad v
ery
low
leve
ls o
f kno
wle
dge
abou
t mod
ern
cont
race
ptiv
e m
etho
ds•
Mai
nly
focu
sed
on ca
mps
Jord
an C
omm
unic
atio
n Ad
voca
cy a
nd P
olic
y Ac
tivity
(18)
2016
Expl
orin
g ge
nder
nor
ms
and
fam
ily p
lann
ing
in Jo
rdan
: a q
ualit
ativ
e st
udy
Yout
hFo
ur k
ey ta
rget
gro
ups:
mar
ried
men
(18–
60 y
ears
); m
arri
ed w
omen
(18–
49);
and
unm
arri
ed m
ale
and
fem
ale
yout
h (18
–24)
for a
to
tal o
f 408
par
ticip
ants
in
42 fo
cus g
roup
dis
cuss
ions
. Ke
y ta
rget
gro
ups f
urth
er
split
into
subg
roup
s by
natio
nalit
y (Jo
rdan
ian
and
Syri
an)
Des
ign:
Foc
us g
roup
dis
cuss
ions
. Pu
rpos
e: to
ass
ess h
ow g
ende
r rol
es
and
perc
eptio
ns, i
n co
njun
ctio
n w
ith re
ligio
us a
nd cu
ltura
l nor
ms,
affe
ct F
P in
term
s of b
elie
fs,
attit
udes
and
pra
ctic
es
•U
nmar
ried
mal
e an
d fe
mal
e yo
ung
peop
le la
cked
su
ffici
ent k
now
ledg
e an
d aw
aren
ess o
f FP
met
hods
an
d sa
id th
at th
ey w
ould
ben
efit f
rom
FP
educ
atio
nal
prog
ram
mes
to h
elp
them
mak
e in
form
ed d
ecis
ions
on
FP a
nd m
etho
d us
ed
Tabl
e 1 S
umm
ary
of p
eer-
revi
ewed
and
gre
y lit
erat
ure
publ
ishe
d be
twee
n 20
08 a
nd 2
018
rela
ted
to fa
mily
pla
nnin
g am
ong
youn
g pe
ople
in Jo
rdan
(Con
tinue
d)

1120
Review EMHJ – Vol. 26 No. 9 – 2020
Auth
ors
Year
Titl
eEc
olog
ical
le
vel o
f foc
usPo
pula
tion
and
sam
ple
size
Stud
y de
sign
/doc
umen
t de
scri
ptio
nK
ey re
sult
s
Jord
an E
vide
nce-
Base
d M
edic
ine/
Repr
oduc
tive
Hea
lth (J
EBM
/RH
) Gro
up
(19)
2016
The
best
evi
denc
e on
fa
mily
pla
nnin
g m
etho
ds
and
prac
tices
Supp
ortiv
e en
viro
nmen
tN
ot a
vaila
ble
Purp
ose:
to d
escr
ibe
an in
terv
entio
n to
impr
ove
evid
ence
-bas
ed p
ract
ices
am
ong
FP p
rovi
ders
•Cu
rren
t bar
rier
s to
upta
ke in
clud
e la
ck o
f up-
to-d
ate
info
rmat
ion
as w
ell a
s a ra
nge
of m
isco
ncep
tions
by
prov
ider
s•
Thes
e m
isco
ncep
tions
are
gre
ates
t for
hor
mon
al
cont
race
ptiv
e m
etho
ds w
hich
incl
ude
oral
cont
race
ptiv
e pi
lls, i
njec
tabl
e co
ntra
cept
ive
and
impl
ants
Wes
t L, e
t al.
(20)
2016
Fact
ors i
n us
e of
fam
ily
plan
ning
serv
ices
by
Syri
an w
omen
in a
re
fuge
e ca
mp
in Jo
rdan
Yout
h16
mar
ried
Syr
ian
wom
en
in ca
mps
age
d 18
–35
year
s D
esig
n: q
ualit
ativ
e st
udy
usin
g in
-de
pth
inte
rvie
ws.
Purp
ose:
to a
sses
s fa
ctor
s tha
t infl
uenc
e us
e of
FP
serv
ices
by
wom
en in
cam
ps
•Yo
unge
r wom
en re
port
ed w
antin
g to
hav
e m
ore
child
ren,
thus
not
dis
cuss
ing
FP•
Cultu
ral n
orm
s, su
ch a
s con
cern
s ove
r fer
tility
an
d pr
essu
re to
beg
in ch
ildbe
arin
g im
med
iate
ly
afte
r mar
riag
e, li
mite
d FP
upt
ake
amon
g yo
unge
r pa
rtic
ipan
ts•
Mos
tly o
lder
wom
en a
cces
sed
FP se
rvic
es in
cam
ps;
maj
ority
of p
artic
ipan
ts d
id n
ot a
cces
s FP
•In
form
atio
n on
and
aw
aren
ess o
f FP
was
lim
ited
for a
ll pa
rtic
ipan
ts
Wor
ld H
ealth
Org
aniz
atio
n (2
1)20
16Ad
oles
cent
cont
race
ptiv
e us
e: d
ata
from
the
Jord
an
popu
latio
n an
d fa
mily
he
alth
surv
ey, 2
012
Yout
hU
sed
Jord
an P
opul
atio
n an
d Fa
mily
Hea
lth S
urve
y,
2012
Des
ign:
seco
ndar
y an
alys
is,
obse
rvat
iona
l stu
dy. P
urpo
se: t
o ex
amin
e co
ntra
cept
ive
use
amon
g ad
oles
cent
s in
Jord
an
•H
igh
unm
et n
eed
amon
g m
arri
ed a
dole
scen
ts: 3
9.1%
of
mar
ried
ado
lesc
ent g
irls
repo
rted
not
wan
ting
a ch
ild
in th
e ne
xt 2
yea
rs, b
ut o
nly
35.2
% w
ere
curr
ently
usi
ng
any
met
hod
to p
reve
nt p
regn
ancy
•
The
mai
n re
ason
s for
not
usi
ng a
FP
met
hod
incl
ude:
br
east
feed
ing
(42.
9%),
fear
of s
ide-
effe
cts o
r hea
lth
conc
erns
(29.
5%),
men
ses h
ad n
ot re
turn
ed a
fter
giv
ing
birt
h (2
6.7%
)•
Of a
ll m
arri
ed a
dole
scen
t gir
ls 15
–19
year
s, 72
.5%
wer
e no
t usi
ng a
met
hod
of co
ntra
cept
ion.
•
Pills
and
lact
atio
nal a
men
orrh
ea w
ere
the
mos
t co
mm
on m
oder
n m
etho
ds u
sed
(11.4
% an
d 4.
1% o
f the
se
adol
esce
nt g
irls
, res
pect
ivel
y). U
se o
f the
trad
ition
al
met
hod
of w
ithdr
awal
was
hig
h.
•M
ost a
dole
scen
t gir
ls o
btai
ned
FP se
rvic
es fr
om th
e pr
ivat
e se
ctor
(38%
) or p
harm
acy
(32%
)
Jord
an C
omm
unic
atio
n Ad
voca
cy a
nd P
olic
y Ac
tivity
(5)
2015
Know
ledg
e at
titud
es
and
prac
tices
tow
ard
fam
ily p
lann
ing
and
repr
oduc
tive
heal
th
amon
g m
arri
ed w
omen
of
repr
oduc
tive
age
in se
lect
ed d
istr
icts
in
Jord
an
Yout
h40
8 m
ale
and
fem
ale
part
icip
ants
(Jor
dani
an a
nd
Syri
an);
mar
ried
wom
en
and
men
, and
unm
arri
ed
youn
g pe
ople
18–2
4 ye
ars
(108
fem
ales
, 80
mal
es)
Des
ign:
qua
litat
ive
desi
gn u
sing
fo
cus g
roup
dis
cuss
ions
. Pur
pose
: to
exp
lore
how
gen
der r
oles
and
pe
rcep
tions
in co
njun
ctio
n w
ith
relig
ious
and
cultu
ral n
orm
s, af
fect
FP
in te
rms o
f bel
iefs
, att
itude
s and
pr
actic
es.
•Yo
ung
peop
le (e
spec
ially
unm
arri
ed) l
acke
d kn
owle
dge
and
awar
enes
s of m
oder
n FP
met
hods
•H
alf o
f the
unm
arri
ed Jo
rdan
ian
and
Syri
an m
ale
and
fem
ale
youn
g pe
ople
said
that
dis
cuss
ing
FP w
as
impo
rtan
t bet
wee
n sp
ouse
s •
Mal
e an
d fe
mal
e yo
ung
peop
le e
xpre
ssed
a n
eed
for
form
al cl
asse
s or t
rain
ing
on F
P
Tabl
e 1 S
umm
ary
of p
eer-
revi
ewed
and
gre
y lit
erat
ure
publ
ishe
d be
twee
n 20
08 a
nd 2
018
rela
ted
to fa
mily
pla
nnin
g am
ong
youn
g pe
ople
in Jo
rdan
(Con
tinue
d)
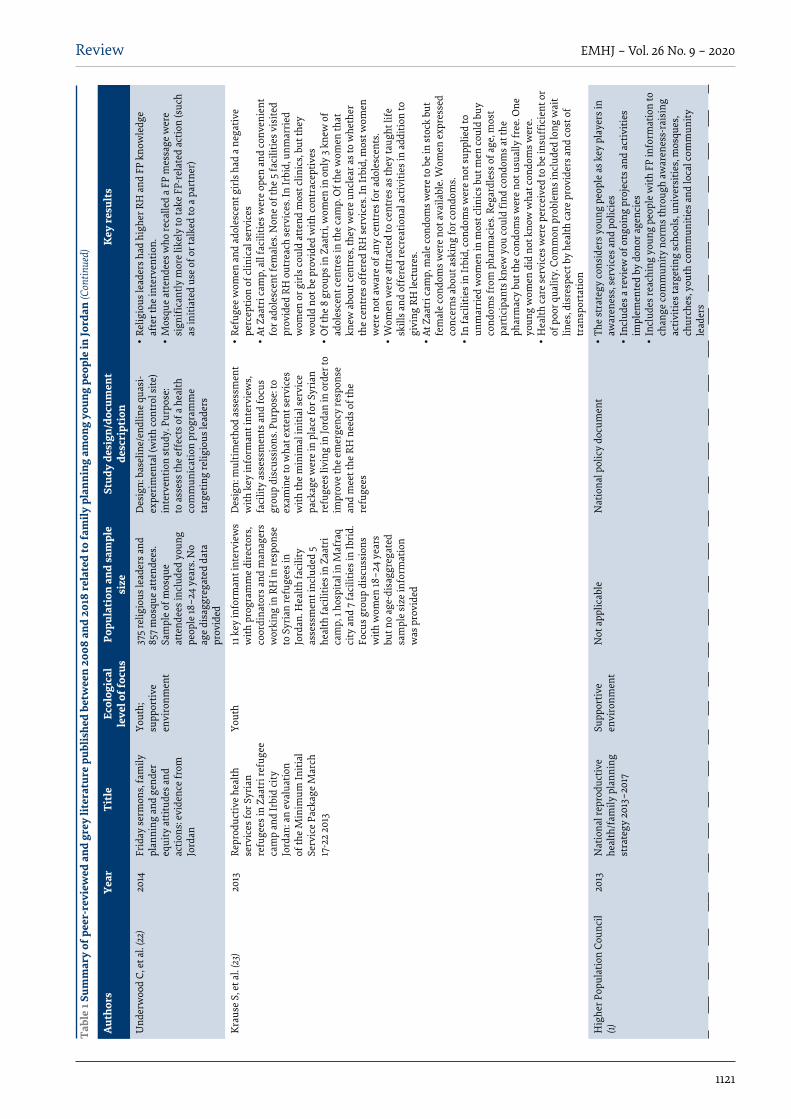
1121
Review EMHJ – Vol. 26 No. 9 – 2020
Auth
ors
Year
Titl
eEc
olog
ical
le
vel o
f foc
usPo
pula
tion
and
sam
ple
size
Stud
y de
sign
/doc
umen
t de
scri
ptio
nK
ey re
sult
s
Und
erw
ood
C, e
t al.
(22)
2014
Frid
ay se
rmon
s, fa
mily
pl
anni
ng a
nd g
ende
r eq
uity
att
itude
s and
ac
tions
: evi
denc
e fr
om
Jord
an
Yout
h;
supp
ortiv
e en
viro
nmen
t
375
relig
ious
lead
ers a
nd
857
mos
que
atte
ndee
s. Sa
mpl
e of
mos
que
atte
ndee
s inc
lude
d yo
ung
peop
le 18
–24
year
s. N
o ag
e di
sagg
rega
ted
data
pr
ovid
ed
Des
ign:
bas
elin
e/en
dlin
e qu
asi-
expe
rim
enta
l (w
ith co
ntro
l site
) in
terv
entio
n st
udy.
Pur
pose
: to
ass
ess t
he e
ffec
ts o
f a h
ealth
co
mm
unic
atio
n pr
ogra
mm
e ta
rget
ing
relig
ious
lead
ers
•Re
ligio
us le
ader
s had
hig
her R
H a
nd F
P kn
owle
dge
afte
r the
inte
rven
tion.
•
Mos
que
atte
ndee
s who
reca
lled
a FP
mes
sage
wer
e si
gnifi
cant
ly m
ore
likel
y to
take
FP-
rela
ted
actio
n (s
uch
as in
itiat
ed u
se o
f or t
alke
d to
a p
artn
er)
Krau
se S
, et a
l. (2
3)20
13Re
prod
uctiv
e he
alth
se
rvic
es fo
r Syr
ian
refu
gees
in Z
aatr
i ref
ugee
ca
mp
and
Irbi
d ci
ty
Jord
an: a
n ev
alua
tion
of th
e M
inim
um In
itial
Se
rvic
e Pa
ckag
e M
arch
17
-22
2013
Yout
h11
key
info
rman
t int
ervi
ews
with
pro
gram
me
dire
ctor
s, co
ordi
nato
rs a
nd m
anag
ers
wor
king
in R
H in
resp
onse
to
Syr
ian
refu
gees
in
Jord
an. H
ealth
faci
lity
asse
ssm
ent i
nclu
ded
5 he
alth
faci
litie
s in
Zaat
ri
cam
p, 1
hosp
ital i
n M
afra
q ci
ty a
nd 7
faci
litie
s in
Ibri
d.
Focu
s gro
up d
iscu
ssio
ns
with
wom
en 18
–24
year
s bu
t no
age-
disa
ggre
gate
d sa
mpl
e si
ze in
form
atio
n w
as p
rovi
ded
Des
ign:
mul
timet
hod
asse
ssm
ent
with
key
info
rman
t int
ervi
ews,
faci
lity
asse
ssm
ents
and
focu
s gr
oup
disc
ussi
ons.
Purp
ose:
to
exam
ine
to w
hat e
xten
t ser
vice
s w
ith th
e m
inim
al in
itial
serv
ice
pack
age
wer
e in
pla
ce fo
r Syr
ian
refu
gees
livi
ng in
Jord
an in
ord
er to
im
prov
e th
e em
erge
ncy
resp
onse
an
d m
eet t
he R
H n
eeds
of t
he
refu
gees
•Re
fuge
e w
omen
and
ado
lesc
ent g
irls
had
a n
egat
ive
perc
eptio
n of
clin
ical
serv
ices
•At
Zaa
tri c
amp,
all
faci
litie
s wer
e op
en a
nd co
nven
ient
fo
r ado
lesc
ent f
emal
es. N
one
of th
e 5
faci
litie
s vis
ited
prov
ided
RH
out
reac
h se
rvic
es. I
n Ir
bid,
unm
arri
ed
wom
en o
r gir
ls co
uld
atte
nd m
ost c
linic
s, bu
t the
y w
ould
not
be
prov
ided
with
cont
race
ptiv
es•
Of t
he 8
gro
ups i
n Za
atri
, wom
en in
onl
y 3
knew
of
adol
esce
nt ce
ntre
s in
the
cam
p. O
f the
wom
en th
at
knew
abo
ut ce
ntre
s, th
ey w
ere
uncl
ear a
s to
whe
ther
th
e ce
ntre
s off
ered
RH
serv
ices
. In
Irbi
d, m
ost w
omen
w
ere
not a
war
e of
any
cent
res f
or a
dole
scen
ts.
•W
omen
wer
e at
trac
ted
to ce
ntre
s as t
hey
taug
ht li
fe
skill
s and
off
ered
recr
eatio
nal a
ctiv
ities
in a
dditi
on to
gi
ving
RH
lect
ures
.•
At Z
aatr
i cam
p, m
ale
cond
oms w
ere
to b
e in
stoc
k bu
t fe
mal
e co
ndom
s wer
e no
t ava
ilabl
e. W
omen
exp
ress
ed
conc
erns
abo
ut a
skin
g fo
r con
dom
s. •
In fa
cilit
ies i
n Ir
bid,
cond
oms w
ere
not s
uppl
ied
to
unm
arri
ed w
omen
in m
ost c
linic
s but
men
coul
d bu
y co
ndom
s fro
m p
harm
acie
s. Re
gard
less
of a
ge, m
ost
part
icip
ants
kne
w y
ou co
uld
find
cond
oms a
t the
ph
arm
acy
but t
he co
ndom
s wer
e no
t usu
ally
free
. One
yo
ung
wom
en d
id n
ot k
now
wha
t con
dom
s wer
e.
•H
ealth
care
serv
ices
wer
e pe
rcei
ved
to b
e in
suffi
cien
t or
of p
oor q
ualit
y. C
omm
on p
robl
ems i
nclu
ded
long
wai
t lin
es, d
isre
spec
t by
heal
th ca
re p
rovi
ders
and
cost
of
tran
spor
tatio
n
Hig
her P
opul
atio
n Co
unci
l (1)
2013
Nat
iona
l rep
rodu
ctiv
e he
alth
/fam
ily p
lann
ing
stra
tegy
201
3–20
17
Supp
ortiv
e en
viro
nmen
tN
ot a
pplic
able
N
atio
nal p
olic
y do
cum
ent
•Th
e st
rate
gy co
nsid
ers y
oung
peo
ple
as k
ey p
laye
rs in
aw
aren
ess,
serv
ices
and
pol
icie
s•
Incl
udes
a re
view
of o
ngoi
ng p
roje
cts a
nd a
ctiv
ities
im
plem
ente
d by
don
or a
genc
ies
•In
clud
es re
achi
ng y
oung
peo
ple
with
FP
info
rmat
ion
to
chan
ge co
mm
unity
nor
ms t
hrou
gh a
war
enes
s-ra
isin
g ac
tiviti
es ta
rget
ing
scho
ols,
univ
ersi
ties,
mos
ques
, ch
urch
es, y
outh
com
mun
ities
and
loca
l com
mun
ity
lead
ers
Tabl
e 1 S
umm
ary
of p
eer-
revi
ewed
and
gre
y lit
erat
ure
publ
ishe
d be
twee
n 20
08 a
nd 2
018
rela
ted
to fa
mily
pla
nnin
g am
ong
youn
g pe
ople
in Jo
rdan
(Con
tinue
d)

1122
Review EMHJ – Vol. 26 No. 9 – 2020
Auth
ors
Year
Titl
eEc
olog
ical
le
vel o
f foc
usPo
pula
tion
and
sam
ple
size
Stud
y de
sign
/doc
umen
t de
scri
ptio
nK
ey re
sult
s
Kam
haw
i S, e
t al.
(24)
2013
Clie
nt-c
ente
red
coun
selin
g im
prov
es
clie
nt sa
tisfa
ctio
n w
ith
fam
ily p
lann
ing
visi
ts:
evid
ence
from
Irbi
d,
Jord
an
Yout
h 35
2 m
arri
ed/e
ngag
ed
wom
en 15
–49
year
s in
Irbi
d D
esig
n: F
P cl
ient
exi
t sur
vey.
Pu
rpos
e: to
exa
min
e w
heth
er cl
ient
-ce
ntre
d co
unse
lling
is a
ssoc
iate
d w
ith b
ette
r clie
nt sa
tisfa
ctio
n
•N
o ag
e di
sagg
rega
ted
data
•Cl
ient
satis
fact
ion
was
ass
ocia
ted
with
use
of t
he
coun
selli
ng p
roto
col f
ocus
ed o
n cl
ient
-cen
tred
co
unse
lling
O’H
ara
K, e
t al.
(25)
2013
Expe
rien
ces o
f int
imat
e-pa
rtne
r vio
lenc
e an
d co
ntra
cept
ion
use
amon
g ev
er-m
arri
ed w
omen
in
Jord
an
Yout
h34
34 w
omen
bet
wee
n 15
an
d 49
yea
rsD
esig
n: cr
oss-
sect
iona
l stu
dy;
seco
ndar
y an
alys
is o
f JPF
S da
ta.
Purp
ose:
to e
xplo
re a
ssoc
iatio
n be
twee
n ex
peri
ence
s of i
ntim
ate
part
ner v
iole
nce
and
use
of a
ny
form
of c
ontr
acep
tion
•N
o ag
e di
sagg
rega
ted
data
•O
lder
wom
en w
ere
mor
e lik
ely
to u
se co
ntra
cept
ion
that
you
nger
wom
en•
Wom
en w
ho re
port
ed se
vere
phy
sica
l vio
lenc
e w
ere
less
like
ly to
use
cont
race
ptio
n th
an w
omen
who
did
no
t exp
erie
nce
such
vio
lenc
e•
Wom
en w
ho e
xper
ienc
ed se
xual
vio
lenc
e w
ere
mor
e lik
ely
to u
se co
ntra
cept
ion
Und
erw
ood
C, e
t al.
(26)
2013
Relig
ious
lead
ers g
ain
grou
nd in
the
Jord
ania
n fa
mily
-pla
nnin
g m
ovem
ent
Supp
ortiv
e en
viro
nmen
t13
6 re
ligio
us le
ader
s at
base
line,
115
at e
ndlin
eD
esig
n: b
asel
ine/
endl
ine
inte
rven
tion
stud
y w
ith se
lf-ad
min
iste
red
ques
tionn
aire
. Pu
rpos
e: to
ass
ess t
he e
ffec
t of a
tr
aini
ng p
rogr
amm
e on
kno
wle
dge
of a
nd a
ttitu
des t
o fa
mily
wel
fare
to
pics
– sp
ecifi
cally
FP
and
RH
•Re
ligio
us le
ader
s had
hig
her k
now
ledg
e of
the
dang
ers
of p
regn
ancy
in w
omen
und
er o
f 20
year
s•
Relig
ious
lead
ers w
ere
mor
e su
ppor
tive
of b
irth
spac
ing
mes
sage
s for
mat
erna
l hea
lth a
fter
the
inte
rven
tion
Ceto
relli
V, e
t al.
(27)
2012
Is fe
rtili
ty st
allin
g in
Jo
rdan
?Yo
uth
Use
d Jo
rdan
Pop
ulat
ion
and
Fam
ily H
ealth
surv
eys
from
1997
to 2
009
Des
ign:
seco
ndar
y an
alys
is
obse
rvat
iona
l stu
dy. P
urpo
se: t
o ex
amin
e pa
tter
ns in
fert
ility
from
19
97 to
200
9 an
d to
revi
ew F
P po
licy
•Pe
rcen
tage
of w
omen
bet
wee
n 15
and
19 y
ears
who
had
ne
ver b
een
mar
ried
, and
per
cent
age
of m
arri
ed w
omen
be
twee
n 15
and
19 y
ears
usi
ng co
ntra
cept
ion
incr
ease
d be
twee
n 19
97 a
nd 2
009
•In
200
9, 2
7% o
f mar
ried
wom
en 15
–19
year
s and
43%
of
mar
ried
wom
en 2
0–24
yea
r use
d co
ntra
cept
ives
•Fe
rtili
ty p
eake
d ar
ound
25–
29 y
ears
Tabl
e 1 S
umm
ary
of p
eer-
revi
ewed
and
gre
y lit
erat
ure
publ
ishe
d be
twee
n 20
08 a
nd 2
018
rela
ted
to fa
mily
pla
nnin
g am
ong
youn
g pe
ople
in Jo
rdan
(Con
tinue
d)

1123
Review EMHJ – Vol. 26 No. 9 – 2020
Auth
ors
Year
Titl
eEc
olog
ical
le
vel o
f foc
usPo
pula
tion
and
sam
ple
size
Stud
y de
sign
/doc
umen
t de
scri
ptio
nK
ey re
sult
s
Ham
za S
(28)
2012
Long
-act
ing
horm
onal
co
ntra
cept
ives
: with
out
them
, Jor
dan
will
not
m
eet t
he p
opul
atio
n de
velo
pmen
t goa
ls
Supp
ortiv
e en
viro
nmen
tN
ot a
vaila
ble
Des
ign:
ass
essm
ent o
f Min
istr
y of
H
ealth
serv
ice
stat
istic
s. Pu
rpos
e:
to e
xam
ine
whe
ther
a te
am o
f st
akeh
olde
rs fo
cuse
d on
exp
andi
ng
cont
race
ptiv
e im
plan
ts in
crea
sed
avai
labi
lity
at fa
cilit
ies
•Pr
elim
inar
y re
sults
sugg
est t
hat c
ontr
acep
tive
impl
ants
ar
e av
aila
ble
and
in u
se b
y cl
ient
s in
40%
of h
ospi
tals
an
d 10
% of
hea
lth ce
ntre
s.•
Befo
re th
e st
art o
f the
pro
gram
me,
onl
y 10
% of
ho
spita
ls a
nd le
ss th
an 4
% of
hea
lth ce
ntre
s pro
vide
d co
ntra
cept
ive
impl
ants
.
Jord
an H
ealth
Co
mm
unic
atio
n Pa
rtne
rshi
p (2
9)
2012
Eval
uatio
n of
the
Arab
W
omen
Spe
ak O
ut
(AW
SO) I
nitia
tive
– 2n
d Ti
er (p
hase
I) –
in Ir
bid
Gov
erno
rate
, Jor
dan,
201
1
Yout
h40
8 w
omen
, 20.
8% b
etw
een
15 a
nd 2
4 ye
ars
Des
ign:
pos
t-tes
t, no
n-eq
uiva
lent
co
ntro
l gro
up. P
urpo
se: t
o in
crea
se
info
rmat
ion
abou
t FP
thro
ugh
dist
ribu
tion
of fl
ash
card
s
•N
o ag
e di
sagg
rega
ted
data
•
76%
reca
lled
mes
sage
s rel
ated
to w
omen
’s ro
le in
m
akin
g fa
mily
-rel
ated
dec
isio
ns•
90%
reca
lled
mes
sage
s abo
ut b
enefi
ts o
f FP;
94%
in
trea
tmen
t vs 7
4% in
cont
rol g
roup
repo
rted
pos
itive
at
titud
es to
mod
ern
cont
race
ptiv
es•
90%
indi
cate
d th
at th
ey w
ould
conv
ey m
essa
ges a
bout
de
layi
ng m
arri
age
until
the
age
of 18
yea
rs fo
r wom
en
for a
hap
py, h
ealth
y lif
e
Jord
an H
ealth
Co
mm
unic
atio
n Pa
rtne
rshi
p (3
0)
2012
Eval
uatio
n of
the
Arab
W
omen
Spe
ak O
ut
(AW
SO) I
nitia
tive
– 2n
d Ti
er (P
hase
II) –
in Ir
bid
Gov
erno
rate
, Jor
dan,
201
2
Yout
h40
8 w
omen
, 26.
5% b
etw
een
15 a
nd 2
4 ye
ars
Des
ign:
pos
t-tes
t, no
n-eq
uiva
lent
co
ntro
l gro
up. P
urpo
se: t
o in
crea
se
info
rmat
ion
abou
t FP
thro
ugh
dist
ribu
tion
of fl
ash
card
s
•N
o ag
e di
sagg
rega
ted
data
•
92%
in tr
eatm
ent a
rm v
s 74%
in co
ntro
l arm
repo
rted
po
sitiv
e at
titud
es to
FP
Jord
an H
ealth
Co
mm
unic
atio
n Pa
rtne
rshi
p (3
1)
2012
Eval
uatio
n of
the
haya
ti ah
la fi
lm in
the
Civi
l St
atus
and
Pas
spor
ts
Dep
artm
ent (
CSPD
) O
ffice
s Jor
dan
– 20
12
Yout
hV
isito
rs to
the
Civi
l Sta
tus
and
Pass
port
s Dep
artm
ent,
3.8%
und
er 2
0 ye
ars a
nd
28.9
% be
twee
n 21
and
30
year
s
Des
ign:
pos
t-tes
t, in
terv
entio
n st
udy.
Pur
pose
: to
targ
et n
ew
pare
nts w
ith in
form
atio
n on
FP
and
RH w
ith a
film
•N
o ag
e di
sagg
rega
ted
data
•
Smal
l im
prov
emen
ts in
FP
know
ledg
e an
d at
titud
es•
Mos
t vie
wer
s tho
ught
that
the
vide
o sh
ould
be
pres
ent i
n al
l offi
ces o
f the
Civ
il St
atus
and
Pas
spor
ts
Dep
artm
ent
Lille
ston
P (3
2)20
12Pl
anni
ng fo
r Life
Pha
se 2
: Ev
alua
tion
Repo
rtYo
uth
Out
-of-s
choo
l you
ng
peop
le b
etw
een
15 a
nd
24 y
ears
(num
ber n
ot
prov
ided
)
Des
ign:
pre
- and
pos
t-int
erve
ntio
n su
rvey
. Pur
pose
: to
inte
grat
e RH
and
FP
into
dev
elop
men
t pr
ogra
mm
es fo
r you
ng p
eopl
e
•Th
e in
terv
entio
n si
gnifi
cant
ly im
prov
ed R
H
info
rmat
ion
and
attit
udes
in p
artic
ipan
ts•
Impl
emen
ting
part
ner w
as su
rpri
sed
how
rece
ptiv
e Jo
rdan
ian
youn
g pe
ople
wer
e to
the
inte
rven
tion
Tabl
e 1 S
umm
ary
of p
eer-
revi
ewed
and
gre
y lit
erat
ure
publ
ishe
d be
twee
n 20
08 a
nd 2
018
rela
ted
to fa
mily
pla
nnin
g am
ong
youn
g pe
ople
in Jo
rdan
(Con
tinue
d)

1124
Review EMHJ – Vol. 26 No. 9 – 2020
Auth
ors
Year
Titl
eEc
olog
ical
le
vel o
f foc
usPo
pula
tion
and
sam
ple
size
Stud
y de
sign
/doc
umen
t de
scri
ptio
nK
ey re
sult
s
Shak
hatr
eh F
(33)
2012
Fam
ily p
lann
ing
in
wom
en o
f chi
ldbe
arin
g ag
e in
dis
adva
ntag
ed
sout
h Jo
rdan
Yout
h;
supp
ortiv
e en
viro
nmen
t
816
wom
en 15
–49
year
sD
esig
n: ra
ndom
ized
hou
seho
ld
surv
ey. P
urpo
se: t
o in
vest
igat
e cu
rren
t use
of F
P m
etho
ds a
mon
g Jo
rdan
ian
wom
en, i
nten
tion
to
use
FP, f
aith
in h
ealth
serv
ices
, an
d su
gges
tions
to im
prov
e he
alth
se
rvic
es
•N
o ag
e di
sagg
rega
ted
data
pre
sent
ed•
Mai
n re
ason
s for
not
curr
ently
usi
ng F
P w
ere:
wan
t m
ore
child
ren,
dis
appr
ove
of th
e us
e of
FP,
refu
sed
by
husb
and
to u
se F
P, a
nd si
de-e
ffec
ts•
Use
of F
P m
etho
ds in
crea
sed
with
incr
easi
ng p
arity
, le
vel o
f edu
catio
n an
d ag
e (u
ntil
40 y
ears
)•
26.8
% of
wom
en h
ad n
o fa
ith in
the
Min
istr
y of
Hea
lth
serv
ices
. Bad
doc
tor–
patie
nt co
mm
unic
atio
n w
as th
e m
ain
reas
on (4
7.3%
) fol
low
ed b
y la
ck o
f hea
lth ca
re
prov
ider
s (10
.9%)
•W
omen
sugg
este
d pr
ovid
ing
and
trai
ning
hea
lth
care
pro
vide
rs a
nd im
prov
ing
doct
or–
patie
nt
com
mun
icat
ion
Conn
elly
M (2
)20
11Ba
selin
e st
udy:
do
cum
entin
g kn
owle
dge
attit
udes
and
pra
ctic
es
of Ir
aqi r
efug
ees a
nd th
e st
atus
of f
amily
pla
nnin
g se
rvic
es in
UN
HCR
s op
erat
ions
in A
mm
an
Jord
an
Yout
hH
ouse
hold
surv
ey: 4
07
hous
ehol
ds (1
4.8%
of t
he
resp
onde
nts w
ere
betw
een
15 a
nd 19
yea
rs, 3
2.2%
w
ere
betw
een
20 a
nd 2
9 ye
ars)
. Foc
us g
roup
s: Th
ree
grou
ps o
f unm
arri
ed g
irls
15
-–19
yea
rs, a
nd th
ree
grou
ps o
f unm
arri
ed b
oys
15–1
9 ye
ars
Des
ign:
mix
ed m
etho
ds cr
oss-
sect
iona
l stu
dy; h
ouse
hold
surv
ey
and
focu
s gro
up d
iscu
ssio
ns.
Purp
ose:
to d
ocum
ent k
now
ledg
e,
belie
fs, p
erce
ptio
ns a
nd p
ract
ices
of
refu
gees
rela
ted
to F
P se
rvic
es
•V
ery
limite
d RH
kno
wle
dge
amon
g ad
oles
cent
s 15–
19
year
s, la
rgel
y du
e to
cultu
ral n
orm
s tha
t pro
hibi
t sex
be
twee
n un
mar
ried
peo
ple
•V
ery
few
you
ng p
eopl
e ha
d he
ard
of e
mer
genc
y co
ntra
cept
ion
or fe
mal
e co
ndom
s.•
Of t
he 4
07 h
ouse
hold
s, 6.
57%
of w
omen
15–2
4 ye
ars
wer
e us
ing
FP m
etho
ds
•M
ost c
omm
on co
ncer
n in
wom
en 15
–24
year
s who
w
ante
d to
lim
it or
spac
e bi
rths
was
rela
ted
to fe
rtili
ty
•Bo
ys a
nd g
irls
15–1
9 ye
ars w
ould
seek
RH
info
rmat
ion
from
thei
r par
ent fi
rst
•Pa
rtic
ipan
ts th
ough
t tha
t sex
ual a
ctiv
ity in
ado
lesc
ents
w
as ra
re, b
ut h
appe
ned
som
etim
es; s
omet
imes
sex
was
tr
ansa
ctio
nal i
n na
ture
•An
unm
arri
ed p
regn
ant g
irl w
ould
bri
ng sh
ame
on h
er
fam
ily a
nd w
ould
be
at ri
sk o
f hon
our k
illin
g or
forc
ed
mar
riag
e
Jord
an H
ealth
Co
mm
unic
atio
n Pa
rtne
rshi
p (3
4)
2011
Eval
uatio
n of
the
cons
ult
and
choo
se in
itiat
ive
in Z
arqa
Gov
erno
rate
, Jo
rdan
, 201
1
Yout
h6.
7% o
f the
sam
ple
wer
e yo
ung
peop
le u
nder
20
year
s and
44.
7% w
ere
betw
een
21 a
nd 3
0 ye
ars
Des
ign:
pos
t-tes
t, ex
it su
rvey
. Pu
rpos
e: to
eva
luat
e th
e ef
fect
of
trai
ning
pro
gram
mes
for h
ealth
pr
ovid
ers i
nclu
ding
pos
ters
, wal
l ch
arts
and
clie
nt cu
e ca
rds i
n m
ater
nal a
nd ch
ild h
ealth
cent
res
•N
o ag
e di
sagg
rega
ted
data
•M
ost p
artic
ipan
ts sa
w th
e po
ster
, fou
nd it
hel
pful
and
w
ere
satis
fied
with
the
inte
rven
tion
Jord
an H
ealth
Co
mm
unic
atio
n Pa
rtne
rshi
p (3
5)
2011
Eval
uatio
n of
the
Arab
W
omen
Spe
ak O
ut
(AW
SO) I
nitia
tive
in Ir
bid
Gov
erno
rate
, Jor
dan,
201
1
Yout
h47
2 w
omen
, 35.
2% a
ged
18–2
9 ye
ars
Des
ign:
inte
rven
tion
stud
y;
pre-
test
/pos
t-tes
t non
-equ
ival
ent
cont
rol g
roup
. Pur
pose
: to
eval
uate
th
e ef
fect
of g
roup
dis
cuss
ion
to
disc
uss h
ealth
-rel
ated
nee
ds
•N
o ag
e di
sagg
rega
ted
data
•Pa
rtic
ipan
ts h
ad im
prov
ed a
ttitu
des t
o bi
rth
spac
ing,
lo
nger
pre
gnan
cy in
terv
als,
asso
ciat
ing
FP w
ith b
irth
sp
acin
g ra
ther
than
bir
th co
ntro
l
Tabl
e 1 S
umm
ary
of p
eer-
revi
ewed
and
gre
y lit
erat
ure
publ
ishe
d be
twee
n 20
08 a
nd 2
018
rela
ted
to fa
mily
pla
nnin
g am
ong
youn
g pe
ople
in Jo
rdan
(Con
tinue
d)
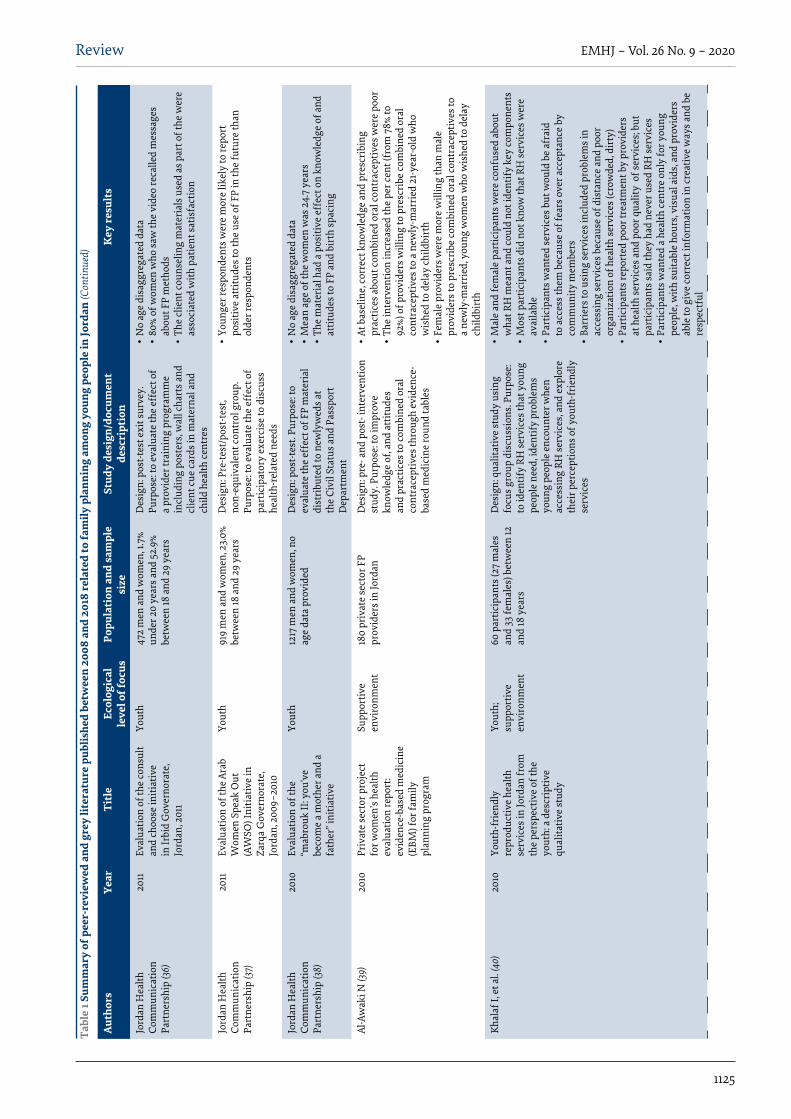
1125
Review EMHJ – Vol. 26 No. 9 – 2020
Auth
ors
Year
Titl
eEc
olog
ical
le
vel o
f foc
usPo
pula
tion
and
sam
ple
size
Stud
y de
sign
/doc
umen
t de
scri
ptio
nK
ey re
sult
s
Jord
an H
ealth
Co
mm
unic
atio
n Pa
rtne
rshi
p (3
6)
2011
Eval
uatio
n of
the
cons
ult
and
choo
se in
itiat
ive
in Ir
bid
Gov
erno
rate
, Jo
rdan
, 201
1
Yout
h47
2 m
en a
nd w
omen
, 1.7
% un
der 2
0 ye
ars a
nd 5
2.9%
be
twee
n 18
and
29
year
s
Des
ign:
pos
t-tes
t exi
t sur
vey.
Pu
rpos
e: to
eva
luat
e th
e ef
fect
of
a pr
ovid
er tr
aini
ng p
rogr
amm
e in
clud
ing
post
ers,
wal
l cha
rts a
nd
clie
nt cu
e ca
rds i
n m
ater
nal a
nd
child
hea
lth ce
ntre
s
•N
o ag
e di
sagg
rega
ted
data
•80
% of
wom
en w
ho sa
w th
e vi
deo
reca
lled
mes
sage
s ab
out F
P m
etho
ds•
The
clie
nt co
unse
ling
mat
eria
ls u
sed
as p
art o
f the
wer
e as
soci
ated
with
pat
ient
satis
fact
ion
Jord
an H
ealth
Co
mm
unic
atio
n Pa
rtne
rshi
p (3
7)
2011
Eval
uatio
n of
the
Arab
W
omen
Spe
ak O
ut
(AW
SO) I
nitia
tive
in
Zarq
a G
over
nora
te,
Jord
an, 2
009–
2010
Yout
h91
9 m
en a
nd w
omen
, 23.
0%
betw
een
18 a
nd 2
9 ye
ars
Des
ign:
Pre
-test
/pos
t-tes
t, no
n-eq
uiva
lent
cont
rol g
roup
. Pu
rpos
e: to
eva
luat
e th
e ef
fect
of
part
icip
ator
y ex
erci
se to
dis
cuss
he
alth
-rel
ated
nee
ds
•Yo
unge
r res
pond
ents
wer
e m
ore
likel
y to
repo
rt
posi
tive
attit
udes
to th
e us
e of
FP
in th
e fu
ture
than
ol
der r
espo
nden
ts
Jord
an H
ealth
Co
mm
unic
atio
n Pa
rtne
rshi
p (3
8)
2010
Eval
uatio
n of
the
“mab
rouk
II: y
ou’v
e be
com
e a
mot
her a
nd a
fa
ther
” ini
tiativ
e
Yout
h12
17 m
en a
nd w
omen
, no
age
data
pro
vide
dD
esig
n: p
ost-t
est.
Purp
ose:
to
eval
uate
the
effe
ct o
f FP
mat
eria
l di
stri
bute
d to
new
lyw
eds a
t th
e Ci
vil S
tatu
s and
Pas
spor
t D
epar
tmen
t
•N
o ag
e di
sagg
rega
ted
data
•
Mea
n ag
e of
the
wom
en w
as 2
4.7
year
s •
The
mat
eria
l had
a p
ositi
ve e
ffec
t on
know
ledg
e of
and
at
titud
es to
FP
and
birt
h sp
acin
g
Al-A
wak
i N (3
9)20
10Pr
ivat
e se
ctor
pro
ject
fo
r wom
en’s
heal
th
eval
uatio
n re
port
: ev
iden
ce-b
ased
med
icin
e (E
BM) f
or fa
mily
pl
anni
ng p
rogr
am
Supp
ortiv
e en
viro
nmen
t18
0 pr
ivat
e se
ctor
FP
prov
ider
s in
Jord
anD
esig
n: p
re- a
nd p
ost-
inte
rven
tion
stud
y. P
urpo
se: t
o im
prov
e kn
owle
dge
of, a
nd a
ttitu
des
and
prac
tices
to co
mbi
ned
oral
co
ntra
cept
ives
thro
ugh
evid
ence
-ba
sed
med
icin
e ro
und
tabl
es
•At
bas
elin
e, co
rrec
t kno
wle
dge
and
pres
crib
ing
prac
tices
abo
ut co
mbi
ned
oral
cont
race
ptiv
es w
ere
poor
•Th
e in
terv
entio
n in
crea
sed
the
per c
ent (
from
78%
to
92%)
of p
rovi
ders
will
ing
to p
resc
ribe
com
bine
d or
al
cont
race
ptiv
es to
a n
ewly
-mar
ried
21-y
ear-
old
who
w
ishe
d to
del
ay ch
ildbi
rth
•Fe
mal
e pr
ovid
ers w
ere
mor
e w
illin
g th
an m
ale
prov
ider
s to
pres
crib
e co
mbi
ned
oral
cont
race
ptiv
es to
a
new
ly-m
arri
ed, y
oung
wom
en w
ho w
ishe
d to
del
ay
child
birt
h
Khal
af I,
et a
l. (4
0)20
10Yo
uth-
frie
ndly
re
prod
uctiv
e he
alth
se
rvic
es in
Jord
an fr
om
the
pers
pect
ive
of th
e yo
uth:
a d
escr
iptiv
e qu
alita
tive
stud
y
Yout
h;
supp
ortiv
e en
viro
nmen
t
60 p
artic
ipan
ts (2
7 m
ales
an
d 33
fem
ales
) bet
wee
n 12
an
d 18
yea
rs
Des
ign:
qua
litat
ive
stud
y us
ing
focu
s gro
up d
iscu
ssio
ns. P
urpo
se:
to id
entif
y RH
serv
ices
that
you
ng
peop
le n
eed,
iden
tify
prob
lem
s yo
ung
peop
le e
ncou
nter
whe
n ac
cess
ing
RH se
rvic
es, a
nd e
xplo
re
thei
r per
cept
ions
of y
outh
-frie
ndly
se
rvic
es
•M
ale
and
fem
ale
part
icip
ants
wer
e co
nfus
ed a
bout
w
hat R
H m
eant
and
coul
d no
t ide
ntify
key
com
pone
nts
•M
ost p
artic
ipan
ts d
id n
ot k
now
that
RH
serv
ices
wer
e av
aila
ble
•Pa
rtic
ipan
ts w
ante
d se
rvic
es b
ut w
ould
be
afra
id
to a
cces
s the
m b
ecau
se o
f fea
rs o
ver a
ccep
tanc
e by
co
mm
unity
mem
bers
•Ba
rrie
rs to
usi
ng se
rvic
es in
clud
ed p
robl
ems i
n ac
cess
ing
serv
ices
bec
ause
of d
ista
nce
and
poor
or
gani
zatio
n of
hea
lth se
rvic
es (c
row
ded,
dir
ty)
•Pa
rtic
ipan
ts re
port
ed p
oor t
reat
men
t by
prov
ider
s at
hea
lth se
rvic
es a
nd p
oor q
ualit
y o
f ser
vice
s; bu
t pa
rtic
ipan
ts sa
id th
ey h
ad n
ever
use
d RH
serv
ices
•
Part
icip
ants
wan
ted
a he
alth
cent
re o
nly
for y
oung
pe
ople
, with
suita
ble
hour
s, vi
sual
aid
s, an
d pr
ovid
ers
able
to g
ive
corr
ect i
nfor
mat
ion
in cr
eativ
e w
ays a
nd b
e re
spec
tful
Tabl
e 1 S
umm
ary
of p
eer-
revi
ewed
and
gre
y lit
erat
ure
publ
ishe
d be
twee
n 20
08 a
nd 2
018
rela
ted
to fa
mily
pla
nnin
g am
ong
youn
g pe
ople
in Jo
rdan
(Con
tinue
d)

1126
Review EMHJ – Vol. 26 No. 9 – 2020
Auth
ors
Year
Titl
eEc
olog
ical
le
vel o
f foc
usPo
pula
tion
and
sam
ple
size
Stud
y de
sign
/doc
umen
t de
scri
ptio
nK
ey re
sult
s
Abel
E. (
41)
2009
Jord
an’s
repr
oduc
tive
heal
th p
olic
y en
viro
nmen
t sco
re:
mea
suri
ng th
e de
gree
to
whi
ch th
e po
licy
envi
ronm
ent i
n Jo
rdan
su
ppor
ts e
ffec
tive
polic
ies a
nd p
rogr
ams f
or
repr
oduc
tive
heal
th
Yout
h;
supp
ortiv
e en
viro
nmen
t
Use
d da
ta fr
om th
e po
licy
envi
ronm
ent s
core
as
sess
men
ts in
1997
, 200
0 an
d 20
08
Des
ign:
long
itudi
nal d
escr
iptiv
e st
udy.
Pur
pose
: to
mea
sure
th
e de
gree
to w
hich
the
polic
y en
viro
nmen
t sup
port
s RH
•Th
e nu
mbe
r of p
olic
y fo
rmul
atio
n, o
rgan
izat
ion,
and
pr
ogra
mm
e co
mpo
nent
s inc
reas
ed g
reat
ly b
etw
een
2000
and
200
8 fo
r ado
lesc
ent F
P an
d RH
•Po
litic
al su
ppor
t and
reso
urce
s for
ado
lesc
ent F
P an
d RH
dec
lined
cons
ider
ably
•Th
e po
licy
envi
ronm
ent f
or a
dole
scen
ts is
wea
k an
d ha
s re
mai
ned
so si
nce
2000
Hea
lth C
omm
unic
atio
n Pa
rtne
rshi
p (4
2)20
08M
otiv
atin
g he
alth
y tim
ing
and
spac
ing
of
preg
nanc
ies –
less
ons
from
the
field
Yout
h12
focu
s gro
up d
iscu
ssio
ns
with
wom
en a
nd m
en o
f re
prod
uctiv
e ag
e w
ho h
ad
at le
ast o
ne ch
ild u
nder
5
year
s to
unde
rsta
nd so
cial
no
rms a
nd p
erce
ived
ba
rrie
rs to
bir
th sp
acin
g
Des
ign:
qua
litat
ive
stud
y. P
urpo
se:
to u
nder
stan
d ho
w to
mot
ivat
e m
othe
rs a
nd co
mm
uniti
es to
ado
pt
safe
bir
th in
terv
als
•N
o sp
ecifi
c age
dis
aggr
egat
ed d
ata
pres
ente
d•
Child
bear
ing
was
the
mai
n ex
pect
atio
n fo
r and
by
coup
les
•FP
was
mor
e pr
oble
mat
ic th
an b
irth
spac
ing
•Ba
rrie
rs to
bir
th sp
acin
g in
clud
e fa
mily
and
com
mun
ity
pres
sure
, des
ire
for m
ale
heir
s, w
oman
’s la
te a
ge a
t m
arri
age,
and
poo
r kno
wle
dge
of co
ntra
cept
ion
and
fear
of s
ide-
effe
cts
•M
otiv
ator
s for
spac
ing
birt
hs in
clud
ed h
igh
cost
of
livin
g, d
esir
e to
giv
e at
tent
ion
to e
ach
child
, mot
her a
nd
child
hea
lth, a
nd b
ette
r qua
lity
of li
fe fo
r the
coup
le•
Resp
onde
nts s
ugge
sted
ent
erta
inm
ent e
duca
tion
such
as
radi
o an
d te
levi
sion
seri
es, s
oap
oper
as, t
estim
onia
ls,
talk
show
s, an
d ot
her e
nter
tain
men
t for
mat
s to
rela
y m
essa
ges.
Oth
er su
gges
tions
conc
erne
d po
licie
s, ed
ucat
iona
l rol
e of
hea
lth p
rovi
ders
, and
impr
ovin
g th
e qu
ality
of s
ervi
ces
Jurd
i P (4
3)20
08U
nint
ende
d pr
egna
ncie
s re
mai
n hi
gh in
Jord
anYo
uth
Seco
ndar
y an
alys
is o
f the
Jo
rdan
Pop
ulat
ion
and
Fam
ily H
ealth
Sur
vey
(200
2) in
clud
ing
mar
ried
w
omen
15–1
9 ye
ars a
nd
20–2
4 ye
ars (
sam
ple
size
no
t pro
vide
d)
Des
ign:
seco
ndar
y an
alys
is.
Purp
ose:
to d
escr
ibe
fert
ility
and
un
inte
nded
/mis
timed
pre
gnan
cy in
th
e Jo
rdan
pop
ulat
ion
•18
% of
pre
gnan
cies
wer
e un
inte
nded
in w
omen
15–1
9 ye
ars;
26%
wer
e un
inte
nded
in w
omen
20-
24 y
ears
Khal
af I,
et a
l. (4
4)20
08Jo
rdan
ian
wom
en’s
expe
rien
ces w
ith th
e us
e of
trad
ition
al fa
mily
pl
anni
ng
Yout
hSi
x fo
cus g
roup
s with
51
wom
en o
f chi
ldbe
arin
g ag
e (18
–44
year
s) in
the
nort
hern
, cen
tral
and
so
uthe
rn re
gion
s of J
orda
n
Des
ign:
qua
litat
ive
stud
y us
ing
focu
s gro
up d
iscu
ssio
ns. P
urpo
se:
to e
xplo
re th
e is
sues
and
chal
leng
es
rela
ted
to th
e us
e of
trad
ition
al F
P m
etho
ds
•N
o sp
ecifi
c res
ults
from
you
ng p
eopl
e as
no
info
rmat
ion
on p
artic
ipan
ts’ a
ge.
•Pr
essu
re to
get
pre
gnan
t im
med
iate
ly a
fter
mar
riag
e
FP: f
amily
pla
nnin
g, R
H re
prod
uctiv
e hea
lth.
Tabl
e 1 S
umm
ary
of p
eer-
revi
ewed
and
gre
y lit
erat
ure
publ
ishe
d be
twee
n 20
08 a
nd 2
018
rela
ted
to fa
mily
pla
nnin
g am
ong
youn
g pe
ople
in Jo
rdan
(Con
clude
d)

1127
Review EMHJ – Vol. 26 No. 9 – 2020
15–19 years had not discussed family planning with their husband in the previous 6 months compared with 50.2% of women aged 20–24 years (5). In addition, cultural values and shame limit the degree to which men participate in decisions on reproductive health (18). Despite the restrictive gender norms, many unmarried Jordanian and Syrian young women want their partners involved in family planning, and some young men believe that discussing family planning between partners can strengthen marital relationships (4,18,40).
Other women, television, community events and radio are common sources of family planning information for young Jordanian women (5,40). While many adolescents use the Internet as a primary source of information, they do not think that online sources, including social media, are trustworthy (5,40). Unmarried Iraqi boys and girls aged 15–19 years said they would first approach their mother (for girls) or father (for boys) if they had a question about their reproductive health before turning to other sources (2).
In general, young people in Jordan have limited information on where to obtain family planning services and are concerned over the quality of care. According to data from the 2012 Jordan Population and Family Health
Survey, most adolescent girls aged 15–19 years obtained family planning services from the private sector (38%) or pharmacy (32%) (21). A study conducted in Jordanian adolescents aged 12–18 years found that most of them did not know where to obtain family planning services or they believed that such services were only available for pregnant women (40). Syrian refugees living in camps also had limited knowledge about family planning services available for young people (23). Young people expressed concerns over privacy and confidentiality because of strict social norms governing the sexual behaviour of adolescents. In Zaatri camp, young Syrian women spoke about embarrassment in asking for condoms and feared being overheard by men (23). Jordanian young people are concerned about long waiting times, poorly staffed clinics and poor quality of care. They believe that providers do not take them seriously, do not know what information they need and view their questions as inappropriate (40). A study that included urban Syrian refugees between 12 and 24 years found that poor treatment by health care workers was one of the biggest disincentives to seeking reproductive health services (16).
Box 1: Lessons learnt and opportunities for interventions to improve family planning in young people in Jordan
Individual level
•Young people in Jordan are interested in sexual and reproductive health topics and are willing to be active participants in research and programmes. As noted in one document detailing the implementation of a reproductive health intervention targeting young people in Jordan, “the taboo nature of reproductive health topics was a concern for the project partner, [but] facilitators and program staff were surprised by the enthusiasm with which youth received the information” (32).
• Interventions that target young people before marriage, such as through premarital counselling, may help to shift attitudes towards family planning and male involvement (18). A young, unmarried Jordanian man indicated, “Of course, family planning concerns both partners and attending workshops on that issue must be compulsory, just like the mandatory pre-marriage blood test” (18). Targeted family planning education for young women and men in Syrian refugee camps could increase family planning uptake by alleviating cultural pressures regarding fertility (20).
Family and community levels
•Create a more accepting community environment among parents, community leaders and religious leaders to shift social norms about family planning and encourage young people to seek reproductive health services. Young people regard parents as trustworthy sources of reproductive health information; however, they may not be adequately equipped to effectively fulfil this role. Furthermore, the social expectations related to fertility, gender norms, and contraceptive use for young people in Jordan are reinforced through families, peers and social structures within communities. Interventions designed to support parents as gatekeepers may also be useful across the Middle East in improving reproductive health outcomes in young people (45).
•Entertainment-focused mass media may offer an effective platform through which to reach young people with information on family planning, especially birth spacing (42). Young people recommend the use of social media along with formal classes on issues related to reproductive health (18). Discussing birth spacing rather than family planning may be a more socially and culturally acceptable entry point with young people.
• Include men in sexual and reproductive health and rights information to encourage their positive and supportive participation in their partner’s health.
•Ensure that youth-friendly sexual and reproductive health services are available in communities. These services should be private, confidential and offer high-quality services specifically for young people. Offering a range of integrated and gender-segregated services may increase the acceptability of such centres.
Policy level
• Improve laws and policies on early marriage. The intersection between gender-based violence, low family planning uptake and early pregnancy in married adolescents suggests the need to improve enforcement of laws against early marriage and empower girls at risk of early marriage (14).
•Develop and approve a comprehensive sexual and reproductive health policy for young people (17,46) that includes measurable indicators to assess youth-friendly services and a robust monitoring and evaluation plan.
• Introduce mandatory comprehensive sexual education in schools, with a focus on puberty, gender-based violence, intimate relationships, family planning, and the importance of birth spacing and delayed first birth for women’s health (46,47).
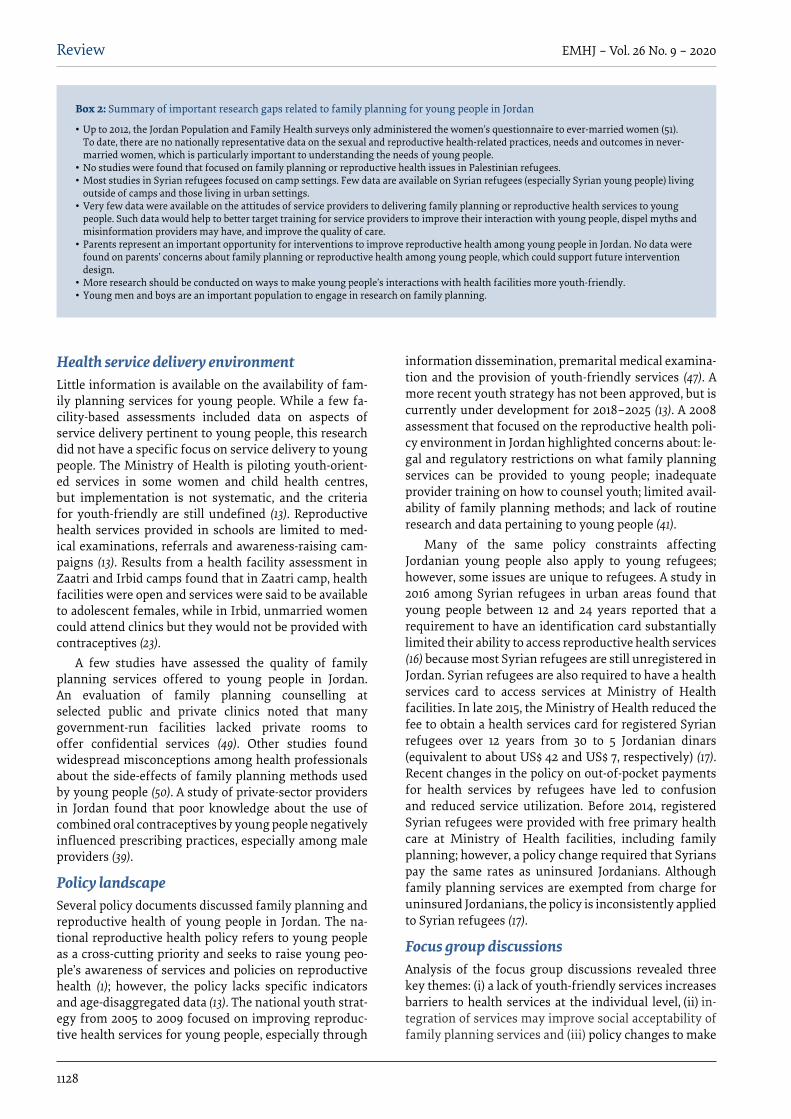
1128
Review EMHJ – Vol. 26 No. 9 – 2020
Box 2: Summary of important research gaps related to family planning for young people in Jordan
•Up to 2012, the Jordan Population and Family Health surveys only administered the women’s questionnaire to ever-married women (51). To date, there are no nationally representative data on the sexual and reproductive health-related practices, needs and outcomes in never-married women, which is particularly important to understanding the needs of young people.
•No studies were found that focused on family planning or reproductive health issues in Palestinian refugees. •Most studies in Syrian refugees focused on camp settings. Few data are available on Syrian refugees (especially Syrian young people) living
outside of camps and those living in urban settings.•Very few data were available on the attitudes of service providers to delivering family planning or reproductive health services to young
people. Such data would help to better target training for service providers to improve their interaction with young people, dispel myths and misinformation providers may have, and improve the quality of care.
•Parents represent an important opportunity for interventions to improve reproductive health among young people in Jordan. No data were found on parents’ concerns about family planning or reproductive health among young people, which could support future intervention design.
•More research should be conducted on ways to make young people’s interactions with health facilities more youth-friendly.•Young men and boys are an important population to engage in research on family planning.
Health service delivery environmentLittle information is available on the availability of fam-ily planning services for young people. While a few fa-cility-based assessments included data on aspects of service delivery pertinent to young people, this research did not have a specific focus on service delivery to young people. The Ministry of Health is piloting youth-orient-ed services in some women and child health centres, but implementation is not systematic, and the criteria for youth-friendly are still undefined (13). Reproductive health services provided in schools are limited to med-ical examinations, referrals and awareness-raising cam-paigns (13). Results from a health facility assessment in Zaatri and Irbid camps found that in Zaatri camp, health facilities were open and services were said to be available to adolescent females, while in Irbid, unmarried women could attend clinics but they would not be provided with contraceptives (23).
A few studies have assessed the quality of family planning services offered to young people in Jordan. An evaluation of family planning counselling at selected public and private clinics noted that many government-run facilities lacked private rooms to offer confidential services (49). Other studies found widespread misconceptions among health professionals about the side-effects of family planning methods used by young people (50). A study of private-sector providers in Jordan found that poor knowledge about the use of combined oral contraceptives by young people negatively influenced prescribing practices, especially among male providers (39).
Policy landscape Several policy documents discussed family planning and reproductive health of young people in Jordan. The na-tional reproductive health policy refers to young people as a cross-cutting priority and seeks to raise young peo-ple’s awareness of services and policies on reproductive health (1); however, the policy lacks specific indicators and age-disaggregated data (13). The national youth strat-egy from 2005 to 2009 focused on improving reproduc-tive health services for young people, especially through
information dissemination, premarital medical examina-tion and the provision of youth-friendly services (47). A more recent youth strategy has not been approved, but is currently under development for 2018–2025 (13). A 2008 assessment that focused on the reproductive health poli-cy environment in Jordan highlighted concerns about: le-gal and regulatory restrictions on what family planning services can be provided to young people; inadequate provider training on how to counsel youth; limited avail-ability of family planning methods; and lack of routine research and data pertaining to young people (41).
Many of the same policy constraints affecting Jordanian young people also apply to young refugees; however, some issues are unique to refugees. A study in 2016 among Syrian refugees in urban areas found that young people between 12 and 24 years reported that a requirement to have an identification card substantially limited their ability to access reproductive health services (16) because most Syrian refugees are still unregistered in Jordan. Syrian refugees are also required to have a health services card to access services at Ministry of Health facilities. In late 2015, the Ministry of Health reduced the fee to obtain a health services card for registered Syrian refugees over 12 years from 30 to 5 Jordanian dinars (equivalent to about US$ 42 and US$ 7, respectively) (17). Recent changes in the policy on out-of-pocket payments for health services by refugees have led to confusion and reduced service utilization. Before 2014, registered Syrian refugees were provided with free primary health care at Ministry of Health facilities, including family planning; however, a policy change required that Syrians pay the same rates as uninsured Jordanians. Although family planning services are exempted from charge for uninsured Jordanians, the policy is inconsistently applied to Syrian refugees (17).
Focus group discussionsAnalysis of the focus group discussions revealed three key themes: (i) a lack of youth-friendly services increases barriers to health services at the individual level, (ii) in-tegration of services may improve social acceptability of family planning services and (iii) policy changes to make
1129
Review EMHJ – Vol. 26 No. 9 – 2020
services more accessible for youth as well as the consist-ent implementation of policies are needed.
Theme 1: lack of youth-friendly services
During focus group discussions, stakeholders empha-sized that family planning for young people is a priority, especially to support married adolescents in delaying and spacing births. Stakeholders also agreed that the existing environment for delivery of reproductive health servic-es is not adequately youth-friendly. A participant from a nongovernmental organization indicated that in recent years there had been a shift away from the provision of youth-friendly services and identifying young people as specific target population for reproductive health servic-es at the policy level: “Ten years ago, there was a ‘youth sector’ that is not there anymore, and part of its [role] was to train health workers in providing youth friendly ser-vices.” A Jordanian government official mentioned that the lack of a youth-friendly environment for delivery of services led to low utilization of health services by young people: “When youth want to go to health centres to ac-quire information related to reproductive health, they shy away from asking due to the fact that we don’t have a friendly environment [for youth] within health centres, this could be a priority… for youth to feel more comfort-able”. Another Jordanian government official mentioned that the existing environment for delivery of services cre-ated even greater challenges for young men who want-ed to obtain reproductive health services: “Even though female youth are shy to go…we only see female youth attending maternity and family planning centres. Male youth are even less willing to attend these centres”.
Theme 2: integration of services
Several participants mentioned that the strong do-nor-driven emphasis on family planning had caused communities to equate family planning with a foreign agenda. For example, a representative from a United Na-tions agency mentioned that, “Unfortunately, when we say family planning they attack us on religious basis and say that there are external agendas being forced upon us”. Another participant representing an international donor agency added that, “[family planning programmes] first appeared under the name of birth limitation, and due to social and cultural customs, they have been doubted, refused, and looked at as foreign policies”. Participants suggested that beginning with less controversial repro-ductive health topics, such as women’s perinatal physical and mental health, before including more sensitive top-ics such as family planning, may be a better strategy than focusing on family planning alone, especially to build ac-ceptance of programmes targeting younger adolescents. However, a government representative mentioned, “we [should] start with 15 years olds about sexual education, psychological health, family planning, looking after women’s health even before marriage, and the same for males… It all must be in line with each other; you cannot focus on one topic and skip the other because people will attack the project… especially in rural areas”
In order to make family planning services more acceptable to communities, several participants described past success in integrating family planning into other programmes targeting young people. A participant from a local nongovernmental organization indicated that including reproductive health information into a life-skills programme made parents more supportive of the content: “We were afraid that parents wouldn’t allow their kids to come. Actually, it was the opposite. Parents were happy that someone was telling the truth to their children”. Participants also emphasized the importance of compulsory sexual education at the university level and integrating family planning into premarital counselling and preconception care; however, one nongovernmental organization participant mentioned that, “it’s [not] a very optimistic environment for sex education, and focusing on extracurricular activities may be a better strategy to reach more young people before compulsory programmes can be established”. Efforts to engage parents and build their capacity in discussing reproductive health information with their children was also discussed as a priority, given the cultural importance of parent–child relationships. A nongovernmental organization participant mentioned that, “mothers avoid answering their children’s questions as children or teenagers,” and there was agreement by participants that engaging adult figures in reproductive health topics was critical to overcoming the shame associated with reproductive health. As a representative from the Ministry of Youth said, “we need to build the capacity of parents, schools, teachers, and counsellors”.
Theme 3: policy change and consistent implementation
Stakeholders identified several policy-related challenges that make access to family planning services more diffi-cult for young people. A government official mentioned that, “there are laws and regulations…that forbid young people between the ages of 10 to 24 from accessing such information and services if not accompanied by a par-ent”. Furthermore, participants from nongovernmental organization indicted that an existing policy that prohib-its pregnant women from accessing reproductive servic-es without a marriage licence is problematic for women married outside the formal legal system. This situation is most common among refugees and adolescent girls, and results in these women becoming pregnant at an early age and not receiving adequate maternal care. In addi-tion, the confusion over the fee structure for reproduc-tive health services at government facilities for Syrian refugees was identified as an important barrier. In ad-dition, focus group participants indicated that there was currently an ongoing debate over another policy change to the fees charged for Syrian refugees accessing health services in the public sector.
Several policy-related opportunities to make services more youth-friendly were identified by focus group participants. One participant indicated that while the new reproductive health policy for young people is believed to include criteria for youth-friendly services, it had not yet been adopted. Furthermore, a national-level monitoring and evaluation plan needs to be implemented at the

1130
Review EMHJ – Vol. 26 No. 9 – 2020
same time to ensure that the services are being offered according to agreed standards and that their delivery is sustained. A participant from the government mentioned that while the recently-drafted, youth-friendly service guidelines are expected to be adopted, “Until now, we don’t have any national standards related to a youth-friendly health environment...and we need support from a strong national body… to sustain [them]”. Participants also emphasized the need for a strong, government-wide body to coordinate activities related to young people across sectors to ensure a unified approach and to maximize impact. While participants praised current efforts to build a platform to document, collect and disseminate past experiences and evidence from research and programmes that target young people in Jordan, they indicated that such efforts were still just starting.
DiscussionThe purpose of our review was to consolidate and syn-thesize the results and lessons learnt from research, programmes and policies targeting family planning in young people in Jordan at different ecological levels (in-dividual, family/community, service delivery and policy levels). Our results highlight several key lessons learnt and opportunities for interventions on family planning for young people in Jordan at the individual, service de-livery and policy levels. In addition, we identified several important research gaps on family planning in young people in Jordan that, if filled, could improve future, ev-idence-based interventions. A summary of these gaps is given in Box 2.
The results of our literature review and focus group discussions emphasize that young people in Jordan face many barriers to accessing reproductive health and family planning information and services. At the individual level, despite ongoing efforts, misinformation about family planning is widespread among young people and utilization of family planning services remains low. Furthermore, young people do not trust existing sources of information. The conservative social environment tends to cause young people to feel ashamed of accessing information related to reproductive health or family planning, so they have few resources they can rely on. To date, both programming and research focused on the unique needs of young people in Jordan have been limited. In particular, little information on the sexual behaviour of unmarried young people, especially young men, means that they are often overlooked in family planning programmes and policies, as the results of our literature review and focus group discussions indicate. As most existing research is based on relatively small sample sizes, larger studies that focus specifically on the reproductive health needs and behaviour of young people, including unmarried young people are needed to improve the evidence base on the family planning and reproductive health services needed by young people in Jordan. With changing demographics and normative shifts, more young people may engage in premarital sexual activity
in the future, thus emphasizing the need for research on the reproductive health needs and behaviour of young people. Recent trends in other Arab countries suggest that increases in the age of marriage may be coupled with increases in premarital sexual activity, although data are limited (52). Increased attention should be also paid to understanding and meeting the needs of Jordan’s most vulnerable young populations, including urban refugees and married adolescents, especially as these populations continue to grow. Research focused on these populations may be of regional significance and help other countries with large refugee populations to better serve young people.
At the service delivery level, data from the focus group discussions emphasized the need for reproductive health and family planning services to be more youth-friendly. However, the literature review provided very limited information on how young people interact with the service delivery environment, and few specific initiatives to address the needs of young people exist. Both the literature review and the focus group discussions highlighted that the gender-related social norms that limit male involvement in reproductive health and family planning issues, and the fact that reproductive health and family planning services are typically provided at maternity and family planning centres, combine to exclude young men from using such services. As suggested in the focus group discussions, in order to ensure that any expanded implementation of youth-friendly services adequately meets the needs of young people, more research is needed to: understand how young people themselves envision a youth-friendly service delivery environment; identify gaps in current services and how they are organized; and explore supply-side barriers to providing high-quality services for young people.
At the policy level, our results highlight the need for improved policies to better support the consistent provision of good-quality youth-friendly reproductive health and family planning services. Often, not only is there inconsistency in what reproductive health and family planning services are available to young people and under what conditions, but consistent awareness is lacking of what policies exist for young people. This is because our focus group participants were inconsistent in the policies that they described pertaining to parental permission and marriage requirements, and such policies were not discussed in the literature. Such inconsistency may contribute to the low rates of utilization of reproductive health and family planning services by young people in an environment where they are already apprehensive about seeking care. Changes in policy that affect service availability for Syrian refugees discussed in the literature and in the focus group discussions may be particularly hard on already vulnerable populations of married adolescents, especially as this population is thought to have the highest rate of child marriage.
To better support policies, improved monitoring and evaluation of services offered at facilities is needed

1131
Review EMHJ – Vol. 26 No. 9 – 2020
to ensure consistent implementation of standards. In addition, a more robust, nationwide, data collection platform is needed that includes age-disaggregated indicators relevant to the specific reproductive health needs of young people. The ongoing development of a national reproductive health strategy for young people signals important progress; however, the exclusion of the sexual and reproductive health of young people from previous national policy documents appears to reflect Jordan’s conservative cultural climate, and work in this area will likely continue to be contentious.
The results of our review should be considered in light of a few limitations. While every attempt was made to be exhaustive in the literature review, some studies or documents may have been unintentionally excluded in the analysis because they did not appear in the search results, or did not appear to have a youth-specific focus. This may be especially true with the grey literature search, as many organizations’ reports are unpublished. Furthermore, while the participants included in the focus group discussions represented a wide range of stakeholders, not all organizations were represented. Furthermore, as participants were representing their organizations, discussions may have been constrained
as they may not have wanted to appear too critical of governmental policy or their organization’s challenges. Nevertheless, the participants openly discussed critical areas for improvement within policies and programmes, which may indicate the reliability of the data. We were not able to draw any conclusions about differences in trends according to stakeholder type.
Our study provides a consolidated picture of the state of research, programmes and policies targeting family planning in Jordan for young people between 10 and 24 years since 2008. Future programmes should build on past evidence in order scale up promising interventions while exploring new areas for research and programmes based on local needs. Results from our study may be applicable across the Middle East, as many other countries are dealing with similar populations because of displacement, a conservative programmatic environment and policy-related challenges.
Funding: This work is part of the Sexual and Reproduc-tive Health Research Programme (project number W 08.560.012), which is financed by the WOTRO Science for Global Development of the Netherlands Organisation for Scientific Research.
Competing interests: None declared.
Analyse globale de la recherche, des programmes et des politiques de planification familiale ciblant les jeunes en Jordanie : évaluation des parties prenantes et revue systématiqueRésumé Contexte : Atteindre les jeunes mariés et non mariés en Jordanie en leur fournissant des informations et des services de planification familiale est une priorité, compte tenu notamment des importantes populations de réfugiés en Jordanie. À ce jour, la diffusion de la recherche en planification familiale et de l’expérience programmatique ciblant les jeunes en Jordanie a été limitée.Objectifs : La présente étude avait pour objectif de fournir des informations approfondies sur les programmes, la recherche et les politiques d’intervention en matière de planification familiale en Jordanie, centrés sur les jeunes âgés de 10 à 24 ans. Méthodes : Les données ont été recueillies par le biais des éléments suivants : un examen systématique de la littérature grise et examinée par des pairs concernant la santé génésique des jeunes ; et des discussions thématiques de groupe avec des parties prenantes de 18 organisations gouvernementales et non gouvernementales concernées.Résultats : L’examen de la littérature comprenait 37 documents produits depuis 2008, qui fournissent de l’information aux niveaux individuel, familial et communautaire, au sujet de la prestation des services et des politiques. Les jeunes Jordaniens ont une connaissance limitée des méthodes de planification familiale et des lieux où obtenir des services de planification familiale. On dispose de peu d’informations sur la disponibilité des services de planification familiale pour les jeunes. Plusieurs documents politiques examinent la planification familiale et de la santé génésique des jeunes en Jordanie. Les discussions thématiques de groupe ont permis de cerner les possibilités d’intégrer les services et de renforcer l’élaboration des politiques futures.Conclusions : Les résultats de la présente étude mettent en évidence les principaux enseignements tirés, les possibilités d’interventions et les lacunes de la recherche liés à la planification familiale chez les jeunes en Jordanie. Il convient d’accorder davantage d’attention à la compréhension et à la satisfaction des besoins des populations de jeunes les plus vulnérables de Jordanie, y compris les réfugiés urbains et les adolescents mariés, en particulier à mesure que ces populations continuent à croître. Les programmes futurs devront s’appuyer sur les données du passé et explorer de nouveaux domaines et interventions.

1132
Review EMHJ – Vol. 26 No. 9 – 2020
References1. Higher Population Council. National Reproductive Health/Family Planning Strategy 2013–2017. Amman: Higher Population
Council; 2013. (http://www.hpc.org.jo/sites/default/files/EN-National%20FP-RH%20Strategy%202013-2017.pdf, accessed 29 Febru-ary 2020).
2. Connelly M. Baseline study: Documenting knowledge attitudes and practices of Iraqi refugees and the status of family plan-ning services in UNHCRs operations in Amman, Jordan. New York, NY: UNHCR, Women’s Refugee Commission; 2011. (https://www.unhcr.org/protection/health/4e8c0c419/baseline-study-documenting-knowledge-attitudes-practices-iraqi-refugees.html, accessed 29 February 2020).
3. DeJong J, El-Khoury G. Reproductive health of Arab young people. BMJ. 2006;333(7573):849–51. https://doi.org/10.1136/bmj.38993.460197.68
4. Hikmat R. A study on child marriage in Jordan. Amman: Higher Population Council; 2017 (http://www.hpc.org.jo/sites/default/files/HPC%20Child%20Marriage%20Eng.pdf, accessed 29 February 2020).
5. Jordan Communication Advocacy and Policy Activity. Knowledge attitudes and practices toward family planning and repro-ductive health among married women of reproductive age in selected districts in Jordan. Amman: US Agency for International Development; 2015 (https://jordankmportal.com/resources/knowledge-attitudes-and-practices-toward-family-planning-and-re-productive-health-among-married-women-of-reproductive-age-in-selected-districts-in-jordan, accessed 29 February 2020).
6. Samari G. Syrian refugee women’s health in Lebanon, Turkey, and Jordan and recommendations for improved practice. World Med Health Policy. 2017;9(2):255–74. https://doi.org/10.1002/wmh3.231
7. Doocy S, Lyles E, Roberton T, Akhu-Zaheya L, Oweis A, Burnham G. Prevalence and care-seeking for chronic diseases among Syrian refugees in Jordan. BMC Public Health. 2015;15(1):1097. https://doi.org/10.1186/s12889-015-2429-3
8. Health access and utilization survey among non-camp refugees in Jordan final report. Geneva: UNHCR – The UN Refugee Agency; 2015 (https://data2.unhcr.org/en/documents/download/68539, accessed 29 February 2020).
9. Where we work. United Nations Relief and Works Agency for Palestine Refugees (UNRWA) [webpage] (https://www.unrwa.org/where-we-work/jordan, accessed 29 February 2020).
10. UNHCR Fact sheet. Jordan – February 2018. Geneva: UNHCR – The UN Refugee Agency; 2018 (https://data2.unhcr.org/en/docu-ments/download/62241, accessed 29 February 2020).
11. McLeroy KR, Bibeau D, Steckler A, Glanz K. An ecological perspective on health promotion programs. Health Educ Behav. 1988;15(4):351–77. https://doi.org/10.1177/109019818801500401
حتليل املشهد الواقعي لبحوث تنظيم األرسة وبراجمه وسياساته التي تستهدف الشباب يف األردن: تقييم أصحاب املصلحة واالستعراض املنهجي
جويل جوسامن، أريج عثامن، عبري دبابنة، إقبال محد، ميسون دبوب، إنصاف دعاس، أنا النجر
اخلالصةاخللفية: يعد الوصول إىل الشباب املتزوجني وغري املتزوجني يف األردن من خالل املعلومات واخلدمات املتعلقة بتنظيم األرسة أولوية، ال سيام بالنظر إىل العدد الكبري من الالجئني يف األردن. وحتى اآلن، كان نرش البحوث املتعلقة بتنظيم األرسة واخلربة الربناجمية التي تستهدف الشباب يف األردن
حمدودا.األهداف: هدفت هذه الدراسة إىل توفري معلومات متعمقة حول برامج التدخل يف جمال تنظيم األرسة والبحوث والسياسات يف األردن التي تركز
عىل الشباب الذين ترتاوح أعامرهم بني 10 و 24 سنة.بالصحة املتعلقة الرسمية غري واألدبيات األقران يراجعها التي للمؤلفات منهجي استعراض ييل: ما خالل من البيانات مجعت البحث: طرق
اإلنجابية للشباب؛ ومناقشات جمموعات الرتكيز مع أصحاب املصلحة من 18 منظمة حكومية وغري حكومية ذات صلة.شمل استعراض املؤلفات 37 وثيقة صدرت منذ عام 2008، وهي تقدم معلومات عىل مستوى الفرد واألرسة/واملجتمع املحيل وعىل النتائج: تنظيم وأين حيصلون عىل خدمات تنظيم األرسة بأساليب لدهيم معرفة حمدودة األردن الشباب يف والسياسات. وكان اخلدمات تقديم مستوى األرسة. وال تتوفر سوى معلومات قليلة عن توافر خدمات تنظيم األرسة للشباب. وناقشت العديد من الوثائق السياسية موضوع األرسة والصحة
اإلنجابية للشباب يف األردن. وحددت مناقشات جمموعات الرتكيز الفرص املتاحة إلدماج اخلدمات وتعزيز وضع السياسات يف املستقبل.االستنتاجات: تربز نتائج هذه الدراسة الدروس الرئيسية املستفادة، وفرص التدخل والثغرات البحثية املتعلقة بتنظيم األرسة بني الشباب يف األردن. احلرضيون الالجئون ذلك يف بام األردن، يف الشباب فئة من ضعفا األشد للسكان وتلبيتها االحتياجات لفهم االهتامم من املزيد إيالء وينبغي واملراهقون املتزوجون، ال سيام مع استمرار نمو هؤالء السكان. وينبغي أن تستند الربامج املقبلة إىل األدلة السابقة وأن تستكشف جماالت وتدخالت
جديدة.

1133
Review EMHJ – Vol. 26 No. 9 – 2020
12. Akour A, Bardaweel S, Awwad O, Al-Muhaissen S, Hussein R. Impact of a pharmacist-provided information booklet on knowl-edge and attitudes towards oral contraception among Jordanian women: an interventional study. Eur J Contracept Reprod Health Care. 2017;22(6):459–64. https://doi.org/10.1080/13625187.2017.1412425
13. OECD Development Centre. Youth well-being policy review of Jordan. Paris: European Union/Organisation for Economic Co-op-eration and Development Youth Inclusion Project; 2018 (https://data2.unhcr.org/en/documents/download/69257, accessed 29 February 2020).
14. Clark CJ, Spencer RA, Khalaf IA, Gilbert L, El-Bassel N, Silverman JG, et al. The influence of family violence and child marriage on unmet need for family planning in Jordan. J Fam Plann Reprod Health Care. 2016;43(2):105–12. https://doi.org/10.1136/jf-prhc-2014-101122
15. Spindler E, Bitar N, Solo J, Menstell E, Shattuck D. Jordan’s 2002 to 2012 fertility stall and parallel USAID investments in family planning: lessons from an assessment to guide future programming. Glob Health Sci Pract 2017;5(4):617–29. https://doi.org/10.9745/GHSP-D-17-00191
16. Reproductive health services for Syrians living outside of camps in Jordan. Amman: Higher Population Council; 2016 (http://www.hpc.org.jo/sites/default/files/Reproductive%20Health%20Services%20for%20Syrians%20Living%20Outside%20Camps%20in%20Jordan.pdf, accessed 28 March 2020).
17. Jordan Communication Advocacy and Policy Activity. Family planning among Syrian refugees living in Jordan. Amman: US Agency for International Development; 2016 (https://jordankmportal.com/resources/family-planning-among-syrian-refu-gees-in-jordan, accessed 29 February 2020).
18. Jordan Communication Advocacy and Policy Activity. Exploring gender norms and family planning in Jordan: a qualitative study. Amman: US Agency for International Development; 2016 (https://jordankmportal.com/resources/exploring-gen-der-norms-and-family-planning-in-jordan, accessed 29 February 2020).
19. Jordan Evidence-Based Medicine/Reproductive Health Group. The best evidence on family planning methods and practices. Jor-dan Pharmacists Association; 2015 (http://pop.jpa.org.jo/news/best-evidence-family-planning-methods-and-practices, accessed 7 November 2018).
20. West L, Isotta-Day H, Ba-Break M, Morgan R.Factors in use of family planning services by Syrian women in a refugee camp in Jordan. J Fam Plann Reprod Health Care. 2016;73(2):96–102. https://doi.org/10.1136/jfprhc-2014-101026
21. Adolescent contraceptive use: data from the Jordan population and family health survey (JPFHS), 2012. Geneva: World Health Organization; 2016 (https://www.rhsupplies.org/uploads/tx_rhscpublications/Hashemite_Kingfom_of_Jordan_-_Adolescent_contraceptive_use__data_from_2012_.pdf, accessed 28 March 2020).
22. Underwood CR, Kamhawi SS. Friday sermons, family planning and gender equity attitudes and actions: Evidence from Jordan. J Public Health. 2015;37(4):641–8. https://doi.org/10.1093/pubmed/fdu090
23. Krause S, Williams H, Onyango MA, Sami S, Doedens W, Giga N, et al. Reproductive health services for Syrian refugees in Zaatri refugee camp and Irbid City Jordan: an evaluation of the minimum initial service package. Confl Health. 2015;9(Suppl 1):S4. https://doi.org/10.1186/1752-1505-9-S1-S4
24. Kamhawi S, Underwood C, Murad H, Jabre B. Client-centered counseling improves client satisfaction with family planning visits: evidence from Irbid, Jordan. Glob Health Sci Pract. 2013;1(2):180–92. https://doi.org/10.9745/GHSP-D-12-00051
25. O’Hara K, Tsai L. C, Carlson CE, Haidar YM. Experiences of intimate-partner violence and contraception use among ever-mar-ried women in Jordan. East Mediterr Health J. 2013;19(10):876–82.
26. Underwood C, Kamhawi S, Nofal A. Religious leaders gain ground in the Jordanian family planning movement. Int J Gynecol Obstet. 2013;123(Suppl 1):e33–7. https://doi.org/10.1016/j.ijgo.2013.07.006
27. Cetorelli V, Leone T. Is fertility stalling in Jordan? Demogr Res. 2012;26:293–318. https://doi.org/10.4054/DemRes.2012.26.13
28. Hamza SM. Long acting hormonal contraceptives: without them, Jordan will not meet the population development goals. Int J Gynecol Obstet. 2012;119(S3):S364. https://doi.org/10.1016/S0020-7292(12)60725-5
29. Jordan Health Communication Partnership. Evaluation of the Arab women speak out (AWSO) initiative – 2nd Tier (Phase I) – in Irbid Governorate, Jordan, 2011. Baltimore, MD: Johns Hopkins Bloomberg School of Public Health Center for Communication Programs, JHUCCP, 2012.
30. Jordan Health Communication Partnership. Evaluation of the Arab women speak out (AWSO) initiative – 2nd Tier (Phase II) – in Irbid Governorate, Jordan, 2012. Baltimore, MD: Johns Hopkins Bloomberg School of Public Health Center for Communication Programs; 2012.
31. Jordan Health Communication Partnership. Evaluation of the “hayati ahla” film in the Civil Status and Passports Department (CSPD) Offices Jordan 2012. Baltimore, MD: Johns Hopkins Bloomberg School of Public Health Center for Communication Programs; 2012.
32. Lilleston P. Planning for life phase 2: evaluation report. Baltimore, MD: International Youth Foundation; 2012 (https://pdf.usaid.gov/pdf_docs/PDACU513.pdf, accessed 29 February 2020).
33. Shakhatreh FMN. Family planning in women of childbearing age in disadvantaged south Jordan. Eur J Contracept Reprod Health Care. 2012;17(Suppl 1): S72. https://doi.org/10.3109/13625187.2012.673963
34. Jordan Health Communication Partnership. Evaluation of the consult and choose initiative in Zarqa Governorate, Jordan – 2011. Baltimore, MD: Johns Hopkins Bloomberg School of Public Health Center for Communication Programs; 2011.

1134
Review EMHJ – Vol. 26 No. 9 – 2020
35. Jordan Health Communication Partnership. Evaluation of the Arab women speak out (AWSO) initiative in Irbid Governorate. Baltimore, MD: Johns Hopkins Bloomberg School of Public Health Center for Communication Programs; 2011.
36. Jordan Health Communication Partnership. Evaluation of the consult and choose initiative in Irbid Governorate, Jordan – 2011. Baltimore, MD: Johns Hopkins Bloomberg School of Public Health Center for Communication Programs; 2011.
37. Jordan Health Communication Partnership. Evaluation of the Arab women speak out (AWSO) initiative in Zarqa Governorate, Jordan, 2009–2010. Baltimore, MD: Johns Hopkins Bloomberg School of Public Health Center for Communication Programs; 2011.
38. Jordan Health Communication Partnership. Evaluation of the “mabrouk II: you’ve become a mother and a father” initiative. Baltimore, MD: Johns Hopkins Bloomberg School of Public Health Center for Communication Programs; 2010.
39. Al-Awaki N. Private sector project for women’s health evaluation report: evidence-based medicine (EBM) for family planning program. Amman: US Agency for International Development; 2010 (https://www.shopsplusproject.org/sites/default/files/re-sources/12%20PSP-Jordan%20Evaluation%20Report%2C%20EBM%20Approach%2C%20Dec.%2020https://doi.org/10.pdf, accessed 29 February 2020).
40. Khalaf I, Moghli FA, Froelicher ES. youth‐friendly reproductive health services in Jordan from the perspective of the youth: a descriptive qualitative study. Scand J Caring Sci. 2010;24(2):321–31. https://doi.org/10.1111/j.1471-6712.2009.00723.x
41. Abel E. Jordan’s reproductive health policy environment score: measuring the degree to which the policy environment in Jordan supports effective policies and programs for reproductive health. Amman: US Agency for International Development; 2009 (http://www.healthpolicyplus.com/archive/ns/pubs/hpi/834_1_Jordan_PES_2008_FINAL_acc.pdf, accessed 29 February 2020).
42. Health Communication Partnership. Motivating healthy timing and spacing of pregnancies – lessons from the field. Baltimore, MD: Johns Hopkins Bloomberg School of Public Health/ Center for Communication Programs; 2008. (https://pdfs.semantic-scholar.org/f6e5/300b1a9f764fc276789c53d69750a648aa82.pdf; accessed 6 April 2020).
43. Jurdi R. Unintended pregnancies remain high in Jordan. Washington, DC: Population Reference Bureau; 2008 (https://u.demog.berkeley.edu/~jrw/Biblio/Eprints/PRB/files/MENAWorkingPaper1.pdf, accessed 28 March 2020).
44. Khalaf IA, Abu-Moghli F, Callister LC, Rasheed R. Jordanian women’s experiences with the use of traditional family planning. Health Care Women Int. 2008;29(5):527–38. https://doi.org/10.1080/07399330801949632
45. DeJong J, Shepard B, Roudi-Fahimi F, Ashford L. Young people’s sexual and reproductive health in the Middle East and North Africa. Washington, DC: Population Reference Bureau; 2007 (https://www.researchgate.net/publication/237641810_Young_peo-ple’s_sexual_and_reproductive_health_in_the_Middle_East_and_North_Africa, accessed 28 March 2020).
46. Committee on the Rights of the Child. Concluding observations on the consolidated fourth and fifth periodic reports of Jordan. New York, NY: United Nations Convention of on the Rights of the Child; 2014 (CRC/C/JOR/CO/4-5; https://undocs.org/en/CRC/C/JOR/CO/4-5, accessed 29 February 2020).
47. Policies, legislation and strategies related to family planning in Jordan: review and recommendations. Amman: Jordan Com-munication Advocacy and Policy; 2015. (http://www.tawasol-jo.org/sites/default/files/policies_legistlations_and_stratgies_relat-ed_to_family_planning_in_jordan_review_and_recommendations.pdf, accessed 17 February 2019).
48. Sinha R, Goyal N, Sirois A, Valeeva N, Doocy S. Family planning in displaced populations: an unmet need among Iraqis in Am-man, Jordan. Am J Disaster Med. 2008;3(5):295–300.
49. Okour AM, Saadeh RA, Zaqoul M. Evaluation of family planning counselling in north Jordan. Sultan Qaboos Univ Med J. 2017;17(4):e436–43. https://doi.org/10.18295/squmj.2017.17.04.010
50. El-Khoury MT, Rebecca; Chatterji, Minki; Choi, Soon Kyu. Effectiveness of evidence-based medicine on knowledge, attitudes, and practices of family planning providers: a randomized experiment in Jordan. BMC Health Serv Res. 2015;15(1):449. https://doi.org/10.1186/s12913-015-1101-z
51. Department of Statistics [Jordan] and ICF International. Jordan Population and Family Health Survey 2012. Calverton (MD): Department of Statistics and ICF International; 2013 (https://dhsprogram.com/pubs/pdf/FR282/FR282.pdf, accessed 29 February 2020).
52. Obermeyer CM, Bott S, Sassine AJ. Arab adolescents: health, gender, and social context. J Adolesc Health. 2015;57(3):252–62. https://doi.org/10.1016/j.jadohealth.2015.01.002

1135
Report EMHJ – Vol. 26 No. 9 – 2020
Mobile-aided diagnosis systems are the future of health careDonia Ben Hassen1
1Higher School of Digital Economy, University of Manouba, Tunisia (Correspondence to: D. Ben Hassen: [email protected])
AbstractTechnology has been a driving force in changing the routine duties of physicians. Advances in mobile technologies have given rise to a new term: mHealth (mobile Health). mHealth devices generate big data and integration of mHealth and big data into existing eHealth services, and the continued growth in coverage of mobile cellular networks are new opportuni-ties. This paper provides an overview on mHealth growth and the benefits of its combination with big data analysis for various purposes of health care. We outline our proposed framework for mobile-aided diagnostic systems. We also discuss the opportunities and challenges of mHealth in aiding diagnosis through mobile technologies.Keywords: big data, health care, mHealth, mobile-aided diagnostic systemsCitation: Ben Hassen D. Mobile-aided diagnosis systems are the future of health care. East Mediterr Health J. 2020;26(9):1135-1140 https://doi.org/10.26719/emhj.20.042Received: 23/02/19; accepted: 23/09/19Copyright © World Health Organization (WHO) 2020. Open Access. Some rights reserved. This work is available under the CC BY-NC-SA 3.0 IGO license (https://creativecommons.org/licenses/by-nc-sa/3.0/igo)
IntroductionSeveral terms such as telemedicine, telehealth, eHealth (electronic health) have been used to refer to the use of information technology to support health service deliv-ery and health systems. Transition of these terms to a new term mHealth (mobile health) has become evident in the literature due to the unprecedented spread of mo-bile technologies as well as advances in their innovative application. As reported by the World Health Organiza-tion, mobile health (mHealth) is a subset of eHealth and is defined as the use of mobile wireless technologies for health. More recently, the term digital health was intro-duced as a broad umbrella term encompassing eHealth (which includes mHealth), as well as emerging areas, such as the use of advanced computing sciences in big data, genomics and artificial intelligence (1). The greater personal access to smartphones worldwide was the mo-tivation behind the development of the mHealth field. This new field has emerged in recent years and offers the ability of remote individuals to participate in health care, which may not have been possible in the past.
The most common application of mHealth is the use of mobile phones and communication devices to educate consumers about preventive healthcare services. However, mHealth is also used for chronic disease management and to aid diagnosis of complex diseases (2). Hence, mHealth devices generate a large amount of data and in order to obtain the maximum benefit from mHealth data, emerging big data technologies can be used. Analysis of big data in aggregate form at different stages has potential in various purposes.
This paper is organized as follows: after commenting on the benefits of using mHealth in decision-making, we describe the contribution of mobile health and big data in various aspects of healthcare services. We then presents computerized schemes for our proposed system, and
finally, we discuss the opportunities and challenges, as well as the directions for future research in this field.
mHealth overviewFrom text reminders to virtual clinic visits, the prolifera-tion of mobile health apps has greatly improved patient outcomes as well as the overall quality of healthcare pro-vided (3). Tens of thousands of mobile health apps are now available for downloading from online stores. These apps enable clinicians to save time by allowing them to access patient information more efficiently (4). Besides, they allows patients particularly with chronic diseases to prevent complications and obtain alarms in abnormal situations that can be viewed by doctors in real time (5). A recent report by the Mobile Health Market notes that 80% of physicians use smartphones and medical apps as healthcare tools and innovative platforms for doctor/pa-tient interaction (6).
Smartphones are the most commonly used mobile devices in our daily life. They are the most prominent platforms for mHealth applications. mHealth apps can perform a variety of functions related to self-monitoring such as weight management, activity levels and smoking cessation by tracking personal data including daily calorie intake, heart rate, glucose level and even brain activity. Thus, healthcare providers can keep patients under continuous observation and detect the symptoms at an early stage to treat them more effectively.
Therefore, many studies have evaluated the effect of mobile health apps on the experience of patients and physicians. mHealth is already being applied and tested in diverse health contexts, such as Parkinson’s disease and maternal and child health (7), and diabetes is the most investigated condition (8,9). The popularity of mobile health for management of diabetes is growing. The Community Preventive Services Task Force
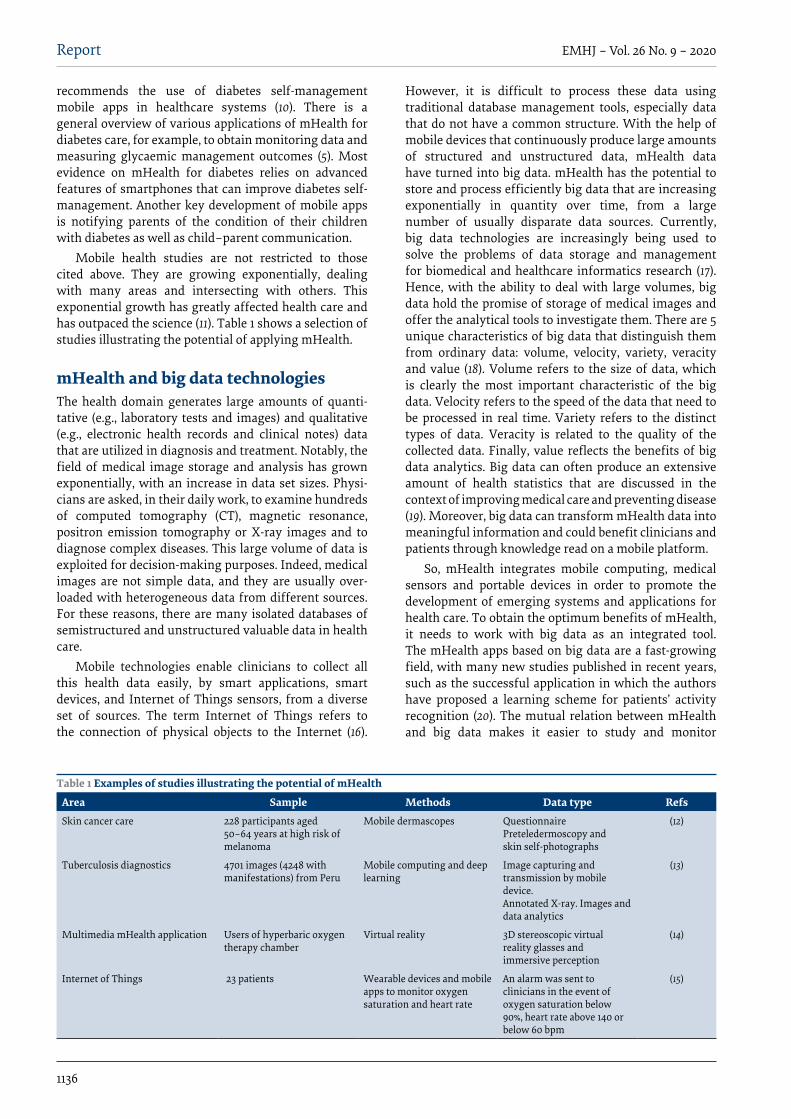
1136
Report EMHJ – Vol. 26 No. 9 – 2020
recommends the use of diabetes self-management mobile apps in healthcare systems (10). There is a general overview of various applications of mHealth for diabetes care, for example, to obtain monitoring data and measuring glycaemic management outcomes (5). Most evidence on mHealth for diabetes relies on advanced features of smartphones that can improve diabetes self-management. Another key development of mobile apps is notifying parents of the condition of their children with diabetes as well as child–parent communication.
Mobile health studies are not restricted to those cited above. They are growing exponentially, dealing with many areas and intersecting with others. This exponential growth has greatly affected health care and has outpaced the science (11). Table 1 shows a selection of studies illustrating the potential of applying mHealth.
mHealth and big data technologiesThe health domain generates large amounts of quanti-tative (e.g., laboratory tests and images) and qualitative (e.g., electronic health records and clinical notes) data that are utilized in diagnosis and treatment. Notably, the field of medical image storage and analysis has grown exponentially, with an increase in data set sizes. Physi-cians are asked, in their daily work, to examine hundreds of computed tomography (CT), magnetic resonance, positron emission tomography or X-ray images and to diagnose complex diseases. This large volume of data is exploited for decision-making purposes. Indeed, medical images are not simple data, and they are usually over-loaded with heterogeneous data from different sources. For these reasons, there are many isolated databases of semistructured and unstructured valuable data in health care.
Mobile technologies enable clinicians to collect all this health data easily, by smart applications, smart devices, and Internet of Things sensors, from a diverse set of sources. The term Internet of Things refers to the connection of physical objects to the Internet (16).
However, it is difficult to process these data using traditional database management tools, especially data that do not have a common structure. With the help of mobile devices that continuously produce large amounts of structured and unstructured data, mHealth data have turned into big data. mHealth has the potential to store and process efficiently big data that are increasing exponentially in quantity over time, from a large number of usually disparate data sources. Currently, big data technologies are increasingly being used to solve the problems of data storage and management for biomedical and healthcare informatics research (17). Hence, with the ability to deal with large volumes, big data hold the promise of storage of medical images and offer the analytical tools to investigate them. There are 5 unique characteristics of big data that distinguish them from ordinary data: volume, velocity, variety, veracity and value (18). Volume refers to the size of data, which is clearly the most important characteristic of the big data. Velocity refers to the speed of the data that need to be processed in real time. Variety refers to the distinct types of data. Veracity is related to the quality of the collected data. Finally, value reflects the benefits of big data analytics. Big data can often produce an extensive amount of health statistics that are discussed in the context of improving medical care and preventing disease (19). Moreover, big data can transform mHealth data into meaningful information and could benefit clinicians and patients through knowledge read on a mobile platform.
So, mHealth integrates mobile computing, medical sensors and portable devices in order to promote the development of emerging systems and applications for health care. To obtain the optimum benefits of mHealth, it needs to work with big data as an integrated tool. The mHealth apps based on big data are a fast-growing field, with many new studies published in recent years, such as the successful application in which the authors have proposed a learning scheme for patients’ activity recognition (20). The mutual relation between mHealth and big data makes it easier to study and monitor
Table 1 Examples of studies illustrating the potential of mHealth
Area Sample Methods Data type RefsSkin cancer care 228 participants aged
50–64 years at high risk of melanoma
Mobile dermascopes Questionnaire Preteledermoscopy andskin self-photographs
(12)
Tuberculosis diagnostics 4701 images (4248 with manifestations) from Peru
Mobile computing and deep learning
Image capturing and transmission by mobile device. Annotated X-ray. Images and data analytics
(13)
Multimedia mHealth application Users of hyperbaric oxygen therapy chamber
Virtual reality 3D stereoscopic virtual reality glasses and immersive perception
(14)
Internet of Things 23 patients Wearable devices and mobile apps to monitor oxygen saturation and heart rate
An alarm was sent to clinicians in the event of oxygen saturation below 90%, heart rate above 140 or below 60 bpm
(15)
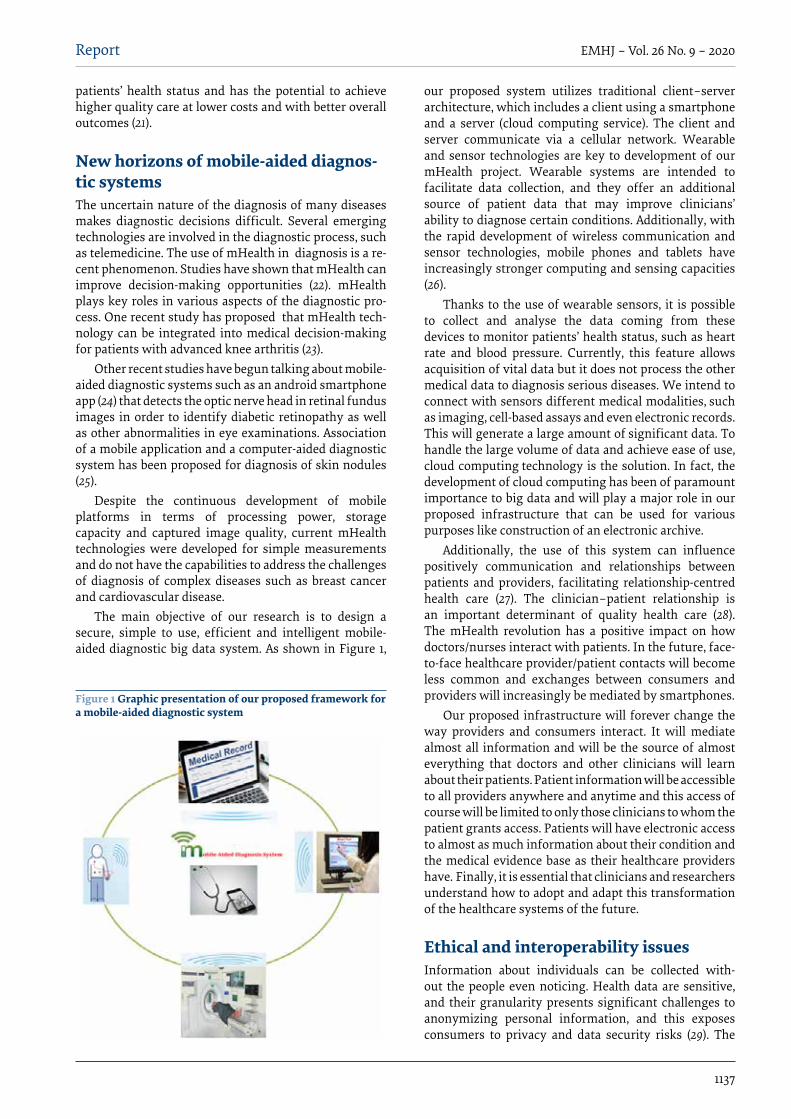
1137
Report EMHJ – Vol. 26 No. 9 – 2020
patients’ health status and has the potential to achieve higher quality care at lower costs and with better overall outcomes (21).
New horizons of mobile-aided diagnos-tic systemsThe uncertain nature of the diagnosis of many diseases makes diagnostic decisions difficult. Several emerging technologies are involved in the diagnostic process, such as telemedicine. The use of mHealth in diagnosis is a re-cent phenomenon. Studies have shown that mHealth can improve decision-making opportunities (22). mHealth plays key roles in various aspects of the diagnostic pro-cess. One recent study has proposed that mHealth tech-nology can be integrated into medical decision-making for patients with advanced knee arthritis (23).
Other recent studies have begun talking about mobile-aided diagnostic systems such as an android smartphone app (24) that detects the optic nerve head in retinal fundus images in order to identify diabetic retinopathy as well as other abnormalities in eye examinations. Association of a mobile application and a computer-aided diagnostic system has been proposed for diagnosis of skin nodules (25).
Despite the continuous development of mobile platforms in terms of processing power, storage capacity and captured image quality, current mHealth technologies were developed for simple measurements and do not have the capabilities to address the challenges of diagnosis of complex diseases such as breast cancer and cardiovascular disease.
The main objective of our research is to design a secure, simple to use, efficient and intelligent mobile-aided diagnostic big data system. As shown in Figure 1,
our proposed system utilizes traditional client–server architecture, which includes a client using a smartphone and a server (cloud computing service). The client and server communicate via a cellular network. Wearable and sensor technologies are key to development of our mHealth project. Wearable systems are intended to facilitate data collection, and they offer an additional source of patient data that may improve clinicians’ ability to diagnose certain conditions. Additionally, with the rapid development of wireless communication and sensor technologies, mobile phones and tablets have increasingly stronger computing and sensing capacities (26).
Thanks to the use of wearable sensors, it is possible to collect and analyse the data coming from these devices to monitor patients’ health status, such as heart rate and blood pressure. Currently, this feature allows acquisition of vital data but it does not process the other medical data to diagnosis serious diseases. We intend to connect with sensors different medical modalities, such as imaging, cell-based assays and even electronic records. This will generate a large amount of significant data. To handle the large volume of data and achieve ease of use, cloud computing technology is the solution. In fact, the development of cloud computing has been of paramount importance to big data and will play a major role in our proposed infrastructure that can be used for various purposes like construction of an electronic archive.
Additionally, the use of this system can influence positively communication and relationships between patients and providers, facilitating relationship-centred health care (27). The clinician–patient relationship is an important determinant of quality health care (28). The mHealth revolution has a positive impact on how doctors/nurses interact with patients. In the future, face-to-face healthcare provider/patient contacts will become less common and exchanges between consumers and providers will increasingly be mediated by smartphones.
Our proposed infrastructure will forever change the way providers and consumers interact. It will mediate almost all information and will be the source of almost everything that doctors and other clinicians will learn about their patients. Patient information will be accessible to all providers anywhere and anytime and this access of course will be limited to only those clinicians to whom the patient grants access. Patients will have electronic access to almost as much information about their condition and the medical evidence base as their healthcare providers have. Finally, it is essential that clinicians and researchers understand how to adopt and adapt this transformation of the healthcare systems of the future.
Ethical and interoperability issuesInformation about individuals can be collected with-out the people even noticing. Health data are sensitive, and their granularity presents significant challenges to anonymizing personal information, and this exposes consumers to privacy and data security risks (29). The
16
<caption>Figure 1. Graphic presentation of our proposed framework for a mobile-aided
diagnostic system
Figure 1 Graphic presentation of our proposed framework for a mobile-aided diagnostic system

1138
Report EMHJ – Vol. 26 No. 9 – 2020
ethical requirement is to keep sensitive and identifia-ble information confidential. With the growth mHealth technologies, healthcare professionals have encountered an emerging new set of ethical issues relating to privacy (30). The classical medical ethics principles of autonomy, beneficence, nonmaleficence and justice can be used to address ethical dimensions of mHealth application de-sign. User autonomy is the issue of trust to the service that is offered and its provider. Beneficence obligates the healthcare professional to promote good and provide as-sistance to others. Nonmaleficence is the principle that one should do no harm. Justice requires that all people be treated fairly and equally (30). Health technology should be safe and secure and its applications should not violate privacy and trust. Therefore, protection of patient data has always been a principal concern within the eHealth field. The evolution of technology to mobile health plat-forms has made the issue more complex. Certainly the use of mobile devices has raised new concerns for data privacy and security. With many things being connect-ed, new security and privacy problems arise, for example, confidentiality, authenticity and integrity of data sensed and exchanged.
Problems of data security in mHealth have been tackled by numerous researchers. Many studies have used standards to ensure the security and privacy of their mobile apps, such as an app that utilizes data encrypted using Secure Shell (31). However, the lack of specific strategies and mechanisms to ensure adequate security and privacy to maximize the full capabilities of mobile devices presents a significant barrier to care. The interoperability problem, in a Wi-Fi-based environment, could be solved through many traditional methods such as a Wi-Fi/Bluetooth gateway or by using Web services. The health data are transmitted in plain text using the JSON format, which represents a security weakness because it allows eavesdropping during the connection.
Discussion and conclusionmHealth combined with big data is fast becoming a new prospect in the world of health and has potential benefits.
This new field refers to electronic health data so large and complex that they are difficult to manage with tradition-al software and computing algorithms. With more com-puting power and high-quality imaging, it will be benefi-cial if doctors receive on their smartphones patient files, CT scans and blood test results. Furthermore, intelligent mobile apps can help with diagnosis. This revolution in mobile-aided diagnostic systems will offer opportunities to manage complex diseases and save time and money. Mobile-aided diagnostic systems are predicted to influ-ence profoundly the future of health care. Although these systems are opening a new generation of innovation ap-plications, several challenges exist.
We think that the main challenge in developing mHealth technologies for complex diseases is the medical infrastructure, especially in low-resource countries. Another challenge is to bring this innovation to clinics and introduce the new equipment to medical staff.
Furthermore, there is a need to improve its usability and security. The impact of mHealth on the work of nurses and physicians must be also analysed. By giving doctors real-time statistics, mobile-aided diagnostic systems could improve population health and reduce healthcare costs. Mobile-aided diagnostic systems have a potentially role to play in preventing disease. They can allow the discovery of relationships between disease and lifestyle or the environment. This helps people to successfully modify their risk behaviours.
Finally, creative use of mHealth, such as mobile-aided diagnostic systems, has the potential to reduce the cost of health care and improve well-being in numerous ways. These applications are making health services more efficient and sustainable, but rigorous research is needed to examine the potential, as well as the challenges, of utilizing mobile technologies to improve health outcomes.
Funding: None.
Competing interests: None declared.

1139
Report EMHJ – Vol. 26 No. 9 – 2020
نظم التشخيص باستخدام األجهزة املحمولة: مستقبل الرعاية الصحيةدنيا بن حسن
اخلالصةظلت التكنولوجيا تثل القوة الدافعة يف تغيري طبيعة املهام الروتينية لألطباء. وقد ساهم التقدم يف تكنولوجيا األجهزة املحمولة يف ظهور مصطلح جديد، أال وهو mHealth أو استخدام تكنولوجيا األجهزة املحمولة يف جمال الصحة. ويساعد استخدام تكنولوجيا األجهزة املحمولة يف جمال الصحة يف توليد بيانات ضخمة ودجمها يف خدمات الصحة اإللكرتونية املوجودة، كام يمثل استمرار نمو التغطية بشبكات اهلاتف املحمول فرصا الضخمة البيانات وحتليل ذلك بني اجلمع وفوائد الصحة جمال يف املحمولة األجهزة تكنولوجيا استخدام نمو الورقة هذه وتستعرض جديدة. ألغراض متعددة خاصة بالرعاية الصحية. كام نطرح من خالهلا إطار العمل املقرتح لنظم التشخيص باستخدام األجهزة املحمولة. ونناقش أيضا
الفرص والتحديات املاثلة أمام استخدام تكنولوجيا األجهزة املحمولة يف جمال الصحة للمساعدة يف التشخيص.
Les systèmes de diagnostic assistés par téléphone portable : l’avenir des soins de santéRésuméLa technologie est génératrice de changements dans les tâches courantes des médecins. Les progrès en matière de technologies mobiles ont donné naissance à un nouveau terme : la santé mobile. Les dispositifs de santé mobile génèrent des mégadonnées (« big data ») ; l’intégration de la santé mobile et des mégadonnées dans les services déjà existants de cybersanté, ainsi que le développement constant de la couverture par les réseaux de téléphonie mobile, ouvrent de nouvelles perspectives. Le présent article fournit une vue d’ensemble du développement de la santé mobile et des avantages de son association avec l’analyse des mégadonnées pour de nombreuses applications des soins de santé. Nous présentons une proposition de cadre pour les systèmes de diagnostic assistés par téléphone portable. Nous examinons également les perspectives et les enjeux de la santé mobile en matière d’aide au diagnostic par les technologies mobiles.
References1 WHO guideline: recommendations on digital interventions for health system strengthening. Geneva: World Health Organ-
ization; 2019 (https://www.who.int/reproductivehealth/publications/digital-interventions-health-system-strengthening/en/, accessed 1 April 2020).
2 Miller AS, Cafazzo JA, Seto E. A game plan: gamification design principles in mHealth applications for chronic disease manage-ment. Health Informatics J. 2016 Jun;22(2):184–93. http://dx.doi.org/10.1177/1460458214537511 PMID:24986104
3 Slovensky DJ, Malvey DM, Neigel AR. A model for mHealth skills training for clinicians: meeting the future now. Mhealth. 2017 Jun 15;3:24. http://dx.doi.org/10.21037/mhealth.2017.05.03 PMID:28736733
4 Marent B, Henwood F, Darking M, EmERGE Consortium. Development of an mHealth platform for HIV care: gathering user perspectives through co-design workshops and interviews. JMIR Mhealth Uhealth. 2018 Oct 19;6(10):e184. http://dx.doi.org/10.2196/mhealth.9856 PMID:30339132
5 Fatehi F, Menon A, Bird D. Diabetes care in the digital era: a synoptic overview. Curr Diab Rep. 2018 May 10;18(7):38. http://dx.doi.org/10.1007/s11892-018-1013-5 PMID:29748905
6 Mobile health trends and figures 2013–2017 [website]. Research and Markets (https://www.researchandmarkets.com/research/nhc8j7/mobile_health, accessed 1 April 2020).
7 Chen H, Chai Y, Dong L, Niu W, Zhang P. Effectiveness and appropriateness of mHealth interventions for maternal and child health: systematic review. JMIR Mhealth Uhealth. 2018 Jan 9;6(1):e7. http://dx.doi.org/10.2196/mhealth.8998 PMID:29317380
8. Al-Taee MA, Al-Nuaimy W, Al-Ataby A, Muhsin ZJ, Abood SN. Mobile health platform for diabetes management based on the Internet-of-Things. 2015 IEEE Jordan Conference on Applied Electrical Engineering and Computing Technologies (AEECT). Am-man; 2015;1–5. https://ieeexplore.ieee.org/document/7360551
9. Wu Y, Yao X, Vespasiani G, Nicolucci A, Dong Y, Kwong J, et al. Correction: Mobile app-based interventions to support diabetes self-management: a systematic review of randomized controlled trials to identify functions associated with glycemic efficacy. JMIR Mhealth Uhealth. 2018 Jan 15;6(1):e20. http://dx.doi.org/10.2196/mhealth.8789 PMID:29334479
10. Diabetes management: mobile phone applications used within healthcare systems for type 2 [website]. The Community guide; 2017 (https://www.thecommunityguide.org/findings/diabetes-management-mobile-phone-applications-used-within-health-care-systems-type-2, accessed 1 April 2020).
11. Kumar S, Nilsen WJ, Abernethy A, Atienza A, Patrick K, Pavel M, et al. Mobile health technology evaluation: the mHealth evi-dence workshop. Am J Prev Med. 2013 Aug;45(2):228–36. http://dx.doi.org/10.1016/j.amepre.2013.03.017 PMID:23867031
12. Horsham C, Loescher LJ, Whiteman DC, Soyer HP, Janda M. Consumer acceptance of patient‐performed mobile teledermosco-py for the early detection of melanoma. Br J Dermatol. 2016 Dec;175(6):1301–10. http://dx.doi.org/10.1111/bjd.14630 PMID:27037999

1140
Report EMHJ – Vol. 26 No. 9 – 2020
13. Alcantara MF, Cao Y, Liu C, Liu B, Brunette M, Zhang N, Albarracin CM et al. Improving tuberculosis diagnostics using deep learning and mobile health technologies among resource-poor communities in Peru. Smart Health. 2017 Jun;1–2:66–76. https://doi.org/10.1016/j.smhl.2017.04.003
14. Lv Z, Chirivella J, Gagliardo P. Bigdata oriented multimedia mobile health applications. J Med Syst. 2016 May;40(5):120. http://dx.doi.org/10.1007/s10916-016-0475-8 PMID:27020918
15. Lee JH, Park YR, Kweon S, Kim S, Ji W, Choi CM. A cardiopulmonary monitoring system for patient transport within hospitals using mobile internet of things technology: observational validation study. JMIR Mhealth Uhealth. 2018 Nov 14;6(11):e12048. http://dx.doi.org/10.2196/12048 PMID:30429115
16. Karkouch A, Mousannif H, Al Moatassime H, Noel T. A model-driven framework for data quality management in the Internet of Things. J Ambient Intell Humanized Comput. 2018;9(4),977–98. https://doi.org/10.1007/s12652-017-0498-0
17. Omboni S, Caserini M, Coronetti C. Telemedicine and m-health in hypertension management: technologies, applications and clinical evidence. High Blood Press Cardiovasc Prev. 2016 Sep;23(3):187–96. http://dx.doi.org/10.1007/s40292-016-0143-6 PMID:27072129
18. Andreu-Perez J, Poon CC, Merrifield RD, Wong ST, Yang GZ. Big data for health. IEEE J Biomed Health Informat-ics. 2015;19(4):1193–208. https://ieeexplore.ieee.org/stamp/stamp.jsp?arnumber=7154395
19. Luo J, Wu M, Gopukumar D, Zhao Y. Big data application in biomedical research and health care: a literature review. Biomed Inform Insights. 2016 Jan 19;8:1–10. http://dx.doi.org/10.4137/BII.S31559 PMID:26843812
20. Guo J, Zhou X, Sun Y, Ping G, Zhao G, Li Z. Smartphone-based patients’ activity recognition by using a self-learning scheme for medical monitoring. J Med Syst. 2016 Jun;40(6):140. http://dx.doi.org/10.1007/s10916-016-0497-2 PMID:27106584
21. Gökalp MO, Kayabay K, Akyol MA, Koçyiğit A, Eren PE. Big data in mHealth. In: Sezgin E, Yildirim S, Özkan-Yildirim S, Sumuer E, editors. Current and emerging mHealth technologies. Springer; 2018:241–56. https://doi.org/10.1007/978-3-319-73135-3_15
22. Abbasgholizadeh Rahimi S, Menear M, Robitaille H, Légaré F. Are mobile health applications useful for supporting shared deci-sion making in diagnostic and treatment decisions? Glob Health Action. 2017 Jun;10(Suppl 3):1332259. http://dx.doi.org/10.1080/16549716.2017.1332259 PMID:28838306
23. Zheng H, Tulu B, Choi W, Franklin P. Using mHealth app to support treatment decision-making for knee arthritis: patient per-spective. EGEMS. 2017 Apr 20;5(2):7. http://dx.doi.org/10.13063/2327-9214.1284 PMID:29930969
24. Elloumi Y, Akil M, Kehtarnavaz N. A mobile computer aided system for optic nerve head detection. Comput Methods Programs Biomed. 2018 Aug;162:139–48. https://doi.org/10.1016/j.cmpb.2018.05.004
25. Thamizhvani TR, Lakshmanan S, Sivaramakrishnan R. Mobile application-based computer-aided diagnosis of skin tumours from dermal images. Imaging Sci J. 2018;66(6):382–91. http://dx.doi.org/10.1080/13682199.2018.1492682
26. Chen M, Mao S, Liu Y. Big data: a survey. Mobile Netw Appl. 2014;19:171–209. https://doi.org/10.1007/s11036-013-0489-0
27. Qudah, B., & Luetsch, K. (2019). The influence of mobile health applications on patient-healthcare provider relationships: a sys-tematic, narrative review. Patient Educ Counsel. 2019 Jun;102(6):1080–9. https://doi.org/10.1016/j.pec.2019.01.021
28. Strengthening the doctor–patient relationship. New Delhi: World Health Organization Regional Office for South-East Asia; 2013 (https://apps.who.int/iris/handle/10665/205942, accessed 1 April 2020).
29. Tarouco LMR, Bertholdo LM, Granville LZ, Arbiza LMR, Carbone F, Marotta M. et al. Internet of Things in healthcare: interop-eratibility and security issues. 2012 IEEE International Conference on Communications (ICC), Ottawa; 2012:6121–5. https://ieeex-plore.ieee.org/document/6364830
30. Francis I. Using classical ethical principles to guide mHealth design. Online J Nurs Informatics. 2017 Fall;21(3). (https://www.researchgate.net/publication/339004012_Using_Classical_Ethical_Priniples_to_Guide_mHealth_Design.
31. Cao Y, Liu C, Liu B, Brunett MJ, Zhang N, Sun T, et al. Improving tuberculosis diagnostics using deep learning and mobile health technologies among resource-poor and marginalized communities. 2016 IEEE First International Conference on Connected Health: Applications, Systems and Engineering Technologies (CHASE), Washington, DC;2016:274–81. https://ieeexplore.ieee.org/document/7545842

WHO events addressing public health priorities
1141
EMHJ – Vol. 26 No. 9 – 2020
Meeting of the Eastern Mediterranean Regional Technical Advisory Group (RTAG) on immunization1
Citation: Meeting of the Eastern Mediterranean Regional Technical Advisory Group (RTAG) on immunization. East Mediterr Health J. 2020;26(9):1141-1142 https://doi.org/10.26719/2020.26.9.1141Copyright © World Health Organization (WHO) 2020. Open Access. Some rights reserved. This work is available under the CC BY-NC-SA 3.0 IGO license (https://creativecommons.org/licenses/by-nc-sa/3.0/igo).
1 This report is based on the Summary Report on the Meeting of the Eastern Mediterranean Regional Technical Advisory Group (RTAG) on immunization, 13–14 April 2020, virtual meeting.
IntroductionThe COVID-19 pandemic has created unprecedented challenges for immunization programmes in the Eastern Mediterranean Region. In order to assess the impact of COVID-19 and scrutinize the current status of immuniza-tion goals in the Region, the World Health Organization Regional Office for the Eastern Mediterranean (WHO/EMRO), Cairo, Egypt, held a meeting of the Regional Technical Advisory Group (RTAG) on immunization dur-ing 13–14 April 2020 (1). The meeting was conducted vir-tually (due to the COVID-19 pandemic situation).
The objectives of the meeting were to:
• review regional progress, challenges and constraints facing the achievement of the goals of the Eastern Mediterranean Vaccine Action Plan (EMVAP) and provide advice on the way forward;
• brief RTAG members on the progress in verification of elimination of measles and rubella and hepatitis B control in the Region;
• review the standard operating procedures (SOPs) of the RTAG; and
• discuss the impact of the COVID-19 pandemic on im-munization programmes in the Region and measures to mitigate it.
Summary of discussionsThe current COVID-19 pandemic may result in a sub-stantial negative impact on immunization programmes in the Region. Initial information from many countries indicates postponement of vaccination campaigns and underutilization of routine immunization services. An accumulation of susceptible populations may have se-rious consequences for vaccine-preventable diseases (VPD) morbidity and mortality. Regional routine vacci-nation coverage has increased in recent years despite the challenges facing the Region. However, around 3 million infants – almost 1 in 5 – still miss receiving their basic vaccines (2).
Commendable progress has taken place towards measles and rubella elimination in the Region, with half of its countries having either achieved elimination or progressed well towards it. However, the occurrence of measles outbreaks in several countries and the failure of
five countries to achieve maternal and neonatal tetanus (MNT) elimination are persistent problems.
Several outbreaks of VPDs have occurred recently in the Region, mainly affecting countries with low routine coverage. Improving immunization coverage, introducing booster doses and improving regional and national capacity for early detection and rapid response are required.
While commendable efforts to improve immunization data quality are ongoing in several countries, the current overall situation of immunization data quality hampers optimal decision-making. However, remarkable progress has taken place in establishing processes for verification of elimination and control goals at the regional level.
RecommendationsTo WHO• Promoting the use of absolute numbers of unvac-
cinated children along with vaccination coverage to monitor programme performance, especially in coun-tries with high numbers of unvaccinated children.
• Support countries of the Region in submitting high quality applications to GAVI to introduce second doses of measles and rubella vaccines.
• Responding to the demand of populations and deci-sion-makers for a vaccine against COVID-19, as an opportunity to promote the unique importance of vaccination, as most cost-effective tool to prevent and control disease outbreaks, epidemics and pandemics.
• Finalizing, printing and disseminating the regional guide for verification of the hepatitis B reduction tar-get and conducting briefing sessions for countries on the verification process, as soon as possible.
• Ensuring continued support to the Expanded Pro-gramme on Immunization (EPI) to streamline the sources and flow of immunization data in order to ensure the coherence and standardization of immu-nization data reporting.
To Member States• Ensuring that countries of the Region document the
impact of the COVID-19 pandemic on national im-munization programmes and monitor vaccine avail-ability.

1142
WHO events addressing public health priorities EMHJ – Vol. 26 No. 9 – 2020
• Monitoring susceptibility to measles and closing the immunity gap among all population groups, including refugees, immigrants, health-care workers and other high-risk groups.
• Ensuring that countries make plans for catch-up vaccination of missed children, using appropriate strategies, as soon as possible, when the COVID-19 pandemic situation allows.
• Involving the national immunization technical advisory group (NITAG), relevant partners and stakeholders in deci-sion-making on the implementation of immunization activities during the COVID-19 pandemic.
• Designing appropriate strategies for the integrated delivery of essential services during the COVID-19 pandemic where possible, and in the post-pandemic period.
• Ensuring that countries of the Region maintain high-quality VPD surveillance and alert functions to safeguard the early detection of VPD outbreaks and timely response to them.
• Encouraging countries of the Region to regularly share their subnational immunization data to ensure identification of missed children and achieve national and regional immunization goals.
References1. World Health Organization Regional Office for the Eastern Mediterranean (WHO/EMRO). Summary Report on the Meeting of
the Eastern Mediterranean Regional Technical Advisory Group (RTAG) on immunization. Cairo: WHO/EMRO; 2020.
2. World Health Organization Regional Office for the Eastern Mediterranean (WHO/EMRO). WHO urges countries to continue lifesaving immunization services during the COVID-19 pandemic. Cairo: WHO/EMRO; 2020 (http://www.emro.who.int/media/news/who-urges-countries-to-continue-lifesaving-immunization-services-during-the-covid-19-pandemic.html).
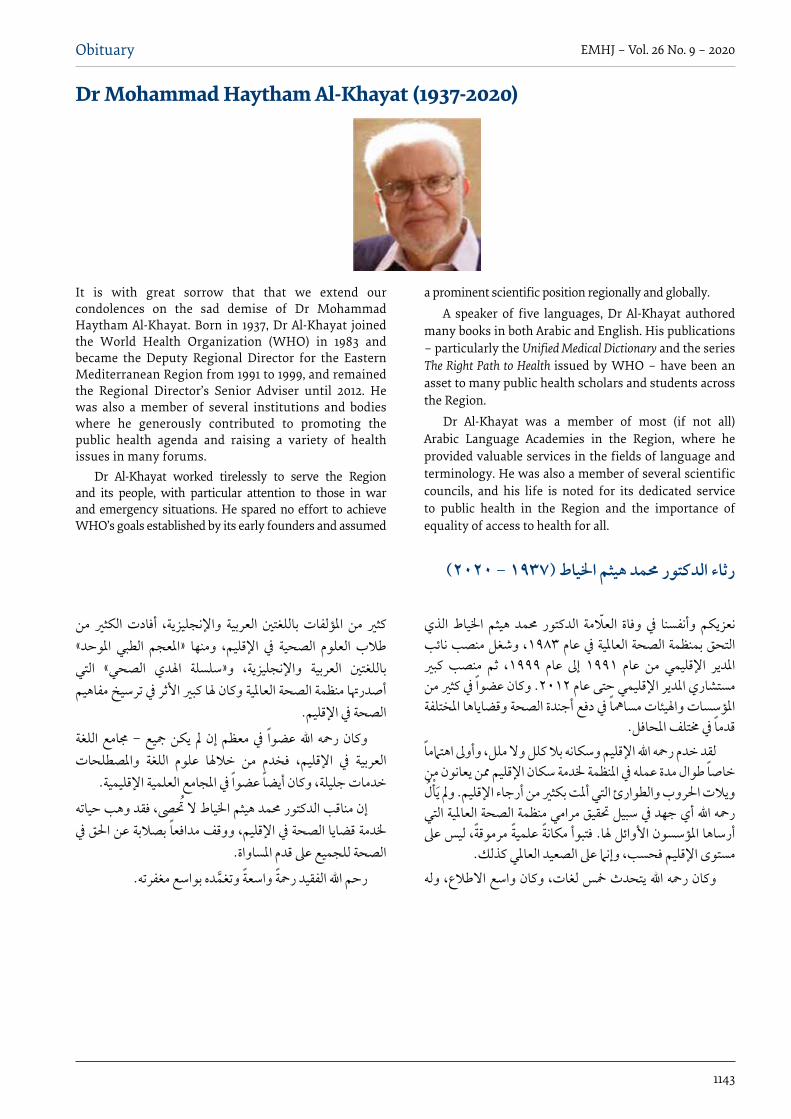
1143
Obituary EMHJ – Vol. 26 No. 9 – 2020
Dr Mohammad Haytham Al-Khayat (1937-2020)
It is with great sorrow that that we extend our condolences on the sad demise of Dr Mohammad Haytham Al-Khayat. Born in 1937, Dr Al-Khayat joined the World Health Organization (WHO) in 1983 and became the Deputy Regional Director for the Eastern Mediterranean Region from 1991 to 1999, and remained the Regional Director’s Senior Adviser until 2012. He was also a member of several institutions and bodies where he generously contributed to promoting the public health agenda and raising a variety of health issues in many forums.
Dr Al-Khayat worked tirelessly to serve the Region and its people, with particular attention to those in war and emergency situations. He spared no effort to achieve WHO’s goals established by its early founders and assumed
a prominent scientific position regionally and globally.A speaker of five languages, Dr Al-Khayat authored
many books in both Arabic and English. His publications – particularly the Unified Medical Dictionary and the series The Right Path to Health issued by WHO – have been an asset to many public health scholars and students across the Region.
Dr Al-Khayat was a member of most (if not all) Arabic Language Academies in the Region, where he provided valuable services in the fields of language and terminology. He was also a member of several scientific councils, and his life is noted for its dedicated service to public health in the Region and the importance of equality of access to health for all.
رثاء الدكتور حممد هيثم اخلياط )1937 - 2020(
الذي اخلياط هيثم حممد الدكتور العلمة وفاة يف وأنفسنا نعزيكم نائب العاملية يف عام 1983، وشغل منصب الصحة بمنظمة التحق كبري منصب ثم ،1999 عام إىل 1991 عام من اإلقليمي املدير مستشاري املدير اإلقليمي حتى عام 2012. وكان عضوا يف كثري من املؤسسات واهليئات مسامها يف دفع أجندة الصحة وقضاياها املختلفة
قدما يف خمتلف املحافل.لقد خدم رمحه اهلل اإلقليم وسكانه بل كلل وال ملل، وأوىل اهتامما خاصا طوال مدة عمله يف املنظمة خلدمة سكان اإلقليم ممن يعانون من ويلت احلروب والطوارئ التي أملت بكثري من أرجاء اإلقليم. ومل يأل رمحه اهلل أي جهد يف سبيل حتقيق مرامي منظمة الصحة العاملية التي أرساها املؤسسون األوائل هلا. فتبوأ مكانة علمية مرموقة، ليس عىل
مستوى اإلقليم فحسب، وإنام عىل الصعيد العاملي كذلك.لغات، وكان واسع االطلع، وله يتحدث مخس اهلل وكان رمحه
من الكثري أفادت واإلنجليزية، العربية باللغتني املؤلفات من كثري املوحد« الطبي »املعجم ومنها اإلقليم، يف الصحية العلوم طلب التي الصحي« اهلدي و»سلسلة واإلنجليزية، العربية باللغتني أصدرهتا منظمة الصحة العاملية وكان هلا كبري األثر يف ترسيخ مفاهيم
الصحة يف اإلقليم.اللغة جمامع - مجيع يكن مل إن معظم يف عضوا اهلل رمحه وكان واملصطلحات اللغة علوم خلهلا من فخدم اإلقليم، يف العربية
خدمات جليلة، وكان أيضا عضوا يف املجامع العلمية اإلقليمية.إن مناقب الدكتور حممد هيثم اخلياط ال حتىص، فقد وهب حياته خلدمة قضايا الصحة يف اإلقليم، ووقف مدافعا بصلبة عن احلق يف
الصحة للجميع عىل قدم املساواة.ده بواسع مغفرته. رحم اهلل الفقيد رمحة واسعة وتغم

1144
EMHJ – Vol. 26 No. 9 – 2020Obituary
Dr Ramez Khairi Mahaini (1959-2020)
It is with great sadness that we announce the loss of our dear colleague Dr Ramez Khairi Mahaini, who passed away on 30 August 2020 in Cairo, Egypt, leaving behind a great legacy with the World Health Organization Regional Office for the Eastern Mediterranean (WHO/EMRO).
Dr Mahaini had dedicated 25 years of his life to the betterment of the lives of women and children in the Eastern Mediterranean Region. He originally joined WHO/EMRO in Alexandria, Egypt, in 1994, and had recently served as Coordinator of Maternal and Child health, Regional Advisor of Reproductive and Maternal
Health, and was the focal point for the health of older persons for the Region.
Dr Mahaini was the embodiment of dedication and professionalism in the service of WHO’s mission and vision, and a great source of support for all his colleagues in WHO Headquarters, Regional and Country Offices. His kindness and thoughtfulness extended to all staff members and he will always be remembered as a resourceful mentor, trustworthy colleague and dear friend. In his private life, Dr Mahaini was also known for his love of poetry and nature. Dr Mahaini is succeeded by his wife and two sons.
رثاء الدكتور رامز خريي مهايني )2020-1959(
انتقل إىل رمحة اهلل زميلنا العزيز الدكتور رامز خريي مهايني، الذي ملفا مرص، القاهرة، يف 2020 آب / أغسطس 30 يف املنية وافته وراءه إرثا عظيام لدى املكتب اإلقليمي ملنظمة الصحة العاملية لرشق
املتوسط.حياة لتحسني حياته من عاما 25 مهايني الدكتور كرس وقد باملكتب التحق قد وكان املتوسط. رشق إقليم يف واألطفال النساء اإلقليمي لرشق املتوسط يف اإلسكندرية، مرص يف عام 1994، وعمل إقليميا ومستشارا واألطفال، األمهات صحة لشؤون منسقا مؤخرا للصحة اإلنجابية وصحة األمهات، كام كان مسؤول االتصال املعني
بصحة كبار السن يف اإلقليم. خدمة يف واملهنية للتفاين حقيقيا جتسيدا مهايني الدكتور ومثل مجيع لدعم مصدرا كان كام ورؤيتها، العاملية الصحة منظمة مهمة اإلقليمي، واملكتب للمنظمة، الرئييس املقر يف كبري بشكل زمالئه الزمالء مجيع إىل الكريمة معاملته امتدت وقد القطرية. واملكاتب واملوظفني، وسيتذكره اجلميع دوما باعتباره معلام بارعا وزميال جديرا بالثقة وصديقا عزيزا. وعرف الدكتور مهايني يف حياته اخلاصة بحبه
للشعر والطبيعة. رحم اهلل الدكتور مهايني وأدخله فسيح جناته.

Correspondence
Editor-in-chief
Eastern Mediterranean Health JournalWHO Regional Office for the Eastern MediterraneanP.O. Box 7608 Nasr City, Cairo 11371 Egypt Tel: (+202) 2276 5000 Fax: (+202) 2670 2492/(+202) 2670 2494 Email: [email protected]
Members of the WHO Regional Committee for the Eastern Mediterranean Afghanistan . Bahrain . Djibouti . Egypt . Islamic Republic of Iran . Iraq . Jordan . Kuwait . Lebanon Libya . Morocco . Oman . Pakistan . Palestine . Qatar . Saudi Arabia . Somalia . Sudan . Syrian Arab Republic Tunisia . United Arab Emirates . Yemen
البلدان أعضاء اللجنة اإلقليمية ملنظمة الصحة العاملية لرشق املتوسط األردن . أفغانستان . اإلمارات العربية املتحدة . باكستان . البحرين . تونس . ليبيا . مجهورية إيران اإلسالمية
اجلمهورية العربية السورية . جيبويت . السودان . الصومال . العراق . عامن . فلسطني . قطر . الكويت . لبنان . مرص . املغرباململكة العربية السعودية . اليمن
Membres du Comité régional de l’OMS pour la Méditerranée orientale Afghanistan . Arabie saoudite . Bahreïn . Djibouti . Égypte . Émirats arabes unis . République islamique d’Iran Iraq . Libye . Jordanie . Koweït . Liban . Maroc . Oman . Pakistan . Palestine . Qatar . République arabe syrienne Somalie . Soudan . Tunisie . Yémen
Subscriptions and Permissions
Publications of the World Health Organization can be obtained from Knowledge Sharing and Production, World Health Organization, Regional Office for the Eastern Mediterranean, PO Box 7608, Nasr City, Cairo 11371, Egypt (tel: +202 2670 2535, fax: +202 2670 2492; email: [email protected]). Requests for permission to reproduce, in part or in whole, or to translate publications of WHO Regional Office for the Eastern Mediterranean – whether for sale or for noncommercial distribution – should be addressed to WHO Regional Office for the Eastern Mediterranean, at the above address; email: [email protected].

EMHJ – Vol. 26 No. 9 – 2020
EditorialComing together in the Region to tackle COVID-19Ahmed Al-Mandhari ....................................................................................................................................................................................................................................992
CommentaryModels of maternity care for pregnant women during the COVID-19 pandemicMona Larki, Farangis Sharifi and Robab Latifnejad Roudsari......................................................................................................................................................994
Short research communicationsBlood coagulation parameters in patients with severe COVID-19 from Kermanshah Province, Islamic Republic of Iran Babak Sayad and Zohreh Rahimi ............................................................................................................................................................................................................999
COVID-19 in the Eastern Mediterranean Region: testing frequency, cumulative cases and mortality analysisPascale Salameh ............................................................................................................................................................................................................................................1005
Educational perspective for the identification of essential competencies required for approaching patients with COVID-19Mayssoon Dashash, Bashar Almasri, Eman Takaleh, Alaa Abou Halawah and Amal Sahyouni .......................................................................................1011
Engagement of medical specialty trainees in research: experience at a Lebanese medical schoolFouad Fayad, Ouidade Aitisha Tabesh, Tamara Lotfi, Fadi Haddad and Elie Nemr ...............................................................................................................1018
Research articlesAn analysis of financial protection before and after the Iranian Health Transformation PlanZhaleh Abdi, Justine Hsu, Elham Ahmadnezhad, Reza Majdzadeh and Iraj Harirchi ..........................................................................................................1025
Prevalence of hypohydration in adolescents during the school day in Cyprus: seasonal variationsPinelopi S. Stavrinou, Christoforos D. Giannaki, Eleni Andreou and George Aphamis .......................................................................................................1034
Medical management of pneumonia in children aged under 5 years in Alexandria, Egypt: mothers’ perspectiveNoha Fadl, Ayat Ashour and Yasmine Muhammed ..........................................................................................................................................................................1042
Audit of antibiotic prophylaxis and adherence of surgeons to standard guidelines in common abdominal surgical proceduresZakir Khan, Naveed Ahmed, Shaista Zafar, Asim ur Rehman, Faiz Ullah Khan, Muhammad Saqlain, Sohail Kamran and Hazir Rahman .....1052
Comparison of validity of the Food Frequency Questionnaire and the Diet History Questionnaire for assessment of energy and nutrients intakes in an Iranian populationFatemeh Toorang, Bahareh Sasanfar, Ahmad Esmaillzadeh, Soraiya Ebrahimpour-Koujan and Kazem Zendehdel .................................................1062
Adherence to the Mediterranean diet of school-age children in Moroccan oases, Draa-Tafilalet RegionKarima Azekour, Zahra Outaleb, Mohamed Eddouks, Farid Khallouki and Bachir El Bouhali .........................................................................................1070
Dentist availability in Egypt: a 20-year study of supply, potential demand and economic factorsMaha El Tantawi, Nourhan M. Aly, Dina Attia, Hams Abdelrahman and Mohamed Mehaina ........................................................................................1078
Malnutrition and food insecurity in child labourers in Sindh, Pakistan: a cross-sectional studyMeesha Iqbal, Zafar Fatmi, Kausar Khan, Yusra Jumani, Neelma Amjad and Asaad Nafees .............................................................................................1087
The epidemiology of cholera in the Islamic Republic of Iran, 1965–2014Hossein Masoumi-Asl, Goodarz Kolifarhood and Mohammad Mehdi Gouya ......................................................................................................................1097
ReviewsRegional disparities in the distribution of Sudan’s health resourcesMohamed Ismail ..........................................................................................................................................................................................................................................1105
Landscape analysis of family planning research, programmes and policies targeting young people in Jordan: stakeholder assessment and systematic reviewJewel Gausman, Areej Othman, Abeer Dababneh, Iqbal Hamad, Maysoon Dabobe, Insaf Daas and Ana Langer ......................................................1115
ReportMobile-aided diagnosis systems are the future of health careDonia Ben Hassen ........................................................................................................................................................................................................................................1135
WHO events addressing public health prioritiesMeeting of the Eastern Mediterranean Regional Technical Advisory Group (RTAG) on immunization ..................1141
ObituariesDr Mohammad Haytham Al-Khayat (1937-2020) ......................................................................................................................................1143Dr Ramez Khairi Mahaini (1959-2020) ............................................................................................................................................................1144
Copyright © 2022 FDOKUMEN