
East Hampshire District Council Heat Techno-Economic ...
138
Report by: South East Wood Fuels Ltd Date: 17/03/2016 Version: Final 0.24 East Hampshire District Council Heat Techno-Economic Feasibility Studies Main Report
-
Upload
khangminh22 -
Category
Documents
-
view
0 -
download
0
Transcript of East Hampshire District Council Heat Techno-Economic ...

Report by: South East Wood Fuels Ltd
Date: 17/03/2016
Version: Final 0.24
East Hampshire District Council
Heat Techno-Economic Feasibility Studies
Main Report

EHDC HNDU: Heat Techno-Economic Feasibility Studies
P a g e | 2
Issued Version Control
Version Status Checked by Approved by
0.14 DRAFT Stewart Boyle Julian Morgan-Jones
0.20 DRAFT FINAL Matthew Morris Stewart Boyle
0.21 DRAFT FINAL Matthew Morris Stewart Boyle
0.22 DRAFT FINAL Matthew Morris Stewart Boyle
0.23 FINAL Matthew Morris Stewart Boyle
0.24 FINAL – Minor Edits Matthew Morris Stewart Boyle

EHDC HNDU: Heat Techno-Economic Feasibility Studies
P a g e | 3
1 EXECUTIVE SUMMARY
1.1 REPORT HIGHLIGHTS (PENNS PLACE, ALTON, WHITEHILL & BORDON)
1.1.1 Introduction EHDC commissioned this project after completion of the East Hampshire Heat Masterplan in 2015,
funded by DECC’s Heat Network Delivery Unit (HNDU). The Heat Masterplan concluded that three
heat loads provided sufficient potential to carry out further assessment to see if they were
technically and commercially viable.
This study is consistent with current EHDC Corporate and Energy Strategies which seek to expand
the contribution of renewable energy technologies in East Hampshire, to meet CO2 reduction
targets and stimulate economic development through green business expansion. The study is also
in keeping with the need to meet legally binding carbon reduction targets at a national level.
1.1.2 Technologies Of the wide range of low-carbon heat technologies assessed, three – biomass heating, gas-
Combined Heat and Power (CHP) and Ground Source Heat Pumps (GSHP) - are technically viable
(albeit with GSHP taking a more limited role). Biomass heating and gas-CHP are the two most
commercially viable options at this stage.
The three proposed heat network projects are all technically viable.
The heat networks combined offer an attractive £5 million investment with rates of return of
between 11% and 15% IRR.
The cumulative positive cash flow benefit for all three projects combined is £10.6 million over 20
years and £28.3 million over 40 years.
The Net Present Value (NPV) for the three projects is more than £3.1 million (20 years) and £5.2
million (40 years).
The results are robust under a wide range of sensitivity tests, except where the RHI is significantly
reduced or not available, and where import power prices fall by 25%.
The Penns Place/Taro Leisure Centre heat network could be installed in 2016, securing a 20-year
income stream of £800,000 from the Government’s RHI scheme.
All three projects offer attractive opportunities for an Energy Services Company (ESCo). If EHDC
took a prominent role in this ESCo, significant positive cash flows could be secured.

EHDC HNDU: Heat Techno-Economic Feasibility Studies
P a g e | 4
Table 1: Summary of recommended modelling scenario technologies and costs for all three sites: Scenarios 2, 5 & 7
Heat (and Power)
demand Technology option Technology Scale Backup
Penns Place/Taro Leisure Centre
(Scenario 2)
2.7 million kWh(th) and 1.5 million kWh(e)
Biomass and CHP heat 450kW(th) biomass and
c.450,000kWh waste CHP heat
1
Gas boilers
Alton (Scenario 5)
3 million kWh (th) and 1 million kWh(e)
Biomass and CHP 400kW(th) biomass and
200kWe gas-CHP Gas boilers
Whitehill & Bordon
(Scenario 7 & 7A)
37 million kWh (th) and 17 million kWh(e)
Gas-CHP and biomass (GSHP for smaller
network)
2MWe gas-CHP + 2MWth biomass (and 1MWe gas-CHP and 4MW(th) biomass
variation)
Gas boilers
1.1.3 Study Results Table 2: Summary of modelling scenarios for all three sites: Scenarios 2, 5 & 7
Capital Costs
Cumulative cash flow benefit £ -
20yr
Cumulative cash flow benefit £ -
40yr
IRR % 20yr
IRR % 40yr
NPV £ 20yr
NPV £ 40yr
CO2 emission reduction (%)
Penns Place/Taro Leisure Centre
(Scenario 2) £550,000
£1.27 million
£1.3 million 14 14 £366,000 £338,000 62-72%
Alton (Scenario 5)
£760,000 £1.04
million £2.6 million 11 12 £220,000 £385,000 44-66%
Whitehill & Bordon
(Scenario 7 & 7A)
£3.75 million
£8.3 million £24.4
million 14 15
£2.46 million
£4.475 million
44-69%
Total £5 million £10.6
million £28.3
million n/a n/a
£3.05 million
£5.2 million
45-69% (8,000-13,000
tCO2/yr)
A detailed financial analysis was carried out for all projects, including sensitivity analysis to assess
how robust the results were. These were measured against a 7% IRR benchmark (the current rate
of return from EHDC’s property portfolio).
The three projects assessed under this study offer a £4.9 million investment opportunity in low-
carbon heat networks, with Internal Rates of Return (IRR) of between 11% and 15%.
The cumulative positive cash flow benefit is £10.6 million over 20 years (£28 million over 40 years).
The Net Present Value (NPV) for the three projects total more than £3 million over 20 years (£5.2
million over 40 years).
1.1.4 Risks and Opportunities The results are most sensitive to future grid electricity prices, as well as the availability and tariff
levels of the Renewable Heat Incentive (RHI). Large reductions in grid electricity prices under
current investment trends are unlikely.
1 Estimated, as metered data was not available.

EHDC HNDU: Heat Techno-Economic Feasibility Studies
P a g e | 5
The results are resilient to the other sensitivity tests (i.e. variations in heat loads, gas and wood
chip prices, capital costs).
The technology risk is low for all three projects, and due to their direct involvement in both
buildings, the heat load risk is low for Penns Place-Taro Leisure Centre.
The Penns Place-Taro Leisure Centre heat network has a time limited opportunity to secure an
£800,000 index-linked RHI income stream over 20 years before the end of 20162.
The Alton project requires strong emphasis on the use of gas-CHP to become viable. A biomass
only investment with assumed lower rates of RHI support is not economic against the Council’s
current investment criteria (<7% IRR).
The Whitehill & Bordon Regeneration Project offers an attractive heat (and power) load and
density over time, and a combination ‘gas-CHP and biomass’ investment offers low-risk
technologies, strong CO2 reductions and an attractive rate of return. At this stage of development,
the heat load offers a ‘moderate’ risk to investment, as it will likely change from current estimates.
However a sensitivity test with 25% lower heat load reduced the IRR by only 2%.
1.1.5 Wider Economic and Environmental benefits EHDC has an Energy Strategy that seeks to grow the renewables sector in its district and meet
high CO2 reduction targets. There are wider economic and environmental benefits from investing
in the three projects. For example, they offer a potential wood fuel market of between 3,000 to
7,500 tonnes per annum. That is estimated to be worth between £270,000 and £700,000 of gross
income per year at current prices.
The three projects offer a combined CO2 reduction potential of 45-69% (8,160-13,165 tCO2/yr)
(see Table 2).
1.1.6 Governance of the Projects Governance of the three projects is critical, and this is explored for each of the projects in turn.
The projects would support the establishment of an Energy Services Company (ESCo).
The appetite of EHDC to take ownership of project design, fuel, capital and management risks will
determine the shape of the governance structure. This will also determine the extent of the
project value returns to EHDC and the wider community.
Based on the current level of risks and benefits, local authorities like EHDC would maximise
benefits by taking a leading direct role in the ESCo.
2 While final decisions over the RHI have not yet been announced by DECC, initial proposals by DECC to trade
associations indicate a preference to reduce biomass tariffs in 2017, while increasing relative support for heat pumps and biomethane (personal communication, Julian Morgan-Jones, WHA, 2016).

EHDC HNDU: Heat Techno-Economic Feasibility Studies
P a g e | 6
1.2 HIGHLIGHTS: PENNS PLACE & TARO LEISURE CENTRE
1.2.1 Introduction The combined Penns Place offices and Taro Leisure Centre heat load offers an attractive
opportunity to develop a heat network.
A possible extension of the heat network to a 96 home development in Penns Field within the
next five years may allow a significant extension to the heat network.
1.2.2 Technologies The recommended heat network solution integrates a new 450kW biomass heating system with
either the existing CHP plant, or a new CHP plant in a few years’ time. A packaged boiler room
located close to the Taro Leisure Centre is recommended. This should have sufficient space
nearby to incorporate the biomass system, a new CHP plant and possible additional plant if the
housing development is connected to the heat network.
Given the age of the existing CHP plant, the fact that it is ‘over-sized’ and heat is being wasted, a
re-sized new CHP plant could be sited at the new boiler room site, with greater control over heat
inputs.
The technical aspects of this project are low risk and viable.
1.2.3 Study Results Table 3: Summary of modelling results for Penns Place/Taro Leisure Centre: Scenario 2
3
Capital Costs
Cumulative cash flow benefit £ -
20yr
Cumulative cash flow benefit £ -
40yr
IRR % 20yr IRR % 40yr NPV £ 20yr NPV £ 40yr CO2 savings
(% of benchmark)
£550,000 £1.27 million £1.26 million 14 14 £366,000 £338,000 62-72%
A detailed financial analysis was carried out. For an investment of £550,000 a 20-year rate of
return of 14% IRR is predicted.
A 20-year positive cash flow benefit of £1.27 million and a Net Present Value (NPV) of £366,000
are also predicted.
An extension of the heat network to a possible housing development in Penns Field is currently
too uncertain and risky to warrant extending the proposed heat network. However, a modest
level of ‘future proofing’ of a larger heat network could be achieved by ensuring there is enough
space for additional biomass boilers and CHP plant at the proposed packaged boiler plant room.
1.2.4 Risks and Opportunities The results are sensitive to the availability and tariff levels of the RHI. Without the current RHI
income stream the project is not viable.
The results are resilient to the other sensitivity tests (i.e. variations in heat loads, gas and wood
chip prices, capital costs).
The technology and heat load risks are low.
3 Figures are rounded.

EHDC HNDU: Heat Techno-Economic Feasibility Studies
P a g e | 7
The Penns Place-Taro Leisure Centre heat network has a time limited opportunity to secure an
£800,000 index-linked RHI income stream over 20 years before the end of 2016. Without that
income stream the rates of return drop significantly to less than 7% IRR. This factor is a significant
driver for the Council in terms of potential investment in the project compared to its current
investment criteria.
1.2.5 Wider Economic and Environmental benefits There are wider economic and environmental benefits. For example, the project offers a potential
wood fuel market of 720 tonnes per annum. This is estimated to be around £75,000 gross income
at current prices.
The project offers a CO2 reduction potential of 62-72% (compared to a benchmark of gas boilers).
1.2.6 Governance of the Project The project lends itself to setting up an Energy Services Company (ESCo).
It is recommended that the Council is directly involved in the establishment of an ESCo and
consider the strengths of a private/public hybrid governance structure. This would maximise the
benefits for EHDC and the wider community.
Given the need to take an early decision over the project, an interim management solution would
be to tender and sign a ‘Design, Build and Operate’ contract with a specialist biomass-district
heating supplier for 3 to 5 years. When EHDC’s preferred approach for an ESCo is agreed and set
up, the management functions could then be taken over.
Figure 1: Provisional heat network pipe layout for Penns Place, Taro Leisure Centre and Penns Field

EHDC HNDU: Heat Techno-Economic Feasibility Studies
P a g e | 8
1.3 HIGHLIGHTS: ALTON SPORTS CENTRE
1.3.1 Introduction The proposed new Alton Sports Centre received outline planning permission in 2015 to replace
the existing facility. It offers an excellent heat network when combined with two smaller heat
loads at the nearby Cardiac Centre and 10 social housing apartments (The Gurdons).
A large 305 homes development nearby offers a potential larger heat network but the timing and
extent of this remains uncertain.
1.3.2 Technologies The recommended solution integrates a new 200kW(e) (300kW(th)4 gas-CHP unit with a 400kW
biomass heating system. Compared to standard gas heating, this offers a good combination of
strong financial returns with significant CO2 emission reductions.
1.3.3 Study Results Table 4: Summary of modelling results for Alton: Scenario 5
5
Capital Costs
Cumulative cash flow benefit £ -
20yr
Cumulative cash flow benefit £ -
40yr
IRR % 20yr IRR % 40yr NPV £ 20yr NPV £ 40yr CO2
emissions savings
£760,000 £1.04 million £2.6 million 11 12 £220,000 £385,000 44-66%
A detailed financial analysis was carried out. For an investment of under £760,000, an 11-12% IRR
is predicted.
The project has a 20-year positive cash flow benefit of £1.04 million (£2.6 million over 40 years)
and a NPV of £220,000 (£385,000 over 40 years).
1.3.4 Risks and Opportunities The financial results are most sensitive to the availability and tariff levels of the RHI, and grid
electricity prices. We think a large fall in electricity prices is unlikely.
The project assumes that 50% of the current ‘medium biomass tariff’ under the RHI is secured
(currently 5.2p/kWh (Tier 1)6. Without that income stream the rates of return drop by up to 6%
IRR, and only the gas-CHP option offers a decent rate of return (>12% IRR) when these factors are
considered.
The results are resilient to the other sensitivity tests (i.e. variations in heat loads, gas and wood
chip prices, capital costs).
The technology risks are low.
4 CHP heat and power ratios vary according to plant size and company offerings. Based on one company’s CHP range
where heat to power ratios vary between 1.07 and 2.17 and an average of 1.36, we have assumed 1.5. We accept this is a conservative figure that under-states the economic benefit of the CHP investment. 5 Figures are rounded.
6 See Footnote 2.

EHDC HNDU: Heat Techno-Economic Feasibility Studies
P a g e | 9
1.3.5 Wider Economic and Environmental benefits There are wider economic and environmental benefits. For example, the project offers a potential
wood fuel market of 520 tonnes per annum. This is estimated to be worth around £54,000 gross
income at current prices.
The project offers a CO2 reduction potential of 46-66% (see Table 2).
1.3.6 Governance of the Project The project lends itself to setting up an ESCo.
It is recommended that the Council are directly involved in the establishment of an ESCo and
consider the strengths of a private/public hybrid governance structure. This would maximise the
benefits for EHDC and the wider community.
Figure 2: Provisional heat network pipe layout for new Alton leisure centre site and housing development

EHDC HNDU: Heat Techno-Economic Feasibility Studies
P a g e | 10
1.4 HIGHLIGHTS: WHITEHILL & BORDON
1.4.1 Introduction This project combines the projected heat loads for the proposed town centre, which is currently
due to be delivered between 2018 and 2021. The estimated combined heat (and power) loads for
housing, service and commercial buildings are attractive for heat network economics, and the
technical and financial aspects of the project are viable.
1.4.2 Technologies The recommended solution with a new heat network integrates a 2,000kW(e) (2,500kW(th)7 gas-
CHP unit with a 2,000kW biomass heating system. Compared to standalone gas heating and no
heat network, this offers a good combination of strong financial returns with significant CO2
emissions reductions. A variation on this with a higher emphasis on biomass was also assessed.
A more limited heat network, supplying around 1/8 of the total heat demand and heated by a
Ground Source Heat Pump (GSHP) system alongside a gas-CHP system offers promising rates of
return (c.15% IRR). While GSHP cannot supply the whole of the heat network, it is worth looking
at further.
1.4.3 Study Results Table 5: Summary of modelling results for Whitehill & Bordon: Scenario 7
Capital Costs
Cumulative cash flow benefit £ -
20yr
Cumulative cash flow benefit £ -
40yr
IRR % 20yr IRR % 40yr NPV £ 20yr NPV £ 40yr
CO2 emissions
savings (% of benchmark)
£3.75 million £8.3 million £24.4 million 14 15 £2.5 million £4.5 million 44-69%
With an investment of £3.7 million, a rate of return of 14-18% IRR is expected.
The project also shows a 20-year positive cash flow benefit of £8.28 million (£24 million over 40
years) and a NPV of £2.5 million (£4.5 million over 40 years).
1.4.4 Risks and Opportunities The financial results are robust under a range of sensitivity tests, except where grid electricity
prices drop by 25%. Sizing the CHP plant such that long-term contracts are entered into between
an ESCo and non-domestic building operators will be important in reducing risks. This will offer
secure financial flows for the project.
The project assumes that 50% of the current ‘large biomass tariff’ (which is currently just over
2p/kWh) under the RHI can be secured. Without that income stream, the rates of return drops by
2-3% (i.e. down to between 12-15% IRR).
7 CHP heat and power ratios vary according to plant size and company offerings. Based on one company’s CHP range
where heat to power ratios vary between 1.07 and 2.17 and an average of 1.36, we have assumed 1.5. We accept this is a conservative figure that under-states the economic benefit of the CHP investment.

EHDC HNDU: Heat Techno-Economic Feasibility Studies
P a g e | 11
The project offers low risks for the Council and its partners, in that the technologies are well-
known, and that the heat network route can be installed at the same time as the town centre
development takes place.
An existing 1km heat network would offer potential cost savings through utilising the existing
Energy Centre and underground pipe routes for the new heat network.
No energy investments are risk-free. They critically depend on the assumptions made in the
modelling work, and the robustness of these under varying futures. The consultants have
deliberately adopted a conservative approach that is resilient to variations in price and cost
assumptions.
1.4.5 Wider Economic and Environmental benefits There are wider economic and environmental benefits. For example, the project offers a potential
wood fuel market of around 3,000 tonnes per annum. That is worth around worth around
£270,000 gross income at current prices.
Based on current technological and district heating network (DH) assumptions, the project offers a
CO2 reduction potential of 44-69% when compared to standard gas heating and imported grid
power.
1.4.6 Governance of the Project The project is attractive for the setting up an ESCo suitable for this project. Compared to a retrofit
district heating network in for example urban areas, this offers a much cheaper and less uncertain
investment.
It is recommended that a direct involvement in the ESCO by EHDC (or at least a hybrid public-
private sector run ESCO) be explored further with the Whitehill & Bordon Regeneration Company
as the development partner. This would allow as much of the project benefits to be retained for
EHDC and the wider community. While it is a larger and more complex project than the other two
projects in this study, with appropriate technical and commercial expertise from private sector
partners, the risks are manageable.

EHDC HNDU: Heat Techno-Economic Feasibility Studies
P a g e | 12
Figure 3: Whitehill & Bordon structuring plan, showing details for the new town centre (within black dotted line) and position of existing gas-fired energy centre (red box). (Sources: Barton Willmore; SEWF Ltd).

EHDC HNDU: Heat Techno-Economic Feasibility Studies
P a g e | 13
Contents
1 EXECUTIVE SUMMARY ..................................................................................................................................... 3
1.1 REPORT HIGHLIGHTS (PENNS PLACE, ALTON, WHITEHILL & BORDON) .................................................................................. 3 1.2 HIGHLIGHTS: PENNS PLACE & TARO LEISURE CENTRE ........................................................................................................ 6 1.3 HIGHLIGHTS: ALTON SPORTS CENTRE .............................................................................................................................. 8 1.4 HIGHLIGHTS: WHITEHILL & BORDON ............................................................................................................................ 10
2 HEAT TECHNO-ECONOMIC FEASIBILITY STUDIES ............................................................................................. 16
2.1 INTRODUCTION ......................................................................................................................................................... 16 2.2 EHDC ENERGY STRATEGY TARGETS .............................................................................................................................. 17 2.3 CURRENT DRIVERS FOR LOW-CARBON HEATING ............................................................................................................. 17 2.4 CARBON EMISSION REDUCTION TARGETS ...................................................................................................................... 18 2.5 TECHNOLOGY APPRAISAL SUMMARY ............................................................................................................................. 18 2.6 GAS PRICE UNCERTAINTY ............................................................................................................................................ 18 2.7 WHY SHOULD EHDC INVEST IN LOW-CARBON HEAT NETWORKS? ....................................................................................... 20 2.8 STUDY METHODOLOGY .............................................................................................................................................. 22 2.9 DEVELOPING THE MODELLING SCENARIOS ..................................................................................................................... 27
3 PENNS PLACE AND TARO LEISURE CENTRE ...................................................................................................... 30
3.1 INTRODUCTION ......................................................................................................................................................... 30 3.2 THE IMPACT OF FAÇADE REFURBISHMENT ON HEAT LOADS ................................................................................................. 31 3.3 ENERGY DATA .......................................................................................................................................................... 31 3.4 PENNS PLACE: NEW HOUSING ..................................................................................................................................... 31 3.5 TECHNOLOGY OPTIONS AND CHOICES ........................................................................................................................... 32 3.6 SCENARIOS DEVELOPED AND MODELLING RESULTS .......................................................................................................... 33 3.7 CONCLUSIONS .......................................................................................................................................................... 33 3.8 RECOMMENDATIONS ................................................................................................................................................. 34
4 ALTON LEISURE CENTRE .................................................................................................................................. 38
4.1 NEW LEISURE CENTRE AND BUILD STRATEGY ................................................................................................................... 38 4.2 ADDITIONAL HEAT LOADS ........................................................................................................................................... 38 4.3 TECHNOLOGY OPTIONS AND CHOICES ........................................................................................................................... 38 4.4 SCENARIOS DEVELOPED AND MODELLING RESULTS .......................................................................................................... 39 4.5 NEW HOUSING - LORD TRELOAR SITE ........................................................................................................................... 40 4.6 FINANCIAL MODELLING .............................................................................................................................................. 40 4.7 MODELLING RESULTS ................................................................................................................................................. 40 4.8 CONCLUSIONS .......................................................................................................................................................... 44 4.9 RECOMMENDATIONS ................................................................................................................................................. 44
5 WHITEHILL AND BORDON ............................................................................................................................... 45
5.1 INTRODUCTION ......................................................................................................................................................... 45 5.2 ENERGY DATA .......................................................................................................................................................... 46 5.3 TECHNOLOGY APPRAISAL AND SCENARIOS...................................................................................................................... 47 5.4 SCENARIOS AND MODELLING RESULTS .......................................................................................................................... 48 5.5 CONCLUSIONS .......................................................................................................................................................... 49 5.6 RECOMMENDATIONS ................................................................................................................................................. 50
6 OVERALL CONCLUSIONS AND RECOMMENDATIONS FOR ALL PROJECTS ......................................................... 54

EHDC HNDU: Heat Techno-Economic Feasibility Studies
P a g e | 14
7 GOVERNANCE AND THE IMPACT ON FINANCIAL ANALYSIS, PROJECT MANAGEMENT AND FUTURE SUCCESS
OF EACH PROJECT.................................................................................................................................................... 55
7.1 INITIAL CONCLUSIONS AND RECOMMENDATIONS OVER GOVERNANCE ................................................................................. 58 7.2 THE POTENTIAL PRIZE OF INVESTING IN LOW-CARBON HEATING NETWORKS ........................................................................ 60
8 CO2 EMISSION IMPACTS .................................................................................................................................. 61
9 BIOMASS FUEL REQUIREMENTS FOR ALL THREE SITES .................................................................................... 62
APPENDIX 1: HEAT NETWORKS AND LEISURE CENTRES IN EAST HAMPSHIRE: EHDC AND LEISURE CENTRE
OPERATORS PERSPECTIVE ....................................................................................................................................... 64
A1.1 ENERGY AND CARBON EMISSIONS ISSUES .................................................................................................................... 64
APPENDIX 2: SUMMARY OF FINANCIAL MODELLING RESULTS ................................................................................ 67
A2.1 MODELLING RESULTS: PENNS PLACE .......................................................................................................................... 67 A2.2 MODELLING RESULTS: ALTON ................................................................................................................................... 70 A2.3 MODELLING RESULTS: WHITEHILL & BORDON ............................................................................................................. 74
APPENDIX 3: PENNS PLACE AND TARO LEISURE CENTRE: SURVEY & ENERGY DATA ................................................ 77
A3.1 PENNS PLACE ......................................................................................................................................................... 77 A3.2 TARO LEISURE CENTRE SURVEY .................................................................................................................................. 81 A3.3 ENERGY DATA INTRODUCTION ................................................................................................................................... 82 A3.4 TECHNOLOGY OPTIONS AND CHOICES ....................................................................................................................... 100 A3.5 MODELLING SCENARIOS: SUMMARY OF KEY INPUTS .................................................................................................... 103 A3.6 PENNS FIELD: NEW HOUSING ................................................................................................................................. 103
APPENDIX 4: ALTON ENERGY DATA ....................................................................................................................... 105
A4.1 SURVEY ............................................................................................................................................................... 105 A4.2 ALTON LEISURE CENTRE: COMBINED HEAT AND POWER (CHP) ..................................................................................... 106 A4.3 NEW LEISURE CENTRE AND NEARBY ADDITIONAL HEAT LOADS ........................................................................................ 106 A4.4 BENCHMARK ENERGY DATA: DEVELOPMENT OF MODELLING SCENARIOS ......................................................................... 107 A4.5 TECHNOLOGY OPTIONS AND CHOICES ....................................................................................................................... 108 A4.6 SUMMARY OF TECHNOLOGY APPRAISAL .................................................................................................................... 109 A4.7 DEVELOPMENT OF MODELLING SCENARIOS................................................................................................................ 110
APPENDIX 5: WHITEHILL & BORDON: ENERGY DATA ............................................................................................. 111
A5.1 DATA ................................................................................................................................................................. 113 A5.2 TECHNOLOGY OPTIONS AND CHOICES ....................................................................................................................... 114 A5.3 SUMMARY OF TECHNOLOGY APPRAISAL (WHITEHILL & BORDON) .................................................................................. 116 A5.4 DEVELOPMENT OF SCENARIOS ................................................................................................................................. 117
APPENDIX 6: DISTRICT HEATING NETWORKS: TECHNOLOGY AND ISSUES ............................................................. 119
A6.1 DISTRICT HEATING INSULATED PIPEWORK ................................................................................................................... 119 A6.2 TYPICAL BELOW ROAD URBAN PIPEWORK AND SERVICES SET UP ...................................................................................... 119 A6.3 THE PRACTICAL ASPECTS OF LAYING PRE-INSULATED PLASTIC PIPEWORK ......................................................................... 121 A6.4 PIPEWORK TYPES: PLASTIC VS STEEL ......................................................................................................................... 122 A6.5 CIBSE HEATING NETWORK GUIDE ........................................................................................................................... 123 A6.6 HEAT NETWORK TECHNOLOGIES: CRITERIA FOR REVIEW AND ASSESSMENT ....................................................................... 124 A6.7 CAPITAL EXPENDITURE, GREEN ENERGY SUBSIDIES AND FUTURE ENERGY PRICES .............................................................. 132

EHDC HNDU: Heat Techno-Economic Feasibility Studies
P a g e | 15
APPENDIX 7: COMPARISON BETWEEN ECONOMIC ASSUMPTIONS USED IN PHASE I HNDU STUDY AND THIS STUDY
.............................................................................................................................................................................. 134
A7.1 GAS BOILER EFFICIENCY ......................................................................................................................................... 134 A7.2 BIOMASS BOILER EFFICIENCY .................................................................................................................................. 134 A7.3 BUILD RATE ......................................................................................................................................................... 134 A7.4 BOILER AND GAS-CHP SIZE .................................................................................................................................... 134 A7.5 CHP EFFICIENCY ................................................................................................................................................... 135 A7.6 BIOMASS FUEL COST ............................................................................................................................................. 135 A7.7 HEAT SALES PRICE ................................................................................................................................................ 135 A7.8 GAS PRICE ........................................................................................................................................................... 136 A7.9 ELECTRICITY PRICE ................................................................................................................................................ 136 A7.10 WHOLESALE PRICE OF ELECTRICITY (FROM GAS-CHP) ................................................................................................ 136 A7.11 OPERATION AND MAINTENANCE COSTS .................................................................................................................. 136 A7.12 NON-DOMESTIC CONNECTION CHARGES ................................................................................................................. 137 A7.13 DOMESTIC CONNECTION CHARGES ......................................................................................................................... 137
APPENDIX 8: INDICATIVE DESIGN FOR ENERGY CENTRE AT PENNS PLACE ............................................................. 138

EHDC HNDU: Heat Techno-Economic Feasibility Studies
P a g e | 16
2 HEAT TECHNO-ECONOMIC FEASIBILITY STUDIES
2.1 INTRODUCTION Of the eight opportunities identified as part of the heat mapping project in Phase 1 of this project8, East
Hampshire District Council (EHDC) has prioritised three sites for more in-depth feasibility assessment.
This report summarises the feasibility assessments for Penns Place, including the Taro Leisure Centre,
Alton Leisure Centre (and other nearby heat loads) and the Whitehill & Bordon regeneration project. Of
these, the Penns Place assessment is the most detailed, reflecting the perceived viability of the scheme
and the availability of background data, whereas the assessment at Alton and Whitehill and Bordon will be
in outline only.
This work has been developed in accordance with the EHDC’s Energy Strategy, which calls for a
commercial approach to drive increasing amounts of renewable energy generated and supplied in East
Hampshire. This Strategy identified the Heat Network Delivery Unit (HNDU), part of the Department of
Energy and Climate Change, as a potential funder of renewable heat research in the district. EHDC’s bid to
HNDU was successful and this has enabled the Council to continue with more detailed assessment of the
main renewable and low-carbon heat opportunities identified during Phase 1.
Figure 4: Phase I heat network opportunities (Peter Brett Associates, 2015)
The objective of the current project is to bring
forward schemes that have the same or better
financial returns compared to those that might be
realised from EHDC property investments, which are
currently estimated to be around 7% per annum.
The three Projects are:
Penns Place and Taro Leisure Centre
Alton Sports Centre (and nearby heat loads)
Whitehill and Bordon new Town Centre
It was agreed during the inception meeting (12th
Oct 2015) that 50% of the project effort should
focus on Penns Place (and the adjacent Taro leisure
centre), with 25% allocated to Whitehill & Bordon
and 25% to Alton.
This allocation of time was driven by the type of
feasibility work required (i.e. detailed at Penns Place,
outline only for Alton and Whitehill and Bordon).
8 Heat Masterplan for East Hampshire (Peter Brett Associates, 2015).

EHDC HNDU: Heat Techno-Economic Feasibility Studies
P a g e | 17
The overall scope of this project is to:
Generate accurate energy data that can provide a solid foundation for future analysis and
investments.
To review technology options that offer viable, low-carbon and financially attractive heat (and
power if appropriate) options utilising decentralised heat networks.
To develop suitable scenarios utilising appropriate technologies with pragmatic and sensible
assumptions, and to carry out detailed financial appraisals.
To review options for possible governance of any viable projects thatemerge from this assessment.
To draw conclusions and make recommendations to EHDC.
2.2 EHDC ENERGY STRATEGY TARGETS The current energy strategy (2014-2020) focuses on carbon dioxide reduction and clean energy
generation from renewables. The Energy Centre and heat networks opportunity at Whitehill & Bordon is
considered to be of strategic importance to EHDC as it creates an opportunity to deliver a long-term
project with the potential for substantial income over future decades.
EHDC is prepared to invest in energy infrastructure from its reserves, prudential borrowing and also from
the £6.5M fund that will be created by the Whitehill & Bordon Section 106 agreement. Whilst this fund
will be used for a variety of measures, including water conservation, green space and sustainable
transport, a proportion has been allocated to a heat network if the decision to proceed is made.
Whilst the Whitehill & Bordon project is still some way into the future, the proposed mix of retail, leisure,
education, residential and health facilities would create a significant opportunity for distributed heating
and power.
Taylor Wimpey Dorchester will not only provide the space for an Energy Centre at Whitehill & Bordon but
will also be responsible for delivering utilities to building plots. Key questions relating to pipe networks,
energy consumers, timing and development phases are therefore critical for determining the viability of
energy infrastructure investments.
2.3 CURRENT DRIVERS FOR LOW-CARBON HEATING The interest in low-carbon heating is being driven by four important factors:
The regeneration project at Whitehill & Bordon, delivered through the Whitehill & Bordon
Regeneration Company led by Taylor Wimpey Dorchester, requires:
o Evidence of the efficacy of heat networks and business models for detailed planning
discussions and for future work.
o Space for an Energy Centre has been agreed and a Section 106 agreement has been
negotiated with some funds for heat networks included.
Investment at Penns Place EHDC offices has been undertaken to improve the energy efficiency of
the building. Additional investment is currently being considered by the Senior Management
Team and EHDC for the Taro Leisure Centre as part of a new 15 year contract for all Leisure Centre
facilities owned by EHDC.
o In addition a 96-unit housing development is planned to be built nearby at Penns Field.
Alton Sports Centre is being replaced, with outline planning already agreed.

EHDC HNDU: Heat Techno-Economic Feasibility Studies
P a g e | 18
o Along with the new Sports Centre two small adjacent heat loads could also be supplied by
a low-carbon source and insulated heat pipework via a network.
o A 305 unit housing development is planned nearby.
The opportunity to reduce greenhouse gas emissions directly in EHDC owned and/or managed
buildings and via planning requirements at other development sites.
EHDC owns and also has access to woodland, and several biomass fuel supply chain studies have already
been completed. This includes a study by the Forestry Commission in 2011 which indicated, for example,
that significant wood fuel resources, around 120,000 cubic metres of wood per year are available within
20 km of Whitehill and Bordon (enough to heat at least 18,000 homes)9. The consideration of wood chip
based biomass heating in East Hampshire is therefore of considerable interest to EHDC, not only because
of the land and woodland owned by the Council, but also because of the role the Council could play in
bolstering the existing timber and wood fuel supply chains that already exist (or which are at an
embryonic stage).
2.4 CARBON EMISSION REDUCTION TARGETS EHDC have set out a clear target for a move towards 'carbon neutrality' by 2036 in the Whitehill & Bordon
development. Biomass (heating and power), heat pumps and solar power are three technologies
mentioned in this Master Plan document10.
2.5 TECHNOLOGY APPRAISAL SUMMARY A range of low-carbon heat technologies are potentially available for all three projects. We evaluated
these technologies set against the physical set up of each site, plus a range of other criteria. This appraisal
was carried out for each of the three sites (see Section 2.7.1).
2.6 GAS PRICE UNCERTAINTY All of the sites included in this study are on the gas network. As such, gas-based systems (boilers and CHP
units) are likely to play a key role in the financial analysis carried out.
A graph showing gas (and oil prices) over the past few decades should convince any energy analyst that
predicting prices more than a few years ahead a thankless task, where the credibility of these forecasts is
likely to be questionable. The UK Heren NBP Index (natural gas process) from 1997 to 2015 (see Figure 5)
varies between $2.1/mbtu (million British Thermal Units (mbtu)) and $10.6/mbtu with rapid price
variations of 50% to 100% in both directions in the space of a year or two. Making sense of these real
world market price variations and trying to model ahead 5, 10 and even 20 years ahead is therefore
fraught with difficulties and inherently risky.
9 Whitehill and Bordon: Woodfuel Supply Feasibility Study (Forestry Commission, 2011)
10 Whitehill and Bordon Eco-town Master Plan Summary, Revised May 2012.

EHDC HNDU: Heat Techno-Economic Feasibility Studies
P a g e | 19
Figure 5: UK Heren NBP Index Natural Gas Prices 1997-2015
The assumption since 2008 that oil exporters would seek a fiscal break-even point when setting prices (or
production quotas that achieved similar ends) has been discredited since late 2014. At their November
2014 meeting, and despite falling prices and a growing surplus of production over demand, OPEC
(Organisation of the Petroleum Exporting Countries) decided to maintain high production quotas for a
range of reasons. Critically, a key driver was to maintain and increase market share, to drive higher cost
producers from the market or make them vulnerable to take-over, and to drive the hitherto burgeoning
US shale gas industry to the wall.
The outlook for gas demand and UK prices is highly complex and beyond the remit of this study to
describe and analyse in depth. However, with North Sea gas production levels continuing to fall, the UK is
essentially heavily reliant on natural gas imports from mainly Norway and Netherlands, and LNG imports
from Qatar. Prices will heavily depend on the attitude of OPEC, as and when it drives a number of shale
gas-oil and other higher cost producers from the market, plus the state of the Chinese and wider global
economy. In addition the impacts of the drive towards low carbon economies in the aftermath of the
Paris COP21 agreement may be felt over time.
Recent rapid changes in the oil and gas markets have made predicting future prices a significant dilemma.
Clearly gas price projections made even a few years ago are now wildly inaccurate and revisions have had
to be made (see Figure 6). There must hence be a significant degree of risk placed on all current gas price
projections, including those provided by DECC. As can be seen, in the space of just two years, DECC
forecasts for gas prices for the year 2020 have fallen by approaching 30%.

EHDC HNDU: Heat Techno-Economic Feasibility Studies
P a g e | 20
Figure 6: Gas Price Forecasts (Source: DECC Fossil Fuel price Projections, September 2014)
For the purposes of this study we have assumed either status quo gas prices (increasing by annual RPI
only), or 2.5% per annum average price inflation for both gas and wood chip fuel. This may well be a
conservative assumption and we carried out sensitivity tests where gas prices increased by a further 25%.
2.7 WHY SHOULD EHDC INVEST IN LOW-CARBON HEAT NETWORKS? For EHDC, we suggest the following objectives may be important in deciding whether to invest in Whitehill
and Bordon (and the other two projects) and in guiding any ultimate decisions over governance if
investment takes place:
To counter-balance reducing Central Government Grants through secure and sustained future
revenue streams from low carbon investments, by accessing internal capital or very low cost
capital from other sources (e.g. PWLB).
In addition, to identify other sources of funding for renewable heat projects by, for example,
accessing EU funding (e.g. ERDF).
To encourage increased economic development in the District by making or attracting
investments into low-carbon initiatives that have a wider policy reach, for instance building local
skills capacity, and additional investment in supply chains for renewable energy and generating
new jobs (e.g. developing wood fuel supply hubs and chains).
To control and reduce energy costs internally through investments in energy efficiency and low-
carbon technologies.
To recycle revenues from successful investments locally in order to increase investment in
community and/or environmental projects.
To support the delivery of the Whitehill & Bordon Green Town Vision towards a low or zero
carbon future.

EHDC HNDU: Heat Techno-Economic Feasibility Studies
P a g e | 21
To reduce carbon emissions from both EHDCs own estate, and other buildings to achieve
reductions and meet (or exceed) targets in line with internal targets, and also national carbon
reductions targets.
2.7.1 Technology Appraisal A range of technology options were assessed for each site. This involved considering technical viability,
whether the technology could be ‘fitted’ into the site, what integration issues the technology presented
and their financial viability. The summary for three sites is shown in table below.
It should be note that this appraisal was focused on the ability of a technology to generate useful heat at a
scale and cost that was suitable for the overall opportunity presented. Solar photovoltaics (PV), for
example, were therefore not considered, although they still could make a viable contribution to the
overall sustainability of the opportunities considered.
Moreover, solar PV can be integrated with hot water and heating systems via solar ‘switches’ that are
designed to divert power into heating hot water when excess solar PV energy is available (rather than it
being exported to the grid at a lower overall cost saving). This option should be considered, therefore, if
solar PV forms part of the overall solution at each site (n.b. this was not part of the scope of this study).

EHDC HNDU: Heat Techno-Economic Feasibility Studies
P a g e | 22
Table 6: Summary of technology appraisal for all three sites
Project Technology
Option Technically
Viable Spatial Issues –
suitable? Integration
with existing?
Costs – attractive or
not?
Overall Assessment
Penns Place-Taro Centre
Solar HW Y – but limited
roof space N – roof not
strong enough Y
N – poor rate of return
No
GSHP
N – Temperature
output not suitable
N – playing fields not
suitable to dig up
N N No
Biomass Y
Y – space for energy centre and wood chip
delivery
Y Y Yes
Gas-CHP Y Y – one existing Y Y Yes
Alton
Solar HW
Y – could be integrated with
new Sports Centre
Y – new scheme
could design this in
N – poor rates of return
No
GSHP Y but spatial
needs make it not possible
No space for heat collection
Y but spatial issues
Y No
Biomass Y Y Y – space for
boilers and fuel store
Y Yes
Gas-CHP Y Y Y Y Yes
Whitehill & Bordon
Solar HW
Y – but not enough output
to make it worthwhile
Y – if roof space used
Y N – poor rates
of return No
GSHP
Y – but only for a small % of
heat and cooling load
N – only enough space for a
modest scheme Y
N – only for limited load
near space for heat
collection
Possible for smaller mini-
network
Biomass Y Y Y Y Yes
Gas-CHP Y Y Y Y Yes
2.8 STUDY METHODOLOGY In order to undertake the technical and financial assessments required for this study, the project team has
undertaken the following approach:
1. Surveys and meetings:
a. Study visits were undertaken at each of the three sites. In addition, several meetings
were held with EHDC officers at Penns Place.
b. At Penns Place this included extensive discussion with estates and facilities managers to
fully understand the condition of the buildings, how they are operated and the main
building services (i.e. boilers, CHP, air handling, air conditioning). This work was
facilitated by representatives of Places for People, the current facilities management
company responsible for the Taro Leisure Centre. The EHDC offices were also surveyed in
some detail to ascertain the likely impact on energy consumption following extensive
refurbishment of the main office facades.

EHDC HNDU: Heat Techno-Economic Feasibility Studies
P a g e | 23
c. At Alton we again undertook a basic survey of the interior and exterior of the existing
leisure centre (again with Places for People). The grounds of the facility were also visited
to understand the relationship between the proposed new leisure centre and other
buildings in close proximity that might benefit from district heating. We also developed
energy data and scenarios for a projected 305 house development nearby.
d. We undertook a short visit to Prince Philips Barracks and the Technical Training Area (TTA)
at Whitehill & Bordon. At the former, we walked the area that will become the new town
centre. A representative of EHDC accompanied the visit and provided an overview of the
main development phases. During this visit we visited the existing (gas-based) energy
centre with an engineer from Carillion (n.b. this was not a scheduled meeting and access
was only gained by chance). This engineer provided useful information as to the route of
the existing district heating network and the capacity of the energy centre. This
information was critical in developing the scenarios for Whitehill & Bordon. Towards the
end of the project we received a brief status report on the quality of the existing
underground pipework via EHDC staff.
2. Energy data collection:
a. Data on electricity and gas consumption at Penns Place was received from both EHDC and
Places for People (for the Taro Leisure Centre). This data spanned five years and included
information on the volume and value (EHDC only) of energy used, along with other
information including VAT, levies, standing charges and so on. Despite a non-disclosure
agreement being in place, cost data for the Taro Leisure Centre was not provided. To
overcome this, the rates per unit for gas and electricity for the EHDC offices were applied
to the Taro data.
b. Data from the outline planning applications for new housing at Penns Field and the
former Lord Treloar Hospital site opposite Alton Leisure Centre were captured. These
documents contained information about the number of houses and their size from which
assumptions around energy use could be generated.
c. For Whitehill & Bordon, a number of outline planning and master planning documents
were consulted. In addition, EHDC provided several additional documents that provided
additional context and details relating to energy, sustainability and the deployment of
renewable energy technologies and district heating.
d. Information from two studies looking at the potential for wood fuel in East Hampshire
was also consulted.
e. References to the above documents, along with other sources of reference information,
have been made throughout this report.
3. Data analysis:
a. Data on gas and electricity consumption between 2011 and 2015 (gas) and 2006/7 and
2015/16 (electricity) was provided by EHDC for Penns Place, and by 'Places for People' for
the Taro Centre. For the other projects at Penns Field, Alton Sports Centre and associated
new housing, and Whitehill and Bordon, energy data was generated through appropriate
methodology and assumptions, and use of reports produced for planning purposes.
2.8.1 Energy Data Availability and Analysis

EHDC HNDU: Heat Techno-Economic Feasibility Studies
P a g e | 24
Our analysis for Penns Place and Taro Leisure Centre focused on the last five most recent years of
complete data, as follows:
Gas: 2011 to 2015
Electricity: 2010/11 to 2014/15
a. The data was aggregated and summarised in order to create an overview of the heat and
power loads and the cost per kWh of energy paid by the Council. Once completed, the
following additional processing steps were completed:
Extrapolation for missing data
Degree days correction
b. This process is described in more detail below. For the other projects we developed new
energy data based on information from a variety of sources (including planning
applications, master-planning and sustainability reports).
c. While daily or weekly metering data is not available for both sites, the pattern of heat and
power use is well known by users and energy managers at both sites.
d. Any missing data was filled in artificially by estimating missing months using averages and
proportions from previous years.
e. The heat load (based on the gas data and excluding any electrical heating) was corrected
for external temperatures using heating degree days. The full methodology for this
process is covered in Appendix 3.
f. The impact on the heat load for EHDC offices, caused by uprated windows and insulation,
was also factored in to the scenarios by modelling the estimated changes in heat loss.
Again, the detailed methodology for this is covered in Appendix 3.
g. For Penns Field, Alton Leisure Centre and Whitehill & Bordon we based our heat load
calculations, and subsequent scenarios, on data contained within planning applications
(and other related documents). We then applied standard rates for gas and electricity
used based on prevailing building regulations (e.g. 2013 Part L11; CIBSE Guide F12). This
produced a more consistent approach between all of the sites, rather than being based on
a range of assumption used by each developer (some of which were deliberately
overstated).
h. Energy cost data for Penns Place was based on the average gas and electricity prices (per
unit) from the EHDC data set. These prices were also applied to the Taro Leisure Centre
data set. Assumptions for the value of heat and power generated by the gas-CHP unit at
the Taro Leisure Centre were also based on EHDC costs per unit.
2.8.2 Financial appraisal methodology: The approach was as follows:
a. Select a representative ‘central case’ energy data set (heat and power) for the appraisal.
b. Model via a bespoke model the impact of investing in a range of new heat (mainly) and
power technologies such as biomass, gas-CHP and GSHP, to provide the heat and power
11
Approved Document L1A: Conservation of fuel and power in new dwellings, 2013 edition (HM Government, 2014). 12
Energy Efficiency in Buildings: CIBSE Guide F, 3rd
Edition (Chartered Institute of Building Services Engineers, 2012).

EHDC HNDU: Heat Techno-Economic Feasibility Studies
P a g e | 25
required on site, when set against standard gas heating and fossil fuel based power from
the grid.
c. The quality of existing data for Penns Place and Taro Leisure Centre was good. We also
used prevailing prices for gas and power (adjusted for Whitehill & Bordon) as our central
price data for all three projects.
d. Capital expenditure (CAPEX): Estimated costs were derived from tenders, completed
projects, information from district heating and renewable energy specialists, and data
from supplier companies (as well as industry benchmark costs for items such as insulated
pipework)13.
e. The analysis is modelled through 20 years, 25 years and 40 year time periods. These are
typical ranges for this type of analysis. For the Penns Place/Taro Leisure Centre project
we have focussed much more on the 20-year time horizon as this is the time period when
the existing Renewable Heat Incentive (RHI) is available for biomass fuelled technologies.
f. Representative input costs for fuel and power (natural gas, wood chip, electricity), and
costs for operations and maintenance, including servicing, call-out, spares and major
rebuilds (in the case of CHP generally every 7-8 years), were gathered from suppliers and
recent tenders.
g. We then carried out cash flow modelling to produce Internal Rate of Return (IRR) and Net
Present Value (NPV) calculations for each project.
h. Based around the ‘central’ case for each modelling scenario we also carried out sensitivity
tests as follows:
i. Gas price variations +/-25% (n.b. we also modelled the most recent DECC gas
price data in several scenarios to asses to assess the impact of these)
ii. Wood chip price variations +/-25%
iii. Electricity price variations +/-25%
iv. Capital cost variations +/-25%
v. Variations in the level of RHI tariff likely to be available to the project, ranging
from full (current) tariff, to 50% of the current level and zero (i.e. no RHI available).
While the central case for Penns Place-Taro was assumed to be current full tariff
for medium biomass, for the other projects this was assumed to be 50% of this
tariff, with sensitivity tests at zero and 100% of existing tariffs.
i. The ‘benchmark’ test of 7% IRR was then used to gauge how investments compared to
those rates of return achieved by the existing EHDC property portfolio.
13
We have based the capital costs on typical ‘Design and Build’ tenders where specialist companies are used. Higher costs could occur where standard tendering using long-term framework supply companies are used (if these are in place).

EHDC HNDU: Heat Techno-Economic Feasibility Studies
P a g e | 26
Table 7: Summary of financial model inputs
Input Standard Assumptions Variation Assumptions
Gas prices 2.75 p/kWh 2.50 p/kWh (Whitehill & Bordon) Wood Chip prices 3.00 p/kWh
Power prices 11.00 p/kWh 10.00 p/kWh (Whitehill &
Bordon)
NPV Discount Rate 7% †
O&M costs (for CHP includes spares, call-out + rebuild every 7-8 years)
Gas-CHP 5-7% of CAPEX pa Biomass 2-3% pa
Natural gas boilers 1% pa GSHP 1-2% pa
Inflation Rate 2.5%
all as per the standard assumption inputs
Gas price inflation Static or 2.5% pa real
Wood chip price escalation Static or 2.5% pa real
Power price escalation Static or 2.5% pa real Notes: † Based on the current IRR for the Council’s property portfolio. We accept that this is a relatively high discount rate for local authorities
but have left this as a conservatism.
2.8.3 Data Sources and Assumptions a. Gas, wood chip and power prices: Based on existing data for EHDC and commercial data.
b. Gas-CHP capital cost and servicing, spares, call-out and rebuild costs: Provided by a
major supplier (Cogenco) supplemented with data from other commercial sources14.
c. Biomass capital costs and servicing, spares and call-out costs: These were gained from a
range of recent tenders administered by SEWF (and others) which we have access to, as
well as quotes from several biomass boiler suppliers and servicing companies.
d. Future natural gas costs: We reviewed the data offered via DECC gas projections15 as well
as other sources such as World Bank and Deloitte. We also checked historical trends to
gauge whether future price projections were credible. While gas prices are important for
the economics of gas-CHP, where the difference in prices between gas inputs and power
outputs is critical, for biomass boiler system economics, it is the price margin differential
between gas and wood chip prices that is more important. Note that multiple annual gas
contracts are available, often in rolling three-year time periods, and this can provide a
good control of risks in this area.
e. Future heating fuel costs: We adopted steady gas and wood chip prices in real terms (i.e.
increased at RPI only) or modest escalating prices (e.g. +2.5% per annum for gas and
wood chip prices) which will slowly increase the margin between the two fuels over time.
For Penns Place and Taro Leisure Centre this will increase the existing 0.25p/kWh(th)
margin in favour of gas by a few % per annum.
f. Gas cost uncertainty: This is discussed in Section 2.6. After a review of options we used a
baseline assumption of steady state gas prices (increasing at RPI only) as well as testing at
2.5% price escalation, and for several of the scenarios, recent DECC gas projections.
g. Future wood chip prices: After modest real increases in prices from 2010-2014, prices
have steadied and in some cases fallen. Despite a reasonable surge in wood chip demand
14
Personal communication Mike King, Aberdeen Heat and Power (December 2015). 15
DECC Fossil Fuel price Projections (September 2014).

EHDC HNDU: Heat Techno-Economic Feasibility Studies
P a g e | 27
for the biomass heating market, the big explosion of fuel demand expected under the RHI
has not taken place. There is hence a significant surplus in supply over current and
expected demand, and prices for the foreseeable future are expected to remain stable.
Multiple annual wood chip contracts are also available in the South-East market, and this
can again provide control of risks in this area. There are substantial wood resources across
the County and region and no indications of shortage which would substantially affect
prices.
2.9 DEVELOPING THE MODELLING SCENARIOS Based on the above inputs and assumptions, we developed a total of 10 main Scenarios which we used to
test out financial viability, matching up appropriate heat (and Power) loads and CO2 reduction impacts
(see Table 8). Of these 10 scenarios, one for each project site was recommended - Scenarios 2, 5 and 7.

EHDC HNDU: Heat Techno-Economic Feasibility Studies
P a g e | 28
Table 8: Summary of financial scenarios
Scenario
(for 20, 25 and 40 years)
Technology Option Biomass/gas-CHP/Other
Central CAPEX Central Heat demand kWh
Fuel pricing
RHI Maintenance
Costs
1
Penns Place
Taro (inc. 50% CHP heat)+EHDC
Biomass takes over 95% of heat loads
Assumed biomass packaged boiler system based at Taro Centre and feeding into Taro and Penns Place
£500,000 and sensitivity test at +/-25%
Capex for 2nd biomass boiler at year 21 = £275,000 2.68M
kWh(th)
See
Table 7
Prevailing RHI tariffs as at Jan 2016
£2,800 per year and then index-
linked
2
Penns Place
Taro (inc. 100% CHP heat)
Lower demand for biomass heat due to rejected CHP heat being captured and used at no cost.
Biomass capacity reduced to 450 kW
£550,000
Capex for 2nd biomass boiler at year 21 = £245,000
£2,700 per year and then index-
linked
3 Penns Place-Taro and
96 homes
As above plus extra 200kW biomass capacity and pipework to the housing development at Penns Field
£1.21M
Capex for 2nd biomass boiler at year 21 = £375,000
4.9M kWh(th)
Prevailing RHI tariffs as at Jan 2016 for first
boiler but 50% of RHI tariff for 2nd boiler in 6
years’ time
£5,200 per year and then index-
linked
4
New Alton Sports Centre + Health Centre
and The Gurdons
2 x 400kW biomass boilers
Biomass provides 95% heat (gas the remainder)
£620,000 and sensitivity test at +/-25%
Capex for 2nd biomass boilers at year 21 = £375,000
3.09M kWh(th)
1.002M kWh(e)
Assume 50% current tariffs, then full and zero
£3,200 per year and then index-
linked
4A
As Scenario 4 but with 125kW(e) gas CHP
variation and smaller biomass
2 x 300 kW biomass boilers
125kW(e) and 200kW(th) heat gas CHP plant – working at 80% efficiency and for 5000 hours a year
£720,000 (£470K biomass + £170K CHP + £80K pipework)
Capex for 2nd biomass boilers at year 21 = £350,000
CAPEX for 2nd CHP in year 16 at £145,000 and 3rd CHP unit at year 31 = £150,000
50% of current and zero
£3,000 per year for biomass
£12,500 a year for CHP and then index-
linked for both
5 As Scenario 4 but with 200kW Gas CHP and
small biomass (400kW)
400kW biomass
200kW(e) Gas CHP unit
£760,000 includes 400kW biomass and gas CHP unit
Capex for 2nd biomass boiler at year 21 = £335,000
CAPEX for 2nd CHP in year 16 at £170,000 and 3rd CHP unit at year 31 = £180,000
£2,600 per year for biomass
£22,,000 for the CHP unit and then index-
linked for both

EHDC HNDU: Heat Techno-Economic Feasibility Studies
P a g e | 29
Scenario
(for 20, 25 and 40 years)
Technology Option Biomass/gas-CHP/Other
Central CAPEX Central Heat demand kWh
Fuel pricing
RHI Maintenance
Costs
6 As Scenario 4 plus new
Housing
3 x 400 kW biomass boiler
plus a 200kW(e) gas CHP plant working for c.5,000 hours
£3.75M
9.37M kWh (th) 2.53M kWh (e)
As above
50% of current and zero
£7,000/yr biomass +
£30,000/yr CHP
7
Whitehill & Bordon Town Centre
2MW Gas CHP and 2000kW biomass heat plus 3,000kW gas boilers
3.69M kWh(th);
16.63M kWh(e)
£6,500/yr biomass +
£110,000/yr CHP
7a Lower CHP/higher
biomass
1MW CHP
4MW biomass
4MW gas
£3.842M As per Scenario
7
CHP - £55,000 per year; biomass £12,500 per year and then index-
linked
As per Scenario 7
8 Part of Whitehill &
Bordon (limited network)
500kW(th) GSHP
200kW(e) gas CHP
600kW(th) gas boilers
CHP - £210,000 GSHP - £700,000
GSHP 3.35M kWh, 200kW
CHP plant 1.5M kW(th) and
1.0M kWh(e)
Tested at current GSHP tier 1 and Tier 2 RHI
tariffs
£3,500 per year GSHP and
£30,000 per year CHP
Notes: Green shading denotes recommended scenarios.
Of the multiple scenarios assessed, the recommended Scenarios offering the best rates of return linked to practical viability were Scenarios 2
(Penns Place-Taro), 5 (Alton) and 7 (Whitehill and Bordon).

EHDC HNDU: Heat Techno-Economic Feasibility Studies
P a g e | 30
3 PENNS PLACE AND TARO LEISURE CENTRE
3.1 INTRODUCTION Penns Place covers around 2.5 hectares and consists of the EHDC main offices and the Taro Leisure Centre.
A 96 unit domestic building programme has been mooted for Penns Field, the nearest point of which lies
approximately 250-300 metres from the leisure centre.
Penns Place is the main location for EHDC staff and consists of two interconnected office blocks. The Taro
Leisure Centre is located within 200 metres on the same site, and is separated from the council offices by
a car park and access roads.
The north and south Penns Place office buildings were constructed during the 1960s and have undergone
various changes, including the addition of a link building in the 1990s. The original buildings are poorly
insulated and the heat distribution system is a mix of mainly radiators and some electric heaters. Various
insulation measures have been planned and are due for completion in late 2015/early 2016. In
combination, these are expected to reduce energy consumption and increase comfort levels significantly.
The buildings also suffer from excess heat in the summer which is exacerbated by the lack of air
conditioning. The building facade consists of an aluminium frame with fibre glass inset panels. Insulation
behind some of these panels has been hampered by the presence of asbestos.
The Taro Leisure Centre was constructed in 1980s. The wet (pool) side was constructed first in the early
1980s and the dry side followed towards the end of the decade. It is of brick and steel construction. The
facility is open between 6am and 11pm seven days per week.
The Taro Centre was constructed in two phases. The dry side of the centre was completed in 1983 and the
wet side in 1996. The wet side houses the leisure and main pools and the cafe. The spa and sauna are
combined with the pool area. The pool water is maintained at 29 Celsius and the air temperature at 30
Celsius.
The Centre has three plant rooms:
Pool plant room:
o Large basement level room containing all of the infrastructure related to water treatment,
filtering and circulation for the wet side. Also contains a 125 kWe gas CHP engine and
associated switch gear.
o The plant room is susceptible to flooding and pumps are used to remove excess water.
o Surplus heat from the CHP unit is vented to the atmosphere via a heat exchanger at the
rear of the building.
Boiler plant room:
o Located at the opposite end of the building to the pool plant room. Total installed (gas
boiler) capacity is 475 kW.
Air handling plant room:
o The air handling unit includes a gas fired heater to condition the pool air. It also provides
condition air to other parts of the Centre.

EHDC HNDU: Heat Techno-Economic Feasibility Studies
P a g e | 31
3.2 THE IMPACT OF FAÇADE REFURBISHMENT ON HEAT LOADS It was important to take into consideration the impact of the recent façade refurbishment on the total
energy demand for Penns Place. In combination, these works are likely to have a relatively large impact on
the kWh/m2 ‘result’ for North Block. For South Block the impact is likely to be lower due to the fact that
some glazing improvements have been in place for some time, plus the reduced opportunity to improve
the non-glazed parts.
Given that façade refurbishment can have a significant impact on heat demand, it was necessary to
develop different scenarios to take into account likely outcomes, as they affect the average heat demand
in kWh/m2. These are assumed to be 50% reductions for North Block and 10% reductions for South Block
(this is described fully in Appendix 3).
3.3 ENERGY DATA Our analysis of historical energy data has produced a set of inputs that will be used for the analysis of heat
network opportunities at Penns Place-Taro. These are summarised in the following table.
Table 9: Summary of annual heat and power inputs at Penns Place and Taro Leisure Centre
Current Heat Demand (kWh) Penns Place Taro Centre Total
Total annual average HDD corrected heat demand: 346,000 2,332,000 2,678,00016
Total annual average electricity demand: 416,000 1,050,000 (grid + CHP)
1,466,000
Cost per unit (p/kWh)
2015 cost per unit of gas (Excl. VAT): 2.75 2.75 n/a
2015 cost per unit of electricity (Excl. VAT): 11.31 11.31 n/a
5-year average cost per unit of gas (Excl. VAT): 2.37 2.37 n/a
5-year average cost per unit of electricity (Excl. VAT): 10.19 10.19 n/a
GHG (Kg CO2e)
Total annual average GHG emissions – gas: 64,000 428,000 492,000
Total annual average GHG emissions – electricity: 192,000 225,000 417,000
Total annual average GHG emissions – CHP electricity: n/a 260,000 260,000
GHG (Kg CO2)
Total annual average GHG emissions – gas: 12,000 427,000 439,000
Total annual average GHG emissions – electricity: 88,000 223,000 311,000
Total annual average GHG emissions – CHP electricity: n/a 258,000 258,000
Cost (£)
Total annual average cost of energy – gas: £8,400 £55,000 £63,400
Total annual average cost of energy – electricity: £42,300 £50,000 £92,300
of which CHP electricity £13,000 £13,000
Income (£)
Total annual average value of CHP electricity generation n/a £57,000 £57,000
Total annual average value of CHP heat generation n/a £21,000 £21,000
3.4 PENNS PLACE: NEW HOUSING A planning application17 for 96 homes at nearby Penns Field was used to derive a list of proposed
dwellings. We then applied a standard heat load per square meter of internal area to derive heat,
16
450,000 kWh(th) of the estimated ‘waste heat’ from the gas-CHP plant is excluded here.

EHDC HNDU: Heat Techno-Economic Feasibility Studies
P a g e | 32
electricity and hot water loads for each dwelling type. These loads were then aggregated to produce an
overall picture for the 96 dwellings proposed in the 2010 planning application. The results of this exercise
indicate a heat load of around 480,000 kWh of electricity and 1,914,712 kWh of heat per year. The
assumptions behind these figures are described in Appendix 3.
Figure 7: Provisional heat network pipe layout for Penns Place, Taro Leisure Centre and Penns Field
3.5 TECHNOLOGY OPTIONS AND CHOICES The only two options that are potentially viable are gas-fired CHP and/or biomass heating. Ground Source
Heat Pumps are unlikely to be a viable option. They tend to be most effective with new buildings or highly
insulated retrofit buildings, and are unlikely to produce high enough space heating temperatures for the
current style and efficiency of buildings.
Biomass heating is a viable low-carbon option for the site, with good access for fuel delivery, and a
suitable location adjacent to the service area for a packaged biomass Energy Centre and fuel silo.
A replacement gas-CHP either in 2017 when the current CHP service agreement runs out, or shortly after
this, looks like the other good low-carbon technology investment.
The summary of the technology appraisal for Penns Place can be found in the Appendix 3.
17
SDNP/52274/001, 2010 (Status: refused).

EHDC HNDU: Heat Techno-Economic Feasibility Studies
P a g e | 33
3.6 SCENARIOS DEVELOPED AND MODELLING RESULTS All projects (screened with today’s RHI tariff) and are above the 7% IRR target and so financially attractive.
See Table 10 for a summary of the main results.
Scenario 1: Investment in a 500 kW packaged biomass Energy Centre, while keeping the existing
heat main at Taro as it is (though continuing to vent 50% of the CHP unit’s heat). This offers a
good rate of return at c. 14% IRR.
o Scenario 1, however, allows a significant level of 'waste heat' from the CHP unit to
continue, and works financially for the 1st 20 years, but without the RHI from year 20
onwards, it is cash flow negative and there may be no case to continue with biomass after
the first 20 years.
Scenarios 2 and 2a: Investment in a new 400-450kW kW biomass Energy Centre, plus using either
most of the excess heat from the existing gas-CHP unit (or a future replacement gas-CHP unit
located with the new biomass boiler system, and controlled in a more integrated way). This
assumes an early start to the project and accessing the existing level of RHI tariffs for ‘medium
biomass’ plant.
Scenario 3: We assume that no RHI is available in five years-time when the Penns Field housing
development occurs. In addition the extra heat load is not an attractive one for a district heating
network as it is very seasonal, and with very little space heating load for 6-8 months of the year.
Also, the hot water load, while available throughout the year is not constant, with demand mainly
in the morning and early evenings. Such domestic heat loads tend to lead to high heat losses and
greater inefficiencies for a heat network. Though the heat price that can be charged to domestic
consumers may be 6-7p/kWh (current prices), there is no real incentive to proceed early with
pipework extending out to Penns Field at this stage. It would make more sense and reduce project
risks if a decision over investment and location of biomass or gas-CHP systems was left to the time
when the heat load and development is close at hand. A low-cost 'future-proofing' option would
be to ensure that the design and layout of the packaged biomass and gas-CHP system at Taro
Leisure Centre provides sufficient space for an additional biomass boiler to be added in the future.
3.7 CONCLUSIONS It is technically and commercial viable to develop a low-carbon heat network mainly based on biomass
plus using currently wasted CHP heat:
A packaged biomass boiler room based near the Taro Leisure Centre can utilise low-cost wood
chip fuel, with good access and potential to expand in future if necessary.
Assuming the existing 'medium biomass' RHI tariff can be secured (i.e. before the end of 2016) the
project offers relatively low risks and excellent rates of return. It is robust under sensitivity testing,
except where the RHI income reduces significantly.
Securing agreement with the future facilities management operator of the Taro Leisure Centre to
utilise and charge for currently wasted CHP heat, or introduce a new gas-CHP unit integrated with
the new biomass system and controlled with the BMS system, should be an important focus of
discussions with potential operators.
The possible extension of the heat network to a housing development at Penns Field is too
uncertain and risky to be worth making extra investment on at this stage. It is also a relatively
poor heat load with low heat density and intermittent demand making likely heat losses high.

EHDC HNDU: Heat Techno-Economic Feasibility Studies
P a g e | 34
3.8 RECOMMENDATIONS Greater clarity on the governance of this project should be made before further detailed financial
analysis is carried out. A Workshop is planned to secure greater clarity on this.
That further work on the Penns Field housing extension (Scenario 3) should be left until greater
clarity over its timing and actuality is clear. No further analysis on this scenario should be carried
out.
That some generic designs for suitable packaged biomass boiler systems be prepared to indicate
the footprint required for the project.

EHDC HNDU: Heat Techno-Economic Feasibility Studies
P a g e | 35
Table 10: Summary of financial modelling results for scenarios 1, 2, 2a and 318
20 YEAR 25 YEAR 40 YEAR
Scenario description Cumulative Cash flow/
£
IRR/ %
NPV/ £ Cumulative
Cash flow/ £ IRR/
% NPV/ £
Cumulative Cash flow/ £
IRR/ %
NPV/ £
Scenario 1
3.128M kWh(th)/year heat generated
(including 450,000 kWh(th) ‘waste heat’)
– actual demand 2.7M kWh(th); No CHP Integration; 500kW biomass;
Capex £500k;
1,141,623 14% 323,376 780,344 13% 238,737 447,324 13% 202,613
Gas price with real 2.5% increase 1,738,733 17% 553,973 1,857,603 17% 569,945 4,686,489 17% 858,033
Wood price with real 2.5% increase 490,230 9% 71,815 - 394,848 n/a - 122,582 - 4,177,220 n/a - 512,391
Gas price as per DECC 435,128 7% - 16,134 - 249,836 n/a - 168,858 - 2,172,768 n/a - 373,403
RHI 50% 192,868 3% - 152,484 - 168,411 n/a - 237,122 - 501,431 n/a - 273,246
RHI 0% - 755,886 n/a - 628,343 - 1,117,165 n/a - 712,982 - 1,450,185 n/a - 749,106
Scenario 2
heat load as per scenario 1 with waste CHP heat used at no cost; 450kW boiler;
£550k
1,267,176 14% 366,411 1,070,214 14% 317,386 1,255,628 14% 337,499
Gas price with real 2.5% increase 1,895,713 17% 609,145 2,204,171 17% 666,027 5,717,907 18% 1,027,415
Wood price with real 2.5% increase 700,895 11% 147,719 48,573 7% 3,278 - 2,764,669 n/a - 284,082
RHI 50% 434,823 6% - 51,066 237,860 4% - 100,091 423,274 5% - 79,978
RHI 0% - 397,531 n/a - 468,543 - 517,568 n/a - 517,568 - 497,455 n/a - 497,455
2a: Waste CHP heat charged at 2p/kWh
1,496,962 16% 481,663 1,377,478 16% 449,002 1,861,944 16% 501,554
Scenario 3
As per scenario 2 but heat load increased
by 1.914M kWh(th)/year and
charged at 6p/kWh; 650kW biomass; Capex ~ £1.1mln
1,776,328 10% 289,459 1,534,059 9% 226,926 2,006,007 10% 282,498
18
Assuming wood fuel price costs of 3p/kWh, heat sale prices of 6p/kWh, network heat losses of 20%, gross heat sales profit of 1.8p/kWh, a boiler and pipework efficiency of 85%, and a heat sales net income of £34,000 per year.

EHDC HNDU: Heat Techno-Economic Feasibility Studies
P a g e | 36
Figure 8: Cumulative cash flows for scenarios 1, 2 and 3
Sensitivity Analysis for Scenario 1
Sensitivity Analysis for Scenario 2
Figure 9: Sensitivity Analysis for Scenarios 1 and 2
-1,500,000
-1,000,000
-500,000
0
500,000
1,000,000
1,500,000
2,000,000
2,500,000
0 5 10 15 20 25 30 35 40
£
40 yr Cumulative Cash Flow for Scenarios 1, 2 & 3
1 Cash flow 2 Cash flow 3 Cash flow
-300,000 -200,000 -100,000 - 100,000 200,000 300,000
Capex
Gas Price
Wood Chip
Heat load
RHI
Swing on NPV £
+-25% Sensitivity Analysis on Central Case NPV of £323,376
Low
Base
High
-300,000 -200,000 -100,000 - 100,000 200,000 300,000
Capex
Gas Price
Wood Chip
Heat load
Waste heat
RHI
Swing on NPV £
+-25% Sensitivity Analysis on Central Case NPV of £366,411
Low
Base
High
-8.0% -6.0% -4.0% -2.0% 0.0% 2.0% 4.0% 6.0%
Capex
Gas Price
Wood Chip
Heat load
RHI
Swing on NPV £
+-25% Sensitivity Analysis on Central Case IRR of 14%
Low
Base
High
-6% -4% -2% 0% 2% 4% 6%
Capex
Gas Price
Wood Chip
Heat load
Waste heat
RHI
Swing on NPV £
+-25% Sensitivity Analysis on Central Case IRR of 14%
Low
Base
High

EHDC HNDU: Heat Techno-Economic Feasibility Studies
P a g e | 37
Table 11: Scenario 1 - Sensitivity Analysis Table on Central Case
NPV £ IRR %
Central Case 323,376 14%
Capex + 25% 198,376 10%
Capex - 25% 448,376 19%
Gas Price+ 25% 577,664 18%
Gas price - 25% 69,087 9%
Wood Chip Price + 25% 45,970 8%
Wood Chip Price - 25% 600,781 19%
Heat load variation + 25% 476,319 17%
Heat load variation - 25% 170,433 11%
RHI - 25% 85,446 9%
Table 12: Scenario 2 - Sensitivity Analysis Table on Central Case
NPV £ IRR %
Central Case 366,411 14%
Capex + 25% 231,411 11%
Capex - 25% 501,411 19%
Gas Price+ 25% 634,083 19%
Gas price - 25% 98,739 9%
Wood Chip Price + 25% 125,252 10%
Wood Chip Price - 25% 607,570 18%
Heat load variation + 25% 527,403 17%
Heat load variation - 25% 205,418 11%
RHI - 25% 157,672 10%
Waste Heat demand + 25% 384,987 14%
Waste Heat demand - 25% 347,835 14%

EHDC HNDU: Heat Techno-Economic Feasibility Studies
P a g e | 38
4 ALTON LEISURE CENTRE
EHDC is planning to replace the Alton Sports Centre as the current building is reaching the end of its life.
The proposed heating networks project would include the Basingstoke & Alton Cardiac Rehabilitation
Charity (Cardiac Centre), which is also less than 50 metres from the proposed new sports centre, and 10
social housing flats (50 to 125 metres away – see Figure 12).
Allocations for 305 housing units have also been made nearby (former Lord Treolar hospital site) and
these may present further significant opportunities for distributed energy. The closest part of this
development is only around 75-100 metres from the existing leisure centre (although the development
would extend across a wide area and the further point would be up to 4-500 metres from the leisure
centre site).
The three storey Alton Leisure Centre was completed in 1975 and has an internal floor area of 4,990
square meters. The plant room is located at ground level and contains 11 Hamworthy gas boilers installed
as two modules (5 x Purewell and 6 x older Hamworthy models).
The plant room also contains a gas CHP unit which appears to be of the same specification and size (125
kWe (200kW(th)) as the one located at the Taro Leisure Centre. Given the age of the building, it is not
surprising that condition of the plant room is relatively poor compared to the Taro Centre.
4.1 NEW LEISURE CENTRE AND BUILD STRATEGY The proposal for the new sports centre at Alton is for demolition of the existing sports centre and outdoor
sports pitches, and construction of a replacement sports centre with sports pitches and additional
community facilities, together with access, parking and open space. The strategy is to build the new
Sports Centre first, then on completion to demolish the existing building.
4.2 ADDITIONAL HEAT LOADS There are two small additional heat loads nearby. These are summarised in the table below.
Table 13: Heat/power load assumptions for The Gurdons and Basingstoke & Alton Cardiac Rehabilitation Charity
Heat Electricity
Cardiac Rehabilitation Centre (assume 500 m2) 174,500 34,000
The Gurdons (10 x flats) 100,000 50,000
Total 274,500 84,000
Notes: a) CIBSE Guide F indicates 349 kWh heat and 68 kWh electricity for day centres. b) The estimated area of the cardia unit is
500 m2. c) For each flat at The Gurdons we assumed 10,000 kWh of heat and 5,000 kWh of electricity per annum. The Part L rate
of 54.26 kWh/m2
was not used as the internal area of flats is unknown.
4.3 TECHNOLOGY OPTIONS AND CHOICES In principle there could be a range of low-carbon heating (and power) options, including Gas-CHP,
biomass heating and Ground Source Heat Pumps (GSHP). In practice, obtaining the five acres required for
a decent scale GSHP system is simply not feasible given the space constraints on the site and the phased
construction schedule that has been planned.

EHDC HNDU: Heat Techno-Economic Feasibility Studies
P a g e | 39
Biomass heating, however, could offer a practical low carbon option, with multiple boilers located in the
footprint of the new building and a large underground fuel silo located alongside. Access for delivery of
fuel is good on this site.
Gas-CHP is a very attractive technology for the significant and sustained heat and power loads on site, but
offers lower CO2 emission reductions.
While the heat and power loads of a Sports Centre are attractive for high utilisation of both CHP and
biomass boilers, an extension to a proposed 305 housing unit development would offer significant but
much less attractive heat and power loads. With high efficiency domestic buildings, there would be little
space heating demand between May and September, and there would be modest heat loads during the
day.
For the reasons outlined above, biomass and gas-CHP are considered to be the most viable technologies.
A summary of the technology appraisal for Alton can be found in Appendix 4.
4.4 SCENARIOS DEVELOPED AND MODELLING RESULTS We based our scenarios on the replacement Sports Centre at Alton on guidance developed by the
Chartered Institute of Building Services Engineers (CIBSE). CIBSE Guide F (Energy Efficiency in Buildings,
2012) provides a series of energy benchmarks for different types of buildings including sports and leisure
centres.
As the precise design for the leisure centre is not yet available we developed three scenarios using CIBSE
data, the full details of which are provided in Table 14. We then applied these rates to the gross internal
area of the proposed centre (8,500 m2) and selected the 'Average Case' under 'Good Practice' (highlighted
in red in Table 15).
Table 14: Average, best case and worst case benchmarks for Alton new sports centre
Good practice Typical practice
kWh/m2/yr Fossil fuels Electricity Fossil fuels Electricity
Average 332 108 754 172
Best case 158 64 343 105
Worst case 573 164 1,321 258
Table 15: Average, best case and worst case heat and electricity loads for Alton new sports centre (figures in red were adopted)
Good practice Typical practice
kWh/m2/yr Fossil fuels Electricity Fossil fuels Electricity
Average 2,819,167 918,000 6,409,000 1,459,167
Best case 1,343,000 544,000 2,915,500 892,500
Worst case 4,870,500 1,394,000 11,228,500 2,193,000

EHDC HNDU: Heat Techno-Economic Feasibility Studies
P a g e | 40
4.5 NEW HOUSING - LORD TRELOAR SITE The planning application19 for the land at the former Lord Mayor Treloar Hospital Site (Chawton Park
Road) was used to derive a list of proposed dwellings. We then applied the same standard heat (and
power) loads used for Penns Field (as described in Appendix 3.6) to derive heat and electricity loads for
each dwelling type.
These loads were then aggregated to produce an overall picture for the 305 dwellings proposed in the
2014 planning application. The results of this exercise (see Table 16) indicate a heat load of around
6,272,307 kWh and 1,525,000 kWh of electricity per year.
Table 16: Summary of dwelling types and derived heat and electricity loads for new housing at Lord Treloar site
Unit Type Qty Area m2
Electricity (kWh)
Space heating (kWh)
Hot Water (kWh/
Household)
Total heat load (kWh/yr)
1 bed flat 14 51 70,000 38,742 207,340 246,082
2 bed flat 11 66 55,000 39,393 162,910 202,303
2 bed house 45 77 225,000 188,011 666,450 854,461
3 bed house 134 97 670,000 705,271 1,984,540 2,689,811
4 bed house 77 134 385,000 559,855 1,140,370 1,700,225
5 bed house 24 172 120,000 223,985 355,440 579,425
Total 305 597 1,525,000 1,755,257 4,517,050 6,272,307
Notes: a) Heat load based on Part L 2013 (54.26 kWh/m2) b) electricity load based on DECC research (average
5,000kWh/dwelling).
4.6 FINANCIAL MODELLING We developed the following Scenarios for Financial Modelling:
Scenario 4: Mainly biomass (2 x 400kW wood chip system) with gas boiler back-up.
Scenario 4A: Smaller biomass (2 x 300kW wood chip system) with a 125kW(e) gas-CHP system and
gas boiler back-up.
Scenario 5: Larger 200kW(e) CHP system, plus smaller 400kW biomass boiler with gas back-up.
Scenario 6: Extending the heat network to include 305 homes by a larger biomass system (3 x
400kW wood chip system) and 200kW(e) gas CHP system, and back-up gas boilers.
We also modelled sensitivities over Capex (+/-25%), gas and power prices (+/-25%), heat loads (+/- 25%)
and RHI tariffs. Where our central RHI case assumes 50% of current ‘medium biomass’ RHI tariffs, we also
modelled either zero RHI or 100% current tariff levels.
4.7 MODELLING RESULTS Only Scenario 4a and 5 pass the screening IRR of 7% and, of the two, Scenario 5 has the better financial
results over the 20, 25 and 40 year terms with an IRR of 11% and payback of 9 years.
19
30021/056, 2014 (Status: Permission granted).

EHDC HNDU: Heat Techno-Economic Feasibility Studies
P a g e | 41
Scenario 4, the biomass only scenario, was assessed with an RHI tariff at 50% of current ‘medium biomass’
levels, and has a 1% IRR or 18 year payback and is loss making without the RHI from year 20. There is no
financial case to continue with biomass from year 20 onwards.
The best case is a larger CHP unit (Scenario 5), as the CHP unit is, not the biomass unit, the main driver of
the economics.
Scenario 6 has an IRR of 3%, or a 14 year payback, though is still cash flow positive without the RHI from
year 20 onwards.
A sensitivity analysis was carried out on Scenario 5 and it shows that electricity price is the key sensitivity.
At 25% lower prices, this is capable of making the project NPV go negative. Under current investment
trends in the power sector, this is unlikely.
On CO2 grounds, CHP offers overall 20-25% CO2 reductions at best compared to gas heating and grid
power, while biomass can offer greater than 45% CO2 savings overall under Scenarios 4, 4A and 6.

EHDC HNDU: Heat Techno-Economic Feasibility Studies
P a g e | 42
Table 17: Summary of financial modelling results for scenarios 4, 4a, 5 and 6
20 YEAR 25 YEAR 40 YEAR
Scenario description
Cumulative Cash flow/
£ IRR/ % NPV/ £
Cumulative Cash flow/
£ IRR/ % NPV/ £
Cumulative Cash flow/
£ IRR/ % NPV/ £
Scenario 4
800kW/ 100% Biomass with head load of
3,094,000kWh; Capex £620,000;
50% RHI
102,114 1% -257,815 -446,045 see
note -384,955 -1,114,402
see note
-457,454
Capex + 25% -52,886 N/A -412,815 -173,693 see
note -165,699 -196,518
see note
-187,473
Capex - 25% 257,114 4% -102,815 -173,693 see
note -165,699 -196,518
see note
-187,473
Gas price with real 2.5% increase 814,493 7% 17,298 -177,454 0% -165,699 -202,476 0% -187,473
Wood price with real 2.5% increase -737,406 see
note -582,028 -251,645
see note
-243,650 -320,011 see
note -310,966
RHI 100% 1,337,781 13% 361,948 -173,693 0% -165,699 -196,518 0% -187,473
Scenario 4a
600kW Biomass with small
125kWe Gas CHP; Capex £720,000;
50% RHI
720,446 8% 75,927 584,407 8% 36,588 1,260,252 9% 107,754
Gas price with real 2.5% increase 1,015,549 10% 189,892 1,116,809 10% 200,277 3,355,325 12% 431,675
Wood price with real 2.5% increase 166,546 3% -137,983 -414,897 see
note -270,653 -2,672,149
see note
-500,237
RHI - 100% 1,571,330 16% 502,698 1,435,291 15% 463,358 2,111,135 16% 534,525
RHI - 0% -350,844 -2% -350,844 -390,183 -7% -390,183 -319,017 2% -319,017
Scenario 5
400kW Biomass with 200kWe Gas
CHP; Capex £760,000; 50%
RHI
1,039,781 11% 220,226 1,129,839 11% 229,095 2,590,472 12% 384,961
Gas price with real 2.5% increase 1,108,658 11% 246,826 1,254,100 11% 267,300 3,079,457 12% 460,563
Wood price with real 2.5% increase 638,841 8% 65,388 406,493 7% 6,699 -255,995 see
note -55,133
DECC Gas Price 962,362 10% 183,022 1,016,950 10% 184,430 2,303,358 11% 321,840
RHI - 100% 1,648,932 16% 525,753 1,738,989 16% 534,622 3,199,623 16% 690,488
RHI - 0% 430,631 5% -85,300 520,689 6% -76,432 1,981,322 8% 79,435
Scenario 6 new houses increases heat and electrical
loads; 3 X 400kW Biomass; 200kWe Gas CHP; Capex
£1,246,000; 50% RHI
494,018 3% -322,664 11,061 0% -444,367 475,813 3% -396,528
Gas price with real 2.5% increase 844,963 5% -187,133 644,209 4% -249,702 2,967,339 7% -11,311
Wood price with real 2.5% increase -448,146 -7% -686,518 -1,688,717 see
note -966,972 -6,213,052
see note
-1,430,697
RHI - 100% 1,862,621 10% 363,775 1,379,664 10% 242,072 1,844,416 10% 289,912
RHI - 0% -874,585 -11% -1,009,104 -1,357,542 see
note -1,130,806 -892,790 -4% -1,082,967
Notes: Where the IRR is showed as not applicable this is because the cumulative cash flow intersects with the x-axis twice and the IRR is re-set to zero on two occasions. For these
cases the return their investment by 40 years remains negative (i.e. they never return on their investment).

EHDC HNDU: Heat Techno-Economic Feasibility Studies
P a g e | 43
Figure 10: Cumulative cash flows for Alton scenarios 4, 4a, 5 and 6
Sensitivity Analysis for 5
Figure 11: Sensitivity for Alton scenario 5
Table 18: Scenario 5 – 20 year sensitivity analysis for central case
NPV £ IRR %
Central Case 220,226 11%
Capex + 25% 30,226 7%
Capex - 25% 410,226 16%
Electricity + 25% 572,563 16%
Electricity - 25% - 132,110 4%
Gas Price+ 25% 249,558 11%
Gas price - 25% 190,894 10%
Wood Chip Price + 25% 49,480 8%
Wood Chip Price - 25% 390,973 14%
Heat load variation + 25% 281,572 12%
Heat load variation - 25% 158,881 10%
RHI +25% (of base case) 296,608 12%
RHI - 25% (of base case) 143,845 10%
-1,500,000
-1,000,000
-500,000
0
500,000
1,000,000
1,500,000
2,000,000
2,500,000
3,000,000
0 5 10 15 20 25 30 35 40
£
40 yr Cumulative Cash Flow for Scenarios 4, 4a, 5, 6
4 Cash flow 4a Cash Flow 5 Cash Flow 6 Cash Flow
-400,000 -200,000 - 200,000 400,000
Capex
Electricity
Gas Price
Wood Chip
Heat load
RHI
Swing on NPV £
+-25% Sensitivity Analysis on Central Case NPV of £220,226
Low
Base
High
-8.0% -6.0% -4.0% -2.0% 0.0% 2.0% 4.0% 6.0% 8.0%
Capex
Electricity
Gas Price
Wood Chip
Heat load
RHI
Swing on IRR%
+-25% Sensitivity Analysis on Central Case IRR of 11%
Low
Base
High

EHDC HNDU: Heat Techno-Economic Feasibility Studies
P a g e | 44
4.8 CONCLUSIONS In summary:
Installing a low-carbon heat network at the proposed new Alton Sports Centre is technically viable.
Current and likely short-term future economics (less than five years) make a ‘biomass only’ heat
scenario unviable on financial grounds.
A mixed biomass and gas-CHP approach leads to a much better financial outcome than biomass
heating alone.
At this relatively early stage of planning and design, it would make sense to plan for a hybrid heat and
power option at Alton, including gas CHP and biomass (with gas back-up boilers). This would mean that:
It would be relatively simple to offer heat to the Cardiac Centre and The Gurdons at the same
time as services are being excavated for the new Sports Centre.
At the same time the modelling demonstrates that if RHI (or equivalent) support is at only 50% of
current levels, it is the gas-CHP system that offers the better IRR (14%) than biomass heating
alone.
There is certainly an opportunity to ‘future-proof’ the heat network at Alton if the nearby housing
development goes ahead. If so, then there would be opportunities for extending the heat network
initially to the housing development site while excavations take place around the new Sports Centre.
Space would also be needed in the boiler room for an additional biomass boiler, CHP unit and gas boilers.
4.9 RECOMMENDATIONS That a hybrid gas-CHP and biomass package be utilised for further work and analysis. More
detailed risk-benefit assessments should be used in future to decide whether a greater or lesser
emphasis on biomass heating should be utilised (Scenarios 4a and 5).
That no further work be carried out on the housing extension to the heat network (Scenario 6)
until greater clarity over the development timing and actuality is available.

EHDC HNDU: Heat Techno-Economic Feasibility Studies
P a g e | 45
Figure 12: Provisional heat network pipe layout for new Alton Sports Centre site and housing development
5 WHITEHILL AND BORDON
5.1 INTRODUCTION The former Ministry of Defence site at Whitehill & Bordon has been allocated for a major new mixed use
development. Whilst most of the existing buildings will be demolished, the former sergeant’s mess and
Sandhurst complex will be retained and incorporated into the new development. A new high street,
linking the existing settlement with the new development, will be formed from the A325 and into the
redevelopment site. This will generate a number of commercial heat loads that will be important in the
consideration of a heat network.
We undertook a short visit to Prince Philips Barracks and the Technical Training Area (TTA) at Whitehill &
Bordon. At the former, we walked the area that will become the new town centre. A representative of
EHDC accompanied the visit and provided an overview of the main development phases. During this visit
we visited the existing (gas-based) energy centre with an engineer from Carillion. This engineer provided
useful information as to the route of the existing district heating network and the capacity of the energy
centre. This information was critical in developing the scenarios for Whitehill & Bordon.
There are two pre-existing heat networks at the Whitehill & Bordon site:
Prince Philip Barracks network:
o Extensive heat network serving a number of large buildings.
o Four large (1.9MW) gas boilers are housed in a brick and steel framed Energy Centre that
was constructed in 1980.
o The underground pipework is around 1km.

EHDC HNDU: Heat Techno-Economic Feasibility Studies
P a g e | 46
o Each building has its own plant room with plate heat exchangers and calorifiers for
domestic hot water.
Technical training area (TTA):
o Above ground heat distribution for training and education buildings.
The TTA heat network is not suitable for re-use or refurbishment, as much of it is above ground and will
be removed as part of the TTA redevelopment.
While the condition of the heat distribution system is not known in detail, being more than 40 years old
and with evidence of some leakage in the system, it is assumed that the existing pipework could not be
retained, reconfigured and recommissioned for the new development. The existing pipe-runs may be
usable and a further assessment is needed. Even if this is not the case, then the Energy Centre itself
appears to be worth retaining.
A number of outline planning and master planning documents were consulted. In addition EHDC provided
several additional documents that provided additional context and details relating to energy,
sustainability and the deployment of renewable energy technologies and district heating.
5.2 ENERGY DATA We initially utilised the basic energy data offered by AMEC as part of the ‘Whitehill & Bordon Garrison
Development: Sustainability and Energy Statement’ (Nov 2014). We further refined this as follows:
Updating the varying sub-sections of development to focus on those identified as moving forward
under Phase 1 in the new town centre.
We reduced energy consumption data to more accurately reflect Building Regulations (2013)
standards and to take into account AMEC’s suggested reduction of 20% to take into account
uncertainties and over-estimates.
We utilised benchmark data (e.g. via CIBSE) for certain types of domestic and non-domestic
buildings to assess likely energy consumption figures and hot water use.
We utilised monthly energy data from supporting reports carried out for adjacent parts of the
new Whitehill & Bordon town which were relevant.
The energy data was reworked to take account of currently higher Building Regulations (2013), and
benchmarked with above average examples of non-domestic building such as schools, leisure buildings,
retail and offices. We also reviewed some of the cost data provided for an earlier heat networks study and
adjusted these to be closer to industry and recent tendering standards20. The majority of buildings in the
Whitehill & Bordon development will be new-build, plus a much smaller number of refurbished existing
buildings. As such, the energy data utilised to assess heat network based options is based on estimates
and projections.
We based our heat load calculations, and subsequent scenarios, on data contained within planning
applications (and other related documents – see Table 19). We then applied standard rates for gas and
electricity used based on prevailing building regulations (e.g. 2013 Part L5; CIBSE Guide F).
20
Gas CHP district heating Feasibility study for former Louisburg Barracks.

EHDC HNDU: Heat Techno-Economic Feasibility Studies
P a g e | 47
Table 19: Summary of building types for the new town centre at Whitehill & Bordon
Site ref Use classification Domestic/
Non Domestic
Total No.
Units
Build area (m
2)
Annual electricity demand (kWh/yr)
Annual heat demand (kWh/yr)
Build phase
Budds Lane Secondary school Non-domestic - 75,000 3,000,000 11,250,000 1
Budds Lane Housing Domestic 70 25,000 700,000 1,442,000 2a/b
TTA South Primary school Non-domestic - 28,000 1,120,000 4,200,000 3a
South Town Cente
Housing Domestic 120 22,000 1,200,000 2,472,000 2b
South Town Cente
Commercial and retail
Non-domestic - 39,300 5,109,000 2,358,000 1
North Town Centre
Housing Domestic 512 93,000 5,120,000 10,547,200 2b
Camp Road Housing Domestic 38 10,100 380,000 782,800 1
Total 740 292,400 16,629,000 33,052,000
Notes: Source – AMEC, Nov 2014.
We also developed data for hot water demand using the same approach for the new housing at Alton (see
Appendix 4). The final set of heat loads used for financial modelling is shown in Table 20.
Table 20: Annual heat and electricity loads for new Whitehill & Bordon town centre based on building regulations (Part L, 2013)
Town Centre (Part L 2013)
Heat + Hot Water (kWh/yr) Electricity (kWh/yr)
Commercial 17,808,000 9,229,000
Domestic 19,103,826 7,400,000
Total 36,911,826 16,629,000
Our analysis at Whitehill & Bordon is focussed on the proposed new town centre area (former Prince
Phillip Barracks). Already at this location is a c.1 km heat network supplied by large gas boilers, housed in
a dedicated Energy Centre, which is used to heat most the main buildings.
The quality and condition of the pipework in this existing network will need to be assessed carefully, but
in principle the network route and existing energy centre offers a lower cost early start to building a heat
network in the new town.
Our strategy was to include low-carbon options such as biomass heating and/or gas-fired CHP around the
current Energy Centre, and then when sufficient heat load has developed, to add to this by building a new
Energy Centre in the land allocated for this. This will significantly reduce costs in the early phase of this
development, while heat loads build up.
5.3 TECHNOLOGY APPRAISAL AND SCENARIOS With new energy efficient buildings, the heat density will be critical in the economics of any heat network
proposed. The new town centre at Whitehill & Bordon offers the best prospects, while the purely housing
related developments in other parts of the new town offer much less attractive opportunities.

EHDC HNDU: Heat Techno-Economic Feasibility Studies
P a g e | 48
As far as the low-carbon technology options, we reviewed these and concluded that the following were
potentially suitable:
Biomass heating
Gas-fired CHP
GSHP (albeit in a more limited way targeting a small number of closely linked buildings)
Smaller- and larger-scale biomass-CHP options were discounted. Our financial appraisal therefore
focussed on three main technology combinations:
Scenario 7:
o 2MW gas-CHP system, with 2MW biomass and 3MW gas for residual load and back-up.
We assumed the power generated was supplied to the commercial loads only to maximise
value and reduce costs212223.
Scenario 7a:
o c.4MW biomass heating system (3-4 boilers) focussed scenario with a smaller-scale 1MW
gas-CHP system and 4MW gas boilers for residual load and back-up. Power is supplied to
commercial buildings only.
o In the absence of the RHI or similar support, the economics of this scenario will be
considerably lower than Scenario 7 so we did not model this option in detail. We did
however establish the impact of a more biomass orientated approach in the event of
carbon saving becoming a policy imperative with greater value placed on CO2 emissions.
Scenario 8:
o A smaller ring-fenced heat network development for 1 to 2 buildings, including a hotel,
focussing on using GSHP (500kWth) plus a 200kW(e) gas CHP system and back-up gas
boilers.
o The CHP system essentially powers the heat pump system at lower cost than grid power
as well as additional power loads for the hotel.
Full details of the technology appraisal for Whitehill & Bordon can be found in Appendix 5.
5.4 SCENARIOS AND MODELLING RESULTS All scenarios were developed with an RHI tariff based on 50% of the existing large biomass tariff', gas and
wood chip prices at 2.5 p/kWh, and import power prices at 10 p/kWh.
Scenario 7 shows a 14% IRR, or 7 year pay back, but the sensitivity analysis shows it is extremely sensitive
to electricity prices. A 25% fall in the electricity price (to 7.5p/kWh from 10p/kWh) swings the NPV by
21
Personal Communication with Mike King, Aberdeen Heat and Power (December 2015). 22
For accredited systems on or after Jan 1st
2016. 23
Scenario 7 involves investment in a larger gas-fired CHP system (2 x 1MWe). Operating at c.5,500 hours per annum, the system covers the majority of the commercial building power and 80% of commercial building heat requirements. Domestic housing heat needs for >700 units could double heat loads which could be met by gas and biomass boilers. While beyond the scope of this project, the costs of a private wire network in the new town centre could be assessed in future to see if the maximum benefits of lower-cost power generated by the CHP system can be captured.

EHDC HNDU: Heat Techno-Economic Feasibility Studies
P a g e | 49
more than £3mln taking it negative (4% IRR). Clearly, understanding future electricity prices is important
when screening this investment)24 25.
The Scenario 7 sensitivity analysis shows all other sensitivities are trivial in comparison to electricity price
reductions including RHI subsidy rates (which we assume to already be small at ~ 1p/kWh).
Scenario 7a shows the impact of reducing the CHP size and increasing the biomass contribution. The IRR
drops to 10% or 9 year pay back and so the larger CHP capacity in Scenario 7 is financially better.
Both the sensitivity analysis and the difference between scenario 7 and 7a show that the CHP unit has a
bigger impact on value than the biomass capacity and it is better to have a larger CHP unit as long as the
spark spread is favourable and there is sufficient commercial power load to sell the electricity to.
Scenario 8 models supplying approximately 1/8th of the total heat load by way of CHP and ground source
heat pumps (GSHP). It cannot be compared directly against scenario 7 and 7a. The IRR is 11% and the
heating cost would reduce significantly when compared to gas. The cases of no RHI and full RHI were
looked at and show a big impact on NPV. The central scenario assumes half of the current RHI
(4.42p/kWh for tier 1 and 1.32p/kWh for tier 2).
5.5 CONCLUSIONS All the scenarios are modelled over 20, 25 and 40 years, and assumptions have been made for
replacement CHP units and biomass boilers at the appropriate point in time. Despite the need for re-
investment in later years, the 20/25/40 year economics show that the financials get better over longer
time frames. In summary:
The new town centre offers a potentially attractive mix of commercial and domestic heat and
power loads, suitable for a heat network working with a combination of gas CHP, biomass heating
and gas back-up (peak load) boilers.
We modelled a hybrid scenario combining a 2MW capacity gas CHP system, plus 2MW of biomass
heating, and 3MW of gas boiler heating – Scenario 7. This offers reasonable rates of return, mainly
driven by power savings from the gas CHP unit.
At this stage, the low carbon heat network project looks to have practical, technical and financial
promise for the proposed town centre area, and is worth pursuing further as development details
emerge.
The biomass viability is heavily dependent on the existence of the RHI or equivalent.
The existence of an existing 1km heat network with Energy Centre is a potential opportunity to
save initial capital costs, build a heat load and then bring on a second new Energy Centre when
the heat load merits this.
24
We do not think this drop in prices is at all likely, given the costs of new generating capacity planned such as Hinkley Point C, a range of renewables capacity, and gas power plant. 25
Even at this Outline Feasibility study stage, we are conscious that this size of CHP covers more than the commercial buildings power demand of 9.3 million kWh via private wires (i.e. 2000kW x 6000 hours = 12mkWh) and would necessitate either exporting to the grid at much lower prices (c.5p/kWh) or to some of the domestic power load. Our variation Scenario 7A uses a 1MW CHP plant, which at 6500 hours of operation per annum would cover 70% of the non-domestic load. For this larger-scale CHP Unit, a heat to power ratio of 1.25 is assumed.

EHDC HNDU: Heat Techno-Economic Feasibility Studies
P a g e | 50
The existing heat network should be surveyed in some detail to ascertain its condition
(underground network and building connections), routing and opportunities for retention and re-
use.
The relative impacts of each technology in reducing CO2 emissions is a key policy issue. The gas-
CHP system offers a 20-25% CO2 reduction from conventional gas heating and brown grid power;
while biomass offers 80% reductions compared to standard gas heating, and around 40-45% CO2
reductions under Scenario 7.
5.6 RECOMMENDATIONS That an early review of the quality and condition of the existing heat network take place to
establish whether it can be used in the new extended heat network. An initial assessment
including detailed review of pipework condition should be commissioned. A key aim would be to
verify condition and to determine whether existing pipe runs can be utilised or not. At the same
time the existing Energy Centre and immediate environs need to be assessed to determine the
level of flexibility it offers (e.g. for gas-CHP) and whether packaged biomass boiler plant can be
installed nearby and fully integrated. Once this is complete, the potential cost saving from re-
using existing infrastructure can be clarified.
That a site visit to a large gas-CHP system with heat network, plus a visit to the nearby CHP
supplier Cogenco (part of Veolia group) be considered in order to review real world experience
and impacts of gas CHP systems.
That a GSHP-CHP hybrid be considered as a possible sub-set option for the wider heat network
and that a visit to an existing GSHP heat network be considered.
Figure 13: Approximate route of pre-existing Whitehill & Bordon heat main (based on conversation with
Carillion engineer during Nov 2015). Existing Energy Centre highlighted in red.

EHDC HNDU: Heat Techno-Economic Feasibility Studies
P a g e | 51
Figure 14: Whitehill & Bordon redevelopment plan showing detail for new town centre (within black
dotted line) and position of existing gas-fired energy centre (red box) (Sources: Barton Willmore; SEWF
Ltd)

EHDC HNDU: Heat Techno-Economic Feasibility Studies
P a g e | 52
Table 21: Summary of modelling results for Whitehill & Bordon
20 YEAR 25 YEAR 40 YEAR
Scenario description
Cash flow benefit/ £
IRR/ %
NPV/ £ Cash flow benefit/ £
IRR/ %
NPV/ £ Cash flow benefit/ £
IRR/ %
NPV/ £
Scenario 7
2MWe CHP/ 2MW Biomass/ 3MW Gas/
Total Capex £3,742,000
8,277,628 14% 2,460,650 11,197,779 15% 3,054,679 24,413,795 15% 4,474,683
Capex £2,972,000 8,277,628 18% 3,230,650 11,197,779 19% 3,824,679 24,413,795 19% 5,244,683
No RHI Case 6,396,707 12% 1,517,251 9,316,858 12% 2,111,280 22,532,873 13% 3,531,284
Gas price with real 2.5% increase 7,214,116 13% 2,049,933 9,279,074 14% 2,464,764 16,863,421 14% 3,307,314
Wood price with real 2.5% increase 6,328,954 13% 1,708,093 7,682,134 13% 1,973,777 10,579,242 13% 2,335,713
Scenario 7a 1 MWe CHP/ 4MW
Biomass/ 4mw Gas/ Total Capex £3,842,000
5,698,989 10% 1,052,328 5,787,682 10% 1,033,178 10,504,755 11% 1,538,421
Scenario 8 4,849,000 heat supplied by 200kWe CHP/500kW
GSHP
1,574,928 11% 324,151 1,368,470 10% 262,362 2,717,461 11% 406,261
No RHI case 7,164 0% (462,180) (199,294) -2% (523,969) 1,149,697 4% (380,070)
100% RHI Case 3,142,692 18% 1,110,482 2,936,234 18% 1,048,693 4,285,225 18% 1,192,592

EHDC HNDU: Heat Techno-Economic Feasibility Studies
P a g e | 53
Sensitivity Analysis for 7
Figure 15: Sensitivity testing results for scenario 7
Figure 16: Cumulative cash flows for scenarios 7 and 7a
Table 22: Scenario 7 – 20 year sensitivity analysis on central case
NPV £ IRR %
Central Case (50% large RHI) 2,460,650 14%
Capex + 25% 1,525,150 11%
Capex - 25% 3,396,150 20%
Electricity + 25% 5,663,707 22%
Electricity - 25% - 742,408 4%
Gas Price+ 25% 2,007,737 13%
Gas price - 25% 2,913,563 15%
Wood Chip Price + 25% 1,630,778 12%
Wood Chip Price - 25% 3,290,522 16%
Heat load variation + 25% 2,966,305 16%
Heat load variation - 25% 1,954,994 13%
RHI + 25% (from base tariff) 2,696,500 15%
RHI - 25% (from base tariff) 2,224,800 14%
-4,000,000 -2,000,000 - 2,000,000 4,000,000
Capex
Electricity
Gas Price
Wood Chip
Heat load
RHI
Swing on NPV £
+-25% Sensitivity Analysis on Central Case NPV of £2.46mln
Low
Base
High
-10,000,000
-5,000,000
0
5,000,000
10,000,000
15,000,000
20,000,000
25,000,000
30,000,000
0 5 10 15 20 25 30 35 40
£
40 yr Cumulative Cash Flow for Scenarios 7 and 7a
7 Cash flow 7a Cash flow
-15.0% -10.0% -5.0% 0.0% 5.0% 10.0%
Capex
Electricity
Gas Price
Wood Chip
Heat load
RHI
Swing on IRR %
+-25% Sensitivity Analysis on Central Case IRR of 14%
Low
Base
High

EHDC HNDU: Heat Techno-Economic Feasibility Studies
P a g e | 54
6 OVERALL CONCLUSIONS AND RECOMMENDATIONS FOR ALL PROJECTS
While each of the three projects can stand on its own feet in financial terms and have varying timescales
for investment, reviewing these collectively does give a broader sense of opportunities for an ESCo
considering investment in all three projects. We consider these in summary form below.
Table 23 provides a summary of the headline results from the financial modelling:
Blue:
o These scenarios pass the basic 7% IRR ‘benchmark’ test that was applied to all scenarios.
This test relates to the current IRR targeted by EHDC’s investment strategy.
Green:
o These are the most favourable IRR results for each of the three sites.
Orange:
o These scenarios fail the IRR test.
Table 23: Summary of modelling results for all three sites
Cumulative cash flow benefit £ -
20years
Cumulative cash flow benefit £ -
25years
Cumulative cash flow benefit £ -
40years
IRR %
20yr
IRR %
25yr
IRR %
40yr NPV £ 20yr NPV £ 25yr NPV £ 40yr
PP-Taro 1 1,141,623 780,344 447,324 14 13 13 323,376 238,737 202,613
PP-Taro 2 1,267,176 1,070,214 1,255,628 14 14 14 366,411 317,386 337,499
PP-Taro 3 1,776,328 1,534,059 2,006,007 10 9 10 289,459 226,926 282,498
Alton 4 102,114 -445,045 -1,114,402 1 (-) (-) (-) (-) (-)
Alton 4a 720,446 584,407 1,260,252 8 8 9 75,927 36,588 107,754
Alton 5 1,038,781 1,129,839 2,590,472 11 11 12 220,226 229,095 384,961
Alton 6 494,018 11,061 475,813 3 0 3 -322,064 -444,367 -396,528
W&B 7 8,277,628 11,197,779 24,413,795 14 15 15 2,460,650 3,054,679 4,474,683
W&B 7a 5,698,989 5,787,682 10,504,755 10 10 11 1,052,328 1,033,178 1,538,421
W&B 8 1,574,928 1,368,470 2,717,461 11 10 11 324,151 262,362 406,261
TOTAL SCENARIOS
2,5,7 10,583,585 13,397,832 28,259,895 n/a n/a n/a 3,047,287 3,601,160 5,197,143

EHDC HNDU: Heat Techno-Economic Feasibility Studies
P a g e | 55
7 GOVERNANCE AND THE IMPACT ON FINANCIAL ANALYSIS, PROJECT
MANAGEMENT AND FUTURE SUCCESS OF EACH PROJECT
There are a wide range of ownership and management models for a heat network type of project. They
essentially range from a pure public sector venture to a purely private sector project. In between, a range
of hybrid options involving both private and public sector financing, design, operation, fuel supply, day to
day management and decision-making are possible.
The key differentiating factors are:
The degree of control required via governance to direct the project towards it objectives.
The degree of risk the project sponsor is willing to carry in order to exercise that control.
The return on investment the project is able to deliver relative to the sources of capital available.
Figure 17: Governance models for Funding, Running and Managing Heat Networks
As Figure 17 indicates, the level of control, risk, the investment required, and expected rates of return
define the choice of governance model. There are examples of all three main models – public, private and
hybrids – in the UK with a number of variations according to local circumstances. One of our Team
members has worked with a wide range of local authorities and housing associations employing models
across this range, and has inputted into their governance decisions. He also sits on the Boards of a
community-owned heat network system in Scotland and a municipally-owned SPV in the Upper Lee Valley
in NE London.
Driving the governance model of choice is an important objective for EHDC. Objectives include carbon
emissions reduction, affordable energy or economic development with local jobs. Increasingly local

EHDC HNDU: Heat Techno-Economic Feasibility Studies
P a g e | 56
authorities are concerned with energy security to improve the resilience of their areas in the face of a
variety of challenges ranging from severe weather events to economic volatility. For others it may be a
purely commercial enterprise to secure future revenues for the host local authority at a time when central
Government revenues are falling.
Whilst localised energy can contribute to achieving all of these objectives it is important to prioritise them,
as this will define the degree of control that needs to be exercised over the project in order for it to
deliver the desired outcomes. For host organisations such as local authorities and housing associations,
the degree of control is maximised the closer ownership sits to them and minimised the further away it
resides.
For EHDC, and based on the guidance given to the Consultants team by relevant staff, the following may
be among the more important objectives:
To counter-balance reducing Central Government Grants through secure and sustained future
revenue streams from low carbon investments, by accessing internal capital or very low cost
capital from other sources (e.g. Public Works Loan Board - PWLB).
In addition, to identify other sources of funding for renewable heat projects by, for example,
accessing EU funding (e.g. European Regional development Fund - ERDF).
To encourage increased economic development in the District by making or attracting
investments into low-carbon initiatives that have a wider policy reach, for instance building local
skills capacity, and additional investment in supply chains for renewable energy and generating
new jobs (e.g. developing wood fuel supply hubs and chains).
To control and reduce energy costs internally through investments in energy efficiency and low-
carbon technologies.
To recycle revenues from successful investments locally in order to increase investment in
community and/or environmental projects.
To access capital grants and renewable energy revenue streams (e.g. the RHI) from public sector
sources (central Government and Europe) while these are available.
To support the delivery of the Whitehill & Bordon Green Town Vision towards a low or zero
carbon future.
To reduce carbon emissions from both EHDC’s own estate, and other buildings to achieve
reductions and meet (or exceed) targets in line with internal targets, and also national carbon
reductions targets.
With these objectives, the model would tend to be more Public or Hybrid to allow more of the project
value to be retained for wider EHDC and community benefit. Thereafter the governance model chosen is
fundamentally about access to and use of capital for the initial and subsequent investments.
Private-owned ESCOs will use commercial or corporate debt and will therefore require a return on capital
above 12 – 15%. If the project cannot physically deliver an IRR to match this expectation then this route is
closed off unless the host organisation is prepared to make a capital injection to improve the rate of
return.
In contrast, local authorities can access low cost capital through the PWLB (2.75%) and therefore projects
with a 6-7% IRR will be financially viable. Hybrids sit between these two positions and will depend on the
structuring of debt and equity particularly if it is split between two or more parties (such as a joint
venture).

EHDC HNDU: Heat Techno-Economic Feasibility Studies
P a g e | 57
Investors, lenders and contractors participating in a project will take account of risk when calculating their
fee or return on capital. Lowering specific or overall risk will therefore reduce costs and managing the
risks of a project is therefore an important activity that needs to be carried out in detail. Figure 18 below
shows in outline how some of the risks can be managed.
Figure 18: Identification of Risks and their Mitigation
Risk is a good thing conceptually because it focuses attention on the important aspects of the project,
whether that be the initial design, the technology choice and performance of the technology, the access
and guarantees over fuel prices and supplies, the level of maintenance, heat pricing formula, or dealing
with bad debts and uncertain heat loads. This helps to prioritise actions to mitigate these risks. It is
important to note that risks can be managed for all of these and other risks.
In conclusion, the decision on the choice of governance model is mediated through these three elements
of control, cost of capital and risk and can be summarised in Figure 19.
The Governance model which is ultimately utilised will impact on the financial modelling, and can be
significant. While there are advantages and disadvantages of each model, clearly a purely private sector
approach will – all else being equal - lead to higher rates of return being expected, and require higher heat
prices for consumers to achieve those rates of return. We have simulated that to some extent with our
sensitivity test of increasing capital costs of each project by 25%.

EHDC HNDU: Heat Techno-Economic Feasibility Studies
P a g e | 58
Figure 19: Range of Governance Options for Heat Networks
7.1 INITIAL CONCLUSIONS AND RECOMMENDATIONS OVER GOVERNANCE At this initial stage, and based on the modelling results and our assessment of the relative risks of each
project the following points may be useful in recommending which governance models might be relevant
for each project.
7.1.1 The three projects combined The three projects represent a total investment of c.£5 million between 2016 and 2021, with additional
investment in replacement CHP plant and biomass boilers in future years (assuming 15 and 20-year
lifetimes for CHP and biomass systems respectively).
The central case modelled for the three projects produces a positive net cash flow of more than
£10 million over 20 years and more than £28 million over 40 years.
The three projects combined offer a Net Present Value (NPV) of £3,000,000 over 20 years – a
substantial benefit under any criteria.
How much of this Value reaches EHDC or the local community will heavily depend on the
Governance model chosen.
7.1.2 Penns Place-Taro Penns Place-Taro is a low risk investment for EHDC as the energy data and heat and power load
trends are well known and understood. The level of investment at £500,000-£600,000 is relatively
low, and if early action is taken, a substantial 20-year Renewable Heat Incentive (RHI) tariff worth
more than £800,000 can be secured.

EHDC HNDU: Heat Techno-Economic Feasibility Studies
P a g e | 59
The critical element with the Penns Place-Taro project is speed of decision-making in order to
tender, contract and complete the installation within 2016, locking in index-linked RHI revenues
before any substantial changes to the RHI biomass tariffs are made by the Government.
Simply offering the project to an existing private sector ESCO could risk giving away much of the
long-term value of this project. Given the time it takes to set up a new ESCO, whether driven by
strong Council control and leadership, OR a more hybrid option, a transitional approach may be
appropriate. This might seek to lock in a selected specialist biomass district heating company to a
minimum 3 to 5-year design, build and operate contract, linked to strong oversite via a dedicated
and experienced EHDC staff person (possibly supported by a consultant). During this initial period,
if a dedicated ESCO is then set up, it can take over management of the project at an agreed point.
7.1.3 Alton This is a low-risk project utilising well-known technologies and fuels. The scale of the heat network
in its initial phase is relatively small, hence minimising risks. Only if and when the heat network
might extend to the major housing development nearby would the risks of the project increase.
A Council driven ESCO or a hybrid model would ensure that the bulk of the benefits of the project
would return to the Council.
While the timescale of this project is more relaxed than Penns Place-Taro, it will be important that
a dedicated member of staff (or a consultant reporting to EHDC) be engaged early on with
developers as the design of the new Sports Centre takes shape. That way, key low-carbon
technologies can be retained in the design.
7.1.4 Whitehill and Bordon This is a much bigger and more complex scheme than the other two, and would require a £3.75
million investment over 3-6 years. At this stage, the project looks to have practical, technical and
financial promise and is worth pursuing further as details emerge. Uncertainties over energy data,
final building decisions, heat network routes, timing and the pragmatic use of an existing Energy
Centre and heat pipework route remain.
An existing EHDC staff person is already embedded part-time with the developers, so information
flows and key decisions can be anticipated and managed. The willingness of the developers to
engage in an ESCO type activity can hence be explored and tested early on in the process, allowing
a range of ESCO models to be evaluated.
The project possibly lends itself more to a hybrid type ESCO, where EHDCs cheap capital (or access
to), policy targets and expertise can be married to a more private sector partnership involving
technical and financial representatives of the commercial and domestic developments. If EHDC
decided that they were willing to take on more of the capital investment and other project risks,
then several dedicated staff members (possibly supported by consultant(s)) would be required to
manage the project successfully.
7.1.5 Summary These initial conclusions and recommendations are meant to stimulate discussion rather than offered as
definitive conclusions. At this stage of the project a formal seminar is has been recommended to discuss
the range of governance options in detail with appropriate EHDC staff and elected officials would be
useful in order to give guidance on the direction of travel for EHDC once this has been held and feedback
obtained. This lies beyond the formal role and timing of this project.

EHDC HNDU: Heat Techno-Economic Feasibility Studies
P a g e | 60
7.2 THE POTENTIAL PRIZE OF INVESTING IN LOW-CARBON HEATING NETWORKS At this initial stage, the following points may be useful in highlighting the significant potential of low-
carbon heat networks for EHDC, and in recommending which models of governance might be relevant.
The three projects represent a total investment of c.£4.9 million between 2016 and 2021, with
additional investment in replacement CHP plant and biomass boilers in future years (assuming 15
and 20-year lifetimes for CHP and biomass systems respectively).
The central case modelled for the three projects produces a positive net cash flow of £10.6M over
20 years. There is a fair degree of conservatism included with this analysis, though it heavily
depends on future electricity, wood and gas prices.
The three projects combined offer a Net Present Value (NPV) of more than £3M (20 years) and
£5.2M (40 years).
These conclusions remain robust under a range of sensitivity tests, except where imported
electricity prices fall considerably or where the RHI tariff falls significantly. We think the former
outcome unlikely, given the costs of new nuclear generating capacity coming forward, plus varied
renewable energy capacity, and new gas plant.
Taken together, the three investments offer a potentially substantial and important business
opportunity. Early investment in these projects offers the potential for long-term positive revenue
streams for EHDC as well as wider economic benefits for the District.

EHDC HNDU: Heat Techno-Economic Feasibility Studies
P a g e | 61
8 CO2 EMISSION IMPACTS
A key driver for all three projects is the need to reduce greenhouse gas emissions. EHDC have indicated a
specific target for Whitehill and Bordon to move the new town to ‘carbon neutrality’ by 2036. While there
are no specific, formal policy targets for other EHDC buildings, projects and initiatives, cutting CO2
emissions is an important policy objective.
When developing the various scenarios for modelling work we utilised the latest DEFRA greenhouse gas
coefficients within the model (see Table 39). This calculated the CO2 equivalent savings when compared to
a benchmark of standard gas heating and imported power from the grid. The Results of the range of
Scenarios developed for the project are summarised in Table 24 .
The more biomass orientated scenarios offer the biggest CO2 savings (see Scenarios 4A and 7). Penns
Place-Taro Scenarios 1 and 2 offer between 62-72% CO2 savings. The lower figure occurs when the
currently dumped heat from the CHP plant is utilised in the Sports Centre and substitutes for some of the
biomass heat in Scenario 1. With Alton, the optimum Scenario in terms of saving CO2 is Scenario 4A which
combines biomass heating with a small CHP plant. Moving to a larger CHP plant (from 125kWe to
200kWe) pushes up CO2 emissions as some of the low carbon biomass heat is pushed out by gas-CHP heat.
For Whitehill and Bordon, the baseline of 16,252 tonnes CO2 equivalent per year is reduced by between
44% to approaching 70% depending on whether a more gas-CHP or biomass orientated approach is taken.
While this is some way from a ‘carbon-neutral’ situation, as planned for in policy statements by 2036, it
does indicate that a substantial reduction of the emissions can be made while investing in a profitable
heat network. This is an important conclusion. Looking at all three Projects – with a baseline generating
some 18,136 tonnes CO2e, under the most biomass orientated options around 66% is cut from baseline
emissions. Under the most cost-effective scenarios the cut in CO2 emissions is lower at 45%.
Table 24: Summary of carbon reduction potential from heat network scenarios (t CO2e)2627
Project and Scenario Total CO2/yr
Baseline (tCO2e)
Total CO2/yr Scenario (tCO2e)
Potential CO2 reduction/year (tCO2e)
Penns Place-Taro 716
Penns Place-Taro Scenario 1: Heat only 204 72%
Penns Place-Taro (>CHP) Scenario 2A: : Heat only 271 62%
Penns Place-Taro-Penns Field: Heat only 804
Penns Place-Taro-Penns Field (Scenario 3): Heat only 223 72%
Alton 1,168
Alton (Scenario 4): Heat only 508 57%
Alton (Scenario 4a): Heat + power 438 63%
Alton Scenario 5: Heat + power 633 46%
Alton+Housing: Heat + power 2,304
Alton Scenario 6: Heat + power 791 66%
Whitehill & Bordon 16,252
W&B Scenario 7: Heat + power 9,106 44%
W&B Scenario 7a: Heat + power 5,097 69%
26
Penns Place: Baseline CO2 based on historical gas data; Alton: Baseline CO2 based on outline planning permissions for new leisure centre and new housing; Whitehill & Bordon: CO2 baseline from AECOM sustainability statement. 27
CO2e – CO2 equivalent which includes CH4 and NO2.

EHDC HNDU: Heat Techno-Economic Feasibility Studies
P a g e | 62
9 BIOMASS FUEL REQUIREMENTS FOR ALL THREE SITES
Based on the full biomass and part-biomass fuelled scenarios of this study, if all three projects
proceeded, wood fuel would need to support heat loads of 20-26 million kWh per annum within
5-7 years.
Assuming a partially dry wood chip fuel with a calorific value of 3,400kWh per tonne28, heat losses
of 10-20% through heat networks and an average boiler efficiency of 80%, the annual demand for
wood chip fuel would be between 6,000 and 7,700 tonnes per annum.
This could extend to approaching 10,000 tonnes per annum where a greater emphasis on biomass
was adopted for Whitehill and Bordon.
Table 25: Estimated wood fuel requirements for all sites
Project-Scenario Biomass kWh (a) Biomass kWh (b) Biomass kWh (c)
Penns Place-Taro Leisure Centre 2,588,595
Penns Place-Taro Leisure Centre-Penns Field
4,503,307 4,503,307
Alton biomass 2,938,984
Alton CHP biomass
2,093,667 2,093,667
Alton larger CHP Biomass 1,493,667
Alton + housing (extra only) 1
5,000,000 5,000,000
W & Bordon 2 7,200,000 7,200,000 12,000,000
Sub-Total 14,221,246 16,703,307 23,596,974
Plus 20% boiler efficiency losses 17,065,495 20,043,968 28,316,369
Plus 15% heat network losses 19,625,319 23,050,564 33,563,824
Total wood chip required (tonnes) 3 5,772 6,780 9,578
Notes: 1 Conservative estimate (full load is 6.7 GWh);
2 2MW biomass and 4MW (3,600 hours and 3,000 hrs respectively);
3
assumed energy content of wood chip at 3,400kWh/tonne.
28
This assumes an average moisture content (MC) of 30%. In reality this will vary. The larger boilers proposed for Whitehill & Bordon could utilise wetter (and cheaper) fuel.

EHDC HNDU: Heat Techno-Economic Feasibility Studies
P a g e | 63
Appendices

EHDC HNDU: Heat Techno-Economic Feasibility Studies
P a g e | 64
APPENDIX 1: HEAT NETWORKS AND LEISURE CENTRES IN EAST HAMPSHIRE:
EHDC AND LEISURE CENTRE OPERATORS PERSPECTIVE
Leisure and Sports Centres feature in all three of the projects which are the focus of this report.
The Taro Leisure Centre is a 1980s existing facility with dry and wet sections and a significant heat
load. It currently uses gas boilers and a small gas-CHP unit to provide its heat and power. The
current heat and power demand is 2.33 million kWh(th) and 1.05 million kWh(e) respectively. .
The Alton Sports Centre is planned to be replaced in 2017 by a new 8,500m2 combined ‘wet’ and
‘dry’ Centre built alongside the old Centre but to modern energy efficiency standards. Sources of
heat and power to serve the new facility have yet to be confirmed, but estimated heat and power
loads are 3.1 million kWh(th) and 1 million kWh(e). This includes small heat loads nearby for the
cardiac health Centre and ten older apartments.
Whitehill & Bordon town centre has a new Leisure Centre planned with similar heat and power
loads as for Alton Sports Centre.
EHDC sub-contracts the operations and management of their Leisure Centre facilities to a private sector
contractor (often set up as a charitable trust). The current contractor is ‘Places for People’. A new 15-year
contract is up for renewal in 2016 (and starting in April 2017).
Six organisations have been shortlisted to take part in the procurement process. This will conclude by the
end of 2016, with the expectation that the preferred bidder will work in partnership with the Council to
deliver the most appropriate heat and power solutions.
The first solutions for review with the preferred bidder will be a decentralised energy solution. This
approach reflects the Council’s corporate and political will to invest in and deliver the East Hampshire
Energy Strategy to demonstrate leadership in this sector.
A1.1 ENERGY AND CARBON EMISSIONS ISSUES The energy loads of Leisure Centres, even under modern high efficiency building standards, generate a
significant year round heat and power load, particularly where swimming pools are involved as well as
‘dry’ facilities.
Small to medium-scale gas-fired CHP units have become quite common for such facilities, while biomass
heating offers a good technical low carbon heating solution. The common duty technology is however
large banks of gas condensing boilers.
There are real opportunities to reduce carbon emissions in this sector via new or retrofitted biomass and
CHP systems. These opportunities are as follows:
Taro Leisure Centre: The current 125kW(e) CHP plant was installed c.2002-03, replacing the
existing single 40kW(e) CHP plant, which ran for approximately 6 years prior to this. The plant is
owned (financed) and maintained by the private company ENER-G, and the current contract is due
to end in March 2017. The plant has clearly been sized to maximise electricity savings benefits and
is ‘over-sized’ as far as heat output is concerned. At present, an estimated 50% of heat output

EHDC HNDU: Heat Techno-Economic Feasibility Studies
P a g e | 65
from the current CHP unit (c.450,000kWh(th)) is rejected via a heat exchanger and fan, leading to
c.83 tonnes CO2 of extra emissions for no energy benefit.
Prior to the current contract ending in March 2017, a decision will need to made as to whether a)
a new or revised contract with ENER-G is signed, b) the CHP plant is replaced with a new re-sized
CHP system, or c) the CHP plant is simply removed. Details of the current CHP contract would
need to be discussed prior to this decision. Options a and b are the most optimal, but the precise
choice will depend on a number of interconnected factors (such as whether the Penns Field
development takes place or not). If a decision is taken to renew or replace this with a new CHP
plant, the existing heat main and controls set-up will require important review and intervention to
ensure that all heat sources are controlled through a Building Management System (BMS)29, and
that greater emphasis on overall system efficiency such that no CHP heat is wasted.
Critical in making the economics work for additional investment in either the existing or a new
CHP plant, will be the nature of the heat supply and delivery, and the costs and benefits for each.
One option is for EHDC to invest in the additional pipework and controls to link or locate a new re-
sized CHP plant at the proposed new biomass Energy Centre, and then to supply this to Taro
Leisure Centre and Penns Place at slightly less than current gas prices (i.e. cost neutral). This
would save up to 83 tonnes of CO2 per annum at a cost of around £10/tCO2.
The existing small gas-CHP at Taro Leisure Centre is approximately 10-12 years old. CHP units at
this scale typically last for 15 years and the unit may therefore require replacement in 2019 or
2021. With significant benefits in providing local power to the Taro Leisure Centre, and heat to
both the Pool and ‘dry’ centre, a commitment to replace the CHP unit with a properly sized unit
should be part of any future Facilities Management agreement with the new operator.
A biomass heating system located in a packaged boiler room close to the existing main boiler
room has been shown to offer significant financial and CO2 reduction benefits. The biomass
system could essentially take over 95% of the existing gas boiler heat load at Taro Leisure Centre
and Penns Place.
A flexible and progressive approach will therefore be needed by the operator of the site from
2017 onwards, with a commitment to improving the efficiency of the heat system, reducing CO2
emissions, and maintaining low heat costs, built in to any legal agreements in the contract.
Alton Sports Centre: A combined gas-CHP and biomass heat solution offers a significant reduction
in CO2 emissions alongside a better than 10% IRR (20 year). Putting in standard gas boilers into
this new building would hence be a significant opportunity missed to reduce running costs and cut
CO2 emissions for the site. Not only would carbon emissions be higher compared to gas-CHP and
biomass heating options (832t CO2 compared to 280t CO2), this would fail to ‘future-proof’ the
Sports Centre boiler room in being able to offer low-carbon heat to a significant new housing
development nearby in 2019-20.
o Essentially the new Sports Centre operators (or an ESCo) could purchase gas or wood chip
for the new heat network at keen commercial rates (at 2.5-3.0p/kWh for wood fuel and
2.5-2.75p/kWh for gas30), while selling heat to the heat network at higher domestic rates
to the existing local heat loads and the new housing. Offering either gas-CHP and/or
biomass heating could therefore deliver cost-effective alternatives to standard gas boilers.
29
The CHP plant is controlled largely by ENER-G and is not linked to the BMS system. 30
Typical existing prices.

EHDC HNDU: Heat Techno-Economic Feasibility Studies
P a g e | 66
As a result carbon emissions could be between 20% and >65% lower than these standard
solutions
o An open and progressive attitude to low-carbon heat and power options at Alton Sports
Centre will be important for the forthcoming Leisure Services management tender. The
Facilities Management contractor could either take a financial stake in any ESCo operation
of the low-carbon heat and power solution, or at least be open to long-term heat and
power agreements with EHDC and/or its selected ESCo operator.
Whitehill & Bordon Leisure Facilities: Similar cost and CO2 savings opportunities exist as for Alton
Sports Centre, as described above. In addition, if a planned leisure centre is connected to a larger
Heat Network, servicing much of the proposed town centre, savings in capital can be secured by
avoiding multiple gas boilers. In this instance, only a heat exchanger and heat meter need be
utilised. A set of guarantees by the ESCo operator of the heat network would be needed, included
guaranteed back up-emergency heat support. The operator of the Leisure Centre may wish a
further level of back-up in the form of basic gas boilers for emergency heating.
o An open and progressive attitude to low-carbon heat and power options for Whitehill and
Bordon town centre will hence be important for the forthcoming Leisure Services
management tender. The Facilities Management contractor could either take a financial
stake in any ESCo operation of the low-carbon heat and power solution, or at least be
open to long-term heat and power agreements with an EHDC-operated ESCo or a third-
party ESCo operator.

EHDC HNDU: Heat Techno-Economic Feasibility Studies
P a g e | 67
APPENDIX 2: SUMMARY OF FINANCIAL MODELLING RESULTS31
A2.1 MODELLING RESULTS: PENNS PLACE Scenario 1: 3,038,823kWh/ 500kW/ No CHP Integration/ all Biomass / 8 year payback/ 14% IRR
31
The complete set of modelling results spreadsheets reside with the EHDC Energy Manager. A user guide is also available.
BIOMASS BOILER PROJECT SCREENING MODEL © THOMAS BURNETT TITLE: Penns Place Taro,500kW. Scenario 1 Date 19th Jan 2016
Heat demand & Existing system RHI Tariffs & Other Income Economic & inflators Key
Current fuel demand 3,038,823 kWh RHI Tier 1 tariff 5.18 p/kWh Inflation rate 2.5% % Input
Old Boiler efficiency 85% % RHI Tier 2 tariff 2.24 p/kWh Discount rate (for NPV) 7.0% % Calc
Total Heat demand 2,582,999 kWh Other Income 0 p/kWh Fossil Price Increase 2.5% %
Heat demand chargable - kWh Biomass Price Increase 2.5% %
Current fuel price 2.75 p/kWh Select Biomass Fuel Type Chips purchased Other Cost Increases 2.5% %
Emissions from fossil 0.18 kgCO2/kWh Biomass cost 3.00 p/kWh RHI increase 2.5% %
Biomass Calorific Value 3,500 kWh/Tonne
Proposed system Biomass Bulk-density 250 kg/M3 Key ResultsType of scheme Commercial Emissions from Biomass 0.007 kgCO2/kWh 20 Year Cashflows Before inflation 25 Year Cashflows before inflation 40 Year Cashflows before inflation
Heat from biomass 95% % Payback Year 8 Payback Year 8 Payback Year 8
Biomass boiler size 500 kW Other Operating Costs -2800 £/ annum Internal Rate of Return (IRR) 14% Internal Rate of Return (IRR) 13% Internal Rate of Return (IRR) 13%
M&E Capex 500,000 £ 20 Year Net Project Cashflow 1,141,623 25 Year Net Project Cashflow 780,344 40 Year Net Project Cashflow 447,324
Capex for 2nd Biomass boiler 275,000 £ NPV (as per discount rate) 323,376 NPV (as per discount rate) 238,737 NPV (as per discount rate) 202,613
Other project Capex - £
New Boiler efficiency 85% %
Year Nos 0 1 2 3 4 5 6 7 8 9 10 11 12 13 14 15 16 17 18 19 20 21 22 23 24 25 26-40
Technical CalculationsHeat requirements
Total Heat Demand kWh - 2,582,999 2,582,999 2,582,999 2,582,999 2,582,999 2,582,999 2,582,999 2,582,999 2,582,999 2,582,999 2,582,999 2,582,999 2,582,999 2,582,999 2,582,999 2,582,999 2,582,999 2,582,999 2,582,999 2,582,999 2,582,999 2,582,999 2,582,999 2,582,999 2,582,999 38,744,989
Fuel requirements & Co2
Co2 Savings Tonnes C02 - 512 512 512 512 512 512 512 512 512 512 512 512 512 512 512 512 512 512 512 512 512 512 512 512 512 7,684
Biomass Fuel Required Tonnes - 825 825 825 825 825 825 825 825 825 825 825 825 825 825 825 825 825 825 825 825 825 825 825 825 825 12,372
Biomass Fuel Required M3 - 3,299 3,299 3,299 3,299 3,299 3,299 3,299 3,299 3,299 3,299 3,299 3,299 3,299 3,299 3,299 3,299 3,299 3,299 3,299 3,299 3,299 3,299 3,299 3,299 3,299 49,489
Financial Calculations £ ()= money out0.0287581
New System Benefit - 1 £ - (19,303) (19,785) (20,280) (20,787) (21,307) (21,839) (22,385) (22,945) (23,519) (24,107) (24,709) (25,327) (25,960) (26,609) (27,274) (27,956) (28,655) (29,371) (30,106) (30,858) (153,350) (157,183) (161,113) (165,141) (169,269) (3,111,208)
RHI Income £ - 74,282 76,139 78,043 79,994 81,993 84,043 86,144 88,298 90,505 92,768 95,087 97,464 99,901 102,399 104,959 107,583 110,272 113,029 115,855 118,751 - - - - - -
Other income £ - - - - - - - - - - - - - - - - - - - - - - - - - - -
Total New Fuel Costs £ - (90,785) (93,054) (95,381) (97,765) (100,209) (102,715) (105,283) (107,915) (110,612) (113,378) (116,212) (119,118) (122,096) (125,148) (128,277) (131,483) (134,771) (138,140) (141,593) (145,133) (148,762) (152,481) (156,293) (160,200) (164,205) (3,018,122)
Additional Costs £ - (2,800) (2,870) (2,942) (3,015) (3,091) (3,168) (3,247) (3,328) (3,412) (3,497) (3,584) (3,674) (3,766) (3,860) (3,956) (4,055) (4,157) (4,261) (4,367) (4,476) (4,588) (4,703) (4,820) (4,941) (5,064) (93,085)
Old system cost - 2 £ - (83,568) (85,657) (87,798) (89,993) (92,243) (94,549) (96,913) (99,336) (101,819) (104,365) (106,974) (109,648) (112,389) (115,199) (118,079) (121,031) (124,057) (127,158) (130,337) (133,595) (136,935) (140,359) (143,868) (147,464) (151,151) (2,778,188)
Total cash flow benefit (1+2) £ - 64,265 65,871 67,518 69,206 70,936 72,710 74,527 76,391 78,300 80,258 82,264 84,321 86,429 88,590 90,805 93,075 95,401 97,787 100,231 102,737 (16,414) (16,825) (17,245) (17,676) (18,118) (333,020)
Fuel Savings £ - (7,217) (7,398) (7,583) (7,772) (7,966) (8,166) (8,370) (8,579) (8,793) (9,013) (9,239) (9,470) (9,706) (9,949) (10,198) (10,453) (10,714) (10,982) (11,256) (11,538) (11,826) (12,122) (12,425) (12,736) (13,054) (239,934)
Total Capex £ (500,000) - - - - - - - - - - - - - - - - - - - - (275,000) - - - - -
Free Cash Flow
FCF £ (500,000) 64,265 65,871 67,518 69,206 70,936 72,710 74,527 76,391 78,300 80,258 82,264 84,321 86,429 88,590 90,805 93,075 95,401 97,787 100,231 102,737 (291,414) (16,825) (17,245) (17,676) (18,118) (333,020)
Cumulative FCF £ (500,000) (435,735) (369,864) (302,346) (233,139) (162,203) (89,493) (14,966) 61,425 139,725 219,983 302,248 386,569 472,998 561,588 652,392 745,467 840,868 938,655 1,038,886 1,141,623 850,208 833,384 816,138 798,462 780,344 9,194,142
Payback Year years - - - - - - - - 8 - - - - - - - - - - - - - - - - - -
RT FCF £ (500,000) 64,265 64,265 64,265 64,265 64,265 64,265 64,265 64,265 64,265 64,265 64,265 64,265 64,265 64,265 64,265 64,265 64,265 64,265 64,265 64,265 (177,842) (10,017) (10,017) (10,017) (10,017) (150,258)
RT Cumulative FCF £ (500,000) (435,735) (371,470) (307,206) (242,941) (178,676) (114,411) (50,146) 14,119 78,383 142,648 206,913 271,178 335,443 399,707 463,972 528,237 592,502 656,767 721,032 785,296 607,455 597,437 587,420 577,403 567,386 (150,258)
RT Payback Year (ungeared) years - - - - - - - - 8 - - - - - - - - - - - - - - - - - -
Disclaimer: Thomas Burnett cannot be held liable for the accuracy of the results nor the biomass system performance. The actual results
will vary depending on Client specific assumptions & circumstance (e.g. biomass cost, weather).

EHDC HNDU: Heat Techno-Economic Feasibility Studies
P a g e | 68
Scenario 2: Waste CHP Heat used at no cost / 8 year payback/ 14% IRR
BIOMASS BOILER PROJECT SCREENING MODEL © THOMAS BURNETT TITLE: Penns Place Taro,450kW. CHP Integration. Scenario 2 Date 19th Jan 2016
Heat demand & Existing system RHI Tariffs & Other Income Economic & inflators Key
Current fuel demand 3,038,823 kWh RHI Tier 1 tariff 5.18 p/kWh Inflation rate 2.5% % Input
Old Boiler efficiency 85% % RHI Tier 2 tariff 2.24 p/kWh Discount rate (for NPV) 7.0% % Calc
Total Heat demand 2,582,999 kWh Other Income 0 p/kWh Fossil Price Increase 2.5% %
Waste heat from CHP 449,772 kWh Biomass Price Increase 2.5% %
Heat demand after waste heat 2,133,227 kWh Select Biomass Fuel Type Chips purchased Other Cost Increases 2.5% %
Current fuel price 2.75 p/kWh Biomass cost 3.00 p/kWh RHI increase 2.5% %
Emissions from fossil 0.18 kgCO2/kWh Biomass Calorific Value 3,500 kWh/Tonne
Proposed system Biomass Bulk-density 250 kg/M3 Key ResultsType of scheme Commercial Emissions from Biomass 0.007 kgCO2/kWh 20 Year Cashflows Before inflation 25 Year Cashflows before inflation 40 Year Cashflows before inflation
Heat from biomass 100% % Payback Year 8 Payback Year 8 Payback Year 8
Biomass boiler size 450 kW Other Operating Costs -2700 £/ annum Internal Rate of Return (IRR) 14% Internal Rate of Return (IRR) 14% Internal Rate of Return (IRR) 14%
M&E Capex 540,000 £ 20 Year Net Project Cashflow 1,267,176 25 Year Net Project Cashflow 1,070,214 40 Year Net Project Cashflow 1,255,628
Capex for 2nd Biomass boiler 245,000 £ NPV (as per discount rate) 366,411 NPV (as per discount rate) 317,386 NPV (as per discount rate) 337,499
Other project Capex - £
New Boiler efficiency 85% %
Year Nos 0 1 2 3 4 5 6 7 8 9 10 11 12 13 14 15 16 17 18 19 20 21 22 23 24 25 26-40
Technical CalculationsHeat requirements
Heat demand for biomass kWh - 2,133,227 2,133,227 2,133,227 2,133,227 2,133,227 2,133,227 2,133,227 2,133,227 2,133,227 2,133,227 2,133,227 2,133,227 2,133,227 2,133,227 2,133,227 2,133,227 2,133,227 2,133,227 2,133,227 2,133,227 2,133,227 2,133,227 2,133,227 2,133,227 2,133,227 31,998,409
Heat demand for CHP kWh - 449,772 449,772 449,772 449,772 449,772 449,772 449,772 449,772 449,772 449,772 449,772 449,772 449,772 449,772 449,772 449,772 449,772 449,772 449,772 449,772 449,772 449,772 449,772 449,772 449,772 6,746,580
Fuel requirements & Co2
Co2 Savings Tonnes C02 - 445 445 445 445 445 445 445 445 445 445 445 445 445 445 445 445 445 445 445 445 445 445 445 445 445 6,680
Biomass Fuel Required Tonnes - 717 717 717 717 717 717 717 717 717 717 717 717 717 717 717 717 717 717 717 717 717 717 717 717 717 10,756
Biomass Fuel Required M3 - 2,868 2,868 2,868 2,868 2,868 2,868 2,868 2,868 2,868 2,868 2,868 2,868 2,868 2,868 2,868 2,868 2,868 2,868 2,868 2,868 2,868 2,868 2,868 2,868 2,868 43,023
Financial Calculations £ ()= money out
New System Benefit - 1 £ - (12,822) (13,142) (13,471) (13,808) (14,153) (14,507) (14,869) (15,241) (15,622) (16,013) (16,413) (16,823) (17,244) (17,675) (18,117) (18,570) (19,034) (19,510) (19,998) (20,498) (127,796) (130,991) (134,266) (137,623) (141,063) (2,592,774)
RHI Income £ - 65,169 66,798 68,468 70,179 71,934 73,732 75,575 77,465 79,402 81,387 83,421 85,507 87,644 89,836 92,081 94,383 96,743 99,162 101,641 104,182 - - - - - -
Waste CHP Heat Costs £ - - - - - - - - - - - - - - - - - - - - - - - - - - -
Total New Fuel Costs £ - (75,290) (77,173) (79,102) (81,079) (83,106) (85,184) (87,314) (89,497) (91,734) (94,027) (96,378) (98,787) (101,257) (103,789) (106,383) (109,043) (111,769) (114,563) (117,427) (120,363) (123,372) (126,456) (129,618) (132,858) (136,180) (2,503,013)
Operating Costs £ - (2,700) (2,768) (2,837) (2,908) (2,980) (3,055) (3,131) (3,209) (3,290) (3,372) (3,456) (3,543) (3,631) (3,722) (3,815) (3,910) (4,008) (4,108) (4,211) (4,316) (4,424) (4,535) (4,648) (4,764) (4,884) (89,761)
Old system cost - 2 £ - (83,568) (85,657) (87,798) (89,993) (92,243) (94,549) (96,913) (99,336) (101,819) (104,365) (106,974) (109,648) (112,389) (115,199) (118,079) (121,031) (124,057) (127,158) (130,337) (133,595) (136,935) (140,359) (143,868) (147,464) (151,151) (2,778,188)
Total cash flow benefit (1+2) £ - 70,746 72,514 74,327 76,185 78,090 80,042 82,043 84,094 86,197 88,352 90,561 92,825 95,145 97,524 99,962 102,461 105,022 107,648 110,339 113,098 9,139 9,367 9,602 9,842 10,088 185,414
Fuel Savings £ - 8,277 8,484 8,696 8,914 9,137 9,365 9,599 9,839 10,085 10,337 10,596 10,860 11,132 11,410 11,696 11,988 12,288 12,595 12,910 13,232 13,563 13,902 14,250 14,606 14,971 275,175
Total Capex £ (540,000) - - - - - - - - - - - - - - - - - - - - (245,000) - - - - -
Free Cash Flow
FCF £ (540,000) 70,746 72,514 74,327 76,185 78,090 80,042 82,043 84,094 86,197 88,352 90,561 92,825 95,145 97,524 99,962 102,461 105,022 107,648 110,339 113,098 (235,861) 9,367 9,602 9,842 10,088 185,414
Cumulative FCF £ (540,000) (469,254) (396,740) (322,413) (246,227) (168,137) (88,095) (6,051) 78,043 164,240 252,592 343,152 435,977 531,122 628,646 728,608 831,069 936,091 1,043,739 1,154,078 1,267,176 1,031,315 1,040,683 1,050,284 1,060,126 1,070,214 17,451,254
Payback Year years - - - - - - - - 8 - - - - - - - - - - - - - - - - - -
RT FCF £ (540,000) 70,746 70,746 70,746 70,746 70,746 70,746 70,746 70,746 70,746 70,746 70,746 70,746 70,746 70,746 70,746 70,746 70,746 70,746 70,746 70,746 (143,939) 5,577 5,577 5,577 5,577 83,659
RT Cumulative FCF £ (540,000) (469,254) (398,508) (327,763) (257,017) (186,271) (115,525) (44,780) 25,966 96,712 167,458 238,203 308,949 379,695 450,441 521,186 591,932 662,678 733,424 804,169 874,915 730,976 736,553 742,131 747,708 753,285 11,968,546
RT Payback Year (ungeared) years - - - - - - - - 8 - - - - - - - - - - - - - - - - - -
Disclaimer: Thomas Burnett cannot be held liable for the accuracy of the results nor the biomass system performance. The actual results
will vary depending on Client specific assumptions & circumstance (e.g. biomass cost, weather).

EHDC HNDU: Heat Techno-Economic Feasibility Studies
P a g e | 69
Scenario 3: As per 2 plus from year 6 new 96 house heat load is charged 6p/kWh / 11 year payback/ 10% IRR
© THOMAS BURNETT TITLE: Penns Place Taro,650kW. CHP Integration. New houses. Scenario 3 Date 19th Jan 2016
Heat demand & Existing system RHI Tariffs & Other Income Economic & inflators Key
Current fuel demand 3,038,823 kWh RHI Tier 1 tariff 5.18 p/kWh Inflation rate 2.5% % Input
Old Boiler efficiency 85% % RHI Tier 2 tariff 2.24 p/kWh Discount rate (for NPV) 7.0% % Calc
Current Heat demand 2,582,999 kWh Other Income 6 p/kWh Fossil Price Increase 2.5% %
Heat from CHP 449,772 kWh CHP Heat price 2 p/kWh Biomass Price Increase 2.5% %
Heat demand chargable/ new houses 1,914,177 kWh Other Cost Increases 2.5% %
Current fuel price 2.75 p/kWh Select Biomass Fuel Type Chips purchased RHI increase 2.5% %
Emissions from fossil 0.18 kgCO2/kWh Biomass cost 3.00 p/kWh
Proposed system Biomass Calorific Value 3,500 kWh/Tonne Key Results
Type of scheme Commercial Biomass Bulk-density 250 kg/M3 20 Year Cashflows Before inflation 25 Year Cashflows before inflation 40 Year Cashflows before inflation
Heat from biomass 100% % Emissions from Biomass 0.007 kgCO2/kWh Payback Year 11 Payback Year 11 Payback Year 11
Biomass boiler size 650 kW Internal Rate of Return (IRR) 10% Internal Rate of Return (IRR) 9% Internal Rate of Return (IRR) 10%
M&E Capex 1,210,000 £ Other Operating Costs 5,200- £/ annum 20 Year Net Project Cashflow 1,776,328 25 Year Net Project Cashflow 1,534,059 40 Year Net Project Cashflow 2,006,007
Capex for 2nd Biomass boiler 375,000 £ NPV (as per discount rate) 289,459 NPV (as per discount rate) 226,926 NPV (as per discount rate) 282,498
Other project Capex - £
New Boiler efficiency and district heat losses 65% %
Year Nos 0 1 2 3 4 5 6 7 8 9 10 11 12 13 14 15 16 17 18 19 20 21 22 23 24 25 26-40
Technical Calculations
Heat requirements
Heat demand net of CHP kWh - 2,133,227 2,133,227 2,133,227 2,133,227 2,133,227 2,133,227 2,133,227 2,133,227 2,133,227 2,133,227 2,133,227 2,133,227 2,133,227 2,133,227 2,133,227 2,133,227 2,133,227 2,133,227 2,133,227 2,133,227 2,133,227 2,133,227 2,133,227 2,133,227 2,133,227 31,998,409
Heat demand for CHP kWh - 449,772 449,772 449,772 449,772 449,772 449,772 449,772 449,772 449,772 449,772 449,772 449,772 449,772 449,772 449,772 449,772 449,772 449,772 449,772 449,772 449,772 449,772 449,772 449,772 449,772 6,746,580
New Houses Heat demand kWh - - - - - - 1,914,177 1,914,177 1,914,177 1,914,177 1,914,177 1,914,177 1,914,177 1,914,177 1,914,177 1,914,177 1,914,177 1,914,177 1,914,177 1,914,177 1,914,177 1,914,177 1,914,177 1,914,177 1,914,177 1,914,177 28,712,660
Total Biomass Heat Demand kWh - 2,133,227 2,133,227 2,133,227 2,133,227 2,133,227 4,047,405 4,047,405 4,047,405 4,047,405 4,047,405 4,047,405 4,047,405 4,047,405 4,047,405 4,047,405 4,047,405 4,047,405 4,047,405 4,047,405 4,047,405 4,047,405 4,047,405 4,047,405 4,047,405 4,047,405 60,711,069
Fossil Heat Demand kWh - - - - - - - - - - - - - - - - - - - - - - - - - - -
Fuel requirements & Co2
Co2 Savings Tonnes C02 - 582 582 582 582 582 1,105 1,105 1,105 1,105 1,105 1,105 1,105 1,105 1,105 1,105 1,105 1,105 1,105 1,105 1,105 1,105 1,105 1,105 1,105 1,105 16,574
Biomass Fuel Required Tonnes - 938 938 938 938 938 1,779 1,779 1,779 1,779 1,779 1,779 1,779 1,779 1,779 1,779 1,779 1,779 1,779 1,779 1,779 1,779 1,779 1,779 1,779 1,779 26,686
Biomass Fuel Required M3 - 3,751 3,751 3,751 3,751 3,751 7,116 7,116 7,116 7,116 7,116 7,116 7,116 7,116 7,116 7,116 7,116 7,116 7,116 7,116 7,116 7,116 7,116 7,116 7,116 7,116 106,745
Financial Calculations £ ()= money out
New System Benefit - 1 £ - (21,766) (22,311) (22,868) (23,440) (24,026) 53,872 55,219 56,600 58,014 59,465 60,951 62,475 64,037 65,638 67,279 68,961 70,685 72,452 74,263 76,120 (111,684) (114,476) (117,338) (120,271) (123,278) (2,265,872)
RHI Income £ - 72,895 74,717 76,585 78,500 80,462 130,986 134,260 137,617 141,057 144,584 148,198 151,903 155,701 159,594 163,583 167,673 171,865 176,161 180,565 185,080 - - - - - -
Other income £ - - - - - - 129,943 133,192 136,521 139,934 143,433 147,019 150,694 154,461 158,323 162,281 166,338 170,496 174,759 179,128 183,606 188,196 192,901 197,724 202,667 207,733 3,818,185
Waste CHP Heat Income £ - 8,995 9,220 9,451 9,687 9,929 10,178 10,432 10,693 10,960 11,234 11,515 11,803 12,098 12,400 12,710 13,028 13,354 13,688 14,030 14,381 14,740 15,109 15,486 15,873 16,270 299,052
Total New Fuel Costs £ - (98,457) (100,918) (103,441) (106,027) (108,678) (211,351) (216,635) (222,050) (227,602) (233,292) (239,124) (245,102) (251,230) (257,510) (263,948) (270,547) (277,311) (284,243) (291,349) (298,633) (306,099) (313,751) (321,595) (329,635) (337,876) (6,210,236)
Operating Costs £ - (5,200) (5,330) (5,463) (5,600) (5,740) (5,883) (6,030) (6,181) (6,336) (6,494) (6,656) (6,823) (6,993) (7,168) (7,347) (7,531) (7,719) (7,912) (8,110) (8,313) (8,521) (8,734) (8,952) (9,176) (9,405) (172,873)
Old system cost - 2 £ - (83,568) (85,657) (87,798) (89,993) (92,243) (94,549) (96,913) (99,336) (101,819) (104,365) (106,974) (109,648) (112,389) (115,199) (118,079) (121,031) (124,057) (127,158) (130,337) (133,595) (136,935) (140,359) (143,868) (147,464) (151,151) (2,778,188)
Total cash flow benefit (1+2) £ - 61,801 63,346 64,930 66,553 68,217 148,421 152,132 155,935 159,834 163,829 167,925 172,123 176,426 180,837 185,358 189,992 194,742 199,610 204,600 209,715 25,252 25,883 26,530 27,193 27,873 512,316
Fuel Savings £ - (14,889) (15,261) (15,643) (16,034) (16,435) (116,802) (119,722) (122,715) (125,783) (128,927) (132,150) (135,454) (138,840) (142,312) (145,869) (149,516) (153,254) (157,085) (161,012) (165,038) (169,164) (173,393) (177,728) (182,171) (186,725) (3,432,048)
Total Capex £ (860,000) - - - - - (350,000) - - - - - - - - - - - - - - (375,000) - - - - -
Free Cash Flow
FCF £ (860,000) 61,801 63,346 64,930 66,553 68,217 (201,579) 152,132 155,935 159,834 163,829 167,925 172,123 176,426 180,837 185,358 189,992 194,742 199,610 204,600 209,715 (349,748) 25,883 26,530 27,193 27,873 512,316
Cumulative FCF £ (860,000) (798,199) (734,852) (669,923) (603,369) (535,152) (736,731) (584,599) (428,664) (268,830) (105,001) 62,924 235,047 411,473 592,310 777,668 967,660 1,162,402 1,362,012 1,566,612 1,776,328 1,426,580 1,452,463 1,478,993 1,506,186 1,534,059 26,873,818
Payback Year years - - - - - - - - - - - 11 - - - - - - - - - - - - - - -
RT FCF £ (860,000) 61,801 61,801 61,801 61,801 61,801 (178,166) 131,183 131,183 131,183 131,183 131,183 131,183 131,183 131,183 131,183 131,183 131,183 131,183 131,183 131,183 (213,441) 15,410 15,410 15,410 15,410 231,156
RT Cumulative FCF £ (860,000) (798,199) (736,397) (674,596) (612,795) (550,994) (729,160) (597,977) (466,794) (335,611) (204,429) (73,246) 57,937 189,120 320,303 451,485 582,668 713,851 845,034 976,217 1,107,400 893,958 909,369 924,779 940,190 955,600 16,183,249
RT Payback Year (ungeared) years - - - - - - - - - - - - 12 - - - - - - - - - - - - - -
Disclaimer: Thomas Burnett cannot be held liable for the accuracy of the results nor the biomass system performance. The actual results
will vary depending on Client specific assumptions & circumstance (e.g. biomass cost, weather).

EHDC HNDU: Heat Techno-Economic Feasibility Studies
P a g e | 70
A2.2 MODELLING RESULTS: ALTON Scenario 4: 3,094,000kWh/ 800kW/ all Biomass / £620k / 50% RHI / 18 years payback/ 1% IRR
BIOMASS BOILER PROJECT SCREENING MODEL © THOMAS BURNETT TITLE: Scenario 4 Alton Biomass only Date 23rd Jan 2016
Heat demand & Existing system RHI Tariffs & Other Income Economic & inflators Key
Current fuel demand 3,640,000 kWh RHI Tier 1 tariff 2.59 p/kWh Inflation rate 2.5% % Input
Old Boiler efficiency 85% % RHI Tier 2 tariff 1.12 p/kWh Discount rate (for NPV) 7.0% % Calc
Total Heat demand 3,094,000 kWh Other Income 0 p/kWh Fossil Price Increase 2.5% %
Heat demand chargable - kWh Biomass Price Increase 2.5% %
Current fuel price 2.75 p/kWh Select Biomass Fuel Type Chips purchased Other Cost Increases 2.5% %
Emissions from fossil 0.18 kgCO2/kWh Biomass cost 3.00 p/kWh RHI increase 2.5% %
Biomass Calorific Value 3,500 kWh/Tonne
Proposed system Biomass Bulk-density 250 kg/M3 Key Results
Type of scheme Commercial Emissions from Biomass 0.007 kgCO2/kWh 20 Year Cashflows Before inflation 25 Year Cashflows before inflation 40 Year Cashflows before inflation
Heat from biomass 95% % Payback Year 18 Payback Year 18 Payback Year 18
Biomass boiler size 800 kW Other Operating Costs -3200 £/ annum Internal Rate of Return (IRR) 1% Internal Rate of Return (IRR) #NUM! Internal Rate of Return (IRR) #NUM!
M&E Capex 620,000 £ 20 Year Net Project Cashflow 102,114 25 Year Net Project Cashflow (446,045) 40 Year Net Project Cashflow (1,114,402)
Capex for 2nd Biomass boiler 375,000 £ NPV (as per discount rate) (257,815) NPV (as per discount rate) (384,955) NPV (as per discount rate) (457,454)
Other project Capex - £
New Boiler efficiency 79% %
Year Nos 0 1 2 3 4 5 6 7 8 9 10 11 12 13 14 15 16 17 18 19 20 21 22 23 24 25 26-40
Technical Calculations
Heat requirements
Total Heat Demand kWh - 3,094,000 3,094,000 3,094,000 3,094,000 3,094,000 3,094,000 3,094,000 3,094,000 3,094,000 3,094,000 3,094,000 3,094,000 3,094,000 3,094,000 3,094,000 3,094,000 3,094,000 3,094,000 3,094,000 3,094,000 3,094,000 3,094,000 3,094,000 3,094,000 3,094,000 46,410,000
Fuel requirements & Co2
Co2 Savings Tonnes C02 - 660 660 660 660 660 660 660 660 660 660 660 660 660 660 660 660 660 660 660 660 660 660 660 660 660 9,903
Biomass Fuel Required Tonnes - 1,063 1,063 1,063 1,063 1,063 1,063 1,063 1,063 1,063 1,063 1,063 1,063 1,063 1,063 1,063 1,063 1,063 1,063 1,063 1,063 1,063 1,063 1,063 1,063 1,063 15,946
Biomass Fuel Required M3 - 4,252 4,252 4,252 4,252 4,252 4,252 4,252 4,252 4,252 4,252 4,252 4,252 4,252 4,252 4,252 4,252 4,252 4,252 4,252 4,252 4,252 4,252 4,252 4,252 4,252 63,782
Financial Calculations £ ()= money out0.0156344
New System Benefit - 1 £ - (71,831) (73,627) (75,468) (77,354) (79,288) (81,271) (83,302) (85,385) (87,519) (89,707) (91,950) (94,249) (96,605) (99,020) (101,496) (104,033) (106,634) (109,300) (112,032) (114,833) (196,968) (201,893) (206,940) (212,113) (217,416) (3,996,160)
RHI Income £ - 48,373 49,582 50,822 52,092 53,395 54,729 56,098 57,500 58,938 60,411 61,921 63,469 65,056 66,682 68,350 70,058 71,810 73,605 75,445 77,331 - - - - - -
Other income £ - - - - - - - - - - - - - - - - - - - - - - - - - - -
Total New Fuel Costs £ - (117,004) (119,929) (122,927) (126,001) (129,151) (132,379) (135,689) (139,081) (142,558) (146,122) (149,775) (153,520) (157,358) (161,291) (165,324) (169,457) (173,693) (178,036) (182,486) (187,049) (191,725) (196,518) (201,431) (206,467) (211,628) (3,889,777)
Additional Costs £ - (3,200) (3,280) (3,362) (3,446) (3,532) (3,621) (3,711) (3,804) (3,899) (3,996) (4,096) (4,199) (4,304) (4,411) (4,522) (4,635) (4,750) (4,869) (4,991) (5,116) (5,244) (5,375) (5,509) (5,647) (5,788) (106,383)
Old system cost - 2 £ - (100,100) (102,603) (105,168) (107,797) (110,492) (113,254) (116,085) (118,987) (121,962) (125,011) (128,136) (131,340) (134,623) (137,989) (141,439) (144,975) (148,599) (152,314) (156,122) (160,025) (164,026) (168,126) (172,329) (176,638) (181,053) (3,327,803)
Total cash flow benefit (1+2) £ - 28,269 28,975 29,700 30,442 31,203 31,983 32,783 33,603 34,443 35,304 36,186 37,091 38,018 38,969 39,943 40,941 41,965 43,014 44,090 45,192 (32,943) (33,767) (34,611) (35,476) (36,363) (668,357)
Fuel Savings £ - (16,904) (17,327) (17,760) (18,204) (18,659) (19,125) (19,604) (20,094) (20,596) (21,111) (21,639) (22,180) (22,734) (23,303) (23,885) (24,482) (25,094) (25,722) (26,365) (27,024) (27,699) (28,392) (29,102) (29,829) (30,575) (561,974)
Total Capex £ (620,000) - - - - - - - - - - - - - - - - - - - - (375,000) - - - - -
Free Cash Flow
FCF £ (620,000) 28,269 28,975 29,700 30,442 31,203 31,983 32,783 33,603 34,443 35,304 36,186 37,091 38,018 38,969 39,943 40,941 41,965 43,014 44,090 45,192 (407,943) (33,767) (34,611) (35,476) (36,363) (668,357)
Cumulative FCF £ (620,000) (591,731) (562,756) (533,056) (502,614) (471,410) (439,427) (406,644) (373,041) (338,599) (303,295) (267,109) (230,018) (192,000) (153,031) (113,088) (72,147) (30,181) 12,833 56,922 102,114 (305,829) (339,596) (374,206) (409,682) (446,045) (11,730,171)
Payback Year years - - - - - - - - - - - - - - - - - - 18 - - - - - - - -
RT FCF £ (620,000) 28,269 28,269 28,269 28,269 28,269 28,269 28,269 28,269 28,269 28,269 28,269 28,269 28,269 28,269 28,269 28,269 28,269 28,269 28,269 28,269 (248,956) (20,104) (20,104) (20,104) (20,104) (301,562)
RT Cumulative FCF £ (620,000) (591,731) (563,463) (535,194) (506,925) (478,657) (450,388) (422,119) (393,851) (365,582) (337,313) (309,044) (280,776) (252,507) (224,238) (195,970) (167,701) (139,432) (111,164) (82,895) (54,626) (303,582) (323,686) (343,790) (363,894) (383,998) (301,562)
RT Payback Year (ungeared) years - - - - - - - - - - - - - - - - - - - - - - - - - - -
Disclaimer: Thomas Burnett cannot be held liable for the accuracy of the results nor the biomass system performance. The actual results will
vary depending on Client specific assumptions & circumstance (e.g. biomass cost, weather).

EHDC HNDU: Heat Techno-Economic Feasibility Studies
P a g e | 71
Scenario 4a: 600kW biomass/ 125kWe CHP / £720k / 10 years payback/ 8% IRR
CHP AND BIOMASS SCREENING TOOL © THOMAS BURNETT TITLE: Scenario 4a Alton 125kWe Gas CHP and 600kW Biomass and 50% RHI Date 23rd Jan 2016
New Alton Data Comments Gas Boiler Comments
Thermal/ Heat load 3,094,000 kWh Gas Boiler Size 800 kW
Electrical load 1,000,000 kWh Gas boiler efficiency 85% % Key
Current gas price 2.75 p/kWh Gas Boiler Capex 100,000 £ Input
Electricity cost 11 p/kWh Gas Boiler Maintenance 2,000.00 £/ annum Calc
CHP Inflators and other factors
CHP electrical output 125 kWe Gas Price Increase 2.5% %
CHP thermal output 200 kWt Electricity Price Increase 2.5% %
CHP electrical efficiency 30% % Biomass Price Increase 2.5% %
CHP thermal efficiency 50% % RHI/RPI increase 2.5% %
CHP hours of operation 5000 hr/ annum NPV Discount Rate 7.0% %
Capital Cost 215,000 £ Capex for 2nd CHP in year 16 at £145,000 and 3rd CHP unit at year 31 = £150,000
Maintenance per annum 12,500 £/annum C02 Emissions
Gas emissions 0.185 kgCO2/kWh
Back up gas & other Biomass emissions 0.012 kgCO2/kWh
% of heat load by gas 5% % Electricity emissions 0.494 kgCO2/kWh
Proxy for other value 4,000 £/annum CRC credits, business rates exemption for good quality CHP
Biomass Requirements
Biomass boiler size 600 kw Results
Boimass boiler hrs of operation 3,232 hrs 20 Year Cashflows Before inflation 25 Year Cashflows before inflation 40 Year Cashflows before inflation
Biomass boiler efficiency 79% % 85% efficient boiler + 6% loses from pipework IRR 8% % IRR 8% IRR 9%
RHI Tier 1 tariff 2.59 p/kWh Half current RHI Payback period 10 Years Payback period 10 Payback period 10
RHI Tier 2 tariff 1.12 p/kWh 20 Year Net Cashlows 720,446 25 Year Net Cashlows 584,407 40 Year Net Cashlows 1,260,252
Biomass Capital Cost 505,000 £ Capex for 2nd biomass boiler at year 21 = £350,000 NPV 75,927 NPV 36,588 NPV 107,754
Biomass fuel cost 3.00 p/kWh
Biomass maintenance cost 3,000 £/year
Year 0 1 2 3 4 5 6 7 8 9 10 11 12 13 14 15 16 17 18 19 20 21-25 26-40
1) Proposed System
Technical Calculations
CHP Thermal output kWh - 1,000,000 1,000,000 1,000,000 1,000,000 1,000,000 1,000,000 1,000,000 1,000,000 1,000,000 1,000,000 1,000,000 1,000,000 1,000,000 1,000,000 1,000,000 1,000,000 1,000,000 1,000,000 1,000,000 1,000,000 5,000,000 15,000,000
CHP Electrical output kWh - 625,000 625,000 625,000 625,000 625,000 625,000 625,000 625,000 625,000 625,000 625,000 625,000 625,000 625,000 625,000 625,000 625,000 625,000 625,000 625,000 3,125,000 9,375,000
CHP Total Useful Output kWh - 1,625,000 1,625,000 1,625,000 1,625,000 1,625,000 1,625,000 1,625,000 1,625,000 1,625,000 1,625,000 1,625,000 1,625,000 1,625,000 1,625,000 1,625,000 1,625,000 1,625,000 1,625,000 1,625,000 1,625,000 8,125,000 24,375,000
CHP Total Fuel requirement kWh - 2,031,250 2,031,250 2,031,250 2,031,250 2,031,250 2,031,250 2,031,250 2,031,250 2,031,250 2,031,250 2,031,250 2,031,250 2,031,250 2,031,250 2,031,250 2,031,250 2,031,250 2,031,250 2,031,250 2,031,250 10,156,250 30,468,750
Gas thermal output kWh - 154,700 154,700 154,700 154,700 154,700 154,700 154,700 154,700 154,700 154,700 154,700 154,700 154,700 154,700 154,700 154,700 154,700 154,700 154,700 154,700 773,500 2,320,500
Gas Fuel Requirements kWh - 182,000 182,000 182,000 182,000 182,000 182,000 182,000 182,000 182,000 182,000 182,000 182,000 182,000 182,000 182,000 182,000 182,000 182,000 182,000 182,000 910,000 2,730,000
Biomass thermal output kWh - 1,939,300 1,939,300 1,939,300 1,939,300 1,939,300 1,939,300 1,939,300 1,939,300 1,939,300 1,939,300 1,939,300 1,939,300 1,939,300 1,939,300 1,939,300 1,939,300 1,939,300 1,939,300 1,939,300 1,939,300 9,696,500 29,089,500
Biomass Fuel Requirements kWh - 2,454,810 2,454,810 2,454,810 2,454,810 2,454,810 2,454,810 2,454,810 2,454,810 2,454,810 2,454,810 2,454,810 2,454,810 2,454,810 2,454,810 2,454,810 2,454,810 2,454,810 2,454,810 2,454,810 2,454,810 12,274,051 36,822,152
Proposed system C02 emissions Tonnes C02 - 438 438 438 438 438 438 438 438 438 438 438 438 438 438 438 438 438 438 438 438 2,192 6,577
Alternative system C02 emissions Tonnes C02 - 1,168 1,168 1,168 1,168 1,168 1,168 1,168 1,168 1,168 1,168 1,168 1,168 1,168 1,168 1,168 1,168 1,168 1,168 1,168 1,168 5,838 17,513
CHP Costs £ (215,000) (68,359) (70,068) (71,820) (73,616) (75,456) (77,342) (79,276) (81,258) (83,289) (85,371) (87,506) (89,693) (91,936) (94,234) (96,590) (244,005) (101,480) (104,017) (106,617) (109,283) (588,787) (2,422,593)
CHP Capital cost £ (215,000) - - - - - - - - - - - - - - - (145,000) - - - - - (150,000)
CHP Fuel cost £ - (55,859) (57,256) (58,687) (60,154) (61,658) (63,200) (64,780) (66,399) (68,059) (69,761) (71,505) (73,292) (75,125) (77,003) (78,928) (80,901) (82,924) (84,997) (87,122) (89,300) (481,123) (1,857,033)
CHP Maintenance cost £ - (12,500) (12,813) (13,133) (13,461) (13,798) (14,143) (14,496) (14,859) (15,230) (15,611) (16,001) (16,401) (16,811) (17,231) (17,662) (18,104) (18,556) (19,020) (19,496) (19,983) (107,664) (415,560)
Biomass Income/ Costs (505,000) (43,335) (44,418) (45,528) (46,667) (47,833) (49,029) (50,255) (51,511) (52,799) (54,119) (55,472) (56,859) (58,280) (59,737) (61,231) (62,762) (64,331) (65,939) (67,587) (69,277) (1,010,146) (2,548,024)
Biomass capital cost £ (505,000) - - - - - - - - - - - - - - - - - - - - (350,000) -
Biomass RHI Income £ - 33,310 34,142 34,996 35,871 36,768 37,687 38,629 39,595 40,585 41,599 42,639 43,705 44,798 45,918 47,066 48,242 49,448 50,685 51,952 53,250 - -
Biomass Fuel Cost £ - (73,644) (75,485) (77,373) (79,307) (81,290) (83,322) (85,405) (87,540) (89,728) (91,972) (94,271) (96,628) (99,043) (101,519) (104,057) (106,659) (109,325) (112,059) (114,860) (117,731) (634,306) (2,448,289)
Biomass Maintenance Costs £ - (3,000) (3,075) (3,152) (3,231) (3,311) (3,394) (3,479) (3,566) (3,655) (3,747) (3,840) (3,936) (4,035) (4,136) (4,239) (4,345) (4,454) (4,565) (4,679) (4,796) (25,839) (99,734)
Gas & Electricity costs & Other value - (42,255) (43,311) (44,394) (45,504) (46,642) (47,808) (49,003) (50,228) (51,484) (52,771) (54,090) (55,442) (56,828) (58,249) (59,705) (61,198) (62,728) (64,296) (65,903) (67,551) (363,947) (1,404,759)
Gas Fuel Costs £ - (5,005) (5,130) (5,258) (5,390) (5,525) (5,663) (5,804) (5,949) (6,098) (6,251) (6,407) (6,567) (6,731) (6,899) (7,072) (7,249) (7,430) (7,616) (7,806) (8,001) (43,109) (166,390)
Electricity Costs £ - (41,250) (42,281) (43,338) (44,422) (45,532) (46,671) (47,837) (49,033) (50,259) (51,516) (52,803) (54,124) (55,477) (56,864) (58,285) (59,742) (61,236) (62,767) (64,336) (65,944) (355,291) (1,371,348)
Other values (CRC, business rates exemption etc) £ - 4,000 4,100 4,203 4,308 4,415 4,526 4,639 4,755 4,874 4,995 5,120 5,248 5,380 5,514 5,652 5,793 5,938 6,086 6,239 6,395 34,452 132,979
Total Cost of proposed system £ (720,000) (153,949) (157,798) (161,743) (165,786) (169,931) (174,179) (178,534) (182,997) (187,572) (192,261) (197,068) (201,994) (207,044) (212,220) (217,526) (367,964) (228,538) (234,252) (240,108) (246,111) (1,962,879) (6,375,375)
2) Alternative System: electrical & heating costs (100,000) (212,100) (217,403) (222,838) (228,409) (234,119) (239,972) (245,971) (252,120) (258,423) (264,884) (271,506) (278,294) (285,251) (292,382) (299,692) (307,184) (314,864) (322,735) (330,804) (339,074) (1,826,840) (7,051,220)
Gas Boiler Capex £ (100,000) - - - - - - - - - - - - - - - - - - - - - -
Gas Fuel Cost £ - (100,100) (102,603) (105,168) (107,797) (110,492) (113,254) (116,085) (118,987) (121,962) (125,011) (128,136) (131,340) (134,623) (137,989) (141,439) (144,975) (148,599) (152,314) (156,122) (160,025) (862,172) (3,327,803)
Gas Maintenance cost £ - (2,000.00) (2,050.00) (2,101.25) (2,153.78) (2,207.63) (2,262.82) (2,319.39) (2,377.37) (2,436.81) (2,497.73) (2,560.17) (2,624.17) (2,689.78) (2,757.02) (2,825.95) (2,896.60) (2,969.01) (3,043.24) (3,119.32) (3,197.30) (17,226.21) (66,489.58)
Electricity Costs £ - (110,000) (112,750) (115,569) (118,458) (121,419) (124,455) (127,566) (130,755) (134,024) (137,375) (140,809) (144,330) (147,938) (151,636) (155,427) (159,313) (163,296) (167,378) (171,562) (175,852) (947,442) (3,656,927)
3) Total benefit/ cost of proposed system £ (620,000) 58,151 59,605 61,095 62,622 64,188 65,792 67,437 69,123 70,851 72,623 74,438 76,299 78,207 80,162 82,166 (60,780) 86,325 88,484 90,696 92,963 (136,039) 675,844
Cumulative Cash flow £ (620,000) (561,849) (502,244) (441,149) (378,527) (314,339) (248,547) (181,110) (111,986) (41,135) 31,487 105,926 182,225 260,431 340,593 422,759 361,979 448,304 536,788 627,483 720,446
4) C02 Benefit Tonnes C02 - 729 729 729 729 729 729 729 729 729 729 729 729 729 729 729 729 729 729 729 729 3,646 10,937
Disclaimer: Thomas Burnett cannot be held liable for the accuracy of the
results nor the system performance. The actual results will vary
depending on Client specific assumptions & circumstance.

EHDC HNDU: Heat Techno-Economic Feasibility Studies
P a g e | 72
Scenario 5: 400kW biomass/ 200kWe CHP/ Capex £720k / 9 years payback/ 11% IRR
CHP AND BIOMASS SCREENING TOOL © THOMAS BURNETT TITLE: Scenario 5 Alton 200kWe Gas CHP; 400kW Biomass; 50% RHI Date 23rd Jan 2016
New Alton Data Comments Gas Boiler Comments
Thermal/ Heat load 3,094,000 kWh Gas Boiler Size 800 kW
Electrical load 1,000,000 kWh Gas boiler efficiency 85% % Key
Current gas price 2.75 p/kWh Gas Boiler Capex 100,000 £ Input
Electricity cost 11 p/kWh Gas Boiler Maintenance 2,000.00 £/ annum Calc
CHP Inflators and other factors
CHP electrical output 200 kWe Gas Price Increase 2.5% %
CHP thermal output 300 kWt Electricity Price Increase 2.5% %
CHP electrical efficiency 30% % Biomass Price Increase 2.5% %
CHP thermal efficiency 50% % RHI/RPI increase 2.5% %
CHP hours of operation 5000 hr/ annum NPV Discount Rate 7.0% %
Capital Cost 240,000 £ Capex for 2nd CHP in year 16 at £170,000 and 3rd CHP unit at year 31 = £180,000
Maintenance per annum 20,000 £/annum C02 Emissions
Gas emissions 0.185 kgCO2/kWh
Back up gas & other Biomass emissions 0.012 kgCO2/kWh
% of heat load by gas 5% % Electricity emissions 0.494 kgCO2/kWh
Proxy for other value 4,000 £/annum CRC credits, business rates exemption for good quality CHP
Biomass Requirements
Biomass boiler size 400 kw Results
Boimass boiler hrs of operation 3,598 hrs 20 Year Cashflows Before inflation 25 Year Cashflows before inflation 40 Year Cashflows before inflation
Biomass boiler efficiency 81% % 85% efficient boiler + 4% loses from pipework IRR 11% % IRR 11% IRR 12%
RHI Tier 1 tariff 2.59 p/kWh Half current RHI Payback period 9 Years Payback period 9 Payback period 9
RHI Tier 2 tariff 1.12 p/kWh 20 Year Net Cashlows 1,039,781 25 Year Net Cashlows 1,129,839 40 Year Net Cashlows 2,590,472
Biomass Capital Cost 520,000 £ Capex for 2nd biomass boiler at year 21 = £335,000 NPV 220,226 NPV 229,095 NPV 384,961
Biomass fuel cost 3.00 p/kWh
Biomass maintenance cost 2,500 £/year
Year 0 1 2 3 4 5 6 7 8 9 10 11 12 13 14 15 16 17 18 19 20 21-25 26-40
1) Proposed System
Technical Calculations
CHP Thermal output kWh - 1,500,000 1,500,000 1,500,000 1,500,000 1,500,000 1,500,000 1,500,000 1,500,000 1,500,000 1,500,000 1,500,000 1,500,000 1,500,000 1,500,000 1,500,000 1,500,000 1,500,000 1,500,000 1,500,000 1,500,000 7,500,000 22,500,000
CHP Electrical output kWh - 1,000,000 1,000,000 1,000,000 1,000,000 1,000,000 1,000,000 1,000,000 1,000,000 1,000,000 1,000,000 1,000,000 1,000,000 1,000,000 1,000,000 1,000,000 1,000,000 1,000,000 1,000,000 1,000,000 1,000,000 5,000,000 15,000,000
CHP Total Useful Output kWh - 2,500,000 2,500,000 2,500,000 2,500,000 2,500,000 2,500,000 2,500,000 2,500,000 2,500,000 2,500,000 2,500,000 2,500,000 2,500,000 2,500,000 2,500,000 2,500,000 2,500,000 2,500,000 2,500,000 2,500,000 12,500,000 37,500,000
CHP Total Fuel requirement kWh - 3,125,000 3,125,000 3,125,000 3,125,000 3,125,000 3,125,000 3,125,000 3,125,000 3,125,000 3,125,000 3,125,000 3,125,000 3,125,000 3,125,000 3,125,000 3,125,000 3,125,000 3,125,000 3,125,000 3,125,000 15,625,000 46,875,000
Gas thermal output kWh - 154,700 154,700 154,700 154,700 154,700 154,700 154,700 154,700 154,700 154,700 154,700 154,700 154,700 154,700 154,700 154,700 154,700 154,700 154,700 154,700 773,500 2,320,500
Gas Fuel Requirements kWh - 182,000 182,000 182,000 182,000 182,000 182,000 182,000 182,000 182,000 182,000 182,000 182,000 182,000 182,000 182,000 182,000 182,000 182,000 182,000 182,000 910,000 2,730,000
Biomass thermal output kWh - 1,439,300 1,439,300 1,439,300 1,439,300 1,439,300 1,439,300 1,439,300 1,439,300 1,439,300 1,439,300 1,439,300 1,439,300 1,439,300 1,439,300 1,439,300 1,439,300 1,439,300 1,439,300 1,439,300 1,439,300 7,196,500 21,589,500
Biomass Fuel Requirements kWh - 1,776,914 1,776,914 1,776,914 1,776,914 1,776,914 1,776,914 1,776,914 1,776,914 1,776,914 1,776,914 1,776,914 1,776,914 1,776,914 1,776,914 1,776,914 1,776,914 1,776,914 1,776,914 1,776,914 1,776,914 8,884,568 26,653,704
Proposed system C02 emissions Tonnes C02 - 633 633 633 633 633 633 633 633 633 633 633 633 633 633 633 633 633 633 633 633 3,164 9,491
Alternative system C02 emissions Tonnes C02 - 1,168 1,168 1,168 1,168 1,168 1,168 1,168 1,168 1,168 1,168 1,168 1,168 1,168 1,168 1,168 1,168 1,168 1,168 1,168 1,168 5,838 17,513
CHP Costs £ (240,000) (105,938) (108,586) (111,301) (114,083) (116,935) (119,859) (122,855) (125,926) (129,075) (132,301) (135,609) (138,999) (142,474) (146,036) (149,687) (323,429) (157,265) (161,196) (165,226) (169,357) (912,451) (3,701,870)
CHP Capital cost £ (240,000) - - - - - - - - - - - - - - - (170,000) - - - - - (180,000)
CHP Fuel cost £ - (85,938) (88,086) (90,288) (92,545) (94,859) (97,230) (99,661) (102,153) (104,706) (107,324) (110,007) (112,757) (115,576) (118,466) (121,427) (124,463) (127,575) (130,764) (134,033) (137,384) (740,189) (2,856,974)
CHP Maintenance cost £ - (20,000) (20,500) (21,013) (21,538) (22,076) (22,628) (23,194) (23,774) (24,368) (24,977) (25,602) (26,242) (26,898) (27,570) (28,259) (28,966) (29,690) (30,432) (31,193) (31,973) (172,262) (664,896)
Biomass Income/ Costs (520,000) (31,961) (32,760) (33,579) (34,418) (35,279) (36,161) (37,065) (37,991) (38,941) (39,915) (40,913) (41,936) (42,984) (44,058) (45,160) (46,289) (47,446) (48,632) (49,848) (51,094) (815,675) (1,855,306)
Biomass capital cost £ (520,000) - - - - - - - - - - - - - - - - - - - - (335,000) -
Biomass RHI Income £ - 23,846 24,443 25,054 25,680 26,322 26,980 27,655 28,346 29,055 29,781 30,526 31,289 32,071 32,873 33,694 34,537 35,400 36,285 37,192 38,122 - -
Biomass Fuel Cost £ - (53,307) (54,640) (56,006) (57,406) (58,841) (60,312) (61,820) (63,366) (64,950) (66,574) (68,238) (69,944) (71,693) (73,485) (75,322) (77,205) (79,135) (81,114) (83,141) (85,220) (459,142) (1,772,194)
Biomass Maintenance Costs £ - (2,500) (2,563) (2,627) (2,692) (2,760) (2,829) (2,899) (2,972) (3,046) (3,122) (3,200) (3,280) (3,362) (3,446) (3,532) (3,621) (3,711) (3,804) (3,899) (3,997) (21,533) (83,112)
Gas & Electricity costs & Other value - (1,005) (1,030) (1,056) (1,082) (1,109) (1,137) (1,165) (1,195) (1,224) (1,255) (1,286) (1,319) (1,352) (1,385) (1,420) (1,456) (1,492) (1,529) (1,567) (1,607) (8,656) (33,411)
Gas Fuel Costs £ - (5,005) (5,130) (5,258) (5,390) (5,525) (5,663) (5,804) (5,949) (6,098) (6,251) (6,407) (6,567) (6,731) (6,899) (7,072) (7,249) (7,430) (7,616) (7,806) (8,001) (43,109) (166,390)
Electricity Costs £ - - - - - - - - - - - - - - - - - - - - - - -
Other values (CRC, business rates exemption etc) £ - 4,000 4,100 4,203 4,308 4,415 4,526 4,639 4,755 4,874 4,995 5,120 5,248 5,380 5,514 5,652 5,793 5,938 6,086 6,239 6,395 34,452 132,979
Total Cost of proposed system £ (760,000) (138,903) (142,376) (145,935) (149,584) (153,323) (157,156) (161,085) (165,113) (169,240) (173,471) (177,808) (182,253) (186,810) (191,480) (196,267) (371,174) (206,203) (211,358) (216,642) (222,058) (1,736,782) (5,590,586)
2) Alternative System: electrical & heating costs (100,000) (212,100) (217,403) (222,838) (228,409) (234,119) (239,972) (245,971) (252,120) (258,423) (264,884) (271,506) (278,294) (285,251) (292,382) (299,692) (307,184) (314,864) (322,735) (330,804) (339,074) (1,826,840) (7,051,220)
Gas Boiler Capex £ (100,000) - - - - - - - - - - - - - - - - - - - - - -
Gas Fuel Cost £ - (100,100) (102,603) (105,168) (107,797) (110,492) (113,254) (116,085) (118,987) (121,962) (125,011) (128,136) (131,340) (134,623) (137,989) (141,439) (144,975) (148,599) (152,314) (156,122) (160,025) (862,172) (3,327,803)
Gas Maintenance cost £ - (2,000.00) (2,050.00) (2,101.25) (2,153.78) (2,207.63) (2,262.82) (2,319.39) (2,377.37) (2,436.81) (2,497.73) (2,560.17) (2,624.17) (2,689.78) (2,757.02) (2,825.95) (2,896.60) (2,969.01) (3,043.24) (3,119.32) (3,197.30) (17,226.21) (66,489.58)
Electricity Costs £ - (110,000) (112,750) (115,569) (118,458) (121,419) (124,455) (127,566) (130,755) (134,024) (137,375) (140,809) (144,330) (147,938) (151,636) (155,427) (159,313) (163,296) (167,378) (171,562) (175,852) (947,442) (3,656,927)
3) Total benefit/ cost of proposed system £ (660,000) 73,197 75,026 76,902 78,825 80,795 82,815 84,886 87,008 89,183 91,412 93,698 96,040 98,441 100,902 103,425 (63,990) 108,661 111,377 114,162 117,016 90,058 1,460,633
Cumulative Cash flow £ (660,000) (586,803) (511,777) (434,875) (356,050) (275,255) (192,440) (107,554) (20,546) 68,637 160,049 253,747 349,787 448,228 549,131 652,556 588,566 697,227 808,604 922,766 1,039,781
4) C02 Benefit Tonnes C02 - 535 535 535 535 535 535 535 535 535 535 535 535 535 535 535 535 535 535 535 535 2,674 8,022
Disclaimer: Thomas Burnett cannot be held liable for the accuracy of the
results nor the system performance. The actual results will vary
depending on Client specific assumptions & circumstance.

EHDC HNDU: Heat Techno-Economic Feasibility Studies
P a g e | 73
Scenario 6: Increased heat and electrical load for new houses / 14 years payback/ 3% IRR
CHP AND BIOMASS SCREENING TOOL © THOMAS BURNETT TITLE: Scenario 6 Alton Increased Heat Load; 200kWe Gas CHP; 3 x 400kW Biomass; 50% RHI Date 23rd Jan 2016
New Alton Data Comments Gas Boiler Comments
Thermal/ Heat load 4,849,000 kWh Gas Boiler Size 800 kW
Electrical load 2,527,000 kWh Gas boiler efficiency 85% % Key
Current gas price 2.75 p/kWh Gas Boiler Capex 100,000 £ Input
Electricity cost 11 p/kWh Gas Boiler Maintenance 2,000.00 £/ annum Calc
CHP Inflators and other factors
CHP electrical output 200 kWe Gas Price Increase 2.5% %
CHP thermal output 300 kWt Electricity Price Increase 2.5% %
CHP electrical efficiency 30% % Biomass Price Increase 2.5% %
CHP thermal efficiency 50% % RHI/RPI increase 2.5% %
CHP hours of operation 5500 hr/ annum NPV Discount Rate 7.0% %
Capital Cost 220,000 £ Capex for 2nd CHP in year 16 at £170,000 and 3rd CHP unit at year 31 = £180,000
Maintenance per annum 22,000 £/annum C02 Emissions
Gas emissions 0.185 kgCO2/kWh
Back up gas & other Biomass emissions 0.012 kgCO2/kWh
% of heat load by gas 10% % Electricity emissions 0.494 kgCO2/kWh
Proxy for other value 4,000 £/annum CRC credits, business rates exemption for good quality CHP
Biomass Requirements
Biomass boiler size 1,200 kw Results
Boimass boiler hrs of operation 2,262 hrs 20 Year Cashflows Before inflation 25 Year Cashflows before inflation 40 Year Cashflows before inflation
Biomass boiler efficiency 65% % 85% efficient boiler + 20% losses due to v. seasonal and peaky heat load IRR 3% % IRR 0% IRR 3%
RHI Tier 1 tariff 2.59 p/kWh Half current RHI Payback period 14 Years Payback period 25 Payback period 25
RHI Tier 2 tariff 1.12 p/kWh 20 Year Net Cashlows 494,018 25 Year Net Cashlows 11,061 40 Year Net Cashlows 475,813
Biomass Capital Cost 1,080,000 £ Total Capex of £1,300,000 less CHP cost. 2nd biomass boiler at year 21 = £650,000 NPV (322,664) NPV (444,367) NPV (396,528)
Biomass fuel cost 3.00 p/kWh
Biomass maintenance cost 7,000 £/year
Year 0 1 2 3 4 5 6 7 8 9 10 11 12 13 14 15 16 17 18 19 20 21-25 26-40
1) Proposed System
Technical Calculations
CHP Thermal output kWh - 1,650,000 1,650,000 1,650,000 1,650,000 1,650,000 1,650,000 1,650,000 1,650,000 1,650,000 1,650,000 1,650,000 1,650,000 1,650,000 1,650,000 1,650,000 1,650,000 1,650,000 1,650,000 1,650,000 1,650,000 8,250,000 24,750,000
CHP Electrical output kWh - 1,100,000 1,100,000 1,100,000 1,100,000 1,100,000 1,100,000 1,100,000 1,100,000 1,100,000 1,100,000 1,100,000 1,100,000 1,100,000 1,100,000 1,100,000 1,100,000 1,100,000 1,100,000 1,100,000 1,100,000 5,500,000 16,500,000
CHP Total Useful Output kWh - 2,750,000 2,750,000 2,750,000 2,750,000 2,750,000 2,750,000 2,750,000 2,750,000 2,750,000 2,750,000 2,750,000 2,750,000 2,750,000 2,750,000 2,750,000 2,750,000 2,750,000 2,750,000 2,750,000 2,750,000 13,750,000 41,250,000
CHP Total Fuel requirement kWh - 3,437,500 3,437,500 3,437,500 3,437,500 3,437,500 3,437,500 3,437,500 3,437,500 3,437,500 3,437,500 3,437,500 3,437,500 3,437,500 3,437,500 3,437,500 3,437,500 3,437,500 3,437,500 3,437,500 3,437,500 17,187,500 51,562,500
Gas thermal output kWh - 484,900 484,900 484,900 484,900 484,900 484,900 484,900 484,900 484,900 484,900 484,900 484,900 484,900 484,900 484,900 484,900 484,900 484,900 484,900 484,900 2,424,500 7,273,500
Gas Fuel Requirements kWh - 570,471 570,471 570,471 570,471 570,471 570,471 570,471 570,471 570,471 570,471 570,471 570,471 570,471 570,471 570,471 570,471 570,471 570,471 570,471 570,471 2,852,353 8,557,059
Biomass thermal output kWh - 2,714,100 2,714,100 2,714,100 2,714,100 2,714,100 2,714,100 2,714,100 2,714,100 2,714,100 2,714,100 2,714,100 2,714,100 2,714,100 2,714,100 2,714,100 2,714,100 2,714,100 2,714,100 2,714,100 2,714,100 13,570,500 40,711,500
Biomass Fuel Requirements kWh - 4,175,538 4,175,538 4,175,538 4,175,538 4,175,538 4,175,538 4,175,538 4,175,538 4,175,538 4,175,538 4,175,538 4,175,538 4,175,538 4,175,538 4,175,538 4,175,538 4,175,538 4,175,538 4,175,538 4,175,538 20,877,692 62,633,077
Proposed system C02 emissions Tonnes C02 - 791 791 791 791 791 791 791 791 791 791 791 791 791 791 791 791 791 791 791 791 3,954 11,862
Alternative system C02 emissions Tonnes C02 - 2,304 2,304 2,304 2,304 2,304 2,304 2,304 2,304 2,304 2,304 2,304 2,304 2,304 2,304 2,304 2,304 2,304 2,304 2,304 2,304 11,521 34,563
CHP Costs £ (220,000) (116,531) (119,445) (122,431) (125,491) (128,629) (131,844) (135,141) (138,519) (141,982) (145,532) (149,170) (152,899) (156,722) (160,640) (164,656) (338,772) (172,991) (177,316) (181,749) (186,293) (1,003,696) (4,054,057)
CHP Capital cost £ (220,000) - - - - - - - - - - - - - - - (170,000) - - - - - (180,000)
CHP Fuel cost £ - (94,531) (96,895) (99,317) (101,800) (104,345) (106,953) (109,627) (112,368) (115,177) (118,057) (121,008) (124,033) (127,134) (130,312) (133,570) (136,909) (140,332) (143,840) (147,436) (151,122) (814,208) (3,142,672)
CHP Maintenance cost £ - (22,000) (22,550) (23,114) (23,692) (24,284) (24,891) (25,513) (26,151) (26,805) (27,475) (28,162) (28,866) (29,588) (30,327) (31,085) (31,863) (32,659) (33,476) (34,312) (35,170) (189,488) (731,385)
Biomass Income/ Costs (1,080,000) (78,689) (80,657) (82,673) (84,740) (86,858) (89,030) (91,255) (93,537) (95,875) (98,272) (100,729) (103,247) (105,828) (108,474) (111,186) (113,966) (116,815) (119,735) (122,728) (125,797) (1,789,222) (4,397,160)
Biomass capital cost £ (1,080,000) - - - - - - - - - - - - - - - - - - - - (650,000) -
Biomass RHI Income £ - 53,577 54,916 56,289 57,696 59,139 60,617 62,133 63,686 65,278 66,910 68,583 70,298 72,055 73,856 75,703 77,595 79,535 81,524 83,562 85,651 - -
Biomass Fuel Cost £ - (125,266) (128,398) (131,608) (134,898) (138,270) (141,727) (145,270) (148,902) (152,625) (156,440) (160,351) (164,360) (168,469) (172,681) (176,998) (181,423) (185,958) (190,607) (195,372) (200,257) (1,078,931) (4,164,447)
Biomass Maintenance Costs £ - (7,000) (7,175) (7,354) (7,538) (7,727) (7,920) (8,118) (8,321) (8,529) (8,742) (8,961) (9,185) (9,414) (9,650) (9,891) (10,138) (10,392) (10,651) (10,918) (11,191) (60,292) (232,714)
Gas & Electricity costs & Other value - (168,658) (172,874) (177,196) (181,626) (186,167) (190,821) (195,592) (200,481) (205,493) (210,631) (215,896) (221,294) (226,826) (232,497) (238,309) (244,267) (250,374) (256,633) (263,049) (269,625) (1,452,669) (5,606,998)
Gas Fuel Costs £ - (15,688) (16,080) (16,482) (16,894) (17,317) (17,749) (18,193) (18,648) (19,114) (19,592) (20,082) (20,584) (21,099) (21,626) (22,167) (22,721) (23,289) (23,871) (24,468) (25,080) (135,122) (521,542)
Electricity Costs £ - (156,970) (160,894) (164,917) (169,040) (173,266) (177,597) (182,037) (186,588) (191,253) (196,034) (200,935) (205,958) (211,107) (216,385) (221,795) (227,339) (233,023) (238,848) (244,820) (250,940) (1,351,999) (5,218,435)
Other values (CRC, business rates exemption etc) £ - 4,000 4,100 4,203 4,308 4,415 4,526 4,639 4,755 4,874 4,995 5,120 5,248 5,380 5,514 5,652 5,793 5,938 6,086 6,239 6,395 34,452 132,979
Total Cost of proposed system £ (1,300,000) (363,878) (372,975) (382,300) (391,857) (401,654) (411,695) (421,987) (432,537) (443,351) (454,434) (465,795) (477,440) (489,376) (501,610) (514,151) (697,005) (540,180) (553,684) (567,526) (581,714) (4,245,587) ##########
2) Alternative System: electrical & heating costs (100,000) (436,849) (447,771) (458,965) (470,439) (482,200) (494,255) (506,611) (519,277) (532,259) (545,565) (559,204) (573,184) (587,514) (602,202) (617,257) (632,688) (648,505) (664,718) (681,336) (698,369) (3,762,630) ##########
Gas Boiler Capex £ (100,000) - - - - - - - - - - - - - - - - - - - - - -
Gas Fuel Cost £ - (156,879) (160,801) (164,821) (168,942) (173,166) (177,495) (181,932) (186,480) (191,142) (195,921) (200,819) (205,839) (210,985) (216,260) (221,667) (227,208) (232,888) (238,711) (244,678) (250,795) (1,351,219) (5,215,423)
Gas Maintenance cost £ - (2,000.00) (2,050.00) (2,101.25) (2,153.78) (2,207.63) (2,262.82) (2,319.39) (2,377.37) (2,436.81) (2,497.73) (2,560.17) (2,624.17) (2,689.78) (2,757.02) (2,825.95) (2,896.60) (2,969.01) (3,043.24) (3,119.32) (3,197.30) (17,226.21) (66,489.58)
Electricity Costs £ - (277,970) (284,919) (292,042) (299,343) (306,827) (314,498) (322,360) (330,419) (338,679) (347,146) (355,825) (364,721) (373,839) (383,185) (392,764) (402,583) (412,648) (422,964) (433,538) (444,377) (2,394,185) (9,241,054)
3) Total benefit/ cost of proposed system £ (1,200,000) 72,971 74,795 76,665 78,582 80,546 82,560 84,624 86,740 88,908 91,131 93,409 95,744 98,138 100,591 103,106 (64,316) 108,326 111,034 113,810 116,655 (482,957) 464,752
Cumulative Cash flow £ (1,200,000) (1,127,029) (1,052,234) (975,569) (896,987) (816,441) (733,881) (649,257) (562,517) (473,609) (382,479) (289,070) (193,325) (95,188) 5,404 108,510 44,193 152,519 263,553 377,363 494,018
4) C02 Benefit Tonnes C02 - 1,513 1,513 1,513 1,513 1,513 1,513 1,513 1,513 1,513 1,513 1,513 1,513 1,513 1,513 1,513 1,513 1,513 1,513 1,513 1,513 7,567 22,701
Disclaimer: Thomas Burnett cannot be held liable for the accuracy of the
results nor the system performance. The actual results will vary
depending on Client specific assumptions & circumstance.

EHDC HNDU: Heat Techno-Economic Feasibility Studies
P a g e | 74
A2.3 MODELLING RESULTS: WHITEHILL & BORDON Scenario 7: 2MWe CHP/ 2MW Biomass/ 3MW Gas / 7 years payback/ 14% IRR
CHP AND BIOMASS SCREENING TOOL © THOMAS BURNETT TITLE: Whitehall and Borden Date 24th January 2016
Basic thermal & electric data Comments Comparison system Comments
Thermal/ Heat load 36,911,826 kWh Gas Boiler Size - kW No new boilers
Electrical load 16,629,000 kWh Gas boiler efficiency 85% % Key
Current gas price 2.75 p/kWh Gas Boiler Capex - £ No new boilers Input
Electricity cost 10 p/kWh Gas Boiler Maintenance 10,000.00 £/ annum Calc
CHP Inflators and other factors
CHP electrical output 2,000 kWe Gas Price Increase 2.5% %
CHP thermal output 3,200 kWt Electricity Price Increase 2.5% %
CHP electrical efficiency 30% % Biomass Price Increase 2.5% %
CHP thermal efficiency 50% % RHI/RPI increase 2.5% %
CHP hours of operation 5000 hr/ annum NPV Discount Rate 7.0% %
Capital Cost 1,100,000 £ Capex for 2nd CHP in year 16 at £850,000 and 3rd CHP unit at year 31 = £950,000
Maintenance per annum 180,000 £/annum C02 Emissions
Gas emissions 0.185 kgCO2/kWh
Back up gas & other Biomass emissions 0.012 kgCO2/kWh
% of heat load by gas 37% % Electricity emissions 0.494 kgCO2/kWh
Proxy for other value 25,000 £/annum CRC credits, business rates exemption for good quality CHP
Additional Capex 1,642,000 £ For heat network, energy centre, and 3MW gas boilers
Biomass Requirements
Biomass boiler size 2,000 kw Results
Boimass boiler hrs of operation 3,627 hrs 20 Year Cashflows Before inflation 25 Year Cashflows before inflation 40 Year Cashflows before inflation
Biomass boiler efficiency 70% % 85% efficient boiler + 15% loses from pipework IRR 14% % IRR 15% IRR 15%
RHI Tier 1 tariff 1.02 p/kWh 50% of today's tariff Payback period 7 Years Payback period 7 Payback period 7
RHI Tier 2 tariff 1.02 p/kWh 20 Year Net Cashlows 8,277,628 25 Year Net Cashlows 11,197,779 40 Year Net Cashlows 24,413,795
Biomass Capital Cost 1,000,000 £ Capex for 2nd biomass boiler systems at year 21 = £750,000 NPV 2,460,650 NPV 3,054,679 NPV 4,474,683
Biomass fuel cost 2.50 p/kWh
Biomass maintenance cost 3,400 £/year
Year 0 1 2 3 4 5 6 7 8 9 10 11 12 13 14 15 16 17 18 19 20 21-25 26-40
1) Proposed System
Technical Calculations
CHP Thermal output kWh - 16,000,000 16,000,000 16,000,000 16,000,000 16,000,000 16,000,000 16,000,000 16,000,000 16,000,000 16,000,000 16,000,000 16,000,000 16,000,000 16,000,000 16,000,000 16,000,000 16,000,000 16,000,000 16,000,000 16,000,000 80,000,000 240,000,000
CHP Electrical output kWh - 10,000,000 10,000,000 10,000,000 10,000,000 10,000,000 10,000,000 10,000,000 10,000,000 10,000,000 10,000,000 10,000,000 10,000,000 10,000,000 10,000,000 10,000,000 10,000,000 10,000,000 10,000,000 10,000,000 10,000,000 50,000,000 150,000,000
CHP Total Useful Output kWh - 26,000,000 26,000,000 26,000,000 26,000,000 26,000,000 26,000,000 26,000,000 26,000,000 26,000,000 26,000,000 26,000,000 26,000,000 26,000,000 26,000,000 26,000,000 26,000,000 26,000,000 26,000,000 26,000,000 26,000,000 130,000,000 390,000,000
CHP Total Fuel requirement kWh - 32,500,000 32,500,000 32,500,000 32,500,000 32,500,000 32,500,000 32,500,000 32,500,000 32,500,000 32,500,000 32,500,000 32,500,000 32,500,000 32,500,000 32,500,000 32,500,000 32,500,000 32,500,000 32,500,000 32,500,000 162,500,000 487,500,000
Gas thermal output kWh - 13,657,376 13,657,376 13,657,376 13,657,376 13,657,376 13,657,376 13,657,376 13,657,376 13,657,376 13,657,376 13,657,376 13,657,376 13,657,376 13,657,376 13,657,376 13,657,376 13,657,376 13,657,376 13,657,376 13,657,376 68,286,878 204,860,634
Gas Fuel Requirements kWh - 16,067,501 16,067,501 16,067,501 16,067,501 16,067,501 16,067,501 16,067,501 16,067,501 16,067,501 16,067,501 16,067,501 16,067,501 16,067,501 16,067,501 16,067,501 16,067,501 16,067,501 16,067,501 16,067,501 16,067,501 80,337,504 241,012,511
Biomass thermal output kWh - 7,254,450 7,254,450 7,254,450 7,254,450 7,254,450 7,254,450 7,254,450 7,254,450 7,254,450 7,254,450 7,254,450 7,254,450 7,254,450 7,254,450 7,254,450 7,254,450 7,254,450 7,254,450 7,254,450 7,254,450 36,272,252 108,816,756
Biomass Fuel Requirements kWh - 10,363,501 10,363,501 10,363,501 10,363,501 10,363,501 10,363,501 10,363,501 10,363,501 10,363,501 10,363,501 10,363,501 10,363,501 10,363,501 10,363,501 10,363,501 10,363,501 10,363,501 10,363,501 10,363,501 10,363,501 51,817,503 155,452,508
Proposed system C02 emissions Tonnes C02 - 9,106 9,106 9,106 9,106 9,106 9,106 9,106 9,106 9,106 9,106 9,106 9,106 9,106 9,106 9,106 9,106 9,106 9,106 9,106 9,106 45,532 136,595
Alternative system C02 emissions Tonnes C02 - 16,252 16,252 16,252 16,252 16,252 16,252 16,252 16,252 16,252 16,252 16,252 16,252 16,252 16,252 16,252 16,252 16,252 16,252 16,252 16,252 81,258 243,774
CHP Costs £ (1,100,000) (1,073,750) (1,100,594) (1,128,109) (1,156,311) (1,185,219) (1,214,850) (1,245,221) (1,276,351) (1,308,260) (1,340,967) (1,374,491) (1,408,853) (1,444,074) (1,480,176) (1,517,181) (2,405,110) (1,593,988) (1,633,838) (1,674,684) (1,716,551) (9,248,323) (36,646,593)
CHP Capital cost £ (1,100,000) - - - - - - - - - - - - - - - (850,000) - - - - - (950,000)
CHP Fuel cost £ - (893,750) (916,094) (938,996) (962,471) (986,533) (1,011,196) (1,036,476) (1,062,388) (1,088,948) (1,116,171) (1,144,076) (1,172,677) (1,201,994) (1,232,044) (1,262,845) (1,294,416) (1,326,777) (1,359,946) (1,393,945) (1,428,794) (7,697,964) (29,712,531)
CHP Maintenance cost £ - (180,000) (184,500) (189,113) (193,840) (198,686) (203,653) (208,745) (213,963) (219,313) (224,795) (230,415) (236,176) (242,080) (248,132) (254,335) (260,694) (267,211) (273,891) (280,739) (287,757) (1,550,359) (5,984,062)
Biomass Income/ Costs (1,000,000) (188,855) (193,576) (198,416) (203,376) (208,460) (213,672) (219,014) (224,489) (230,101) (235,854) (241,750) (247,794) (253,989) (260,338) (266,847) (273,518) (280,356) (287,365) (294,549) (301,913) (3,010,833) (8,726,342)
Biomass capital cost £ (1,000,000) - - - - - - - - - - - - - - - - - - - - (750,000) -
Biomass RHI Income £ - 73,633 75,473 77,360 79,294 81,277 83,309 85,391 87,526 89,714 91,957 94,256 96,612 99,028 101,503 104,041 106,642 109,308 112,041 114,842 117,713 - -
Biomass Fuel Cost £ - (259,088) (265,565) (272,204) (279,009) (285,984) (293,134) (300,462) (307,974) (315,673) (323,565) (331,654) (339,945) (348,444) (357,155) (366,084) (375,236) (384,617) (394,232) (404,088) (414,190) (2,231,548) (8,613,310)
Biomass Maintenance Costs £ - (3,400) (3,485) (3,572) (3,661) (3,753) (3,847) (3,943) (4,042) (4,143) (4,246) (4,352) (4,461) (4,573) (4,687) (4,804) (4,924) (5,047) (5,174) (5,303) (5,435) (29,285) (113,032)
Gas & Electricity costs & Other value (1,642,000) (1,079,756) (1,106,750) (1,134,419) (1,162,779) (1,219,444) (1,249,930) (1,281,179) (1,313,208) (1,346,038) (1,379,689) (1,414,181) (1,449,536) (1,485,774) (1,522,919) (1,560,992) (1,600,016) (1,640,017) (1,681,017) (1,723,043) (1,766,119) (9,515,383) (36,727,390)
Other additional cost £ (1,642,000) - - - - - - - - - - - - - - - - - - - - - -
Gas Fuel Costs £ - (441,856) (452,903) (464,225) (475,831) (487,727) (499,920) (512,418) (525,228) (538,359) (551,818) (565,613) (579,754) (594,248) (609,104) (624,331) (639,940) (655,938) (672,337) (689,145) (706,374) (3,805,755) (14,689,419)
Electricity Costs £ - (662,900) (679,473) (696,459) (713,871) (731,718) (750,011) (768,761) (787,980) (807,679) (827,871) (848,568) (869,782) (891,527) (913,815) (936,660) (960,077) (984,079) (1,008,681) (1,033,898) (1,059,745) (5,709,628) (22,037,971)
Other values (CRC, business rates exemption etc) £ - 25,000 25,625 26,266 26,922 - - - - - - - - - - - - - - - - - -
Total Cost of proposed system £ (3,742,000) (2,342,361) (2,400,920) (2,460,943) (2,522,467) (2,613,124) (2,678,452) (2,745,413) (2,814,048) (2,884,400) (2,956,510) (3,030,422) (3,106,183) (3,183,838) (3,263,433) (3,345,019) (4,278,645) (3,514,361) (3,602,220) (3,692,275) (3,784,582) (21,774,539) (82,100,325)
2) Alternative System: electrical & heating costs - (2,867,106) (2,938,784) (3,012,253) (3,087,560) (3,164,749) (3,243,867) (3,324,964) (3,408,088) (3,493,290) (3,580,623) (3,670,138) (3,761,892) (3,855,939) (3,952,337) (4,051,146) (4,152,425) (4,256,235) (4,362,641) (4,471,707) (4,583,500) (24,694,690) (95,316,340)
Gas Boiler Capex £ - - - - - - - - - - - - - - - - - - - - - - -
Gas Fuel Cost £ - (1,194,206) (1,224,061) (1,254,663) (1,286,029) (1,318,180) (1,351,135) (1,384,913) (1,419,536) (1,455,024) (1,491,400) (1,528,685) (1,566,902) (1,606,074) (1,646,226) (1,687,382) (1,729,567) (1,772,806) (1,817,126) (1,862,554) (1,909,118) (10,285,824) (39,701,132)
Gas Maintenance cost £ - (10,000) (10,250) (10,506) (10,769) (11,038) (11,314) (11,597) (11,887) (12,184) (12,489) (12,801) (13,121) (13,449) (13,785) (14,130) (14,483) (14,845) (15,216) (15,597) (15,987) (86,131) (332,448)
Electricity Costs £ - (1,662,900) (1,704,473) (1,747,084) (1,790,761) (1,835,530) (1,881,419) (1,928,454) (1,976,666) (2,026,082) (2,076,734) (2,128,653) (2,181,869) (2,236,416) (2,292,326) (2,349,634) (2,408,375) (2,468,584) (2,530,299) (2,593,556) (2,658,395) (14,322,735) (55,282,761)
3) Total benefit/ cost of proposed system £ (3,742,000) 524,745 537,864 551,310 565,093 551,625 565,416 579,551 594,040 608,891 624,113 639,716 655,709 672,101 688,904 706,127 (126,220) 741,874 760,421 779,432 798,917 2,920,151 13,216,015
Cumulative Cash flow £ (3,742,000) (3,217,255) (2,679,391) (2,128,081) (1,562,988) (1,011,363) (445,947) 133,604 727,643 1,336,534 1,960,647 2,600,363 3,256,072 3,928,173 4,617,077 5,323,204 5,196,984 5,938,858 6,699,279 7,478,711 8,277,628 48,467,392 265,280,238
4) C02 Benefit Tonnes C02 - 7,145 7,145 7,145 7,145 7,145 7,145 7,145 7,145 7,145 7,145 7,145 7,145 7,145 7,145 7,145 7,145 7,145 7,145 7,145 7,145 35,726 107,179
Disclaimer: Thomas Burnett cannot be held liable for the accuracy of the results nor the
system performance. The actual results will vary depending on Client specific
assumptions & circumstance.
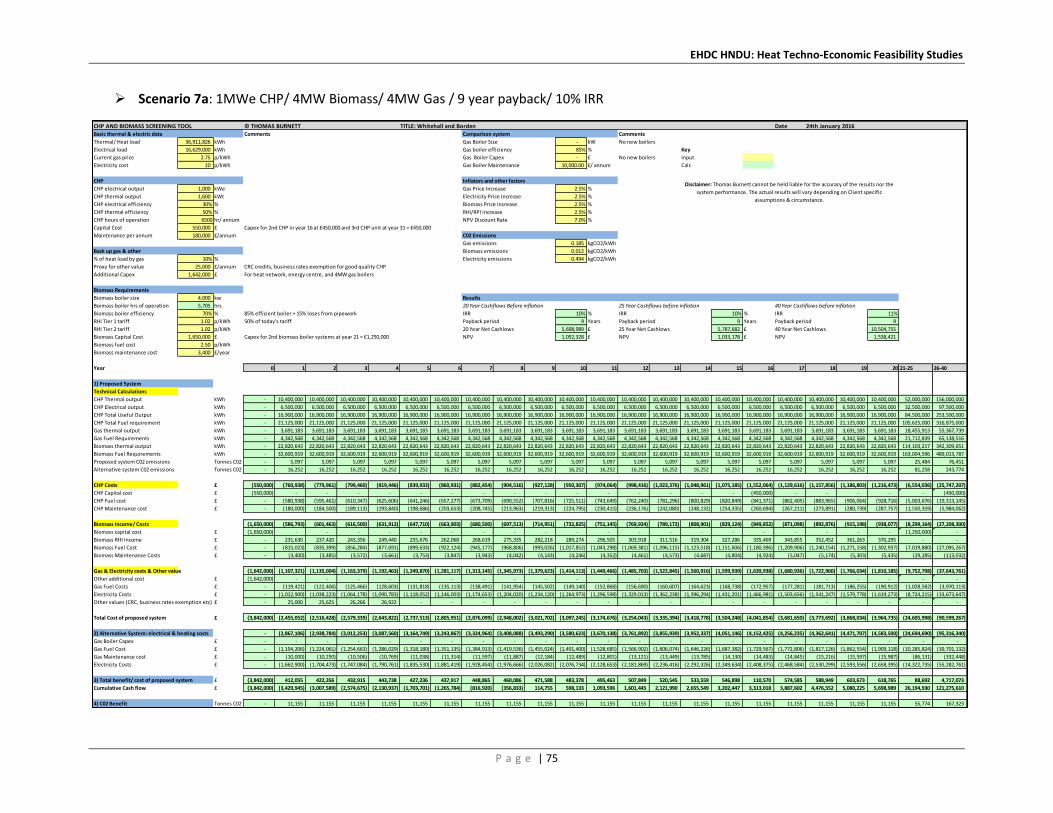
EHDC HNDU: Heat Techno-Economic Feasibility Studies
P a g e | 75
Scenario 7a: 1MWe CHP/ 4MW Biomass/ 4MW Gas / 9 year payback/ 10% IRR
CHP AND BIOMASS SCREENING TOOL © THOMAS BURNETT TITLE: Whitehall and Borden Date 24th January 2016
Basic thermal & electric data Comments Comparison system Comments
Thermal/ Heat load 36,911,826 kWh Gas Boiler Size - kW No new boilers
Electrical load 16,629,000 kWh Gas boiler efficiency 85% % Key
Current gas price 2.75 p/kWh Gas Boiler Capex - £ No new boilers Input
Electricity cost 10 p/kWh Gas Boiler Maintenance 10,000.00 £/ annum Calc
CHP Inflators and other factors
CHP electrical output 1,000 kWe Gas Price Increase 2.5% %
CHP thermal output 1,600 kWt Electricity Price Increase 2.5% %
CHP electrical efficiency 30% % Biomass Price Increase 2.5% %
CHP thermal efficiency 50% % RHI/RPI increase 2.5% %
CHP hours of operation 6500 hr/ annum NPV Discount Rate 7.0% %
Capital Cost 550,000 £ Capex for 2nd CHP in year 16 at £450,000 and 3rd CHP unit at year 31 = £450,000
Maintenance per annum 180,000 £/annum C02 Emissions
Gas emissions 0.185 kgCO2/kWh
Back up gas & other Biomass emissions 0.012 kgCO2/kWh
% of heat load by gas 10% % Electricity emissions 0.494 kgCO2/kWh
Proxy for other value 25,000 £/annum CRC credits, business rates exemption for good quality CHP
Additional Capex 1,642,000 £ For heat network, energy centre, and 4MW gas boilers
Biomass Requirements
Biomass boiler size 4,000 kw Results
Boimass boiler hrs of operation 5,705 hrs 20 Year Cashflows Before inflation 25 Year Cashflows before inflation 40 Year Cashflows before inflation
Biomass boiler efficiency 70% % 85% efficient boiler + 15% loses from pipework IRR 10% % IRR 10% % IRR 11%
RHI Tier 1 tariff 1.02 p/kWh 50% of today's tariff Payback period 9 Years Payback period 9 Years Payback period 9
RHI Tier 2 tariff 1.02 p/kWh 20 Year Net Cashlows 5,698,989 £ 25 Year Net Cashlows 5,787,682 £ 40 Year Net Cashlows 10,504,755
Biomass Capital Cost 1,650,000 £ Capex for 2nd biomass boiler systems at year 21 = £1,250,000 NPV 1,052,328 £ NPV 1,033,178 £ NPV 1,538,421
Biomass fuel cost 2.50 p/kWh
Biomass maintenance cost 3,400 £/year
Year 0 1 2 3 4 5 6 7 8 9 10 11 12 13 14 15 16 17 18 19 20 21-25 26-40
1) Proposed System
Technical Calculations
CHP Thermal output kWh - 10,400,000 10,400,000 10,400,000 10,400,000 10,400,000 10,400,000 10,400,000 10,400,000 10,400,000 10,400,000 10,400,000 10,400,000 10,400,000 10,400,000 10,400,000 10,400,000 10,400,000 10,400,000 10,400,000 10,400,000 52,000,000 156,000,000
CHP Electrical output kWh - 6,500,000 6,500,000 6,500,000 6,500,000 6,500,000 6,500,000 6,500,000 6,500,000 6,500,000 6,500,000 6,500,000 6,500,000 6,500,000 6,500,000 6,500,000 6,500,000 6,500,000 6,500,000 6,500,000 6,500,000 32,500,000 97,500,000
CHP Total Useful Output kWh - 16,900,000 16,900,000 16,900,000 16,900,000 16,900,000 16,900,000 16,900,000 16,900,000 16,900,000 16,900,000 16,900,000 16,900,000 16,900,000 16,900,000 16,900,000 16,900,000 16,900,000 16,900,000 16,900,000 16,900,000 84,500,000 253,500,000
CHP Total Fuel requirement kWh - 21,125,000 21,125,000 21,125,000 21,125,000 21,125,000 21,125,000 21,125,000 21,125,000 21,125,000 21,125,000 21,125,000 21,125,000 21,125,000 21,125,000 21,125,000 21,125,000 21,125,000 21,125,000 21,125,000 21,125,000 105,625,000 316,875,000
Gas thermal output kWh - 3,691,183 3,691,183 3,691,183 3,691,183 3,691,183 3,691,183 3,691,183 3,691,183 3,691,183 3,691,183 3,691,183 3,691,183 3,691,183 3,691,183 3,691,183 3,691,183 3,691,183 3,691,183 3,691,183 3,691,183 18,455,913 55,367,739
Gas Fuel Requirements kWh - 4,342,568 4,342,568 4,342,568 4,342,568 4,342,568 4,342,568 4,342,568 4,342,568 4,342,568 4,342,568 4,342,568 4,342,568 4,342,568 4,342,568 4,342,568 4,342,568 4,342,568 4,342,568 4,342,568 4,342,568 21,712,839 65,138,516
Biomass thermal output kWh - 22,820,643 22,820,643 22,820,643 22,820,643 22,820,643 22,820,643 22,820,643 22,820,643 22,820,643 22,820,643 22,820,643 22,820,643 22,820,643 22,820,643 22,820,643 22,820,643 22,820,643 22,820,643 22,820,643 22,820,643 114,103,217 342,309,651
Biomass Fuel Requirements kWh - 32,600,919 32,600,919 32,600,919 32,600,919 32,600,919 32,600,919 32,600,919 32,600,919 32,600,919 32,600,919 32,600,919 32,600,919 32,600,919 32,600,919 32,600,919 32,600,919 32,600,919 32,600,919 32,600,919 32,600,919 163,004,596 489,013,787
Proposed system C02 emissions Tonnes C02 - 5,097 5,097 5,097 5,097 5,097 5,097 5,097 5,097 5,097 5,097 5,097 5,097 5,097 5,097 5,097 5,097 5,097 5,097 5,097 5,097 25,484 76,451
Alternative system C02 emissions Tonnes C02 - 16,252 16,252 16,252 16,252 16,252 16,252 16,252 16,252 16,252 16,252 16,252 16,252 16,252 16,252 16,252 16,252 16,252 16,252 16,252 16,252 81,258 243,774
CHP Costs £ (550,000) (760,938) (779,961) (799,460) (819,446) (839,933) (860,931) (882,454) (904,516) (927,128) (950,307) (974,064) (998,416) (1,023,376) (1,048,961) (1,075,185) (1,552,064) (1,129,616) (1,157,856) (1,186,803) (1,216,473) (6,554,036) (25,747,207)
CHP Capital cost £ (550,000) - - - - - - - - - - - - - - - (450,000) - - - - - (450,000)
CHP Fuel cost £ - (580,938) (595,461) (610,347) (625,606) (641,246) (657,277) (673,709) (690,552) (707,816) (725,511) (743,649) (762,240) (781,296) (800,829) (820,849) (841,371) (862,405) (883,965) (906,064) (928,716) (5,003,676) (19,313,145)
CHP Maintenance cost £ - (180,000) (184,500) (189,113) (193,840) (198,686) (203,653) (208,745) (213,963) (219,313) (224,795) (230,415) (236,176) (242,080) (248,132) (254,335) (260,694) (267,211) (273,891) (280,739) (287,757) (1,550,359) (5,984,062)
Biomass Income/ Costs (1,650,000) (586,793) (601,463) (616,500) (631,912) (647,710) (663,903) (680,500) (697,513) (714,951) (732,825) (751,145) (769,924) (789,172) (808,901) (829,124) (849,852) (871,098) (892,876) (915,198) (938,077) (8,299,164) (27,208,300)
Biomass capital cost £ (1,650,000) - - - - - - - - - - - - - - - - - - - - (1,250,000) -
Biomass RHI Income £ - 231,630 237,420 243,356 249,440 255,676 262,068 268,619 275,335 282,218 289,274 296,505 303,918 311,516 319,304 327,286 335,469 343,855 352,452 361,263 370,295 - -
Biomass Fuel Cost £ - (815,023) (835,399) (856,284) (877,691) (899,633) (922,124) (945,177) (968,806) (993,026) (1,017,852) (1,043,298) (1,069,381) (1,096,115) (1,123,518) (1,151,606) (1,180,396) (1,209,906) (1,240,154) (1,271,158) (1,302,937) (7,019,880) (27,095,267)
Biomass Maintenance Costs £ - (3,400) (3,485) (3,572) (3,661) (3,753) (3,847) (3,943) (4,042) (4,143) (4,246) (4,352) (4,461) (4,573) (4,687) (4,804) (4,924) (5,047) (5,174) (5,303) (5,435) (29,285) (113,032)
Gas & Electricity costs & Other value (1,642,000) (1,107,321) (1,135,004) (1,163,379) (1,192,463) (1,249,870) (1,281,117) (1,313,145) (1,345,973) (1,379,623) (1,414,113) (1,449,466) (1,485,703) (1,522,845) (1,560,916) (1,599,939) (1,639,938) (1,680,936) (1,722,960) (1,766,034) (1,810,185) (9,752,798) (37,643,761)
Other additional cost £ (1,642,000) - - - - - - - - - - - - - - - - - - - - - -
Gas Fuel Costs £ - (119,421) (122,406) (125,466) (128,603) (131,818) (135,113) (138,491) (141,954) (145,502) (149,140) (152,868) (156,690) (160,607) (164,623) (168,738) (172,957) (177,281) (181,713) (186,255) (190,912) (1,028,582) (3,970,113)
Electricity Costs £ - (1,012,900) (1,038,223) (1,064,178) (1,090,783) (1,118,052) (1,146,003) (1,174,653) (1,204,020) (1,234,120) (1,264,973) (1,296,598) (1,329,013) (1,362,238) (1,396,294) (1,431,201) (1,466,981) (1,503,656) (1,541,247) (1,579,778) (1,619,273) (8,724,215) (33,673,647)
Other values (CRC, business rates exemption etc) £ - 25,000 25,625 26,266 26,922 - - - - - - - - - - - - - - - - - -
Total Cost of proposed system £ (3,842,000) (2,455,052) (2,516,428) (2,579,339) (2,643,822) (2,737,513) (2,805,951) (2,876,099) (2,948,002) (3,021,702) (3,097,245) (3,174,676) (3,254,043) (3,335,394) (3,418,778) (3,504,248) (4,041,854) (3,681,650) (3,773,692) (3,868,034) (3,964,735) (24,605,998) (90,599,267)
2) Alternative System: electrical & heating costs - (2,867,106) (2,938,784) (3,012,253) (3,087,560) (3,164,749) (3,243,867) (3,324,964) (3,408,088) (3,493,290) (3,580,623) (3,670,138) (3,761,892) (3,855,939) (3,952,337) (4,051,146) (4,152,425) (4,256,235) (4,362,641) (4,471,707) (4,583,500) (24,694,690) (95,316,340)
Gas Boiler Capex £ - - - - - - - - - - - - - - - - - - - - - - -
Gas Fuel Cost £ - (1,194,206) (1,224,061) (1,254,663) (1,286,029) (1,318,180) (1,351,135) (1,384,913) (1,419,536) (1,455,024) (1,491,400) (1,528,685) (1,566,902) (1,606,074) (1,646,226) (1,687,382) (1,729,567) (1,772,806) (1,817,126) (1,862,554) (1,909,118) (10,285,824) (39,701,132)
Gas Maintenance cost £ - (10,000) (10,250) (10,506) (10,769) (11,038) (11,314) (11,597) (11,887) (12,184) (12,489) (12,801) (13,121) (13,449) (13,785) (14,130) (14,483) (14,845) (15,216) (15,597) (15,987) (86,131) (332,448)
Electricity Costs £ - (1,662,900) (1,704,473) (1,747,084) (1,790,761) (1,835,530) (1,881,419) (1,928,454) (1,976,666) (2,026,082) (2,076,734) (2,128,653) (2,181,869) (2,236,416) (2,292,326) (2,349,634) (2,408,375) (2,468,584) (2,530,299) (2,593,556) (2,658,395) (14,322,735) (55,282,761)
3) Total benefit/ cost of proposed system £ (3,842,000) 412,055 422,356 432,915 443,738 427,236 437,917 448,865 460,086 471,588 483,378 495,463 507,849 520,545 533,559 546,898 110,570 574,585 588,949 603,673 618,765 88,692 4,717,073
Cumulative Cash flow £ (3,842,000) (3,429,945) (3,007,589) (2,574,675) (2,130,937) (1,703,701) (1,265,784) (816,920) (356,833) 114,755 598,133 1,093,596 1,601,445 2,121,990 2,655,549 3,202,447 3,313,018 3,887,602 4,476,552 5,080,225 5,698,989 26,194,930 121,275,610
4) C02 Benefit Tonnes C02 - 11,155 11,155 11,155 11,155 11,155 11,155 11,155 11,155 11,155 11,155 11,155 11,155 11,155 11,155 11,155 11,155 11,155 11,155 11,155 11,155 55,774 167,323
Disclaimer: Thomas Burnett cannot be held liable for the accuracy of the results nor the
system performance. The actual results will vary depending on Client specific
assumptions & circumstance.

EHDC HNDU: Heat Techno-Economic Feasibility Studies
P a g e | 76
Scenario 8: 4,849,000 heat supplied by 200kWe CHP/ 500kW GSHP / 9 year payback/ 11% IRR
CHP AND GSHP SCREENING TOOL © THOMAS BURNETT TITLE: Whitehall and Borden - Scenario 8: Heating supplied by CHP and GSHP Date 24th Jan 2016
Basic thermal & electric data Comments Comparison system Comments
Thermal/ Heat load 4,849,000 kWh Gas Boiler Size - kW No new boilers
Electrical load - kWh Gas boiler efficiency 85% % Key
Current gas price 2.75 p/kWh Gas Boiler Capex - £ No new boilers Input
Electricity cost 11 p/kWh Gas Boiler Maintenance 10,000.00 £/ annum Calc
CHP Inflators and other factors
CHP electrical output 200 kWe Gas Price Increase 2.5% %
CHP thermal output 300 kWt Electricity Price Increase 2.5% %
CHP electrical efficiency 30% % Biomass Price Increase 2.5% %
CHP thermal efficiency 50% % RHI/RPI increase 2.5% %
CHP hours of operation 5000 hr/ annum NPV Discount Rate 7.0% %
Capital Cost 220,000 £ Capex for 2nd CHP in year 16 at £170,000 and 3rd CHP unit at year 31 = £170,000
Maintenance per annum 20,000 £/annum C02 Emissions
Gas emissions 0.185 kgCO2/kWh
Back up gas & other Biomass emissions 0.012 kgCO2/kWh
% of heat load by gas 5% % Electricity emissions 0.494 kgCO2/kWh
Proxy for other value - £/annum CRC credits, business rates exemption for good quality CHP
Additional Capex -
GSHP System
GSHP boiler size 500 kw Results
GSHP boiler hrs of operation 6,213 hrs 20 Year Cashflows Before inflation 25 Year Cashflows before inflation 40 Year Cashflows before inflation
Coefficient of Performance 3.00 IRR 11% % IRR 10% % IRR 11%
RHI Tier 1 tariff 4.42 p/kWh Payback period 9 Years Payback period 9 Years Payback period 9
RHI Tier 2 tariff 1.32 p/kWh 20 Year Net Cashlows 1,574,928 20 Year Net Cashlows 1,368,470 20 Year Net Cashlows 2,717,461
GSHP Capital Cost 770,000 £ Capex for 2nd GSHP in year 21 at £600,000 NPV 324,151 NPV 262,362 NPV 406,261
GSHP Electricity cost - p/kWh
GSHP maintenance cost 3,500 £/year
Year 0 1 2 3 4 5 6 7 8 9 10 11 12 13 14 15 16 17 18 19 20 21-25 26-40
1) Proposed System
Technical Calculations
CHP Thermal output kWh - 1,500,000 1,500,000 1,500,000 1,500,000 1,500,000 1,500,000 1,500,000 1,500,000 1,500,000 1,500,000 1,500,000 1,500,000 1,500,000 1,500,000 1,500,000 1,500,000 1,500,000 1,500,000 1,500,000 1,500,000 7,500,000 22,500,000
CHP Electrical output kWh - 1,000,000 1,000,000 1,000,000 1,000,000 1,000,000 1,000,000 1,000,000 1,000,000 1,000,000 1,000,000 1,000,000 1,000,000 1,000,000 1,000,000 1,000,000 1,000,000 1,000,000 1,000,000 1,000,000 1,000,000 5,000,000 15,000,000
CHP Total Useful Output kWh - 2,500,000 2,500,000 2,500,000 2,500,000 2,500,000 2,500,000 2,500,000 2,500,000 2,500,000 2,500,000 2,500,000 2,500,000 2,500,000 2,500,000 2,500,000 2,500,000 2,500,000 2,500,000 2,500,000 2,500,000 12,500,000 37,500,000
CHP Total Fuel requirement kWh - 3,125,000 3,125,000 3,125,000 3,125,000 3,125,000 3,125,000 3,125,000 3,125,000 3,125,000 3,125,000 3,125,000 3,125,000 3,125,000 3,125,000 3,125,000 3,125,000 3,125,000 3,125,000 3,125,000 3,125,000 15,625,000 46,875,000
Gas thermal output kWh - 242,450 242,450 242,450 242,450 242,450 242,450 242,450 242,450 242,450 242,450 242,450 242,450 242,450 242,450 242,450 242,450 242,450 242,450 242,450 242,450 1,212,250 3,636,750
Gas Fuel Requirements kWh - 285,235 285,235 285,235 285,235 285,235 285,235 285,235 285,235 285,235 285,235 285,235 285,235 285,235 285,235 285,235 285,235 285,235 285,235 285,235 285,235 1,426,176 4,278,529
GSHP thermal output kWh - 3,106,550 3,106,550 3,106,550 3,106,550 3,106,550 3,106,550 3,106,550 3,106,550 3,106,550 3,106,550 3,106,550 3,106,550 3,106,550 3,106,550 3,106,550 3,106,550 3,106,550 3,106,550 3,106,550 3,106,550 15,532,750 46,598,250
GSHP Electricity Requirements kWh - 1,035,517 1,035,517 1,035,517 1,035,517 1,035,517 1,035,517 1,035,517 1,035,517 1,035,517 1,035,517 1,035,517 1,035,517 1,035,517 1,035,517 1,035,517 1,035,517 1,035,517 1,035,517 1,035,517 1,035,517 5,177,583 15,532,750
CHP Costs £ (220,000) (105,938) (108,586) (111,301) (114,083) (116,935) (119,859) (122,855) (125,926) (129,075) (132,301) (135,609) (138,999) (142,474) (146,036) (149,687) (323,429) (157,265) (161,196) (165,226) (169,357) (912,451) (3,691,870)
CHP Capital cost £ (220,000) - - - - - - - - - - - - - - - (170,000) - - - - - (170,000)
CHP Fuel cost £ - (85,938) (88,086) (90,288) (92,545) (94,859) (97,230) (99,661) (102,153) (104,706) (107,324) (110,007) (112,757) (115,576) (118,466) (121,427) (124,463) (127,575) (130,764) (134,033) (137,384) (740,189) (2,856,974)
CHP Maintenance cost £ - (20,000) (20,500) (21,013) (21,538) (22,076) (22,628) (23,194) (23,774) (24,368) (24,977) (25,602) (26,242) (26,898) (27,570) (28,259) (28,966) (29,690) (30,432) (31,193) (31,973) (172,262) (664,896)
GSHP Income/ Costs (770,000) 57,873 59,320 60,803 62,323 63,881 65,479 67,115 68,793 70,513 72,276 74,083 75,935 77,833 79,779 81,774 83,818 85,913 88,061 90,263 92,519 (630,146) (116,357)
GSHP capital cost £ (770,000) - - - - - - - - - - - - - - - - - - - - (600,000) -
GSHP RHI Income £ - 61,373 62,908 64,480 66,093 67,745 69,438 71,174 72,954 74,778 76,647 78,563 80,527 82,540 84,604 86,719 88,887 91,109 93,387 95,722 98,115 - -
GSHP Electricity Cost £ - - - - - - - - - - - - - - - - - - - - - - -
GSHP Maintenance Costs £ - (3,500) (3,588) (3,677) (3,769) (3,863) (3,960) (4,059) (4,160) (4,264) (4,371) (4,480) (4,592) (4,707) (4,825) (4,945) (5,069) (5,196) (5,326) (5,459) (5,595) (30,146) (116,357)
Gas & Electricity costs & Other value - (11,751) (12,045) (12,346) (12,654) (12,971) (13,295) (13,627) (13,968) (14,317) (14,675) (15,042) (15,418) (15,804) (16,199) (16,604) (17,019) (17,444) (17,880) (18,327) (18,785) (101,211) (390,653)
Other additional cost £ - - - - - - - - - - - - - - - - - - - - - - -
Gas Fuel Costs £ - (7,844) (8,040) (8,241) (8,447) (8,658) (8,875) (9,097) (9,324) (9,557) (9,796) (10,041) (10,292) (10,549) (10,813) (11,083) (11,360) (11,644) (11,936) (12,234) (12,540) (67,561) (260,771)
Electricity Costs £ - (3,907) (4,005) (4,105) (4,207) (4,312) (4,420) (4,531) (4,644) (4,760) (4,879) (5,001) (5,126) (5,254) (5,386) (5,520) (5,658) (5,800) (5,945) (6,093) (6,246) (33,650) (129,882)
Other values (CRC, business rates exemption etc) £ - - - - - - - - - - - - - - - - - - - - - - -
Total Cost of proposed system £ (990,000) (59,815) (61,310) (62,843) (64,414) (66,024) (67,675) (69,367) (71,101) (72,879) (74,701) (76,568) (78,482) (80,444) (82,455) (84,517) (256,630) (88,795) (91,015) (93,291) (95,623) (1,643,808) (4,198,880)
2) Alternative System: electrical & heating costs - (166,879) (171,051) (175,328) (179,711) (184,204) (188,809) (193,529) (198,367) (203,326) (208,410) (213,620) (218,960) (224,434) (230,045) (235,796) (241,691) (247,733) (253,927) (260,275) (266,782) (1,437,350) (5,547,871)
Gas Boiler Capex £ - - - - - - - - - - - - - - - - - - - - - - -
Gas Fuel Cost £ - (156,879) (160,801) (164,821) (168,942) (173,166) (177,495) (181,932) (186,480) (191,142) (195,921) (200,819) (205,839) (210,985) (216,260) (221,667) (227,208) (232,888) (238,711) (244,678) (250,795) (1,351,219) (5,215,423)
Gas Maintenance cost £ - (10,000) (10,250) (10,506) (10,769) (11,038) (11,314) (11,597) (11,887) (12,184) (12,489) (12,801) (13,121) (13,449) (13,785) (14,130) (14,483) (14,845) (15,216) (15,597) (15,987) (86,131) (332,448)
Electricity Costs £ - - - - - - - - - - - - - - - - - - - - - - -
3) Total benefit/ cost of proposed system £ (990,000) 107,065 109,741 112,485 115,297 118,179 121,134 124,162 127,266 130,448 133,709 137,052 140,478 143,990 147,590 151,279 (14,939) 158,938 162,911 166,984 171,159 (206,458) 1,348,991
Cumulative Cash flow £ (990,000) (882,935) (773,194) (660,710) (545,413) (427,233) (306,100) (181,938) (54,672) 75,776 209,485 346,537 487,015 631,005 778,595 929,874 914,935 1,073,873 1,236,785 1,403,769 1,574,928 6,035,836 30,280,438
4) C02 Benefit Tonnes C02 - 424 424 424 424 424 424 424 424 424 424 424 424 424 424 424 424 424 424 424 424 2,122 6,366
Disclaimer: Thomas Burnett cannot be held liable for the accuracy of the results nor the
system performance. The actual results will vary depending on Client specific
assumptions & circumstance.

EHDC HNDU: Heat Techno-Economic Feasibility Studies
P a g e | 77
APPENDIX 3: PENNS PLACE AND TARO LEISURE CENTRE: SURVEY & ENERGY
DATA
A3.1 PENNS PLACE
A3.1.1 South Block South block consists of a two storey building with flat roof constructed in the late 1960s and early 1970s.
The nature of construction is unusual and includes extensive use of aluminium facades with fibre glass
panels. The core of the building is a steel frame.
The majority of the building facade is uninsulated and it is likely that thermal bridging is taking place
between the exterior facade and internal steel frame. Whilst the light coloured aluminium frame is quite
reflective the dark glass fibre panels tend to absorb a lot of solar energy which is in turn transmitted into
the internal spaces. This heat transfer can add substantially to internal temperatures during the warmer
months and during periods of intense sunlight.
Insulation has taken place internally above suspended ceilings. The roof spaces are also insulated, albeit
to a low level. Due to asbestos the majority of the walls/facade are uninsulated.
The conference rooms are heated using electric panel radiators. In this part of the building the wet
central heating system has been decommissioned due to the poor condition of the pipework.
The Display Energy Certificate for the building shows and energy rating of 'D' and a total useful area of
4,705 square meters.
The boiler room for South Block houses two Hamworthy 105 kW gas boilers (total installed capacity 210
kW). There is also a 16 kW fast recovery hot water cylinder also fired by gas.
A3.1.2 Link building The two storey link building is of conventional brick construction with a pitched tiled roof and was
competed in 1986. The cavity walls were insulated on construction.
The link building houses the reception and public areas and is attached to the council chamber which is
used for meetings and official functions.
A3.1.3 North block The two storey north block runs at 90 degrees to the south block and is of the same construction as the
south block. This building houses offices and has relatively high occupancy compared to other areas.
Refurbishment of the north block facades took place during late 2015. These works included:
Replacement of single-glazed windows with double glazed units
Cavity wall insulation
Sealing of glass fibre inset panels to reduce air permeability

EHDC HNDU: Heat Techno-Economic Feasibility Studies
P a g e | 78
As with the south block over-heating is a key problem in summer, exacerbated by malfunctioning window
units that could not be opened properly due to defective springs. The new windows, and accompanying
internal shades, should therefore help mitigate over-heating (although it may not be fully eradicated).
Maintaining a comfortable heating regime during the colder months is rarely an issue at Penns Place. The
upgraded façade will reduce energy demand and should again enhance comfort via the eradication of
drafts.
A3.1.4 The impact of façade refurbishment on heat loads The Display Energy Certificates (DEC) data for Penns Place and Taro Leisure Centre were retrieved from
the Landmark database and are summarised in the table below. Both Penns Place and Taro Leisure Centre
achieve a rating of ‘D’ which indicates that they perform slightly better than the reference building or
benchmark32.
Table 26: Display Energy Certificate data for surveyed buildings
Building Rating Total Useful Floor Area
(m2)
Heating (kWh/m
2/year)
Electricity (kWh/m
2/year)
Energy from renewables†(%)
CO2 (t/pa)
EHDC Offices
D (84) 4,705
Actual 76
(Typical 110)
Actual 85
(Typical 95)
None
Ca. 270
Taro Leisure Centre
D (80) 3,920
Actual 481
(Typical 610)
Actual 151
(Typical 187)
47.9% (546,131 kWh)
Ca. 706
Notes: † The source of the renewable energy at Taro is stated as CHP in the DEC advisory report.
CIBSE Guide F provides energy benchmarks for a range of building types. The benchmarks provided for
offices, sports and recreation buildings are shown in the following table.
Table 27: Energy benchmarks for selected buildings
Building Type Good Practice (kWh/m
2/year) Typical Practice (kWh/m
2/year)
Fossil fuels Electricity Fossil fuels Electricity
Combined centre 264 96 598 152
Leisure pool centre 573 164 1321 258
Swimming pool (25m) centre 573 152 1336 237
Offices (naturally ventilated, open plan) 79 54 151 85
Offices (naturally ventilated, cellular) 79 33 151 54
Source: Energy Efficiency in Buildings, Third Edition 2012.
It is important to take into consideration the impact of the recent façade refurbishment on the total
energy demand for Penns Place. In combination these works are likely to have a relatively large impact on
the kWh/m2 ‘result’ for north block. For south block the impact is likely to be lower due to the fact that
32
Note that the benchmarks used for the DEC differ from the CIBSE benchmarks presented in Table 4. This is due to the way in which benchmarks are calculated within the software used to generate Display Energy Certificates (DECs).

EHDC HNDU: Heat Techno-Economic Feasibility Studies
P a g e | 79
some glazing improvements have already taken place plus the reduced opportunity to improve the non-
glazed parts33.
Given that façade refurbishment can have a significant impact on energy demand (space heating), which is
currently unknown, it was necessary to develop different scenarios to take into account likely outcomes,
as they affect the average heat demand in kWh/m2.
Note however, that the energy efficiency impact of these measures (e.g. as a result of improve r- and u-
values) has not been modelled in detail in this project and consequently any impact on overall energy
demand is only likely to be revealed via meter readings over the next 12 to 24 months34.
To help facilitate this discussion, and improve the accuracy of our energy data and the financial appraisals,
we prepared a basic simulation (see Table 28) using a notational room (10m x 10m x 2.5m) to demonstrate
the potential impact. This is an indicative calculation based on a notational space and based on Steady
Heat Loss Calculation Method as set out in the CIBSE Guide A. The results in the following table suggest an
energy saving in the region of 78% (based on the notional space created for this exercise). In reality it
would be unlikely to achieve such high energy savings as heat loss will be driven by a number of complex
interactions (e.g. occupant behaviour, season, climate, heat loss, air permeability and so on). As such
there is will always be a gap between the theoretical projected energy savings and those found in reality.
On the basis of these we concluded that a pragmatic approach would assume a saving of around 50%.
For South Block, where new double glazing was also installed in late 2015 but not panel efficiency
improvements, we again carried out a simulation using a notional room (see Table 29) and concluded that
around 27% savings could be achieved.
Based on experience we therefore down-rated this result slightly to reflect that there was some older
double glazing in parts of this block already, meaning the efficiency benefits would be lower. Also, using
the same approach as for North Block, we down-rated the assumed savings to 10%. These reductions
were based on professional judgement and are deliberately cautious. This re-working was based on
professional judgement and basic energy modelling. It would require direct measurement, post-
installation, and more advanced modelling, to deliver a more accurate evaluation of the impact of this
refurbishment.
Table 28: Example heat loss simulation for EHDC North Block
U values Building Constructed in 1970
standard Building Refurbished to a level
closer to current standards
Walls 1.7 0.1235
Glazing 6.0 1.8
Roof 2.5 0.21
Floor 0.5 0.5
Infiltration rate (air changes per hour) 1.5 0.5
Heat loss (W) 15,355 3,411
33
The non-glazed parts of the north block façade will be insulated from inside whereas the internal structure of the south block provides less opportunity for cavity filling and is, in parts, affected by the presence of asbestos. 34
The specification for the replacement windows installed at north block during October 2016 is: Architectonics EL75 window system, double glazed, argon filled cavities, and simulated area weighted u-value of no greater than 1.8W/m
2k.
35 U-values in red were provided by EHDC. All others have been assumed.

EHDC HNDU: Heat Techno-Economic Feasibility Studies
P a g e | 80
Saving 77.8%
Notes: External temperature -4C; internal of 21C; flat roof; ground slab; two external walls; 20% glazing (excluding
doors, covered walkways and other glazed openings not-associated with the façades).
Table 29: Example heat loss simulation for EHDC South Block
U values Building
Constructed in 1970 standard
15% double glazed 100% double glazed Potential saving
First Floor - Glazing heat loss (watts)
16,466 16,519 12,052 27%
First Floor - Glazing heat loss (watts)
10,631 10,763 6,176 42%
Notes: Whilst these are useful indications reality suggests that the reductions are likely to be around 10-15% for the
ground floor and 5 -10% for the first floor. Based on professional judgement a 10% reduction overall is more realistic.
The actual reduction can only be properly assessed once all factors have been taken into account (including variable
factors such as weather, occupancy and heating regime).
We have used this technique to prepare scenarios for both north and south block. These is explained in
more detail in the Appendices.
It will be necessary for EHDC to pay careful attention to energy use during 2016 and beyond to ascertain
the degree to which energy demand has been affected by the refurbishment. This data should then be
used to refine the analysis developed during this project.
A3.1.5 North block - boiler room The boiler room has been refurbished in during which two large gas boilers were replaced in the last few
years with five gas combination condensing boilers (Heston C55 - total installed capacity assumed at 275
kW). The boiler room also houses the main pump set for the north block.
A reasonable lifetime for theses boilers is around 10-15 years assuming that regular maintenance takes
place. It is not uncommon for boilers to remain in place well beyond their warranty period and standard
life expectancy (10-15 years), particularly if they are functioning well. As such these boilers could remain
in place for up to 20 years or beyond. Also, the modular nature of the boilers in this plant room means
that a faulty boiler (or boilers) could be swapped out relatively easily.
The downside of this set-up is there are five individual boilers to maintain and certify. In most commercial
(gas) boilers rooms it would be normal to just have a minimum of two boilers working in tandem. The
arrangement in place, therefore, could be more expensive to maintain, but not necessarily more
expensive to replace.
As a back-up option this plant room is clearly adequate for the EHDC offices. Given that we expect
demand to reduce, following the façade refurbishment, this plant room would also provide sufficient
back-up for the offices if it was integrated with a wider district heating network.
Note that the precise hydraulic configuration of a district heating system is yet to be determined and as
such these comments are provisional until more investigations take place by heating and other engineers
(i.e. mechanical and electrical).

EHDC HNDU: Heat Techno-Economic Feasibility Studies
P a g e | 81
A3.2 TARO LEISURE CENTRE SURVEY The Taro Centre was constructed in two phases. The dry side of the centre was completed in 1973 and
the wet side in 1996. The dry side comprises:
reception
changing rooms
creche
play areas
3 x squash courts
dance studio
gym
sports hall
boiler room
various offices, stores and circulation
areas
The wet side houses the leisure and main pools and the cafe. The spa and sauna are combined with the
pool area. The pool water is maintained at 29 Celsius and the air temperature at 30 Celsius.
The Centre has three plant rooms:
Pool plant room:
o Large basement level room containing all of the infrastructure related to water treatment,
filtering and circulation plus an indirect calorifier for domestic hot water (DHW) in the wet
side only.
o Also contains a 125 kWe gas combined heat and power (CHP) engine and associated
switch gear. At the time of our survey the CHP system was generating around 100 kWe.
According to the meter data on the unit the total kWh generated was 5.3M kWh and the
run time was 45,700 hours (approx. 5 years assuming 24 hour operation and no down
time). In fact there has been some down time and we estimated an average use of 5-
5,500 hours per annum for the CHP unit. This suggest the CHP unit is around 9-10 years
old.
o The plant room is susceptible to flooding and sump pumps are used to remove excess
water. This is caused by inadequate drainage at Penns Place due to the nature of the
surrounding land and proximity to a river (n.b. Penns Place has a water and sewerage
pumping station located in the car park that is needed to move water from the site into
the main sewage system. The apparent high water table and susceptibility to flooding will
need to be borne in mind when biomass fuel storage is being considered).
o Excess heat from the CHP system is vented to the atmosphere via a heat exchanger and
fan unit at the back of the building.
o There is no backup generator.
Boiler plant room:
o Located at the opposite end of the building to the pool plant room.
o Contains 5 x Hamworthy Purewell gas boilers, 2 x indirectly fed calorifier and associated
circulation pumps.
o Total installed capacity is 475 kW.
Air handling plant room:
o The air handling unit includes a gas fired heater to condition the pool air. It also provides
condition air to other parts of the Centre.

EHDC HNDU: Heat Techno-Economic Feasibility Studies
P a g e | 82
o Air cooling is provided by a battery of air conditioners located at the rear of the building.
Of these five are just used for cooling (gym) and three are reversible and are used for
cooling and heating fir the dance studio which has no radiators.
Overall the building and plant are in good condition and heating and cooling systems function well. It was
noted that most parts of the roof on the dry side are uninsulated and the cavity walls are not filled with
insulation.
The west and east facing roof elevations appear suitable for solar panels (n.b. the internal steel structure
of the building is likely to be suitable for the additional load that a large array would create). As a guide
the less steeply angles roof sections could easily accommodate 100-120 kWp of solar PV panels that
would be capable of generating around 100,000 kWh per annum.
A3.2.1 Combined Heat and Power (CHP) The Taro Centre CHP system (Ener-G 125 kWe) effectively acts as the pool water heating system.
However, it also acts as the 'sixth' boiler for general space heating throughout the centre. Heat
distribution in the Centre is configured as a loop and all boilers are connected to the same loop. The flow
and return temperatures are roughly the same at 70 Celsius.
Due the nature and size of CHP, excess heat is being generated and this is currently being 'dumped' to the
atmosphere. We estimate that the CHP unit may waste up to 50% of the heat produced36. We include an
option to invest in insulated pipework and pumps to utilise this 'waste' heat in a new biomass Energy
Centre located near the current gas boiler room. This will be assessed as an option under the varying
scenarios.
The CHP system was installed by Ener-G. The detailed nature of the relationship between the centre
operators (People for Places) and Ener-G is unclear though the unit was financed by Ener-G. It is assumed
that Energi maintain, remotely monitor and service the system. It is also assumed that the CHP unit is not
grid connected.
A3.3 ENERGY DATA INTRODUCTION Due to the timing of the project gas data for October to December 2015 was unavailable. To create a full
five years’ worth of data we extrapolated from previous years to derive data for the last quarter of 2015.
The majority of gas (average 61%) at Penns Place is consumed between January and April. Consumption
between May and September is proportionally much lower at around 10% of the January to April total (in
the case of South block heat consumption during the summer is negligible). Consequently it was felt that
total consumption between April and May was a better predictor of the likely total annual consumption.
As such it was necessary to calculate the proportion of gas consumed used in the first four months of the
calendar year and to use this to extrapolate what was likely to happen in the final quarter.
The method for this was as follows:
Calculate the proportion used between January and April for 2011 to 2015.
36
Based on guidance provided by service engineers as well as interpolations when there have been gas and CHP heat variations (e.g. when the CHP unit has been off-line).

EHDC HNDU: Heat Techno-Economic Feasibility Studies
P a g e | 83
Use the average of these proportions to predict the total consumption for 2015.
From this estimate the missing proportions for Oct to Dec 2015 to match the predicted total.
The same approach was used to calculate the missing expenditure data. The results of this exercise are
shown in the following table.
Table 30: Data extrapolation for Penns Place: Gas, 2015 Oct-Dec, kWh
Year Jan-Apr kWh Total kWh % Jan-Apr
2011 171,189 276,577 61.9%
2012 187,868 343,795 54.6%
2013 276,499 418,583 66.1%
2014 202,749 320,920 63.2%
2015 235,371 383,500 61.4%
Avg. Jan-Apr 61.4%
Table 31: Data extrapolation for Penns Place: Gas, 2015 Oct-Dec, £
Year Jan-Apr Total % Jan-Apr
2011 £2,163 £4,005 54.0%
2012 £4,063 £9,977 40.7%
2013 £5,931 £9,520 62.3%
2014 £4,998 £7,912 63.2%
2015 £5,803 £10,540 55.1%
Avg. Jan-Apr 55.1%
A3.3.1 Energy Data Multi-year data was available for both EHDC offices and Taro Leisure Centre. This data was re-worked to
fill gaps and include heating degree day (HDD) variations and to ensure accuracy. The impact of the
recent façade refurbishments on energy demand was also modelled to provide estimates of the likely
reductions in heat loads. The methodology employed for these adjustments is described in the following
sections.
For the Taro Leisure Centre, multi-year data again allowed HDD re-working to produce accurate average
figures for heat. There are multiple gas boilers in one of the two boiler rooms, with a small 125kWe
(200kWth) gas-CHP system in the other. As there were some limitations in the data disaggregation, data
was analysed to create assumptions around the amount heat generated by the CHP unit that is being
rejected as waste heat.
Although at an early stage, a 96 unit housing development is planned for nearby Penns Field. This could be
serviced by a new low-carbon Energy Centre located adjacent to the Taro Centre and servicing all three
heat loads (see Figure 20 ).
A complete summary of the energy data analysed for this project is provided below. This clearly shows
that the dominant heat load is based at the Taro Centre, with a far smaller, and diminishing, heat load at
Penns Place EHDC offices. Electricity costs are more than four times higher than heat costs at Penns Place,

EHDC HNDU: Heat Techno-Economic Feasibility Studies
P a g e | 84
and at a similar level of costs as heat at Taro. Much of the Taro power load is supplied through the CHP
unit, offering significant savings compared to grid purchased power.
Figure 20: Provisional heat network pipe layout for Penns Place, Taro Leisure Centre and Penns Field
A3.3.2 North and south block We also analysed the kWh data by block and used the same extrapolation method above to fill the gaps.
The results are shown in the following table.
Table 32: Data extrapolation for Penns Place: North and south blocks, Gas, 2015 Oct-Dec, £
Year
North South Jan-Apr
Total Total
North South North South
Jan-Apr Jan-Apr % Jan-Apr % Jan-Apr Oct-Dec
Est. Total Oct-Dec
Est. Total
2011 69,239 101,950 171,189 276,577 40.4% 59.6%
2012 73,682 114,185 187,868 343,795 39.2% 60.8%
2013 102,664 173,835 276,499 418,583 37.1% 62.9%
2014 78,974 123,775 202,749 320,920 39.0% 61.0%
2015 88,263 147,108 235,371 383,500 37.5% 62.5% 148,201 235,299
Avg. Jan-Apr 38.6% 61.4%
A3.3.3 Heating degree days (HDD) To further refine the gas/heat load data we applied a correction factor using heating degree days (HDD).
A heating degree day (HDD) is a measurement designed to reflect the demand for energy needed to heat
a building (i.e. the outside temperature above which a building needs no heating).

EHDC HNDU: Heat Techno-Economic Feasibility Studies
P a g e | 85
Degree day data for Middle Wallop, an airfield approximately 40 miles south west of Penns Place, was
selected for baseline comparison HDD purposes. We chose this site as airfield weather data is often more
reliable than other locations that may be urban or peri-urban in nature. The following table shows the
number of degree days at Middle Wallop between 2011 and 2015 (with an estimate for 2015).
The average number of HDD was then calculated and compared with each year to produce a percentage.
In this instance results greater than 100% indicates a colder year than average. To standardise the heat
load at Penns Place the total annual kWh for each year was adjusted up or down according to the ratio of
HDD to the five-year average.
For example, in 2014:
Total 320,920 kWh
HDD corrected = 320,920 * 1.1 = 353,012 kWh
Note that the reciprocal of the HDD comparator is used (i.e. 90% = 1.1) to artificially increase or decrease
the total kWh to reflect the average HDD over the five-year reference period.
Table 33: Heating Degree Days (HDD) correction for Penns Place data
Year Heating degree days HDD comparator Compared to five year average
2011 2,183 101% Colder
2012 2,020 94% Warmer
2013 2,465 115% Colder
2014 1,940 90% Warmer
2015 2,146 100% Negligible difference
Average last five years 2,151
Notes: Base temperature for degree days set at 15.5°C. Source: DegreeDays.net.
The net result of this exercise is marginal and the average heat load between 2011 and 2015 was reduced
by a negligible amount.
A3.3.4 Analysis of results - gas The summarised gas data for Penns Place is shown in the following table. The HDD corrected average
annual heat load (to the nearest ‘000) is 346,000 kWh. The HDD corrected heat loads are fairly consistent
and show only a very slight annual variation.
The average cost per annum is around £8,400 and the average cost per kWh (all charges included and
excluding VAT) is 2.37 pence. However, note that the current cost per kWh hour (2015) is higher at
2.75p/kWh.

EHDC HNDU: Heat Techno-Economic Feasibility Studies
P a g e | 86
Table 34: Summary of gas data for Penns Place
Year Total kWh Total kWh -
HDD corrected Total Cost (excl. VAT)
Pence per kWh (excl. VAT)
2011 276,577 273,811 £4,005 0.0145
2012 343,795 364,423 £9,977 0.0290
2013 418,583 355,796 £9,520 0.0227
2014 320,920 353,012 £7,912 0.0247
2015 383,500 383,500 £10,540 0.0275
Average 348,675 346,108 £8,391 0.0237
The heat load profile for Penns Place between 2011 and 2015 is shown in the following figure. The profile
shows that heat use normally peaks between January and April. Summer heat loads are negligible and
most likely reflect a deliberate ‘shut down’ period.
Figure 21: Penns Place heat load profile 2011-2015
The raw data also allowed an analysis of gas use between the north and south office blocks at Penn Place.
The figure below shows the consumption in 2015 and is indicative of the general profile between 2011
and 2015.
-
10,000
20,000
30,000
40,000
50,000
60,000
70,000
80,000
90,000
Jan Feb Mar Apr May Jun Jul Aug Sep Oct Nov Dec
kWh
2011 2012 2013 2014 2015

EHDC HNDU: Heat Techno-Economic Feasibility Studies
P a g e | 87
Figure 22: Penns Place heat load profile (kWh) 2015: Split by north and south block
South block has a higher heat load than north block. On average this difference averages around 53% or
just over 73,000 kWh (see Table 35).
Table 35: Summary of heat load difference between Penns Place north and south blocks
2011 2012 2013 2014 2015 Average
% Difference 42% 56% 61% 49% 59% 53%
kWh Difference 47,171 79,393 83,203 69,630 87,099 73,299
Total kWh 273,811 364,423 355,796 353,012 383,500 1,730,542
A3.3.5 Analysis of results - electricity The summarised electricity data for Penns Place is shown in the following table. The average total kWh
(units) is 416,000 (rounded to the nearest ‘000). The data shows that consumption is fairly consistent and
variation between years.
Of note is the generally downward trend in consumption between 2010/11 and 2014/15 (n.b. electricity
data for Penns Place is organised by financial year in contrast to calendar year for gas).
In contrast the cost of electricity has increased during the reference period and averages just over
£42,000 per year. The cost per unit has also increased – from 9.07 pence per unit in 2010/11 to 11.31
pence per unit in 2014/15.
-
10,000
20,000
30,000
40,000
50,000
60,000
Jan Feb Mar Apr May Jun Jul Aug Sep Oct Nov Dec
kWh
North South

EHDC HNDU: Heat Techno-Economic Feasibility Studies
P a g e | 88
Table 36: Summary of electricity data for Penns Place
Year Total kWh Total Cost excl. VAT Cost per kWh excl. VAT
2010/11 433,533 £39,321 0.0907
2011/12 419,005 £40,211 0.0960
2012/13 419,087 £43,065 0.1028
2013/14 408,266 £43,660 0.1069
2014/15 399,720 £45,195 0.1131
Average 415,922 £42,291 0.1019
The profile of electricity use is shown in the following figure. The step-change in consumption that can be
seen is fairly consistent with an office and mainly relects the differential use of lighting between
spring/summer and sutumn/winter. Consumption in 2014/15 was the lowest over the last five-years.
Figure 23: Penns Place electricity consumption (kWh) profile 2010/11-2014/15
The difference in consumption between the day and night was also analysed. The difference averages
around 74%. This is a useful piece of analysis as it confirms that EHDC electricity use is mainly confined to
the day which helps to inform the precise role of any combined heat and power (CHP) modules that are
connected to a district heating system. The corollary would be, for example, a hospital or industrial
facility with more constant electricity demand and balanced demand between day and night.
25,000
27,000
29,000
31,000
33,000
35,000
37,000
39,000
41,000
43,000
45,000
Apr May Jun Jul Aug Sep Oct Nov Dec Jan Feb Mar
kWh
2010/11 2011/12 2012/13 2013/14 2014/15

EHDC HNDU: Heat Techno-Economic Feasibility Studies
P a g e | 89
Table 37: Summary of annual day and night electricity use at Penns Place
2010/11 2011/12 2012/13 2013/14 2014/15 Average
% Difference day Vs night
-75% -75% -74% -74% -73% -74%
kWh Difference -261,507 -250,552 -243,874 -237,273 -230,600 -244,761
Total Annual kWh 433,533 419,005 419,087 408,266 399,720 2,079,611
A3.3.6 Development of heat load scenarios The discussion around the North and South block façade refurbishment has highlighted the need to reflect
future energy efficiency improvements in the heat load scenarios used in the assessment of heat network
options for Penns Place37.
These discussions suggest that the improvements may reduce the heat load by around 50% for North
block and around 10% for South block. We have therefore adjusted the HDD heat loads for North and
South blocks by -50% and -10%, respectively, and combined these to create an overall heat load. The
results are shown in the following table.
The average heat load for Penns Place, allowing for heating degree days and refurbishment, is therefore
257,000 kWh per year (rounded to the nearest ‘000).
Table 38: Summary of final heat load in kWh at Penns Place (with adjustments for Heating Degree Day (HDD) and refurbishment included)
North (HDD Corrected)
kWh
Average North -50%
kWh
South (HDD corrected)
kWh
Average South - 10%
kWh
Average Total kWh
2011 113,320
68,370
160,491
188,432 256,802
2012 142,515 221,908
2013 136,296 219,499
2014 141,691 211,321
2015 149,877 233,623
Average 136,740 209,369
A3.3.7 Analysis of results - greenhouse gases The greenhouse gas (GHG) emissions for Penns Place were calculated using the standard UK Government correction factors (which are shown in the following table).
Table 39: UK Government GHG conversion factors for company reporting: Electricity & gas, 2015
Activity Unit Year kg CO2e kg CO2 kg CH4 kg N2O
Electricity generated kWh 2015 0.46219 0.4585 0.00035 0.00334
Natural Gas kWh 2015 0.18445 0.1840 0.00028 0.0001
Source: DECC/DEFRA, 2015.
Due to the mix of fuels used for electricity production, including coal and oil, the conversion factors are
higher than those for gas. Consequently, the largest contribution to GHG emissions at Penns Place is
caused by electricity use. The GHG results split by gas and electricity are shown in the following two tables.
37
Note that any energy use in the Link Block is included in these calculations.

EHDC HNDU: Heat Techno-Economic Feasibility Studies
P a g e | 90
Table 40: Penns Place GHG emissions 2011-2015: Gas
Gas
Year Total kWh kg CO2e ‡ kg CO2 kg CH4 kg N2O
2011 276,577 127,831 126,811 97 924
2012 343,795 158,899 157,630 120 1148
2013 418,583 193,465 191,920 147 1398
2014 320,920 148,326 147,142 112 1072
2015 383,500 177,250 175,835 134 1281
Average 348,675 161,154 159,867 122 1165
Note: ‡ CO2 equivalent, including other greenhouse gases methane and nitrous oxide. Table 41: Penns Place GHG emissions 2011-2015: Electricity
Electricity
Year Total kWh kg CO2e kg CO2 kg CH4 kg N2O
2010/11 200,375 92,611 91,872 70 669
2011/12 193,660 89,508 88,793 68 647
2012/13 193,698 89,525 88,811 68 647
2013/14 188,696 87,213 86,517 66 630
2014/15 184,747 85,388 84,706 65 617
Average 192,235 88,849 88,140 67 642
The gas and electricity GHG emissions are shown in the following figure.
Figure 24: Total GHG emissions (kG CO2e, gas + electricity) for Penns Place 2011-2015
-
50,000
100,000
150,000
200,000
250,000
-
50,000
100,000
150,000
200,000
250,000
300,000
350,000
400,000
450,000
2011 2012 2013 2014 2015
kWh
Gas: Total kWh Electricity: Total kWh Gas: kg CO2e Electricity: kg CO2e

EHDC HNDU: Heat Techno-Economic Feasibility Studies
P a g e | 91
A3.3.8 Analysis of results - cost The total cost of energy at Penns Place averages around £50,500 per year. Of this around 83% is
electricity and the remainder gas.
Table 42: Total cost of energy at Penns Place 2011-2015
Year Total Cost ex. VAT
Gas Electricity Total
2011 £4,005 £39,321 £43,326
2012 £9,977 £40,211 £50,189
2013 £9,520 £43,065 £52,585
2014 £7,912 £43,660 £51,572
2015 £10,540 £45,195 £55,735
Average £8,391 £42,291 £50,681
% of Avg. Total 17% 83%
A3.3.9 Summary (Penns Place) The consumption of electricity is both the major cost and main contributor to GHG emissions at Penns
Place. Based on the above analysis the likely inputs into the analysis of heat network opportunities at
Penns Place can be summarised as follows (n.b. figures have been rounded):
Loads:
o Total annual average HDD corrected heat demand: 346,000 kWh
Scenario 1: North block -50%/South block -10% 257,000 kWh
o Total annual average electricity demand: 416,000 kWh
Cost per unit:
o 2015 cost per unit of gas (Excl. VAT): 2.75 p/kWh
o 2015 cost per unit of electricity (Excl. VAT): 11.31 p/kWh
o 5-year average cost per unit of gas (Excl. VAT): 2.37 p/kWh
o 5-year average cost per unit of electricity (Excl. VAT): 10.19 p/kWh
GHG – CO2e:
o Total annual average GHG emissions – gas: 161,154 kg CO2e
o Total annual average GHG emissions – electricity: 88,849 kg CO2e
Cost:
o Total annual average cost of energy – gas: £8,400
o Total annual average cost of energy – electricity: £42,300
A3.3.10 Taro Leisure Centre: Analysis of Energy Data Data on gas and electricity consumption and CHP generation between 2007/8 and 2015/16 was provided
by the operator of the Taro Centre (People for Places). This data excluded financial information on the
cost of energy. It was therefore agreed that the prevailing prices for gas and electricity at EHDC were also
applied to the Taro Centre (i.e. 2.75p/kWh for gas and 11.31p/kWh for electricity).
Our analysis focused on the last five most recent years of complete data (2011/12 to 2015/16). The data
was aggregated and summarised in order to create an overview of the heat and power loads and the cost
per kWh of energy paid.

EHDC HNDU: Heat Techno-Economic Feasibility Studies
P a g e | 92
Once completed, missing data for 2015/16 (Nov to Mar) was added and a correction for degree days
added. It should be noted that two outliers in the electricity data were discounted in the data correction
process as these were adversely affecting the calculation of missing data38.
A3.3.11 Analysis of results - gas The summarised gas data for the Taro Centre is shown in the following table. The Heating Degree Days
(HDD) corrected average annual heat load (to the nearest ‘000) across the reference period was 2,332,000
kWh. The use of gas for heat has reduced from a high of 3.5M kWh in 2011/12 and appears to be fairly
consistent at around 2-2.4M kWh per annum. 2014/15 was a notable exception and is likely to be an
outlier (possibly due to service disruption that resulted in reduced consumption).
Using cost data from EHDC, the average cost per annum is around £64,000. This is based on the 2015
EHDC cost of 2.75 pence per kWh (all charges included but excluding VAT).
Table 43: Summary of gas data for Taro Leisure Centre
Year Total kWh Total kWh -
HDD corrected Total Cost (excl. VAT)
Pence per kWh (excl. VAT)
2011/12 3,272,074 3,468,398 £89,982 0.0275
2012/13 2,365,016 2,010,264 £65,038 0.0275
2013/14 2,243,131 2,467,444 £61,686 0.0275
2014/15 1,686,139 1,686,139 £46,369 0.0275
2015/16 2,029,000 2,029,000 £55,798 0.0275
Average 2,319,072 2,332,249 £63,774 0.0275
Notes: Gas price in pence per kWh based on EHDC Penns Place five year average.
The heat load profile for Penns Place between 2011/12 and 2015/16 is shown in Figure 25. This shows
that gas use normally peaks around October and actually drops between November and February. Overall
the heat load for the Taro Leisure Centre is fairly constant and ranges between 115,000 kWh per month
on average in February and 227,000 in October. This appears counterintuitive but is most likely due to a
greater use of surplus heat from the CHP unit during the colder months (in contrast to surplus CHP heat
being ‘dumped’ to the atmosphere during warmer months).
38
2013/14 grid electricity proportion for Apr to Oct; 2014/15 CHP electricity proportion for Apr to Oct.

EHDC HNDU: Heat Techno-Economic Feasibility Studies
P a g e | 93
Figure 25: Taro Centre heat load (kWh) profile 2011/12-2015/16
Figure 26 shows the trend in gas use at the Taro Centre between 2011/12 and 2015/16. This shows a very
clear reduction in gas use and this is likely to be a direct result of the CHP unit which is displacing a
significant amount of gas use during the coldest part of the year.
This is also delivering a significant cost saving to centre operator due to the large differential in grid
electricity and CHP electricity.
Figure 26: Taro Centre heat load (kWh) trend 2011/12-2015/16
-
50,000
100,000
150,000
200,000
250,000
300,000
350,000
April May June July Aug Sept Oct Nov Dec Jan Feb Mar
kWh
2011/12 2012/13 2013/14
2014/15 2015/16 Avg. last 3 complete years
-
50,000
100,000
150,000
200,000
250,000
300,000
350,000
Ap
ril
Jun
e
Au
g
Oct
De
c
Feb
Ap
ril
Jun
e
Au
g
Oct
De
c
Feb
Ap
ril
Jun
e
Au
g
Oct
De
c
Feb
Ap
ril
Jun
e
Au
g
Oct
De
c
Feb
Ap
ril
Jun
e
Au
g
Oct
De
c
Feb
2011/12 2012/13 2013/14 2014/15 2015/16
kWh

EHDC HNDU: Heat Techno-Economic Feasibility Studies
P a g e | 94
A3.3.12 Analysis of results - grid electricity The summarised grid electricity consumption data for the Taro Centre is shown in Table 44. The average
total kWh (units) is 486,000 (rounded to the nearest ‘000). The data shows that consumption has
increased since 2011/12.
The cost of electricity has therefore increased during the reference period and averages just under
£55,000 per year. Costs are based on EHDC prices (11.31 pence per unit), but the actual rate and scale of
change is unknown.
Table 44: Summary of grid electricity consumption for Taro Centre 2011/12-2015/16
Year Total kWh Total Cost excl. VAT Pence per kWh excl. VAT
2011/12 384,706 £43,510 0.1131
2012/13 362,857 £41,039 0.1131
2013/14 488,554 £55,255 0.1131
2014/15 697,255 £78,860 0.1131
2015/16 497,700 £56,290 0.1131
Average 486,214 £54,991 0.1131
The profile of grid electricity use is shown in Figure 27. The average situation, shown by the dotted
orange line, shows a distinct downward step-change in grid electricity consumption between October-
March. Again, this is likely to be a consequence of the increased use of the CHP unit to top-up heat and to
satisfy increased electricity demand (and duration) in the winter months.
The precise cause of the spike in grid electricity use in 2014/15 is unknown. This may have been a result
of extended (planned) maintenance and/or unplanned maintenance caused by a fault. Gas-CHP engines
do require regular maintenance, a very similar regime to a high-use large commercial vehicle engine in
fact, and some maintenance intervals can be significant in duration and complexity.
Figure 28 shows the trend in grid electricity use between 2011/12 and the current year. Whilst the
trendline shows a clear increase in grid electricity consumption it appears that data from 2014/15 is
skewing the result (n.b. this anomaly corresponds with low gas consumption in the same period and is
most likely caused by CHP-downtime). If this anomaly is removed then grid electricity consumption is
roughly consistent over the reference period.

EHDC HNDU: Heat Techno-Economic Feasibility Studies
P a g e | 95
Figure 27: Taro Centre electricity consumption (kWh) profile 2011/12-2015/16
Figure 28: Taro Centre grid electricity consumption (kWh) trend 2011/12-2015/16
A3.3.13 Analysis of results - CHP electricity The summarised CHP electricity generation data is shown in Table 45. The average annual total kWh
(units) generated is 562,000 (rounded to the nearest ‘000). The data shows that generation is fairly
-
10,000
20,000
30,000
40,000
50,000
60,000
70,000
80,000
90,000
100,000
April May June July Aug Sept Oct Nov Dec Jan Feb Mar
kWh
2011/12 2012/13 2013/14
2014/15 2015/16 Avg. last 3 complete yrs
-
10,000
20,000
30,000
40,000
50,000
60,000
70,000
80,000
90,000
100,000
Ap
ril
Jun
e
Au
g
Oct
De
c
Feb
Ap
ril
Jun
e
Au
g
Oct
De
c
Feb
Ap
ril
Jun
e
Au
g
Oct
De
c
Feb
Ap
ril
Jun
e
Au
g
Oct
De
c
Feb
Ap
ril
Jun
e
Au
g
Oct
De
c
Feb
2011/12 2012/13 2013/14 2014/15 2015/16
kWh

EHDC HNDU: Heat Techno-Economic Feasibility Studies
P a g e | 96
consistent (which is what would be expected from a CHP unit). Any fluctuations are likely to be caused by
planned and unplanned maintenance.
Using the average grid electricity cost for the EHDC offices, the value of the CHP generated electricity
averages around £63,500 per year. This is on average higher than the value of the grid electricity
consumed (see Table 44) which indicates that the CHP unit is offsetting more than 100% of the Taro
Centre’s grid electricity consumption. Given that the cost of gas is significantly lower than electricity, the
CHP unit is therefore generating a significant cost saving – particularly when the value of CHP heat is also
factored in39.
Table 45: Summary of CHP electricity generation for Taro Centre 2011/12-2015/16
Year Total kWh Total value
2011/12 617,180 £69,803
2012/13 605,433 £68,474
2013/14 571,899 £64,682
2014/15 421,563 £47,679
2015/16 595,000 £67,295
Average 562,215 £63,587
The profile of CHP electricity generation is shown in Figure 29. The average situation, shown by dotted
orange line, indicates that generation is higher during the colder months and is consistent with greater
demand for electricity and heat withing the centre.
Figure 29: Taro Centre CHP electricity generation (kWh) profile 2011/12-2015/16
39
We have assumed that the CHP unit is not grid connected and all electricity generated is consumed within the sports centre.
-
10,000
20,000
30,000
40,000
50,000
60,000
70,000
April May June July Aug Sept Oct Nov Dec Jan Feb Mar
kWh
2011/12 2012/13 2013/14 2014/15 2015/16 Avg. last 3 yrs

EHDC HNDU: Heat Techno-Economic Feasibility Studies
P a g e | 97
The trend in CHP electricity generation is shown in Figure 30). In contrast to increasing grid electricity
consumption (Figure 28), CHP electricity generation appears to have fallen. However, if we disregard data
for 2014/15 the trend in generation is approximately flat.
Note that the 2014/15 data is an outlier and we assume that there was a problem with the CHP unit in
2014/15 that led to significant unit downtime (and a loss in generation of around 100,000 units of
electricity)40.
Figure 30: Taro Centre CHP electricity generation (kWh) trend 2011/12-2015/16
A3.3.14 Analysis of results - CHP heat generation In order to calculate the heat generated by the CHP unit we have calculated that 1.6 units of heat are
generated for each unit of electricity. This ratio was based on the data sheet for the Ener-G 125 kWe CHP
unit.
The summarised CHP heat generation data is shown in the following figure. The average total kWh (units)
generated is 900,000 kWh (rounded to the nearest ‘000). The data shows that generation is fairly
consistent (which is what would be expected from a CHP unit). Any fluctuations are likely to be caused by
planned and unplanned maintenance.
40
These outliers were queried with Places for People and it was confirmed that the CHP unit was offline due to maintenance. It was not confirmed whether the downtime was due to planned or unplanned maintenance.
-
10,000
20,000
30,000
40,000
50,000
60,000
70,000
Ap
ril
Jun
e
Au
g
Oct
De
c
Feb
Ap
ril
Jun
e
Au
g
Oct
De
c
Feb
Ap
ril
Jun
e
Au
g
Oct
De
c
Feb
Ap
ril
Jun
e
Au
g
Oct
De
c
Feb
Ap
ril
Jun
e
Au
g
Oct
De
c
Feb
2011/12 2012/13 2013/14 2014/15 2015/16
kWh

EHDC HNDU: Heat Techno-Economic Feasibility Studies
P a g e | 98
Figure 31: Summary of CHP heat generation for Taro Centre 2011/12-2015/16 (Note: Gas price = 2.75p/kWh)
The CHP heat will need to be added to the consumption to derive an overall generation and heat load for
the Taro Centre. However, it is currently unclear as to the amount of CHP heat that is rejected to the
atmosphere. This uncertainty will be taken into account in the scenarios used for financial modelling. At
this stage we are assuming that 50% of the CHP heat is used in the centre and 50% rejected to the
atmosphere.
A3.3.15 Analysis of results - greenhouse gases The greenhouse gas (GHG) emissions for the Taro Centre were calculated using the standard UK Government correction factors (which are shown in Table 39). Emissions data has been separated by source and is shown in following tables.
Table 46: Taro Centre GHG emissions 2011/12-2015/16: Gas
Gas
Year Total kWh kg CO2e kg CO2 kg CH4 kg N2O
2011/12 3,272,074 603,534 602,291 916 327
2012/13 2,365,016 436,227 435,328 662 237
2013/14 2,243,131 413,746 412,893 628 224
2014/15 1,686,139 311,008 310,368 472 169
2015/16 2,029,000 374,249 373,478 568 203
Average 2,319,072 427,753 426,872 649 232
Table 47: Taro Centre GHG emissions 2011/12-2015/16: Grid electricity
Grid Electricity
Year Total kWh kg CO2e kg CO2 kg CH4 kg N2O
2011/12 384,706 177,807 176,388 135 1,285
2012/13 362,857 167,709 166,370 127 1,212
2013/14 488,554 225,805 224,002 171 1,632
2014/15 697,255 322,264 319,691 244 2,329
2015/16 497,700 230,032 228,195 174 1,662
Average 486,214 224,723 222,929 170 1,624
£0
£5,000
£10,000
£15,000
£20,000
£25,000
£30,000
0
200,000
400,000
600,000
800,000
1,000,000
1,200,000
2011/12 2012/13 2013/14 2014/15 2015/16
kWh
Total kWh Total Estimated Value (see notes)

EHDC HNDU: Heat Techno-Economic Feasibility Studies
P a g e | 99
Table 48: Taro Centre GHG emissions 2011/12-2015/16: CHP electricity (using GHG emissions data for natural gas)
CHP Electricity
Year Total kWh kg CO2e kg CO2 kg CH4 kg N2O
2011/12 617,180 285,254 282,977 216 2,061
2012/13 605,433 279,825 277,591 212 2,022
2013/14 571,899 264,326 262,216 200 1,910
2014/15 421,563 194,842 193,287 148 1,408
2015/16 595,000 275,003 272,808 208 1,987
Average 562,215 259,850 257,776 197 1,878
The emissions for CHP electricity cannot be counted as a reduction in total GHG emissions due to the source of the fuel. However, due to the relative difference in emissions factors for grid electricity and natural gas, the overall GHG emissions from the Taro Centre are overall around 20-25% lower due to the use of the CHP unit.
However, as CHP heat is rejected as waste heat, with our assumption being 50%, the GHG impact may be neutral or slightly negative compared to gas heating and grid power. Figure 32 shows that total GHG emissions are roughly stable at around 874 tonnes per year.
Figure 32: Total GHG emissions (kG CO2e, gas + electricity) for Penns Place 2011-2015
-
200
400
600
800
1,000
1,200
-
500
1,000
1,500
2,000
2,500
3,000
3,500
2011/12 2012/13 2013/14 2014/15 2015/16
Gas: Total MWh Grid electricity: Total MWh
CHP electricity: Total MWh Gas: Tonnes CO2e
Grid electricity: Tonnes CO2e CHP electricity: Tonnes CO2e
Total Tonnes Co2e

EHDC HNDU: Heat Techno-Economic Feasibility Studies
P a g e | 100
A3.3.16 Summary (Taro Leisure Centre) Based on the above analysis the likely inputs into the analysis of heat network opportunities for the Taro
Centre can be summarised as follows (n.b. figures have been rounded):
Loads:
o Total annual average HDD corrected heat demand: 2,300,000 kWh
o Total annual average electricity demand (grid): 486,000 kWh
o Total annual average CHP heat generation: 900,000 kWh
o Total annual average CHP electricity generation: 562,000 kWh
Cost per unit (based on EHDC Penns Place):
o 2015 cost per unit of gas (Excl. VAT): 2.75 p/kWh
o 2015 cost per unit of electricity (Excl. VAT): 11.31 p/kWh
GHG – CO2e (gas + grid electricity + CHP electricity):
o Total annual average GHG emissions – gas: 428,000 kg CO2e
o Total annual average GHG emissions – electricity: 225,000 kg CO2e
o Total annual average GHG emissions – CHP electricity: 260,000 kg CO2e
Cost:
o Total annual average cost of energy – gas: £55,000
o Total annual average cost of energy – electricity: £50,000
Income41:
o Total estimated annual average value of CHP electricity generation £57,000
o Total estimated annual average value of CHP heat generation £21,000
A3.4 TECHNOLOGY OPTIONS AND CHOICES Ground Source Heat Pumps are unlikely to be a viable option for either the EHDC office at Penns Place or
the Taro Leisure Centre. They tend to be most effective with new buildings or highly insulated retrofit
buildings, and are unlikely to produce high enough space heating temperatures for the current style of
buildings, particularly the Taro Leisure Centre.
The only two options that are potentially viable, therefore, are gas-fired CHP and/or biomass heating.
There is already a small gas-fired CHP in place at Taro and some (or all) of the excess heat currently
dumped through a heat exchanger could be utilised. While the CHP unit may only have a further 5-6 years
life, it could be replaced by a similar or smaller sized CHP system (something we have assumed in several
of the scenarios modelled).
41
These numbers have been estimate using data provided by Place for People and the costs per unit paid by EHDC (these being electricity at 10.19p/kWh per unit and gas at 0.0237p/kWh per unit).

EHDC HNDU: Heat Techno-Economic Feasibility Studies
P a g e | 101
Figure 33: Examples of packaged biomass energy centres (Photos courtesy of Packaged Plant Solutions Ltd)
Biomass heating is a viable low-carbon option for the site, with good access for fuel delivery, and a
suitable location adjacent to the service area for a packaged biomass Energy Centre and fuel silo.

EHDC HNDU: Heat Techno-Economic Feasibility Studies
P a g e | 102
Table 49: Technology Options for Penns Place and Taro Leisure Centre
Physical Limits
Energy Centre issues
Integration Biomass
fuel delivery
Potential CO2
reduction Cost Issues Finance
Overall Conclusions
Solar Thermal
Large roof space
needed and
stronger roof
structure
N/A
Large integration
tanks where solar used
as pre-heat source
N/A
Medium to Good in hot water
savings
High per unit of heat
delivered and cost of carbon
saved
RHI
NO - extensive roof
space needed,
needs other heat source
and poor economics
likely
GSHP
Large ground space
needed (c.5 acres)
or multiple
boreholes
N/A
Difficult due to lower (c.30oC)
temperatures provided
N/A
At least 50% cf
standard gas
c. 15-20% >than
biomass heating; borehole collection
higher. Some savings with uninsulated collection pipework
RHI
No - access for c.5 acres
ground space could be tricky as
playing fields out of use;
low temperature output not
suitable
Biomass - pellet
Compact space
needs inc. fuel store
OK- need
packaged new boiler
room at Taro
Easy integration
Good access at Taro centre
service area
High - c.85% cf
gas Medium RHI
YES - but opt for cheaper chip fuel -
suitable and access good
Biomass - Chip
Compact space
needs inc. fuel store
OK- need
packaged new boiler
room at Taro
Easy integration
Good access at Taro centre
service area
High - c.85% cf
gas Medium RHI
Yes - suitable and access
good
Gas CHP Compact
space needs
N/A already there
Existing gas CHP at Taro
N/A
Modest - c.20-25%
cf standard
brown power
and gas heating
Medium to low
Modest ECAs and
possible business
rates relief
YES - existing CHP unit at Taro, a new unit may be
appropriate in c.5 years’
time; modest CO2 savings
Biomass - CHP
Compact space
needs inc. fuel store
Might be
possible in
Service area of
Taro
Relatively easy
integration
Good access at Taro centre
service area
High - c.80% cf gas CHP
High
RHI, FITs,
Business rates
exemption
NO- no current
commercial technology at
sub 1MW(e)scale

EHDC HNDU: Heat Techno-Economic Feasibility Studies
P a g e | 103
A3.5 MODELLING SCENARIOS: SUMMARY OF KEY INPUTS In the previous sections an analysis of the current energy consumption for Penns Place (EHDC offices) and
Taro Leisure Centre has been provided. The headline results were merged to create a summary of the
total heat and electricity load at Penns Place and Taro Leisure Centre. We also estimate a projected heat
(and power) demand for a possible housing development at Penns Field (see below).
Note that the cost of energy for the Taro Centre was based on average prices for the EHDC offices. Due to
their large purchasing power, we think that the operator of the Taro Leisure Centre will likely be
purchasing gas at lower prices than those EHDC are paying.
A3.6 PENNS FIELD: NEW HOUSING A planning application42 for Penns Field was used to derive a list of proposed dwellings. We then applied a
standard loads per square meter of internal area to derive heat, electricity and hot water loads for each
dwelling type. These loads were then aggregated to produce an overall picture for the 96 dwellings
proposed in the 2010 planning application. The results of this exercise (see Table 50) indicate a heat load
of around 480,000 kWh of electricity and 1,914,712 kWh of electricity per year. The assumptions behind
these figures are described below.
Table 50: Summary of annual heat and electricity consumption for housing proposed at Penns Field
Unit Type Qty Internal
Area (m2)
Avg. area (m
2)
Annual Elec
(kWh/yr)
Annual heat
(kWh/yr)
Annual hot water (DHW)
(kWh/yr)
Total heat load
(kWh/yr)
Apartment 32 2,450 77 160,000 132,937 473,920 606,857
Detached 1 90 90 5,000 4,883 14,810 19,693
Detached with garage 10 1,603 160 50,000 86,979 148,100 235,079
Detached with integral parking
3 545 182 15,000 29,572 44,430 74,002
End of terrace 7 570 81 35,000 30,928 103,670 134,598
End of terrace with garage 1 105 105 5,000 5,697 14,810 20,507
Type undefined 2 160 80 10,000 8,682 29,620 38,302
Link semi-detached 2 180 90 10,000 9,767 29,620 39,387
Link semi-detached with garage
6 565 94 30,000 30,657 88,860 119,517
Semi-detached 11 843 77 55,000 45,741 162,910 208,651
Semi-detached with garage 9 826 92 45,000 44,819 133,290 178,109
Terraced 12 1,148 96 60,000 62,290 177,720 240,010
Total 96 9,085
480,000 492,952 1,421,760 1,914,712
The reference quantities for heat and electricity were calculated as follows:
Heat: We used the Target Fabric Energy Efficiency rate (TFEE) from building regulations (2013 Part
L). This is 54.26 kWh/m2. This rate is indicative of a high energy efficiency property build to a
level that is roughly equivalent to the now voluntary Code for Sustainable Homes (CSH) Level 4.
42
SDNP/52274/001, 2010 (Status: refused).

EHDC HNDU: Heat Techno-Economic Feasibility Studies
P a g e | 104
Electricity: We have applied an average of 5,000 kWh per dwelling. This was based on research
undertaken by DECC43 on domestic energy consumption that found that the average energy use in
existing dwellings was 4,200 kWh (2011, based on a sample of 3.7M randomly selected pre-
existing properties). We have rounded this up to 5,000 to take into account any increase in
consumption since this analysis was conducted.
Domestic hot water (DHW): We have assumed 115 litres of hot water per day per person
(adapted from Institute of Plumbing Guide) heated to 51.9oC from 15.2oC (Delta T = 36.7oC based
on Energy Saving Trust research). Then using Q = mCp ΔT (Q = 0.115 x 4.18 x 36.7 = 17.64
kWhrs/day) multiplied by 365 days = 17.64 x 365 = 6438.6 kWh/year/per person. We then
multiplied this result by 2.3 persons per household (based on ONS Census 2011) to give a result of
14,810 kWh per household per year (on average) for domestic hot water (DHW). While we feel
this may be on the high side, in the absence of solid data and proposals, it is the best data we can
secure for our analysis at this stage.
43
National Energy Efficiency Data Framework: Summary of Analysis using the National Energy Efficiency Data-Framework Part L Domestic Energy Consumption (June 2013). DECC.

EHDC HNDU: Heat Techno-Economic Feasibility Studies
P a g e | 105
APPENDIX 4: ALTON ENERGY DATA
EHDC is planning to replace the Alton Sports Centre as the current building is reaching the end of its life.
The proposed heating networks project would include the Basingstoke & Alton Cardiac Rehabilitation
Charity (‘Cardiac Centre’), which is 75 metres from the existing leisure centre, and 10 social housing flats
(50 metres away). Allocations for 305 housing units have also been made nearby and these may present
further opportunities for distributed energy. The closest part of this development is only around 75-100
metres from the existing leisure centre (although the development would extend across a wide area and
the further point would be up to 4-500 metres from the leisure centre site).
The three storey Alton Sports Centre was completed in 1975 and has an internal floor area of 4,990
square meters. The building sits within a larger site and includes parking and an all-weather pitch. The
building is in close proximity to a health unit and social housing (The Gurdons). The site is bounded on
one side by a railway line and on the other by a road.
An outline planning application was made by EHDC during 2015 and detailed specifications are being
prepared in advance of a full planning application. This is a council led project.
Outline planning permission was granted for a replacement Sports Centre during 2015. The plan is to
construct the new 8,500 m2 footprint building on the plot currently occupied by the all-weather pitch. The
project should commence in 2017 and it is proposed that the current centre remains operational during
the construction to enable a seamless transition.
The existing plant room is located at ground level and contains 11 Hamworthy gas boilers installed as two
modules (5 x Purewell and 6 x older Hamworthy models). Three of the six older boilers have been
condemned and the remaining three are used for backup only. The total installed capacity is estimated at
around 1MW. There are also two gas-fired calorifiers totalling around 200 kW.
A4.1 SURVEY The three storey Alton Leisure Centre was completed in 1975 and has an internal floor area of 4,990
square meters. The DEC rating for the building is C (see Table 51). The building sits within a larger site that
extends to 8,500 square meters and includes parking and an all-weather pitch. The building is in close
proximity to a health unit and 10 social housing apartments (The Gurdons). The site is bounded on one
side by a railway line and on the other by a road.
Outline planning permission was granted for a replacement leisure centre during 2015. The plan is to
construct the new building on the plot currently occupied by the all-weather pitch. The project should
commence in 2017 and it is proposed that the current centre remains operational during the construction
to enable a seamless transition.
The plant room is located at ground level and contains 11 Hamworthy gas boilers installed as two modules
(5 x Purewell and 6 x older Hamworthy models). Three of the six older boilers have been condemned and
the remaining three are used for backup only. The total installed capacity is estimated at around 1MW
plus a 125kW(e) (200kW(th) CHP unit. There are also two gas-fired calorifiers totalling around 200 kW.

EHDC HNDU: Heat Techno-Economic Feasibility Studies
P a g e | 106
Table 51: Display Energy Certificate data for Alton Leisure Centre
Building Rating Total Useful Floor Area
(m2)
Heating (kWh/m
2/year)
Electricity (kWh/m
2/year)
Energy from renewables†(%)
CO2 (t/pa)
Alton C (71) 5,058
Actual 511
(Typical 553)
Actual 82
(Typical 175)
45.0% (340,052 kWh)
Ca. 740
Notes: † The source of the renewable energy at Alton is stated as CHP in the DEC advisory report.
A4.2 ALTON LEISURE CENTRE: COMBINED HEAT AND POWER (CHP) The plant room also contains a gas CHP unit which appears to be of the same specification and size (125
kWe (200kW(th)) as the one located at the Taro Centre. Generation at the time of visit was around 100
kWe and the hours of operation were 45,000 (ca. 5 years assuming 24 hour operation and no down time
or more typically 9 years old if running hours are 5-6,000 hours per year)44. Cumulative electricity
generation was 18.7 million kWh. It is assumed that excess heat may again be vented to the atmosphere.
Finally, there is a bank of air conditioning units mounted on the external elevation facing the road. It is
assumed that these are just used for cooling.
Given the age of the building, it is not surprising that condition of the plant room is relatively poor
compared to the Taro Centre. As with the Taro Centre the precise relationship with the CHP installer and
operator Ener-G is unclear.
A4.3 NEW LEISURE CENTRE AND NEARBY ADDITIONAL HEAT LOADS The proposal for the new sports centre at Alton, which will be adjacent to the existing one, is for
demolition of the existing sports centre and outdoor sports pitches and construction of a replacement
sports centre with sports pitches and additional community facilities, together with access, parking and
open space.
The following provides a summary of the core indoor facilities:
Swimming: Minimum six-lane swimming pool and a small learning pool.
Sports Hall: Multi-purpose sports hall with sprung timber floor and spectator seating
Studios and Play Spaces: The studio and play spaces will be flexible space to allow for a range of
exercise classes and other uses. It is intended that this space will also be suitable as a general
community resource available for hire.
Fitness studio: Fitness gym able to support a broad range of specialist fitness equipment.
Changing Rooms: Dry and wet changing facilities with toilets will be provided for the indoor and
outdoor sporting facilities.
Community Meeting Rooms: A flexible space available for use by community groups.
Based on the Outline Planning documents available, the new Leisure centre will be a mixed wet-dry centre
of up to 8,500m2 sports/leisure floor space (Use Class D2). The sustainability statement for the
44
The CHP running hours at Alton and Taro are similar and this may reflect a similar installation date. However, the total output is much higher at Alton.

EHDC HNDU: Heat Techno-Economic Feasibility Studies
P a g e | 107
replacement sports centre45 does not provide any indication of the likely heat or electricity loads. As such
we have based our estimates on CIBSE benchmarks for similar buildings. We used these benchmarks to
develop a heat load scenario for the new centre.
A4.4 BENCHMARK ENERGY DATA: DEVELOPMENT OF MODELLING SCENARIOS Based on the Outline Planning documents available, the new Leisure centre will be a mixed wet-dry centre
of up to 8,500m2 sports/leisure floor space (Use Class D2). The sustainability statement for the
replacement sports centre does not provide any indication of the likely heat or electricity loads. As such
we have based our estimates on CIBSE benchmarks for similar buildings (see Table 52). We used these
benchmarks to develop a heat load scenario for the new centre.
Table 52: CIBSE Guide F benchmarks for leisure centres
Building Type Good Practice (kWh/m
2/year) Typical Practice (kWh/m
2/year)
Fossil fuels Electricity Fossil fuels Electricity
Dry sports centre 158 64 343 105
Combined centre 264 96 598 152
Leisure pool centre 573 164 1321 258
Swimming pool (25m) centre 573 152 1336 237
We based our scenarios on the replacement sports at Alton on guidance developed by the Chartered
Institute of Building Services Engineers (CIBSE).
CIBSE Guide F (Energy Efficiency in Buildings, 2012) provides a series of energy benchmarks for different
types of buildings including sports and leisure centres. As the precise design for the leisure centre is not
yet available we developed three scenarios using the CIBSE data which are shown in the following table.
Table 53: Average, best case and worst case benchmarks for Alton new sports centre
Good practice Typical practice
kWh/m2/yr Fossil fuels Electricity Fossil fuels Electricity
Average 332 108 754 172
Best case 158 64 343 105
Worst case 573 164 1,321 258
For the proposed heat network scenarios we assumed ‘good practice’ and adopted the average scenario.
To this we added estimates for the nearby Gurdons social housing apartments and the Cardiac Centre as
follows:
45
Alton Leisure Centre: Sustainability Statement (AECOM, 2015).

EHDC HNDU: Heat Techno-Economic Feasibility Studies
P a g e | 108
Table 54: Heat and electricity load assumptions for The Gurdons and cardiac centre
Heat Electricity
Cardiac Rehabilitation Centre (assume 500 m2) 174,500 34,000
The Gurdons (10 x flats) 100,000 50,000
Total 274,500 84,000
Notes: a) CIBSE Guide F indicates 349 kWh heat and 68 kWh electricity for day centres. b) The estimated area of the cardia unit is
500 m2. c) For each flat at The Gurdons we assumed 10,000 kWh of heat and 5,000 kWh of electricity per annum. The Part L rate
of 54.26 kWh/m2
was not used as the internal area of flats is unknown.
Utilising the above, we applied these rates to the gross internal area of the proposed new Sports Centre
(8,500m2) to produce some representative heat and power loads as shown in the table below. We
adopted ‘good practice’ and the ‘average scenario’ (highlighted in red in the following table) which
reflects the mixed wet and dry aspects of the new Centre.
Table 55: Average, best case and worst case heat and electricity loads for Alton new sports centre
Good practice Typical practice
kWh/m2/yr Fossil fuels Electricity Fossil fuels Electricity
Average 2,819,167 918,000 6,409,000 1,459,167
Best case 1,343,000 544,000 2,915,500 892,500
Worst case 4,870,500 1,394,000 11,228,500 2,193,000
A4.5 TECHNOLOGY OPTIONS AND CHOICES For a modern high efficiency building, in principle we have a wide range of low-carbon options, including:
Gas-CHP
Biomass heating
GSHP
In practice obtaining the five acres (or more) needed for a decent scale GSHP system (or alternatively a
large number of boreholes) is simply not feasible given the space constraints on the site (i.e. the extensive
car parking areas, the access road and the presence of the cardiac rehabilitation centre and social
housing). Moreover, the construction of the replacement Alton Leisure Centre will take place whilst the
existing centre is kept operational. This fact in itself rules out the option of installing heat collection
pipework for the heat pump (either vertically or horizontally) for the new centre.
Biomass heating could offer a practical low carbon option, with multiple boilers located in the footprint of
the new building and a large underground fuel silo located alongside. Access for delivery of fuel is good on
this site. Using mainly biomass – 800kW boilers – this could run alongside a small gas CHP unit (125 kW(e))
or gas boilers.
Gas CHP offers an attractive financial option for the site if the output is matched to the power needs of
the new building – c.1,000,000 kWh. This would suggest a 200 kW(e) CHP system (350kW(th)) operating at
around 5,000 hours per annum. In this scenario the residual heat load could be managed either with a
c.400kW biomass system and/or gas boilers.
While the heat and power loads of a Sports Centre are attractive for high utilisation of both CHP and
biomass boilers, an extension to a proposed 305 housing unit development would offer much less

EHDC HNDU: Heat Techno-Economic Feasibility Studies
P a g e | 109
attractive heat and power loads. With high efficiency domestic buildings, there would be little space
heating demand between May and September, and daily there would be modest loads during the day.
This extended heat and power demand could be met with a combination of a bigger biomass capacity (up
to 3 x 400kW system), gas boilers and power from the grid.
A4.6 SUMMARY OF TECHNOLOGY APPRAISAL
Physical Limits
Energy Centre issues
Biomass fuel
delivery
Potential CO2
reduction Cost Issues Finance Overall Conclusions
Solar Thermal
Large roof space needed
New Boiler
room can be
designed in
N/A
Medium to Good in hot water
savings
High per unit delivered & cost of carbon saved
RHI
NO - extensive roof space available; needs other
heat source; poor economics likely
GSHP
Large area needed (c.5
acres) or multiple
boreholes. Difficult under
new build strategy
At least 50% cf
standard gas
c. 15-20% >than biomass heating;
borehole collection higher.
Some savings with uninsulated collection pipework
NO – finding c.5 acres difficult; new build
strategy will make space for boreholes and
horizontal collection difficult; low temperature output mostly suitable for high efficiency buildings
Biomass - pellet
Compact space needs
inc. fuel store
New Boiler
room so can be
designed in Good
access
High - c.85% cf
gas
Medium RHI
YES but focus on cheaper chip fuel - suitable and
access good
Biomass - Chip
Compact space needs
inc. fuel store
New Boiler
room so can be
designed in
High - c.85% cf
gas
YES - suitable and access good
Gas CHP Compact
space needs
New Boiler
room so can be
designed in
N/A
Modest - c.20-25%
cf standard
brown power
and gas heating
Medium to low
Modest ECAs and
possible business
rates relief
YES - suitable and small space needs but modest
CO2 savings
Biomass - CHP
Compact space needs
inc. fuel store
Probably not
sufficient space for
power plant and big fuel
store
Good access
High - c.80% cf gas CHP
High
RHI, FITs,
Business rates
exemption
NO - no current high efficiency gasification
commercial technology at sub 1MW(e)scale; needs
large fuel silo

EHDC HNDU: Heat Techno-Economic Feasibility Studies
P a g e | 110
A4.7 DEVELOPMENT OF MODELLING SCENARIOS
A4.7.1 New Housing - Former Lord Treolar Site A planning application46 for the land at the former Lord Mayor Treloar Hospital Site (Chawton Park Road)
was used to derive a list of proposed dwellings. We then applied the same standard loads used for Penns
Field (as described in the Appendices) to derive heat and electricity loads for each dwelling type.
These loads were then aggregated to produce an overall picture for the 305 dwellings proposed in the
2014 planning application. The results of this exercise (see Table 56) indicate a heat load of around
6,272,307 kWh and 1,525,000 kWh of electricity per year.
Table 56: Summary of dwelling types and derived heat and electricity loads for new housing at Alton (Lord Treolar)
Unit Type Qty Area m2
Electricity (kWh)
Space heating (kWh)
Hot Water (kWh/hh)
Total heat load (kWh/yr)
1 bed flat 14 51 70,000 38,742 207,340 246,082
2 bed flat 11 66 55,000 39,393 162,910 202,303
2 bed house 45 77 225,000 188,011 666,450 854,461
3 bed house 134 97 670,000 705,271 1,984,540 2,689,811
4 bed house 77 134 385,000 559,855 1,140,370 1,700,225
5 bed house 24 172 120,000 223,985 355,440 579,425
Total 305 597 1,525,000 1,755,257 4,517,050 6,272,307
Notes: a) Heat load based on Part L 2013 (54.26 kWh/m2) b) electricity load based on DECC research (5,000 kWh per dwelling on
average).
46
30021/056, 2014 (Status: Permission granted).

EHDC HNDU: Heat Techno-Economic Feasibility Studies
P a g e | 111
APPENDIX 5: WHITEHILL & BORDON: ENERGY DATA
The former Ministry of Defence site at Whitehill & Bordon has been allocated for a major new mixed use
development. Whilst most of the existing buildings will be demolished, the former sergeant’s mess and
Sandhurst complex will be retained and incorporated into the new development.
A new high street, linking the existing settlement with the new development will be formed from the
A325 and into the redevelopment site. This will generate several commercial heat loads that will be
important in the consideration of a heat network.
There are two pre-existing heat networks at the Whitehill & Bordon site:
Prince Philip Barracks network:
o Extensive heat network serving a number of large buildings.
o Four 1.9MW gas boilers housed in a purpose built Energy Centre constructed in 1975.
o The underground pipework is around 1km (see Figure 34).
o Each building has its own plant room with plate heat exchangers and indirect calorifiers
for domestic hot water.
Technical training area (TTA):
o Above ground heat distribution for training and education buildings.
The TTA heat network is not suitable for re-use or refurbishment as much of it is above ground and will be
removed as part of the TTA redevelopment. In addition, we received a short status report on the
condition of the existing network. Whilst still operational it appears that the 41 year old pipework is not
in great condition and suffers from several leaks47.
Figure 34: Approximate route of pre-existing Whitehill & Bordon heat main (based on conversation with
Carillion engineer during Nov 2015). Existing Energy Centre highlighted in red.
47
Bruce Collinson, EHDC, January 2016.

EHDC HNDU: Heat Techno-Economic Feasibility Studies
P a g e | 112
The existing Energy Centre and Prince Philip Barracks network are of considerable interest to this project
as they provide a fully functioning heat network that could possibly be retained within the new
development. The boiler room, to which access was gained, is relatively spacious and well laid out with
good external access. Conceivably it would be relatively simple to retrofit replacement gas boilers and
possibly gas CHP. Moreover, close to the Energy Centre building and immediate surrounding area it may
be able to incorporate a biomass heating system.
Correspondence received from EHDC indicates that feedback on the general condition of the pipework
had been received recently. Anecdotal
evidence suggests that there are significant
water leaks on the pipe run between
Sandhurst Block and the Armoury. The
assumption, therefore, is that the
underground pipework is not serviceable and
would need to be replaced (or new pipework
installed in the same conduits if there is
sufficient space to do so). Even if this is not
the case, then the Energy Centre building
appears to be worth retaining. The impact of
this is a significant potential cost saving.
Figure 35: Whitehill & Bordon redevelopment plan showing detail for new town centre (within black dotted line) and position of existing gas-fired energy centre (red box) (Sources: Barton Willmore; SEWF Ltd)
It is recommended, therefore, that the
existing gas district heating network at the
Prince Phillip Barracks site is surveyed in some detail to ascertain condition (underground network and
building connections), routing and opportunities for retention and re-use (including the existing pipe
conduits) prior to investment. Carillion, the current holder of the maintenance contract, would need to
be involved in this process as they undoubtedly hold important records on maintenance, usage, efficiency,
condition and so on.
EHDC has already negotiated space for a new Energy Centre at the Prince Philip site (estimated at around
one-third of an acre). It could be that the existing gas-fired Energy Centre is retained, recommissioned
and a new gas-CHP and biomass system is introduced, reserving space for a new Energy Centre for a
phase when the heat load has grown significantly.

EHDC HNDU: Heat Techno-Economic Feasibility Studies
P a g e | 113
Figure 36: Plan from the Bordon
Garrison Structuring Plan with
approximate location of town centre
circled in red (Source: Barton Willmore,
2015)
A5.1 DATA The majority of buildings in the
Whitehill & Bordon development
will be new-build, plus a much
smaller number of refurbished
existing buildings. As such, the
energy data utilised to assess
heat network based options is
based on estimates and
projections.
Energy and related data for
Whitehill & Bordon has been
secured from a variety of reports
and sources. These include
documents produced for
planning purposes as well
analysis carried out for EHDC and
Hampshire County Council on
heat networks and low carbon
options.
We utilised the basic energy data offered by AMEC as part of the ‘Whitehill & Bordon Garrison
Development: Sustainability and Energy Statement’ (Nov 2014). We further refined this as follows:
Updating the varying sub-sections of development to focus on those identified as moving forward
under Phase 1 in the new town centre.
We reduced energy consumption data to more accurately reflect Building Regulations (2013)
standards and to take into account AMEC’s suggested reduction of 20% to take into account
uncertainties and over-estimates.
We utilised benchmark data (e.g. via CIBSE) for certain types of domestic and non-domestic
buildings to assess likely energy consumption figures and hot water use.
We utilised monthly energy data from supporting reports carried out for adjacent parts of the
new Whitehill & Bordon town which were relevant.
The energy data was reworked to take account of currently higher Building Regulations (2013), and
benchmarked with above average examples of non-domestic building such as schools, leisure buildings,
retail and offices. We also reviewed some of the cost data provided for an earlier heat networks study and

EHDC HNDU: Heat Techno-Economic Feasibility Studies
P a g e | 114
adjusted these to be closer to industry and recent tendering standards48. The resultant energy data is
summarised in the tables below.
Our analysis at Whitehill & Bordon is focussed on the proposed new town centre area (former Prince
Phillip Barracks). Already at this location is a c.1 km heat network supplied by large gas boilers, housed in
a dedicated Energy Centre, which is used to heat most the main buildings (see Figure 34).
The quality and condition of the pipework in this existing network is 40 years old and anecdotally is not in
good condition, but in principle the underground routing and existing Energy Centre offers a lower cost
early start to building a heat network in the new town.
Following discussions with the client, our strategy is to include low-carbon options such as biomass
heating and/or gas-fired CHP around the current Energy Centre, and then when sufficient heat load has
developed, to add to this by building a new Energy Centre in the land allocated for this. This will likely
significantly reduce costs in the early phase of this development, while heat loads build up.
Table 57: Annual heat and electricity loads for new Whitehill & Bordon town centre based on AMEC estimates
Town Centre (AMEC estimates)
Heat + Hot Water (kWh/yr) Electricity (kWh/yr)
Commercial 17,808,000 9,229,000
Domestic 26,203,400 7,400,000
Total 44,011,400 (35,209,120) 16,629,000 (13,303,200)
Notes: AMEC 20% adjustment shown in red.
Table 58: Annual heat and electricity loads for new Whitehill & Bordon town centre based on building regulations (Part L, 2013)
Town Centre (Part L 2013)
Heat + Hot Water (kWh/yr) Electricity (kWh/yr)
Commercial 17,808,000 9,229,000
Domestic 19,103,826 7,400,000
Total 36,911,826 16,629,000
A5.2 TECHNOLOGY OPTIONS AND CHOICES With new, energy efficient buildings, the heat density will be critical in the economics of any heat network
proposed. The new town centre at Whitehill & Bordon offers the best prospects, while the purely housing
related developments in other parts of the new town offer much less attractive opportunities.
As far as the low-carbon technology options, we reviewed these and concluded that the following were
potentially suitable:
Biomass heating
Gas-fired CHP
GSHP (albeit in a more limited way targeting a small number of closely linked buildings).
Rejected were:
48
Gas CHP district heating Feasibility study for former Louisburg Barracks.

EHDC HNDU: Heat Techno-Economic Feasibility Studies
P a g e | 115
Smaller-scale biomass-CHP, which is not yet a fully commercial proposition (although encouraging
development is taking place).
Larger scale biomass CHP.
o While the full scale development of Whitehill & Bordon in 5-8 years’ time might offer
sufficient scale and heat loads for a larger commercial biomass CHP system, the very high
costs of such a system and the need for >3MW power demand and >9MW heat demand
would in practice make this very difficult to achieve. It has was therefore rejected as a
low-carbon option for this project.
Our financial appraisal therefore focussed on three main technology combinations:
Scenario 7:
o Large 2MW gas-CHP system, with 2MW biomass heating and 3MW gas for residual load
and back-up.
Scenario 7a:
o Although not developed as a full scenario, we simply adjusted the balance between gas-
CHP and biomass to give a much higher emphasis on reducing CO2 emissions through the
greater use of biomass heating. This assumes a 4MW(th) biomass heating system (3-4
boilers) with a smaller-scale 1MW(e) gas-CHP system and 4MW gas boilers for residual
load and back-up.
o In the absence of the RHI or similar support, the economics of this scenario will be
considerably lower than Scenario 7 so we did not model this option in detail. We did
however establish the impact of a more biomass orientated approach, in the event of
carbon saving becoming a policy imperative with greater financial value placed on CO2
emissions,
Scenario 8:
o A smaller ring-fenced heat network development for 1 to 2 buildings, including a hotel,
focussing on using GSHP (500kW) plus a 200kW(e) gas CHP system and back-up gas boilers.
o The CHP system essentially powers the heat pump system at lower cost than grid power
as well as supplying all the additional power loads for the hotel.

EHDC HNDU: Heat Techno-Economic Feasibility Studies
P a g e | 116
A5.3 SUMMARY OF TECHNOLOGY APPRAISAL (WHITEHILL & BORDON) Table 59: Summary of technology appraisal for Whitehill a& Bordon
Physical Limits
Energy Centre issues
Biomass fuel delivery
Potential CO2 reduction
Cost Issues Finance Overall Conclusions
Solar Thermal
Very large roof and
land space needed
Not sufficient heat to be a
viable prospect
N/A Medium to Good in hot
water savings
High per unit of heat
delivered and cost of
carbon saved
RHI
NO - extensive roof space available, but
needs other heat source and poor economics likely
GSHP
Large ground space
needed (c.25 acres
plus) or many
multiple boreholes
Could work with existing
and new E Centre but
space for heat collection a major issue
N/A At least 50% cf standard
gas
c. 15-20% >than
biomass heating; borehole collection
higher. Some
savings with uninsulated collection pipework
RHI
YES - part use in distinct heat area - availability of 5-10 acres for smaller scheme could be difficult; evolving heat load makes collection area-
borehole assessment difficult; could be
suitable for part of heat load
Biomass - pellet
Compact space needs
inc. fuel store
Can use area near existing
Energy centre Good access
High - c.85% cf gas
Medium RHI
YES - but focus on cheaper chip fuel - suitable and access
good
Biomass - Chip
Compact space needs
inc. fuel store
Can use area near existing
Energy centre Good access
High - c.85% cf gas
Medium RHI YES - suitable and
access good
Gas CHP Compact
space needs
Can use area near existing
Energy centre as well as new Energy centre
N/A
Modest - c.20-25% cf
standard brown power
and gas heating
Medium to low
Modest ECAs and
possible business
rates relief
YES - suitable but more modest CO2
savings
Biomass - CHP
Compact space needs
inc. fuel store
Would need new Energy centre for
spatial needs + regular
wood deliveries
Good access at existing
Energy Centre and new Energy
Centre
High - c.80% cf gas CHP
High
RHI, FITs,
Business rates
exemption
POSSIBLE IN FUTURE - no current high
efficiency gasification commercial
technology at sub 1MW(e)scale;
economics very poor below 5MW(e)

EHDC HNDU: Heat Techno-Economic Feasibility Studies
P a g e | 117
A5.4 DEVELOPMENT OF SCENARIOS
A5.4.1 Summary of Key Inputs The heat loads for the new domestic and commercial buildings at the former Prince Phillip Barracks site
were derived from the summary of new buildings for the town centre in the Whitehill & Bordon Garrison
Redevelopment report49 (see Table 60).
Note that this element of the project is concerned with the new town centre which forms part of eastern
section of the former Prince Phillip Barracks site. As such not all of the energy data contained in the AMEC
report is valid for this project and the following housing development sites have been removed as they do
not form part of the new town centre:
BOSC
Havannah Officers Mess
Louisburg DIO land
TTA North
TTA South
An earlier document (Whitehill & Bordon Infrastructure and Utilities Strategy50) appears to be the source
of the estimates provided in the November 2014 AMEC report.
We note that AMEC makes the following statements about their heat and electricity load estimates:
There is a degree of uncertainty at outline planning stage regarding the exact mix of development
and building types the ultimate developers will build.
Given the scale of the proposed scheme, some high level assumptions need to be made in terms
of timing and phasing.
Initial estimates can still be made – but these are overstated and deliberately cautious.
Ultimately the scheme’s homes and businesses will be built to higher standards than those
contained within building regulations (Part L, 2013) and this would significantly reduce the
baseline energy demand position.
Formal Standard Assessment Protocol (SAP) testing would be required at design stage to reveal a
more accurate energy load.
For example, achieving the 2013 Fabric Energy Efficiency Standard could reduce residential energy
demand and emissions by at least 20%.
The assumptions developed by AMEC are shown in the Table 60. For domestic buildings the estimates
effectively translate into the following energy loads per dwelling:
Heat: 20,600 kWh
Electricity: 10,000 kWh
If we take the area of domestic dwellings, for example the Budds Lane housing site, the average area for
each unit is 357 m2 (which is fairly large and perhaps not that representative of the ‘average’ property). If
this average area is multiplied by the Target Fabric Energy Efficiency (TFEE) rate using in building
49
Whitehill & Bordon Garrison Redevelopment: Sustainability and Energy Statement (DIO/HPA/DOC/02a). AMEC (Nov 2014) 50
WB/HPA/DOC/17, AMEC, October 2014.

EHDC HNDU: Heat Techno-Economic Feasibility Studies
P a g e | 118
regulations Part L 2013 (i.e. 54.26 kWh/m2), the result (19,379 kWh) matches fairly well with the 20,600
kWh result above.
However, this relationship is less clear for the other housing sites (South Town Centre, North Town centre,
Camp Road), most likely due to the mix of building sizes. As such it is not clear on what basis the heat
loads have been arrived at.
For the commercial buildings the heat load per square meter varies between 60 kWh/m2 (South Town
Centre - commercial and retail) and 150 kWh/m2 for the schools. Again, it is not clear how these rates
were derived.
Table 60: Summary of building types for the new town centre at Whitehill & Bordon
Site ref Use classification Domestic/
Non Domestic
Total No.
Units
Build area (m
2)
Annual electricity demand (kWh/yr)
Annual heat
demand (kWh/yr)
Build phase
Budds Lane Secondary school Non-domestic - 75,000 3,000,000 11,250,000 1
Budds Lane Housing Domestic 70 25,000 700,000 1,442,000 2a/b
TTA South Primary school Non-domestic - 28,000 1,120,000 4,200,000 3a
South Town Cente
Housing Domestic 120 22,000 1,200,000 2,472,000 2b
South Town Cente
Commercial and retail
Non-domestic - 39,300 5,109,000 2,358,000 1
North Town Centre
Housing Domestic 512 93,000 5,120,000 10,547,200 2b
Camp Road Housing Domestic 38 10,100 380,000 782,800 1
Total 740 292,400 16,629,000 33,052,000
Notes: Source – AMEC, Nov 2014.

EHDC HNDU: Heat Techno-Economic Feasibility Studies
P a g e | 119
APPENDIX 6: DISTRICT HEATING NETWORKS: TECHNOLOGY AND ISSUES
A6.1 DISTRICT HEATING INSULATED PIPEWORK In a district heat (DH) network such as that envisaged for the three EHDC sites covered by this study, the
underground pipework is a significant part of the overall project costs. Detailed data on these costs are
hard to find as information on district heating tends to be asymmetric until one enters detailed
negotiations with companies that design, build, operate and maintain heat networks. Most of the
literature on this topic51 cite that pipework costs represent a significant proportion of the total
construction cost.
As well as the costs of the pipework itself, there are excavation costs, the costs of laying sand and then
the pipework, and then backfilling. Such costs can vary between £50 per metre (excavation costs only in
greenfield site) to £1,000+ per metre (full installation including pipework in existing major urban area).
For example, the pipework for a one kilometre district heating network could cost up to £1m whereas the
associated energy centre might only cost £500,000 (a ratio of 2:1).
The latter cost levels are found sometimes with large pipework retrofit costs in urban areas, which
involves digging up concrete and negotiation around existing buried services.
In pure green field situations, the excavation and installation costs alone are significantly lower, of the
order of £40-£110/metre (n.b. this excludes the actual cost of pipework). For smaller DH systems, an all-in
price of £120-£200/metre for green field sites is typical. In a new build situation, as long as there is clear
coordination with these other groundworks, the costs of excavation, installation and backfilling should be
at the lower end of the range.
A6.2 TYPICAL BELOW ROAD URBAN PIPEWORK AND SERVICES SET UP The costs of pipework itself are fairly transparent, though a significant set of discount levels exists
compared to standard retail prices.
We worked with a major pipework manufacturer and supplier Rehau, to design and cost the DH networks
for this project. We then applied an appropriate discount likely to be available with a ‘Design and Build’
contract.
51
For example: The Potential and Costs of District Heating Networks: A Report to the Department of Energy and Climate Change (Poyry, 2009);

EHDC HNDU: Heat Techno-Economic Feasibility Studies
P a g e | 120
Figure 37: Twin duo and single PEXa pre-insulated pipework (left); Larger diameter insulated steel pipework (right)
Figure 38: Varying single and twin plastic pipework pre-insulated 90o Bends

EHDC HNDU: Heat Techno-Economic Feasibility Studies
P a g e | 121
A6.3 THE PRACTICAL ASPECTS OF LAYING PRE-INSULATED PLASTIC PIPEWORK Pre-insulated plastic pipework can be delivered in long rolls (see below). Depending on the site details, the
pipework can be unrolled and laid out in a trench, or pulled through an excavated trench.
Figure 39: Practical aspects of laying pre-insulated plastic pipework
Large PEXa pipework coil
Pipework being pulled under road
‘Soft dig’ pipework trench
Cross-section of pipes entering brick wall
Typical cross section of trench for plastic
pipework
Photo showing sand covering pipe and
identification tapes to prevent accidental damage in future

EHDC HNDU: Heat Techno-Economic Feasibility Studies
P a g e | 122
Excavating and laying pipework – 93mm ID Single
pipework for a 300kW biomass boiler
Making a secure Joint at T-Junction twin (duo type)
pipework
A6.4 PIPEWORK TYPES: PLASTIC VS STEEL We have carried out a technical review of insulated pipework, reviewing both plastic and steel pipework.
This included a review of the literature as well as interviews with both suppliers and practitioners. The
main issues we assessed were:
Costs of purchase and installation and difficulties of installation
Longevity
Technical issues relating to flow temperatures and pressure
Servicing and quality control
In our review of steel and plastic insulated heating pipework, a number of key conclusions emerged.
These are:
Up to 110mm internal diameter (ID) steel pipe is cheaper than plastic (c. half the cost), though the
more frequent joints for steel pipes (every 10-12 metres) reduces that advantage significantly and
particularly the labour element of installation
Above 110mm ID, plastic pipework gets increasingly more expensive relative to steel (2-3 times
the cost of the product)
The majority of pipework proposed for the three EHDC projects is between 25mm and 125mm
(ID)
Where there are a significant number of bends and ‘Ts’ in a scheme, plastic systems become much
more cost-effective
Installation costs are lower for plastic pipework, particularly where there are longer straight
lengths and also more complicated bends
Steel pipework is generally sold in 10-12m lengths, therefore requiring significantly more joints.
Plastic pipework can be purchased in extremely long lengths, only limited by transportation to the
site. Larger diameter coils are more limited in length
Corrosion can be an issue with steel pipework, so careful control of water quality and water
ingress is important
A major issue in deciding whether to opt for plastic or steel is that plastic systems (PEXa) has a
significantly reduced lifetime once flow temperatures increase beyond 85oC. Flow temperatures
of around 80-82oC will however allow lifetimes of 30 to 50 years. The length of time flow

EHDC HNDU: Heat Techno-Economic Feasibility Studies
P a g e | 123
temperatures are at the higher level will impact on lifetime. Running summer flow temperatures
at a lower 70oC when the load is dominated by DHW will help extend lifetimes.
Subject to the careful control of flow temperatures, and taking account of the pros and cons above (see
also the Table below), overall, the use of plastic pipework systems are appropriate for the proposed DH
networks at Penns Place-Taro and Alton Leisure Centre. They offer a good balance of costs, ease of
installation, servicing and longevity. For Whitehill & Bordon steel pipework for the main heating loops
could be appropriate, with plastic pipework for the links to individual buildings and homes.
Figure 40: Summary of Pros and Cons of steel vs plastic insulated pipework
Steel Plastic
Ad
van
tage
s
Strong material
Resistant to impact damage
Larger range diameter sizes available
Capable of withstanding higher flow
temperatures / pressure
Different levels of insulation can be specified
Integrated trace heating and leak detection
possible
No thermal expansion (self-compensating)
More flexible compared to steel
Long coil lengths possible (less joints)
Cheaper to install than steel
continuous production, coiled for delivery
Easier joining (no welding)
Flexibility allows obstacles to be avoided more easily
Easier handling contributes to higher laying speed
Narrower trench profile - excavation costs are reduced
No risk of corrosion of the service pipe
Building entries easier
Dis
adva
nta
ges
Only straight lengths possible
Joints required every 6-12m
High installation costs
Corrosion risk
Water quality requirements
Water quality monitoring
Specialist welding required
Larger trenches required
Less flexibility overall
Building entry more complex
Very precise limitations on:
o Temperature
o Pressure
More expensive than steel (particularly larger dimensions)
Insulation can degrade on cheaper products
Lifespan can be compromised by short-term fluctuations in
pressure/temperature
Limited diameter range
A6.5 CIBSE HEATING NETWORK GUIDE The initiative for this Guide came from a realisation that UK experience and expertise in heat network
expertise was more limited than in countries such as Denmark, Germany and the Scandinavian countries.
With a rapid increase in interest and investment in new or upgraded heat networks, there was concern
over quality standards and systems being installed. CIBSE and the Association for Decentralised Energy
(ADE) came together to lead up an initiative to develop a Code of Practice. It was envisaged that this
would support the spread of the technology by increasing the confidence of developers and investors.
Government, as part of its support for the growth of heat networks, had also called on the industry to set
out standards.
As well as a code of practice, training, accreditation and registration of engineers to enhance the quality
of heat networks from design through to operation is being developed.

EHDC HNDU: Heat Techno-Economic Feasibility Studies
P a g e | 124
A major challenge will be to deliver a high standard of service to customers, who will have had good long-
term experience using gas-fired boilers. Therefore, a high quality installation offering good reliability, a
long life, low carbon intensity of heat supplies and low operating costs will be key. The cost-effectiveness
of the heat supply will also depend on achieving low-cost finance over a long period of time and funders
will also be looking for long-term performance and reliability.
The Code of Practice is therefore written to:
Improve the quality of feasibility studies, design, construction, commissioning and operation by
setting minimum requirements and identifying best practice options.
Deliver energy efficiency and environmental benefits.
Provide a good level of customer service.
Promote long-lasting heat networks in which customers and investors can have confidence.
A6.6 HEAT NETWORK TECHNOLOGIES: CRITERIA FOR REVIEW AND ASSESSMENT The main heat technologies which are suitable for modern heat networks must be able to provide a range
of heat services, including low temperature hot water for space heating (LTHW), domestic hot water
(DHW) for washing, heating swimming pools (if appropriate), and higher temperature space heating for
industrial uses. Older heat networks more commonly used steam as a medium for delivering higher
temperature heat to end-uses but this is much less common today.
Given the increasing pressure to cut carbon emissions, the technologies suitable for delivering heat to
heat networks, and sometimes associated power, are:
Gas-fired CHP
Biomass CHP
Biomass heating boilers (suitable for LTHW and Higher temperature hot water)
Ground source heat pumps (GSHP)
Water-based heat pumps (river and lake sourced)
Solar hot water (SHW) – usually in conjunction with another options such as biomass
For the three projects in this study, water-based heat pumps are not an option (no water source is
available nearby), and solar water heating was rejected early on as this could not provide sufficient
heating throughout the year to be a viable option. In theory, SHW linked to biomass heating could provide
a year round supply of heat, but this would require very significant areas (roof space) and would offer
poor rates of return compared to a straight biomass heating option for example.
The team have a set of criteria used to evaluate technology options and they were utilised to narrow
down technology options for the three project locations. The appraisals are summarised in the
Appendices.
The conclusions were as follows:
Penns Place-Taro: Biomass heating with gas-CHP (current and new system in 5 years’ time)
Alton Leisure centre: Biomass heating and gas CHP
Whitehill & Bordon: Biomass heating, gas CHP, partial use of GSHP

EHDC HNDU: Heat Techno-Economic Feasibility Studies
P a g e | 125
A6.6.1 Ground Source Heat Pumps (GSHP) The ground acts as a very large store of heat energy. It can be used as a heat source in winter, or a heat
sink in summer. The ground can be used to moderate the temperature in buildings standing on it.
A ground source heat pump (GSHP) can be used to extract heat energy from the ground in winter and to
transfer the heat into buildings. Equally it can be used to provide a very efficient mechanism for heat to
escape from buildings down into the ground in summer.
A GSHP provides a clean way to heat buildings, free of all carbon emissions on site though requiring power
to run the system. It can make use of solar energy stored in the ground to provide one of the most
energy-efficient ways of heating buildings. Solar recharge of the ground is an integral part of ground
source energy which is used to increase the efficiency of ground source heat pumps.
Ground source heat pumps are suitable for a wide variety of buildings and are particularly appropriate for
low environmental impact projects.
They can be installed anywhere in the UK, using a borehole or shallow trenches or, less commonly, by
extracting heat from a pond, a lake or the sea. Heat collecting pipes in a closed loop, containing water
(with a little antifreeze) are used to extract this stored energy, which can then be used to provide space
heating and domestic hot water. Heat pumps can also be reversed in summer to provide cooling.
The main energy used by a ground source heat pump is electricity to power the compressor and the
circulation pumps which transfer heat energy from the ground into the building. A well designed ground
source heat pump installation should deliver three or four times as much thermal energy (heat) as is used
in electrical energy to drive the system. For a particularly environmental solution, green electricity can be
purchased.
Ground source heat pumps have been widely used in North America, Sweden, Germany and Switzerland
for many years. Typically they cost more to install than conventional heating systems. However, they have
low maintenance costs and could be expected to provide safe, reliable and emission-free heating for well
over 20 years.
GSHPs work best with heating systems which are optimised to run at a lower water delivery temperature
than is commonly used in radiator systems. As such, they make an ideal partner for underfloor heating
systems.

EHDC HNDU: Heat Techno-Economic Feasibility Studies
P a g e | 126
Figure 41: Practical aspects of laying pipework for large-scale (400 kW) ground source heat pump (Photos: Baystar)
Some key facts for GSHP include:
Boreholes vs horizontal ground source heat collection – former is 30-35% more expensive.
While horizontal low temperature heat collection is charged up seasonally, this is not the case for
boreholes which do not re-charge and therefore heat pump capacity calculations have to be
pretty accurate.
For an indicative 200kW capacity GSHP system (70kW swimming pool and 125kW space heating
and hot water) approximately four acres of land was needed to install the horizontal heat
collection pipework. More space and capacity is needed for a swimming pool than standard space
and water heating, but this gives a broad indication of spatial needs. For the same heat pump
capacity around 12-16 boreholes 80m deep would be needed.

EHDC HNDU: Heat Techno-Economic Feasibility Studies
P a g e | 127
The collection pipework would be uninsulated and heat would be transferred to the homes or
buildings where a heat pump would then upgrade temperatures to a useful level (i.e. >30oC).
GSHP would not be suitable for Penns Place-Taro Centre as the heat output is not suitable for the
radiator systems utilised and the lower efficiency buildings.
While GSHP could in principle work for the Alton Sports Centre, there are major spatial problems
due to the new building strategy opting for the older Sports Centre to exist alongside the new
build, making space requirements very difficult to achieve.
There are doubts over GSHP supporting a large and an evolving heat load in Whitehill & Bordon.
Accurate decisions have to be made over capacity requirements for both horizontal and borehole
collection approaches. If these are incorrect or new heat loads appear then expensive additions
might be required. It might however be possible to earmark one or two adjacent specific heat
loads and use GSHP for these.
A6.6.2 Biomass Heating This is a very versatile virtual ‘drop in’ technology for LTHW and DHW and is the easiest renewable heat to
use for existing buildings. Care is needed over sizing biomass boilers with appropriate accumulator tanks
to avoid under or over-sizing systems and leading to poor efficiency performance.
The technology uses a solid fuel, therefore decent space and good design is needed for a fuel silo that
allows sufficient capacity to ensure that fuel is available in winter, that deliveries are not too frequent and
access for fuel delivery is easy and cost-effective.
Biomass fuel (wood chip and wood pellets) is now widely available and supply chains are well established.
It is important to note that indigenous sources of wood pellets are available with manufacturers such as
Verdo Renewables (Andover) responsible for much of the supply in southern England. While wood pellet
fuel offers a number of advantages over chip fuel, such as higher calorific value and density, related less
frequent deliveries, greater facility to handle as the fuel naturally 'flows', and less expensive boilers, it is a
more expensive fuel. All else being equal it costs consumers between 1p-1.7p/kWh more than good
quality wood chip fuel. When set against competing gas as a fuel for heating it tends to be much less
competitive. This is why we have opted for wood chip fuel in our analysis.
Given that EHDC may be able to invest in wood fuel supply hubs in the future, the risk around security of
supply and predictable price points may well diminish further still (although this would be subject to a
separate feasibility study).
Several previous studies have been carried out to assess the likely wood fuel potential in Hampshire and
within 10kM of Whitehill & Bordon. One of these studies by the Forestry Commission52 estimated that:
There is a sustainable wood fuel resource estimated at 40,000 cubic metres of wood per year
from within a 10kM radius of the centre of Whitehill & Bordon.
This would provide heat for at least 6,000 homes and savings of more than 7,000 tonnes of carbon
per year.
Based on the full biomass and part-biomass fuelled scenarios of this study, if all three projects proceeded,
wood fuel would need to support heat loads of 20-26 million kWh per annum within 5-7 years. Assuming a
partially dry wood chip fuel with a calorific value of 3,400kWh per tonne, heat losses of 10-20% through
52
Whitehill and Bordon: Woodfuel Supply Feasibility Study (Forestry Commission, 2011)

EHDC HNDU: Heat Techno-Economic Feasibility Studies
P a g e | 128
heat networks and an average boiler efficiency of 80%, the annual demand for wood chip fuel would be
between 6,000 and 7,700 tonnes per annum. This could extend to more than 9,000 tonnes per annum
where a greater emphasis on biomass was adopted for Whitehill and Bordon.
Table 61: Estimated wood fuel requirements for all sites
Project-Scenario Biomass kWh (a) Biomass kWh (b) Biomass kWh (c)
Penns Place-Taro Leisure Centre 2,588,595
Penns Place-Taro Leisure Centre-Penns Field
4,503,307 4,503,307
Alton biomass 2,938,984
Alton CHP biomass
2,093,667 2,093,667
Alton larger CHP Biomass 1,493,667
Alton + housing (extra only) 1
5,000,000 5,000,000
W & Bordon 2 7,200,000 7,200,000 12,000,000
Sub-Total 14,221,246 16,703,307 23,596,974
Plus 20% boiler efficiency losses 17,065,495 20,043,968 28,316,369
Plus 15% heat network losses 19,625,319 23,050,564 33,563,824
Total wood chip required (tonnes)
3
5,772 6,780 9,578
Notes: 1 Conservative estimate (full load is 6.7 GWh);
2 2MW biomass and 4MW (3,600 hours and 3,000 hrs respectively);
3
assumed energy content of wood chip at 3,400kWh/tonne.
For larger schemes, pollution assessments may be required to ensure that air quality standards are not
breached. All biomass boilers in receipt of the RHI tariff must come with certified Emissions certificates
that meet standards for PMs and NOx.

EHDC HNDU: Heat Techno-Economic Feasibility Studies
P a g e | 129
Figure 42: Practical aspects of medium-scale biomass district heating projects (Photos: SEWF)
Trenching and pipe installation
Trenching and pipe installation
Underground chip store
Above ground chip store
Trenching and connection for existing building
Flues and boiler room
A6.6.3 Solar Water Heating This is a long established technology, offering low temperature hot water for part of the year. While in
principle SHW can provide space heating in high efficiency buildings, in practice this is hard to achieve
year round without very high investment costs. SHW can be integrated well with a biomass heating
system, whereby the biomass offers heat for 8-9 months of the year and is switched off in summer

EHDC HNDU: Heat Techno-Economic Feasibility Studies
P a g e | 130
months when the SHW offers heat for washing, showers etc during the higher solar insolation periods of
the year. The main problem with SHW is its low rate of return in comparison with biomass and gas-CHP
options. Under the RHI scheme, the tariff rates are designed to offer only a standard 6% IRR (compared to
12% for biomass).
Figure 43: Large-scale solar water heating (Photos: Viridian Solar)
A6.6.4 Combined Heat and Power (CHP) Combined heat and power (CHP) integrates the production of usable heat and power (electricity), in one
single, highly efficient process.
CHP generates electricity whilst also capturing usable heat that is produced in this process. This contrasts
with conventional ways of generating electricity where vast amounts of heat are simply wasted. In today’s
coal and gas fired power stations, up to two thirds of the overall energy consumed is lost in this way,
often seen as a cloud of steam rising from cooling towers. In a straight comparison a well-run CHP system
should deliver an overall 80% efficiency while separate power and heating boilers could deliver around
56% efficiency.
A6.6.5 Gas-fired CHP This is now a well-understood, experienced and accepted technology, and particularly common in leisure
centres, hospitals or mixed use locations where there is a high heat and power demand across the year. It
is generally not suitable for pure domestic heat and power loads, particularly for modern efficient homes
where there is virtually no space heating demand for 4-6 months of the year. There are domestic scale
CHP units now available but this market has not taken off to any extent and the economics are still quite
poor even with strong incentives under FITs.
It is now quite common for larger boiler rooms to integrate multiple small gas CHP system and gas boilers
to manage heating and cooling loads, as well as provide most of the on-site power requirements.
Assessing a suitable CHP system size is heavily dependent on the heat loads throughout the year, but the
economics of saving imported power costs can sometimes lead to an over-sized CHP system that has
excess heat outputs that are simply dumped to the atmosphere.

EHDC HNDU: Heat Techno-Economic Feasibility Studies
P a g e | 131
Figure 44: 125 kWe (200 kWh th) Ener-G gas-CHP unit at Taro Centre (Source: SEWF)
A6.6.6 Biomass CHP At a scale above 5MWe a range of biomass CHP technologies are available, including steam-based systems
and Organic Rankine Cycle (ORC). At a scale of 250-3000kW however the range of options is more limited,
including a variety of gasification systems offering higher electrical efficiency of 20-27%. While smaller
scale biomass CHP units have been developed, their availability in a true commercial market is very
limited and there have been some significant failures. Issues include difficulties in providing very dry wood
chip for some designs, and high maintenance costs for gasification systems.
For more conventional technology – steam-based turbines for example – electrical efficiencies are low,
and usually below 20%. This means a heat to power ratio of up to 4:1. That requires a very significant year
round heat load for the system to be viable. While this can work at say a wood pellet plant where heat is
needed to dry wood to 10% year round, for other heat loads it is much more difficult to meet this type of
heat output.
Our assessment of this market is that it is currently immature and cannot be regarded as a commercial
technology choice at a scale below 1,000kW(e). In principle, Whitehill & Bordon could support a steam-
based biomass CHP system but as well as high capital costs (2-4 times higher than gas-CHP systems), there
are predicted low heat demand levels in summer months, making it unviable to operate a large biomass
CHP system throughout the year.

EHDC HNDU: Heat Techno-Economic Feasibility Studies
P a g e | 132
Figure 45: Waitrose biomass CHP installation at East Cowes (Source: SEWF)
A6.7 CAPITAL EXPENDITURE, GREEN ENERGY SUBSIDIES AND FUTURE ENERGY PRICES
A6.7.1 Capital costs, access to capital & expected rates of return For the purposes of this project we have been asked to utilise a base level financial performance of 7% IRR.
This is the existing rate of return of the EHDC property portfolio.
This has been fed into our financial modelling as an indicative cost of capital. As far as access to capital is
concerned, we have carried out our analysis on the basis that capital is available from EHDC internal
sources and/or low cost borrowing can be obtained from sources such as the Public Works Loan Board.
A6.7.2 Feed-In-Tariff (FIT) This system of tariffs was introduced to encourage the market for smaller scale renewable power
producing technologies. Solar photovoltaic (PV) systems have been the biggest recipients of FIT monies
and the tariff rates have been slashed to a fraction of the initial rates when these were first introduced.
Smaller scale wind power, and Anaerobic Digestion have also been supported under this subsidy scheme.
A6.7.3 Renewable Heat Incentive (RHI) This system of tariff support was introduced in November 2011 to develop the market for technologies
such as biomass heating, heat pumps (water, ground and air), solar water heating, and latterly bio-
methane. The big success amongst these technologies to date has been the small and medium biomass
heating market (up to 999kW(th). Over 95% of monies and capacity has been in this sector. Rapid tariff
reductions (degression) have slowed the sub-200kW(th) market, though the medium biomass tariffs have
remained steady.
A6.7.4 Other low carbon renewable energy incentives There are a few other financial incentives that help encourage low-carbon heating technologies. These
include the CRC scheme, enhanced capital allowances (ECAs) for high efficiency and low carbon
technologies, and some business rate exemptions for low-carbon technologies such as gas CHP. The CRC
Energy Efficiency scheme is meant to encourage larger energy using companies and the public sector to
improve the efficiency of buildings and therefore reduce carbon emissions.
In each compliance year, an organisation that has registered for CRC needs to do the following:

EHDC HNDU: Heat Techno-Economic Feasibility Studies
P a g e | 133
Collate information about its energy supplies.
Submit a report about its energy supplies.
Buy and surrender allowances equal to the CO2 emissions it generated.
Tell the Environment Agency about changes to its organisation that could affect its registration
(designated changes).
Keep records about its energy supplies and organisation in an evidence pack.

EHDC HNDU: Heat Techno-Economic Feasibility Studies
P a g e | 134
APPENDIX 7: COMPARISON BETWEEN ECONOMIC ASSUMPTIONS USED IN
PHASE I HNDU STUDY AND THIS STUDY
A7.1 GAS BOILER EFFICIENCY Phase I Report:
o Recommended minimum energy efficiency standards for building services, contained
within the Non-domestic Building Services Compliance Guide (2013 edition) states that
the seasonal efficiency of gas boilers is between 91% and 86%.
This report:
o We differentiate between laboratory tested gas boiler efficiencies and the seasonal
average efficiency of ‘real world’ boilers. For the latter, field studies suggest a seasonal
average efficiency of 85% is appropriate. A study by the Energy Saving Trust (EST) into
both standard and condensing gas boilers confirms this efficiency level. A study sponsored
by DECC, when seeking to establish the environmental benefits of switching away from
grid power and gas boilers to a CHP system suggests that 80% efficiency is a reliable figure.
We think this is on the low side for new gas condensing boilers and we therefore assume
85%.
A7.2 BIOMASS BOILER EFFICIENCY Phase I Report:
o Recommended minimum energy efficiency standards for building services, contained
within the Non-domestic Building Services Compliance Guide (2013 edition) states that
the seasonal efficiency of biomass boiler in new buildings is 75%.
This report:
o We think this is a low efficiency figure. The Guide simply offers ‘minimum’ standards for
biomass boilers below 50kW, i.e. domestic scale. This is not relevant for commercial scale
biomass boilers working with the much higher heat loads in this study. For a well-
designed biomass system, appropriately sized, linked to a good accumulator tank and
control system, a figure in the 80-85% range is more realistic.
A7.3 BUILD RATE Phase I Report:
o Where the build rate is not known this has been assumed to be 100 dwellings per annum.
This report:
o The information supplied to use suggests a faster build rate in Whitehill & Bordon and
Alton.
A7.4 BOILER AND GAS-CHP SIZE Phase I Report:
o The split between the space heating and hot water demand of the developments are
assumed to be 60% and 40% respectively. Where there is a larger heat source such as a

EHDC HNDU: Heat Techno-Economic Feasibility Studies
P a g e | 135
swimming pool, this has been recalibrated to be 20% and 80%, due to increased hot water
demands.
This report:
o We have assumed that domestic hot water use will be higher at around 72-74%. If we
base our space heating loads on Part L 2013, then this component of the total heat load
(space heat plus hot water) becomes far more significant. If the homes built fall below
the target rate of 54.26 kWh/m2 then the ratio will change and become more balanced.
Note that for mixed-use developments the ratio will be different again – this needs to be
looked at again once the final mix of buildings types, use and occupancy is confirmed.
A7.5 CHP EFFICIENCY Phase I Report:
o The thermal and electrical efficiencies of the CHP system have been taken from the
Department of Energy & Climate Change - CHP Technology - A detailed Guide for CHP
developers 2008.
This report:
o Based on this study and real world experience, we have used a figure of 80%.
A7.6 BIOMASS FUEL COST Phase I Report:
o This figure has been taken from data available on the Biomass Energy Centre website
(accessed July 2015).
This report:
o This is not a good source for wood fuel data as the site has not been updated for the past
18 months and the figures on the site do not reflect real world commercial data. The
delivered cost of wood chip fuel will vary according to the volume of fuel in each delivery,
the distance of the fuel delivery, the type and source of wood fuel (which varies between
woodland management materials and arboricultural wood) and the length of fuel
contracts. We have used a central price of 3p/kWh for Penns Place-Taro and Alton, and
2.5p/kWh for Whitehill & Bordon. Access is good in all three locations and would allow
large volume deliveries (up to 85m3 with walking floor articulated vehicles). The lower
price for Whitehill & Bordon reflects the use of arboriculture materials at high volumes.
A7.7 HEAT SALES PRICE Phase I Report:
o This has been assumed to be 6 pence per kilowatt therm. This has been assumed based
on data taken from DECC and the Domestic Renewable Heat Incentive – Domestic RHI
payment calculator report calculator53.
This report:
o We agree with this assumption for domestic heat sales, which reflects a domestic gas
price of 5p/kWh plus efficiency losses of 15%. For non-domestic heat sales, we assume
3.23p/kWh when boiler efficiency losses are factored in. 53
Available from https://renewable-heat-calculator.service.gov.uk/

EHDC HNDU: Heat Techno-Economic Feasibility Studies
P a g e | 136
A7.8 GAS PRICE Phase I Report:
o This has been assumed to be 3.5 pence per kilowatt hour. This is to provide some
flexibility due to the difference in price per kilowatt hour paid domestically (5p/kWh) and
commercially (2.5p/kWh).
This report:
o Based on current gas prices and contracts by EHDC and ‘Places for People’, we have used
a figure of 2.75p/kWh (excluding VAT) for non-domestic gas, and 5p/kWh for domestic
gas supplies.
A7.9 ELECTRICITY PRICE Phase I Report:
o The purchase price of electricity has been assumed to be 10 pence per kilowatt hour. This
is to provide some flexibility due to the difference in price per kilowatt hour paid
domestically (15p/kWh) and commercially (9p/kWh).
This report:
o Based on recent prices paid by EHDC, we assume a price of 11p/kWh.
A7.10 WHOLESALE PRICE OF ELECTRICITY (FROM GAS-CHP) Phase I Report:
o The heat sale price of electricity has been assumed to be 4 pence per kilowatt hour, this
has been taken from www.apxgroup.com, who are one of Europe's premier providers of
power exchange for the wholesale market. When there is an opportunity to utilise the
electricity generated from the CHP within a Local Authority owned/operated building, the
sales price in the model is increased to match that of the purchase price, as It is assumed
that the electricity will be sold through a 'private wire' agreement.
This report:
o We are not clear about the assumption and basis of these here. With power from a CHP
unit where the power is entirely used in the buildings where it is generated, the value
must be a balance between the alternative of imported power and the need to pay back
the investment and running costs of the CHP unit.
o For CHP produced heat, in the case of Taro Leisure Centre, the heat price needs to reflect
the alternative costs of buying in gas and combusting this in gas boilers (c.3.23p/kWh
when boiler efficiencies are accounted for).
A7.11 OPERATION AND MAINTENANCE COSTS Phase I Report:
o These have been fixed at 1% of Capex for all of the models. It should be noted that this is
highly likely to increase within the biomass scenarios due to a greater likely of locally
fluctuating fuel prices when compared to national grid gas prices.
This report:
o While the 1% figure may be appropriate for gas boilers, experience suggests a higher
figure of 2-3% for biomass boilers, and a much higher figure for gas-CHP systems.

EHDC HNDU: Heat Techno-Economic Feasibility Studies
P a g e | 137
Commercial data suggests that 5-7% per annum is a typical figure for a full service, call-
out and spares contract. This includes a major engine rebuild every 7 years.
A7.12 NON-DOMESTIC CONNECTION CHARGES Phase I Report:
o CIBSE Guide F – Energy Efficiency in Buildings Good Practice 2012 the energy consumption
for a typical office building is 97/kWh/m2. Which when combined with an assumed load
factor of 20% (rentable space/usable space) and a boiler cost of £90.93/kWh provides a
connection charge of £9.25/m2. This has been taken from University of Exeter CHP study.
This report:
o We agree with this general approach, though we have also looked at the real world costs
of connection via commercial heat exchangers, gas supply (or savings from this), and
pipework for a range of buildings and building types. We then added a generous margin.
For Whitehill and Bordon this approach came in at c.25% less than the PBA figure above.
Whilst we have retained the PBA figure we feel this is conservative and we would
therefore expect savings. For example, based on recent tenders, the costs of a 200kW
heat exchanger, heat meter and install (mechanical and electrical) including valves and
controls for a medium sized office type building should be of the order of £9-£12,000
including labour.
A7.13 DOMESTIC CONNECTION CHARGES Phase I Report:
o These are a variable which can be altered within the model. To enable a comparison
between each of the models, a £3000 connection charge per household has been used.
This report:
o We essentially need to assume full district heating network connection costs, including
pipework into the house, and a heat exchanger unit including a heat meter. We then
subtracted the costs of bringing in gas to the house (currently £660/house) and the
savings from not needing a gas boiler. The latter we assume to be £1,500 fully installed
(bulk order for multiple dwellings). Hence an average figure of £2,500 is assumed, i.e.
£4,700 gross less costs of bringing in gas and a new gas boiler.

EHDC HNDU: Heat Techno-Economic Feasibility Studies
P a g e | 138
APPENDIX 8: INDICATIVE DESIGN FOR ENERGY CENTRE AT PENNS PLACE
Figure 46: Indicative design for biomass energy centre for Penns Place (Source: Rural Energy Ltd for SEWF Ltd)