#Earthquake: Twitter as a Distributed Sensor System
24
#Earthquake: Twitter as a Distributed Sensor System Andrew Crooks,* Arie Croitoru, † Anthony Stefanidis † and Jacek Radzikowski † *Department of Computational Social Science, George Mason University † Center for Geospatial Intelligence and Department of Geography and Geoinformation Science, George Mason University Abstract Social media feeds are rapidly emerging as a novel avenue for the contribution and dissemination of infor- mation that is often geographic. Their content often includes references to events occurring at, or affecting specific locations. Within this article we analyze the spatial and temporal characteristics of the twitter feed activity responding to a 5.8 magnitude earthquake which occurred on the East Coast of the United States (US) on August 23, 2011. We argue that these feeds represent a hybrid form of a sensor system that allows for the identification and localization of the impact area of the event. By contrasting this with com- parable content collected through the dedicated crowdsourcing ‘Did You Feel It?’ (DYFI) website of the U.S. Geological Survey we assess the potential of the use of harvested social media content for event monitoring. The experiments support the notion that people act as sensors to give us comparable results in a timely manner, and can complement other sources of data to enhance our situational awareness and improve our understanding and response to such events. 1 Introduction Enabled by Web 2.0, ubiquitous computing, and corresponding technological advancements, social media has drastically altered the concepts of information contribution, dissemination, and exchange (Kaplan and Haenlein 2010). By empowering the general public to publish and distribute user-generated content, social media has enabled them to bypass the need to utilize centralized, authoritative agencies (e.g. news organizations). In a sense, this makes virtually every citizen a potential contributor or user of information. The power of social media to communicate information of societal importance has been demonstrated very effectively during the last few years. One could argue that a defining moment in this direction was the coordinated use of Twitter, Facebook, and YouTube by Iranian protesters in June 2009 to communicate to a global audience the state of unrest in the streets of Tehran, bypassing the ruling regime’s restrictions on information dissemination (Newsweek 2009). A comparable situation on a larger geographic scale was witnessed in early 2011 during the Arab Spring events in North Africa (Christensen 2011, Howard et al. 2011). More recently social media has been heavily involved during the Occupy Wall Street protests in the U.S. (Huffington Post 2011, Christian Science Monitor 2011). In a sense, such technology enables the crowds to publicly broadcast information, on a scale never seen before. Address for correspondence: Andrew Crooks, Department of Computational Social Science, George Mason University. Research I, CSC Suite, Level 3, 4400 University Drive, Fairfax, VA 22030, USA. E-mail: [email protected] Acknowledgments: We would like to acknowledge Eric Fischer and Maksim Tsvetovat for their assistance. Research Article Transactions in GIS, 2013, 17(1): 124–147 © 2012 Blackwell Publishing Ltd doi: 10.1111/j.1467-9671.2012.01359.x
Transcript of #Earthquake: Twitter as a Distributed Sensor System

#Earthquake: Twitter as a Distributed Sensor System
Andrew Crooks,* Arie Croitoru,† Anthony Stefanidis† andJacek Radzikowski†
*Department of Computational Social Science, George Mason University†Center for Geospatial Intelligence and Department of Geography and GeoinformationScience, George Mason University
AbstractSocial media feeds are rapidly emerging as a novel avenue for the contribution and dissemination of infor-mation that is often geographic. Their content often includes references to events occurring at, or affectingspecific locations. Within this article we analyze the spatial and temporal characteristics of the twitter feedactivity responding to a 5.8 magnitude earthquake which occurred on the East Coast of the United States(US) on August 23, 2011. We argue that these feeds represent a hybrid form of a sensor system thatallows for the identification and localization of the impact area of the event. By contrasting this with com-parable content collected through the dedicated crowdsourcing ‘Did You Feel It?’ (DYFI) website of theU.S. Geological Survey we assess the potential of the use of harvested social media content for eventmonitoring. The experiments support the notion that people act as sensors to give us comparable resultsin a timely manner, and can complement other sources of data to enhance our situational awareness andimprove our understanding and response to such events.
1 Introduction
Enabled by Web 2.0, ubiquitous computing, and corresponding technological advancements,social media has drastically altered the concepts of information contribution, dissemination,and exchange (Kaplan and Haenlein 2010). By empowering the general public to publish anddistribute user-generated content, social media has enabled them to bypass the need to utilizecentralized, authoritative agencies (e.g. news organizations). In a sense, this makes virtuallyevery citizen a potential contributor or user of information. The power of social media tocommunicate information of societal importance has been demonstrated very effectivelyduring the last few years. One could argue that a defining moment in this direction was thecoordinated use of Twitter, Facebook, and YouTube by Iranian protesters in June 2009 tocommunicate to a global audience the state of unrest in the streets of Tehran, bypassing theruling regime’s restrictions on information dissemination (Newsweek 2009). A comparablesituation on a larger geographic scale was witnessed in early 2011 during the Arab Springevents in North Africa (Christensen 2011, Howard et al. 2011). More recently social mediahas been heavily involved during the Occupy Wall Street protests in the U.S. (Huffington Post2011, Christian Science Monitor 2011). In a sense, such technology enables the crowds topublicly broadcast information, on a scale never seen before.
Address for correspondence: Andrew Crooks, Department of Computational Social Science, George Mason University. Research I, CSCSuite, Level 3, 4400 University Drive, Fairfax, VA 22030, USA. E-mail: [email protected]: We would like to acknowledge Eric Fischer and Maksim Tsvetovat for their assistance.
bs_bs_banner
Research Article Transactions in GIS, 2013, 17(1): 124–147
© 2012 Blackwell Publishing Ltd doi: 10.1111/j.1467-9671.2012.01359.x

The rise in Web 2.0 technology has also enabled crowdsourcing (Howe 2008), the delega-tion of tasks traditionally performed by professionals to the community at large. We can iden-tify numerous geographic applications that benefit from this. For example, car navigation HDTrafficTM from TomTom (www.tomtom.com/hdtraffic) provides real time traffic information,updated every three minutes, while the Waze (http://www.waze.com/) application allows acommunity of users to exchange geographically explicit information such as traffic incidents inreal time. In both instances the quality of information depends on the level of participationand the number of users. In the related area of public transportation, citizens are crowdsourc-ing information on bus arrival time through Tiramisu (Steinfeld et al. 2011). Furthermore,crowds are used to detect potholes in roads (see for example, SeeClickFix (http://www.seeclickflix.com) or FixMyStreet (http://www.fixmystreet.com) or to report a variety oflocal problems ranging from poor road conditions and graffiti to background noise levels intheir neighborhoods, by using GPS-enabled smart phones (Demirbas et al. 2010). A sensor-driven variant of these applications is Street Bump (http://www.appbrain.com/app/street-bump-%28alpha%29/com.citizapps.streetbump) which takes advantage of accelerometers andGPS sensors embedded in smart phones to automatically capture and report street pothole andbump information. Conceptually, this falls under the ‘Participatory Sensing’ framework,whereby ad-hoc sensor networks are formed taking advantage of sensors embedded in mobiledevices, to enable public and professional users to gather, analyze and share local information(Burke et al. 2006). Currently there exists a variety of applications whereby sensor measure-ments are crowdsourced, including Japan Geigermap (http://japan.failedrobot.com) that visu-alizes crowdsourced radiation Geiger counter readings from across Japan, or the contributionof weather data in Weather Underground (http://www.wunderground.com). Participatorysensing still adheres to the Volunteered Geographic information (VGI, Goodchild 2007) prin-ciple of the general public contributing on purpose particular pieces of geographic informa-tion, most frequently towards defined tasks.
Like the crowdsourcing systems presented above, social media feeds often convey geo-graphic information, as people frequently comment on events happening at or affecting theirlocation, or refer to locations that represent momentary social hotspots (e.g. by referring to thelocation of a protest, or to the area hit by a natural disaster). Nevertheless, this represents adeviation from the well-established concept of crowdsourcing in geographic applications (Fritzet al. 2009, Goodchild and Glennon 2010): unlike Wikimapia or OpenStreetMap, socialmedia feeds are not a vehicle for citizens to explicitly and purposefully contribute geographicinformation to update or expand geographic databases. Instead, the geographic content isembedded in the contributors’ comments, and has to be harvested and analyzed before it canbe used. This type of geographic information that can be harvested from social media feedscould be referred to as Ambient Geographic Information (AGI, Stefanidis et al. 2012) and rep-resents an extension of the concept of VGI. One could argue that whereas VGI is primarilycrowdsourcing, with specific tasks outsourced to the public at large, AGI is crowdharvesting,with the general public broadcasting information that can be harvested in a meaningfulmanner.
The proliferation of social media feeds and corresponding AGI content fosters the emer-gence of micro-blogging as a new type of a distributed sensor system, with citizen bloggersacting as sensors, and their comments (e.g. in the form of tweets) conveying relevant informa-tion, often with a corresponding geographic footprint. In this article we offer an analysis of theperformance of micro-blogging as a sensor system for geographic event detection by consider-ing the Mineral, VA earthquake of August 23, 2011 as a sample case. Some early publicationsin this emerging research direction have addressed the use of Twitter content to generate map
#Earthquake: Twitter as a Distributed Sensor System 125
© 2012 Blackwell Publishing Ltd Transactions in GIS, 2013, 17(1)

mashups to support collaborative real-time mapping (Field and O’Brien 2010), and providedan overview of emerging opportunities for harvesting geospatial content (Stefanidis et al.2012). Furthermore, Earle et al. (2010) attempted assessing how fast tweeters reacted to thesmaller (4.3 magnitude) and much more localized earthquake of Morgan Hill, CA in March,2009. Our work in this article will extend this emerging research direction, by analyzing themanner in which earthquake information was reported in the blogosphere, in order to identifyspatial and temporal characteristics of this information dissemination avenue. This is a criticalstep towards assessing the value of harvesting geospatial information from social media feedsfor event detection and analysis. We consider in particular Twitter as a representative samplesocial media environment for our work. In our analysis we will also compare Twitter reactionto the event (which represents a form of AGI) to the VGI content contributed by the publicthrough the dedicated ‘Did You Feel It?’ (DYFI) website of the U.S. Geological Survey (USGS).DYFI builds upon the work of Wald et al. (1999) and represents a prototypical crowdsourcingwebsite (http://earthquake.usgs.gov/earthquakes/dyfi/), with a focus on earthquakes. It pro-vides a web portal to collect citizen responses to earthquakes, and integrates this informationto model earthquake activity (Atkinson and Wald 2007). By investigating a large earthquake(5.8 magnitude) with a substantial impact area in the East Coast of America, by analyzing thespatial and temporal characteristics of the Twitter community response to it, and by compar-ing this to crowdsourced information, our work extends our understanding of the value of thisnovel type of geospatial information.
The article is organized as follows. In Section 2 we make a case for an analogy betweensocial media feeds and sensor systems. In Section 3 we discuss information harvesting andanalysis from social media feeds, followed by a discussion on the geolocation content of tweetsin Section 4. In Section 5 we provide an assessment of the role of micro-blogging as a geosen-sor system, using the Virginia earthquake data. Finally, in Section 6 we offer our outlookassessment.
2 Social Media Feeds as Sensor Systems
Quite interestingly, early work to link Twitter and sensor systems started from the oppositedirection than the one we pursue. For example, Demirbas et al. (2010) presented a systemarchitecture to publish sensor observations over Twitter. In the same direction, the UK snow-map Twitter mashup (http://uksnowmap.com/) crowdsources snow coverage in the UK, withTwitter contributors using a particular tweet format (containing a specific hashtag and a loca-tion in the form of a postcode) in order to report snow fall in their vicinity. That informationis then aggregated to generate snow coverage maps. Again, this is an example of crowdsourc-ing that simply makes use of Twitter to contribute particular information.
However, the argument that we present here is its reverse, namely that Twitter is a formof a hybrid sensor system. When citizens communicate information through micro-bloggingthey act in many ways just like a sensor would: something is catching their attention, andthey report it. Unlike sensors though, this information typically is not provided directly inthe form of a quantified measurement (e.g. ‘42.5 degrees Fahrenheit’), but it is often hiddenwithin the text of a message (e.g. ‘yesterday was a cold day in London’). Furthermore,unlike typical sensors that always operate on specific bands of the spectrums, or collect spe-cific types of measurements, humans operate in a wide range of the socio-cultural spectrum,commenting in one message on a natural phenomenon, and in the next on a political issue.Yet despite these slight variations, human bloggers operate in a manner comparable tosensors in a sensor network.
126 A Crooks, A Croitoru, A Stefanidis and J Radzikowski
© 2012 Blackwell Publishing Ltd Transactions in GIS, 2013, 17(1)

If we consider the typical architecture of individual sensor nodes within wireless sensornetworks (WSN), we can see that a prototypical node comprises certain key elements (Akyildizet al. 2002) as shown in Figure 1:
• One or more dedicated sensors to collect local data for monitoring the specific types ofphenomena that the WSN is designed to observe;
• A microcontroller processing unit to control and execute the basic functionalities of thesensor;
• A transceiver to communicate with other nodes in the WSN and thus ensure informationflow within the network;
• Data storage capability, for future retrieval and analysis; and of course,• An energy source to support its long term operation.
In a micro-blogging analogy to the physical sensor node, the human blogger is the sensorand the microcontroller: she collects the information that she considers remarkable and impor-tant to communicate (Sternberg 2009), in order to document one’s life, provide a commentary,or to build a community (Nardi et al. 2004, Java et al. 2009, Naaman et al. 2010), and pub-lishes this information. In this example, the transceiver is the actual micro-blogging applica-tion (e.g. Twitter) that enables the dissemination of this information among the other nodes ofthe network (the remainder of the Twitter community). The presence of an energy source isnot important in this particular situation, as users use a variety of modalities, ranging fromhandhelds to laptops and desktops, which are presumably free of the limitations presentedwhen motes are deployed in remote, often inaccessible locations (Selavo et al. 2007). Lastly,data storage is handled by the micro-blogging site itself, as this is where the data are actuallystored and reside.
In comparison to standard WSN deployments, where the number of nodes and the areathey cover are both rather limited, micro-blogging offers massive numbers of nodes, and prac-tically worldwide distribution. In the spring of 2011, Twitter announced that it had over 200million accounts, distributed all over the world. Among these accounts, it is estimated thatTwitter has 100 million active users, logging in at least once a month, and 50 million userswho do so daily. Furthermore, its #numbers entry (http://blog.twitter.com/2011/03/numbers.html) indicates that a record 572,000 new accounts were created on a single day(March 12, 2011, the day after the Fukushima earthquake and resulting nuclear disaster),while an average of 140 million tweets are sent daily, resulting in a billion tweets sent everyweek. As a measure of reference it is worth mentioning that Facebook has stated that 600million people visit it each month, with half of them using it daily.
However, a key distinction between micro-blogging and wireless sensor networks is the lackin the former of an explicit application-serving cooperative framework that is a characteristic of
Figure 1 Components of a prototypical sensor node
#Earthquake: Twitter as a Distributed Sensor System 127
© 2012 Blackwell Publishing Ltd Transactions in GIS, 2013, 17(1)

the latter (Akyildiz et al. 2002). While there is interaction between Twitter users (e.g. throughretweeting or following) and this can lead to the establishment of geographically definedcomplex social network groups (see for example, Stefanidis et al. 2012), the collaboration ofthese groups tends to be ad-hoc and not as rapid as in traditional wireless sensor networks(Honey and Herring 2009, Zhao and Rosson 2009). Nevertheless, as we assert later in thisarticle, micro-blogging emerges as a hybrid form of a distributed sensor system, supporting keyoperations like the effective monitoring of natural events.
3 Harvesting and Analyzing Social Media Feeds
Harvesting information from social media feeds is in essence a web-mining process (Kosalaand Blockeel 2000, Sakaki et al. 2010, Russell 2011). It entails in general three operations:extracting data from the data providers (various social media servers) via application program-ming interfaces (APIs); parsing, integrating, and storing these data in a resident database; andthen analyzing these data to extract information of interest.
There exist a number of tools that perform parts of these processes, such as 140 kit(http://140kit.com/) or Twapperkeeper, (http://twapperkeeper.com/) but these are limited intheir scalability with respect to large datasets. Sites such as Ushahidi (http://www.ushahidi.com/) also provide a means to collect social media feeds and disseminate this information overthe web. However, currently available tools offer limited capabilities to add context to content,or to support detailed analysis, thus forcing the development of custom systems to perform theabovementioned three operations.
Original social media feeds can be retrieved from source data providers through queries.This entails submitting a query in the form of an http request and receiving in response data inXML format (e.g. Atom or RSS). The query parameters may be for example, based on loca-tion (e.g. specifying an area of interest to which the feed is related), time (e.g. specifying aperiod of interest), content (e.g. specifying keywords or hashtags), or even user handle/ID. Inresponse to these queries, and depending on the characteristics of the information provided bythe service, we can receive from the server just metadata or metadata and actual data. A rep-resentative example of the first case is Flickr, where the query result contains exclusively meta-data information (e.g. author, time, and geolocation when available), and information on howto access the actual image itself. Twitter is a representative example of the second, where thedata received in response to a query are actual tweets and associated metadata (e.g. user infor-mation, time of tweet publication, geolocation when available, and information on whetherthis particular tweet is in response to or retweet of an earlier message).
Once this information is harvested from the social media server it can be parsed tobecome part of a local database (e.g. implemented using ProstgreSQL), thus creating a localmirror of the content of the original server for the entries specified by our queries. Dependingon the subject, the queries may be periodic, or may be intensified during episodes of crisis.While the information harvested from social media in this manner is not explicitly geographic,it does include implicit geospatial content, thus rendering it suitable for geographic analysis.
The diverse content of these datasets and of user-contributed web-content in general hasintroduced novel applications for event detection and contribution validation. In the work thatis most closely related to our analysis, Hyvarinen and Saltikoff (2010) focused on imagery con-tributed to Flickr, and addressed the quality of the provided metadata in terms of its descrip-tive content (confirming for example that over 70% of the contributed imagery labeled as hailactually depicts hailstorm), positional accuracy (assessing it to be close to 1–2 km for land-
128 A Crooks, A Croitoru, A Stefanidis and J Radzikowski
© 2012 Blackwell Publishing Ltd Transactions in GIS, 2013, 17(1)

mark imagery), and temporal accuracy (less than 15 minutes for 90% of all contributedimagery, and substantially less for automatically populated metadata, e.g. when contributionsare made using handheld devices). They also performed a very limited analysis of Flickrimagery using two images of hailstorms and confirming them with radar data for the area andtime they depict.
The temporal, spatial, and social dynamics of Twitter activity during a major forest firewere addressed by De Longueville et al. (2009) in an effort to investigate the performance ofLocation-Based Social Networks (LBSN) as information creation and dissemination platforms.In the same direction, an analysis of Twitter activity from people on the ground during twoemergency events (grass fires and river flooding) indicated the possibility of increased situ-ational awareness through it (Vieweg et al. 2010). This issue was also addressed by Singh et al.(2010) who introduced the concept of social pixels and social imagery as visualizations of pat-terns of user interest. Furthermore, MacEachren et al. (2011) presented a geovisual analyticsapproach to aggregate social Twitter-derived information in place-time-concept indexingschemes, for enhanced situational awareness.
Social media feeds have been used quite extensively for event detection from Web andSocial Media (WSM) information (Brownstein et al. 2009, Sakaki et al. 2010, Okasaki andMatsuo 2012). Notable applications addressed the early detection of contagious outbreaks bymonitoring influenza-related blogging trends during the emergence of the U.S. 2008 flu season(Corley et al. 2010), and the analysis of the structure of the social network and correspondingrelationships to improve our prediction of the spread of these outbreaks (Christakis andFowler 2010). In the same application domain of bioinformatics, Ginsberg et al. (2009) usedweb-contributed information, in the form of search engine query data, to detect influenza epi-demic outbreaks, and showed that their approach beat the standard methods used by theCenters for Disease Control to monitor these outbreaks.
4 Geolocation Content of Twitter Feeds
Geolocation information in tweets can be provided directly by the contributing bloggers, ifthey decide to make this information available, or it can be deduced from IP addresses usingany of the IP geolocation solutions (see Eriksson et al. 2010, Poese et al. 2011). In this articlewe are focusing on geolocation information that is contributed either directly by the user orprovided through the client application.
This geolocation information may be available either in the form of precise coordinates asshown in Figure 2, or in a descriptive manner (e.g. listing a city name, as shown in Figure 3). Itis typically harvested from Twitter using the capabilities provided by the communication pro-tocol linking the client to it. For example, the World Wide Web Consortium (W3C) Geoloca-tion API enables scripting code to access device information from web browsers of any web-capable device (e.g. a mobile phone or a laptop; see Doty and Wilde 2010). In this wayinformation is collected in a dynamic mode, reflecting the actual location from where a tweetwas sent. In addition to this, geolocation information can also be harvested from the contentof users’ profiles, but this is less reliable as it is static and does not necessarily reflect user loca-tion at the moment that the tweet was sent.
Statistics on the percentage of geolocatable tweets vary from one part of the world toanother, depending on the prevalence of GPS-equipped smartphones, and to cultural accept-ance of the location information option in Twitter (Java et al. 2009, Miller and Wortham2010, Hecht et al. 2011). Early on Java et al. (2009) had reported that approximately half of
#Earthquake: Twitter as a Distributed Sensor System 129
© 2012 Blackwell Publishing Ltd Transactions in GIS, 2013, 17(1)

Twitter users in their study provided some location information in the corresponding entry oftheir profiles (either coordinates or description). More recently Cheng et al. (2010) reportedthat 5% of users in their study listed actual coordinates, with another 21% of users listinglocational information at the city level, while Hecht et al. (2011) reported that two out ofthree users in their study provided such geolocation information. Stefanidis et al. (2012)reported that approximately 16% of the Twitter feeds in their experiments had detailed loca-tion information with it in the form of coordinates, while another 45% of the tweets they col-lected had some geolocation information at coarser granularity (e.g. the city level). Thesevariations in the availability of geolocation information tend to be geographic in nature, asproviding precise geolocational information is common practice when using mobile devices topost. Accordingly, one can reasonably argue that precise geolocation information will be morefrequently available in areas where the latest mobile technology is more easily and rapidlyadopted.
Attempting to assess the granularity of descriptive geolocation information, studies in thesocial media community indicate that the large majority of users who provide such informa-
Figure 2 Example of a geolocated tweet. At the top we see the tweet as it appears on a follower’sstream, and this is the Twitter message that is actually displayed in the browser. At the bottom we seehighlights from the information retrieved through the search API for this particular tweet, includingits geolocation information (marked by the box) in the form of precise coordinates. The coordinatescorrespond to a location in the Fairview borough of New Jersey
Figure 3 An example of descriptive geolocation information recovered for another tweet similar tothe one presented in Figure 2
130 A Crooks, A Croitoru, A Stefanidis and J Radzikowski
© 2012 Blackwell Publishing Ltd Transactions in GIS, 2013, 17(1)

tion tend to gravitate towards listing their city as their location (Ludford et al. 2007, Hechtet al. 2011). Furthermore, recent work by Cheng et al. (2010) showed that even without anyIP or geolocation information provided, users’ location could often be estimated at the citylevel based purely on the content of their messages. Comparable work has been performed onpredicting the location of Flickr users through an analysis of their contributions’ content(Popescu and Grefenstete 2010), and of Facebook users through an analysis of their socialnetwork (Backstrom et al. 2010).
5 Twitter Response to the Mineral, VA Earthquake
In order to assess the performance of micro-blogging and AGI as a sensor system for geo-graphic event detection we use a major earthquake as a test case. The August 23, 2011 earth-quake that is the subject of this analysis had an epicenter at 37.936° N, 77.933° W, in therural Louisa County (VA), 8 km SSW of Mineral, VA (135 km SW of Washington, DC). Thismagnitude 5.8 earthquake struck at 17:51:04 UTC time (13:51 local time), and was the largestearthquake to hit the Eastern part of the U.S. since 1944. According to the USGS this was themost widely felt earthquake in U.S. history (http://www.dmme.virginia.gov/DMR3/va_5.8_earthquake.shtml) as it impacted the very densely populated East Coast of the U.S.,and was felt from central Georgia in the South to central Maine in the North, and from theEast Coast all the way to Illinois in the West.
The Mineral, VA earthquake is a particularly suitable event for our analysis as it is thelargest magnitude earthquake to hit the eastern half of the U.S. in more than half a century.Accordingly, it has a more substantial impact on the locals than comparable events inearthquake-prone areas like California, making the local society more reactionary to thisevent. Furthermore, the event affected a large geographic area, including major metropolitancenters, thus providing a substantial sample to perform our analysis.
5.1 Dataset and Data Streaming Rates
We analyze the response to this earthquake in Twitter by harvesting a 1% random sample ofTwitter feeds directly from the Twitter API1 in the period immediately following this event, andwe mine the data to find references to the earthquake through keyword (earthquake or earthand quake) and hashtag search (#earthquake or #quake). Hashtags represent a community-adopted means to add context to tweets by using them to label terms of particular significance.Practically, they serve as user-driven tools through which real-life events are assigned a briefblogosphere reference term.
We are interested in an assessment of the performance of Twitter feeds as a novel type ofgeosensor network (Nittel et al. 2008) and accordingly we consider only geolocated tweets.Furthermore, we are interested in tweets initiated within the contiguous 48 states and thus fil-tered out any contributions from outside this region’s latitude and longitude extent. From our1% sample of tweets over a period of 8 hours immediately following the earthquake we havecollected 144,892 tweets with a reference to earthquake, out of which 21,362 were geolocatedtweets with precise coordinate information (for an average of 2,670 such geolocated tweetsper hour) and this is the data corpus we use in this analysis. In this particular dataset the pre-cisely geolocated tweets represent 14.7% of the tweets with a reference to the earthquake. It isworth mentioning that of these geolocated tweets, 1,558 (7.3%) were retweets, a process thatis typically faster than composing a new one.
#Earthquake: Twitter as a Distributed Sensor System 131
© 2012 Blackwell Publishing Ltd Transactions in GIS, 2013, 17(1)

Table 1 provides a summary of the manner in which this information was streaming inTwitter. It is worth noting that the first tweet in our data corpus arrived 54 seconds after theevent (at 17:51:58 UTC) from location Laurel, VA (approximately 50 Km from the epicenter)and its content was: “Earthquake in Richmond”. In comparison, Earle et al. (2010) reportedthat the first tweet after the March 30, 2009, Morgan Hill, CA earthquake arrived only 19seconds after that event. An argument can be made that the faster response recorded inMorgan Hill is explained by the fact that Californian residents are very familiar with earth-quakes and thus use their past experience of comparable events to respond quicker to newincidents, whereas the East Coast public is not as familiar and its response is slower. Work inpsychology fully supports this notion, as it has been shown that repeated exposure to a stimu-lus leads to the development of processing fluency for this particular stimulus (Nessler et al.2005), making our brain identify it faster, a process that eventually leads to habituation(Yamaguchi et al. 2004). Such enhanced memory mechanisms have also been shown to be acti-vated in response to the frequent exposure to otherwise traumatic or critical incidents (Dyre-grov et al. 2000) as would be the case with the earthquake tremors.
Within 2 minutes of the event we approached 100 tweets, while within 5 minutes we areapproaching 1,000. As our data corpus is from a random 1% sample of Twitter it is reason-able to expect that these numbers should be multiplied by 100 if we are to estimate the overallresponse to the event in the Twitter community, raising these figures to close to 10,000 tweetswithin 2 minutes, and close to 100,000 within 5 minutes which, as we will see in Section 6, iscomparable to the number of reports contributed to the USGS DYFI website over a period ofnearly 8 hours after the earthquake.
5.2 Reaction Time and Response Patterns as Function of Distance from Epicenter andImpact Area Detection
While Table 1 shows the temporal trend in geolocated data streaming from Twitter, it does notconvey information on the originating locations of these tweets. In this section we investigate
Table 1 A list of geolocated Twitter reports of earthquake during the first hour of the earthquake(from among our data corpus). The first column lists time period in minutes and seconds. Thesecond column lists the number of precisely geolocated tweets referring to the event at distincttime intervals that are part of our data corpus (and the rate per minute of these tweets). The thirdcolumn lists the cumulative number of such tweets (from the event time)
Time period (min., sec.)
Geolocated earthquake tweetsCumulative numberof tweetsNumber Rate per min.
00m01s – 01m00s 2 2 201m01s – 02m00s 91 91 9302m01s – 03m00s 221 221 31403m01s – 04m00s 281 281 59504m01s – 05m00s 324 324 91905m01s – 10m00s 1142 228 206110m01s – 60m00s 11,668 233 13,729
132 A Crooks, A Croitoru, A Stefanidis and J Radzikowski
© 2012 Blackwell Publishing Ltd Transactions in GIS, 2013, 17(1)

temporal patterns of Twitter response as a function of distance from the event epicenter.Figure 4 (top) shows patterns of reaction time of tweet responses over the first 400 seconds (6minutes 20 seconds) after the earthquake. The horizontal axis shows distance from the epi-center (expressed as km), and the vertical shows the Twitter community reaction time (inseconds). Reaction time is defined as the time lapsed between the actual event and a tweetreferring to it, and is an indicator of the community reaction to this particular event. Each dotin this plot represents a particular tweet in our data corpus, with a corresponding (time, dis-tance) set of coordinates. At the top of that graph we have listed major cities corresponding toa particular distance, to provide a more intuitive reference frame.
A visual inspection of Figure 4 shows that we can easily identify a dense cluster of tweetson the left-hand side of the graph, extending from the epicenter all the way to approximately700 to 950 km away from it (the area between Boston and Chicago in the graph). We havemarked the furthermost point of this threshold region by a red line in the figure for easy refer-ence. The same observation can be made in the histogram of tweets as shown in the bottom ofFigure 4, which records the number of tweets as a function of distance from the epicenter. Inthat histogram too we observe a substantial drop as we move beyond this point, which weconsider to be a threshold in Twitter data stream activity. The spatiotemporal patterns of tweetdata streams before and after that threshold are clearly differentiable. Before it (to the left ofthe red line) we have the overwhelming majority of relevant tweets, resulting in very highdensity in space and time, whereas beyond it (to the right of it) we have sporadic referencesonly. In the area before the threshold we have large groups of responses from the major met-ropolitan areas (Washington, D.C., Philadelphia, New York City), which manifest themselvesas dark identifiable strands in the graph, indicating nearly continuous flow of informationfrom these locations. Similarly, at the corresponding parts of the histogram (Figure 4, bottom)we identify peaks. At the same time, we have a sufficient number of responses in between thesemetropolitan areas, to provide good spatial coverage over that area. Beyond the threshold,there is no discernible pattern of data streams as the feeds are separated from each other inspace and time.
In order to decipher the meaning of this pattern of data streams we took the locations ofthe 40 tweets that fall in the threshold sliver between approximately 700 and 950 km of dis-tance from the epicenter in Figure 4 (roughly the dots presented are between the distance spotmarked Boston and the one marked Chicago in this figure) and plotted them on top of theUSGS Community Decimal Intensity (CDI) map as shown in Figure 5. The CDI map showsthe estimated perceived intensity of the earthquake at different locations, and also visualizesthe extent of its impact area. As we see the tweets (shown as circles in Figure 5) from thisthreshold sliver fall at the edge of what is identified to be the earthquake’s impact area.Accordingly, we observe that by analyzing the patterns of data streaming (and without anyadditional information) we can derive an excellent approximation of the earthquake’s impactarea within as few as 400 seconds of the event, which can be very critical for disaster response.
The two clearly differentiable patterns of activity inside and outside the impact area canbe referred to as response to the physical event versus response to the cyber event (its presencein and coverage by the media). One could argue that the first is the reaction to the earthquake,whereas the latter is the response to #earthquake, the corresponding cyber reference term tothe news story. From a sensor network analysis point of view, responses to the physical eventare the actual signal: people report an event occurring in their vicinity, just like a sensor would(sample tweet: ‘I think we just had an earthquake in Boston. Not kidding’). These responsesare binary in nature and are comparable to threshold-based event detection in sensor networks(Abadi et al. 2005). In contrast to physical event reports, Twitter traffic addressing the cyber
#Earthquake: Twitter as a Distributed Sensor System 133
© 2012 Blackwell Publishing Ltd Transactions in GIS, 2013, 17(1)

Figure 4 Response pattern as function of distance from epicenter for the first 400 seconds after theearthquake. At the top we see a plot of reaction time, verus distance of all tweets during that period.At the bottom we show the histogram of the number of tweets as a function of angular distance
134 A Crooks, A Croitoru, A Stefanidis and J Radzikowski
© 2012 Blackwell Publishing Ltd Transactions in GIS, 2013, 17(1)

event (from outside the actual impact area) can be viewed as noise in the context of our analy-sis, as they are not reports of the event itself but reactions to the coverage of the event in themedia (sample tweet: ‘Yep earthquake in dc/md area confirmed (source: family and friendsVIA fb’). Such responses have a negative effect on attempts to localize the event using Twitterfeeds. We can define a signal-to-noise ratio (SNRT) metric over a time period T as:
SNRtweets within impact over time Ttotal number tweets over time T
T = (1)
Therefore, a high SNRT value would ensure better event localization potential. For ourparticular dataset the SNRT value over the first 400 seconds was 95.8%. This is also visualizedvery effectively in the histogram of tweets shown in the bottom of Figure 4, where the valuesdrop significantly after an angular distance of 8 degrees.
We can also observe in Figure 4 (top) a notable trend in response time within the impactarea. Response time is represented by the lowest dots in each column of this figure, as theyreflect the fastest response from a particular distance. We observe faster responses closer to theepicenter, while the time of reaction drops almost linearly as we move away from it untilwe reach the edge of the impact area. This trend in reaction time within the impact area is
Figure 5 Locations of the 40 tweets in the shaded area of Figure 4 overlaid over the USGS CDI scalemap. Tweet locations are marked as green circles. Color-coding in the graph is ranging from red(high perceived intensity) to yellow (lower perceived intensity). The dashed line shows a distance ofapproximately 950 km (8.5 degrees of angular distance) from the epicenter
#Earthquake: Twitter as a Distributed Sensor System 135
© 2012 Blackwell Publishing Ltd Transactions in GIS, 2013, 17(1)

consistent with the fact that the perceived local impact of an earthquake decreases as a func-tion of distance, with tremors weakening away from the epicenter (Dengler and Dewey 1998).Beyond the impact area this trend ends, and even reverses, as is shown in the same figure, withreaction becoming faster as we move further towards the West Coast.
The earthquake is not an instantaneous event affecting all locations within its impact zoneat the same time: the seismic waves propagate away from the epicenter, and the USGS providesestimates of the theoretical arrival times of the earthquake at different locations as a functionof angular distance from the epicenter (http://neic.usgs.gov/neis/eq_depot/2011/eq_110823_se082311a/se082311a_t.html). Angular distance is calculated as the spherical central angle:
Δ Δˆ arcsin sin cos( )cos( )sin2 2σφ φ
φ φ λ=−⎛
⎝⎞⎠ + ⎛
⎝⎜⎞⎠⎟
⎛⎝⎜
⎞⎠
22 2
f ss f ⎟⎟ (2)
where fs and ff refer to the latitudes of the tweets and the epicenter, while Dl refers to the dif-ference of their longitudes. For example, it is estimated that the wave reached Washington,D.C., within 24 seconds (at 17:51:28 UTC), Philadelphia within 49 seconds (at 17:51:53UTC), New York City within 65 seconds (at 17:52:09 UTC), and further away it would havereached Los Angeles within 6 minutes 34 seconds (even though it would have been so weak-ened by then that it would have been undetectable by humans). Using this information, and inorder to better understand the reaction time to the event we adjusted the data presented inFigure 4 to reflect response lag time compared to the local arrival time of the earthquake waverather than the instance of the event at the epicenter. The adjusted results are shown inFigure 6. The axes are similarly defined to the ones we used in Figure 4 (top), but the data hereare adjusted to correct for the arrival time of the seismic wave at each location. In Figure 6 wehave also visualized by a light gray sliver the threshold zone between 700 and 950 km(approximately 6.5 and 8.5 angular degrees) that we used to generate the plot of Figure 5. Westill see the very pronounced nearly linear increase in response time as we move away from theepicenter in Virginia towards the edges of the impact area. This is consistent with our earlierobservation that the data may indicate that reaction time tends to be related to the perceivedmagnitude of the reported event.
The temporal reaction beyond the impact area is very interesting to observe in theadjusted data of Figure 6. We can see that the reaction time outside the impact area becomesnegative as we consider areas like Salt Lake City, Phoenix, Los Angeles and Seattle. In theseareas the Twitter community has already become aware of the event through the media beforethe actual event would have reached them. This observation shows the strong potential ofusing Twitter as an advanced warning system, as we see that it offers a lead time of one (e.g.Salt Lake City) to five (e.g. Los Angeles) minutes to alert the public at distant locations of aforthcoming incident.
If we consider responses over a longer period of time, say 60 minutes as shown inFigure 7, we can observe that similar to Figure 6 we still have the vast majority of tweetsoriginating within the impact area. However, the SNRT metric over this longer periodworsens, dropping to 88.1%. Nevertheless, we can easily identify the impact area in thisfigure too, as the left most dense portion of the graph extending towards the region ofreversal in reaction times (Chicago). The data presented in Figure 7 are directly comparableto Figure 6, as they reflect the adjusted response time, to take into account the travel time ofthe seismic wave.
136 A Crooks, A Croitoru, A Stefanidis and J Radzikowski
© 2012 Blackwell Publishing Ltd Transactions in GIS, 2013, 17(1)

5.3 Event Coverage and Localization
In order to better visualize the geographic distribution of the Twitter-harvested earthquakereports we have mapped their locations at different time instances. In Figure 8 we show theevolution of the Twitter responses over the first five minutes of the event. The red dots indicatethe locations from which we have received tweets reporting an earthquake for the correspond-ing time interval while the blue lines represent the seismic wave at the start (nearest toMineral, VA) and end of each analysis period. As we observe in Figure 8, already in the secondanalysis period (2 to 3 minutes) tweets appear ahead of the seismic wave. This demonstratesthat as early as a couple of minutes after the event, Twittersphere awareness of the event over-takes the event’s propagation in physical space.
We can see that reporting starts in the vicinity of the epicenter over the first two minutes,and starts spreading and densifying over the impact area as time passes by. We can see that thedots in the Twitter coverage maps as shown in Figure 8 correspond well to the high intensity
Figure 6 Response pattern as function of distance from epicenter: first 400 seconds. Reaction timeis adjusted to reflect the local arrival time of the earthquake wave
#Earthquake: Twitter as a Distributed Sensor System 137
© 2012 Blackwell Publishing Ltd Transactions in GIS, 2013, 17(1)

regions of the CDI map of Figure 5. At the same time some sporadic responses start appearing,but we can see in the map that the major cluster of responses delineates very successfully theCDI impact area (compare Figures 5 and 8 lower right). This effect still holds as we monitorthe period 5–10 minutes after the earthquake as seen in the left of Figure 9. By eight minutesafter the event the seismic wave would have traveled across the U.S. as highlighted by the bluelines in the figure. As we move beyond that time period, towards 60 minutes after the event asshown in Figure 9 (right) we see that the SNRT values drop and response clusters also startforming outside the impact area. This is the effect of the increase in responses to the cyberevent relative to responses to the physical event as we discussed in Section 5.2 above. Never-theless, the East Coast impact area is still recognizable in the right of Figure 9. Based on theseresponses we can see that by focusing on Twitter feeds over the first few minutes after theevent (up to 5 or even 10 minutes in this case) we can obtain a good approximation of theimpact area, as responses to the cyber event remain relatively sparse during that early period.
Figure 7 Response pattern as function of distance from epicenter for the first 60 minutes after theearthquake
138 A Crooks, A Croitoru, A Stefanidis and J Radzikowski
© 2012 Blackwell Publishing Ltd Transactions in GIS, 2013, 17(1)
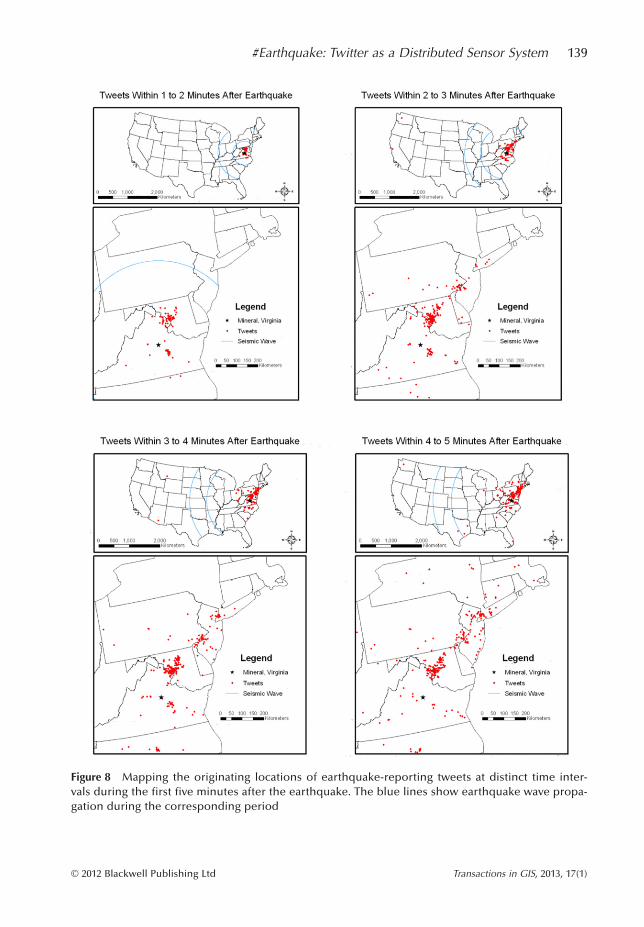
Figure 8 Mapping the originating locations of earthquake-reporting tweets at distinct time inter-vals during the first five minutes after the earthquake. The blue lines show earthquake wave propa-gation during the corresponding period
#Earthquake: Twitter as a Distributed Sensor System 139
© 2012 Blackwell Publishing Ltd Transactions in GIS, 2013, 17(1)

5.4 Comparison of AGI to VGI Data Contributions
As we argued earlier, harvesting information from Twitter feeds represents a form of AmbientGeographic Information (AGI), which we consider to be a variant of what has traditionallybeen viewed as Volunteered Geographic Information (VGI) in terms of the purpose andprocess followed to contribute and collect this information. In order to assess the performanceof VGI versus AGI we compare the data we harvested from Twitter to ‘Did you Feel It?’ theofficial VGI system of the USGS. Earlier, in Figures 5 and 8 we showed how well the twomatch in terms of geographic coverage. Here we present some additional analysis of the datacontribution patterns in AGI and VGI.
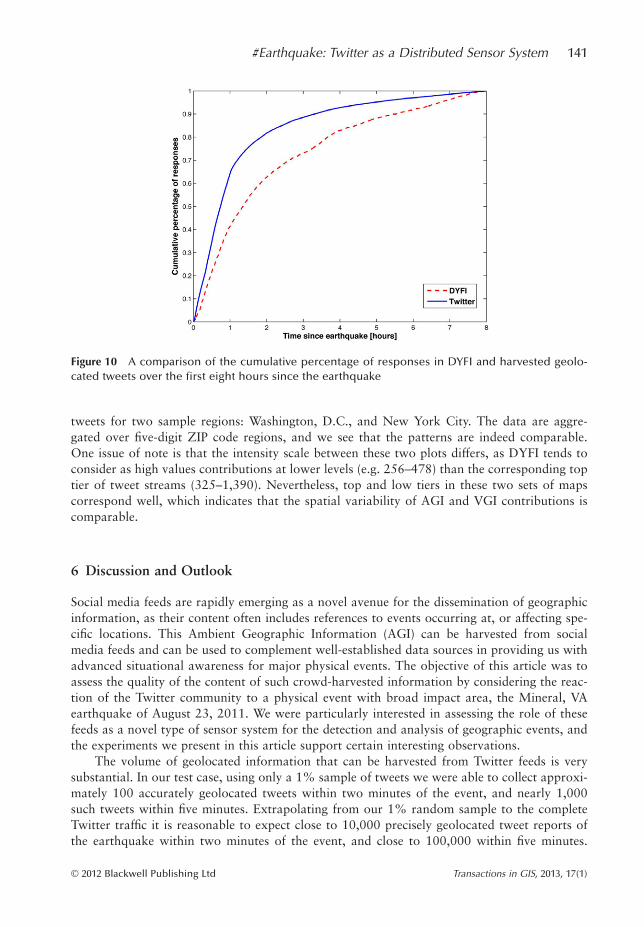
In Figure 10 we show a comparison of the temporal rate of DYFI contributions versusgeolocated earthquake references harvested from Twitter over a period of eight hours. Weobserve that the two curves are comparable, but Twitter shows a faster gain rate early on, andstarts tapering off faster than DYFI, which displays a slower progression. In order to bettercompare the two curves we are displaying cumulative percentages of responses rather thanactual numbers. The actual number of contributions to DYFI over the eight hour period isapproximately 125,000 whereas our data corpus from a random 1% sample of Twitterincludes approximately 23,500 tweets, and thus we could expect that the full Twitter trafficwould correspond to nearly 2.3 million geolocated earthquake tweets over eight hours. Thisindicates that AGI flows faster and at higher volumes than VGI in this case.
In order to demonstrate the spatial variability of these contributions we visualize inFigures 11 and 12 patterns of DYFI contributions versus patterns of harvested geolocated
Figure 9 Mapping the originating locations of earthquake-reporting tweets 5–10 minutes (left) and10–60 minutes (right) after the earthquake. The blue lines show earthquake wave propagationduring the corresponding period
140 A Crooks, A Croitoru, A Stefanidis and J Radzikowski
© 2012 Blackwell Publishing Ltd Transactions in GIS, 2013, 17(1)
tweets for two sample regions: Washington, D.C., and New York City. The data are aggre-gated over five-digit ZIP code regions, and we see that the patterns are indeed comparable.One issue of note is that the intensity scale between these two plots differs, as DYFI tends toconsider as high values contributions at lower levels (e.g. 256–478) than the corresponding toptier of tweet streams (325–1,390). Nevertheless, top and low tiers in these two sets of mapscorrespond well, which indicates that the spatial variability of AGI and VGI contributions iscomparable.
6 Discussion and Outlook
Social media feeds are rapidly emerging as a novel avenue for the dissemination of geographicinformation, as their content often includes references to events occurring at, or affecting spe-cific locations. This Ambient Geographic Information (AGI) can be harvested from socialmedia feeds and can be used to complement well-established data sources in providing us withadvanced situational awareness for major physical events. The objective of this article was toassess the quality of the content of such crowd-harvested information by considering the reac-tion of the Twitter community to a physical event with broad impact area, the Mineral, VAearthquake of August 23, 2011. We were particularly interested in assessing the role of thesefeeds as a novel type of sensor system for the detection and analysis of geographic events, andthe experiments we present in this article support certain interesting observations.
The volume of geolocated information that can be harvested from Twitter feeds is verysubstantial. In our test case, using only a 1% sample of tweets we were able to collect approxi-mately 100 accurately geolocated tweets within two minutes of the event, and nearly 1,000such tweets within five minutes. Extrapolating from our 1% random sample to the completeTwitter traffic it is reasonable to expect close to 10,000 precisely geolocated tweet reports ofthe earthquake within two minutes of the event, and close to 100,000 within five minutes.
Figure 10 A comparison of the cumulative percentage of responses in DYFI and harvested geolo-cated tweets over the first eight hours since the earthquake
#Earthquake: Twitter as a Distributed Sensor System 141
© 2012 Blackwell Publishing Ltd Transactions in GIS, 2013, 17(1)

This is a very substantial volume of reports, especially if we consider that the USGS DYFIwebsite collected a comparable number of reports (125,000) over a period of eight hours.Based on these numbers we can argue that we harvest from Twitter and AGI a volume ofreports comparable to the official VGI portal within 5% of the time. This reflects a substantialtime gain, especially as it relates to disasters and the need to have timely information. In termsof sheer numbers, 100,000 reports is also considered a very substantial number if we considerthat the planned USGS Advanced National Seismic System (ANSS) will comprise 7,000 earth-quake monitoring units distributed all over the U.S. or that the EarthScope program whichdeploys a transportable array of 400 broadband seismometers over the U.S.
Moreover, the potential role of social media and AGI should not be underestimated asofficial sensor networks may be sparse or costly to implement, but human sensor networks areexponentially densifying with respect to the growing use of smart phones. They are not justdense but they are dense at the right places, namely where human populations are gathered,and arguably these are the places that are of the most interest under specific events. One mightassume citizen reporting through Twitter will be less accurate than that of trained observers oractual recording stations and could be susceptible to false reports. However, authors such asCox and Plale (2011) or Demirbas et al. (2010) argue that such information can be accurate
(a) (b)
(c)
Figure 11 Washington, D.C.: (a) Plot of DYFI contributions aggregated per five digit ZIP code; (b)Plot of geolocated Twitter contributions aggregated per five digit ZIP code; (c) Plot of the geolo-cated Tweets
142 A Crooks, A Croitoru, A Stefanidis and J Radzikowski
© 2012 Blackwell Publishing Ltd Transactions in GIS, 2013, 17(1)

enough to improve localized weather reports. Which in a sense relates to the notion in theopen source community that “given enough eyeballs, all bugs are shallow” (Raymond 1999)or the law of large numbers.
Another issue that needs to be considered is that while the data stream volume is impres-sive, we should not ignore the fact that the information conveyed by Twitter is qualitative butnot quantitative. Unlike a seismometer, a tweet does not provide a metric of the magnitude ofthe earthquake but rather conveys binary information: that an earthquake was felt at a givenlocation. However, the massive amount of data harvested from Twitter allows us to overcomethis limitation, and identifies the extent of the impact area of the earthquake event as shown inFigures 8 and 9.
We also observed interesting spatial and temporal trends in Twitter reports of the earth-quake event. More specifically, the majority of tweets originated from within the impact area,and slowly over time diffused across the country as we move from tweeting about the event totweeting about news of the event. Accordingly, an early collection of tweets (e.g. in the first 10minutes after the event) can be used to provide a fast and good approximation of the impact
(a) (b)
(c)
Figure 12 New York City: (a) Plot of DYFI contributions aggregated per five digit ZIP code; (b) Plotof geolocated Twitter contributions aggregated per five digit ZIP code; (c) Plot of the geolocatedTweets
#Earthquake: Twitter as a Distributed Sensor System 143
© 2012 Blackwell Publishing Ltd Transactions in GIS, 2013, 17(1)

area (especially if the context of the tweet and associated images were to be analyzed as well),which is valuable information for response and recovery operations. Furthermore, reactiontime tends to increase away from the epicenter, which may serve as an indicator to estimate theevent epicenter simply by considering the temporal stamps of relevant Twitter data streams.Moreover, one could also explore a “social epicenter” or “cyber epicenter”, in the sense thatthe central point of the cluster of messages about the phenomena could be delineated and thiswould likely move in time, as more people report the event. Our dataset also showed thatinformation dissemination through Twitter can travel faster than the physical event to distantlocations, as demonstrated vividly by the negative reaction times of the West Coast in Figure 5.This is a very critical observation supporting the use of social media in general, and Twitter inparticular, for providing novel geographic information and thus acting as an early warningsystem for large-scale incidents. Together with the abovementioned ability to obtain an accu-rate assessment of the impact area, this supports the notion that by harvesting geospatial infor-mation from Twitter feeds we can rapidly gain valuable information on the impact of aphysical event. Of course in the experiments we showed here the data were collected after theevent, but nevertheless we have demonstrated through our work that tweet content enables therapid identification of impact areas and enhances our situational awareness. In order to fullyrealize this potential we need to take advantage of systems that perform real-time trend detec-tion over the Twitter stream (e.g. Mathioudakis and Koudas 2010). Recently, Zhao et al.(2011) reported on the use of an adaptive sliding window application of a lexicon-basedcontent analysis solution that is able to detect events in Twitter within 40 seconds of the actualevent. The integration of such systems with the type of analysis we demonstrated here sup-ports the emergence of Twitter as an effective distributed sensor system for event detection andimpact assessment.
The geographic focus of our work complements earlier work on data mining approachesthat addressed disease outbreak detection by harvesting information from news articles(Brownstein et al. 2009), Internet search engines (e.g. Polgreen et al. 2008), blogs at large(Corley et al. 2010), and Twitter specifically (Ritterman et al. 2009, Culotta 2010). The obser-vations we made in this article highlight the very rich potential offered by harvesting ambientgeographic information from Twitter to enhance our situational awareness capabilities, andthe evolution of geographic information from traditional formats (e.g. maps and imagery) andauthoritative sources to distributed content provided by the general public.
Note
1 Twitter provides free access to a 1% sample of all tweets via their API and permits the geolocationanalysis of such harvested information. For this analysis, the 1% sample was based on keywords andhashtags relating to earthquakes.
References
Abadi D, Madden S, and Lindner W 2005 REED: Robust, Efficient Filtering and Event Detection in sensor net-works. In Proceedings of the Thirty-first International Conference on Very Large Data Bases (VLDB’05),Trondheim, Norway: 769–80
Akyildiz I F, Sankarasubramanian Y, and Cayirci E 2002 Wireless sensor networks: A survey. Computer Net-works 38: 393–422
Atkinson G M and Wald D 2007 “Did You Feel It?” intensity data: A surprisingly good measure of earthquakeground motion. Seismological Research Letters, 78: 362–68
144 A Crooks, A Croitoru, A Stefanidis and J Radzikowski
© 2012 Blackwell Publishing Ltd Transactions in GIS, 2013, 17(1)

Backstrom L, Sun E, and Marlow C 2010 Find me if you can: Improving geographical prediction with socialand spatial proximity. In Proceedings of the Nineteenth International World Wide Web Conference(WWW ’10), Raleigh, North Carolina: 61–70
Brownstein J S, Clark C, Freitfeld B S, and Madoff L C 2009 Digital disease detection: Harnessing the Web forpublic health surveillance. New England Journal of Medicine 360: 2153–57
Burke J, Estrin D, Hansen M, Parker A, Ramanathan N, Reddy S, and Srivastava M B 2006 Participatorysensing. In Proceedings of the Workshop on the World-Sensor-Web (WSW’06), Mobile Device CentricSensor Networks and Applications, Boulder, Colorado: 117–34
Cheng Z, Caverlee J, and Lee K 2010 You are where you Tweet: A content-based approach to geo-locatingTwitter users. In Proceedings of the ACM Conference on Information and Knowledge Management (CIKM’10), Toronto, Ontario: 759–68
Christakis N A and Fowler J H 2010 Social network sensors for early detection of contagious outbreaks. PLoSONE 5 (9): e12948
Christensen C 2011 Twitter revolutions? Addressing social media and dissent. The Communication Review 14:155–57
Christian Science Monitor 2011 Social Media Drive Occupy Wall Street: Do They Also Divulge Its Secrets?WWW document, http://www.csmonitor.com/USA/Politics/2011/1012/Social-media-drive-Occupy-Wall-Street.-Do-they-also-divulge-its-secrets
Corley C D, Cook D J, Mikler A R, and Singh K P 2010 Text and structural data mining of influenza mentionsin web and social media. International Journal of Environmental Research and Public Health 7: 596–615
Cox J and Plale B 2011 Improving Automatic Weather Observations with the Public Twitter Stream. Blooming-ton, IN, Indiana University, School of Informatics and Computing Research Report (available at: http://www.cs.indiana.edu/Research/techreports/)
Culotta A 2010 ‘Towards detecting Influenza Epidemics by Analyzing Twitter Messages’, Proceedings of theFirst Workshop on Social Media Analytics, Washington, D.C., pp. 115–122
De Longueville B, Smith R S, and Luraschi G 2009 “OMG, from here, I can see the flames!”: A use case ofmining location based social networks to acquire spatio-temporal data on forest fires. In Proceedings of theInternational Workshop on Location-Based Social Networks (LBSN ’09), Seattle, Washington: 73–80
Demirbas M, Bayir M A, Akcora C G, Yilmaz Y S, and Ferhatosmanoglu H 2010 Crowd-sourced sensing andcollaboration using Twitter. In Proceedings of the IEEE International Symposium on a World of Wireless,Mobile and Multimedia Networks (WOWMOM), Montreal, Quebec: 1–9
Dengler L A and Dewey J W 1998 An intensity survey of households affected by the Northridge, California,earthquake of 17 January 1994. Bulletin of the Seismological Society of America 88: 441–62
Doty N and Wilde E 2010 Geolocation privacy and application platforms. In Proceedings of the Third ACMSIGSPATIAL International Workshop on Security and Privacy in GIS and LBS, San Jose, California:65–69
Dyregrov A, Solomon R, and Bassoe C F 2000 Mental mobilization process in critical incident stress situations.International Journal of Emergency Mental Health 2(2): 73–81
Earle P, Guy M, Buckmaster R, Ostrum C, Horvath S, and Vaughan A 2010 OMG earthquake! Can Twitterimprove earthquake response? Seismological Research Letters 81: 246–51
Eriksson B, Barford P, Sommers J, and Nowak R 2010 A learning-based approach for IP geolocation. InKrishnamurthy A and Plattner B (eds) Passive and Active Measurement. Berlin, Springer Lecture Notes inComputer Science Vol. 6032: 171–80
Field K and O’Brien J 2010 Cartoblography: Experiments in using and organizing the spatial context of micro-blogging. Transactions in GIS 15: 5–23
Fritz S, MacCallum I, Schill C, Perger C, Grillmayer R, Achard F, Kraxner F, and Obersteiner M 2009 Geo-Wiki.Org: The use of crowdsourcing to improve global land cover. Remote Sensing, 1: 345–54
Ginsberg J, Mohebbi M H, Patel R S, Brammer L, Smolinski M S, and Brilliant L 2009 Detecting influenza epi-demics using search engine query data. Nature- 457: 1012–14
Goodchild M F 2007 Citizens as sensors: The world of volunteered geography. GeoJournal 69: 211–21Goodchild M F and Glennon J A 2010 Crowdsourcing geographic information for disaster response: A research
frontier. International Journal of Digital Earth 3: 231–41Hecht B, Hong L, Suh B, and Chi E 2011 Tweets from Justin Bieber’s Heart: The dynamics of the ‘location’ field
in user profiles. In Proceedings of the ACM Conference on Human Factors in Computing Systems, Vancou-ver, British Columbia: 237–46
Honey C and Herring S C 2009 Beyond microblogging: Conversation and collaboration via Twitter. In Proceed-ings of the Forty-Second Hawaii International Conference on System Sciences (HICSS-42), Big Island,Hawaii: 1–10
Howard P N, Agarwal S D, and Mazammil M 2011 When do states disconnect their digital networks?Responses to the political uses of social media. The Communication Review 14: 216–32
#Earthquake: Twitter as a Distributed Sensor System 145
© 2012 Blackwell Publishing Ltd Transactions in GIS, 2013, 17(1)

Howe J 2008 Crowdsourcing: Why the Power of the Crowd is Driving the Future of Business. New York,Crown Business
Hyvarinen O and Saltikoff E 2010 Social media as a source of meteorological observations. Monthly WeatherReview 138: 3175–84
Huffington Post 2011 Occupy Wall Street: Social Media’s Role in Social Change. WWW document, http://www.huffingtonpost.com/2011/10/06/occupy-wall-street-socialmedia_n_999178.html)
Java A, Song X, Finin T, and Tseng B 2009 Why we Twitter: An analysis of a microblogging community. InGoebel R, Siekmann J, and Wahlster W (eds) Advances in Web Mining and Web Usage Analysis. Berlin,Springer Lecture Notes in Computer Science Vol. 5439: 118–38
Kaplan A M and Haenlein M 2010 Users of the World unite! The challenges and opportunities of social media.Business Horizons 53: 59–68
Kosala R and Blockeel H 2000 Web mining research: A survey. SIGKDD Explorations 2: 1–15Ludford P J, Priedhorsky R, Reily K, and Terveen L G 2007 Capturing, sharing, and using local place informa-
tion. In Proceedings of the ACM Conference on Human Factors in Computing Systems (CHI ’07), SanJose, California: 1235–44
MacEachren A M, Jaiswal A, Robinson A C, Pezanowski S, Savelyev A, Mitra P, Zhang X, and Blanford J 2011SensePlace2: GeoTwitter analytics support for situational awareness. In Proceedings of the IEEE Confer-ence on Visual Analytics Science and Technology, Providence, Rhode Island
Mathioudakis M and Koudas N 2010 TwitterMonitor: Trend detection over the Twitter stream. In Proceedingsof the International ACM Conference on Management of Data (SIGMOD’10), Indianapolis, Indiana:1155–58
Miller C and Wortham J 2010 Technology Aside, Most People Still Decline to Be Located. New York Times. (30August; available at: http://www.nytimes.com/2010/08/30/technology/30location.html?src=tp)
Naaman M, Boase J, and Lai C-H 2010 ‘Is it really about me? Message content in social awareness streams’. InProceedings of the 2010 ACM Conference on Computer Supported Coopertaive Work – (CSCW’10),Savannah, Georgia: 189–92
Nardi B A, Schiano D J, Gumbrecht M, and Schwartz L 2004 Why we blog. Communications of the ACM47(12): 41–6
Nessler D, Mecklinger A, and Penney T B 2005 Perceptual fluency, semantic familiarity and recognition-relatedfamiliarity: An electrophysiological exploration. Cognitive Brain Research 22: 265–88
Newsweek 2009 A Twitter Timeline of the Iran Election. Newsweek (available at http://www.newsweek.com/2009/06/25/a-twitter-timeline-of-the-iran-election.html)
Nittel S, Labrinidis A, and Stefanidis A (eds) 2008 Advances in Geosensor Networks. Berlin, Springer LectureNotes in Computer Science Vol. 4540
Okasaki M and Matsuo Y 2012 Semantic Twitter: Analyzing tweets for real-time event notification. In Breslin JG, Burg T N, Kim H-G, Raftery T, and Schmidt J-H (eds) Recent Trends and Development sin Social Soft-ware. Berlin, Springer Lecture Notes in Computer Science Vol. 6045: 63–74
Poese I, Uhlig S, Kaafar M A, Donnet B, and Gueye B 2011 IP Geolocation databases: Unreliable? ComputerCommunication Review 4 (2): 53–56
Polgreen P M, Chen Y, Pennock D M and Nelson F D 2008 Using Internet searches for influenza surveillance.Clinical Infectious Diseases, 47: 1443–48
Popescu A and Grefenstette G 2010 Mining user home location and gender from Flickr tags. In Proceedings ofthe Fourth International Conference on Weblogs and Social Media – (ICWSM ’10), Washington, D.C.:307–10
Raymond E S 1999 The Cathedral and the Bazaar: Musings on Linux and Open Source by an Accidental Revo-lutionary. North Sebastopol, CA, O’Reilly Media
Russell M A 2011 Mining the Social Web. North Sebastopol, CA, O’Reilly MediaRitterman J, Osborne M, and Klein E 2009 Using prediction markets and Twitter to predict a swine flu pan-
demic. In Proceedings of the First International Workshop on Mining Social Media, Sevilla, Spain: 9–18Sakaki T, Okazaki M, and Matsuo Y 2010 Earthquake shakes Twitter users: Real-time event detection by social
sensors. In Proceedings of the International Conference on the World Wide Web (WWW ’10), Raleigh,North Carolina: 851–60
Selavo L, Wood A, Cao Q, Sookoor T, Liu H, Srinivasan A, Wu Y, Kang W, Stankovic J, Young D, and Porter J2007 LUSTER: Wireless sensor network for environmental research. In Proceedings of the Fifth Interna-tional Conference on Embedded Networked Sensor Systems, Sydney, Australia: 103–16
Singh V K, Gao M, and Jain R 2010 Situation detection and control using spatio-temporal analysis of microb-logs. In Proceedings of the International Conference on the World Wide Web (WWW ’10), Raleigh, NorthCarolina: 1181–82
Stefanidis A, Crooks A, and Radzikowski J 2012 Harvesting ambient geospatial information from social mediafeeds. GeoJournal 77: in press
146 A Crooks, A Croitoru, A Stefanidis and J Radzikowski
© 2012 Blackwell Publishing Ltd Transactions in GIS, 2013, 17(1)

Steinfeld A, Zimmerman J, Tomasic A, Yoo A, and Aziz R 2011 Mobile transit rider information via universaldesign and crowdsourcing. In Proceedings of the 2011 Annual Meeting of the Transportation ResearchBoard, Washington, D.C.
Sternberg R J 2009 Cognitive Psychology. Florence, KY, Wadsworth PublishingVieweg S, Hughes A L, Starbird K, and Palen L 2010 Microblogging during two natural hazards events: What
Twitter may contribute to situational awareness. In Proceedings of the ACM Conference on ComputerHuman Interaction (CHI ‘10), Atlanta, Georgia: 1079–88
Wald D J, Quitoriano V, Dengler L A, and Dewey J W 1999 Utilization of the Internet for rapid communityintensity maps. Seismological Research Letters 70: 680–93
Yamaguchi S, Hale L A, D’Esposito M, and Knight R T 2004 Rapid prefrontal-hippocampal habituation tonovel events. Journal of Neuroscience 24: 5356–63
Zhao D and Rosson M B 2009 How and why people Twitter: The role that micro-blogging plays in informalcommunication at work. In Proceedings of the ACM International Conference on Supporting GroupWork, Sanibel Island, Florida: 243–52
Zhao S, Zhong L, Wickramasuriya J, and Vasudevan V 2011 Human as real-time sensors of social and physicalevents: A case study of Twitter and sports games. Houston, TX, Rice University Technical Report No.TR0620
#Earthquake: Twitter as a Distributed Sensor System 147
© 2012 Blackwell Publishing Ltd Transactions in GIS, 2013, 17(1)