Earnings quality in UK private firms - CiteSeerX
64
Earnings quality in U.K. private firms: Comparative loss recognition timeliness I Ray Ball a,* and Lakshmanan Shivakumar b a Graduate School of Business, University of Chicago, Chicago, IL 60637, USA b London Business School, Regent’s Park, London NW1 4SA, United Kingdom December 2004 Abstract UK private and public companies face substantially equivalent regulation on auditing, accounting standards and taxes. We hypothesize that private-company financial reporting nevertheless is lower quality due to different market demand, regulation notwithstanding. A large UK sample supports this hypothesis. Quality is operationalized using Basu’s (1997) time-series measure of timely loss recognition and a new accruals-based method. The result is not affected by controls for size, leverage, industry membership and auditor size, or by allowing endogenous listing choice. The result enhances understanding of private companies, which are predominant in the economy. It also provides insight into the economics of accounting standards. JEL Classification: M41; K22; N24 Keywords: Earnings quality; conservatism; loss recognition; private firms; economics of accounting standards; earnings time series; accruals. _________ Ι We are grateful for helpful comments from Sudipta Basu, Martin Casey, Greg Clinch, Gilad Livne, Jim Seida, Michelle Yetman, Jim Wahlen, Gregory Waymire (the referee), Jerold Zimmerman (the editor), and participants at the 2002 Annual Meeting of the American Accounting Association, University of Chicago, Indiana University, London Business School, Massachusetts Institute of Technology, University of Notre Dame and University of Toronto. Ball gratefully acknowledges financial support from the University of Chicago, Graduate School of Business. *Corresponding author. Present address: Graduate School of Business, University of Chicago, 1101 East 58 th Street, Chicago, IL 60637-1561; Phone: +1-773-834-5941; fax: +1-773- 834-4585. E-mail address : [email protected] (R. Ball)
-
Upload
khangminh22 -
Category
Documents
-
view
3 -
download
0
Transcript of Earnings quality in UK private firms - CiteSeerX
Earnings quality in U.K. private firms: Comparative loss recognition timelinessΙ
Ray Balla,* and Lakshmanan Shivakumarb
aGraduate School of Business, University of Chicago, Chicago, IL 60637, USA bLondon Business School, Regent’s Park, London NW1 4SA, United Kingdom
December 2004 Abstract UK private and public companies face substantially equivalent regulation on auditing, accounting standards and taxes. We hypothesize that private-company financial reporting nevertheless is lower quality due to different market demand, regulation notwithstanding. A large UK sample supports this hypothesis. Quality is operationalized using Basu’s (1997) time-series measure of timely loss recognition and a new accruals-based method. The result is not affected by controls for size, leverage, industry membership and auditor size, or by allowing endogenous listing choice. The result enhances understanding of private companies, which are predominant in the economy. It also provides insight into the economics of accounting standards.
JEL Classification: M41; K22; N24 Keywords: Earnings quality; conservatism; loss recognition; private firms; economics of accounting standards; earnings time series; accruals. _________ ΙWe are grateful for helpful comments from Sudipta Basu, Martin Casey, Greg Clinch, Gilad Livne, Jim Seida, Michelle Yetman, Jim Wahlen, Gregory Waymire (the referee), Jerold Zimmerman (the editor), and participants at the 2002 Annual Meeting of the American Accounting Association, University of Chicago, Indiana University, London Business School, Massachusetts Institute of Technology, University of Notre Dame and University of Toronto. Ball gratefully acknowledges financial support from the University of Chicago, Graduate School of Business.
*Corresponding author. Present address: Graduate School of Business, University of Chicago, 1101 East 58th Street, Chicago, IL 60637-1561; Phone: +1-773-834-5941; fax: +1-773-834-4585. E-mail address: [email protected] (R. Ball)

1. Introduction
We examine timely loss recognition – an important attribute of financial reporting quality
– in a large sample of U.K. private and public firms. Private company reporting is interesting in
its own right, due to the predominance of private companies in the economy.1 The U.K. setting is
particularly interesting, because U.K. private company reporting is subject to substantially
equivalent regulatory provisions as public company reporting, whereas the markets for private
and public financial reporting are substantially different. The U.K. therefore provides a rare
opportunity to study the interaction between market and regulatory effects (Ball, Robin and Wu
2000, 2003; Ball 2001). We argue that the market demands lower quality financial reporting for
private companies than for public companies, regulation notwithstanding, and report evidence
consistent with that view. The result enhances our understanding of the economic role of
accounting standards, an issue that is surprisingly neglected in the literature.
Three principal features of the U.K. financial reporting regulations are substantially
equivalent for private and public companies. First, the U.K. Companies Act requires all private
and public companies to file annual financial statements that comply with the same accounting
standards. Second, financial statements filed by U.K. private companies must be audited (there is
an exemption for very small companies, but no firms in our sample qualify). Third, private and
public companies are subject to the same tax laws. These are the major regulatory institutions for
U.K. financial reporting, and they are substantially equivalent for public and private companies.
Nevertheless, the market for financial reporting differs substantially between private and
public companies. Private companies are more likely to resolve information asymmetry by an
1 Over 90% of registered U.K. companies are private (Companies House, U.K.). They constitute 99.9% of all private non-agricultural entities in 1993 Europe (Mulhern 1995). The Forbes list of the top 500 U.S. private companies (http://www.forbes.com/private500/) includes 245 with revenues exceeding $1 billion in 2000. The U.S. Small Business Administration (http://www.sba.gov/advo/stats/facts99.pdf) reports that in 1998 businesses with fewer than 500 employees accounted for 51% of US GDP, 47% of sales, and 53% of private nonfarm e mployment. The role of small firms in job creation, growth and innovation is widely debated; see Schumpeter (1934) and Acs (1996).

2
“insider access” model. They are less likely to use public financial statements in contracting with
lenders, managers and other parties, and in primary and secondary equity transactions. Their
financial reporting is correspondingly more likely to be influenced by taxation, dividend and
other policies. These differences imply a demand for lower quality financial reporting.
We interpret reporting quality in abstract terms as the usefulness of financial statements to
investors, creditors, managers and all other parties contracting with the firm. Following Basu
(1997), we measure a single but nevertheless important attribute of reporting quality: timeliness
in financial-statement recognition of economic losses. Timely loss recognition increases financial
statement usefulness generally, particularly in corporate governance and debt agreements.
Governance is affected because timely loss recognition makes managers less likely to make
investments they expect ex ante to be negative-NPV, and less likely to continue operating
investments with ex post negative cash flows. Debt is affected because timely loss recognition
provides more accurate ex ante information for loan pricing and more quickly triggers debt
agreement rights (such as repricing, and restrictions on leverage, investment and dividends) from
violating covenants based on ex post accounting ratios. We therefore argue that timely
recognition of economic losses is an important attribute of financial reporting quality.2
Our principal result is that timely loss recognition is substantially less prevalent in private
companies than in public companies, despite the groups facing equivalent regulatory rules. The
result is apparent in both a test for transitory time-series components in income and a new test
based on the relation between accruals and cash flow from operations. It is robust with respect to
controls for size, leverage, industry and fiscal year-end (which influence the likelihood of
experiencing an economic loss) and for auditor firm size. It also is robust with respect to
alternative definitions of both income (inclusion or exclusion of exceptional and/or extra-ordinary
2 The literature on timely loss recognition, conservatism and value relevance are discussed further in Section 2.3.

3
items) and operating cash flow (estimated from successive balance sheets or directly from cash
flow statements), alternative estimation methods (Fama-MacBeth t-statistics, extent of data
Winsorizing) and alternative model specifications (a selection model addressing endogeneity of
the public/private choice). This result cannot be attributed to risk or tax differences between
private and listed firms. The lower timeliness of loss recognition observed in private companies
relative to public companies, despite the substantive equivalence of their reporting rules, supports
the view that market demand substantially determines important financial reporting properties.
As financial reporting criteria, quality and usefulness differ from economic efficiency
because they do not address optimality. Lower quality does not imply sub-optimality because it
can arise from either lower demand for or higher cost of supplying quality. Our findings thus
should not be interpreted as supporting stricter regulation of financial reporting by private firms.
Quite the contrary: our hypothesis is that lower earnings quality in private firms is an optimal
outcome in the market for financial reporting, not a failure in supply.
The following section describes the economic role of timely loss recognition (the attribute
of earnings quality we measure), and its relation to conservatism and “value relevance.” The
section also outlines our two principal tests of loss recognition timeliness: Basu’s (1997) method
of identifying transitory loss components in income; and a test we develop that is based on the
relation between accruals and cash flow from operations. Section three describes the relevant UK
institutional features and develops the hypothesis that loss recognition timeliness is substantially
affected by the different economic roles of financial reporting in private and public companies.
Section four describes the data, section five presents the principal results, and section six
describes a variety of specification tests to ensure the robustness of the results. The final two
sections consider alternative explanations and summarize our conclusions.
2. Timely loss recognition: hypotheses and tests

4
This section outlines the economic role of timely loss recognition in accounting, and its
relation to conservatism and to value relevance. It then describes the two measures of loss
recognition timeliness we utilize: Basu’s (1997) test for transitory time-series components in
income and a new test based on the relation between accruals and cash flow from operations.
2.1 Timeliness of accounting income
Accounting income is a barometer for evaluating financial reporting in general, because
changes in balance sheet quantities flow through the income statement (assuming “clean surplus”
accounting and ignoring offsetting changes such as reclassifications). Timely income-statement
recognition therefore implies timely revision of all financial statement variables and all financial
ratios based on them.
Economic income incorporates both current-period cash flow and any revision in the
present value of expected future cash flows.3 Accounting recognition of economic income can be
thought of as occurring under two broad models: deferred and timely recognition. Deferred
recognition largely ignores revisions in expectations and awaits the realization of the revised cash
flows themselves. For a multi-period investment, revisions in expected cash flow for any one
future period are likely to be correlated with revisions for other future periods, so deferred
recognition incorporates economic gains and losses in accounting income over its entire life.
Equivalently, deferred recognition generates persistent components of accounting income.
Timely recognition incorporates unrealized gains or losses in income (and hence the balance
sheet) on an accrued basis, for example as inventory write-downs or as restructuring or asset
impairment charges. Our tests seek to identify which recognition model is most prevalently used
for economic gains and losses, and how this choice differs between public and private companies.
3 Economic income is change in market value of equity, adjusted for dividends and capital contributions. This corresponds to the Hicks (1946) definition of income as the maximum amount that can be consumed consistent with the maintenance of wealth. Hicks discusses alternative definitions.
5
The following subsections discuss the disproportionate emphasis that is placed on loss
recognition in accounting, relative to gain recognition, and how this asymmetry is related to
conservatism and value relevance.
2.2 Economic role of asymmetric timeliness in income-statement recognition of gains and losses
Accountants are reluctant to recognize (i.e., incorporate in audited financial statements)
information managers possess about future cash flows when it is unobservable to external parties,
and hence is unauditable (unverifiable). Thus, under the revenue recognition rules, reported
income is based on actual cash flow realizations, adjusted for accruals that are derived from
independently-verifiable predictors of future cash flows. One such predictor is the verified
amount of accounts receivable, which is a predictor of future cash inflow, other things equal.
Ignoring unverifiable information about future cash flows – such as that embodied in managers’
expectations, strategies and plans – reflects a trade-off between relevance and reliability
(Financial Accounting Standards Board 1984, para. 77).
Financial reporting normally modifies the revenue recognition rules by adopting a lower
verification standard for information about decreases in expected future cash flows (i.e.,
economic losses) than for increases (i.e., economic gains). 4 A primary reason for asymmetric
accounting recognition is that managers have an asymmetric incentive to reveal their private
information.5 Timeliness of economic loss incorporation is an important attribute of earnings
quality because it makes financial statements more useful in several contexts, for example in
corporate governance and loan agreements. 6
The governance effect of timely loss incorporation is due to it mitigating agency problems
associated with managers’ investments decisions. If managers know ex ante that losses will be
4 Basu (1997, page 7), Watts (2003). 5 Gilman (1939, page 232), Watts and Zimmerman (1986, page 206).
6
recognized during their tenure, then they are less likely to make negative-NPV investments, such
as “pet” projects or “trophy” acquisitions. In contrast, if managers can defer loss recognition to
periods when the reduced cash flows underlying negative NPVs are realized, then the earnings
consequences of their investment decisions can be passed on to subsequent generations of
managers. The ability to defer loss recognition also provides managers with an accounting-based
incentive to continue operating investments with ex post negative NPVs, to avoid reported losses
on sale or abandonment. These agency problems are mitigated by timely loss recognition, which
reports losses around the time expectations are revised downward, irrespective of managers’
decisions to continue or abandon. Timely loss recognition therefore increases managers’
incentives to act quickly to limit economic losses, and thereby increases the efficiency of
contracting between firms and managers.7
The efficiency of debt agreements that utilize financial statement variables also is
affected. Timely loss recognition can assist ex ante loan pricing by providing new information to
lenders. It also is quicker in triggering ex post violations of covenants based on financial
statement variables. This increases debt agreement efficiency by more quickly giving lenders the
option to impose contractual restrictions (such as leverage, investment and dividend restrictions)
on covenant violators. This applies to covenants triggered by income-statement variables such as
minimum interest coverage and balance-sheet variables such as leverage ratios, because
accounting losses flow from the income statement onto the balance sheet values of asset, liability
and owners’ equity accounts. Consequently, timely income-statement incorporation of economic
losses more quickly transfers decision rights from loss-making managers to lenders.
6 Recent awareness of the importance of losses is due to Hayn (1995), Elliott and Hanna (1996), Francis, Hanna and Vincent (1996) and Collins, Maydew and Weiss (1997). Basu (1997) studies timely loss recognition, discussed below. 7 An example is reported in DaimlerBenz AG Annual Report 1996 (English language version, pages 44-45), reproduced in Ball (1998). Daimler implemented US GAAP standards for calculating earnings throughout the corporation, reducing the discretion that individual business-unit managers exercised in reporting their own performance (including their capacity to hide losses), and requiring them to focus more on shareholder value.

7
We do not focus on timely gain recognition, for three overlapping reasons. First, we
conjecture there is less demand for it. Managers have a greater incentive to disclose timely
information about unrealized economic gains than unrealized losses (they can realize gains by
selling), so external parties are likely to demand an offsetting asymmetry in the financial
statements. For example, managers have incentives to disclose economic gains to potential
lenders to obtain favorable ex ante debt pricing, thereby skewing the demand from lenders toward
loss recognit ion in the financial statements. Further, debt agreements do not generally transfer
decision rights when covenants are exceeded, only when they are violated, so there is lower ex
post demand for timely gain recognition. 8 In the context of corporate governance, potential
agency issues arise from managers undertaking or continuing negative-NPV (not positive NPV)
investments, so there is less demand from investors for timely gain recognition derived from
contracting with managers. Overall, the economics of contracts involving financial reporting
predicts asymmetry in the demand for gain and loss accounting.
Second, we note that accounting rules and practice are fundamentally asymmetric. Recall
that economic gains and losses involve changes in expected future cash flows, which by
definition are “unrealized.” A long-standing example of asymmetric accruals is the lower of cost
or market inventory rule, which recognizes unrealized economic losses arising from declines in
fair values of inventory, but does not recognize unrealized gains. Accounting for gains and losses
on long-term assets also is asymmetric, as formalized in the asset impairment standards issued by
several countries, including FAS 121 and 144 in the U.S. and FRS11 in the U.K. In contrast,
upward revaluation has not been practiced in the U.S. since the SEC was established in 1934. In
the U.K., although upward revaluation can be recognized in the balance sheet, gains from
8 Beatty and Weber (2002) report that performance-pricing, under which interest rates vary inversely with accounting performance measures, is a new feature of U.S. debt contracts. While this provides incentives for timely recognition

8
revaluation are not included in income like losses from asset impairment. In general, asymmetry
is a fundamental property of accounting rules and practice.
Third, the evidence is consistent with timely gain recognition not being a high priority in
accounting. Basu (1997) reports that loss recognition is the prime source of timeliness in U.S.
earnings. The asymmetry is difficult to reconcile with a symmetric value relevance view of
accounting (Holthausen and Watts 2001). It replicates for public companies in a wide range of
countries, including the U.K. (Ball, Kothari and Robin, 2000).
The three reasons for not focusing on gain recognition are far from independent. To the
extent that accounting standards are endogenous rather than imposed, asymmetry in demand will
be reflected in standards (e.g., standards for asset impairment but not for upward revaluation),
and the evidence will reveal an asymmetric response of earnings to economic gains and losses.
2.3 Timely loss recognition, value relevance and conservatism
Timely loss recognition is related to the concepts of value relevance and conservatism.
This subsection attempts to clarify those concepts and how they relate to each other, with a view
to understanding timely loss recognition, which is the attribute of reporting quality we measure.
In a Basu (1997) piecewise-linear regression with fiscal-year stock return as the
independent variable and current -year accounting income as the dependent variable, timely loss
recognition is equivalent to a partial stock price association criterion. In this context, stock returns
proxy for economic gains and losses, assuming some degree of market efficiency. The association
criterion is partial in that it focuses on losses, whereas a full association criterion also addresses
gains. Further, the use of fiscal-year returns implies there is no gap in calendar time between
successive return intervals, as is the case with short windows. Fiscal-year association tests
therefore map directly into value relevance tests. In particular, timelier recognition of fiscal-year
of economic gains, we are not aware of this being practiced in the U.K. during our sample period. In any event, our

9
economic gains and losses (proxied by fiscal-year stock returns) implies a higher correlation
between book and market values.
The relation between timely loss recognition and conservatism is clouded by the existence
of two related but distinct definitions of conservatism. One definition of conservatism is an
accounting bias toward reporting low book values of stockholders equity (and hence, if clean
surplus accounting is being followed, low average net incomes). The second definition of
conservatism is an equivalent bias conditional on firms experiencing contemporaneous economic
losses. Confusion of the unconditional and conditional versions of conservatism is evident as
early as Gilman (1939, page 130) and APB Statement No. 4.
In the more recent literature, Watts and Zimmerman define conservatism as:9
Conservatism means that the accountant should report the lowest value among possible alternative values for assets and the highest alternative value for liabilities. Revenues should be recognized later rather than sooner and expenses sooner than later.
This is a variant of the first definition above, in that it does not specify conditionally low equity
or income, and hence does not address loss-recognition timeliness. To illustrate, under this
definition a firm’s accounting is conservative if it simply delays revenue recognition by one
period, or subtracts a constant from earnings every period, independent of current economic gains
and losses. This type of conservatism is an asymmetric response to uncertainty: from a range of
possible values, select a low value, not the expected value. It frequently is associated with
Germany, where under the vorsicht (prudence) principle there are unconditionally conservative
practices such as charging future operating expenses against current-period income.10
Basu (1997) is an important contribution to our understanding of the conservatism
concept. He defines conservatism as (page 4, emphasis added):
hypothesis is that there is asymmetrically less demand – not no demand – for timely gain recognition. 9 Watts and Zimmerman (1986, pages 205-206). See also Watts (1993, page 1).

10
I interpret conservatism as capturing accountants’ tendency to require a higher degree of verification for recognizing good news than bad news in financial statements. Under my interpretation of conservatism, earnings reflects bad news more quickly than good news.
Basu (pages 7-8) compares this definition – which stresses the timeliness of loss recognition –
with variants of the first definition. The additional requirement of this conditional conservatism
definition is that the reduction in accounting income reflects a contemporaneous economic loss.
This requirement is not satisfied by expensing early, by deferring revenue, or by under-reporting
income or book value on a regular basis (e.g., creating excessive provisions in all years), none of
which is correlated with contemporaneous real income. The difference in definitions is most
apparent in Basu’s primary research design, which studies the asymmetric incorporation of
economic gains and losses (proxied by positive and negative stock returns over the fiscal year) in
current-year accounting income.
The distinction between conditional and unconditional asymmetry is central to
understanding the role of conservatism in efficient contracting with the firm. Watts (1993,
abstract page) hypothesizes that accounting conservatism “evolved from accounting’s contracting
role.” He singles out “avoidance of inappropriate distributions to claim holders” to protect more
senior claims (notably, debt) as “an important contracting reason for conservatism.” Watts (1993,
page 5) mentions the effect of conservatism “to offset the manager’s optimism (engendered by
compensation based on income).”11 Gilman (1939, page 232) explores similar effects of
conservatism, and also suggests a political costs motive.
The “timely loss recognition” version of conservatism provides fresh insight into its
contracting role. It is difficult to see how contracting is affected by conservatism in the form of
an unconditional accounting bias of known magnitude. Rational agents would simply invert the
10 See, for example, (Gray 1980). Delaying recognition or under-reporting income correspondingly reports lower book values of equity, hence lower asset values or higher liabilities.

11
bias. For example, if book values of assets were under-reported by a known proportion ?,
leverage covenants would increase the proportion of book value that firms could borrow by a
factor of (1-?)-1, without affecting the lending rate or the circumstances under which covenants
were violated. In addition, unconditional biases reduce opportunities to account in a conditionally
conservative fashion (for example, writing off assets at acquisition eliminates the opportunity to
impair them at the time of economic losses). Contracting-based demand for a known
unconditional bias thus seems unlikely. Further, an unconditional bias of unknown magnitude
introduces randomness in decisions based on financial information and can only reduce
contracting efficiency.12 In contrast, the conditional form of conservatism (timely loss
recognition) can improve contracting efficiency. It more quickly triggers debt covenant violations
that transfer decision rights to lenders, allowing lenders to restrict managers’ actions (such as
distributions, borrowing, and new investment) sooner after economic losses become apparent,
thereby increasing the efficiency of debt contracting. Similarly, timely loss recognition gives
managers less incentive to undertake ex ante negative-NPV projects and more incentive to
abandon ex post loss-making investments quickly, thereby increasing the efficiency of
compensation contracting and corporate governance. 13 While unconditional conservatism seems
inefficient or at best neutral in contracting, conditional conservatism (timely loss recognition) can
enhance contracting efficiency.
Confusion between the unconditional and conditional versions of conservatism helps
explain why conservatism is a controversial property of accounting, despite its long–standing
11 Earlier, Watts and Zimmerman (1986, page 206) hypothesized a purpose of conservatism is to “offset managerial optimism (presumably encouraged by earnings-based compensation plans).” 12 These points are made in the context of German vorsicht conservatism in Ball (1998). 13 The role of timeliness in debt and governance is discussed in Ball, Kothari and Robin (2000, page 52), Ball (2001, pages 138-140), and Ball, Robin and Wu (2003, pages 4-5).

12
influence on practice.14 Ambivalence is evident in APB Statement No. 4, which seemingly
approves of conservatism in its unconditional version (AICPA 1970, ¶171):
Conservatism. Frequently, assets and liabilities are measured in a context of significant uncertainties. Historically, managers, investors, and accountants have generally preferred that possible errors in measurement be in the direction of understatement rather than overstatement of net income and net assets.
while combining the versions among accounting’s “characteristics and limitations” (¶35):
Conservatism. The uncertainties that surround the preparation of financial statements are reflected in a general tendency toward early recognition of unfavorable events and minimization of the amount of net assets and net income.
Later, FASB Statement of Financial Accounting Concepts No. 2 defines conservatism with
seeming approval as “prudent reaction to uncertainty” (FASB 1980, Glossary), which it interprets
by quoting the unconditional version of APB Statement No. 4 (¶171, cited above). It then appears
to cite the unconditional version disapprovingly:
The convention of conservatism, which was once commonly expressed as “anticipate no profits but anticipate all losses,” developed during a time when balance sheets were considered the prime (and often only) financial statement, and details of profits or other operating results were rarely provided … .”
Ambivalence toward conservatism could reflect confusion between its unconditional and
conditional forms. As argued above, in a contracting setting unconditional conservatism seems at
best neutral (if the bias is known) and possibly inefficient (if the bias is unknown). In contrast,
conditional conservatism involves timely loss recognition, and thereby increases the efficiency of
debt and compensation/governance contracting. From a contracting perspective, conditional and
unconditional conservatism are substantially different concepts.
2.4 Time-series test of timeliness in loss recognition
Our principal timeliness measure exploits the transitory nature of economic income
[Samuelson (1965), Fama (1970)]. It measures timely gain and loss incorporation as the tendency
14 Basu (1997, pages 8-9) cites evidence of conservatism in accounting as early as the fifteenth century. Gilman

13
for increases and decreases in accounting income to reverse (Basu 1997), an indicator of
transitory gain and loss components. Our hypothesis is that there is less reversal of income
decreases in private companies than in public companies, reflecting a lower frequency of timely
loss recognition due to lower demand for financial reporting quality.
To identify transitory gain and loss components in accounting income, we therefore
estimate various specifications of Basu’s (1997) piecewise -linear regression:
∆NIt = α0 + α1D∆NIt -1 + α2∆NIt -1 + α3D∆NIt -1*∆NIt -1 + ε t (1)
∆NIt is change in income (alternatively defined as including and excluding extra-ordinary and
exceptional items) from fiscal year t-1 to t, scaled by beginning book value of total assets.
D∆NIt -1 is a dummy variable taking the value 1 if the prior-year change ∆NIt -1 is negative.
Untimely recognition of economic gains, by deferring incorporation in income until their
underlying increases in cash flows are realized, causes gains to be recognized as “persistent”
positive components of accounting income that tend not to reverse. The implication is α2 = 0.
Alternatively, timely recognition of economic gains implies they are recognized as “transitory”
increases in income components that do tend to reverse, the implication being α2 < 0. Similarly,
timely recognition of economic losses implies they are recognized as transitory income decreases,
and hence reverse, the implication being α2 + α3 < 0. The hypothesis that economic losses are
recognized in a more timely fashion than gains implies α3 < 0.
The independent variable in this specification is change in income, which has two primary
advantages. First, changes provide the correct specification for identifying transitory income
components. 15 Second, the incremental coefficient α3 is less likely to be affected by survival
biases in a changes specification, because survival frequencies are likely to be more similar in
(1939, especially pp. 201-204) describes the controversy, which persists to this day. 15 Hayn’s (1995) bankruptcy model predicts a non-linearity, but it applies to income levels.

14
samples of negative and positive earnings changes than in samples of negative and positive
earnings levels (i.e., loss-making firms are less likely to survive than profitable firms
experiencing earnings decreases). The non-linearity is due to accounting income being a mixture
of two processes: a type of moving average of current and past economic gains; and a
substantially less smoothed, more transitory incorporation of economic losses.
2.5 Accruals-based test of loss recognition
Basu’s serial dependence model (1) has two potential limitations. First, it cannot
distinguish transitory gain or loss components in earnings from random errors in accruals (such as
miscounting inventory) and from some types of earnings management (such as excess provisions
that revert over time). All are transitory and cause negative serial dependence in income changes.
Second, the model can only identify the existence of transitory components, and not whether their
recognition is timely or untimely. Basu’s association test mitigates both limitations by identifying
whether transitory earnings components are contemporaneously correlated with stock returns,
which proxy for economic gains and losses. Private companies do not have stock returns, so we
develop an alternative model that exploits the likelihood that timely loss recognition occurs
through accounting accruals. The model adapts the Dechow, Kothari and Watts (1998) model to
incorporate the recognition of unrealized gains and losses via accruals.
The role of accruals in the Dechow, Kothari and Watts (1998) model is to mitigate noise
in operating cash flow. 16 For example, other things equal (specifically, accounts payable) the cash
flow effects of a transitory fall in inventory reverse over time: an increase in the current year and
a decrease in the following year. Accrual accounting attempts to eliminate these transitory effects
by matching the cost of inventory sold, rather than the cost of inventory purchased, against sales
revenue. A primary function of working-capital accruals thus is to construct an earnings variable
16 The model builds on Dechow (1994) and Guay, Kothari and Watts (1996).

15
that is less noisy than cash flow from operations. One implication is that accruals and cash flow
from operations are contemporaneously negatively correlated (Dechow 1994).
We envision a second role for accruals, timely recognition of economic gains and losses,
and hypothesize it is a source of positive but asymmetric correlation between accruals and
contemporaneous cash flows. The positive correlation between accruals and cash flows arises
because cash flows from an individual durable asset (such as plant and equipment, or an ongoing
production process) tend to be correlated over time, or “persistent.” This implies that revisions in
current-period cash flow are positively correlated with current revisions in expected future cash
flows. For example, an investment experiencing decreased current-period cash flow is likely also
to be experiencing a downward revision in its future prospects: i.e., in its expected future cash
flows. Timely gain and loss recognition is based on expected not realized cash flows, and
therefore is accomplished through accruals. It follows that timely gain and loss recognition is a
source of positive correlation between accruals and current-period cash flow, thereby attenuating
the negative correlation predicted by the Dechow, Kothari and Watts (1998) model.
The above argument is assisted by the following illustration, adapted from Ball, Robin
and Wu (2003). Consider an asset that at the beginning of period t is an L-period annuity of
expected future cash flows, CF. Assume new information arriving at the end of period t causes a
revision ∆CFt in both its current-period cash flow and its expected cash flows for all remaining
future periods. For example, the market for the products produced out of an economically specific
plant might have shrunk in the current period, without prospects for recovery, thereby
permanently impairing the cash flows associated with the plant. The current-period cash flow
effect of the information is ∆CFt. To analyze the contemporaneous effect on accruals, assume
without loss of generality a discount rate of zero. The new information then generates a reduced
present value of future cash flows of (L-1)∆CFt, which is correlated with the revision in current-

16
period cash flows ∆CFt (perfectly correlated in this simple example) and also with the level of the
current-period cash flow CFt (of which ∆CFt is but a part). To the extent this reduction in present
value is accrued as a component of current -period accounting income as an impairment charge, it
is a source of positive correlation between accruals and both cash flows and cash flow revisions.
The asymmetry in this accruals model arises because economic losses are more likely to
be recognized on a timely basis, as unrealized (i.e., non-cash) accrued charges against income.
Economic gains are more likely to be recognized when realized, and hence accounted for on a
cash basis.17 This asymmetry implies that the positive correlation between cash flows and
accruals arising from the second role of accruals is greater in the case of losses. We therefore
estimate a piecewise-linear relation between cash flows and accruals:
ACCt = β0 + β1*DCFOt + β2*CFOt + β3*DCFOt*CFOt + νt (2)
Cash flow from operations (CFOt) is measured as earnings before exceptional and extra-ordinary
items less accruals.18 Accruals (ACCt) initially are measured as:19
ACCt = ∆Inventory + ∆Debtors + ∆Other current assets - ∆Creditors - ∆Other current
liabilities – Depreciation (3)
Both accruals and cash from operations are standardized by the beginning of period total assets.
DCFOt is a dummy variable taking the value 1 if CFOt is negative, and 0 otherwise.
This model provides for both roles of accruals: mitigation of noise in cash flow and
asymmetric recognition of unrealized gains and losses. We predict a negative coefficient for cash
flows β2 , as in Dechow, Kothari and Watts (1998). Under our hypothesis that accrued losses are
17 No such asymmetry would occur if accruals functioned only to reduce earnings variability. Accruals then would be negatively related to both negative and positive changes in cash flow from operations. 18 Exceptional and extra-ordinary items tend to be accrued liabilities or diminutions in value of fixed assets. 19 Section 6.3 also reports results for a smaller sample of firms that report cash flow statements. “Debtors” and “Creditors” in U.K. terminology are equivalent to Accounts Receivable and Payable in U.S. terminology.

17
more likely in periods of negative cash flows, we predict a positive incremental coefficient β3 for
negative cash flows. We offer no prediction for the intercept β0 or the “dummy” intercept β1.
3. Hypothesis: Different demand for financial reporting in private and public companies
Private companies have different ownership, governance, financing, management and
compensation structures than public companies. They do not have access to public capital
markets, and their financial statements are not widely distributed to the public. Consequently,
their financial reporting is more likely to be influenced by dividend and retention policies, as well
as income tax policies. These important differences between private and public companies can be
exploited to further our understanding of the economics of financial reporting generally.
In this section, we outline the institutional framework for private and public company
reporting in the U.K., and develop our hypothesis that their financial reporting fulfils different
economic functions and hence differs in quality, even under identical accounting standards.
3.1 Regulatory influences: U.K. company law for private and public companies
In the United Kingdom, all limited liability companies are formed by incorporation with
the Companies House, the government agency that administers them. They are registered as
either public or private companies. Public companies must incorporate ‘public limited company’
or ‘plc’ in their name, whereas private limited liability companies need only include ‘limited.’20
Public companies must have a minimum share capital of £50,000 before they can commence
business, whereas there is no minimum share capital requirement for pr ivate companies. 21
The most important distinction between private and public companies relates to their
ability to raise funds from the general public. A public company has an unrestricted right to offer
shares or debentures to the public, whereas this is prohibited in the case of a private company. 22
20 Section 25 of Companies Act, 1985. 21 Section 117 of Companies Act, 1985. 22 Section 81 of Companies Act, 1985.

18
Since only public companies can issue shares to the general public, only they are eligible to be
listed. In our empirical analysis, we define “public companies” as those listed on the London
Stock Exchange.
Prior to 1967, only public companies were required to file their financial statements with
the Registrar of Companies House. In the preceding years there was a substantial increase in the
number of firms incorporated as private companies, and also in the pe rcentage of private
companies being liquidated or struck-off the Companies Register, which sparked political fears of
abuse and creditor protection. This led to the Companies Act of 1967 requiring all companies,
private and public, to file their financial statements annually with the Registrar.
The 1981 Companies Act modified this provision, allowing “small” and “medium-sized”
companies to protect their financial affairs from public scrutiny by reporting only abridged
financial statements. Under the Act, “Small” companies have (i) annual revenue (“turnover”) not
exceeding £2.8 million, (ii) book value of total assets not exceeding £1.4 million and (iii) average
number of employees not exceeding 50 for the last two years. “Medium” companies have (i)
revenue not exceeding £11.2 million, (ii) total assets not exceeding £5.6 million and (iii) average
number of employees not exceeding 250 for the last two years. Small companies are required to
submit only an abbreviated balance sheet, and medium companies are required to submit also an
abbreviated profit and loss account (which need not disclose sales).23
The financial statements of private (public) companies must be filed within ten (seven)
months of their fiscal year. Failure to file is a criminal offense. All f inancial statements must be
prepared in accordance with U.K. accounting standards, whether the firm is public or private. 24
They must be audited if annual sales exceed £350,000, a threshold exceeded by all firms in our
23 Sections 246 and 246A of the Companies Act, 1985 24 Sections 221-242 of Companies Act, 1985 lay down the rules for submission of accounts and audit reports.

19
sample. 25 U.K. tax laws likewise do not discriminate between public and private firms.26 London
Stock Exchange listing rules require additional disclosure for public companies, but do not
mandate accounting standards for financial reporting and in particular do not address the
calculation of earnings. In all important respects, the U.K. regulatory regimes governing financial
reporting for public companies and all but the smallest private companies are equivalent.
3.2 Market influences: demand and supply of earnings quality in private and public companies
Differences between the actual financial reporting practices of private and public
companies depend on the demand for and supply of financial reporting. We reason that, relative
to public companies, the demand for financial reporting in private companies arises relatively less
from reducing information asymmetry between managers and other parties (lenders, shareholders,
suppliers and customers) and relatively more from other sources (tax, dividend and compensation
payment policies). We also reason that there is sufficient flexibility in the application of
accounting rules to allow financial reporting practice to respond to demand differences between
public and private companies, even under uniform regulations. In other words, we hypothesize
the supply of financial reporting quality is not inelastic, rules notwithstanding.
3.2.1 The demand for earnings quality
Our fundamental hypothesis is that private companies are more likely than public
companies to communicate privately, on an “as needed” basis, with shareholders, creditors,
employees, suppliers, customers and others, thereby reducing the demand for public financial
reporting quality. Private communication would be comparatively inefficient for public
companies, which contract in larger volume “at arm’s length.” For example, public companies
face an almost unlimited number of actual and potential shareholders, whose identities change
almost continually through stock market trading. For public firms in common-law countries like
25 The threshold was increased to £1 million after June 2000 (Section 249A of Companies Act).

20
the U.K., information asymmetry therefore is ameliorated more through public dissemination of
information than is the case in private companies. Private companies typically are more closely
held, shareholder turnover is lower, and shareholders take a more active role in management,
which reduces their reliance on financial statements for monitoring managers. 27 The implication
is that higher-quality financial statements are demanded from public companies on average than
from private companies.
Debt contracting differences between private and public companies constitute a
potentially important determinant of financial reporting quality. The median private company in
our sample has more total debt, though less long-term debt, than the median public company (see
Table 2). We surmise this reflects greater use of trade credit and bank debt by private firms,
though the data we use are not sufficiently fine to verify this. We have been unable to uncover
reliable information on systematic differences (if any) between U.K. private and public company
debt agreements. We suspect private companies communicate with lending banks on a more
private, “insider” basis than public companies, thereby reducing the demand for financial
reporting quality, but we cannot confirm this.
The demand for higher quality in public-company financial statements is reflected in the
greater legal obligations of issuers – managers and auditors – to recognize economic losses in a
more timely fashion, and in the litigation costs of failing to do so. Managers and auditor s of
private firms implicitly or explicitly contract for a lower level of financial reporting quality, and
face lower litigation costs for supplying it.28
26 UK corporate tax in 1998 was a 31% flat rate for both public firms and private firms with sales over £300,000. 27 For example, see Nagar et al. (2002). Ke, Petroni and Safieddine (1999) and Beatty, Ke and Petroni (2002) show, in a sample of U.S. insurers and banks, that publicly-held firms rely more on accounting information for performance measurement and for monitoring managers than do privately-held firms. 28 Thompson and Thomas (2002) show that in Delaware Court of Chancery cases alleging breach of fiduciary duties by corporate officers and directors, less than 10% related to private corporations. This contrasts with the predominance and aggregate size of private companies in the economy (see n.1). St. Pierre and Anderson (1984) and Palmrose (1997) show that U. S. auditor litigation involving privately held firms is comparatively infrequent.

21
We therefore expect less demand for financial reporting quality in private companies. If
financial reporting in private companies is oriented less to reducing information asymmetry, then
correspondingly it is determined more by other factors, such as tax, dividend or compensation
policies. The influence of tax policy on private firms’ financial reporting would arise from the
lower benefit, relative to cost, of keeping separate tax and financial reporting records. We
discuss the effect of taxes on our results in Section 7 below.
3.2.2 The supply of earnings quality
We believe there is sufficient flexibility in the application of accounting standards to
allow the supply of financial reporting quality to respond to demand. It is well known that
accruals present flexibility in financial reporting (e.g., Dechow 1994, page 5), because accruals
by definition are not observable cash outcomes at the time of reporting and require estimates of
future cash outcomes. Thus, for any set of accounting, auditing and tax standards, we predict
there is sufficient supply elasticity to respond to differences between public and private
companies in the demand for financial reporting quality.
The fundamental reason for earnings quality to differ between private and public
companies therefore is that their financial statements fulfill different economic roles: that is, the
demand for quality varies. The lower demand for financial reporting in private firms has an
international parallel in the financial reporting by public companies in countries that resolve
information asymmetry via “insider access” rather than “arm’s length” public disclosure.
Examples of insider access include the German “stakeholder” system, with both labor and capital
(bank) represented in corporate governance, the Japanese keiretsu and South Korean chaebol
systems of investing and trading largely within internally-informed corporate groups, and the
Chinese system of family-controlled businesses and guanxi (connections) networks. The
international evidence is consistent with insider access and high quality public financial reporting

22
being substitutes for reducing information asymmetry, so we expect private and public companies
follow a similar pattern.
4. Data
4.1 Sample selection
Data are obtained from the March 2000 and earlier versions of the “Financial Analysis
Made Easy” (FAME) database supplied by Bureau Van Dijk. The database provides financial
statement information on over 100,000 public and private British companies for fiscal years
ending between January 1989 and December 1999. It is compiled from records filed at the
Companies House in Cardiff, London and Edinburgh, and supplemented with information taken
from the London and Edinburgh Gazettes. Its coverage is less detailed in the initial years.
The database is updated monthly. When a firm converts from one type to another (private
to public, for example), all its past information is classified in subsequent versions of FAME
under the latest type. We therefore checked the firm type in older versions of the database for
each year over the sample period, 1990 to 2000. Changes in type were verified against the listing
or delisting date from the London Share Price database and/or the date of last change of name in
the FAME database (conversion from private to public requires a name change in the U.K.). The
database does not include banks, insurance companies and other financial institutions. It includes
only companies with either annual turnover greater than £750,000 or pre-tax profits greater than
£45,000, or shareholders’ funds greater than £750,000. Further, since certain firms with sales of
less than £350,000 are exempt from audit, we deleted firms with less than £350,000 in sales to
ensure that our sample includes only firms that meet the audit requirement criteria. Thus, very
small companies are not represented, and there is a small survivor bias. There is no other survivor
bias because coverage starts when a firm first files accounts with the Companies House and stops
only when it ceases functioning as a separate legal entity.

23
We exclude subsidiaries because the economic role of their financial reporting likely is
different.29 For example, Ford Motor Company Limited (U.K.) is a private, wholly owned
subsidiary of Ford Motor Company (USA). Its financial statements by definition are “internal”
reports. We also exclude all firm-years in which the fiscal year was not exactly twelve months or
a change in organizational type (such as public to private) took place.
Several forms of verification are used by the vendor to insure accuracy of the FAME data.
In addition, we screen out observations judged likely to be erroneous, based on the following
rules. First, we exclude firms for which book value of total assets changed by over 30% from the
prior year. These are likely to be firm-years in which a major acquisition, restructuring or
divestment occurred. 30 Second, we exclude firm-years in which accounting numbers were
inconsistent (e.g., revenues, expenses and profits were inconsistent) or irreconcilable across the
different monthly versions of FAME. After these exclusions and after requiring firms to have
data for our analyses, the sample consists of 54,778 (1475) firms and 141,649 (6,208) firm-years
for private (public) companies.
Due to data errors and scaling problems, we study a truncated sample that excludes 1% of
the accounting variables at each extreme. Data errors are a concern because companies do not file
with the Companies House electronically. There undoubtedly are undetected data entry errors,
especially in view of the large size and limited circulation of the database. Errors introduce noise
in measuring income, leading us to over-estimate the extent of both positive and negative
transitory components. Scaling problems arise from near-zero observations in the scaling
variables.31 Kothari, Sabino and Zach (1999) demonstrate that truncating skewed distributions
29 The FAME database indicates whether a firm is a subsidiary. 30 This could exclude genuinely extreme gains or losses, so we re-ran the regressions in Tables 3 to 5 below with: (1) no exclusion based on change in total assets; and (2) excluding firms/years when total assets changed by less th an -50% or more than 100%. Neither modification had a qualitative impact on the results. 31 For example, when scaled by total assets the extreme values for change in net income before exceptional and extraordinary items are -1305555% and 30700%.

24
such as earnings can bias test statistics, but we believe that there are sufficient errors (as distinct
from genuinely extreme observations) in the data to warrant it. We repeat the analyses with 0.5%
and 2% exclusion criteria, and our conclusions are unaltered. 32
4.2 Descriptive statistics
Little is known about private companies generally and about the database used in this
study, so we provide relatively detailed descriptive statistics. To maintain comparability with our
results, we present descriptive statistics only for the data used in our tests. 33 This restriction
essentially excludes very small firms that are required by the Companies Act to report only the
balance sheet and not the profit and loss account. For ease of presentation, we separately describe
income statement (Table 1) and balance sheet (Table 2) variables. Panels A and B present
statistics for public and private companies respectively, with t-statistics for a two tailed test of
differences in means between private and public. The t-statistics must be interpreted with
caution, since they control for neither cross-sectional nor serial correlation.
4.2.1 Income statement items
Table 1 presents descriptive statistics for the income statement variables. Size is the most
obvious difference. Listed firms in the sample have mean annual sales of £432 million, compared
to £6 million for private firms. Other measures of firm size (such as total assets and number of
employees) exhibit typical right skewness for both private and public firms, indicating the
presence of a few relatively large firms in both groups. The substantial size difference between
private and public firms suggests the need to control for size in our earnings quality analyses.
32 When ext reme observations are not deleted, the coefficients representing differences between public and private firm reporting (α7 and β7, defined below) are significant with the predicted signs, but the r-squares and t-statistics are substantially reduced. Due to the magnitude of the outliers and their influence on the regressions, we place little weight on these results. 33Descriptive statistics are for all firm-years with data availability, which varies across firm-years and data items. Statistics for the full sample can be obtained from: www.london.edu/faculty/lshivakumar.
25
Table 1
The mean net income after exceptional and extra-ordinary items, scaled by total assets,
averages 4.8% for publicly listed firms and 5.2% for private firms.34 Other definitions of net
incomes are also marginally higher for private firms compared to listed firm. This is consistent
with private firms being more profitable, or more capital-constrained. However, it also is
consistent with different loss and gain recognition practices between the samples. Thus, the
ranking of the medians is reversed (5.6% for listed firms and only 4.1% for private firms),
indicating that private-firm earnings are right-skewed but public-firm earnings are left-skewed.
This is consistent with a greater one -time recognition of capitalized gains by private firms, and/or
greater one-time recognition of capitalized losses by public firms and is our first evidence of
reporting quality differences between the groups.
The next descriptive evidence of reporting quality differences between public and private
companies comes from their different practices in reporting exceptional and extra-ordinary
items.35 Under U.K. accounting standards, both items arise from material events or transactions
that are unusual and non-recurring in nature. Exceptional items arise within the firm’s ordinary
business activities, whereas extra -ordinary items arise outside its ordinary activities (FRS 3).
Public firms report significantly negative average exceptional and extra-ordinary items combined
(-0.5% of total assets, or approximately one-tenth of average net income before exceptional and
extra-ordinary items), compared with an average of 0.0% for private firms. Public firms report
either an exceptional or extra-ordinary item in 57% of all firm-years, with negative values in 35%
of all firm-years. In contrast, private firms report exceptional or extra-ordinary items in only 13%
of firm-years, with negative values in only 7% of firm-years. Exceptional and extra -ordinary
34 For variables that are scaled by beginning of year total assets, we repeated the analyses using either sales or end of year total assets. The results are qualitatively unchanged. 35 Exceptional items (and income before exceptional and extraordinary items) are on the FAME database after 1994.

26
items thus are frequent and asymmetric in public companies, but less frequent and symmetric in
private companies. These data are consistent with listed companies recognizing economic losses
in a more timely manner, as negative transitory (“one time”) components of income.36 This is
despite public companies on average being substantially larger and having less volatile earnings
before exceptional and extra-ordinary items (standard deviation of 8.4% versus 9.2%).
The earnings skewness statistics show a similar picture. Income is positively skewed for
private firms, but negatively skewed for public firms, consistent with them recording a greater
frequency of large losses. The skewness statistics for income before both exceptional and extra-
ordinary items are –1.2 and +0.5 for public and private firms, respectively. The equivalent
skewness statistics for income after both exceptional and extra-ordinary items are –1.3 and +0.5.
The substantial difference in skewness between the private and public firms occurs despite them
exhibiting near-identical skewness for Sales (+4.0 and +3.9) and Cost of Sales/Sales (-1.0 for
both), and despite private firms exhibiting substantially greater earnings volatility. The income
skewness difference also occurs despite public and private firms exhibiting similar skewness in
accruals (-0.3 and –0.2), suggesting the relation between cash flow and accruals differs between
the two groups. We take up this suggestion in our accruals-based model (2), reported in table 5
below. Overall, the negative earnings skewness for public firms is consistent with income
conservatism – that is, timelier recognition of economic losses than gains, as large transitory
items. In contrast, private firms exhibit positive earnings skewness.
4.2.2 Balance sheet items
Table 2 presents summary statistics for balance sheet items. Substantial size differences
between private and public companies are apparent, as in the income -statement variables. The
average public company has total assets of £419.9 million, while the average private firm has
36We report below that most of the asymmetry is in earnings before exceptional and/or extra-ordinary items.

27
total assets of only £3.7 million. The first decile of total assets for public (private) firms is £10.5
million (£0.3) and the ninth decile is £1093.6 million (£9.1). This is further evidence of the need
to control for size in our analysis of differential earnings quality.
Table 2
5. Results: Timely loss recognition in private and public companies
The descriptive statistics provide preliminary evidence that listed public companies
recognize larger loss components in book income than private firms. This section investigates
whether they are more likely to report loss components of income that are transitory in time, and
whether their accrual behavior is consistent with transitory loss recognition.
5.1 Differential mean reversion in earnings changes
Table 3 presents the results from estimating the following version of the regression (1),
modified to a llow differences between private and public firms:
∆NIt = α0 + α1D∆NIt-1 + α2∆NIt-1 + α3D∆NIt-1*∆NIt-1 + α4DPR
+ α5DPR*D∆NIt-1 + α6*DPR*∆NIt-1 + α7DPR*D∆NIt-1*∆NIt-1 + εt (4)
where DPR is a dummy variable that takes the value 1 for private firms and 0 for publicly-listed
firms, and other variables are as defined above.
Our predictions concerning public companies are based on the reasoning and evidence
reported in Ball, Kothari and Robin (2000) and Ball and Robin (1999) for companies listed in the
U.K. and other common law countries. We predict deferred recognition of economic gains, as
“persistent” positive components of accounting income, the implication being α2 = 0. We also
predict economic losses receive timelier recognition than gains, as transitor y income decreases,
the implications being α3 < 0 and α2 + α3 < 0.
We expect private company financial reporting to be substantially different. We have no
hypotheses concerning differences between public and private companies in gain recognition, so

28
we offer no prediction on the incremental private-company coefficient on earnings increases, α6.
Our primary hypothesis is that private firms are less likely to recognize economic losses in a
timely fashion than public firms, the prediction being α7 > 0. We offer no prediction for the
intercept and incremental intercept coefficients α0 , α1, α4 and α5.
Table 3
Panel A of Table 3 reports results for three definitions of income: income before both
exceptional and extra-ordinary items; income after exceptional items, but before extra-ordinary
items; and income after both exceptional and extra-ordinary items. This allows us to examine the
role of exceptional items and extra-ordinary items in timely loss recognition (Pope and Walker
1999). Prior to 1994, the FAME database has limited data on income before exceptional and
extra-ordinary items and on exceptional items, so the regressions for those variables have
considerably lower sample sizes.
For public companies, there is clear evidence of transitory loss but not gain components,
under all income definitions. The coefficient α2 on lagged positive earnings changes is small and
insignificant, ranging from -0.006 to 0.04 depending on the income definition. This indicates a
near absence of either continuation or reversal of income increases. Conditional on an increase,
the level of income thus is “persistent” because the increase has essentially no “momentum,” with
at most 4% continuing on as an increase in the following year. The persistence of the level of
income after experiencing an increase is consistent with the deferred recognition of economic
gains as repeating elements over time in accounting income. In contrast, the sum of the
coefficients α2 + α3 ranges from -0.59 to -0.67 across the three income definitions, indicating a
substantial (on average, approximately sixty to seventy percent) reversal of income decreases (in
all regressions, the p-value from an F-test for the sum of the coefficients is less than 0.0001). This
is consistent with timely recognition of economic losses as non-repeating transitory components

29
of income. The incremental coefficient α3 on lagged negative earnings changes is significantly
negative, ranging from –0.58 to –0.71, consistent with loss recognition being substantially more
timely (i.e., more transient) than gain recognition. The α3 coefficient estimates are only slightly
larger in absolute value when earnings is defined after exceptional and/or extra-ordinary items,
suggesting that most transitory loss components of earnings are not classified by U.K. public
companies as either exceptional or extra-ordinary.
Because our hypothesis is that private company financial reporting is substantially
different, we focus on the incremental coefficients α6 and α7, particularly the latter. Relative to
public companies, private companies are more likely to incorporate transitory gains , since the
incremental private-firm coefficient α6 on earnings increases is significantly negative for all
income definitions (coefficients of -0.15, -0.21 and –0.20; t-values –3.57, -7.48 and –7.56). As
hypothesized, private companies are less likely than public companies to incorporate transitory
losses in income, since the incremental private-firm coefficient α7 on income-decreases varies
from 0.35 to 0.47 and is statistically significant for all income definitions (t-values of 5.35, 10.59
and 10.81). That is, decreases in private-company income are substantially less transitory, but
increases are substantially more transitory. Overall, these results are consistent with our
hypothesis that private companies report lower-quality earnings, with substantially less
asymmetry in the timely recognition of gains and losses.37
Figures 1 and 2
37 The other significant coefficients are α1, α4 and α5, for which we offered no prediction. All are incremental “dummy” intercepts, identifying negative lagged changes in income, private firms and the interaction of those variables, respectively. α1 indicates that changes in net income for listed firms on average are 0.1% of total assets lower following years of decreases in income than after increases, controlling for all other variables in the regression. α4 indicates that changes in net income average 0.4% of total assets more for private than public firms, controlling for all other variables. α5 indicates that, for private firms relative to public firms, the average change in net income in the year after income decreases is smaller by 0.9% of total assets, again controlling for all other variables.

30
Figure 1 graphs the serial dependence coefficients for income changes in private and
public firms, with income defined before and after both exceptional and extra-ordinary items. It
shows that negative earnings changes are substantially less transitory for private companies, and
positive changes are more transitory. Figure 2 compares the U.K. public and private samples with
the most comparable common law, code law and East Asia public-firm groups reported in prior
research. 38 U.K. private firms most closely approximate the code law group, which is not
surprising in view of their similar “insider access” model of ameliorating information asymmetry.
The sample of firm-years underlying Panel A of Table 3 varies across alternative
definitions of net income, primarily due to the absence of data on exceptional and/or extra-
ordinary items in the earlier years of the FAME database. Panel B of Table 3 therefore reports
results from a sample that is constant across all income definitions. No coefficient changes
substantially in sign or magnitude, and our conclusions are qualitatively unchanged.
Pope and Walker (1999) claim that UK accounting standards cause income before
exceptional and/or extra-ordinary items to incorporate substantially fewer negative transitory
elements than income after these items. There is little evidence of this in our private company
sample, which reports under UK standards. The three versions of income exhibit similar
skewness statistics (0.5 in Table 1). In Panel B of Table 3, the slope of earnings changes on
negative lagged earnings changes is the sum α2 + α3 + α6 + α7, which is approximately –0.4 for
all income definitions.39
5.2 Controls for size, industry and leverage
Table 4 reports results from versions of regression (4) with controls for size and industry
composition, which proxy for exogenous volatility in economic income. Size also is correlated
38 For comparability, U.K. results are for income after exceptional and extra -ordinary items (Pope and Walker 1999).

31
with listing status, and larger firms – both public and private – could report losses in a more
timely manner than small firms, due for example to greater litigation risk or different agency
costs. We check this possibility by adding the rank of year-end total assets (SIZEt) as an
interactive variable. The results in Panel A of Table 4 show that size adds little or no explanatory
power: adjusted r-squares increase by less than 0.5%. The coefficient on SIZE* ∆NIt-1*D∆NIt-1
varies between 0.01 and 0.10 and is significantly positive in two of the three regressions,
consistent with larger firms being more likely to report transitory losses. Nevertheless, the
coefficient in which we are primarily interested, the α7 slope on DPR*D∆NIt-1*∆NIt-1, continues
to be statistically significant and varies from 0.38 to 0.53. Size differences thus do not explain
differences between public and private companies in gain and loss recognition practices. In
untabulated results, we included leverage (defined as the ratio of long-term debt to shareholder’s
funds) as a further interactive variable, and the results were qualitatively unchanged. None of
these proxies for exogenous volatility in economic income affects our results.
Table 4
To test whether differences in industry composition between public and private firms can
explain our results, we re-estimated equation (2) with 349 interactive dummy variables, one for
each 3-digit SIC code. Results are reported in Panel B of Table 4. The interactive dummies
reduce the degrees of freedom, but little other change is apparent. Further, the results remain
qualitatively unaltered when size is included as an additional interactive variable.
5.3 Different public and private loss accruals behavior
Table 5 presents results from the following regression, which allows an asymmetric
relation between accruals and cash flow levels that differs between private and public firms:
39 The corresponding slope for public firms (α2 + α3) is –0.7 for income after exceptional and/or extra-ordinary items, but only –0.6 for income before these items. Private and public firms therefore differ slightly in reporting exceptional and extra-ordinary items, even though they report under the same UK standards.

32
ACCt = β0 + β1*DCFOt + β2*CFOt + β3*DCFOt*CFOt +β4 DPR
+ β5*DPR* DCFOt + β6*DPR*CFOt + β7 DPR* DCFOt *CFOt + νt (5)
The variables are as defined earlier. The role of accruals in mitigating negative serial correlation
in cash flows predicts β2 is negative. Asymmetric loss recognition predicts β3 is positive. Our
central hypothesis, that private firms are less likely to recognize losses as transitory items, implies
their asymmetry is lower. We test this by predicting β7 is negative. We offer no prediction for the
intercept coefficients β0 , β1, β4 and β5, or for the coefficient β6 reflecting the differential accruals
behavior of private firms in years with positive cash flows.
Table 5
The predictions are borne out in Table 5. For public firms, β2 is –0.61 and statistically
significant, implying that on average 61% of cash flow is offset by accruals in years it is positive.
This is consistent with accruals purging noise in cash flows from earnings (Dechow, 1994;
Dechow, Kothari and Watts, 1998). As predicted, β3 is 0.34 and significant, implying that in
years with negative cash flows only 27% (61%-34%) on average of cash flow is offset by
accruals. Thus, the negative relation between accruals and cash flow is less pronounced when
cash flow is negative, consistent with asymmetrically more unrealized loss recognition via
accruals than gain recognition. This asymmetric behavior supports our view that timely loss
recognition is an important role of accounting accruals.40
In years with positive cash flows, private and public firms exhibit very similar accruals
behavior. β6 is 0.00 and statistically insignificant, implying that accruals of private firms also
40 The asymmetry in our accruals model (5), together with a similar asymmetry in the alternative specification based on cash flow changes reported in Section 6.5 below, helps explain the asymmetric shape of the earnings and earnings changes distributions reported in Hayn (1995, Fig. 1) and Burgstahler and Dichev (1977, Fig. 1). As cash flow falls, the frequency of accrued losses (e.g., provisions, inventory write-downs, asset impairments) rises, thereby moving mass to the left tail of the earnings distribution. The earnings distribution then is missing mass above and immediately below the mean, and has additional mass in the left tail. We conjecture that much of the shape of the

33
offset on average 61% of cash flows. This does not carry over into years with cash losses: the
incremental coefficient for private firms in cash-loss years β7 is negative (-0.41) and statistically
significant (t = -10.00). The sum β2 + β3+ β6+β7 is -0.68, indicating that in negative cash flow
years private companies offset 68% of cash flows through accruals. Compared to public firms,
they appear to accrue substantially less unrealized losses in cash-loss years.
When we control for size in this regression, the explanatory power marginally increases:
adjusted r-squares increase by 1%. All the coefficients interacted with size are statistically
significant. Because size is scaled to the interval (0,1), its coefficient of 0.009 (t = 5.51) implies
that, in positive cash flow years, accruals increase by 0.9% of assets over the entire range of
public and private firm sizes. The negative coefficient -0.04 for β9 indicates that, in negative cash
flow years, larger firms report more negative accruals. The coefficient on SIZE*CFOt is
significantly negative (-0.36), indicating that the relation between accruals and positive cash
flows is more negative for larger firms. This is consistent with accruals mitigating more cash flow
noise in larger firms. The coefficient β11, which is a measure of asymmetric income statement
conservatism, is significantly positive, indicating that conservatism increases with firm size.
Relative to the regression that does not control for size, the coefficients β1 to β7, in
general, are smaller in magnitude. The only exceptions to this are β1 and β6. The significantly
positive coefficient for β1 implies that accruals on average are positive in cash loss years. β6 is
significantly negative in these regressions, which implies that, after controlling for size, private
firms use accruals to mitigate more of cash flow noise in positive cash flow years. Since listing
status is correlated with size, it is possible that our earlier results on timely loss recognition are a
size effect. However, the significantly negative coefficient on β7 suggests otherwise. Even after
earnings distribution is due to the asymmetric loss-recognition role of accruals, combined with the positive correlation between current-period cash flows and accrued losses that we model.
34
controlling for firm size, private firms have a significantly greater negative relation between
accruals and negative cash flows. This conclusion remains unchanged when we control for
interactive dummy variables for industry membership. Overall, the results from the accruals-
based test, like those based on earnings changes, show that private firms report fewer transitory
losses than listed firms.
6. Specification and other estimation issues
6.1 Fama -Macbeth t-statistics
The estimated standard errors in the pooled regressions likely are affected by cross-
sectional correlation, particularly since the data are concentrated in a small number of years. We
therefore estimated Fama-Macbeth t-statistics derived from annual cross-sectional regressions,
for all years that have non-trivial sample sizes. These t-statistics are not affected by cross-
correlation or skew (or other departures from normality) in the residuals, since they are based on
the sampling distribution of the mean of the annual regression slopes. Results are not tabulated.
The Fama-Macbeth t-statistic for the incremental private-firm coefficient on earnings
decreases [α7 in regression (4)] is significantly positive for all three income-definitions (t-values
of 2.91, 7.74 and 6.77). In the accruals regression (5), the average annual incremental private-
firm coefficient β7 on negative cash flows is –0.52, with a Fama-Macbeth t-statistic of –3.72. The
significance is attributable to a surprising degree of consistency in the annual coefficient values.
Thus, the hypothesis that private firms are less likely to report economic losses in a timely
manner is robust with respect to this test of cross-sectional dependence.
6.2 Private and public firm samples matched on size, industry and fiscal year-end.
Private firms are smaller on average than listed firms, and could have different investment
and financing policies. While we report above that the results are qualitatively unaffected by
including size and industry dummies as interactive control variables, the effects of size and
35
industry on the estimated coefficients need not be linear. Consequently, we also study a sub-
sample of private and listed firms matched on the basis of size, industry and fiscal year-end. To
conserve space, we discuss the results without tabulating them.
In each year and for each private firm, we choose, without replacement, a size-matched
firm from all listed firms with the same 2-digit SIC code and fiscal year-end.41 The chosen firm is
the closest in year-end total assets to the private firm, provided they differ by no more than 5%.42
This yields 5020 matched pairs, with the actual number for a particular analysis depending on
data availability. The average total assets is £25mn for both groups. Size-matching selects largely
from the largest decile of private firms and the smallest three deciles of listed firms.
For this matched sample, the coefficient α7 on DPR*∆NIt-1*D∆NIt-1 is significantly
positive, ranging from 0.51 to 0.72 for different income definitions (t-statistics of 4.12 to 4.72),
consistent with the full sample results in Table 3. The results from the regression of accruals on
cash from operations are qualitatively similar to those in Table 5. The coefficient β7 on
DPR*DCFOt*CFOt is significantly negative (-0.37, t-statistic of –3.97). Differences in
asymmetric recognition of economic losses therefore exist between similar-sized public and
private firms in the same industry.
6.3 Sample with directly-observed cash flows.
Operating cash flow in our accruals-based analysis is estimated from changes in balance
sheet accounts. Hribar and Collins (2002) show this is noisy, so we reran the regression using
data taken directly from the cash flow statements, with accruals estimated from operating profits
and cash from operations.43 Cash flow statement data are available for most firms only for 1995-
41 We match on 2-digit SIC codes because finer classifications yield insufficient observations for meaningful analysis. We also conducted the analyses with replacement, with no qualitative impact on the results. 42 The results are qualitatively insensitive to changing the maximum difference in total assets to either 10% or 20%. 43 Since FRS 1 (revised 1996), UK firms are required to reconcile operating profits to cash from operations before interest and taxes in their cash flow statement. US cash flow statements reconcile to income after interest and taxes.
36
1999. Despite the short sample period, β7 is consistently negative in both the pooled regressions
and in annual regressions. In the pooled regressions, the coefficient β7 is –0.43 with a t-statistic
of -5.66, while in the Fama-Macbeth regressions the average coefficient β7 is –0.62 with a t-
statistic of -3.58. Hence, our results are robust to alternative measures of cash flow.
6.4 Endogeneity of private-firm dummy.
If firms select listing status based on either expected changes in net income or expected
accruals, the dummy variable DPR is endogenous. Choice of listing status then should be
estimated simultaneously with the regressions of changes in net income (4) and accruals (5). We
believe this is highly unlikely in the income changes regression (4), because any relation between
choice of listing status and income is likely to involve the average level of income in the years
following the listing decision, not the change in a single future year. In contrast, regression (5) of
accruals on cash flows is specified in the levels, so endogeneity is a greater threat.
The standard 2SLS simultaneous equations model is inappropriate here, because the
dummy variable for listing status (the dependent variable in the choice regression) is interactive
in the regressions. Hence, we use the switching simultaneous equations model of Lee (1979),
which controls for any bias resulting from self-selection of listing status (Maddala 1983, Chapter
9). The model is estimated using the Heckman (1979) two-stage approach. In the first stage, the
listing choice equation is estimated as a probit model and, using the parameters estimated from
this model, the inverse Mills ratios are computed for all firms in the sample. In the second stage,
regression equations (4) and (5) are estimated, including the inverse Mills ratio as a control
variable and allowing its coefficient to vary between private and listed firms.
To implement the first-stage probit model, we include size, long-term leverage (a measure
of financial constraints and equity risk), the quick ratio (a measure of liquidity needs and
financial risk), the ratio of exports to total sales (a measure of risk), and sales growth (a measure
37
of growth options) as explanatory variables.44 The sample size is reduced by nearly two-thirds.
Little else changes qualitatively. In untabulated results, all the variables in the first-stage
regressions except sales growth are significant at less than the 1% level.
In the second stage income changes regression, the coefficients on the inverse Mills ratios
are insignificant, indicating a lack of endogeneity bias in this regression. Our primary coefficient
of interest (α7) continues to be significantly positive. For example, in regressions based on net
income after exceptional and extra-ordinary items, α7 is 0.28 with a t-statistic of 3.47. This
compares with 0.45 in Table 3 (for a substantially larger sample).
In the second stage accruals regression, the coefficients on the inverse Mills ratios are
significant, justifying the endogeneity concerns. However, controlling for endogeneity has little
effect on the estimated coefficients. The coefficient of primary interest (β7) is –0.42 (t = –6.82)
when endogeneity is controlled for, but for the same sample it is –0.45 (t = -7.33) under standard
OLS. Further, the adjusted r-square is identical in the standard OLS and the two stage
approaches. We find little benefit from using the two-stage approach, and focus on the results
from standard OLS regressions, which permits a larger sample.
6.5 Alternative specifications of accruals-based model.
Our accruals based regression adapts the Dechow, Kothari and Watts (1998) working
capital model to incorporate asymmetric gain and loss recognition. Several studies control for
cash flow levels when disaggregating accruals into discretionary and non-discretionary
components (e.g., Rees, Gill and Gore (1996), Jeter and Shivakumar (1999), Denis and Sarin
(2000)). However, Dechow (1994) argues that accruals are negatively related to changes in cash
flow, not its level. In addition, the discussion of our accruals model in section 2.5 predicts a
44 We also considered profitability, measured either as return on equity or as ratio of cash flows to shareholders’ funds. Inclusion or exclusion of this variable has no qualitative effect on our results.

38
positive correlation between accruals and both the level and change in current -period cash flows.
We therefore estimate an alternative specification of (5) using cash flow changes.
We replace CFOt and DCFOt in equation (5) with ∆CFOt (change in cash from operations
between period t-1 and t, standardized by total assets at end of period t-1) and D∆CFOt (a dummy
variable that takes the value 1 if change in cash flow is negative, and 0 otherwise). Consistent
with Dechow (1994), untabulated results from this specification show that accruals and changes
in cash from operations are negatively related: the coefficient on ∆CFOt is –0.412 (t-stat=-11.92).
Further, the coefficient on the interactive dummy D∆CFOt*∆CFOt is significantly positive with a
coefficient of 0.22 (t-stat=4.31). This is consistent with listed firms being more likely to use
accruals to recognize losses than gains. When the variables in the accruals model are interacted
with the private dummy, DPR, only the coefficient on the DPR*D∆CFOt*∆CFOt is statistically
significant. This coefficient estimate is –0.12 (t = –3.21), which supports the arguments that
private firms report less conservatively than public listed firms. These results are robust to
controls for size, leverage, and industry as well as to using the Fama -Macbeth t-statistics.
As a further robustness check, we included both cash flow levels (CFOt) and changes
(∆CFOt) in the accrual regressions, with the coefficients on both varying with their signs. The
primary coefficients of interest, on DPR*DCFOt*CFOt and DPR*D∆CFOt*∆CFOt, are both
significantly negative in this combined regression. Overall, our inferences from accruals -based
analyses remain unchanged irrespective of whether the independent variables in the regressions
are expressed in levels, changes or both levels and changes.
7. Alternative Explanations
7.1 Are public firms more risky?
Watts and Zimmerman (1983) argue that because firms can self-select their organizational
type for efficient risk sharing, listed firms might be higher risk. They thus could experience a
39
higher frequency and magnitude of economic losses. Even under the alternative hypothesis of
equal accounting behavior, they thus could report more and larger transitory losses. An
alternative interpretation of our results thus is that listed firms simply face greater economic risk.
We believe there are several reasons to reject this interpretation, as explained below.
First, in our tests of different loss recognition between public and private firms, we focus
on regression slope coefficients. In contrast to the covariances of the dependent and independent
variables, regression slopes are standardized by the variance of the independent variable. The
dummy slope DPR therefore controls for any difference in the variance of income changes
between public and private firms.
Second, the descriptive data in Table 1 imply that the listed-firm sample is not more risky,
in that operating cash flow (standardized by total assets) is less variable than for private firms.
The standard deviations are 10.3% and 11.8% respectively. The lowest decile of cash flow for
public firms is +0.9% of total assets, but for private firms it is –2.8%, implying a lower frequency
of cash losses. These data are more consistent with selection of firm type occurring in the
opposite direction (e.g., with high-risk firms not meeting the LSE’s listing requirements).
Third, the cash flow distributions for public and private firms exhibit similar skewness
(skew statistics of -0.1 and 0.3 respectively). Due to different financial reporting behaviors there
is a substantial difference in the skew of their earnings distributions (skew statistics of -1.3 and
+0.5 respectively, for earnings after exceptional and extraordinary items).
Fourth, risk cannot explain asymmetry in the recognition of losses and gains. Our
principal results are the significant incremental slopes α7 and β7 on DPR*D∆NIt-1*∆NIt-1 and
DPR*DCFOt*CFOt in the income-change and accruals-based regressions, respectively. Even if
there was more volatility in the cash flows of public firms than private firms and it somehow
influenced regression slopes (it should be clear from the above that neither of these premises is

40
correct), the effect on income and accruals would not be asymmetric: it would be reflected in the
slopes α6 and β6 on DPR*∆NIt-1 and DPR*CFOt, but not in either α7 or β7.
Fifth, the risk interpretation is inconsistent with the results from our accruals-based test. If
the results were due to risk differences between private and public firms, but they actually
reported losses in the same manner, then the relation between accruals and cash flows would not
differ between firm types. Accruals reflect reporting choices and cash flows reflect more
fundamental economic gains and losses; in absence of reporting differences, the relationship
between them would not differ between the samples. The regressions of accruals on changes in
cash flows show that they differ substantially.
Sixth, the evidence suggests that any risk differences between private and public
companies do not influence our results. Data limitations do not allow us to estimate individual-
company standard deviations, but we do have several valid proxies for individual-company risk.
In tables 4-6 we show that all of our results are robust with respect to controls for size, leverage
and industry membership, all of which are likely to influence the standard deviation of equity
cash flows. In our untabulated results from allowing listing choice to be endogenous, listing is
specified in the probit model as a function of size, leverage, the quick ratio (a measure of
financial risk), the ratio of exports to total sales (a measure of risk), and sales growth (a measure
of growth options). In the second-stage regression for changes in net income, the coefficients on
the inverse Mills ratio are insignificant, indicating that these proxies for risk do not have a
significant influence on the income-changes regression (4).
7.2 Does audit firm size affect earnings quality?
DeAngelo (1981) proposes that audit firm size is a determinant of audit quality. Basu,
Hwang and Jan (2001) show that earnings reported by U.S. clients of larger audit firms
incorporate economic losses in a more timely fashion. Chaney, Jeter and Shivakumar (2001)

41
report that approximately three-quarters of U.K. public firms employ “Big-five” auditors,
compared with only one-quarter of private firms. These studies suggest that the differences in
earnings quality could be due to public firms being more likely to employ large auditors. This
would not necessarily be a threat to our hypothesis, because the selection of audit firm size is
endogenous and could be a means of bonding to or signaling high quality. Nevertheless, we
investigate the relation between audit firm size and timely loss recognition.
Table 6
Panel A of Table 6 confirms that the Big-five audit 76% of our public firms, but only 19%
of private firms. Panels B and C repeat the whole-sample analyses in Tables 3, 4 and 5, for firms
with Big-five auditors. The results are similar. For the Big-five sample, α7 varies between 0.38
and 0.46 for the three definitions of income, compared with 0.35 to 0.47 for the full sample in
Table 3. Controlling for size, the coefficients are similar to the full sample in Table 4. The α7
coefficient when income is defined after exceptional and extra-ordinary items is 0.43 in Table 6,
which is lower than the 0.51 reported for this coefficient in Table 4. The β7 coefficients from the
accruals regressions in Panel C are qualitatively similar to those reported for the full sample in
Table 5. Thus, even if auditor size is viewed as an exogenous determinant of financial reporting
quality, it does not explain the difference in loss recognition between private and public firms.
7.3 Are managers of public firms more opportunistic?
Public firms could incorporate more negative transitory components in earnings than
private firms because their managers take more frequent “big baths,” allowing them to report
higher earnings in future years. This would reflect managerial opportunism, not timely loss
recognition. If negative transitory earnings components arise from earnings management, then
they are purely cosmetic and will not predict future cash flows. However, if transitory earnings

42
components reflect revised estimates of future cash flows, then both positive and negative
earnings changes will be positively correlated with realized future cash flows.
We test these differential predictions, by estimating the following regression:
CFOt+1 = α0 + α1 NIt-1 + α2 I∆NI<0 + α3 I∆NI>=0*∆NI t + α4 I∆NI<0*∆NI t + α5 DPR + α6 DPR*NIt-1
+ α7 DPR*I∆NI<0 + α8 DPR* I∆NI>=0*∆NI t + α9 DPR* I∆NI<0*∆NI t + εt+1 (6)
where: CFOt+1 is cash flow from operations in year t+1 as reported in the cash flow
statement, standardized by total assets at end of year t; NIt-1 is income (before or after)
exceptional and extra-ordinary items, standardized by total assets at the end of year t-2; ∆NI t is
the change in income from year t-1 to t, standardized by total assets at end of year t-1; and I∆NI<0
(I∆NI>=0) is an indicator variable for negative (non-negative) earnings changes in year t. The
model includes the interactive dummy variable for private firms, DPR.
We include NIt-1 in the above model to control for expected CFOt+1 conditional on
information at the beginning of year t, and predict its coefficient α0 is positive. Our basic
hypothesis that private firms’ earnings are of lower quality implies they are less informative
about future cash flows, so we predict α6 is negative. This specification allows us to examine the
news about future cash flows contained in the current period's unexpected earnings, measured as
earnings change (∆NI t). Since asymmetric recognition of economic losses and gains could cause
positive and negative earnings changes to have different information about future cash flows, we
interact earnings change with the indicator variables for non-negative (I∆NI>=0) and negative
earnings changes (I∆NI<0). The coefficients on earnings change α3 and α4 are predicted to be
positive if both positive and negative earnings changes contain economic information.
Alternatively, if negative earnings changes are due to earnings management (we earlier used them
to indicate transitory loss components of earnings), α4 is predicted to be insignificant Moreover,
if earnings changes contain less economic information relating to one-year-ahead cash flows for
43
private firms than for public firms, the incremental coefficients α8 and α9 are predicted to be
negative. We offer no predictions for the intercept and dummy intercepts α0 , α2, α5 and α7.
Table 7
Results from regression (6) are reported in Table 7. Consistent with past earnings
containing information about future cash flows (Dechow 1994, Dechow, Kothari and Watts
1998), the coefficient α1 on for net income in year t-1 is 0.9 and statistically significant. α3 and
α4 are significantly positive, ranging from 0.65 to 0.82 for α3 and from 0.28 to 0.41 for α4. Both
negative and positive earnings changes in year t therefore contain information about future cash
flow. The coefficient on negative earnings changes (α4) is significantly lower than that on
positive earnings changes (α3) in year t, consistent with losses being incorporated in income as
larger, more transitory components relative to gains. The incremental coefficients for private
firms tend to be significant for positive earnings changes and vary from –0.17 to –0.24. For
negative earnings changes, the incremental coefficients are insignificant and close to zero. These
results hold irrespective of whether income is before or after exceptional and extra-ordinary
items. There is no evidence in these regressions to suggest that transitory negative earnings
changes in public firms are due to greater earnings management.
We repeated the above analysis with separate regressions for each year. The untabulated
average coefficients from these annual regressions, and their Fama-Macbeth t-statistics, confirm
the evidence. We also repeated the analyses using cash flows calculated from changes in balance
sheet accounts, and the results were qualitatively unchanged.
7.4 What is the role of taxes?
If informing users is a lower priority in private company reporting, then other factors
presumably exert relatively higher influence. A prime candidate is taxes, because private firms
are likely to see a lower benefit (relative to cost) of keeping separate tax and financial reporting

44
records. While tax is likely to affect private company financial reporting, financial reporting is
unlikely to affect tax. U.K. financial reporting choices are not binding for tax purposes.45
Expenses do not have to be reported in financial accounting to be deductible for tax purposes, and
different depreciation methods and estimates can be used in tax and financial records. The
definition of taxable profits is based primarily on tax case law and to a lesser extent on codified
tax laws; in particular, it is not based on the company law governing financial reporting.
In one sense, tax-motivated reporting creates a pos sible bias against our hypotheses in our
income-changes test (4), in that taxes might induce firms to take large write-offs against income.
This would introduce transitory negative elements in private company reporting, due to tax
incentives rather than timely loss recognition, making it more closely resemble public company
reporting in the Basu (1997) income-changes test. However, for several reasons we do not believe
any such bias against our hypothesis is large. First, we observe evidence of substantially less loss
recognition in private companies, despite any tax-induced bias to the contrary. Second, our
accruals -based test (5) confirms the difference between private and public companies, and tax
rules generally do not allow the same degree of discretion in making income-decreasing accruals
as does financial reporting. Third, our test (6) of managerial opportunism in the form of “big
baths” should detect transitory negative elements due to tax incentives rather than timely loss
recognition. The test indicates that the earnings of public firms are more positively correlated
with (contain more information about) one-year-ahead cash flows than the earnings of private
firms, whereas if anything tax motivated earnings management would imply the opposite. Fourth,
all our results are substantially unchanged when we control for size, which is a control among
other things for the benefit relative to cost of keeping separate tax and financial reporting records.
45 U.K. tax information in this paragraph is from Eberhartinger (1999).

45
In another sense, private companies giving higher prior ity to taxes in their financial
reporting essentially is our hypothesis. That is, we hypothesize that objectives other than reducing
information asymmetry between managers and other parties have greater priority in private
companies. It is not a problem for the hypothesis that taxes could be one of those other objectives.
8. Conclusions
In spite of their economic importance and likely differences from public companies, little
is known about financial reporting by private firms, including their reporting qua lity. We attribute
this to the difficulty of obtaining financial data, and to the absence of market-based measures of
quality such as association with stock prices or returns. We address these limitations with a large
sample of U.K. private-firm data and by using two time-series measures of timely loss
recognition that do not require share market data. Loss recognition timeliness is a summary
indicator of the speed with which adverse economic events are reflected in the both income
statements and balance sheets, and thus is an important attribute of earnings quality.
A feature of the UK institutional setting makes private companies especially interesting:
under U.K. law, their financial statements must be audited and must comply with the same
accounting standards and tax laws as public companies. We hypothesize that private-company
financial reporting nevertheless is lower in quality because that is what the market demands.
That is, private companies are likely to substitute private communication for financ ial reporting
to reduce information asymmetry between managers and other parties.
The evidence consistently shows that private-company earnings indeed are lower quality
on average, despite being prepared under the same regulations. We interpret “quality” as the
usefulness of financial statements to investors, creditors, managers and all parties contracting
with the firm. We observe a single but important attribute of quality: timely recognition of
economic losses (Basu 1997). The difference between public and private company timeliness
occurs consistently in both earnings -changes-based and accruals-based tests of quality. It is

46
reflected in different earnings skewness between public and private companies, despite similar
skewness in revenues. It holds under alternative measures of both income (with and without
extraordinary and/or exceptional items) and cash flow (estimated from balance sheets or taken
directly from cash flow statements). It is not affected by controls for size, leverage, fiscal year-
end and industry differences between public and private companies, and does not appear to be
due to risk differences or tax effects. It holds in a sub-sample of private companies with Big-5
auditors. It is robust with respect to Fama-MacBeth tests of significance, to different levels of
Winsorizing to eliminate data errors, and to allowing listing status to be endogenous using the
switching simultaneous equations model of Lee (1979).
Our results support the hypothesis that financial statements are economic goods and their
properties – including earnings quality – are determined primarily by the economic uses to which
they are put. Lower earnings quality on average in private firms does not imply the failure of
accounting or auditing standards, or the need for stricter regulation of financial reporting by
private firms, or that their financial reporting practices are sub-optimal. Our interpretation is that
the difference in average earnings quality between public and private firms is an equilibrium
outcome in the market for corporate financial reporting, reflecting differences in demand for
financial reporting between private and public firms, and is that it is not a failure in supply.
The results also assist in understanding the economic role of accounting standards, an
issue that is surprisingly neglected in the literature. Average earnings quality is measurably lower
in U.K. private companies than in public companies, even though their financial statements are
audited and certified as complying with the same accounting standards. Accounting standards are
not absolute givens, and their effect on actual financial reporting is subject to market demand.
Although the focus of this paper has been on private and listed companies in general, future
studies could extend this line of research by examining firms that switch organizational type.

47
References
Acs, Z. J. (Ed.), 1996. Small Firms and Economic Growth, Vol. I and II. Cheltenham England: Edward Elgar. American Institute of Certified Public Accountants, 1970. Basic Concepts and Accounting Principles Underlying Financial Statements of Business Enterprises. Statement of the Accounting Principles Board No. 4. New York, NY: American Institute of Certified Public Accountants. Ball, R., 1998. Daimler-Benz AG: Evolution of corporate governance from a code-law stakeholder to a common-law shareholder value system. Forthcoming in: Hopwood, A., Leuz, C. and Pfaff, D. (Eds.), The Economics and Politics of Accounting: International Perspectives. Oxford, England: Oxford University Press. Ball, R., 2001. Infrastructure requirements for an economically efficient system of public financial reporting and disclosure , Brookings-Wharton Papers on Financial Services, 127-169. Ball, R., Kothari, S.P., Robin, A., 2000. The effect of international institutional factors on properties of accounting earnings, Journal of Accounting & Economics 29, 1-51. Ball, R., Robin, A., 1999. Time-series properties of accounting earnings: international evidence, working paper, University of Rochester and Rochester Institute of Technology. Ball, R., Robin, A., Wu, J.S., 2000. Accounting standards, the institutional environment and issuer incentives: Effect on timely loss recognition in China, Asia Pacific Journal of Accounting & Economics 7, 71-96. Ball, R., Robin A., Wu, J.S., 2003. Incentives versus standards: properties of accounting income in four East Asian countries and implications for acceptance of IAS. Journal of Accounting & Economics 36, 235-270. Basu, S., 1997. The conservatism principle and asymmetric timeliness of earnings, Journal of Accounting & Economics 24, 3-37. Basu, S., Hwang, L., Jan, C., 2001. Differences in conservatism between big eight and non-big-eight auditors, working paper, Baruch College, City University of New York. Beatty, A., Ke, B., Petroni, K., 2002. Earnings management to avoid earnings declines across publicly and privately held banks, The Accounting Review 77, 547-570 Beatty, A., Weber, J., 2002. Performance pricing in debt contracts, working paper, Massachusetts Institute of Technology. Burgstahler, D. and Dichev, I., 1997. Earnings management to avoid earnings decreases and losses, Journal of Accounting and Economics 24, pp. 99–126. Chaney, P.K., Jeter, D., Shivakumar, L., 2001. Audit pricing among private and public firms, working paper, Vanderbilt University.

48
Collins, D.W., Maydew, E.L., Weiss, I.S., 1997. Changes in the value-relevance of earnings and book values over the past forty years, Journal of Accounting & Economics 24, 39-67. DeAngelo, L., 1981. Auditor size and audit quality, Journal of Accounting and Economics 3, 189–199. Dechow, P., 1994. Accounting earnings and cash flows as measures of firm performance: The role of accounting accruals, Journal of Accounting & Economics 18, 3-42. Dechow, P.M., Kothari, S.P., Watts R.L., 1998. The relation between earnings and cash flows. Journal of Accounting & Economics 25, 133-168. Denis, D., Sarin, A., 2000. Is the market surprised by poor earnings realizations following seasoned equity offerings? Journal of Financial & Quantitative Analysis 36, 169-193. Elliott, J.A., Hanna, J.D., 1996. Repeated accounting write-offs and the information content of earnings, Journal of Accounting Research (Supplement), 135-155. Eberhartinger, E.L., 1999. The impact of tax rules on financial reporting in Germany, France and UK, The International Journal of Accounting Research 34, 93-119. Fama, E.F., 1970. Efficient capital markets: A review of theory and empirical work, Journal of Finance 25, 383-417. Financial Accounting Standards Board, 1980. Concepts Statement No. 2: Qualitative Characteristics of Accounting Information. Norwalk, Connecticut: Financial Accounting Standards Board. Financial Accounting Standards Board, 1984. Concepts Statement No. 5: Recognition and measurement in financial statements of business enterprises. Norwalk, Connecticut: Financial Accounting Standards Board. Francis, J., Hanna, J.D., Vincent, L., 1996. Causes and Effects of Discretionary Asset Write-Offs, Journal of Accounting Research 34 (Supplement), 117-134. Gilman, S., 1939. Accounting Concepts of Profit. New York, N.Y.: The Ronald Press Company. Gray, S., 1980, International accounting differences from a security analysis perspective, Journal of Accounting Research 18, 64-76. Guay, W., Kothari S.P., Watts, R.L., 1996. A market-based evaluation of discretionary accruals, Journal of Accounting Research Supplement 24, 83-115. Hayn, C., 1995. The information content of losses, Journal of Accounting & Economics 20, 123-153. Heckman, J. J., 1979. Sample selection bias as a specification error, Econometrica 47, 153-162.

49
Hicks, J. R., 1946. Value and Capital: An Enquiry into Some Fundamental Principles of Economic Theory. Oxford: Clarendon Press. (2nd. edition). Holthausen, R.W., Watts, R.L., 2001. The relevance of the value-relevance literature for financial accounting standard setting, Journal of Accounting & Economics 31, 3-75. Hribar, P., Collins, D.W., 2002. Errors in estimating accruals: Implications for empirical research, Journal of Accounting Research 40, 105-134. Jeter, D., Shivakumar, L., 1999. Cross -sectional estimation of abnormal accruals using quarterly and annual data: effectiveness in detecting event -specific earnings management. Accounting and Business Research 29, 299-319. Ke, B., Petroni, K., Safieddine, A., 1999. Ownership concentration and sensitivity of executive pay to accounting performance measures: Evidence from publicly and privately-held insurance companies, Journal of Accounting & Economics 28, 185-209. Kothari, S. P., Sabino, J.S., Zach, T., 1999. Implications of data restrictions on performance measurement and tests of rational pricing, unpublished, Massachusetts Institute of Technology. Lee, L., 1979. Identification and estimation in binary choice models with limited (censored) dependent variables, Econometrica 47, 977-996. Maddala, G.S., 1983. Limited-dependent and Qualitative Variables in Econometrics. Cambridge UK: Cambridge University Press. Mulhern, A., 1995. The SME sector in Europe: A broad perspective, Journal of Small Business Management 33 (3), 83-87. Nagar, V., Petroni, K., Wolfenzon, D., 2002. Ownership and performance in close corporations: a natural experiment in exogenous ownership structure, unpublished Working Paper No. S-CG-02-06, New York University. Palmrose, Z., 1997. Who got sued? Journal of Accountancy 183, 67-69. Pope, P., Walker, M., 1999. International differences in the timeliness, conservatism and classification of earnings, Journal of Accounting Research 37 (Supplement), 53-87. Rees, L., Gill, S., Gore, R., 1996. An investigation of asset write-downs and concurrent abnormal accruals, Journal of Accounting Research 34, 157-169. Samuelson, P.A., 1965. Proof that properly anticipated prices fluctuate randomly, Industrial Management Review 6, 41-49. Schumpeter, J. A., 1934. The Theory of Economic Development: Ann Inquiry into Profits, Capital, Credit, Interest, and the Business Cycle. Cambridge Mass: Harvard University Press. (Translation of 1912 German publication, Theorie der Wirtschaftlichen Entwicklung).

50
St. Pierre, K., Anderson, J.A., 1984. An analysis of the factors associated with lawsuits against public accountants, The Accounting Review 59, 242-263. Thompson, R.B., Thomas, R.S., 2002. Shareholder litigation: Re-examining the balance between litigation agency costs and management agency costs, working paper, Vanderbilt University. Watts, R.L., 1993. A proposal for research on conservatism, unpublished, University of Rochester. Watts, R.L., 2003. “Conservatism in accounting part 1: Explanations and implications, Accounting Horizons 17, 207-221. Watts, R.L., Zimmerman, J.L., 1983. Agency problems, auditing, and the theory of the firm: Some evidence, Journal of Law and Economics 26, 613-33. Watts, R.L., Zimmerman, J.L., 1986. Positive Accounting Theory. Englewood Cliffs, N.J.: Prentice-Hall.

51
Table 1 Summary statistics for income statement items
Sales
Sales/ Assets
CoS/ Sales
Depn/ LTAssets
Interest/ EBIT
X-cep/ Assets
X-ord/ Assets
(X-cep +X-ord)/ Assets
NI_1 / Assets
NI_2/ Assets
NI_3/ Assets
Acc/ Assets
CFO/ Assets
(£ mn) (%) (%) (%) (%) (%) (%) (%) (%) (%) (%) (%) (%) A: Public listed firms No. of obs 6084 5958 4012 5753 5314 4700 5948 4700 4704 5965 5964 5128 2972Mean 431.6 143.1 68.9 12.6 22.5 -0.4 -0.1 -0.5 5.6 5.0 4.8 -3.8 12.5% > 0 100.0 100.0 100.0 100.0 92.2 21.1 4.1 22.5 87.0 84.4 83.2 28.3 91.6% < 0 0.0 0.0 0.0 0.0 0.0 22.2 20.4 34.8 13.0 15.6 16.7 71.6 8.4Skewness 4.0 0.8 -1.0 1.6 3.8 -3.5 -5.7 -3.4 -1.2 -1.3 -1.3 -0.3 -0.1Std dev 1001.5 81.7 16.9 9.4 31.1 2.5 0.5 2.6 7.7 8.3 8.4 8.5 10.31st decile 10.5 39.7 45.7 2.4 0.2 -1.6 -0.3 -2.1 -2.1 -4.1 -4.6 -14.3 0.9Median 75.9 137.3 72.3 11.0 13.3 0.0 0.0 0.0 6.2 5.7 5.6 -3.4 12.49th decile 1198.5 242.0 87.6 24.1 53.0 0.7 0.0 0.7 13.6 13.4 13.2 5.7 25.2 B: Private firms No. of obs 138813 136254 116217 132234 118818 115418 134650 115415 115662 135836 135811 124159 31072Mean 6.1 239.1 70.4 19.6 31.0 0.0 0.0 0.0 5.8 5.3 5.2 0.0 10.9% > 0 100.0 100.0 100.0 100.0 78.9 4.9 0.8 5.9 80.4 79.6 79.3 36.3 84.9% < 0 0.0 0.0 0.0 0.0 0.0 3.8 2.8 6.7 18.9 19.6 19.9 63.3 15.0Skewness 3.9 1.6 -1.0 1.8 3.6 1.9 -10.4 -0.3 0.5 0.5 0.5 -0.2 0.3Std dev 10.1 161.9 17.8 16.8 48.2 0.6 0.1 0.8 9.4 9.2 9.2 0.1 11.81st decile 0.8 72.3 45.8 3.2 0.0 0.0 0.0 0.0 -3.5 -3.7 -3.8 -0.2 -2.8Median 2.5 205.1 73.6 15.2 14.2 0.0 0.0 0.0 4.3 4.1 4.1 0.0 10.19th decile 14.9 438.6 90.4 40.0 79.2 0.0 0.0 0.0 16.9 16.4 16.3 0.1 25.9 t-stat* 10.1 544.8 1103.1 423.5 223.7 8.1 -31.1 -4.6 200.7 210.7 208.3 -91.6 156.6* t-stat for two tailed test of differences between private and public firms

52
Table 1 (contd.) Variable definitions: Sales Total annual sales revenue in £ millions Sales/Assets Sales divided by total assets at beginning of year CoS/sales Cost of sales divided by total sales. Depn/LTAssets Depreciation and amortization expense divided by long-term assets (fixed assets + intangible assets) at end of
year Interest/EBIT Interest expense, net of interest income, divided by earnings before interest and taxes X-cep/Assets Exceptional items divided by total assets at beginning of year X-ord/Assets Extra-ordinary items divided by total assets at beginning of year (X-cep + X-ord)/Assets
Exceptional items plus extra-ordinary items divided by total assets at beginning of year
NI_1/Assets Net income before exceptional and extra-ordinary items divided by total assets at beginning of year NI_2/Assets Net income after exceptional but before extra-ordinary items divided by total assets at beginning of year NI_3/Assets Net income after exceptional and extra-ordinary items divided by total assets at beginning of year Acc/Assets Accruals scaled by beginning total assets, where accruals are change in inventory + change in debtors +
change in other current assets – change in creditors – change in other current liabilities – depreciation CFO/Assets Cash flow from operations (as per cash flow statement), scaled by beginning total assets The table reports the summary statistics on income statement and cash flow variables for firm-years with data available to estimate regressions reported in either Tables 3 or 5. The statistics are reported separately for public listed firms and private firms. For each variable, the extreme 1% of the observations on each side is excluded.
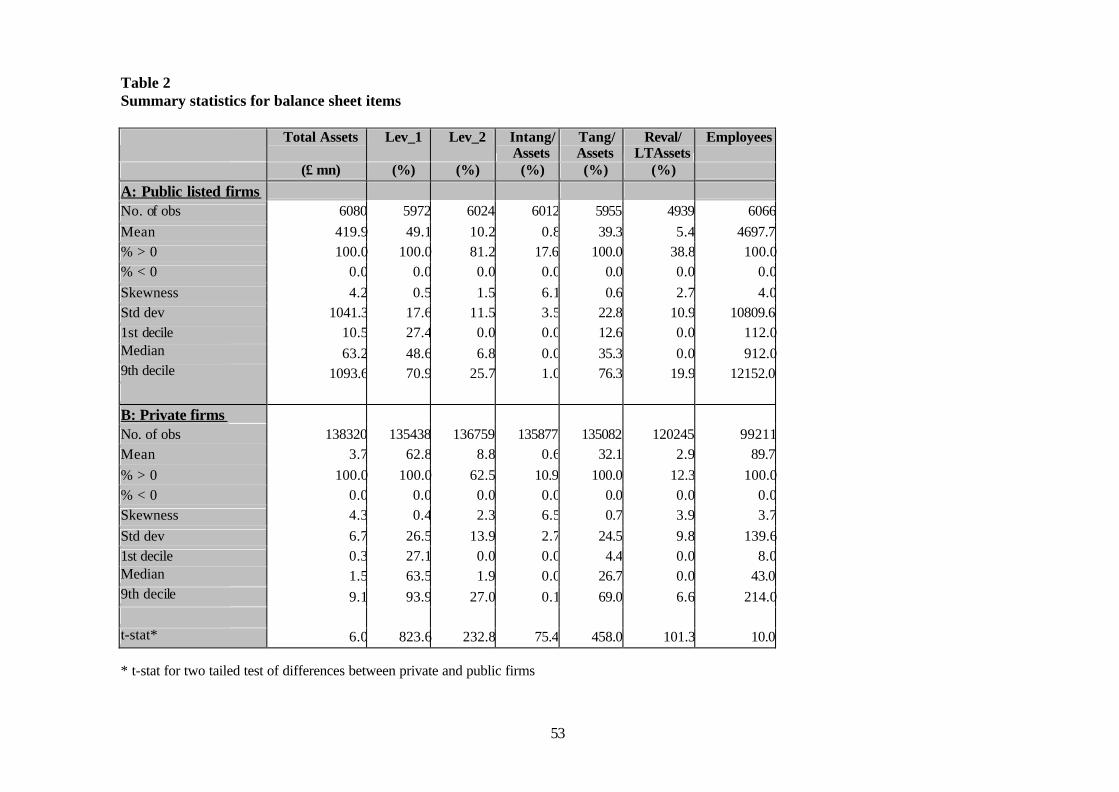
53
Table 2 Summary statistics for balance sheet items
Total Assets Lev_1 Lev_2 Intang/ Assets
Tang/ Assets
Reval/ LTAssets
Employees
(£ mn) (%) (%) (%) (%) (%) A: Public listed firms No. of obs 6080 5972 6024 6012 5955 4939 6066Mean 419.9 49.1 10.2 0.8 39.3 5.4 4697.7% > 0 100.0 100.0 81.2 17.6 100.0 38.8 100.0% < 0 0.0 0.0 0.0 0.0 0.0 0.0 0.0Skewness 4.2 0.5 1.5 6.1 0.6 2.7 4.0Std dev 1041.3 17.6 11.5 3.5 22.8 10.9 10809.61st decile 10.5 27.4 0.0 0.0 12.6 0.0 112.0Median 63.2 48.6 6.8 0.0 35.3 0.0 912.09th decile 1093.6 70.9 25.7 1.0 76.3 19.9 12152.0 B: Private firms No. of obs 138320 135438 136759 135877 135082 120245 99211Mean 3.7 62.8 8.8 0.6 32.1 2.9 89.7% > 0 100.0 100.0 62.5 10.9 100.0 12.3 100.0% < 0 0.0 0.0 0.0 0.0 0.0 0.0 0.0Skewness 4.3 0.4 2.3 6.5 0.7 3.9 3.7Std dev 6.7 26.5 13.9 2.7 24.5 9.8 139.61st decile 0.3 27.1 0.0 0.0 4.4 0.0 8.0Median 1.5 63.5 1.9 0.0 26.7 0.0 43.09th decile 9.1 93.9 27.0 0.1 69.0 6.6 214.0 t-stat* 6.0 823.6 232.8 75.4 458.0 101.3 10.0 * t-stat for two tailed test of differences between private and public firms

54
Table 2 (contd). Variable definitions: Total Assets Total assets at end of year in £ millions Lev_1 Leverage defined as total liabilities divided by total assets at end of year Lev_2 Leverage defined as long-term liabilities divided by total assets at end of year Intang/Assets Intangible assets divided by total assets at end of year Tang/Assets Tangible fixed assets (property, plant and equipment) divided by total assets at end of year Reval/LTAssets Revaluation reserve divided by long term assets (= tangible fixed assets + intangible fixed assets at end of year) Employees Number of employees The table reports the summary statistics on balance sheet variables for firm-years with data available to estimate regressions reported in either Tables 3 or 5. The statistics are reported separately for public listed firms and private firms. For each variable, the extreme 1% of the observations on each side is excluded.
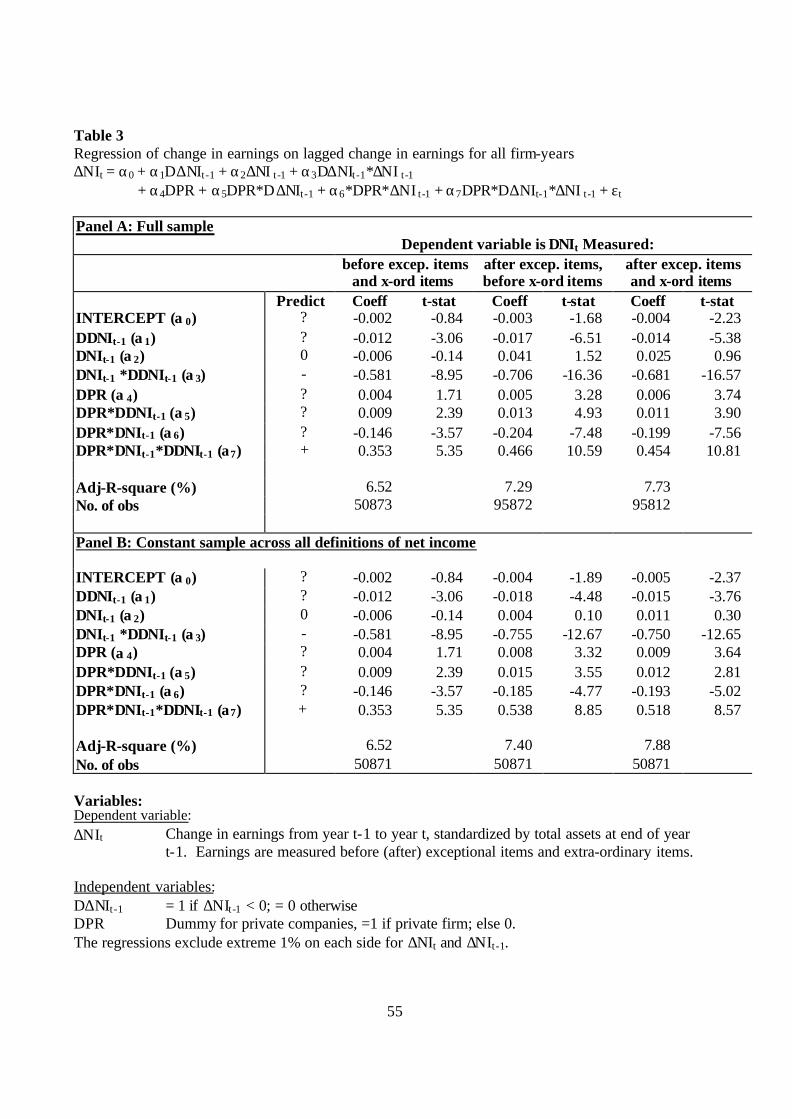
55
Table 3 Regression of change in earnings on lagged change in earnings for all firm-years ∆NIt = α0 + α1D∆NIt -1 + α2∆NI t -1 + α3D∆NIt -1*∆NI t -1
+ α4DPR + α5DPR*D∆NIt -1 + α6*DPR*∆NI t -1 + α7DPR*D∆NIt-1*∆NI t -1 + εt Panel A: Full sample Dependent variable is ∆NIt Measured:
before excep. items and x-ord items
after excep. items, before x-ord items
after excep. items and x-ord items
Predict Coeff t-stat Coeff t-stat Coeff t-stat INTERCEPT (α0) ? -0.002 -0.84 -0.003 -1.68 -0.004 -2.23 D∆NIt-1 (α1) ? -0.012 -3.06 -0.017 -6.51 -0.014 -5.38 ∆NIt-1 (α2) 0 -0.006 -0.14 0.041 1.52 0.025 0.96 ∆NIt-1 *D∆NIt-1 (α3) - -0.581 -8.95 -0.706 -16.36 -0.681 -16.57 DPR (α4) ? 0.004 1.71 0.005 3.28 0.006 3.74 DPR*D∆NIt-1 (α5) ? 0.009 2.39 0.013 4.93 0.011 3.90 DPR*∆NIt-1 (α6) ? -0.146 -3.57 -0.204 -7.48 -0.199 -7.56 DPR*∆NIt-1*D∆NIt-1 (α7) + 0.353 5.35 0.466 10.59 0.454 10.81 Adj-R-square (%) 6.52 7.29 7.73 No. of obs 50873 95872 95812 Panel B: Constant sample across all definitions of net income INTERCEPT (α0) ? -0.002 -0.84 -0.004 -1.89 -0.005 -2.37 D∆NIt-1 (α1) ? -0.012 -3.06 -0.018 -4.48 -0.015 -3.76 ∆NIt-1 (α2) 0 -0.006 -0.14 0.004 0.10 0.011 0.30 ∆NIt-1 *D∆NIt-1 (α3) - -0.581 -8.95 -0.755 -12.67 -0.750 -12.65 DPR (α4) ? 0.004 1.71 0.008 3.32 0.009 3.64 DPR*D∆NIt-1 (α5) ? 0.009 2.39 0.015 3.55 0.012 2.81 DPR*∆NIt-1 (α6) ? -0.146 -3.57 -0.185 -4.77 -0.193 -5.02 DPR*∆NIt-1*D∆NIt-1 (α7) + 0.353 5.35 0.538 8.85 0.518 8.57 Adj-R-square (%) 6.52 7.40 7.88 No. of obs 50871 50871 50871 Variables: Dependent variable: ∆NIt Change in earnings from year t-1 to year t, standardized by total assets at end of year
t-1. Earnings are measured before (after) exceptional items and extra-ordinary items. Independent variables: D∆NIt -1 = 1 if ∆NIt -1 < 0; = 0 otherwise DPR Dummy for private companies, =1 if private firm; else 0. The regressions exclude extreme 1% on each side for ∆NIt and ∆NIt -1.
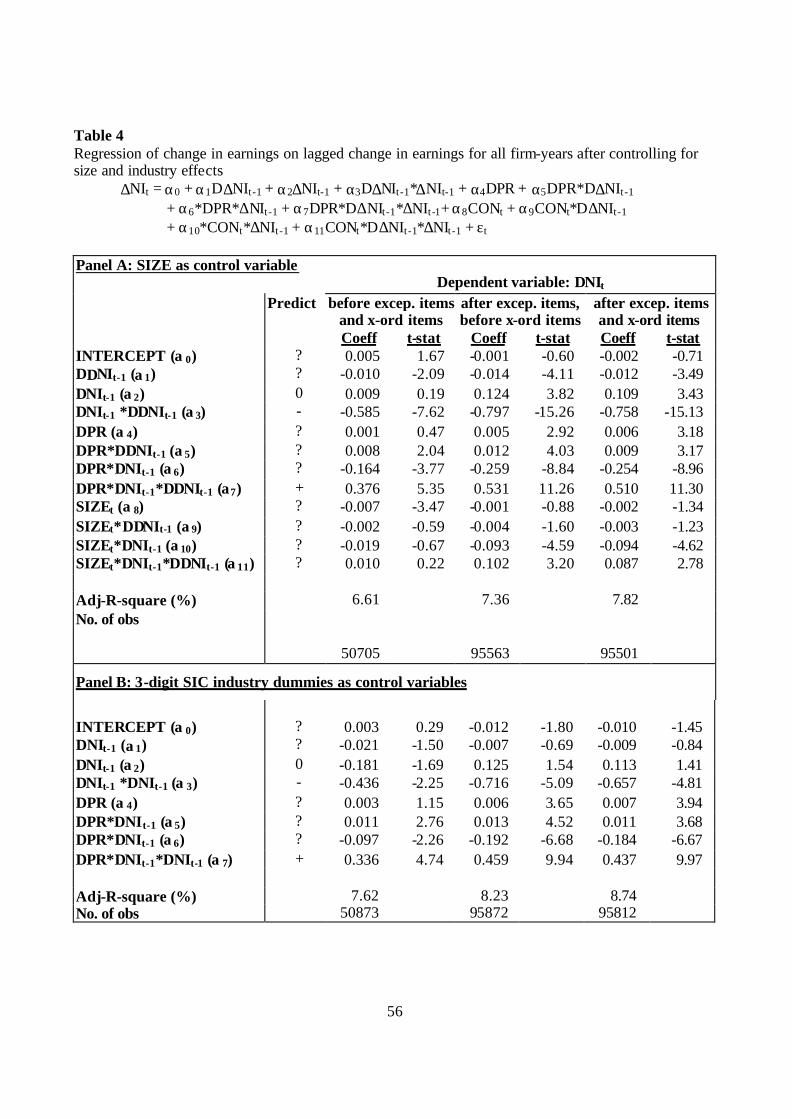
56
Table 4 Regression of change in earnings on lagged change in earnings for all firm-years after controlling for size and industry effects
∆NIt = α0 + α1D∆NIt -1 + α2∆NIt-1 + α3D∆NIt -1*∆NIt-1 + α4DPR + α5DPR*D∆NIt -1 + α6*DPR*∆NIt -1 + α7DPR*D∆NIt -1*∆NIt -1+ α8CONt + α9CONt*D∆NIt -1 + α10*CONt*∆NIt -1 + α11CONt*D∆NIt -1*∆NIt -1 + εt
Panel A: SIZE as control variable
Dependent variable: ∆NIt Predict before excep. items
and x-ord items after excep. items, before x-ord items
after excep. items and x-ord items
Coeff t-stat Coeff t-stat Coeff t-stat INTERCEPT (α0) ? 0.005 1.67 -0.001 -0.60 -0.002 -0.71 D∆NIt-1 (α1) ? -0.010 -2.09 -0.014 -4.11 -0.012 -3.49 ∆NIt-1 (α2) 0 0.009 0.19 0.124 3.82 0.109 3.43 ∆NIt-1 *D∆NIt-1 (α3) - -0.585 -7.62 -0.797 -15.26 -0.758 -15.13 DPR (α4) ? 0.001 0.47 0.005 2.92 0.006 3.18 DPR*D∆NIt-1 (α5) ? 0.008 2.04 0.012 4.03 0.009 3.17 DPR*∆NIt-1 (α6) ? -0.164 -3.77 -0.259 -8.84 -0.254 -8.96 DPR*∆NIt-1*D∆NIt-1 (α7) + 0.376 5.35 0.531 11.26 0.510 11.30 SIZEt (α8) ? -0.007 -3.47 -0.001 -0.88 -0.002 -1.34 SIZEt*D∆NIt-1 (α9) ? -0.002 -0.59 -0.004 -1.60 -0.003 -1.23 SIZEt*∆NIt-1 (α10) ? -0.019 -0.67 -0.093 -4.59 -0.094 -4.62 SIZEt*∆NIt-1*D∆NIt-1 (α11) ? 0.010 0.22 0.102 3.20 0.087 2.78 Adj-R-square (%) 6.61 7.36 7.82 No. of obs
50705 95563 95501
Panel B: 3-digit SIC industry dummies as control variables
INTERCEPT (α0) ? 0.003 0.29 -0.012 -1.80 -0.010 -1.45 DNIt-1 (α1) ? -0.021 -1.50 -0.007 -0.69 -0.009 -0.84 ∆NIt-1 (α2) 0 -0.181 -1.69 0.125 1.54 0.113 1.41 ∆NIt-1 *DNIt-1 (α3) - -0.436 -2.25 -0.716 -5.09 -0.657 -4.81 DPR (α4) ? 0.003 1.15 0.006 3.65 0.007 3.94 DPR*DNIt-1 (α5) ? 0.011 2.76 0.013 4.52 0.011 3.68 DPR*∆NIt-1 (α6) ? -0.097 -2.26 -0.192 -6.68 -0.184 -6.67 DPR*∆NIt-1*DNIt-1 (α7) + 0.336 4.74 0.459 9.94 0.437 9.97 Adj-R-square (%) 7.62 8.23 8.74 No. of obs 50873 95872 95812

57
Table 4 (contd) In Panel A, the interactive control variable (CONt) is SIZEt. In Panel B, the interactive control variables are 349 industry dummies, one for each 3-digit SIC classification (the interactive coefficients on the 349 industry dummies are not reported). The regressions exclude the extreme 1% of observations on each side for ∆NIt and ∆NIt -1. Variables: Dependent variable: ∆NIt Change in earnings from year t-1 to year t, standardized by total assets at end of year
t-1. Earnings are measured before (after) exceptional items and extra-ordinary items. Independent variables: D∆NIt -1 = 1 if ∆NIt -1 < 0; = 0 otherwise. DPR Dummy for private companies. = 1 if private firm; else 0. SIZEt Rank of total assets at end of year t, standardized to the interval (0,1). CONt An interactive dummy variable to control for size and industry differences between
public and private firms, interacting with the intercepts, ∆NIt -1 and D∆NIt -1.
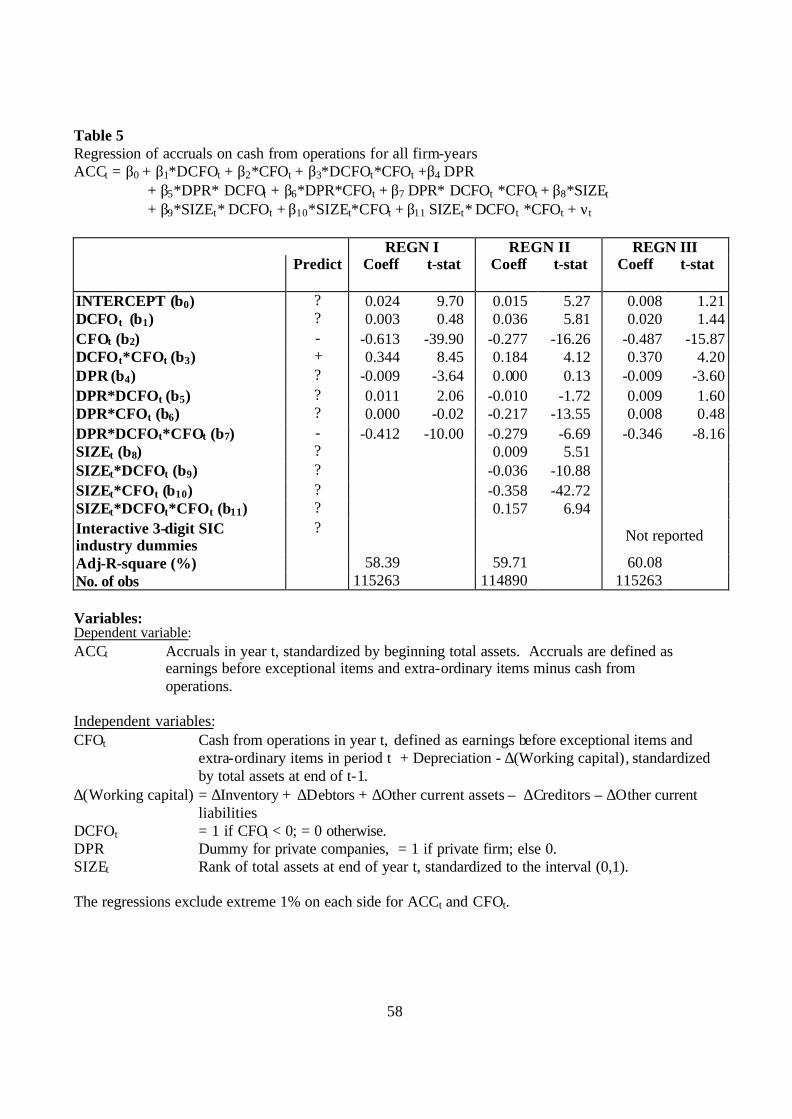
58
Table 5 Regression of accruals on cash from operations for all firm-years ACCt = β0 + β1*DCFOt + β2*CFOt + β3*DCFOt*CFOt +β4 DPR
+ β5*DPR* DCFOt + β6*DPR*CFOt + β7 DPR* DCFOt *CFOt + β8*SIZEt + β9*SIZEt* DCFOt + β10*SIZEt*CFOt + β11 SIZEt* DCFOt *CFOt + νt
REGN I REGN II REGN III
Predict
Coeff t-stat Coeff t-stat Coeff t-stat
INTERCEPT (β0) ? 0.024 9.70 0.015 5.27 0.008 1.21 DCFOt (β1) ? 0.003 0.48 0.036 5.81 0.020 1.44 CFOt (β2) - -0.613 -39.90 -0.277 -16.26 -0.487 -15.87 DCFOt*CFOt (β3) + 0.344 8.45 0.184 4.12 0.370 4.20 DPR (β4) ? -0.009 -3.64 0.000 0.13 -0.009 -3.60 DPR*DCFOt (β5) ? 0.011 2.06 -0.010 -1.72 0.009 1.60 DPR*CFOt (β6) ? 0.000 -0.02 -0.217 -13.55 0.008 0.48 DPR*DCFOt*CFOt (β7) - -0.412 -10.00 -0.279 -6.69 -0.346 -8.16 SIZEt (β8) ? 0.009 5.51 SIZEt*DCFOt (β9) ? -0.036 -10.88 SIZEt*CFOt (β10) ? -0.358 -42.72 SIZEt*DCFOt*CFOt (β11) ? 0.157 6.94 Interactive 3-digit SIC industry dummies
? Not reported
Adj-R-square (%) 58.39 59.71 60.08 No. of obs 115263 114890 115263 Variables: Dependent variable: ACCt Accruals in year t, standardized by beginning total assets. Accruals are defined as
earnings before exceptional items and extra-ordinary items minus cash from operations.
Independent variables: CFOt Cash from operations in year t, defined as earnings before exceptional items and
extra-ordinary items in period t + Depreciation - ∆(Working capital), standardized by total assets at end of t-1.
∆(Working capital) = ∆Inventory + ∆Debtors + ∆Other current assets – ∆Creditors – ∆Other current liabilities
DCFOt = 1 if CFOt < 0; = 0 otherwise. DPR Dummy for private companies, = 1 if private firm; else 0. SIZEt Rank of total assets at end of year t, standardized to the interval (0,1). The regressions exclude extreme 1% on each side for ACCt and CFOt.
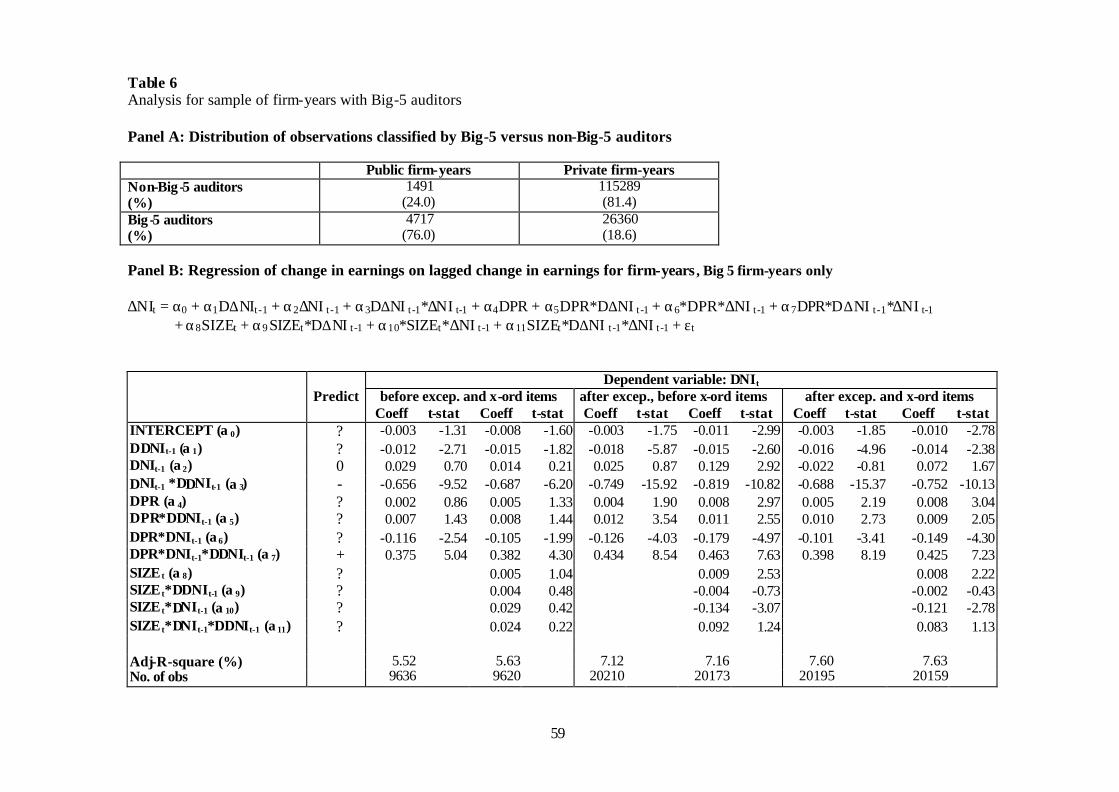
59
Table 6 Analysis for sample of firm-years with Big-5 auditors Panel A: Distribution of observations classified by Big-5 versus non-Big-5 auditors Public firm-years Private firm-years Non-Big-5 auditors (%)
1491 (24.0)
115289 (81.4)
Big-5 auditors (%)
4717 (76.0)
26360 (18.6)
Panel B: Regression of change in earnings on lagged change in earnings for firm-years , Big 5 firm-years only ∆NIt = α0 + α1D∆NIt -1 + α2∆NI t -1 + α3D∆NI t -1*∆NI t-1 + α4DPR + α5DPR*D∆NI t -1 + α6*DPR*∆NI t -1 + α7DPR*D∆NI t -1*∆NI t-1
+ α8SIZEt + α9 SIZEt*D∆NI t -1 + α10*SIZEt*∆NI t -1 + α11SIZEt*D∆NI t -1*∆NI t -1 + εt
Dependent variable: ∆NIt Predict before excep. and x-ord items after excep., before x-ord items after excep. and x-ord items Coeff t-stat Coeff t-stat Coeff t-stat Coeff t-stat Coeff t-stat Coeff t-stat
INTERCEPT (α0) ? -0.003 -1.31 -0.008 -1.60 -0.003 -1.75 -0.011 -2.99 -0.003 -1.85 -0.010 -2.78 D∆NIt-1 (α1) ? -0.012 -2.71 -0.015 -1.82 -0.018 -5.87 -0.015 -2.60 -0.016 -4.96 -0.014 -2.38 ∆NIt-1 (α2) 0 0.029 0.70 0.014 0.21 0.025 0.87 0.129 2.92 -0.022 -0.81 0.072 1.67 ∆NIt-1 *D∆NIt-1 (α3) - -0.656 -9.52 -0.687 -6.20 -0.749 -15.92 -0.819 -10.82 -0.688 -15.37 -0.752 -10.13 DPR (α4) ? 0.002 0.86 0.005 1.33 0.004 1.90 0.008 2.97 0.005 2.19 0.008 3.04 DPR*D∆NIt-1 (α5) ? 0.007 1.43 0.008 1.44 0.012 3.54 0.011 2.55 0.010 2.73 0.009 2.05 DPR*∆NIt-1 (α6) ? -0.116 -2.54 -0.105 -1.99 -0.126 -4.03 -0.179 -4.97 -0.101 -3.41 -0.149 -4.30 DPR*∆NIt-1*D∆NIt-1 (α7) + 0.375 5.04 0.382 4.30 0.434 8.54 0.463 7.63 0.398 8.19 0.425 7.23 SIZE t (α8) ? 0.005 1.04 0.009 2.53 0.008 2.22 SIZE t*D∆NIt-1 (α9) ? 0.004 0.48 -0.004 -0.73 -0.002 -0.43 SIZE t*∆NIt-1 (α10) ? 0.029 0.42 -0.134 -3.07 -0.121 -2.78 SIZE t*∆NIt-1*D∆NIt-1 (α11) ? 0.024 0.22 0.092 1.24 0.083 1.13 Adj-R-square (%) 5.52 5.63 7.12 7.16 7.60 7.63 No. of obs 9636 9620 20210 20173 20195 20159
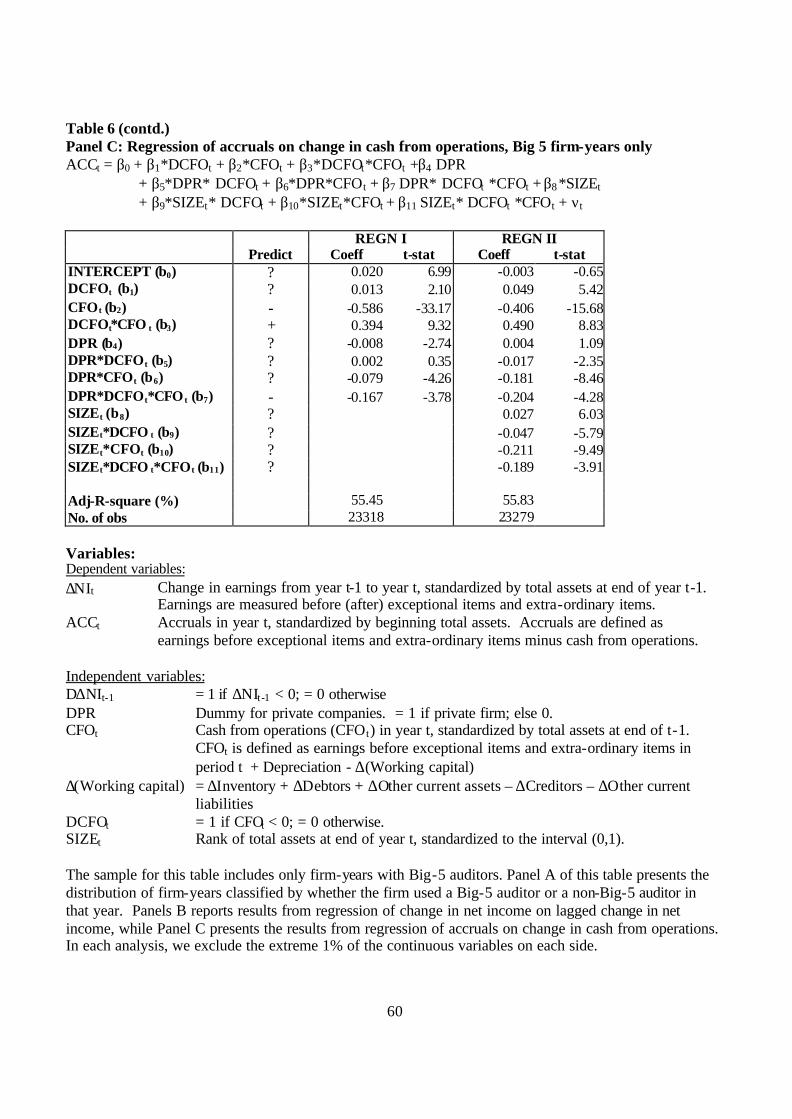
60
Table 6 (contd.) Panel C: Regression of accruals on change in cash from operations, Big 5 firm-years only ACCt = β0 + β1*DCFOt + β2*CFOt + β3*DCFOt*CFOt +β4 DPR
+ β5*DPR* DCFOt + β6*DPR*CFOt + β7 DPR* DCFOt *CFOt + β8 *SIZEt + β9*SIZEt* DCFOt + β10*SIZEt*CFOt + β11 SIZEt* DCFOt *CFOt + νt
REGN I REGN II Predict Coeff t-stat Coeff t-stat
INTERCEPT (β0) ? 0.020 6.99 -0.003 -0.65 DCFOt (β1) ? 0.013 2.10 0.049 5.42 CFOt (β2) - -0.586 -33.17 -0.406 -15.68 DCFOt*CFO t (β3) + 0.394 9.32 0.490 8.83 DPR (β4) ? -0.008 -2.74 0.004 1.09 DPR*DCFOt (β5) ? 0.002 0.35 -0.017 -2.35 DPR*CFOt (β6) ? -0.079 -4.26 -0.181 -8.46 DPR*DCFOt*CFO t (β7) - -0.167 -3.78 -0.204 -4.28 SIZEt (β8) ? 0.027 6.03 SIZEt*DCFO t (β9) ? -0.047 -5.79 SIZEt*CFOt (β10) ? -0.211 -9.49 SIZEt*DCFO t*CFOt (β11) ? -0.189 -3.91 Adj-R-square (%) 55.45 55.83 No. of obs 23318 23279 Variables: Dependent variables: ∆NIt Change in earnings from year t-1 to year t, standardized by total assets at end of year t-1.
Earnings are measured before (after) exceptional items and extra-ordinary items. ACCt Accruals in year t, standardized by beginning total assets. Accruals are defined as
earnings before exceptional items and extra-ordinary items minus cash from operations. Independent variables: D∆NIt-1 = 1 if ∆NIt -1 < 0; = 0 otherwise DPR Dummy for private companies. = 1 if private firm; else 0. CFOt Cash from operations (CFOt) in year t, standardized by total assets at end of t-1.
CFOt is defined as earnings before exceptional items and extra-ordinary items in period t + Depreciation - ∆(Working capital)
∆(Working capital) = ∆Inventory + ∆Debtors + ∆Other current assets – ∆Creditors – ∆Other current liabilities
DCFOt = 1 if CFOt < 0; = 0 otherwise. SIZEt Rank of total assets at end of year t, standardized to the interval (0,1). The sample for this table includes only firm-years with Big-5 auditors. Panel A of this table presents the distribution of firm-years classified by whether the firm used a Big-5 auditor or a non-Big-5 auditor in that year. Panels B reports results from regression of change in net income on lagged change in net income, while Panel C presents the results from regression of accruals on change in cash from operations. In each analysis, we exclude the extreme 1% of the continuous variables on each side.

61
Table 7 Regression of cash flow from operations on lagged net income and lagged change in net income for all firm-years
CFOt+1 = α0 + α1 NIt -1 + α2 I∆NI<0 + α3 I∆NI>=0 *∆NIt + α4 I∆NI<0*∆NIt + α5 DPR
+ α6 DPR*NIt -1 + α7 DPR*I∆NI<0 + α8 DPR* I∆NI>=0*∆NIt + α9 DPR* I∆NI<0*∆NIt + ε t+1
Net income before excep.
and x-ord items
Net income after excep., but before x-
ord items
Net income after excep. and x-ord
items
Predict Coeff t-stat Coeff t-stat Coeff t-stat INTERCEPT (α0) ? 0.06 10.99 0.06 12.24 0.07 13.01 NIt-1 (α1) + 0.91 19.06 0.88 20.15 0.87 19.84 I∆NI<0 (α2) ? 0.00 -0.26 0.00 -0.09 0.00 -0.04 I∆NI>=0*∆NIt (α3) + 0.82 7.44 0.68 7.62 0.65 7.58 I∆NI<0*∆NIt (α4) + 0.41 3.35 0.29 3.19 0.28 3.14 DPR (α5) ? 0.01 2.26 0.01 2.44 0.01 2.10 DPR*NIt-1 (α6) - -0.30 -5.86 -0.29 -6.36 -0.28 -6.17 DPR* I∆ NI<0 (α7) ? 0.00 -0.12 0.00 -0.58 0.00 -0.64 DPR* I∆ NI>=0*∆NIt (α8) - -0.24 -2.06 -0.19 -2.05 -0.17 -1.85 DPR* I∆ NI<0*∆NIt (α9) - -0.09 -0.70 0.00 0.03 0.00 0.03 Adj-R-square (%) 12.26 11.26 10.93 No. of obs 15726 18130 18121
Variables: Dependent variable CFOt+1 Cash from operations in year t+1 as reported in the cash flow statement, standardized
by total assets at end of year t. Independent variables: NIt -1 Net income in period t-1, standardized by total assets at end of year t-2 ∆NIt Change in earnings from year t-1 to year t, standardized by total assets at end of year
t-1. Earnings are measured before (after) exceptional items and extra-ordinary items. I∆NI<0 Indicator variable for negative earnings changes, =1 if ∆NIt < 0; = 0 otherwise I∆NI>=0 Indicator variable for non-negative earnings changes, =1 if ∆NIt >= 0; = 0 otherwise DPR Dummy for private companies. = 1 if private firm; else 0. The regressions exclude the extreme 1% on each side for the continuous variables.
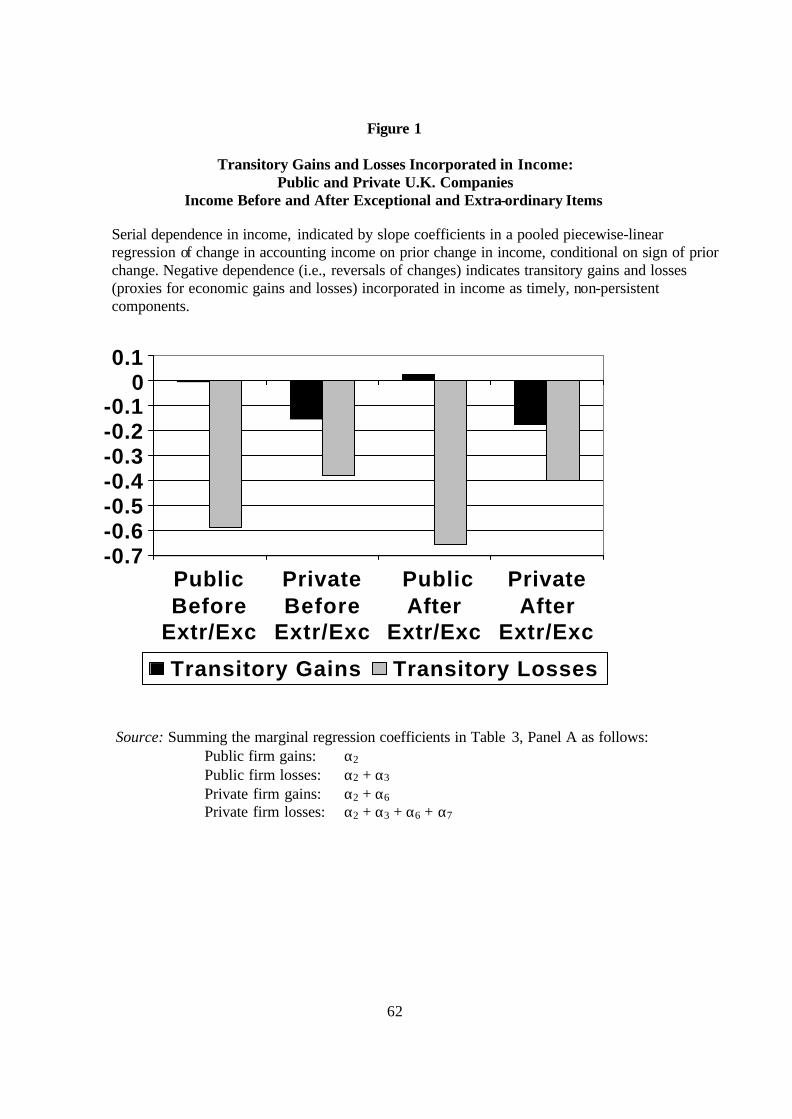
62
Figure 1
Transitory Gains and Losses Incorporated in Income: Public and Private U.K. Companies
Income Before and After Exceptional and Extra-ordinary Items Serial dependence in income, indicated by slope coefficients in a pooled piecewise-linear regression of change in accounting income on prior change in income, conditional on sign of prior change. Negative dependence (i.e., reversals of changes) indicates transitory gains and losses (proxies for economic gains and losses) incorporated in income as timely, non-persistent components.
-0.7-0.6-0.5-0.4-0.3-0.2-0.1
00.1
PublicBefore
Extr/Exc
PrivateBefore
Extr/Exc
Public After
Extr/Exc
PrivateAfter
Extr/Exc
Transitory Gains Transitory Losses
Source: Summing the marginal regression coefficients in Table 3, Panel A as follows:
Public firm gains: α2 Public firm losses: α2 + α3 Private firm gains: α2 + α6 Private firm losses: α2 + α3 + α6 + α7

63
Figure 2
Transitory Gains and Losses Incorporated in Income: Public and Private U.K. Companies
Compared with Code -law, Common-law and East Asia Groups
Serial dependence in income, indicated by slope coefficients in a pooled piecewise-linear regression of change in accounting income on prior change in income, conditional on sign of prior change. Negative dependence (i.e., reversals of changes) indicates transitory gains and losses (proxies for economic gains and losses) incorporated in income as timely, non-persistent components.
-0.9-0.8-0.7-0.6-0.5-0.4-0.3-0.2-0.1
00.1
U.KPublic
U.K. Private
CommonPublic
Code Public
E. AsiaPublic
Transitory Gains Transitory Losses
Sources: U.K. Public and U.K. Private from Table 3, Panel A; Common and Code from Ball and Robin (1999, Table 3); East Asia from Ball, Robin and Wu (2003, Table 4). U.K. results are for income after exceptional and extra-ordinary items, for comparability with the other categories (Pope and Walker, 1999).