
Early Paleozoic paleomagnetism of east Kazakhstan: implications for paleolatitudinal drift of...
19
Early Paleozoic paleomagnetism of east Kazakhstan: implications for paleolatitudinal drift of tectonic elements within the Ural–Mongol belt $ Adam Q. Collins a , Kirill E. Degtyarev b , Natalia M. Levashova b , Mikhail L. Bazhenov a,b , Rob Van der Voo b, * a Department of Geological Sciences, University of Michigan, Ann Arbor, MI 48109-1063, USA b Geological Institute, Academy of Sciences of Russia, Pyzhevsky Lane, 7, Moscow 109017, Russia Received 15 November 2002; accepted 2 September 2003 Abstract Conflicting paleogeographic reconstructions of the Ural – Mongol fold belt have been developed over the past decade; very few of them, however, have been based on paleomagnetic data, which still remain scarce. The Chingiz Range in northeastern Kazakhstan provides an opportunity to evaluate the tectonic evolution of the central part of this belt through extensive paleomagnetic studies. In this paper, we report the results from Upper Cambrian andesites and Lower Ordovician tuffaceous sandstones within the Chingiz Range. A high-temperature component (HTC), decaying to the origin, is isolated from Upper Cambrian rocks at eight sites with an easterly and low-intermediate upward direction. This component passes the tilt test and is likely primary. A HTC is also isolated from Lower Ordovician rocks at 11 sites. These site means exhibit a shallow-inclination girdle distribution within the southeast quadrant, likely due to net rotations within the complex structure studied. The inclination-only tilt test is positive, and the best grouping of data is observed at 100% untilting. Also included in our paleolatitudinal analyses are new middle and late Paleozoic paleolatitudes from nearby parts of the Chingiz Range as well as published paleomagnetic data from central and east Kazakhstan. We favor normal polarity of the early Paleozoic results of this paper and conclude that the study area moved northward throughout the Paleozoic. The observed paleolatitudes generally fit the Siberian reference data and hence indicate coherent latitudinal motion of the Boshekul – Chingiz tectonic zone and the Siberian plate. D 2003 Elsevier B.V. All rights reserved. Keywords: East Kazakhstan; Early Paleozoic; Paleomagnetism; Paleolatitudes; Ural – Mongol fold belt 1. Introduction Published syntheses describing the Paleozoic tec- tonic evolution of the Ural –Mongol fold belt, which separates the European (Baltica), Siberian (Siberia), and Tarim cratons (Fig. 1a), as well as the mosaic of island arc complexes, accretionary wedges, and ophiolites that comprise present-day east–central Kazakhstan (Fig. 1b), are rather controversial. Much of the ambiguity surrounding existing models is due to the scarcity of reliable paleomagnetic data and to the complex structural geometries observed in the 0040-1951/$ - see front matter D 2003 Elsevier B.V. All rights reserved. doi:10.1016/j.tecto.2003.09.003 $ Refers to doi:10.1016/j.tecto.2003.09.013. * Corresponding author. Tel.: +1-734-764-8322; fax: +1-734- 763-4690. E-mail address: [email protected] (R. Van der Voo). www.elsevier.com/locate/tecto Tectonophysics 377 (2003) 229– 247
Transcript of Early Paleozoic paleomagnetism of east Kazakhstan: implications for paleolatitudinal drift of...
www.elsevier.com/locate/tecto
Tectonophysics 377 (2003) 229–247
Early Paleozoic paleomagnetism of east Kazakhstan:
implications for paleolatitudinal drift of tectonic
elements within the Ural–Mongol belt$
Adam Q. Collinsa, Kirill E. Degtyarevb, Natalia M. Levashovab,Mikhail L. Bazhenova,b, Rob Van der Voob,*
aDepartment of Geological Sciences, University of Michigan, Ann Arbor, MI 48109-1063, USAbGeological Institute, Academy of Sciences of Russia, Pyzhevsky Lane, 7, Moscow 109017, Russia
Received 15 November 2002; accepted 2 September 2003
Abstract
Conflicting paleogeographic reconstructions of the Ural–Mongol fold belt have been developed over the past decade; very
few of them, however, have been based on paleomagnetic data, which still remain scarce. The Chingiz Range in northeastern
Kazakhstan provides an opportunity to evaluate the tectonic evolution of the central part of this belt through extensive
paleomagnetic studies. In this paper, we report the results from Upper Cambrian andesites and Lower Ordovician tuffaceous
sandstones within the Chingiz Range. A high-temperature component (HTC), decaying to the origin, is isolated from Upper
Cambrian rocks at eight sites with an easterly and low-intermediate upward direction. This component passes the tilt test and is
likely primary. A HTC is also isolated from Lower Ordovician rocks at 11 sites. These site means exhibit a shallow-inclination
girdle distribution within the southeast quadrant, likely due to net rotations within the complex structure studied. The
inclination-only tilt test is positive, and the best grouping of data is observed at 100% untilting. Also included in our
paleolatitudinal analyses are new middle and late Paleozoic paleolatitudes from nearby parts of the Chingiz Range as well as
published paleomagnetic data from central and east Kazakhstan. We favor normal polarity of the early Paleozoic results of this
paper and conclude that the study area moved northward throughout the Paleozoic. The observed paleolatitudes generally fit
the Siberian reference data and hence indicate coherent latitudinal motion of the Boshekul–Chingiz tectonic zone and the
Siberian plate.
D 2003 Elsevier B.V. All rights reserved.
Keywords: East Kazakhstan; Early Paleozoic; Paleomagnetism; Paleolatitudes; Ural–Mongol fold belt
1. Introduction separates the European (Baltica), Siberian (Siberia),
Published syntheses describing the Paleozoic tec-
tonic evolution of the Ural–Mongol fold belt, which
0040-1951/$ - see front matter D 2003 Elsevier B.V. All rights reserved.
doi:10.1016/j.tecto.2003.09.003
$Refers to doi:10.1016/j.tecto.2003.09.013.
* Corresponding author. Tel.: +1-734-764-8322; fax: +1-734-
763-4690.
E-mail address: [email protected] (R. Van der Voo).
and Tarim cratons (Fig. 1a), as well as the mosaic of
island arc complexes, accretionary wedges, and
ophiolites that comprise present-day east–central
Kazakhstan (Fig. 1b), are rather controversial. Much
of the ambiguity surrounding existing models is due
to the scarcity of reliable paleomagnetic data and to
the complex structural geometries observed in the

A.Q. Collins et al. / Tectonophysics 377 (2003) 229–247230
A.Q. Collins et al. / Tectonophysics 377 (2003) 229–247 231
field. Several hypotheses concerning the Paleozoic
evolution of these complexes have been generated
over the past decade. The two leading reconstructions
are contrasting views inferring the Paleozoic paleo-
geographic positions and tectonic environments asso-
ciated with the complexes that constitute present-day
Kazakhstan and northern Kyrgyzstan (Didenko et al.,
1994; Sengor and Natal’in, 1996).
The Didenko et al. (1994) model characterizes the
amalgamation of the central Ural–Mongol fold belt as
a mosaic of exotic, and mostly unrelated volcanic arc
terranes and microcontinents that moved at low to
moderate northerly latitudes throughout the Paleozoic.
The Didenko et al. (1994) model and others (Zonen-
shain et al., 1990; Mossakovsky et al., 1993; Dobret-
sov et al., 1995) suggest that the first-order
amalgamation of present-day Kazakhstan occurred
by the latest Silurian. In contrast, the original model
of Sengor et al. (1993), followed by the more extensive
interpretation of Sengor and Natal’in (1996), suggests
the existence of a continuous, north–south trending,
over 5500 km long volcanic arc system, coined the
Kipchak Arc. This arc is hypothesized to have been
connected to Siberia, in the north, and Baltica in the
south, with a significant intervening ocean. The Kip-
chak Arc is interpreted as originating in the southern
hemisphere during the early Paleozoic, followed by
northward drift at the same time as the Siberian and
Baltica cratons moved north throughout the rest of the
Paleozoic.
Paleomagnetic investigations of the Boshekul–
Chingiz region (Fig. 1b) can provide constraints for
early Paleozoic latitudinal positions of island arc
complexes and accretionary wedges associated with
the amalgamation of Kazakhstan. These data will also
facilitate reconstructions characterizing the tectonic
framework and paleogeographic positions of these
tectonic ‘‘slivers’’ throughout early Paleozoic time.
In this study, we test the existing hypotheses and
suggest a paleolatitudinally plausible solution, for
early Paleozoic time. This will in turn set the stage
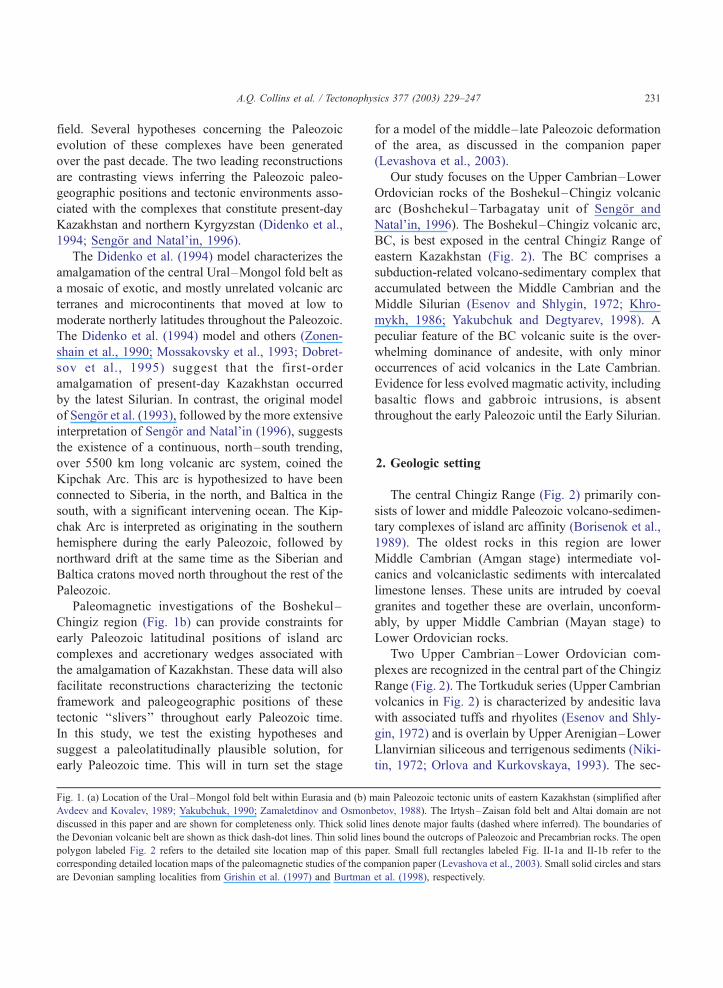
Fig. 1. (a) Location of the Ural–Mongol fold belt within Eurasia and (b) m
Avdeev and Kovalev, 1989; Yakubchuk, 1990; Zamaletdinov and Osmonb
discussed in this paper and are shown for completeness only. Thick solid l
the Devonian volcanic belt are shown as thick dash-dot lines. Thin solid lin
polygon labeled Fig. 2 refers to the detailed site location map of this pa
corresponding detailed location maps of the paleomagnetic studies of the co
are Devonian sampling localities from Grishin et al. (1997) and Burtman
for a model of the middle–late Paleozoic deformation
of the area, as discussed in the companion paper
(Levashova et al., 2003).
Our study focuses on the Upper Cambrian–Lower
Ordovician rocks of the Boshekul–Chingiz volcanic
arc (Boshchekul–Tarbagatay unit of Sengor and
Natal’in, 1996). The Boshekul–Chingiz volcanic arc,
BC, is best exposed in the central Chingiz Range of
eastern Kazakhstan (Fig. 2). The BC comprises a
subduction-related volcano-sedimentary complex that
accumulated between the Middle Cambrian and the
Middle Silurian (Esenov and Shlygin, 1972; Khro-
mykh, 1986; Yakubchuk and Degtyarev, 1998). A
peculiar feature of the BC volcanic suite is the over-
whelming dominance of andesite, with only minor
occurrences of acid volcanics in the Late Cambrian.
Evidence for less evolved magmatic activity, including
basaltic flows and gabbroic intrusions, is absent
throughout the early Paleozoic until the Early Silurian.
2. Geologic setting
The central Chingiz Range (Fig. 2) primarily con-
sists of lower and middle Paleozoic volcano-sedimen-
tary complexes of island arc affinity (Borisenok et al.,
1989). The oldest rocks in this region are lower
Middle Cambrian (Amgan stage) intermediate vol-
canics and volcaniclastic sediments with intercalated
limestone lenses. These units are intruded by coeval
granites and together these are overlain, unconform-
ably, by upper Middle Cambrian (Mayan stage) to
Lower Ordovician rocks.
Two Upper Cambrian–Lower Ordovician com-
plexes are recognized in the central part of the Chingiz
Range (Fig. 2). The Tortkuduk series (Upper Cambrian
volcanics in Fig. 2) is characterized by andesitic lava
with associated tuffs and rhyolites (Esenov and Shly-
gin, 1972) and is overlain by Upper Arenigian–Lower
Llanvirnian siliceous and terrigenous sediments (Niki-
tin, 1972; Orlova and Kurkovskaya, 1993). The sec-
ain Paleozoic tectonic units of eastern Kazakhstan (simplified after
etov, 1988). The Irtysh–Zaisan fold belt and Altai domain are not
ines denote major faults (dashed where inferred). The boundaries of
es bound the outcrops of Paleozoic and Precambrian rocks. The open
per. Small full rectangles labeled Fig. II-1a and II-1b refer to the
mpanion paper (Levashova et al., 2003). Small solid circles and stars
et al. (1998), respectively.

Fig. 2. Geological map of the central Chingiz Range (simplified from Bespalov and Kostenko (1979)). Thick dash-dot lines represent faults; thin
lines denote lithologic contacts. Sampling localities are denoted as solid squares and are labeled as defined in the text. The rectangle labeled Fig.
II-1a refers to the corresponding Fig. 1(a) in the companion paper (Levashova et al., this 2003).
A.Q. Collins et al. / Tectonophysics 377 (2003) 229–247232
ond complex is distributed to the east and southeast. Its
basal units are Upper Cambrian black cherts. Lower
Ordovician volcaniclastic and terrigenous sandstones
conformably overlie the basal members of this series.
Conglomerates locally overly these Lower Ordovician
units. This primarily sedimentary complex is thought
to represent a backarc or forearc basin (Degtyarev,
1999a).
By late Early Ordovician time, a set of granitic
plutons intruded the Middle Cambrian–Lower Ordo-
vician country rock. This whole sequence, both intru-
sions and host rock, was thrusted and folded in the
Middle Ordovician, most likely in the Llanvirnian.
Llandeilian–Caradocian rocks cover the Middle Cam-
brian–Lower Ordovician series (Degtyarev, 1999b)
with an angular unconformity.
A.Q. Collins et al. / Tectonophysics 377 (2003) 229–247 233
The Middle Ordovician units are characterized by
andesite flows with local intercalations of limestone in
the lower half and by volcaniclastic and terrigenous
sediments in the upper one. Upper Ordovician (Car-
adocian–Ashgillian) rocks unconformably cover all
older complexes and are represented by terrigenous
sandstones, intermediate volcanics, and volcaniclastic
sediments. Upper Ordovician units are conformably
overlain by Silurian terrigenous sandstones (Nikitin,
1972). The uppermost part of the BC series includes
voluminous basaltic-andesite flows with intercalated
redbed members of late Llandoverian–Wenlockian
age (Bandaletov, 1969). Upper Silurian granitic plu-
tons were emplaced into the Upper Ordovician–Lower
Silurian complex (Kayupov, 1977). In the study area,
Famennian to Lower Carboniferous sediments uncon-
formably overlie lower Middle Paleozoic rocks. In
other parts of the Chingiz Range and in adjacent
tectonic units, a major angular unconformity of Late
Silurian age is observed.
3. Sampling and methods
We sampled Upper Cambrian and Lower Ordovi-
cian rocks within the BC (Fig. 2; localities CU, OV1,
OV2, and OS). The ages of these formations are based
on different groups of fossils, mainly trilobites and
conodonts, from sedimentary intercalations in these
rocks (Degtyarev, 1999b). Porphyric andesites and
intercalated red sandstones were collected from 14
sites (112 samples) in the Tortkuduk series (locality
CU). Both lithologies, as well as 23 clasts from an
intra-formational conglomerate, were collected from
both limbs of a NW–SE trending anticline. Lower
Ordovician (lower Arenigian) volcanics were sampled
at 11 sites (98 samples) at two localities OV1 and OV2
(Fig. 2). All sites are within andesitic lava and tuff
units of island arc affinity (Yakubchuk and Degtyarev,
1998). We collected a total of 110 samples of Lower
Ordovician (Arenigian) tuffaceous sandstones and silt-
stones, from 13 sites, distributed over a complex
anticline (locality OS; Fig. 2).
Between five and fifteen 2.5-cm-diameter cores,
collected with a portable gasoline-powered drill, or
hand samples were taken from each site. Both cores
and hand samples were oriented with a magnetic
compass and corrected for the regional magnetic
declination. At all localities, a sufficient number of
sedimentary units were found to obtain bedding
attitudes for each paleomagnetic site.
At the University of Michigan paleomagnetic lab-
oratory, cylindrical specimens of dimensions 2.2� 2.5
cm were prepared from cores or hand samples prior to
treatment in a magnetically shielded room. Specimens
were stepwise thermally demagnetized over the range
of 50–680 jC utilizing an Analytical Services TD-48
thermal demagnetizer and measured with a 2G Enter-
prises cryogenic magnetometer.
At the paleomagnetic laboratory of the Geologic
Institute, Russian Academy of Sciences in Moscow,
cubic specimens of 8 cm3 volume were cut from hand
blocks. Specimens were stepwise demagnetized in
15–20 increments, up to 685 jC in a homemade oven
with internal residual fields of about 10 nT and
measured with a JR-4 spinner magnetometer with a
noise level of 0.1 mA m� 1.
Demagnetization results were plotted on orthogo-
nal vector diagrams (Zijderveld, 1967), and linear
trajectories were used to determine directions of
magnetic components by a least-squares fit compris-
ing three measurements or more (Kirschvink, 1980).
Site-mean directions were computed either using
direct observations (isolated components) or combin-
ing them with remagnetization circles (McFadden and
McElhinny, 1988). Paleomagnetic software written by
Randy Enkin, Stanislav V. Shipunov, Trond Torsvik,
and Jean-Pascal Cogne was used in the analysis of
paleomagnetic data.
4. Results
4.1. Lower Ordovician volcanics
After removal of an unstable component, some-
times accounting for the larger part of the NRM, at
200–300 jC, many samples of volcanic rocks did not
reveal a consistent demagnetization pattern. At the
same time, other samples yielded perfect rectilinear
demagnetization trajectories from room temperature
up to well above 600 jC (Fig. 3b), but the cor-
responding component directions are random within
a given site. Only at three sites from locality OV2
could a consistent remanent magnetization component,
showing rectilinear decay to the origin, be isolated
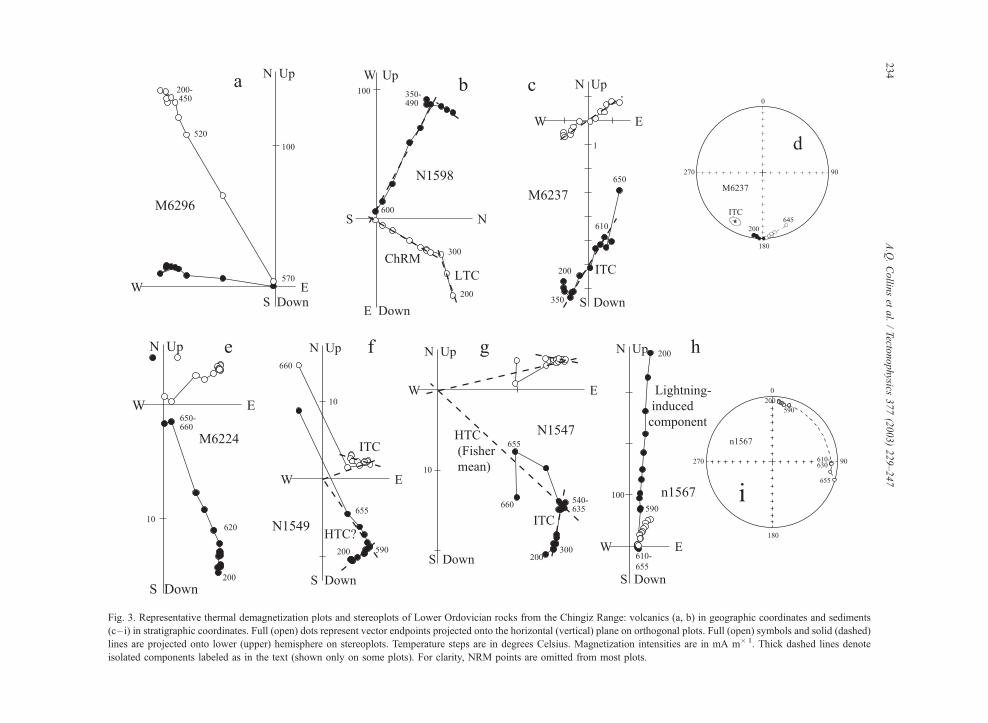
Fig. 3. Representative thermal demagnetization plots and stereoplots of Lower Ordovician rocks from the Chingiz Range: volcanics (a, b) in geographic coordinates and sediments
(c– i) in stratigraphic coordinates. Full (open) dots represent vector endpoints projected onto the horizontal (vertical) plane on orthogonal plots. Full (open) symbols and solid (dashed)
lines are projected onto lower (upper) hemisphere on stereoplots. Temperature steps are in degrees Celsius. Magnetization intensities are in mA m� 1. Thick dashed lines denote
isolated components labeled as in the text (shown only on some plots). For clarity, NRM points are omitted from most plots.
A.Q.Collin
set
al./Tecto
nophysics
377(2003)229–247
234

A.Q. Collins et al. / Tectonophysics 377 (2003) 229–247 235
(Fig. 3a). This component, generally removed below
570 jC, is called the intermediate-temperature com-
ponent (ITC) in Table 1. Its three site means are best
grouped in situ (Table 1; Fig. 4a,b), thus indicating a
postfolding origin of this component.
At both localities OV1 and OV2, sampling could be
done only at higher elevations in the generally mature
relief, although the very crests were avoided. Despite
this, the presence of perfectly single-component, yet
randomly directed, remanences indicates that many
samples were lightning-struck (e.g., Miller et al.,
2000). Very strong drops of NRM intensity at low
demagnetization temperatures may result from pene-
Table 1
Paleomagnetic results from Lower Ordovician volcanics and sediments of
Site N0/N A/d Geographic coordinates
D (j) I (j) k
Intermediate-temperature component (ITC)—volcanic units
OV2-6 13/8 248/51* 286.5 � 76.7 1
OV2-8 10/9 314/51 241.5 � 66.3 1
OV2-9 7/6 245/76* 209.8 � 45.1 2
Mean (4/3) 231.4 � 65.5 1
Intermediate-temperature component (ITC)—sedimentary units
OS1 10/3 36/42* 250.4 � 56.9 2
OS2 10/6 7/61 246.6 � 61.2 1
OS3 8/8 15/74 246.3 � 50.0 2
OS4 7/5 19/65 264.1 � 54.6 1
OS5 9/5 347/85 264.1 � 49.2 1
OS10 9/7 227/37* 235.5 � 36.6 3
Mean (13/6) 250.5 � 51.9 5
ITC (9) 245.9 � 56.6 2
High-temperature component (HTC)—sedimentary units
OS1 10/10 3/29* 137.4 � 54.8 1
OS2 10/10 8/61 128.1 � 66.4 2
OS3 8/7 14/72* 145.2 � 73.9
OS4 7/6 19/65* 135.5 � 61.2 4
OS5 9/8 347/85 57.9 � 67.2 5
OS6 6/5 26/81* 97.3 � 34.6 5
OS7 5/5 13/78* 87.0 � 40.5 5
OS8 9/7 239/104* 196.1 � 20.7 2
OS9 14/10 182/82 109.0 4.3 7
OS12 8/8 327/42 105.3 � 69.8 5
OS13 9/7 344/44* 120.6 � 72.4 2
Mean (13/11) 120.4 � 57.2
INC (13/11) – � 51.8
Sites are labeled as in text. Mean directions are calculated from site means
and sediments; INC: inclination-only statistics (McFadden and Reid, 1982)
dip direction/dip angle (calculated for the accepted samples; d>90j for
precision parameter (Fisher, 1953); a95, radius of confidence circle (in j).* Bedding attitudes are variable at these sites.
trative weathering due to long exposure times. Tenta-
tively, we interpret the high scatter at most sites to
reflect the combined effects of lightning and mineral
alteration.
4.2. Lower Ordovician sediments
A low temperature component (LTC) was isolated
from more than three samples at only two sites but
was observed at other sites as well. Its directions are
close to the present-day field in situ and diverge upon
tilt correction; hence, this remanence is either a
viscous overprint or related to weathering.
the Chingiz Range
Stratigraphic coordinates
a95 D (j) I (j) k a95
9 13.0 55.1 � 48.3 18 13.4
3 14.6 165.0 � 41.8 13 14.6
8 6.0 101.6 � 47.0 6 28.4
4 34.7 108.7 � 55.3 5 61.3
7 24.3 235.2 � 18.3 14 34.9
7 16.7 212.5 � 11.8 20 15.3
7 10.9 225.7 10.4 30 10.3
3 21.7 231.0 � 7.1 13 22.5
6 19.6 208.4 � 8.4 16 19.6
4 10.8 249.8 � 72.7 25 12.7
3 9.3 224.1 � 17.1 7 26.6
5 10.5 207.2 � 38.6 < 3 40.0
4 14.2 154.3 � 30.8 21 11.3
8 9.4 167.3 � 15.7 32 8.8
9 23.6 181.9 � 7.2 28 13.3
1 11.4 172.9 � 10.1 153 5.8
2 8.1 144.7 � 16.5 54 7.9
0 12.4 144.1 � 16.1 158 6.9
6 11.8 142.4 � 20.5 124 7.9
4 12.2 110.2 � 35.9 40 9.4
9 5.7 98.5 � 16.5 65 6.3
7 7.8 131.3 � 31.9 47 8.6
6 12.5 150.3 � 32.8 18 15.0
6 20.0 146.3 � 23.1 10 14.8
5 22.3 – � 21.3 29 6.3
(Fisher, 1953); ITC: overall mean of overprint data from volcanics
; N0/N, the number of samples (sites) studied/accepted; A/d, average
the beds in overturned position); D, declination; I, inclination; k,

Fig. 4. Stereoplots of intermediate- (a, b) and high-temperature component (c, d) site-mean directions with confidence circles (thin lines) in
Lower Ordovician volcanics (squares) and sediments (circles) from the Chingiz Range in situ (a,c) and after tilt correction (b,d). Stars are overall
mean directions of these remanences with confidence circles (thick lines). Cross in (a) is the expected Permian Eurasian reference direction for
this locality with confidence circle (thick dotted line). Thick and thin dotted lines in (d) denote mean inclination and its confidence limits,
respectively, computed with the aid of inclination-only statistics (McFadden and Reid, 1982). (e) Distribution of all bedding poles measured in
sediments from locality OS. Solid (open) symbols and solid (dashed and dotted) lines are projected onto lower (upper) hemisphere.
A.Q. Collins et al. / Tectonophysics 377 (2003) 229–247236

Fig. 5. Representative thermal demagnetization plots and stereoplots of Upper Cambrian host rocks (a–e) and clasts from an intra-formational
conglomerate (f– i) in stratigraphic coordinates. Notation as in Fig. 3.
A.Q. Collins et al. / Tectonophysics 377 (2003) 229–247 237
A.Q. Collins et al. / Tectonophysics 377 (2003) 229–247238
In many samples, a well-defined intermediate
component persists over a wide range from 300 jCto more than 600 jC; sometimes, it is the only compo-
nent. This intermediate-temperature component (ITC)
does not decay to the origin and displays remagnetiza-
tion circles on the stereonet (Fig. 3c,d), thus indicating
that a high-temperature component (HTC) is also
present. Acquisition of spurious remanences above
600 jC, however, prevented complete demagnetization
of several samples. As a result, just an initial part of the
HTC trajectory was observed in some samples (Fig.
3f), while the HTC was fully determined from quite a
few other samples (Fig. 3e). In still other samples, the
remanence stabilized (as clustered vector endpoints),
both in intensity and direction, after ITC removal (Fig.
3g; 540–635 jC), but the final decay to the origin couldnot be observed because of sudden (and spurious)
magnetization changes. At two sites, many samples
were clearly affected by lightning strikes; luckily, some
of them displayed remagnetization circles (Fig. 3h,i),
which could be used further on. Directly isolated HTC
directions and remagnetization circles were preferably
used to calculate HTC site-mean vectors (McFadden
and McElhinny, 1988); for samples where the two
previous types of data could not be obtained, Fisher
statistics was used to determine directions by averaging
the clustered endpoints of the interval 540–635 jC.The ITC site-mean directions cluster better in situ
than in tilt-corrected coordinates, and a postfolding
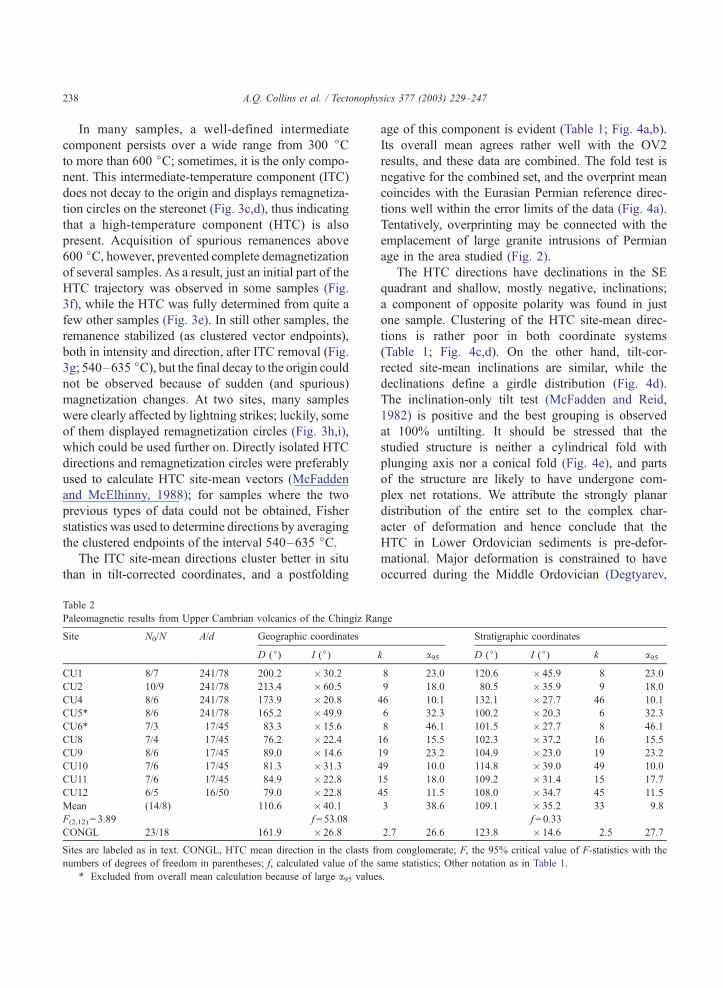
Table 2
Paleomagnetic results from Upper Cambrian volcanics of the Chingiz Ra
Site N0/N A/d Geographic coordinates
D (j) I (j)
CU1 8/7 241/78 200.2 � 30.2
CU2 10/9 241/78 213.4 � 60.5
CU4 8/6 241/78 173.9 � 20.8
CU5* 8/6 241/78 165.2 � 49.9
CU6* 7/3 17/45 83.3 � 15.6
CU8 7/4 17/45 76.2 � 22.4
CU9 8/6 17/45 89.0 � 14.6
CU10 7/6 17/45 81.3 � 31.3
CU11 7/6 17/45 84.9 � 22.8
CU12 6/5 16/50 79.0 � 22.8
Mean (14/8) 110.6 � 40.1
F(2,12) = 3.89 f = 53.08
CONGL 23/18 161.9 � 26.8
Sites are labeled as in text. CONGL, HTC mean direction in the clasts fr
numbers of degrees of freedom in parentheses; f, calculated value of the
* Excluded from overall mean calculation because of large a95 value
age of this component is evident (Table 1; Fig. 4a,b).
Its overall mean agrees rather well with the OV2
results, and these data are combined. The fold test is
negative for the combined set, and the overprint mean
coincides with the Eurasian Permian reference direc-
tions well within the error limits of the data (Fig. 4a).
Tentatively, overprinting may be connected with the
emplacement of large granite intrusions of Permian
age in the area studied (Fig. 2).
The HTC directions have declinations in the SE
quadrant and shallow, mostly negative, inclinations;
a component of opposite polarity was found in just
one sample. Clustering of the HTC site-mean direc-
tions is rather poor in both coordinate systems
(Table 1; Fig. 4c,d). On the other hand, tilt-cor-
rected site-mean inclinations are similar, while the
declinations define a girdle distribution (Fig. 4d).
The inclination-only tilt test (McFadden and Reid,
1982) is positive and the best grouping is observed
at 100% untilting. It should be stressed that the
studied structure is neither a cylindrical fold with
plunging axis nor a conical fold (Fig. 4e), and parts
of the structure are likely to have undergone com-
plex net rotations. We attribute the strongly planar
distribution of the entire set to the complex char-
acter of deformation and hence conclude that the
HTC in Lower Ordovician sediments is pre-defor-
mational. Major deformation is constrained to have
occurred during the Middle Ordovician (Degtyarev,
nge
Stratigraphic coordinates
k a95 D (j) I (j) k a95
8 23.0 120.6 � 45.9 8 23.0
9 18.0 80.5 � 35.9 9 18.0
46 10.1 132.1 � 27.7 46 10.1
6 32.3 100.2 � 20.3 6 32.3
8 46.1 101.5 � 27.7 8 46.1
16 15.5 102.3 � 37.2 16 15.5
19 23.2 104.9 � 23.0 19 23.2
49 10.0 114.8 � 39.0 49 10.0
15 18.0 109.2 � 31.4 15 17.7
45 11.5 108.0 � 34.7 45 11.5
3 38.6 109.1 � 35.2 33 9.8
f = 0.33
2.7 26.6 123.8 � 14.6 2.5 27.7
om conglomerate; F, the 95% critical value of F-statistics with the
same statistics; Other notation as in Table 1.
s.
A.Q. Collins et al. / Tectonophysics 377 (2003) 229–247 239
1999b); therefore, it is likely that the magnetization
observed is primary.
4.3. Upper Cambrian units
Upper Cambrian volcanics and associated sedi-
ments were sampled from both slopes of a small
range; although the range crest was avoided, several
samples from this collection, during thermal clean-
ing, exhibit characteristics that can be attributed to
lightning-induced magnetization. These observations
include convex up geometry of intensity curves,
high natural remanent magnetization (NRM) values
of 10 A m� 1 or greater, and random directions.
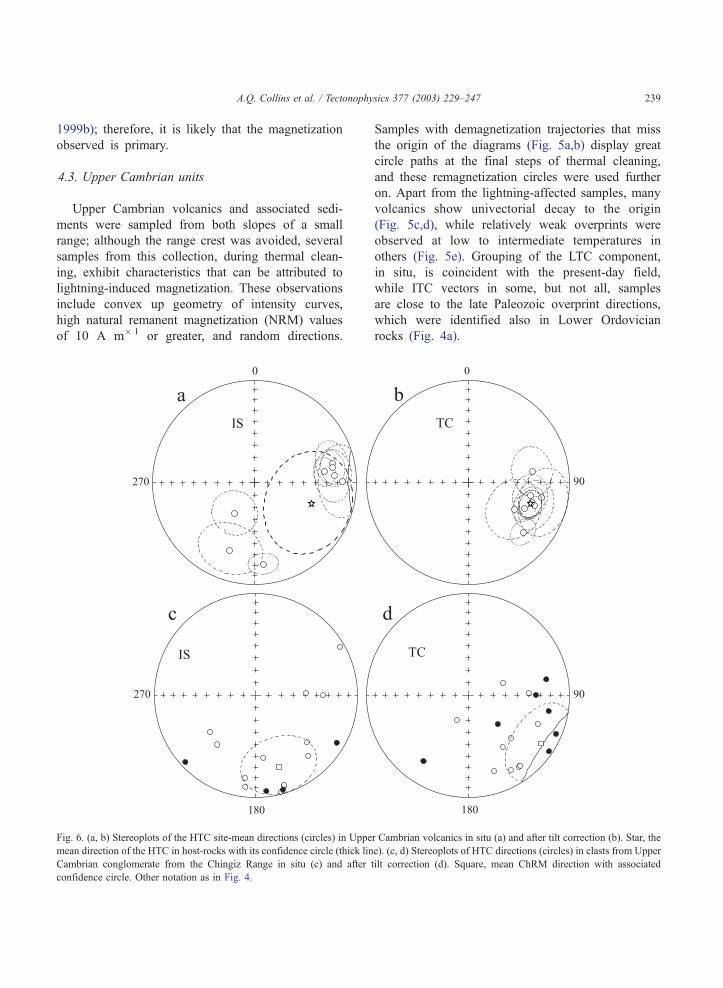
Fig. 6. (a, b) Stereoplots of the HTC site-mean directions (circles) in Uppe
mean direction of the HTC in host-rocks with its confidence circle (thick lin
Cambrian conglomerate from the Chingiz Range in situ (c) and after t
confidence circle. Other notation as in Fig. 4.
Samples with demagnetization trajectories that miss
the origin of the diagrams (Fig. 5a,b) display great
circle paths at the final steps of thermal cleaning,
and these remagnetization circles were used further
on. Apart from the lightning-affected samples, many
volcanics show univectorial decay to the origin
(Fig. 5c,d), while relatively weak overprints were
observed at low to intermediate temperatures in
others (Fig. 5e). Grouping of the LTC component,
in situ, is coincident with the present-day field,
while ITC vectors in some, but not all, samples
are close to the late Paleozoic overprint directions,
which were identified also in Lower Ordovician
rocks (Fig. 4a).
r Cambrian volcanics in situ (a) and after tilt correction (b). Star, the
e). (c, d) Stereoplots of HTC directions (circles) in clasts from Upper
ilt correction (d). Square, mean ChRM direction with associated

A.Q. Collins et al. / Tectonophysics 377 (2003) 229–247240
HTC directions, such as shown in Fig. 5c–e, are of
the same polarity in all samples. The HTC site means
are based mostly on directly isolated components,
with a few remagnetization circles used if acquisition
of spurious remanences prevented complete demag-
netization. These directions form two distinct clusters
in situ, which converge into a tight one upon tilt
correction (Table 2; Fig. 6a,b), providing a positive tilt
test (McFadden and Jones, 1981).
Some andesite samples from two conglomerate sites
contain only one component up to well above 600 jC(Fig. 5f), while two or even three components are
present in others (Fig. 5g–i); the HTC can be confi-
dently isolated from 18 samples out of 23 studied.
Despite considerable scatter, HTC directions are not
random in either coordinate system (Table 2; Fig. 6c,d);
note also that the tilt-corrected HTC mean from the
clasts is similar to the host rock data within the error
limits (Fig. 6b). This pattern can indicate a complete
remagnetization of all Upper Cambrian rocks; because
of the positive tilt test, this remagnetization must have
been acquired prior to folding, which took place in the
Middle Ordovician. However, there is another possible
explanation for the lack of randomness in the clast data
set. The intra-formational conglomerate studied con-
sists of angular to rounded andesite debris within a
matrix of the same composition. In the field, a gradual
transition from massive andesite flows to these con-
glomerate-like units was observed. It is possible that
the ‘‘conglomerate’’ is actually an agglomerate, indi-
cating a ‘‘hot’’ depositional nature. In this depositional
environment lava debris could have been displaced
during final stages of cooling after the HTC magneti-
zation had already been acquired. This displacement
would not have been of a magnitude to completely
randomize the HTC vectors observed, but would have
sufficed to increase the data scatter.
The HTC in Upper Cambrian rocks is prefolding
and hence not younger than the end of the Early
Ordovician; despite the ambiguous conglomerate data,
we favor the interpretation that this remanence is
primary.
5. Interpretation
The main objective of this study is to provide a
paleomagnetic test of the different hypotheses
concerning the early Paleozoic tectonic evolution of
the central Ural–Mongol fold belt. The disparate
views of Sengor and Natal’in (1996) and Didenko et
al. (1994) portray early Paleozoic models placing the
BC in different paleogeographic positions and geo-
dynamic settings. Didenko et al. (1994) have inferred
a low northerly paleolatitude (f 15jN) during Early
Ordovician time, without any paleogeographic con-
nection to either Siberia or Baltica (Fig. 7a). In
contrast, Sengor and Natal’in (1996) place the BC at
intermediate southerly paleolatitudes during Late
Cambrian time (f 30jS) and propose that this region
is a duplexed member of an extensive volcanic arc
that, during the early Paleozoic, was situated between
the Siberian and Baltica cratons and reached low
southern latitudes by Middle Ordovician time (Fig.
7b). These hypotheses not only show variable location
of the BC, but also require different paleolatitudinal
displacement histories and predict different origins.
Our new paleomagnetic data can be used to test
paleogeographic models for the BC for Paleozoic
times. The Late Cambrian (� 35.2F 9.8j) and Early
Ordovician (� 21.3F 6.3j) mean inclinations corre-
spond to paleolatitudes of 19.4F 6.5j and 12.2F3.6j, respectively. Given the southeasterly declina-
tions of both these results, it is logical to infer that
they are of the same polarity, although it is not known
whether this polarity was normal or reversed. As a
consequence, it is also not a priori clear whether these
early Paleozoic paleolatitudes were northerly or south-
erly. We also include two new middle Paleozoic
results from the companion paper into our analysis
(Levashova et al., 2003), which add an Early Silurian
(Wenlockian) paleolatitude of 1.4F 4.1j and a Mid-
dle Devonian (Givetian) one of 30.2F 10.7j. Lastly,we include a paleolatitude of 32.2F 3.2j derived
from Permian volcanics in a more easterly part of
the Chingiz Range (Levashova et al., 2003).
The polarity of the Permian result is straightfor-
ward and places the BC in northern mid-latitudes. The
Middle Devonian paleolatitude is almost certainly
northerly as well, as the opposite option creates large
difficulties for the tectonic evolution of the entire
Ural–Mongol belt and would require ultra-fast veloc-
ities for the BC in post-Givetian time. The Wenlock-
ian result indicates that the study area straddled the
equator within error limits; its polarity choice is
therefore irrelevant for the paleolatitudinal evolution-

Fig. 7. Palinspastic reconstructions of the Ural–Mongol belt: (a) after Didenko et al. (1994), depicting Early Ordovician time; BC—Boshekul–
Chingiz volcanic arc, NT—North Tien Shan block; (b) after Sengor and Natal’in (1996), depicting Middle Ordovician time. Both
reconstructions are simplified. For clarity, only major units pertinent to this study are shown and are labeled as they are referred to in the text.
A.Q. Collins et al. / Tectonophysics 377 (2003) 229–247 241
ary scenario, although this choice will certainly play a
role in the discussion of rotations as indicated by the
declinations (Levashova et al., 2003). However, the
polarity option for the two early Paleozoic results
allows for two competing drift scenarios. Assuming
normal polarity, the paleolatitudes indicate a southern-
hemisphere position in the early Paleozoic and require
a rather steady northward translation of the BC
throughout the Paleozoic (Fig. 8). A reversed-polarity
scenario would imply a northerly paleolatitude posi-
A.Q. Collins et al. / Tectonophysics 377 (2003) 229–247242

A.Q. Collins et al. / Tectonophysics 377 (2003) 229–247 243
tion and requires a southward translation during the
early Paleozoic; it also would imply a reversal in the
motion of BC sometime during the Silurian (Fig. 8).
Both scenarios are plausible. The first one implies
a movement of BC in general accord with those of
Siberia, which shows steadfast northward motion
throughout the Paleozoic, albeit with variable veloc-
ities (e.g., Torsvik et al., 1996). Instead, the second
scenario requires a southward drift of the BC from the
Late Cambrian to the Early Silurian that is completely
independent of, and opposite to, the movements of the
nearby (?) cratons of Baltica and Siberia. In favor of
the second scenario is that the Arenigian is thought to
be largely, if not entirely, an interval of reversed
polarity (Khramov et al., 1982; Torsvik and Trench,
1991; Gallet and Pavlov, 1996; Pavlov and Gallet,
1998).
For our subsequent analysis, the above results from
the BC are compared with reference paleolatitudes,
which can either be estimated from the palinspastic
reconstructions of the Ural–Mongol belt or, more
conventionally, calculated from the apparent polar
wander paths (APWPs) of adjacent major cratonic
blocks, i.e., Baltica and Siberia. We used the recon-
structions of Sengor and Natal’in (1996) and Didenko
et al. (1994) as the end-members of the models
proposed thus far.
Several APWPs have been constructed for Baltica
during the last decade (Van der Voo, 1993; Pechersky
and Didenko, 1995; Smethurst et al., 1998; McEl-
hinny and McFadden, 2000, and others). Although
they are based on different selection criteria and
statistical treatments, these paths show a general
agreement. Some, albeit limited, additions of newer
paleomagnetic data for Baltica may account for the
differences in the APWPs and, hence, in the
corresponding paleolatitude plots (Fig. 8a). To first
approximation, our results show good agreement with
these plots for the Early Silurian–Late Permian inter-
val. In contrast, the observed early Paleozoic paleo-
latitudes differ from the predicted ones for both
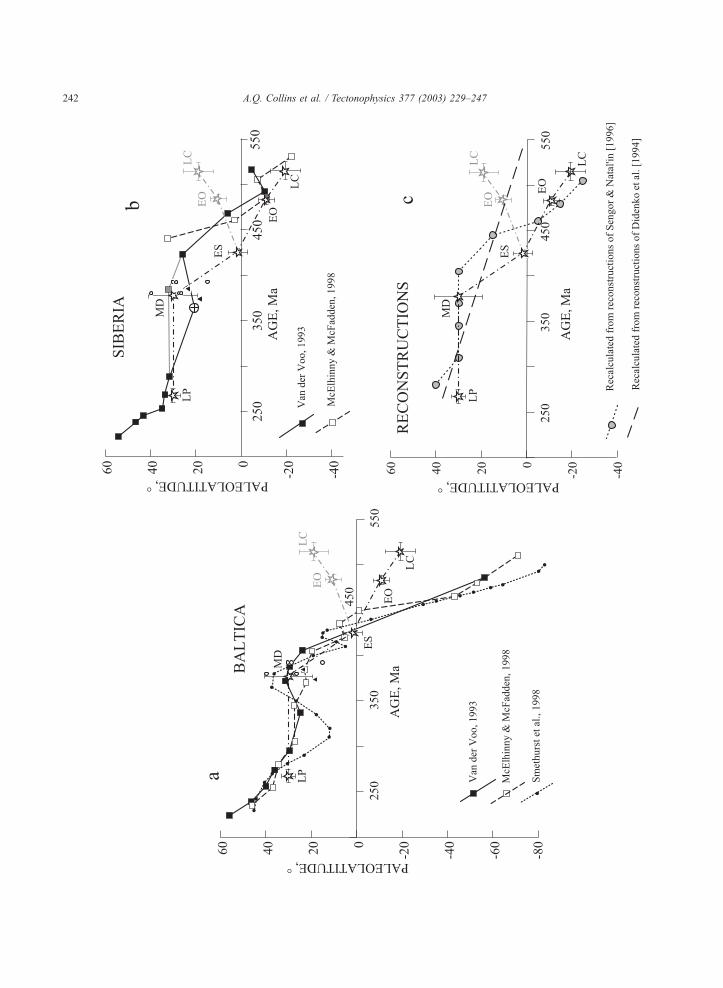
Fig. 8. Plots of paleolatitudes versus age for observed and reference data. S
error bars. LC: Late Cambrian, EO: Early Ordovician, ES: Early Silurian,
and ES are smaller than symbols). Ages are assigned according to the DN
shaded) symbols and lines correspond to normal (reversed) polarities of
calculated for a common point at 48.9jN, 79.0jE from different APWPs f
Sengor and Natal’in (1996) and Didenko et al. (1994). Small open circles
Grishin et al. (1997) and Burtman et al. (1998), respectively.
polarity options; the magnitude of inferred poleward
motion of the BC is much less than that expected for
Baltica for Cambro-Ordovician times (Fig. 8a).
All published Siberian APWPs result in rather
similar paleolatitude predictions for the BC in the
early Paleozoic (Fig. 8b), despite the steadily growing
database for this interval (e.g., Gallet and Pavlov,
1996; Pavlov and Gallet, 1998). In contrast, the
reference values diverge greatly in the middle Paleo-
zoic and Carboniferous; in particular, a recent Siberian
APWP of McElhinny and McFadden (2000) predicts
paleolatitudes up to 50jN and higher for the study
area, and these are higher by more than 20j than those
predicted by other APWPs (e.g., Van der Voo, 1993;
Smethurst et al., 1998). This discrepancy, however, is
not surprising because the middle– late Paleozoic
Siberian data used by McElhinny and McFadden
(2000) are decades old and are suspected to be
unreliable. These suspicions are confirmed by geo-
logical data (Scotese and McKerrow, 1990; Pedder
and Oliver, 1990) that point to much lower paleola-
titudes for Siberia than those deduced from the older
paleomagnetic data. Also, the APWP of McElhinny
and McFadden (2000) predicts paleolatitudes that are
too high by about 20j compared to observed values
for some blocks near the southern margin of Siberia,
which are thought to have been geologically linked to
the Siberian craton in the middle Paleozoic (Bach-
tadse et al., 2000 and references therein). Finally,
Kravchinsky et al. (2002) have just obtained a Late
Devonian–Early Carboniferous pole, which differs
from all previously available data for Siberia. So,
for this paper, we replaced the Devonian pole of
Van der Voo (1993) by this new result (Fig. 8b) and
did not include the Silurian and younger reference
APWP of McElhinny and McFadden (2000). For our
purposes, the uncertainties in the APWPs for Siberia
allow us to reach only qualitative conclusions.
Our results show an acceptable agreement with the
predictions extrapolated from Siberia for the early
Paleozoic, but they deviate in the Early Silurian and
tars, observed paleolatitudes for the Chingiz Range with associated
MD: Middle Devonian, LP: Late Permian (age uncertainties for MD
AG time scale after Palmer (1983). For LC and EO, black (lightly
these results as discussed in the text. Reference paleolatitudes are
or (a) Baltica and (b) Siberia and (c) palinspastic reconstructions of
and solid triangles in (a) and (b) are Devonian paleolatitudes from
A.Q. Collins et al. / Tectonophysics 377 (2003) 229–247244
converge again for the Middle Devonian–Late Perm-
ian interval (Fig. 8b). The Early Silurian discrepancy
might have some tectonic explanation. However, we
would like to point out that all Silurian results from
Siberia are old and, at the very least, of suspected
quality. Moreover, several attempts to get more reli-
able data for this interval have failed because Silurian
rocks, even at previously studied localities, are found
to be either completely remagnetized, presumably
during the emplacement of Permo-Triassic flood
basalts, or they reveal no stable components altogether
(V.E. Pavlov, personal communication). So it appears
to be likely that the Early Silurian discrepancy is due
to low reliability of the Siberian data set.
Our analysis shows that the Devonian–Permian
segments of both Baltica and Siberia reference pale-
olatitude plots do not differ for the Chingiz; at least
two APWPs from the available sets give predicted
paleolatitudes that coincide with our results within the
error limits. The Early Silurian paleolatitude agrees
better with Baltica, but the reliability of the Siberian
data, as already noted, is very doubtful.
We next turn to the two early Paleozoic results,
which differ from Baltica predictions for either
choice of polarity. Assuming the reversed polarity
option, these two paleolatitudes from the BC differ
from the Siberian reference plot as well. Instead,
they show rather good agreement with the Siberian
curve for the normal polarity option. Although not
indisputable, this agreement, and the fact that all
tectonic elements surrounding the study area show
northward drift, makes us prefer the latter option
below.
Besides an examination of the predictions from
reference APWPs, we have also used tectonic models
of the Paleozoic amalgamation of Kazakhstan for a
comparison with our observations (Fig. 8c). This
comparison shows that the reversed polarity option
results in serious disagreement with the positions and
motion of the BC suggested by Sengor and Natal’in
(1996). Comparison with the Didenko et al. (1994)
model exhibits only minor disagreement with respect
to latitudinal position of the BC for the reversed
polarity option (Fig. 8c). However, this model sug-
gests northward drift of the Chingiz during the Paleo-
zoic, whereas a reversed-polarity interpretation of our
data calls for a southward drift of the BC from the
Late Cambrian to the Early Silurian. Hence we
conclude that an apparent agreement of the early
Paleozoic paleolatitudes with the Didenko et al.
(1994) model is fortuitous.
Conversely, the normal polarity option is in dis-
agreement with the Didenko et al. (1994) model,
whereas it provides a rather good correlation of the
BC paleolatitudinal positions with the Sengor and
Natal’in (1996) model during the early Paleozoic
(Fig. 8c). The Early Silurian paleolatitude supports
this correlation by the general sense of Chingiz
motion but differs considerably from the predicted
value. We recall, though, that the position of the
Kipchak Arc of Sengor and Natal’in (1996) is tied
to the positions of Siberia and Baltica, which in turn
have been based on (older) paleomagnetic data by
these authors. If, as we just argued, the APWP for
Siberia is in error, the model should—and can—be
modified accordingly (alas, not in this paper).
Unfortunately, we cannot get more support for
our conclusions from the few previously published
paleomagnetic results because of their low or dis-
putable reliability. Several results from Ordovician
and Early Silurian ophiolite complexes of central
Kazakhstan (Fig. 1b) have been used to suggest that
these rocks were originally at low northerly lati-
tudes, between the equator and 20jN (Turmanidze
et al., 1991; Grishin et al., 1991). These collections
were mostly heated in a few steps up to 540 jCand revealed very scattered remanence directions at
the highest temperatures used. Consequently, the
mean directions are based mainly on ‘‘remagnetiza-
tion great circles’’; however, these were drawn to
connect only the last two vector endpoints (usually
500 and 540 jC); more rigorous principal compo-
nent analysis (Kirschvink, 1980) was rarely used.
We do not think that these data are reliable enough
to be incorporated in our interpretation.
Our Middle Devonian result (Levashova et al.,
2003) is clearly of preliminary nature. Several Devo-
nian paleomagnetic results were reported from central
and east Kazakhstan (Grishin et al., 1997; Burtman et
al., 1998), and we tried to reinforce our interpretation
by combining all results. The corresponding paleola-
titudes, however, are rather scattered (Fig. 8a,b; small
open circles and full triangles); our evaluation of these
data is that their reliability is not high. Clearly, new
reliable middle Paleozoic and Carboniferous results
are needed.
A.Q. Collins et al. / Tectonophysics 377 (2003) 229–247 245
At this point in time, though, we think that the
generally good agreement of the BC paleolatitudes
with the Siberian reference values looks rather con-
vincing and, hence, that BC motion was mainly
governed by the kinematics of the Siberian plate.
Within the framework of the model of Sengor and
Natal’in (1996), the BC is treated as a peri-Siberian
segment of the huge Kipchak Arc; hence, we can state,
with the above-discussed reservations, that this model
is compatible with available paleomagnetic data.
So far, we discussed only paleomagnetic data from
the northeastern part of Kazakhstan, which supposed-
ly constituted the peri-Siberian part of the Kipchak
Arc. Recently, a set of Ordovician and Carboniferous
paleomagnetic results (Bazhenov et al., 2003) was
obtained in south Kazakhstan and north Kyrgyzstan,
in the North Tien Shan tectonic zone, which was
placed in the central part of the same Kipchak Arc
and thus closer to Baltica (Fig. 7b). Resolving polarity
ambiguities for the Ordovician results by assuming
steady northward drift (just like in this paper), Bazhe-
nov et al. (2003) found that the paleolatitudes for the
North Tien Shan generally match the expected values
for Baltica and differ from the Siberian data. Hence,
the available paleomagnetic data from the two distant
segments of the hypothetical Kipchak Arc generally
agree with the kinematics of the craton closest to each
of them.
Despite numerous uncertainties about the different
APWP versions for Baltica and Siberia, the paleola-
titude predictions agree too well with the observed
middle–late Paleozoic paleolatitudes from the North
Tien Shan and BC to be a coincidence. It is also well
known that the Ural Ocean existed between Baltica
and Kazakhstan sensu lato during the same interval as
indicated by numerous island arc complexes and
deep-sea sediments of various ages in the modern
Ural Mountains (Fig. 1a). This ocean is thought to
have closed not earlier than the end of Carboniferous
or even later (Puchkov, 1993, 1997; Alvarez-Marron
et al., 2000). Close agreement between the observed
paleolatitudes and the reference values for Baltica,
Siberia and Kazakhstan greatly narrows the north–
south extent of this ocean. However, a rather large
difference in Devonian latitudes has been reported for
both sides of the Ural Ocean (Burtman et al., 2000). A
resolution of the paleogeography of the Ural Ocean
will require further study.
Conclusions that can be drawn from an analysis of
the declinations of all the Paleozoic results from the
Chingiz area and the North Tien Shan Zone will be
discussed in the companion paper (Levashova et al.,
2003).
6. Conclusions
We have isolated prefolding paleomagnetic com-
ponents from Upper Cambrian and Lower Ordovi-
cian rocks of the Chingiz Range in eastern
Kazakhstan. Notwithstanding an ambiguous con-
glomerate test for Cambrian volcanics and a large
range of declinations in the Ordovician tuffaceous
sediments, both components are most likely primary
and were acquired in geomagnetic fields of the
same polarity. These results are combined with
middle and late Paleozoic data from other parts of
the Chingiz Range (Levashova et al., 2003; Leva-
shova et al., 2003) and allow us to evaluate pale-
olatitudinal displacements of this area over most of
the Paleozoic. Comparison with the reference lati-
tudes for Siberia and Baltica shows that the Chingiz
area moved coherently with Siberia; a misfit of
Silurian predictions and observations can be attrib-
uted to the low reliability of Siberian reference
poles. When compared with the models of the
tectonic evolution of the Ural–Mongol belt, our
paleomagnetic data show good correlation with the
hypothesized kinematics of the Kipchak Arc (Sen-
gor et al., 1993; Sengor and Natal’in, 1996) and
disagree with other models. This correlation is
further corroborated by paleomagnetic data from
the North Tien Shan Range in south Kazakhstan
and north Kyrgyzstan (Bazhenov et al., 2003),
which also show good correspondence with the
kinematics of its segment of this arc. Therefore,
available paleomagnetic data from the central part of
the Ural–Mongol belt generally support the model
suggested by Sengor and colleagues. Our data,
however, come from only two segments of the
Kipchak Arc and do not provide as complete a
coverage of Paleozoic time as would ultimately be
desirable; clearly, a lot of work still awaits geolo-
gists and paleomagnetists before a thoroughly docu-
mented kinematic model of the Ural–Mongol belt
will be available.
A.Q. Collins et al. / Tectonophysics 377 (2003) 229–247246
Acknowledgements
We thank Nina Dvorova for extensive help with
paleomagnetic measurements. We would also like to
thank the Scientific Station of the Institute for High
Temperatures (IVTAN) in Bishkek, Kyrgyzstan, for
immeasurable logistical support during our field
works in Kyrgyzia and Kazakhstan. Helpful com-
ments from Ben van der Pluijm, Josep M. Pares, and
Konstantine Statagin greatly improved the contents of
the manuscript, as did constructive reviews by Vadim
Kravchinsky, an anonymous reviewer and Editor J. P.
Burg. This research has been funded by the United
States National Science Foundation through a grant
from the Earth Sciences division (EAR 9909231-
RVDV), through grants issued by the Russian Basic
Research Fund (Bazhenov, Degtyarev and Levashova;
nos. 00-05-64148, 00-05-64149, and 00-0564646),
and through grant support from the University of
Michigan Scott Turner Fund (Collins).
References
Alvarez-Marron, J., Brown, D., Perez-Estaun, A., Puchkov, V.,
Gorozhanina, Y., 2000. Accretionary complex structure and kin-
ematics during Paleozoic arc–continent collision in the southern
Urals. Tectonophysics 325, 175–191.
Avdeev, A.V., Kovalev, A.S., 1989. Ophiolites and Evolution of the
Southwest Part of the Ural–Mongol Fold belt Moscow State
University, Moscow 227 p. (in Russian).
Bachtadse, V., Pavlov, V.E., Kazansky, A.Y., Tait, J.A., 2000. Si-
luro-Devonian paleomagnetic results from the Tuva Terrane
(southern Siberia, Russia): implications for the paleogeography
of Siberia. J. Geophys. Res. 105, 13509–13518.
Bandaletov, S.M., 1969. The Silurian of Kazakhstan. Nauka, Alma-
Ata 149 p. (in Russian).
Bazhenov, M.L., Collins, A.Q., Degtyarev, K.E., Levashova, N.M.,
Mikolaichuk, A.V., Pavlov, V.E., Van der Voo, R., 2003. Pale-
ozoic northward drift of the North Tien Shan (Central Asia) as
revealed by Ordovician and Carboniferous paleomagnetism.
Tectonophysics 366, 113–141.
Bespalov, V.F., Kostenko, N.N. (Eds.), 1979. Geological Map of
Kazakh SSR, scale 1:500,000, sheet M-44-A. Ministry of Geol-
ogy of KazSSR, Alma-Ata (in Russian).
Borisenok, V.I., Ryazantsev, A.V., Degtyarev, K.E., Yakubchuk,
A.S., 1989. Paleozoic geodynamics of central Kazakhstan. In:
Puscharovskiy, Y.M. (Ed.), Tectonic Research and Middle-
Large Scale Geological Mapping. Nauka, Moscow, pp. 81–95
(in Russian).
Burtman, V.S., Gurary, G.Z., Belenky, A.V., Kudasheva, I.A., 1998.
Kazakhstan and the Altai in the Devonian: paleomagnetic evi-
dence. Geotectonics 32 (6), 63–71.
Burtman, V.S., Gurary, G.Z., Dvorova, A.V., Kuznetsov, N.B., Shi-
punov, S.V., 2000. The Uralian ocean in the Devonian (as in-
ferred from paleomagnetic data). Geotectonics 34 (5), 61–70.
Degtyarev, K.E., 1999a. Stratigraphy and structure of lower Paleo-
zoic carbonate–siliceous– terrigenous complex of the Chingiz
Range (east Kazakhstan). Stratigr. Geol. Correl. 7, 93–99.
Degtyarev, K.E., 1999b. Tectonic Evolution of the early Paleo-
zoic Active Margin in Kazakhstan. Nauka, Moscow. 123 p.
(in Russian).
Didenko, A.N., Mossakovsky, A.A., Pechersky, D.M., Ruzhent-
sev, S.V., Samygin, S.G., Kheraskova, T.N., 1994. Geody-
namics of Paleozoic oceans of Central Asia. Geol. Geofiz.
35 (7–8), 59–75 (in Russian).
Dobretsov, N.L., Berzin, N.A., Buslov, M.M., 1995. Opening and
tectonic evolution of the Paleoasian ocean. Int. Geol. Rev. 37,
335–360.
Esenov, S.E., Shlygin, E.D. (Eds.), 1972. Geology of the USSR.
Central Kazakhstan, Geological Description, Book 1, vol. 20.
Nedra, Moscow, p. 532 (in Russian).
Fisher, R.A., 1953. Dispersion on a sphere. Proc. R. Soc. Lond., A
217, 295–305.
Gallet, Y., Pavlov, V.E., 1996. Magnetostratigraphy of the Moyero
river section (northwestern Siberia): a constraint on the geomag-
netic reversal frequency during the early Palaeozoic. Geophys.
J. Int. 125, 95–105.
Grishin, D.V., Didenko, A.N., Pechersky, D.M., Turmanidze,
T.L., 1991. Paleomagnetic and petromagnetic study of struc-
ture and evolution of paleooceanic lithosphere (Phanerozoic
ophiolites of Asia). In: Khramov, A.N. (Ed.), Paleomagnetism
and Paleogeodynamics of the USSR Territory. VNIGRI, Len-
ingrad, pp. 135–149 (in Russian).
Grishin, D.V., Pechersky, D.M., Degtyarev, K.E., 1997. Paleomag-
netism and reconstruction of middle Paleozoic structure of cen-
tral Kazakhstan. Geotectonics 31 (1), 71–81.
Kayupov, A.K. (Ed.), 1977. Geology and Metalogeny of the
Chingiz–Tarbagatay Anticlinorium. Nauka, Alma-Ata, p. 532
(in Russian).
Khramov, A.N., Goncharov, G.I., Komissarova, R.A., Pisarevsky,
I.A., Pogarskaya, I.A., Rzhevsky, Yu.S., Rodionov, V.P., Slaut-
sitais, I.P., 1982. Paleomagnetology Nedra, Leningrad. 312 pp.
(in Russian).
Khromykh, B.F., 1986. New data on Vendian–Paleozoic evolution
and metallogeny of the Boshchekul ore region. Izv. Akad. Nauk
Kaz. SSR, Ser. Geol. 6, 20–34 (in Russian).
Kirschvink, J.L., 1980. The least-square line and plane and the
analysis of palaeomagnetic data. Geophys. J. R. Astron. Soc.
62, 699–718.
Kravchinsky, V.A., Konstantinov, K.M., Courtillot, V., Savrasov,
J.I., Valet, J.-P., Cherniy, S.D., Mishenin, S.G., Parasotka, B.S.,
2002. Palaeomagnetism of east Siberian traps and kimberlites:
two new poles and palaeogeographic reconstructions at about
360 and 250 Ma. Geophys. J. Int. 148, 1–33.
Levashova, N.M., Degtyarev, K.E., Bazhenov, M.L., Collins, A.Q.,
Van der Voo, R., 2003. Permian Paleomagnetism of east Ka-
zakhstan and the Amalgamation of Eurasia. Geophys. J. Int.
152, 677–687.
Levashova, N.M., Degtyarev, K.E., Bazhenov, M.L., Collins,
A.Q. Collins et al. / Tectonophysics 377 (2003) 229–247 247
A.Q., Van der Voo, R., 2003. Middle Paleozoic paleomagnet-
ism of east Kazakhstan: post-Middle Devonian rotations in a
large-scale orocline in the central Ural–Mongol belt. Tectono-
physics 377, 249–268. (doi:10.1016/j.tecto.2003.09.003)
McElhinny, M.W., McFadden, P.L., 2000. Paleomagnetism: conti-
nents and oceans. Int. Geophys. Ser., vol. 73. Academic Press,
San Diego. 386 pp.
McFadden, P.L., Jones, D.L., 1981. The fold test in palaeomagnet-
ism. Geophys. J. R. Astron. Soc. 67, 53–58.
McFadden, P.L., Reid, A.B., 1982. Analysis of paleomagnetic in-
clination data. Geophys. J. R. Astron. Soc. 69, 307–319.
McFadden, P.L., McElhinny, M.W., 1988. The combined analysis
of remagnetization circles and direct observations in palaeomag-
netism. Earth Planet. Sci. Lett. 87, 161–172.
Miller, W.R., Tauxe, L., Constable, C.G., Staudigel, H., Johnson,
C.I., Constable, S., 2000. When lightning strikes: paleomagnetic
data from the San Francisco volcanics. EOS Trans. AGU 81 (48),
F350 (Fall Meeting suppl.).
Mossakovsky, A.A., Ruzhentsev, S.V., Samygin, S.G., Kheraskova,
T.N., 1993. Central Asian fold belt: geodynamic evolution and
formation. Geotectonics 27 (6), 3–32.
Nikitin, I.F., 1972. The Ordovician of Kazakhstan. Stratigraphy,
vol. 1. Nauka, Alma-Ata. 242 pp. (in Russian).
Orlova, A.R., Kurkovskaya, L.A., 1993. New data on graptolites
and conodonts of the Nayman Formation (Lower Ordovician) of
the Chingiz Range, central Kazakhstan. MOIP Bull., Ser. Geol.
69 (1), 43–47 (in Russian).
Palmer, A.R., 1983. The decade of North American geology
(DNAG) 1983 geologic time scale. Geology 11, 503–504.
Pavlov, V.E., Gallet, Y., 1998. Upper Cambrian to Middle Ordovi-
cian magnetostratigraphy from the Kulumbe river section
(northwestern Siberia). Phys. Earth Planet. Inter. 108, 49–59.
Pechersky, D.M., Didenko, A.N., 1995. The Paleoasian Ocean.
OIFZ, Moscow. 296 pp. (in Russian).
Pedder, A.E.H., Oliver Jr., W.A., 1990. Rugose coral distribution as
a test of Devonian paleogeographic models. In: McKerrow, W.S.,
Scotese, C.R. (Eds.), Palaeozoic Palaeogeography and Biogeo-
graphy. Geol. Soc. of London, London, pp. 267–275.
Puchkov, V.N., 1993. Paleooceanic structures of the Urals. Geo-
tectonics 27 (3), 18–33.
Puchkov, V.N., 1997. Tectonics of the Urals: modern conceptions.
Geotectonics 31 (4), 30–45.
Scotese, C.R., McKerrow, W.S., 1990. Revised world maps and
introduction. In: McKerrow, W.S., Scotese, C.R. (Eds.), Palae-
ozoic Palaeogeography and Biogeography. Geol. Soc. London,
London, pp. 1–21.
Sengor, A.M.C., Natal’in, B.A., 1996. Paleotectonics of Asia: frag-
ments of a synthesis. In: Yin, A., Harrison, M. (Eds.), The
Tectonic Evolution of Asia. Cambridge Univ. Press, Cambridge,
pp. 486–640.
Sengor, A.M.C., Natal’in, B.A., Burtman, V.S., 1993. Evolution of
the Altaid tectonic collage and Palaeozoic crustal growth in
Eurasia. Nature 364, 299–307.
Smethurst, M.A., Khramov, A.N., Torsvik, T.H., 1998. The Neo-
proterozoic and Paleozoic paleomagnetic data for the Siberian
platform: from Rodinia to Pangea. Earth-Sci. Rev. 43, 1–24.
Torsvik, T.H., Trench, A., 1991. Ordovician magnetostratigraphy:
Llanvirn–Caradoc limestones of the Baltic platform. Geophys.
J. Int. 107, 171–184.
Torsvik, T.H., Smethurst, M.A., Meert, J.G., Van der Voo, R.,
McKerrow, W.S., Brasier, M.D., Sturt, B.A., Walterhaug, H.J.,
1996. Continental break-up and collision in the Neoproterozoic
and Paleozoic–a tale of Baltica and Laurentia. Earth-Sci. Rev.
40, 229–258.
Turmanidze, T.L., Grishin, D.V., Pechersky, D.M., Stepanets, V.G.,
1991. Paleomagnetism of Ordovician ophiolites from allochth-
onous massifs of central Kazakhstan. Geotektonika 4, 54–69
(in Russian).
Van der Voo, R., 1993. Paleomagnetism of the Atlantic, Tethys and
Iapetus Oceans Cambridge Univ. Press, Cambridge. 411 pp.
Yakubchuk, A.S., 1990. Tectonic position of ophiolite zones in
the Paleozoic structure of central Kazakhstan. Geotektonika 5,
55–68 (in Russian).
Yakubchuk, A.S., Degtyarev, K.E., 1998. The character of link
between the Chingiz and Boshchekul trends in the Caledonides
of northeastern central Kazakhstan. Dokl. Akad. Nauk SSSR
298, 1193–1198 (in Russian).
Zamaletdinov, T.S., Osmonbetov, K.O., 1988. Geodynamic model
of the Kyrgyzia Earth crust evolution during the Phanerozoic.
Sov. Geol. 1, 66–75 (in Russian).
Zijderveld, J.D.A., 1967. AC demagnetization of rocks: analysis of
results. In: Collinson, D.W., Creer, K.M. (Eds.), Methods in
Paleomagnetism. Elsevier, Amsterdam, pp. 254–286.
Zonenshain, L.P., Kuzmin, M.I., Natapov, L.M., 1990. Geology of
the USSR: a plate tectonic synthesis. Geodynamic Series, vol.
21. American Geophysical Union, Washington, DC. 242 pp.