E-voting readiness in Kenya: a case study of Nairobi county
98
UNIVERSITY OF NAIROBI School of Computing and Informatics E-VOTING READINESS IN KENYA: A CASE STUDY OF NAIROBI COUNTY By Emaase, Patrick Mokodir P56/70398/2009 SUPERVISOR Evans Miriti A Project Submitted in Partial Fulfillment of the Regulations Governing the Award of the Degree of Masters of Science in Information Systems Mav 2011 University of NAIROBI
-
Upload
khangminh22 -
Category
Documents
-
view
1 -
download
0
Transcript of E-voting readiness in Kenya: a case study of Nairobi county
UNIVERSITY OF NAIROBI
School of Computing and Informatics
E-VOTING READINESS IN KENYA: A CASE STUDY OF NAIROBI
COUNTY
By
Emaase, Patrick Mokodir
P56/70398/2009
SUPERVISOR
Evans Miriti
A Project Submitted in Partial Fulfillment of the Regulations Governing the Award of
the Degree of Masters of Science in Information Systems
Mav 2011
University of NAIROBI

Declaration
I hereby declare that this project, as presented in this report, is my original work and has not been
presented for any other university award.
NAME:
REG. NO.
SIGNATURE:
DATE:
EMAASE, PATRICK MOKODIR
P56/7P398/2009
pcTo_[4>f f c » i i
This project has been submitted in Partial Fulfillment o f the Regulations Governing the Award of the
Degree of Masters of Science in Information Systems of the University of Nairobi with my approval
as supervisor.
SUPERVISOR:
SIGNATURE:
DATE:
EVANS MERITI
C i f c * ( l o t I
Abstract
D eveloping countries have established prom ising e-voting initiatives w ith the objective o f
enhancing the dem ocracy for their citizens. H ow ever, governm ents tend to design and
launch system s based on their understanding o f w hat citizens need, surprisingly, w ithout
actually m easuring the extent o f readiness and w hat increases c itizens’ w illingness to
adopt the services. It is im portant that G overnm ents m ust first understand variables that
influence citizens’ adoption o f e-voting in order to take them into account when
im plem enting e-voting system s.
This project addresses critical factors that influence adoption o f e-voting w ith objective
o f developing a fram ew ork. The fram ew ork synthesizes, refines, and extends current
approaches to understand adoption factors. The study started w ith a background research
to identify factors that influence the adoption o f innovation and e-voting.
A survey w as thereafter carried out in eight constituencies in N airobi County w hich had
questions on voter readiness for e-voting. The study w as conducted by surveying 203
voters from eight constituencies in N airobi County. The project aim ed at exploring the
correlation betw een e-voter readiness and the diffusion rate o f e-voting in N airobi
County. E -voting Readiness is achieved by determ ining the stage o f readiness and
com paring to the U N 2008 indices for developing countries. The findings indicated that
there is a positive correlation betw een e-voting readiness and its diffusion.
The research is o f m ore im portance at this stage as K enya is approaching election cycle
period. G overnm ent and electoral stakeholders will com prehend voter readiness and
diffusion o f e-voting in N airobi County in order to im plem ent effective, acceptable and
secure electoral process.
iii

Acknowledgement
I am most grateful to my project supervisor at the University o f Nairobi - Evans Miriti for
valuable feedback on my work, his commitment to my progress and for academic critic to my
research. I am indebted to him for providing me with the opportunity to carry out my research on
Readiness for E-voting in Nairobi County. His constant encouragement, coupled with his
availability and easily-approachable nature, gave me the confidence I needed to complete this
work.
I would also like to sincerely thank the University panelists Dr. Wanjiku N g’ang’a and Robert
Oboko for their effort and valuable comments on my work during all the phases o f the research.
Further, 1 am indebted to the panel for evocable and timely contribution to all milestones towards
the completion o f the research.
Last and most importantly, I would like to recognize the Almighty, for granting me both mental
and physical strength to undertake research.
iv
TABLE OF CONTENTS
L IS T O F T A B L E S ................................................................................................................................viiL IS T O F F IG U R E S ............................................................................................................................... ixC H A P T E R O N E IN T R O D U C T IO N ...............................................................................................1
1.0 B ack g ro u n d ................................................................................................................................. 1
1.1 Research Problem and Context.............................................................................................2
1.1.3 Objectives o f the Study......................................................................................................2
1.2 D efinition o f T erm ino log ies...................................................................................................3
1.3 O utline o f the p ro ject................................................................................................................ 4
C h a p te r T w o L ite ra tu re R eview ........................................................................................................ 52.0 In troduction ................................................................................................................................ 5
2.2 E-V oting S y s tem ...................................................................................................................... 7
2.3 E-V oting E x am p les ................................................................................................................15
2.4 E-V oting R eadiness Index ....................................................................................................17
2.5 D iscussion o f Previously used E-Readiness A ssessm ent T ools.............................. 23
2.6 O verview o f E-V oting R eadiness at G lobal L eve l.......................................................28
2.7 O ver V iew o f E-V oting R eadiness in A fr ic a ................................................................ 28
2.8 O verview o f E -R eadiness by K E N E T ............................................................................. 28
2.9 N ational ICT Strategy for Education and T ra in ing ..................................................... 29
2.10 C ritical R ev iew ........................................................................................................................29
2.11 S u m m ary ......................... 30
C H A P T E R T H R E E M E T H O D O L O G Y .....................................................................................313.1 IN T R O D U C T IO N ..................................................................................................................31
3.2 R esearch D esig n ...................................................................................................................... 31
3.3 Population and Sam pling P ro ced u re ................................................................................31
3.5 Sam pling Procedure: Q ualitative Survey o f R esea rch ................................................ 31
3.6 D ata C ollection P ro c ed u re ..................................................................................................32A
3.7 Q uestionnaire P ilo ting...!......................................................................................................33
3.9 Fram ew ork for E-V oting R eadiness A ssessm ent..........................................................34
3.10 Factor A nalysis........................................................................................................................40
C H A P T E R F O U R D A T A C O L L E C T IO N AND A N A L Y S IS ...........................................424.1 R eliab ility ................................................................................................................................. 42
4.2 Factor A nalysis....................................................................................................................... 42
v

4.4 Inferential A n a ly s is ..............................................................................................................59
CHAPTER FIVE - DATA ANALYSIS............................................................................... 645.1 D eterm ination o f C o rre la tio n ............................................................................................. 64
5.2 D eterm ination o f the R egression M o d e l.........................................................................65
5.3 D eterm ination o f C orrelation C o effic ien t...................................................................... 67
5.4 The C oefficient o f D eterm ina tion .....................................................................................67
5.4.1 M inim um A doption Rate at Stage 1 o f E-V oter R eadiness S ta tu s ........................ 68
5.4.2 M axim um A doption Rate at Stage 4 o f E-V oting R eadiness S ta tu s......................68
5.4.3 Percentage E rror in A doption Rate E-V oting S y stem s.............................................. 68
CHAPTER SIX - CONCEPTUAL FRAMEW ORK....................................................... 706.3 R eliability T e s t ........................................................................................................................71
6.4 Fram ew ork V alidation U sing R egression A n a ly s is .................................................... 71
CHAPTER SEVEN - RECOMMENDATIONS AND CONCLUSION........................737.2 R esearch O b jec tives .............................................................................................................. 73
7.3 Im plications for T heory ........................................................................................................ 74
7.4 Im plications for P ra c tic e ......................................................................................................74
7.5 L im itations and Suggestion for Future R esea rch ......................................................... 74
REFERENCES........................................................................................................................... 76
VI

LIST OF TABLES
Table 1: Previous studies of Kenyan Elections............................................................................ 6Table 2: The functions of general e-voting model.................................................................... 10Table 3: Data Items and their abridgements of general e-voting model................................. 10Table 4: Summary of E-voting Literature.................................................................................. 17Table 5: Details of Readiness Factors....................................................................................... 36Table 6: Adoption Constructs Criteria...................................................................................... 38Table 7: KMO and Bertlett's Test on Field Data........................................................................ 42Table 8: Dagoreti Constituency Technology Readiness............................................................ 43Table 9: Dagoreti Constituency ICT Readiness......................................................................... 43Table 10: Dagoreti Constituency E-Society Readiness................................................................ 44Table 11: Dagoreti Constituency Security and Trust Readiness................................................. 44Table 12: Embakasi Constituency Technology Readiness........................................................... 45Table 13: Embakasi Constituency ICT Competency Readiness................................................... 45Table 14: Embakasi Constituency E-Society Readiness.............................................................. 45Table 15: Embakasi Constituency Security and Trust Readiness................................................45Table 16: Kamkunji Constituency Technology Readiness........................................................... 46Table 17: Kamkunji Constituency ICT Competency Readiness................................................... 46Table 18: Kamkunji Constituency E-Society Readiness............................................................... 47Table 19: Kamkunji Constituency Security and Trust Readiness................................................ 47Table 20: Kasarani Constituency Technology Readiness............................................................ 48Table 21: Kasarani Constituency ICT Competency Readiness.................................................... 48Table 22: Kasarani Constituency E-Soceity Readiness................................................................ 48Table 23: Kasarani Constituency Security and Trust Readiness.................................................48Table 24: Langata Constituency Technology Readiness.............................................................49Table 25: Langata Constituency ICT Competency Readiness.....................................................49Table 26: Langata Constituency Society Readiness.................................................................... 50Table 27: Langata Constituency Security and Trust Readiness...................................................50Table 28: Makadara Constituency Technology Readiness.......................................................... 50Table 29: Makadara Constituency ICT Competency Readiness.................................................. 51Table 30: Makadara Constituency E-Society Readiness............................................................. 51Table 31: Makadara Constituency Security and Trust Readiness............................................... 51Table 32: Starehe Constituency Technology Readiness.............................................................52Table 33: Starehe Constituency ICT Competency Readiness......................................................52Table 34: Starehe Constituency E-Society Readiness.................................................................53Table 35: Starehe Constituency Security and Trust Readiness...................................................53Table 36: Westlands Constituency Technology Readiness......................................................... 53Table 37: Westlands Constituency ICT Readiness...................................................................... 54Table 38: Westlands Constituency E-Society Readiness............................................................. 54Table 39: Westlands Constituency Security and Trust Readiness.............................................. 54
vii
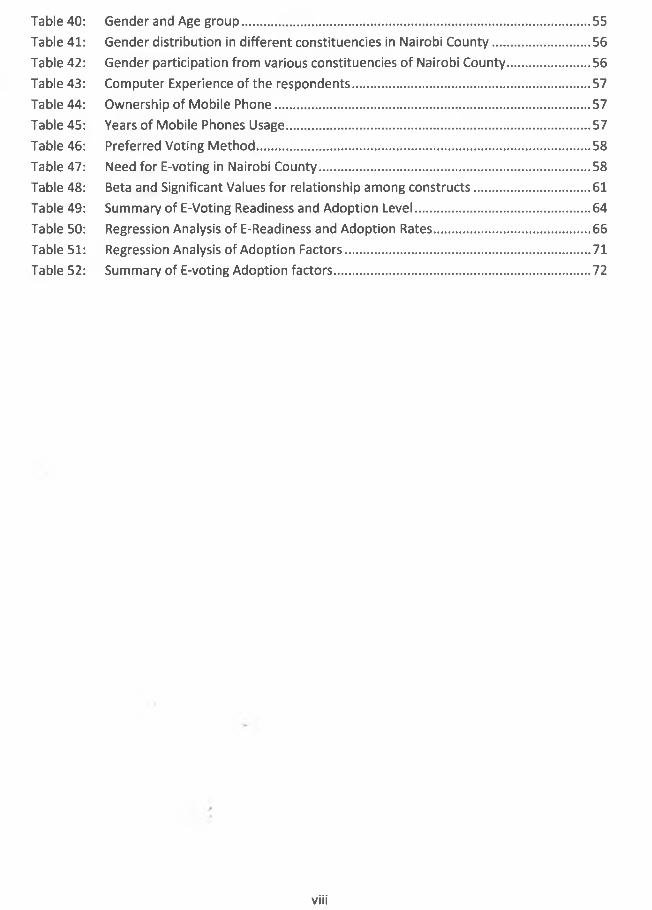
Table 40: Gender and Age group................................................................................................ 55Table 41: Gender distribution in different constituencies in Nairobi County............................56Table 42: Gender participation from various constituencies of Nairobi County.........................56Table 43: Computer Experience of the respondents.................................................................. 57Table 44: Ownership of Mobile Phone....................................................................................... 57Table 45: Years of Mobile Phones Usage.................................................................................... 57Table 46: Preferred Voting Method.............................................................................................58Table 47: Need for E-voting in Nairobi County........................................................................... 58Table 48: Beta and Significant Values for relationship among constructs................................. 61Table 49: Summary of E-Voting Readiness and Adoption Level.................................................64Table 50: Regression Analysis of E-Readiness and Adoption Rates............................................ 66Table 51: Regression Analysis of Adoption Factors.................................................................... 71Table 52: Summary of E-voting Adoption factors....................................................................... 72
viii
..8
..91213141839555659626465707172
LIST OF FIGURES
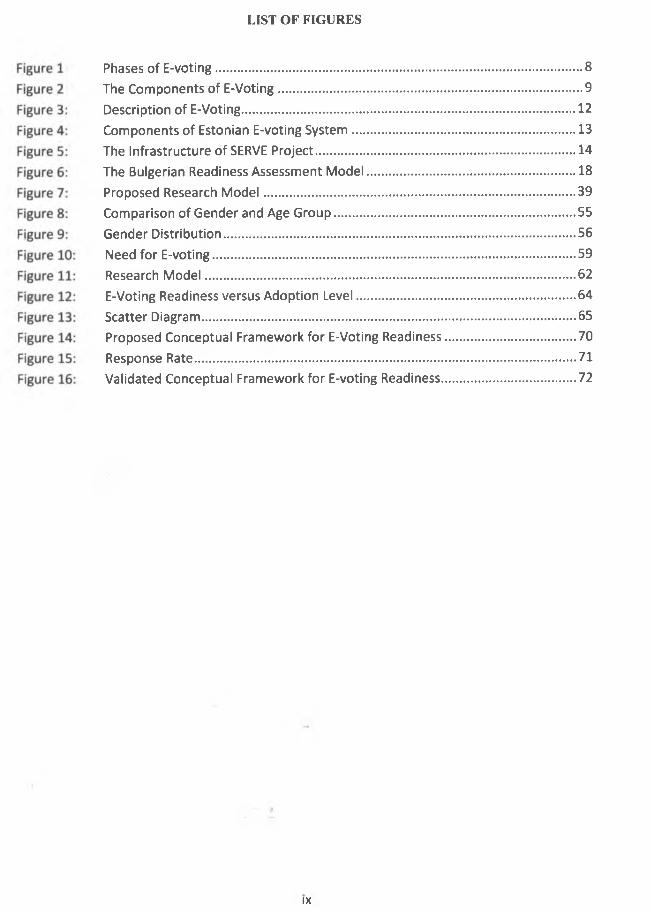
Phases of E-voting..............................................................The Components of E-Voting............................................Description of E-Voting......................................................Components of Estonian E-voting System........................The Infrastructure of SERVE Project..................................The Bulgerian Readiness Assessment Model....................Proposed Research Model................................................Comparison of Gender and Age Group.............................Gender Distribution...........................................................Need for E-voting...............................................................Research Model.................................................................E-Voting Readiness versus Adoption Level.......................Scatter Diagram.................................................................Proposed Conceptual Framework for E-Voting ReadinessResponse Rate...................................................................Validated Conceptual Framework for E-voting Readiness.
IX
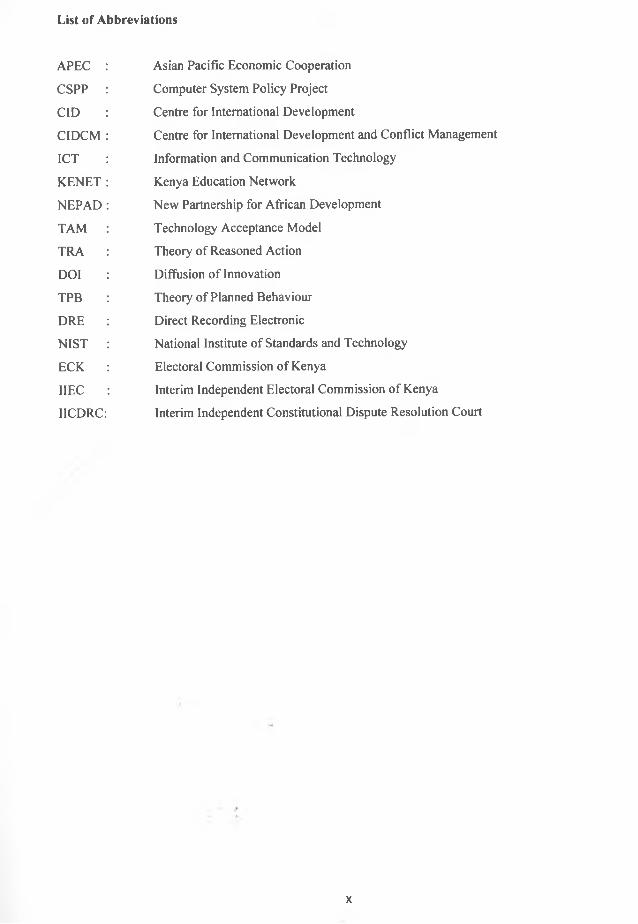
List of Abbreviations
APEC
CSPP
CID
CIDCM
ICT
KENET
NEPAD
TAM
TRA
DOI
TPB
DRE
NIST
ECK
IIEC
IICDRC:
Asian Pacific Economic Cooperation
Computer System Policy Project
Centre for International Development
Centre for International Development and Conflict Management
Information and Communication Technology
Kenya Education Network
New Partnership for African Development
Technology Acceptance Model
Theory of Reasoned Action
Diffusion of Innovation
Theory of Planned Behaviour
Direct Recording Electronic
National Institute of Standards and Technology
Electoral Commission of Kenya
Interim Independent Electoral Commission of Kenya
Interim Independent Constitutional Dispute Resolution Court
x
CHAPTER ONE INTRODUCTION
This introductory chapter introduces the problem area, statement of the problem, objectives of the study and
justification for conducting the research.
1.0 Background
Information has always played a vital role in our history. Over the ages, people have used it to gain a more accurate
picture of their current situations, make better decisions for the future and improve the quality of their lives. But
never has information been more accessible and more widespread that it is today. The recent developments in
Information Technology (IT) have been phenomenal. Computers are progressively becoming smaller, more
affordable and more powerful. They are linked together through telephone lines, satellites, and fibre optic cables that
span across the world, allowing the ability to communicate and share information across borders. With this rapid
advance of technology, IT has been revolutionizing the way we live our lives by eliminating digital divide.
Democracy has been integrated into IT.
Kenya is a democratic state and has been holding elections after every five years using the ballot system for
presidential, parliamentary and civic positions. Contention of 1997 and 2007 elections led to violence. Violence,
which was mainly triggered by the perception that the election had been rigged, reduced trust and social capital
among communities making violence more likely to reoccur (Dercon and Gutierrez-Romero, 2009).
Elections in Kenya are conducted manually using ballot and ballot boxes. As the whole system is manual so vote
results compromised at polling stations (Kramon, 2010). Therefore, Kenya was in need of such a system where
people can vote and feel secure, ensuring results cannot be manipulated (Kramon, 2010). Such environment may be
achieved through electronic voting system, in which results may not be forged, manipulated or delayed by any one.
Switching from paper-based to electronic elections is a challenging task, in which the technological aspect (e.g., the
type of systems used to vote electronically) is just a part of a larger problem that includes sociological, political,
normative and organizational aspects. Other works - as for instance Ghapanchi et al. (2008) advocate the need to
adopt a more general, integrated, ‘holistic’ view on electronic government (e-govemment) processes as a key factor
for success.
With the specter of the growing digital divide looming large, the significance of ‘citizens’ readiness for e-voting’
assumes paramount position in the roadmap towards e-govemment because in an environment that is more ‘e-
ready’, people are in general more comfortable with the new technologies. Further, e-govemment initiatives are
easily accepted and adopted. Hence, before a country embarks on a journey towards adoption of e-voting, it has to
assess its state o f ‘e-readiness’.
In May 2010, IIEC introduced electronic registration of voters in eighteen constituencies as a pilot in preparation to
adopt e-voting in Kenya. IIEC plans to extend the service to all constituencies, and automate the entire electoral
process including voter registration, national electoral register, register analysis and validation, data processing,
electronic voting, automated counting and tallying, electronic delivery and analysis and dissemination of results.
1
Despite the potential benefits of the introduction of e-voting, it should be noted that modernizing how people vote
will not, per se, improve democratic participation. Failure to do so, however, is likely to weaken the credibility and
legitimacy of democratic institutions (Carter and Belanger, 2005). Only e-enabled voting systems which are
efficient, secure, technically robust and readily accessible and acceptable to all voters will build the public trust to
such an extent as to make it feasible to hold large-scale e-enabled elections.
While the use of ICT promises to facilitate the role of e-democracy in Kenya, little is known of how ready citizens
are for the actual implementation of e-voting.
1.1 Research Problem and Context
1.1.1 Statement of the Problem
The increased interest in use of ICT in enhancing governance and democracy may point to the growing role of e-
voting in democratizing Kenya and the counties. IIEC was allocated Kshs. 40 billion to automate the voting system
during the financial year 2010/2011 (IFC 2008).
It can be argued that common standards on e-voting, reflecting and applying the principles of democratic elections
and referendums to the specificities of e-voting, are key to guaranteeing the respect of all the principles of
democratic elections and referenda when using e-voting, and thus building trust and confidence in domestic e-voting
schemes.
Studies on e-voter readiness have focused on developed countries. The need to adopt e-democracy practice suggests
an immeasurable chance of success. E-voting readiness index (Krimmer and Schuster, 2009) analyzed and compared
the environment for the introduction of E-voting in thirty one countries including all EU member states. The index
does not tell us how ready we are given our circumstances in Kenya. So a need exists to establish if voters are ready
to adopt the technology ahead of 2012 general elections.
To address this gap, this study will establish the extent of diffusion of e-voting and the significance of various
influences on the uptake of e-voting among the citizens in Nairobi County.
1.1.2 Research Hypothesis
Null Hypothesis, H0. There exists no correlation between readiness for e-voting status and adoption of
e-voting in Kenya.
Alternative Hypothesis, Ht. There exist a positive correlation between readiness for e-voting and adoption of
e-voting in Kenya.
1.1.3 Objectives of the Study
The aim of the study was to investigate readiness of citizens in order to shed light on the factors that may influence
the adoption and diffusion of e-voting in Kenya. The research explores the readiness of citizens in adopting e-voting
system in Nairobi County. The specific objectives of the study are to:
2
i. Determine the critical success factors for the adoption e-voting systems
ii. Investigate how e-voting readiness affects diffusion of e-voting systems.
iii. Establish e-voting readiness status in Nairobi County.
iv. Suggest appropriate framework for e-voting readiness for Kenya.
1.1.4 Research Questions
i. What critical success factors affect the adoption of e-voting system?
ii. How does E-voting readiness compare with UN Index of 2008?
iii. What is the extent of voter readiness for e-voting in Nairobi County?
1.1.5 Significance of the Study
The study was significant for various reasons, including:
i. The findings will be useful to management of elections in Kenya. The management of IIEC may find
information on factors enhancing or inhibiting the use of e-voting important in their adoption of the
technology.
ii. The government and IIEC will find the results important in that they will get a better understanding of
factors affecting the adoption and diffusion of e-voting technology in Kenya. With this added information,
they may factor in significant improvements designing and recommending intervention strategies.
iii. The study will also add to the growing body of literature on e-voting readiness in Kenya. It will also
identify gaps for further research./
1.2 Definition of Terminologies
1.2.1 E-voting readiness
Electronic voting (e-voting) is any voting method where the voter’s intention is expressed or collected by electronic
means. According to Krimmer and Schuster (2008) the e-voting readiness defines how prepared an individual or a
country is for the adoption of electronic voting. It’s the readiness to incorporate ICT in e-democracy. The e-voting
readiness index offers insights into different strategies, clear patterns and common themes in development patterns
among regions and across them.
1.2.2 E-voting adoption
Adoption is the decision by a voter to become a regular user of electronic voting innovation (Kotler and Armstrong,
2002).
1.2.3 E-voting diffusion >
For Rogers (2003), adoption is a decision of “full use of an innovation as the best course of action available” and
rejection is a decision “not to adopt an innovation”. Rogers defines diffusion as “the process in which an innovation
3

is communicated thorough certain channels over time among the members of a social system”. Kotler and
Armstrong (2002) define adoption as a decision by an individual to become a regular user of the product. Hence
adoption process is defined as the mental process through which an individual passes from first learning about an
innovation to final Adoption. As expressed in this definition, innovation, communication channels, time, and social
system are the four key components of the diffusion of innovations. “An innovation is an idea, practice, or project
that is perceived as new by an individual or other unit of adoption” (Rogers, 2003). An innovation may have been
invented a long time ago, but if individuals perceive it as new, then it may still be an innovation for them. The
newness characteristic of an adoption is more related to the three steps (knowledge, persuasion, and decision) of the
innovation-decision process. E-voting diffusion is the process by a voter is made aware, develops interest, evaluates,
tries and adopters electronic voting as way of determining winners to various positions in the society.
1.3 Outline of the project
This project consists of six sections. In chapter one, a relatively broad description is given, providing the reader with
a background and discussion of the issues related to the problem area. Chapter two presents the literature review
with theories relevant for the problem area. Also the research problem and research questions are described. Chapter
three details the methodology used to undertake the research. Chapter four describes Data collection and Analysis
for the research undertaken. Further findings will be analyzed against the conceptual framework in chapter Five.
Chapter six describes the recommendation and conclusion from the research undertaken. The document there after
provides references and appendices.
4
Chapter Two Literature Review
This chapter describes literature review about Nairobi County, IT Development and citizens’ readiness for e-voting,
e-voting adoption in Kenya. Citizens’ readiness for E-voting adoption can be attributed to several effective factors:
Personal, social or level of technology. Though the current literature provides valuable lessons about E-voting
readiness, a drawback of many approaches is a tendency to presuppose the empirical puzzle; taking as given the
effect that e-voting will have on democracy and focusing the attention on explaining why the relationship exists. Yet
empirical support for the notion that e-voting has a casual effect on democracy is limited and mixed, particularly in
the African context.
2.0 Introduction
The use of information and communication technology (ICT) in the electoral process is on the rise around the world.
While most of the applications emerge back-office, ICT is finally reaching the arena of the voters (Krimmer and
Schuster, 2008). E-voting is one of the most basic uses of technology in e-democracy. It offers considerable scope
for faster, more efficient and more accurate elections and referenda, not to mention the possibility of more frequent
public consultation. However, it is also deeply controversial and has been subject to criticism on a number of fronts,
not least from people in the computer industry and citizens concerned about the potential for widespread electoral
error or fraud (Barrister and Connolly, 2007). In Ireland, these factors contributed to the government having to
abandon plans to introduce electronic voting for the European and local elections in June 2004 (Bannister, 2007).
The use of E-voting machines has been undertaken in many developed countries. However, the use of E-voting in
remote elections mostly in developing nations is still (Krimmer and Schuster, 2008). These underpin the need for
citizens’ readiness for e-voting.
2.1 Elections in Kenya
Kenya gained independence from Great Britain in 1963 and from then up until 2002 was ruled out by the political
party Kenya African National Union (KANU). KANU’s dominance was achieved by banning opposition parties in
1969 leaving Kenya a de facto one-party state to a de jure one-party state when a constitutional amendment in 1978
ruled that no other party was able to contest in the elections. In 1991 after much pressure from Kenyan activists and
the international community multi-party elections were re-introduced. Several opposition parties emerged (FORD
Kenya, FORD Asili, Democratic Party, Social Democratic Party, National Development Party of Kenya and other
smaller parties). Nonetheless KANU remained in power winning the general elections of 1992 and 1997 amid
violence and allegations of electoral irregularities (Dercon and Gutidrrez-Romero, 2008). Analysts though, argued
that politicians instigated the violence as a tool for winning the elections. The KANU elite aiming to suppress
opposition political parties also recruited and sponsored ‘tribal militias’ and gangs for them to terrorize and instigate
ethnic violence in the same vein as other African countries have done such as Cameroon, Malawi, Nigeria, South
Africa and Sudan (Kagwanja, 2003). These underpin the need for consistent citizens’ readiness for election process.
2.1.1 2002 General Elections \
In the general elections of 2002, all the opposition parties for the first time united under the National Rainbow
Coalition (NARC) and behind a single presidential candidate, Mwai Kibaki. Kibaki won the presidential elections
5
by defeating KANU’s presidential candidate Uhuru Kenyatta. Mwai Kibaki’s Presidential election success in 2002 -
declared free, fair and the most peaceful elections that Kenya has had in recent years by international observers -
was hailed at the time as a step forward for Kenyan democracy. The democratic achievement was much owed for
having formed a multi-tribal NARC coalition, unlike the previous multi-party elections where political parties
formed seeking to target a specific ethnic group (Oyugi, 1997). The results were counted in the polling station for
the first time and the introduction of form 16-A, as authentic verification and validity check, ensured credibility of
elections.
2.1.2 2007 General Elections
On 27th December 2007, the fourth multi-party general elections were held. There was no outright winner for
presidential elections. The political crisis exposed the extent of their shortcomings. The failure by the commission to
guarantee free and fair elections left its mark, not so much on the institution’s credibility, which is already at its
lowest ebb, but on the understanding of the democratic process itself by citizens. Democracy is undoubtedly in its
infancy in Kenya. The disappointment over the scale of electoral fraud, whose proof becomes more evident with the
release of various reports, comes with real mistrust of the political class by citizens and a questioning, which should
be taken very seriously, of the usefulness of the ballot. Added to this is the meaning of democracy and the ability of
politics to solve the most urgent problems, be they economic or social. The expectations of citizens in Kenya have
risen highly “Will the political class be able to promptly respond” (Lafargue, 2008)?
The election of 2007 was characterized by flaws in vote tallying process where auditability of votes was lacking
either due to slackness or intended fraud (Lafargue, 2008). These require tamp proof election system to regain the
lost trust, credibility and management fear of unknown, hence the need for electronic voting system based on
citizens’ requirements.
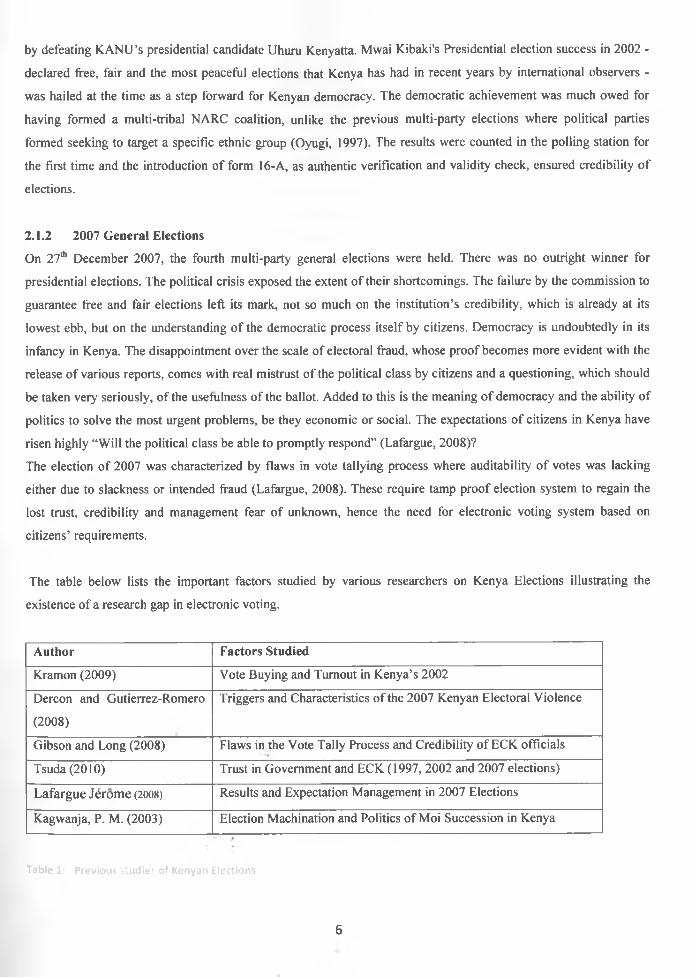
The table below lists the important factors studied by various researchers on Kenya Elections illustrating the
existence of a research gap in electronic voting.
Author Factors Studied
Kramon (2009) Vote Buying and Turnout in Kenya’s 2002
Dercon and Gutierrez-Romero
(2008)
Triggers and Characteristics of the 2007 Kenyan Electoral Violence
Gibson and Long (2008) Flaws in the Vote Tally Process and Credibility of ECK officials
Tsuda (2010) Trust in Government and ECK (1997, 2002 and 2007 elections)
Lafargue Jerome (2008) Results and Expectation Management in 2007 Elections
Kagwanja, P. M. (2003) Election Machination and Politics of Moi Succession in Kenya
Table 1: Previous studies of Kenyan Elections
6

2.2 E-Voting System
2.2.1 Concept of E-voting
E-voting terms
This section gives the explanations of the term “e-voting”. The term “e-voting” is used, in variety of different ways
mainly and it encompasses all voting techniques involving electronic voting equipment, including voting over the
internet, using booths in polling stations and sometimes even counting of paper ballots.
Electronic voting (e-voting) is any voting method where the voter’s intention is expressed or collected by electronic
means. There are considered the following electronic voting ways.
Kiosk voting means the use of dedicated voting machines in polling stations or other controlled locations. Voters
mark their choice electronically (perhaps on touch sensitive screen) rather than on paper ballot. The votes are
counted on individual machines, known as Direct Recording Electronic (DRE) machines, and the votes cast are
transferred to the central tallying point by unspecified means. A ballot paper can be printed and retained in
confidence in a ballot box as an additional check.
Remote electronic voting is the preferred term for voting that takes place by electronic means from any location.
This could include the use of the Internet, text message, interactive digital TV or touch tone telephone.
Internet voting (i-voting) is a specific case of remote electronic voting, whereby the vote takes place over the
Internet such as via a web site or voting applet. Sometimes also used synonymously with Remote Electronic Voting.
That usage is however deprecated and it will be used instead as a strict subset of remote electronic voting.
In this study, we use the term e-voting with the specific meaning of Internet voting where specific components of
voting process are automated. If we use it as a general term, then we specify the meaning.
2.2.2 Security properties of e-voting
High security is essential to elections. Democracy relies on broad confidence in the integrity of elections. There has
been a lot of attention to an electronic voting by cryptographers. Many scientific researchers have been done in order
to achieve security, privacy and correctness in electronic voting systems by improving cryptographic protocols of e-
voting systems. The main interest has been the practical security in e-voting systems (Magi, 2007). Hence, e-voting
should be uniform, confidential, secure and verifiable. According to Magi (2007), the most important requirements
of e-voting include:
i. Eligible voters are capable to cast ballots that participate in the computation of the final tally.
ii. Non-eligible voters are disfranchised.
iii. Eligible voters are not capable to cast two ballots that both participate in the computation of the final
tally.
iv. Votes are secret. This is the property of privacy. This property is apparently contradicting property
with correctness. On the one hand voting must be private and the votes that are counted anonymous.
On the other hand, voters must be identified in order to guarantee that only the eligible voters are
capable to vote.
7
v. It is possible for auditors to check whether all correct cast ballots participated in the computation of the
final tally.
vi. This requirement says that a group of dedicated auditors or Electoral Committee can check the
correctness of voting.
vii. The result of an election must be secret until the end of an election. The third party must not be capable
to reveal the results of the election. Additionally, the system should guarantee that official votes’
counting office cannot reveal the final tally before the end of voting. Otherwise, the result of voting
could affect voters’ decisions during the voting.
viii. All valid votes are counted correctly and the system outputs the final tally,
ix. It must be possible to repeat the computation of the final tally.
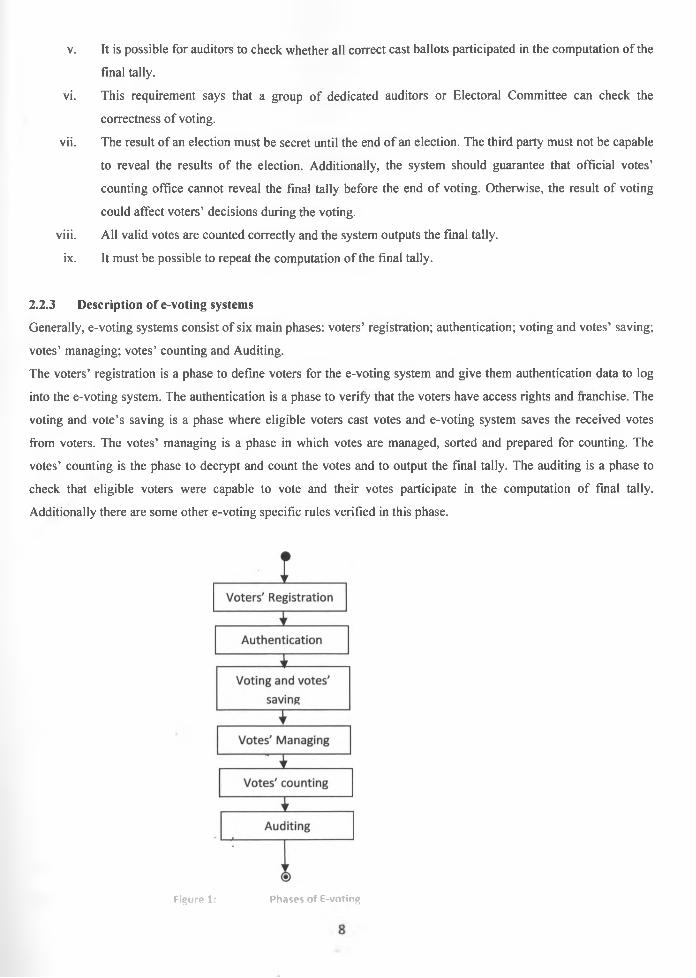
2.2.3 Description of e-voting systems
Generally, e-voting systems consist of six main phases: voters’ registration; authentication; voting and votes’ saving;
votes’ managing; votes’ counting and Auditing.
The voters’ registration is a phase to define voters for the e-voting system and give them authentication data to log
into the e-voting system. The authentication is a phase to verify that the voters have access rights and franchise. The
voting and vote’s saving is a phase where eligible voters cast votes and e-voting system saves the received votes
from voters. The votes’ managing is a phase in which votes are managed, sorted and prepared for counting. The
votes’ counting is the phase to decrypt and count the votes and to output the final tally. The auditing is a phase to
check that eligible voters were capable to vote and their votes participate in the computation of final tally.
Additionally there are some other e-voting specific rules verified in this phase.
Figure 1: Phases of E-voting
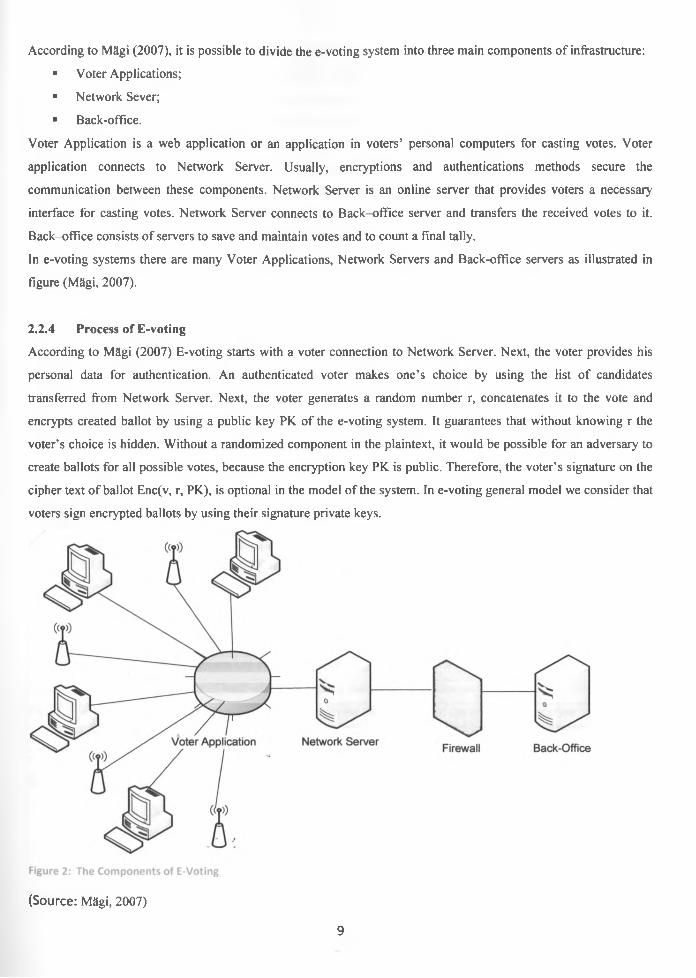
According to Magi (2007), it is possible to divide the e-voting system into three main components of infrastructure:
■ Voter Applications;
■ Network Sever;
■ Back-office.
Voter Application is a web application or an application in voters’ personal computers for casting votes. Voter
application connects to Network Server. Usually, encryptions and authentications methods secure the
communication between these components. Network Server is an online server that provides voters a necessary
interface for casting votes. Network Server connects to Back-office server and transfers the received votes to it.
Back-office consists of servers to save and maintain votes and to count a final tally.
In e-voting systems there are many Voter Applications, Network Servers and Back-office servers as illustrated in
figure (Mdgi, 2007).
2.2.4 Process of E-voting
According to Magi (2007) E-voting starts with a voter connection to Network Server. Next, the voter provides his
personal data for authentication. An authenticated voter makes one’s choice by using the list of candidates
transferred from Network Server. Next, the voter generates a random number r, concatenates it to the vote and
encrypts created ballot by using a public key PK of the e-voting system. It guarantees that without knowing r the
voter’s choice is hidden. Without a randomized component in the plaintext, it would be possible for an adversary to
create ballots for all possible votes, because the encryption key PK is public. Therefore, the voter’s signature on the
cipher text of ballot Enc(v, r, PK), is optional in the model of the system. In e-voting general model we consider that
voters sign encrypted ballots by using their signature private keys.
(Source: Mdgi, 2007)
9

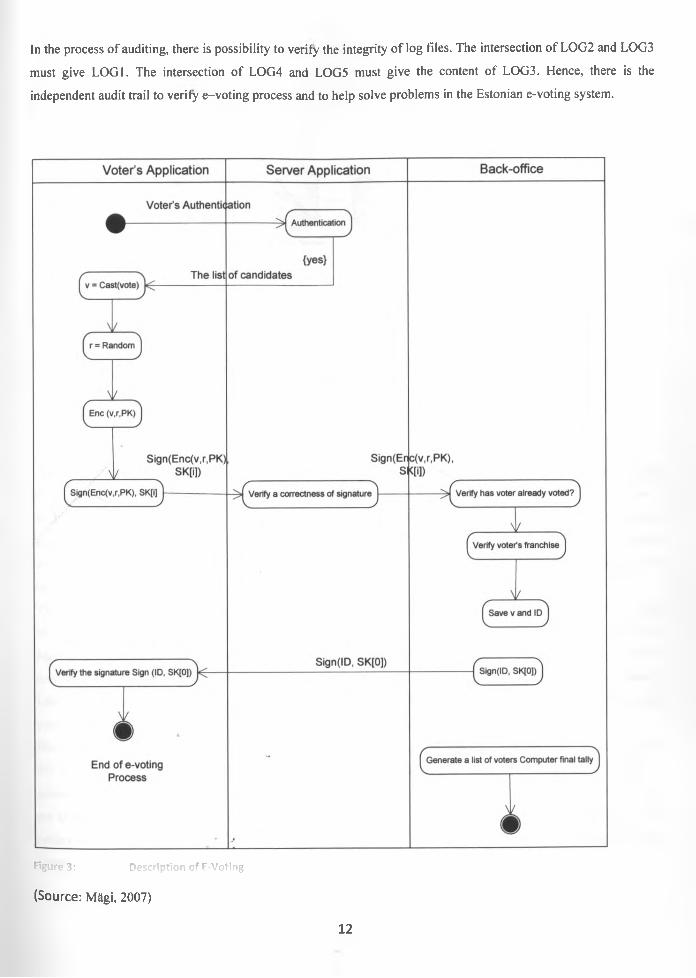
Network Server receives signed encrypted ballot Sign(Enc(v, r, PK), SK[i]) and transfers the accepted signature to
Back-office. In order to guarantee that only eligible voters can vote, the processes of Back-office checks the
signatures of the ballots and verifies whether voters already voted. If a voter had already voted the systems sends to
the voter a signed receipt of voting Sign(ID, SK[0]). Votes’ managing process saves every cast vote v and voter’s
personal data ID in Back-office servers. Back-office process replies to each correctly cast vote with a signed receipt
Sign(ID, SK[0]), which is a confirmation of the voting system that the vote of the i-th voter has been correctly cast.
Receipts do not contain any information about the corresponding votes. The voter can verify the signature Sign(ID,
SK[0]) with public key PK[0] that corresponds to SK[0].
When the voting period is ended, Back-office’s votes’ counting process computes the final tally. Back-office
outputs the signed final tally and the signed list of voters. Figure 3 depicts the process of e-voting systems. The
activities and their abridgements in the model are given in Table 2 and Table 3.
Authentication process for authentication
Cast process to cast a vote
Random function for generate random number
Enc function for encrypting
Sign function for digitally signing encrypted ballots
Save function for saving data to following transmission
Count function for counting the final tally
Table 2: The functions of general e-voting model
Table 2.3 Data items and their abridgements of general e-voting model
PK the public key of the e-voting system which is used to encrypt ballot
SK the secret key of the e-voting system, which is used to decrypt encrypted ballot in the
back-office server
SK[i] the private signature key of eligible voter
PK[i] the public signature key of eligible voter
SK[0] the private key of back-office for signing the voting confirmation
PK[0] the public key of back - office for verifying the signature of the voting confirmation
V a voter’s choice, vote
r randomly generated number
ID voter’s personal data file
Table 3: Data Items and their abridgements of general e-voting model
10
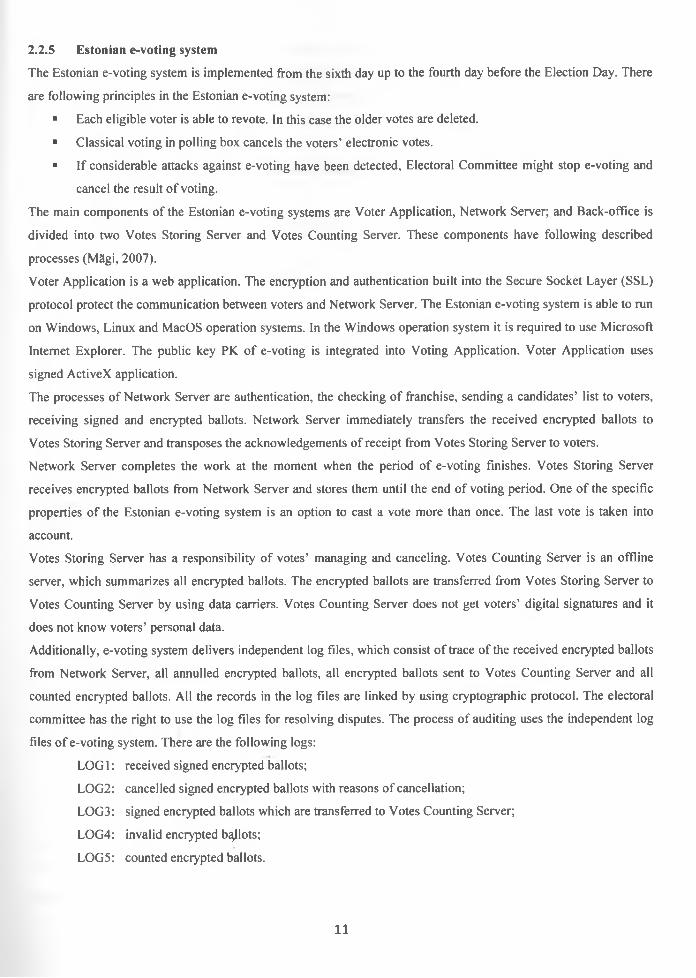
2.2.5 Estonian e-voting system
The Estonian e-voting system is implemented from the sixth day up to the fourth day before the Election Day. There
are following principles in the Estonian e-voting system:
■ Each eligible voter is able to revote. In this case the older votes are deleted.
■ Classical voting in polling box cancels the voters’ electronic votes.
■ If considerable attacks against e-voting have been detected, Electoral Committee might stop e-voting and
cancel the result of voting.
The main components of the Estonian e-voting systems are Voter Application, Network Server; and Back-office is
divided into two Votes Storing Server and Votes Counting Server. These components have following described
processes (MMgi, 2007).
Voter Application is a web application. The encryption and authentication built into the Secure Socket Layer (SSL)
protocol protect the communication between voters and Network Server. The Estonian e-voting system is able to run
on Windows, Linux and MacOS operation systems. In the Windows operation system it is required to use Microsoft
Internet Explorer. The public key PK of e-voting is integrated into Voting Application. Voter Application uses
signed ActiveX application.
The processes of Network Server are authentication, the checking of franchise, sending a candidates’ list to voters,
receiving signed and encrypted ballots. Network Server immediately transfers the received encrypted ballots to
Votes Storing Server and transposes the acknowledgements of receipt from Votes Storing Server to voters.
Network Server completes the work at the moment when the period of e-voting finishes. Votes Storing Server
receives encrypted ballots from Network Server and stores them until the end of voting period. One of the specific
properties of the Estonian e-voting system is an option to cast a vote more than once. The last vote is taken into
account.
Votes Storing Server has a responsibility of votes’ managing and canceling. Votes Counting Server is an offline
server, which summarizes all encrypted ballots. The encrypted ballots are transferred from Votes Storing Server to
Votes Counting Server by using data carriers. Votes Counting Server does not get voters’ digital signatures and it
does not know voters’ personal data.
Additionally, e-voting system delivers independent log files, which consist of trace of the received encrypted ballots
from Network Server, all annulled encrypted ballots, all encrypted ballots sent to Votes Counting Server and all
counted encrypted ballots. All the records in the log files are linked by using cryptographic protocol. The electoral
committee has the right to use the log files for resolving disputes. The process of auditing uses the independent log
files of e-voting system. There are the following logs:
LOG 1: received signed encrypted ballots;
LOG2: cancelled signed encrypted ballots with reasons of cancellation;
LOG3: signed encrypted ballots which are transferred to Votes Counting Server;
LOG4: invalid encrypted ballots;
LOG5: counted encrypted ballots.
11
In the process of auditing, there is possibility to verify the integrity of log files. The intersection of LOG2 and LOG3
must give LOG1. The intersection of LOG4 and LOG5 must give the content of LOG3. Hence, there is the
independent audit trail to verily e-voting process and to help solve problems in the Estonian e-voting system.
Figure 3: Description of E-Voting
(Source: Mdgi, 2007)
12
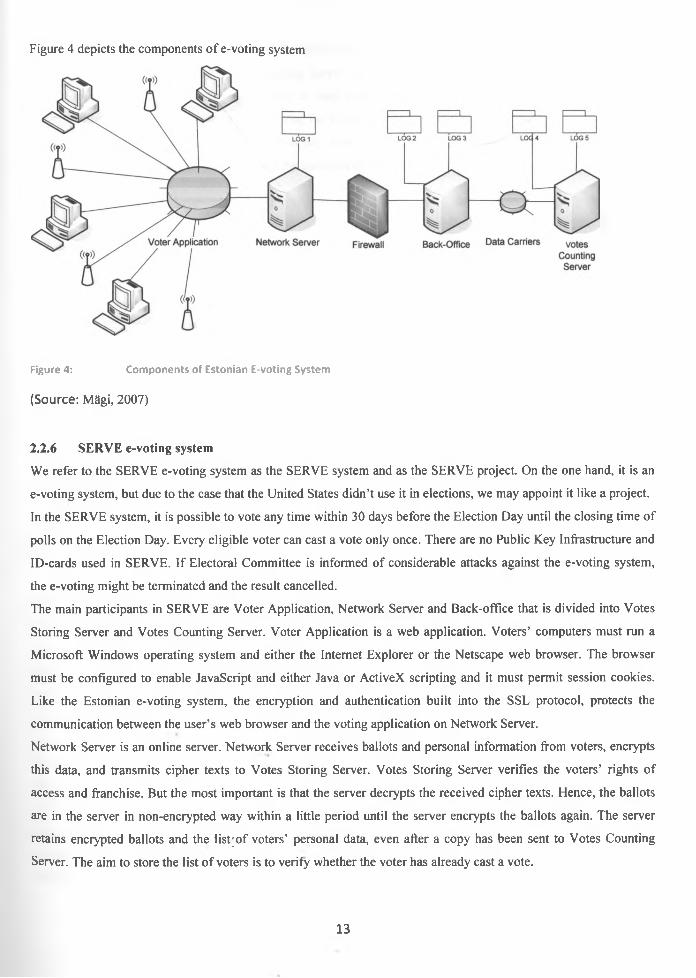
Figure 4 depicts the components of e-voting system
Figure 4: Components of Estonian E-voting System
(Source: Magi, 2007)
2.2.6 SERVE e-voting system
We refer to the SERVE e-voting system as the SERVE system and as the SERVE project. On the one hand, it is an
e-voting system, but due to the case that the United States didn’t use it in elections, we may appoint it like a project.
In the SERVE system, it is possible to vote any time within 30 days before the Election Day until the closing time of
polls on the Election Day. Every eligible voter can cast a vote only once. There are no Public Key Infrastructure and
ID-cards used in SERVE. If Electoral Committee is informed of considerable attacks against the e-voting system,
the e-voting might be terminated and the result cancelled.
The main participants in SERVE are Voter Application, Network Server and Back-office that is divided into Votes
Storing Server and Votes Counting Server. Voter Application is a web application. Voters’ computers must run a
Microsoft Windows operating system and either the Internet Explorer or the Netscape web browser. The browser
must be configured to enable JavaScript and either Java or ActiveX scripting and it must permit session cookies.
Like the Estonian e-voting system, the encryption and authentication built into the SSL protocol, protects the
communication between the user’s web browser and the voting application on Network Server.
Network Server is an online server. Network Server receives ballots and personal information from voters, encrypts
this data, and transmits cipher texts to Votes Storing Server. Votes Storing Server verifies the voters’ rights of
access and franchise. But the most important is that the server decrypts the received cipher texts. Hence, the ballots
are in the server in non-encrypted way within a little period until the server encrypts the ballots again. The server
retains encrypted ballots and the list;of voters’ personal data, even after a copy has been sent to Votes Counting
Server. The aim to store the list of voters is to verify whether the voter has already cast a vote.
13
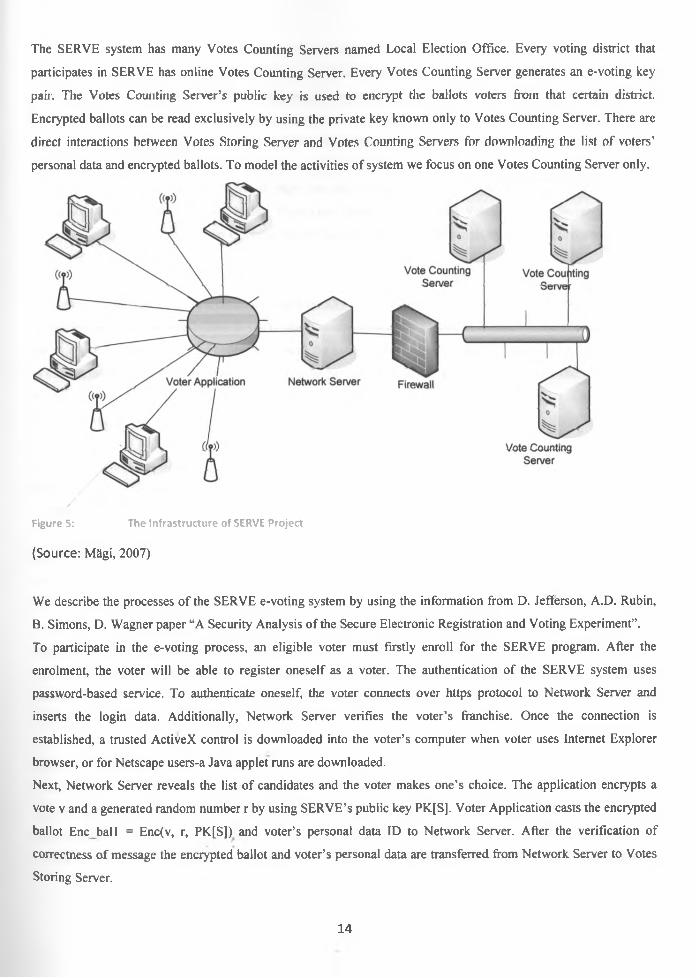
The SERVE system has many Votes Counting Servers named Local Election Office. Every voting district that
participates in SERVE has online Votes Counting Server. Every Votes Counting Server generates an e-voting key
pair. The Votes Counting Server’s public key is used to encrypt the ballots voters from that certain district.
Encrypted ballots can be read exclusively by using the private key known only to Votes Counting Server. There are
direct interactions between Votes Storing Server and Votes Counting Servers for downloading the list of voters’
personal data and encrypted ballots. To model the activities of system we focus on one Votes Counting Server only.
Figure 5: The Infrastructure of SERVE Project
(Source: Magi, 2007)
We describe the processes of the SERVE e-voting system by using the information from D. Jefferson, A.D. Rubin,
B. Simons, D. Wagner paper “A Security Analysis of the Secure Electronic Registration and Voting Experiment”.
To participate in the e-voting process, an eligible voter must firstly enroll for the SERVE program. After the
enrolment, the voter will be able to register oneself as a voter. The authentication of the SERVE system uses
password-based service. To authenticate oneself, the voter connects over https protocol to Network Server and
inserts the login data. Additionally, Network Server verifies the voter’s franchise. Once the connection is
established, a trusted ActiveX control is downloaded into the voter’s computer when voter uses Internet Explorer
browser, or for Netscape users-a Java applet runs are downloaded.
Next, Network Server reveals the list of candidates and the voter makes one’s choice. The application encrypts a
vote v and a generated random number r by using SERVE’s public key PK[S], Voter Application casts the encrypted
ballot Enc ball = Enc(v, r, PK[S]) and voter’s personal data ID to Network Server. After the verification of
correctness of message the encrypted ballot and voter’s personal data are transferred from Network Server to Votes
Storing Server.
14
In the votes’ managing phase, the Votes Storing Server verifies that a voter is registered and has not yet voted. The
server generates a Response for each accepted vote. In case the voter has already voted the receipt Response with
conespondiiig answer is generated and voting process terminates. Accepted encrypted ballots follow tire process irt
Votes Storing Server. The server decrypts cipher text of votes using the private key of SERVE and separates the
ballots and the voters’ personal data. Afterwards, Votes Storing Server encrypts ballots without the voters’ personal
data using the public key of Votes Counting Server. Votes Storing Server retains the encrypted ballots Enc_bal2 =
Enc(v, r, PK) = Encfbal, PK) and the list of voters who have already cast a vote. Votes Counting Server downloads
the list of voters and the encrypted ballots from Votes Storing Server when Votes Counting Server updates its
database. For counting votes, Votes Counting Server decrypts the encrypted ballots by using the private key SK of
Votes Counting Server.
Only accepted format of votes are counted to the final tally. The computation of the votes is repeatable.
In SERVE there are two possibilities to verify which components of the system have received the information about
the voters or the ballots. The first option is to check the list of voters in Votes Counting Server and another option is
to make a query to the list of voters in Votes Storing Server. Both servers retain the voters’ list and the encrypted
ballots separately. It is not possible to verify whether a voter’s vote participated in the calculation of the final tally.
To summarize, there is no independent audit trail of votes to verify the e-voting process.
2.3 E-Voting Examples
Electronic voting has been a hot issue in many states worldwide and lately some of these states implemented e-
voting as a replacement for their conventional electoral systems in practice.
2.3.1 BrazilBrazil is a world leader in electronic elections, having conducted them since 1990. The elections in October, 1998,
was one of the largest electronic elections in history with over sixty million voters casting ballots by computer for
local and national candidates. 57% of the voting population voted electronically in elections for local, state and
national offices. In accordance with Brazilian law, an initial election involving all candidates was held in October
and a run-off election between top two vote-getters for each office was held in November. When the results were
tabulated, Brazil had elected its President, 27 Senators, 27 Governors and over 2000 state and local officials
(Krimmer and Schuster, 2008; Avgerou, C. et.al., 2006).
2.3.2 United KingdomThe expansion of new Information and communication Technologies into every sphere of people’s lives offer
opportunity to progressively overhaul electoral processes and to realize the benefits that new technologies can offer
this component of democracy. Most, people routinely undertake electronic transactions as part of their everyday
activities. Millions of people regularly cast electronic votes in private elections, particularly for television and radio
15

contests. Soon, voting in public elections (both locally and general elections) may be one other activity which can be
achieved electronically (Krimmer and Schuster, 2008).
The vision of e-voting is not one of a sudden switch over to a simple technology. Rather the vision is one of a
phased move to multi-channel elections in which voters are offered a range of means by which to cast their vote and
choose the mechanism that most suits them. Some of the ?00? local election pilots were experimented with multi
channel approach. The process of piloting, testing and then introducing became an increasing feature of electoral
practice. By the 2008 General elections most counties tried this approach and it showed significant improvements.
By 2011, much of the ground should have been prepared for an e-enabled election, offering various vote casting
alternatives (Mercuri, 2001).
2.3.3 New Zealand
Most of the developments are providing electronic voting facilities in polling places particularly replacing paper and
ballot s in jurisdictions with complicated ballots and multiple languages as in the case in Delgium, the Netherland
and the United States. There were ambitious remote e-voting trials that took place in 2007 that were monitored
closely. In particular, registered overseas New Zealand voters voted online at the parliamentary elections.
2.3.4 How Best to Introduce E-Voting
Buchsbaum (2004) in work offered suggestions on how best to introduce (remote) e-voting.
■ suggest e-voting as additional, optional voting channel;
■ start with identifiable group(s) of persons who wish / need e-voting, e.g. persons away from polling stations
on election day(s), handicapped and bedridden persons incapable of going to polling stations, and mobile
and busy people unwilling to go to polling stations but interested in participating in elections;
■ go for added-value schemes which may be different in individual countries, with respect to existing voting
channels and procedures;
■ full understanding and trust by voters and lawmakers - including of the opposition - are absolutely
necessary;
■ only a step-by-step approach leads to success: election tests separate from or parallel to, elections are to be
held before valid test elections (pilots) can be, and small before big numbers of electors should be involved;
■ in countries where postal voting is practiced, extending postal voting to remote e-voting eases the
introduction of e-voting;
■ the best, as most reliable way, is identification with the help of electronic signatures / smart cards (not
PINS);
■ In order to avoid risks through postal transmissions, any transmission related to e-voting shall be possible /
offered by electronic channels.
The above underpins the need for dedicated communication channel that is reliable, efficient and always available.
Hence citizens’ readiness is vital in order to establish e-voting system.
16
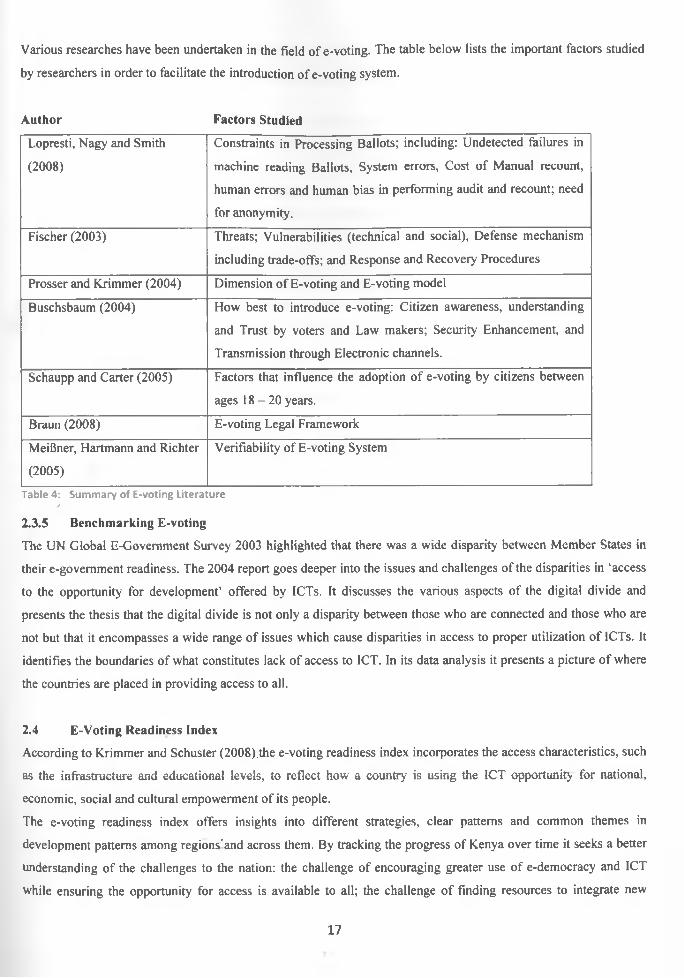
Various researches have been undertaken in the field of e-voting. The table below lists the important factors studied
by researchers in order to facilitate the introduction of e-voting system.
Author Factors Studied
Lopresti, Nagy and Smith
(2008)
Constraints in Processing Ballots; including: Undetected failures in
machine reading Ballots, System errors, Cost of Manual recount,
human errors and human bias in performing audit and recount; need
for anonymity.
Fischer (2003) Threats; Vulnerabilities (technical and social), Defense mechanism
including trade-offs; and Response and Recovery Procedures
Prosser and Krimmer (2004) Dimension of E-voting and E-voting model
Buschsbaum (2004) How best to introduce e-voting: Citizen awareness, understanding
and Trust by voters and Law makers; Security Enhancement, and
Transmission through Electronic channels.
Schaupp and Carter (2005) Factors that influence the adoption of e-voting by citizens between
ages 18-20 years.
Braun (2008) E-voting Legal Framework
MeiBner, Hartmann and Richter
(2005)
Verifiability of E-voting System
Table 4: Summary of E-voting Literature/
2.3.5 Benchmarking E-voting
The UN Global E-Govemment Survey 2003 highlighted that there was a wide disparity between Member States in
their e-govemment readiness. The 2004 report goes deeper into the issues and challenges of the disparities in ‘access
to the opportunity for development’ offered by ICTs. It discusses the various aspects of the digital divide and
presents the thesis that the digital divide is not only a disparity between those who are connected and those who are
not but that it encompasses a wide range of issues which cause disparities in access to proper utilization of ICTs. It
identifies the boundaries of what constitutes lack of access to ICT. In its data analysis it presents a picture of where
the countries are placed in providing access to all.
2.4 E-Voting Readiness Index
According to Krimmer and Schuster (2008).the e-voting readiness index incorporates the access characteristics, such
as the infrastructure and educational levels, to reflect how a country is using the ICT opportunity for national,
economic, social and cultural empowerment of its people.
The e-voting readiness index offers insights into different strategies, clear patterns and common themes in
development patterns among regions'and across them. By tracking the progress of Kenya over time it seeks a better
understanding of the challenges to the nation: the challenge of encouraging greater use of e-democracy and ICT
while ensuring the opportunity for access is available to all; the challenge of finding resources to integrate new
17
technologies into traditional development patterns at a pace that allows for exploitation of those opportunities; the
challenge of devising appropriate e-democracy strategies and policies which would overcome the inept leadership
and resource management.
The e-voting index will also signals broad trends counties in Kenya and across regions. It contributes to the
discussion of the centrality of ICT to development by gaining a better understanding of the emerging patterns of
country performance across the world.
By constructing a comparative index the e-voting readiness index ranks government’s efforts while taking into
account their size; infrastructure availability and ICT penetration; and the level of education and skill development,
the index provides a valuable input for policy making and agenda setting for the future. The relative rankings will
assess a county within its economic and social development context.
The e-voting readiness indices are useful for government officials, policy makers, researchers, and the
representatives of civil society and the private sector to gain a deeper understanding of the comparative
benchmarking of the relative position of a county in utilizing e-voting for the citizen vis a vis the rest of the country.
The Survey aims to inform and improve the understanding of policy makers’ choices to shape their e-voting
programs in the service of development. The Survey rankings - which serve as a snapshot - hope to shape further
consolidation of ICT programs which contribute to a more participatory public policy model of development for all.
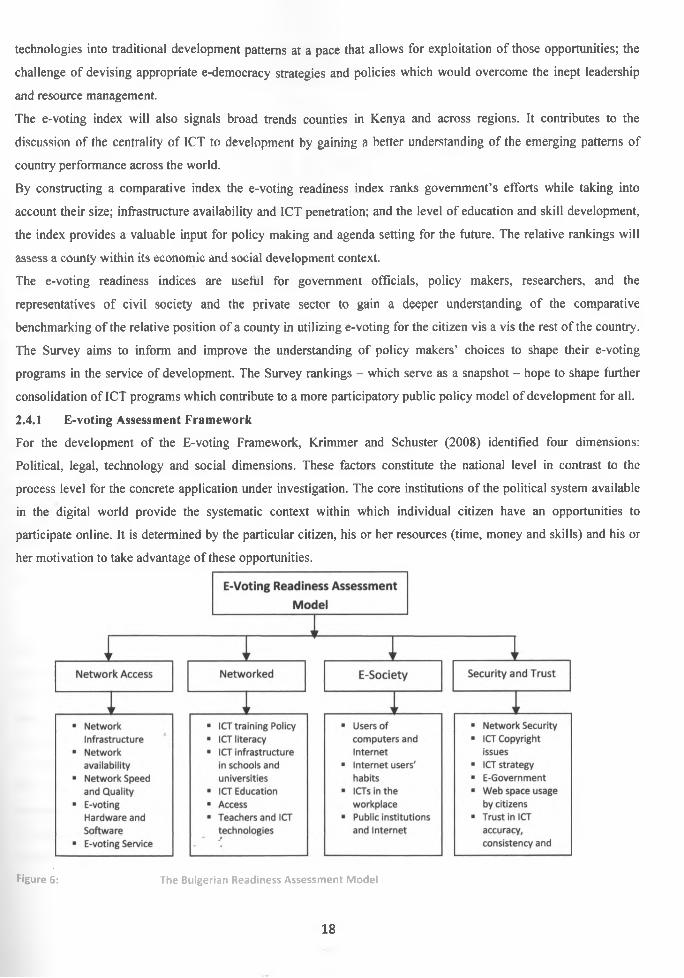
2.4.1 E-voting Assessment Framework
For the development of the E-voting Framework, Krimmer and Schuster (2008) identified four dimensions:
Political, legal, technology and social dimensions. These factors constitute the national level in contrast to the
process level for the concrete application under investigation. The core institutions of the political system available
in the digital world provide the systematic context within which individual citizen have an opportunities to
participate online. It is determined by the particular citizen, his or her resources (time, money and skills) and his or
her motivation to take advantage of these opportunities.
Figure 6: The Bulgerian Readiness Assessment Mode!
18
Regarding E-democracy, the dimensions of the national level that can be considered include:
■ Information Society Context
■ Political Context
■ Legal Context
Information society context measures computer and internet penetration. Political Context considers the
democratization of a country based on political stability and type of government. A stable democracy is necessary
for the introduction of e-voting system. Legal Context measures the basics of democratic elections using election
system or supplementary protocol for human rights.
2.4.2 Origin of the concept of E-voting Readiness
The rapid rate of Internet penetration throughout the world and the dramatic advances in the use of information
technology in business and industry has occasioned a growing interest and literature on e-readiness not only in
developed countries but also in developing countries as well. The concept of e-readiness was developed as a result
of the need to provide a unified framework to evaluate the breadth and depth of the digital divide at macro level
between most and least developed countries during the later part of the 1990s. This was followed by the emergence
of various e-readiness assessment tools which were developed by different companies, organizations or groups with
each group claiming its tool to offer better results. The Computer Systems Policy Project - a public policy advocacy
group that comprises of the United States information technology companies, was the first to use the concept of e-
readiness when it developed in 1998 an e-readiness assessment tool known as the “Readiness Guide for Living in
the Networked World”. From this first model by CSPP, other models have evolved (www.cssp.org). These have
been applied to democracy, particularly in analyzing citizens’ readiness for e-voting.
2.4.3 E-Readiness Attributes
(a) Network Access
The minimum necessary condition for e-readiness is access to adequate network infrastructure. Without access to
global communications networks, no organization can participate in the Networked World. Access is determined by
a combination of the availability and affordability of the network itself, as well as of the hardware and software
needed for network interface. The quality and speed of the network are also important in determining how the
network is used.
(i) Network Infrastructure
This refers to the physical hardware used to interconnect computers and users. Infrastructure includes the
transmission media, telephone lines, routers, repeaters, and other devices that control transmission paths.
The infrastructure provides the necessary backbone that connects institutions to the global network infrastructure is
important for realization of quality services. Infrastructure development consumes large amounts of financial
19
resources in ICT projects and it is important that management attention be directed to this component right from
project initiation,
(ii) Network Availability
This affects the rate at which results are relayed to the commission headquarters and tallying centre. The range of
services offered, the number of dial-up lines and the transmission capacity all influence an ISP’s usefulness. The
availability of wireless network is particularly important in evaluating citizens’ e-voting readiness.
(iii) Network Speed and Quality
The available bandwidth determines the number of users and types of online activities the network can support.
Bandwidth-intensive activities, such as large file transfers or video streaming, may be unavailable to organizations
with constrained access to the network. The quality of the network, including servers, also determines its usage.
High numbers of network faults, poor connections, dropped connections and packet loss can render any network
useless or operationally sub-optimal, thus discouraging use of and investment in new technologies.
(iv) E-voting Hardware and Software
According to CID (2000), a vibrant market with numerous hardware and software options can encourage more
specialized usage of the network, including ICT solutions that are tailored to organizational needs. The availability
of open source software is important. The usability and complexity of hardware and software are particularly
important if most of the citizens are to become ICT compliant.
(v) E-voting Service and SupportA strong citizen service orientation is important in determining the success of e-voting deployment. The quality and
number of technical support professionals are essential in maintaining the network and providing service. The hand-
on expertise is fundamental to the evaluation of e-voting readiness in Kenya.
(b) Networked Learning
(i) Access to Information and Communication Technologies
Institutions must integrate ICT tools into their processes if they are to be part of the Networked World, Programs
that give voters and general public at large access to information and communication technologies anywhere,
anytime and using any device; providing an important step to e-voting adoption. According to CID (2000), an
organization’s e-readiness in terms of access can be broken down into six broad areas: number of computers,
physical access to the technology, types of computers, diffusion of the network, access to and organization of
electronic content, and quality and speed of connectivity in the school.
(ii) ICT Literacy
While putting ICTs into institutions is an important step to e-voting readiness; the technologies need to be properly
harnessed to improve the voting process. Hands-on and practical must be encourage.
(iii) ICT Infrastructure
It is essential that there exist opportunities within the institutions to offer ICT workers essential skills such as
software programming, hardware engineering and World Wide Web design. These opportunities are fundamental to
creating a sustainable ICT industry and support the integration of ICTs into the institutions.
20
(c) NETWORKED SOCIETY
According to CID (2000), e-voting readiness depends upon the community’s incorporation of information and
communication technologies into the fabric of its activities in order to maximize the gains of joining in the
Networked World. ICTs in society at large can have a profound effect upon people’s professional and personal lives
by providing easier access to information, more efficient ways to communicate and powerful organizational tools. In
order to understand how a community is using ICTs, it is important to assess not only how many members of the
community have access to the technologies, but also how they are using them.
(i) Users of computers and Internet
According to CID (2000), one of the hardest indicators to track is the actual number of online users, particularly in
the developing world, where multiple users share many electronic mail accounts and other online tools, there are few
reliable indicators that accurately map how many people are online. The exponential growth in online usage also
makes tracking current use difficult. This is nevertheless an important indicator. According to CID (2000), as more
people access the Internet regularly and networks of users grow, there is greater demand and opportunity for online
interaction, as well as better meshing with the Networked World at- large. As more organizations gain an online
presence, it becomes more likely that the community will use information and communication technologies to
augment or carry out its activities and needs.
(ii) Internet Users’ habits
Community members find the Internet medium more useful and relevant to their own lives when online content
reflects their own interests and needs. Locally relevant content is a major driver of growth of Internet usage.
Interactions such as chat rooms, online interest groups, special interest software, bulletin boards and websites all
drive the community to use ICTs more widely in their lives: Similarly, online content is more relevant when it is
available in local languages.
(iii) Information and Communication Technologies in Everyday Life
According to CID (2000), communities participate more directly in the Networked World when information devices,
such as radios, faxes, televisions, telephones, pagers and computers are culturally accepted and widely incorporated
into daily life. It is important to examine both penetration of ICT devices into a community and their applications. In
communities where either income levels or the network infrastructure cannot support high levels of individual
access, public shared facilities provide a needed alternative. Such venues may include tele-centres, cyber cafts and
community information centres. Strategies for drawing people in to use these facilities are essential.
(iv) Information and Communication Technologies in the Workplace
According to CID (2000), the more, that business and government offices are already using information and
communication technologies, the better prepared they are to participate in the global networked economy. CID
(2000) further notes that in order to realize important efficiency gains from ICTs, businesses and governments need
21

to not only make technologies available to their employees, but also effectively incorporate them into their core
processes.
(d) NETWORK POLICY, SECURITY AND ICT STRATEGY
(i) Network security
The terms Network Security and Information Security are often used interchangeably. Network Security is generally
taken as providing network protection against unauthorized people. Information Security, however, explicitly
focuses on protecting data resources from malware attack or simple mistakes by people within an organization.
(ii) ICT Copyright issues
Copyright is a form of intellectual property that gives the author of an original work exclusive right for a certain
time period in relation to that work, including its publication, distribution and adaptation, after which time the work
is said to enter the public domain.
Copyright applies to any expressible form of an idea or information that is substantive and discrete and fixed in a
medium. Some jurisdictions also recognize “moral rights” of the creator of a work, such as the right to be credited
for the work.
(iii) ICT Strategy
The information and Communication Technology (ICT) Strategy defines the technical direction and framework for
institutional developments, services and risk management.
It is envisaged that this strategy will act as a guide for the development and management of ICT for a predefined
period of time. The aims of the ICT Strategy are to:
■ Define the technical direction and framework for developments in the infrastructure and administrative and
academic applications that involve use of information technology.
■ Define the principles and standards that permit data sharing, integration and devolvement of systems that
will lead to efficient and coherent working.
■ Cover issues such as security and disaster recovery
(iv) Web space usage by citizen
This determines the number of citizens currently on social networks and possibility of fraud, hacking and
cybercrime to occur.
(v) Trust in ICT accuracy, consistency and timeliness
The infamous “computer error” while releasing Kenya Certificate of Secondary Education, raise an issue of trust in
ICT. Citizens’ readiness often is influenced by public opinion. It is often worthwhile to establish standards.
22

2.5 Discussion of Previously used E-Readiness Assessment Tools
Various e-readiness assessment tools have been used over the past few years. Each tool gauges how ready a society
or economy is to benefit from information and communication technology. The range of tools uses varying
definitions for e-readiness and different methods for measurement.
For each assessment tool, the following questions are answered in this discussion: What is the goal of the tool? What
is measured? Who created the tool? How is ‘e-readiness’ defined? How is assessment carried out? What is
produced?
The range of available tools is broken down into different categories.
2.5.1 READY-TO-USE TOOLS - QUESTIONA1RES
2.5.1.1 CSPP’s readiness guide for living in the networked world
Who created the tool?
The Computer Systems Policy Project (CSPP) developed this tool. It was published in 1998, and is available at
www.cspp.org. CSPP is a “public policy advocacy group comprised of the Chairmen and Chief Executive Officers”
of US information technology companies.
What is the tool’s goal?
This self-assessment tool is designed to help individuals and communities determine how prepared they are to
participate in the “networked world”.
What does it measure?
The guide measures the prevalence and integration of ICTs in homes, schools, businesses, heath care facilities, and
government offices, with additional focus on competition among access providers, speed of access, and government
policy. Measurements are divided into five categories:
» Infrastructure;
■ Access
■ Applications and services;
■ Economy; and
■ Enablers” (policy, privacy, security, ubiquity).
How does it define ‘e-readiness’?An e’-ready’ community has high-speed access in a competitive market; with constant access and application of
ICTs in schools, government offices, businesses, healthcare facilities and homes; user privacy and online security;
and government policies which are “favorable to promoting connectedness and use of the Network.”
How the assessment carried out?
The CSPP Readiness Guide provides, a series of 23 questions, for community members to ask ho the community
itself for each question, the users choose from a set of answers, which represent four progressive “stages” of
development. The 23 questions are divided into the five categories listed above.
23

What result does it produce?
The assessment produces a rating that indicates which of four progressive stages of development the community is
at for each of the five categories listed above. “An overall ‘score’ for the community can be estimated by simply
averaging the scores across the criteria.
2.5.1.2 CID’s Readiness for the Networked World: A Guide for Developing Countries
Who created the tool?
The center for International Development at Harvard University developed this guide. It was published in 2000, and
is available at www.readinessguide.org. It draws from the CSPP guide, described earlier.
What is the tool’s goal?
“The guide systematically organizes the assessment of numerous factors that determine the Networked Readiness of
a community in the developing world.” This assessment is meant to serve as a basis for further analysis and
planning.
What does it measure?
This guide measures 19 different variables classified as follows:
i. Network access (Information Infrastructure, Internet Availability. Internet Affordability, Network Speed
and Quality, Hardware and Software, Service and Support).
ii. Networked learning (Schools’ Access to Information and Communication Technologies, Enhancing
Education with ICTs, Developing the ICT Workforce)
iii. Networked society (People and Organizations Online, Locally Relevant Content, information and
Communication Technologies in Everyday Life, Information and Communication Technologies in the
Workplace).
iv. Networked economy (ICT Employment Opportunities, Business-to-Consumer (B2C) Electronic
Commerce, Business-to-Business (B2B) Electronic Commerce, E-Govemment).
v. Network policy (Telecommunications Regulation, ICT Trade Policy).
How does it define ‘e-readiness’?An ‘e-ready’ society is one that has the necessary physical infrastructure (high bandwidth, reliability and affordable
prices); integrated current ICTs throughout businesses (e-commerce, local ICT sector), communities (local content,
many organizations online, ICTs used in everyday life, ICTs taught in schools), and the government (e-govemment);
strong telecommunications competition; independent regulation with a commitment to universal access, and no
limits on trade or foreign investment. }
24

How is the assessment carried out?
Tb guide provides a grid (See appendix B) with descriptions of four stages of advancement in each of 19 categories
(placed into five groups). Communities estimate their current stage of development in each category. No
prescription is given on how that estimate should be made.
What results does it produce?
The guide rates the ‘stage’ a community is in for each of the 19 categories, and descriptions are given of what is
required to be in a particular stage. “The Guide does not offer prescriptions for improved Readiness.”
2.5.1.3 APEC’s E-Commerce Readiness Assessment
Who created the tool?
The Asian Pacific Economic Co-operation (APEC) Electronic Commerce Steering Group developed this guide. It
was published in 2000, and is available at http://www.ecommerce.gov/apec.
‘Who is the tool’s goal?“To help governments develop their own focused policies, adapted to their specific environment, for healthy
development of c-commerce.”
What does it measure?
Six categories are measured for “readiness for e-commerce:”
i. Basic infrastructure and technology (speed, pricing, access, market competition, industry standards, foreign
investments),
ii. Access to network services (bandwidth, industry diversity, export controls, credit card regulation),
iii. Use of the internet (use in business, government, homes),
iv. Promotion and facilitation (industry led standards),
v. Skills and human resources (ICT education, workforce), and
vi. Positioning for the digital economy (taxes and tariffs, industry self-regulation, government regulations,
citizens’ trust).
How does it define ‘e-readiness’?A country that is ‘ready’ for e-commerce has free trade, ease of exports, and compliance with international standards
and trade agreements.
How is the assessment carried out?
Participants are asked 100 multiple-choice questions grouped into six categories listed above. The possible answers
indicate progressive levels of e-readiness for a country. No overall scoring occurs.
What result does it produce?
25

The product of the assessment is the answer to the 100’questions. Countries are supposed to work areas with less
than optimal answers, since they are “impediments... to the deployment e-commerce.”
2.5.2 Third Party Surveys and Reports
2.5.2.1 McConnell International’s Risk E-Business: Seizing the Opportunity of Global E-Readiness
Who created the tool?
McConnell International prepared this report in collaboration with World information Technology and Services
Alliance (WITSA), and it was released in August 2000. It is available at http://www.mcconnel lintemational.com.
What is the tool’s goal?
The goal is to assess a national economy’s e-readiness or “capacity to participate in the global digital economy.”
What does it measure?
The report measures five areas:
i. Connectivity (infrastructure, access and pricing),
ii. E-leadership (government policies and regulations),
iii. Information security (intellectual property, privacy, electronic signatures),
iv. Human capital (ICT education, available skilled workforce), and
v. E-business climate (competition, political and financial stability, foreign investment, financial
infrastructure).
How does it define ‘e-readiness’?An ‘e-ready’ country has extensive usage of computers in schools, businesses, government and homes; affordable
reliable access in a competitive market; free trade; skilled workforces and taming schools; a culture of creativity;
government-business partnerships; transparency and stability in government and an evenly enforced legal system;
secure networks and personal privacy; and regulations allowing digital signatures and encryption.
How is the assessment carried out?
For each country and each category, the report performs a “dynamic evaluation of the relevance and accuracy of
available quantitative data with an understanding of myriad cultural, institutional, and historical factors.” These
general ratings and their narratives can be used as a starting point for further planning.a
What results does it produce?
Countries are rated in the five categories listed above on a scale of one to three (‘blue,’ amber, red’), and extensive
analysis and recommendations are given.
26

2.5.2.2 CIDCM’s negotiating the Net Model
Who created the Tool? The Leland Initiative Telematics for Africa project at the Centre for international
Development and Conflict Management (CIDCM) at the University of Maryland developed tin tool and was
published in 2001.
What is the tool’s goal?
To help advance the diffusion of ICTs in developing countries, especially Africa, by helping decision-makers
improve the processes of negotiating through which ICTs are diffused by governments, NOOs and the private
sector.
What does it measure?
The framework measures four categories of information for each country:
1. Background and history — structural context (economy, education levels, existing infrastructure), political
structure and culture (type of government, policy making style), cultural norms (religion, etc).
2. Key players in Internet development — responsibilities and objectives of relevant players in government,
local and foreign businesses, universities, NOOs, international financial institutions, research groups.
3. Internet development and 1CT policy over time — access, regulation, competition.
4. Negotiations between players in developing the country’s Internet — each aspect of Internet development
and ICT policy is categorized into one of four stages (pre-commercial, commercial, competitive, and
consolidated). ‘Negotiation’ between players is the focus of the framework — the rest is supporting
information.
How does it define ‘e-readiness’?
An ‘e-ready’ society has an ISP market that has passed through three phases of development: (1) pre-commercial
(access limited to a pioneer community), (2) commercial (access is sold s) and (3) competitive (the ISP market has
multiple competing actors). The negotiations between actors should be transparent, conclusive, speedy and inclusive
of the major players in public, private and NGO sectors.
How is the assessment carried out?The assessment is conducted through interviews with key actors in the relevant institutions draws upon a range of
background statistics and information as outlined above.
What result does it produce?The result will be detailed narrative that describes the processes and outcomes of negotiations between key players
over the phases of development, identifying major contentious issues likely to remain problematic in the future.
27

2.6 Overview of E-Voting Readiness at Global Level
Many countries and organizations across the world have realized the enormous potential Information and
Communication Technology plays in accelerating their development. As such these countries and organizations
have found it important to take stock of the state of the e-voting readiness by appraising the status of the underlying
infrastructure, human resources, policies and investment climate at regular interval using e-voting readiness index
(Krimmer, 2008). This is based on four dimensions, namely: Political, Social, Technology and Legal. The
underlying principle behind the ranking is that digital business is crucial to national economy and for digital
transactions to be widely adopted and efficient, they have to thrive in all supportive environment (Economic Group
2005), and hence the potential for the introduction of e-voting in Kenya.
2.7 Over View of E-Voting Readiness in Africa
In Africa, e-readiness initiatives are being driven by the World Economic Forum and the e-Africa Commission ICT
Task Team responsible for developing NEPAD ICT program and implementing its projects. The World Economic
Forum-NEPAD E-readiness Policy has the goal of helping African countries to develop e-readiness policies and to
reduce the policy obstacles that limit the use of ICTs throughout the region. These can be adopted for e-voting
readiness.
According to Bridges.org (2003), some of the activities that have so far been undertaken by the World Economic
Forum-NEPAD E-readiness Policy Programme include:
■ Establishing collaboration with the e-Africa Commission;
■ Identifying key actors and mechanisms to engage them;
■ Collecting information on basic c-readiness in African countries;
■ Creating a framework for examining the issues, and proposing country; groupings according to e- readiness
levels.
According to Bridges.org (2003), key findings about e-readiness in Africa undertaken by the World Economic
Forum- NEPAD E-readiness Policy Programme show that there is unanimous agreement among Africa’s leaders
and pan-African structures on the benefits that ICT could bring and the impact it could have on a wide range of
development issues. This underpin the need for need for e-voting readiness.
2.8 Overview of E-Readiness by KENET
KENET an organization providing Internet connection to public and private universities in Kenya recently carried
out a study whose objective was to assess the level of preparedness of Higher Education (HE) institutions in Kenya
to use Information and Communication Technologies in teaching, learning, research, and management.
The study included 17 universities, eight middle-level colleges (including polytechnics), and five research
institutions that are members of the body. The assessment was conducted using a diagnostic tool derived from the
Center for International Development at Harvard University. The study concluded that the higher education
community, especially the university community in Kenya, was ready to use ICT for learning, teaching, research
and management but observed that tlje institutional leadership did not yet consider ICT as strategic way for their
institutions. The study noted that the institutions were allocating low operational budgets to ICT, were not investing
28
adequately in campus networks and they were not giving attention to the use of ICT to enhance education and
research (KENET, 2007).
This was the first e-readiness assessment to be carried, out in Kenya. The study made several recommendations one
of which was to carry a similar assessment to cover e-voting readiness in Kenya.
2.9 National ICT Strategy for Education and Training
The Ministry of Information, sector partners and stakeholders have developed the National ICT Strategy (2006)
aimed at guiding the education sector in the adoption of ICTs across all levels of education and training. The
strategy was developed by taking into consideration the policy environment captured in the National ICT Policy of
2006. The strategy was been developed in line with the E-Govemment Strategy of 2004 and wider Economic
Recovery Strategy Paper for Wealth and Employment Creation (ERSWEC). The strategy identifies the following
strategic pillars for education sector ICT implementation:
■ Establishment of a policy framework Digital equipment
■ Connectivity and network infrastructure
■ Technical support
■ Harnessing emerging technologies
■ Digital content development
■ Integration of ICTs in education
■ Training (capacity building including professional development)
■ Research and development
■ Partnerships and resource mobilization
■ Legal and regulatory framework, and
■ Monitoring and evaluation.
■ It is in the light of this strategy that technical training institutions in Kenya have taken steps towards
making the institutions e-ready.
2.10 Critical ReviewPrevious studies obtained revealed broad areas covered by other researchers and scholars in pursuit of deeper
insights into the understanding of complex and slipping issues which impacts the technology acceptance both
positively and negatively. They have also been able to identify possible strategies to enable the organization roll-out
the benefits of ICT but none of these studies showed a clear picture of citizens’ readiness for e-voting as an enabler
for e-democracy. The changes over the last decade forecast a trend of increased use of ICT for achievement of
democratic society.
In their study Hall and Alvarez (2004) did not find all of the expected factors affecting the introduction of e-voting.
The results provided only a mixed suggestion that TAM forms the basis of individual’s attitudes and behaviours are
significantly affected by society and ICT. Nevertheless, it is possible that the specific behaviours examined by the
scholars were not relevant to the outcomes when measured at the level of readiness to adopt e-voting. Although a
29v
number of scholars have carried out previous studies on e-voting and e-democracy; one area that perhaps got less
attention is citizens’ readiness to e-voting.
2.11 Summary
Carter and Belanger (2005) e-govemment adoption model is encompassing enough to be applied to various
applications of e-govemment including e-voting. The model captures the fundamental factors of adoption that are
relevant to examine citizens’ readiness for e-voting, a paradigm in e-democracy and social development. Security
and Legal Policies are fundamental as means of creating and enhancing trust in the e-voting technology. It is
important to evaluate these factors in addition to Complexity, Relative advantage, Compatibility and Tmst in
government.
There is need for enhanced individual responsibility in the society. In this regard time needs to be budgeted and
should only be spent on allocated events depending on one’s schedule. The review stresses that for a simpler
tomorrow; today must be taken care of through good time management in order to the expectation of the population.
Citizens need to play a role in the adoption and implementation of any technology. This requirement will demystify
the complexify notion. This project explores the need for concerted effort in introduction and diffusion of
technology.
30
CHAPTER THREE METHODOLOGY
The aim of this chapter is to give an introduction about the general research methodology used in this study together
with specific tools used in data collection and analysis. Further, this chapter discusses the methods to evaluate
validity and reliability of the research.
3.1 INTRODUCTION
A method can be defined as a set of techniques that researchers use to carry out an inquiry by systematically
gathering information to describe, explore, explain or predict a phenomenon of interest. The methodology involved
in this project used both quantitative and qualitative research. Quantitative research focuses on determining facts and
the relationships among variables and seeks to describe observations through statistical analysis of data. On the other
hand, qualitative research refers to descriptive study that is aimed at collecting and analyzing in-depth narrative data
that provide information about subjective meaning of human experiences and phenomena, usually conducted in the
natural setting.
The project hoped that by combining two research approaches (quantitative and qualitative) a more comprehensive
study would be carried out that would give more accurate results and more valid conclusions at the end of the
process. It is empirical examination of factors that influence adoption and usage of e-voting system. For purpose of
this study, the universe consists of all persons living in Nairobi County and who use internet services in their daily
activities, the exact number is unknown for now.
3.2 Research Design
Research design is the logical sequence that connects the empirical data to a study’s initial research questions and
ultimately to its conclusions. The research design consists of a plan to answer the research question or test the
hypothesis. It includes the plan of how to measure the concepts of interest, determine who will participate and how
they will be selected, what setting will be used, what data collection procedure will be employed, and how the data
will be analyzed. This project used a two-phased research design, the quantitative and qualitative survey.
3.3 Population and Sampling Procedure
Sampling can be defined as the representation of subsets making up the population from which results can be
generalized. How well a sample represents a population depend on the sample frame, the sample size and the
specific design of the selection procedure.
3.5 Sampling Procedure: Qualitative Survey of Research
The type of research is qualitative. It is empirical examination of the factors that influence adoption of E-voting
system. For purpose of this study, the universe consists of all persons living in Nairobi county and registered voters.
31
3.5.1 Sampling Determination
When times and resources allow, a research should take as big a sample as possible since this will ensure reliability
of results (Mugenda and Mugenda, 2003). Minimum sample size for research is
n = {Za2p(l-p)}/d2
Za = Standard normal deviation at the required level
n = Sample size
p = Proportion in the target population estimated to have characteristics being measured
d = Level of statistical significance set
Using confidence level of 95%, z is read from the table which is 1.96 and the proportion of a target population with
certain characteristic is 0.50 the desired accuracy at the 0.05 level, then the sample size is
n = (1,96)2(0.50) (0.50)}/ (0.05)2
= 384
3.6 Data Collection Procedure
Data collection procedure involved the use of a questionnaire for quantitative research and use of interviews for the
qualitative research.
3.6.1 Data Collection Procedure: Quantitative Survey of the Research
Data collection procedure during the quantitative survey involved the use of a short self-administered questionnaire
to sample population. The questionnaires were delivered to the respondents by the researcher. The delivery of the
questionnaire was accompanied by a letter explaining the purpose of the research and requesting that the
questionnaire be completed.
3.6.2 Data Collection Procedure: Qualitative Survey of the Research
The qualitative survey involved the use of face-to-face interviews that were conducted in various firms and
government agencies that will be directly involved with e-voting implementation (see Appendix). This sought to
explore readiness for e-voting. This could not have been achieved by using the structured questionnaire. The
respondents were given enough time to prepare so that they could voluntarily give the required information without
pressure.
The researcher prepared himself adequately prior to the interview to ensure the success of the process. Each
interviewee was briefed on the information concerning the goals of the study and the purpose of conducting the
interviews. Each interview was expected to last between 20 and 30 minutes. The choice of face-to-face interviews as
the data collection method for the qualitative data was motivated by various factors including the following:
(i) Interviews give a researcher an opportunity to motivate the interviewees to respond freely and openly to
questions. ■ >
(ii) Interviews allow a researcher to probe for more feedback from the interviewee if necessary.
32
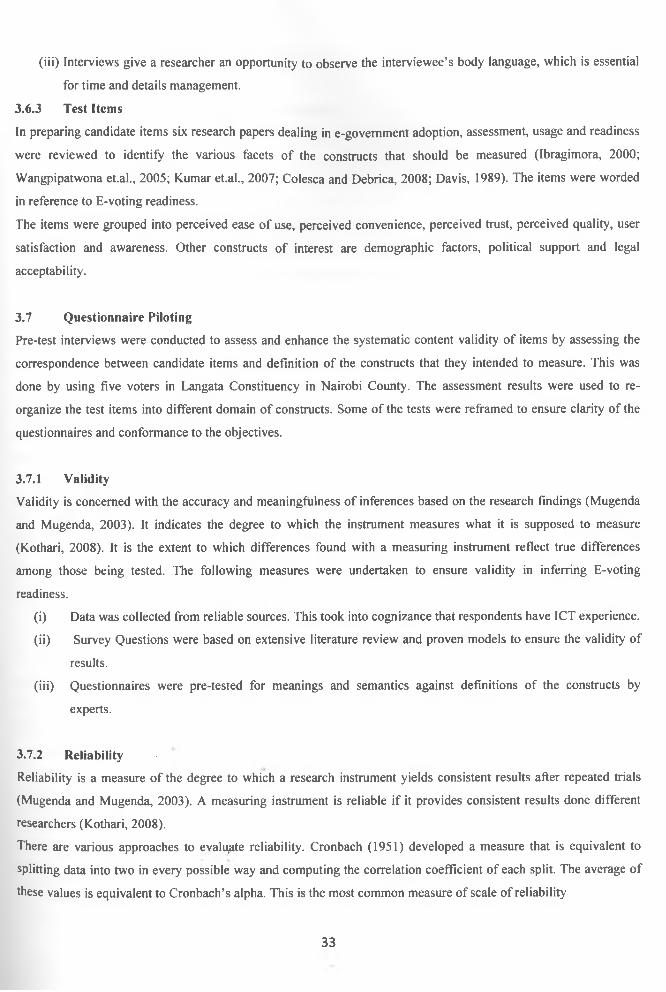
(iii) Interviews give a researcher an opportunity to observe the interviewee’s body language, which is essential
for time and details management.
3.6.3 Test Items
In preparing candidate items six research papers dealing in e-govemment adoption, assessment, usage and readiness
were reviewed to identify the various facets of the constructs that should be measured (Ibragimora, 2000;
Wangpipatwona et.al., 2005; Kumar et.al., 2007; Colesca and Debrica, 2008; Davis, 1989). The items were worded
in reference to E-voting readiness.
The items were grouped into perceived ease of use, perceived convenience, perceived trust, perceived quality, user
satisfaction and awareness. Other constructs of interest are demographic factors, political support and legal
acceptability.
3.7 Questionnaire Piloting
Pre-test interviews were conducted to assess and enhance the systematic content validity of items by assessing the
correspondence between candidate items and definition of the constructs that they intended to measure. This was
done by using five voters in Langata Constituency in Nairobi County. The assessment results were used to re
organize the test items into different domain of constructs. Some of the tests were reffamed to ensure clarity of the
questionnaires and conformance to the objectives.
3.7.1 Validity
Validity is concerned with the accuracy and meaningfulness of inferences based on the research findings (Mugenda
and Mugenda, 2003). It indicates the degree to which the instrument measures what it is supposed to measure
(Kothari, 2008). It is the extent to which differences found with a measuring instrument reflect true differences
among those being tested. The following measures were undertaken to ensure validity in inferring E-voting
readiness.
(i) Data was collected from reliable sources. This took into cognizance that respondents have ICT experience.
(ii) Survey Questions were based on extensive literature review and proven models to ensure the validity of
results.
(iii) Questionnaires were pre-tested for meanings and semantics against definitions of the constructs by
experts.
3.7.2 Reliability
Reliability is a measure of the degree to which a research instrument yields consistent results after repeated trials
(Mugenda and Mugenda, 2003). A measuring instrument is reliable if it provides consistent results done different
researchers (Kothari, 2008).
There are various approaches to evaluate reliability. Cronbach (1951) developed a measure that is equivalent to
splitting data into two in every possible way and computing the correlation coefficient of each split. The average of
these values is equivalent to Cronbach’s alpha. This is the most common measure of scale of reliability
33

KR20={(K)(S2-£ s 2)}/S2 ( K - l )
Where
K R 2o = Reliability coefficient of internal consistency
K = Number of items used to measure the concept
S2 = Variance of all scores
s2 = Variance of individual items
3.9 Framework for E-Voting Readiness Assessment
A special framework was developed for the purpose of this project research. The framework was designed to meet
the specific needs of voters in Nairobi County. It owed much of its structure on the existing e-readiness tools
developed by other bodies.
3.9.1 Adaptation of E-Voting Readiness Assessment Model
The project used an e-voting readiness assessment framework based on a combination of existing e-readiness
models. First, Computer Systems Policy Project (CSPP). This provides for “Readiness Guide for Living in the
Networked World”. Second, Asia Pacific Economic Cooperation Electronic Commerce Steering Group (APEC)
provides for “E-Commerce Readiness Assessment” and thirdly, Centre for International Development (CID)
provides “Readiness for the Networked World: A Guide for Developing Countries”. These three tools have a total of
37 indicators some of which are not relevant to e-voting readiness. Details of the 37 factors are indicated in table 3.2
below.
No. Indicator Source Factor DescriptionIs the factor
Relevant
1Network
Infrastructure
CID,
CSPP,
APEC
This appertains to e-voting as a network is a
necessity for connectivity and vote information
sharing and management. This was adopted.
Yes
2 Internet Availability CIDThe Internet is one of the core technology used in
results relay.Yes
3 Internet AffordabilityCID,
APEC
It determines how much bandwidth can be acquired
to manage concurrent request.Yes
4Network Speed and
Quality
CID,
APEC
The factor determines how fast information may be
retrieved and transmitted over internet during the
voting process
Yes
5 Network Reliability APECIt determines the dependability and credibility of
telecommunication Infrastructure in relaying results.Yes
6Infrastructure market
conditions
* J»APEC This factor is not relevant to e-voting readiness. Yes
7 Interconnection and APEC It evaluates how the network is and it is important Yes
34

Interoperability for network access.
8Access to necessary
serviceAPEC It determines accessibility voting services provided. Yes
9
Current Level and
Type of use of the
internet
APECThis factor is relevant to e-voting readiness as it
determines perceived ease of use.Yes
10 Access to ICTs APECIt determines the number of voters and voting
officials that can access ICTs.Yes
11ICT Hardware and
Software
CID,
APEC
This factor is relevant to e-voting readiness as it
forms the core of ICTs.Yes
12Enhancing Education
with ICTsCID
This factor is relevant to e-voting readiness since
determines ICT adoption in a county and country.Yes
13
Security of ICT
equipment and
software
APECThis factor is relevant to e-voting readiness since it
determines security of ICT resources.Yes
14 ICT Privacy issues APEC
This factor is relevant to e-voting readiness because
it relates to confidentiality, integrity and availability
of information.
Yes
15ICT Services and
SupportCID
This factor is relevant to e-voting readiness since it
evaluates how continuous operation can be achieved.Yes
16People and
Organizations onlineCID
This factor is relevant to e-voting readiness since it
determines the adoption of ICTs in voting.Yes
17 ICT Strategy NewThis factor is relevant to e-voting readiness since it
determines the current and future projections.Yes
18ICTs in Government
officesNew
This is a new factor introduced to evaluate the level
of automation in public institution and it is relevant
to e-voting readiness
Yes
19 ICT Copyright issuesCID,
APEC
This factor is relevant to e-voting readiness since it
determines the legality of software.Yes
20 Relevant Software CIDThis factor is relevant to e-voting readiness since it
evaluates applicability and usability of software.Yes
21Locally Relevant
ContentCID
This factor is relevant to e-voting readiness since it
determines relevance of information and
configurability.
Yes
22 Access to ICTs CIDThis factor is relevant to e-voting readiness since it
enhances usability and reduces surprises.Yes
23 Developing ICT CID This factor is relevant to e-voting readiness since it Yes
35
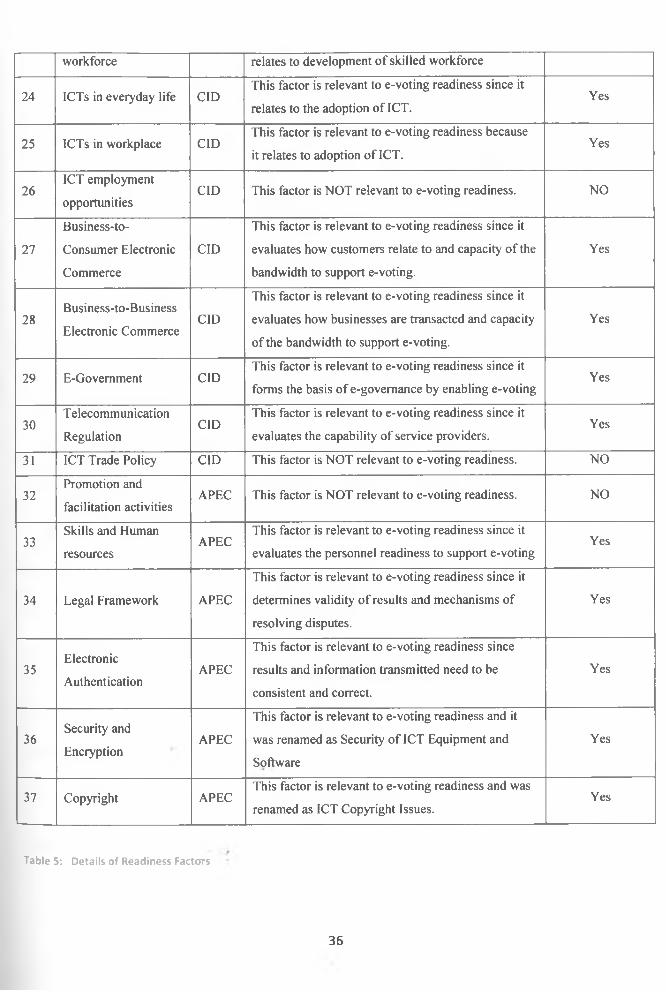
workforce relates to development of skilled workforce
24 ICTs in everyday life CIDThis factor is relevant to e-voting readiness since it
relates to the adoption of ICT.Yes
25 ICTs in workplace CIDThis factor is relevant to e-voting readiness because
it relates to adoption of ICT.Yes
26ICT employment
opportunitiesCID This factor is NOT relevant to e-voting readiness. NO
27
Business-to-
Consumer Electronic
Commerce
CID
This factor is relevant to e-voting readiness since it
evaluates how customers relate to and capacity of the
bandwidth to support e-voting.
Yes
28Business-to-Business
Electronic CommerceCID
This factor is relevant to e-voting readiness since it
evaluates how businesses are transacted and capacity
of the bandwidth to support e-voting.
Yes
29 E-Govemment CIDThis factor is relevant to e-voting readiness since it
forms the basis of e-govemance by enabling e-votingYes
30Telecommunication
RegulationCID
This factor is relevant to e-voting readiness since it
evaluates the capability of service providers.Yes
31 ICT Trade Policy CID This factor is NOT relevant to e-voting readiness. NO
32Promotion and
facilitation activitiesAPEC This factor is NOT relevant to e-voting readiness. NO
33Skills and Human
resourcesAPEC
This factor is relevant to e-voting readiness since it
evaluates the personnel readiness to support e-votingYes
34 Legal Framework APEC
This factor is relevant to e-voting readiness since it
determines validity of results and mechanisms of
resolving disputes.
Yes
35Electronic
AuthenticationAPEC
This factor is relevant to e-voting readiness since
results and information transmitted need to be
consistent and correct.
Yes
36Security and
EncryptionAPEC
This factor is relevant to e-voting readiness and it
was renamed as Security of ICT Equipment and
Software
Yes
37 Copyright APECThis factor is relevant to e-voting readiness and was
renamed as ICT Copyright Issues.Yes
Table 5: Details of Readiness Factors
36

The relevance of the factors was based on the UN Survey 2008 on E-Voting Assessment. The 37 ICT Indicators
were grouped under the following four categories:
(a) Technology Readiness - Network Infrastructure, Internet availability, Internet affordability, Network Speed
and Quality, ICT Hardware and Software, ICT Service and Support.
(b) ICT Competency Readiness - Access to ICTs, Enhancing Education with ICTs, Developing ICT
Workforce, ICT in Government Offices.
(c) E- Society - People and Organizations online, locally relevant Content, ICTs in workplaces.
(d) Security and Trust - Security of ICT Equipment and Software, ICT Privacy Issues, ICT Copyright Issues,
ICT Strategy.
There are additional factors derived from the Kumar (2008):
(a) Political Support
(b) Legal Binding
Using SPSS, the above pilot data generates a Cronbach’s coefficient of 0.75. This implies that items correlate highly
among themselves. There is consistency among items in measuring E-voting readiness. It can therefore be inferred
that the questionnaire is reliable as an instrument of measurement.
Adaptation of E-Voting Adoption Models
Adoption of e-voting is influenced by various factors as outlined in Technology Acceptance Model and E-
govemment adoption Models. These are outline in Table 3.3 below. Understanding the factors that influence E-
voting adoption and acceptance would be of great value for the successful evaluation of E-voting readiness.
Constructs Adaptation
CONSTRUCTS CRITERIA
Perceived Ease of use (PEU)
Usability (PEU1)
Navigation (PEU2)
Accessibility (PEU3)
Helpfulness (PEU4)
Perceived Convenience (PC)
Availability (PCI)
Timeliness (PC2)
Transparency (PC3)
Accountability (PC4)
Perceived Trust (PT)
Trustworthiness (PT1)
Privacy (PT2)
Security (PT3)
Risk (PT4)
37

CONSTRUCTS CRITERIA
User Satisfaction (US)
Overall Satisfaction (US1)
Content Satisfaction (US2)
Interface Satisfaction (US3)
Speed Satisfaction (US4)
Security Satisfaction (US5)
Demographic Factors (DF)
Gender (DF1)
Age (DF2)
Education (DF3)
Years of Internet Use (DF4)
E-Government Use (EU)
Willingness to use (EU1)
Intent to use (EU2)
Frequency (EU3)
Awareness (A)Knowledge of available E-services (Al)
Knowledge of what site to visit (A2)
Political Support (PS)
Political Leadership support (PS 1)
Political Parties’ participation (PS2)
Used in Parties’ preliminaries (PS3)
Acceptance of the results (PS4)
Legal Acceptability (LA)/
Law Provision (LA 1)
Acceptance of electronic results (LA2)
Resolution of disputes (LA3)
Persistency of results (LA4)
Table 6: Adoption Constructs Criteria
38
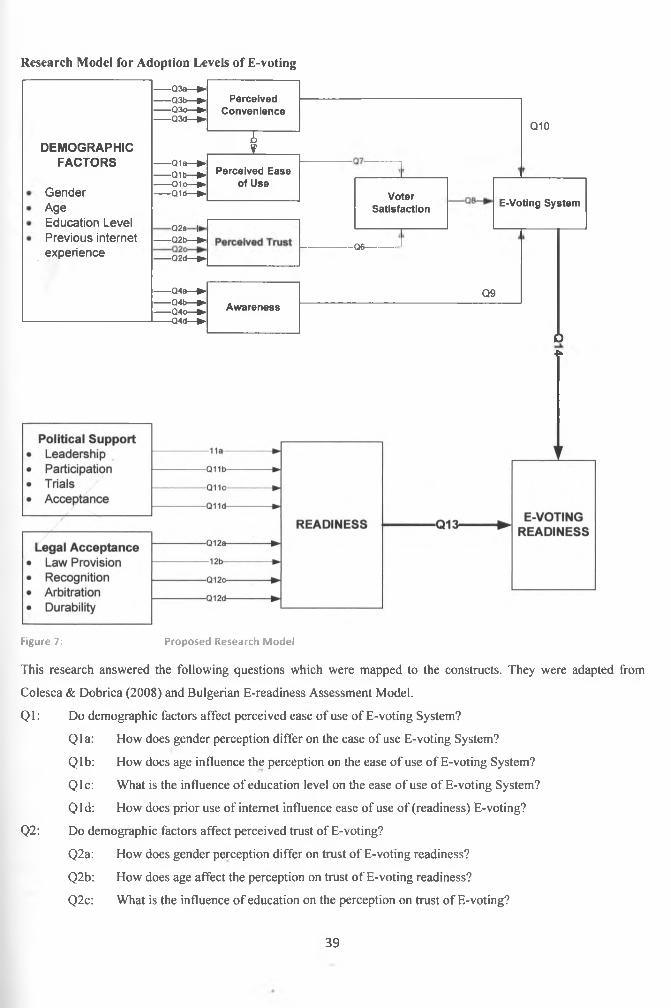
Research Model for Adoption Levels of E-voting
---------Q 3 a — ►
---------Q 3 b — ►---------Q 3 o — ►---------Q 3 d — ►
D E M O G R A P H ICF A C T O R S ---------Q 1 a — ►
---------Q 1 b — ►--------- Q 1 o — ►
Gender ---------Q 1 d — ►
AgeEducation Level
C P a I
Previous internet ---------Q 2 b — ►
experience---------Q 2 d — ►
---------Q 4 a — ►
---------Q 4 b — ►---------Q 4 o — ►--------- Q 4 4 — ►
PerceivedConvenience
T JL
Perceived Ease of Use
Awareness
Q10
VoterSatisfaction E-Voting System
-Q6-
Q9
OA
Figure 7: Proposed Research Model
This research answered the following questions which were mapped to the constructs. They were adapted from
Colesca & Dobrica (2008) and Bulgerian E-readiness Assessment Model.
Ql: Do demographic factors affect perceived ease of use of E-voting System?
Qla: How does gender perception differ on the ease of use E-voting System?
Qlb: How does age influence the perception on the ease of use of E-voting System?
Qlc: What is the influence of education level on the ease of use of E-voting System?
Qld: How does prior use of internet influence ease of use of (readiness) E-voting?
Q2: Do demographic factors affect perceived trust of E-voting?
Q2a: How does gender perception differ on trust of E-voting readiness?
Q2b: How does age affect the perception on trust of E-voting readiness?
Q2c: What is the influence of education on the perception on trust of E-voting?
39
Q2d: How does prior use of internet influence perception on the trust for E-voting?
Q3: Do demographic factors affect perceived convenience of E-voting?
Q3a: How does gender perception differ on convenience of E-voting readiness?
Q3b: How does age affect the perception on convenience of E-voting readiness?
Q3c: What is the influence of education on the perception of convenience E-voting?
Q3d: How does prior use of internet influence perception on the convenience for E-voting?
Q4: Do demographic factors affect awareness of E-Voting?
Q4a: How does gender perception differ on awareness of E-voting readiness?
Q4b: How does age affect the perception on awareness of E-voting readiness?
Q4c: What is the influence of education on the perception of awareness E-voting?
Q4d: How does prior use of internet influence perception on the awareness for E-voting?
Q5: How does perceived convenience of use of E-voting System influence perceived ease of use of E-voting
System?
Q6: How does perceived trust while using E-Voting system influence the satisfaction in the use of E-voting
system?
Q7: How does ease of use while using E-voting influence user satisfaction?
Q8: How does user satisfaction influence E-voting Readiness?
Q9: What is the effect of awareness on the use of E-voting System?
Q10: What is the effect of perceived convenience on the use of E-voting system?
Q11: Does Political Support affect Readiness for e-voting?
Q1 la: How does political leadership affect E-voting readiness?
Q1 lb: How does political parties’ participation influence E-voting readiness?
Q1 lc: How do prior trials influence readiness for E-voting adoption?
Q11 d: What is the influence of political will on E-voting readiness?
Q12: Does Legal Acceptability affect Readiness for e-voting?
Q12a: Does constitution influence E-voting readiness?
Q12b: How does recognition of results influence E-voting readiness?
Q12c: How do arbitration of vote dispute influence readiness for E-voting adoption?
Q12d: What is the influence of durability of results on E-voting readiness?
Q13: What needs to be done to increase the level of E-Voting readiness in Nairobi County?
3.10 Factor AnalysisFactor analysis is a statistical approach that is used to analyze the interrelationships among a large number of
variables. It aims at explaining variables in terms of their common underlying dimensions. Factor analysis is a data
reduction technique that condenses the information contained in a number of original variables into smaller set of
dimensions with minimum loss of information. It therefore groups the given set of input variables into minimal
number factors with the maximum capability of extracting information with the reduced set of factors
40

f i , . J , n . « i t * l | /V l »-• » * «• : . * V j W « • . . f i . f V ' . » . J 4“ » « ►V/ ,1 V ,* iV r . *• I
, < twt;J sc Ki#'«. It is applicable when there is systematic interdependence among a set of observed variables and
l he common methods of Factor Analy .i(>
> i'ii it* ipal < imiponent Method
f.m ) iftt Maximum likelihood method.
the centroid Method maximizes the sum ot absolute loadings ot each tactor. in tins method, die ..n-,
terms in the linear composite of each factor will be either+1 or-1. It disregards the signs (Fanneerselvu.i, *1X3,\ *1i r j | ' - * / » / > r \ - < n * * ' ' < 1 * * i - tM __ 1 ___ I I . ,< . -
• * * / ' ‘ 1 fc. v d t U t i I I e i u i c o w l i j t> C U l f U C i J U A A i U I/ U U l t V l t V b O l/ l / p iC l
T. -UUms. I he Principal Component Method maximizes the sum of squares of loadings of each identified factor,
it is a j*«ptr(ar technique which determines loadings of variables on different factors bv usinc the standard normal
values of the observations of the original (input) variables signs (Panneerselvam, 2006; and Kothari, 200<») lli.:
weights in the principal components are chosen such that the following requirements are met:
(i) The variances of principal components (eigenvalues) are in the decreasing order from the principal
component - I to the principal component - n.
(ii) l ne vaiues of the factor loadings of the principal components me uiicuucutcuL
(iii) The sum of the squares of the weights used in principal component is equal to 1.
Maximum Likelihood method consists of obtaining sets of factor loadings successively in such a way that each
explains as much as possible of the population correlation matrix as estimated from the sample correlation matrix.
This method is complex hence not commonly used.
3.10.1 Formula used for Computing E-Voting Readiness
Once data was collected on each of the indicators across the four different categories, each indicator was given a
score based on a scale of 1 to 4 with 1 representing the state of unpreparedness while 4 represents full e-voting
readiness status. The score is arrived at by comparing the indicator data against the set of predetermined factors
defining the characteristics of each stage of ICT development.
E-voting readinessj = Zj=i-n e /n
E-voting readiness - Overal e-voting readiness value
i - Organization; j - Each of the indicators•»
eij - Individual score for each indicator on a scale of 1 to 4; n - Total number of measures.
41

CHAPTER FOUR DATA COLLECTION AND ANALYSIS
Data collection took place in January and February 2011. It was collected by targeting voters in Nairobi County in
the eight constituencies. Data was also collected from voters in all the eight constituencies.
The process targeted Nairobi County since it has stratified sample population. 320 questionnaires were set out. 203
valid responses were received. This represented a response rate of 63.4%.
4.1 Reliability
Reliability analysis on the questionnaire using the data from the field was performed using Cronbach’s alpha. The
results of the reliability are presented in the table below. As shown, the reliability analysis gives an alpha coefficient
of 0.8937. This exceeds 0.70 which is the lower limit of the acceptable reliability coefficient. This justifies that
questionnaire have high reliability.
Reliability Coefficient N of cases = 79
Alpha = 0.8937
n = 3 4
4.2 Factor Analysis
The 34 test items testing factors that influence e-voting readiness were subjected to principal component analysis
(method for Factor Analysis) using SPSS. Evaluation of the correlation matrix showed that most facts have
coefficients of 0.3 and above.
Kaiser-Meyer-Olkin (KMO) value 0.8688 which is greater than a significant value of 0.0000. The KMO values
indicate that Factor Analysis can be used to validate the test items under respective constructs.
KMO Measure of Sampling Adequacy Approx. Chi-Square = 0.8688
Bartlett’s Test of Sphericity DF = 145
Significance = .0000
Table 7: KMO and Bertlett's Test on Field Data
The Eigenvalues associated with each factor before extraction, after extraction and after extraction were generated.
Before extraction, SPSS identified 34 components within the data set. Component illustrates that all factors with
eigenvalues greater than 1 are considered. Eigenvalues associated with these values are again displayed.
The data collected during the research was divided into two sections. The first section presented the E-voting
readiness of voters in each constituency of Nairobi County. The second section contains results of adoption of e-
voting system in the County. Each section concludes with a summary of results. All questionnaires were subjected to
voters in Nairobi County.
42
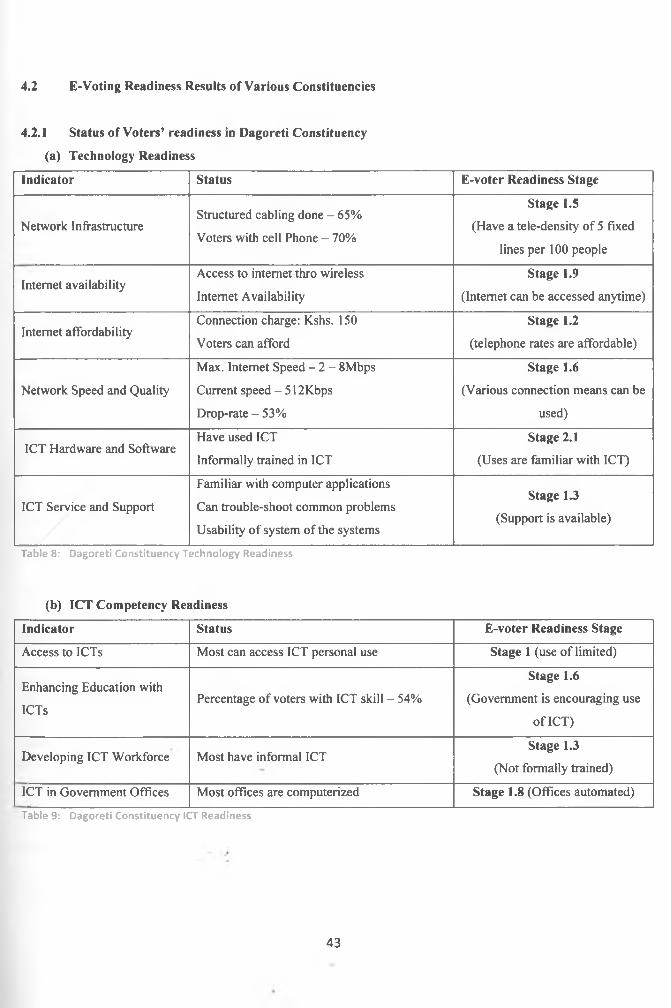
4.2 E-Voting Readiness Results of Various Constituencies
4.2.1 Status of Voters’ readiness in Dagoreti Constituency
(a) Technology Readiness
Indicator Status E-voter Readiness Stage
Network InfrastructureStructured cabling done - 65%
Voters with cell Phone - 70%
Stage 1.5
(Have a tele-density of 5 fixed
lines per 100 people
Internet availabilityAccess to internet thro wireless
Internet Availability
Stage 1.9
(Internet can be accessed anytime)
Internet affordabilityConnection charge: Kshs. 150
Voters can afford
Stage 1.2
(telephone rates are affordable)
Network Speed and Quality
Max. Internet Speed - 2 - 8Mbps
Current speed - 512Kbps
Drop-rate - 53%
Stage 1.6
(Various connection means can be
used)
ICT Hardware and SoftwareHave used ICT
Informally trained in ICT
Stage 2.1
(Uses are familiar with ICT)
ICT Service and Support
Familiar with computer applications
Can trouble-shoot common problems
Usability of system of the systems
Stage 1.3
(Support is available)
Table 8: Dagoreti Constituency Technology Readiness
(b) 1CT Competency Readiness
Indicator Status E-voter Readiness Stage
Access to ICTs Most can access ICT personal use Stage 1 (use of limited)
Enhancing Education with
ICTsPercentage of voters with ICT skill - 54%
Stage 1.6
(Government is encouraging use
of ICT)
Developing ICT Workforce Most have informal ICTStage 1.3
(Not formally trained)
ICT in Government Offices Most offices are computerized Stage 1.8 (Offices automated)
Table 9: Dagoreti Constituency ICT Readiness
43
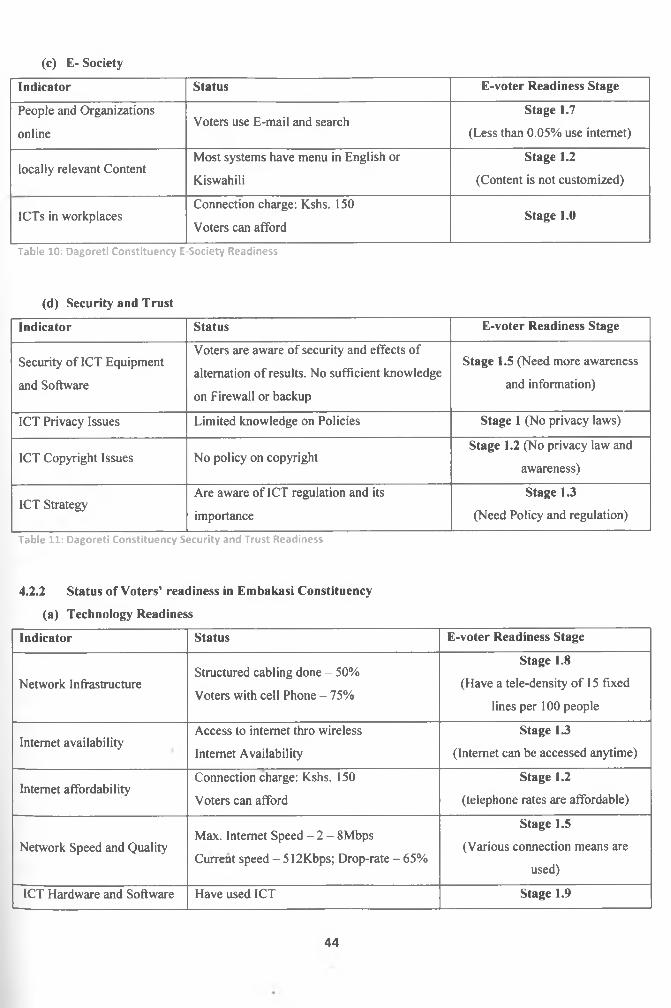
(c) E- Society
Indicator Status E-voter Readiness Stage
People and Organizations
onlineVoters use E-mail and search
Stage 1.7
(Less than 0.05% use internet)
locally relevant ContentMost systems have menu in English or
Kiswahili
Stage 1.2
(Content is not customized)
ICTs in workplacesConnection charge: Kshs. 150
Voters can affordStage 1.0
Table 10: Dagoreti Constituency E-Society Readiness
(d) Security and Trust
Indicator Status E-voter Readiness Stage
Security of ICT Equipment
and Software
Voters are aware of security and effects of
alternation of results. No sufficient knowledge
on Firewall or backup
Stage 1.5 (Need more awareness
and information)
ICT Privacy Issues Limited knowledge on Policies Stage 1 (No privacy laws)
ICT Copyright Issues No policy on copyrightStage 1.2 (No privacy law and
awareness)
ICT StrategyAre aware of ICT regulation and its
importance
Stage 1.3
(Need Policy and regulation)
Table 11: Dagoreti Constituency Security and Trust Readiness
4.2.2 Status of Voters’ readiness in Embakasi Constituency
(a) Technology Readiness
Indicator Status E-voter Readiness Stage
Network InfrastructureStructured cabling done - 50%
Voters with cell Phone - 75%
Stage 1.8
(Have a tele-density of 15 fixed
lines per 100 people
Internet availabilityAccess to internet thro wireless
Internet Availability
Stage 1.3
(Internet can be accessed anytime)
Internet affordabilityConnection charge: Kshs. 150
Voters can afford
Stage 1.2
(telephone rates are affordable)
Network Speed and QualityMax. Internet Speed - 2 - 8Mbps
Current speed - 512Kbps; Drop-rate - 65%
Stage 1.5
(Various connection means are
used)
ICT Hardware and Software Have used ICT Stage 1.9
44
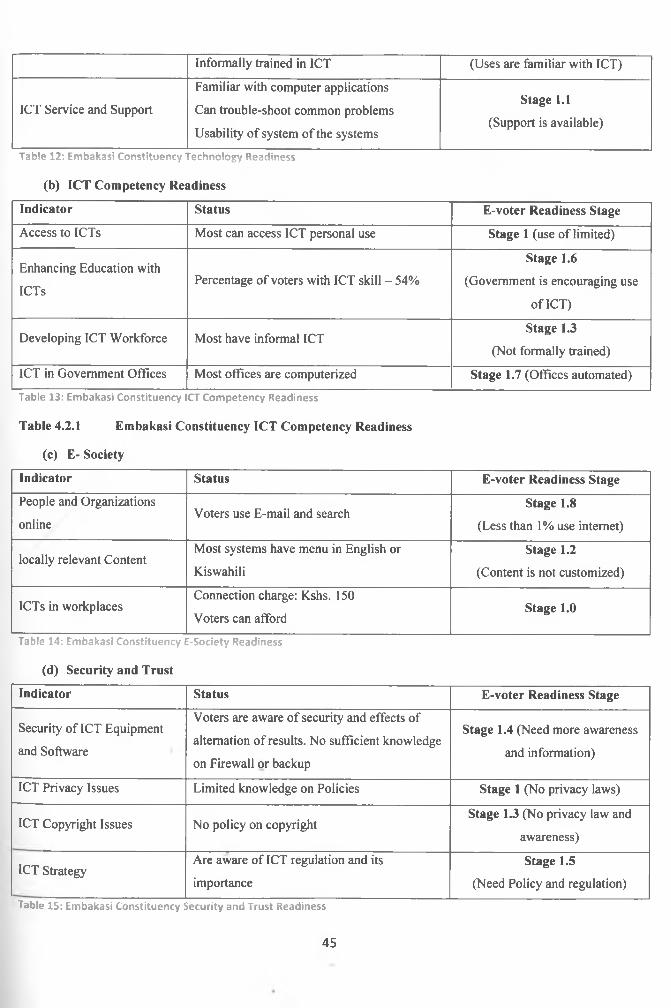
Informally trained in ICT (Uses are familiar with ICT)
ICT Service and Support
Familiar with computer applications
Can trouble-shoot common problems
Usability of system of the systems
Stage 1.1
(Support is available)
Table 12: Embakasi Constituency Technology Readiness
(b) ICT Competency Readiness
Indicator Status E-voter Readiness Stage
Access to ICTs Most can access ICT personal use Stage 1 (use of limited)
Enhancing Education with
ICTsPercentage of voters with ICT skill - 54%
Stage 1.6
(Government is encouraging use
of ICT)
Developing ICT Workforce Most have informal ICTStage 1.3
(Not formally trained)
ICT in Government Offices Most offices are computerized Stage 1.7 (Offices automated)
Table 13: Embakasi Constituency ICT Competency Readiness
Table 4.2.1 Embakasi Constituency ICT Competency Readiness
(c) E- Society
Indicator Status E-voter Readiness Stage
People and Organizations
onlineVoters use E-mail and search
Stage 1.8
(Less than 1% use internet)
locally relevant ContentMost systems have menu in English or
KiswahiliStage 1.2
(Content is not customized)
ICTs in workplacesConnection charge: Kshs. 150
Voters can affordStage 1.0
Table 14: Embakasi Constituency E-Society Readiness
(d) Security and Trust
Indicator Status E-voter Readiness Stage
Security of ICT Equipment
and Software
Voters are aware of security and effects of
alternation of results. No sufficient knowledge
on Firewall or backup
Stage 1.4 (Need more awareness
and information)
ICT Privacy Issues Limited knowledge on Policies Stage 1 (No privacy laws)
ICT Copyright Issues No policy on copyrightStage 1.3 (No privacy law and
awareness)
ICT StrategyAre aware of ICT regulation and its
importance
Stage 1.5
(Need Policy and regulation)
Table 15: Embakasi Constituency Security and Trust Readiness
45
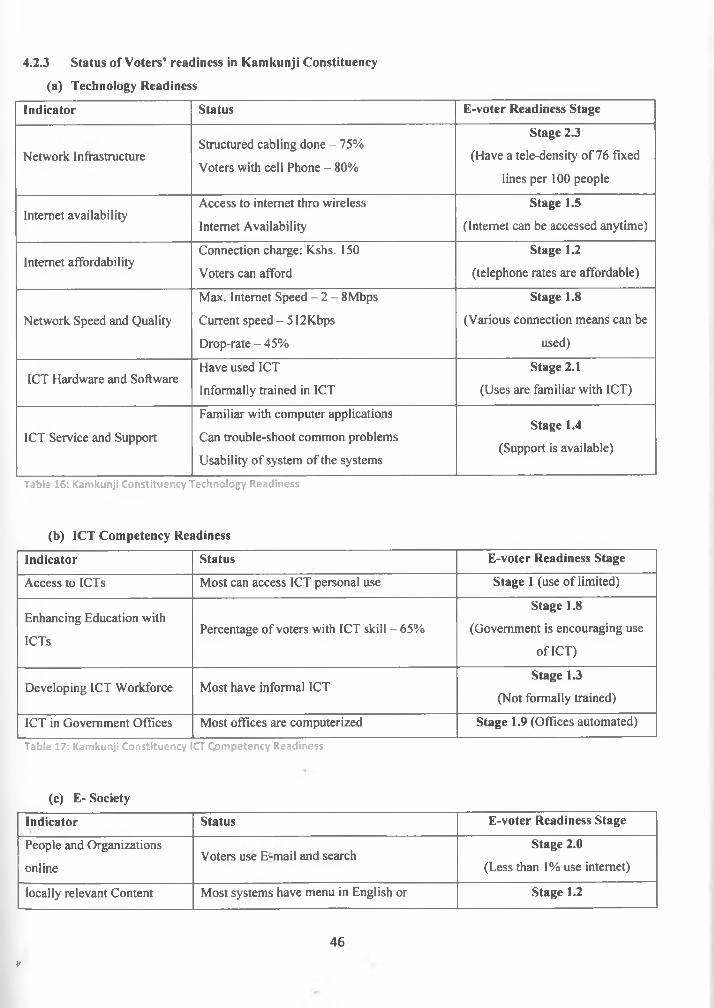
4.2.3 Status of Voters’ readiness in Kamkunji Constituency
(a) Technology Readiness
Indicator Status E-voter Readiness Stage
Network InfrastructureStructured cabling done - 75%
Voters with cell Phone - 80%
Stage 2.3
(Have a tele-density of 76 fixed
lines per 100 people
Internet availabilityAccess to internet thro wireless
Internet Availability
Stage 1.5
(Internet can be accessed anytime)
Internet affordabilityConnection charge: Kshs. 150
Voters can afford
Stage 1.2
(telephone rates are affordable)
Network Speed and Quality
Max. Internet Speed - 2 - 8Mbps
Current speed - 512Kbps
Drop-rate - 45%
Stage 1.8
(Various connection means can be
used)
ICT Hardware and SoftwareHave used ICT
Informally trained in ICT
Stage 2.1
(Uses are familiar with ICT)
ICT Service and Support
Familiar with computer applications
Can trouble-shoot common problems
Usability of system of the systems
Stage 1.4
(Support is available)
Table 16: Kamkunji Constituency Technology Readiness
(b) ICT Competency Readiness
Indicator Status E-voter Readiness Stage
Access to ICTs Most can access ICT personal use Stage 1 (use of limited)
Enhancing Education with
ICTsPercentage of voters with ICT skill - 65%
Stage 1.8
(Government is encouraging use
of ICT)
Developing ICT Workforce Most have informal ICTStage 1.3
(Not formally trained)
ICT in Government Offices Most offices are computerized Stage 1.9 (Offices automated)
Table 17: Kamkunji Constituency ICT Competency Readiness
(c) E- Society
Indicator Status E-voter Readiness Stage
People and Organizations
onlineVoters use E-mail and search
Stage 2.0
(Less than 1% use internet)
locally relevant Content Most systems have menu in English or Stage 1.2
46v
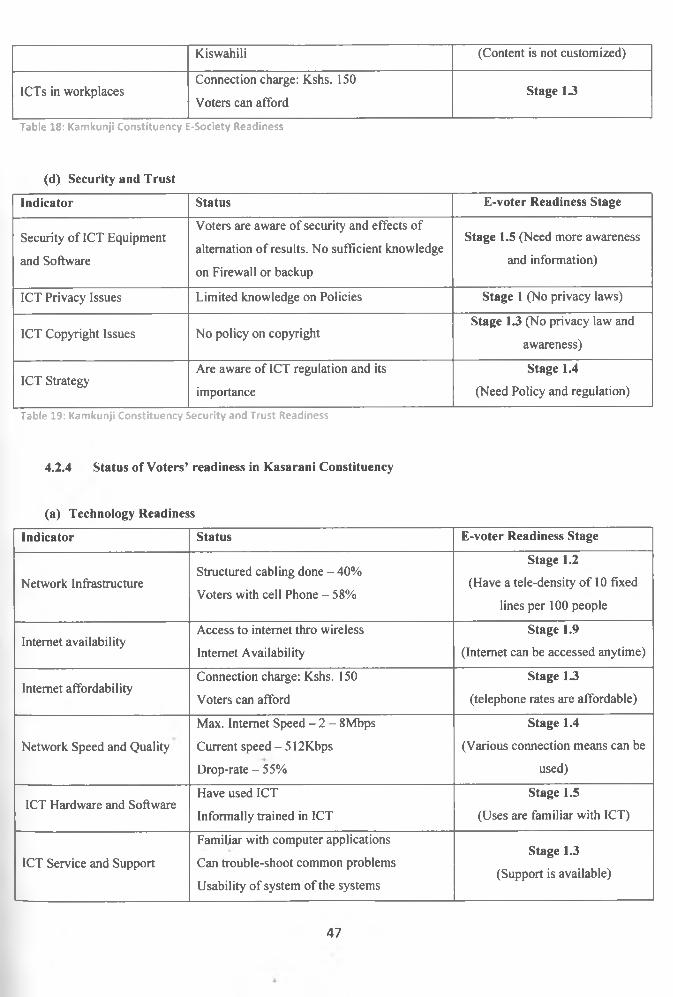
Kiswahili (Content is not customized)
ICTs in workplacesConnection charge: Kshs. 150
Voters can affordStage 13
Table 18: Kamkunji Constituency E-Society Readiness
(d) Security and Trust
Indicator Status E-voter Readiness Stage
Security of ICT Equipment
and Software
Voters are aware of security and effects of
alternation of results. No sufficient knowledge
on Firewall or backup
Stage 1.5 (Need more awareness
and information)
ICT Privacy Issues Limited knowledge on Policies Stage 1 (No privacy laws)
ICT Copyright Issues No policy on copyrightStage 1.3 (No privacy law and
awareness)
ICT StrategyAre aware of ICT regulation and its
importance
Stage 1.4
(Need Policy and regulation)
Table 19: Kamkunji Constituency Security and Trust Readiness
4.2.4 Status of Voters’ readiness in Kasarani Constituency
(a) Technology Readiness
Indicator Status E-voter Readiness Stage
Network InfrastructureStructured cabling done - 40%
Voters with cell Phone - 58%
Stage 1.2
(Have a tele-density of 10 fixed
lines per 100 people
Internet availabilityAccess to internet thro wireless
Internet Availability
Stage 1.9
(Internet can be accessed anytime)
Internet affordabilityConnection charge: Kshs. 150
Voters can afford
Stage 1.3
(telephone rates are affordable)
Network Speed and Quality
Max. Internet Speed - 2 - 8Mbps
Current speed - 512Kbps
Drop-rate - 55%
Stage 1.4
(Various connection means can be
used)
ICT Hardware and SoftwareHave used ICT
Informally trained in ICT
Stage 1.5
(Uses are familiar with ICT)
ICT Service and Support
Familiar with computer applications
Can trouble-shoot common problems
Usability of system of the systems
Stage 1.3
(Support is available)
47
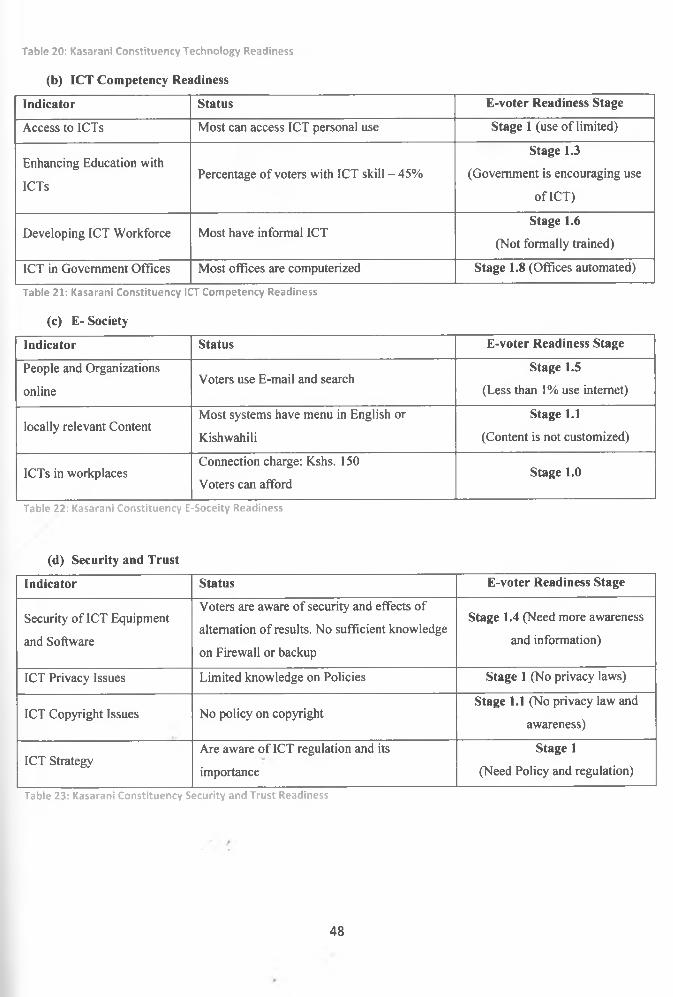
Table 20: Kasarani Constituency Technology Readiness
(b) ICT Competency Readiness
Indicator Status E-voter Readiness Stage
Access to ICTs Most can access ICT personal use Stage 1 (use of limited)
Enhancing Education with
ICTsPercentage of voters with ICT skill - 45%
Stage 1.3
(Government is encouraging use
of ICT)
Developing ICT Workforce Most have informal ICTStage 1.6
(Not formally trained)
ICT in Government Offices Most offices are computerized Stage 1.8 (Offices automated)
Table 21: Kasarani Constituency ICT Competency Readiness
(c) E- Society
Indicator Status E-voter Readiness Stage
People and Organizations
onlineVoters use E-mail and search
Stage 1.5
(Less than 1% use internet)
locally relevant ContentMost systems have menu in English or
Kishwahili
Stage 1.1
(Content is not customized)
ICTs in workplacesConnection charge: Kshs. 150
Voters can affordStage 1.0
Table 22: Kasarani Constituency E-Soceity Readiness
(d) Security and Trust
Indicator Status E-voter Readiness Stage
Security of ICT Equipment
and Software
Voters are aware of security and effects of
alternation of results. No sufficient knowledge
on Firewall or backup
Stage 1.4 (Need more awareness
and information)
ICT Privacy Issues Limited knowledge on Policies Stage 1 (No privacy laws)
ICT Copyright Issues No policy on copyrightStage 1.1 (No privacy law and
awareness)
ICT StrategyAre aware of ICT regulation and its
importance
Stage 1
(Need Policy and regulation)
Table 23: Kasarani Constituency Security and Trust Readiness
48

4.2.5 Status of Voters’ readiness in Langata Constituency
(a) Technology Readiness
Indicator Status E-voter Readiness Stage
Network InfrastructureStructured cabling done - 65%
Voters with cell Phone - 75%
Stage 2.4
(Have a tele-density of 35 fixed
lines per 100 people
Internet availabilityAccess to internet thro wireless
Internet Availability
Stage 1.5
(Internet can be accessed anytime)
Internet affordabilityConnection charge: Kshs. 150
Voters can afford
Stage 1.6
(telephone rates are affordable)
Network Speed and Quality
Max. Internet Speed - 2 - 8Mbps
Current speed - 512Kbps
Drop-rate - 40%
Stage 1.8
(Various connection means can be
used)
ICT Hardware and SoftwareHave used ICT
Informally trained in ICT
Stage 1.6
(Uses are familiar with ICT)
ICT Service and Support
Familiar with computer applications
Can trouble-shoot common problems
Usability of system of the systems
Stage 1.1
(Support is available)
Table 24: Langata Constituency Technology Readiness
(b) ICT Competency Readiness
Indicator Status E-voter Readiness Stage
Access to ICTs Most can access ICT personal use Stage 1 (use of limited)
Enhancing Education with
ICTsPercentage of voters with ICT skill - 60%
Stage 1.4
(Government is encouraging use
of ICT)
Developing ICT Workforce Most have informal ICTStage 1.3
(Not formally trained)
ICT in Government Offices Most offices are computerized Stage 1.7 (Offices automated)
Table 25: Langata Constituency ICT Competency Readiness
(c) E- Society
Indicator Status E-voter Readiness Stage
People and Organizations
onlineVoter's use E-mail and search
Stage 2
(15% use internet)
locally relevant Content Most systems have menu in English or Stage 1.2
49
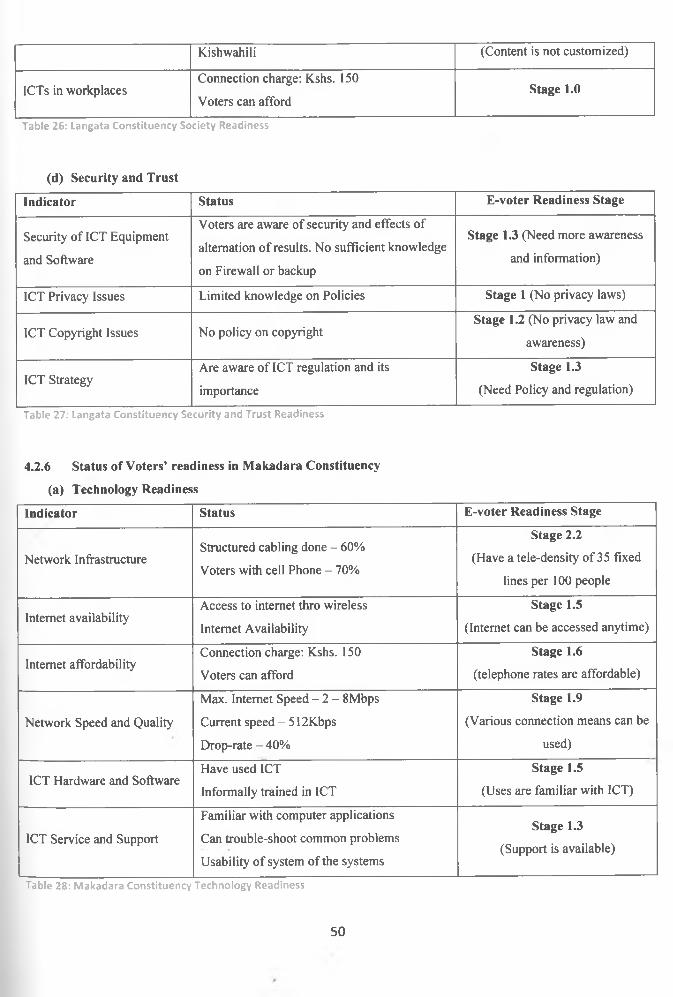
Kishwahili (Content is not customized)
ICTs in workplacesConnection charge: Kshs. 150
Voters can affordStage 1.0
Table 26: Langata Constituency Society Readiness
(d) Security and Trust
Indicator Status E-voter Readiness Stage
Security of ICT Equipment
and Software
Voters are aware of security and effects of
alternation of results. No sufficient knowledge
on Firewall or backup
Stage 1.3 (Need more awareness
and information)
ICT Privacy Issues Limited knowledge on Policies Stage 1 (No privacy laws)
ICT Copyright Issues No policy on copyrightStage 1.2 (No privacy law and
awareness)
ICT StrategyAre aware of ICT regulation and its
importance
Stage 1.3
(Need Policy and regulation)
Table 27: Langata Constituency Security and Trust Readiness
4.2.6 Status of Voters’ readiness in Makadara Constituency
(a) Technology Readiness
Indicator Status E-voter Readiness Stage
Network InfrastructureStructured cabling done - 60%
Voters with cell Phone - 70%
Stage 2.2
(Have a tele-density of 35 fixed
lines per 100 people
Internet availabilityAccess to internet thro wireless
Internet Availability
Stage 1.5
(Internet can be accessed anytime)
Internet affordabilityConnection charge: Kshs. 150
Voters can afford
Stage 1.6
(telephone rates are affordable)
Network Speed and Quality
Max. Internet Speed - 2 - 8Mbps
Current speed - 512Kbps
Drop-rate - 40%
Stage 1.9
(Various connection means can be
used)
ICT Hardware and SoftwareHave used ICT
Informally trained in ICT
Stage 1.5
(Uses are familiar with ICT)
ICT Service and Support
Familiar with computer applications
Can trouble-shoot common problems
Usability of system of the systems
Stage 1.3
(Support is available)
Table 28: Makadara Constituency Technology Readiness
50

(b) ICT Competency Readiness
Indicator Status E-voter Readiness Stage
Access to ICTs Most can access ICT personal use Stage 1 (use of limited)
Enhancing Education with
ICTsPercentage of voters with ICT skill - 60%
Stage 1.2
(Government is encouraging use
of ICT)
Developing ICT Workforce Most have informal ICTStage 1.7
(Not formally trained)
ICT in Government Offices Most offices are computerized Stage 1.7 (Offices automated)
Table 29: Makadara Constituency ICT Competency Readiness
(c) E- Society
Indicator Status E-voter Readiness Stage
People and Organizations
onlineVoters use E-mail and search
Stage 2.4
(15% use internet)
locally relevant ContentMost systems have menu in English or
Kishwahili
Stage 1.6
(Content is not customized)
ICTs in workplacesConnection charge: Kshs. 150
Voters can affordStage 1.3
Table 30: Makadara Constituency E-Society Readiness
(d) Security and Trust
Indicator Status E-voter Readiness Stage
Security of ICT Equipment
and Software
Voters are aware of security and effects of
alternation of results. No sufficient knowledge
on Firewall or backup
Stage 1.4 (Need more awareness
and information)
ICT Privacy Issues Limited knowledge on Policies Stage 1.2 (No privacy laws)
ICT Copyright Issues No policy on copyrightStage 1.4 (No privacy law and
awareness)
ICT StrategyAre aware of ICT regulation and its
importance
Stage 1.5
(Need Policy and regulation)
Table 31: Makadara Constituency Security and Trust Readiness
51
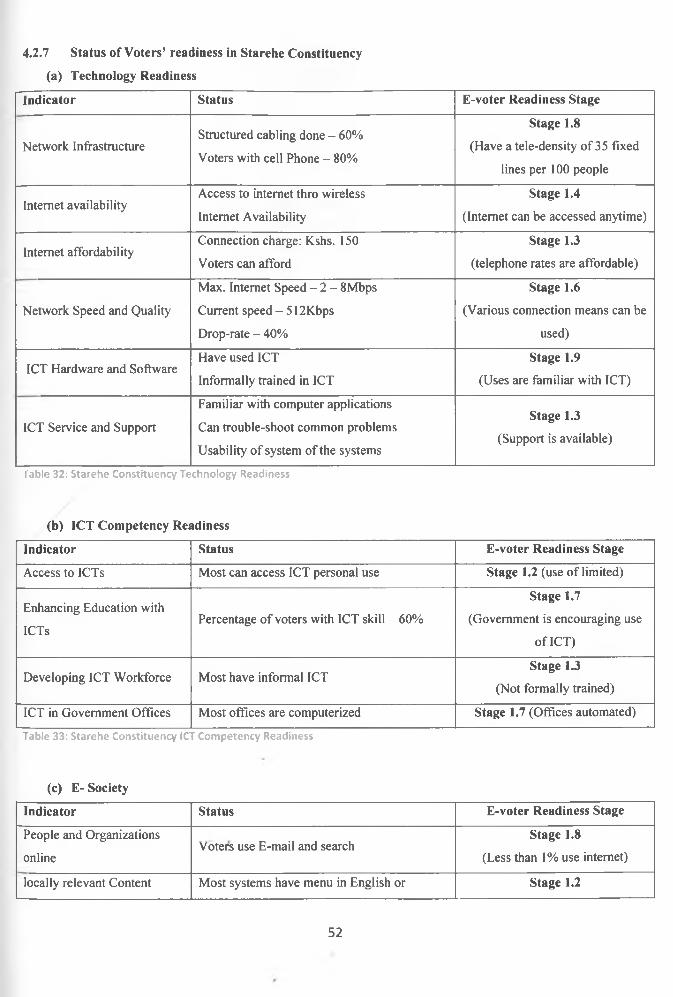
4.2.7 Status of Voters’ readiness in Starehe Constituency
(a) Technology Readiness
Indicator Status E-voter Readiness Stage
Network InfrastructureStructured cabling done - 60%
Voters with cell Phone - 80%
Stage 1.8
(Have a tele-density of 35 fixed
lines per 100 people
Internet availabilityAccess to internet thro wireless
Internet Availability
Stage 1.4
(Internet can be accessed anytime)
Internet affordabilityConnection charge: Kshs. 150
Voters can afford
Stage 1.3
(telephone rates are affordable)
Network Speed and Quality
Max. Internet Speed - 2 - 8Mbps
Current speed - 512Kbps
Drop-rate - 40%
Stage 1.6
(Various connection means can be
used)
ICT Hardware and SoftwareHave used ICT
Informally trained in ICT
Stage 1.9
(Uses are familiar with ICT)
ICT Service and Support
Familiar with computer applications
Can trouble-shoot common problems
Usability of system of the systems
Stage 1.3
(Support is available)
Table 32: Starehe Constituency Technology Readiness
(b) ICT Competency Readiness
Indicator Status E-voter Readiness Stage
Access to ICTs Most can access ICT personal use Stage 1.2 (use of limited)
Enhancing Education with
ICTsPercentage of voters with ICT skill - 60%
Stage 1.7
(Government is encouraging use
of ICT)
Developing ICT Workforce Most have informal ICTStage 1.3
(Not formally trained)
ICT in Government Offices Most offices are computerized Stage 1.7 (Offices automated)
Table 33: Starehe Constituency ICT Competency Readiness
(c) E- Society
Indicator Status E-voter Readiness Stage
People and Organizations
onlineVoters use E-mail and search
Stage 1.8
(Less than 1% use internet)
locally relevant Content Most systems have menu in English or Stage 1.2
52
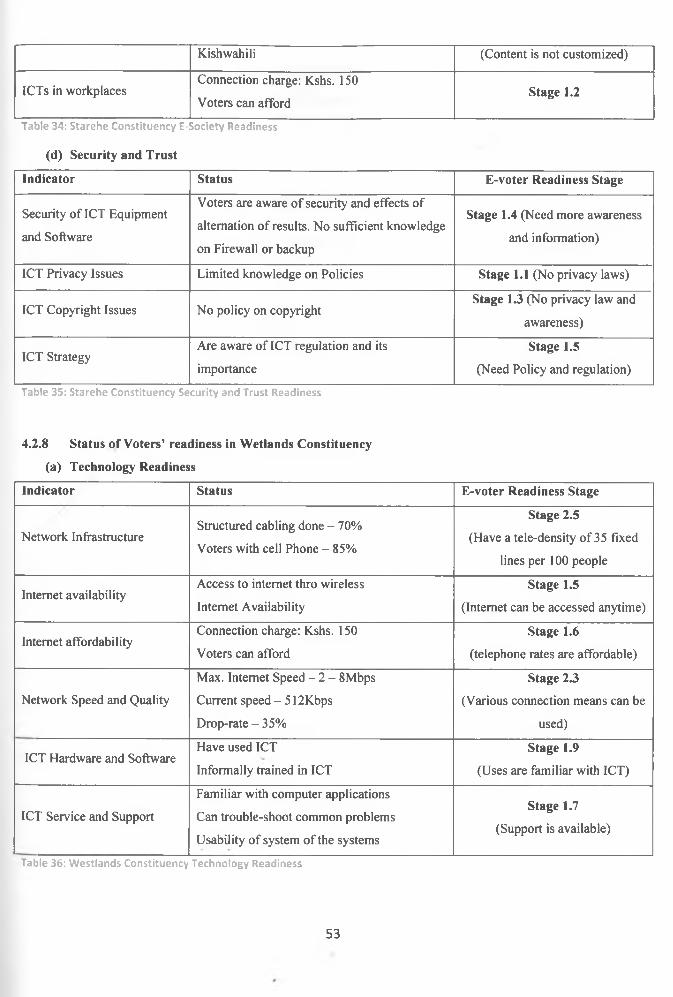
Kishwahili (Content is not customized)
ICTs in workplacesConnection charge: Kshs. 150
Voters can affordStage 1.2
Table 34: Starehe Constituency E-Society Readiness
(d) Security and Trust
Indicator Status E-voter Readiness Stage
Security of ICT Equipment
and Software
Voters are aware of security and effects of
alternation of results. No sufficient knowledge
on Firewall or backup
Stage 1.4 (Need more awareness
and information)
ICT Privacy Issues Limited knowledge on Policies Stage 1.1 (No privacy laws)
ICT Copyright Issues No policy on copyrightStage 1.3 (No privacy law and
awareness)
ICT StrategyAre aware of ICT regulation and its
importance
Stage 1.5
(Need Policy and regulation)
Table 35: Starehe Constituency Security and Trust Readiness
4.2.8 Status of Voters’ readiness in Wetlands Constituency
(a) Technology Readiness
Indicator Status E-voter Readiness Stage
Network InfrastructureStructured cabling done - 70%
Voters with cell Phone - 85%
Stage 2.5
(Have a tele-density of 35 fixed
lines per 100 people
Internet availabilityAccess to internet thro wireless
Internet Availability
Stage 1.5
(Internet can be accessed anytime)
Internet affordabilityConnection charge: Kshs. 150
Voters can afford
Stage 1.6
(telephone rates are affordable)
Network Speed and Quality
Max. Internet Speed - 2 - 8Mbps
Current speed - 512Kbps
Drop-rate - 35%
Stage 2.3
(Various connection means can be
used)
ICT Hardware and SoftwareHave used ICT
Informally trained in ICT
Stage 1.9
(Uses are familiar with ICT)
ICT Service and Support
Familiar with computer applications
Can trouble-shoot common problems
Usability of system of the systems
Stage 1.7
(Support is available)
Table 36: Westlands Constituency Technology Readiness
53
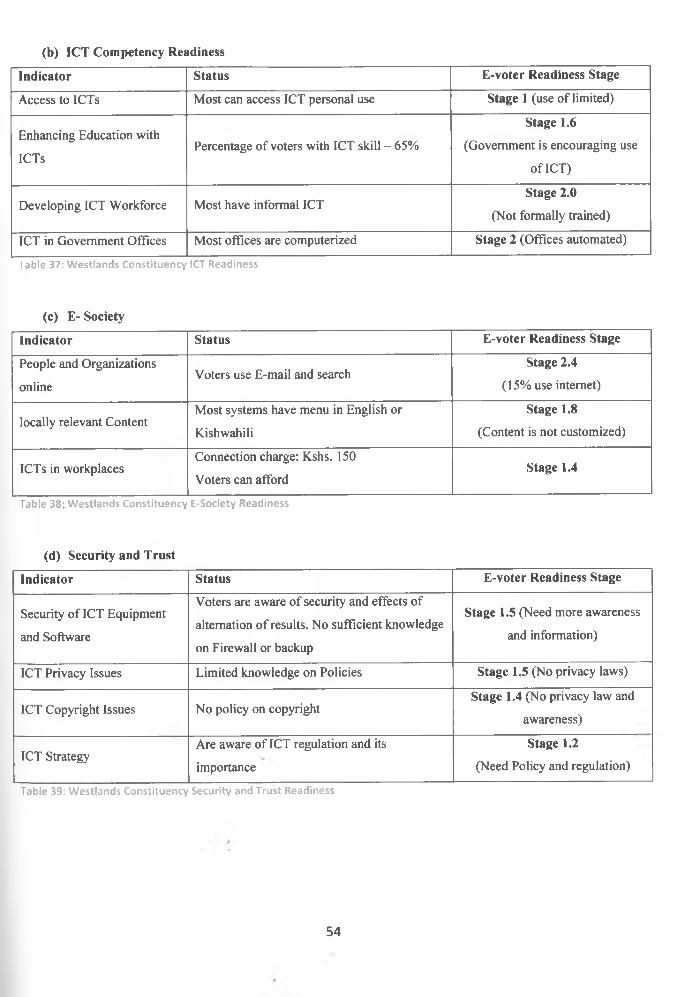
(b) ICT Competency Readiness
Indicator Status E-voter Readiness Stage
Access to ICTs Most can access ICT personal use Stage 1 (use of limited)
Enhancing Education with
ICTsPercentage of voters with ICT skill - 65%
Stage 1.6
(Government is encouraging use
of ICT)
Developing ICT Workforce Most have informal ICTStage 2.0
(Not formally trained)
ICT in Government Offices Most offices are computerized Stage 2 (Offices automated)
Table 37: Westlands Constituency ICT Readiness
(c) E- Society
Indicator Status E-voter Readiness Stage
People and Organizations
onlineVoters use E-mail and search
Stage 2.4
(15% use internet)
locally relevant ContentMost systems have menu in English or
Kishwahili
Stage 1.8
(Content is not customized)
ICTs in workplacesConnection charge: Kshs. 150
Voters can affordStage 1.4
Table 38; Westlands Constituency E-Society Readiness
(d) Security and Trust
Indicator Status E-voter Readiness Stage
Security of ICT Equipment
and Software
Voters are aware of security and effects of
alternation of results. No sufficient knowledge
on Firewall or backup
Stage 1.5 (Need more awareness
and information)
ICT Privacy Issues Limited knowledge on Policies Stage 1.5 (No privacy laws)
ICT Copyright Issues No policy on copyrightStage 1.4 (No privacy law and
awareness)
ICT StrategyAre aware of ICT regulation and its
importance
Stage 1.2
(Need Policy and regulation)
Table 39: Westlands Constituency Security and Trust Readiness
54

4.3 Survey Results
The survey included 14 questions and 1 field for general suggestions if a respondent had any. We had a target of 320
respondents in eight constituencies in Nairobi. We received 223 completed questionnaires. 20 respondents did not
answer question about gender, education level or their constituency. These questionnaires were excluded during the
process of vindication.
18-24 2 5 -3 4 3 5 -5 0 Above 50 Total
Male 34 24 20 10 88
Female 39 34 26 16 115
Total 73 58 46 26 203
Table 40: Gender and Age group
Gender and Age Group
4540353025201510
50
il.l .1 ■ 1 ■ 1 1■ 1 1 1■ 1 1 ■ 11 ■ 1 ■ 1 ■ 1
18 -24 2 5 -3 4 3 5 -5 0 Above 50
■ Male ■ Female
Figure 8: Comparison of Gender and Age Group
According to table 40 above, there were 88 male and 115 female who participated in the survey. Graphically the
above can be represented as follows:
55

Table 42 shows that people who participated in our survey had mixed education level. Most of the respondents
turned to be either having secondary or basic education.
Constituency Male Female
Dagoreti 6 10
Embakasi 10 12
Kamkunji 13 17
Kasarani 7 9
Langata 16 23
Makadara 10 13
Starehe 12 14
Westlands 14 17
Total 88 115
Table 41: Gender distribution in different constituencies in Nairobi County
Age of Respondents Basic Secondary College University
18-24Male 2 10 12 10
Female 8 7 10 14
25-34Male 4 10 8 2
FemaleA 10 10 10 4
35-50Male J 9 3 1
Female 9 12 4 1
Above 50Male 4 5 1 0
Female 8 4 3 1
Total 52 67 51 33
Table 42: Gender participation from various constituencies of Nairobi County
56
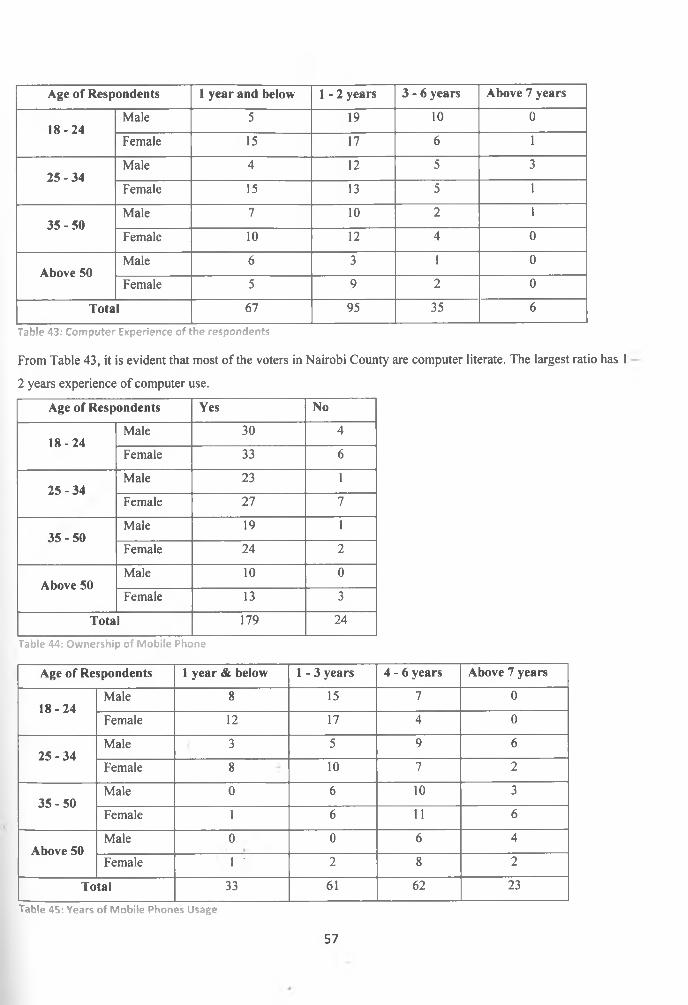
Age of Respondents 1 year and below 1 -2 years 3 - 6 years Above 7 years
18-24Male 5 19 10 0
Female 15 17 6 1
25-34Male 4 12 5 3
Female 15 13 5 1
35-50Male 7 10 2 1
Female 10 12 4 0
Above 50Male 6 3 1 0
Female 5 9 2 0
Total 67 95 35 6
Table 43: Computer Experience of the respondents
From Table 43, it is evident that most of the voters in Nairobi County are computer literate. The largest ratio has 1
2 years experience of computer use.
Age of Respondents Yes No
18-24Male 30 4
Female 33 6
25-34Male 23 1
Female 27 7
35-50Male 19 1
Female 24 2
Above 50Male 10 0
Female 13 3
Total 179 24
Table 44: Ownership of Mobile Phone
Age of Respondents 1 year & below 1 -3 years 4 - 6 years Above 7 years
18-24Male 8 15 7 0
Female 12 17 4 0
25-34Male 3 5 9 6
Female 8 10 7 2
35-50Male 0 6 10 3
Female 1 6 11 6
Above 50Male 0 0 6 4
Female 1 ' 2 8 2
Total 33 61 62 23
Table 45: Years of Mobile Phones Usage
57
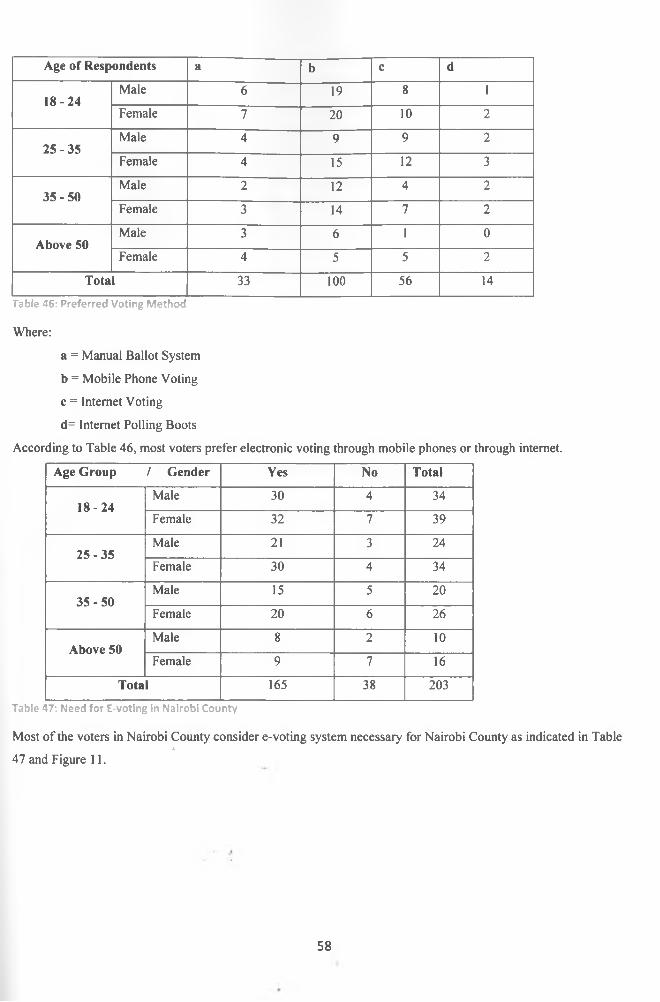
Age of Respondents a b c d
18-24Male 6 19 8 1
Female 7 20 10 2
25-35Male 4 9 9 2
Female 4 15 12 3
35-50Male 2 12 4 2
Female 3 14 7 2
Above 50Male 3 6 1 0
Female 4 5 5 2
Total 33 100 56 14
Table 46: Preferred Voting Method
Where:
a = Manual Ballot System
b = Mobile Phone Voting
c = Internet Voting
d= Internet Polling Boots
According to Table 46, most voters prefer electronic voting through mobile phones or through internet.
Age Group / Gender Yes No Total
18-24Male 30 4 34
Female 32 7 39
25-35Male 21 3 24
Female 30 4 34
35-50Male 15 5 20
Female 20 6 26
Above 50Male 8 2 10
Female 9 7 16
Total 165 38 203
Table 47: Need for E-voting in Nairobi County
Most of the voters in Nairobi County consider e-voting system necessary for Nairobi County as indicated in Tablea
47 and Figure 11.
58
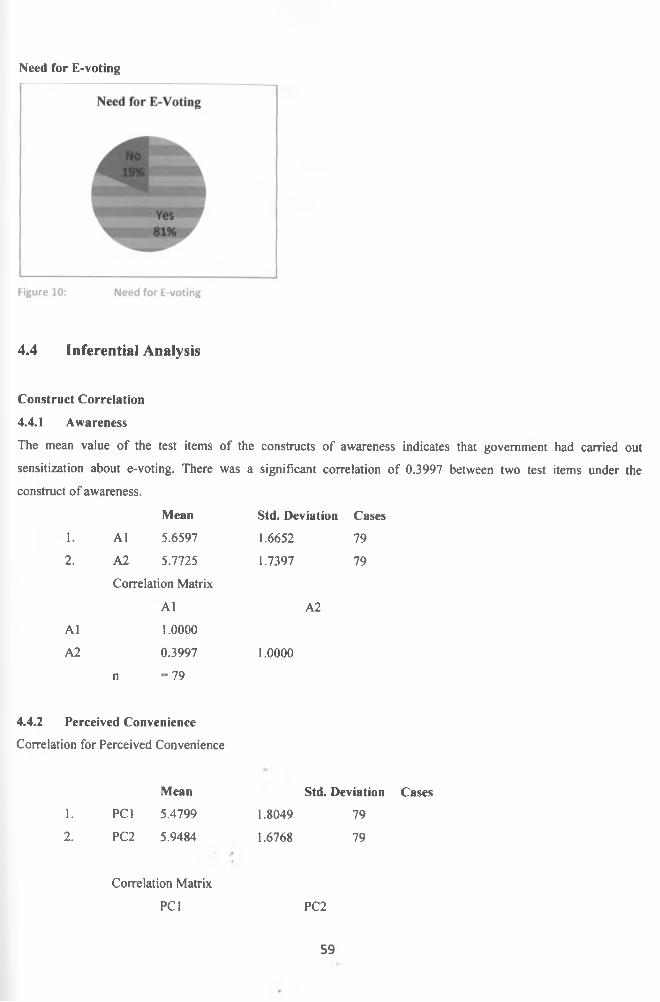
Need for E-voting
4.4 Inferential Analysis
Construct Correlation
4.4.1 Awareness
The mean value of the test items of the constructs of awareness indicates that government had carried out
sensitization about e-voting. There was a significant correlation of 0.3997 between two test items under the
construct of awareness.
Mean Std. Deviation Cases
1. A1 5.6597 1.6652 79
2. A2 5.7725 1.7397 79
Correlation Matrix
A1 A2
A1 1.0000
A2 0.3997 1.0000
n =79
4.4.2 Perceived Convenience
Correlation for Perceived Convenience
Mean Std. Deviation Cases1. PCI 5.4799 1.8049 792. PC2 5.9484 1.6768 79
Correlation Matrix
PCI PC2
59
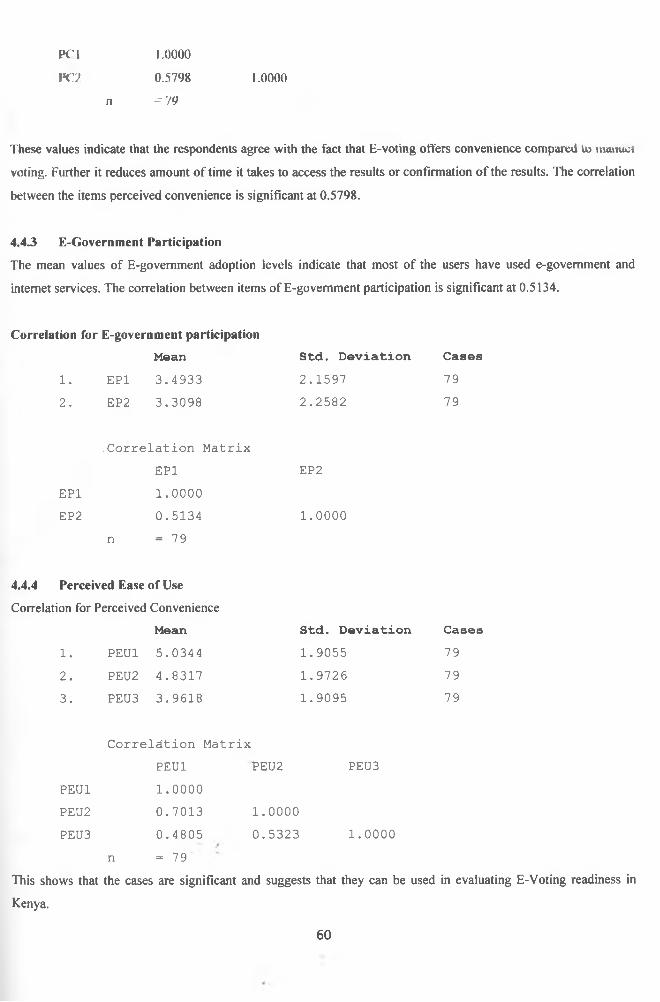
PCI 1.0000
VC) 0.5798 1.0000
n ='/9
These values indicate that the respondents agree with the fact that E-voting offers convenience compared to mnuuci
voting. Further it reduces amount of time it takes to access the results or confirmation of the results. The correlation
between the items perceived convenience is significant at 0.5798.
4.4.3 E-Government Participation
The mean values of E-govemment adoption levels indicate that most of the users have used e-govemment and
internet services. The correlation between items of E-govemment participation is significant at 0.5134.
Correlation for E-government participationM e a n S t d . D e v i a t i o n C a s e s
1. EP1 3.4933 2.1597 792. EP2 3.3098 2.2582 79
.Correlation MatrixEP1 EP2
EP1 1 .0000
EP2 0.5134 1 .0000
n = 79
4.4.4 Perceived Ease of Use
Correlation for Perceived ConvenienceM e a n S t d . D e v i a t i o n C a s e s
1. PEU1 5.0344 1.9055 792. PEU2 4.8317 1.9726 793. PEU3 3.9618 1.9095 79
Correlation MatrixPEU1 PEU2 PEU3
PEU1 1.0000PEU2 0.7013 1.0000PEU3 0.4805 0.5323 1.0000
n = 79This shows that the cases are significant and suggests that they can be used in evaluating E-Voting readiness in
Kenya.
60
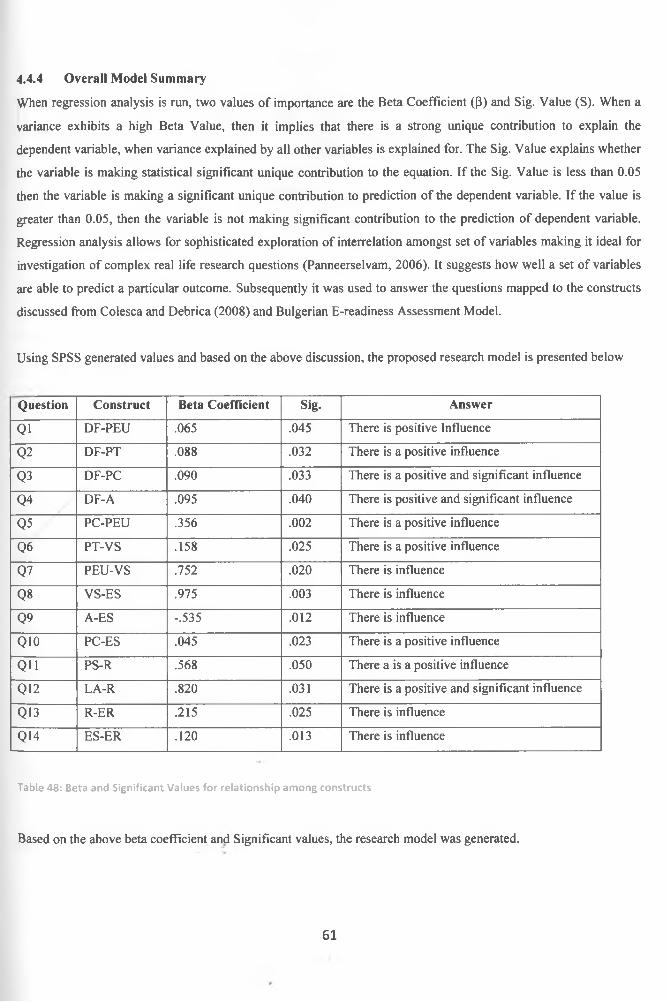
4.4.4 Overall Model Summary
When regression analysis is run, two values of importance are the Beta Coefficient (P) and Sig. Value (S). When a
variance exhibits a high Beta Value, then it implies that there is a strong unique contribution to explain the
dependent variable, when variance explained by all other variables is explained for. The Sig. Value explains whether
the variable is making statistical significant unique contribution to the equation. If the Sig. Value is less than 0.05
then the variable is making a significant unique contribution to prediction of the dependent variable. If the value is
greater than 0.05, then the variable is not making significant contribution to the prediction of dependent variable.
Regression analysis allows for sophisticated exploration of interrelation amongst set of variables making it ideal for
investigation of complex real life research questions (Panneerselvam, 2006). It suggests how well a set of variables
are able to predict a particular outcome. Subsequently it was used to answer the questions mapped to the constructs
discussed from Colesca and Debrica (2008) and Bulgerian E-readiness Assessment Model.
Using SPSS generated values and based on the above discussion, the proposed research model is presented below
Question Construct Beta Coefficient Sig. Answer
01 DF-PEU .065 .045 There is positive Influence
Q2 DF-PT .088 .032 There is a positive influence
Q3 DF-PC .090 .033 There is a positive and significant influence
Q4 DF-A .095 .040 There is positive and significant influence
Q5 PC-PEU .356 .002 There is a positive influence
Q6 PT-VS .158 .025 There is a positive influence
Q7 PEU-VS .752 .020 There is influence
Q8 VS-ES .975 .003 There is influence
Q9 A-ES -.535 .012 There is influence
Q10 PC-ES .045 .023 There is a positive influence
QH PS-R .568 .050 There a is a positive influence
Q12 LA-R .820 .031 There is a positive and significant influence
Q13 R-ER .215 .025 There is influence
Q14 ES-ER .120 .013 There is influence
Table 48: Beta and Significant Values for relationship among constructs
Based on the above beta coefficient and Significant values, the research model was generated.
61
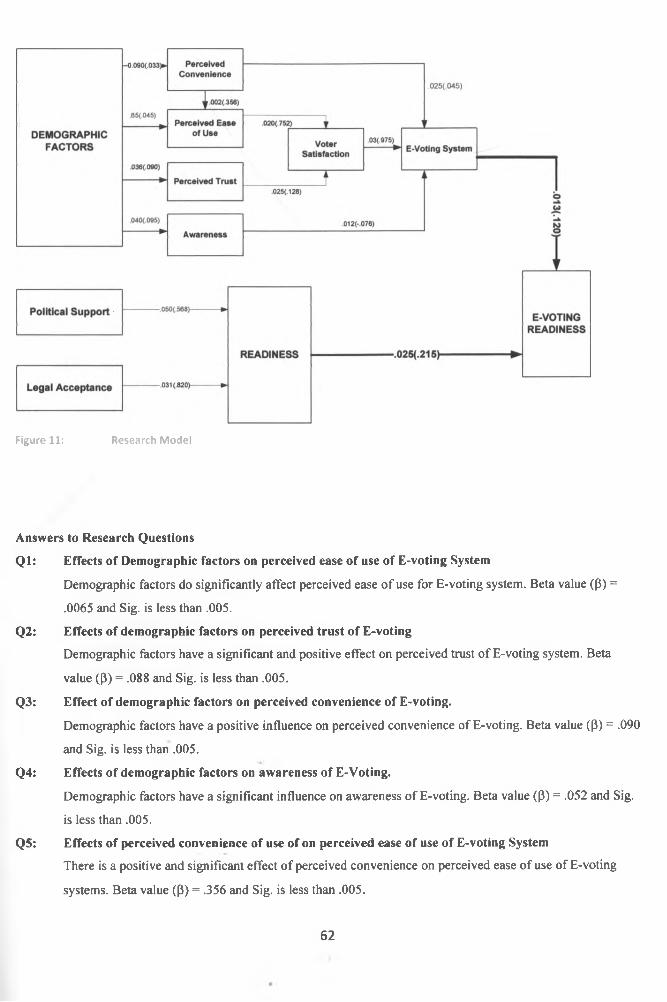
Figure 11: Research Model
Answers to Research Questions
Ql: Effects of Demographic factors on perceived ease of use of E-voting System
Demographic factors do significantly affect perceived ease of use for E-voting system. Beta value ((3) =
.0065 and Sig. is less than .005.
Q2: Effects of demographic factors on perceived trust of E-voting
Demographic factors have a significant and positive effect on perceived trust of E-voting system. Beta
value (P) = .088 and Sig. is less than .005.
Q3: Effect of demographic factors on perceived convenience of E-voting.
Demographic factors have a positive influence on perceived convenience of E-voting. Beta value (P) = .090
and Sig. is less than .005.
Q4: Effects of demographic factors on awareness of E-Voting.
Demographic factors have a significant influence on awareness of E-voting. Beta value (P) = .052 and Sig.
is less than .005.
Q5: Effects of perceived convenience of use of on perceived ease of use of E-voting System
There is a positive and significant effect of perceived convenience on perceived ease of use of E-voting
systems. Beta value (p) = .356 and Sig. is less than .005.
62
Q6: Effect of perceived trust on the satisfaction in the use of E-voting system.
There is a significant effect of perceived trust on the voter satisfaction. Beta value (P) = . 158 and Sig. is
.005.
Q7: Effect of perceived ease of use of E-voting system on voter satisfaction.
There is a positive and significant effect of perceived ease of use of e-voting system on Voter Satisfaction.
Beta value (P) = .752 and Sig. is less than .005.
Q8: Effect of voter satisfaction on E-voting Readiness.
There is a positive and significant effect of Voter Satisfaction on E-voting readiness. Beta value (p) = .975
and Sig. is less than .005.
Q9: Effect of awareness on the use of E-voting System adoption.
There is a positive and significant effect awareness of e-voting system adoption. Beta value (P) = -.535 and
Sig. is less than .005.
Q10: Effect of perceived convenience on the use of E-voting system
There is no significant influence of perceived convenience on the adoption of E-voting system. Beta value
(p) = .045 and Sig. is less than .005.
Qll: Extent of Political support for of E-voting.
Political factors have no significant effect on readiness of E-voting system. Beta value (P) = .568 and Sig.
is less than .005.
Q12: Extent of Legal acceptability for E-voting.
Legal factors have a significant and positive effect on readiness of E-voting system. Beta value (p) = .820
and Sig. is .005.
Q13. Extent of Social Readiness for E-voting
Social factors have a significant and positive effect on readiness for E-voting. Beta value (P) = .215 and
Sig. is less than .005.
Q14. Extent of Technological readiness for E-voting
Technological factors have a significant and positive effect on readiness for E-voting. Beta value (P) = .215
and Sig. is less than .005.
63
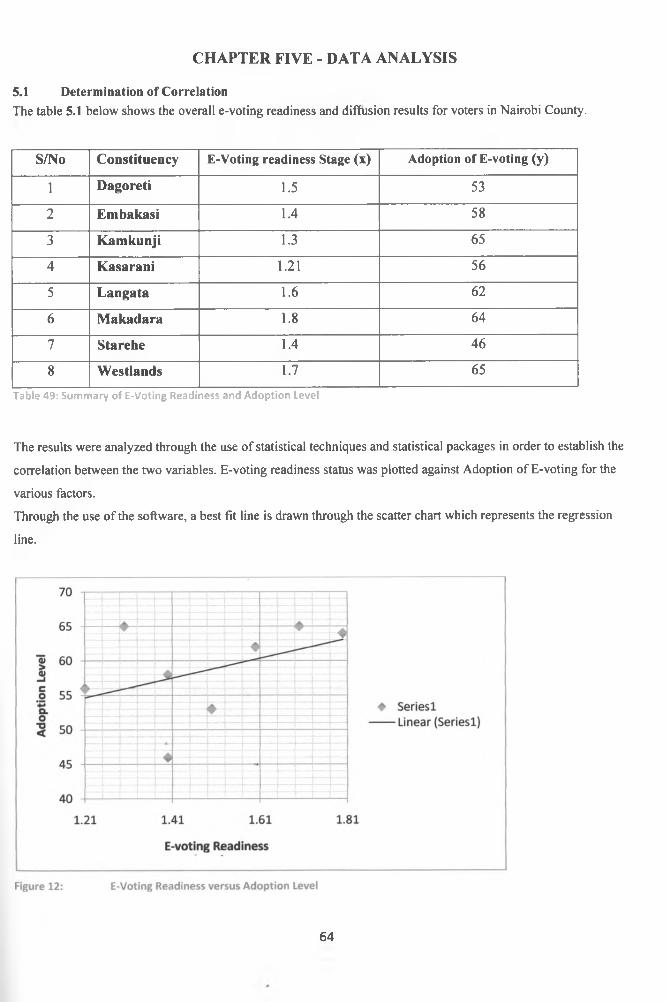
CHAPTER FIVE - DATA ANALYSIS
5.1 Determination of CorrelationThe table 5.1 below shows the overall e-voting readiness and diffusion results for voters in Nairobi County.
S/No Constituency E-Voting readiness Stage (x) Adoption of E-voting (y)
1 Dagoreti 1.5 53
2 Embakasi 1.4 58
3 Kamkunji 1.3 65
4 Kasarani 1.21 56
5 Langata 1.6 62
6 Makadara 1.8 64
7 Starehe 1.4 46
8 Westlands 1.7 65
Table 49: Summary of E-Voting Readiness and Adoption Level
The results were analyzed through the use of statistical techniques and statistical packages in order to establish the
correlation between the two variables. E-voting readiness status was plotted against Adoption of E-voting for the
various factors.
Through the use of the software, a best fit line is drawn through the scatter chart which represents the regression
line.
64

5.2 Determination of the Regression Model
Formula for Determining Regression Model - Least Squares Method
Consider a scatter diagram of a set of bivaiate data. Of all the regression lines that could be drawn to represent data,
the least squares regression line of y on x that line for which the sum of the squares of the vertical deviations of all
the points from the line is least.
The line shown in Figure 5.2 is the least squares line of y on x. di, d2... d„
are the numerical differences between each plotted value and the regression line. If the least squares regression lin of
y on x is given by y = a + bx, then:„ L _ nZxy - Ix S y
b = nZx2 - (£x)2
_ 2 y b lx. , n n
From the graphical results it is possible to generate the equation of a straight line through the points that can be used
to describe the relationship between two variables. Assuming the regression model is of the form y = a + bx where y
65
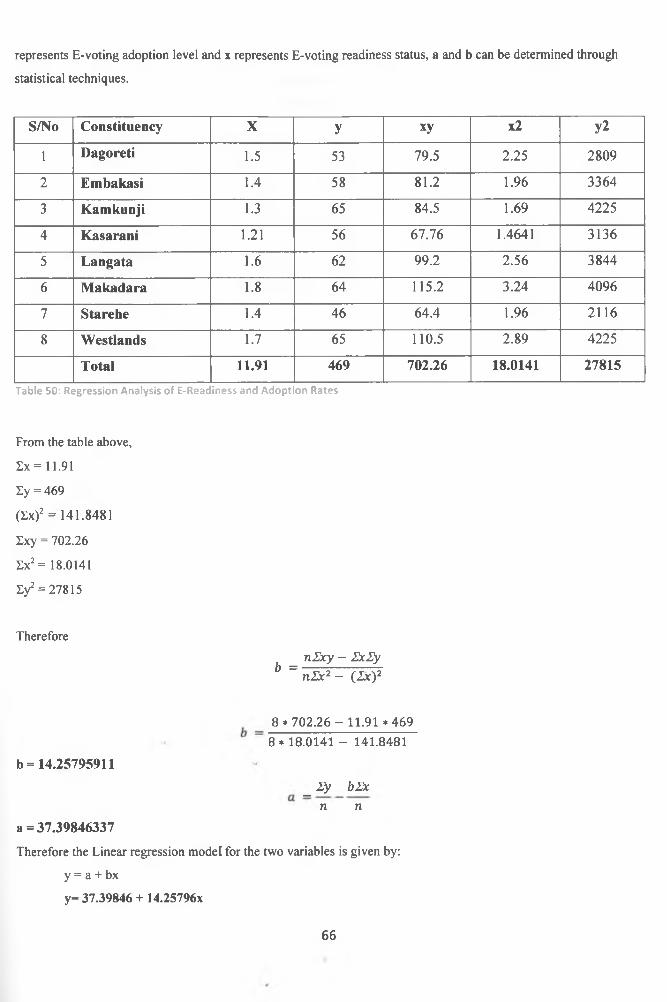
represents E-voting adoption level and x represents E-voting readiness status, a and b can be determined through
statistical techniques.
S/No Constituency X y *y x2 y2
1 Dagoreti 1.5 53 79.5 2.25 2809
2 Embakasi 1.4 58 81.2 1.96 3364
3 Kamkunji 1.3 65 84.5 1.69 4225
4 Kasarani 1.21 56 67.76 1.4641 3136
5 Langata 1.6 62 99.2 2.56 3844
6 Makadara 1.8 64 115.2 3.24 4096
7 Starehe 1.4 46 64.4 1.96 2116
8 Westlands 1.7 65 110.5 2.89 4225
Total 11.91 469 702.26 18.0141 27815Table 50: Regression Analysis of E-Readiness and Adoption Rates
From the table above,
Ex = 11.91
Ey = 469
(Ex)2 = 141.8481
Exy = 702.26
Ex2 = 18.0141
Ey2 = 27815
Therefore
b = 14,25795911
a = 37.39846337
nZxy - ZxZy b = nZx2 - (2x)2
8 * 7 0 2 .2 6 - 11.91 *469 8* 18.0141 - 141.8481
_ Zy bZx n n
Therefore the Linear regression model for the two variables is given by:
y = a + bx
y= 37.39846 + 14.25796x
6 6
This implies that given an e-voting readiness status of voters, the adoption rate can be determined from the above
equation. These results show there is a correlation between adoption rate and e-voting readiness. This justifies the
government investment in education and ICT obtain democratic and acceptable results.
5.3 Determination of Correlation CoefficientA measure of strength of the correlation between two variables is fundamental and absolute for the study. This can
be derived using a correlation coefficient normally represented by r. This is a numerical that ranges from -1 to +1.
Hence -1 <=r<=+1.
A value of r = 0 signifies that there is no correlation between the variables. The bigger the coefficient (absolute
value) indicates the stronger the association between the two variables. If the correlation coefficient is positive (+), it
means that there is a positive relationship between the two variables. According to our study, positive coefficient
means that as E-voting Readiness increases, adoption and acceptability of e-voting system increases.
From statistics, the formula for r is given by:
Correlation Coefficient, r =nlxy — nlx£y
VnXy2 - (Ey2)VnZx2 - (Xx)2
n£xy — nSxSy
VnZy2 - (Ey2)
r = 0.8672
The value of r = 0.8672 is closer to +1 implying that there is a strong correlation between the two variables. Also the
fact that the value of r is positive implies that there is a positive correlation. This means that an increase in the value
of one variable tends to be associated with an increase in the value of the other variable. This implies an increase in
e-voting readiness will cause a proportionate increase in e-voting adoption. This inference makes the null hypothesis
Ho to be rejected and the alternative hypothesis H| to be approved.
5.4 The Coefficient of DeterminationThe coefficient of determination, r2 is used in the context of statistical models whose main purpose is to predict
future outcome based on related variables’ information. It is the proportion of variability in a data set that is
accounted for by the statistical model. It provides a measure of how well future outcomes are likely to confirm to the
model and to be used to predict with high degree of certainty the outcome.
* JCoefficient of determination, r2 is derived from:
67

Explained variation in all itemsr 2 = --------------------------------- -—-—-—
Total variation in all items
Statistically, correlation coefficient r2 ranges from -1 to +1, hence the value of r2 is positive and lies in the range of
0< r2 < 1.
Therefore Coefficient of determination, r2 = 0.8672 x 0.8672
= 0.7520
This implies that 75.2% of the variation in the adoption rate is due to e-voting readiness in Nairobi County. The
percentage of the variation in adoption of e-voting due other factors (other than e-voting readiness) is 24.8%.
5.4.1 Minimum Adoption Rate at Stage 1 of E-Voter Readiness StatusIn terms of e-voting readiness status, stage 1 represents the minimum state of unpreparedness in a county. The
expected percentage adoption rate at this stage is computed as follows:
y = a + bx
The values of a and b are 37.39846 and 14.25796 respectively and x = 1;
y = 37.39846 + 14.25796*1
51.65642%
This implies that without ICT facilities and networking infrastructure at all to facilitate e-voting, the expected
adoption rate will be 51.65642%.
5.4.2 Maximum Adoption Rate at Stage 4 of E-Voting Readiness StatusIn terms of e-voting readiness status, stage 4 represents the maximum stage of preparedness of voters is in a county.
The expected percentage adoption rate at this stage will be computed as follows:
y = a + bx
The values of a and b are 37.39846 and 14.25796 respectively and x = 4;
y = 37.39846 + 14.25796 *4
= 94.43%
This implies that with adequate ICT facilities and networking infrastructure to facilitate e-voting, the expected
adoption rate will be 94.43%. This is lower than expected value of 100% by 5.57%. This implies that there are some
extenuating factors that need to analyze further for the diffusion and adoption of e-voting systems.
5.4.3 Percentage Error in Adoption Rate E-Voting SystemsBased on the maximum e-voting readiness of stage 4, the percentage error in academic performance estimation may
be computed as follows:
' Estimated Percentage — Actual Percentage% error —------------------------- — -------------------------------
Actual Percentage94.43 - 100
= ----- — ----- x 100
6 8

= -5 .5 7 %
69
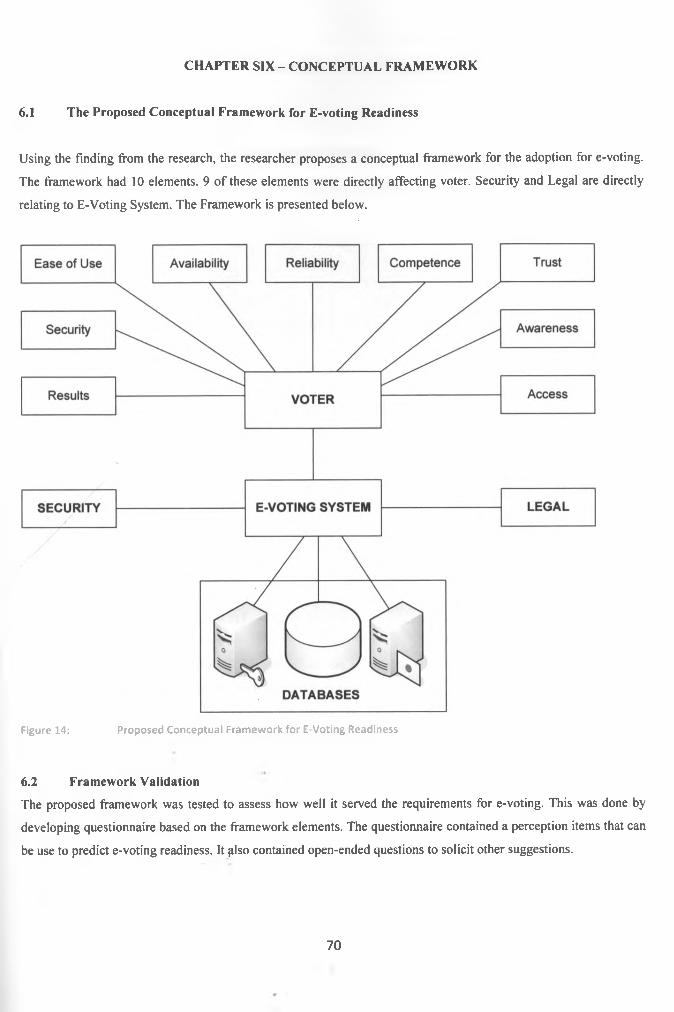
CHAPTER SIX - CONCEPTUAL FRAMEWORK
6.1 The Proposed Conceptual Framework for E-voting Readiness
Using the finding from the research, the researcher proposes a conceptual framework for the adoption for e-voting.
The framework had 10 elements. 9 of these elements were directly affecting voter. Security and Legal are directly
relating to E-Voting System. The Framework is presented below.
Figure 14: Proposed Conceptual Framework for E-Voting Readiness
6.2 Framework Validation
The proposed framework was tested to assess how well it served the requirements for e-voting. This was done by
developing questionnaire based on the framework elements. The questionnaire contained a perception items that can
be use to predict e-voting readiness. It ^lso contained open-ended questions to solicit other suggestions.
70
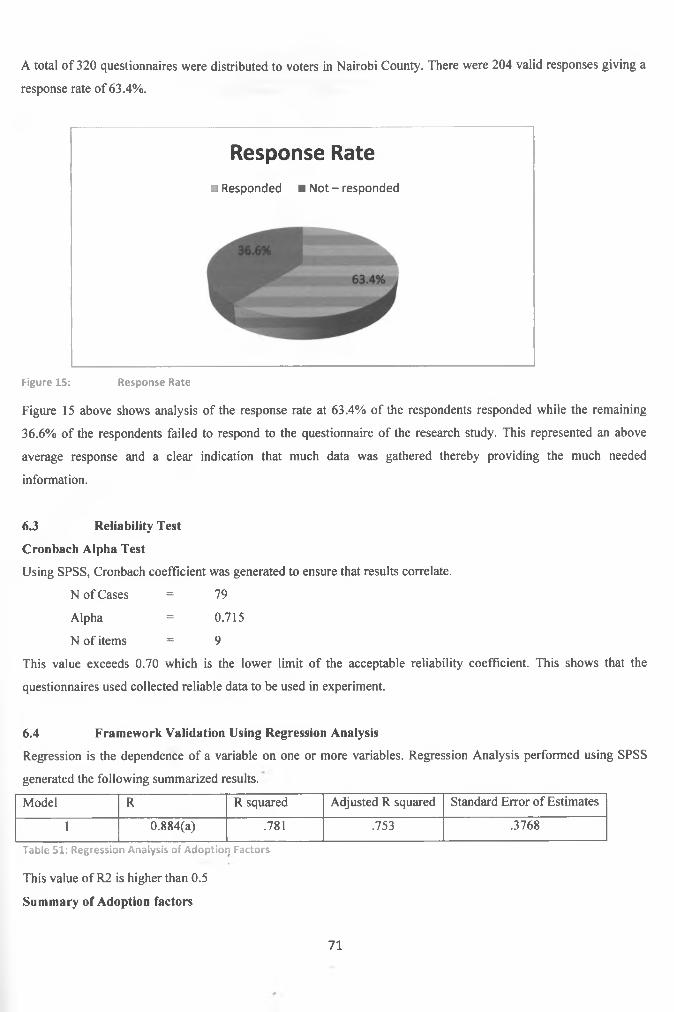
A total of 320 questionnaires were distributed to voters in Nairobi County. There were 204 valid responses giving a
response rate of 63.4%.
Response Rate■ Responded ■ Not - responded
Figure 15: Response Rate
Figure 15 above shows analysis of the response rate at 63.4% of the respondents responded while the remaining
36.6% of the respondents failed to respond to the questionnaire of the research study. This represented an above
average response and a clear indication that much data was gathered thereby providing the much needed
information.
6.3 Reliability Test
Cronbach Alpha Test
Using SPSS, Cronbach coefficient was generated to ensure that results correlate.
N of Cases = 79
Alpha = 0.715
N of items = 9
This value exceeds 0.70 which is the lower limit of the acceptable reliability coefficient. This shows that the
questionnaires used collected reliable data to be used in experiment.
6.4 Framework Validation Using Regression Analysis
Regression is the dependence of a variable on one or more variables. Regression Analysis performed using SPSS
generated the following summarized results.
Model R R squared Adjusted R squared Standard Error of Estimates
1 0.884(a) .781 .753 .3768
Table 51: Regression Analysis of Adoption Factors
This value of R2 is higher than 0.5
Summary of Adoption factors
71
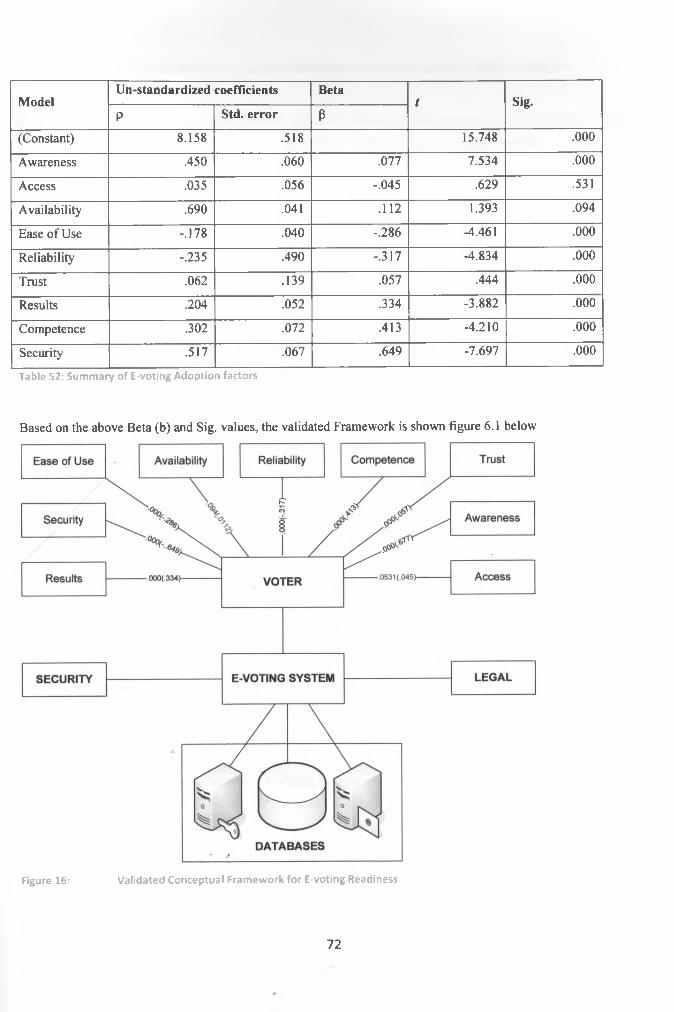
ModelUn-standardized coefficients Beta
t Sig.P Std. error P
(Constant) 8.158 .518 15.748 .000
Awareness .450 .060 .077 7.534 .000
Access .035 .056 -.045 .629 .531
Availability .690 .041 .112 1.393 .094
Ease of Use -.178 .040 -.286 -4.461 .000
Reliability -.235 .490 -.317 -4.834 .000
Trust .062 .139 .057 .444 .000
Results .204 .052 .334 -3.882 .000
Competence .302 .072 .413 -4.210 .000
Security .517 .067 .649 -7.697 .000
Table 52: Summary of E-voting Adoption factors
Based on the above Beta (b) and Sig. values, the validated Framework is shown figure 6.1 below
Figure 16: Validated Conceptual Framework for E-voting Readiness
72

CHAPTER SEVEN - RECOMMENDATIONS AND CONCLUSION
Based on the findings of the research, this final chapter will present the findings based on the research objectives
and next the implication for practice and theory. The chapter concludes by presenting the limitations of the study.
7.1 Discussion of Results
This project addresses a framework for adoption factors of e-voting. The framework synthesizes, refines, and
extends current approaches to understand adoption factors. The study started with a background research to identify
factors determining the adoption of innovation and e-voting. Then, study is continued with a survey carried out in
eight constituencies in Nairobi County which had questions about voter readiness for e-voting. The study was
conducted by surveying 203 voters from eight constituencies in Nairobi County. The project aimed at exploring the
correlation between e-voter readiness and the diffusion rate in Nairobi County. E-voting Readiness is achieved by
determining the stage of readiness and comparing to the UN 2008 indices for developing countries. The findings
indicate that there is a positive correlation between e-voting readiness and its adoption. The e-voting readiness
results generate various indices for constituencies in Nairobi County on a scale of 1 to 4 with 1 representing a state
of unpreparedness while 4 representing full readiness status.
The adoption level was obtained using 1- 7-Linkert Scale questionnaires where 1 represents strongly disagree and 7
represents strongly agree. The results were analyzed using statistical tool SPSS and converted to percentage.
By plotting the e-voting readiness status against the adoption level and obtaining a straight line through the various
points, a direct link between the e-voting readiness and adoption level of for each constituency in Nairobi County
was established.
The regression model established can be used to determine the e-voting adoption levels of any constituency given e-
voting readiness status.
7.1.1 Strength of the Correlation
Statistical analysis gave a coefficient of determination of 0.752. This value indicates a measure of the strength of
correlation between the two variables with a value of 0 indicating no correlation while a value of 1 indicates perfect
correlation. The difference of 0.248 may account for a variety of factors such voter apathy and political biasness.
A
7.2 Research Objectives
7.2.1 Factors that influence adoption of E-voting System
The first objective was to find out factors that influence the adoption of e-voting in Nairobi County. After validation
it was found out that Security, Trust, Access, Reliability, Competence, Results, Ease of Use and awareness have a
positive and significant effect on adoption of E-voting Systems.
Further, availability and access indicated significant influence on the intention to adopt electronic voting. They have
been shown to have significant contribution to influence the E-voting adoption due to various reasons. First the
73
sample for the study focused mainly in Nairobi County where voters have unlimited access to internet services. The
choice of the sample may have removed any a bias in the results.
7.2.2 E-voting Readiness
The level of E-voting readiness was assessed by 203 responses received. 30% of the respondents did were skeptical
of electronic voting due reliability and lack of trust. 43% of the respondents suggested that E-voting would introduce
corruption, thereby not improving democracy.
The findings were not encouraging and closely agree with UN Survey on E-Voting readiness of 2008 where by
developing countries had an index of 0.03 on a scale of 0 to 1.
7.2.3 Factors that influence E-voting Readiness
E-voting readiness was investigated by both qualitative and quantitative research. The study identified the Legal and
Security dimensions as primary determinants for e-voting readiness. In addition, Communication and
Telecommunication Infrastructure play a significant role to ensure e-voting is to be implemented successfully.
7.2.4 Framework for E-voting
A framework for E-voting was proposed. The key factors that were found to have significant influence on the
adoption of e-voting in Nairobi County include Security, Access, availability, perceived ease of use, reliability,
competence, trust, awareness and access. Security and Legal factors have a direct effect on e-voting system.
7.3 Implications for Theory
The research has added to the body of knowledge since it brings to e-voting readiness in Kenya.
7.4 Implications for Practice
The study shed light on readiness for e-voting and some of the main factors that influence adoption of E-voting in
Nairobi County. The findings from the research can be considered by Independent Electoral and Boundaries
Commission since it is directly involved in managing election. Hence e-voting can be used in 2012 to avert any
contention and manipulation of results delay. Further, it can reduce the time required to conclude election petitions
significantly since evidence can adduced in court.
7.5 Limitations and Suggestion for Future Research
The study focused in Nairobi County that is cosmopolitan. Other counties were not considered. These could
generate an interesting and new dimension. The questionnaire approach is not free of subjectivity in the respondent
and was taken at one point at a time. IJser reaction change in time and may depend on the political environment.
74

Other factors affecting e-voting may exist. Further testing and expansion of our framework may capture factors that
were not considered in this research. We recommend further research in rural and monolithic counties in Kenya.
75

REFERENCES
Avgerou, C. et.al., 2006; Proceedings of the 9th International Conference on Social Implications of Computers in Developing Countries, SSo Paulo, Brazil, May 2007
Bannister, F. (2007) Risk Assessment Framework for Electronic Voting, International Journal of Technology, Policy and Management, Issue: Volume 7, No. 2/2007
Buchsbaum, T (2004) E-Voting: International Developments and Lessons Learnt
Carter, L. and Belanger, F. (2004), “The influence of perceived characteristics of innovating on e-govemment adoption”, Electronic Journal of E-govemment, Vol. 2 No. 1.
Carter, L. and Belanger, F.(2005), “The utilization of e-govemment services: citizen trust innovation and acceptance factors”, Information Systems Journal, Vol. 15 No. 1, pp. 5-25.
Kagwanja, P. M. (2003). Facing Mount Kenya or facing Mecca? The Mungiki, ethnic violence and the politics of the Moi succession in Kenya, 1987-2002, African Affairs, 102: 25-49.
Kombo, D. and Tromp, D. (2006), Study and Thesis Writing. Paulines Publications Africa, Nairobi Kenya.
Kotler, P. and Armstrong, G. (2002) Principles of Marketing, 9th Edition, Prentice-Hall of India, New Delhi, India, 2002.
Krimmer, R. and Schuster, R. (2008) The E-Voting Readiness Index. Competence Centre for Electronic Voting and Participation www.e-voting.cc/topics/wD/ accessed August, 7th 1010.
Lafargue, J. (2008). A country in suspense: Political fallouts and popular anxiety. INSTITUT FRANCAIS DE RECHERCHE EN AFRIQUE (IFRA).
M3gi, T. (2007). Practical Security Analysis of E-voting Systems: Master thesis, Tallin University of Technology.
MeiBner, N., Hartmann, V. and Richter, D. (2005). Verifiability and Other Technical Requirements for Online Voting Systems.
Mercuri, R. (2001) Electronic Vote Tabulation: Checks and Balances PhD thesis: University of Pennsylvania
Mugenda, O. and Mugenda A. (2003) Research Methods: Quantitative and Qualitative Approaches, Acts Press, Nairobi Kenya.
Nadja Braun, E-Voting: Switzerland's Projects and their Legal Framework - in a European Context
Omari, A. and Omari, H. (2006). E-Govemment Readiness Assessment Model. Journal of Computer Science 2(11): 841-845,2006. ISSN 1549-3636.
Panneerselvam, R., (2006). Research Methodology, Prentice-Hall of India, New Delhi.
Oyugi, W. O. (1997). Ethnicity in the electoral process: The 1992 general elections in Kenya, African Journal of Political Science, 2(1): 41-69.
Rogers, E.M. (1995), Diffusion of Innovations, The Free Press, New York, NY.* /
Russell, S. and Norvig, P (2008), Artificial Intelligence - A modem Approach, Pearson Prentice Hall, New Delhi, India.
76

Structure of the Bulgerian E-readiness Assessment Model, date accessed 10th October, 2010http://www.csd.bg/fileSrc.php?id=804
Tsuda, M. (2010) IDE Discussion Paper No. 243, Kenya’s 2007 Election www.ide.go.ip/english/publish/download/dp/pdf/243.pdf Accessed August 5th 2010 at 7.30 pm
UN Department of Economic and Social Affairs, Division for Public Administration and Development Management. UN Global E-govemment Readiness Report 2005 - From E-govemment to E- inclusion.http://unpanl.un.org/intradoc/groups/public/documents/un/unpan021888.pdf
Crisis
77

SERIAL N O ........................
Time interview started---------------------------------------------
Time interview ended---------------------------------------------
Date of interview--------------------------------------------------
NB
1. Fill your answers to all questions in the space provided
2. Do not indicate your name anywhere in the questionnaire
3. It is important that all the sections have responses
INSTRUCTIONS
1. In the sections based on 7-point scale, give your opinion whereby
a. 7 means Strongly agree
b. 6 Agree
c. 4 means not sure
d. 1 means strongly disagree
2. All questions should have ONE answer
3. Make sure you tick inside the box
4. For questions where there are no numbers to be ticked, we ask you to write your answer in your own words
in the space provided.
1. DEMOGRAPHIC DETAILS (This is for analysis only)
E-VOTING SURVEY QUESTIONNAIRE
Gender Age
□ Male □ 18-24 Q 25-35
l~l Female □ 3 5 -5 0 □ Above 50
Education Level Years of Computer use
Q] Basic □ 1 year and below
Q] Secondary □ 2 years and below
□ College □ 3 - 6 years
□ University □ Above 7 years
Constituency: Tick the constituency that you reside in Nairobi
] Dagoreti Langata
Q Embakasi | Makadara
d l Kamkunji □ Starehe
□ Kasarani Q Westlands
Mobile Phones
Have you ever owned a mobile phone? □ Yes □ No
If you own a phone, indicate the number of years of Using Mobile phones
[ ] Less than 1 year [ ] 1 -3 years ^ 4 - 6 years □ Over 7 years
78

3.
4.
5.
6.
7.
8.
Preferred Voting Methods
□ Manual Ballot system □ Mobile Phone Q Internet Voting Q Internet Polling Boots
Need for E-voting
Do you agree that e-voting is required in Nairobi County? [ ] Yes Q] No
Willingness to use E-Voting System
To what extent do you agree with the following statement on your willingness to use E-voting system?
Strongly Least
Agree Agree
1 2 3 4 5 6 7
(a) 1 will be willing to use the system □ Q □ □ □ □ □(b) I will accept the results of e-voting □ □ □ □ □ □
Voter Readiness for E-Voting
To what extent do you think you are ready to use E-voting system as a voter in Nairobi County?
Strongly Least
Agree Agree
1 2 3 4 5 6 7
(a) I am ready to use e-voting System □ □ □ □ □ □ □(b) I am ready to use if all concerns
have been addressed. □ □ □ □ □
Reasons of Implementing E-Voting
To what extent do you agree with the following statements regarding reasons for implement e-voting system?
Strongly Least
Agree Agree
1 2 3 4 5 6 7
(a) E-voting will reduce rigging □ □ □ □ □ □ □(b) E-voting will Ensure fair election □ □ □ □ □ □ □(c) E-voting reduce tally results time to 48hrs □ □ □ □ □ □ □(d) E-voting reduce results altering □ □ □ □ □ □ □Minimum E-voting Readiness
To what extent do you agree with the following statements regarding requirements of e-voting system?
Strongly Least
Agree Agree
* f 1 2 3 4 5 6 7
(a) Ease to Use during voting □ □ □ □ □ □ □(b) Reliable to be used □ □ □ □ □ □ □
79

(c) Tally results within 12 hours □ □ □ □ □ □ □(d) E-voting give accurate results □ □ □ □ □ □ □(e) E-voting allows voting anywhere □ □ □ □ □ □ □
9. Perceived Usability {Change of one’s decision after voting and before committing the vote}
To what extent do you agree with the following statements regarding usability of electronic voting system?
Strongly Least
Agree Agree
1 2 3 4 5 6 7
(a) E-voting ease to use □ □ □ □ □ □ □(b) I feel its flexible to use the system □ □ □ □ □ □ □(c) Correcting errors is easy □ □ □ □ □ □ □
10. Access
To what extent do you agree with the following statement regarding accessibility of voters to e-voting points?
Strongly Least
Agree Agree
1 2 3 4 5 6 7
(a) E-voting access points available □□
□ □ □ □ □(b) Access points be proportional to number of
registered voters.
□□
□ □ □ □ □
11. Perceived Trust
To what extent do you agree with the following statement regarding trust e-voting being conducted?
Strongly Least
Agree Agree
1 2 3 4 5 6 7
(a) Voting over the internet can be trusted □ □ □ □ □ □ □(b) Voting over mobile phones can be trusted □ □ □ □ □ □ □(c) Manual paper voting can be trusted □ □ □ □ □ □ □
12. Availability
To what extent do you agree with the following statements regarding availability and speed of internet?
Strongly Least
Agree Agree
1 2 3 4 5 6 7
(a) The Government should ensure speed of Internet
is sufficient to facilitate e-vot,ing □ □ □ □ □ □ □
13. Perceived Reliability of E-voting Results
80

To what extent do you agree with the following statement on reliance of E-voting results?
Strongly
Agree
Least
Agree
1 2 3 4 5 6 7
(a) Results will not be tampered with □ □ □ □ □ □ □
(b) Results will be use to resolve disputes
{Max time allowed for petition in the current constitution is 12 months}
14. Political Support
□ □ □
To what extent do you agree with the following statement political support on
Strongly
Agree
E-voting system?
Least
Agree
1 2 3 4 5 6 7
(a) E-voting will be accepted
□□□ □
□□
□(b) Executive will support E-voting system
Implementation
□□
□ □
□□
□
IS. SecurityTo what extent do you think E-voting system will ensure security of voting process and results?
Strongly
Agree
Least
Agree
1 2 3 4 5 6 7
(a) E-voting will give accurate results □ □ □ □ □ □ □(b) E-voting will ensure Confidentiality □ □ □ □ □ □ □(c) E-voting will ensure voter details are safe
SUGGESTION
□ □ □ □ □ □ □
In your own words, suggest any other thing that needs to be done to make the use of E-voting appealing
and acceptable.
81

SERIAL NO
Time interview started
Time interview ended
Date of interview-----
Name of Institution —
Address------------------
NB
4. Fill your answers to all questions in the space provided
5. It is important that all the sections have responses
Network Access Indicators
Network Infrastructure
1. Has your constituency been networked?---------------------------------------------
a. If yes, what area has been networked?-----------------------------------
2. What is the tele-density of each constituency?-------------------------------------
Internet Availability
1. What is the capacity of your leased lines available to your constituency? —
2. Does your phone have wireless access capability?---------------------------------
Network Speed and Quality
1. What is the maximum Internet access speed available in the constituency?
2. How frequent does your internet or phone fail to connect---------------------
3. What is the mean drop rate of calls in the constituency?------------------------
ICT Hardware and Software Availability
1. How frequent do you use ICTs like computers?------------------------------------
2. Are you trained in ICT?--------------------------------------------------------------------
a. If yes, up-to what level--------------------------------------------------------
ICT Service and Support
1. How long have you used computer applications?----------------------------------
2. Can you troubleshoot common problems?------------------------------------------
3. How easily can you use and modify ICT tools?--------------------------------------
ICT COMPENCY READINESS
Access to ICTs
1. Do you have access to ICTs?...........................................................................
QUALITATIVE QUESTIONNAIRE E-VOTING READINESS
{optional}
{optional}
82
2. How frequent do you access ICTS?..............................................................
Enhancing Education with ICTs
1. To what extent is CDF encouraging the ICTs Update?................................
2. Do you have ICT Skills?................................................................................
Developing ICT workforce
1. Is there any committee on ICT in your constituency?................................
2. Is the community actively involved in the development of the strategies?
ICT in government Offices
1. How do you pay for your bills?.............................................................................
2. How do you file your annual income returns?.....................................................
(C) E-SOCIETY
People and Organization Online
1. List any websites that you commonly visit...........................................................
2. How frequently do you use e-mail as a communication tool?............................
Locally relevant content
1. What language is your web browser using?
2. Which language are you comfortable with what communicate over the net?
ICTs in workplaces
1. Is your workplace automated?............................................................................
2. How much do you spend on telecommunication on monthly basis?.................
(D) SECURITY AND TRUST
Security of ICT equipment and Software
1. Are you aware of how variations/alterations can be done through computers?
2. How can security of equipment be attained?......................................................
3. Have you ever seen a firewall?............................................................................
ICT Privacy Issues
1. Are you aware of any ICT Privacy Issues?............................................................
a. If yes, describe any..................................................................................
2. How is confidentiality, Integrity and auditability being implemented?..............
83

ICT COPYRIGHT ISSUES
1. Do you use custom-made software?....... .
a. If yes, from which developer?....
2. What do recommend on software piracy?
ICT Strategy
1. Have you ever read ICT Strategy of 2006?.......................................................
a. If yes, how can it help you to ensure compliance to the rule of law?
2. What possible benefits can be accrued from complying with ICT Strategy?
84
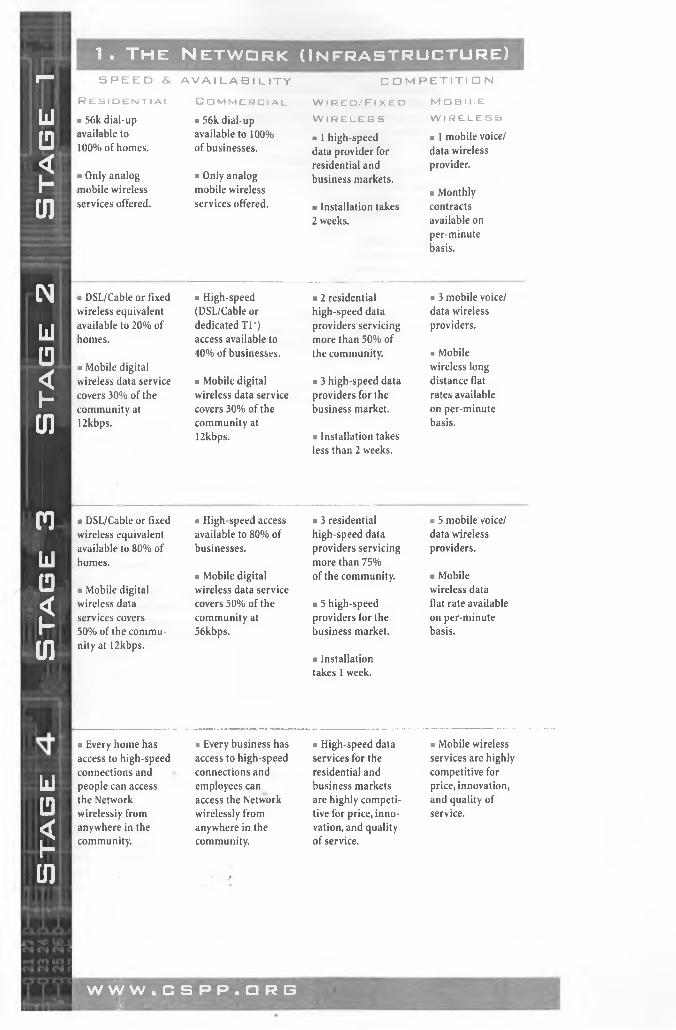
1. The Network (Infrastructure)*— S P E E D & A V A I L A B I L I T Y C O M P E T I T I O N
R e s i d e n t i a l C o m m e r c i a l W i r e d / F i x e d M O B I L E
L I • 56k dial-up . 56k dial-up W i r e l e s s W I R E L E S S
r navailable to available to 100% . 1 high-speed . 1 mobile voice/
L I 100% of homes. of businesses. data provider for data wireless< residential and provider.u ■ Only analog ■ Only analog business markets.n mobile wireless mobile wireless . Monthly
i nservices offered. services offered. ■ Installation takes contracts
2 weeks. available onper-minutebasis.
N . DSL/Cable or fixed ■ High-speed ■ 2 residential . 3 mobile voice/wireless equivalent (DSL/Cable or high-speed data data wireless
I I Iavailable to 20% of dedicated Tl*) providers servicing providers.
111 homes. access available to more than 50% of
1 940% of businesses. the community. a Mobile
. Mobile digital wireless long< wireless data service . Mobile digital . 3 high-speed data distance flat
h covers 30% of the wireless data service providers for the rates available1 community at covers 30% of the business market. on per-minute
U )12kbps. community at basis.
12kbps. . Installation takesless than 2 weeks.
n • DSL/Cable or fixed ■ High-speed access ■ 3 residential • 5 mobile voice/wireless equivalent available to 80% of high-speed data data wireless
L Javailable to 80% of businesses. providers servicing providers.homes. more than 75%
rn * Mobile digital of the community. a MobileL I . Mobile digital wireless data service wireless data< wireless data covers 50% of the . 5 high-speed flat rate availablec services covers community at providers for the on per-minuter* 50% of the commu 56kbps. business market. basis.
rn nity at 12kbps.U i . Installation
takes 1 week.
. Every home has . Every business has a High-speed data a Mobile wirelessaccess to high-speed access to high-speed services for the services are highly
Idconnections and connections and residential and competitive forpeople can access employees can business markets price, innovation,
19 the Network access the Network are highly competi and quality ofwirelessiy from wirelessly from tive for price, inno service.
< anywhere in the anywhere in the vation, and quality
h community. community. of service.
tn
f t m*
W W W . C S P P . a R GLa.
'& >■ ■ '■ ? y .V < ■ - ■' * ’ '

Employees dial-up 50% of govern 10% of classrooms 100% of offices, 25% of providers 25% of homesfor Internet access. ment buildings have have always-on libraries, and labs have dial-up Internet have a computer/
25% of employees have email accounts.
always-on connection.
25% of employees have email.
connection to the Internet.
25% of teachers have email accounts.
have always-on connection to the Internet.
25% of dorm rooms have always- on connection to the Internet.
100% of students, faculty, and staff have email accounts.
access.
25% of providers have email accounts for external communication.
access device.
15% of homes use the Internet.
30% of employees 100% of govern 50% of classrooms 50% of dorm 25% of providers 50% of homeshave access to an ment buildings have have always-on rooms have always- have always-on have a computer/always-on connec always-on connec connection to the on connection to the connection to the access device.tion to the Internet. tion to the Internet. Internet. Internet. Internet.
30% of homes50% of employees 100% of employees 100% of teachers 25% of campuses 50% of providers use the Internet.
have email accounts. have email. have email accounts. have a wireless have email accountsnetwork. for external
50% of mobile 50% of mobile communication.employees use employees usewireless devices. wireless devices.
60% of employees 100% of mobile 75% of classrooms 100% of dorm 50% of providers 80% of homeshave access to an employees use have always-on rooms have always- have always-on have a computer/always-on connec wireless devices. connection to the on connection to the connection to the access device.tion to the Internet.
Public terminalsInternet. Internet. Internet.
80% of homes75% of employees are available in 50% 100% of students 50% of campuses 100% of providers use the Internet.
have email accounts. of buildings that are have email accounts. have a wireless have email accountsaccessible to the network. for external
100% of mobile public. Public ports communication.employees use and terminals arewireless devices. available in some
common areas.
All businesses of all sizes and in all sectors are always connected to the Network and every employee is able to access the Network
' when it is needed to perform their job, even when mobile.
Governments make the Network always available to employees and become a point of Network access for the public when they are in a public building.
All K-12 campuses are highly networked environments where the Network is available to students, faculty, and staff from anywhere on campus.
All higher ed campuses are highly networked environments where the Network is available to students, faculty, and staff from anywhere on campus.
All health care providers have high-speed access for communication and telemedicine purposes.
All homes are connected to the Network and enable people and devices to access the Network from multi pie sites in the home.
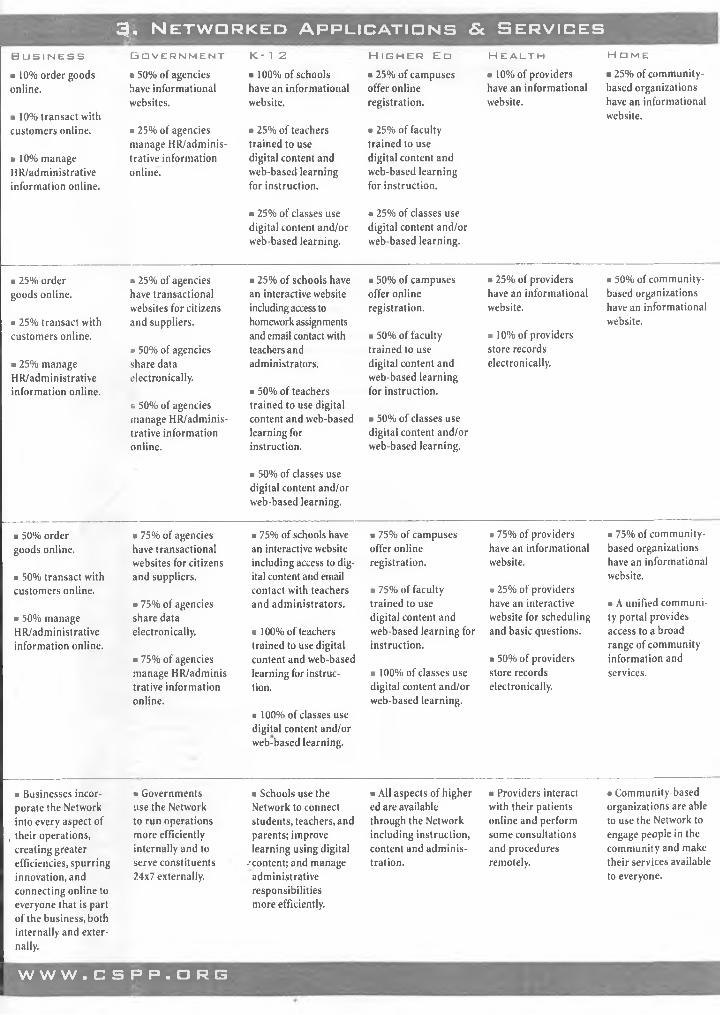
3 . N e t w o r k e d A p p l i c a t i o n s & S e r v i c e s
B u s i n e s s G o v e r n m e n t K- 1 2 H i g h e r E d H e a l t h H o m e
■ 10% order goods • 50% of agencies b 100% of schools b 25% of campuses b 10% of providers b 25% of community-online. have informational have an informational offer online have an informational based organizations
websites. website. registration. website. have an informational■ 10% transact with customers online. ■ 25% of agencies ■ 25% of teachers b 25% of faculty
website.
manage HR/adminis- trained to use trained to use* 10% manage trative information digital content and digital content andHR/administrative online. web-based learning web-based learninginformation online. for instruction. for instruction.
a 25% of classes use b 25% of classes usedigital content and/or digital content and/orweb-based learning. web-based learning.
■ 25% order • 25% of agencies b 25% of schools have b 50% of campuses a 25% of providers a 50% of community-goods online. have transactional an interactive website offer online have an informational based organizations
websites for citizens including access to registration. website. have an informational■ 25% transact with and suppliers. homework assignments website.customers online. and email contact with b 50% of faculty a 10% of providers
» 50% of agencies teachers and trained to use store records■ 25% manage share data administrators. digital content and electronically.HR/administrative electronically. web-based learninginformation online.
b 50% of agenciesb 50% of teachers trained to use digital
for instruction.
manage HR/adminis- content and web-based b 50% of classes usetrative information learning for digital content and/oronline. instruction. web-based learning.
a 50% of classes use digital content and/or web-based learning.
■ 50% order ■ 75% of agencies a 75% of schools have a 75% of campuses a 75% of providers b 75% of community-goods online. have transactional an interactive website offer online have an informational based organizations
websites for citizens including access to dig- registration. website. have an informational■ 50% transact with and suppliers. ital content and email website.customers online. contact with teachers b 75% of faculty a 25% of providers
■ 75% of agencies and administrators. trained to use have an interactive b A unified communi-■ 50% manage share data digital content and website for scheduling ty portal providesHR/administrative electronically. a 100% of teachers web-based learning for and basic questions. access to a broadinformation online. trained to use digital instruction. range of community
■ 75% of agencies content and web-based a 50% of providers information andmanage HR/adminis- learning for instruc- b 100% of classes use store records services.trative information tion. digital content and/or electronically.online.
a 100% of classes useweb-based learning.
digital content and/or web-based learning.
■ Businesses incor- » Governments b Schools use the b All aspects of higher a Providers interact b Community-basedporate the Network use the Network Network to connect ed are available with their patients organizations are ableinto every aspect of to run operations students, teachers, and through the Network online and perform to use the Network to
, their operations, more efficiently parents; improve including instruction, some consultations engage people in thecreating greater internally and to learning using digital content and adminis- and procedures community and makeefficiencies, spurring serve constituents -'content; and manage tration. remotely. their services availableinnovation, and 24x7 externally. administrative to everyone.connecting online to responsibilitieseveryone that is part of the business, both internally and externally.
more efficiently.
W W W . C S P P . D R E

Li02tnN
Id0
2tn
nLiu
2tn
4. Networked Economy
I n n o v a t i o n W o r k f o r c e C o n s u m e r
Business permits » 10% of the workforce par- ■ 10% of householdsand licenses take up to ticipates in training/educa- purchase goods or use3 months to secure. tion programs either online services online.
or in person every 5 years.25% of existing business
es have transformed their ■ 10% of employers post internal and external prac- job openings on online job tices due to the Internet. listing services.
Business permits * 25% of the workforce par- » 33% of householdsand licenses take up to ticipates in training/educa- purchase goods or1 month to secure. tion programs either online use services online.
or in person every 5 years.50% of existing busi
nesses have transformed * 25% of employers posttheir internal and external job openings on online job practices due to the listing services.Internet.
« 5% of the workforce telecommutes at least once a week.
Business permits and * 50% of the workforce par- 75% of householdslicenses take less than ticipates in training/educa- purchase goods or2 weeks to secure. tion programs either online use services online.
or in person every 5 years.■ 75% of existing businesses have transformed their ■ 75% of employers post internal and external prac- job openings on online job tices due to the Internet. listing services.
15% of the workforce telecommutes at least once a week.
ill□201
mm mm i f i
Starting a new business has minimal bureaucratic and economic barriers and support mechanisms are in place to assist and encourage new business development. Existing businesses are embracing new technologies and best practices.
■ People are continually upgrading their skills to adjust to new technologies and best practices. Online job banks are able to dynamically match employees with openings and connect to training/ education programs to identify changing workforce skill requirements. Telework becomes a standard operating procedure in most work environments.
« Consumers can find information about, compare, and buy any good or service located anywhere in the world online.
W W W . C S P P . D R G