E-411 - World Bank Documents
280
RAJASTHAN WATERRESOURCES CONSOLIDATION PROJECT SECTORAL ENVIRONMENTAL ASSESSMENT FINAL REPORT VOLUME 2 E-411 VOL. 2 Prepared for: The World Bank, Washington D.C and Project Preparation Unit, RWRCP, Jaipur Prepared by: UMA Engineering Ltd, Calgary, Canada In Association with AGRA Earth & Environmental, Calgary, Canada Project Office: Kota, Rajasthan, India Contract # A49096 File # 925504-00-02 April 30, 2000 4 Engineering Ltd. ki E Engineers, Planners & Surveyors Public Disclosure Authorized Public Disclosure Authorized Public Disclosure Authorized Public Disclosure Authorized Public Disclosure Authorized Public Disclosure Authorized Public Disclosure Authorized Public Disclosure Authorized
-
Upload
khangminh22 -
Category
Documents
-
view
2 -
download
0
Transcript of E-411 - World Bank Documents

RAJASTHAN WATER RESOURCES CONSOLIDATION PROJECTSECTORAL ENVIRONMENTAL ASSESSMENT
FINAL REPORTVOLUME 2 E-411
VOL. 2
Prepared for:The World Bank, Washington D.C
andProject Preparation Unit, RWRCP, Jaipur
Prepared by:UMA Engineering Ltd, Calgary, Canada
In Association withAGRA Earth & Environmental, Calgary, Canada
Project Office: Kota, Rajasthan, India
Contract # A49096
File # 925504-00-02
April 30, 2000
4 Engineering Ltd.ki E Engineers, Planners & Surveyors
Pub
lic D
iscl
osur
e A
utho
rized
Pub
lic D
iscl
osur
e A
utho
rized
Pub
lic D
iscl
osur
e A
utho
rized
Pub
lic D
iscl
osur
e A
utho
rized
Pub
lic D
iscl
osur
e A
utho
rized
Pub
lic D
iscl
osur
e A
utho
rized
Pub
lic D
iscl
osur
e A
utho
rized
Pub
lic D
iscl
osur
e A
utho
rized


UMA Engineering Ltd.Engineers, Planners & Surveyors
2540 Kensington Road N.W., Calgary, Alberta, Canada T2N 3S3 (403) 270-9200 FAX 270-0399
April 30, 20009255-004-00-02
The Team LeaderProject Preparation UnitRajasthan Water Resources Consolidation ProjectIrrigation DepartmentSinchai Bhawan, J L N MargJaipur 302 017
Dear Sir,
Re: RWRCP- Sectoral Environmental Assessment Study: Final Report
UMA Engineering Ltd is pleased to submit the Final Report for the above study. The reportis in three volumes: Summary report (Volume 1); Main Report (Volume 2); and, Basin-wiseEMPs (Volume 3).
The excellent assistance provided by you and your colleagues enabled us to prepare thisreport on time.
We thank you for the opportunity to associate with your organization on this project.
Yours sincerely
Dr N A Visvanatha, P EngDirector (Environmental and Water Resources)E-mail: [email protected]
CC: Mr S Rajagopal, World Bank, New DelhiMr Geoffery Spencer, World Bank, Washington D.C.Dr Rafik Hirzi, World Bank, Washington D.C.
Project Office:P.O. Box 112, New Grain Mandi Phone: 091-744-500781Kota- 324007 Fax: 091-744-500o609
E-mail: rajad jp1.dot.net.in

ACKNOWLEDGMENTS
The SEA study team would like to acknowledge all the individuals of different departments of theWorld Bank, Govemment ot Rajasthan, Govemment of India and the Canadian IntemationalDevelopment Agency for providing relevant data used for preparing this report. The teamacknowledges the help and assistance of all the officers and individuals who provided informationand relevant documentation. Mr. Mahesh Kumar, Team Leader, and other officers of the ProjectPreparation Unit, RWRCP, have been very kind to enable access to various organizations.
SEA: Final Report - Volume 2 April 30, 2000Page i

!! a6edOOOZ 'o l,idv Z awnIOA -liodaH leu- -v3S
.T .s..afojd pauueBld w5 £
.- . 6uauaaJOs iao eualu3 Z S £.- . - asodind I C
£. spafOJd lo 6U!UaaJ:S 5 8-£ spaeoid jsuo i
L .spafold leulsnpul C£ £L .. s...oQOd )pOOsa!I pUe 3flsaLUOO Z z £
t.d P-d WspfoJd uoUle6w L I £
.- .SUo!pe Aseluaw!idwoo JaL4O ££.S £ ................. uaBwa6eueuuw JoleMpun 6 alqeu!elsns £ £ £
.. uoijuipsuaui jnfiflnU6V Z-£ £Z £.*------------- -------------- ...... jasuesl pue iuawa6euew uole6w! pPAoJdwI L-£ £Z.£ ............ .- .........------- ..---- sluauodwoO dO3ME £ tl . ueld JaIeM ale5S Z-Z-£l £.sWJoJia AOiIOd L Z
.! . S AIPy uoilejedejd 1paf Jd Z ££ .-..... alqweaJd lV£
.. NOIidIOS3Q 103rO8d O £
!.1Z - : asn JaleMpunoJ6pue aoepns alqeuaelsns AIielUaWuoJIAua JOJ SlUleJlSUOO pUB B!JOlUD £ 8-Z
iula6euesw IejUaWUOJ!Aua 6uiuielsns pue 6ui6euew JOl MaleJis Z-g-ZL Z laPOw juaWaAIOAU! AIpunuwuwoo -a9)weLU -)UaWWaAOE L 8ZL .. . ."I ............. "I'll" . ............. p.................................... 8 Ze wwooa Z
..................... .................... awi6al Io0luoo pue pueewwo 6uilsix o 0sXoemejC L!
.z sao!pJd lUaG aWJojUg 1uaufn 6uipie6ai (sluieilsuoo pue) swaouoo 9gZ...... I", - ---- IUOWuoJIAu3 Ao:Iad °1 pglelaS sde9 pue sanssi S Z
'v. .............................................. 0............. su j0j Ao d 6ui6u0 WZ
.; z V (uo!lnjlod 0 I4IUo0 'R U01UaUAGUd) JaleM a4i japun Al!qtsuodsaN i £ Z~~~~~~~~~~~~~~...: --------------------------------------------- Vomaweil je6a-j £ £ Z
.eZ ...... Ue4sfu 0 Aoilod leuIsnpul MGN Z--ZE.pZ .......................... a.uoo GAIIBJIs!U[wpe pue A°!Iad Vl£Z
Z ... oMawe4 o!padS-ooaS £ Z
[z.1@--@---- -- -xa1uoo eA!le11siu!wBPe ue AD!I0d I Z ZL'Z ... ---*- ----- e- ------- -sWMueilu! ........................................................ ZXIO AIJSUW BPeA10 VZ'
L'Z -------- ---- --- ------- -- .... I'llwa .............................. I.........................................V m w J leuIB ZZ
L'Z* .......... OMVWMA 3AIIVlUSINiWGV CNV 1VS1'AOflOd IVIN31AJNCIAN3 O'
. ........ ........ L.----------........................ weaIApnIs S . 1
£-.L uoileziue6Jo liodad t-LZ' ..>--------------------------...I........................................................ s-4sel AaM j z- L
LI ................................... sluawuaiinbai pue sauijap!nE Mueq Pl°oM L Z, L
V L ----- -........................................................... -............ - -3 lelolsas Z'
.L' --------------------------............................................................. *........ punoj6NOLs L'
IIX......................................................... S1*131 =10 A)VE SSOIS
X..................................... . .......... SWUNOUDYV GNV SNOIlVIA32iSSe
SlN31N00 =10 338I31

4.0 ENVIRONMENTAL BASELINE REVIEW . . ........................... 4.14.1 Preamble .................... 4.14.2 Sectoral Baseline Overview ................... 4.1
4.2.1 Physical environment ........................... 4.14.2.2 Chemical environment ........................... 4.54.2.3 Biological environment ........................... 4.104.2.4 Social and cultural environment ........................... 4.114.2.5 Community health environment ........................... 4.124.2.6 Overview of subsurface contamination ........................... 4.134.2.7 Summary of baseline conditions ........................... 4.134.2.8 Baseline data gaps ........................... 4.15
5.0 ENVIRONMENTAL ISSUES ....... ..................................... 5.15.1 Preamble ........................................................... 5.15.2 Water Quality Issues: ........................................................... 5.15.3 Social and Cultural Issues: ............................................................ 5.15.4 Water Transfer Issues ........................................................... 5.25.5 Environmental Management Issues ........................................................... 5.25.6 Categorzation of Environmental Issues ........................................................... 5.2
6.0 POTENTIAL CUMULATIVE ENVIRONMENTAL IMPACTS . .......................................... 6.16.1 Identification of Impacts ............................... . 6.16.2 Methodology ................................ 6.16.3 Impact Assessment Guidelines ............................... 6.16.4 Examples of Impact Assessment ............ ................... 6.2
6.4.1 RWRCP ............................... 6.26.4.2 Planned projects ............................... 6.26.4.3 Groundwater development changes ............................... 6.2
6.5 Impact Assessment Matrix ............................... 6.36.5.1 RWRCP activities ............................... 6.36.5.2 Planned projects ............................... 6.36.5.3 Groundwater development changes ............................... 6.4
7.0 ANALYSIS OF ALTERNATIVES ............... ........ 7.17.1 Preamble ........ 7.17.2 Methodology ........ 7.1
7.2.1 General ........ 7.17.2.2 Development objective .......................................... 7.17.2.3 Altemative development strategies .................. ........................ 7.17.2.4 Altemative resource management strategies . ............................ 7.17.2.5 Resource requirements ........ ......... .. ....................... 7.27.2.6 Screening of altemative resource management strategies ........................ 7.27.2.7 Identification of altemative locations .................. ........................ 7.27.2.8 Screening of altemative locations ................ .. ........................ 7.27.2.9 Evaluation of selected altematives ..................................... 7.27.2.10 Public involvement ........................................................... 7.27.2.11 Comparative assessment of realistic altematives .............. ........................ 7.27.2.12 Preferred altemative ................................................ 7.37.2.13 Optimum investment strategy ........................................................... 7.4
7.3 Assessment of Environmental Costs and Benefits ................................................. 7.47.3.1 Valuation of environmental impacts for RWRCP activities .......... .............. 7.47.3.2 Valuation of environmental impacts for ongoing and planned activities: .... 7.57.3.3 Environmental indicators of reduced groundwater recharge .......... ............ 7.57.3.4 Environmental related costs of measures to sustain positive impacts ........ 7.5
7.4 Recommendations ........................................................... 7.6
SEA Final Report - Volume 2 April 30, 2000Page iii
8.0 PUBLIC CONSULTATION .................. 8.18.1 Purpose .......................... 8.18.2 Methodology .......................... 8.18.3 Summary of Findings ......................... 8.2
8.3.1 Outside basin ......................... 8.28.3.2 Chambal basin ......................... 8.28.3.3 Mahi basin ......................... 8.28.3.4 Banas basin ......................... 8.3
8.4 Impact of Workshop on SEA Study ......................... 8.3
9.0 MITIGATION PLAN .............. . 9.19.1 Preamble ........................ 9.19.2 Summary of Mitigation Measures ....................... 9.19.3 Discussion ........................ 9.2
9.3.1 Integrated nutrient management ...................... 9.29.3.2 Integrated pest management .................... 9.29.3.3 Aquatic weed control .................... 9.39.3.4 Integrated water and agriculture management ......................... ........ 9.39.3.5 Provision of new drainage network ................................. 9.49.3.6 On-farm development ................................. 9.59.3.7 Monitoring and treatment of effluent disposal ................................. 9.59.3.8 Rural water supply and sanitation ................................. 9.69.3.9 Maintaining minimum instream flows ................................. 9.69.3.10 Groundwater management ..................................... 9.69.3.11 Infrastructure development ..................................... 9.79.3.12 100% membership in WUA's ..................................... 9.79.3.13 Community health ..................................... 9.7
9.4 Mitigation Costs ..................................... 9.8
10.0 INSTITUTIONAL STRENGTHENING PLAN . . ............................ 10.110.1 Scope ...................................... 10.110.2 Policy and Regulatory Instruments ..................................... 10.110.3 Institutional Re-organization and Strengthening ................................. 10.110.4 Environmental Management Training ................. .................... 10.3
10.4.1 Class room training ..................................... 10.310.4.2 Training of farmers/ WUAs ..................................... 10.310.4.3 Training in coordination with other agencies ..................................... 10.3
10.5 Institutional Strengthening Costs .. ................................... 10.410.5.1 Costs for RWRCP activities ..................................... 10.410.5.2 Costs for planned projects ..................................... 10.4
11.0 ENVIRONMENTAL MONITORING PROGRAM ........................................ 11.111.1 Preamble ......................................... 11.111.2 Objectives and Scope ........................................ 11.111.3 Descnption ........................................ 11.111.4 Environmental Monitoring Costs ........................................ 11.2
12.0 FOLLOW UP WORK ........................................ . 12.112.1 Update Data Base ........................................ 12.112.2 Additional Studies to Supplement the SEA ........................................ 12.112.3 Institutional, Legal and Administrative Reforms ........................................ 12.112.4 Applied Research ........................................ 12.2
13.0 SUMMARY OF SEA STUDIES FOR OTHER WRCPS . ................................ 13.113.1 Overview ........................................ 13.113.2 Haryana WRCP (1993) ........................................ 13.113.3 Orissa WRCP (1993 and 1994) ........................................ 13.1
SEA Final Report - Volume 2 April 30, 2000Page iv

13.4 Tamilnadu WRCP (HR Wallingford, 1993) ............................................ 13.1
13.5 Tungbhadra Irrigation Pilot Project, Phase II (TIPP 11, 1997) ................................ 13.213.6 IGNP Environmental Review (1998) ............................................ 13.213.7 Bisalpur Irrigation and Water Supply Project- Environmental and Socio-Economical
Action Plan (Hasan, 1992) ............................................ 13.3
14.0 ANNEXURES .......... 14.1
15.0 REFERENCES .......... 15.1
LIST OF BOXES
Box 2.1: Water Sector Projects Requiring EIA for Clearance by GOI ......................................... 2.2
Box 2.2: Aims and objectives of Rajasthan's Industrial Policy 1998 ............................................ 2.3
Box 2.3: Legislative Gaps .................................................... 2.5Box 2.4: Institutional Gaps .................................................... 2.5Box 2.5: Innovative Approaches for Environmental Compliance Culture .................................... 2.7Box 2.6: Strategies for effective Environmental Management and Enforcement ........................ 2.8Box 2.7: Typical Pollution Charges: Categories, Examples, Sources, Values ............................. 2.9
Box 2.8: Pollution Management Key Policy Lessons .................................................... 2.12Box 3.1: GOR Policy Reforms and RWRCP Preparation Studies ............................................... 3.1
Box 3.2: Water Supply Priorities in SWP .................................................... 3.2Box 3.3: Guidelines for Project Classification for EA Preparation ............................................... 3.9Box 4.1: Agro-Climatic Zones .................................................... 4.2Box 4.2: Groundwater Utilization .................................................... 4.3
Box 4.3: Frequency of Flooding Events in Different Basins .................................................... 4.4
Box 4.4 In-stream flow characterization for Rajasthan rivers .................................................... 4.6Box 4.5: Prime Industrial Districts .................................................... 4.7
Box 4.6: Special Industrial Complexes .................................................... 4.8Box 4.7: Pesticide Uses .................................................... 4.9
Box 4.8: Major Eco-systems of Rajasthan .................................................... 4.10Box 5.1: Cumulative Environmental and Social Conditions in the Water Sector ......................... 5.2Box 5.2: Key Environmental and Social Issues Sector-wide .................................................... 5.3
Box 6.1: Impact Assessment Guidelines .................................................... 6.1
Box 6.2: Positive Impacts of RWRCP .................................................... 6.3Box 6.3: Major Positive and Negative Impacts of Planned Projects ............................................ 6.3Box 6.4: Major Impacts of Groundwater Development Changes ................................................. 6.4
Box 7.1: Relative Scores for Environmental impacts .................................................... 7.3
Box 8.1: Highlights of Issues from Public Consultation .................................................... 8.4
Box 9.1: Measures to Sustain Positive Impacts .................................................... 9.1
Box 9.2: Mitigation Measures .................................................... 9.2
Box 9.3: Existing Conditions in Irrigation Systems .................................................... 9.4
Box 9.4: IWAM Activities Included in RWRCP .................................................... 9.4Box 9.5: Benefits of OFD .................................................... 9.5
Box 9.6: Typical OFD Works .................................................... 9.5
Box A4.11.1: Waste Characteristics of Dye Manufacturing Industry .. 14.25
Box A4.11.2: Waste Characteristics of Mixed Fertilizer Plants .. 14.25
Box A4.11.3: Waste Characteristics of Pesticide Manufacturing Plants .. 14.26
Box A4. 11 .4: Waste Characteristics of Sugar Manufacturing Plants .. 14.26
Box A4.11.5: Typical wastewater characteristics of Vegetable Oil Processing .. 14.26
Box A4.16.1: Selected Values for nutrient losses (FAO, 1996) .. 14.48
SEA: Final Report - Volume 2 April 30, 2000Page v

LIST OF FIGURES
Figure 1.1: Sectoral Environmental Assessment and the Project Cycle .......................................... 1.5Figure 2.1: Organizational Structure for Environmental Management Plan .................................. 2.14Figure 2.2: Rajasthan Water Sector Institutional Structure ........................................................... 2.15Figure 3.1: Ultimate Surface Water Utilization, Inter-Basin Transfers and Import from Outside
Rajasthan ......................................................................... 3.10Figure 3.2: Performance of Irrigation Sector with Constraints (Vicious Circle) .............................. 3.11
Figure 3.3: Improved Irrigation Management & Transfer (Virtuous Circie) ................................... 3.11
Figure 4.1: Cropping Pattem of Major Crops in Rajasthan (1996-97) ........................................... 4.16
Figure 4.2: Yield of Major Crops in Rajasthan, 1996-97 ............................................................... 4.16
Figure 4.3: Bio Mapping of Chambal and Tributaries & Point Source Pollution ............................. 4.17
Figure 4.4: Chemical Fertilizer Consumption in Rajasthan ........................................................... 4.18
Figure 4.5: Maximum Nitrate Concentration in Rajasthan ............................................................ 4.19Figure 4.6: Productivity of Crops in Rajasthan State .................................................................... 4.20
Figure 7.1: Analysis of Altemative Development Scenarios for SEA .............................................. 7.7Figure 10.1: Recommended Institutional Setup for Environmental Management . ................... 10.5
LIST OF TABLES
Table 2.1: Development policy reforms agenda of RWRCP ........................................................ 2.16
Table 3.1: Rajasthan Water Development ......................................................................... 3.12Table 3.2: Categorization of RWRCP ......................................................................... 3.13
Table 3.3: Categorization of Planned Projects ......................................................................... 3.14Table 3.4: Salient Features of Existing, On-going ad Proposed Surface Water Projects in
Rajasthan: Within Basin Resources ......................................................................... 3.15Table 3.5: Summary of groundwater potential of the state as on January 1998 ........................... 3.18Table 4.1: An overview of Baseline Environmental Conditions within Rajasthan ......................... 4.21
Table 4.2: Water Resource Utilization in Rajasthan .................................................................... 4.23Table 4.3: List of Flood Prone Areas ......................................................................... 4.24
Table 4.4: Groundwater Quality Problems ......................................................................... 4.25
Table 5.1: Environmental Issues Summary ......................................................................... 5.4
Table 5.2: Critena for Categorizing Environmental Issues .............................................................. 5.5Table 5.3: Basin-wise Assessment of Issues ......................................................................... 5.6
Table 6.1: Sectoral EMP: Impact Assessment matrix for RWRCP ................................................ 6.5Table 6.2: Sectoral EMP: Impact Assessment Matrix for Planned Projects ................................... 6.7
Table 6.3 Sectoral EMP: Impact assessment matrix for groundwater development outside canalcommand areas ........................................................................... 6.10
Table 7.1: Sectoral EA: Analysis of Altematives: Interactive Impact Assessment Matrix ................ 7.8
Table 7.2: Summary of Comparative Assessment of Altematives ................................................. 7.3
Table 7.3 Health cost reduction for RWRCP activities ................................................................. 7.5Table 8.1. Public Consultation Workshop details .......................................................................... 8.1
Table 9.1: Cost of Environmental Mitigation Measures ................................................................. 9.9
Table 10.1: Recommended Institutional Roles and Responsibilities for EnvironmentalManagement ................................................................ 106........
Table 10.2: Cost Estimates for Institutional Strengthening .............................................. .............. 10.7
Table 10.3: Recommended Training Program for Environmental Management ........................... 10.8
Table 10.4: Training Costs for Environmental Management ............................ 1 ............................. 10.9
Table 10.5: Summary of Institutional Strengthening Cost .............................................................. 10.4Table 11.1: Environmental Monitoring Program in Relation to Impacts for RWRCP and Planned
Projects .......................................................................... 11.3
Table 11.2: Surface Water Monitoring Stations (Existing and Proposed) ....................................... 11.4
Table 11.3: List of Additional Inst.uments for Proposed Analysis of Environmental Parameters
Related to Soil and Water Analysis .......................................................................... 11.5
Table 11.4: Cost Analysis for Testing of Proposed Soil and Water Quality Monitoring .................. 11.6
SEA: Final Report - Volume 2 April 30D 2000Page vi

Table A4.11.1: Selected Industrial Effluent Data Monitored by State Pollution Control Board,Jaipur ....................................................................... 14.27
Table A4.11.2: Effluent Discharge Requirements: Parameters and Maximum Values,Miscellaneous Parameters............I ....... 14.28
Table A4.11.3: Effluent Discharge Requirements: Parameters and Maximum Values, Metals ..... 14.29Table A4.12.1: Groundwater Draft 1995 & 1998 ....................................................................... 14.34Table A4.12.2: Basin-wise Groundwater Recharge, Extraction & Stage of Groundwater
Development in Command & Non-Command Areas of State of Rajasthan as on1.1.98 .................... 14.35
Table A4.12.3: SWP Summary State Water Balance for a 50% Dependable Climatic State inPlanning Stage 2045, Mm3/yr .................... 14.37
Table A4.13.1: Groundwater monitoring activiies in Haryana ..................................................... 14.40Table A4.13.2: Other systematic groundwater data acquisition activities in Haryana ................... 14.41
UST OF MAPS
Map 3.1: Existing and On-going Projects ............................................................. 3.19Map 3.2: RWRCP and Planned Projects (Upto 2015) ............................................................. 3.20Map 5.1: Map of Rajasthan EMP Basins ............................................................. 5.8Map 11.1: Existing Surface Water Monitoring Gauging Stations ................................................. 11.6Map 11.2: Proposed Surface Water Monitoring Gauging Stations ............................................... 11.7Map 4.1: Average Annual Rainfall in Rajasthan. 14.50Map 4.2: Rajasthan agro-climatic zones and irrigation demand zones. 14.51Map 4.3: Physiographic regions of Rajasthan. 14.52Map 4.4: Soil map of Rajasthan .14.53Map 4.5: Groundwater depth in November, 1998 .14.54Map 4.6: Groundwater exploitation. 14.55Map 4.7: Change in groundwater depth (pre-monsoon 1984 & 1998). 14.56Map 4.8: Flood Prone areas in Rajasthan. 14.57Map 4.9: Intensity of cropping in Rajasthan. 14.58Map 4.10: Prime Industrial Areas and Industrial Hot Spots. 14.59Map 4.1 1: Municipal Waste/Sewage Teatment Plants ........................................ 14.60Map 4.12: Annual Fertilizer Consumption in Terms of Nutrients during 1997-98 .14.61Map 4.13: Annual Consumption of plants protection measures (Pesticides) during 1997-98 .14.62Map 4.14: Distribution of electrcal conductivity and flouride in groundwater .14.63Map 4.15: Forest areas & protected areas relative to Planned Projects in Rajasthan. 14.64Map 4.16: Dominant eco-systems based on biodiversity .14.65Map 4.17: Rajasthan biodiversity heritage and tourism areas. 14.66Map 4.18: Typical Industries in the Banas Basin (Udaipur Region). 14.67
UST OF PHOTOGRAPHS
Photo 1: Rainfedlgroundwater irrigated cropPhoto 2: Industrial effluent discharge into surface waterPhoto 3: Industrial discharge adjoining urban centresPhoto 4: BiodiversityPhoto 5: Livestock pollutionPhoto 6: Untreated municipal wastewater into riverPhoto 7: Aquatic weed growthPhoto 8: Point source pollution into irrigation canalPhoto 9: Participants at Public Consultation Workshop, UdaipurPhoto 10: Participants at Public Consultation Workshop, UdaipurPhoto 11: Participants at Public Consultation Workshop, BanswaraPhoto 12: Participants at Public Consultation Workshop, Kota
SEA Final Report - Volume 2 April 30, 2000Page vii

LIST OF ANNEXURES
Annexure 2.1: Central Govemment Roles and Responsibilities of Water SectorDevelopment ............. 14.1
Annexure 2.2: Summary of Policies Related to Water Sector and Environmental Protection:Govemment of India ............. 14.3
Annexure 2.3: State Govemment Roles and Responsibilities of Water SectorDevelopments ........ 14.4
Annexure 2.4: Summary of Policy and Acts Related to Water Sector and EnvironmentalProtection: Govemment of Rajasthan ................................................... 14.6
Annexure 2.5: Mechanisms for Developing a Culture of Industrial EnvrionmentalCompliance ...... 14.8
Annexure 2.6: Limits for Process waste water, domestic Sewage, and ContaminatedStormwater Discharged to Surface Waters for General Application .14.9
Annexure 2.7: Treated Wastewater Quality Requirements. 14.9Annexure 2.8: Draft Environmental Policy with Regards to Water Management. 14.10Annexure 3.1: Source of surface water taken into account for the cities and towns of
Rajasthan for non-irrigation water demand ............................. 14.11Annexure 3.2: Non-irrigation Water Demands and Supply, Mm3/yr (in the 90% dependable
Climatic State) ........ 14.12Annexure 4.1: Pnmary Water Quality Criteria for Various Uses of Fresh Water, as laid
down by the Central Pollution Board. 14.13Annexure 4.2: Biological Water Quality Criteria .14.14Annexure 4.3: Project Amounts of Reclaimable Urban Sewage and Approx Minimum Areas
which can be Imgated. 14.15Annexure 4.4: Extent of Salt Affected Area Under Irrigation in Rajasthan (1969) .14.16Annexure 4.5: List of Rare and Endangered Plants of Rajasthan .14.17Annexure 4.6: Vegetation in Different Habitats of Rajasthan. 14.18Annexure 4.7: General Characteristics of the 'Biodiversity Habitats' in Existing Different
Major Ecosystems of Rajasthan., 14.20Annexure 4.8: Environmentally Sensitive and Protected Areas of Rajasthan. 14.21Annexure 4.9: Endangered Wildlife Species of Rajasthan .14.22Annexure 4.10: Incidence of Water Related Diseases in Rajasthan (1994- 97). 14.24Annexure 4.11 Typical Waste Water Characteristics and Effluent Discharge Requirements 14.25Annexure 4.12: On the Longterm Estimates of Groundwater Potential in Rajasthan . 14.30
A4.12.1 Preamble .14.30A4.12.2 GWD Estimate. 14.30A4.12.3 Limitations of GEC Method .14.30A4.12.4 Impacts of Groundwater Management based on the GEC Methodology .14.33A4.12.5 Long term water level fluctuation method. 14.33A4.12.6 SWP Results ............................ 14.33A4.12.7 Summary .14.33
Annexure 4.13: Groundwater Data Collection, Processing and Analysis in World Bank (1998)India-Water Resources Management Sector Review GroundwaterManagement Report .14.38
Annexure 4.14: The Groundwater Estimation Methodology of the Groundwater EstimationCommittee (World Bank, 1998) .14.42
Annexure 4.15: Impacts of Groundwater Management ........................................... 14.43A4.15.1 General .14.43A4.15.2 Database. 14.43A4.15.3 Present Status of Groundwater Development. 14.43A4.15.3.1 Chambal Basin .14.43A4.15.3.2 Outside Basin. 14.44A4.15.3.3 Mahi Basin. 14.44A4.15.3.4 Banas Basin .14.45A4.15.3.5 Group 5 Basin .14.45
SEA: Final Report - Volume 2 April 30, 2000Page viii

A4.15.3.6 Group 6 Basin .......... 14.45A4.15.3.7 Luni Basin .......... 1 4.46A4.15.3.8 Sabarmati Basin .......... 14.46A4.15.3.9 Group 9 Basin ......... 14.46A4.15.4 Basin-wise Impact Assessment for Groundwater Development Changes ..... 14.47A4.15.5 Recommended Follow-up Work ....................................................... 14.47
Annexure 4.16: Impacts of Fertilizers and Pesticides on Water Quality ................................ 14.48A4.16.1 Field Data ....................................................... 14.48A4.16.2 Citing from Literature ....................................................... 14.48A4.16.2.1 Impact of Fertilizer Application ....................................................... 14.48A4.16.2.2 The Impact of Pesticide Applications ....................................................... 14.48A4.16.2.3 Experience in Pakistan (UNESCO, 1999) .................................................... 14.49
Annexure 7.1: Suggested Framework for Assessment of Social and Economic Costs ofAltemative Strategies/investments in a Project-Specific Setting .. 14.69
Annexure 7.2: Baseline Survey data on Selected Envronmental, Socio-economic andHealth Condtions, 1999 ....................................................... 14.70
Annexure 9.1: Criteria for Minimum in-stream Environmental Flows for Perennial Rivers ... 14.72Annexure 10.1: Training Needs Assessment ....................................................... 14.73Annexure 10.2: Training Needs Assessment: Check List ...................................................... 14.74Annexure 11.1: Water Quality Guidelines ....................................................... 14.76Annexure 11.2: Imgability Classes of Water ....................................................... 14.77Annexure 11.3: Water Quality Criteria for Classification of Groundwater .............................. 14.77Annexure 11.4: Water Quality Guidelines Note ....................................................... 14.78Annexure 11.5: Water Quality Guidelines for Selected Nutrients .......................................... 14.79Annexure 11.6: Water Quality Guidelines for Selected Bacteria ........................................... 14.79Annexure 11.7: Water Quality Guidelines for Selected Pesticides ........................................ 14.79Annexure 11.8: Standard Maximum Residue level of different insecticides .......................... 14.80Annexure 11.9: Existing and Proposed Monitoring Program for Environmental Parameters
for RWRCP and Planned Projects ...................................... 14.81Annexure 13.1: Haryana Water Resources Consolidation Project ...................................... 14.82Annexure 13.2: Orissa Water Consolidation Project ...................................... 14.83Annexure 13.3: Tamil Nadu Water Resources Consolidation Project .................................... 14.84
SEA Final Report - Volume 2 April 30, 2000Page ix

ABBREVIATIONS AND ACRONYMS
AARO Assistant Agriculture Research GWD Groundwater DepartmentOfficer GWW Groundwater Wing
ACE Additional Chief Engineer Ha HectaresAD Agnculture Department HIECP Health Information, Education andADC Area Development Commissioner Communication ProgrammeADP Agricultural Development Project HG HydrogeologistAE Assistant Engineer HQ Head QuartersARO Assistant Research Officer HR Human Resourcesamsl Above mean sea level HRD Human Resources DevelopmentAWM Aquatic Weed Management I&D Irrigation and Drainage systemB/C Benefit Cost ID Irrigation DepartmentBGA Blue Green Algae ID & R Investigation, Design and Researchbgl Below Ground Level UnitBIS Bureau of Indian Standards IDS Institute of Development StudiesBNF Biological Nitrogen Fixing IEC Information, Education andBOD Biochemical Oxygen Demand CommunicationCAA Command Area Authority IGNB Indira Gandhi Nahar BoardCAD Command Area Development IGNP Indira Gandhi Nahar ParyojnaCADA Command Area Development IGNPD Indira Gandhi Nahar Pariyojna
Authority DepartmentCADD Command Area Development IMD Indian Meteorological Department
Department IMTI Irrigation Management and TrainingCCA Culturable Command Area InstituteCE Chief Engineer INM Integrated Nutrient ManagementCETP Common Effluent Treatment Plant IPM Integrated Pest ManagementCGWB Central Groundwater Board IPNM Integrated Plant NutrientCHG Chief Hydrogeologist ManagementCOD Chemical Oxygen Demand ISR Institutional Strengthening andCPCB Central Polluting Control Board RestructuringCWC Central Water Commission IWAM Integrated Water and AgriculturalDOE Directorate of Environment ManagementDRDA District Rural Development JE Junior Engineer
Authority Jr.HG Junior HydrogeologistEA Environmental Assessment LDC Lower Divisional ClerkEAP Environment Action Plan MAF Million Acre FeetEC Electrical Conductivity dS/m MIS Management Information SystemsEE Executive Engineer MISD Minor Irrigation SchemesEEM Environmental Effect Matrix DirectorateEDBMS Environmental Database MOEF Ministry of Environment and Forest
Management System MOWR Ministry of Water ResourcesEIA Environmental Impact Assessment MRL Maximum Residue LevelEIC Engineer-in-chief NEERI National Environmental EngineeringEMP Environmental Management Plan Research InstituteERR Environment, Rehabilitation and NGO Non Govemment Organisation
Resettlement No. NumberESDS Environmentally Sound NPU Nodal Planning Unit
Development Strategy O&M Operation and MaintenanceESTI Engineering Staff Training Institute OD Operational DirectiveFD Forest Department OFD On-Farm-DevelopmentFOT Farmers Organization and Tumover OP Operation PolicyFZA Flood Plan Zoning Authority OSD Officer on Special DutyGIS Geographical Information System PAP Project Affected PersonsGOI Govemment of India PERT Program Evaluation and ReviewGOR Govemment of Rajasthan TechniqueGW GroundwaterSEA: Final Report - Volume 2 April 30, 2000
Page x
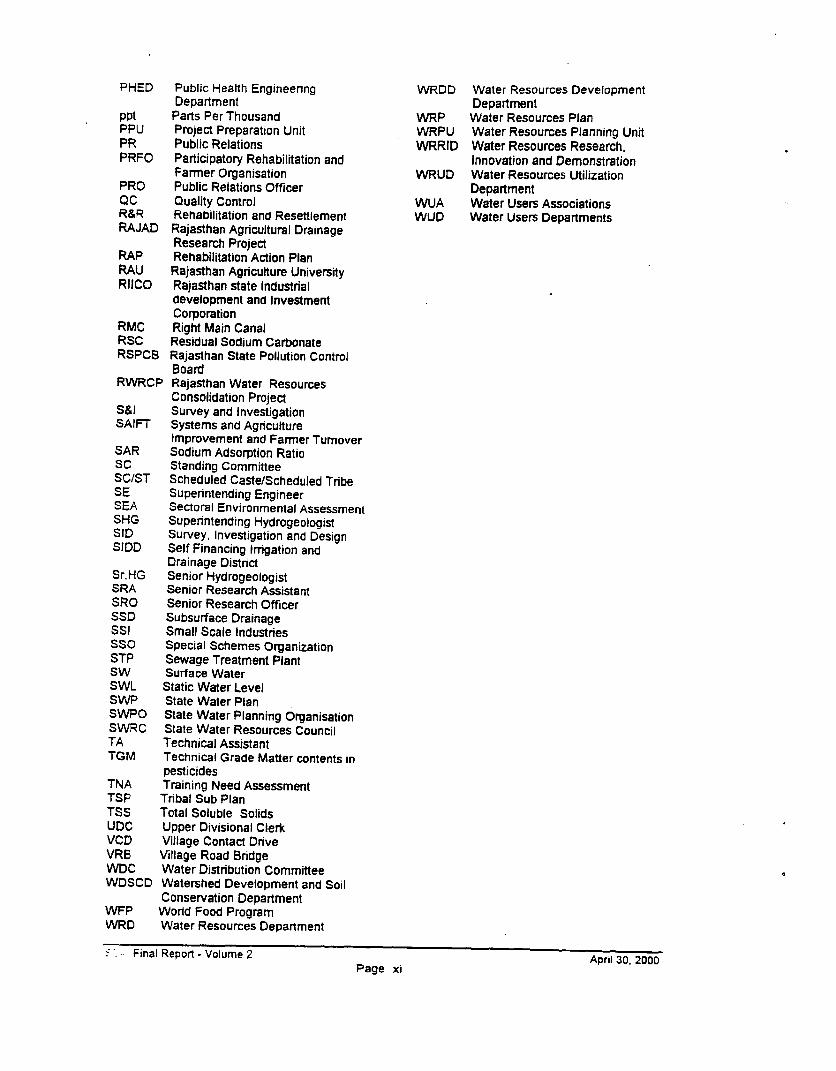
PHED Public Health Engineering WRDD Water Resources DevelopmentDepartment Department
ppt Parts Per Thousand WRP Water Resources PlanPPU Project Preparation Unit WRPU Water Resources Planning UnitPR Public Relations WRRID Water Resources Research,PRFO Participatory Rehabilitation and Innovation and Demonstration
Farmer Organisation WRUD Water Resources UtilizationPRO Public Relations Officer DepartmentQC Quality Control WUA Water Users AssociationsR&R Rehabilitation and Resettlement WUD Water Users DepartmentsRAJAD Rajasthan Agricultural Drainage
Research ProjectRAP Rehabilitation Action PlanRAU Rajasthan Agriculture UniversityRIICO Rajasthan state Industrial
development and InvestmentCorporation
RMC Right Main CanalRSC Residual Sodium CarbonateRSPCB Rajasthan State Pollution Control
BoardRWRCP Rajasthan Water Resources
Consolidation ProjectS&l Survey and InvestigationSAIFT Systems and Agriculture
Improvement and Farmer TumoverSAR Sodium Adsorption RatioSC Standing CommitteeSC/ST Scheduled Caste/Scheduled TribeSE Superintending EngineerSEA Sectoral Environmental AssessmentSHG Superintending HydrogeologistSID Survey, Investigation and DesignSIDD Self Financing Irrigation and
Drainage DistrictSr.HG Senior HydrogeologistSRA Senior Research AssistantSRO Senior Research OfficersSD Subsurface DrainageSSI Small Scale IndustriesSSO Special Schemes OrganizationSTP Sewage Treatment PlantSW Surface WaterSWL Static Water LevelSWP State Water PlanSWPO State Water Planning OrganisationSWRC State Water Resources CouncilTA Technical AssistantTGM Technical Grade Matter contents in
pesticidesTNA Training Need AssessmentTSP Tribal Sub PlanTSS Total Soluble SolidsUDC Upper Divisional ClerkVCD Village Contact DriveVRB Village Road BridgeWDC Water Distribution CommitteeWDSCD Watershed Development and Soil
Conservation DepartmentWFP World Food ProgramWRD Water Resources Department
c Final Report - Volume 2 April 30, 2000Page xi

GLOSSARY OF TERMS
Abadi Primary village in the Outside BasinAnalysis of Altematives: Systematic comparison of proposed investment, design, site,
technology and operational altematives in terms of their potentialEnvironmental Impacts
Bigha Unit of land area: approx 50 m x 50 mChak The unit of land served by one watercourse, generally 100 to 400 ha.Closed Area An area declared under wildlife (protection) Act, 1972 in which no
hunting of any wildlife animal is permitted for the specified period.Command Area Those areas deemed irngable by the canal network according to the
Irrigation Department survey.Dhani Dispersed hamlet.Diggi Open water reservoir.Gaur Culsterbeen.EA Instrument: A range of instruments that can be used to satisfy the Banks EA
requirements; EIA, regional or sectoral EA; environmental audit;hazard or risk assessment; and EMP.
Environmental Impact An instrument to identify and assess the potential environmentalAssessment (EIA): impacts of a proposed project, evaluate altematives, and design
appropriate mitigation, management, and monitoring measures.Projects and subprojects need EIA to address important issues notcovered by any applicable regional or sectoral EA.
Environmental Management An instrument that details (a) the measures to be taken during thePlan: implementation and operation of a project to eliminate or offset
adverse environmental impacts, or to reduce them to acceptablelevels: and (b) the actions needed to implement these measures. TheEMP is an integral part of Category A EAs (irrespective of otherinstruments used). EAs for Category B projects may also result in anEMP. The management plan is sometimes known as an 'action plan'.
Environmental screening: Screening of each proposed project into one of four categories todetermine the appropriate extent and type of EA: Category A;Category B; Category C; Category Fl.
Kharif Monsoon cropping season.Lac One hundred thousand.Mandi MarketMitigation Measures: Encompass all actions taken to eliminate, offset or reduce potentially
adverse environmental impacts to acceptable levels.
Nahar Canal.National Park An area declared under the Wildlife (Protection) Act, 1972, for all
times to come to conserve the natural or historical objects of nationalsignificance and conserve wildlife in them.
Nomads Wandering Tribal GroupsProtected Areas All national parks, sanctuaries and closed areas.Rabi Winter Cropping seasonRegional EA: An instrument that examines environmental issues and impacts
associated with a particular strategy, policy, plan, or program, or witha series of projects for a particular region (eg. an urban area, awatershed, or coastal zone); evaluates and compares the impactsagainst those of altemative options: assesses legal and institutional
SEA. Final Report - Volume 2 April 30, 2000Page xii

aspects ,o the issues and impacts; and recommends broadmeasL -engthen environmental management in the region.Regio;f .ys particular attention to potential cumulative impactsof mulu:. -wies.
Reserved Forest Any forest land or waste land which is the property of or over hwichthe State Govement has proprietary right, notified by the StateGovemment in the official Gazette.
Sanctuary An area declared under the Wildlife (Protection) Act, 1972 in whichkilling, hunting, shooting or capturing of any species of birds oranimals is prohibited except by an order of the competent authority.
Sectoral EA: An instrument that examines environmental issues and impactsassociated with a particular strategy. policy, plan, or program, or witha series of projects for a specific sector (e.g. power, transport, oragriculture); evaluates and compares the impacts against those ofaltemative options; assesses legal and institutional aspects relevantto the issues and impacts; and recommends broad measures tostrengthen environmental management in the sector. Sectoral EApays particular attention to potential cumulative impacts of muftipleactivities.
Unclassified Forest The forest land or waste land which is property of the StateGovemment or over which the State Govemment has proprietaryrights but not included in reserved forest and protected forest areas.
SEA: Final Report - Volume 2 Apnl 30, 2000Page xiii

1.0 INTRODUCTION


1.0 INTRODUCTION
1.1 Background
The Govemment of Rajasthan (GOR) has initiated policy reforms in the irrigation sector startingwith the World Bank financed Agrcultural Development Project (ADP) since 1992. A State WaterPlan (SWP) has been developed in 1998. The proposed state-level Rajasthan Water ResourcesConsolidation Project (RWRCP) will increase the economic, technical, environmental, and socialsustainability of Rajasthan's irrigation sector, and the GOR commitment to and subsequentimplementation of policy refomns and improved water sector performance. The key componentsof RWRCP are improved inigation management, agricultural intensification and groundwatermanagement, together with associated complementary policy actions.
Since 1995, the Bank has been discussing with GOR the salient features of the RWRCP, the mainissues and commitments that should be addressed for the preparation and appraisal of theproject. The Bank's appraisal of RWRCP is scheduled to conclude upon GOR finishing theongoing preparatory activities and studies related to policy reforms and issues, one of which is theenvironmental management. The proposed actions related to envimnmental management arethe development of an action plan based on Sectoral Environmental Assessment (SEA) and toappoint an environmental unit in the State Water Planning Organization (SWPO) which will beconstituted to monitor the environmental issues related to the entire water sector, includinggroundwater.
As a planning tool, the SEA has the opportunity to address the envimnmental issues related topolicy, planning, legal and the institutional framework, for its use to achieve long-tefm sustainablesolutions, and for supporting environmentally sound sector-wide investment strategies. The studywill address avenues to improve the environmental, and social sustainability of Rajasthan'swater sector. It is conducted upstream in the planning phase of the RWRCP where majordecisions have not yet been made (Figure 1.1). It is expected that the quality of sector planningfrom environmental standpoint will be increased and the need for project specific EnvironmentalAssessment (EA) work and associated costs will be reduced downstream.
The SEA is a state-level undertaking of the water sector, encompassing the RWRCP and others inthe SWP as the candidate projects. As the SWP will likely be updated every five years or so bythe SWPO, the focus of this study was on the environmental aspects of the proposed RWRCP.Development in other water related sub-sectors (municipal, industrial and ecological uses of water)have also been addressed within the context of environmental management.
1.2 Sectoral EA
i.2.1 World Bank Guidelines and requirements
The SEA is required during the project preparation stage of the RWRCP and will fomn an integralcomponent of the project. As in other WRCPs of Orissa, Tamil Naau and Haryana states, theSEA is of considerable relevance to Rajasthan, where a large number of State-level projects are inthe lending program because: they are substantially programmatic and not all activities will befully defined at the appraisal stage; the main environmental issues concem monitoring andmanagement rather than impacts from new construction projects; and, environmental conditionsrelated mainly to water quantity and quality are becoming increasingly important. Thegovemment needs improved technical advice on how to cope with these challenges at theinstitutional and policy level.
The SEA is particularly suitable for reviewing: Sector investment alternatives; Effect of sectorpolicy changes; Institutional capacities and requirements for environmental review,implementation and monitoring at sectoral level; uumulative impacts of many relatively small,similar investmerns that do not merit project specific EAs; institutional capacity andrequirements for EA, implementation and monitoring of EMPs at the sectoral level. SEAs serve toidentify relevant environmental and social issues and compile data for specific EAs.
SEA: Final Report - Volume 2 April 30, 2000Page 1.1
The Bank requires GOR to undertake the SEA for the project and have it cleared by the Ministry ofEnvironment and Forests of the GOI and the Bank.
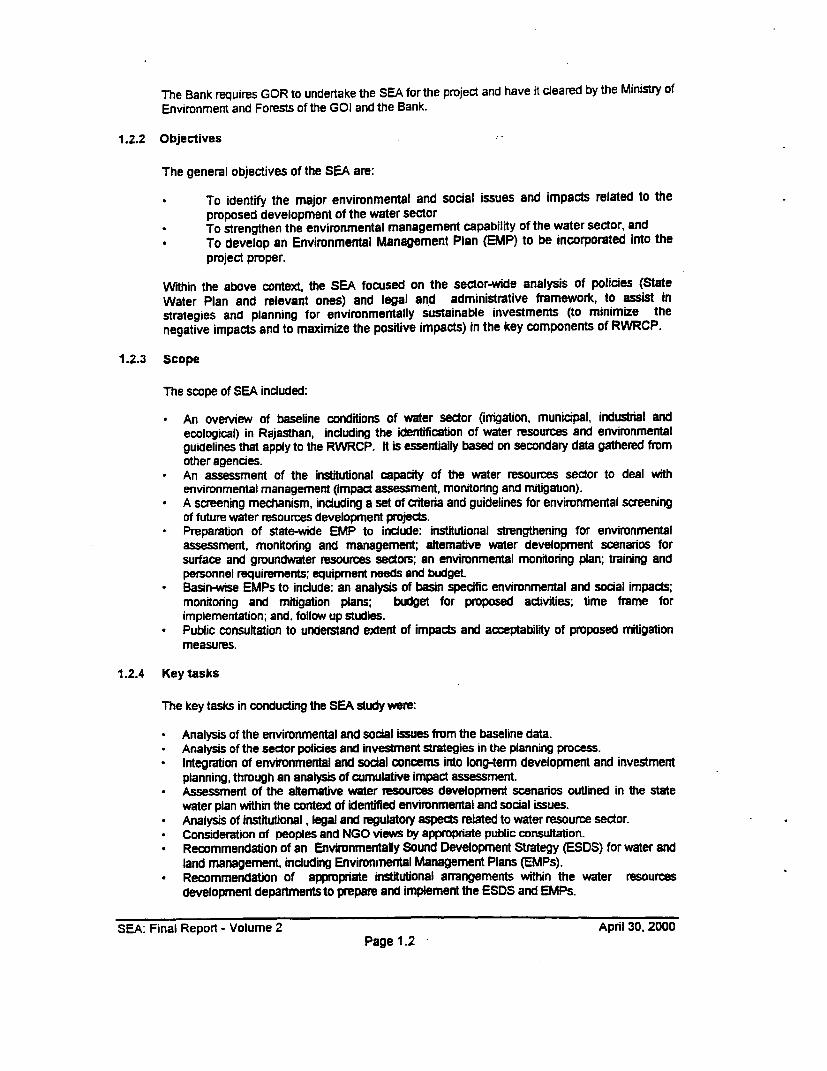
1.2.2 Objectives
The general objectives of the SEA are:
To identify the major environmental and social issues and impacts related to theproposed development of the water sector
* To strengthen the environmental management capability of the water sector, and* To develop an Environmental Management Plan (EMP) to be incorporated into the
project proper.
Within the above context, the SEA focused on the sector-wide analysis of policies (StateWater Plan and relevant ones) and legal and administrative framework, to assist instrategies and planning for environmentally sustainable investments (to minimize thenegative impacts and to maximize the positive impacts) in the key components of RWRCP.
1.2.3 Scope
The scope of SEA included:
* An overview of baseline conditions of water sector (imgation, municipal, industrial andecological) in Rajasthan, including the identification of water resources and environmentalguidelines that apply to the RWRCP. t is essenially based on secondary data gathered frmother agencies.
- An assessment of the institutional capacity of the water resources sector to deal withenvironmental management (impact assessment, monitoring and mitigation).
* A screening mechanism, including a set of criteria and guidelines for envimnmental screeningof future water resources development pmjects.
* Preparation of state-wide EMP to include: institutional strengthening for environmentalassessmernt, monitoring and management; attemative water development scenarios forsurface and groundwater resources sectors; an environmental monitoring plan; training andpersonnel requirements; equipment needs and budget.
* Basin-wise EMPs to include: an analysis of basin specific envimnmental and social impacts;monitoring and mitigation plans; budget for proposed activities; tme frame forimplementation; and, follow up studies.
* Public consultation to understand extent of impacts and acceptability of pmposed mitigationmeasures.
1.2.4 Key tasks
The key tasks in conducting the SEA study were:
Analysis of the envimnmental and social issues frm the baseline data.Analysis of the sector policies and investment strategies in the planning process.
* Integration of envimnmental and social concems into long-termn development and investmentplanning, thmugh an analysis of cumulative impact assessment.
* Assessment of the aftemative water resources development scenarios ouUined in the statewater plan within the context of identified envimnmental and social issues.
* Analysis of institutional , legal and regulatory aspeCts related to water resource sector.* Consideration of peoples and NGO views by appropriate public consultation.* Recommendation of an Environmentally Sound Development Strategy (ESDS) for water and
land management, including Envimrnmental Management Plans (EMPs).* Recommendation of appmpriate institutional arrangements within the water resources
development departments to prepare and implement the ESDS and EMPs.
SEA: Final Report - Volume 2 April 30,2000Page 1.2

1.3 Report Organization
The SEA report is prepared in three volumes :Summary report (Volume 1); this main report(Volume 2); and basinrwise EMPs (Volume 3).
This state-wide report is organized following the appropriate World Bank Environmental SourceBook updates specifically related to SEA preparation, the Operational Policy OP 4.01, and otherrelated guidelines in the senes.
Secion 2. Environmental Policy, Legal and Administrative Framework (national and Rajasthansector), including an assessment with respect to gaps for EA preparation and review, institutionalcapacity, agencies responsible for environrnental services and social issues.
Secion 3. Project Desaiption, including the nature and objectives, on-going studies and theirrelevance to the SEA, and identification of key issues wiftin the sector.
Section 4. Sedoral Environmental Baseline Data Review induding an evaluation of cumentenvironmental situation, focus on the typical environmental issues for the sector as a whole.
Section 5. Environmental Issues such as, sectoral growth trends and emerging inter-sectoralissues, inter-state and intra. basin water transfer issues, health related issues, including screeningof key issues.
Secton 6. Potential Cumulative Environmental Impacts with Focus on three key components ofRWRCP which are: Improved lnigation Management, Agricultural Intensification, andGroundwater Management. A qualitative analysis (and quantitative analysis where possible) ofcumulative impacts, positive and negative, short temn and long term, and direct and indirect, inrelation to developing plans and programs. Modeling acfivity to prdict the impacts of RWRCP onquantity and quality aspects of surface and groundwater resources was beyond the scope of thisSEA study.
Section 7. Analysis of Altemative water development scenarios outiined in the SWP in the contextof identified social and environmental issues, focus will be on the alternative strategiesf policies/plans for water resources development in terms of comparative assessment (measured byseverity of environmental and social impacts) induding available options, and without projectscenario.
Section 8. Public Consultations with the affected groups in various basins. It indudes a summaryof the outcome from the workshops organized at Hanumangarh, Kota, Banswara, and Udaipurconsultations with relevant govemment agencies at Jaipur, and, their effect on the envirnmentaland social impacts of the projects.
Section 9. Environmental Mgigation Plans consisting of Integrated Nutrient Managemern,Integrated Pest Management, Aquatic weed control, Integrated Water and AgriculturalManagement, anc Water Quality Management, in addition to the Sustainable GroundwaterManagement component of the RWRCP.
Section 10. Institutional Strengthening Plan for Environmental Management and Training whichincludes: recommended policy and regulatory instruments for environmental management andenforcement sector, training of existing staff; hiring of new staff/ reorganiation of existingunits/agencies.
Section 11. Environmental Monitoring Plan based on the base One data section. It includes thegeneral guidelines for long-term sector-wide environmental monitoring to ensure adequateimplementation of investments.
Secion 12. Follow-up work for site specific environmerntal issues, applied research studies forsubsequent environmental assessment, for mid-term review of the projects, RWRCP and others.
Section 13. Summary of SEA studies for other WRCPs
Section 14: Annexures
Section 15. References\ bibliography
SEA: Final Report - Volume 2 April 30, 2000Page 1.3

1.4 SEA Study Team
The SEA study team consisted of expertise drawn from similar projects undertaken by theteam members working on intemational and local projects. The following are the keyprofessionals and support personnel:
* Project Management* Dr. N.A. Visvanatha, Team Leader and Principal Author of Report* Mr R.C. Bower, Project Principal* Dr. Chandra Madramootoo, Project Advisor* IiMr. J.W. Thiessen, Policy Advisor* Mr. B.P. ehatnagar, Project Advisor
Study Team* Ms. Leslie A. ZlJm, Envimnmental Scientist* Dr. K.V.G.K. Rao, Irrigation & Drainage Specialist* Dr. Sewa Ram, Irrigation & Drainage Specialist* Dr. LK. Dadhich, Environmental Biologist* Dr. R.C. Swarankar, Anthropologist* Dr. L.N. Vyas, Plant Ecologist* Dr. S.N. Mundra, HRD & Training Advisor* Mr P.L. Vaya, Senior Hydrogeologist
* Support personnel for data processing, report typing and re-production* Ms Uma Singh* Mr S S Chaudharyd Mr Satyendra Garg* Mr Rajendra Gautam* Mr Ramkumar Agarwal
SEA: Final Report - Volume 2 April 30, 2000Page 1.4

Environmnta creenn ora nvnmental Assesg 3
ent ton Planned Projects c irmDvelopment Projcts.......
- s ~~~~~~~~~~~~~~~DESIGN PHASE ........St -. -Enhancement of environmental benefits Specific.EA
- , .- -. _ _. ,: _* - (Review EnvironmentaPost Implementation: --- ...... _ _ . _ _ . _ -- Findings
Monitoring on o
: s ApprovalN _ . Process
IMPLEMENTATION PHASE % APPROVAL PHASECompletion - Environmental & social benefits
- Change In quality of life0 ......... ~~~~~~~~~~~~~~~~~~~~~~~~~~~by GORIG01
Environmental ) \, i Negotiationimproveme Ion n urng Process
Implementation
Implementatlon Funding ncorporate Environmental7 _ of Projects / Approval oncern
iMan Streaming of EMP D o(Further Studies)~~~~~ur
Figure 1.1: Sectoral Environmental Assessment and the Project Cycle
SEA: Final Report - Volume 2 Page 1.5 April 30, 2000


2.0 ENVIRONMENTAL POLICY, LEGAL AND ADMINISTRATIVE FRAMEWORK


2.0 ENVIRONMENTAL POLICY, LEGAL AND ADMINISTRATIVE FRAMEWORK
2.1 Preamble
Water is a state subject and so is imgation management. GOR is responsible for storage,exploitation and use of its water resources. Water imports from interstate river basins aregovemed by the respective agreements. The roles and responsibilities, policies and relevantacts of Govemment of India (GOI) and state govemment of Rajasthan (GOR) related towater sector are summarized in Annexure 2.1 to 2.4. Presently, GOR is the only decisionmaking actor in the sector.
This section provides a bref review of environmental policy, legal and administrativeframework, (national and sector-specific) of water sector. These are assessed forcompleteness and appropriateness and problems of the sector, gaps and weaknesses arenoted. Ongoing policy reforms which are currently undertaken by the GOR (Table 2.1) inpreparation for the RWRCP activities are also reviewed within the context of environmentalmanagement.
2.2 National Framework
India's environmental management system is primarily govemment-centered (Figure 2.1). Itdoes however employ fiscal incentives to ensure that industries are motivated to comply withvarious environmental standards prescribed under different acts and rules to control andprevent pollution.
Some major fiscal incentives for the industrial sector are: exemption from income tax,depreciation allowance, investment allowance, exemption from tax on capital gains,reduction of excise duties etc. Incentives applicable to irrigation and agricultural sector arenot specified.
2.2.1 Policy and administrative context
The key GOI ministries responsible for water sector development within the context of thesectoral EA are the Ministry of Water Resources (MoWR), and the Ministry of Environmentand Forest (MoEF) of which the monitoring agency is the Central Pollution Control Board(CPCB). Other ministries are agriculture, rural development, power and urban development(Annexure 2.1).
MoWR: This Ministry is responsible for laying down policy guidelines and programs for thedevelopment and regulation of country's water resources. The functions listed in Annexure2.1 give a broad picture of the Central Govemment's jurisdiction and responsibilities in thewater resources sector.
MoEF: The environment related framework evolved largely since the creation of Ministry ofEnvironment and Forest (MoEF) in 1985. This Ministry is the nodal agency in theadministrative structure of the Central Govemment, for the planning promotion and co-ordination of environmental and forestry programs.
Central Pollution Control Board (CPCB) constituted in 1974 is a statutory authority attachedto MoEF and located in New Delhi.
MoEF Regional Offices: The Central Region office of MoEF located in Lucknow, covers bothRajasthan and Uttar Pradesh. Its responsibilities are to:
* Dispose of proposals for diversion of forest lands:* Assist in the preparation of the National Forestry Action Plan (NFAP);
SEA: Final Report - Volume 2 April 30, 2000Page 2.1

* Assist Paryavaran Vahinis (Paryavaran Vahini Program) - an adjunct to the NationalEnvironmental Awareness Campaign, (launched in 1992/93) to involve communitymembers in reporting and monitoring as well as awareness program;
* Provide technical and scientific consultations on biological diversity;* Follow the implementation of conditions following environmental clearance;* Follow-up pollution control measures by industries and local bodies;* Collect and fumish information relating to environmental impact assessment of
projects, pollution control measures, methodology and status of legal andenforcement measures and biological reserves.
Industrial Water Pollution Control programmes designed to maintain/restore the natural waterbodies to various designated best use include: Water Pollution Control Strategies togetherwith the strategic administrative mechanisms for control of pollution at source; Industry-specific Effluent Standards evolved at the national level recognized as 'Minimal NationalStandards' (MINAS); and Monitoring of Indian National Aquatic Resources System(MINARS) which comprises a network of water quality monitoring stations for monitoringvariables on a monthly/quarterly frequency.
2.2.2 Legal framework
Annexure 2.2 presents a summary of policies and legislative acts. The major elements of theIndian legal framework for environmental management are:
* The Constitution - provides for protection and improvement of the environment andstates that *it shall be the duty of every cittizen of India to protect and improve thenational environment, including forest, lakes, rivers, and wildlife and to havecompassion for living creatures'.
* Water (Prevention & Control of Pollution) Act of 1974 and Cess Act of 1977.* Environment (Protection) Act of 1986.* Forest (Conservation) Act as amended in 1988.* Wildlife (Protection) Act of 1972.* Policy Statement on Abatement of Pollution of 1992. Affirmed the govemment's
intention to integrate environmental and economic aspects in development planningwith stress on preventive aspects of pollution abatement and the 'polluter pays'principle.
* The Environmental Impact Assessment of Development Projects Notification of1994.
The applicable rules are the GOI notified rules of Environmental Impact Assessment (EIA)for development projects in 1994, under its Environment Protection Act and rules of 1986.GOI in its notification lists 29 developmental projects (schedule 1) which requireenvironmental clearance from the central govemment, depending on the order of financialinvestments. The projects in the water sector that require an EIA are listed in Box 2.1:
Box 2.1: Water Sector Projects Requiring E/A for Clearance by GOI
* Al projects listed under scheduie 1: River valley projects including hydro power, major irrigatioand their combination including flood control; industries; mining; thermal power plants; ports;harbor; atomic energy.
* Projects which fall under the de-licensed category of the New Industrial Policy.* AI development projects whether under schedule 1 or not, if they are to be in certain notified
ecologically sensitive or fragile areas such as AIwar district in Rajasthan etc.* Industrial projects where the investment is Rs 500 million or above.* Industrial activities where the investment is Rs 10 million and above in pesticides; bulk drugs and
pharmaceuticals, asbestos and asbestos products; paints; distilleries; raw skins and hides; dyes;foundnes and electroplating.
*i Mining projects involving more than 5 hectares of land.
SEA: Final Report - Volume 2 April 30, 2000Page 2.2

2.3 Sector-Specific Framework
2.3.1 Policy and administrative context
Annexure 2.3 shows the state-wide roles and responsibilities of various departments. The Figure2.2 shows the institutional structure of water resources sector in Rajasthan. The responsibilities ofvarious institutions are briefly described below.
* State Water Resources Council (SWRC) is the Policy making body. The Chief Minister is thehead assisted by other Ministers and Secretaries.
* Standing Committee on State Water Resources (SCSWR) which facilitates the SWRC. TheChief Secretary is the Chairman. Members of the committee include the secretaries andheads of WRDD, the User Departments. and monitoring department, and others.
* Four Water Resources Development Departments for surface and groundwater are at theexecution level. They indude: lMgation Department (ID); Groundwater Department;Command Area Development Department; Indira Gandhi Nahar Paryojana Department. IDhas the primary responsibility of planning, development, construction, operation andmaintenance of surface water projects. In addition to these departments, agencies such asSpecial Scheme Organization (SSO); Panchayati Raj Institutions and WatershedDevelopment and Soil Conservation Department also contribute towards development ofwater resources in the state.
* Five Water Users Departments are: Agriculture & Horticulture Department; Public HealthEngineering Department; Department of Energy; Industries Department; and ForestDepartment.
* Monitoring department is the Department of Envirmnment. It's secretary is the ex-officiochairman of the State Pollution Control Board. It performs functions similar to MoEF, at thestate level.
* Individual project level Water Distribution Committees (WDC) comprising of primaryrepresentatives of the concemed departments and farmers which decide on the timing andfrequency of waterng to be provided to the command area from each projectAtank. WDC isthe forum where farmers are involved in water distribution.
2.3.2 New Industrial Policy of Rajasthan
Among the many steps undertaken by the State govemment to sustain and strengthen thecreation of a fiscal, regulatory and infrastructural environment in which private industry canflourish, was the unveiling of the new industrial policy. A forward looking and progressive industrialpolicy was announced in June 1998.The last industrial policy which was successfully implemented after its announcement in 1994 hasplayed a major role in emergence of Rajasthan as a prime industrial destinabon. A fresh endeavorwas required to redress certain deficiencies and practical problems which still exist. Areas likehuman resource development and infrstructure need even greater attention than accorded in thepast. The aim and objectives of the industrial policy are shown in Box 2.2.
Box 2.2: Aims and objectives of Rajasthan's Industrial Policy 199B
. To make Rajasthan the most preferred state for investment in identified sectors* To ultimately achieve global competveness* To lay special emphasis on accelerating overall pace of industnal growth for increased employment
opportunites* To improve producivity* To ensure sustainable deveiopment* To strengthen SSI, tiny and cottage industry sector
SEA: Final Report - Volume 2 April 30, 2000Page 2.3

A report on the implementation of the policy will be fumished every quarter to the EmpoweredCommittee and a similar report will be submitted to the Board of Infrastructure Development andInvestment once in six months. Also, as a part of development of a state-wide industrial policy, theSPCB in associaton with CPCB and German Agency for Technical Cooperation (GTZ), iscurrently involved in preparation of a zoning atlas for industial siting based on environmentalconsiderations. The atlas zones and classifies the environment in a district and presents thepollution receiving potential of various sites/zones in the distrct and the possible altemative sitesfor industries through easy-to-read maps.
2.3.3 Legal framework
Annexure 2.4 presents a summary of policies and legislative acts. The major elements of theRajasthan legal frame work for environmental management are:* The Rajasthan Irrigation and Drainage Act and Rules;* The Rajasthan Minor Irrigation Works Act;* The Rajasthan Forest Act;* The Rajasthan Lands Special Irrigation Charges Act;* The Rajasthan Colonization Act;* Rajasthan Cooperative Society Act;* Rajasthan Society Registration Act;* The Rajasthan Tenancy Act;* The Rajasthan Panchayat Act;- Panchayat Samiti and Zila Parishad Act; and,* The Rajasthan Flood Plain Zone Act.
2.3.4 Responsibility under the Water (Prevention & Control of Pollution) Act
For the prevention and control of water pollution, the state govemment has the power torestrict the application of the act to certain areas, obtain information, take samples ofeffluents and follow appropriate procedures thereafter, enter and inspect an establishment,prohibit use of streams or wells for disposal of polluting material, restrict new outlets anddischarges, restrict existing discharge of sewage or trade effluent, and refuse or withdraw anyconsent by the state board. In addition to clearance from the Central govemment, industrialprojects are further required to obtain a Letter of Intent (LOI) from the Ministry of Industry,and a No Objection Certificate (NOC) form the State Pollution Control Board and state ForestDepartment, if the location involves forest land. Mining projects involving leases of less than5 hectares of land are also cleared by state govemment.
2.4 Ongoing Policy Reforns for RWRCP
Rajasthan has recently approved a state water policy and a state water plan responsive to itsneeds and in line with the principles of national water policy. An action agenda outlining thespecific actions is currently developed in preparation for the RWRCP. Table 2.1 presentsthe current status of the following issues.
* Institutional reforms* Water resources policy and planning* Water services* Sustainable groundwater resource management* Public expenditure prioritization in water sector* Cost recovery to recover full O&M costs* Resettlement and rehabilitation of project affected persons* Environmental management
SEA: Final Report - Volume 2 April 30, 2000Page 2.4

2.5 Issues and Gaps Related to Policy Environment
Environment is a central as well as state subject in India. In the state H is through the GORdepartment of Environment, and the State Pollution Control Board. As such, the nationallevel environmental legislation needs to be matched by the institutional abilities at the statelevel where most of the monitoring and compliance activities are initiated (World Bank 1996).
Upon reviewing the existing legislation and institutional abilities at state level, several gapsare identified (Box 2.3 and 2.4). In summary, there are gaps related to the capacities ofexisting institutions for environmental management namely, to plan, monitor, and ensurecompliance with environmental laws and standards.
Box 2.3: Legislative Gaps
* Drainage management of irrigation projects including environmental sustainabilityis to be adequately covered. Acts needing amendment include: Rajasthan Lands SpecialImgation Act 1953; Rajasthan Colonization Act; Panchayat Samiti Act; Rajasthan lImgation andDrainage Act 1954.
* Social aspects are not covered by laws, except the R&R policy which is under approval.* Existing provisions under Water (Prevention and Control of Pollution) Act do not permit
SPCB to have area- industry- process specific standards'.* Environment clearance from the Central Govemment is needed for industries and river
valley water projects costing Rs 50 crores or more. Govemrnment of Rajasthan agency forenvironmental clearance for project under Rs 50 crores is not clear.
* Inter-state water agreements refer to water quantities only and not water quality.* Primary powers for planning and development of river valley projects vested at state level
do not correspond to river basin boundanes.* Surface water rights are not defined, not secure, and can not be commercially transferred.* Groundwater exploitation has not been covered by the existing state laws.* Enforcement procedures do not exist for non-compliance of environmental regulations of
river valley projects.* Environmental economics, environmental Indicators and Indices are new to the country
\and essentially non-existent. For large projects requiring EA, such disciplines would allowmainstream the impacts and altematives for eventual reduction in costs of EA during theproject proper.
Box 2.4: Instittional Gaps
* Institutional mandate for public awareness and involvement is necessary in order toenable acceptance of water allocation, planning and management decisions, andprotection of environment.
* Pollution monitonng is camed out for municipal/ urban/ industrial development projects,and not in agnculture and irrigation development programs.
* The environmental awareness, and familiarity with existing laws, policies, regulations,approaches to EA, preparation of EMP and monitoring of EMP is limited.
• Mandate of various departments: There is no institutional mechanism for systematicmonitoring to ensure adherence to environmental safeguards.
* Roles and responsibilities related to carrying out Environmental Management Plan in\ Water Sector Instiutions have not been defined.
Goel M.M.. Industries and pollution Control (Policies Procedures and Problems), 1992SEA: Final Report - Volume 2 April 30, 2000
Page 2.5

2.6 Concems (and constraints) regarding Current Enforcement Practices
Rajasthan's environmental management system is primarily govemment controlled. In otherwords, it has a traditional command and control regime as the essential regulatoryinstruments for pollution control. While it employs fiscal incentives to the industries tocomply with various environmental standards, the legislation is incomplete with respect toapplication of existing laws, monitoring and enforcement. Despite various laws andregulations in place, some of the major constraints related to policy, institutional andeconomic, regarding environmental enforcement are:
Policy constraints
* State having authority over water management, including groundwater, except sharedinterstate waters
* Inadequate application of existing laws, which have incomplete monitoring andenforcement provisions
* Lack of enabling legislation and regulatory environment with respect to integrated watermanagement, including groundwater
* Absence of well defined water rights, regulatory frameworks, institutional structures,enabling technology and adequate training to enable formal transactions in water anddevelopment of inter-sector water markets
* Lack of adequate and clear procedures to implement supreme court decisions as to theregulation of groundwater extraction, indiscriminate boring of wells, creation ofgroundwater authority applicable to the state
* Lack of appropriate policy and regulatory instruments for pollution prevention andabatement from domestic uses, municipalities, and industries including irrigatedagriculture
Institutional Constraints
A public sector approach without accountability- Limited specialization and staff skills in environmental management- Inadequate and not so effective linkages between agriculture and irrigation departments* Minimal involvement of farmers in irrigation and water management* Non existence of comprehensive water allocation arrangements* Non availability of water quality information to interested stake holders
Financial and Economic Constraints
* Insufficient cost recovery arrangements* Inadequate operation and maintenance budget allocations* Inadequate incentives for pollution prevention and abatement procedures* Non availability of formal water markets for surface and groundwater management
2.7 Drawbacks of existing Command and Control Regime
A major drawback of direct regulation also known as the command and control regime isthat it requires firms or industries to use a pafticular process or technology that reduceseffluent to specified levels, or otherwise meet specific design or performance criteria. It alsorequires that all affected agencies meet the same criteria, which is a 'one-size-fits- airapproach. This syndrome does not permit the needed flexibility and efficient systems thatprovides strong incentives for polluting agencies to clean up to conform to environmentalcompliance requirements..
SEA: Final Report - Volume 2 April 30, 2000Page 2.6

Regulations are inherently unenforceable as institutional capabilities required to implementthem are weak. Contributing factors to weak enforcement ability generally include: (a)contradictions in the legal system; (b) a lack of expertise in or motivation for collectingcharges, often exacerbated by a general problem of underreporting and under collecting oftaxes; and ( c) insufficient capacity to monitor discharges. Such weaknesses are across thestate's water sector programs including the industrial, inigation. urban and rural water sub-sectors
An overall culture of industrial environmental compliance is needed following the legaltraditions, the maturity of institutions, available resources, and the capacity and support oflocal citizens and private sector. Compliance does not automatically happen oncerequirements are legislated and issued; rather it is achieved as a result of targeted effortsthat encourage behavioral changes among polluters (World Bank,1998).
2.8 Recommendations
Environmental water quality enforcement ability needs not only a clear legal basis andtechnical expertise but also broad political support. Two sets of recommendations are madewith respect to environmental enforcement and compliance. The first is the development ofa new model that uses more informal ways for achieving compliance and the second isrelated to managing and sustaining the reforms.
2.8.1 Govemment- market- community involvement model.
While there appears to be no substitute for environmental regulatory regime, there is theneed to focus on what makes industry take action. Within this context, it is recommended toinitiate enforcement and thereby improve the culture of industrial environmental compliancebased on market based incentives that are being practiced in several south Asian countriesand being actively considered in certain states in India as well. Selected emerginginnovative approaches as effective ways to improve environmental compliance culture areincluded in Annex 2. 5 and summarized in Box 2.5 .
Box 2.5 Innovative Approaches for Environmental Compliance Culture
* Pollution inventories * Environmental Management Systems. Information on enterpnse performance . Negotiated agreements. Cleaner production a GovemrnMent- Industry Partnerships
New directions and innovative strategies are recommended for promoting effectiveenforcement, stewardship and/or change in behaviors towards effective and efficient use ofthe scarce water resource base. Strategies related to informal regulation are directed to thedevelopment and adoption of a new model, which is information intensive and transparent.Pollution charges are becoming an increasingly popular instrument for environmental policy.They play a key role among environmental policy instruments and are being introduced indeveloping countries, such as east Asia. These strategies are summarized in Box 2.6 and2.7 .
SEA: Final Report - Volume 2 April 30, 2000Page 2.7

< S~~~~~ox 2.6. Strategies for efferative ~>/ ~~~Environmental Management and Enforcemxent
/ harging poliluters for every unit of *Following economic reforms and privatizationemissions or discharges into surface water and working closely with environmental agenciesbodies or groundwater; such charges aregenerally flex with local circumstances.Using simple rating systems to publicly * Using local community groups (NGOs, religiousrecognize factories that adhere to local and institutions, social organizations, citizen'snational pollution standards: movements, and politicians) and market agents
Black: Serious damage as informal regulators for environmentalRed: Falls short of compliance performanceBlue: Adheres to national standardsGren: Significantly exceed standardsGold: World class performers
* Classifying factones based on their * Using environmental concems of market agents,environmental performance, emissions and including impacts of negative performancedischarges, and widely broadcasting their information on stock values, to create additionalresults. incentives for environmental pollution control
* Educating public on sources and impacts * Using changes necessary to qualify for ISOof pollution, from both point and diffuse 14001 certification, the most recent businesssources; advocating the using low cost performance standard that included explicitcomputer technology. norms for Environmental Management Systems.
* Supporting training in environmental * Establishing a program such as PROPER-management for small and medium scale Program for Pollution control, Evaluation andenterprises. Rating of environmental performance.
. Redefining environmental injustice: goal is # Adopting environmental mainstreaming byequal environmental quality for all citizens, assigning environmental responsibilities toregardless of income, education, or managers, environmental training for staff andethnicity. workers and environmental personnel.
* Establishing pilot projects to experiment * Providing commitment to sustain the linkageswith new approaches, gain broader between the regulatory agencies, communityexpenence and improve understanding of and market agencies.their strengths and limitations.
SEA: Final Report - Volume 2 April 30, 2000Page 2.8

/ Box 2.7 Typical Pollution Charges: Categories, Examples, / ~~~~~~~Sources, Values\
/ ~~~Categories of charges Examples
* Effluent discharges to soil and water in the * Implemented by water board or the PHED; Waterform of fiat rate, commonly applied to pollution charge is determined by revenue requiredhouseholds and small firms for municipal for sewage treatment and maintaining and improvingwaste and wastewater discharges water quality, mostly based on BOD.
* User charges- payments for costs of * Incentive for large firms that are metered, includingcollective or public treatment of effluents, agricultural sector, especially live stock production.based on quality of effluent treated, on waterusage, or on uniform tariffs
* Product Chargesw Taxes on pollutingproducts in the manufactunng, consumptionor disposal phase.
* Administrative charges- authorzation fees,licensing, registering etc.
Sources Values* Households and small enterprises * BOO, Phosphates and metals: User charges based
on water use or flat rate* Industries connected to waste water * BOD & Phosphorus: User charges (and surcharge)
treatment plants based on water use and pollution load* Metals: Emission limits, plus surcharge
* Industries not connected to collective waste * BOD and Phosphorus: Effluent charge based onwater treatment plants load or presumptive effluent charge based on water
use* Metals: Emission limits plus surcharge
* Irrigated agricultural areas with established * Incentives for Reduced drainage discharge: Flat ratedrainage system water pncing initially and volumetric water use
pricing In the long termm"-Irgated agncultural areas without a Incentives for reduced water demand: flat ratewae
blse drai _nage system pricngX
A new environmental enforcement and compliance model which recognizes that publicdisclosure and performance ratings as powerful tools for improving envimnmental conditionsin the water sector is recommended. In developing and adopting the model, theexperiences from pioneering work undertaken in several developing countries such asIndonesia, Columbia, Brazil, Philippines, and Mexico, and other Asian countries are worthconsidering.
The new model gives the policy makers more options, but also imposes new responsibilities:for strategic thinking about the benefits and costs of pollution contml; a stmng commitment topublic participation; clever, focused use of information technologies such as themanagement information systems; and willingness to try new appmaches such as pollutioncharges and public disclosure. Of course, regulators will always have importantresponsibilities for monitoring factories' envimnmental performance and enforcingregulations. But in the new model, the regulators use more resources to pmvide betterinformation, encourage informal regulation, fumish technical assistance to managers,promote environmentally sound economic refomns, that stand their gmund in conflicts overland use, resource exploitation, and social and environmental degradation. The users andpublic understand their roles as both users and guardians of their scarce natural resources.(World Bank, 2000).
SEA: Final Report - Volume 2 April 30, 2000Page 2.9

2.8.2 Strategy for managing and sustaining environmental management reforms
Ground realities require a major consideration. New roles for communities, markets andgovemments will virtually lead to the greening industry, a long shot for conditions ofRajasthan. Sustained progress on pollution control will most likely depend on clear evidencethat its benefits and costs compare favorably with those of other social investments.However, regulating pollutants under all conditions at all urban and rural locations in the stateis neither economically defensible nor politically sustainable. The proposed environmentalcell under the department of environment will have the responsibility for enforcement for theentire water sector, including irrigation, industry and urban and rural sub-sectors.
The following strategy for the sustainability of a viable environmental management andenforcement of compliance is drawn fron several recommendations in the literature, theWorld Bank and the Asian Development Bank (ADB), including lessons leamed, and tailoredto Rajasthan's water sector.
* A clear legal basis and technical expertise, and also continued political support forenvironmental management including enforcement of compliance of pollution controI.
* Development of an environmental policy for the water sector that includes all relatedsub-sectors. (Annexure 2.8)
* Integrated water management of surface and groundwater resources.* Commitment of the Govemment, consensus among the stake holders, and public
participation are important inputs to continuously improving enforcement practices .a View environment not as a technical issue to be addressed independently from overall
municipal and industrial strategic decision making, but by the expression: Environmentalmanagement, not just pollution control.
i Emphasize shift to environmental management, using broad mix of incentives andpressures to achieve sustainable improvements. This involves:
* defining environmental policies in terms of goals rather than inputs;• more explicit consideration of and reference to priorities;* greater decentralization, especially with respect to the implementation of polices;- finding ways to promote improved performance and management rather than just
controlling emissions and liquid discharges to receiving waters;3 adopting cost-effective strategies rather than specifying particular control measures.* Emphasize key requirements of general environmental management guidelines such
as:e pollution prevention, cleaner production technologies; minimize resource
consumption, including energy use (particularly in the case of groundwater use;)* elimination or reduction of pollutants at the source;* dilution of effluent to achieve maximum permissible values as not permissible:* Increasing efficiencies in production and manufacturing pmcesses in order to reduce
waste and encourage reuse and recycling of waste materials;* emission levels and discharges into receiving bodies to be achieved for atleast 95 %
of the time that the plant or unit is operating, calculated as the proportion of annualoperating hours:
* process wastewater, domestic sewage and contaminated storm water runoffdischarged to surface waters for general application to meet maximum limits shownin Annexure 2.6: treated wastewater for manufacturing process use or for irrigation tomeet guidelines for liquid effluents which are applicable to the project or wastewatersource (Annexure 2.7, treated wastewater quality requirements).
* Development of a culture of industrial environmental compliance.* Ability of the environmental cell to marshal reliable in'ormation, educate the public
about environmental tradeoffs, and encourage broad participation in setting goals.
SEA: Final Report - Volume 2 April 30, 2000Page 2.10
* Elimination of factors that weaken the enforcement ability including: contradictionsin the legal system; a lack of expertise in or motivation for collecting charges, oftenexacerbated by under reporting and under collecting of taxes; and, insufficientcapacity to monitor discharges.
* A systematic program evaluation that focuses on clear-cut objectives and finaloutcomes.
* Continuous improvement of pollution management and compliance programs basedon key policy lessons, such as the ones summarized in Box 2.8
* Adopting environmental mainstreaming by assigning environmental responsibilitiesto managers, environmental training for staff, workers and environmental personnel.
2.8.3 Criteria and constraints for environmentally sustainable surface and groundwater use
Preamble: In water scarce state such as Rajasthan, water must be used more efficientlythan in the past if the standard of living is to improve. Efficient use of water is simply notpossible, unless it is managed in an environmentally-sound manner. The essential elementsfor environmentally sustainable and sound water management include a holistic and broad-based approach to integrate the surface and groundwater use. Both supply-side and demand-side management must be considered. The above implies that:
* development be controlled in such a way as to ensure that the resource itself ismaintained and that adverse effects on other resources are considered and wherepossible ameliorated;
* options for future development are not foreclosed; and* efficiency in water use and in the use of capital are key criteria in strategy selection
Concepts and themes: The following concepts or themes should be recognized andfollowed in achieving sustainable water management (Thanh and Biswas, 1993).
* Adoption of a comprehensive view point: This includes coordinated water management;links with environmental management; links with economic and social policy; andbroadening range of professions.
* Promotion of a search for the widest possible range of choice: Policies to improve wateruse efficiency, such as recycling, wastewater renovation etc.
* Recognition of water as economic good: Charges for resource use namely, waterwithdrawal charges and prices to reflect the real costs, allocations to reflect value in use,and metering.
* Use of river basin as a unit of area in various phases of water management: River basinplanning and management.
* Involvement of public in planning and policy making: Adhoc, usually at the end ofprocess, narrow range of methods, to continuous and often.
* Consideration of environmental impacts: Environmental protection as key element inwater management, specific legislation or clauses in existing legislation.
* Assessment of social impacts: Protection of minority rights and redressal of sociallosses, social impact assessment, settlement of native land claims, institution ofcompensation measures.
Integrated Resource Planning Process: In order to consider both demand-sideinterventions and conjunctive management techniques, an integrated Resource PlanningProcess (IRP) is to be developed and adopted (World Bank, 1998). IRP is an emergingconcept having several key features:
* Equal aftention to demand as well as supply management* Extensive involvement of all stakeholders ( environmental, NGO, and govemment) in the
planning and decision making process
SEA: Final Report - Volume 2 April 30, 2000Page 2. 11

* Integration in planning of a broad array of soCial objectives and the factors affecting them* Iteration- the 'plan," while pxviding a basis for action, is continuously re-evaluated as
experiences, options and new issues emerge.
/ ~~~Box 2.8: Pollution Management Key Policy Lessons
|Work with agreed priorities. * Start with clear goals and objectives and not mechanisms.* An effective environmental strategy requires clear priorities.* Agree on priorities* First do those things that are a high priority and that are also
inexpensive and easily implemented.* Cooperative approaches are essential* Infommation is power share it.* Set realistic standards: where existing facilities are to be rehabilitated,
use environmental audit for cost-effective implementation measures.Devolve Responsibility * Delegate responsibility downward as far as possible: legislation to
establish regional agencies such as water basin authorities to collectdata and impose various kind of penalties for non-compliance.
* Set goals and objectives at the state level in line with national level, butallow local flexibility in implementation.
Adopt Solutions to * Find the target group: the top third or the bottom third of polluters.Circumstances * Define targets, not solutions, with an emphasis on operational practices
and good house keeping.* Compliance agreements are an essential tool in dealing with large
polluters.* Use yardstick competition to improve environmental performance over
time.* Precaution is often less expensive than ex-post measures
Promote good management * Intemalize environmental management* Rely on incentives - both financial and social - wherever possible* Win-win options are not costless when management is the critical
constraint* Improving management is the best win-win option.* Privatization is often the best and only solution to the environmental
problems of state-owned enterprises, such as the river basins and theimgation and drainage systems in Rajasthan.
Rewarding good behavior or * Money is often not the limiting factor.Penalizing Bad Behavior? * Improve financial performance and operational management.
* Recognize the need for reasonable transitional arrangements.Mainstreaming Environmental * Make environmental management and performance as the basicConcems criteria by which the success of any operation or process is measured.
SEA: Final Report - Volume 2 April 30, 2000Page 2.12

Constraints: A comprehensive and critical analysis of literature on environmental aspects ofwater development and management indicates that there are many constraints which limit thepotential application of available knowledge by water professionals and decision makers indeveloping countries, India included. On the basis of this review, the following major andclosely interrelated constraints can be identified that address the application gap.
* Incomplete framework for analysis;* Lack of appropriate methodology;* Inadequacy of knowiedge; and* Institutional constraints.
Actions: The following core actions are identified to achieve sustainable utilization ofresources.
* A shift from development ( i.e. additional extraction activities) to management;* Regulation of indiscriminate withdrawal of waters both surface and groundwater;* Enactment of necessary regulations together with enforcement instruments to preserve
and protect the resource base;* Having appropriate institutions responsive to environmental quality issues as well as to
accelerating technological and social change;* Presence of an independent water tribunal to reduce apprehension of local communities
that regulation will be imposed whether or not they initiate sincere management efforts;C Creation of a package of incentives and disincentives to assist notified areas; andPromotion of informal and formal water markets that would function within a clearly definedframework of rights and institutions, to enable efficient reallocation of scarce water suppliesto high-value uses while compensating existing users.
SEA: Final Report - Volume 2 April 30, 2000Page 2.13

C C~~~Goenentra Government =
Other Environment Regional Department ofDerMinistries andFors MoEF u and Forest
Central Pollution Zonal | State PollutionControl Board Offices of . Control Board
(CPCB) CPCB (SPCB)
< ~~~~~~Non Government Organizations
Figure 2.1: Organizational Structure for Environmental Management In India
SEA: Final Report - Volume 2 Page 2.14 April 30, 2000

......................... S.....................t.... Sate Water Resources CouncilChairman: Chief Minister
Standing CommitteeChairman: Chief Secretary
r ----------------------- ________--- ----------------------------------------- ____|~~~~~~~~~~~ I _I .,
ater Reseources J -- Irrigation Ground Water Indira Gandhi Command Other Agencies:
artmen Department Department Nahar Parlyolana Area Development SSO PRI,l----~ Department Department WS & SC
.____________ ________ _________________________________________________
I_______________ I *___________ I______________
Water Users ' Departments - - I Agriculture & Forest Public Health Industries Energy
Horticulture Department Engineering Department DepartmentDepartment Department |
~~> Secre ____ __ _____ ~~~~~~~~~~Rajasthan Pollution_
{ Monioring5 ___________ _______ Departmentlof Environment olo orkDe artmenlJ _ Chairman
I.
- - - - - - - - - - - - - - - - - - - - - - - -I
Figure 2.2: Rajasthan Water Sector Institutional Structure
SEA: Final Report - Volume 2 Page 2.15 April 30. 2000

Table: 2.1 Devlopment Pollcy Reform Agenda of RWRCP
Policy Issues Proposed Actions Current Status1. Institutinl Reform 1. Reforniuation of Rasthan Irrgation Departmnt trough itegration of specifed
functions relted to water stor. prentty with ote dep et. arnd tmng a s WaterResoums Department (WRD)2. Establishrent of a sae Water PlanrnAi Oiganiabon (SWPO)3. Interaon of a ground water and surfaoe waer dat cobcbon. axnpislbon and snalyisin one unit reportng to te SWPO4. Stengttenmg degsn and rse chcpabdibes tnhugh oe olo ddesin ofisando trgh human resource deveopmnnt for speolhlt siff kiudgraing andincontives5. Strengthening adinenaturae support funchons in WRD trough khrodLiC of le)
prgram baed budgt dlopsmen system b) inancal nd cost accounting; d)proremet pl gnd monng: a) pe i mnamg ond evaluin6. Orgneamg wwr meour planing and mnagenhnt genealy an river basn tnesundr BaSin Chief Engneers7 Establishing Management Infmation Systn (MIS) tfough use of. mxoem nfornibonToechnoly, as a tool for ffilont _mangmnt dof waler esources cudi t lopationso aadmirse5iv support functionsS. Estsbshino a Prodet Monitorno Unt
11 Via:e Resouroes 1. Setting up a State war Cosaci (SWC) and a Sbie Watr Comnmttee (SWSC) for anPolc. a-c Plannmg integnted and muftector pproa to an pla nning d opment and us of the States
watr sour based on the Ste Wtr Plan2. SWPO to act a the aupon technicel orgatneibon repat to the SWRC and SWC3. Declton of R_lastian Satds Water Policy Approved 19994. Finalization of the Stast WaWr Plan an updtig plan aey n year by m SWPO Completed 1998
Ill V.; re Services 1. EstabLisning a customr servce orieation in WRD by developig a client focus (farmr)in the move fmrm watr vlopment to wae mangent2. Declrtion of govemni policy e w n aoch ofingati o mnagementthrough benefidary pabopan nd abysm burn ovr encmntd of lgiston and mume ofGovewnment order intiB reaprd3. hue of Government orders d5ignalg dhe Nodal Department for system tum-over,aoPnm ent of a competent Nodal Officer and respornaata of vrcous tate govermnentdepartments i this activity4. Apprval of procedures and rules of system tum over, and approvl of Vte by-laws andMemorandum of Undebtandmng for Water Usr Associaois (WUA)5. Eaabsihing Water User Assoostions and achieving imgtion sysem turn over Mt thedesignated datsibution evel to benefici over an resa of 750.000 ha over the penod19982003.6. Deveop guidelines for addresng sustanability iaun regdng water use in al thesecto Pausrly speciying minimum sm Gmow requirment hr down strewncommunuties as well as ecoystem needs for surfoe water and dilheating the aptfr
IV Suslainabie Ground 1. Strengthening groundwater rescume nagement las oppoed to resourpe develbpment)Water inctuing tBealng waler uiy iResources 2. Develpment of gundwater legislotionManaqement 3. Establishing commnity consrvaion and management of grodwa
4. Establishig grndwater rchage saegy an progam5. Establishrn ubbic outnuch and dissemnabon nte relted to aroqudwater
V. PL:. c Exoenditure 1. issue of Govemmefnt policy resuinon to provide luHl rqaud funding for Operation andPncr.:.zavon in Water Maintenance of the igon systm ses tmtt pronty on pubic expenditure under theSecic' water sector
2. Iue of Government pdicy rason on expene prtnuixion La. gving fit pnorto hl fung for Opatio and Maintenance (O&U) of exiasg asse, folbwed byrehablition and modenation of exisdg syms and thereafter to viableinwestments to comolete oniq schemes exoeditouty.
Vi. Ccs Rerzvery 1. Enhance walar charges for awa services to recove fut O&M co and pat of thefixed cost2. Taking effective steps to ipove rec y of asse d _we har3. Creating a eparatte hed of accont for revenues fom wtr charges gnd earmaring Appoved 100% increa ini1999such revenues for exclusive use bv the WRD
VII Resetieent and 1. Dedarutionof Rathan State polcy on R&Rof proeh aected persons Prepared in 1999. with Cabinet forRehaohiatiOn _aporovl
Vill. Environment 1. Develop an Envwonrantal Action Pan based on Sectonl Envionmental AssesmentManagement
2. Appoint an Environmental Unit in the SWPO to monitor the environmnal issues retedto entbre water sector wmAudina woutdwler.
Source: World Bank - GOR Correspondence.
SEA Final Repon - Volume 2 Apni30. 2000Page 2.16

3.0 PROJECT DESCRIPTION


3.0 PROJECT DESCRIPTION
3.1 Preamble.
The State Water Plan has identified several projects, ongoing and proposed, (induding waterimportation projects) for taking up within a time horizon of 45 years. Four development scenarioswere identbfied in the SWP (Figure 3.1). This SWP vill likely be updated every five years. Withinthe SWP, the RWRCP is a priority project and a major undertaking. The components of theRWRCP are being finalized dunng the project design and approval phases. However, the scope,location, extent of development and scheduling of other planned projects are yet to be identified.Both the RWRCP and other planned projects within the SWP will be taken up within theframework of a comprehensive program of management reforms of the State's water resourcesmanagement in general, and inigation, drainage and groundwater, in particular.
A summary of the possible development in the water sector over the next fifteen yeais ispresented in Table 3.1 and Maps 3.1 and 3.2. This secion describes the prposed RWRCP, itscomponents and adtives, and addresses other projects in the water sector upto the year 2015.
3.2 Project Preparation Activities
3.2.1 Policy Reforms
Several policy reforms are being addressed by GOR with concurrent studies leading to projectappraisal. These are presented in Box 3.1.
Box 3.1: GOR Policy Reforms and RWRCP Prpamtion Studies
Policy Reforms Project Pmparation Studies* State water plan and water policy * InsItitnl Restucting and Sngthning.* Water charges and cost recovery * Management Information Systems (MIS).* Expenditure priodteation . Operation and Maintenance (O&M).* Strategy on the creation of Water User * Basline Survey (BLS).
Assocations (WUA)* Resettement and Rehabiliation (R&R) * Water Cost Recowvery
policy* Legislation for sustainable groundwater * Study on sustainable groundwater resource
management management* Institutional reforms. * Feasibility Studies for the irrigaton systen
Rehabilitation and Modnization.* Action plan for fornation of WUA* Sectoral Environmental Assment Study
3.2.2 State Water Plan
Scenarios of ultimate surface and groundwater development were presented in the SWPbased on water supply priorities (Box 3.2). These are consistent with National Water Policy(NWP).
SEA: Final Report - Volume 2 April 30,2000Page 3.1

Box 3.2: Water Supply Priorities in SWP
* Domestic* Livestock* Export* Existing Industries and power stations* Irrigation* Proposed industries and power stations* Artfficial recharge
Possible development in the water sector over the next fifteen years is summarized in Table3.1 and Maps 3.1 and 3.2.
3.3 RWRCP Components
The RWRCP has three key components: a) Improved irrgation management and transfer, whichhas three inter-linked sub-components: Participatory Rehabilitation and Fafmer Organization(PRFO); Systems and Agricultural Improvement and Farmer Tumover ( SAIFT); and SelfFinancing Irrigation and Drainage Disticts (SIDD), b) Agricultural intensification and, c)Sustainable groundwater resource management.
Other complementary actions supporting the above will include: Water Resources Planning andEnvironmental Management.; Resettlement and Rehabilitation (R&R); Water ResourcesResearch, Innovation and Demonstration (WRRID); Cost Recovery, including O&M and financialsustainability; Institutional Restructuring and Strengthening; and, Management InformationSystem (MIS).
Described below are the RWRCP components summarized from various Aide Memoirs of theBank missions during 1997-98.
3.3.1 Improved irrigation management and transfer
* Overview
This will be the largest component of the project and will consist of a number of inter-linked sub-components. The overall objective is to address the primary problems thatafflict imgation systems in Rajasthan in particular. The component will address thefundamental issues of iffigation systems performance which is caught in a vicious circleof low performance leading to low levels of service that inhibit agricultural productivityand farmer wealth, which leads, in tum, to dissatisfaction and resistance to pay fair andreasonable water charges for an unreliable and inequitable service. This shortfall inrevenue and under pricing of the service results in inadequate funding of O&M programsleading, again, to poor system perfornance. The primary objectives therefore, is to breakout of this vicious circle by restoring system performance and hence services levelsthrougn low level investment on a broad scale in deferred maintenance, and increasingwater charges subsequently and allocating this additional revenue directly back in toO&M programs.
* Participatory Rehabilitation
Principles: This sub-component will comprise funding of deferred maintenance activitiescombined with the formation of Water Users Association (WUA), over an area of about0.75 mha initially (Table 3.2), covering selected major, medium and minor irrigationschemes directly managed by ID & CAD to improve systems performance, with theultimate goal of statewide coverage. Out of the 15 basins of the state, Chambal and
SEA: Final Report - Volume 2 April 30, 2000Page 3.2

Outside basins are proposed to have major areas under RWRCP. The ProjectPreparation Unit (PPU) has prepared model proposals for 13 projects to indicate thehardware and software activities to be taken up and the probable cost per hectare. Acomplementary action will be the state-wide increase in water charges which will increaserevenue and will be earmarked for operations and maintenance functions, to ensureadequate and sustainable levels of O&M. The other important component will be theestablishment and/or strengthening of the partnership between the Departments ofIrrigation and Agriculture and farmers through WUAs. To ensure sustainability ofinvestment and as an incentive for fafmers to organize, the minimum rehabilitation workfor each minor will be carried out only after formation of the respective WUA.
Objectives: The main objectives of this component will be to finance minimumrehabilitation works, excluding establishment, as a one-time investment to restore, withinreasonable limits, satisfactory operating conditions to the systems. This component alsoincludes limited additional water control and measuring structures required to improvewater use efficiency and equitable distribution by the concemed schemes, distributoryand WUA- level organization.
Scope of Work: This component will be limited to priority deferred maintenance,comprising rationalization of outlets, desifting, measuring structures at the head ofWUAs, and special repair works for existing canals, drains or structures necessary torestore a reasonable level of system operation and ensure structural integrity and safety.Any expansion of systems beyond the design CCA with the water available will not beeligible for financing under the component.
Execution: The minimum rehabilitation activities within WUA jurisdiction will be carriedout by the WUAs according to Bank guidelines for procurement through beneficiaries.The minimum rehabilitation activities upstream of WUA jurisdiction will be carried out bythe Irrigation Department by following NCB procurement procedures of the Bank.
Systems and Agriculture Improvements and Farmer Turnover (SAIFT)
Scope: Under this component, selected major and minor schemes, including headworks,bulk distribution and other components, will be modemized over about 500,000 ha ofdistributory and above and 390,000 ha below the minor head. The respective investmentat each level is estimated to be about Rs 60001ha and Rs 2000/ ha, respectively and willbe confirmed when detailed cost estimates are prepared.
Locations: Priority will be given to the schemes where WUAs are established and wherewater services are unreliable and inequitable, resulting in agricultural productivity belowpotential due to inappropriate operational concepts, modemization needs for canals andstnuctures, inadequate water control and measuring structures, lack of maintenance dueto deferred maintenance and aging infrastructure. Investment would fund improved canalregulation, water measurement and improved O&M program delivery through theprovision of vehicle, equipment and communication provisions.
Beneficiary Participation and Financial Contribution: Systems improvement whereverfully within the jurisdiction of the WUAs or otherwise would be linked to significantlyincreased levels of beneficiary participation in the design and implementation of thesystem improvement works and ultimately, the tumover of the O&M operations to thefarmers. The financial contribution fmm the farmers will be at a higher level (say 20% ormore) for system improvement works under this component to be undertaken within theareas under the control of the WUAs.
Principles: Based on detailed scoping. Preparation of a list of schemes to be incluoedunder this project has been completed. There will be a reseaonable mix of major,medium and minor schemes to be included in the RWRCP. The medium and minor
SEA: Final Report - Volume 2 April 30, 2000Page 3.3

schemes will likely to have a number of advantages, namely: I) they are scattered allover the state, thus giving an equitable geographical distribution; ii) these schemes aremore amenable to the formation of WUAs as their sizes are relatively small: iii) althoughthe investment cost per unit area might be higher, the incremental benefd from theinvestment is likely to be higher, and the realization of this benefd is expected to bequicker; and, iv) farmers in the medium and minor schemes are generally poorer thanthose in the large schemes and therefore are more easily targeting.
Farmer Tumover: The system improvement (and agricultural intensification) componentwill involve the farmers again at high level of participation in system improvement worksand the tumover of these works to WUAs. This phase will also mean more in depthtraining of WUAs in operations and maintenance, financial and organizationalmanagement and in some base grade agricultural areas to provide the required skills toallow the WUAs to take over the system. The period from WUA organization to tumoverof the systems to them will represent a period of joint management between ID andfarmers. The establishment of distributory and project level farmers managementcommittees will be part of the continuum of the formation WUAs.
Agricultural Improvement: The partnership between agriculture, irrigation and farmersestablished under the PRFO would be further developed through an agriculturalintensification program. This program will complement improvements in irrigation servicedelivery performance, particularly the reliability and equity of services under the systemsimprovement program and allow the intensification of agriculture. It would also help toincrease the influence of agricultural needs on the irrigation system performance andlead to canal operations that are flexible and more in tune with agricultural needs. Inother words, this entails implementation of the principle that irrigation system operationalplans should be developed and managed, with major participation of farmers andagricultural services, as part of the agricultural production process, and not a means inthemselves.
This program will also facilitate coordination among various agencies to strengthenagricultural development services, provide specialized irrigation agronomy and watermanagement courses, and disseminate the extension messages to farmers. Also,wherever possible, establishment of marketing tie-ups with agro-industries, privateentrepreneurs, or farmer consortiums will be promoted.
The comerstone of field implementation would be through a federation of WUAs of 'ApexCommittees'. As WUAs become fully functional, Apex committees will be formed andagriculture and irrigation field officers will come together with fammers at the distributorylevel. Commands with successfully operating Apex level committees could be providedunder the project, for instance, with a simple multi-purpose building or 'Apex CommitteeCenter comprising a large multi-purpose room and a limited number of small offices forthe irrigation and agriculture field operatives at this level, and for the WUA's committees.The objectives of the centers would be multi-purpose:
* To provide a center for the meetings of the Apex Committee to fostercommunication and interaction among farmers in the command area;
* To provide space and equipment for multi-purpose farmer training;* To encourage and provide the means for regular communication between farmers
and the govemment staff (Irrigation. Agriculture etc)* To encourage field level communication, through close proximity of irrigation and
agricultural extension staff and WUA representatives; and,* To act as centers for adaptive agronomic research, field trails and demonstrations,
and for connections with marketing agencies and input and equipment suppliers.
SEA: Final Report - Volume 2 April 30, 2000Page 3.4

Self Financing Irrigation and Drainage Districts (SIDDs)
The concept of self financing irrigation and drainage distrcts will be focused at mediumlevel schemes with WUAs actively encouraged to move upstream to takeover themanagement of medium projects. The SIDDs would then have the powers to determinelevels of service, set water charges to reflect the cost of service provision within theparticular scheme and to control costs, particularly staff costs.
The move towards SIDDs will be an integral part of the vVUA formnation continuum andthe requisite enabling Legislative provision supporting SIDD formation will be developedas an extension of WUA legislative provisions. WUAs will be based at the minor leveland two additional levels involving the formnation of distributory and then project levelmanagement committees will be a continuum towards the formation of SIDDs.
3.3.2 Agriculture intensification
The objectives of this component is to strengthen the institutional capability of the AgricultureDepartment to deliver high quality irrigated agriculture extension services and to develop aneffective partnership with the irrigation and CAD & WU departments and farmers. Activitiessuch as institutional strengthening, including the strengthening of training institutions andtraining communication methods, staff training, technical assistance and study tours, vehiclesand buildings, equipment, and applied pilot activity will be funded.
The main thrust of this component would be to provide enhanced quality extension services,including field demonstration in key areas of water management and irrigated agriculture andwill develop and promote an improved package of agricultural practices. In addHion, someadaptive research programs will also be taken up under this component.
3.3.3 Sustainable groundwater management
Background
In Rajasthan, groundwater management is one of, if not the, most important challengesfacing the state's water future over coming decades. While this is recognized by many policymakers, some of the core issues are re-stated here in order to provide a dear statement ofthe perspectives on which activities proposed in the groundwater component of the WRCPare based.
Groundwater is the primary source of water supply for drinking and domestic uses in mostrural and many urban areas of Rajasthan. Overall, roughly 80% of Rajasthan's drinking waterneeds are met from groundwater. In addition, approximately 61% of Rajasthan's irrigatedareas depends on groundwater. Given the substantially higher productivity of mostgroundwater irrigated areas in comparison to those irrigated from surface sources,groundwater is the single most important resource underpinning agricultural production andmaintaining the 70% of Rajasthan's population connected with agriculture. Finally,groundwater is the most important source of water for industrial and other economic uses.Sustainable management of Rajasthan's groundwater resources is, thus, of fundamentalimportance to the State's future.
Objectives
As currently envisioned, the Groundwater component of the Rajasthan RWRCP will havethe following goals:
SEA: Final Report - Volume 2 April 30, 2000Page 3.5

* To initiate a long terrn process, of capacity development leading towards an ability tomanage the groundwater resource base and address emerging problems throughout thestate;
* To establish a framework through which groundwater activities within the WRCP can beimplemented;
* To communicate with and educate policy makers and the general public regarding theimportance of groundwater, nature of emerging problems and management options;
* To implement pilot groundwater management projects that include demand sidemanagement and address different problems in different agro-climatic regions;
* To strengthen institutional capacity (including hardware and software facilities) for basicdata collection, analysis and research for management, including (Of possible) formationof a groundwater management institute;
* To undertake a series of research studies designed to produce technical, economic andinstitutional information essential for policy development and pilot project evaluation;
. To produce an action plan for subsequent phases in the long-term process ofmanagement capacity development including specific proposals for implementationprojects, groundwater legislation and Institutional reform.
3.3.4 Other complimentary actions
• Water Resources Planning and Environment Management
This component would establish the institutional structures and technical capabilities toplan, allocate, manage and monitor Rajasthan's water resources on an integrated basis.The World Bank advised GOR on the need to prepare a Sectoral EnvironmentAssessment (SEA) for the project and have it reviewed and cleared by the Ministry ofEnvironment and Forests. GOI and the Bank.
* Resettlement and Rehabilitation
The January 1997 Draft Rajasthan R&R Policy was reviewed by the World Bank,including use of specialist advice provided by a Bank R&R specialist. The Bank felt thatthe draft policy document has progressed well, but there are still areas needingimprovement, including a number of inconsistencies with Bank OD 4.30. Issuance of asatisfactory R&R policy will be a condition for RWRCP appraisal, and for otherinfrastructure projects in Rajasthan. The adoption by GOR of a state-wide R&R policy,approved by the Bank would work together to review the policy document.
Water Resources Research, Innovation and Demonstration
The component offers a unique opportunity to develop within GOR departments, aculture of leaming and innovation and receptivity to technological advances outside thestate, in the academic and private sectors and also to develop and internationalperspective through forging closer links with countries that have similar climatic andgeographic characteristics (Middle East, Chile, Australia)
The component will aim at getting results on the ground and hence will place a strongemphasis on applied research, innovation and demonstration through piloting combinedwith institutional strengthening and capacity building as well as on the establishment ofcollaboration between other Indian and intemational organizations and fostering linkagesbetween GOR departments and academic institutions in both the private and publicsectors.
SEA: Final Report - Volume 2 April 30, 2000Page 3.6

* Institutional Reorganization and Reforms
This is a significant component of the project and would include an institutionalrestructunng component, followed by a sustained process of capacity building in allfunctional areas, with project funding for non-establishment associated activities(training, consultancies, study tours, equipment, computers, vehicles, civil works etc) Thefirst need of to undertake an Institutional Study to assess the appropriate stnucture of ID/CAD & WU departments and related aspects or inter-linkages needs for the Departmentsof Agriculture and Groundwater. Key issues to examine include; (a) the institutionalstructure for functional specialization; (b) field decentralization along river basin lines; (c)suitabiiity of the present ID/CAD & WU spiit; (e) and personnel policies, skill mix andtraining needs and incentives.
3.4 Planned Projects
3.4.1 Irrigation Projects
Surface Irrigation: A large number of irrigation development projects were recommended forconsideration in the SWP. The SWP prepared a long term plan up to the year 2045 andpolicy for development and management of water resources of the state, both surface(intemal and extemal) and groundwater, on a comprehensive and integrated basis. It willserve to visualize the simulated development scenarios for all planned and recommendedschemes, including the identified inter-basin transfers.
These planned projects are based on water resources within the basin, intra-basin (watertransfer from one basin to another basin within the state), and import of water from adjoiningstates. Table 3.3 provides a summary of the planned water development projects. Of theestimated total imgable area of 15.7 Mha as per the plan, the present CCA under varioussurface irrigation projects in the state is about 2.75 Mha which is planned to be raised to 5.5Mha (100 percent increase). The salient features of existing, on-going and planned projectsare summarized in Table 3.4.
Groundwater lnigation: An area of about 3.79 Mha is under irrigation using groundwaterresources in various basins (Table 3.5). About 6% of groundwater irrigation is in thecommand areas while the rest is in non-command areas of the state. It is projected thatgroundwater irrigation would significantly reduce in the next fifteen years by approximately15-20% with a corresponding increase in domestic and livestock water demand. In certainareas, reduction in groundwater supplies for irrigation will have to be compensated by acorresponding increase in surface water irrigation systems in the planned projects so as tomitigate adverse social and environmental aspects of large reduction in groundwater draft forirrigation.
3.4.2 Domestic and livestock projects
The existing domestic and livestock demand is estimated at 3070 Mm3/yr, mostly fromgroundwater resources. This demand is expected to increase to about 4300 Mm3/yr by 2015(Table 3.1). The domestic demands of many cities and towns of Rajasthan are to be metfrom surface water resources (Annexure 3.1).
3.4.3 Industrial projects
The demand for existing industries is estimated at 47 Mm3/yr which is expected to increaseto about 71 Mm3/yr by the year 2015 (Table 3.1). The increased non-irrigation demands ofthe state are proposed to be mostly met by groundwater resources (Annexure 3.2).
SEA: Final Report - Volume 2 April 30, 2000Page 3.7
3.4.4 Other projects
Water demand for other projects such as the cooling water purposes and the, Keoladeonational park are not significant.
3.5 Screening of Projects
3.5.1 Purpose
With respect to World Bank's environmental review process, the purpose of screening at thetime of project identification, is to decide the nature and extent of EA or environmentalanalysis to be carried out for the purpose of granting loan or credit.
3.5.2 Criteria for screening
A project is assigned to one of three categories (Box 3.3) based on professional judgmentand information at the time of project identification. If the project is modified or newinformation becomes available, a re-ciassification of the project could be appmpriate, withconcurrence from the Bank.
3.5.3 Rajasthan water resources consolidation project (RWRCP)
The RWRCP will involve rehabilitation of existing irrigation and drainage system indudingimprovements to supply, distributon and or-farm management per se. Individual investmentscould have local impact that do not necessanly qualify for an independent EA. A duster of suchprojects spread over an area over 750,000 ha covering most of the river basins presents adifferent perspective to the project classification. The public consultation program providedadditional concems of the farTning community as to the social expectations and concems. Basedon the above observations, the RWRCP qualifies as Category A project.
3.5.4 Planned projects
A summary listing of planned projects identified in the SWP is provided in Table 3.3. Based onsketchy information available, these would qualify into all the three categories namely, Category Aprojects which require a full EA, Category B projects (medium irigation projects) and Category Cprojects (minor irrigation schemes). As most of these projects are in conceptual stages, finalcategorization of projects will have to be undertaken during their respective planning stages andEA prepared following the appropriate guidelines.
SEA: Final Report - Volume 2 April 30, 2000Page 3.8

Box 3.3: Guidelines for Project Classification for EA Preparation
Category A: A full EA is required if a project is likely to have adverse impacts that may be sensitive,irreversible, and diverse. The impacts are likely to be comprehensive, broad, sector-ide, or precedent -settng. They require to have a full EA or an SEA The following projects can be considered:
* Dam and Reservoir upgrading.* Inter basin and intr- basin transfer project* Major irrigation project having a CCA greater than 10,000 ha.
Category B: Projects having some impacts for which more limited environmental analysis is appropriate.These impacts are not as severe, major, or diverse as Category A impacts; remedial measures can moreeasily be designed. Medium Irmigation and drainage projects having a proposed CCA 2,000 - 10,000 haand the RWRCP rehabilitation and upgrading type projects are in the category B. Preparation ofmitigation plan may suffice for these projects and therefore need not have a separate EA report. Thesecould be discussed in a separate chapter of the project preparation or feasibility study. As an exmpie,large-scale rehabilitation of an existing irrigation project in Morocco was placed in environment screeningcategory B as mentroned in Source book update #2 (October, 1993).
Category C: Minor projects having a CCA less than 2000 ha are considered in this category. Theyare essentially localized projects within the scope of river basin and do not require environmentalassessment per se.
SEA: Final Report- Volume 2 April 30, 2000Page 3.9

, -: . It U. i.,, k, ,, S. -kJ
14r,,
SI I
17,
Sour NnTahalt 19.98 -
ill .Ip 0
~~~~~~~~~~~L'I.. ._, ...
Source:~~ j7ha, 1998,.
EA: ~ ~ ~ ~ ~ ~ i Fina Reor - Voum 2 ,,g ..1 Apri 30 20-0

low performing irrigation deparnMts iandequaw exteunlno farmer involvecmc and w use eenon
systems in poor stale poor serice
poor O&M low yields
budget allocations
low cmol recovery low incomes
Emm diarm disf& d oflm politic pegsue
Adapted from K. Oblitas, Making Irrigation Pay, 1992
Figure 3.2: Performance of Irrigatlon Sector with Constraints (Vicious Circle)
0on
mnamom~~~~am
_e~~~~C
PSTPAUM bmp~~~Inmmd@vr Aiuumrwiarnuin. -m *a aprnict mid wrm
Pauin lowID
G~~~
J in4AaaIrA IS jYlwSmn W po U 1wY
- O&Mf 1 1Pge .1
I '
-V w q w
am-
Figure 3.3: Improved Irrigation Management & Transfer (Virtous Circle)
Source: India - Water Resouroe Management Sector Review Report on the Imgation Sector,World Bank, t998
SEA: Final Report - Volume 2 April 30,.2000Page 3.11

Table 3.1 Rjaslohan Water Sector Developmenl upto year 2015
Water Dovelopment Irrigatlon Prolects Rehabillitallon Projects Nonr-rrtigaton Projects Oihar Wahr Po act______ Rainfed Watershed Evporston pond
Basin's WR WR Import RWRCP DoestIc Livestock bnkustrIa Agrlculture"' Development stagnant waterSW GW oFDIo OFO wlth PRFO & Urban Rural Thermal Other a son Bodies fLakeskm
SSD SAIFT power ConsarvatlonmrConrtmand NonIomn tommand
Present development Area (Mha) 1 476 0 22 om mand 1.27 0.05 0 015 10 1 0.13 0019'
_________ ~~~~~~0 00111
Water use Mn35r 5.20 65! 10.37 8.344 120 7 10699 18 4 O00O'17Projectd Expansion kea 4Mh1 11 002D 0 394 16 0.075 0015 0?56 ---S- _ _ 0.89upto 201 5 Water use: Mm'Iw 6 48 7 -1.14 9.14 t0 37 Z 4 2Year 2015 cumulattve Area (Mha) 2.54 020 3 171 2 974 0 10 0 030 8 1.0
projections ~Water use: Mm'r 11.04 58 23 17,491 -06 I0 717 _____
I Rainied agricuture Is assumed as total area suitable for inigation minus the Canat Command Area = 15 .- 5 59 = 10 It Mha2 Watershed Development Program Constitut upio 30% irrigated ares vith the Individual block (Panchayst Sarniti) in the IXth Plan. Present devebpment Is tor 19906983 Area of evaporation ponds In Ouiside Basin, Area of Sembhar lake and Area of Keoladeo National Park4 Projections we based on possible development at the present pace of work In Chambal basin OFo Is also projected In Mahi basinS Estimated GW draft for krigation Is 1t036 Mm' (OWO estimates 1999). sahough OW Iigation esilmated in SWP Is approx. 5.000 Mm' now and 4.151 Mm' in 20156 Estimaled areas (3.793.000 ha) fom projected GW draft of 11.03S Mm' based on agricuural stallsitcs 1996 977 Assumplion: Increase In domestc £ kidusridal demand t 1217 Mm'wi be offset by s corresponding reducion In GW irrigation In the over draft areas by Integraled SW A GW msnagement8 SWP esiimaed OW long-term agf yId Is epprox 5.698 Mm' although estimated annual recharge Is 7, 143 Mm'
Sources: 1) State Water Resources Plan. Februay 199 TAHAL Conslng Engtneerng Ld21 Ground Water Department, GOR. 1999, Ground Water Resources of Ralasthan Inlgation Potential as on Januay 199831 Waershed Development end Sol Conservation Departmendt Jaipur41 Directorate of Agriuture, Rajasthan. 1998. Vtal Agrlcutture Statistics 1 997-98
Note: The values have been compiled from various eources end adopted, with best iudgoemnt for this SEA atudy. Therefore these values may not be apprpriate for designing development works'both RWRCP and planned projects) within and outside Ihe respectie CCAs.
SEA: Final Report -Volume 2 Page 3 12 Aprx 30 2O0
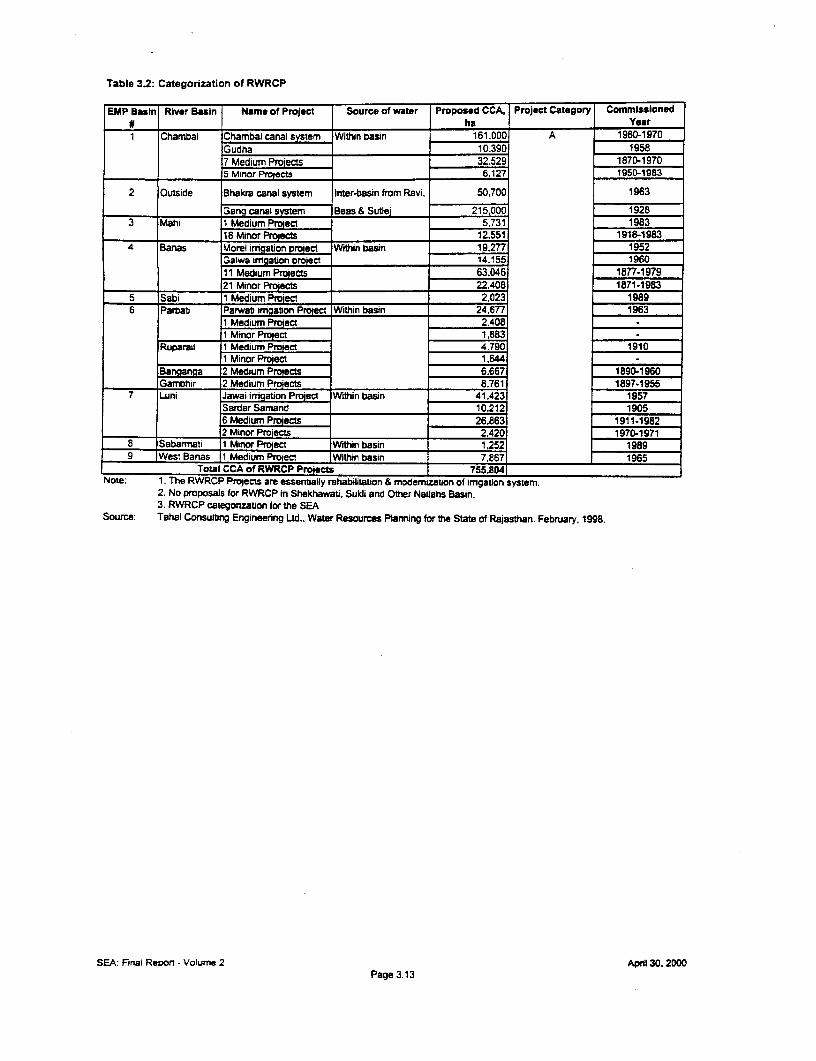
Table 3.2: Categorization of RWRCP
EMP Basin River Basin Name of Project Source of water Proposed CCA, Project Category Commissioned#_____________________ ha Year
1 Chambal Chambal canal system Within basin 161,000 A 1960-1970Gudha 10.390 19587 Medium Projects 32.529 1870-1970
Mminor Projects 6,127 1950-1983
2 Outside Bhakra canal system Inter-basin from Ravi, 50,700 1963
Gang canal system Beas & Sutle 215,000 19283 Mahi 1 Medium Proect 5.731 1983
18 Minor Projects 12,551 1918-19834 Banas Morel irrigation project Within basin 19.277 1952
Gaiwa imgation project 14.155 196011 Medium Projects 63.046 1877-197921 Minor Projects 22.408 1871-1983
5 Sabi 1 Medium Project 2.023 19896 Parbati Parwati irrigation Project Within basin 24.677 1963
1 Medium Project 2.4081 Minor Project 1,883
Ruparail 1 Medium Project 4,790 19101 Minor Project 1,644
Banganga 2 Medium Projects 6.667 1890-1960Gambhir 2 Medium Projects 8.761 1897-1955
7 Luni Jawai imgation Project Wdhin basin 41,423 1957Sardar Samand 10.212 19056 Medium Projects 26.863 1911-19822 Minor Projects 2.420 1970-1971
8 Sabarmiati 1 Minor Project Wdhin basin 1.252 19899 West Banas 1 Medium Project Within basin 7 867 1965
Total CCA of RWRCP Projects 755.804Note: 1 The RWRCP Projects are essentially rehabilitation & modemization of imgabon system.
2. No proposals for RWRCP in Shekhawati, Sukli and Other Nallahs Basin.3. RWRCP categorzabon for the SEA
Source: Tahal Consuling Engineenring Ltd., Water Resources Planning for the State of Rajasthan. February, 1 998
SEA Final Report - Volume 2 April 30. 2000Page 3.13

Table 3.3: Categorization of Planned Projects
EMP River Basin Name of Project Source of water Proposed CCA, ha Project Category Proposed year of
Basin # I_Commhsslonina
1 Chambal Dhanwas Within basin 22.000 A 2005Parwan I.P. 33.740Gugar lift 76,700CSoni 10.5W 2015Pipaida lift 12,930Dholpur lift 34,000Kalisind Major l.P. 40.2WChambal lift 43,200Manohar Thana 54.249Indira lift 104.0020 Medium Projects 112,531 B 2005-2015
_ 346 Minor Proiects _ 86,481 C 2000-2015
2 Outside IGNP Inter-basin transfer 1,316,000 A Ongoing
from Rabi, BeasSidh,mukh-Nohar and
Sutei 118,690 A Ongoing- __________ 4 Minor Proiects Within basin 608 C _ 2000
3 Mahi 3 Medium Proiects Within basin 13,757 B 2005-2015_ _________ 308 Minor Pro;ects 40.995 C
4 Banas Isarda Within Basin 22.460 2015Kala Khera 43.185 200S
4 Medium Projects 12.372 B
1 ~ 50 Minor Projects 12.3T2 C
5 Shekhawati 9 Minor Projects Within basin 3.2o4 C 2000-2010Sabi 14 Minor Projects 3,125
6 Banganga Gurgaon canal Inter-basin transfer 188,100 A 2015
Bharatpur feeder from Yamuna8 Minor Projects Within basin 2,732 C 2005-2015
Parbati 2 Medium Pro ects 9,962 20004 Minor Projects 2.497
Ruparail 8 Minor Projects 3.219 2000-2015Gambhir 25 Minor Proiects 4.487 _
7 Luni Nafmada canal Inter-basin transfer 73,160 A 2002
from Narmada _
1 Medium Project Within basin 2.7_4 B 2000
24 Minor rojects 5.631 C 2000s2005
8 Sabarmati 4 Medium Projects Within basin 12.909 B 2005-201526 Minor Proiects _ 7,845 C 2000-2015
9 West Banas 3 Medium Proects Wfitin basin 10,877 B 2005-2015_24 Minor Projects 9.989 C
Suki 1 Medium Proect 3.978 B 2015
_ 27 Minor Proiects _ 3.920 C 2005-2015
Other Nallah NeNnnada canal Inter-basin transfer 16,460 A 2002____________ frm Narmada
15 Minor Projects Within basin 1,775_ C 2005-2015
Total CCA of Planned Water Development Projects 2,575,8491
Note: 1. There are no major planned project in Mahi. Shekhwati. Sabi. Ruparail, Sabarmat, West Banas and Sukji basin.2. There are no medium projects in Outside Basin, Shekhawati, Sabi, Ruparail, Banganga, Gambhir and
Other Nallahs basin.3. Projects categorization for the SEA
Source: Tahal Consulting Engineering Ltd., Water Resources Planning for the State of Rajasthan. February. 1998.
SEA: Final Report - Volume 2 April 30,2000Page 3.14

Page 1 of 3
Table: 34: Salient Features of Existing, Ongoing and Proposed Surface Water Projects In Rajasthan:Within Basin Resources and Imports
Status Clas No. of Pro ects Fr'e CatchmentArea (Krn2) LiveStorm gCapalty(Mm3) I CCA ha)1 CHAMBAL BASIN
Existing Major 7 41,481 8.850 269,917Medium 12 10,437 276 50,102Minor 134 3,401 263 42,410Subtotal 153 55,319 9,391 362.429
Ongong Major Medium 7 1,327 207 43.014Minor 45 10 64 14.565Subtotal 52 1,337 271 57,579
Proposed Major 10 2,618 1,743 431,519Medium 20 2,006 687 112.531Minor 346 83 517 86.481
rSubtotal 376 4,707 2.947 630,531Basin tota l 61,363 12,609 1.050.540
2 OUTSIDE BASINC-'_islcin Maior 3 Imports |- 1,232,850
Minor 31 804 44 5,134
OKping Major 2 Imporb2 1,434,690Minor 2 11 1t 73
Frwosed Minor 42 608
Basin Total 815 47 2,673,3553 MANI BASIN
Existing Major 3 8,747 2.262 1167813Medium 2 681 46 7,96Minor 220 5,837 256 49,088Subtotal 225 15,265 2563 224,869
Ongoing Maior 1 1,242 160 17,724Minor 37 17 173 13.968Subtotal 38 1,259 333 31,692
Proposed Medium 3 467 72 13.757Minor 307 n.e. 212 40,995Subtotal 310 467 283 54,751
Basin total 16.990 3.179 311,3124 BANAS BASIN
Existing Major 7 6.133 425 99.376Medium 33 11,337 816 161,460Minor 1219 16.496 1.055 211.961Subtotal 1259 33.965 2.296 472.797
Ongoing Ma or 2 10.524 995 79290Medium 1 259 12 2.080Mmnu ; 20 281 54 7,361Subtotal | 23 11,064 1,061 88,731
Proposed Major 2 | 444 65.645Medium 4 1,145 63 16.387Minor 50 55 57 12,372
,Subtotal 56 1.199 954 94404Basin totl 3_ _ 46269 3,921 655.932
5 GROUP 5 BASINI ______________________ Shekh stl River B sin Existing Mebum 1 97 8 2.206
Minor s1 993 49 12.455Subtotal j 1,090 57 14,661
Ongoin Minor 11 1,059 38 4,660Prosead Minor 9| 2,043, 15 3204Total I 4,192 j 110 22.525I __________________________ Sabi River Basin Existing Medium 3 348 43 7.392
| |Minor | 501 1,454 8472 7,681I |Subtotal | 1,4802 90 | 15073
>goina IMinor 51 139 9 2,503Proposed Minor |14 13 11 3.125Total 1 1.954 110 20.701Grand Total | 6,146 220 43.226
SEA Final Report - Volume 2 Apd 30. 2000Page 3.15

Page 2 Of 3
Table: 34: Sallbnt Feaur of Existing, Ongoing and Proposed Surface Waor Projects In Rajasthan:Within Basin Resources and Imports
StWs | Chas No. of ProecZ | Free Catchment Area (Km2) Lie Storage Capadtv Mmn3) | CCA (ha) |
6 GROUP 6 BASINRuparall Rivr Bsin
Existing Maior 1 983 37 17,452
Medium 1 43 27 4,847Minor 50 1,917 6919,113Subtotal 2,943 133 41,412
Onooino Minor 2 . 7 992
Propose Minor 7 13 3,219
Total 2,943 45,623Banganas River Basin_______ ____ _____
Exmbng Major I1 73 nb"ir89iMedium 10 B20 71 34,747Minor 177 4,588 _ _ _ 46.612
Subtotal 6,139 336 21269Ongoinc Minor 791 1 1 214Prpd Wffh Basin Resourcess
MiSlor 1Bl5- 10 2,732Wlih ImorYamunas 1 188.100
Total 1 6,139 13471 27.f99Gambhlr River Bain
ngong Medium 6 8,761_znor 7__1_248_ 2 21,421
Subtotal 1_5 T 30,1B2
Orongw Medi~um 622 53 9.9851Minor 2 2 421Subtotal 622 S5 10_406
PMinor | 25 1 19 4,487
Total 2.277 251 45.075Parbati River Basin
Existing Major 1 785 103 24,678Meoium 223 15 2,408Minor 13 252 39 4,247Subtotal 11260 157 31.333
nooino -Minor 20 131
Proposed Medium 2, 27 33 9,962_Minor 1 4 7 2,497
1 Subtotal 27 40 12,459
Total 1,287 197
Grand Total 12,646 948 407.3207 LUNI BASIN
Existng Maior 2 2,478 297 51,635Medium 9 5.463 225 35,489Minor 344 12.587 4101 77,493Subtotal 355 20,528 932 164,617
Ongoing Minor 4 129 111 2514Proposed With Basin Resources
Medium | 11 382 241 2.784Minor 241 6551 451Subtotal 251 1,037 1 681 8Wih ImportsNarmada | 1 | 6151 73,60
Basin Total 3851 21,694 1 1,627 1 2U,706s SABARMATI BASIN
Exising Mintor 47 1003 74 8755
|OniGjngq IMinor 15 25 16, 3196
Proposed Medium 4 5271 57, 12909Minor 26 2401 129 7845
|__________ |Subtotal | _ 30_ 767_ te51 2D7541
.Basin Total 921 17951 275 327076
SEA: Final Report - Volume 2 Apri 30,2000Page 3.16

Page 3 of 3
Table: 3A: Salient Features of Existing, Ongoing and Proposed Surface Water Projects In Rajasthan:Within Basin Resources and imports
Status Class No. of Proects I Free Catchment Area (Km2) Uve Stora ge Capacity (Mm3) CCA (ha)
9 GROUP 9-__________ _____________________ W est Banas BainExisting Medium 1 410 36 7,867
Minor 17 326 34 6.624
Subtotal 18 735 71 14,491
Proposed Medium 3 59 74 10.877
Minor 24 40 87 9.989
Subtotal 27 99 161 20.8861
Total 45 834 232 35,356
______________ Sukil_Basin I__ _ _ _ _ _ _ _ __ _ _ _ _ _ _ _
Existkn |Minor 12 330 22 B4,739
Prposed- Medium 1 223 26 3.978
Minor 27 n.s. 27 3,920
Subtota 28 223 53 7.898
Total 40 553 75 12.637
_______ Other Naliahs asinExiistn Minor 18 216 20 3.533
Onol i; Minor 1 73 17 t_819
od_ I Minor 14 195 _ 1775
Total 33 483 45 7127
Basin_Group S _ _ _ _ _ _ _ _ _ _ _ _ _ _ _ _ _
Existing Medium 1 410 _ 36 7,B67
Minor 47 871 76 14_895_
Sub Total 48 1.281 113 22.7621
oinQ _ Minor 1 73 ,17 ,, 1 .819
Proposed Medium 4 282 100 14,855
Minor L 65 235 122 15.6_ 4
S77- Total lSub Total 69 517 = 30,539
Grand Total 1 554t20
SEA: Final Report - Volume 2 April 30, 2000
Page 3.17

Table 3.5: Summary of Ground Water Potential of the State as on January, 1998
Basin Total Potential Recharge Irrigation Non- Gross- Net BalanceM31 Stage of Remarks Fstimatedarea areal1l Draft Irrigation Draft Draft'" Development4' .Ilgated Area
Demand ha(s_ Km2 Km2 Mm, Mm3 Mm3 Mm, Mm3 Mm3 %
Chambal 31,460 28,237 2,700 1,424 89 1,513 1,086 1.614 40 Safe 559,176Outside 166,463 74.996 2,111 1,890 319 2,209 1,642 469 78 Semi Critical 547.513Mahi 16,985 12,555 961 378 32 410 297 664 31 Safe 102,785Banas 45,833 38,613 2.690 2.406 218 2,625 1,903 787 71 Semi Critical 789.740Group 5 15,964 14,218 841 1,145 110 1,255 912 -70 108 Over Exploited 426,884Group 6 19,295 15,122 1,784 1,752 100 1,877 1,327 457 74 Semi Critical 717,027Luni 37,363 24,880 1.120 1,614 96 1.710 1,226 -106 109 Over Exploited 534,349Sabarmati 4,164 2,782 186 102 8 85 80 106 43 Safe 23,490Group 9 47131 3,738 211 324 10 333 237 -26 112 Over Exploited 92,425Total 342,240 215.142 12,602 11.036 983 12,019 8.709 3,893 69 Safe 3,793,389
(1) Potential Area: The area of groundwater recharge considered for exploitation, excluding hilly terrain, forest, protected areas, and areas of high salinitywithin the basin
(2) Net draft = 70% of Irrigation demand + 100% non-Irrigation draft(3) Balance = Recharge - Neldraft(4) Stage of Development = Net draft/recharge(5) Source: Directorate of Agriculture, Rajasthan, 1998. Vital Agriculture Statistics (1997-98).
Computations are based on district wise data and percent area of districts in the basins
Safe = <70% stage of developmentSemi Critical = 70 - 90% stage of developmentCritical = 90 - 100% stage of developmentOver Exploited => 100% stage of development
Source: Ground Water Resources of Rajasthan, as on January 1. 1998, GWD. 1999
SEA: Final Report - Volume 2 April30 2000Page 3.18

LEGEND
Dimit Hed O4mtwm Leah
met.. 0Wti. R w --
OWea. UkW
'Ifto 0- SOm ty
um ~~~~Map 3.1.a Existing & Ongoing P>rojects9. TANAL (1008). MAP SVRP2
SEA: Final Report-Volume 2 Page 3.19 April 30. 2000

LEGEND
M..d A
. I.F A_ (PC a * T
A 0
0 50 100
10 KMS
Map 3.2 * RWRCP & Planned Projects (Upto 2015)
SEAM (IOn)n Rep SW22 P PPUr
SEA: Final Report -Volume 2 Page 3.20 April 30. 2000

4.0 ENVIRONMENTAL BASELINE REVIEW


4.0 ENVIRONMENTAL BASELINE REVIEW
4.1 Preamble
Current environmental situations across the water sector including the sub-sectors,municipal, industnal, livestock and others, are drawn from an evaluation of the baselineconditions in the fifteen river basins in the state. An overview of the environmental situationis presented in Table 4.1 and briefly discussed in this section. Basin-wise typicalenvironmental conditions are briefly described in Vol 3. Spatial variation provides valuableinformation in understanding the issues in the sector as a whole.
4.2 Sectoral Baseline Overview
4.2.1 Physical environment
Natural setting: Rajasthan state, situated in northwest India, has an aerial extent of 342,240sq.km. Its westem border is an intemational boundary with Pakistan. It is bounded by fivestates within India: Gujrat in the southwest; Madhya Pradesh in the southeast; Punjab in thenorth; Haryana and Uttar Pradesh in the north east. Rajasthan is the second largest statecovering about one-tenth geographical area and 5% population of the country, but with onlyone percent of country's water resources. It is a water scarce state.
Population Trends: According to 1991 Census, the population of Rajasthan was 44.0 million,with 77% population living in niral area spread in its 31 districts. The estimated current (1999)population of the state is 50 million. Population growth by 2015 has been projected to 73 million, atan annual growth rate of 2.7%.
Climate and Precipitation: Rajasthan experiences significant varations in terms of climate andhydro-meteorological set up. A conspicuous feature of the state is Aravali mountain rangestretching some 690 km from south-west to north-east. It divides the state into two distinctclimatic zones. The westem region, which covers about 60% of the area, the Thar desert, is anarid zone which confinues part ways into neighboring Pakistan. It is characterized by extremes oftemperatures and long periods of drought. High wind velocity and low relative humidity are typicalof the region. Dust storms are common dunng May and June. Normal temperature duringsummer months is 40-42 degrees C, the maximum being about 49.5 degrees C. Sub zero wintertemperatures have been recorded on Mount Abu in the southem part of the state.
Rainfall is sparse and highly variable, resulting in droughts and uncertain farming conditions,severe erosion of barren areas, flooding, soil erosion, and ponding of water in low lying areas.Monsoon extends from July to September, with total annual rainfall ranging from 150 mm in thenorth-west to about 1100 mm in the south-east (Map 4.1) . About 90 % of the rainfall occursduring the monsoon period. Rainfall distribution is highly variable and unreliable in time andspace. The state is covered by nine agro-ciimatic zones (Box 4.1 and Map 4.2) ranging from andwest plain to humid south east plains. About 80% of the land area is classified as and, semi-arid ortransitional.
Due to changing terrain and physiographic conditions (Map 4.3), occasional flooding occur inGhaggar river in Ganganagar and Hanumangarh districts, Bharatpur and Alwar districts, and citieslike Jaipur and Ajmer (Map 4.8).
All Maps are in Annexure 4.8SEA: Final Report - Volume 2 April 30, 2000
Page 4.1
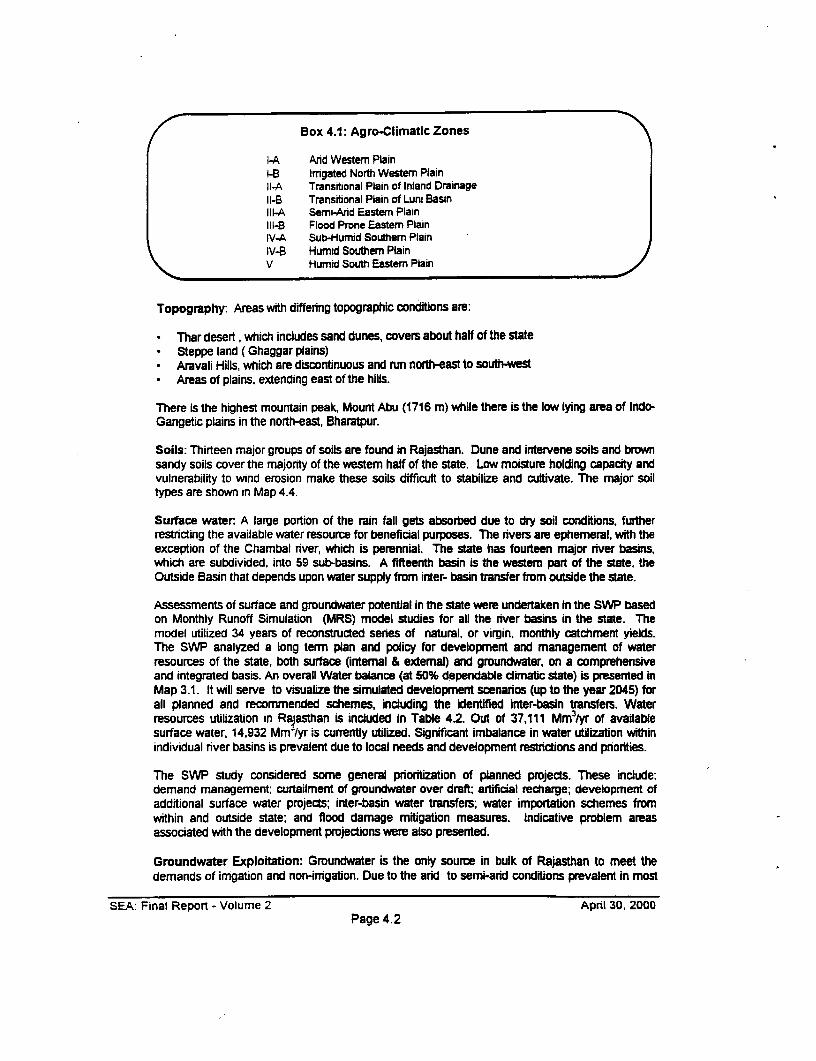
Box 4.1: Agro-Climatic Zones
I-A Arid Westem PlainI-B Imgated North Westem Plainl-A Transitional Plain of Inland DrainageH-E Transitional Plain of Luni BasinIll-A Semi-Ard Eastem PlainIll-B Flood Prone Eastern PlainIV-A Sub-Humid Southem PlainIV-B Humid Southern Plainv Humid South Eastem Plain
Topography: Areas with differing topographic conditions are:
* Thor desert , which includes sand dunes, covers about half of the stateSteppe land ( Ghaggar plains)
* Aravali Hills, which are discontinuous and run north-east to south-west* Areas of plains, extending east of the hills.
There is the highest mountain peak, Mount Abu (1716 m) while there is the low lying area of Indo-Gangetic plains in the north-east, Bharatpur.
Soils: Thirteen major groups of soils are found in Rajasthan. Dune and intervene soils and brownsandy soils cover the majorty of the westem half of the state. Low moisture holding capacity andvulnerability to wind erosion make these soils difficult to stabilize and cultivate. The major soiltypes are shown in Map 4.4.
Surface water A large portion of the rain fall gets absorbed due to dry soil conditions, furtherrestricting the available water resource for beneficial purposes. The rivers are ephemeral, with theexception of the Chambal river, which is perennial. The state has fourteen major river basins,which are subdivided, into 59 sub-basins. A fifteenth basin is the westem part of the state, theOutside Basin that depends upon water supply from inter- basin transfer from outside the state.
Assessments of surface and groundwater potential in the state were undertaken in the SWP basedon Monthly Runoff Simulation (MRS) model studies for all the river basins in the state. Themodel utilized 34 years of reconstructed series of natural, or virgin, morthly catchment yields.The SWP analyzed a long term plan and policy for development and management of waterresources of the state, both surface (intemal & extemai) and groundwater, on a comprehensiveand integrated basis. An overall Water balance (at 50% dependable climatic state) is presented inMap 3.1. It will serve to visualize the simulated development scenarios (up to the year 2045) forall planned and recommended schemes, including the identified inter-basin transfers. Waterresources utilization in Rajasthan is included in Table 4.2. Out of 37,111 Mm3/yr of availablesurface water, 14,932 Mm3lyr ;s currently utilized. Significant imbalance in water utilization withinindividual river basins is prevalent due to local needs and development restrictions and pnorities.
The SWP study considered some general pnoritization of planned projects. These include:demand management; curtailment of groundwater over draft; artificial recharge; development ofadditional surface water projects; inter-basin water transfers; water importation schemes fromwithin and outside state; and flood damage mitigation measures. Indicative problem areasassociated with the development projections were also presented.
Groundwater Exploitation: Groundwater is the only source in bulk of Rajasthan to meet thedemands of imgation and non-irrigation. Due to the arid to semi-arid conditions prevalent in most
SEA: Final Report - Volume 2 April 30, 2000Page 4.2

of the state, groundwater is a reliable source and if properly managed, it has the advantage ofbeing of good quality for drnking, industrial and agricultural uses. Rainfall is the principal sourceof recharge to groundwater in Rajasthan. Seepage from canal irrigation systems and on-farmpractices also contributes to groundwater recharge.
The groundwater potential assessment in the SWP was based on data from the GWD for theyears 1988- 92 for various aquifers, or potential zones (PZ), which followed the administrativeboundaries, and not river basin boundaries. The GWD has prepared revised estimates based onupdated information validated to January 1998. There has been wide variations in the assessmentof groundwater potential by the SWP and GWD, which needs reconciliation (Table 4.2).
The updated groundwater recharge is estimated as 12.6 BCWMyear, out of which about 11.0BCM/yr is utilized for irrigation and 1.0 BCM for other uses (Table 3.5). The groundwater quality ingeneral is very poor with very high salinity and in some places with excessive fluoride content .Thepost monsoon (Nov. 1998) groundwater depths vary from less than 2.0 m to 20.0 m (Map 4.5).
In 11 out of the 15 river basins, the groundwater extraction is either over exploited or in semi-critical stage of development (Map 4.6). About 72% of the state is experiencing fall in groundwaterlevels ranging from 3.0 to 10.0 m between 1984 and 1998 (Map 4.7). State-wide status ofgroundwater utilization is summarized in Box 4.2. Basin-wise details are included in Table 3.5.
Box 4.2: Groundwater Utilization
Overdraft Semi-critical & critical Safe(>100% development) (70-100% development) (c70% development)Shekhawatr Ruparail GambhirSabi Banganga ChambalLuni Parbat MahiOther Nallahs Banas Sabarmati
West BanasSukiiOutside Basin
Waterlogging: Area with water table less than 2.Om is tefmed as waterlogged and between 2.0and 3.Om as potential waterlogging as per the guidelines adopted in 1996 by the Ministry of WaterResources, Govemment of India. An area of about 440,000 ha is estimated to have watertablewithin 3.0m below ground level within the irrigated areas of the State during 1998 (GWD, 1999and CAD, IGNP, 1999-2000) and needs immediate attention (Map 4.5). Waterlogging andpotential wateulogging are reported in a big way in IGNP of Outside Basin and Chambal irrigationProject in Chambal Basin. In Chambal CCA an area of 195,000 ha and in IGNP about 1,66,000 hahave waterlogging and potential waterlogging conditions. Waterlogging is also reported in someparts of Mahi Basin particularly Mahi Command. About 1.0 Mha area has watertable between 3.0and 5.Om below groundwater level and needs monitoring and precautionary measures.
Flooding Problems: TAHAL (1998) analyzed 40 years of available data on occurrence of severeflood events In Rajasthan. The lower plains of Banganga and Ruparail river basins are found themost flood prone areas. The worst flooding occurred when these two rivers and Gambhir peak atthe same time, as all the three rivers fan out over the same flat region west of Bharatpur city.Although flood control protection works have been carried out along these rivers, the problem stillpersists. Another area which is frequently hit by floods is Ghaggar nali in the Outside basin. Tomitigate the effect of floods in this area, a number of natural depressions have been connected tothe river so as to act as a detention reservoir for the floods.
SEA: Final Report - Volume 2 April 30, 2000Page 4.3

Box 4.3: Frequency of Flooding Events in Different Basins
Rivr Basin Number of Events Number of Eventssince 1956 since 1976
Banganga 13 5Ruparail 9 5Banganga & Ruparail simultaneously 7 5Outside 12 5Luni 8 3Banas 7 1Chambal 3 1Mahi 2 1Sabi 1
Source: TAHAL. 1998. State Water Resources Plan, Vol 2 Main Report
The IrTigation Department has updated the possible flood prone areas in different basins in thestate as shown in Map 4.8 and Table 4.3.
Land Use: Cropped area varies widely from about 9°K in Jaisalmer district to 74% in Jhunjhunudistrict. The total cuflturable area in 1996-97 is 16.8 Mha, which is 49% of the state's geographicalarea (Directorate of Agriculture, 1998). An area of 39,037 sq.km. (11 %) is sown more than once inthe state. Culturable waste, fallow land and uncultivated land accounted for about 14%, 11% and8% respectively. About 31,972 sq.km is under various categories of forests, which is about 9.3%of the State's geographical area. A variety of land use pattems which are exhibited in the state, toa large extent, depend on the availability of soil and water resources in the area, and theavailability of human/ social endeavors to hamess them. The change in land use from the mid-fifties to eady nineties compiled by National Remote Sensing Center indicated the followingtrends:
* There has been an increase in the land coverage for forests, non-agricultural uses andpasture.
* There has been a decrease in the land coverage for net sown area, cultivable waste andfallow.
Operational holdings: The average size of operational holding is within the cultivated areas isapproximately 4 ha.
Irrigation: In all, there are 2,567 irrigation projects in Rajasthan, exploiting the limited state waterresources, and all with open surface conveyance and application. Out of these. 25 are majorprojects and 75 are medium. About 1.48 Mha area at present is under canal commands usingwater resources of the state and 128 Mha area is under projects with imported water. With theadddions from ongoing and proposed projects, the area under surface water iffigation is projectedto increase up to 5.52 Mha (Table 4.2). 535,000 ha are irigated with more than 100,000 sprinklersets.
Agriculture: Rajasthan's agriculture is largely rain dependent. About 30% crpped area isimgated with surface and grundwater. The intensity of cropping in Rajasthan is variable (Map4.9). In kharif season about 48% area is planted with cereals mainly with bazra (36%). Kharifpulses and oilseeds occupy about 16 and 9% of cmpped area respectively (Figure 4.1). In rabiseason, the share of cereals (Wheat and barley) is about 35%, pulses 2C% and oilseeds 35%. Inthe Kharif season, the bazra yield is about 0.5 fha. :!ses 0.3 f/ha anc oilseeds 0.7 f/ha and inrabi season the wheat yields are 2.7 t/ha, pulses 0.7 and oilseeds 1.0 t/ha (Figure 4.2).
Mineral Deposits: Copper, lead, zinc and tungsten are the important metallic mineral deposits ofthe state. Rajasthan is famous for building stone deposits like marble, granite, sandstone,
SEA: Final Report - Volume 2 April 30, 2000Page 4.4

limestone etc. It is a leading producer of asbestos, gypsum, bentonite, rock phosphate, calcite,feldspar, soapstone etc. and enjoys monopoly in the production of wollastonite, emerald, jasperand gem gamet. Ugnite deposits are found in Bikaner, Nagaur and Barmer districts.
4.2.2 Chemical environment
Water quality is a major concem throughout the state. Major water quality concems stem from thefollowing issues.
Water Pollution: Deterioration of surface and groundwater quality from diffused sourcepollution in the irrigated areas occurs due to: inefficient irrigation water use (10 to 30 percentefficiency in some cases); on farm practices such as excessive/ ineffective use of agriculturalchemicals (fertilizers, pesticides, herbicides, and weed killers); poor maintenance of surfacedrainage system; existence of extensive areas of hard pan (gypsum and limestone); poor intemalcharacteristics of root zone soil profile; and inadequate subsurface drainage.
Deterioration of surface and groundwater quality from point source pollution occurs due to: urbanand industrial waste discharges, live stock operations, cultural and management pracffcesassociated with industries, quanying and open pit mining operations, mineral extraction processes,and deforestation activities related to watershed management practices.
In-stream Water Quality: Due primarily to varying in-stream flows in time and space in theephemeral river basins, the surface waters suffer from low dissolved oxygen, high BiochemicalOxygen Demand (BOD), and high in Total Dissolved Solids (TDS), often in association withdisease vectors such as malaria. The existing conditions of the streams can best be understoodby considering the receiving water standards of the CPCB and SPCB. The CPCB has a nationwide responsibility of water quality (WO) monitoring and management of rivers. The riverwater quality is monitored through three major schemes:
* Global Environment Monitoring system (GEMS)* Monitoring of Indian National Aquatic Resources (MINARS) and,* Yamuna Action Plan
The WO monitoring network also covers lakes and groundwater sources. The entire WOmonitoring is performed by SPCB under the overall guidance of CPCB. In Rajasthan,monitoring of rivers is being done under MINARS.
The CPCB derived primary classification of rivers (Annexure 4.1) based on nation-wide longterm data on physico-chemical characteristics. More recently, the biological water qualitycriteria for different grades of pollution level in streams (Annex 4.2) are being developed sothat it depicts the stretches where, the deterioration of water quality has occurred, whichenvisages actions for improvement. The general conditions of rivers in Rajasthan withrespect to these criteria are presented in Figure 4.3 (CPWB,1999). Box 4.4 presents asummary of stream conditions in Rajasthan. While the classification of the rivers as slightand moderate' are with respect to pollution conditions, it is possible to consider them asdrinking water sources with appropriate treatment followed by disinfection, similar to thephysico-chemical criteria.
* Gurgaon canal, supplying water to Rajasthan and draws water from Yamuna river atOkhla, is prone to industrial and domestic waste pollution from Delhi. The River Yamunais classified as Class E (severely polluted) at Okhla barrage. Canal water entering fromPunjab Haryana into Outside Basin shows no quality deterioration now but may beaffected with upstream developments in future.
* Water Ouality of Pushkar, Ramgarh , Fatehsagar and Pichola lakes indicate somedeterioration.
SEA: Final Report - Volume 2 April 30,2000Page 4.5

In-stream water quality standards set for receiving waters inherently considered the dilutionrequirements and assimilative capacity of the streams, and threshold values for variouspollutants. The corresponding standards that set the effluent loading and those whichspecify the degree of treatment required are separately provided under the environmentprotection act, 1986
/ Box 4.4 In-stream flow characterization for Rajasthan rivr\
/ ~~~River Class Classification crfteris Use category/water qualiya Saarmati A Primary, physico- Drinking water source without
chemical conventional treatment, butwith disinfection
* Mahi C Primary, physico- Drinking water source followedchemical by conventional treatment
followed by disinfection* Banas: A portion uls confluence A Biological water quality Clean water
with Chambal critena
* Banas: upstream of confluence B Biological water quality Slight pollutionwith Chambal criteria
* Banas: Upper reaches above C Biological water quality Moderate pollutionTonk critena
. Berach: portion u/s confluence E Biological water quality Severe pollutionwith wagan criteria
. Kalisindh C Biological water quality Moderate pollutioncritena
* Parwan C Biological water quality Moderate pollutioncriteria
* Parbati: u/s of confluence with C Biological water quality Moderate pollutionChambal critena
* Parbati upper reaches B Biological water quality Slight pollutioncriteria
* Chambal:u/s of Gandhisagar E Biological water quality Severe pollutionreservoir criteria
* Chambalt u/s of confluence with C Biological water quality Moderate pollutionKalisindh criteria
. Chambal:u/s of and some B Biological water quality Slight pollutiondistance dis of Banas criteria
* Chambal: some stretch u/s of C Biological water quality Moderate Pollutionconfluence of Yamuna criteria
\Source: Central Pollution Control Board, Parivesh Vol. 5 (1999)
SEA: Final Report - Volume 2 April 30, 2000Page 4.6

Industrial water pollution: The Rajasthan lndustnal Investment Corporation (RIICO) is theapex organization engaged in the development of industrial areas and specialized industrialparks in the state. It has so far developed 276 industrial areas with over 14000 industries inproduction spread over more than 19000 ha of land. There are other several industriesoutside RIICO industrial areas. The prime industrial districts are summarized in Map 4.10 andBox 4.5:
Box 4.5: Prime Industrial Districts
* Jaipur (Sanganer, Sitapura, Bagru, Kukus, Bassiand Manpur Machen)
* Aiwar (Bhiwadi, Neemrana, Matsya and Kurushkhera)* Kota* Sirohi (Abu Road)* Jodhpur (Boranada)* Bikaner (Kami and Khara)* Ganganagar* Hanumangarh* Dholpur. Churu (Ratangarh)* Udaipur (Gudhi). Pali* Barmer (Balotra and Jasol)* Bhilwara* Ajmer (Kishangarh and Beawar)
Major industrial water pollution is confined to those industries which are highly pollutingand/or hazardous in nature (the red category) and those which are less polluting in nature(the orange category). Some of the red category industries in the state are dyeing and textileindustries, cement, fertilizer, pesticide, sugar, vegetable products and mining of minerals.The SPCB monitors the effluent treatment requirements and standards of the pollutants. Theexisting and potential industrial pollution hot spots are Pali, Balotra, Jhotwara, Jodhpur,Sanganer, Bagru, Bhilwara, Udaipur, Bhiwar, Kota and Bithuja (Map 4.10 ). There are veryfew common effluent treatment plants (CETP) such as the ones at Pali, Jodhpur and Balotra.Some more CEPTs are planned. The State and the Central Govemments share 25% eachof the cost of a CETP. The quality of groundwater in the vicinity of industrial areas at Balotra,Jodhpur, Udaipur and Pali shows that it is unsuitable for drinking as well as irimgation.
Information on waste loading characteristics from selected industries provided by the SPCB(2000) is summarized in Table A4.11.1 which provided a glimpse of the operational ETPefficiency, and quality of some raw industrial discharges. The quality of effluents from theETPs is generally meeting the recommended limits (Table A4.11.2). The quality of industrialeffluents prior to ETP such as the Alcohol industry near Behror (Alwar) being typically veryhigh in BOD and COD, and would contribute to severe contamination of surface andgroundwater in the viciniy.
Preliminary assessments of Industrial effluents at Sanganer town near Jaipur and the MatsyaIndustrial Area (MIA) near Alwar undertaken by SPCB ( 1998 )are indicative of the type,scale, extent, nature and concentrations that are likely to be discharged in to the nearbystreams, nallas or open drains, and in the areas of ephemeral streams resulting in significantpollution loading to the groundwater aquifers within the respective areas.
Sanganer Industrial Complex: At Sanganer industrial complex, about 105 small scale, 25medium scale, and 5 large scale textile industries are being operated. The area is coveredby agricultural land where agriculture and animal husbandry are the twin operations. The
SEA: Final Report - Volume 2 April 30, 2000Page 4.7
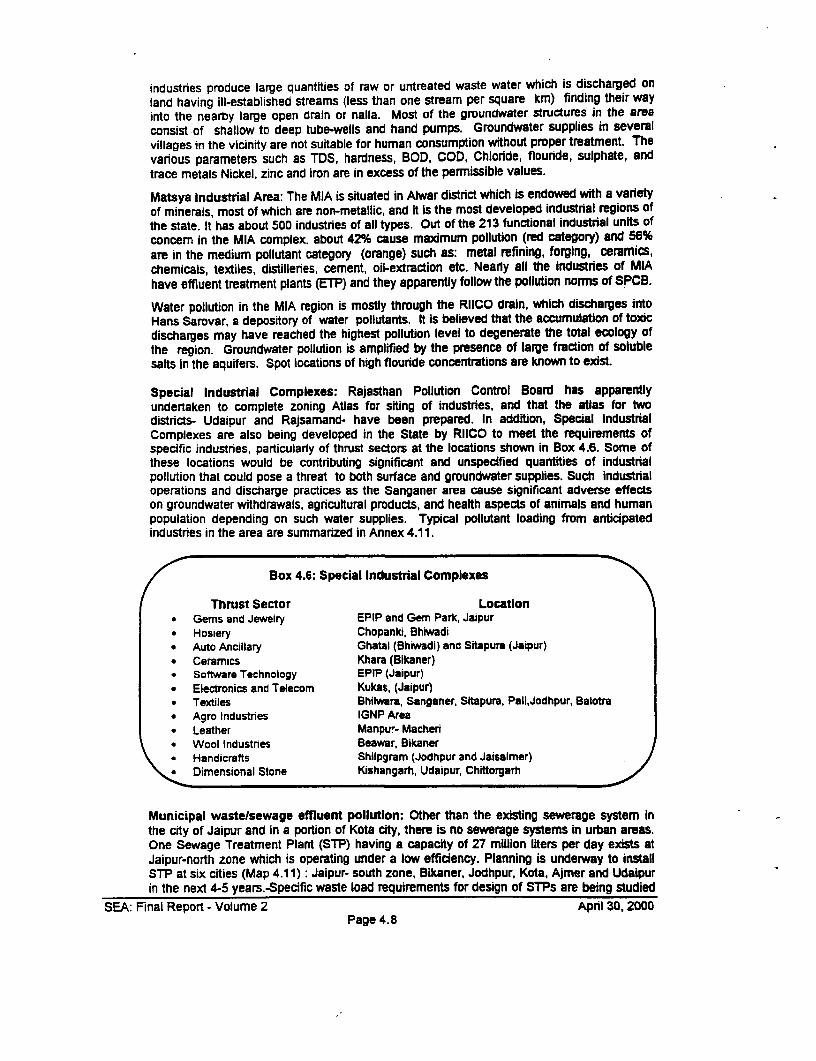
industries produce large quantities of raw or untreated waste water which is discharged onland having ill-established streams (less than one stream per square km) finding their wayinto the nearby large open drain or nalla. Most of the groundwater structures in the areaconsist of shallow to deep tube-wells and hand pumps. Groundwater supplies in severalvillages in the vicinity are not suitable for human consumption without proper treatment. Thevarious parameters such as TDS, hardness, BOD, COD, Chloride, flouride, sulphate, andtrace metals Nickel, zinc and iron are in excess of the permissible values.
Matsya Industrial Area: The MIA is situated in Alwar district which is endowed with a varietyof minerals, most of which are non-metallic, and I is the most developed industrial regions ofthe state. It has about 500 industries of all types. Out of the 213 functional industrial units ofconcem in the MIA complex, about 42% cause maximum pollution (red category) and 56%are in the medium pollutant category (orange) such as: metal refining, forging, ceramics,chemicals, textiles, distilleries, cement, oil-extraction etc. Neany all the industries of MIAhave effluent treatment plants (ETP) and they apparently follow the pollution norms of SPCB.
Water pollution in the MIA region is mostly through the RIICO drain, which discharges intoHans Sarovar, a depository of water pollutants. It is believed that the accumulation of toxicdischarges may have reached the highest pollution level to degenerate the total ecology ofthe region. Groundwater pollution is amplified by the presence of large fraction of solublesalts in the aquifers. Spot locations of high flouride concentrations are known to exist.
Special Industrial Complexes: Rajasthan Pollution Control Board has apparentlyundertaken to complete zoning Atlas for siting of industries, and that the atlas for twodistricts- Udaipur and Rajsamand- have been prepared. In addition, Special IndustrialComplexes are also being developed in the State by RIICO to meet the requirements ofspecific industries, particularly of thrust sectors at the locations shown in Box 4.6. Some ofthese locations would be contributing significant and unspecified quantities of industrialpollution that could pose a threat to both surface and groundwater supplies. Such industrialoperations and discharge practices as the Sanganer area cause significant adverse effectson groundwater withdrawals, agricultural products, and health aspects of animals and humanpopulation depending on such water supplies. Typical pollutant loading from anticipatedindustries in the area are summarized in Annex 4.1 1.
Box 4.6: Special Industrial Complexes
Thrust Sector Location* Gems and Jewelry EPIP and Gem Park, Jaipur* Hosiery Chopanki, Bhiwadi* Auto Ancillary Ghatal (Bhiwadi) and Sitapura (Jaipur)* Ceramics Khara (Bikaner)* Software Technology EPIP (Jaipur)* Electronics and Telecom Kukas, (Jaipur)* Textiles Bhilwara, Sanganer, Sitapura, Pali,Jodhpur, Balotra* Agro Industnes IGNP Area* Leather Manpu'- Macheri* Wool Industries Beawar, Bikaner* Handicrafts Shiipgram (Jodhpur and Jaisalmer)* Dimensional Stone Kishangarh, Udaipur, Chittorgarht
Municipal wasteisewage effluent pollution: Other than the existing sewerage system inthe city of Jaipur and in a portion of Kota city, there is no sewerage systems in urban areas.One Sewage Treatment Plant (STP) having a capacity of 27 million liters per day exists atJaipur-north zone which is operating under a low efficiency. Planning is underway to installSTP at six cities (Map 4.11): Jaipur- south zone, Bikaner, Jodhpur, Kota, Ajmer and Udaipurin the next 4-5 years.-Specific waste load requirements for design of STPs are being studied
SEA: Final Report - Volume 2 April 30, 2000Page 4.8

by the concemed organizations. NEERI Jaipur also studied sewage requirements forJodhpur and Ajmer. NEERI, under National River Conservation Plan, is studying installing aSTP for the sewage waste presently discharged untreated in Chambal u/s of Kota Barrage.The SWP identified reclaimable urban sewage and approximate irrigable area for differentbasins (Annexure 4.3). Available urtan waste water for land application could beapproximately 35 Milion m3 at present and likely to increase to 450 Mm3 by the year 2015.
Pollution from agricultural practices: Pollution hazards from Fertilizer and pesticide usesprovide challenges to manage water supplies on a sustainable basis. Fertilizer use in thestate (Map 4.12) has been on the increase for the past thirty years, about 35 Kg/ha in 1997-98 (Fig 4.4) applied over total cropped area in the state, both irrigated and dry land farming.The maximum permissible value is 200 Kg/ha. However, fertilizer leaching into thegroundwater aquifers and migration to surface water bodies in the agricultural areas has notbeen monitored. It could be a potential pollution hazard if the application trends continue inthe long term. The estimated pollution loading in the receiving waters could be in the rangeof 10-20 kg/ha of irrigated area (Annexure 4.16).
Pesticide use in the state in terms of technical grade matter (TGM) per unit area coveredunder plant protection (Map 4.13) has been generally uniform (Box 4.7). While the impact ofpesticide application on groundwater is not monitored, the limited research on the marketablevegetables and field research crops conducted at the Agricultural Research Station,Durgapura, Jaipur indicated that the residues on selected vegetable crops has been morethan the maximum residual level (MRL) for various crops related insecticides (Annex 11.8).This would indicate the need for monitoring the pesticide residues on continuous basis.
Box 4.7: Pesticide Uses (TGM)
1993-94 0.411994-95 0.421995-96 0.361996-97 0.33
Groundwater Quality: The chemical quality of groundwater in the State can be broadly dividedinto two zones, the fresh water zone having TDS<2000mgA which mostly occurs in east of Aravalliand saline to brackish zone having TDS>2000mgA that occurs west of Aravalli mountain range(Map 4.14).
In eastem Rajasthan groundwater replenishment is fast due to high rainfall (above 500 mm). Therain water flushes the chemical constitutions which accumulate during summer and thusmaintaining the quality. However, in few areas like Alwar and Bharatpur districts the groundwateris saline mostly due to poor inland drainage. In Chambal Command Area some patches of poorquality of groundwater are being observed in water logged/ stagnant areas.
In westem Rajasthan, groundwater aquifers are often deep, saline (EC>2dS/n) and sodic(SAR>10). In Barmer, Jaisalmer and Bikaner districts, the occurrence of sodic water ispredominant. Groundwater of eastem region of district Sikar, Jhunjunu and Nagaur ischaracterized by low salinity but high sodic content, which limits its use for irrigation and domesticconsumption.
High fluoride content (>1.5 ppm) in groundwater is characteristic of westem Rajasthan particularlyin Nagaur, Pali, Jalore and Sirohi districts and in few districts of eastern Rajasthan, Jaipur, Tonk,Dungarpur and Bhilwara (Map 4.14). Nitrate (in excess of 45 ppm) is common in Chunu, Barner,Jodhpur, Bikaner, Ganganagar, Hanumangarh, Jhunjhunu, Jhala.ar and Dholpur distrcts (Fig4.5). Arsenic problems have not been reported. although most likely not monitored.
SEA: Final Report - Volume 2 April 30, 2000Page 4.9

Soil Salinity: Salt affected soils are of common occurrence through out the state and are a resultof both natural and man made causes. Because of arid to semi-add climate, the salt content in thesoil and groundwater is quite high. Irrigation induced soil salinity is a serious problem in theinigation commands of Outside and Chambal Basins. Large areps are affected with excess soilsalinity developed due to irrigation with poor quality groundwater. Earier data in the sixtiesindicated that more than 0.7 Mha had high soil salinity (ECe>4dS/m), out of which 85% area wasbeing irigated with groundwater (Annexure 4.4). Update of soil salinity data is not available.
Soil Fertility
Intensive cropping in irrigated areas and corresponding uptake of nutrients has causeddeficiency of micro-nutrients such as zinc, sulpher and iron in different parts in the state. Thedeficiency of nitrogen and phosphorous has in general been reported. Specific studies inJaipur and Dausa districts over a period of four years (1996-2000) show that the soils are lowin nitrogen and medium in phosphorous. Potash status showed a declined trend from high tomedium. Status of micro-nutrients showed improvement in the status of zinc but decreasedtrend in the status of iron, manganese and copper. The crop yield data of major crops, overthe period 1976-98 show increasing yield trend (Figure 4.6).
4.2.3 Biological environment
Forst Coverage: Rajasthan's ecological resources have endured a long history of use byinhabitants, live stock and wild life. Floral wealth is rich and varied. However, the occurrence offorests in Rajasthan is very much restricted due to various pressures on the growth aspects ofvegetation. Most of the forest area is unevenly distributed and is restricted to eastem and southernpart of the state (Map 4.15). Dense natural forests are in protected patches, mostly confined tovanous national forests and wildlife sanctuaries. Most of the remaining forsts are in variousstages of plant growth. Three broad types of forest types exist, tropical thom forests, tropical drydeciduous forests, and central Indian sub-tropical hill forests. The area under forests in Rajasthanis 3.197 Mha, out of which 1.152 Mha is reserved forest, 1.767 Mha is protected forest, and 0278Mha is unclassified forest. Vegetation is broadly characterized into two distinct groups: and andsparse vegetation in the westem desert and the semi-humid to sub-humid vegetation in theeastem and southeastem regions of the state, in which double cropping and cultural operationssignificantly modified the vegetation growth. In general, the vegetation species are tolerant of lowwater availability. Heavy grazing, clearing for agnculture, high seasonal temperatures, and otheruses have reduced the species, to the extent that now some 30 plant species are considered rareand endangered in the state (Annexure 4.5).
Eco-systems: Rajasthan is a well known land of varied and fragile ecosystems ranging fromdesert to humid (Map 4.16). These ecosystems have a clear impact on environment andclimate prevailing from thousand years. Major ecosystems covering the river basins areshown in Box 4.8:
Box 4.8: Major Eco-systems of Rajasthan
* Great Indian Desert Ecosystem (GIDE): include the active process of deserrification mainly on themarginal areas e.g. Outside basin, Luni, Sukli and other nallahs.;
* Aravali Hilly Ecosystem ( AHE ): the area is stretching in the direction of NE to SW in Rajasthanstate e.g. Shekhawati, Ruparail, Sabi, Sabarmati and West Banas river basins;
* Eastem Plain Ecosystem (EPE): lies in the eastem portion of Rajasthan state including weUandse.g. Banganga, Gambhir, Banas and Mahi river basins;
* Ravine Ecosystem (RE ): deeply eroded extensive ravine areas in the Chambal and Parbati riverbasins.
SEA: Final Report - Volume 2 April 30, 2000Page 4.10

Vegetative communities in different habitats of Rajasthan are presented in Annexure 4.6. Severalplant species are indigenous to the Indian Desert (Bhandari, 1995 in Louise Berger Intemational,May 1998). The Thar and its immediate surroundings form a fairly fragile ecosystem, which hasevolved over a long period to adjust to the harsh environment for both fauna and flora. Itscomparative isolation means that it is a center of flora species and the area forms an importantand unique ecological zone in the country.
Rajasthan is abundantly blessed in its natural wealth, especially its biodiversity (Annexure4.7). Rajasthan's immense range of ecosystems, species and genetic fomms has forsometime been under threat. Habitat destruction, over exploitation, pollution and introductionof exotics like Parthenium, Eichhomea, lpomoea and Lantana have caused a decline inmany species and varieties of both wild and domesticated (agricultural) plants and animals.Rapid depletion of biodiversity, particularly due to wanton deforestation, is a majorenvironmental concem. The majority of state's people are dependent on biological resourcesand natural habitats for their day to day existence for food, medicine, shelter, householdgoods, fodder and manure.
Map 4.15 shows the location of forests and protected areas in general relation to the majorand medium planned projects. A few of the planned projects appear to be in the close vicinity offorest as seen in Map 4.15. Ministry of Environment and Forests, under Section 3(1) and 3(2) (v)of Environment (Protection) Act 1986 and Rule 5(3) (a) under Environment Protection Rules 1986on Environment Clearance, vide notification dated January 29, 1992 issued general guidelines fordevelopment in the vicnity of forest areas. Any Projects proposed to be located within 10 km ofthe boundary of National park or sanctuary will require environmental clearance from the CentralGovemment.
Eco-sensitive Areas: Rajasthan has always been a place of renown for its splendor andvianety of colorful flora and fauna and the preservation of wildlife goes back as far as to theMoghul and British period. Rulers guarded the wild fauna of their areas. Most of the forestarea is unevenly distributed and is restricted to eastem and southem part of the state. Densenatural forests are in protected patches, mostly confined to various national forests andwildlife sanctuaries (Map 4.17 and Annexure 4.8).
Rajasthan provides habitat for various species of birds, mammais , reptiles, and amphibians.Some of whom are endangered species (Annexure 4.9). Desert fauna is discussed in IGNPstudies (Mott Mac Donalds, 1998), and Louise Berger (1998). The Great Indian Bustard,Desert Fox and Desert Cat are in the category of rare species.
Aquatic Ecology: Wetlands have socio economic, ecological, academic and recreationalimportance. Two designated wet lands of intemational significance are in Rajasthan. Sambharlake an extensive shallow brackish lake in Nagaur district supports largest inland salt industry andhosts large number of flamingos and pelicans and other wading birds. Keoladeo National Park, afresh water marsh hosting wintering and nesting water birds near Bharatpur, is formerly amaharajas' pnvate shooting reserve. Other wetlands are generally small, restricted to margins ofpermanent rivers and/or to waterlogged areas adjacent to irrigation canals and tanks. As well,irrigated fields, when flooded, function as wetlands and support substantial numbers of wild Ife,mainly migratory wading birds and waterfowl. These Wetlands contain different groups ofhabitat which are intermediate between aquatic and terrestrial ecosystem and supportsunique species
4.2.4 Social and cultural environment
Socio-cultural profile: Rajasthan is the erstwhile Rajput ruled state in the pre-independenceperiod. It is now a predominartly rural state. It is one of the states in the country having low socialdevelopment indicators, such as infant mortality and literacy, basic and primary schooling,especially girls education, and quality of primary health care.
SEA: Final Report - Volume 2 April 30, 2000Page 4.1 1

Out of a population base of 50 million people, about 30%/o are scheduled caste and schedule tribes.About 20% is urban population distributed in six major cities and towns. The remaining 80 percentare nural population, which depends on agriculture and allied activities for their livelihood. Abouttwo-thirds of the population remain non-working, while the remaining one-third are the main tomarginal or part time workers. Industrialization has been very slow in the state and therefore, theproportion of industrial workers is also low, less than 1 to 8%.
The tribal population is mosty concentrated in southem, southeastem and eastem part of thestate, while the scheduled caste population is concentrated in the northern and eastem districts(Map 3.1). The male population of schedule tribes is generally less than the female population.
Cultural heritage of Rajasthan dates back to about 2800 B.C based on the archeologicalexcavations and explorations done at several locations in the state. The uniqueness of sculptures,paintings, forts, temples, fine arts, perfommrng arts and folk arts are very distinct of the state.
* Inspite of relatively high economic growth in the past and substantial investments by thecentral and state governments, Rajasthan remains one of the states with very poor socialdevelopment indicators. While there are some indications of progress In the 190s, indicatorsuch as infant mortality and literacy (specially female literacy) are dose to the bottom amongthe 14 major Indian states.
* If Rajasthan is to meet its objective of sustaining high rates of economic growth with equity,then provision of basic and primary schooling, especially girls' education, and the quality forprimary health care need to be strengthened.
* The key sector issues in Rajasthan are: (1) inadequate access to pnimary school and disparateenrollment especially for girls, SC And ST children, working children and children withdisabilities; (ii) low efficiency resulting in low retention and high drop-out and repetition rates-(ini) poor leamring outcomes resulting in dismally low achievement rates in mathematics andlanguages; (iv) inadequate pedagogical support; and (v) weak management.
* To address this social and educational backwardness, the Govemment of Rajasthan (GOR)has implemented several innovative operations under Lok Jumbish and Shiksha KafniProject, originally with the assistance of the Swedish Intemational Developmernt Agency(SIDA), which will now be assisted by DFID. Rajasthan District Primary Education is beingimplemented in 10 districts with assistance from the Bank. Another 9 distrcts will be coveredunder Rajasthan DPEP II.
The overall literacy is about 39%, while It is 20% for femnale population. Women ratio is 910 per1000 men. The women get married at a low age of only 16 years. This contributes to a highfertility rate of 2.5 percent and a low status of women in the traditional patriarchal social system.
Cottage Industry: Fine art and handicraft industry such as jewelry, texliles, metal work, pottery,stone carving, woodwork, leather craft, painting, wool work and carpets are generally the coltageindustries practiced in the rural and semi-urban areas. Mining and mineral extraction industriesare existing in the geologically famous quarries in the state. The percentage of populationinvolved in industries is very small.
4.2.5 Community health environment
Rajasthan experiences water related diseases such as amoebiasis, gastroenteritis, jaundicelhepatitis, typhoid and malaria (Annexure 4.10). Some of these are mosquito/vector basedand some are due to poor quality of drinking water. Malaria is of most concem. The statealso runs a Health Information, Education and communication Program (HIECP) aimed atthe population down to village level through the Village Contact Drive (VCD). The programcovers general health preservation measures including malaria prevention. Awarenesscampaigns for sanitation, particularly in rural areas, and use of good quality drinking waterare less frequently organized.
SEA: Final Report - Volume 2 April 30, 2000Page 4.12

4.2.6 Overview of subsurface contamination
Due to the and nature of Rajasthan, it is very important to understand the linkages betweenrecharge and land use as significant portion of total groundwater recharge is likely being derivedfrom imgation canals and /or irrigation fields, a fact that is strongly reflected by wide fluctuations inrLs quaiity and water table depths. Modifications to canal constructionloperation, irrigationtechnology and cropping regimes can cause marked changes in groundwater recharge rates. Thesame is true in urban areas, where various facets of urbanization process radically modify existingrecharge mechanisms and introduce new ones. In most of rural and semi-urban areas of thestate, groundwater recharge from in-situ wastewater disposal and/or mains water leakage is oftenmuch larger than that arising from excess natural rainfall under natural vegetative conditions. Itwould normally take several years for infitating water to find its way to groundwater table, whenthe depths involved are in the range of 30-50m. However, under shallow groundwater conditonssuch infitrating water is of serious concem for subsurface contamination and the associatedenvironmental health, hygiene and social well being.
Considering the hydro-geological framework for regulation of groundwater uses, groundwater isnot confined to pipes and channels. Its front-line managers are municipalities, communities,industrialists and farmers; in essence, the water-user and those who take decisions on land-useplanning and waste management.
Based on the above considerations, the vulnerability of aquifer contamination seems to be aconcem due to anthropogenic pollution, excessive abstraction, well head contamination, andnaturally occurring contamination due to mineral dissolution, in the case of the outside basin. Thevarious problems, causes and groundwater quality concemns are summarized in Table 4.4.
Due to considerable complexity and inherent time-lag on many aquifer flow regimes, the causeand effect seem to be de-coupled both when considering groundwater abstraction, and pollution.As such. some control is obviously in the works on groundwater abstraction for water supply andsome restraint on the generation of subsurface contaminant load due to discharges on, and/orleaching from, the land surface. The land use zoning being undertaken by the SPCB is the firststep in the nght direction in applying such controls to specific priority areas identified as resourceconservation zones where the water supplies are threatened or protection zones in areas of highaquifer pollution.
4.2.7 Summary of baseline conditions
* Physically, Rajasthan is the second largest state in India, covering 10% of the area and5% population, but with only 1% of the country's water resources. It is a water scarcestate, with arid to semi-arid conditions, resulting in droughts, uncertain farmingconditions, severe soil erosion, wind drift in the westem desert, and ponding of water inlow lying areas.
* Most rivers, with the exception of Chambal river, are ephemeral with monsoon run offconditions for about three months in summer and virtually dry river beds during the restof the year.
* State's intemal surface water resources are not sufficient for the projected waterdemand, without relying on water imported schemes from adjacent states.
* Groundwater is the main source of domestic supply. In 11 out of the 15 river basins, thegroundwater extraction is over exploited or in semi-critical stage of development. During thepenod 1984-94, about 72% of the state's potential groundwater zones expenenced declininggroundwater levels, ranging from 3.0 to 10.0 m.
* Agriculture is largely rain dependent. About 1.5 M ha is irrigated from surface waterresources, and 1.3 M ha is irrigated with imported water from adjacent states. The areaimgated with groundwater is about 3.79 M ha.
* Surface water imgation is projected to increase to about 5.50 Mha by the year 2015 while thegroundwater irrigated areas are projected to reduce by about 10- 20%, due mostly to
SEA: Final Report - Volume 2 April 30,2000Page 4.13

competng water demands from other sub-sectors such as domestic, live stock and industrialuses, and intense management of groundwater overexploited zones.
* Waterlogging conditions exist within the irrigated areas of the State. An area of about 440,000ha is estimated to have water table within 3.Om below ground ievel, and an area of about 1.0million hectares has water table depth between 3m and Sm.
* Water quality is a major concern throughout the state, within the irrigated areas, urban andrural areas. and in the areas impacted by industrial complexes.
* In-stream water quality is variable. Only Sabarmati and a small stretch in the Banasnver are A class, which is fi for drinking without treatment but with disinfection. Theremaining streams are down rated, classes B to E.
* Some of the red category industries contributing pollution of concem are dyeing, textile,cement, fertilizer, pesticide, sugar, vegetable processing and mining of minerals. Theexisting and potential industrial pollution hot spots are Pali, Balotra, Jhotwara, Jodhpur,Sanganer, Bagru, Bhilwara, Udaipur, Bhiwar, Kota and Bithuja.
* Special Industrial Complexes are also being developed in the State to meet therequirements of specific industries, which could be contributing significant andunspecified quantities of industrial pollution to both surface and groundwater supplies.
* Other than the existing sewerage system in the city of Jaipur, which is essentially servingportion of the city and operating at a low efficiency, there are no sewerage systems inurban areas of the state. Planning is underway to install STP at six cities: Jaipur- southzone, Bikaner, Jodhpur, Kota, Ajmer and Udaipur in the next 4-5 years.
* Agricultural pollution from fertilizer and pesticide uses provide challenges to managingwater supplies on a sustainable basis. Agro-chemical leaching into the groundwateraquifers and migration to surface water bodies could be a potential pollution hazard inthe long term.
* High fluoride concentration in groundwater is characteristic of several areas in westernRajasthan, particularly in Nagaur, Pali, Jalore and Sirohi districts; and, in few districts ofeastem Rajasthan, Jaipur, Tonk, Dungarpur and Bhilwara.
* High nitrate concentration in groundwater is common in Churu. Barmer, Jodhpur, Bikaner,Ganganagar, Hanumangarh, Jhunjhunu, Jhalawar and Dholpur districts.
i lrnigation induced soil salinity is a serious problem in portions of irrigation commands of theOutside and Chambal Basins.
* Aquifer contamination seems to be a concem due to anthropogenic pollution, excessiveabstraction, well head contamination, and naturally occurring contamination due to mineraldissolution in the case of the Outside Basin.
* Most of the forest area is unevenly distributed and is restricted to eastem and southem part ofthe state. Dense natural forests are in protected patches, mosty confined to various nationalforests and wildlife sanctuaries. A few of the planned projects appear to be in the closevicinity of forests.
* Vegetation is in two distinct groups: arid and sparse vegetation in the westem desert and thesemi-humid to sub-humid vegetation in the eastem and southeastem regions of the state.Depletion of biodiversity, particularly due to wanton deforestation in parts of the state,could be an environmental concem.
* Two designated wet lands of intemational significance are: Sambhar lake in Nagur district,supports largest inland salt industry and hosts large number of flamingos and pelicans andother wading birds; and, Keoladeo National Parik, a fresh water marsh hosting wintering andnesting water birds near Bharatpur.
* Culturally, it is one of the states in the country having low social development indicators, suchas infant mortality and literacy, basic and primary schooling, especially girls education, andquality of primary health care.
* Community health environment experiences water related diseases, mostly in ruralareas, due possibly to inadequate health clinic facilities nearby.
SEA: Final Report - Volume 2 April 30, 2000Page 4.14

4.2.8 Baseline data gaps
* Water quality and stream flow information is sporadic and not amenable to assessmentof stream pollution loading.
* Industrial discharge quantities and concentrations on to receiving streams are notavailable, or at the best sketchy to assess the contaminant loading into the impactedaquifers.
* Planned surface water projects in the SWP considered 50% climatic dependability, anassumption that could be updated at the time of next revision of the SWP, and prior todetailed planning of scope for the respective pmjects.
* Long term groundwater recharge estimates differ significantly, as much as 30-50%,between the assessments from the SWP which is based on 198892 data and therecently updated assessment by GWD in 1998.
* The present groundwater draft estimates cannot be used for long term projection ofgroundwater development due to conceptual flaws and highly limited accuracy. Theseestimates need to be fine tuned for realistic management of groundwater resources(Annexure 4.12).
* While the sketchy data on fertilizer and pesticide uses suggested their use is within thenorms, data on agricultural pollutant loading in the receiving water bodies is not availableto estimate the potential impacts.
SEA: Final Report - Volume 2 April 30, 2000Page 4.15
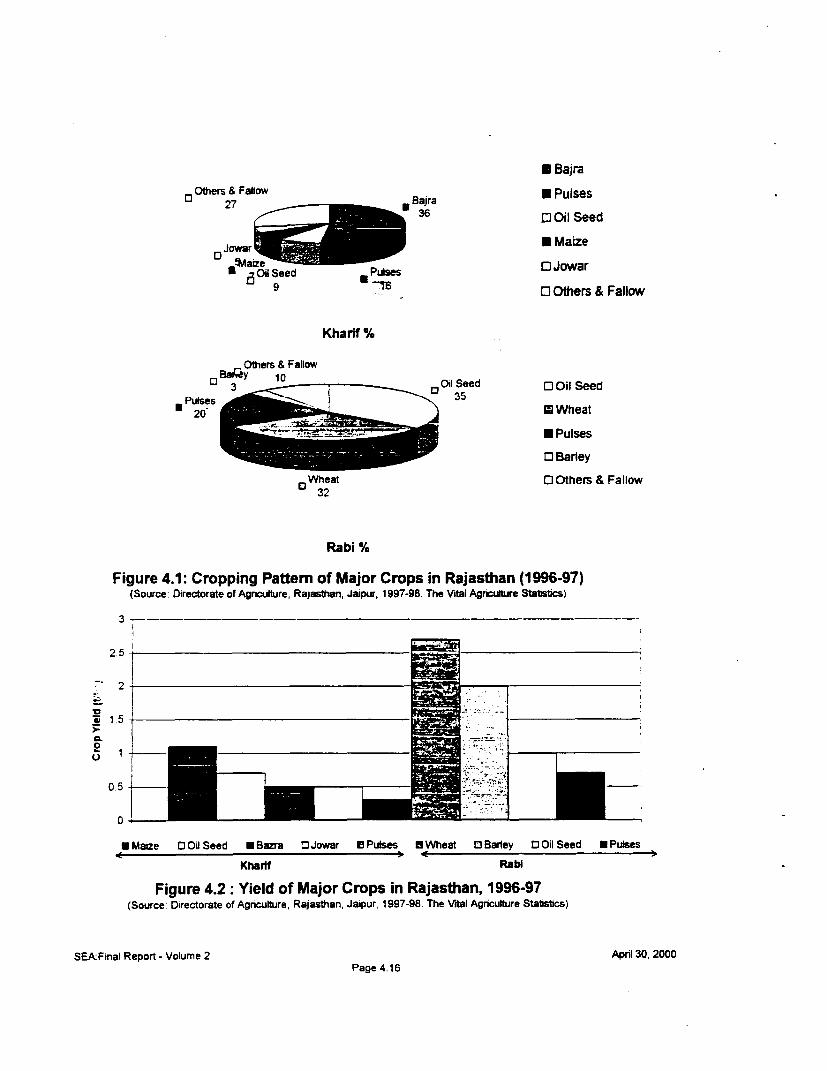
* BajraOthers & Fallow UPle
27 Bajra * Pulses36 DOil Seed
O Jowar OIze MaizeowBOil Seed .Pulses O Jowar
0 Others & Fallow
Kharf %
Others & FallowDl BNQY 1 0 Oil Seed 0 Oil Seed
3~~~~~~~~~~3
* G Wheat
* Pulses
O BarleyWheat 0 Others & Fallow
32
Rabi %
Figure 4.1: Cropping Pattem of Major Crops in Rajasthan (1996-97)(Source: Directorate of Agriculture, Rajasthan, Jaipur, 1997-98. The Vital Agriculture Statstics)
3 71
2.5
2
Z) 1.5-$ =
0.5
0
* Maize 0 Oil Seed * Bazra O Jowar O Pulses D Wheat 0 Barley 0 Oil Seed * Pulses
Kharff RatW
Figure 4.2: Yield of Major Crops in Rajasthan, 1996-97(Source: Directorate of Agriculture, Rajasthan, Jaipur, 1997-98. The Vital Agriculture Statstics)
SEA:Final Report - Volume 2 April 30, 2000Page 4.16

LEGEND
Class Water Ouality Uttor ProdeshA Clean
B Slight Pollution
C Moderate PollutionE Severe Pollution Ralasthan \ e
Water Intake Polnt! f Utiar PradeshRiver ( not monitored)-
Jaipur2 4Polnt Source Pollution Disposal 4 0r0,
1 Textile Industries2 Dyelng - Printing Industries3 Pesticide Industries (p tEdht?r4 Zinc Smelter Industries 404:5 Fertilizer Plants or
6 Cement Plant Bhlwaro
Rajasthan .,Udo p r _ondhi
Sagar
M dhyo Pr esh0 25 50
s KMS
Figure 4.3 eio Mapping of Chembal and Tributaries & Point Souroe Pofution
Ul"Now.: CntrWl Polutom Control Doed. P.a1.b. Vol. B (I). (in*)
SEA: Final Report-Volume 2 Page 4.17 April 30, 2000

45
40
iO 35 20 ----------- . - -_- __ __ __
0 0
E 25 25
20
10 - -- - -- - - - -_ _- - -
U.
5 ------ - -- -- --r ----- a---- -- r-r------ -r- - r- - r -r- ~r-----.-r------~--.-- r- -- r--
0 -1 -I ~ ~ \lb C, T - T %1- b 1-b -- - 1 6 cT c; -c -- 1- !r Cb -T --
95#f 9 5 ¢ 5.r AA \ 9^v lbC 90 %b 60Y9Nofb 9°^ <9°q< 9
Years
Figure 4.4: Chemical Fertilizer Consumption in Rajasthan(N, P, K)
Source: Agricultural Statistics, Directorate of Economics & Statistics, (1973-74 to 1997-98)
SEA: Final Report - Volume 2 April 30 2000Page 4.18

1800 _
1600
1400
E 1200 .a.CL 1000
- 800 ------
Z 600 __ ___
400- _ _ _
200 [l
Districts
Flgure 4.5: Maximum Nitrate (NO3) Concentration In RaJasthan
Source: Groundwater Year Book, Rajasthan, 1989-99, Central Ground Water Board, Western Region, Jaipur. 1999
SEA: Final Report - Volume 2 A T0,
2000
Page 4.19

3500 2%03000 9 * * 50 1.
-2500 4 . . . 200 *
t1500 U a __
50 it Ut *000 u _
20-- - ^ 1200
0~~~~~~~~~~~~~~~~~~~~~~~~
1eo_*=800 aIe 49 - *
1600W?140D f5
*1200 0
GM00 44 * 00-M- -------- --- * *- --
400 U200 ~~~~~~~~~~~~~~~~~~~~200
4000f0
3000 1200 -
e~~~~~~~~~~~~~~~~~~~~~~~~~~~~~~~
- 300 40
9 -^* Q I,e
__ __ _ __ _ __ _ __ _ __f00
*SW00 94* ft00 9
Flgut 4.6-: Productivityi of CropF In Itsuostan Stew
29 Yre AgeurM SbatNs" of* ft"han3 ft
(a IOOFII)
SEk F &10 -hatt Vd ff0-r4.2ta x :eD0

Page 1 of 2
Table 4.1: An Overview of Baseline Environmental Conditions vithin Rajasthan
S.No. Exiing Environment sallne InfomniaonCoditionsI Physical
DemograPhy (million) 1991 - 44.0. 1995 - 48.6 1999 - 50.0, 2015 - 72.9Topography Baun covers 342,240 l2 area In NW part of India. Aravall Nill ranges, easten plains, wem sand
plains and and dunes and Vindhyan Scarplnds and Deccan LaYa Plateu are theunits of the state. Ground elevations above sea level range 150 to 1300m
Soils Thirteen mayor groups (See Map 4.4)Geology Presence of sevral groups of rocks belnging to Archaean and Pfe-Conbran ages foring A va
mountain system. Details In Basin EMPsLand Forms Ar_vaii hill rnges _ nning NE-SW. Plins east of A_ai occpe by pedi_nwn _s fluvial aUU
covered in some parts with snd and sand dunes; sandy plains tD the West of Annaabloccupied by alluvium and wind blown send.
Land Use 15.7 (as per t Plan) Mha under cultvato, approximately 40% of _th sta.Water Distribution 1.5 Mha inigated under 25 major, 75 medium and 2682 minor prects ui 5=209 Mr 3 /y of
surface water and 11.000 Mn3/vr ormundwater Nonroation use Is about 3285 Mrr3 vr.Irrigation Growth 1.07 Mha emgation expansion under ongoing and proposed 17 major, 47 mnedum and 1036 no
proiects.Croppng Pattern Intensity of cropping is very low to moderatelo lw in maior parts of the state (Map 4.9)Climate Tropical steppe, arid, seni-ard and hot Mean annual infall vanes form 310 rwn In westem to 700
mm in eastern Rjasthan wih an average of 590 mm for the entb ste (See Map 4.1)
Reservoirs Details in basin EMPsSurface Water Yield 21,713 Mm3iyear of natural surface water yided at 50% probability wItn the state; Chal rIverS
the only oerimneal river.Drain water No data available: drmn waer used for irrigation in unspecfied quantitV.Groundwater GW mostly occurs in Phearemic condition. Depth ranges from 5 to 50 m bgl. In irigatd area in nori
western portion of Outside basin and in Chambsl basin extensive waterlogging conditionsdeveloped. Waterloqginq is also develped in some parts.
Sedimentation Estimated siltation in reservors vanes from 137 to 475 m3/lmI2/yr which is Iow. Sediment deposdtIreservoirs less than 10% per year.
2 ChemicalSurface Water Quality CPCB Physio-chenical critena - Mahi C ciass; Sabamiati A class; Biological Criitea - Chawbal
Kota, Parbati, Kalisindh, Banas (uis of Tonk). Gambheri, Berach (paty) C Class. Banas river ClaA in sorne parts
Reservoir water quality Suitable for imgaln as per morutonng at Kota barrag of Ch_nbJ aW pamgrh of s__vers.
Groundwater Quality GW quality is highly vanable, in general, mostay saine.Ares with war unfit for drinking vary Irw14 to 79%. 9 out of 15 basins hoving unfit water in more than 50% are. (See Map 4.14)
Soil Salinity & Quality Department of Agncutme estniated 0.73 Mha under different categones of sinity under iigaton.Most of the salinity is due to irngation with poor quaity gwund water. N & P status low to nedium, Khigh. Zinc. Sulphur & iron deficiency in some areas
Point source Pollution High level of industrial develpment in towns like Jaipur. Avwar. Kota, Aj4mr. Bhiwa Pali, JodhpurUdaiPur. Chitor, Baofa snd Bagru. Minn of lime stone, buiig tone, gypsum zinc and cpperPall. Balotra and Jodhpur ae industrial hot spots.
Diffuse source Polluton Soil Sali & Sodicity due to ground wiar Engaton; an disposal of untreated effuen t f rocnties and towns.
Feilizer use N 486,346 t P 150,489 t K 5716 L Aveage nutient use in toW opped area 35 kgtha (1997.w)Fertilizer use i n irgated area 145 kglha which is wifthn recommmnded dose (map 4.12).
Pesticide use Generally static since 1993-94 ranging 0.41 kg/ha (TGM) in 1993-94 to 0.33 kg). in 1997-98. LOWlevel (Map 4.13).
Weed killer use Negligible3 Biological
Desert Enmronment Fairty fragile eco-system in Ouside and Luis basins. Spae vegetation cOer and a limited nbeof species. Unique ecological zone.
Naturai desert Flora Predorninantly tanilies of Posceae (125 spp) and Fabaces (80 app). Spase xrpytic Ipsammophytic grass lands.
Endangered flora (See Table 4.4)Desert Fauna The great Indian Bustard, Chonotis rugnceps vigors is endangered specie & Houba bustard,
Chlamydotus undulala. deseart cat. Fells libyea. the Caracal, Feis Cwacal and the desrt ox,_______________ Vulpes vulpes pusilla are becorinq rare.
Conservation areas Keoladeo bird sanctuary and Sambhar lake are the two Ramser sites, 14 sanctuanes and mn_ ______________ closed areas (See Map 4.17 & Table 4.7)
SEA: Final Report - Volume 2 Apri 30. 2000Page 4.21

Page 2 of 2
Table 4.1: An Overview of Baseline Environmental Conditions within Rajasthan
S.No. Existing Environment Bsline IntormtionConditions
Lakes 11 important lakes; E.ound Udaipur, 2 around Ajmer, 1 each near ML Abu. Bikaner. Jodhpur ancAlwar.
Wild life 57 species of repties, 418 species of birds. 77 species of mammalsForests, sa.km. Reserve 11.521, Protected 17,670. Unclassified 2.781 (Total 31.972) (See Map 4.15).WetUands 3900 ha of stagnant water bodies in Outside basin, Keoladeo bird sanctuary and Sambhar lake.
Endangered fauna 16 mammals, 9 amphibians and reptiles and 13 birds. (Tabie 4.8)Biodiversity Vaned grasses and plants of meicinal importmce, rich in bio-diversity in some areas (See Map 4.1
8 4.17).4 Socio- Cultural
Crop Yields, t/ha Jowar 0.5, bazra 0.5, maize 1.1, wheat 2.7. barley 2.0, aram 0.7 & mustard 1.0. (Figure 4.4)Food for Work Program Not applicable at presentLand tenure Average ize of land holdng 4.1 ha. Marginal farners 30%, snall 20%, medium 41% & lage 9%.
Settlement Pattem Populabon density 129 /km.2
Quality of life (1995.96) Total literacy rate 38.55%. decadal growth rate 28.44%. Per capita eieetrity corsumption 389Mkwh.
Gender equitv 910 women Der 1000D men. Mean aae at rurriage 15.5vrs,; female literacv 11.3%.People partcipabon Cooperatve Societies 20.089Tounsm Very important. 7 tourist arcuitsHistorical sites 20 (Map 4.17)NGO involvement 239Indiaenous Tribal population in Mahi. Sabamat and Chambal basins.
5 Communttv HelthMalaria 342105. ases r 1000 -7Gastroenteribs 556.250, cases per 1000 - 1Jaundice 14,748, cases per 1000 - 0.3 Cases reported in 1997Amoebiasis 51 6.316. cases per 1000 - 11Tvphoid 78545, oases r 1000. 1.6
SEA: Final Report - Volume 2 April 30, 2000Page 4.22
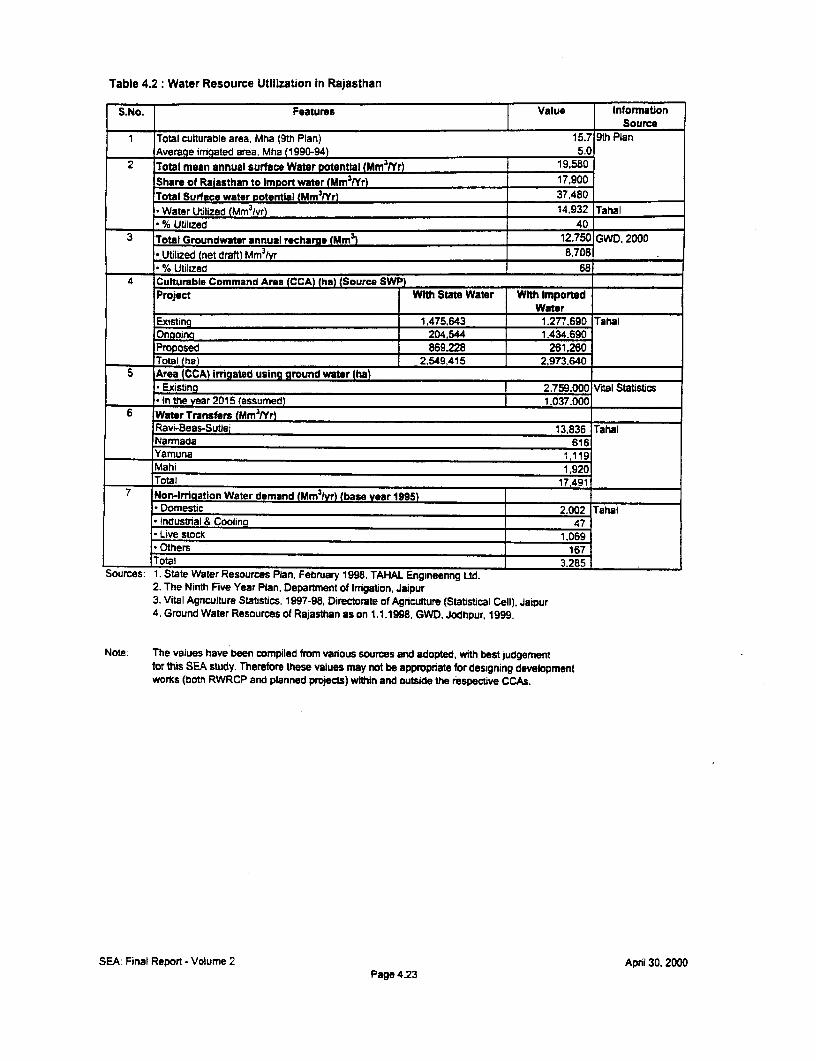
Table 4.2: Water Resource Utilization in Rajasthan
S.No. Features Value InformationSource
1 Total culturable area, Mha (9th Plan) 15.7 9th PlanAverage irrigated area. Mha (1990-94) 5.0
2 Total mean annual surface Water potential (Mm3PYr) 19,580Share of Raiasthan to Import water (Mm3lYr) 17,900Total Surface water Dotential lMm3IYr) 37,480* Water Utilized (Mm3/yr) 14.932 Tahal* % Ublized 40
3 Total Groundwater annual rechara. (Mm3) 12.750 GWD. 2000* Ublized (net draft) Mm31yr 8,708* % Utilized 68
4 Culturable Command Area (CCA) (ha) (Source SWP)Project With Stats Water With Imported
Water ______ __
Existing 1,475.643 1.277.690 TahalOngoinc 204,544 1,434.690Proposed 869,228 261,260Total (ha) 2.549,415 2,973.640
5 Area (CCA) irrigated using ground water (ha)* Existinc 2,759.000 Vital Statistcs* In the year 2015 (assumed) 1,037.000
6 Water Transfers (Mm3tYr)Ravi-Beas-Sutlei 13.836 TahalNarmnada 616Yamuna 1,119Mahi 1,920Total 17,491
7 Non-Irrigation Water demand (Mm3tyr) (base year 1995)* Domestic 2.002 Tahal* Industrial & Cooling 47* Live stock 1,069* Others 167Total 3.285_
Sources: 1. State Water Resources Plan, February 1998. TAHAL Engineenring Ltd.2. The Ninth Five Year Plan, Department of Irrigaton, Jaipur3. Vital Agnculture Statistics, 1997-98. Directorate of Agriculture (Statistical Cell). Jaipur4. Ground Water Resources of Rajasthan as on 1.1.1998, GWD, Jodhpur, 1999.
Note: The values have been compiled from various sources and adopted, with best judgementfor this SEA study. Therefore these values may not be appropriate for designing developmentworks (both RWRCP and planned projects) within and outside the respective CCAs.
SEA: Final Report - Volume 2 April 30. 2000Page 4.23

Table 4.3: List of Flood Prone Areas (Refer Map 4.8)
Sl.no. Basin Sub-basin District Important towns/villages in
(Referred to the flood prone area
In Map 4.8)
1 Luni Luni Ajmer Ajmer cityBanner Balotra, Sindri,GudaJalore Chitalwana, Bhawatra
1A Luni Jodhpur Bilada
2 Luni Jodhpur Kakelav,Kankani, Dudiya3 Joiari Jodhpur Benar.Banhiya, Kalyanpura
4 Budh Hemawas Pali Rani, Chanod
5 Sukri Jalore Rama, Bhavrani, Debawas
6 Jawai Jalore Ahore, Jalore7 ____ _ Bandi Sirohi Pandiv, Jdwal
8 Sngi Jalore Jaswatpura. Nimbawas
_________ 9 Sukli Sukii Sirohi Karaunti
10 West Banas West Banas Sirohi Abu Road11 Banas Banas Udaipur Udaipur citv12 Berach Chittorgarh Chittorgarh city, Sambhupura13 Banas Bundi Khatoli.Tonk Unara
14 Morel Jaipur Jaipur, Sanganer
15 Mashi Jaipur Bichun16 Mahi Som Udaipur Chillwand
17 Som Udaipur Jhadol18 Chambal Mei Bundi Bundi city19 Chambal Kota city20 _ Chambal Kota Kathun21 _________ Kali Sindh Kota Khaiun22 _________ Kali Sindh Kota Sangod23 Kali Sindh Jhalawar Jhalawar city24 Kali Sindh Jhalawar Richwa
25 Parwan Jhalawar Manohar Thana
26 _ Parwati Jhalawar Chhabra, Baran, Karaiahat27 Parwati Baran Baran town
28 Banganga & Banganga & Bharatpur Kaman, Phari. Bharatpur, Deeg,Ruprail Ruprail Bayana, Roopwas,
29 Sabi Sabi Alwar Kotkasim, Tapukara, Patiabad,30 Shekhawati Mendha Nagaur Kuchaman31 Outside Ghaggar Sri-ganganagar Hanumangarh, Pillibanga,
&Hanumangarh' Suratgarh, Jetsar, Srivijaynagar
Source: Chief Engineer, Irrigation Deparment, GOR, Jaipur.
SEA: Final Report - Volume 2 April 30, 2000Page 4.24

Table 4.4: Groundwater Qualitv Problems.
Ty,pe of Problem Causes ConcernsAnthropogenic Inadequate protection of Pathogens, Nitrates, Ammonia,Pollution vulnerable aquifers against sulfate, Boron, heavy metals and
manmade discharges and halogenated hydrocarbons.leachates from urban/industrial activities andintensification of agriculturalcultivation
Excessive Saline and/or polluted Mainly Sodium, Chlorides, butAbstraction groundwater induced in flow can also include persistant
into fresh water aquifer anthropogenic contaminants.Well head Inadequate well design and Mainly pathogensContamination construction (and inadequate
abandomnent procedures),allowing ingress of pollutedsurface water or shallowgroundwater
Naturally occurring Related to pH-Eh evolution of Mainly Iron, Fluoride, sometimescontamination groundwater and dissolution of Arsenic, Manganese, Aluminum,
minerals ( aggravated by Magnesium. Sulphate, evenanthropogenic pollution and/or Nitrate.excessive abstraction).
Source: World Bank 1999.
SEA: Final Report - Volume 2 April 30, 2000Page 4.25


5.0 ENVIRONMENTAL ISSUES


5.0 ENVIRONMENTAL ISSUES
5.1 Preamble
The general growth trend in Rajasthan's water sector is similar to the situation elsewhere in India.Finite and fragile water resources of the State are stressed and depleting. Continuing pressure foririgation intensification and.expansion, require fundamental changes in water allocation, planningand management.
The proposed water development strategy and baseline environmental review indicate that thekey emerging issues are related to water quality, socio-cultural, water transfers, and environmentalmanagement. Water quality issues are less evident than the more visible quantity relatedproblems, but are critically important to social welfare and resource sustainability. Some spotexamples of emerging issues and imbalances in the water sector include:
5.2 Water Quality Issues:
Irrigation efficiency on surface irrigation schemes is typically only 30 to 40 percent, andunaccounted water losses in domestic supply schemes range from 30 to 50 percent
* In urban areas such as the city of Jaipur, which depend on groundwater supplies, the aquifersare being depleted rapidly and also being severely polluted due to inadequate sanitationfacilities
• The general public has limited understanding of the nature of the many water sustainability,environmental, or public health issues and their consequences. The threat of salinization fromrising groundwater levels in irrigated agricultural lands is not understood by them until thewater table has reached the root zone, already late for remedial actions
* Water quaiity issues are gaining recognition as groundwater depletion worsens. The level ofnatural contaminants such as fluoride and arsenic, and chemical pollutants such as salinity,boron, pesticides and insecticides, is high and rising.
* Over the years with rapid growth in population, industrialization and indiscriminate exploitationof rivers, they are now polluted. This situation in lakes is alarming due to contamination byindustrial and human wastes. Due to pollution by partially treated and untreated sewagedischarged in to the receiving water bodies, there are a number of negative environmentalproblems. Some rivers dry out in summer with resultant impact both on the supply of drinkingwater and in-stream assimilative capacity.
* At the field level, rural water supply programs are not integrated with sanitation, nor are theyintegrated or coordinated with pnmary health care or education programs.
5.3 Social and Cultural Issues:
* The quality of life of indigenous people is impacted by water development projects, withissues such as: social structure and income sources; resources used; technical data onproduction systems; relationship between indigenous people and others; production andmarketing activities; and land tenure.
* Agricuitural practices, such as the use of fertilizers, pesticides and weed management* Social values of water availability (surface and groundwater)
Loss of opportunities due to water logging and salinization* Social imbalance and health hazards due to unsafe drinking water* Soual awareness of irrigation rehabilitation and other water related development programs
that would enhance the quality of life of farming community.* Soao-cultural practices of farming community related to typical household activities such as:
land ownership and inventory; cropping pattem; crop marketing opportunities; live stockoperations; produce and local practices of caring and tending of live stock; fodder and feedpractices; income generation of women farmners
SEA: Final Report - Volume 2 April 30, 2000Page 5. 1

* Farmers involvement in irTigation system rehabilitabon and management,* Village level socal imbalances due to poor conditions of existing irrigation systems.
5.4 Water Transfer Issues
* Due to the ephemeral nature of most of the river systems, inadequacies of water supplies intime and space would increase which in tum provide focus on the need for inter-basin andintra-basin water transfers.
* The environmental and social issues related to transfers of water from surplus basins to deficitbasins would be a concem to both Rajasthan and the states exporting the waters. Suchschemes will have far reaching implications: political senstivities associated with watertransfers: technical, economic, social and environmental issues: identifying cost effective andfeasible options; demand management.
* Projects such as the IGNP, Sidhmukh Nohar, utilization of Rajasthan's share of Namrnadabasin waters from Gujrat, and the Yamuna basin waters from Haryana are examples of inter-state pollutant transfers via the open canal systems, and an unspecified impact on theregional aquifer exploitation.
5.5 Environmental Management Issues
* Preventing waterlogging and salinization by incorporating integrated operation of surface andgrundwater systems, including conjunctive use of surface and groundwater and adequatedrainage
* Preventing standing water nuisances by introducing improvements in irrigation systems* Considering sewage reclamation for irrigation• Excluding the utilizable groundwater potential areas (identified by PHED) having higher than
permissible levels of certain chemicals for drinking* Exaluding from utilizable groundwater potential for irrigation, those areas having higher
groundwater salinity than pernissible levels* Limiting raising water levels in existing dams, where this was found necessary, to the
designed maximum water level (MWL), to avoid submergence of additional areas* Minimizing forest area coming under submergence of new projects= Management of groundwater depletion due to over exploitation.- Management of industrial effluents in existing and potential hot spot areas.
5.6 Categorization of Environmental Issues
Table 5.1 and Box 5.2 present basinwise environmental and social issues caused by variousenvironmental conditions such as these identified in Box 5.1.
Box 5.1:Cumulative Environmental and Social Conditionsin the Water Sector
* Canal Seepage * Dam construction in ephemeral streams* On-farm water and nutnent losses * Over application of fertilizer and pesticides
I Inadequate maintenance of imgation . Proximity of water development projects fromand drainage systems forests and protected areas
* Over-exploitation of groundwater * Municipal and industrial discharges intoephemeral streams.
SEA: Final Report - Volume 2 April 30, 2000Page 5.2
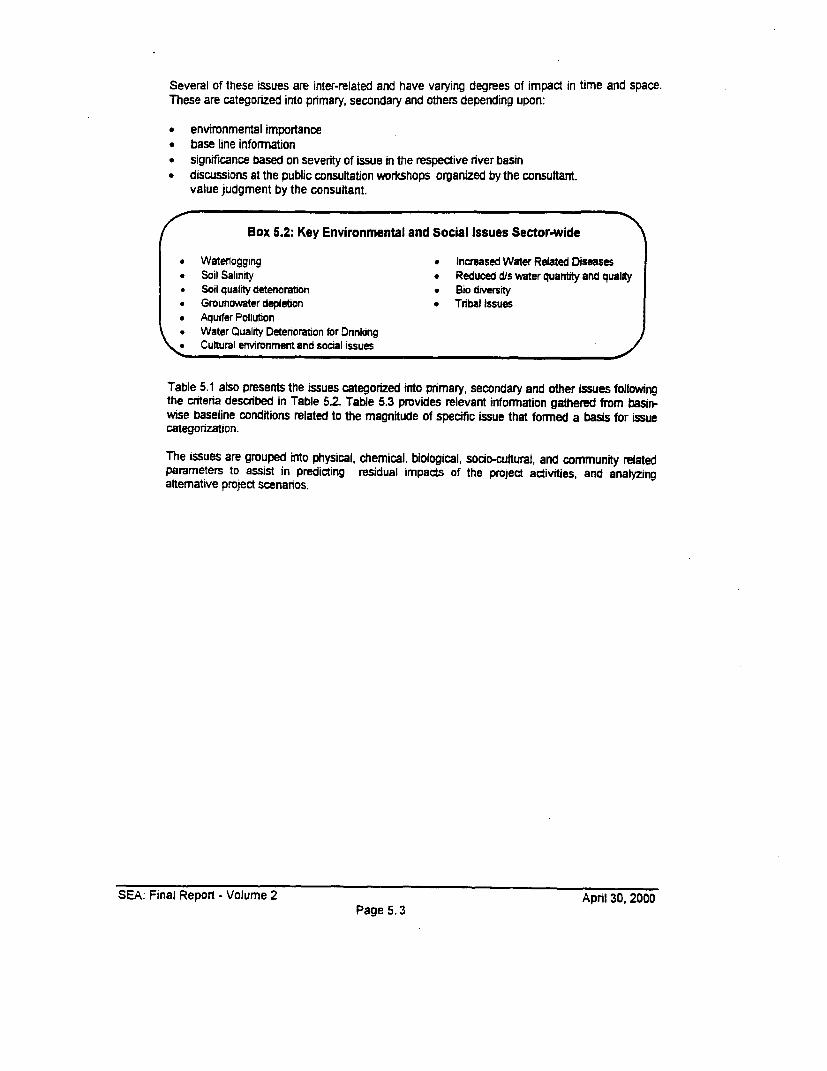
Several of these issues are inter-related and have varying degrees of impact in time and space.These are categorized into pnmary, secondary and others depending upon:
* environmental importance* base line information* significance based on severity of issue in the respective river basin* discussions at the public consultation workshops organized by the consultant.
value judgment by the consultant.
Box 5.2: Key Environmental and Social Issues Sector-wide
* Waterlogging * Increased Water Related Diseases* Soil Salinrty * Reduced dWs water quantity and quality. Soil quality detencrabon * Bio diversity* Grounowater depletion * Tribal Issues* Aquifer Pollution* Water Quality Deterioration for DOnking
Cultural environment and social issues
Table 5.1 also presents the issues categorized into primary, secondary and other issues followingthe criterta described in Table 52. Table 5.3 provides relevant information gathered from basin-wise baseline conditions related to the magnitude of specific issue that fomned a basis for issuecategonzation.
The issues are grouped into physical, chemical, biological, socio-cultural, and community relatedparameters to assist in predicting residual impacts of the project activities, and analyzingaltemative project scenarios.
SEA: Final Report - Volume 2 April 30, 2000Page 5.3

Table 5.1: Environmental Issues Summary
EMP Basin River Basins Category
Group i Primary Issues Secondary issues Other Issues
I Chambal Waterlogging Soil quality deterioration Eutrophication, aquatic vegetationSoil Salinity Water quality deterioration tor drinking Subsurface drainage and downstream water quality
Aquifer pollution Dam construction and downstream impacts. Ground waler depletion'
Increased water related diseases Reduced d/s water quantity and quality.Cultural environment and sociat issues Bio-diversity
Tribal issues
2 Outside Waterlogging Soil salinity Subsurface drainage and downstream water qualityIncreased water related diseases Soil quality deterioration imported water quality ( Impact ot upstream development)
Water quality deterioration for drinking Groundwater depletionCultural environment and social issues Biodiversity
3 Mahi Watetlogging Waler quality deterioration tor drinking Soil quality deteriorationIncreased water retated diseases Reduced d/s water quantity and quality. Bio-diversltyTribal issues Soil salinityCultural environment and social issues
4 Banas Increased water related diseases Reduced d/s water quantity and quality. WaterloggingSoil salinity Aquifer pollulion Groundwater depletion
Soil quality deterioration Bio-diversityCultural environment and social IssuesWater qualily deterioration for drinking & irrtpaton
5 Shekhawalti Sabl Groundwater depletion Waterlogging Soil quallty deterioration
(Group 5) Soil salinity Increased water related diseases Bio-diversItyWater auality deterioraton for drinking Cuitural environment and social Issues
6 Ruparail, Banganga. Sodi Salinilty Pesticide & fertilizer use Waterloggtng
Ghambhlr, Parbatl Water quality deterioration for drinking b Irrigation Blo-diversity(Group 6) Groundwater depletion In Ruparail and Cultural environment and social Issues
BangangaAnuller pollution In Ruparaltl
7 Luni Soil Salinity CuNural environment and social Issues Soil qualty deterioration
Groundwater depletion WaterloggingAquifer pollution BlodiversityWater quality deterioratlon for drinking A irrigation
Sabarmali Cultural environment and social Issues Blo-diversityWater quality deterioration for drinking Sol saHnityAquifer pollution Groundwater depletionIncreased water related diseases Soil quality deteriorationWaterFqing
9 West Banas. Groundwater depletion Soil salinity Sol quality deterioration
Sukil. Other Naltahs Water quality deterioration for drinking Tribal Issues Bto-dtversIty
(Group 9) Increased water related diseases__________________ Cultural environment and social Issues _I_
Based on teed back from Public ConsultationNote: Walertogging areas are within the CCA. and groundwater depletion areas are outside CCA
SEA: Final Report - Volume 2 Page 5.4 April 30. 2000

Table 5.2: Criteria for Categorising Environmental Issues
S.No Parameter/ Issue Categori ation CriteriaPrimary Issue Secondary Issue
1 Waterlogging (WTc3m bgl) Area 2 10% of CCA Area 5-10% of CCA
2 Salinity (ECe > 4dStm) Area Ž 10% of irmgated areas; soil texture; 5-10% of imgated areas; soil texture:groundwater quality (EC>1dS/m) for groundwater quality (EC>1dS/m) for imgatonimgation; and, extent of acquifer >50% not and, extent of acquifer > 25-50% not suitablesuitable for irTigation or drinking. for imgabon or drinking.
3 Aquifer Pollution* Point Source Judgement based on number, concentration and types of industry & municipal waste.
Diffuse Source Judgement based on agricultural extent4 Increased Water releated Area with Wr <3 m bgl is 2 10% of CCA Area with WT <3 m bgl is 5-10% of CCA and
diseases and reported cases, aridity, populabon reported cases, aridity, population density.densitv
5 Cuftural environment and lmgation and rehabilitabon development in irrigation and rehabilitation development in 25-social issues >50% of irigable area 50% of imgable area
6 Water quality detenoration Populabon density>200 personsisq km Population density 1S0-2001sq km and has 25-for dnnking and has>50% basin area unfit drinking 50% basin area unfit for drinking. Unbtated
water. Untreated industrial & municipal industrial and municipal waste disposal.waste disposal.
7 Ground water depletion Over exploitation stage of development Critical stage of development (90-100%)('100%) ___
8 Soil quality detenoration Judgement based on cropping patten. land use, fertitizer and pesticide use.9 Reduced d/s water quantity Impact based on wld life, instream flows, drinking water demand
and quality10 Bio-diversity lmgated area of planned projects within 25 lmgated area of planned projects outside of 25
km of reserve area and the extent of km of reserve area and the extent of irigabonimgabon development >50% of basin area development 25 to 50% of basin area.
1 1 Tribal issues Judgement based on whether Imgaton development or irrgated_canai is routed through tribal areas
1 Seoiment loading and soil Siltation 2 10% reduction in live storage Siltation 5-10% reduction in live storage pererosion oa Dr year ivar
Note 1: Wateriogging includes waterlogging (< 2.0 m watertable) and potential waterlogging (WT between 2.0 and 3.0 m)2 Ground Water Development: Critcal 90-100%: over explotted >100% as indicated by rabo of net draftl recharge3 Water related diseases are related to extent of water logging area4 Water quality for drinking reiated to population density
SEA: Final Report - Volume 2 April 30. 2000Page 5.5
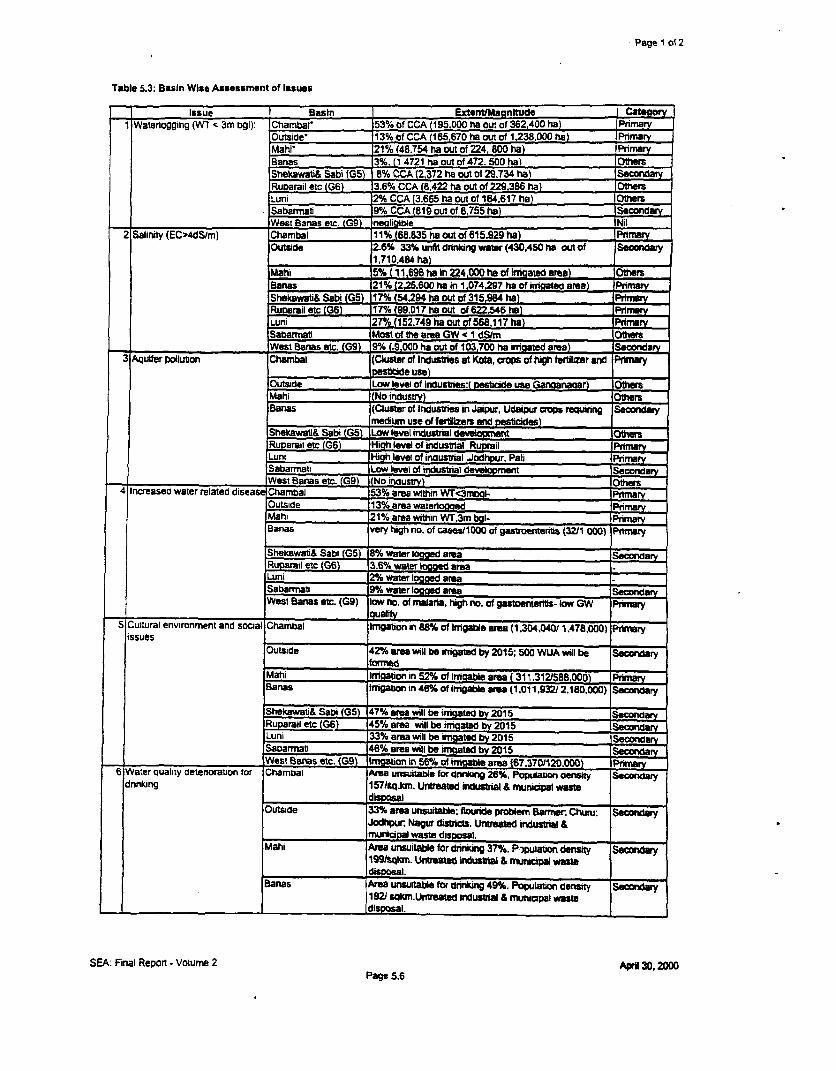
Page * of 2
Table 5.3: Basin Wise Assessment of Issues
IlIsue Basin Extent/Magnitude Ctcr1 Watenogging (WT c 3m og1): Chambai 153% of CCA (195,000 ha out of 362,400 ha) Pnmarv
Outside 13% of CCA (165,670 ha out of 1.238,O0 ha) PrmarvMahi- 21% (48.754 ha out of 224, 800 ha) PrimaryBanas 3%. i 4721 ha out of 472. 500 ha) OthShekawi& Sabi (G5) 8% CCA (2,372 ha out of 29.734 ha) SecondarvRuparail etc (G6) 3.6% CCA (8,422 ha out of 229.386 ha) OthersLuni 2% CCA (3.665 ha out of 164,617 ha) OtersSabamtat 9% CCA (819 out of 8.755 ha) Secondary
_ West Banas etc. (G9) nealiigible Nil
2 Sabrity (EC>4dS/im) Chambal I1% (68.835 ha out of 615,929 ha) PrirtryOutside 2.6% 33% unfit drino water (430,450 he out of Secondary
1,710,484 ha) Mahi 5% (11,698 ha in 224,000 ha of irrigated or"a) OthersBanas 21% (2.25.600 ha in 1,074.297 ha of iiaMted area) PuSheltwati& Sabi lG5) 17%(54.294 ha out of 31S,984 ha) PrmRunarail etc (G6) 17% (99.017 ha out of 622,546 ha)Luni 27% (152.749 ha out of 568,117 he)Sabamati Most of the area GW < I dSIm OtrsWest Banas etc. (G9) 9% (.9.000 ha out of 103,700 ha irrioated area)
3 Aquifer poulibon Chambal (Custer of Industries at Kota, crops of high ferftiizer and Primey. _______ _ p pstsde use)Outside Low level of industnes:( pesbcide use Gancianagar) OftersMahi (No industry) OthersBanas (Cluster of industies in Jaipur, Udaipur r requirnng Secnar,y
_____________ n edium use of fertilzers arid pesticides)Shekawati& Sabi (G5) Low level industril devel et OhersRuparail etc (G6) Hih level of industrial Rupiil PvLuni Hig lee of indusrial Jod r. PalirirrSabarrati Low ievel of industrial devopment Seconda
__________________ West Banas etc. (G9) (No ridusv) Others4 Increased water related disease Chambal 53% area within WTc3mb - rima
Outside 13% area waterloged 'rimarvMahi 21% area within WT.3m bgl- PrimarBanas very high no. of caseI0OO of gasroerteriti (3211 000) Prmaury
Shekawati& Sabi (G5) 8% water looged area S_eco arRuparail etc (G6) 36% water oged ar -
Luni 2% water logged areaSabarnrati 9% water logged area SecondaryWest Banas etc. (G9) low no. of rmSaria, high no. of gastoenterilis- low GW Prnary
__________________ quali1tyv5 Cultural environmnent and social Chambal Irigaibon in 88% of Irngare area (1.304.040/ 1.478,000) Pimary
issuesOutside 4 2% rea wil be inid by 2015; 500 WUA will be Secondary
Mahi !rigatoni in 52% of imol area ( 311.312/588000) PmayBanas l*gatonin 46% of imgabe are (1,011.932i2.180.000) Secondary
Shekawati& Sabi (G5) 47% area will be irigate by 2015Ruparail etc (G6) 45% ara wil be ated by 2015 Sea idarLuni 33% ama will be irrigated by 2015Se arSabarmati 46% area will be iatdr by 2015West Banas etc. (G9) Irnigation in 56% o igigable area (67.370/120.000) Pnmary
6 Water quality detenoration for Chambal Ara unsuitable for dnlrkg 26%, Population density Secondarydrinking 157h%q.km. Untted indusirial & frunicipal waste
djisposal
Outside 33% area unsutable: flouride problem Barrner. Churu: SecondaryJodhpur; Naur disicts. Untreated industr4ia &municipal waste disposal.
Mahi Area unsuitable for drinking 37%, Papuiation density Seconar1991Sqkrn. Untreated industrial & nunicipal waste
_disposal.
Banas Area unsutatble for driming 49%, Popultion densty Secodary1921 sl1m.1tltreated indusria & aunicipal waste
______ _____ _____ disposal.
SEA: Final Report - Volume 2 April 30. 2W00Page 5.6

Page 2 of 2
Table 5.3: Basin Wise Assessment of Issues
Issue Basin Extent/Maanltude CategorySheKawati& Sabi (G5) Unfit in 6672% area. Untreated inoustnal & municipal Pnmary
waste disposal
Ruparail etc (G6) Unfit in 60-14% area. Untreated industral & municipal Primarywaste disposal.
Luni Unfit in 55% of area. Untreated industrial & municipal Primarywaste disosal
Sabarmati Unfit in 23% of area SecondaWest Banas etc. (G9) Area unsuitable for drnking 63-79o Population density Prinmary
1119)sQkrn.7 Ground Water depletion Chambal Sta of development of GW 40% Others
Outside SUM of development of GW 70% OthersMahi Sta of developmert of GW 30% OthersBanas S of develop t of GW 70% OthersShekawati& Sabi (G5) 110% over exploited PrmaRuparail etc (G6) 132 % over exploited PrimaryLuni 109% over exploited PrimarySabarmati 78% exloited, semi-ctical OthersWest Banas etc. (Gg) Staae of development of GW 11 8% Primary
8 Soil quality detenoration Chambal Seconda(due to excess agro-chemical Outside 10% inigated area Secondaryuse) Mahi Otters
Banas OthersShekawati& Sabi (G5) for Mustard crop SecondaryRRuparafl etc (G6) for Mustard crop SecondaryLunt Bazra based cropping not much fertilizer use OthersSabarmati Not much use OthersWest Banas etc. (G9) Others
_ Reouced d/s water quanuty Chamdal Secondary& quality Outsioe Nil
Maht SecondaryBanas SecondaryShekawatu& Sabi (G5) NilRuparail etc (G6) NilLuni NilSabarmati NilWest Banas etc. (GO) Nil
10 Bio-diversity Chambal Imqiabon development of basin area 41 % Secondary(1.3D4Mha/3.136 Mha)
Outside Imbtion development 20% area OthersMahi Imgation development of basin area 20% (0.31 Mha/ Others
1.66Mha)Banas Imgation development of basin area 22% (1.01 1 Mhal Others
4.580 Mha)Shekawati& Sabi (G5) 11% area in imqation development OthersRuparail etc (G6) 29% of area in imration develoDment SecondaryLuni 13% of area in imgation develoDment OthersSabarmati 10% of area in irrigation develooment OthersWest Banas etc. (G9) Irgaltion development of basin area 14% (67370/ Others
470000)11 Trbal issues Chambal Tribals in Baran distnct Secondary
Outsioe NilMahi Tnbals in whole basin PnmaryBanas NlShekawati& Sabi (G5) NilRuparaul etc (G6) NilLuni NSabarmati NilWest Banas etc. (G9) Tribais in Sirohi distnct ISecondary
Watertable data of post-monsoon 1998. others as on January. 1998
SEA: Final ReDort - Volume 2 April 30. 2000Page 5.7

EMP Basins River Basins
RL .raktW
l 5:4 Tne Ou Lft i _" Ru4armi
- W" A Gwit&r
- fktaiftaISApG, WmA~
tl ~ ~ ~ a 5.; =a o Rajas r.rhn (6; Bais
SEA Final eport - Voume 2 _2' - Iul020
J~~~~4)3N -BWklt fJI
MSI heO O _ e
LEGEN
.~~~~~~~~~~~~~~~~~~~~Drf PAKSTA OMffR {,
I~~~~~~~~~~~~~~~~ Ij GUJAR~~~~~~~PNATB
UIADHYA PRADESH
Mfiap 5.1: Map of Rajasthan Eb1P Basirts
SEA! Final Report - Volurme 2 Page 5-8 April 30. 20DO

6.0 POTENTIAL CUMULATIVE ENVIRONMENTAL IMPACTS


6.0 POTENTIAL CUMULATIVE ENVIRONMENTAL IMPACTS
6.1 Identification of Impacts
Impact identification is a continuous pmcess. It occurs during screening and scoping exercise ofprojects and continues to impact prediction as new information becomes available. For this SEA,potential impacts have been initially idenified thmugh gathering of issues and categoriation ofthem into primary, secondary and others using the baseline data compiled for the impactassessment of project activities. The public consultation process provided additional informationwhich in tum assisted in confirming and/or modifying the severity of impacts, where reqwired.
Following this SEA preparation, gmund verification of existing conditions in various river basinsand forthcoming additional details of the proposed development would significanty enhance theimpact prediction capability of specific projects and some of the more significant sector-wideenvironmental and social impacts.
6.2 Methodology
Water resource development projects, such as the RWRCP and other planned projects, includingthe sector-wide changes (reduction) in groundwater development, cover large areas. They willlikely be concurrently undertaken in several river basins which have varying climatic and physicalconditions. A systematic approach to identifying the impacts as an aid to providing a framework toguide EA implementation has been adopted. It incduded developing a checklist and an interactivematrix of environmental factors and development actions likely to cause impacts. Wherepossible, overlay maps are also tried to show position, nature and extent of natural and humanattributes such as, water logging and saline areas, agricultural lands, settlements of tribalpopulation, and cultural resources including reserve and forest areas in the individual river basins.Thus, a combination of structured and semi-structured approach and professional judgment toimpact prediction has been adopted based on the available data base.
6.3 Impact Assessment Guidelines
Five categories of impacts were considered in developing the guidelines for impact prediction:scope; magnitude; direction; short-term; longterm; reversible and non-reversible nature ofindividual impacts The evaluation of 'significance' of impacts, was based on the aboveguidelines and elaborated in Box 6.1.
Box 6.1: Impact Assessment Guidelines
* Scope (local, basin-wide, regional)* Magnitude (high, medium, low, negligible)* Direction (positive, negative, neutral)* Duration (long-term, medium-term, short-term). Reversibility (reversible, irreversible)
Where:* Local is within 1 km of the proposed development activity, basin-wide is within the basin
itself, regional is within Rajasthan).* High means >75% of the resource/population is affected, medium is between 50-75%,
low is 25 to 50%, negligible is <25%.* Activity will resuft in either net positive, negative or neutral impacts to the affected
resource/population.
SEA: Final Report - Volume 2 April 30, 2000Page 6. 1

* Long term is >10 years, Medium- teml is 2-10 years, short-term is < 2 years.* Activity results in either a reversible or irreversible positive or negative impact to the
resourcelpopulation (within a projected time-frame of 15 years).
It is noted that at the present stage of the RWRCP and other planned projects, severaluncertainties with respect to anticipated environmental and social changes exist. Therefore,additional data could change the predicted results of individual impacts.
6.4 Examples of Impact Assessment
6.4.1 RWRCP
Water logging: This will be reduced due to lining of canals and distributaries, and surface drainagemaintenance. This is local, low in magniude, positive, long term and of coumse reversible, ifmonioring of groundwater levels and regular maintenance are not canied out. While the RWRCPis aimed at deferred maintenance and groundwater management, the positive impacts achievedduring the project implementation would be reversible leading to the deterioration ofenvironmental conditions.
Similarly, most of the achieved positive impacts due to RWRCP activities could result in not soposiUtve to negative impacts in the long termn, should the suggested mitigation measures were notregularly implemented.
6.4.2 Planned projects
Waterlogging: In areas where new surface irrigation projects will be introduced, groundwaterrecharge will take place due to seepage from distribution network and on-farm losses. Thiswould generally cause gradual rise of watertable and over a time waterlogging condition. Thisis regional (extent of new projects being large), medium in magnitude, negative, long-termbut reversible if appropriate preventive and mitigation measures such as OFD, IWAM andO&M of I&D network are taken.
6.4.3 Groundwater development changes
The SWP projected sector-wide changes in groundwater utilization namely, a generalreduction in the groundwater inigation, reduction in the overdraft of groundwater resourcesand significant increases in domestic industrial and livestock demands. The expectedenvironmental impacts are interrelated with the surface water development. A ripple effect atthe local scene could be reversible interference such as an increase in groundwater pumpingdepth; increase energy costs; reduce groundwater quality; and yield; and effect natural andagricultural vegetation. In aquifers having high natural salinity, water table depletion wouldfurther increase the withdrawal of saline and/or contaminated water which will be irreversibledeterioration.
All these will have negative impact on end uses. Positive impacts could include a reductionin water related diseases, improved social conditions and local hygiene and quality of rurallife due to improved water supply and sanitation conditions.
Negative impacts on groundwater quality, whatever its cause, is insidious and expensive:insidious because it takes many years to draw its full effect in the quality of water pumpedfrom deep wells, expensive because by this time the cost of remedying polluted aquifers willbe extremely high.
SEA: Final Report - Volume 2 April 30, 2000Page 6.2

6.5 Impact Assessment Matrix
6.5.1 RWRCP activities
The impacts with respect to environmental parameters in the analysis (Table 6.1) aremostly posiive, except concems on possible reduction in GW aquifer recharge. Thegroundwater extraction to supplement canal supplies (conjunctive use), should be monftoredto avoid over exploitation. The major positive impacts of RWRCP are summarized in Box6.2. Sustainability aspects of the positive impacts are discussed in the section on mitigationmeasures.
Box 6.2: Positive Impacts of RWRCP
* Reduced watelogging* Reduced soil salinity* Increased supplies at tail end* Increased imgation intensity, cropping intensity and crop yield* Balanced use of agro-chomicals* Reduced pollution from agro-chemicals* Socio-economic uplift and improvement in the quality of life of farmers and farm workers* Improved status of women farmers and women farm workers* improvement in socio-economic and cuitural traditions of tribals* Increased participation of farmers in I and D system management* Decrease in the incidence of water related diseases
6.5.2 Planned projects
The impacts are mixed, mostly positive (Table 6.2). The negative impacts are reversible andwith the implementation of suggested mitigation measures, the impacts can be minimizedwvith negligible residual balance. The major positive and negative impacts of plannedprojects are summarized in Box 6.3.
Box 6.3: Major Positive and Negative Impacts of Planned Projects
Positive Negative* Land improvement * Rise in GW level and general* Increased soil fertility waterlogging in CCA* Multiple cropping * Soil salinity development* Water supplies for non-irrigation sector * New reservoirs built-possible* Improved drainage network displacement of people, and de-* Introduction of multiple cropping with high value afforestation
irrigated crops * Reduced in-stream flow* Increased crop yield * Increased use of agro-chemical &. Increased cropping intensity deterioration in surface water quality* Increased GW recharge Detenoration of GW quality in* Conjunctive use of surface and GW industrial areas. Increased GW quality * Increased water related diseases in* Socio-economic improvement rural areas* Improved quality of life* Improvement in the status and participation of\women in faming operations/\ Increased participation of farmers in water
resources developmentanagement
SEA: Final Report - Volume 2 April 30, 2000Page 6.3

6.5.3 Groundwater development changes
As the most valuable natural resource possessed by the large areas of rural Rajasthansupporting public health, agriculture, economic development and ecological diversity, it is stillinsufficiently understood widely undervalued, irrationally exploited, and inadequatelyprotected.
A detailed discussion on the limitations in the long term estimates of groundwater potential ispresented in Annexure 4.12- 4.14. Under these conditions, large scale reductions in irrigationdevelopment with groundwater resources will have signfficant long term environmentalimpacts in the region, both positive and negative. With the addition of point source pollutionfrom municipal and industrial effluents, the situation would provide challenges to sustainablemanagement of groundwater resources as water quality impacts due to pollutant loadingwould mostly be irreversible. In developing strategies for groundwater protection, the issue ofquantity and quality cannot be divorced because of hydraulic complexity of aquifer responseto abstraction and slow response times to changes in recharge quality. An integratedapproach to this and to the interrelation with surface water systems, must be adopted.
Subject to the above rationale for long term impact predictions, some of the major positiveand negative impacts of groundwater development changes within the State's water sectorare discussed in Table 6.3 and are summarized in Box 6.4.
Box 6.4: Major Impacts of Groundwater Development Changes
Positive Negative* Improved water supply to domestic consumption * Decrease in irrigation and cropping
intensity and yield* Rise in water table in existing overdraft areas * Fall in water table due to increased
domestic demand* Conjunctive use of groundwater * Increase in groundwater salinity* Improved quality of life in rural and urban areas * Point and diffuse source pollution.* Social benefits such as people participation in
groundwater management* Reduced water related diseases
SEA: Final Report - Volume 2 April 30, 2000Page 6.4

Sheet I of 2
Table 6.1: Sectoral EMP: Impact Assessment Matrix for RWRCP
RWRCP Components: Improved Irrigatlion management and transfer: Agricultural Intensirication: Sustainable ground water resource managementRWRCP Activities: Rehabilitation and modernization of ItD systems In 755,800 ha: Lining of canals and water courses (as needed); rehabilitation of structures; servIce roads: now measurement; removat of unauthorised outlets;remod ting ofouflets; lormaton of WLtA and Waler Distribution Committee; Strengthening agriculture extension; and, farme trainfng through PRFO and SAIFT.Stto. Environmental Potentlat Envtronmental Rating of Impacts for Signiflcance Measures to sustain litigatlon Measures Residua Impact
Parametar Impact of Project (scopef magnItudef directiont neutral or posftive Impacts for negatIv, Impacts_ _____________________ I I duration/ raversibilityl J
I PhnstcalI Demography No Impact Nit NeglIgIble on a sector-wide
basis2 Topography Land improvement ReglonalAiowlpositivetAong-termAlrreversible3 Soils: water togging Reduced waterlogging Local I low/positvet long-tenm/ reversible O&M of IO network4 Soils: qualiy Increased fedility tWAM5 GeologY No Impat Nil6 Land lonm's7 Land use: head end8 Land use: middle Some Improvement Local/lowtpostiveAtong-tenn/reversible IWAM. O&M of tbD network9 Land use tall end Change from single to mulM croOPO110 On-farm devepment mDroved land levellina ItoUlowpositlve/tong-term!lrreversible OFDI Water disirbition System Increased supply to tail end; Increased Locae lowl positive/ tong-term) reversible IWAM. O&M of l&D network
rtgatton eMdency _t2 Drainoge system Improved drainage Locallmedlum/positive/tong-terml reversible
13 ItNation tnIncrease LocaU l!ewi poslitve knsg-t-emV reversible14 elton GrowthIS C n t nstiy _Local bwt positve! long-lerm! IrreversibleeS Cr e ntroducHon ot high value crops Local! wl poslive Iona-lerrr reversible
17 Clmale No Impact Ni18 Reservot_s19 Surface water quantty Some increase LocaVlow/positIveitong-tenrmreverstble
downstream _
20 Drain water quantity Reduced quantity Locilow1posflvellong term/reversible 08M of IUD network _
21 1GW aquifer Recharge Reduced recharge LocrleNowl nsatitfllong temnnreversible Control of over exploItation ofOW; OW depth monitoring"
22 GW dA leionNO impact Nil _ __ _ _ __ _ _ __ _ _ _23 GW table rise Lower water table Locae low) posilive/ iong-lerml revarsible Control of over explotation of GW. GW depth
24 Conjunctive use Increase25 Erosion Cleaning of canals, water courses a RegtonamediUm)positivefotg-terrtV ObM of IbD network
drains26 Sedimentatin
2 - Chem icat _ _ _ _ _ _ _ _ _ _ _ _ _ _ _27 Surface water quality Reduced potution from agro-chemIcels LocaU lowl positive/ long-termv reversible INM; IPM; weed control; treatment of
downstream. . I Industrtal and municipal eftiuents; WO28 Drain water qusiNty Improvement due to INMI IPM Local)medlum/positiveIshod-lemvreversible monitoring29 Reservoir Water Oust No Impact Nil30 GW drhnkq uaNlItv31 GW irrigation quality 32 Soil satity Reduction In soil salnttv FLocalf ebw poswtHve/ "ng-tmv reversNble ProvIsion of drainae _
SEA: Final Report -Volume 2 Page e 5 April 30. 2000

Sheet 2 of 2
Table 6.1: Sectoral EMP: Impact Assessment Matrix for RVvRCP
RWRCP Components: Improved Irrigation management and transfer: Agricultural intensification; Suttainable ground water resource management.RWRCP Activities: Rehabitbtation and modernization of i&D systems In 755.800 ha: Lining of canals and water courses (as needed); rehabHilation of structures: service roads; flow measurement; removal of unauthorised outlets;remodrting of outtets; formattonoWUAandWater DisibutIon Committee trnhnIng _gFriculture extension; and frmer traning through PRFO and SAIFT.S.No. Environmental Potential Environmental Rating of Impacts for Significance Measures to sustain Mitgation Measures Residual Impacts
Psrametbr Impact of Project (seepel miagnitudet diractiont neutral or pottive Impacts for negattve kmpactsdurationt reveralbllltv_
33 Poinl rre ilutton No Impact Nil
34 Diffuse source poNutlon35 fertitizer use taienced use Locaiitowl neutral/tong-term/reversible INM36 Pesticlde use IPM37 UWeed killer use _Weed control a training
3 9tolok__ala38 Conservation areas No kmpact _Nl39 Wildlife40 Forests41 Endanoered fora42 Ldkestwater bodies43 1odMivensity
4 Socto-Cutturv _44 Crop vield Ircrease LOCtiu lrw/ positivel krne-lerm/ reversible IWAM45 Food ti o pogirm No Impac NH48 Land enure4? Fetement pattem48 OuNtiy to 4it Itmprovement In soclo-economy, LocV medium? positive) long.termv Infrstructue development such as oads,
increase In tlleracy rate. increase In per Irrversible markets and credit a Input fadities
49 Gender equity Imtpoved statue o women,incresse In Local hight positive/ long-ttrm? irreversibleIHeracy more partWpation In bfmihng
______________and decision50 Peopet partWpation ceased paripaton through WUAs LocalU highipositlvet long-ternm reversible Farmer training; 100% membership In WUA
51 Tourism No Impact Nil52 Histortcal tes53 NGO Increased Involvement Localtlow/posilHvetlong termAirreversible NGO Iraining54 Indigenous people Improvement In soclo-economic status
d tribalh In Mahl I West Banas
5 Comnmunity Heallh55 ('iseases urban Not act56 Diseases: rural Decrease In the Incidence of malaria LocaV lowl positive/ long-erm/ reversible Water supply & sanitation
and other waler related disoases e5t 1ilseases: ive stock No I act Nit
Note: II Scope: Local: is within 1 km of the proposed development activity, basin-wide Is within the basin Itsel, regional Is wilhin Rajasthan21 Magntude: High means >75%. medium Is between 50-75%. low Is 25.50% and negligible Is less than 25%3) Oirection Net poshive, negative or neutral Impact4)Duration ong-termmks 10years. medium-termis2-10years, short- trmis 2years5) Reversibility: Reversible or Irreversible (postive or negative) Impact to the resourcelpopulation (wlthtn a projected time -frame ol 15 years).
8) Parameters reqrioIng monhioring
SEA: Final Report -Volume? 2 Page 6 a Aprt 30t 2000

Sheet 0of 3
Table 6.2: Sectoral EMP: rnpact Assessment Matrix for Planned Projects
Planned Projects (Upto 2015j: Irrigatlon expansion In 1 639 Mha (ongoing projects); new irrigation projecis in additional 1 13 Mha:water development for non-agriculture projecls 5000 Mm' (Industry, domeslic, livestock, thermal power)
S No Environmental Potential impacts Rallng of Impacts Measures to sustain Mttigatlon measures Residual Impactaparameter Iscopef magnitudet directionr duratlonl neutral or positive Impaets for negative Impact or benefits
__ _ __ _ __ _ __ _ __ _ j_ __ _ __ _ __ _ __ _ __ _ _ __ _ _ _ _ _ J reversibillhy) I1 Physlcal
1 Demography Population increase due to Improved quality Regional ihigh iposilive Aong lerm /irreversible Increased agriculture output.of life increased water supply
2 Topography Land Imrovement In Irihated area Local /low /posilive Itoncg term /irreversible environmentally beneficial.3 Soils: Wateudogging Rise In GW level, and general watertogging Regional/ mediumv negative long-lerrnl IWAM, OFD and su.bject to miligatlon measures
in CCA reversible Agriculttiral drainage beIng Implemented
4 Soils:quallty Improve Reglonal/mediirniposilivel bona-lermnreversible IWAM5 Gelcay No Impact Nil6 Land Forms7 Land use: head end Ralnfed agriculture to irrigated agriculture: Regionallmedium/posiiiveAiong-leml/rev0rslble IWAM 8 O&M of I&D network
a Land use: middle Change In cropping patemn:9 Land use: tai end
10 On-farm development Increase LocaUmediurns!osltiveilong-te'rr irreversibe ApplIcabte OFD modelI I Water distributilon system Increase in agricutture and non-agriculturat Regional I high /positivel long-terml Infeversible OFD. IWAM. 03M of l&D
demands, network. WUA. Water Pricing
12 Dralnage svslem Some Improvernent Reolonalmediumipositiveliong-trm/irreversible New dralnage network13 Irrigation Intensity Increase RegionalImedium/potitivellong term /reversible IWAM. O&M of I&D network.
WUA
14 irrigation Growth Irrigation expansion RegIonalU high posifivel fong-term/Irreversible OFD. IWAM. O&M oif tAnetwoFk. WUA
15 'rapg Inlettna increased multiple aoppino ReglonaUmedluntpoeilvellona-lermIirreversible IWAM16 rppng Pattem Introductlon of high value rops RegionaUmediunWposiivellong term/reversible IWAMti Climate Improvemenl possibe RegionaU low/ positive/ long-term! irreversible18 Reservoirs New reservoirs built Locallnegtig'blleagatM5 ong-termI Irreversible
19 Surface water quanFity Reduced In-stream fow Local lowl nrslgat! short-term/ reversible MaIntain In-stream flowre tulrements
20 Drain waler qualmlty Increased drain flow Regional/mediumInte9tlvytlong-IermIreversible
21 iW aquiler recharge Inreased recharae RegIonal/medlumIposiflve fang-termr reversible OAU olt lAD network IWAM22 G3W deple-lion NelgeIWAM23 GW table Rise in waler table Regionalmediumnnloaitlve/long-term/lreversible I O&M of 180 network, O-D.
IWALl24 Conjunctive use Increase Local!~~~~~~.. low/ positivel long-term!i reversible Mnorng of Wepotto
-land enforcement**
25 ErosionNosinfct26 SedimentatIon __l -_Vo_ur__2_Page__April_30__200
SEA:Flnal Reporl Volumne 2 Page 6.t April30, 2000

Sheet 2 of 3
Table 6.2: Sectorat EMP: Impact Assessment Malrix for Planned Prolects
Planned Projects (Upto 2015j: Irrigation expansion In 1 639 Mha (ongoing projecis); new irrigation projects In additional 1 13 Mhra;water devetopment for non-agriculture projects 5000 Mm' (Industry, domestic, livestock, thermal power)
S.No. Environmental Potentlal Impacts RatIng of Impacts Measure, to sustain IMlttgatlon measures Residual impactsparemeter (scopeI magnhludel dlrectfonr duraltoni neutral or positive Impactb for negative Impacts Or benefits
. I reverslbilltyj
2 Chem Ical__ _ _ _ _ _ _ _ _ _ _ _ _ _ _ _ _ _ _ _ _ _ _ _ _ _ _ _ _ _ _ _ _ _ _ _
27 Surface waler qualiiy Deteriorated In-siream and drain waler RegionaV medium/ negattl reversible M Miain acceptable waler
downstream quality; Increased industrial and domeslic quality, INM. IPM. etluenteffluent; and increased pesticide use treatment and monitoring,
and entorcement "
28 Drain water quahly Deterioration due lo Increased agro- Regionaltmediumttgatii/reversible INM. IPM. Monitoring"chemicals use
29 Reservoir walr quaiily Neqliclible Nit30 GW drinking quality Improved GW quality, deterorsaton In RegionaVl mediumv positive 8 nagatlnt long-lerrn Efuent treatment and
Industrial areas reversible enforcement in Industidalareas
31 GW igdetlon quality Improved GW quality RelotnaUrnedium/posttvaetiona-lemllffeversleb32 SoNi salinity Inereased soil salinity in CCA RegbonaVl medlumt neaatal/ bong-termn reversible OFD. IWAM. OAM of I&D
systems; provision of____________ ____________ ____________draln age
33 Point source pofutilon some Increase LocalVkowtnmgaotbng termtreversible Treatment of Industrialeiwuent and enlorcement
34 iffuse source irutlon Untreated sewage efluent dIspostl in Locaslmedlumrnagalye/long-lermr eversibe Sewage eMuentrivers, canals and dralnage system; treatment. onitoring odeterloration of surface WO; and aquifer eluenl ** and
poptition__ __ __ __ _ __ __ __ __ nforcement
35 Fertilkzer ue Inreased fertiizer use Regionatmediuml neulral long-ermil reversible NM36 Pesticide use Increased uesticih use end hnqicide 1PM37 _Weed kIler use Increse _Weed conlrt a trol inq3 stlo ut tes I_ _ __ _ _ __-__ _ _ __ _
38 Conservation areas MIninal impact LoctV lowI neutral long-termt Irreversible Avoldence of locating projects _ Environmentally beneficial torneor ecoarical sensiive areas blodiversity and wild life
_ development
39 Wv ife -
40 Foreds
43 Biodiversib ___
44 Cop yield Incresse In yIeld Regbonas hlgt posHilvet long-ternV reversible IWAM Soclo-cutural benefits and_S _ood for_wont runt _______________________________ jR Improvement In quality of life.
4 _5 FeDdobr _RonoqnNoim
46 Land tenre (land hoidlng Changes from dryiand to Irrigafed Reg loneV w/ neutrdt bong-temrirreversibie
SEAFInal Report - Vokume2 Page 2e Apti 30. 2000

Sheet 3 of 3
Table 6.2: Sectoral EMP: Impact Assessment Matrix for Planned Projects
Planned Prolects (Upto 2015): Irrigation expansion in 1 639 Mha (ongoing projects); new irrigalion prolects in addilional 1. 13 Mha:
water development for non-agriculture projects 5000 Mmj (Industry, domeslic, liveslock, Ihermal power)
S.No. Envlronmental Potential Impacts Rating of Impacts Measures to sustain Mitigation measures Residual Impacts
paranmeter (scopef magnIltudet direction) duration/ neutral or positive Impacts for negative Impacts or benefits
reversibility)
47 Settlement paitern Migration from other areas, Increase In Regional/ medium! positive/ IrreversibleDopulation density
48 Quality ol life Improvement In socio-economy: Increase in RegionaU high/ positive/ long-term/ irreversible Intrasiructure development
literacy rate, Increase In per capita income such as roads, markets, credit
49 'v~~~~~~~~~~~~~~~~~~~~~~~~~~~~~~~~~~~~~~ Input facilities49 Gender equily Improvement in the status of women. RegionaV high/ positive/ long-term! irreversible
increase in literacy, more participation In_armming and decision making
50 People paricipalion In att stages of project development Regional/ high/ positivet long-term!reversible
5t Tourism Increase Local/tow/positivetAong term/irreversible
52 Historical sites Not known at this stage Require prtoect specitic_3 NGnraeivleetevaluatlon
53 NGO increased involvement RegionalV medium! neutraV long-term! reversible
54 Indigenous people Minimal kmpact Local! lowl neutral long-bermrtrreversfble
5 Communhy Health55 Diseases: urban Reduced water related diseases due to LocaV low/ Posillve/ long-term! reversible
____ ___ ____ ___ ___ better water Supof 56 Diseases: rural Inefeased water borne diseases In project Low/medium! negatlva/tong term/reversible Ensure rural wafer supply
areas. and sanitation; monitoring
Nr water quality;
57 Diseases: iveslock Reduced dseases due to better Localolow/ positive/ lng-lemV iffeversible
Note: 1) Scope: Local: Is within I km ol the proposed development activity. basin-wide is within the basin tIse"t regional Is within Rajasthan
21 Magnitude: High means 475%. medium Is between 50-75%. low is 25-50% and neglgible is less than 25%
3) Dlrection: Net positive, negative or neutral Impad41 Duration: long-lerm Is >10 years. medium -term is 2-10 years. short - term is c2 years
5) Reversibility: Reversible or irreversible (posilive or negative) impact lo the resourcetpopulation (within a projected time - frame ot 15 years),
6) Planned projeds would not be Imptemenled within 25km of ecologicatly and otherwise sensitive areas (Source: Goetl 1992)
7) Parameters rquihg merritrxirg
SEA:Final Report - Volume 2 Page 6f9 April 30. 2000

Sheet I of 2
Table 6.3: Sectoral EMP: Impact Assessment Matirx for State-Wide Groundwater Development Changes
Assumption:aiBseilne Conditlon: Over exploited category of development in Shekhawati. Sabi Luni and Other Nattas; semi-critical to critical category of development In Ruparail. Bangenga. Parbati. Banas, West Banas,
Suktil and the Oulside basinGroundwater development changes (Upto 2015): (at A net reduction In non-command area Irrigation development by about 15-20% and a net Increase In domeslic. Industriat demand by the
same amount (Delails ske'thy at this time) (b) integrated surface and groundwater management Imptemented (c) Introduction of surface Irrigatlon In non-command areas.
S.No. Environmental Potential Impacts Rating of impacts Mitigation measures I Restdual Impacts
parameter I(copel magnitudel directionf durationv for negative Impacts and to or benefits
I F reversibilityi sustaln poslUve ImpattI Phystcal _ _ _ _ _ _ _ _ _ _ _ _
II Waler distribution system Increase in non-agriculturat demand Negative Impact on Soci-
12 Drainare system Some Improvement. RegTonal/medlumvpositiveAlong-terfvreversible economic condition In areas
13 lrrigalion Intensity Decrease trom GW sources Regional/mediumtnegaUveflong term /reversible integrated groundwater of reduced crop production
14 Irrigation Grovwh management and
15 CroppIng nintnsity __________________enforcement particularly In
Is Cropping Pattern Introduction of high value crops Reglonai/mediunVpositivellong term/reversible Ihe over draft and semi-cnttcatareas
21 GW aquifer recharge No imnpact In non-command areas22 GW depletion Mixed results: decrease In command area: Reglonal/medium/positivellong-termv reversible
iicrease in non-command area RbgtonaL/medkumigaaUve/long-ternV reversible
23 GW table fal in wT In areas with domestic demand and Regional/medlumrnegailvetieng-terffireversiblenoe-commarnd areas.
24 Coniuncltve use Some improvement-2 Chemical _ _ _ _ _ _ _ _ _ _ _ _ _ _ _ _ _ _ _
27 Surface water quality NeglIgitbe In ephemeral streamsdownstream ______________________
30 GW drinking quality Possible Deteriration Regionatl/ medIumJg&a/lve/ long-lermv reversible Pubiic education, poflutionprevention measures, treatmentat source and enforcement InIndustrial areas
31 GW irigation quatity Some Improvement In command area and ReglonaUmediunmpositive/tiong-termireversibledoleroration In non-command area
33 Point source potution Variable, long-time to realize Impacts of Iocalflowineantlvellono term/irreversible
34 Dfuesucpolton aquifier polltio ~oeluin/eatlve/iong-termlirreversible35 Fertilizer usir _ _ iReduced use RegtonatlmediurrV positivellong-termrirreversible36 Posticide uso37 Weed killer use3 Blot g cat _ _ _ _ _ _ _ _ _ _ __ _ _ _ _ _ _ _ _ _ _ _ _
38 Conservation areas Minimai Impact39 Wildlife40 Forests41 Endanered flora42 takes/water bodies43 Biodiverstly
SEA: Final Report - Volume 2 Page 6.10 Aprit 30. 2000

Sheet 2 of 2
Tahle 6 3: Sectoral EMP: Impact Assessment Matrix for State-Wide Groundwater Development Changes
Assujmption:Baseline Condition: Over exrploiled caterUnry of devO rlpmei in Shetkhawati. Sabti toni amfd Olher Natas, semi crifiral to ritical catrgory of devetopnient in Rirpparait, Banganga pjrtbati, Banas, West DanasSiil'i and Ithe Outside basin.Groundwater development changes (Uplo 20151 (a) A noel ierdtiion in non-conimand area irrigalion developrnent by aliolit 15-20% and a net increase in donestic, industrial (lernoid by thesa-ri anmoimnt (Dltaih. stkelh:iiy at this Ilme) (b) hir,ItiIal,d s;rf;ace nnd irolmndwater ni.larcm-ent implenmented Ic) ,inor-fi.ion nl sturface irrigatiorn in non-cunmmand arcas
S No. Environmental Potential Impacts Rating of Impacts Mitigation measures Residual Impactsparameter (scope' magrltludel direction/ durationt for negative Impacts and to or benoefits
re versibility) ,last sin positive Impacts4 Soclo-cultural
44 Crop yield ReductonM in yield in sonie areas in non- Regional/ hight negativef long-lormt reversible tntegrated groundwatercommand _ ___ __ management and enforcement
46 [and tenure Itani holdng) Setting ott ofltand due to reduction in productivity Locat)lmedium/negatlveltong-lerm)irreversible Mass awareness Resettementand
47 Settlement pattern Possible large scale migration, if deprived of rehabilitation In Ihe Impacledlivelihood, areas
48 Quality of lie Socio-economic reduclion in areas gone otit of Regional/ high/ negalive/ tong-fermi reversibteprotiltclicil
4 J G;ender equily Improvement in the sialtis of women, increase in Rcgionalt high/ posilive/ longlernul reversibleiteracy, mnre partiripa ion in Farming anddecision making
50 People participalion In all stages of groundwater management Regional/ hight positivel long-term/reversible53 NGO Increased involvemenl Regionall medium/ neutral) tong-termn reversible54 Indigenous pteo (Minimnal) Inipact5 Community Healhh_________
5! tDisease_s:urban t 5__ Red,,ced water retated diseases due to Local/ low/ Positive/ long-ternUi eversible _ Improved heallit .aciliiresincreased water supplyt
b,G Diseases _rurl Inicreased waler horne diseases in poor quality Lowlrnedium) negativelloig le-riilreversib)tO Ensure rural waler suppty andgrouindwater areas sanitation: monitoring of water
qualily;
57 Ftiseases. ivesock Reduced diseases due lo bellor waler supply Regional/ Meditmn positive/ long-lermt reversibleNole: 1) Scnpe. Local: is within I km of the proposed development activity, basin-wide Is within the basin itself, regional is within Rajasthan
2) Magnilude: Iboh nieans '75%, nmedium is between 50-75%. tow is 25-50% and negligible is less than 251%3) Direction litl positive, negative or neutral impact4) Duration tong ltmni is >10 years. meditum -lerm Is 2-10 years. shod - lerm Is c2 years5) Reversibility: Reversible or Irreversible (posilive or negative) Impact to the resouircelpnptilation (within a projected lime - frame of 15 years)6) lrneli3Cs of grainifwaler dovetlpment will be oil integral parl of coresimonrding changes in suiflace waler development As stuch. impact assessment related to RWIRCP and planned projects
should be considered itlegral witlh froumnwatrr developmenilmaonaguiriort per se*S Re Pafanlunies retaeiIing n nIoAptl3020g
SEA: Final Roedor - Vofunie 7 ae April 30. 2000


7.0 ANALYSIS OF ALTERNATIVES


7.0 ANALYSIS OF ALTERNATIVES
7.1 Preamble
Altemative water resources investment options and development scenarios discussed in the StateWater Plan ( 1998) were analyzed. The relative severity of environmental and social impactswere considered as a measure to represent the associated costs and benefits. The objective wasto assist the decision makers in choosing an altemative sector proposal or an investment optionfor strategic development by bringing environmental and social considerations into the upstreamstage of RWRCP and planned projects. n can be used as a framework for the decision makersand for development of project specific EAs.
7.2 Methodology
7.2.1 General
A tiered approach is adopted with respect to altemative development strategies. This being thefirst tier of analysis, the RWRCP activities are assessed for their potential impacts as comparedwith other planned projects. As the specifics of planned projects unfold, a second tier or similarprocedures could be adopted dunng specific EA preparation for planned projects. Options such asaltemative sites, technologies, scope, design, mitigation measures etc could then be furtherassessed. As well, a broad range of supply options including increased exploitation of surface andgroundwater, integrated use of total water resource, construction of additional storage capacity tohaamess and exploit peak flows, inter basin transfers or re-use of treated waste water could beidentified and analyzed for the associated costs and benefits and environmental impacts.
Figure 7.1 presents a systematic sequence in conducting the analysis of altematives at thestrategic planning level, the SEA in this context. Similar procedures can be adopted forproject specific analysis for planned project EA development and complement the existingstate water plan and its future updates. A brief discussion of step-wise tasks undertaken ispresented below.
7.2.2 Development objective
The overall development objective adopted for purposes of altematives evaluation is 'toincrease economic, technical, environmental and social sustainability of Imrgation Sectorwithin the framework of necessary policy and legislative reforms".
7.2.3 Altemative development strategies
Emphasis was on proposed RWRCP and planned new projects in the strategic developmentof water resources. RWRCP will provide focus on both demand side management andsupply side efficiency improvement of water resource as compared with the development ofnew projects, gravity, lift or water transfer schemes. A 'no project scenario' is also includedas a routine aspect in the altemative analysis and assessment.
7.2.4 Altemative resource management strategies
These will include the management of existing resources versus new resources, inter-basinor intra-basin use of water supplies, with focus on demand side management and supply sideefficiency, including groundwater management for domestic and irrigation needs. RWRCPinvolves development of management strateg% for improved irrigation management,agricultural intensification strategy and groundwater management strategy.
SEA: Final Report - Volume 2 April 30, 2000Page 7. 1

7.2.5 Resource requirements
While infrastructu development, staff training during and post project implementation arecommon for RWV 7'P and planned projects, the latter would be dependent on additionalwater resources, e: ergy, etc.
7.2.6 Screening of altemative resource management strategies
These include the ability to manage the available resources, location suitability, andenvironmental and social acceptability. For the RWRCP, demand side and supply sideefficiencies, environmental and social acceptability will be the kind of issues related to theformation of WUAs and sustainability of the institution. For other planned projects, theadded requirement will be location suitability and availability of resources, such as land, andwater of acceptable quality and quantity in time and space.
7.2.7 Identification of altemative locations
These will include the basin specific areas for the project development, routing of canals andpipe lines etc.
7.2.8 Screening of altemative locations etc
This task is tD do with conflicting uses and water quality criteria, ability to implement thewhole project and social concems, policy planning needs at altemative locations. This willapply to specific development programs such as: water bodies/aquifers sites fordams/reservoirs; pipe line routes; transfer points at other states; conflicting uses of water;concurrent abstractions; end uses; water quality data requirements; land use; policy planning;socio-cultural and ecological effects; stnuctural and non-structural measures; and, retum oninvestment.
7.2.9 Evaluation of selected altematives
It included the environmental, social and health impacts as identified in the impactassessment matnx. Included in this evaluation were the results of public consultationworkshops held for this study.
7.2.10 Public involvement
This is primarily a consensus building exercise. It is based on stake holders local knowledge,experts in the sector and the study team. In the case of project specific EA of plannedprojects, stake holders views could go a long way in firming up altemativeoption/investment.
7.2.11 Comparative assessment of realistic altematives
Three altemative strategy scenarios were considered within the irrigation sector the 'noproject scenario'; the 750,000 ha extent of RWRCP activities in the imgation sector, and,development of several planned projects within a time honzon up the year 2015. Theobjective is to define the merits and demerits of realistic altematives, thereby providing abasis for choosing between options. For purposes of this study, the institutional, policy andlegislative aspects of reforms are considered common for all the development scenarios. Theuse of scaling/ranking for comparison of individual impacts was adopted based on level ofinformation available (quantitative and qualitative) and professional judgment.
SEA: Final Report - Volume 2 April 30, 2000Page 7.2

An interactive Impact Assessment Matrix (Table 7.1) was used to compare altematives. It isbased on the general check list developed by the Working group on Environmental Impactsof Irrigation and Drainage set up by Intemational Commission on Irrigation and Drainage(ICID). The inter-related sub-parameters for the environmental and social impact weregrouped into five components, physical, chemical, biological, socio-cultural and communItyhealth. The procedure is particularly useful for the rehabilitation, modemization or extensionof existing projects, as well as for new irrigation projects.
A scoring system of 1 to 8 was adopted for comparison of various impacts in the check list.The scores were given the following meanings (Box 7.1).
Box 7.1: Relative Scores for Environmental Impacts
Score 1 = The user believes that a positve impact from the project is probable with regards to thischeck-list item and that there is little likelihood of any adverse impact resultng
Score 2 = The user believes that a positive impact is possible with regard to this checklIst item andthat there is little likelihood of any adverse impact resulting.
Score 4 =The user believes that no positive or adverse impacts are likely to occur as a result of theproject; that the project is likely to have a neutral effect with regards to this area ofimpact.
Score 5 =The user is unable to reach a judgment on this area of impact at this time either becausethe available data is too sparse to make a reliable assessment or because the area ofimpact is outside his/her own area of professional experbse and no-one with suitableexpertise is currently available to assist.
Score 7 =The user believes that an adverse impact is possible with regard to this check4ist item.score 8 = The user believes that an adverse impact trom the project is probable with regards to this
check -list item
Maximum score having to deal with most negative impacts could be in the range of 400-500while the maximum score having to deal with most positive impacts would be around 100.
7.2.12 Preferred altemative
Table 7.2 presents a summary of the comparative assessment of altematives. The RWRCPactivities have relatively lower scores as compared with the other two, from envimnment andsocial considerations. The score of 900 for a no pmject scenario in Table 7.2. would indicatea large number of negatively impacted items (category 7 and 8) with few positively impacteditems (categories 1 and 2). A lower score of 153 for RWRCP being much lower than theplanned projects (209) indicate that there are several positive impact items. RWRCPappears to be the a favorable investment considering the current condition of waterresources projects and the deferred maintenance requirements in most of the irTigationsector. It will pmvide the needed shift of emphasis fmm a primary reliance on expansion toparticular focus on pmductivity of irrigated agriculture which also is an emphasis onperformance improvement.
..... .. , ...... .... _ ovvovos .................. _ .... ... ... ... ............... ............... .....Tale7.:-u Sm mar"y of. Comparative ' A -s"s ama..nt of Aler"na"ties'
Assessment Scores tor bcores lor swores torNo Project RIKP Planned
Projects upto2015
Environmental Impacts
*Psisive hpacts 2 36 51
* Negative brpacts 138 70
Neuubal 100 112 68
* hsufficienit nfofmton 60 5 20
Total Scores 300 153 209
SEA: Final Report - Volume 2 April 30, 2000Page 7.3

7.2.13 Optimum investment strategy
As water resources of Rajasthan are extremely limited for the competing demands, anoptimum strategy would be to realistically consider the most appropriate specific projects forimplementation in any given time period, following the master plan for the overalldevelopment. Upon completing the policy reforms that the state is adopting, analysis ofaltematives investment scenarios could be better worked out when more concrete proposalsfor specific projects other than the RWRCP become available and funding agenciesidentified for implementation.
7.3 Assessment of Environmental Costs and Benefits
Preamble: The SEA is regarded as a primary tool for inserting critical environmentalinformation into the overall economic analysis of projects in the project identification,preparation, and implementation phases. Adverse environmental impacts are part of thecosts of a project, and positive environmental impacts are part of its benefts. To the extentpossible environmental impacts should be considered and integrated into the other aspectsof the project economic analysis and for estimation of economic rate of retum.
Scope: A preliminary level of assessment was undertaken to identify the economic values(where feasible and appropriate) of social and health indicators, and rough costs associatedwith their environmental impacts , both adverse impacts and benefits of RWRCP andplanned projects. The following discussion provides a rationale developed in assessingvalues to the environmental impacts of the RWRCP and planned projects. Table 7.3provides a summary of the quantification and assessment.
7.3.1 Valuation of environmental impacts for RWRCP activities
Socio-economic indicators: The positive impacts of RWRCP such as reduction in areasof waterlogging, and soil salinity, increased water supplies for the tail end farmers, andincreased crop yields are highly interdependent and non-quantifiable at this stage of projectdesign. Also, given the mandate that the project would improve the overall water quality inthe agricultural areas, the net impact will be an overall reduction and judicious use andmanagement of agricultural inputs. The benefits of such management in quantifiable termsare linked with fertilizer and pesticide usage. The overall positive impact will however besocio-economic uplift and improvement in quality of life of the farming community. It isassumed that the positive impacts together could improve about 20- 25% of net farmincome. The monitory value for the 750,000 ha of RWRCP area, excluding farmers'contribution for annual operation and maintenance costs, is estimated as follows.
* Annual increase in net income Rs. 3000. per hectare* Annual net gain in income by the farmers Rs. 2.25 Billion.
Environmental health indicators: A significant reduction in the incidence of water pollutionrelated diseas3s is predicted. The benefits of reduction in health costs are assessed basedon available data from the ongoing social baseline survey conducted by IDS as part of theRWRCP preparation studies (Annexure 7.2), and the state level medical records for theyears 1994-97 which contained an assessment of the affected population. About 3% ofpeople are estimated to be presently affected an account of water bome diseases. Theannual health costs being incurred by this fraction of population and projected savings areassessed as follows.
SEA: Final Report - Volume 2 April 30. 2000Page 7.4

Table 7.3 Health cost reduction for RWRCP activities
Item Short term Illness Long Termn Illness TotalAffected people 24000 36000 50,000 peopleMedical costs incurred per person Rs. 100 Rs. 400 Rs. 16.8 MTransportation expenses Rs. 100 Rs. 1000 Rs. 38.4 MHospital costs per person Rs. 1000 Rs. 4000 Rs. 168 MTotal health cost per person Rs. 1200 Rs. 5400 Rs. 223.2 MTotal health cost per ha (base area Rs. 300750,000 ha) at presentProjected overall savings in health Rs 111.6 M/ RsIcosts 50% 150 per ha/yr
7.3.2 Valuation of environmental impacts for ongoing and planned activities:
Socio-economic indicators: The positive impacts such as: conversion of rainfedagriculture to irrigated agriculture; increased water supply to domestic uses; increasedgroundwater recharge; and, integrated management of surface and groundwater resources,will result in an overall improvement in the socio-economic status and quality of life.Assuming that the positive impact could result in about 50% increase in agriculturalproduction or about Rs. 5,000/ha increase per annum, the benefd to the community residentsin estimated 2.76 Million hectare area could be about Rs. 13.8 Billion.
Environmental health indicators: Based on histoncal experience with the introduction ofnew irrigation or conversion of rain fed agriculture to irrigated agriculture, there will be anincrease in the incidence of water bome diseases in the impacted areas. To mitigate theadverse impacts, community health awareness program is proposed The annual overallhealth costs for the planned projects in a CCA of 2.76 M ha are summarized below.
Unit health costs related to diseases Rs 150 per hectareHealth costs* Costs related to diseases Rs 414 Million/ yr- Community health awareness program Rs. 4 Millionlyr
* Total health costs Rs. 415 Million/yr
7.3.3. Environmental indicators of reduced groundwater recharge
The SWP estimated an overall reduction of about 2400 Million cubic meters of canal andrelated seepage reaching the groundwater aquifer by the year 2015. However, at this stagein the project design, it is a highly subjective projection for purposes of quantifying theassociated environmental indicators such as: declining water tables and related waterquality deterioration, increase in energy costs and, reduced irrigation draft. Quantification ofvalue of such adverse impacts will be very premature considering: a) the disparity in thegroundwater draft estimates; and b) the dire need for a state-wide integrated surface andgroundwater management.
7.3.4 Environmental related costs of measures to sustain positive impacts
These costs relate to the measures such as: on-farm development; effective and timelyoperation and maintenance of irrigation and drainage systems; land leveling; integratedgroundwater and surface water management. Most of these activities are also interrelated.These are assessed and included in Box S-15 (SEA Report Volume 1).
SEA: Final Report - Volume 2 April 30, 2000Page 7. 5

7.4 Recommendations
At this sectoral EA level, the assessment of altematives has been made using relativeweights given to severity of impacts as outlined above. The broad technical issues andinstitutional issues have been factored into the present assessment for purposes of costingthe same. It is advantageous in that this procedure provided the needed answers to complexdevelopment options such as the sector-wide RWRCP and other planned projectsconsidered as broad investment altematives. It served as a measure that is proxy toassessing the relative costs of mitigating the residual impacts per se for use in distinguishingaltemative strategy and investments in the water sector.
This is an appropriate level of assessment given that, the proposed development is verycomplex in that it would have both physical infrastructure development, modifications to theexisting physical systems of varying magnitude in several river basins of the state. Inessence, the development and water resource management programs will have to take aholistic approach to integrate the management of surface and groundwater. The individualsub-projects scope and lead time of implementation are yet to be formulated.
For project specific EAs, , a detailed evaluation of environmental, social and health impactsof the short list of altematives would have to be undertaken in sufficient detail to facilitatetheir comparative assessment, as outlined in World Bank Source Book update (1996) onanalysis of altematives. Where possible, extemal environmental costs which have not beenpreviously been accounted for should be evaluated and intemalized within the overalleconomic analysis to reflect the effects of environmental costs on the rate of return ofaltematives.
The evaluation will be more realistic if project specific environmental appraisals were to becompleted for all the subprojects in the respective river basins ,and cumulative impacts andmitigation measures designed to minimize overall environmental impacts for the basin-widedevelopment. The sub-projects should include the irrigated agriculture with integratedsurface and groundwater supplies, domestic and industrial development together with theirlead times of implementation within the respective basins. Annex 7.1 provides a suggestedframework for conducting such an analysis.
SEA: Final Report - Volume 2 April 30, 2000Page 7.6

Derlne Secloral Identify Aliemative Identify Altemalive None ldentlfy Screen EvaluateDevelopment Development Resource Manage ment Alternative Alernative Selected
Objectives Strategies Strategles Locations Locations Alternatives
Define Resource Screen Alteative Operaional 'Comparatively Assess.Requirements Resource Management Mitigation ---, Alteratives
Strategies M Alterativesjg|lnAlte
: ; @~~~~~~~~~~~~~~v; Poe-e'd vvih -I Implementation' * * Preferred Altemative!
j FAllematives ~j ~~~~@ Dsgn |
jConfiguration'Altematives
Figure 7.1 Analysis of Alternative Development Scenarios for SEA
SEA:Final Report - Volume 2 Page 7.7 April 30, 2000

Sh"t 1 of 2
Table 7.1: Sictoral EA: Analysls of Alternatives: Interactive Impact Assssment Matrix
Prolects: 1) No Proect Scenario: ExisOng protect oevsopment on prevais, ie. witout me RWRCPand plbnneo prmpec
2) RWRCP In 7T0.000 sa: Componenbs- a) Improved mtion Managermet & Trnnsferb) AgncuItufl Intensiicationc) Susanatbis Groundwater ManagemenL
3) New Projcts: a) LfSLswemes 289.700 he I.ged areas:b) Gavity lipon MajorProj cts 487.500 ha rigaed mac) eum & Minor proe 349.180 ha i t ares
SAO. EnvlronenwteI No. X With RWRCP Wth New Planned PrrwetsPataweter PrOet Score i Mari (X) tos of Scorn Mark X acorns o
Scanano 7or 5 7or 5A strnAtvos Nurnbar t 2 3
1 Phv5101 _ 1 Dssiiiapheydfl 4 4 2
2 Topographly 4 1 _ 2i
3 Sods: wetertoggmng I 7 X
4 5ioP3:sw _t ualitv 8 1 2 _ _
5 Geotorv 4 4 46 iLansJ forms 4 4 47 Latno usse: hea and 7 4 1 I
8 Land use: Middle 7 2 29 Land us:te tilend 4 I 210 On-farm devboQment 4 t 2
t I Wtelr distribubsonystema 8 I 2
12 Drmaoe sastm B 1 213 Imstion Intenstuv 8 1 214 lmgauion Growth 7 1 215 Crooomrn mnenstt 5 1 216 Cropping pnm 5 1 217 Climate 4 4 218 Reservoirs 4 4 7 X
19 Su lt s water quanttydown stream 4 2 4
20 Drain water quanty 4 2 7 X21 GW Aquer rechanqe 2 5 X 222 GW deletion 7 4 423 GWtablense 7 1 7 X24 Conuncive use 7 2 225 Erosion 4 1 5 X26 Sedtimenettbon 4 1 S X
2 ChmticaliSurtace water quShty
27 Downsrem 5 2 7 X28 Drain water quary 5 7 2 7 X
29 ReservoirWaterQuastiy 4 4 5 x30 GW dnnkmn quallity 7 4 231 GW imwnabon uaty 5 4 232 Soil salinity 7 2 7 X33 Poit source DouUon 5 4 7 I34 Ditsuse sroun pollution 5 4 7 X
35 Fertilizer use S 4 4
36 Pesticide use S 4
37 Ws kdiller use _ 4
3 0ioiocal38 Conservabon areas 4 4 439 Widile 4 4 440 Forests 4 4 441 Enos eed flora 4 4 442 Lakesowter bodies 5 4 443 Biodnreitv 4 4 4
4 Socii-Cuttural44 Cmp Vid 7 1 2 45 Food for Work osgram 4 4 4
46 Land tenure 4 14 1 447 Settement aterm 4 448 Oualit of hte 7 1 249 Gender erulsv 1 250 Peoa e nicmation 7 1 251 Tnoursm 4 4 252 IHtstonrial sites 4 4 5 X
SEA Final ReDom -Volume 2 Apni 30. 2000Page 7.8

Sheet 2 of 2
Table 7.1: Sectoral EA: Analysis of Altematives: Intaractive Impact Assessment Matrix
Prooet.: 1i No Project Senario: Exrstng proect development on prevais, i.e. wifout the RWRCPend planned propects
2) RWRCP tn 750,000 ha: Components- a) Im>ved tmgation Marngement & Transfer,b) Agncutlntl Intens itonc) Sustamtble Groundwatar Management.
3) New Protects: a) lft Schemes 289.700 ha Irngated armes:b) Gravity lmgatbon Major Pr. t 487.500 ha ngaptd aeas:c) Medrum&Minor pro is349180hae riated eas.
S.Nt. o Emvironmental No. X With RWRCP With New Planned Prorects
P tra f RoPret Score ark (X) scores of Score Mart /Xt acores ofScenano I 7or 8 S 7or 8 5
Atermative Number 1 2 3
53 NGO 4 1 4
54 Indigenous peopte 5 1 4S Community Health
55 Diseases: urban 4 4 | 256 Drseasesnurel 7 2 7 X57 Live stock 7 4 2
Total Score 300 153 1 209
Analysis of Altermatives1. Asgnmernt of Project Impact Unds for ech of the Environmental Caomonents.
a) Depnding upon the environmental set up in the are.b) Objectiva of the proposd propecc) Baseo on value judgement of the consultant
2. Sconng SystemI - Posliv, Impact Probable ( highest rank)2 - Positve Impact Possibe4- No postive or adverse inpact5 - No judgement Possible at this stage or not applicabe7- Adverse Impact possible ( marked X)8 -Adverste Impact probable( fowet rnk. Marked X)
SEA Final ReDonrt Volume 2 Aont 30. 2000Page 7.9


8.0 PUBLIC CONSULTATION


8.0 PUBLIC CONSULTATION
8.1 Purpose
The purpose of public Consultation in the EA preparation was to obtain the views ofbeneficiaries, farmers, NGOs, and public and others interested groups on: the socio-economic-cultural environment of the existing system; potential impacts of implementation;measures required to sustain positive impacts; and, the mitigation measures to minimizenegative impacts of RWRCP and other planned projects in the water sector.
8.2 Methodology
The SEA study identified nine EMP basins, of which major water development within thenext fifteen years is projected to take place within four EMP basins (Chambal, Outside, Mahiand Banas). In the other five EMP basins (Group 9, Group 6, Luni, Sabarmati and Group 5)no significant development is projected to occur. Therefore, public consultation workshops(PCW) were held to obtain views of various interest groups in four locations: Hanumangarh(to represent the Outside Basin excluding IGNP), Banswara (to represent Mahi & Lunibasins), Kota (to represent Chambal), and Udaipur (represents Banas ).
Participants were invited from among the following groups: Farmers (including farm women)at the head, middle, tail-end of distribution system, NGOs, Panchayati Raj Institutions, andtribal Communities. The Irrigation Department of GOR assisted in contacting the invitees toall the workshops while the consultant provided the logistics to conduct the workshops.Workshop venues, date and number of participants at each location are summarized in Table8.1.
Table 8.1 Public Consuttation Workshop details
Basin Venue Date No. ofParticipants
Outside Sidhmukh-Nohar Irrigation Project 12110/99 41Hanumangarh Junction
Chambal CAD Conference Hall, Kota 15/10199 35Mahi Meeting Hall, Chief Engineer's Office, Mahi 23/10199 44
Project. BanswaraBanas Directorate of Extension Education, 26/10/99 120
Suraipole, Udaipur
The invitees were provided with the following inforTnation package:
* The proposed water development projects in the region.* Available information on socido-cultural and environmental issues as perceived by the
people in the respective region.* Preliminary findings of this EA study with respect to potential positive impacts, required
measures to sustain them and mitigation measures of possible negative impacts of theproposed development.
* A template for facilitating the participants to exercise their individual perceptions.
Group discussions were held at each of the workshop sessions during which the participantsselected their own leader for conducting the discussion. The sessions were focused on theimpacts of existing in,gation projects, proposed RWRCP and planned projects and mit.gationmeasures for sustainability of positive impacts and mitigation measures to minimize negativeimpacts. Each group leader presented a brief report on group's opinion on the issues.
SEA: Final Report - Volume 2 April30, 2000Page 8.1

Responses were received from the participants and were analyzed in terms of percent ofparticipants' level of agreement on preliminary findings.
8.3 Summary of Findings
In all 240 participants attended the workshops at the four locations. They represented thearea farmers, including farm women and tribal communities, WUAs, NGOs, and otherinterested citizens. They discussed the existing conditions as well as individual views on theproposed development, including the RWRCP activities, based on their past experience inthe area. Some of the participants felt that this is the first of its kind workshop in the regionwhich involved beneficiaries and other public representatives and addressed theenvironmental issues and mitigation measures during the planning stage of the project. Thusthe workshops provided an opportunity to obtain the environmental and social aspects of thedevelopment activities for inciusion in the sectoral EA.
The following is a summary of social and environmental findings related to development inthe Outside Basin, Chambal Basin, Mahi Basin, and Banas Basin. For purposes of this EA,the efforts are considered adequate and they represent the likely issues related todevelopment in other basins as well.
8.3.1 Outside basin
* Water Quality Issues: Need to monitor quality of imported water in the canals fromPunjab and Haryana and the drinking water supplied through 'Diggis'. Need to have anadditional filter as standby.
- Empowerment of WUAs: Need for strong institutional and political will to soonimplement the projects as per the World Bank guidelines.
- Fertilizer and pesticide use: the participants did not feel that there would be an increasein the use of these chemicals due to proposed RWRCP activities.
8.3.2 Chambal basin
* Diseases: a) absence of drainage and sewerage systems in the constructed rural watersupply schemes created stagnant water bodies and favorable environmental conditionsfor disease carrying vectors, b) Animal diseases from the use of water from Trapa(Singhara) ponds treated with savin' pesticide, which in tum created deterioration ofquality of milk.
* Farner education: a) mandatory farmer education on the harmful effects of pesticideuse, b) training on IWAM, INM, IPM, and Aquatic weed management.
* Groundwater depletion due to random installation of hand pumps and tube wells which intum impacted on the availability of groundwater resources.
* Legislative policy changes suggested by participants: A review by the WUA as thepolicies are GOR driven and not farmer-driven; Changes in present licensing policies forsale of pesticides, policy decisions with respect to IWAM,INM, IPM; aquatic weedmanagement, particularly with respect to water hyacinth, prosopis juliflora and ipomeaaquatica.
8.3.3 Mahi basin
Tribal related issues raised by the participants include:
* Dependence of tribal farmers on money lenders for the seed and fertilisers.* Tribals are unable to pay cash for the purchase of fertilisers and seeds at the time of
need, and so the Co-operative society is not effective.
SEA: Final Report - Volume 2 April 30, 2000Page 8.2

* There is a perception that rainfall has been decreasing in the recent years* As there is no OFD program in Mahi Command Area, land levelling concept is being
practised by 5 to 10 percent of farmers only. Agricultural land is mostly undulated andirrigation is practised through flooding of fields.
* Need for uniform irrigation water rates for WUAs and other areas in the Command Area.* Sustained awareness for tribal population: Commitment from GOR personnel in the
formation and functioning of WUAs for first 3 years is essential as tribals are illiterate,shy in expression, not exposed to GOR system of sanctions & approvals, recovery ofwater fee from the members and other management decisions to run the WUAs
* Migration of Tribal communities due to water logging: Communities are changing theirhabitat pattem in some areas by migrating from foot hills to upper areas as their mudmade huts in low lying areas collapsed due to moisture build-up. Due to rise in watertable, many reptiles have possibly migrated to other areas
* Abandoned village tanks: About 300 village tanks in the Command Area which wereused for domestic purposes as well as for irrigation, are now abandoned due toquestionable ownership of these tanks. It was suggested that these tanks be renovatedand linked with nearby canal water source, to incease the availability of water anddistribution pattem.
* Improved bio-diversity: As favourable environment is developed for migration of differentkind of birds from outside basin to Mahi Basin, investigations suggested for developingthe basin similar to Keola Deo Ghana Bird Sanctuary in Bharatpur.
* Some areas in Mahi Command are severely affected by waterlogging.
8.3.4 Banas basin
* WUA related issues: Farmers felt that they are capable of managing WUA providedGOR is really interested to hand over water management to WUA through appropriateAct] Rules/ MOU. The WUA farmers of Sukher Naka Irrigation, (Gogunda Project) havelost faith in GOR promises to handover minor to the WUA.
* Farmers are unaware of water management techniques. They make big size plots inthe fields and flood with the water. Program for borderstrip type irrigation should bejointly taken-up by farmers as well as GOR departments.
* There is a perception that rainfall has been decreasing in the recent years.* Suitable tree plantation be encouraged through Forest Deptt. & Agri. Deptt. on both
sides of canal as well as on waste land available adjoining the canalse R&R Policy Issue: Farmers prefer land- to- land compensation instead of 'in-cash'
compensation for loss of their land due to water development projects.* Downstream impact of dam construction: Earlier to construction of dams in the Banas
Basin, the river was generally perennial. After the dam construction, downstream areashave dried resulting in hardship to the farmers and unemployment.
8.4 Impact of Workshop on SEA Study
An analysis of responses received from the participants at each of four Public ConsultationWorkshops indicated that a majority of the participants agreed on preliminary findings of theSEA study. The specific feedback of the affected people has been considered in thepreparation of basin-wise EMPs. Highlights are summarized in Box 8.1.
SEA: Final Report - Volume 2 April 30, 2000Page 8.3

Box 8.1: Highlights of Issues from Public Consultation
* Excessive use of fertilizer doses.* Increase in water bome diseases.* Effects of upstream developments on the quantity and quality of imported water.* Water quality for drinking supplies through Diggis.. Incidence of now Insect, pest and disease in agricultural crops.* Drainage in urban and rural areas.* Land tenure system on warabandi.* Role of women in farm activities.* Impact of reduced in stream flow dls of the dam.
SEA: Final Report - Volume 2 April 30, 2000Page 8.4

9.0 MITIGATION PLAN


9.0 MITIGATION PLAN
9.1 Preamble
The RWRCP activities and planned projects provide positive and negative environmentaland social impacts. As majority of impacts of the RWRCP are positive, mitigationmeasures are broadly discussed for sustaining the several positive impacts during andbeyond the project implementation. For planned projects such as irrigation expansion,project -specific EA would be the vehicle for a detailed identification of measures foreliminating, reducing to acceptable levels, or mitigating environmental impacts.
The mitigation measures discussed in this section are for the impacts which are drawn onfindings from the analysis of policy, legal and institutional issues as well as analysis ofaltematives. Environmental management is a state- subject and unless decentralized to beoperated, implemented and enforced, these measures can be implemented at the sectorlevel or the basin-specific levels for regulatory reasons.
Recognition has been given to the cumulative aspects of residual or project induced impactsand the side effects of mitigation measures themselves.
9.2 Summary of Mitigation Measures
The overall measures to sustain the positive, mitigate the negative and to handle the inducedimpacts are briefly identified in Boxes 9.1 and 9.2 below, following which is the discussion onindividual mitigation measures. Each mitigation measure is described with reference to theimpact to which it relates and the condition under which it is required.
Box 9.1: Measures to Sustain Positive Impacts
RWRCP Activities Planned Projects
* Integrated Nutrient Management (INM) * OFD in new irrigated areas* Integrated Pest Management (IPM) * IWAM, INM, IPM. Weed Control . Weed control* Integrated Water and Agriculture Management * Effluent treatment (industries & urban
(IWAM) wastes). Operation and Maintenance of 1&D network . Provision of new drainage network* On-Farm Development (OFD) in Command areas * Operation and maintenance of l&D* Training and awareness creation of PRFO activities network* Infrastructure development such as roads, markets * Infrastructure development such as roads,
& credit & input faciiities markets & credit & input facilities* 1 00% farmer membership in WUAs * Farmer participation & promotion of WUA
SEA: Final Report - Volume 2 April 30, 2000Page 9. 1

Box 9.2: Mitigation Measures
RWRCP Activities Planned Projects
* Control of over exploitation of * Provision of new drainage networkgroundwater * Introduction of farmers participation and transfer of
irrigation and drainage systems management* Operation & maintenance of I&D network* Effluent treatment (industries & urban wastes)* Avoidance of locating projects near ecologically
sensitive areas* Maintaining minimum in-stream flows* Groundwater management* Rural water supply & saniation* Community- health
9.3 Discussion
The following positive impacts due to RWRCP and irnigation expansion projects in theirrigation sector will require continuos follow-up to sustain the improvements.
9.3.1 Integrated nutrient management (INM)
Impact: Intensive agriculture involving high yielding varieties alongwith imbalanced fertilizeruse results in heavy withdrawals of nutrients from the soil. Reduction in soil fertility isprojected if proper nutnent management program is not resorted to the agriculturalintensification program of the RWRCP and planned projects.
Recommendation: Nutrient management aims at efficient and judicious use of major plantnutrients in an integrated manner, so as to get the maximum economic yield withoutdeleterious effects on physio-chemical and biological properties of the soil. Biologicalnitrogen fixation (BNF) plays positive and constructive role in maintaining soil N levels.Vermiculture is also one of the important measures to improve environment besidesqualitative and quantitative improvement of crops. Use of compost, crop residues, greenmanunng, different bio-inoculants and vermiculture in combination with chemical fertilizer isrecommended for sustainable agriculture. Prolonged training of farmers, NGOs and GORextension staff will also be essential to sustain the INM program.
9.3.2 Integrated pest management
Impact: The quantity and quality of improved crop yields due to intensive agrculture dependon the on-farm input management and crop disease control. Pest problems are due toseveral facts including:* Monoculture: Single crop cultivation provides favorable conditions for the pest to feed
on and breed. There is an easy access to food which in tum avoids search by flyingabout, thus reducing the dangers from enemies,and a relaxation in environmentalresistance.
* Extension of cultivated areas: Provide encroachment on the natural parasites andpredators of the pests resulting in relaxation of biotic pressures on the pests. Thisultimately helps build up of pest population.
SEA: Final Report - Volume 2 April 30, 2000Page 9.2

* Faulty crop husbandry: Rational crop husbandry involves judicious management,proper selection of variety and cropping sequences, use of balanced fertilizers andmanure etc. The application of excess nitrogenous fertilizers causes imbalance renderingthe plant much more succulent for the pest to feed voraciously on plants.
* Intensive cultivation: Intensification of agriculture with the same crop continuously in
the same area provides congenial conditions for pest survival and results in the build upof pest population.
* Improper plant protection measures: Judicious use of chemical pesticides provide avaluable tool in the management of pests.
* Sole reliance on chemicals for pest control: Draw backs include: Selection of faultypesticide; Resurgence of treated population; Outbreaks of secondary pests; hazards andlegal complications; Destruction of beneficial species including predators, parasites etc;and, expense of pesticides, recurrent constraints of equipment labour and material.
Pest management, should be sustained to prevent high crop losses due to pest damage andwithout causing major perturbance to the agro-ecosystem, if utilized in a range of tactics -cultural, variety resistance, biological and chemical - in a harmonious manner to reduce pestdamage to minimal levels.
Recommendation: Substantial reduction in the amount of chemicals being used for pestcontrol without sacrificing efficiency could be achieved by:* Replacing scheduled applications with applications based on pest population
assessment.* Recognizing of crop tolerance to intensity of pest infestation without economic loss.* Adopting IPM techniques and, -
* Integrating with the training and visit program of the CAD extension activities.
9.3.3 Aquatic weed control
Impact: Weed control could be achieved by physical, chemical or biological weed removalmethods. While each method has its advantage and disadvantage from environmental standpoint, the success are generally of short duration.
Aquatic weeds pose acute environmental and social problems to the operation of canals.Weeds grow fast and reduce capacity of channels resulting in water stagnation which in tumpropagate further weed growth. Siltation and bank caving and damage by animal crossingsare also conducive to weed growth.
Recommendation: Effective and efficient annual maintenance and weed clearance wouldbe prerequisites for sustainability of the RWRCP and other planned water resource projects.
9.3.4 Integrated water and agriculture management (IWAM)
Impact: RWRCP activities are aimed at alleviating the existing environmental and social set-up due to poor condition with IL&D network (Box 9.3). Training and demonstration of theprinciples of IWAM would be part of the RWRCP (Box 9.4). The experiences of the IWAMpilot program introduced in the Chambal Command are required to be continuously adoptedin irrigated agriculture.
SEA: Final Report- Volume 2 April 30, 2000Page 9.3

Box 9.3: Existing Conditions in Irrigation Systems
* Inequitable distribution of water, head enders draw more water than tail enders.* Inefficient water delivery resulting in unreliable and unpredicted water supply.* Improper method of irrigation application such as wild flooding resulting in excess water
application.* Poor maintenance management of imgation and drainage system resulting in waterlogging
and salinization.* Poor management of fertilizers in crop production resulting in overuse of fertilizer.* Weed and pest problems in the crops resuKting in yield reduction.* Lack of farmers participation in the maintenance of field drains, canals and structures* Communication gap between farmers and the imgation department resulting in over all
deterioration of the system.
Box 9.4: IWAM Activities Included in RWRCP
* Reconstruction/rehabilitation of minors.* Adopt an integrated multi-disciplinary approach;* Demonstrate effectiveness of improved imgation water application methods;* Provide field drainage;* Study and evaluate suitable cropping paltem.* Install effective water delivery and control systems with Warabandi (a system of rotational
irrigation system);* Provide structured and non-structured interventions in supply and distribution systems to
restore confidence of the farmers in the irrigation system replicability;* Provide improved weed, pest control and fertilizer management procedures.* Establish water users associabon that can effectively control, manage and operate their water
supply and drainage systems;* Transfer improved and integrated water rnanagement technology to the farmers (WUAs) for
adoption and establishment of farmner managed institutions.
Recommendation: IWAM is considered an effective mitigation, preventive and curativemeasure in irrigated agriculture to eliminate the ill effects of poorly managed systemsthrough farmers participation. IWAM concepts should be expanded in all CCAS throughirrigation and agricultural extension services as well as NGOs.
9.3.5 Provision of new drainage network
Impact: The obvious negative impacts in the planned Irrigation projects implemented Withinadequate drainage system are water table and soil salinity buildup over time, and reducedyields.
Recommendation: It is not clear whether the RWRCP provides for significant extent ofadditional surface drainage network. Adequate surface drainage system consisting of fielddrains, carrier drains, sub-main and main drains should be planned and providedconcurrently in new irrigation projects and RWRCP. Wherever necessary subsurface pipedrainage may be considered for salinity and waterlogging control.
SEA: Final Report - Volume 2 April 30, 2000Page 9.4

9.3.6 On-farm development (OFD)
Impact: Improved land leveling should be undertaken as a positive feature in all irrigationprojects. OFD is a pre-requisite for efficient operation and maintenance of an irrigation anddrainage system (Box 9.5). It has been a major component of the CAD programs in thecountry, particularly in the Chambal Command Area.
Box 9.5: Benefits of OFD
* Increased application efficiency at farm level* Increased irrigation intensity,* Minimum soil erosion dunng imgation* Improved field drainage system* Improved cultivation techniques resulting in increased yields* Improved social setting within the farrning community.* Reduced salinization
Recommendation: For complete implementation of all the proposed 750,000 ha of RWRCPand planned irrigation projects, OFD will be essential. Typical OFD works are identified inBox 9.6.
Box 9.6: Typical OFD Works
* Realignment of farm boundaries, to permit a rational layout of on-farm water courses, drainageand road network.
* Construction and re-alignment of watercourses, surface drains and farm roads along the drains toserve each field.
* Land shaping to enable the use of efficient surface imgation methods and fine leveling whererequired.
9.3.7 Monitoring and treatment of effluent disposal
Impact: Point source pollution from urban and industrial discharges constitute water qualityand health hazards in the receiving water bodies. This situation will magnify due to theephemeral nature of most of Rajasthan's river basins and given that the State is in anindustrial expansion phase.
Recommendation:
* GOR needs to monitor the effluent quality and discharge loads from industries so as tominimize the impact of industrial effluents that contribute to the deterioration of surfaceand GW quaiity in the vicinity. As well, The on-going preparation of zoning atlas forindustrial complexes within various districts should be completed
* With respect to industries, RPCB 'Comprehensive Guidelines, 19958' for compliance ofenvironmental acts/rules in the operation of industries having pollution potential shouldbe followed, monitored and enforced where necessary. The board has classified theindustries for the purpose of granting consent to existing and new industries from thepoint of view of their potential pollution hazard as: Red, Orange and Others. The Redcategory consists of those units which are highly polluting and/or hazardous in nature.The Orange category consists of units which arc comparatively less polluting in nature,and Others category consists of units which are least polluting in n'ature and do not fallunder the above two categories. The above classification and the standards for discharge
SEA: Final Report - Volume 2 April 30, 2000Page 9.5

of environmental pollutants (standards for effluent, waste water generation, and loadbased standards) should be implemented on industry- specific pollution loading.
* With respect to siting of industries, the hotspots should be recognized, and effluentmonitoring and enforcement procedures implemented.
* With respect to urban effluents, the SWP (1998) recommended land application oftreated effluent for selective irrigation needs as an imperative part of development of theirrigation sector to reduce contamination of the basin water resources, and serve as anadditional source of irrigation water for selected non-edible crops. The SWP estimatedthat about 457 Mm3/yr of urban sewage by 2015 and if it is used for irrigation more than50,000 ha can be covered. The SEA study recommends that pilot projects of effluentirrigation be implemented, monitored before implementing full scale effluent irrigationschemes.
9.3.8 Rural water supply and sanitation
Impact: Community health could be effected In rural areas impacted by RWRCP activitiesand new projects. It could be in part due to unbalanced use of agro-chemicals such as,fertilizers, pesticides and chemical weed removal procedures during the agriculturalintensification program and the use of canals, and drains as supply sources. While, IPM, INMand weed control training programs are intended as the measures to sustain the positiveimpacts and to mitigate negative impacts, secondary impacts, such as local health hazards,are also projected.
The Rajasthan State Water Policy has given top priority to use of available water fordrinking. The drinking water needs in most of the cities of Rajasthan are met from surfacewater and that of rural areas from groundwater. The point sources of untreated effluents andsewerage, and diffused sources of pollutants from the use of agro-chemicals, deteriorate thequality of surface and groundwater. The extent of deterioration of surface water dependsupon the instream flow downstream of the pollutant source. In the case of rural community,use of canal water and drain water for domestic uses poses a health hazard.
Recommendation: It is important that regular monitoring of drinking water quality and onsetof water bome diseases in the rural community in the project impacted areas be undertakenon a continuos basis.
9.3.9 Maintaining minimum instream flows
Impact: Construction of a dam across a river impacts in-stream flows downstream, such as:adverse effects on stream water quality and assimilating capacity of streams due to pollutioninputs, silt load; impact on aquatic flora and fauna; infringement upon the downstream waterrights for domestic, imgation, live stock and others; disturbance to bio-diversity and the eco-system. Cumulative impacts are the socio-economic hardship and deterioration in the qualityof life of the down stream population. Criteria for minimum instream flows are summarized inAnnexure 9.1.
Recommendation: It should be ensured that stream flows (quantity and quality) aremonitored and minimum required in-stream flows are maintained down stream of dams toprotect and satisfy the water requirements of downstream users. With respect to industriesthe zoning atlas prepared by SPCB should be consulted.
9.3.10 Groundwater management
Impact: At present, the stage of groundwater development in the State is uneven. In about16% of the state, the groundwater is overexploited and in another 68%, the development is insemi-critical to critical stages. In the absence of intensive monitoring in the project impacted
SEA: Final Report - Volume 2 April 30, 2000Page 9.6

areas, the proposed conjunctive use in CCAs and development of groundwater resources forirrigation outside the CCAs, imbalances in the stage of groundwater exploitation could beaggrevated. Social impacts of such situations include: drying up of the well which has aneconomic impact on middle and lower class families which depend on hand pumps fordrawing water for domestic use; poor quality; increase in pumping costs for irrigation water,loss in crop production due to insufficient water and some times poor quality of water,reduction in natural vegetation as the water levels drop.
Recommendation:
* Enactment of groundwater legislation; education of people against over exploitation ofgroundwater, supply of surface water, wherever possible, to prevent groundwater overexploitation; changing crop mix towards less water demanding crops; adoption ofsprinkler and drip irrigation practices to reduce demands on groundwater, sewage water(estimated at 457 Mm3/yr) on reclamation could be used for meeting part of irrigationdemands and for recharging groundwater.
* While enactment of groundwater legislation is considered with-in the current policyreforms, regulatory systems, enforcement mechanisms and strengthening ofempowerment of the GOR institutions are to be institutionalized for the legislation to beimplemented.
9.3.11 Infrastructure development
Impact: The RWRCP activities have a major positive social impact namely, improvement ofquality of life of the fanming community within the project and areas adjoining the projectboundary. A secondary impact will be the need for improved infrastructure development suchas rural roads, markets, and crop in-put facilities, to name a few.
Recommendation: Together with the promotion of WUAs, it is recommended to haveintensive campaign to involve NGOs and other interest groups in the local economy, andadditional funding/ financing to realize and sustain the positive momentum.
9.3.12 100% membership in WUA's
Impact: The existing policy is appears to register a WUA with atleast 51% membership offarmers within the Command areas of a minor or similar hydraulic unis. Due to inherent in-equitable water distribution within the existing head end, middle and tail end systems, themotivational level of the WUA community will be at varying levels for active participation inthe proposed RWRCP activiies, PRFO and SAIFT. This situation could lead to unspecifiedsocial impacts, if un-corrected at the earliest.
Recommendation: WUAs should have 100% farmers membership as soon as possible.The appropriate legislative framework shou!d be in place for enforcement, if necessary.
9.3.13 Community health
Impact : The increase of water spread area provides suitable habitation for the growth ofvectors and pathogens of various diseases particularly in rural areas. Malaria has beenfound to be the major vector bome disease in Rajasthan due to stagnant or slow movingwater open to sunshine or moderate shade.
SEA: Final Report - Volume 2 April 30, 2000Page 9.7

Recommendation: Community Health Centers in rural areas should be strengthened andprovided with the facility for the collection and examination of blood smears. Healtheducation on the transmission of water related diseases should be imparted. Rural watersupply and sanitation along with monitoring of water quality should be ensured. Awarenessthrough various media measures about sanitation, proper storage and use of good qualRtydrinking water, avoidance of water ponding in residential areas, and preventive measures forchecking water bome diseases should be organized. HIECP, and VCD programmes shouldbe strengthened.
9.4 Mitigation Costs
Based on the above discussion, the mitigation measures to sustain most of the positiveimpacts wiil be part of post- project implementation and sustained monitoring activities. Thecost of mitigation for environmental and social consideration aimed at protection andenhancement of positive environment and quality of life, are to be considered (Table 9.1).These are not necessarily attributed to environmental mitigation costs, but lack of properproject activities such as the OFD and O&M of irrigation and drainage network would in thelong term once again result in deterioration of environmental and social conditions in theproject impacted areas. Similarly, the mitigation costs for sustained groundwaterdevelopment programs for irrigation, domestic and industrial uses, are to be oriented towardsintegrated and sustainable groundwater management involving all the stakeholders.
SEA: Final Report - Volume 2 April 30, 2000Page 9.8

Table 9.1: Cost of Sustaining Positive nmpacts and Mitgation Measure.
SNo. Project Mitigaton One Tine Cost Annual Cost FrUquafcyMeura# RaJha Anount Rs. Na RaJha Rs. Milon
_Million
1 RWRCP *O&MWRDD * Imngton network 250.000 450 112.50 3 yn
Draiae network 150.000 250 37.50 5ysSub Total 150.00
* OFD* Chbl CCA (90000 ha) 10,00C 90C* Other CCA (600.000 ha) 1.001 6* Land Levellina 750.000 ha 1 75C One Timne
* Groundwr Management* Strategic Monitofn and hmp aum 6.00 Annua
Artficial RehacheMiedical & Communy health Progrn 1.00 Andi5Heath Rs. 500/1000 popxation
(Allebed popubeon apprmL 2million) awaeness promm
Sub Total 2250 157.002 Planned O&M
Prcqects lmgaton network 900,000 450 405.00 3 yamWRDD Drage network . 550,000 250 137.0 50
Sub Total 5420 5OFD (2,760.000 h 50 13 5
* Groundwater ManagementStagic Moioring and bmip am 6.00 AnnualArtihial Recharge _
Medical & * Comnty hlth Pram 3 4.00 AnnuadHealh Rs. 5D0t1000 popuMlon
(Affected population approx. 6milion) awareness prouram
Sub Total 13 800 * 552.50I Total 16 - -0 709.=
SEA Fmal Reoor - Volume 2 Apnl 30. 2000Page 9.9


10.0 INSTITUTIONAL STRENGTHENING PLAN


10.0 INSTITUTIONAL STRENGTHENING PLAN
10.1 Scope
A main output of this SEA is the institutional plan for improving the capability forenvironmental management and training in the sector. It is based on a review of therecommendations of the institutional strengthening and restructunng (ISR) study undertakenby other consultants, and augmented for sustainability of the institutional set up forenvironmental management. It is based on discussions in the eadlier sections. The followingdiscussion provides the highlights of institutional strengthening for EMP management:
* Policy and regulatory instruments for environmental management and enforcement inthe water sector, for environmental protection and to ensure implementation
* Reorganization of institutional units/agencies in the state* Redefinition of roles and responsibilities of concremed agencies/departments for
environmental management and implementing mitigation and monitoring measures* Arrangements for coordination between various agencies responsible for mitigation* Training of existing and hiring of additional staff to help establish a sound basis for
mitigation, monitoring and management.* Cost estimates, both for initial investment and recurring expenses for implementing all
measures contained in the EMP for integration into the project costs.
10.2 Policy and Regulatory Instruments
Table 2.1 summarized the ongoing policy reforms and proposed actions being considered.Within the environmental management policy issues, actions proposed are the developmentof an environmental action plan based on the SEA and the creation of an Environmental Unitin the SWPO to monitor the environmental issues related to entire water sector, includinggroundwater.
The following additional actions are recommended relative to the environmentalmanagement policy issues and the regulatory instruments.
* Formulation of a state policy for environmental protection and management.* Formulation and implementation of a state-wide policy for control of pollution from
agricultural activities. Presently, the CPCB and SPCB have focus on control andabatement of industrial pollution, and not on agricultural activities.
* Development of a training Policy for WRDD, WUD and monitoring department.• Development of legal and administrative measures related to water quality of inter-
state water resources namely, Rajasthan, Punjab, Haryana and Gujarat.* Development of a policy to ensure mandatory requirement for GOR departments to
develop, support, monitor and implement environmental management and mitigationplans and to regular information exchange with proposed environmental cell, and thedirectorate of environment.
10.3 Institutional Re-organization and Strengthening
An overall institutional set up to include environmental management for the proposedprograms in the SWP is presented in Figure 10.1. Details on staffing and responsibilities foreach of proposed institutional strengthening measures are presented in Table 10.1. Theseare briefly discussed below.
* Formation of Environmental Manacement Review Committee at State Level, underSWRC: This committee will be chaired by Chief Secretary. Secretary, Departmeni ofEnvironment will be a Member Secretary. Secretaries of all WRDD, WUD, MonitoringDepartment will be members of this committee.
SEA: Final Report - Volume 2 April 30, 2000Page 10.1

Responsibility: Primary responsibility of this committee will be to frame policy forenvironment protection and management which will form the legal basis for thecommittee to effectively support implementation of EMPs. Other responsibilities includereview implementation of EMP in the water sector periodically, advice policy changesand provine directions for insttutional arrangements for effecting timely implementationand enformcment of environment policies, laws and regulations for water sector.
* Establishment of a State level Environmental Cell within the Department of Environmentfor purposes of enforcement and addressing growing environmental managementchallenges. As RSPCB is mainly responsible for enforcement of Provisions of Water(Prevention and Control of Pollution) Act in industries, an Environment Cell with theState Department of Environment for Water Sector is recommended consisting of oneMember Secretary in the rank of Chief Engineer, one Environmental Planner, Ecologist,Hydrologist, Engineer and Economist and complementary support staff.
Responsibility: Enforcement of Environmental Regulations for Water Sector,particularly Irrigation Sector. This cell will also be responsible for prioritizing anddeveloping procedures for water allocation among competing users, collectinginformation, monitoring water quality and undertaking Environmental ImpactAssessment.
* Formation of a Directorate of Environment: This unit will be at the State Level withinthe WRD, with two directors, director of environment and director of social sciences anda Superintending Hydrogeologist.
Responsibility: (a) Develop an in-house Environmental framework to help address dayto day concems relating to environmental issues, developing appropriate irrigation plansand management issues, (b) Coordination, planning and monitoring of EMP for each ofthe river basins, (c) Act as a nodal agency for extension services and informationdissemination, (d) develop short term courses for training GOR personnel, andbeneficianes awareness programs, through IMTI, Kota.
* Regional Environmental Units: Three units are recommended, located at Jaipur, Kotaand Bikaner. The functionaries in each of the regional units would include: Joint DirectorEnvironment; Environmental Engineer, Senior Hydrogeologist; Social Scientist andPublic Consuftant; and Rehabilitation Officer. Joint Director of Jaipur region will be thecoordinator for Banas and Group 6 basins( Ruparail, Banganga, Ghambir, and Parbati).Joint Director for Bikaner region will be the Coordinator for the Outside Basin, Luni andGroup 5 ( Shekhawati and Sabi). Similarly, the Joint Director for Kota region will be thecoordinator for Chambal and Mahi basins.
Responsibility Basin-wise planning and monitoring; EMP preparation for specificprojects. It will be mandatory for all WRDD and WUD to regularly send environmentalmonitoring data related to each of the basins to the regional offices.
* Strengthening of IMTI: An environment Trainina Unit comprising of one Environmentalist(SE Cadre), and specialists in environmental planning, hydrogeologist and chemist,IWAM, IPM, INM, and supported by SMS. This unit will draw expertise fromprofessionals drawn from irrigation management, agriculture, social sciences, NGOs,knowledgeable farmers, invited specialists from within and outside the state/country.
Details on cost for institutional strengthening is given in Table 10.2.
SEA: Final Report - Volume 2 April 30, 2000Page 10.2

10.4 Environmental Management Training
10.4.1 Class room training
Based on an evaluation of Training Needs Assessment conducted for this study by theconsultant ( Annexure 10.1 and 10.2), specific areas identified for environmental training aresummarized in Table 10.3. Typical environment related programs include:
* EIA preparation* Environmental protection and mitigation measures* Environmental monitoring and analysis* Legislative aspects of Environmental protection and enhancement, Rajasthan Irrigation &
drainage act, etc.* Socio-economics aspects of development and management of water resources* Integrated Pest & Plant Nutrient Management practices* Integrated Water and Agricultural Management Practices* Farmer training, NGO training programs* Water quantity and quality monitoring and analysis* Soil quality monitoring and analysis* Bio-diversity- ecological variables e.g. waterfowl monitoring* Training of trainers by IMTI staff
10.4.2 Training of farmers/ WUAs
The change from rain-fed to irrigated agriculture requires extension, training anddemonstration programs for farmers. It is recommended that the farmer training mustinclude the following aspects of environmental protection:
* prevention of spread of water related diseases: hygienic and personal health care; waterspills, puddling, etc; preventive and prophylactic measures, control of vectors; disposalof human waste: and disposal of drainage water.
* safe use of agro-chemicals: method of cleaning and disposal of weeds; detrimentalenvironmental effects of agro-chemicals; information on biological weed control.
* environmental conservation programs: protection of forest; control of felling of timber,advice on establishment of village farm forestry;; and soil conservation measures suchas tree plantation, growing of perennial grasses etc.
* training on WUA formation and functioning to members and office bearers of WUAs inarea of motivation leadership, accounting, management, record keeping etc.
10.4.3 Training in coordination with other agencies
* As the training facilities in the State are limited, i is recommended that WRDDfunctionaries should be sent on training courses to CWC , which regularly organizestraining courses for Central and State Govemment employees in specialized areas suchas: remote sensing, river basin planning and computerized applications for design ofdams etc.
* Faculty from CWC be invited for imparting specialized on-field inputs at specificlocations in the state.
* Training to field level WRDD and WUD functionaries and farmers on WUA formation andfunctioning could be imparted at Adaptive Trial Centre/Agriculture Training Centre ofState Department of Agriculture and Krshi Vigyan Kendras of the Rajasthan AgricultureUniversity located across the state.
Details on cost for Trainings on Environmental Management for five years is given in Table10.4
SEA: Final Report - Volume 2 April 30, 2000Page 10.3

10.5 Institutional Strengthening Costs
This section provides rough cost estimates for recommended institutional strengtheningmeasures:
10.5.1 Costs for RWRCP activities
The establishment costs, equipment, training and recurring costs are summarized in Table10.5:
Table 10.5: Summary of Institutional Strengthening Cost
Project Item One Time Annual CostsCosts (Rs. Millionlyr)
(Rs. Million},_____ _ *__ .__ WRDD Other Deptt Total
RWRCP/planned * Personnel 9.79 2.28 12.07projects including (detaiis in Tablegroundwater 10.2)management
* Office equipment 0.50and dBasemanagement(lump sum)
* Training costs 10.60 13.60(details in Table10.4)
* Travel cost of 3.00Trainees
Total 0.50 23.39 2.28Grand 0.50 25.67 25.67
_______________ Total
10.5.2 Costs for planned projects
As the institutional strengthening will be a long term entity for the planned projects, theannual budget for training and other recurring costs beyond the RWRCP should be includedin the respective annual budget of various departments.
SEA: Final Report - Volume 2 April 30, 2000Page 10.4

| SWRC
|le10.1 Recommende Sndtitutonag Itup for EnvironmentalMaronment
} Im*~oLbn P ffi | S-euebrs WFDO |u rtm [4 3@ E 1
I~~~~~ ~~ Implernenlatlonn |
1----------gur 10.1 Sec ommended Wn.ittl a uetupfor nniom na s annvronmnn
EZZ_-| Proposed
Note: Recommended shift df proposed environmental eeti from WRDD to Departmnent df Envionment for purposes of enfor ement. *---Ci LC on funrtIon
SEA: Finad Report_ Voume W
Page 10.5 ArtX,20E sodal SCA
0l,0

Table 10.1: Recommended Institutional Roles and Responsibilities for Environmental Management
S.No. lnstUtutlonIDepartment Respons_bIlitiesI Environment Management Review Committee , Form policy for environment protecrion and management
Chairman: Chief Secretary Review implementation of EMP In water sectorMember Secretary Secretary Environment Advise on Policy changesMembers: Secretary, CADA; IGNPD, GWD, Imgation, AD, Provide directions for instItutional arrangements in WSD forPHED, Industnes: Forest. Energy implementation of EMP
2 Envirnmental Cell for water sector with Department of Enforcement of environmental policies, laws, regubations inEnvironment water sectDrMember Secretary (CE Rank) Set up and Operate Environmental Database ManagementEnvironmental Planner (SE Rank) System (EDBMS) for Water SectorEcologist Advises WRC on environmental regulaion, conservation,Hydrogeologist and awareness policy.Chemist Prepare guidelines for EAHydrologist Review mitgation measures and advise WSDEconomistSupPort Staff
a Directorate of Environment, under Secretary, WRD Provide input to State Water Plan.Director. Environment (CE Rank) Plan and liaise with IMTI for Training inputDirector Social Sciences (CE Rank) Impiement Sectoral EMPSupenrintending Hydrgeologist (SE Rank) Handle environmental public reationsSupport Staff Coordinate with line GOR WSD for monitoring activities
Prepare EA plans, programs and budget for water sectDorprojectsCoordinate planrung and monitoring of EMPsAct as nodal agency for extension services and informationdisseminationPreware and process EMP
4 Regional Environmental Units at Jaipur, Kota, Bikaner Undertake detailed EA of projects in respectve RiverBasins
- Joint Director (3): (SE Rank) Planning, implementation and monitoring of EMPEnvironmental Engineer (3) (EE Rank) Undertake public consultation activitiesSr. Hydrogeologists (3): (EE Rank) - Liaise with other departrnents for data coilection, analysisSocial Scienbst & Public Consultant (6): (EE Rank) and monitoring activitiesRehabilitation Officer (3): (EE Rank)Support Staff
SEA: Final Report - Volume 2 April30. 2000Page 10.6

Table 10.2: Cost Estimates for Institutional Strengthening
Name of the post No. of post Annual Budget (Rs. Lacs)WRDD r Other
T DepartmentsEnvironment Call (Water Sector)Member Secretary (CE Rank) 1 3.00Environmental Planner (SE Rank)EcologistHydrologistHydrogeologistChemistEconomist 6 14.60Support Staff L.S. 1.45
Sub Total 19.05Directorate of Environment _Director, Environment (CE Rank) _____1 3.00Director, Social Sciences (CE Rank) 1 3.00Superintending Hydrogeologist (SE IRank) 2.60Joint Director, Environment (SE Rank) 3 7.70Social Scientist (EE Rank) 3 6.40Public Consultants 3 6.40Rehabilitation Officer "3 6.40Environmental Engineer 3 6.40Sr. Hydro eologist 63 .40Support Staff L.S. 13.30
Sub Total 61.60IMTI, Kota|SE_ 1 2.50EE Rank Environmental planner; 5Hydrogeologist; Chemist; IWAMSpecialist; IPM Specialist 9.30AE Rank Subject Matter Specialist 5 8.20
Sub Total 20.00Total Cost on Establishment 81.60 19.05Recurring cost ( 20 percent of theestablishment cost 16.32 3.81
Grand Total 97.92 22.86Cost estimate based on cost projection shown in ISR Studyby Price Water House Coopers, 1999 with modificatons
SEA: Final Report - Volume 2 April 30, 2000Page 10.7

Table 10.3: Recommended TraIning Program for Environmental Management
Tralning Module Typical TralneosDepartnment Proposed TrainingDuration Location/Cenbr(Days) __
1 Environmental Impact Assessment . Environment unit in WRD IMTI(EIA) Environment cells in Emn. DeptL
Functionaires of WRDD; EE & above2 Environmental Protecion & Mitigation Functionaires of WRDD; EE & above IMTUKVKs of RAU
Measures Functionaires of WUD; Dy. Directos and SLAMI _________________________________ above
3 Environmental Measurement and Funcionares of WRDD - EE, AE, JE; IMTI, ESTIMonitoring Functionines of WUD. SPCB:
Environment Dept - Dy. Directors, AD,_ ___________________ AO, Sr. Chemist
4 iLaboray training for Equipment Technical and Lab staff from WRDD and IMTi, ESTIhandlino _ WUD, SPCB
5 Environmental Legisiabon Senior R&D funconarms - EIC, CE, IMTi, NCMSIPA,CHG, SEtSHG ESTI
6 Soclo-Economic Surveys/R&R R&R cells in WRO, NGOS IMTI, SLAM.Evaluation HCMSIPA
7 Imgation and Crop Water Scheoduing O&M functionaes of WRDD, EE andabove. JL Director, Dy. Dfector from
_ ________________________ W UD8 Rajasthan Imgation and Drainage Ac Middle iwel & Fieid level funionaires IMTi
WRDD & WUD - EE. AE. JE. Dy._Director, AO
9 Integrated Nutrient Management and For Agricutture Department CAD KVKs. SIAM, ATCBio-Fertilization of Field Crops Extension. Dy. Director, AD. SMS. AO,
AAO10 Integrated Pest Management ForAgriculu Departmnt CAD KVKs, SiAM, ATC
Extension. Dy. Director, AD, SMS, AO,
11 Aquabc Weed Management Middle lee functonaires of ID CADD - KVKs, SIAM, ATC_______________________EE. AE. JE_ _ _ _ _ _ _
12 Training on INM, [PM, AWM and Members of WUAs, NGOs, Farmrws, KVKs. ATCs_ IWAM Farm Wormen
13 Measures for Environmrental Members of WUAs. NGOs, Farme, KVKs. FieldProtecbon and Conservaton Farm Women Worksops by IMTI,
________________________ ATC14 Rajshan Irrigation and Drainage Office bears of WUAs, NGOs IMTI through Field
Act, COOD Act. Workshops15 Participatory Imgation Management Office beares of WUAs, NGOs, Member KVKs, ATCs, IMTI
___of WUAs _____
16 Motivabon, Leadership & Office bearers of WUAs, Outlet KVKs, ATC. IMTI. Manaoement of WUAs Commttmees
17 Integrated Groundwater Resource Senior & middle lvel functonnaries of GWD Training Wing.Management GWD Jodhpur
1 Envionmentai and Social Impacts of 5 Middle leve and fied level staff of GWD, GWD Trarg Wing,Groundwater Development Agriculture Department IMTI
1 Economic Aspects of Groundwater 5 Senior and middle level staff of GWD IMTI, GWD TrainingDevelopment Win
2 Stakeholder Involvement in 5 Farmers, NGOs, Member of PR IMTI, KVKs, GWDIntegrated Groundwater Managemen Institutions Training Wing
21 Conjunctive use of Surface Water Middle evel and field level staff of GWD, IMTI, KVKs, GWDand Groundwatr Agrculture Department, Farmers & Training WingI NGOs _
Legend:IMTI: Irigation .Uanagement Training Institute, KotaSIAM: State Institute of Agriculture Management, JaipurESTI: Engineering Staff Training Instmte, JaipurHCMSIPA Harish Chandra Mathur State Institue for Public Administration, JaipurKVKS: Knshi Vigyan KendraATC: Adaptive Trial CentreGWD: Ground Water Department
SEA: Final Report - Volume 2 April 30. 2000Page 10.8

Tabl 10 4: TraIning Costs of Envltonmentsl Managenment for Flve Years
S0No Training Module Duration _o ot TrInaaee Nof trlinee No f CoJt IRa,) I Total Cost_Lpy iD GWD AD 0thp a her cowa, Coures _n da (Ro. Lacs)
I Environment tmpadt Assessmnrt 5 ISO 15 40 5 210 25 8 500 5 00IEIA )_ _ _ __ _ _ _ _ _ _ _ _ _ __ _ _ _ _
2 Environmoentl Prolecton a 3 350 80 2 40 700 25 28 500 10.60MAipsation Meassures ______
3 EnvIronment Meassurement 3 100 Is X 35 200 15 14 SO 3 00Monitorinct_ _ _ _ __ _ _ _ _ _
4 Eciutpnnl relalted 5 450 10 2t 25 505 10 101 500 2.505 11salslattv Environment 3 350 60 2X0 40 700 25 28 50l 10.60 e Sodo-Eonomic Survey/lR& 5 St0 50 15 4 100 t .50
Evaluation _ _ _I nigatn & Crop waler dieduting a 151 500 8501 25 28 500 18.50
8 Rajasthan hftsion and Dranage 2 300 60 250 40 850 25 25 500 7.00Ad
9 IPNM 3 _ 300- 300 25 12 500 4.5010 1PM 3 I__- 300 - 300 25 12 500i 4.501 IIAWM 3 ___ 300 I300 25 1 2 500 4.5012 RWRCP&FonnetbivoVfWUAs _ _(i Commurft hnteradbn & 5 Sr - 100 tS 7 750 3 75
__ _ Motivational skils__ _ _ __ _ __ _ _ _ _ _ _ _ _ _ __ _______________________ 3k3 Jr 1075 25 43 500 1l.13
Ja) FOT Program and tnp-ementation 5 Sr 100 15 7 750 3.75
_ _______________________ 3kJr = 1075 25 43 500 16.13Ji unrior level kOsiclmk~ skidl 10 ____. - 00 25 40 j001 50.00
13 itegratedGWReowc 5 _ 150 150 25 8 500 3.75
14 Ent*ontal and Soda5 Im s 150 150 300 25 12 50 7.50of ow Daveloom n _ _ _ __ _ __ _ _ __ _ _
1S EconomkcAspedsdOoW 5 100 _ t00 2! 500 2 50
IS Confunctive us do Surfacesnd * 300 150 500 950 2! 3 5 23 75___.rmtindwste
_ Gnr,l.0_ ____ _____ _
I ratinhhg cr-u INM, IPMb AWM a 3 4500 24 300 4050IWAM__ _ _ _ _ _
2 Meesures of Environmentl 3 4500 25 300 40.50Prolecrion and Conservationt____ - - - ______
3 Rajasthan btugaBon and Drainage 2 1500 25 6 9g.00
4 cPadpatbn kuigiSon Manaement 3 4500 25 300 40.50
- Motivation. Leadere* end 3 _ 4500 25 300 40.50mwanosmn t of WYUAa _ _ _ _ _ _ _ _ _ _ _ _ _
8 Stakahoder limttn t in 3 45X 25 300 40.50I4eareted GW Mngmn ___t Coruniciv 3e -S1stec t 3 4500 25 300 40.50
__Groundwater- _ - -_ _ _Totat 457.46
ConthtPenes _72.54_ ~ ~ GidTlltr er 530 00- Annual Coat~A= 10.000
Note:Colt eslrniles are Gadu81Ve Of Travel rit Of TrOIneeaCoit estumate fbr trot bdurlkn lees at IMtl. KVKJ. ATC end oShw Satob Inseitutes lR. 50tXTralneeDIYCost d outside Slats euse a estimated @Re(OOOfTfi00nSrtD*YCost of Fmes Treirg Is estatettd gRs 300tfrainet3
SEA. Finhl Report- Voum 2 PpApt 30. 2000


11.0 ENVIRONMENTAL MONITORING PROGRAM


11.0 ENVIRONMENTAL MONITORING PROGRAM
11.1 Preamble
A number of environmental issues impacted by management and expansion of water sectorprojects in the state relate to: surface and groundwater quality; industrial and domesticeffluent quality; soil and water chemistry; performance of iffigation and drainage systems;agriculture inputs and output; eco-system and health related aspects. Several of the impactsare inter-related. These are being monitored by various GOR Departments such as RSPCB,GWD, PHED, Agri. Department, Forest Department, and Medical and Heafth Department,and GOI regional offices such as CPCB, CGWD, and CWC located within the state.
11.2 Objectives and Scope
This sectoral EA provides general guidelines for long-term sector-wide environmentalmonitoring to ensure adequate implementation of investments. The objectives ofenvironmental monitoring program are:
* To provide database for dynamic monitoring of environmental parameters.* For enforcement of preventive measures to maintain ambient water and
soil quality for deserved uses and to prevent water bome diseases..* For classifying the river waters for different uses.* To monitor the effects of implementation of mitigation measures, to reduce the
negative impacts on the environment to acceptable levels* To measure progress in mid-term review of program implementation, and final
evaluation.* To recommend measures needed to collect and organize missing data.
11.3 Description
The foregoing monitoring program is designed to ensure that in principle, mitigationmeasures identified in the SEA are implemented. As most of the impacts are interrelated,the program attempted to identify the linkages between impacts. On balance, the monitoringprogram described herein serves also as a framework for post- project monitoringrequirements.
Details of monitoring program are presented in Table 11.1. The existing and proposedmonitoring sites for surface water quality is given in Maps 11.1 and 11.2 and Table 11.2.Recommended guidelines with respect to threshold values of individual parameters are inAnnexures 11.1 to 11.8. Rationale for assessing the existing and proposed monitoringprogram is included in Annexures 11.9 and 11.10. The following is a brief description of theprogram.
Surface Water Management
For assessing the suitability and dynamic changes in the water quality, and plan surfacewater management, water quality monitoring is proposed on all major rivers, major tributariesof Chambal river, major reservoirs, lakes, and canals carrying imported water The SPCB andPHED are monitoring surface water quality in Chambal river and lakes. As the facilities foranalysis of parameters related to pesticides elements, nutrients, trace elements andBiological elements are not adequately available, necessary institutional strengthening andequipment are reorommended. Enforcement of effluent standards for industrial wastedisposal and urban waste and sewage disposal in surface water bodies should beimplemented.
SEA: Final Report - Volume 2 April 30, 2000Page 1 1.1

Groundwater Management
GWD has a network of 6679 key wells and observation wells in the state, where groundwaterquality and groundwater levels are regularly monitored twice a year i.e. pre-monsoon (May-June) and post-monsoon (October-November). CGWD monitors GW levels and quality at1336 National Hydrograph Network Stations (HNS) in the state. PHED also monitorsgroundwater quality of hand pumps and tube wells installed for domestic use and otherdrinking water sources. RSPCB takes up monitoring of groundwater quality in industrialareas for ascertaining aquifer pollution at selected locations. As facilities for monitoring ofpesticides elements, nutrients, trace elements and bio-elements are lacking, necessaryinstitutional strengthening and equipment are recommended.
Irrigated System Management
Efficient operation of irrigation system requires regular monitoring and evaluation of theparameters such as canal discharges, seepage losses, drain discharges, 0 & M of irrigationand drainage systems and irrigation intensity. The monitoring of quality of canal water andreservoirs for changes in the suitability for irrigation, bathing and other domestic andlivestock uses on regular basis is necessary to take up the preventive/corrective measures.
Agriculture Intensification
A positive impact of RWRCP agricultural intensification activities and introduction of cashcrops, changes in cropping pattem, cropping intensity, crop yields, use of fertilizers,pesticides, herbicides will take place. To sustain the positive impacts /mitigate negativeimpact, measures like IWAM, OFD, pressurized irrigation, IPM, INM will have to becontinued. Monitoring in respect of cropping intensity crop, yields, quantity of chemical inputparticularly chemical fertilizers and pesticides, herbicides etc, and areas implemented withsuggested mitigation measures are recommended.
11.4 Environmental Monitoring Costs
Broad cost estimates are presented for both the initial investment and recurring expenses forimplementing all measures with respect to monitoring measures for the environmental andsocial impacts (Tables 11.3 and 11.4). The estimates will assist in developing overall budgetfor the project costs.
* One time costs for equipment to strengthen the laboratories Rs. 46 Million* Annual costs of environmental monitoring, Rs. 7 Million
There would be the other costs related to OFD works and O&M works in the command areasthat could be budgeted under the respective components of project costs. However, it shouldbe noted that the sustainability of positive impacts related the project depends on regularundertaking of O&M and OFD works in the command areas.
SEA: Final Report - Volume 2 April 30, 2000Page 112

Table 11.1: Environmental Monitoring Program In relation to Impacts for RWRCP and Planned Projects
S. Potential Impacts Measures for sustlfnability Parameters to be monitored Parameter Measurements Agencies responsible
No. positive Impact a_ ________________ mitigation measurement Method Locallon Frequency Supportive role Responsible
I Waterlogging/ rise In Conjunctive use of surface Groundwater use - discharge & average Field survey CCA Annual GWD
watertable ground water annual workiig hoursArea under surface irrigation/sprinkler ID S Extension wing WUAirrigation of Agriculture
_______ _______ _______ _______ ______ _______ _ _____ _______ D eparlm ent_ _ _ _ _ _ _ _ _ _
Groundwater levels Measurements Key & observation Pre & Post GWD
____ ____ ____ ____ ____ ___ ____ ____ ____ ____ ____ ___ ____ ____ ____ ____ ____ wels is nsoow e_s__monsoon__
Adequate drainage network Construction of surface draln In new CCA CCA -area CCA Annual lrdIgation Department
2 Increased Irrigation ObM of t&D network Maintenance of canals/drains completed - Measurements Canals b drains 2 years Inigation Department Farmers/WUA minor &Intensity length 3 years for canals distributary & above below, field drain
3 Change in cropping Deweeding 5 years for main drainpattern De-silting drainage
OFD Area Implemented with OFD works Suitable Model CCA Annual CADfIDIADIWAM Membership of WUA & Membership drive Farmer survey Seasonal ID & AD Farmer
4 Groundwater deplelion Groundwater management Analysis of pesticide residues in market Lab analysis of random Market survey Random Depti. of Agriculture &vegetables & fruits samples __ _ RAU Res. StationsAnnual recharge S draft Discharge, working Non-command Annual GWD
hours, rainfall GW level
S Groundwater Ouality GW quality Water sampling from Basin-wide Annual GWD
Detrioration key wetshand pumps/ water Basin-wide Annual PHEDsupply wells
6 Soil Salinily Drainage Soil salinity (EC values) Field measurements 100 ha grd 5 yearly Farmer/WUA Aqgrcuitural Department
7 Increased use of Fertilizer Management Ouantily of lertilizer use in different crops Information gathering Sale points Annual Famners/WUA Extension wing In
fertilizers AgHculture DeDartmentSoil analysis for Nutrient Stalus Soil analysis tW0 ha grid Once In 5 years FarmersWUA Solis Lab de ADWater quality In dls of area water goiality analysis Rivers, drains Bl-annual sn Department
8 Increased use of Pest Management Quantity of pesticides, used in different Information gathering Sale points Annual Farmers/WUA Extension wing of
pesticides crops Agiculture DepartmentPesticide residues In vegetables Random Sampling Sale points Random RAUSoil analysis for pesticide status Soil analysis 100 ha arid Ornce In 5 years FarmersdWUA Soils Lab of AD
9 Increased use of weed Weed Control Ouantity of herbicides/weed killers used In Information gathering Sate points Annual Extension wing of
kilters different crops Agi,jture DepartmentSoi anelysis for herbecidestweed killer Soil analysis 100 ha arid Once In 5 years FarmerstWUA Sois Lab of AD
10 Point source pollution Effluent treatment and Surface and Ground water quality in the Stream & GW analysis Potential urban & Annual Regional unit of SPCBdisposal vicinity of Industries and Urban areas nural areas/ Industrial
areaindustirial effluent quality Effiuent analysis Industry spedfic Industry specific _ _
II Diffuse source Urban eflteunt treatment EMffuent quality Effluent analysis Sewage treatment Annual SPCB
roNution ants12 Water bone diseases Drainage Affected persons Surveys by Health Health Centres Annual Department of Health
SEA: Final Report -Volume2 Depargment April_30_2000_
SEA: Final Report- Vdlume 2 pi302KPage 113 Api30.20

ble 11.2 Surface Water Monitoring Statlons (Existing and Proposed)
Existmg _______-___' ProposedMonitoring Monitoring
Basin Location Agency Basin Locstion Aaencv
Rtyum rsI Str -ms Ri1ve ,f stream ,
Chamol 1 Garganga at Manoharftna I r1 Chamrl 1 Parwan et Confluence with Kaisindh I
2 Garganga at Akhera 2 2 Kunu at Exit htmm Basn
3 Parwan at Sangod 2 3 Aima st Confluence with Charnbal
4 Kabirndh at Saiawad 2 4 Me) at Confluence with Chambal I
5 Parwati at Barod 2 5 Chaken at Confluence with Chambal I
6 Parwab at Khatoli 2 6 Kahisindh at Confluence with Chambal 1
7 C hlantal at Pa4ghat 2,38 Chambal at Gandhi Sagar 2 Q Group 6 7 Parati River at exit from Basin 1
9 Chambil at Ransprntap Sagar 2 8 Gwnbhir Rrivr at exdt frm Basin 1
tO Chambal at Jawhar Sagar 2t1 Chambel at Kota Barrage 24 S ti 9 Sbarma Rier at ext Irom Bmin 1
12 Chambal at Mandawara 213 Chamnbalat Akeigarh 3,4 M Group 9 10 Suii Rier at tt from8sin 1
14 Chambel at Kota DIS 3,4 11 Badgaon at axt from Basin I
O Ouse 15 Ghapr River 3 l_k_hN Group 6 1 Kaosdev 3
| Mahi 16 Jtdimt Nsgiia PW, 2 __________
17 Krmal P.W. 1.2 Imrdw Cannaia
18 Som at Ranfei 2 Outiude 1 Sidhmukh - Notr (2 nos.) I
19 Ana at Power House 2 2 Bikaner Csnal 1
20 Mah at Chandangprn I Matai 2 3 IGNP Cantl 1
21 Mah at Perdbadi 2 4 Bhaknt Canal (4 nos.) 1
22 Mahit Kadna2 2 Grmup 6 5 BhartpFrFfer I
Banas 23 Banas at Pipli 2 91 Group 9 6 Nameda Canal
24 Bewch oAt Chitorprh 225 Gobhri at ChittPrgarh 12 R&sanli Wtar Qua tty'
26 Banis at Negna 1.2 Resrvors of *t Major clams
27 Banas at Tonk Z3 (Totl 37 nos.)
28 MoWl atKanota 129 Moqt at Nnmnda 2
Group 5 30 Mendha at Ringus 231 Sabi at Sora s
Group 6 32 Rupi at iatusmand 1
33 Bangawa at Mahwa I Rashicpur 1 Mewilinnev AUosB
34 Banpnga at Hingota 135 Banganga at Malun Bndge 1 1 Irrgaton Department
36 Nahro *t Bere aBunri 1 2 :CWC
37 Gambhir at Shn Mahav.erui 1 3:CPCBIRSPCB< PHIED
Lun, 38 Lui at AInrywwas 2
39 Sukn at Sqat Road 2
40 Mithn at Swami 2
41 Mit tnatAldars 2
42 Luni at Gandhav / Chitatwana 2
roup 9 43 WeaW Bangs at Abu Road 2
bnas t Pichola - Udaipur 3
2 Udai Sagar- Udaipur 3
,roup 6 3 Rarhgar -Jaipur 3
unt 4 PUthkar - Afmer 3
I Gurgaon 3
RaeWr to Maps 11 1 and Annexure 11.9 for Location of Monnonng Staons
SEA Fmnal Report - Volurme 2 Apnl 30. 2000Opoe 11 4

Table 11.3: Ust o1 Addltional Instruments for Proposed Monitoring and Analysis ofEnvironmental Parmmeters Related to Soil and Water Analysis
GOR Agency lAdditonal Equlpmont Number Aproximate Coat Rs. mrilloni Re=ulned Purpose RD Other Dept
Laboratory Equioment1. RSPCB Already ordered by CPCB for
for supply to RSPCB under a_GOI scheme !
2. GWD Gas chmromatograph Tro,e elements. 2 3.00UV Spectrophotometer agro-crneicals. 3 1 060AA Spectrmphotometer salinty and 1 2.00Incubator slkalinity 2 0.02Autoclave 2 0.03Accessones 1.00Conductivity reters and others 0.60
3 PHED UV Spopotar Biologicl wter 9 540Wlater Field Testing Kit quty & trace 9 0.053aD Scones deeolnas a 5.00Mobile Van j J 1 0.50
_ _ _ _ _ _ _ _ _ _ _ _ _ _ _ __ _________ ________ T otal _ _ _ _ _ _ _ _ __ _6 14. Agncultre Gas Chmmatogrmph Agro.chemicals, 4 3.20
High Perlonnance Liquid numwsne. trce 4 3.20Chromatorph (HPLC) elements, salinityAAS & aiklinmty 3 6.00FIA 3 6.00EM 38 Salinity mneters 3 0.60Accessones 3 100
I Total 20.005. CAD. IGNP AAS Agrohermicals, 1 2.00
Bikaner FIA nutrients, trace 1 2.00EM 38 Salinity meter elwments, salinity 1 t 0.20
alkalinitv _Total 4.20
6. CAD ChamDal Acrassones tor AAS, FIA Agro-ctemicals, 1.20in soil & water tab Nanta Farmn nutnents, trace
elements, salinity_ & altinity _
Field Monitonng Eouicment7, ID .SPCB, CWC installaions at nver and canal Water quaity 65 3.00 300
gauging statons (Water level anals and flw |ecormers ctomrate water measurement
samders cutmendmter mauoreflumest __I_I_L-
Total 15.651 23.95Grand Total4.0
SEA. Fnal Report- Volume 2 Apinl 30.2000Page 11.5

Table 114: Cost Analysis for Proposed Soil and Water Quality MonitoringRs Lacs
Parameters No. of Cost analysis Tota analysis Transport cost @ TotalSampes per sample cost 250 per sample
_ _ _ _ _ _ _ _ _ _ _ _ _ _ ~~~Rs.RWRCP__ _ _ __ _ _ ___ _ _ _ _
1 urfa water quality, 20 1.000 0.20 0 05 025reservoirs & canals _ 0
2 Soil and Agncultural runoff 1.650 250 4.1 2 41 8.25_Analysis __
_al~is Sub Total 4.32 418 B SC_Planned Prolects
1 Surface water quality, 13 1,000 0.13 0.0 0.1_reservoirs & canals j2PHED- water supply 2.500 1,000 25.00 62 31samples _ 5
3 Soil and Agncultural runoff 6.000 250 15.0C 15.0C 300_AnalvsisI I
Sub Total 40.13 21.28 6141Grand Total 44.45 25.46 69.91
Note: 1. The samples of surface water quality will be collected by ID and analysed in GWD laboratories2. The cost of existing monitonng by vanous agencies is not included
SEA: Draft Final Report - Volume 2 Aptil 30.2000Page 11.6

LEGEND EMP BasinsOistrict headquarters t Chombal
Ooeftdrels E _ [ IThe Outslde Basin
State. Di - - [ Mehl
Ryr Basin 4Banrhtes. Lake, Co"l c ' - Shekhawti, Sobi
Shegmtlow Water Gou1ng Station s Ruparall, Snpan, Gambhlr, Parbatl
a * Ouot Hy (33) Luni
w Otlty (10) L_ West Bonn., Sokil. Oter Nialohs
Lelk,. Imported Canals Ouollty Mnto~ing Shtalons
* Lake. - Ewiting Staion. (4)
o Conch - Exlltng Statieon (1)
PUNJAB
UTTAR PRADES
10 KUS
GUJARAT
WJM Map 11.1 Existing Surface Water Monitoring Gauging Stations
?AAL (1906) bASD URP. MAP S. SPCO/CPM. PB}D
SEA: Final Report-Volume 2 Page 11.7 April 30, 2000

LEGEND __EM_P 6ctsins
Dbtvc heoquottM e hrb
Stale. ,Odti - -4 kOutmbOl
Rller. L, Ce. Canal li- toRUII, oneoaa C.bMlr, Parbo
W0e~~~~~~~~~~T OFtsw O :E n
* Poroposd Stations (ii)
_irn. Laes. C ote Canal Oualty nitsSiOSrn
Station
A Moa ElNg. ngI a dw dm (37)
* Lks-r d Station (1)
O Cn- ped Stations (It) PUNJAB
> H A R Y A N~~~~ARYN
PAKISTAN J 4sR%cu oUTTAR PRADES
ADHYA PRADESH
IU~ Map 112 a Proposed Surface Water Monitoring Gaugng Stations
TAOW (SNS) RON WRP. MAP 6. WM/CPCB. P1O
SEA: Final Report-Volume 2 Pago 11.8 April 30, 2000

12.0 FOLLOW UP WORK


12.0 FOLLOW UP WORK
12.1 Update Data Base
This sectoral EA examined the environmental issues and impacts associated with theproposed and ongoing policy reforms for water management being taken up by the stategovemment of Rajasthan. It is based on the available data within the time frame of thestudy. The EMP elements, mitigation, monitoring and institutional measures contained in thereport would need to be updated as additional data base becomes available during andsubsequent to the project implementation. The following aspects of data base deserveattention:
* SWP: Update the SWP as soon as possible, preferably during the RWRCPimplementation;
* Groundwater improved and better defined groundwater exploitation levels from thestate GWD, including the quantity and quality dimensions;
* Social and economic costs, including community health: from the recently concludedbaseline study undertaken by IDS;
* Water quaiity: to be integrated with the available quantities of water supplies andenvironmental deterioration due to point and diffuse sources of pollution;
* Modeling and GIS techniques: for defining quality levels of the water resources in spaceand time;
* Creation of a centralized data base: to access available surface and ground waterquantity and quality data for inter-decartmental and inter-agency retrieval and analysis;
* Creation of river basin-wise drainage Zones: to classify the state in different drainagezones based on pollutant loading ( type, scale, extent, nature and concentrations) onreceiving streams and/or aquifers;
12.2 Additional Studies to Supplement the SEA
The most important and needed additional studies to be undertaken during the projectimplementation should address the following areas:
* An assessment of other water related sub-sectors such as: municipal. industrial, andecological uses of water;
* Analysis of water pollution from municipal, industrial, and agricultural sources (such asrunoff from fertilizer and pesticide uses);
* Analysis of impacts in terms of the social ( public health) and economic costs; and,* A state-wide groundwater resource management study to include: a better definition of
the present status of its use and management, for all beneficial uses; a thoroughidentification and evaluation of the dark, gray and white groundwater potential zones; anidentification of potential recharge areas to assess the quantitative, qualitative, andsafety aspects of contamination potential.
12.3 Institutional, Legal and Administrative Reforms
* Environmental Policy: needs to be developed and adopted for environmentalmanagement in Water Sector ( surface and groundwater) which is characterized withinadequate water supplies of varying quality within the river basins and large importsfrom outside the state
* Environmental Enforcement Policy: needs a detailed investigation on the existingconstraints and gaps to effectively enforce the environmental regulations, policies and
SEA: Final Report - Volume 2 April 30,2000Page 12. 1
decisions, including opportunities for market based incentives for pollution control andabatement;
* The Inter State Agreements/Awards on sharing of river waters: need a review of theexisting agreements which, in addition to apportionment of quantities, should alsoinclude quality standards to be maintained at points of inter-basin or inter-state transfer,and in the downstream needs;
* Criteria for environmentally sound and sustainable groundwater management: need to bedeveioped for basin-wise integrated water utilization, considenng: the quantity andquality dimensions of the resource, both demand side interventions and conjunctivemanagement techniques: and, the guidelines for integrated resource planning of surfaceand groundwater.
* Groundwater legislation: needs to be developed and adopted.
12.4 Applied Research
To develop environmental friendly measures for efficient use of land and water and otherinputs to agriculture, some of the environmental and social issues for applied research are:
* Practices for improving on-farm water use efficiency, including irrigation scheduling andmethods, including the conjunctive use methods considering the quality dimensions ofthe resource;
* Pilot scale wateriogging and drainage studies in the impacted areas of the state toidentiy site specific interventions, with farmer participation and contribution;
• Residual impacts of agricultural chemicals on soil-water-drainage systems.
SEA: Final Report - Volume 2 April 30,2000Page 12. 2

13.0 SUMMARY OF SEA STUDIES FOR OTHER WRCPs


13.0 SUMMARY OF SEA STUDIES FOR OTHER WRCPS
13.1 Overview
Sectoral EAs have been carried out in only three WRCPs in India, for Haryana, Orissa, andTamilnadu states. Other related studies include: Rajasthan Highway Project; Gujrat StateHighway Project; and Regional EA for proposed Integrated Watershed Development Project.A brief review of these assessment studies is given herein:
13.2 Haryana WRCP ( 1993)
Contents: A 'category A ' SEA with virtually no further requirements for project- specificcategory A documents to be prepared under the WRCP program. The proposed activitiesunder WRCP focused mainly on improvements to the state's existing water supply anddrainage system. The main environmental and social issues, key EMPs and other covenantsare summarised in Annexure 13.1.
Proposed Institutional Strengthening: Establishment of an Environmental Group in HIDincluded within the Water Resources Planning Unit (WRPU) and be supervised by anExecutive Engineer reporting to the WRPU Chief Engineer.
13.3 Orissa WRCP (1993 and 1994)
Contents: A 'Category A' Sectoral SEA conducted, the Orissa WRCP aimed atmocemisation and rehabilitation of projects covering approximately 0.25 Mha of CCAs. Themajor issues identified were: waterlogging and salinity problems in the inigated delta andcoastal zones, aquatic ecology and fisheries, water quality particularly central parts of Orissa,water related diseases. Key environmental and social impacts, EMPs and other convenienceare summarised in Annexure 13.2.
Proposed Institutional Strengthening: Two Environment Assessment Cells (EA Cells) tobe formed in (I) River Basin Planning Directorate and (ii) Project Preparation andFormulation Directorate
13.4 Tamilnadu WRCP (HR Wallingford, 1993)
Contents: A 'Category A' Sectoral EA was conducted. The Tamilnadu WRCP was aimedat the inigation rehabilitation and modemisation covering approximately 0.5 Mha. The mainissues identified are: catchment disturbances during construction, industrial effluent andsurface and groundwater quality, unregulated groundwater abstraction and increase inhydro-electric energy requirement. Key issues, EMPs and other covenants are summarisedin Annexure 13.3.
Proposed Institutional Strengthening: included the establishment of: i) An ExpertCommittee as a statutory body under the Water Resources Council (WRC) which wouldundertake many of the WRC's tasks in relation to planning and project approval and wouldprepare policy statements and justifications for consideration by the WRC. ii) AnEnvironmental cell within the Planning Division of PWDIWRD iii) An Environmental Unitunder the Assistant Director (Environment) Institute of Water Studies IWS iv) an ExpertPanel chaired by the Director IWS, the Head of the Environmental Cell and the AssistantDirector (Environment) IWS be ex-officio members. Environmental training to establish andmaintain the capabilities of the Environmental Cell and the Environmental Unit and the widertraining and awareness building for other members of the PWDIWRD.
SEA: Final Report - Volume 2 April 30, 2000Page 13. 1
13.5 Tungbhadra Irrigation Pilot Project, Phase 11 (TIPP ll, 1997)
Contents: The, ingabhadra project is aimed at providing 'Protective irrigation' to meet theirigation water demands of drought prone areas in the states of Kamataka and AndhraPradesh. The EIA has been done for a distributary (D36). The report identified theenvironmental, economical and social constraints, and short/long term interventions such as:equitable distribution of water, reclamation of salt-affected areas, draining of waterloggedareas, formation of WUAs, strengthening of existing distribution system, protected drinkingwater supply to each village/camp and generation of employment resources for idle labour.The report also describes altematives which would lead to better water management,improved socio-economic conditions and overall health status in the command area. Plansfor mitigating the following adverse environmental impacts:
* Waterlogging and salinity- improvement in natural drainage and prvision of subsurfacedrainage locally
* Pollution - restricted use of fertilisers, optimal use of pesticides, introduction of bio-pesticides
* Water Management - selective of canals; water distribution as per crop waterrequirements; proper maintenance of water distribution system eg. nala cleaning;intmduction of conjunctive use of surface and gmundwater
* Socio-economic and health condHtions - users involvement through water usersassociations; adequate women representation in all activities; organising marketingavenues for agriculture pmduce; organising awareness programmes for water use, healthand sanitation; crop systems; village and small scale industries; provision of protecteddrinking water supply; and availability of institutional finance for promoting groundwaterdevelopment in tail end areas.
Proposed Actions Plans included:
- The monitoring of water quality and groundwater level, soil pmperties, crop productivityand socio-economic conditions.
* Command area development.* Formation of Water Users Associations and participatory land and water management
through integrated action of water users and CADA/lrrigation department.e Establishment of small scale agro-based industries, a sugar factory and a fruit pmcessing
unit.* Conjunctive utilisation of surface and gmundwater in the tail end areas.
13.6 IGNP Environmental Review (1998)
Contents: The present review pertains to IGNP stage 1. Principal Beneficial Impactsinclude: i) Greatly increased agricultural activiy; ii) Greatly increased scope for settlement,poverty alleviation and land ownership, with associated employment opportuniies andincome generation; iii) Reduction in desertification influences, notably by stabilisation of largetracts of sandy soils and sand dunes; iv) Increases in bio-diversity, notably of birds andmesophytic flora; v) Establishment of agricultural and general social support services, andimproved means of access, with further improvements in general qualiy of life; vi)Establishment of suitable condiions for improving human and animal nutrition and drinkingwater quality and, therefore, for improving general health.
* Principal Adverse Impacts include: i) The development of a rising regional groundwatertable, resulting in surface waterlogging and soil salinity n certain areas; ii) The long termaccumulation of salts from the irrigation water, because there are no proven naturaldrainage outlets; iii) Major changes to the sensitive desert eco-system, involvingirreversible loss of desert flora and fauna as a direct result; iv) Increased potential for the
SEA: Final Report - Volume 2 April 30, 2000Page 13. 2

spread of water-related disease vectors and the diseases themselves, with falciparummalaria being a particular concem; v) Destruction of traditional rangelands and livestockpassageways and consequent destruction of the associated nomadic ways of life; vi)Damage to archaeological sites in the Ghaggar Depressions; vii) Social problems withinthe settler communities; viii) Increased potential for the influx and development ofagricultural pests and diseases.
* Sustainability factors included: Prevention or mitigation of groundwater rise;establishment of environmentally sound measures for ultimate disposal of drain water;continuing efforts in afforestation; O&M activities to combat the effects of wind-blownsand deposition and growth of aquatic weed; continuing public health measures,especially the anti-malaria campaign.
* Proposed Environmental Management and Monitoring Action Plan included: Theestablishment of: an Environmental Department to deal with the various issues pertainingto environmental management and monitoring an inter-agency steering committee andformal links with key environmental organisations. A regular extemal environmentalaudit.
13.7 Bisalpur irrigation and Water Supply Project- Environmental and Socio-EconomicalAction Plan (Hasan, 1992)
Contents: The Bisalpur Dam located on River Banas supplies water to some irrigation, anddnnking water to chronic water scarce urban centres of Jaipur, Beawer, Kishangarh, Kekri,Nasirabad and intervening rural settlements. The identified the environmental issues and theimpacts included risk of wateriogging in CCA in alluvial deposits; saline groundwater hencensk of salinization; water pollution from agro-chemicals.
Proposed Actions included: Measures to control waterlogging and salinity by lined canals,conjunctive use of groundwater and canal water, Chemical treatment of salt affected land;drainage control water pollution from agro-chemicals, monitoring soil chemistry and adoptionof soil and water conservation measures; integrated nutrient and pest management; farmerstraining for prevention of spread of water related diseases, safe use of agro-chemicals andenvironmental conservation programs.
SEA: Final Report - Volume 2 April 30, 2000Page 13. 3


PHOTOGRAPHS


ZA-~ ~ ~ ~ ~ '; ;w3,~~~~~~~~~~~~~~~~~~ s. --.-- -~ - -~
Photo I: RainfedlGroundwater Irrgated CropP~~~. .t= t ;S! , _ -
Photo 2: Industrial Effluent Discharge Into Surface Water
SEA: Final Report April 30, 2000

Photo 3: Industrial Discharge adjoining Urban Centres
Le.~~~~~,
Photo 4: Blodiversity
SEA: Final Report April130,A2000

r~~~~~~~~~~~~~
At
0- aft - .A- K
Photo 5: Livestock Pollution
Photo 6: Untreated Municipal Waste Water into River
SEA: Final Report BBApril 30,2000

Photo 7: Aquatic Weed Growth
-~~~~~ ~ ~ ~ ~ ~ ~ ~ ~ ~ ~ ~ ~ ._ _
Photo 5: Point Source Pollution Into Irrigation Canal
SEA: Final Report April 30. 2000

j- ,I.k'I,',.WrERSEWRTOj ,16-SECTORALENVIRONMB TAL
. UBLIC OKSULTATION Its£ i:
'it~26"~ october. 1999 1~~!7, e *T Extension Directorate Udalpur
Photo 9: Public Consultation Workshop at Udaipur
._d~~~~~~~~~~~~~~~~~~~~~~~~~~~~~~Jp - 1- K.Xr kL^+~~~V ij -.
Photo 10: Public Consultation Workshop at Udaipur
SEA: Final Report Apnl 30, 2000

Photo I1: Public Consultation Workshop at Banswara
Photo 12: Public Consultation Workshop at Kota
SEA: Final Report April 30, 2000

14.0 ANNEXURES


Page 1 of 2
Annexure 2.1: Central Govemment Roles and Responslblitlas of Water Sector Devolopment
AgencylDepartment Roles and Functions
Minmstry of Water Resources a) Overall planrurig, policy formulation, coordination and guidance in the sector of water sources as awhole; b) Tedcical guidance, scrutiny, cearance and monilonig of the Ir'gabon, flood control endmulti-purpose projects (madjormedium) of the States; c) General intrastructural, tchnial and rsearchsupport for sectoral development at the State level; d) Providing special Central firncnial assstancefor specific projects and assistance in obtaining external finance from World Bank and ofter agencies;e) Overall poiicy formlaftion, planning and guidance in respect of minor irrigation and command araadevelopment, and also the adminirstrabon and monftoring of the Centray Sponsored Schemes inthese areas: f) Overall pannmng for the development of ground water remsourcs establishment ofutilisable resources and formuation of policies of exploitabon, overeeming of and support to State 1lactivtes in ground water development; g) Formuabon of nabonal water development perspecve andthe determination of th water balance of different basinsisub-bas for considertion of po _*ltisof Interbasin transfers; h) Coordination, mediation and facilibtaton in regard to the resolution ofdifferences or disputes relting to iner-state rivers and in some instances, the overseeing of thetmplementaion of inter-state prects; I) Operation of the central network for flood forecasting andwaming on inter-state rivers, the provision of central assistance for some Stt Schemes in speilcases and prepamrion of flood cotrl master plans for the Ganga and the Brhtaputra; J) Taks andnegotiations with neighbounng countries, in regard to river waters, water resources devopmentproects end the operation of the Indus Water Treaty; k) Conservation and regeneation of woatndsand coral reefs; I) Mondonn,g water quality.
In MOWR derives assitnce fron several orgnzaibons wawing under Its control: Central WaterCommission, New Defh; Central Ground Water Board. Fandabad; Central Water and Power ReserchStabon, Pune; Cenlral Soil and Mateials Research Station, New Delhi; Natioal Water DevelopmentAgency, New Delhi; National Institute of Hydrology, Roorkee; Brahmaputra Board. Guwahati; Waterand Power Consultancy Services (Indta) Ltd., New Delhi; Rashtny Pariyolana Nirman Niom Ltd.,New Delhi; Ganga Flood Contol Commission. Patina: Narmada Control Authorkty. Indora; SanderSarovar Construcbon Advmsory Conimtee, Vadodama; Farakka Barrage Prpect, Farakka; Betwa RiverBoard; Bansagar Contrl Board.
Central Groundwater Board For generaring rqusite scintific data base, CGWB montos groundwater system four ties a yea(May, August, November and January) and water quality once a year (in May)
Ministry of Environnent & Foress The pnncupal activites undertaken by Mnistry of Environment & Forers, cornsist of conservaton 8survey of flora, fauna, forests and Wldlife, prevention & control of pollubon, aftorestation &egenarabon of degraded areas and protection of envtronment, in the frame work of gislaions. Themain tools utilmed for this include surveys, impact assessment. cotr of poliubon, regnerationprogrammes, support to organzabons, research to solve soutions and taining to augment therequisite manpower, collection and dissenvnabon of environmental infomation and creaion ofenvironmental awareness among all sectors of the countys populabon. The organizabona structretof the Ministry covers vanous divisions, auxliary bodies, assocated offices and autonomousagencies.
The several divisions of MoEF include: Environmental Infomation System (ENVIS); SustainabieDevelopment Networking Pogrme (SDNP) - A project implemented by ENVIS; EnvironmentalImpact Assessment (EtA); Conbtr of PoUubon (CP): Conservabon & Survey, Hazardous SubstancesManagement Division (HSMD); Environment Research ; Clean Technology Ernvronment Education,Policy & Law;C General Co.ordination. Protcol & Parliament: General Admnitbrton, NGO &Grievances Cell: Services Division; Plan Coordinabon (PC); Integrated Finance; IntemationalCooperabon; Civil Consruction Unit (CCU); Forest Conservabon: Forest Policy: Survey & Utlzaftion.Forest Fire; Extemaliv Aided Proiects
Central Pollubon Controi Boaro The CPCB is within the MoEF. t functions include: advise the Central Govemment on any matterconceming preenbon and control of water and air pollubon and improvment of the quality of air; planand cause to be executed a naton-wide programm for the prevenaon.control or abatement of waterand air pollutbon; co-ordinate the actvities of the State Board and resolve disputes among themprovide technical assistance and guidance to the State Boards, carry out and sponsror wnesbgatonand resarch relabng to pmblems of water and air pollUon, and for their prevention, contl orabatement; pand organise rang of persons engaged in programme on the prevenbon, contol orabatement of water and air pollution; organise through mass media, a comprehenstve massawareness programme on the prevenion, cntoI or abatement of water and air polubtion; oleompile and publish technical and stsial data relabng to water and air polltion and the measrdevised for ther effectv prevenbon. control or abatement: prepare mnanuals, codes and guidelinesrelaing to trtatment and diposal of sewage and trade effluents as wall as for stack gas ceuaningdevices, stacks and ducts: disseminate informawton tn respect of matters relatig to water and oirpollubon and their prevenon and contiol; lay down, modify or annual, in consutation with the SlateGovemments coneemed, the standards for staeem or well.
SEA: Final Report - Volume 2 Aprl 30. 2000Page 14.1

Page 2 of 2
Annexure 21: Central Govemment Roles and ResponsibilIties of Water Sector Development
Agency/DOpartment Roles and Functions
and bay down standards for the quality of air and pertorm such other funobon as mnay be presecnbed
by the Govemment of India.
Ministry of Agnculture Prevention and control of desertification; Conservabon and regeneration of watersheds; Protecbon of
imgabon command areas; Conservation and regenerabon of forest: Preventon and control of pollution
Ministry of Rural Development Conservabon ano rmanagement of land and soil; Prevention and control of drought: Conservation and
regeneration of forest; Prevention and control of pollubon.
Ministry of Power Prevention and control of pollution; Recyling of resources; Conservation and managemfent of energy.
Minstry of Urban Development Preventon and control of Dollubon
SEA- Finat Report - Volume 2 Aonl 30.2000Page 14.2

Annexure 22: Summary of Poticbes and Acts Related to Water Sector and Environmnntal Proection Govemrnment of India
Central Govemment Year Legal FrmeWorkPolicy I
42nd Conistitional 1977 The 1977 constmtion (42nd Amendment) Act, Arice 48A specefically places on the Obligation on theAmendments Artcle 48A nation to protect the envi-mnmenL The Indian Consituion erloins the 'State to take meaawus to
project and improve the environnent and to safeguard the forest and wldlfe of the country. It alsomakes a fundamental durty of every citizen to protect and Improve the national envirnment minudmglakes, rnver and wildlife to have ecological compassion for the Irving creaurs For this vanous lawshave been enacted by the Peariament from tme to time for Environmental Protection.
Entry 17 list ll (State List) The states are pnwarity responsible for development of 'Water. that is to say, waer supples.Article 246 imgabon and canals, drainage and embankmnt, water storage and water power, subject to the
orovision of entrv 56 Of ist 1.Entry 56 List I (Union iUst) The Union Government can also aisume responswibity for 'ReguatiOn and deveopment of interstateAibele 246 nver valleys to the extent to which such reguabon awnd devopment under the citrol of the
Union iS declared bv Parliament bv law to be exoedient hi the oublic ite.National Water Policy 1987 The Nabional Water Poihcy (1987) provides an overvew of isus and future direcion of resovng
water use issues keepmg in vw the natonal needs, as perevett by the policy mker nd pannersThis is presentiy being revised.
The polcy highiights Include Infotion systems; mainwig avllat prject planig;maintenance and modernzation; safety of res; groundwatr devopnt; wSter allocationpnorities drnking water; igaton water ntes participatio of famoe and voluntary agences: waterqualty water zoang; conervaion of water; flood conrto and matnagement lad erosion by sea ornver drouoht manement; science and technolo trainin.
Model rnmgailon Bil 1976 The 2nd Imgapton Coason (1972).had rommmended that e laws reatng ID gption shold be
unified & simplfled. A draft model bl prepared by committee was reommeed to the whole of StateGovemrnment by the then Minstry of trpation for consideration. The sient fres of the IrrigationBill are: a) Regulaibon of ground water in so far as it kmpinges on srace waters within the comnidof rgation works: b) Expeditious nrtuction of irripgtion and draage wors rcludn courses.fed channels and field drins: c) Consuction of war courses by the Sute for effectve uiaton ofirngabon potential; d) Provison for Onr-FamHevellopmnet e) Provsions for water user'associabons in the form of waiter committees for marnagement of end suppiy of water from rnrorIrmgatlon works: fn Levy of water rates and betterment contribution; g) Levy of penal water rate andstringent punishment for unauthorzed Iriogation and cofisction of electical or nechanal devicesused for unauthorrzed imabon and confcaon of elenrial or mecranical devices used tounauthorized punping of water from imgabon works h) Enhance mnent of punrmient for pollubon ofwater of imgation works; i) Provision for cimpoundment of impgbon offenses.
Model Bill for Grouna 7996 The tfbi provides for me establishment of a Gomund Water Authonty which tihal be empwred toWater notify areas tor control and reguation of ground water devebpment, to gant pemts. licenses and
certficates of regstration for etaction of ground water. The Ground Wer Autority shall have widepowers to enter on any poperty, mvestigate, inspect, take soil sampes, take copies of relevnwtrecord or documents and call for requsibt informa ton e uers to _ta water measaxmgdevices, to seize me mechanical equpment utitzed for lgai sinin, tose down any illegal watersuppiy et.
Pobcy Statement tor 1992 The Envirnrmental Impact Assesment Notification ewemets wars ied by MOEF in May 1994.
Abatement of Pollution Under the nobfions, oertm activities requwe envionmel clearance in the form of a NoMOEF Objection Certficate (NOC) from the Central Govrnnt (or State Gvwerme as the case may be)
before they can crmrnenom or be expand or odeomrzed. The appliation to be sturmt to theMOEF mrust be *o_dnpad by; 1) a easblltyproject report I) a complfte envvnontal apprslquestionnaire; i) an applcaion form: iv) no objecion cefite (NOC) frm the SPC8; v) an EIAroot and manaoement obln.
Central Ground Water 1997 CGWA has been consted under secton 3(3) of the eronmetl (protcton) Act 1986 t
Authority regulate ndsrmmite boring & withdrwa of groundwater in the country & to isue necesry
reoulatorv directions with a view to oresrve & protect the oroundwter
SEA Final Report - Volume 2 Apr. 2000Page 14.3

Sheet 1 of 2
Annexure 2.3: State Government Roles and ResponsibilteS of Water Sector Developments
AgpncyDepartment Roles and Functions
Deparmfnt of Environment & Created in 1983 by GOR the responsibilities indude: Promobon of Environrmental ManagernentForest through co-ordinabon and catalysis of the activibes of the reevant DepartmentlAgencis; Supervision
and scrutny of environmental appraisal of development projects and plans; The 'Thmk-tank function',policy planming and preparaton of guidelines for environmental managerment in all sectors;Environmnental monitonng to asss the quality of physical envwonrnent and implementation ofprotection measures by various agencies: Ensuring adequate manpower and insttutional supportCreation of Environmental awareness, educabon and infomaibon systems; To process and fouow upon information/requests recoved from the public in regard exisfing or future envrnet hazards;Co-ordiniabon with Central Govemrnment and other agencieslDepartmerlts/ Voluntary Organisations;Supervision of works of Wid llte Wing and Rajasthan Board for Prevention and Conlrol of Air andWater Pollution.
Rajasthan Polluton Control Board Constiued in 1975, the Board performs from Head Office in Jaspur with assistance of Regional Officesat Jaipur. Jodhpur, Udaipur, Kota, Alwar and Pali. The enforcement of provisons of: The Water(Preventon and Cono of Pollution) Act: 1974; The Water (Prevention and Control of Poluton) CossAct. 1977; and The Air (Prvention and Control of Pollution) Act, 1981: the Envionmrent (Protection)Act, 1986; The Hazardous Cherracals and Wastes Handling Rules of 1989.
lmgation Department Cames out basin-wise planning of sta water resources; meteorological and hydro meteorological
observatons like precpitation tempera, relative humidity, river lows, sediment load In rive,evaporabon. etc; undertakes hydrological studies for the project, which need dearance fain ntCenra Water Cownnison (CWC); crop planning and crop water requirement for new Inigaonprojects; design of canals and canal strucures: dagnostc analysis of exstng projet=: googcalinvestgations: and proict preparaion responsibibbes for all the major and medium projects.
State Ground Water Departmnent Periodic monitonng of the gound water potnt in key welkl piez2ieters in each of the Distt kn theState. Pre-monsoon and post- monsoon data colection from wlis to monitor the watr level andchemical quality; The estination of ground water potential foliowng the guidelines of the GroundWater Resource Estmation Commitee; Block-wise, semfidetailed hydomgeological surveys anddetailed hydrogeological investigations indudmig chemical analysis of groundwater Palaeo dramnagedelineabon of Westem Ralasthan, fluonde distribution studies, water balance studies and grund waterdatmig; ground water studies in the Agnrculture Development Project (ADP); GWD has centrMal andregional laboratones located at Jodhpur. Jaipur, Udaipur and Bikaner.
Commano Area Development Monttonng and surveying several aspects of environmental interest, such as ground water, sois andDepartment forestry plantrng, and also comnissn periodic studies of environmental and soaoeconornic ues
in the IGNP and Chambat Command areas.
IGNP Hydrological and Draage wing: studies on drainage opons in IGNP command area and sovespecific problems of waterloggtng in seWcted areas: construction of tubewells and other activities torestnct waterlogging and improved drainage facilities; construction of piezomneters and piezometnctests: chemical analyss of grund water samples; drunage mtns mdcuding constiucon of tube wells.vertcal drainage, subsurface drainage and investgations; conducing pumping tsts on hydrauliccondudtvity; monitoring ground water table under the hydrological bamer study. IGNP walermanagemetnt antiwatrogng program; hydrological bamer study- and intensive water managementstudy.
IGNP Forest wing: afbrsttion aong canal system and pasture devebpment for iroving theecogv thrugh deopment of pasures for stabibzing sand dunes and protecting nver banks:detailed and semri-detailed sod surey.
Chambal Command: Investigation of wateilogging and salinity problems (RAJAD Project) training on aspecific technology i.e. Sub-surface drainage system including data collection, monitodng andinvesugaton; Soil and water evaluaton reclamation of salne and watenogged sail; Socialdeveopment for enhancng development effects of the Sub-surface dranage and related agrnomrctechndogies; and develpment effects of the SSD and reiated ag9nonic techniogies.
Water management piot IWAM pret for identfying, testing and demonstratng techniques forimproved water deivery for imgation. Envminmental analysis nd rnonitonrig for assessin,g efects ofdrainage of saline and wasber9d areas on downsteam water quality, and of agncultural priceson quality of gound and surface waters; Soil and Water Lab in CAD, Kota and CAD. IGNP. Bilanerprovide soilwater analysis results to farmers and alo undertake soil survey work.
SEA: Final Report - Volune 2 April 30. 2000Page 14.4

Sheet 2 of 2
Annexure 2.3: State Govemment Roles and ReasponsibllUies of Water Sector Developments
Agency/Department Roles and Functions
Agnculture Department Responsible for development of agnculture tirough agncuhure extension seMces: distnbubon of
seeds, fertilizers and pescades, farmers training on modem farming methods; state level monionng
on use of agncultural inputs, improved agnriulture implements, adoption of new agnicultural
techniques yields, change in cropping pattem. Analysis of soil and water samDles: at laboratones at
Kota, Jhalawar, Jaipur, Jodhpur, Sriganganagar, Aiwar, Banswara and Dungarpur. Mobile Soil Test
Vans for distnct Chittorgarh, Udaipur, Bhilwara, Ajmer, Sirohi, Pali, Nagaur, Sikcar, BharatDur,
Swaimadhopur, Tonk and Jaipur.
Public Health Engineenng Responsibie for development and supply of rural and urban dnninng water frorn both surface and
Department ground water resources. Depariment is also responsbe for collection treatment and disposal of
sewage and waste water.
Department of Industnes Responsible for policy and planning, promotion of industnal growth in the state.
SEA Final Report - Volume 2 Apnl 30. 2000
Page 14.5

Sheet 1 of 2
Annexure 2.4: Summary of Policy and Acts Related to Watr Sector and Environmental Protection: Govemment of Rjasthan
State Govemment Year Legl Frme Work
ActRajasthan State Water Policy 1999 The Rajasthan State Water Policy (1999) provdes development of aU ulibsable water resources to
maximum possible extent, includimg surface water local and mported groundwater and wastewater for
optmal economic develoment and social well being. It aiso emphasizes on judicious and economical
sound allocation of water resources to different sectors, wtth dnnkmg water suppty as a first pnoffty.
The policy defines a series of measures, or polcy instruments, required for the surweafulimplementation ot i) Informbon system; ii) Maxinaig water avaaablity; lii) Prowect planning; iv)Maintenance & modernization; v) Safty of srucs; vi) Groundwatr deveiopmrent; vii) Waterallocation pnontes; vii) Dnnkbng water ix) rmgaton water x) Water rats xi) Parbaipation d waterusers; xii) Water qualty monitonring xiii) Water zoning; xiv) Water conservabon and efficiecy ofutilzaton: xv) Flood control and draine mngemnt xvi) Drought manaement; xvii) Traiig end
education; xviii) Legisabon and egujabon.
Re-habitation and Re- 1997 This policy shall apply to all projects i govemnment. publc & pnvate ectors imvolving land acquibon
settlement Policy or tnvoluntary resememei. Water Resources Development Prqects generaly reqWe aiston of
large tracts of and in predomawtly rurl are. They doen necesate dislaeme of persons andloss o ivelihood, also there may be persons who are adveely afected but not dplaed due to
the project. Restfment arid rehabilitation of such profect ftected peIsons s tI be covered under tlerule. This policy goverms t ca of R&R due to project coming up m the State.
The Rajasthan lmauon and 1954 & The 1954 Act as revsed from tiMe to tme ai to regulte rigation and drainage in Rawtn and mte
Drainae Act and Rules 1955 alha provides for construction and manmenance of water courses by the farmers and nrt of the
system by the Government determination of water rates by nres to be esbshed by the StmteGovemrnment and paid by the and holders reevi the water. Rajasthan Impatbon & Dramage Rules1955, mnae under the 1954 Act, are to regulate the matters contaied in the AcL tn parclar theyprovide for of Warabandi (rotatonal distributon of wae) for equitable nid econoric dstbutonof water water supply to cantonments. towns etc, mUotti canal losure Wnd fixton of lmgatonwater charges for different cmops on area basis.
The Rajasthan Minor lmgation 1953 An Act to provide for the constructon, improvement nd mantmenance of mmor irgbon works m the
Works Act (Amened in 1957 State of Rapsthan. Minor lrngafon Work means an rrgabon. submerson, draiage, protectveanr 1962) work or systems of such work, natural or artifiial of which the contnCtlon or maintenance by the
State Govemment
The Rajastnan Forest Act 1953 An Act to consobdate the law reating to forests, the tanst of forest prodUce and the duty vWable on
btmer and other forest produce. Under ths Act Forest officer "my, with Vie previous sancion of GORstop any publc or prriate way or water course water coue In a reseved fort, provdd that asubstitute for the way or wr course already exist or has been pvided or ctuctd by VieFnreel nflffrr in kiwi Itimnf
The Rajasthan Lanos Special 1953 An Act to provide for the tevy of specald chrges xm respect of land icle in irrgaton acmes.
Imgation Charges Act Whereas, d is expedient to provide for the levy of spacial chages by way of betterment arge and
acreage rate on lands nudexd i and benefited or lely to be benefited by, imgibon swhmesproected or contled by ax undertaken or maintained at cost of Stte Goverment.
The Rajasthan Colon,sation 1954 The Act extends to the State of Rapsthan. Sec. 13 of the A restrns a tenam from tonsfer any rght
Act or nterest vested mi him by or under thIs Act Wtthout the pnor wnten consent of Vie Stat
Government. Improvement made to in ths Act, inter alba, means the construcon and renontion ofweUs, tanks, bunds nd water cehanns. Lend defined in Rajasthan Tenany Act (RTA) 1955 &acqwred under Lend Acquistion Act 1953 atlso fas uder the purvwof this AcL The pvions ofRTA 1955 and Raasth Land Revenue Act (RLRA) 1956 rlti to agricuural tenunces and
Whe powers & dute as well as puidico nd procedures of revenue courts are applicable o thisActL Breches for ut8 nsed excavabon or cotuction of a water cha l are punble.Govemment reserves and aOpts o itself fthe nght to cnstru a water cre or ater anexisting wahtr couse w tener ths may be considered desmable by the Colleor af,tr rcnsublttion
________ with Dwonal lmgabon Officer.
Rajasthan Cooperative 1965 This act requires regsatbon with the department of Coopertv. The Regsrr of Coopeoves haSociety Act por to register bye-laws, approve, transter of asiets and iblis, amend byelas admit menbers
_onDtuct elections and aPDoit an auditor to audd
Rajastnan Societues 1958 Regtrabon under Vhs Act s most simple. This Act requres sen pesons to sign an agreement tVia
Registration Act they ae formin a Soity whose name rind purpose are stad in is Memorandon od Asoition. Thfoundmg memwbers are free to make nrles and bye laws.
The Rajasthan Tenancy Act 195 This Act was enacted in the year 1955 bto c ate law rati to tncy of agrilturol ls nW tprvide for certain measures ofnd forms, repling the Raystn Revenue Courts(Procedure & Jinedion) Act 1951 excep prmvsons reatng to suvey. record and tn
oerationsThe Ralastlian Panchayat Act 1953 The Panchayab Raj system in Raasthan is based on this Act Under this act prvwson has been m
regarding irIrgaton work. Secton 24(l) of this Act pnroids for dutes of a pawcyat to
mainrain those mino irrgation works having a commend are of les then 20 ha whch are entrtedthe panchavat samibs
SEA Final ReDon - Volume 2 Apnl 30, 2000Page 14.6

Sheet 2 of 2
Annexure 2.4: Summary of Policy and Acts Related to Water Sector and Environmental Protectlon: Government of Rajasthan
State Govemment Year Legal Frame WorkAct
Panchayat Samit & Zila 1959 The Ralastan Panchayst Samit= Act 1959 enpxns on Panchayat Samits to cntruct andPanshad frgaton works costing more than Rs 25,000/-, to provide assistance for constucion of
irngation weBs. bunds, armuts and also to provide credd and other facdbties for development of ingabonand agrnculture
Rajasthan Pachayati Raj Act 1994 The previous laws referred to above dealing separately with Panchayal legal enactment and PencthyaSamit and Zila Paanshad Law have been combined in one lgal enacted ve. 'heRajasthan Panchayat Raj Act, 194. The whole Stale of Rajasthan is covered by is law except the a_where Municipal Law is applicable.
Insecbcide Act 19 These bws regulate the import manufacture, sale transport, dstnbuton. These laws were macted so uInsecticde Rules 1971 to prevent rnsk to human lbfe, nials and envimnment Offences under this Act attict penals of fiInsecticide (Amentdment Act) 1977 and Imprisonment or both.The Rajasthan Flood Plain 199 The Central Govemment had prepaed a Model Bil for Flood Plain Zonmg and circulated the samne to amZone Act States m 1975. Based o ts, Raasthan Govemment prepared the Rajasthu Flood Plan
Zoning Bill. 1990 which was passed by the Assembly on 21)9/1992 grving it the shape of en ActThe State Govemnent may appomt a Flood Plain Zoning Authority (FZA) delineating tspowers and functions. dmarete flood plain areas with prohibition or retrictlion on the use of landtherein by publc noices FZA has the power to direct the owners to remove unauthoriedobstrucbons. Preventn FZA from doing its duty is an offence under Secbon 1S6 of Indian Penal Code.
Water Users Association 1999 The siate of Raastan propowd to set-up Water User's Association (WUA) in all imgaton systms. H sproposed to et up 1600 WUAs on 7,50,000 hectares of CCA wenring mwor.medium and mior irrgation projects under the RWRCP. The Rajasthan and Dminage Act, 1954 &MRajasthan lmgation and Drainage Rules 1995 are under finl stage of amendnent ID enableformaliies of WUAs and to give them egal recognibon. This will also empower WUAs to collet and ti
revenues from Inigation charges. Over a period of bme as the WUAs mabtre ndbecome effetive managers of the resource at their local levels, they wil be orgapned kWlo laefederations which will be enouaged to take up dsuon branch canals nd ulmaly head works.
Irrgation Water Rates 1999 GOR vide notification dated May 24. 1999. has made amendnent in the Rapsthan Imggaton DNnaAct. 1955 namely the nrgation rates per acre per crop in Gang Canal. Bhakra. Ghaggar, Rapasthaand Charmbal Canal. all woks constructeW improved andworks in farmer states of Banswara, Dungarpur and Pratapnagar. pre-1952 iprton works excepInundation imgation works will be charged with ncreased rfts as spedhed in the notification for dlftere
Industnal Policy 1998 The new dustnal polcy announced in June 1998 to sutami and strengthen the aeation of a fiscalregulatory and inhrstructure environment in which a pnvate industry can urish.
SEA Final Report - Volume 2 Apri30. 2000Page 14.7

Annexure 2.5: Mechanisms for Developing a Culture of Industrial Environmental Compliance
Mechanism Requirements ImpactPolubon Inventones Industry and govemment Provides stakeholders with a basic environmental
monitoring and dissemination information base to better understand pollution problems andof data on ambient to make informed decisionsenvimnment and pollution
_______________________ loadsinformabon on Enterprise Industry monitoring pollution Collection and dissemination of environmental informationPerfomiance loads; communications can result in 1) an informed constituency that can effectively
strategy for disseminating demand improvement from firms with poor performance andinformation 2) open discussions with communities that can reducoe
mnistrustCleaner Production Govemment: regulation & real Improvements in industrial processes and managementTechniques natural resource pricing reduce the volume of pollution generated, increase
Industry: commitment from producion efficiencies and cut overall operating costs.management
Environmental Management Intemational trade and market Ensures that impacts of industry facilities are managed bySystems pressures; commitment from process of contnuous environmental improvements that are
management regularly monitored, measured and reported
Supplier Chain ImpaGts Intemational trade and marke Large firms work with smaller ones to provide advice andpressures: larger firms mentoring on developing environmental managementconcerned with reputabon systems and improving overall environmental performanceand quality of products
Negotiated Agreemernts & Flexible govemment Creates mechanism for consensus buiiding among majorGovemment-lndustry structures; political stability; stakeholders to commit to achieving dearly definedPartnerships trust between govemment environmental goals
and industry; persuasion andsocial pressures
Source: Developing culture of Industrial Environmental Culture, World Bank, 1998.
SEA: Final Report - Volume 2 April 30, 2000Page 14.8

Annexure 2.6 Limits for Process waste water, domestic Sewage, and ContaminatedStormwatem Discharged to Surface Waters for General Application
(Milligram per liter except for pH, bacteria. and temperal re)Pollutant or Parameter LimitPh 6-9BOD 50COD 250Oil and grease 10TSS 50
MetaisHeavy Metals 10Arsenic 0.1Cadmium 0.1Chromium
Hexavalent 0.1Total 0.5
Copper 0.5Iron 3.5Lead 0.1Mercury 0.01Nickel 005Selenium 0.1Silver 0.5Zinc 2_0Cynide _ _ _ _ _ _ _ _ _ _ _ _ _
Free 0.1Total 1.0
Ammonia 10Fluonde 20Chionne. total residual 0.2Phenols D 5Phosphorus 2.0Sulfide 1.0Colifomm bactena c400 MPN/100ml
Temperature Increase <3CNote: The effluent should result in a temperature increase of no more than 3 deg C at the
edge of the zone where initial mixing and dilution take place. Where the zone is notdefined, use 1 00m from the point of discharge.
Source: Pollution Prevention and Abatement Handbook World Bank, 1998
Annexure 2.7: Treated Wastewater Quality Requirements
Parameter Maximum Value
Coliforms Less than 100MPN/100 ml
Helminth Standard <1 viable intestnal nematode egg per liter
1(>99% egg removal)
MPN = Most Probable Number
Source: intemational finance Corporation. Environmental Healthand Safety Guidelines for Water Reuse
SEA: Final Report - Volume 2 April 30, 2000Page 14.9

Annexure 2.8: DRAFT ENVIRONMENTAL POUCY WITH REGARDS TO WATERMANAGEMENT
Respcr--sibility
A number of state departments have responsibility for water development and use as outlinedelsewhere in the Sectoral Environmental Assessment Report. The State Water Resources Councilis the policy making body wlth respect to water. The Department of Environment is responsible forenvimnmental monitoring. It is not clear as to which department is responsible for enforcement ofenvironmental legislation.
Ultimately every citizen of a state bears some responsibility to protect and preserve the quality ofprecious surface and groundwater resources for the benefit of present and future generations. Inorder to create an awareness of this responsibility among the public the Govemment of Rajasthanshould develop an environmental policy with respect to protection of water quality. Following aresome suggestions as to the type of policy statements regarding envimnmental protection of waterresources that could be developed to assist the government in Wts role as custodian and manager ofwater resources.
Suggested Environmental Policies With Respect to Water
1. Every citizen shares some responsibility to preserve, protect and maintain the quality of preciouswater resources for the beneft of present and future generations.
2. Environmenta! education programs that emphasize the importance of clean water will bedeveloped and used in the standard education curriculum.
3. Environmental awareness will be created through public advertising, mass awareness campaignsand special events such as environmental protection week.
4. Monitoring of water quality shall be carried out on point source effluent discharges by industry ormunicipalities and also on representative non-point source cumulative discharges fromagricultural drainage and urban runoff
5. Groundwater quality will be monitored and legislation drafted for the protection of and right to useof groundwater.
6. There will be an environmental approval process including the requirement for environmentalimpact assessments of all new projects which may have a detrimental impact on downstreamwater quality or quantity.
7. Where rehabilitation of existing water distribution systems are carried out within the framework ofthe State Water Resources Consolidation Program a sectoral environmental assessment willmeet the environmental assessment requirements.
S. Interstate agreements with respect to water sharing will be adhered to and discussions will becarried out between states to initiate water quality monitoring and to develop a framework forincluding water quality in the termns of interstate agreements.
9. The development of new environmental protection policies and legislation will involve an openpublic consultation process.
10. There will be a clarification of roles between the Central and State govemments with respect toenvironmental protection of water resources.
11. There will be a govemment department or agency with responsibility for enforcement proceduresand penalties for non-compliance of environmental regulations.
12. There will be a state water allocation policy that takes into account priority of various water usesand in-stream flow needs to protect the rights of all water users.
13. Water planning and management will be carried out on a river basin basis and inter basintransfers will only be considered after all other options have been exhausted.
14. Water conservation and efficiency of water use will be promoted.15. Rehabilitation of existing water supply systems will have precedence over the development of
new water management projects.
There are obviously other issues that can be addressed in a broad ranging state water policy. Theabove only represent a sampling of the kind of policy statements that can be developed to addressenvironmental protection issues related to water management.
SEA: Final Report- Volume 2 April 30, 200014.10
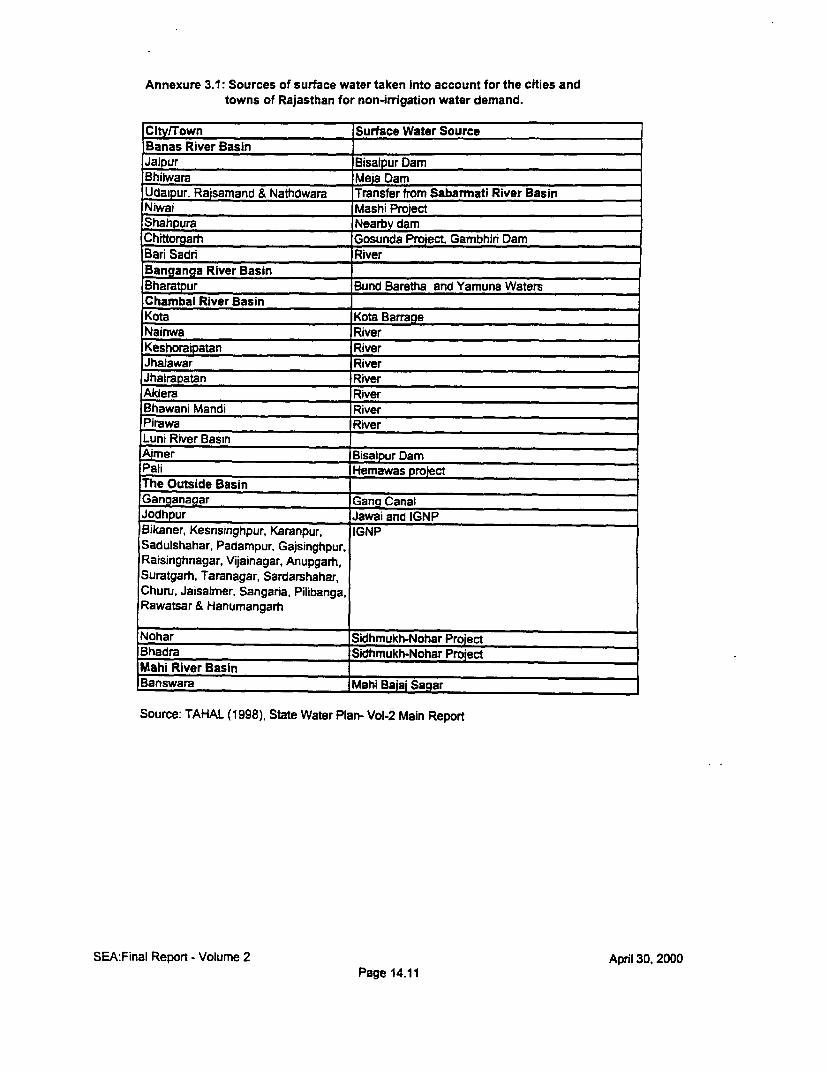
Annexure 3.1: Sources of surface water taken into account for the cities andtowns of Rajasthan for non-irrigation water demand.
CitylTown Surface Water SourceBanas River BasinJaipur Bisalpur DamBhilwara Meia DamUdaipur, Rajsamand & Nathdwara Transfer from Sabarnati River BasinNiwai Mashi ProjectShahpura Nearby damChittorgarh Gosunda Proiect, Gambhiri DamBari Sadri RiverBanganga River BasinBharatpur Bund Baretha and Yamuna WatersChambal River BasinKota Kota BarrageNainwa RiverKeshoraipatan RiverJhalawar RiverJhairapatan RiverAkiera RiverBhawani Mandi RiverPirawa RiverLuni River BasinA;mer Bisalpur DamPali Hemawas projectThe Outside BasinGanganagar Gang CanalJodhpur Jawai and IGNPBikaner, Kesnsinghpur, Karanpur, IGNPSaduishahar, Padampur, Gajsinghpur,Raisinghnagar, Vijainagar, Anupgarh,Suratgarh, Taranagar, Sardarshahar,Churu, Jaisalmer, Sangaria, Pilibanga,Rawatsar & Hanumangarh
Nohar Sidhmukh-Nohar ProjectBhadra Sidhmukh-NohrPeMahi River Basin _ect_
Banswara Mahi Baiai Sagar
Source: TAHAL (1998), State Water Plan- Vol-2 Main Report
SEA:Final Report - Volume 2 April 30, 2000Page 14.11

Annexure 32: Non-Irrigation Water Demands andl Supply, Mn3/yr (in the 90% dependable Climatic State)
1995 | 2005 2015Demarnd I SUDPIV IDemnd |_ PSu IDem-and I SUPDW
TSWI) JGW 2) I TSW rGW I ISW IGWShekhawati River Basin
Domestc I 93 01 931 1251 01 1251 59 01 159Industnal I 1 O 1 1 [ 1 1 0 1Lrvestock I 41 0 411 401 0 40 48 0 48
Rurnil River BasinDomeestc 58) 58[ 781 01 781 1021 01 102Industrula 3 0. 31 0 3 5 0 3Lfvestock 14 0 141 15 0 15 18 0 18
Bantiance River BasnDomestc 91 5 85 1211 561 65 155 a1 74Industral iI 0 1 1 _ i 1 i 1 21 01Lvestock 301 301 321 0] 32 39 0 39Oers 171 161 01 17 171 0 17 16 0
Gmbhir RRiver Basn'Domestc 33 0 33 431 0I 431 541 01 54Lvestock 11 0 11 131 ol 131 151 0o 15
Patbsb Rver BSonDomestc 1 141 01 141 191 01 191 241 01 24Indusbial 01 0 1 °l 0l °l °l 0l l 0Livestock 1 7 0 71 71 01 71 8 0 8
Sabi River Basin_Dmestc 34 0 34 44 0 4 551 0o 55
Indusrial 4 01 4 5 0 41 6 4Livestock ~~161 01 161 161 01 1is i -- 01 19
I___ Banas Rier BasnDometii;525 64- 4591 67 3301 3441 8241 491 333
InCuslnal I 9 0 191 231 Of 201 291 1 1 120;;-M 190 0 1901 1821 01 1821 2181 0 218[Ofers 5 5 0 95 951 95 95 0
Chambal River BasmnDomesc | 213| 741 138| 274 92 181 334 103 230Industrial |01 SI ° 61 01 51 71 0l Srietock 1 861 01 861 91 01 91 109 0 109
lOthers | 981 gal D0 173 1731 0 191 191 0Mahi River Basn
Domestic 941 0 1 94 1251 01 1251 15 01 157Indusial I 1 0 1 1 0l I -Livestock 731 0 7 68 - 81L 0 81
Sabamnati Rtiver BasinDomestic 101 0 101 121 0 1 1 0 141iLNestock 201 01 201 16L 0o 16 20 0 20
Luni River BasinDomestc i 1991 531 1451 2431 871 1551 2891 901 199Industial | 41 0 4 51 ol 51 71 01 5Lrvestock 1 1651 0 1651 1231 ol 123 147 0 147
West Banos River BasnDomestc I ill 0 i 111 151 01 151 191 01 19Industnal 1 01 I I 1I 0 1 0 Lrvestock 10 01 101 7 0 71 0 8
Suli River BasinDomestic 21 0l 21 21 0o 21 31 01 3Livestock 5 01 51 31 0 _ 31 41 01 4
Other Nalahs BanDomestc 51 01 51 7 0 7 8 0 ULveStck a81 0 81 61 0 61 71 0 7
Outade BawnDomesbc 6241 - 01L LIIrndustnal 1 81 1 12Livestock 3931 20 3481Others -47 I i 3601 1 41I__________ Total for 15 River BasinsDomestic 20061 1961 1181L 2589 565 1215, 3183 765 13industrial- 47 391 571 01 411 71 11l 33Livestock 1069 01 6761 909 0 6191 9 108 0 741Others 167 1191 01 6451 2851 01 7151 3021 0* Industnal demand in these Basins is neglgibe
Source: TAHAL (1998), State Water Plan, Volmen 2. Main Report
SEA Finl Report - VoLune 2 Apdl 30. 200DPage 14.12

Annexure 4.1: Primary Water Quality Crieteria for Various uses of Fresh Water,as laid down by the Central Pollution Board
S.No Characteristics Class A Class B Class C Class D Class E1 Dissolved oxygen (DO), mg/I, Min 6 5 4 42 Biochemical oxygen demand (BOD) mgri, Max 2 3 33 Total coliform organism' MPN/100 ml. Max 50 500 .4 pH value 6.5-8.5 6.5-8.5 6 9 6.5-8.5 6.5-8.55I Electrical conductivity, micromhos/cm, Max 2.2506 Sodium adsorption ration, Max 267 Boron, mgl, Max 2
If the coliforms are found to be more than the prescribed tolerance limits, the crieteria for coliforms shallbe satisfied if not more than 20 percent of samples show more than the tolerance limits specified, andnot more than 5 percent of samples show valves more than 4 Umes the tolerance limits.
Class A: Drinking water source without conventional treatment but after disinfection. There should be no visibledischarge of domestic and industrial wastes into Class A waters.
Class B: Outdoor bathing organized. The discharge shall be so regulated/treated as to ensure maintenance ofthe stream standards.
Class C: Drinking water source with conventional treatment followed by disinfection. The discharge shall be soregulated/treated as to ensure maintenance of the stream standards.
Class D: Propogation of wildlife, fisheries.Class E: Imgation, industnal cooling, controlled waste disposal.
Source: CPCB Publication ADSORBS/3/1978-79, In CPCB, Parivesh News letter; Volume 5(iv), Mar 1999
SEA: Final Report - Volume 2 April 30, 2000Page 14.13

Annexure 42: Biological Water Quality CrIteria (BWQC)
S.No Taxonomic Groups Range of Saprobic Ranoe of Water Qualrtv Water Quality Indicator_ _______________ Score (BMWP) Diversity Score Characteristic Class Cour
1 Ephemeroptera, Plecoptera, 7 and more 0.2-1 Clean A BJurTrichoptera, Hemiptera,Diptera .
2 Ephemeroptera, Plecoptera, 6-7 0.5-1 Slight Pollution B Light BlueTrchoptera, Hemiptera,Planara, Odonata. Diptera
3 Ephemeroptera, Plecoptera. 3-6 0.3-0.9 Moderate Pollubon C GrenTnchoptera, Hemiptera.Odonata, Crustacea,Mollusca, Polychaeta,Hemiptera, Coleoptera.Diptera. Hirudnea.Oliqochaeta
4 Mollusca, Hemiptera, 2-5 0.4O l ss Heavy Pollution D OrangeColeoptera, Diptera.Oligochaeta
5 Diptera, Oligochaeta No 0-2 0-0.2 Severe Pollution Eanimals Red
Source: CPCB, Panvesh Newsletter. Volume 5 (iv), March 1999
SEA: Final Report - Volume 2 April 30,2000Page 14.14

Annexure 4.3: Projected Amounts of Reclaimable Urban Sewage and Approx.Minimum Areas which can be Irrigated
(thousand m)
1995 2005 2015River Basin Sewage Water Area, ha Sewage Water Area, ha Sewage Water Area, ha
Shekhawati 1,204 216 7,386 1,326 18,385 3,307Ruparail 1,160 142 6,706 822 16,525 2,028Banganga 1,223 141 7,308 853 18.289 2,132Gambhir 426 56 2,568 335 6,403 835Parbat 148 20 920 126 2,321 317Sabi 280 28 1,820 177 4,530 443Banas 11,563 1,263 67,832 7,551 151,911 16,958Chambal 4,034 620 22,114 3,395 49,699 7,640Mahi 8611 124 5,196 749 12,891 1,861Sabarmati* 0 0 0 0 0 0Luni 3,632 446 18.164 2,270 38,841 4,942West Banas 193 21 1,138 120 2,825 300Sukli 0 0 0 0 0 0Other Nallahs 37 4 222 22 553 55Outside Basin 11,000 1100 59,318 5932 133,827 13,383Total 35,761 4,181 200,692 23,678 457,000 54,201* No city or town in this River BasinSource: TAHAL (1998), State Water Plan, Vol-2, Main Report
SEA: Final Report - Volume 2 April 30, 2000Page 14.15

Annexure 4.4: Extent of Salt Affected Area Under Irrigation In RaJasthan (1969)
Districts Total Irrigated Salt affected area under irrigation by Total salt affected area Salt affected area (percent of____________ area under IrrigatIon total Irrigated area)
Canal Tank Well & tube wells Inundation
I Almer 95,078 1,642 50,064 51,706 542 Alwar 74.013 1,064 20,800 .21,864 303 Banswara 7,588 160 400 560 74 Barmer 11.511 9,310 9,310 815 Bharatpur 120,432 3,541 6,120 39,140 5,160 53,961 456 Bhilwara 134,533 108 12,040 91,000 103,148 777 Bikaner 58 58 58 1008 Bundi 58,572 15,000 6,420 21,420 379 Chittorgarh 94,501 240 860 51,214 52,314 5!10 Churu 360 360 360 10011 Dungarpur 8,865 56 56 112 Gilnganagar 451,671 350 350 013 IJalpur 186,901 280 139,960 140,240 7514 Jaisalmer 197 197 197 10015 Jalore 55,274 36,420 36,420 6616 Jhalawar 27,129 __ 285 285 117 Jhunihunu 10,368 590 590 615 Jodhpur 23,611 18,560 18,560 7919 Kota 63,328 10,12 1,024 10,118 21,262 3420 Nagaur 19,840 14,400 14,400 7321 Pall 109,235 670 102,416 103,086 9422 Sawal- 71,392 1,048 1,048 1
Madhopur _ _
23 Sikar 31,334 12,600 12,600 4024 Sirohl 41,354 120 5,164 5,284 1325 Tonk 59,219 880 1 880 126 Udalpur 106,694 70 700(1
_Total 1,863,058 30,86 22,126 612,510 670,659Source: Saline & Alkali Soils In Rajasthan. Their nature, extent and management, 1969. Department of Agricuiture, Govemment of Rajasthan,
SEA:Flnal Report - Volume 2 April 30, 2000Page 14.16

Annexure 4.5: Ust of Rare and Endangered Plants of Rajasthan
S. No. Latin Name Local Name Habit1 2 3 4
1 Amrnannia desertoruin BlatL & Hallb. Moto-jalbhangro Under shrubtree
2 Anogessus sencea Brandis var indok beenummularia King ex Duthie (= Arotundifolia Blatt & Hallb.)
3 Anbchans gladulosa Asch, var caerulea HerbBlatt & Hallb. ex Sant
4 Bouchea marrubifoba Schauer (= Bai HerbPleurostigma submtundum Hoechstnomnud)
5 Commiphora wAghtii (Amnott) Bhandan gugul Shurb acme= C. mukal Engl. and = Balsamodendron dendmoidmukul Hook. ex Stock) formn
6 Convoivulus scrndices Stock Kaland Herb7 Crypsis schoenoides Lamk. . Herb ( gross)8 Dignathia hirtealla Stapf Herb (grass)9 Dipteryggum olaucum Decne Under shrub10 Ephedra ciliata Flan & Mey ex. C. A. Suo-phogaro Climbing
may ( = C. foliata Boasas.) shrubI1 Enolaena hookenana W & A. bhoti dhaman Tree12 Euphorbia ;odhpurensis Blatt & Hallb. Dudheli Herb13 Fprsetia macrantha BlatL & Hallb. Mobo-Hlran chabbx Under shrub14 Grewia damine Gaertan (= G. saivHfolia Phalsa ShrubI IWeyne ex Roth non Linn. f.)115 Monsonia heliotropoides Boiss Herb16 Malhania denhamii R. Br. Herb17 M. maqgnfolia Blatt. & Hallb. Shrub18 Monna concanensis Nimmo Sarguro Tree19 Nannae pulla Lamk. ex D.C. . Herb20 Pulicarua raiputanae Blatt. & Hallb. Dhola lioru Herb21 Rhnchelytrum villosum (Parl) chiov. Herb ( grass)22 Rose Iveiiii Lindi. Shrub23 Seetzenia onetaias Deene Dhakri Herb24 Talinum portulacifolaum Aschers ox Shrub
Schweinf25 T. avemiera cuneifola Am. Under shrub26 Tecommeia undulata ( Sm) seem rohida Tree27 Tribulus rajasthanensis Bhandan et gokhru Herb
Sharma28 Tnpogon gacquemontit Stapf Herb (grass)29 T. roxburghuanus Bhide Herb (grass)30 Withanma coagulans Dunal Paneer bandh Under shrubSource: Rajasthan State Gazetter, 1995
SEA:Final Reporl - Volume 2 April 30.2000Page 14.17

Page 1 of 2
Annexure 4.6: Vegetation in Different Habitats of Rajasthan
Habitat SpeciesTrees Shrubs Grasses
Granite Hills Anogeissus spp. Asparagus spp.Windward fac Salvadora olcoides Cocculus cebatha
Commiphora mukulEuphorbia caducifoiaGrewa ternaxVogelia indicaZizyDhus nummularia
Granite Hills Acacia senegal Acaca jacqucmontLeeward face Anogeissus pendula Euphorbia caducifolia
Prosopis cinerana Zizyphus nummulariaSalvadora oleoides
Rhyolite Hills Acacia senegal Blephans sindica Anstida depressaAnogoissus rotundiolia Commiphora muul Aristida hystxBalanites acgyptiaca Euphorbia caducifdia Aristida myleanaCapparis decidua Fagonia cretica Cenchrus biflorusGymnnosporia spinosa Growia tenax Cloris barbata
Lycium barbaram Cynodon dacylonMiinosa hamata Dactylcbtnium sin-dicumTephrosia purpurea Digitaria adscendens
Elousine conmpressaEragrostis ciiansEmgrostis pilosaLatipes senegalensisMeanoemnchiis jacquemontiOfopebum thomaeumSehima nervosumTragus bifiorusUrochloa panicoides
Upper Piedmont Acacia senegal Bafieria acanthoides Oropetum thomaeumAnogeissus pendula Bariena prionitis Euneapogon slogansBalanites aegyptaca Boerhavia diffusa Auistida spp.Cassia auncubata Corchorus aestuansGynmosporia spinosa Grewna tenaxSalvadora oleoides Volutarella divaricata
Lower Piedmont Acacia leucopholes Aerva persica Anstida hirbglumaAzadirachta mdica Aristida hertigluma Conchrus biftorusBalanites aegyptaca Cocculus cebatha Eleusme compressaCaparis decidua Euphorbia caducifolia Eragrosus bifanaGymnospona spinosa Grewia tenax Melanocenchris lacquemontiProsopis cinerana Holiotropium marifoliumSalvadora oleoides lndigodrta cordifolia
Leptadenia pyro4schnicaPanicum turgidumSericostoma pauci-fiornmTephrosia purpureaZizP"hus nummularia
Older Alluvium Capans decidua Acacia jacqucmonbPlains Prosopis cinerana Aerva persica
Saivadora oleoides Euphorbia caducifdia(11,3,4,5,6) Leptadenia pyo4echnica
Zizyphus nummulanaSand Covered Acacia senegal Acacia lacqucmonb Anstidia adscensionisOlder Alluvium Caparis decidua Achyranthes aspera Aristdia tunicubata(1,4) Gymnosporia spinosa Boehavia diffusa Cenchrus biflorus
Prosopis aneraria Cassia suriculat Cenchrus ciliansSalvadora oleoides Commelina benghalen-ais Digitara adscendens
Indigofera pauciflolia Eragrosts cilrisJusbcia simpicx Eragrostis unikoidsLeptadenia pyro-technica Leucas asperaPeristrophe bicalyculata Sida corditfoliaZizyphus nummularia Tragus bifionjs
I_Urochloa panicoides
SEA: Final Report - Volume 2 April30. 2000Page 14. 18

Page 2 of 2
Annexure 4.6: Vegetation in Dlfferent Habitats of Rajasthan
Habitat SpeciesTrees Shrubs Grasses
Youncer Alluvial Acacia arabica Achyranthes aspera Cenchrus catharticusPlains Acacia cupressiformis Amaranthus viridis Cenchrus setigerus
Acacia leucopholes Cynodon dactylon Chions virgata(1.2.34.5, 6) Ailanthus excelsa Demostachya bipinata Cyperus rotandus
Albizla lebek Digera arvensis Dactyloctenium sindi-cumAzadirachta indica Indigofera crodifiora Dicanthium annulatumFicus benphalensis Jusbata procumbens Digitana adscendensFicus religiosa Mollugo cerviana Eleusine compressaFicus mysorensis Solanum xanthocarpum Eragroabs pilossInga dulcis Tephrosia purpurea Ergrosts tremulaMonnga pterygosperma Xanthium strumanum Sporobolus coromandeliansProsopis cincmnaTamanndus inoicaTecomella undubata
_____________ Zizyphus mauntianiaRiver Beds in Aerva persicaYounger Crotalana burhiaAlluvium Cynodon dactylon
Cyperus arenanus(1.2.3,4.5) Cyperus rotundus
Demostachya bipinataEchinochola colonumErianthus munjaLeptadenia pyro-technicaXanthium strumanum
Stable Sand Acacia senegal Acacia jacqucmont Amevia hispidissimaDunes. Balanites aegyptica Aerva persica Anstida adscensionis(uncuigvated) Cappans decioua Calligonum polygo-noides Anstida funiculata(1. 8 9,10. 11) Gymnospona spinosa Calotropis procera Celosia argentea
Prosopis cinerana Crotalana burhia Cenchrus biflorusTecomella undulata Ephedra foliata Citrullus colocynthisZazyphus mauntiania Leptadenia pyro-technica Convolvulus pluncaulis
Lyraum barbaram Cyperus arenanusMelhania denhami Desmostachya bipi-nnataMimisa hamata Eleusine compressaSencostoma pauci-florum Helitropium stngosumTephrosia purpurea Helitropium sububatum
indigofera cordifoliaIndigofera linifoliaPanicum trugidumTribulus terrestns
Unstable Sand Acacia senegal Acacia jacqucmonb Arnebia hispidissimaDunes Gymnospona spinosa Aerva persica Ansbda adscensionis(1, 8. 9, 10. 11) Prosopis cinerana Crotalaria burhia Cenchrus biflorus
Salvadqra olcoides Euphorbia caducifolia Cenchrus ciliansGrewia tenax Cenchrus setgerusLeptadenia pyro-technica Eragrostis poacodiesSencostoma pauci-florum Fagonia cretica
Helitropium stngosumHelitropium subulatumPanicum trugidumPolygaba enopetraTribulus terrespns
Dissected Sand Acacia senegal Ephedra foliata Boerhavia verticllataDunes Balanites aegypbca Cenchrus biflorus
Commiphora muk 'l Justica procmbensOropebum thomaeumPupalia lappseea
_Tragus diflorus
Source: Shankar. 1994
SEA Final Report - Volume 2 ApnI 30, 2000Page 14.19

Annexure 4.7: General Characteristics of the 'lodiverslty Habitatslln Existing Different Major Ecosystems of Ralasthan,
So Mahor Ecosystems Percentage Area Prevailing Climate Major solis Main Agricultural Crops Dominant Plants Dominant AnimalsI Desert Ecosystem 59 94 Arid and-Semi arid Desert Soil Bajra Gwar and Till Cailigonum polygonoldes, Zizyphus Fells libycaonata, Anidope arvicapra.
climate nummulara. Prosolls cinerarla, Tecomella Chlordotis nigriceps. Vuples vulpes pusili2a__________________ ______________________ _undiata' Lasiunus sindicus Uromastix hardwickel
_ Aravalil Hilly 12 51 Subhumid to humid Hilly and Maize, Wheat and Rice Boswelfia serrala. Butea monosperma, Panthera tigris. Panthera pardus',Ecosystem cdmate Brown soil Tecdona grandis, Diosphyros melanoxylon, Melufus ursinus. Cerveus unicofomiger,
Syzygium cumint, Mangferra Indica, Gailoperdix spadicea caurinaI ~~~~~~~~~~~~~~~~~~~~~~~~Carissa congesta
3 Eastem Plain 16 Semi and sub humid Yellowish Gram. Mustard and Wheat Anogeissus latifoaia, Tamarindus indica. Boselaphus tragocamelus. PresphytlsEcosystem Brown and Maytenus emarginata, Dalbergia sissoo, entellus, Canis lupus palilpes, Grus
alluvium soil Typha. Hydrilla, Ceralo phyllum, leucogeranus, Suscrofa cristatusElchhomea, Trapa
4 Ravine Ecosystem i 1.35 Sub-humid Medium Wheal, Colton and Jowar Dichrostachys cinerea, Tenminalla asouns, Axis axis, Pathera pardus, GazellaBlack soli Acacia catechu, Acecia senegel, Acada gazella, Gavialls gangeticus', Canis
nilotica, lpomola, Typha, Nymphaea aureus eureus aureus.
*rare or endangered specles
Source: Chauhan, T.S. Editor. 1993. Human Resources of Rajasthan. Scientific Publishers. Jodhpur. pp 503
SEA: Final Report - Volume 2 Page t4 20 Apdl30.2000

Annexure 4.8: Envrionmentally Sensitive and Protected Areas of Rajasthan
Name Location Size (Sq Km)Bhensmdaarh Sanctuary Rawatbhata. Chittorarh 229Darrah Sanctuary KRmalpura. Kota 266Desert Nabonal park Jaisalmer 3172Jaismmand Sanctuary UdaiDur, Jaisammand 52Keoladeo Ghana National Park Bharatpur 29Kumbhalgarh Ranakpur Sadr, Udaipur 578Mount Abu Sanctuary Mount Abu 289National Chambal Sanctuary Kota 549Ranthamnbore Nabonal Park Sawai Madhopur 392Sinska National Park Aiwar 492Sitamata Sanctuary ChttoMarh 423Tal Chapper Sanctuary Chapper, Churu a
Jamvwa Ramgarh Jaipur 300Jawahar Sagar Kota, Bundi 100Kaila Devi Sawai Madhopur 676Nahargarh National Park Jaipur 50Phulwari Ki nal Udalpur, Pali 511Ramqarh Bisdhar Bundi 250Shergarh Baran 99Sonkhalia Closed Area Aimer 71Sorson Closed Am Kota 80Todqarh Raoli Aimer.Udaipur.Pall 495Vanvihar & Ram Sagar Dholpur 49Sa angarh Udaipur 5Band Barretha Bharatpur 192Sawai Man Singh, Sawai Madhopur 103National Gavial Chambal 280Bassi Chittor arh 153Balu Bikaner 100Jorbir Bikaner 75Deshnok Bikaner 25Mukami | Bikaner 168Diyatra Bikaner 5C0Sawantsar Kotasai Churu 7091Rotu Nayaur 50Jorada Nagaur 30Barrod A__ar 23Jodian Akv_ar 30Saithalsagar Jaipur Mehlan Jaipur e
Jarrsesnamol Jodhpur 3500Lohawat Jodhpur 1242Dechu Jodhpur 20Sathmn Jodhpur 244Phitkasni Jodhpur 569Dhawa Doli Jodhpur 424Gudhavishnoi Jodhpur 424Ramdeora Jaisaimer 3000Ulalan Jaisaimer 3000Tilbra Ajmer 2000Gahwana Ajmer 21 0ORanmpura Tonk 120Dhonmanna Bamier = 69Sanchore Jabor 1813Jawai Banoh Pali Baqdharrah lUdairpur 34Menal Closed Area IChittorgarh 2Kanak-bahar lBurndiaKvwaii Sawai Madhopur 40Source: Rajasthan State Gazetteer (GOR), 1995
SEA:Final Report - Volume 2 April 30, 2000Page 14.21

Page 1 of 2
Annexure 4.9: Endangered Wildlife Species of Rajasthan
Species Habitat Requirements Livelihood of ProjectI I Occurance* & (route recorded) Impact Potential
Mammals _Tiger Forest or dense grassland U LLeopard Forest. scrub. plains U LCaracal scrub, jungle L MDesert Cat desert scrub L MFishing Cat Forest near streams U LLeopard Cat Forest scrub. plains U LIndian Wolf Forest scrub U LSloth Bear Rockey forests U LPangolin lains L LRatel Forest, scrub, plains L LFlying Squirrel Forest U LMouse Deer Forest U LBlack Buck plains, open scrub MO 1) MChinkara scrub, plains R(10, 11) MFour-homed Antelope iltht forest L LGanecr c Dolphin river U LReptilsAgra Monitor Lizard and. san coun R(1) MBarred Monitor Lizard plains M MWater Lizard wetilands. trees R(2) LCrocodile river. lake. Marsh H MGavial rnvers H MPython LGanges Soft-shelled TurU river M MIndian Flapshelled Turtle ponds M LStarred Tortoise sandy scrubland M MBirds _ __ _ _______Indian Peafowl Forest. scrub. cultivabon R(ALL) LArvalli Red SPurfowl Deciduous. scrub. ravines. rL L LGreat Indian Bustard Grassland. scrub. cultivation L LLesser foncan Grassland. scrub. cultvation L LHoubara Bustard sandy semi-desert L LSibenan White Crane Marsh U LWhite Stork Marh. ctivation U LSpoonbill Marsh. Lake U LOsprey River. Lake U LPeregnne Falcon Wetlands. cliffs U LLaggar Falwn Dry open countr L Red-headed Merlin Open country L LBlack-wnged Kite Open forest Grassland. scrul R(1.2,4,8,9,10) LCrested Honey Buzzard Ooen forest cultivation M LPanah Kite Urban. cultivabon, marsh R(ALL) LBrahmin Kite Urban. shores L LGoshawk Forest U LCentral Asian Shikra Forest, scrub, cultivabon M LIndian Shikra Forest, scrub. cultivation R(9) LBesra Sparrow Hawk Forest L LLong-leaged Buzzard Cultivation.Scrub.Open fores M LAsiatic Sparrow Hawk Forest L LDesert Buard Open areas M LWhde-eyed Buzzard Eagi Cultivaton, Scrub, grassland M LCrested Hawk-eagle Dry forest, near cultivation M LBonelh's Hawk Eagle Open forest L LBooted Hawk Eagle O0en forest. scrub L LTawny Eagle Dry scrub, cultivabon L Llmpenal Eaole Open country R(10) LGreat Spotted Eagle Shorelines U LSteppe Eagle Dry scrub. cultivation L LLesser Spotted Eagle Woodlands. scrub, cultivati L LPalla's Fishine Eagle Lake. river U L
SEA: Final Report - Volume 2 April 30. 2000Page 14.22

Page 2 of 2
Annexure 4.9: Endangered Wildlife Species of Rajasthan
Species Habitat Requirements Livelihood of ProjectOccurance & (route recorded) Impact Potential
Whie-tailed Eagle Lake: nver U LKing Vulture Open forest. scrub, cultivabo M MIndian long-bilied Vulture Open country H MIndian white-backed Vultu Open forest Marsh. cultivabo R(ALL) MWhite Scavenger Vulture Drv open country R(ALL) MPale Hamer Open country, March. scrub L LMarsh Hamer Wetlands R(4) LHen Hamer Open plains. cultivation. footl L LShort-toed Eagle Open country L LMontagu's Hamer Marsh. cutibvation, grassland .L LCrested Serpent Eagle Open forest Marsh. cuftivatio L Losprey River. Lake Li LSource: Rajasthan State Gazetter. GOR. 1995(#) = Alignment where recorded
U = unlikely, I m- low potental, M=moderate potential, H=high potential, R = recorded
SEA: Final Repon - Volume 2 April 30. 2000Page 14.23

Annexure 4.10: Incidence of Water Related Diseases In Rajasthan (1994-97)
Year Tyohoid Amoebibsis Gastroententis Jaundicel Hepatitis Malaria
Tota. -. ases per Total Cases per Total Cases per Total Cases pa Total Cases par1000 1000 1000 1000 1000
1994 169.021 3 639,764 13 749.684 15 28,580 - 460.261 91995 138.787 2 680,742 14 739,870 15 35,491 165 81996 125,439 2 624,933 12 702,090 14 29,980 -389,060 81997 78,545 516,316 10 556.250 11 14,748 L-342.105 7
Source. Medical and Health Depatment, GOR
SEA:Final Report - Volume 2Page 14.24 April 30.2000

ANNEXURE 4.11
TYPICAL WASTE WATER CHARACTERISTICS ANDEFFLUENT DISCHARGE REQUIREMENTS
Preamble: For protecting and improving the quality of environment and preventing and abatingenvironmental pollution, the standards for discharge of environmental pollutants from the industries,operations and processes are specified in the Environment (Protection) Act, 1986. While thesestandards focus on end-of-pipe treatment of pollution, a new approach for consideration and that isemerging in the industry is the concept of sustainable development and cleaner production, togetherwith an emphasis on good management practices.
Industrial Wastewater Characteristics: In the absence of detailed monitoring and data fromindividual industrial discharges, the typical wastewater characteristics that could likely beexperienced from selected industries in Rajasthan's water sector are summarized based on dataprovided by the SPCB (Table A4.11.1 and Map 4.18) literature review of effluents ( World Bank,1998) from similar industries.
Dye Manufacturing Industry: While cooling waters are normally re-circulated, liquid effluentsresulting from equipment cleaning after batch operation can contain toxic organic residues. Wastewater and pollution generation rates are of the order summarized in Box A 4.11.1
Box A 4.11.1 Waste Characteristics of Dye Manufacturing Industry
* Waste water generation 1-700 Vkg of product, except for vat dyes.* Waste water generation 8000 Ikg of product, for vat dyes.* BOD and COD levels 25 kg/kg and 80 kg/kg of products, respectively.
(reactive and azoic dyes)* BOD and COD 6kg/kg and 25 kg/kg, for other dyes.* Suspended solids 6 kg/kg.
Mixed Fertilizer Plants: Liquid effluents from mixed fertilizer plants and pollution generation ratesare of the order summanzed in Box A 4.11.2
Box A 4.11.2 Waste Characteristics of Mixed Fertilizer Plants
* Liquid effluent 1.4 to 50 cubic meters/ metric ton of product.* Nitrogen 0.7 -15.7 kgAt ( as N)of product* Phosphorus 0.1 - 7.8 kg/t ( as P205) of product* Flourine 0.1 - 3.2 kg/t of product
Pesticide fornulation: Formulation of pesticides from active ingredients results in liquid effluentsfrom spills, the cleaning equipment, and process waste waters. The effluent may contain toxicorganic compounds, including pesticide residues, such as: organochlorines, nitro-organics,pyrethroids, phenoxy compounds, arsenic and chrome, copper, and mercury. Waste waterconcentrations and pollution generation rates in Pesticide Manufacturing are of the ordersummarized in Box A 4.11.3. Major solid waste of concem include process and effluent treatmentsludges, spent catalysts, and container residues. Approximately 200 kg of waste can be generatedper metric ton of active ingredient manufactured.
SEA: Final Report- Volume 2 April 30, 200014. 25

Box A 4.11.3 Waste Characteristics of Pesticide Manufacturing Plants
* COD 13,000 mg/A (range 0.4 - 73,000 mgfl)* Oil and grease 800 mgA ( range 1- 13,000 gA)* TSS 2,800 mgn ( range 4 - 43,000 mgA)
Sugar Manufacturing: Sugar manufacturing industry is highly seasonal, with seasonal lengths ofabout 20-32 weeks for sugar cane produce. Approximately 10% of sugar cane can be processed tocommercial sugar, using approximately 10 cubic meters of water per metric ton of cane processed.Typical manufacturing effluents of sugar manufacturing industry from sugar cane are summarized inBox A 4.11.4.
Box A 4.11.4 Waste Characteristics of Sugar Manufacturing Plants
* Waste water may contain pathogens from contaminated materials or production processesBOD 1700 - 6,600 mg/l in untreated effluent from cane processing
* COD 2,300 - 8,000 mgA* TSS up to 5000 mg/l< * Ammonium high
Textile Industr": Textile production involves a number of wet processes that may use solvents.Process wastewater is a major source of pollutants. 11 is typically alkaline and has a high BOD ( 700 -2000 mg/I), and high COD (2- 5 times the BOD). Wastewater also contains solids, oil and possiblytoxic organics, including phenols from dyeing and finishing and halogenated organics from processessuch as bleaching. Dye wastewater is frequently highly colored and may contain heavy metals suchas copper and chromium. Wool processing may release bacteria and other pathogens. Pesticidesare sometimes used for preservation of natural fibers, and these are transferred into wastewaterduring washing and scouring operations.
Vegetable Oil Processing: Wastewater is high in organic content, depending on the agriculturalproduce used to extract the oil and process operations. Typical wastewater characteristics arerepresented in Box A 4.11.5. Seed dressing and edible fat and oil processing generateapproximately 10 - 25 cubic meters of wastewater per metric ton of product. Most of the solid waste(0.7 to 0.8 t/t of raw matenal) of vegetable origin can be processed into byproducts or used as fuel.
Box A 4.11 .S. Typical wastewater characteristics ofVegetable Oil Processing
* BOD 20,000- 30,000 mg/* COD 30,000 - 60,000 mgI* Oil and fat residues 5,000- 10,000 mg/I* Dissolved solids 10,000 mg/i. Organic nitrogen 500- 800 mg/* Ash residues 4,000- 5,000 mg/I
Effluent discharge requirements: Guidelines for discharge requirements of effluents from selectedindustres are aimed to protect human health and environment. The World Bank Group financedindustrial projects must comply with pollution prevention and abatement measures acceptable to theBank Group. Some of the guidelines are summarized in Table A 4.11.2 and A4.11.3 (World Bank,1 998).
SEA: Final Report- Volume 2 April 30, 200014. 26

Table A4.11.1: Selected Industrial Effluent Data Monitored by State Pollution Control Board, Jalpur
S.No. Name of Industry Basin Location Type Scale E_ffluent Concentration Date of
pH TSS PB.O.D C.O.D Flurolde Oil & SamplingGrease
_____ ___________ ~~~~~ ~~~~ ~~~~ ~~~~ ~~~mgIl mgph mgph mph mg/i1 Final Outlet E.T.P. of M/s. Banas Bhilwara Textile Medium 6.87 81 - 2401 - 10 7.9.99_Bhilwara Processors Ltd.
21Binanal Cement Ltd. Binanal Luni Pall Cement Medium 7.08 36 20 88 1.11.99Gram
3 M/s. Dee pharma Ltd. Banas Bhilwara Pharmacutical Medium 6.51 87 156 9 27.9.994 M/s. Globus Agronics Ltd. Sabi Behror (Alwar) Alkhol Medium 6.95 315 2800 10640 - 10 4.10.995 M/s. Govinda Rubber ltd. Banas Whilwara Rubber Medium 7.08 152 112 - 8 27.8.996 M/s. Rajasthan State Outside Gangangar Sugar Major 6.74 364 280 832 - 23 30.7.99
Ganganagar Sugar Mills Ltd.7 M/s. Mahveer Dying Ltd. Luni Pall Dyeing Medium 8.9 684 - 386 - 16 1.10.9981Outlet of E.T.P. of M/s. Auto Banas Jalpur Auto Light Major 8.1 84 - 236 - 2.8 31.8.99
Light Industries Ltd. I9|M/s. Shri Ram Vinyl and Chambal Kota Chemical Major 7.6 52 - 35 - 4.8 3.8.99
Chemical Industries Ltd. .10 Final outlet of E.T.P. M/s. Banas Bhliwara Textile Medium 7.12 65 25 128 - 4 7.9.99
Ranjan Polysters andprocessers Ltd. I_I__ _
Source: SPCB, Jaipur, April. 2000
SEA: Final Report - Volume 2 Page April 30, 2000

Table A 4.11.2: Effluent Discharge Requirements: Parameters and maximum Values, Miscellaneous Parameters
Guideline pH BOD, COD TSS O&G Phenol CN N P F Cl Coliform Temp. Other; comments__ _ . _ _ .Increase
Dye manufacturing 6-9 30 150 50 10 0.5 Total organic (each) e.g.,- -- - _______ - - - ~~~~~~~~~~~~~~benzidine: 0.05; AOX: 1 mg/i
Industrial estates 6-9 50 250 50 10 0.5 s 30 C TSS: 20 mg/i where toxicmetals are present at significantlevels; sulfide: 1; AOX: 1:benzene: 0.05: benzo(a)pyrene: 0.05
Mixed fertilizer plants 6-9 50 NH4:10 5 20Nitrogenous fertilizer plants 6-9 50 N-H3:10 < 30 C
Urea: 1Pesticies formulation 6-9 150 20 10 TSS: 20, monthly average must
not exceed 50 mg/i at any time;AOX: 1; organo-chlorines: 0.05;phenoxy compounds: 0.05;active Ingredients (each): 0.05
Pesticides manufacturing 6-9 30 150 10 10 0.5 AOX: 1; active Ingredients(each): 0.05; BOD test to bedone only when no toxics to
_________________________ _ - _____ - - - ______ - _______ - - - ________ _______ m icroorganism s are presentPhosphate fertilizer plants 6-9 50 _ 5 20Sugar manufacturing 6-9 50 250 50 10 NH4:10 2 s 30 CTanning and leather finishing 6-9 50 250 50 10 NH4:10 2 400 MPNI Sulfide: 1
100 ml
Textiles industry 6-9 50 250 50 10 400 MPN/ < 30 C AOX: 8; pesticides (each): 0.05100 ml sulfide: 1
Vegetable oil processing 6-9 50 250 50 10T 10 = = =s 30 C* See column headed 'Other; comments"
Source: Pollution Prevention and Abatement Hand book, Wordd Bank (1999)
SEA: Final Report - Volume 2 April 30,2000Page 14.28Api3020

Table A 4.11.3: Effluent Discharge Requirements: Parameters and Maximum Values, Metals
Guideline Total Metals Other; commentsAg Al As Cd Cr f Cr Cu Fe Hg Ni Pb Sn Zn |
Dye manufacturing __ _ 0.1 _ 0.5 2 2Fruit and vegetable processing 0.5 0.1 0.1 0.1 0.5 3.5 0.01 0.5 0.1 2 10 Se:0.1general manufacturing - - - -
Industrial estates 0.1 0.1 0.5 0.5 0.5 0.1 2Mixed fertilizer plants 0.1 o_ 1Pesticies formulation 0.1- 0.1 0.5 0.01Pesticides manufacturlng - 0.1 0.1 0.5 0.01 -
Phosphate fertilizer plants 0.1 -
Sugar manufacturing - -
Tanning and leather finishing - 0.5 -.
Textiles Industry =_=_= 0.5 - 0.5 2 Co:0.5Vegetable oil processing -.-
-_
Source: Pollution Prevention and Abatement Hand book, World Bank (1999)
SEA: Final Report - Volume 2 Page 14.29 April 30, 2000

ANNEXURE 4.12
ON THE LONGTERM ESTIMATES OFGROUNDWATER POTENTIAL IN RAJASTHAN
A4.12.1 Preamble: The SWP assessment of groundwater potential was based on dataobtained from the GWD for the years 1988-82, which were the years of low rain fall.The data were gathered for area units called Potential Zones (PZ), or water bearingaquifers, which were delineated by the department along the administrativeboundaries of Blocks and according to geological formations within a Block.Because the delineation of PZ boundaries did not follow river basin boundaries, theSWP study adjusted the original data to (a) suit the river basin boundariesconsidered, and (b) to obtain reliable values of mean annual natural groundwaterreplenishment which could be employed in the long-term (to year 2045), waterbalance computations in the overall simulation modeling task. The two methods ofestimating gmundwater potential are reviewed, the GWD method and the SWPmethod.
A4.12.2 GWD Estimate: The seasonal water level fluctuation method (WLF) applied by theGWD, is based on PZ balances for the monsoon periods only, using the water levelsin some 6000 observation wells being measured twice a year, prior to and post-monsoon. This methodology is outlined by he Gmundwater Estimating Committee(GEC) of 1984. It focused on extraction and recharge.
The GWD updates extraction and recharge estimates regularly for all developmentalunits in the state. The 1998 update considered by the GWD provided estimates forCommand, non-command and saline areas. The stage of ground water developmenthas been computed by matching net irrigation draft plus domestic and industrial draftagainst gross ground water recharge. While categorizing zones and blocks inindividual district, long term water level trends of pre-monsoon (for the past fiveyears) have also been taken into account along-with the corresponding stage ofground water development.
The 1998 annual ground water recharge has been computed as approximately12,600 Mcm, irrigation draft 11,035 Mcm and domestic and industrial draft 983Mcm. The over all stage of ground water development was estimated at 69%. Inall, 67 blocks in 17 districts are in critical and over-exploited categories. Majority oftnese blocks are in by 7 districts namely Alwar, Jaipur, Jalore, Jhunjhunu, Jodhpur,Nagaur and Sikar. Between 1995 to 1998, ground water draft has significantlyincreased (Table A4.12.1)
A4.12.3 Limitations of GEC Method: The following excerpts from ground water regulationand management report prepared by the World Bank (1998) in collaboration withCGWB and MoWR provide rationale for understanding the limitations of the GECmethod of estimating groundwater potential.
a) In India, the govemmental organizations at the central and state levels systematicallycollect groundwater data. This has produced considerable information anddocumentation. Data collection focuses on exploration, groundwater levelmonitoring, and determination of basic quality (in particular salinity). In general, moreattention is given to routine data processing than to scientific analysis. Although thissatisfies operational needs, scientific analysis is indispensable to understandinghydrologic systems and identifying management options.
SEA: Final Report- Volume 2 April 30, 200014. 30

b) Systems for collecting and analyzing data in national (CGWB), state (SGWOs), andpublic water supply organizations are similar, resulting in significant duplication asmentioned above (see Annex 4.13). Currently, groundwater data are mainly used toguide development. Uses include site determination, design of wells, and projectionsof groundwater development potential. Potential estimates generated through astandard groundwater estimation methodology are used to allocate subsidies andloans for new irrigation wells. This procedure enables limHed management by linkingdevelopment funds with the condition of the gmundwater resource. However,groundwater management is not yet a primary goal of efforts to collect and analyzegroundwater data.
c) The methodology of the GEC plays an important role in the estimation ofgroundwater potential. A brief description of this methodology is presented inAnnexure 4.14. This water balance methodology focuses on extraction and recharge.SGWOs update extraction and recharge estimates regularly for all developmentunits (blocks, taluks, mandals or watersheds) in the state. The methodolgy provides aclear framework for collecting and processing data and contributes to the continuityof nationwide and systematic data collection pmgrams. The estimates of averageannual recharge and gmundwater draft produced using the GEC methodology,although they are useful and enhance understanding of groundwater conditions,should not be used to calculate the level of development or to guide developmentfinances and abstraction regulation. Conceptual flows and limited accuracy castserious doubt on the suitability of the estimates for these purposes.
d) An important conceptual weakness is that the methodolgy treats development unitsas independent. Dynamic interactions between units, which especially in largeraquifer systems may be very important, are completely ignored. The method is staticin other respects as well: for example, it allocates a fixed percentage of the rechargeto unrecoverable losses and non-agricultural use without relation to real groundwaterconditions and water requirements (which are likely to change over time).Furthermore, it uses assumptions on the seasonal variation of grmundwater levelsrather than measures information.
e) A fundamental flaw in the methodology is the implicit objective of full development ofthe groundwater resources: that is, it assumes that the total recoverable recharge inindividual development units should be captured. The general validity of thisprinciple can be severely criticized. It neglects, again, the dynamics of groundwatersystems and completely ignores their interaction with environmental and socio-economic systems. Base flow depletion, saline water intrusion, and declines ingroundwater level may all reach unacceptable levels long before total recharge iscaptured. Furthermore, the amount of water required may in some areas besignificantly less than the amount of water available.
i) Based on analysis of computational instructions and assessment of the accuracy offield data, block level recharge and draft estimates have likely errors on the order of25 percent or greater. The estimated 'level of groundwater development' derivedfrom these estimates therefore has an even larger probable error, some 30 to 40percent (attempts to estimate 90 percent confidence intervals on extraction andrecharge at the block level indicate even larger potential errors; Moench 1991). The'level of groundwater development' as calculated by the GEC is therefore notsuitable as a single criterion for planning development or regulating abstraction.
g) New guidelines have been proposed amending GEC methodology. They includesignificant improvements: the bias toward agricultural groundwater use (irrigation)has been removed; the selection of watersheds as units for assessment in hard-rockareas mitigates the methodological flaw regarding groundwater dynamics;subdivision of units is proposed to reduce averaging effects; nonagricultural water isallocated according to needs; field work is recommended to determine specificvalues of relevant parameters; and, last but not the least, the long term trend inground water level has beer, adopted as a second indicator complementing slightlymodified estimates of the stage of groundwater development.
SEA: Final Report- Volume 2 April 30, 200014. 31

h) inspite of improvements, the proposed guidelines, while useful as a component in amore comprehensive approach, cannot be considered as a fully satisfactory basis forplanning groundwater development. A two stage approach is recommended forimprovements. The first stano- would be to score each development unit based on aset of indicators. PmvisionD;v, the set might consist of 0) stage of groundwaterdevelopment; (ii) trends in groundwater level and quality: and (iii) evidence of aspecial problem or sensitivity (pollution risk, salt water intrusion) or a special interest(urban water supply well field, wetland nature reserve). Each of these indicators hasits shortcomings, but together they should provide a reliable indication ofmanagement needs. The second stage would focus on units with likely managementneeds. Detailed scientific studies accounting for the physical and socio-economiccontext and using numerical modeling tools should form the basis for planning andmanagement in these units. These detailed studies should evolve over time into full-fledged groundwater resource management studies.
i) Current data collection activfties are extremely limited in relation to these issues.Consequently, management faces an enormous data gap. In addition, there issubstantial duplication in data collection and analysis between organizations.Diversification of tasks and mandates would increase efficiency. ft would alsopmmote scientific analysis and enable responses to emerging issues.
j) Addressing the Data Gap: Data gaps cannot be eliminated rapidly. Priorities have tobe defined and the pmcess of narmwing the data gap started. Pertaps the mostcritical data gap is related to groundwater pollution. Pollution of groundwater isvirtually irreversible, and there is ample evidence that pollution poses a seriousthreat to all water table aquifers in India. Special monitoring networks need to beinstalled to monitor industrial, urban, and agricultural pollution systematically.Inventories and studies of pollution, including non-point sources such as agriculture,are also essential. The resulting information will reveal which pollutants areencroaching and thus how to target pollution control activities. Beyond pollution, dataare required on the dynamics of hydrologic systems. Key steps in this directioninclude:* Observations: Increasing the frequency of observation (monthly) of the
groundwater level, conducting time series analysis in the context of explanatoryvariables, and locating monitoring stations within groundwater systems wouldsubstantially imprve the understanding of groundwater regimes.
• Hydrochemical data processing: Numerous hydrochemical analysis have beencompleted but never used beyond general water quality evaluation. Availablehydrochemical data would allow much more to be done. Time series analysisand 3-D mapping of hydrochemical facies recommended. Mapping has provenelsewhere (for example, in the Netherlands) to be a powerful technique forunderstanding the interaction between groundwater and surface water.
* Computer based data processing and storage: Computer technology makes dataprocessing more efficient, enables detailed analysis, and improves access togroundwater information. Proper design of data bases is key. Datastandardization, quality checks, and interface with pmcessing and analysissoftware are fundamental consideration. Furthermore, systems should be flexibleto accommodate new types and functions of data.
* Basic research on the hard rock aquifers that underlie a large portion of India(MoWR, 1996): World wide, most groundwater models and analytical techniqueshave been developed for use in porous media such as sediments. Hard rockaquifers are dominated by flow through fractures and secondary porosity. Thisdifference has fundamental implications for development and management.Conducting more basic research is, therefore, important to ensure sufficientscientific understanding to meet management needs.
* Other priorities for data collection may v?rv from state to state. In general, it isimportant to define procedures for pro essing and analyzing simultaneously.Otherwise, the data might end up in data graveyards and fail to contribute to themanagement of groundwater resources.
SEA Final Report- Volume 2 April 30, 200014. 32

A4.12.4 Impacts of Groundwater Management based on the GEC Methodology:Annexure 4.15 includes a summary on the present status of groundwaterdevelopment based on the GEC methodology adopted by the GWD. In view of theseveral gaps, the existing data do not adequately represent the current status ofexploration.
A4.12.5 Long term water level fluctuation method (LTWLF): This is a modification of theWLF procedure adopted in the SWP computations, following aquifer operating rules,and order of priorities for the various demands. The following seven order ofpriorities adopted in the SWP which were in line with the National Water Policy:* Domestic* Livestock* Export* Existing industries and power stations* Irrigation* Proposed industries and power stations* Artificial recharge
The following aquifer operating rules were included in the SWP. Supply to the lowerpriority customers is curtailed when the storage level in the aquifer falls below apredetermined 'red line' (policy level). Higher priority customer can go on beingsupplied in such cases as long as there is water left in the aquifer between the policylevel and the predetermined absolute minimum level. The storage levels defined foreach Balance Unit as the policy level and the absolute minimum and maximum, aretaken from the results of the groundwater assessment.
A4.12.6 SWP Results: Table A4.12.3 presents SWP summary of State Water balance for a50% dependable climatic state in long term planning stage 2045. On the whole,considerable amounts of groundwater utilization in excess of natural replenishment isstated to be possible depending upon the extent of return flows from irrigated areas,urban and other water utilization sectors when added to the groundwater storage.
A4.12.7 Summary: A major concem on the state- wide groundwater draft estimate, is thewide disparity in the long term natural replishment estimate. The SWP estimated theannual natural replenishment as 7400 Mm3 which in essence will be the long termsafe yield of groundwater resources of the state. The present GWD estimated draft is12000 Mm3 which is far in excess of the above safe-yield values. On the basis ofsuch wide disparity of estimates, integrated water resources planning using surfaceand groundwater resources requires immediate reconciliation. Recommendedfollow-up work is also discussed in Annexure 4.15.
SEA: Final Report- Volume 2 April 30, 200014. 33

Table A 4.12.1: Groundwater Draft 1995 & 1998
S.No. I Component January 1995 January 19981 IGross Recharge 13157 12602211mgation Draft 9084 110353|Domestic Draft 696 983
ICategodsation of Blocks (Nos.)1 ISafe 127 1352 Semi critical 35 343 Crtcal 14 264 Over-exploited 60 41
Source: Ground Water Department, GOR, 1999, Ground WaterResources of Rajasthan (Imgation Potential) as on January 1, 1998.
SEA: Final Reoort - Volume 2 April 30,2000Page 14.34

Page 1 of 2Table A 4.12.2: BasIn Wise Ground Water Recharge, Extraction A Stage of Ground Water Development In Command
& Non-Command Areas of State of Rajasthan as on 1.1.98
Block Potential Annual Gross Annual G.W. Annual G.W. Annual Gross Net Annual Present Stage of G.W. Water Req. BalanceZone Area Recharge Draft for Draft For Draft Ground Water Ground Water Development for Dom. & Future Water
Irrigatlon Domestic & Draft For All Balance As Ind. As on Req. for Dom.Industrial use Uses on 1.1.98 Year 2025 & Ind. Use
(Sq. Km.) (mcml (mcm) (mcml (mcml (mcml (mcml % (mcm) (mcml
Total 41,089.781 2.799.081 2,442.331 240.211 2.682.541 1,949.841 849.241 69.661 663.051 422.83Non Command Total 38.268.68 2 459.39 2,247.87 219.01 2 466.88 1 792.521 666.87 72.88 602.89 383.87Command Total 2,821.10 339.69 194.46 21.20 215.66 157.321 182.37 46.31 60.161 38.96Banganga BasinTotal 3. 63.61 830.761 40.841 871.601 622.371 14.301 97.781 128.831 8.99Non Command Total 3,442.36 4981 830.765 40.847 871.60 622.37 11.357 972.2 68.47 87.90Command Total 0.240 0.001 0.00 0.001 0.001 1 0.020 0.002 0.04
Chunba Basin
Totat 274689.891 2.63.021 1,265.001 770511 1,342.513 963.011 1.1726.0 3.551 317.283 239.79Non Command Total 223632.451 144.3431| 79024 104. 189241.241 887.124 593.20 591931 258.301 195.4Command Total 5057.441 115.691 64.601 16.671 101.271 75.891 1078.801 f.f571 60.981 44.31
Gamhir Basin
Total 3. 1 687.061 454.921 414.031 31.281 445.311 321.10 1.871 70.581 73.701 42.42Non CommandTotal 5 .0 79.631 325.1 25.471 421.00. 303.241 116.571 72.231 68.471 40.09Comimand Total 22.71 25. 0I 21.501 2.811 24.311 17.861 17.251 50.871 5.231 2.4
Total Bsn1 24,55.9 194341 1,806.481 '105.901 1.912.371 1,370.431 -17ff.081 114.741 222.831 116.93
Non Command Total 2| 9 4s l sCo 021 1 0421 17 89451 1,3157431 -21t3.091 11i2 21-5 114- T256Total 1 20221 907-701 335.881 30.721 360.601 265.031 701.871 27.471 111.00| 80.28
Commnand Totgl 2.525.191 2058.0731 2490.71 25 651 342E0.321 234.1721 223.9251 13.3221 228 991 167 .34Other Nallsh of JaloreTotal 1 749.511 92.941 239.421 6.711 246.131 174.301 -81.361 187.541 16.751 10.05Non Command Total 1,749.511 92.941 239.421 6.711 246.131 174.301 -81.31 187.541 16.751 1005Command Tota 0.00 0.00 0.00° 0.00 0.00° 0 0.00° I 0.00 0.00Outside BasinTotal I 75304.481 2078.121 1.570.231 313.611 1.883.851 1.412.781 617.901 67.981 647.571 333.95Non Command Total 1 272 8 11 2.0 09 1 177.721 85.271 630.961 323.99Comnmand Total 327.0 66.0 290.631 6.641 297.281 210.09i 440.181 31.471 18.61 9.9
Toaral 1,8R70.331 181.421 15.6 1166.261 121.971 59.451 67.231 21.60199Non command Total 1,743.931 1603.321 1147.041 10.131 157.171 113.061 50.261 69.231 14.98148Command Total 12.401 18.10 10.601 1.491 12.09 8.91 9.191 49.221 6.621 5.1
Source: Grouncdwater Department (updale) February and April, 2000
SEA: Final Report - Volume 2 Aprl 30 2000Page 14.35 Arl3,20

Sheet 2 of 2Table A 4.12.2: Basin Wise Ground Water Recharge, Extraction & Stage of Ground Water Development In Command
& Non-Command Areas of State of Rajasthan as on 1.1.98
Blockz tPotentlai Annual Gross Annual G.W. Annual G.W. Annual Gross Net Annual Present Stage of G.W. Water Req. BalanceZone Area Recharge Draft for Draft For Draft Ground Water Ground Water Development for Dom. & Future Water
Irrigation Domestic & Draft For All Balance As Ind. As on Req. for Dom.Industrial use Uses on 1.1.98 Year 2025 & Ind. Use
(Sq. Km.) Imcm) (mcm) (mcm Imcm) Imcm) Imcm) % (mcm) (mcm)Ruparall Basin
Total I 2.942.31 464.84 352.311 20.231 372.541 266.871 197.9i1 57.41I 105.53 85.30Non Command Tolal 1 2,942 31 464.84 352.31 20.23 372 54 266 871 197.971 57.41 105.53 85.30Command Total 0.00 0.00 0 00 0 00 0 00 0 001 0 00 0.001 0.00Sabarmatl BasinTotal I 2,156.57 132.54 48.131 4.61 52.741 38.30 94.241 28.90 19.56 14.96Non Command Total 2,156.57i 132.541 48.131 4.611 52.741 38.30 94.24 28.901 19.561 14.96Command Total 0.001 0.001 0.001 0.00 0.001 0.00 0.00I 0.001 0.00Sabl BasInTotal 1 3901.831 472.091 594.711 21.201 615.921 437.501 -9.421 102.201 64.481 43.28Non Command Total I 3901.831 472.091 594.71 21.201 615.921 437.501 -9.421 102.20 64.48 43.28Command Total I 0.001 0.00o 0.00o 0.00o 0.00o 0.00o 0.00 0.00o 0.00Shekhawatl BasinTotal 1 9,494.781 533.611 869.301 74.731 944.031 683.241 -194.841 128.041 172.921 98.19Non Command Total | 9.494.781 533.611 869.301 74.731 944.031 683.241 -194.641 128.041 172.921 98.19Command Total 0.001 0.00o 0.001 0.00 0.00 0.001 0.00 0.001 0.00Sukil BasinTotal 867.201 43.921 49.181 0 861 50.041 35.291 8.641 80.341 2.071 1.21Non Comrnand Total 867.201 43.921 49.181 0.861 50.041 35.291 8.641 80.341 2.071 1.21Command Total 0.001 0.001 0.001 000 00 0.001 0.001 0.001 0.00West Banas BasinTotal 1,186.741 66.621 60.411 3.371 63.781 45.651 20.971 68.531 8.771 5.41Non Command Total 1,186.741 66.621 60.411 3.371 63.781 45 651 20.971 68.531 8.771 5.41Command Tolal I 0.001 0.001 0.0 0.001 0.001 0.00° 0.001 0.001 0.00
Grand Total 215,141.941 12753.021 11035811 983.401 12019.221 8708.48 3,908.901 68.281 2,575.941 1 592.55Non Command 0and0542611 10.56 10377.11 927.311 11 304.421 8,191.291 1,920.151 80.07 2,399.04 1,471.75Command Grand Total I 14,599.331 2,523.26 658.70 56.091 714.801 517.191 1 988.751 20.50 176.901 120.80
Note: Refer to Table A4.12.1 for groundwater draft comparson between 1995 and 1998
Source: Groundwater Department (update) February and April, 2000
SEA: Final Report - Volume 2 AprIl 30, 2000Page 14.36

Table A 4.12.3: SWP Summary State Water Balance for a 50% Dependable Climatic State In Planning Stage 2045, Mm3lyr
River Basin Surface Water,Mm3/yr Ground Water,Mm3/yr Imported Water, Utillsatlon of Water,Mm3/yrmean annual,
Available In Utlised Unutillsed Natural Total Mm31yr IrrigatIon, Others* Totalthe Basin Re lenishment, Utillsed
(') (2) P (3) (4) (5) (6) (7) ()(9)1 Shekhawati 160 93 56' 334 265 38 320 3582 Ruparall 196 78 22') 151 218 50 246 2963 Banganga 494 4894 67 557 1.047 245(i) 1,187 594 1.7814 Gambhir 567 5265 197 308 534 899 161 1,0605 Parbati 176 175 44 161 272 395 52 4476 Sabi 230 119 55 144 229 185 163 3487 Banas 4,497 3,3556 0(625)' 1.315 2,842 3,905 2,292 6.1978 Chambal 11.359 5.916 4,85093 707 2,408 6.037 2,287 8,3249 Mahl 3,019 1,172 0(1621)10 896 729 1.257 644 1.90110 Sabarmati 830 1329 0(471) 58 127 181 78 25911 Luni 831 4,239111 369 906 1,230 655(H1) 5.519 605 6.12412 West Banas 410 164 0(134)°0 46 135 196 103 29913 Sukil 117 45 0(42) 48 66 98 13 11114 Other Nallahs 46 3491 0(32)10) 52 86 92(ii) 502 25 527
Subtotal 22.932 16.852 5.683 10.1B8 992 20.449 7,583 28,032151 Outside Basin 452 2013) 1,730 652' 966(i) 13,076(1il) 11.69014 3,024 14,7144)
ITot a I 23.384 16,872 5,660 7.413 10.840T) 15,034 325139" 10,607 42.7461'
Note: Normalized Natural Replenishment Is estimated at 5.698 Mm which is essentially the cumulative safe yield of groundwater In the state.
Source: TAHAL, State Water Resources Planning, Summary. 1998.
SEA: Final Report - Volume 2 Page 1.37 April 30. 2000

ANNEXURE 4.13
GROUNDWATER DATA COLLECTION, PROCESSING AND ANALYSISIN WORLD BANK (1998)
INDIA- WATER RESOURCES MANAGEMENT SECTOR REVIEWGROUNDWATER MANAGEMENT REPORT
A4.13.1 Interviews were conducted in October 1996 with officiais of national and stategroundwater related organizations in Haryana, Uttar Pradesh, Tamil Nadu and Gujrat.One of the main objectives of these interviews was to get an impression of state-widegroundwater data collection activities and practices. The organizations visited for thispurpose were: the Central Groundwater Board North- West India, the GroundwaterDirectorate of Haryana State Minor Irrigation and Tubewell Organiation, theGroundwater Cell of Haryana State Department of Agriculture, the Haryana State PublicHealth Department, the Haryana State Pollution Control Board, the Central GroundwaterBoard Northem India, the Uttar Pradesh Groundwater Department, JalNigam (UttarPradesh), the Central Groundwater Board Tamil Nadu, the Tamil Nadu Groundwater andSurface Water Data Centre, the Tamil Nadu Water Supply and Drainage Board, theTamil Nadu Pollution Control Board, the Central Groundwater Board West Central India,the Gujrat Water Resources Development Corporation, the Gujrat Water Supply andSewerage Board and the Gujrat Pollution Control Board. The state pollution controlboards were included to find out whether or not they would have any activities related togorundwater pollution.
A4.13.2 A summary of the main groundwater related field activities is presented in Tables A1.1through A1.8 (referred to in the above report). Only a few comments will be made here.First, there is a rather high degree of similarity of the gorundwater data collectionprograms, both if one compares between states and between the main groundwaterrelated organizations active in each of the states visited. Differences in performance,however, do exist for a variety of reasons. Second, there is a considerable overlap ofactivities, especially as regards state-wide monitoring of groundwater levels and ofgroundwater quality. In spite of differences that are present as well, there is obviouslyscope for reducing duplication and using the capacity thus made available for moredifferentiation in groundwater activities. Third, groundwater pollution monitoring iscompletely missing; the same is true for state-wide groundwater pollution surveys.Groundwater organizations are not yet equipped for the special requirements ofgroundwater pollution monitoring. Pollution Control Boards feel, however, thatgroundwater pollution monitoring is beyond their scope of activities.
A4.13.3 Similarities were also observed in data processing and analysis, and in the presentationand use of the information. Groundwater investigation activities in general reflectoperational information needs for groundwater development- and not yet those forgroundwater resources management. Production of maps and updating the classificationof blocks according to their 'level of development (see the GEC methodology inAnnexure A4.14) are important goals that will answer practical questions regarding localgroundwater development conditions. Lack of computer facilities results in only limiedprocessing and even less analysis of the data. The hydrochemical data would, inparticular, reveal much more if they were more thoroughly analyzed. Lttle attention isgiven to time series analysis, to links between ground and surface water systems and theenvironment, or to the variation of groundwater conditions with depth. Numericalsimulation models or other techniques that focus on the physical processes behindgroundwater quantity are not yet in common use at the organizations visited. Data arestill predominantly stored on paper.
SEA: Final Report- Volume 2 April 30, 200014. 38

A4.13.4 Obvious suggestions for improvement are: (i) reducing the duplication of activities; (ii)widening the range of variables to be monitored, in particular initiating state-widegroundwater pollution activities; (iii) enhancing processing, analysis and storage of thedata by introduction of computers; and, (iv) more attention to scientific analysis ofgroundwater quantfty and quality processes (e.g. by time series analysis, 3D mappingand model simulations).
SEA: Final Report- Volume 2 April 30, 200014. 39

Table A 4.13.1: Groundwater monitoring activities In Haryana
CGW-NWI GWD-HSMITC GWC-HSDoAGroundwater levelsnumber of sites 358 dug w. + 165 piezometers 1650 (50% are 'key wells') 1857 (mostly dug wells)frequency of observation 4/year 2/year (key wells: 1/month) 3/year (Jan-June-Oct) monthly data
for 108 wells aremarks mainly dug wells used few recorder-equipped wellsGroundwater qualitynumber of sites 358 dug w. + 165 piezometers 1650 (50% are 'key wells') unknown numberfrequency of observation 1/year (pre-monsoon) 2/year (pre- & post-monsoon) unknown frequencyremarks in gr. Water level monit. Wells in groundwater level monitoring wells 10000 water analyses targeted for
1996/97 (limited number ofparameters)
Groundwater abstractionnumber of sites None only DIT and ATW selected sitesfrequency of observation monthlyremarks annual draft recorded for determining unit draftGroundwater pollutionnumber of sites None None Nonefrequency of observatlon INotes: CGW-NWI: Central Groundwater Board, Reglon North-West India
DW-HSMTC: Groundwater Directorate of Haryana State Minor Irrigation and Tubewell CorporationWC-HSDoA: Groundwater Cell of Haryana State Department of Agriculture
Source: Groundwater Regulation and Management Report, World Bank (1998)
SEA: Final Report - Vol. 2 Page 14.40 April 30, 2000

Table A 4.13.2: Other systematic groundwater data acquisition activities In Haryana
CGW-NWI GWD-HSMITC GWC-HSDoARemote sensing on very limited scale no noResistivity surveying yes (4 or 5 sets) occaslonally, on request yes (8 sets)Exploratory drilling yes last 3 years no activity (no budget) noGeophysical well-logging yes (2 loggers - 600 m) yes (4 loggers) yes (1 logger)Chem. Analysis of groundwater yes (own laboratories) yes; in own laboratories yes; In own laboratories (10)Pumping tests:
step-testing In wells yes In all DIT and ATW yes (40-50'yr)aquifer testing In wells yes (computer-aided Interpretation) only In exploration boreholes yes (40-50/yr)Well counts no no annual village-wise censusUnit well draft surveys each year some 15% of total ad-hoe surveys yesOther field data acquisition activities some magnetometry network of 40 rain gauges
Notes: CGW-NWI: Central Groundwater Board, Region North-West IndiaDW-HSMTC: Groundwater Directorate of Haryana State Minor Irrigation and Tubewell CorporationWC-HSDoA: Groundwater Cell of Haryana State Department of Agriculture
Source: Groundwater Regulation and Management Report, World Bank (1998)
SEA: Final Report - Volume 2 Page 14.41 April 30, 2000

ANNEXURE 4.14
THE GROUNDWATER ESTIMATION METHODOLOGY OF THE GROUND WATERESTIMATION COMMITTEE (WORLD BANK, 1998)
A4.14.1 The groundwater estimation methodology outlined by the Groundwater EstimationCommittee (GEC) in 1984 is based on water balance concepts: groundwater draftestimates are compared to groundwater recharge estimates in order to judge whether theexisting draft in a development unit (block, taluk) is sustainable and to assess the scopefor additional groundwater development for irrigation. An important feature of themethodology is that neighboring development units are assumed to be hydraulicallyisolated from each other i.e. cross- boundary flows are considered to be non-existent.
A4.14.2 The methodology can be schematized to a number of consecutive steps, carried out foreach of the development units or areas (block, taluk) considered: (i) calculation of theaverage annual groundwater recharge; (ii) calculation of the potential recharge: (iii)calculation of the total groundwater resources for water table aquifers; (iv) calculation ofthe utilization resources for irrigation; and, (iv) calculation of the 'level of groundwaterdevelopment'. These are described in tum below.
A4.14.3 The recharge is thought to be composed of rainfall recharge and recharge from surfacewater sources (seepage from influent rivers, canals, tanks, ponds and lakes, andpercolating irrigation water). Two altemative methods are given for this step: (I) the so-called 'ad-hoc method' which uses empirical 'rainfall infiltration coefficients- to estimaterainfall recharge from rainfall figures and geological conditions; and, (ii) the 'water levelfluctuation method' which bases the groundwater recharge estimates primarily onobserved groundwater level rise during the monsoon period. The latter one isrecommended for (and only applicable to) the monsoon part of the year, whenever thereare sufficient data. Estimates of recharge from surface water sources are calculated inboth approaches by relying on assumed unit rates and on the surveyed extent of surfacewaler bodies and irrigated areas.
A4.14.4 This comprises the currently 'rejected' recharge from shallow table areas and therecharge by flooding of flood prone areas. The former one is assumed to be equal to theincrease in groundwater storage capacity if the water table would decline to 5m belowground surface. Estimates of the potential recharge in flood prone areas are based onassumed unit rates and on the surveyed extent of this type of area.
A4.14.5 This quantity is defined as the sum of the average annual recharge and the potentialrecharge.
A4.14.6 This is obtained after subtracting 15 percent from the total groundwater resources, toallow for non-agncultural water-uses, drinking and industrial and for irrecoverable losses.
A4.14.7 Assigning a value to this indicator is the ultimate aim of the methodology. It is calculatedby computing the ratio of net groundwater draft over utilisable resource and converting itto a percentage. A block (i.e. administrative jurisdiction within a district) wih adevelopment level under 65 percent classifies as a 'white' block, between 65 percent and85 percent it is a 'gray' block, and above 85 percent H is a 'dark' block.
A4.14.8 The methodology is described in full detail in the brochure titled Ground WaterEstimation Methodology' (GOI, 1984). Recent discussions on the methodology haveresulted in recommendations for 'new guidelines. Both the original methodology and theproposed new guidelines have been commented upon in the Base Report 'GroundwaterInformation for Groundwater Resources Management in India', prepared by GOI inDecember 1996 as part of the Water Resources Management Sector Review jointlyundertaken by the World Bank and the Govemment of India.
SEA: Final Report- Volume 2 April 30, 200014. 42

ANNEXURE 4.15
IMPACTS OF GROUNDWATER MANAGEMENT
A4.15.1 GENERAL
Groundwater is used for irrigation and non-irrigation purposes, domestic, live stock, and
industrial needs in all the river basins of the state for nearly 80 % of state's population.The basin-wise EMP preparation identified the dire need to concentrate on a holisticapproach to integrated management of surface and groundwater aimed at environmentalsustainability of the resources. Exploitation and management of either one of theresources will impact on the sustainability of the other. A major issue that is common in allthe EMP basins is proper identification of the present status of groundwater exploitationand management. Within this context, the reader is advised to refer to the main SEAreport ( Volume 2, Annex 4.12). It contains a complementary discussion on the gaps indata base and methodology for long term estimates of groundwater potential or the safeyield of the aquifer systems in various river basins. This section was prepared to highlightthe environmental impacts due to groundwater development changes in the near future,most importantly in the areas outside the present irrigation command areas.
A4.15.2 DATA BASE
The data base reviewed dunng the sectoral EA and the EMP preparation activities waspooled from various sources, including the updated estimates from the GWD in February2000. The review essentially reflected the existing concems and constraints in evaluatingenvironmental impacts of changes in groundwater development out side the commandareas, where groundwater plays a major roie for meeting the domestic, some industrial andirrigation demands of the area inhabitants.
The existing data do not adequately represent the current status of exploitation andmanagement of the precious resource, considering the cumulative effects of the industrial,domestic and agricultural interventions in respective river basins; and, the local andregional contamination aspects of aquifer systems.
The values and trends such as water table conditions, exploitation and contaminationlevels within the respective basins were adopted with best engineering judgement for theSEA study. Therefore, these values may not be appropnate for designing developmentworks ( both the RWRCP and planned projects) within and outside the respectivecommand areas.
A4.15.3 PRESENT STATUS OF GROUNDWATER DEVELOPMENT
A4.15.3.1 Chambal Basin
Groundwater table
The pre-monsoon 1998 water table in about 20 percent of the basin area was within 5 m,and in 60 percent of the basin area within 10 m below the ground level (bgl) (Map B5).Within the Chambal Command 1998 the pre-monsoon water table in about 105,000 ha wasobserved within 3 m bgl (Map B 5.1) These areas are waterlogged (upto 2 m WTD) orpotentially waterlogged and prone to high soil salinity. A few areas have experienceddecline in watertable dunng 1984-98 (Map B6) particularly in Dholpur, Bundi and Jhalawardistricts. Groundwater exFpoitation in the basin as a whole is in the safe category (Map 17),except Dholpur and Bundi in which the exploitation is in the semi-critical to critical stagesof development
SEA: Final Report- Volume 2 April 30, 200014. 43

* Groundwater quality
The ground water quality within the basin (1998) is generally suitable for irrigation exceptsome isolated patches (Map B8 and B8.1). Area having ground water unfit for drinkingcovers some 26 percent of the basin (Map 89). On the basis of analysis of more than 500ground water samples collected by GWD (1998), in about 90% of area groundwater issuitable for irrigation. The areas with high EC mostly occur in scattered and isolatedpatches in Sultanpur and Etawa blocks of Kota district, and Keshoraipatan of Bundi district(Map 88.1).
The aquifers of Chambal basin generally exhlbit a progressive change in quality of waterafter the on-set of monsoon. Both improvement and some deterioration in quality ofgroundwater were noticed during last five years. However, the water quaiity is well wihinthe permissible limits for irrigation. High values of nitrate in certain areas were observedpossibly due to fertilizer use and other sources of agricultural pollution.
A4.15.3.2 Outside Basin
* Groundwater table
Grounawater is found both under water table and deep semi-confined to confinedconditions, in almost all types of lithological units which form the aquifers in the OutsideBasin. The depth to groundwater is highly variable, ranging from less than a meter to about80m bgl. There are few pockets in which the groundwater is in excess of 120 m bgl (Map5). The regional groundwater flow is north-westward, westward, south-westward andsouthward, all ending in Pakistan except a narrow belt which heads towards the Runn ofKutch in the south. Water tables in the areas irrigated by the major projects and particularlyin the vicinity of canals, are much closer to the surface.
Wateriogging conditions are a threat to the sustainability of irrigated agriculture in manyparts of the outside basin: The average annual water table rise in the project areas are:IGNP, 0.2 to lm; Gang CCA, 0.23 to 0.53m; Bhakra CCA, 0.29-0.98m; and, aroundSuratgarh 1.6m.
It is significant to leam that while there has been a rise in water table in the irrigated CCA,in non-command areas, there is a continuous over exploitation occurring during the pastdecade or so. During 1984-98, the rise in water table in the north was in the order of about7m. while in the eastem parts of the outside basin there has been a decline in water tableupto 1 Om. The overdraft of groundwater development is observed in Jhunjhunu districtsand semi-critical to critical stages in several districts such as Barmer, Jodhpur, Nagaur,Sikar, Churu and Hanumangarh.
* Groundwater quality
Salinity is a serious problem in Barmer, Bikaner, Churu, Ganganagar, Hanumangath,Jodhpur and Nagaur districts. Major part of the basin has ground water salinity between 2.0and 8.0 dSlm. The concentration of fluoride in some areas of Barmer, Bikaner, Churu,Nagaur and Pali district is more than 1.5 ppm which is a hazard for drinking water.
A4.15.3.3 Mahi Basin
* Groundwater table
The pre-monsoon (1998) water table in the basin was 5 to 2Dm (Map D5) bgl except insome areas of Mahi command where the water table was within 5 m bgl. In post-monsoon,1998, watertable depth was within 3m in about 48,000 ha and within 5m in 83,000 ha inMahi command. The water table in several areas had declined up to 7m during the last 15
SEA: Final Report- Volume 2 April 30, 200014. 44

years (Map D6). In the southem half of the basin up to 3m rise in water level was observed.In general, groundwater development in the basin is within safe category exceptChittorgarh, which is in semi-critical stage.
Groundwater quality
The EC ranges from 0.5 to 1.0 dS/m except some places which have higher values of EC(Map D8). In 37 % area of the basin, the groundwater is unsuitable for drinking (Map D9).Fluoride problem is reported in parts of Dungarpur and Udaipur districts
A4.15.3.4 Banas Basin
* Groundwater table
The pre-monsoon 1998 water table in the basin was mostly 5 to 20 m bgl (Map E5). Inabout 3 percent of the area (142,000 ha), mostly in Ajmer district, the water table waswithin 5 m bgl (GWD, 1998). Changes in groundwater depth during 1984 - 1998 (Map ES)indicated watertable decline in Jaipur, Sawai Madhopur, Bhilwara and Chittorgarh districts.Jaipur is in the over exploitation stage of groundwater development (Map E7).
* Groundwater quality
The EC ranges from 0.5 to 1.5 (dSlm) except some places have EC 8-16 (Map E8 andE8.1). Groundwater in 49 % area of the basin is assessed by PHED as generally unsuitablefor drinking (Map E9). Fluoride problem exists in north-central part of the basin, particularlyGoner area in Jaipur district. Groundwater quality assessment in and around Sanganertown and Jaipur city is impacted by industrial pollution from 105 small scale, 25 mediumscale and 5 large scale textile industries. The SPCB (1997) indicated that the groundwaterquality deteriorated towards east, south east, and east of Sanganer area . Out of 73samples, the EC of 40% samples, was within 1 dS/m. Similarly groundwater quality inindustrial areas around Bhilwara and Udaipur monitored during 1996-98 showed higherthan normal concentrations permissible for drinking and even irrigation purposes.
A4.15.3.5 Group 5 Basin
* Groundwater table
Groundwater in Sabi basin usually occurs at fairly shallow depths, ranging from a fewmeters to 20 m. The water table depth is greater than 20m below ground level inShekhawati basin (Map F5). The groundwater is phreatic in most of the area, althoughsemi-confined conditions occur within the alluvial aquifer. In Shekhawati basin groundwateris available in alluvium and consolidated rock formation. Groundwater tables have beendeclining continuously in the past decade or so (Map F6). As well, the entire basin hasbeen experiencing overdraft or critical condition in groundwater development (Map F7).
* Groundwater quality
The quality of groundwater is good to brackish with salinity varying from 0.75 to 2.5 dS/m(Map F8a, F8b and F8.1). Groundwater in 70% of the basin is not suitable for drinking(Map F9a and F9b).
A4.15.3.6 Group 6 Basin
* Groundwater table
Groundwater mostly occurs in water table (phreatic) conditions in both unconsolidated andhard rocks. The water table depth varies upto 30m bgl (Map G5). During 1984 to 1998
SEA: Final Report- Volume 2 April 30, 200014. 45

there was a significant decline in water table almost in the entire Basin Group 6 (Map G6).As well, nearly all the westem half of the basin has experienced over exploitation and/orsemi-critical to critical stages of development (Map G7).
Groundwater quality
The quality of groundwater is highly variable, ranging from 1 to 8 dS/m (Map GBa to GBcand G8.1). The eastem plains have mostly saline groundwater. Parbati basin has goodquality groundwater. Groundwater is not suitable for drinking in about 55% area of Ruparailand Banganga basins, and in 15% area of Parbati Basin. In patches of Gambhir basin, thegroundwater is not fit for drinking (Map G9a to G9c).
A4.15.3.7 Luni Basin
* Groundwater table
Groundwater is found both underwater table conditions as well as under semi-confined toconfined conditions, in most geological formations in the area. The water table depth variesupto 20m bgl (Map 1-15). Groundwater depth during 1984 to 1998 (Map H6) indicates ageneral decline in water table in most part of the basin. Groundwater in Jalore, Jodhpurand Nagaur is over exploited, while the exploitation level in Pali, Rajasamand, Sirohi andAjmer districts is in semi-critical stages (Map H7).
* Groundwater quality
The quality of groundwater is highly variable ranging from 1 to 25 dS/m (Map H8 andH8.1). The chloride content is varying from less than 100 to 8000 ppm. About 80% ofgroundwater used for irrigation in the Basin is saline. Groundwater in 55% area is notsuitable for drinking (Map H9). The BOD levels (3.0-4.5 mg/I) in wells monitored by SPCBaround Pali indicated levels higher than permissible limits (2-3 mg/I). In case of DO, thelevels (1 -3 mg/I) were lower than the permissible limits (6-4 mg/I) for drinking water.
A4.15.3.8 Sabafnati Basin
* Groundwater table
Groundwater is found under water table (phreatic) conditions in alluvium and in theconsolidated rocks, semi-confined and confined conditions have been encountered. Thealluvial aquifer is limited. The water table depth is upto 10m bgl (Map K5). A generaldecline in water table was observed during 1984 and 1998 (Map K6). In general, theexploitation has been within the safe limits (Map K7).
* Groundwater quality
The quality of groundwater is good with salinity less than 1.0 dS/m (Map K8). Groundwaterin some parts of the basin is not suitable for drinking (Map K9).
A4.15.3.9 Group 9 Basin
* Groundwater table
The water table aquifer comprises of hard rocks and alluvium. Reported static water levelswithin these basins dunng pre-monsoon 1998, were in the range of 10 to 20 m (Map L5).Changes in water table levels during the period 1984 - 1998 indicate nse of water table insome portions in the Other Nallahs and declifne in other areas of all the three basins (MapL6). Groundwater is over exploited in Jalore district and in Sirohi the groundwaterdevelopment is in semi-critical stage (Map L7).
SEA: Final Report- Volume 2 April 30, 200014. 46

* Groundwater quality
Groundwater quality (1998) within the basins is generally suitable for irrigation except forsome isolated patches (Map LB). Groundwater in 60% area in West Banas, 79% area inSukli and 71% area in Other Nallahs is reported unsuitable for drinking by PHED (Map L9).
A4.15.4 BASIN-WISE IMPACT ASSESSMENT FOR GROUNDWATER DEVELOPMENTCHANGES
Impact assessment for groundwater development changes was undertaken for therespective EMP basins, and presented in Tables Ml to M 9 (Volume 3 of SEA report). Theassessment was based on:* several assumptions with respect to the existing conditions namely, the safe, semi
critical to critical, and over exploitation status;* projected groundwater development changes; and,* interdependency of groundwater development and management on the corresponding
changes in the surface water.
A4.15.5 RECOMMENDED FOLLOW UP WORK
Considering the existing gaps in data base and methodology in establishing the safe yieldof the groundwater basins to attain an environmentally sustainable water resourcesmanagement in Rajasthan, it is recommended to undertake, through competentconsultants, a full scale state-wide detailed study of groundwater resource managementto include:* a better definition of the present status of Hts use and management, for all beneficial
uses;* a thorough identification and evaluation of the dark, gray and white groundwater
potential zones:* an identification of the recharge areas to assess the contamination levels for the
present and future scenarios of development of the resource base;, and,* development of basin-wise integrated water resource utilization criteria for
environmentally sound and sustainable groundwater management, considering thequantity and qualiy dimensions of the resource, and both demand-side interventionsand conjunctive management techniques.
SEA: Final Report- Volume 2 April 30. 200014. 47

ANNEXURE 4.16
IMPACTS OF FERTILIZERS AND PESTICIDES ON WATER QUALITY
A4.16.1 Field Data: Database on water quality from agriculture runoff in the state is lacking.Limited monitoring was undertaken from 7700 ha of subsurface drained area in theRajasthan Agricultural Drainage Research Project during 1997-98. The nitrogen(NO3+NO2) concentration in the receiving drains were in the range of 3.03 mg/l in monsoonseason, and 3.01 mg/l in irrigation season. This gives a load of 1.8kg/ha and 82 kg/haduring monsoon and irrigation seasons respectively i.e. 10 kg/ha/yr. The averageapplication of nitrogeneous fertilizers in the command was about 138 kg/ha. The annualnitrogen loss from agriculture runoff is thus about 7 percent. The average rates of fertilizerapplication in other parts of the state are much below Chambal Command.
The water quality of Chambal river at Kota during 1996-97 and Banas river at Deoli durng1999 showed nitrogen (nitrate.nitrite) concentration in the range of 0.1-1.7 mg/I. The ortho-phosphate (PO4 ) concentration in the Banas river was 0.3 mgA. These levels ofconcentration and loading are considered low. Selected values for nitrogen loss in croppedarea in some of the countries are reported below (FAO, 1996):
Box A4.16.1: Selected Values for nutrient losses (FAO, 1996)
Location Land use Thosphorus Nitrogen(kg/halyr) kg/ha/yr)
Southem Ontario (Canada) Cropland Maize, potatoes, Cereals, 0.415 26.0beans
Great Lakes Basin Cropland 0.2 - 37.1(N America)
Hungary Cropland 1.142USA Cropland 64\ Cote dsivoire Agnculture 29.0 98
A4.16.2 Citing from Literature: FAO/ECE (1991) cited the following water quality impacts offertilizers:
A4.16.2.1 Impact of fertilizer application: Eutrophication of surface waters caused by excessivefertilizer leaching results in explosive growth of algae which causes disruptive changes tothe ecological equilibrium (including fish kill). This is true both for inland waters (ditch,river, lakes) and coastal waters.
In all countries, groundwater is an important source of drinking water. In several areasnitrate pollution in groundwater is excessive, to the extent that it is no longer fit to be usedas drinking water.
In some areas the problem is particularly associated with extensive and intensiveapplication of organic fertilizers (manures).
A4.16.2.2 The impact of oesticide applications: The impacts on water quality by pesticides isassociated with the following factors (FAO,1996):
* Active ingredient in the pesticide forrnulation.* Contaminants that exist as impurities in the active ingredients.
SEA: Final Report- Volume 2 April 30, 200014. 48

* Activities that are mixed with the active ingredients (wetting agents, diluents or solvents,extenders, adhesives, buffers, preservatives, and emulsifiers)
* Degradate that is formed during chemical, microbial, or photochemical degradation of theactive ingredients.
In addition to use of pesticides in agriculture, orchards and silviculture also make extensiveuse of pesticides.
A4.16.2.3 Experience in Pakistan (UNESCO, 1999S:
* Within the subsurface (tile) drainage project, the nitrate-nitrogen (Nitrate- N) in watersamples from hand pumps, tubewells, sumps and manholes varied from 0.03 tQ 3.3 mg/(well below the maximum pefmissible limit of 10 mg/I)
* Outside the tile drainage project boundaries, Nitrate-N concentration in water samplesvaried considerably from 0.11 to 12 mg/I.
* Analysis further revealed the nitrate pollution is associated with existence of coarsetextured patches contiguous to medium to fine textured soils; application of nitrophosfertilizer; and heavy irrigation even in heavy textured soils., N03-N accumulates in the topsurface of the ground water after it is leached down from the root zone.
SEA: Final Report- Volume 2 April 30, 200014. 49

-LE EW
alifafe In nim Dht. Hood OLuart.
150 law 2 0
150 - o lundarib
300- 460 | Sle t _
00- eoo
750 1 a
100& Ab e
PUNJAB
UTTAR PRADESH
GUJARAT - ~ ~ ~ RAES
GU~~~~~~~~~~~~~~~~~~o 50 TZooo1
to KMS
Map 4.1 . Average Annual Rainfall In RajasthanS eA: iolu e -(low6)
SEA: Final Report -Volume 2 Page 14.50 April 30. 2000

LEGEND River Basins
DISTRICT HEAD OUARTERS (I SIhwchaall
- - STATE, DISTMCT BOUNDARIES (2 Rupecil
- RiVER BA9N BOUNDARY (3 ) Bswng
IRRIGATION DEMAND ZONES BOUNDARY GambhIr
ACRO-CUMATIC ZONES BOUNDARY NDPA bat
AGRO-CLIMATiC ZONES Sabi
I-A ARID WESTERN PLAIN 1-i IRRIGATED NORTH WESTERN PLAiN Chambal
i -A TRANSITIONAL PLAIN OF INLAND DRAINAGE 9 Mohr
1-B TRANSITiONAL PLAIN OF ILUNI BA9N ( S_bwl
Yl-A SEMI -ARID EASTERN PLAIN _ LuriN;l-B FLOOD PRONE EASTERN PLAIN 1 WesIt oet
IV-A SUB-HUMD SOUTHERN PLAIN 13 S.kli
IV-9 HUMID SOJTHERN PLAIN _ OH -Ibch of Jodor Di4d
V HUMID SOUTHERN EASTERN PLAIN Th. 0,,de Bonin
OWARAT ~ X ~ HA0YANA
PAK!= r .TAN SEA: Final Report-Volume 2 Page 14.51 Apr11 30, 2000
e De~~~~~~~~~~~~~~' TRr PRADeSH
~~~~~~~~~~~I AsFFr >Z_ t,_) r ~~~~~~~~~~0 50 100
GUJARAT IO Ktt
U# ~~Map 4^2 .Rajasthan Agro-Climatic Zones & Irrigation Demand Zones
SEA: Finatl Report-Volume 2 Page 14.51 April 30, 2000

LEGND
Distrkct Head Quarters E)
Satote Boudo-ry
Phyiogrea#hc Rgonsq.
Has
*NIERDUNE DE5ER
DUNE AREA
ROCKY AND UNDULATIN DEERFt EUWLAO OEPRESWSOQS & FLAYAS
EASlERNI UPLANV D
EASTERN PLAIN
OUJARAT~~~~~~ PRAIMS1
HAD"
4e ;~~~~~~~~~~~~~F
P ~~~~~~~~MDHYP PRIADESH
~~~~~~~~~~~~0, SO IOD.GUJtART 6 10 KHS
Map 4.3 ' Physiographic Regons of Rajasthan
SEA: Final Report-Volume 2 Page 14.52 April 30, 2000

co
. ~~~~~~~~~~~~~~~~~~- '|- 2----------
0
< ~~~~~~~~~~~~~~~~t
0
41~~~~~~~~~~~~~~~~~~~~~~
LIno

LEGEND
Bdorsit) ute
Stote, Dhritok
Depth to water il. (vn.b.qJ.)
( 2<2 to
2to5 35totO JJtOto20
20to60 3> so mm
High Relkf Area PUNJAB
PAKMTA^ KMF
_ | o, 5~~~~~~~~0 ,zoo
Map 4.5 ' Ground Water Depth bi November, 1998SEom: CEinct Ground Meter 2e (ION)
SEA: Final Report -Volumne 2 Page 14.54 April 30. 2000

River BasinsLEGEND -_I Sh.Ichowatl
Cad9oy staop of _ 2 Ruparall3 Sa gm,g
Sof aC< 704 Ga_mbhhr
.;;Semi Crf1tic 70 - 90% SCbi~~aI _-- ~~~~~~~~~~~~~()SamOwniriln ~~> tOOX (7 Bow
______________________ B~~~~(78 Chamnbai
9 ) Mahi
We Sw,i
PUNJAB w The s ah D*asi
r .: < ..T.ARPHARYANA1~~~~..' ... . : ...
PAKISTAN / iAiER- U. :
D.-HY TAR PRADES H
[~ ~~~~a 4.X 6 a GrudWte xpiaRo,19
Souce OL V.ER (19
SEA' Fnal Reort -Volme 2 Pag 14.55AIl30.TO 2K 000,ii!7~~~ ...... '.. '1.'2'. J
,~~~~~~~~ .... .;Z Nlt>I it Bi! # ...... i bAL9, I-LAR 11 BUNI) r
w r~~~~. .-, :.:: .......... ....
<lJL >1 } _,§PRADRAE§H
GUJARA 1o KVS
Map 4.6 Ground Water Exlpoitation 1998
Jl_ee MND. 0itO (19W)
SEA: Finol Report-Volume 2 Page 14.55 April 30. 2000

LEGEND River Bcasins
trtt / .ct1no In (rn) EN4P Basins ShIh'woI
+3*0 b v The Outilde §9in I 3 0ntr
*~-~<wr:r 0 to +3 bi S two1I
O to -3 Shkhawett. SObt I 6 I Sdbt
_:Seretlt, t wo. GormtbWr, Poaba I M = _
-5 le - 7 Luanl 8 Chamba
'__-7'._-tO Wai Sun.,, Sa.un, Ch at[E I SoborrnWi ~ ~ ('I Meh
-10 W" Now-, sukAr. onwr wa12 WI S easfwf> - tO_ _ tain
OIw ; t naWrs of Jew District
PUNJAB STh Ouhuldo a.
f O' JARA'!- g HARYANA
PAKISTAN~
\8CpUFt^PPUtm- iADHYAPRADESH
-@--r O~~~~~~~~~~~~ so .00G I.~~~~~~~~0 KUS
WUm Map 4.7 a Change hi Ground Water Depth (Pro Monsoon 1984 & 1998jS,,e. CW). GM (to")
SEA: Final Report-Volume 2 Page 15.56 April 30. 2000

River BasinsLEGEND (I) Shokhow0ai
Ditrct d uarters RuporilBoundw'he 32 -uorl
Stoie, District. Baios _ -_ Gebir
fivw. Lake, kale C * -_ Paibali
flood Drains _a 6 Sabi
Ftooe Prone Area (73) gSW"
Note See Table 4.1 W ahl
(- Luau
O.w r olisti of Jor DW
Tlhe OCu. Basin
~~~~~Map 4.8 a Flood Prone Areas in Rajasthan
SEA: Final Report1-Volume 2 Paige 14.57 April 30, 2000

~~~~~~~~~~~I -
; A� o Asts n~~~~~tC,~~~~~~~~~~~~~~~~~~~~~~~C
I ' W 1 l',
C

LEGEND EMiP Basins River Basins
Oqtr,Ct Head .. r.ters I) iChmb Sh,,kh.-ONI
Boundaries: lirTh. Ousig Bauittn 2 Suwuil
Stote. District, Basin - G -one + _W_r
PwmbhlrPrki Intdustrioi lawns * i Sh.khowatl. Sabi Sbi
Wo hot epot lnintriol Locationr * D ituparOii, b a, Gmbhlr. Parball
Potentii hot spot
Industria LotoUnn, S oab.Oll SuB i- -*bl
_________________________________ Wsti Banat. SukLt. Othar NotOchos (9 Mhl
o *) Sobarmo*
4 Nhr Me.IaI of Jalor -i1P U tl J A B The OubiW Bain
4=A'
~~~~~~5~~~9
imi
GOARM~~~~~~~~~~~~~~~~~~~~~~'
S\m.. eCO /gmP
SEA: Final Report-Volumne 2 Page 14.59 April 30, 2000

LEGENDr River Basins
DiW H"ed Ourten Sb) hotrW@fl
:2) Rupoall
Sl. District. Ibrn _ t . eanO.mbhNr
Ex"ttng Sevage TreatWwnt Plant (tI) _5 P_rbttl
(North Zone Jalpur) _6) Sabi
_p Co te (I 6) for Sew er ... - m s
Ireatment Pianh under ADS (a) Chembal
Lam~
() 11w Our*te SaelOP U li J A B TS Odebb Imin
Map/4.11 * Municipal Waste / Sewage T Tent Plant
SEA Final H A R r Vm A
B U J A R A r i= ) d F P ~~~~~~~~~~~~~9 F 4Ds~~~~~~~~~~~~~~~~~~~~~~~~~~~~~~~~~~~~~~~~~A
< ttl Ki5~~~~~~~e
gmel Map 4 tt | Mundpal Westo / SewageTOM ten l t
Pl r4uted0n itbGOR(PB .AB
_ _ 0
SEA: Final Report-Volume 2 ~~~~~Pa ge1.0LpTA3,20

LEGEND River BasinsOstrict heod Ouarters h Sikhawafl
Boundorbe (2) Ruperall
State. District. Basin - - - 3-W
F.taii.r Consumption - Range (kg/noz) Poml
~~~~ 25 5 ~~~~~~~~~~~~~~~~~ Pwm ti
Upto 25 (~~~~~~~~~~~~~6) Sobi
25-50 (7) M. _
50-75 .B Chembol
75-100 tO ) Sobmoti
150-175 *I L tn i12 WestBo
h4ote- Range l1O to 1S0 - No Suk
Other Nollot of Jolor Dldrlel
tbe Outsid lbain
PSKISTAN at A uu V r
Vitil _wlctaltute ItaUsUcs (1997--P
S nl p V eP 4A 3,A PaADESH
GUAA O 0 K00
MaiEp 4.12 .Ann,ual FertilF,zer Consumption in Terms of Nutrients
during 199S7-98Sorc: Dsetertoi of Agicuture. RsioU"hn.Vltid 4r.cunuft StaUXtrUs (1907-Olt)
SEA: Final Report-Volume 2 Page 14.61 April 30, 2000

LEGEND River BasinsDistrlct Heod Ouorters (1) I Sh.4howali
i3aundoos ( Ruparol 03) iotngo
State. Distrit, Basin - - - Cvm ir
Range (T.C.U. usod kg/ho) 5 Parbatiup to 0.1 ( 6 Sebl
(7 Booms0.1 to 0.5 M8 Chambl
1.0 to 1.5 a ( hi
1.5 to 2.0 1 0 Seiboml
Not aow9e 12 Weot nes
13 SuEkNO"w Owwr ofib Jaw DWI I
PUINIWi Tim 'iutde ibsin
-,,,,,'. _. ........ . . _t
JUJA
. .. . . . . .. .. . . . ...
PAKW"ii -Y
0 50 1OO
IC KMS
Map 4.13 mAnnual consumption of plant protection measures (Pesticides)Cf ~~~ ~~ during 1997-98
SEA: Final Report -Volume 2 Page 14.62 April 30. 2000

LEGEND
District Neod Ouarters (3OounoorUs
State, District - _
Eircrtki Ccnducivty hn PPM X10
FLUOReE > 1.5 PPU
FLUORIDE > 3.0 PPt UFtlGH RELIEF AREA D
uuu~~ Map 4.14 ' Distribution of Electrical Conductivity and FluorideSoulrce: Centrl Groundt *j$*.r Bold* (3999 in Ground Water
SEA: Finol Report-Volume 2 Page 14.63 April 30. 2000
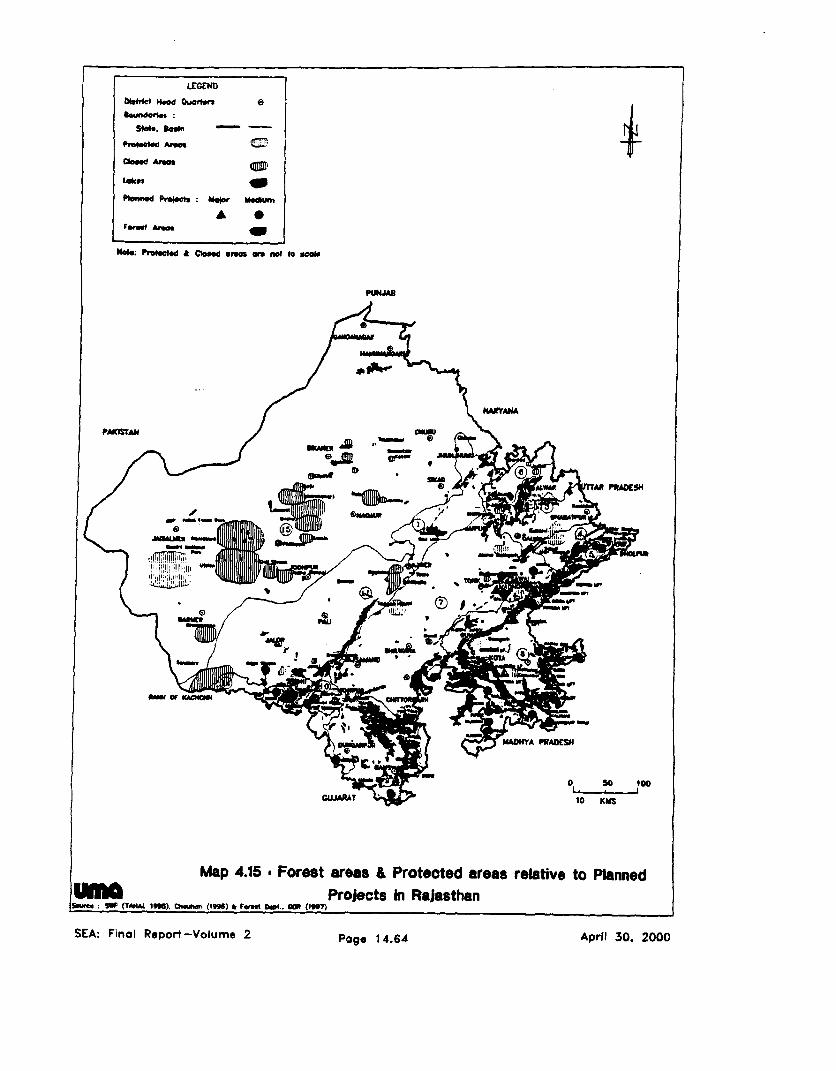
LEGED
b*rkc4 Hoed OuLis eoundaflea:.
.hWe. Sog - - o
pYemd Areaf
Planned WrOeW: urnr um
A *
Ma 4.1' Fret ara D Prtce areas reaietXlne
NO * ProjeAts in ' jo wta 4<,,m X FDHYAt^OESH~~~~PRDES
Map 4.15 *Forest areas & Protected areas relative to Planned
umx MAAL 1916). o~ (196) & F Dot.. GM (199 Projects in Rajasthan
SEA: Final Report-Volume 2 Poge 14.64 April 30. 2000

LEGEND EMP Basins River Basins
Desort E£coswtm _ Chombol SbhhowotiQj] Thi OutsId* Sasin (2 Ruoroll
A_ wolil Nils Ecosysbrm M &iahl _
Ea .so Pb n EB QanaA QOirbMirSh khawll. Sobi Pb ti
RBn. Eco"snm Ruporoa. Bngan.A , Gambhr. ParbO i6 SlW
ES Sai°rfl 7 F ChombelL w kBnos, SukMl. Ow Nallhos I i o
_ West soaa-Sukil
~14 Oter iIW .e 1t Jobor Dhur i¢c
PUNJAB T- e b W in
r ~~- S \| H-IARYANA
PAKIStAN / 8~~~~~~~iKANER ' CNiURU J
TTAR PRADES
ADHYA PRADESH
~~GJARSALMERV
U ~~~Map 4.16 * Dominant Ecosystems Base,d on BiodiversitySourc Cliouh.n (1i 3)
SJAODiHlRPURt-Voum .2 g 16
SEA: Finol Ropod -Volume 2 Poge 14.65 April 30, 2000~S(%

LEGEND
Sow _--a- P R
<Uh II
PUNJAB ~ ~ ~ ~ ~~C U
-AD-PS
mrnl Map 4.17 . Rajastharn Biodiversiy Heritage asnd Tourism Areals
SEA: Finat Report-Volume 2 Page 14.68 April 30, 2000

10 J.K. Udapur Udyog Ltd. \I1 Udaipur Phosphate & Feriliser Ltd. Khernil ;12 RIICO lnduaal Area13 Hundusan Zinc Ltd. %14 ncndlutan Ago ChemicalLts LL;15 Proposed Industal Ara17 Proposed Indus*l Ana18 Udyag Vihar, Sukher ,*
19 Mowers olming, Shnit Synthetic Ltd.,Mtex p or (doad) ( o ) VA ` A-.-#I
20 Marble and Mineral GrindingUnis . I
21 Marble and Mineral Grinding Unrts22 Pebarties Indi imra ted25 Stone Cruurer indusnes (Balecha) AI,A;,r26 Stone Cnwawer Induatns |__, U,mOt & 1
30 HZL. Zawr . A\
32 Hazardous Waste OLuirping Sites $5
If .,
as's
Map 4.18: Typical Industries in the Banas Basin (Udaipur Region)
Source: SPCB. Zoning Aftas for Siting of Industries Udaiptur & Rsaiaaand Disab1b, Aped. 2000.
SEAk- Final Report - Volume 2 Apr_ 30. 2000
Page ̀14.67

ANNEXURE 7.1
SUGGESTED FRAMEWORK FOR ASSESSMENT OF SOCIAL AND ECONOMIC COSTSOF ALTERNATIVE STRATEGIESIINVESTMENTS IN A PROJECT-SPECIFIC SETTING
Guidelines: World Bank Source Book Updates:Number 16, December 1996. Challenges of Managing the EA Process.Number 17, December 1996. Analysis of Altematives in EA.Number 18, July 1997. Health Aspects of EA.Number 23, April 1998. Economic Analysis and EA.
1. Identify sub-project developmentV management objectives2. Produce development proposals with costs3. Identify altemative technologies for the specific sub-project4. Define resource requirements for the specific sub-project5. Screen altemative technologies6. Identify and screen altemative locations, routes etc.7. Short list altematives8. Evaluate selected altematives in terms of:
* operational* mitigation* implementationX design configuration* Extemal environmental, health and social costs, or management plans as cost of overall
EMP9. Conduct overall economic analysis to reflect the effects of environmental costs and the rate of
return of altemativese Use direct monitory vaiuation for impacts that lend themselves to monitory evaluation,
following guidelines for converting physical impacts into monitory terms, as much aspractical: use the services of qualified and trained economist
* Use comparative assessment techniques for impacts that do not lend themselves to monitoryevaluation such as environmental health, social impacts, loss of bio-diversity, culturalheritage etc.
10. Conduct field work as required, in addition to site reconnaissance and review of existinginformation sources and available documentation
11. Continue public consultations to ensure that decision makers and stakeholders have confidencein the process
12. Comparatively assess altematives, based on output from evaluation: Justify chosen altemativefrom environmental perspective ( if a sub-optimal one is preferred), adopt transparent processand clearly describe the altemative
13. Proceed with preferred altemative
SEA: Final Report- Volume 2 April 30, 200014. 69

ANNEX 72: Basellns Survey data on Selected Environmental, Soclo-economic and Health Condlilons, 1999
Environmental Chambal Outside Basin Mahi Group 6 (Ruparatl.Paramelor eanganga. Ghambhir
a Parwati)
Bela | Ummed S9r | Manasgaon | 811as I Sameja Munsary Gogamerl Jalsammnd Kolar Jaggar_elar Umm I _ I I |Gambhlr basin)
1 PhvsicalI Demography 17.3 persons per 17 8 persons per 8 1 persons per le 7 persons per 17 persons per 18 persons per 87.persons per 18 persons per 15.7 persons per 7.7 persons per
____________ Ihousehold Ihousehold Ihousehold lhousehold _household ihousehold lhousehold ihousehold Ihousehdd ihousehold
48 Duality of life Increased per Increased per Improved; Present Improved; Present Increase In per capita Income end improved: Present Improved; Present per Improved; Present Increased per capita
capita Income; lfve capita Income Rs per capHa Income per capita Income improved quality of life; no schools; Ive per capita Income capita Income Rs. per capita Income Income. Rs. 11,680stock income 20- 16.500 per annum. Rs. 24,000 per Rs. 18,000 per stock Income 21 % Rs. 22,000 per 7840 per annum Rs.99() per annum per year; 75%30% annum annum annum contributed by
I I I 1~~~~~~~~~~~~~~~~~~~~~~~~~~~~~~~~~~~~~~~~~~~~~agriculture and live_ _ _ _ _ _ _ 1.1_ _ _ _ _ _ _ 1 _ _ _ _ _ _ _ _ _ _ _ _ _ _ _ _ _ _ _ _ _ _ _ _ _ _ _ _ _ ___ slock enterprises.5 CommunityHealth _ _ _ _ _ _ _ _ _ _ _ _ _ _ _
56 Diseases: rural Water bome No public health |Water bome No water bome Present Health 2. 1% short term Present health No water bome Sample size 340: No water bomediseases In the tall center In the area; diseases diseases.Present costs for 280 Inness, cost Rs conditions are diseases were 4.4% short term diseases reported;reach; 1.8% short skin diseases Iprevalent; 1.8% Health costs for people: 0.6% 200per person; 7% good; Sample size reported, although Illness, cost Rs 135term Niness Rs 75 prevalent shon term Nilness 400 people: I .7% short term Illness long term Illness, 457; 0-5% short guenea worm was per person; 2 4%per person; 4.5% Rs 50 per person; short term Illness Rs. 120t person; cost Rs term ilness, cost noted In humans; long term ilness.long term illness. 4 5% long term Rs. 13 person: 7% 3. 1% long term 700tperson; no Rs 230per person; Present health cost Rs 140/personRs 755 per person. illness, Rs 570 per long term Illness Illness Rs. public health 0.6% long term condilons are good;
person. Rs. 39tperson 1200/person; no center Illness, cost Rs Sample size 364; 1%public heaRh 550/person;. short term Illness, costcenter Re 68 per person; 3%
long termn iilness, costRe 2 10/person
Source: Escerpts and Interpretations from Chapter 3 of respective Baseline Survey project reports (IDS 2000). Information Is not available for other parameters.Note: Project reportS for other basins not avallable.
SEA: Final Repori - Volume 2 Page 14.70 April 30, 2000

Shieet 2 of 2
ANNEX 7.2: Basellne Survey data on Selocted Environmental. Socloeconomic and Health CondItilons. 1999
Environmental Parameter B anas Lunt
_ hyslcal |Kels Kundell | Bsss Banaklys I FbafSar |a r Mol an Hemawas Jawat Mlthart Gerola
1 Demography 18 persons per 8.1 persons per 5.6 persons per I5s9 persons per 7.1 ps per per I84 persons per 7 3 persons per 1 persons per 6.1 persons per 1-5 persons per_ |household ho otd household household householdhousehold household household household household
4 Soclo-Cultural _ _ _ _ _ _ _ _ _ _ _ _ _ _ _ _ _ _ _ _ __ _ _ _ _ _ _ _ _ _ _ _ __ _ _ _ __ _ _ _ _ _ _
48 Quality of lite Increased per Increased per Increased per Increased per Increased per Increased per capita Increased per lnfeased per capita Increased per capita Increased percapita Income. Rs capita Income, Rs capita Income, Rs capilta income, Rs. capita Income, Rs Income, Rs. 9800per capita income. Rs. Income, Income. Rs. 11.800 capita Income,12S50per year 90'9per year 11800per year 14300per year; 9500per year; year; 70% 19.9DOper year; Rs. tSOOOper year; per year; 81% Rs. t3.200 per year
89% contributed 85% contributed conlributed by 82% contributed 72% contributed by contribuled by ; 81% contributtedby agriculture and by agricullure and agricullure and live by agriculture and agriculture and live agriculture and live by agricultiure andlive stock live stock stock enterprises. live stock stock enterprises. stock enterprises. live stockenterprises, enterprises. enterprises, enterprises.
5 Community HealthSo Diseases: rural Waler borne Water borne Improvemenl in Water bome Water borne No waler bome One public health Water bome Water borne
diseases diseases nol health facilities; diseases not diseases emerged; diseases reported; center diseases emerged diseases notprevalent; sample reported; sample water borne reported; sample sample size 429; 2 sample size 468; 2.6 but not reported; reported; sample
size 479; 15 % size 366; t % short diseases exist; size 335; 1 % short % short term % short term illness sample size 368; size 452; 1. 3 %
short term illness term llness Rs 38 sample size 337; term Nlness Rs 26 illness; 3.5% long Rs 74 per person; 1.4 % short term short term Illness
Rs 68 per person; per person; 3.8% 1.2 % short term per person; 6% term llness 1.9% long lemn illness Rs 36 per Rs 45 per person;
7% lng term tng term iness. illness Rs 100 per long term ilness. illness, Rs 143 per personlyear no 3.3% long termiiiness, Rs 106 per Rs 335 per person 11 .6% Rs 490 per person/year long term Illness Illness Rs 225 pe
person/yeer. person/year, long term liness, personryeau. was reported personlyearRs 650 per
_ ~~~~~~~~~~~~~~~~~~~~persWyorr/narII
Source: Excerpts and Interpretations from Chapter 3 of respecltve Baseline Survey project reports lIDS 2000). Informalion is not available for other parameters.
Note: Project reporis for other basins not available.
SEA: Final Report - Volume 2 Page 14.71 AprH 30. 2000

ANNEXURE 9.1
CRITERIA FOR MINIMUM IN-STREAM ENVIRONMENTAL FLOWSFOR PERENNIAL RIVERS
Preamble: Criteria represent the characteristics of water that are necessary or desirable forspecific uses. Criteria are expressed in specific numerical forms and thus are more specificthan objectives. The latter are general aims and goals to be obtained usually within a fixedtime frame. A comparison of data on quality of water under consideration with establishedcriteria will indicate whether the water is suitable for the intended use and, if not, whatchanges in quality would be necessary to make K suitable. Criteria are different fromstandards or requirements which apply to definite rule, principle, or measure established byauthority, which makes it quite rigid, official, or quazi-legal. Receiving water quality criteriabased on use and stream classification set minimum stream requirements for the arbtraryclasses without attempting to dictate the treatment measures by which they should beachieved. The crieria can be used as guide in analyzing each problem as it arises andwithout set rigid standards because of the wide variations in natural stream or river conditionsin time and space.
Somewhat more detailed and forceful than criteria are water qualiy guidelines, whichindicate strong desire for achievement and compliance. Both criteria and guidelines are notrigid and do not have enforcement power, but they clearly express the ultimate desirablequality that should be achieved. In establishing criteria, consideration should include thefollowing:
* Not all streams are of the same quality before pollution began.* All beneficial uses of the stream, including waste disposal, should be taken into account.* Standards must be revised from time to time to meet changed needs* Based on the above rationale, the elements of criteria for minimum in-stream flows to
satisfy the receiving water quality criteria include the following ( MeGauhey, 1968 and,Thanh and Biswas, 1993).
- Establish what constitutes beneficial use.C Consider which uses of water intended to be protected by considering a) establishedwater use, planned future uses, and need for economical waste disposal; b) hold publichearings; and c) take action at a public meeting.
e Establish limits of chemical, physical, and biological characteristics beyond whichimpairment for beneficial use occurs.
* Consult authorities in the proper fields ( agriculture, water supply, recreation etc.)* Expect the criteria to have a reasonable margin of safety, to represent maximum
concentration of pollutants which may be achieved.
Continue checks on water quality and quantity in the stream, considering the assimilativecapacity of the stretch of the stream, for indications of unreasonable impairment, and to affectcareful checks on waste discharges and enforcement procedures.
SEA: Final Report- Volume 2 April 30, 200014. 72

ANNEXURE 10.1
TRAINING NEEDS ASSESSMENT
Purpose: The purpose of TNA for this study was:
* To assess the environmental management capability and training needs of GORpersonnel of Water Sector Departments.
* To review the on-going training programs in terms of their focus on environmentalmanagement.
* To suggest appropriate courses on environment management in water sector for GORpersonnel, NGOs, farmers and members of WUA.
Methodology:
* A check list (Annexure 10.2) on possible training needs related to environmentalplanning, monitoring and mitigation measures was prepared in consultation with selectedsenior GOR personnel of Water Sector Departments, review of the existing coursesorganised by IMTI as to the extent of environmental management aspects; and groupdiscussions with 90 GOR personnel from Irrigation and Agriculture Departments whowere attending training courses at IMTI. This check-list, was reviewed and finalised bythe SEA study team and incorporated into Training Need Assessment (TNA)Questionnaire. It was mailed to randomly selected 210 GOR personnel of Water sectorDepartments viz: ID, GWD, IGNPD, CAD, AD, PHED, WD & SC, SPCB and Forest inJune, 1999.
• Each respondent was requested to fill up the questionnaire and return through selfaddressed stamped envelope to the SEA project office. Responses received from theserespondents were tabulated and analysed in term of percent of respondents needingtraining in different aspects related to environment management in water sector.
Summary of Findings:
- The level of environmental awareness is average;Limited familiarity with existing Indian laws requirement for EA;
* Lack of experience or familiarity with multi-disciplinary approaches to planning fordevelopment;
4 Appreciation of concems of other agencies is limited with respect to: water quality andhealth related matters of water sector, ecological resource assessment; environmentalimpact analysis requirements; institutional and department's capabilities in respect ofenvironmental assessment.
* Substantial institutional strengthening and staff training at all levels are required.
SEA: Final Report - Volume 2 April 30, 2000Page 14.73
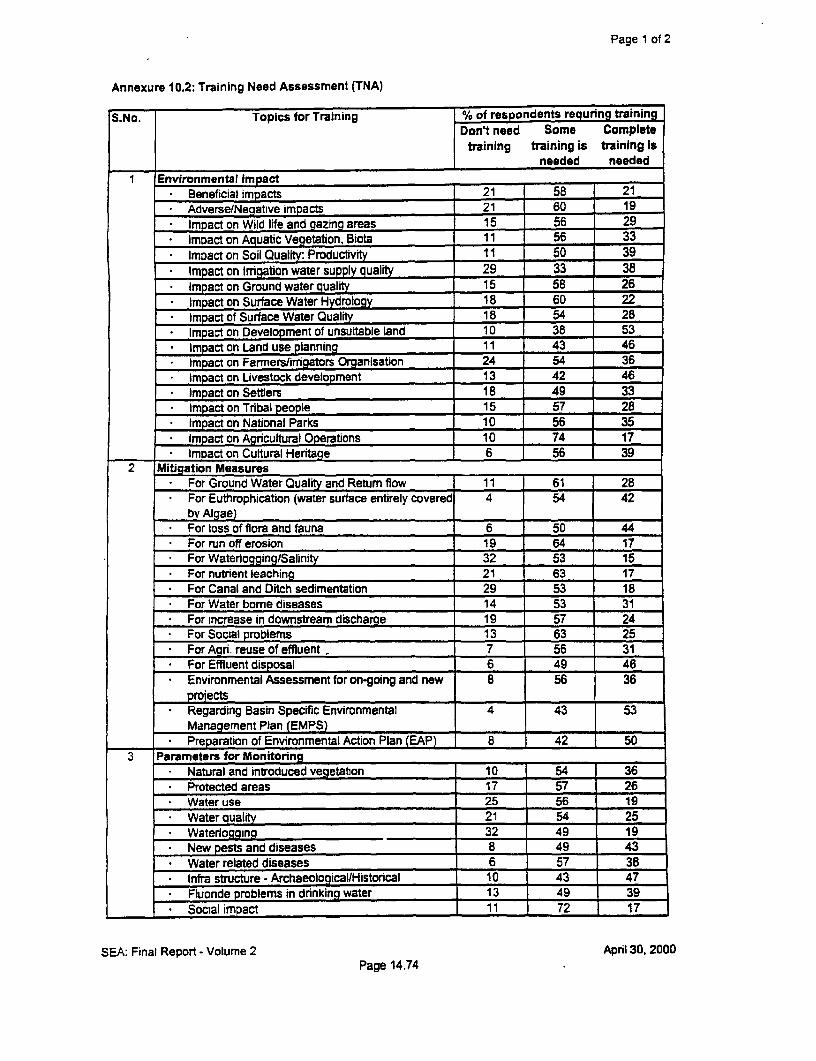
Page 1 of 2
Annexure 10.2: Training Need Assessment (TNA)
S.No. Topics tor Training % of respondents requring trainingDont need Some Complete
training training is training isneeded needed
I Environmental Impact* Beneficial impacts 21 58 21* Adverse/Negative impacts 21 60 19* Impact on Wild life and gazing areas 15 56 29* Impact on Aquatic Vegetabtion, Biota 11 56 33* Impact on Soil Quality: Productivity 11 50 39* Impact on irrigation water supply quality 29 33 38* Impact on Ground water quaiity 15 58 26* impact on Surface Water Hydrology 18 60 22* Impact of Surface Water Quality 18 54 28* Impact on Development of unsuitable land 10 38 53* Impact on Land use planning 11 43 46
Impact on Farmers/irrigators Organisation 24 54 36* Impact on Livestock development 13 42 46* Impact on Settlers 18 49 33* Impact on Tribal people 15 57 28
Impact an Natonal Parks 10 56 35* Impact on Agricultural Operations 10 74 17v Impact on Cultural Heritage 6 56 39
2 Mitigation Measures* For Ground Water Quality and Retum flow 11 61 28* For Euthrophication (water surface entirely covered 4 54 42
bv Algae)Fo lssoffor ad aua6 50 44
*For run off erosion 19 64 17* For Waterlogging/Salinity 32 53 15
*For nutnient leaching 21 63 17* For Canal and Ditch sedimentation 29 53 18* For Water bome diseases 14 53 31* For increase in downstream discharge 19 57 24* For Social problems 13 63 25* For Agri. reuse of effluent 7 56 31* For Effluent disposal 6 49 46* Environmental Assessment for on-going and new 8 56 36
projects* Regarding Basin Specific Environmental 4 43 53
Management Plan (EMPS)* Preparation of Environmental Action Plan (EAP) 5 42 50
3 Parameters for MonitoringNatural and introduced vegetation 10 54 36
* Protected areas 17 57 26* Water use 25 56 19* Water quality 21 54 25* Waterlogging 32 49 19* New pests and diseases 8 49 43* Water related diseases 6 57 38* Infra structure - ArchaeologicaVHistorical 10 43 47* Fluonde problems in drinking water 13 49 39* Social impact 1 1 72 17
SEA: Final Report - Volume 2 April30, 2000Page 14.74

Page 2 of 2
Annexure 10.2: Training Need Assessment (TNA)
S.No. Topics for Training % of respondents reguring trainingDon't need Some Complete
training training Is training Isneeded needed
* Growth of Aquatic weeds 8 64 28* Wild life bio-diversity 4 46 50* Livestock development 6 44 50* Traditional life style 10 57 33* Settler problems 14 1 57 29
4 Equipment related Need* Water measurement 21 54 25
EC meter 7 54 39*_pH meter 15 49 36* EM-38 Salinity meter 6 43 51* Photo-microscope 3 39 58* Aenal photo interpretation 3 46 51* Mobile hydraulic drill for augunng and coring 7 49 44* Water Testing Kit (CPCB) 3 44 53* Dissolved Oxygen (DO) 6 43 51
Rapid Soil Test Kit 8 39 53Gate Control equipment 19 44 36Chemistry kits 7 49 44
* Water level recorders 18 49 33Meteorological equipment 13 50 38
* Waste water treatment 14 53 33* Pre-treatment equipment 7 49* Sewers - small diameter gravityvpressurelvacuum 3 51 46* Water Pollution Control equipment 6 39 56* Air Pollution Control equipment 4 54 42
5 Environmental Legal Status:* Environmental issues 10 38 51* Legislations (Laws)
Central 6 46 49* State 6 47 47
* Regulations 21 39 40* Compliance of various legislations 8 44 47* Compliance of regulations 14 39 47* GOI Environmental standards
*Soil 7 50 43WAir 1 54 44
*WaterIDnnking 13 56 32
* Agnculture 7 61 32* Industnal use 4 60 36
Number of Respondents = 210Departments Consulted: ID, GWD; PHED; IGNPD; CAD; AD; SPCB; Forest Department;
Watershed Development & Soil Conservation Department
SEA: Final Report - Volume 2 April 30, 2000Page 14.75

Annexure 11.1: Water Quality Guidelines
._______ Water use clas belowCharacterstic Units A _ C D EpH -_ _ 6.5-8.5 6.5-8.5 6.5-8.5 6.0-8.5 6.0-8.5
D.O(min) mgl 6 5 4 4-
BOD (5 days, 20°C) mg/l 2 3 3- -
Total Colilofms (max) MPN/100 ml 50 500 5000- -
Colour Hazen Units 10 300 300- -
ODOUR ODOURiess Yes .Taste Tasteless Yes - = _ _
TOS ml 500- 1500- 2100
Total Hardness mgIl(CaCO3) 200 -
Lead mg_i_ 0.1 - .
Magnesium mo/l 1W -
Copper mg/i 1.5 - 1.5 -Iron mgij 0.5 - 50soManganese mgil 0.5 -Chlondes mgJ 250 - 600 - 600Fluorides mgll 1.5 1.5 1.5-Cynadies ml 0.05 0.05 0.05 -
Selenium mg-i . 0.05 Cadmium mo/l 0.01 o
Born mg/i . . . * 2Arsenic _ _2 2tPhenols m____ -gil _ _ 0.2Pheno=s mgli 0.005
ChromiLum mq/i -___ ____ 0.05 -Sulphates mgi- 400 - 1000Anionic Detergents mg/l _ 1 .Aipha Emitters uc/mi 10- 7
Beta Emitters iciml 1 _ _ _
Free Ammonia _gi 1.2 -
Eiectncai Conductivity (at 250C) dS 1.0 2.2
Free O _ mg/i - . 6 -Oils and Grease mg 11 0.1-SAR _. - _ . 25
Water use classesA. Drinking water source without conventional treatment but after disinfection.B. Outdoor bathing (organised)C. Drinking water source with conventional treatment followed by disinfectionD. Propagation of vwild life and fisheriesE. Irrigaton, industrial cooling and controlled waste disposal
Source Assessment of Water Quality in Rajasthan, RSCB, 1997
SEA: Final Report - Volume 2 April 30,2000Page 14.76

Annexure 11.2: lrrigability Classes of Water
Electric conductance of water micro ClassdSim, 25°C0.1 to 0.2 Ci0.2 to 0.8 C20.8 to 2.2 C32.2 to 5.0 C45.0 to 20.0 C5Sodium Adsorption Ratio (SAR) of waterLessthen 10 SiIO tol8 S2
Annexure 11.3: Water Quality Criteria for Classification of Groundwater
Water class ECiw (dS/m_ SARlm molesnl)112 RSC (meqil)Good__ c 2 s_ _ 10 c 2.5Marginally saline 2-4 s 10 c 2.5Saline , 4 s __ < 2.5HighSAR Saline > _4 = > 10 c 2.5___ ___ __ _ _alkali I _<4 1> 10 2.5-4.0Marginally alkali 11 1< = _ _ _4 _< 10 > 4.0
_ 1<4 -- > 10 >4.0
SEA: Final Report - Volume 2 April 30, 2000Page 14.77
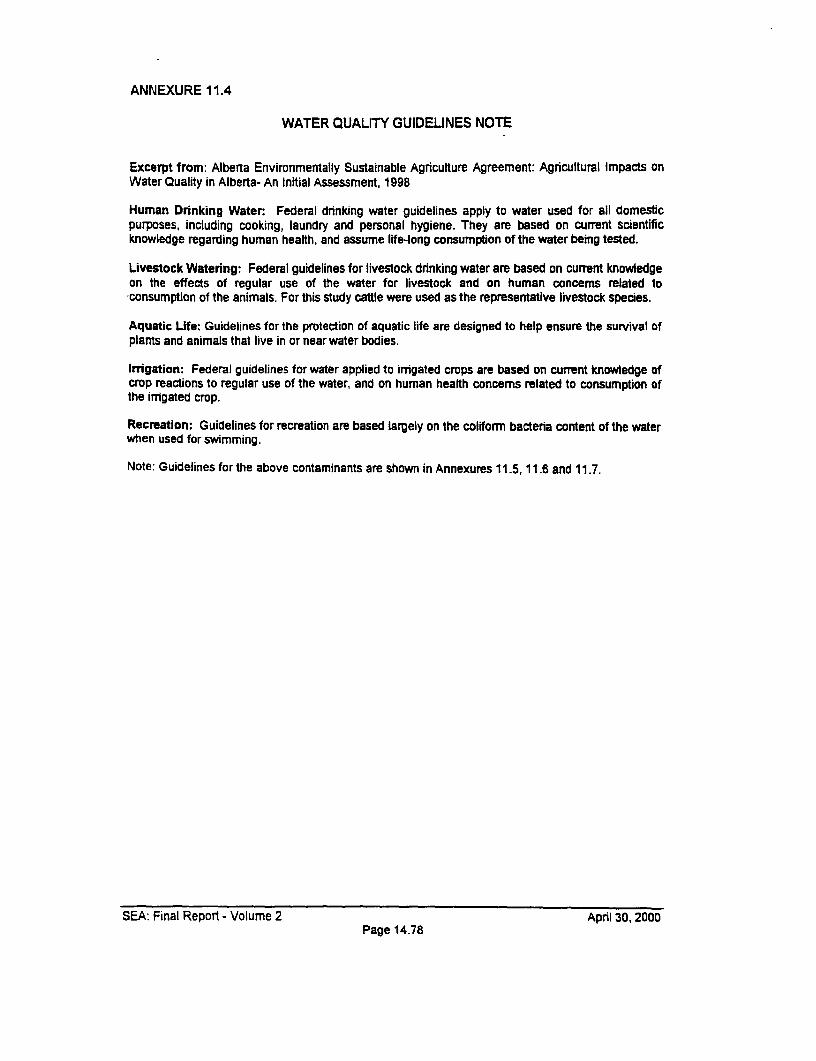
ANNEXURE 11.4
WATER QUALITY GUIDELINES NOTE
Excerpt from: Alberta Environmentally Sustainable Agriculture Agreement: Agricultural Impacts onWater Quality in Alberta- An Initial Assessment, 1998
Human Drinking Water: Federal drinking water guidelines apply to water used for all domesticpurposes, including cooking, laundry and personal hygiene. They are based on current scientificknowledge regarding human health, and assume life-long consumption of the water being tested.
Livestock Watering: Federal guidelines for livestock drinking water are based on current knowledgeon the effects of regular use of the water for livestock and on human concems related to,consumption of the animals. For this study cattle were used as the representative livestock species.
Aquatic Ufe: Guidelines for the protection of aquatic life are designed to help ensure the survival ofplants and animals that live in or near water bodies.
Irrigation: Federal guidelines for water applied to irrigated crops are based on current knowledge ofcrop reactions to regular use of the water, and on human health concrems related to consumption ofthe irrigated crop.
Recreation: Guidelines for recreation are based largely on the coliforrn bacteria content of the waterwhen used for swimming.
Note: Guidelines for the above contaminants are shown in Annexures 11.5, 11.6 and 11.7.
SEA: Final Report - Volume 2 April 30, 2000Page 14.78

Annexure 11.5: Water Quality Guidelines for Selected Nutrients
Nutnent Mar. Aceaptable Concentration - m ppmHuman Drinking | Auabc Life mqaton
TotBl Nrogen (TN) NIG NtG 1NJGTotal Phosphorus (TP) N/G N/G 0.05 N/GNitrate + Nitnt N03 + N02) 10 100 NWG 100Total Amoua (NH,) NIG NIG 1.13-1.18 NWGNitra t(N0,) 10 100 N/G NIG- temperature & pH dependent ppm = parts per milhon NtG = No GuidelimesNote: There are no recreation guidelines for nutnents
Annexur 11.6: Water Quality Guidelines for Siected Bacteria
_ BO Human Maximum Apoble Concentration I m counts per 100 rrd)Human Drnnkmg Livotcick Dllnrn Aquabc Life Irriaton Recebon
Fecal Coiforms 0 WG N/G 1W 400Total Enterococi NtG Nt NIG N/G 70E. Coli NtG N/G N/G 400
Annexure 11.7: Water Quality Guidelines for Selected Pesides
Pesticide(H Herbicide (I) Insecticide me Ampable C (MAC) - ipb
Human Dnnkmng Lvestock Dnniaing Aquatic Lie lAtrazne(H) 60 60 2 10Bromoxvni (H) 5 11 5 0.35Dcamba (H) 120 122 10 0.0062,4-D (H) 100 100 4 100Dic m (H 9 9 6.1 0.18MCPA(H) UR 25 2.6 0.03Lndane (i) 4 N/G 0.01 NWGTnalate (H) 230 230 0.24 NtGTrifluralin (H) 45 45 0.1 NtGEthalfiuralin (H) NIG NIG NtG NtGlmazarnemtabenz (H) NIG NWG _NG N/G|Picloran (H)0 190 190 29 NWGFenoxa - l H NIG NtG NtG WNGUR = Under Revww ppb = parts per billon Note: There are no recreabon guidelins for pestcdes
Note: The maximum allowable roncentrabons given in te above gdelines typically providWe protection factor of10 to 100 btres the identified safe brmits.
Source: Canada - Alberta Enviromntally Sustainable Agnculture Agreement Agnicultural inpacts on WaterQuality in Alberta - An Intial Assessment 1998
SEA:Final Repon - Volume 2 April 30. 2000Page 14.79

Annexure 11.8: Standard Maximum Residue level (NIRL) of different insecticides
SNo Insecticides MRL (Value in ppm)1 Malathion 32 Endosulfan 23 Phosphamidon 0.24 Carbofuran 0.25 Monocrotophos 0.26 Fenvalerate 17 Phorate 0.28 Methyl Parathion 0.29 Dichlorovos 0.2
10 Chlorpyriphos 0.211 Dimethoate 212 Quinalphos 0.213 B.H.C. 3
Source: Rajasthan Agriculture University, Bikaner
SEA: Final Report - Volume 2 April 30, 2000Page 14.80

Annexure 11 29 Exislting nd Proposed Monitorlng Program for Environmental Parameters for RWRCP and Planned Projects
S No tParameter Existing onitorng Proposei Addilional Monitoring Agency-______________________________ 8Locations Frequency Lo tons _ Frequene ResponsibleI Surftce Water Quality 46 sites by ID CWC. SPCB and CPCB Monthly 33 tes (Refer to Map 11 2) October a March In Chanffi river b Reler to details in
(Refer to Mapl 1) tribubaries Table11 I
August/Septenber In other riversAprrU.May in reservoirs A canals
________________ *Ouarlel In takes2 Ground Watef Quality 5414 tubewehs and hand pumps 2 limes in a year Pre _ Post Continuation of existig network 2 tOmoseI to year Pro s POstmonsoon monsoon
1336 National Hydrograph Network Annual (May) Annual (May)I _____________________________ Stations IH NS)
3 Ground Water Levets 5414 key wets and 1265 observation 2 hmes in ayear-Pre b Post_ _________________________________ wess monsoon __
4 Aquifer Pollutlon Jalpur (Sanganer). AJwar One time Major potential urban and nural Annual_ _________________________________ _________________________________ _________________________ areas, idustrial areas
5 Soil Anatysle Random locations upon famner Seasonal Soil chemical analysis indudinv Once In 5 yearsrequests nutnent status at 100 he Wrid
e Agritultural Runott Analysis jFefrtilzers Main drains l-annuali Pesticide Loadinal_
7 Ifrrgallon Systems ManagementCanal Discharge rimited canals Hourly at RMC A LMC Minor Seasonal
heads A at daily on branch Above minor ExstingCanal _ _ _ _ _ _ _ _ _ _ _ _ _ _ _ _ _ _ _ _ _
Seepage Losses Occastonal Miner SeasonatAbova minor_ _ _ _
nrrigation itenstry CCA _ Annua t CCA AntualObM CCA Al canals/mors. and dams
DOeweeding Annual rAnnualD oe-slum S years 3 yaew
8 Drainage System Maintenance AN major drainsdeweedig 2 years
_ _ _ de-slithnto 5 years9 Agricultural intensflealtion
Cropping Intensity Distridc-wise Irrigated b unirnigaled Annual*Crop yledFePrSiar, pesticide A herbicide use - Sales points AnnualquanftiftWAMi Chambal CAD Annual Al CCAs rAnnualOFD Chambal CAD Annual Al CCAs AnnualPressurized irriqaston Ditrlddrnumriber of sprinkler sets Annual AN CCAs AnnualSprinkler b drip set numbers b areatrrbalted _
10 Eco4ystemEmergence of new vegelabon Protected foresl area Annual Prolecred forest rea Annual
1i Water retated diseases Dishict-wilae Annual Di-wise AnnualMalariaGastroenlrihSAmoeblosisTyphid
12 ~VYxtr Supply * Eanitatlon Dishttrictdwise _ Annual * Dirlct-wirse _Mrutst 13 hndustrbteslltaunts Indi-bry wedlcdk . Iduslty specifi Industry specfc * AnMnl
SEA Final Repont -VOtun 2 AprR 30 20Page 14 atA,I 3*20

Annexure 13.1: Haryana Water Resources Ronsolidation Project
Components:A Physical Works i) rehabilitation and modenization of the existing canal, drainage systems, and
watercourses, replacement of the Hathnikund Barrage, and construction/ extension of minor canals; ii)upgradation of operation and maintenance of the water distribution and drainage system;
B. Institutional Strengthening to support administration, data collection, planning, design, research, training,beneficiary participation and formation of Water User Associations.
(These investments are financed under the areas of the Bhakra Canal and Westem Yamuna Canal System ofthe State.)
Environmental impactslissues as a result of major project-activities:* Rehabilitation of irrigation facilities: conservation and increased water use efficiency* Canalwater course lining water conservation, better distribution, public health benefit due to better supply* Drainage Programme: flood control benefits, reduction of waterlogging and soil salinity* Research/training: benefit water resource management, data collection etc* Hathnikund Barrage: economic benefits, minimal disruption of aquatic resources* A Category A- Sectoral EA completed for the project in August 1993 (before appraisal)
Social issues:* There are no R&R issues involving movement of families or communities. Land acquisition would be
limited to narrow strips for reaiigned canals* Benefits to people provided through increased and assured water supplies for irrigation, agnculture,
domestic and livestock related uses.
Key EMPs:* Notification of works to users/public relations Programme on water conservation* Replanting as appropriate. Monitoring of water quality impacts* Notification at command area level* Notification to downstream user groups
Environment covenants compliance. 'Carry out a socio economic baseline survey related to water resources use, management and service and
furnish findings to IDA'* Select tubewells for rehabilitation as per agreed critena* Select water courses for rehabilitation only after formation of Water Users Associabon (WUA) of the
beneficiaries
Social covenantsImplement a satisfactory land acquisition program'.
Source. L Paneer Selvam et al. 1999. The World Bank
SEA: Final Report - Volume 2 April 30, 2000Page 14. 82

< ~~~Annexure 13.2: Orissa Water Resources Consolidation Project
Cmponents:A Physical works. i) scheme completion, for on-going projects tor increase availability/reliability of water,ii) systems Improvement and farmer tumover, to improve productivity through rehabilitation/modemizationof selected existing irngation schemes, linked with increased farmer participation;B_ Institutional Strengthening: i) capacity building to introduce mufti-sectoral water planning, allocationand incorporation of environmental management in all aspects of water use, di) strengthening Onssa'sDepartment of Water Resources in technical and managerial areas;C. Technical assistance: i) research and agnculture intensification to foster research and technologytransfer in the water sector and improved agncultural practices;D. R&R for project affected persons and indigenous peoples development plan
Environmental impactslissues as a result ot major project activities:* SIFT projects i.e. rehabilitation, of imgation systems, better O&M: relieve 240,000 ha of imgated command
area, increase in crop yields.* Improved water management: reduce waterlogging, soil salinity, malana and water bome diseases* Schemes completions i.e. Naraj Barrage, Rengali and Mahanadi-Chatropala imgation: ensure flood
control, silt reduction, stabilize imgation systems,marginal loss of forest land* River basin multi-sectoral planning: optimum use of water resources, integrate flood control and drought
management* A sectoral EA prepared in October 1993 initially by snowy Mountains Engineenng Corporation (SMEC).
The report was revised after a review of the issues related to the implementation of the WRCP Program, inJune 1994
Social issues* Resettlement and rehabilitation is required on seven scheme completion sites.* About 1,799 ha of pnvate lands, 1,680 ha of government lands (pnmanily unused wastelands) and about
1,636 ha of forest lands need to be acquired.. About 76% of the land acquired would be due to canal/ drainage construction and 24% due to
submergencetreservoirs* About 2,596 persons would be displaced and about 31,207 persons would be affected* Orissa State resettlement and rehabilitatlon Policy' was issues in 1994* An IPDP has been prepared for six project sites. The total tribal population to benefit from the IPDP
component is close to 57,000 persons.
Key EMPs:* Environment Action Plan Priortizes: (There is no detailed EMP)* Fornmation of EA cells, training of EA staff in DOWR* State Water Policy emphasizes the implementation of an Environmental Management Plan. This
incorporates rehabilitation measures, afforestation, impacts on estuanne/coastal fishenes, salt intrusion,mitigat- vaterlogging effects
* Institut._ ;al strengthening i.e. creation of the Water Resource Boards to decide about water allocationamong water users
* Measurementimonitoring- all aspects of surface water hydrologylwater quality* Catchmeht management- watershed management to form part of environment. To control sediment inflow
into reservoirs
Environment covenants and compliance as of June 1997. No environmental covenants
Social covenants and compliance as of June 1997:* Carry out resettlement and rehabilitation in acordance with the R&R plan and in a manner and time
frame acceptable to IDA' Caout IPDP activities In a manner and time frame acceptable to the Association'
SEA: Final Report - Volume 2 April 30, 2000Page 14.83

< ~~Annexure 13.3: tamil Nadu Water Resources Consolidation Project
Components:A. Physical Works: (i) rehabilitation and modemization of the existing irrgation systems linked with farmer'sparticipation; (ii) scheme completion to complete viable investment on existing schemes for increasedavailability and reliability of water.B. Institutional strengthening (i) capacity building to incorporate environmental management in water planning,investment anci management; (ii) strengthen Tamil Nadus Water Resources Organisation.C. Technical Assistance to enhance research in the water sector.D. Land acquisition and economic rehabilitation for project affected persons.
Environmental impacts/ issues as a result of major project activities:* Rehabilitation, modemrization and scheme completion: mitigate against waterlogging, salinization,
depletion of ground water levels and disease nsks caused by sources of stagnant water.* Category A Sectorat EA was conducted by Public Works DepartmenVWRO and HR Wallingford
consultants (before appraisal).
Social issues:* Acquisition of 570 hectares of fanmed land involving about 1,460 project-affected persons, i.e., no village
residential sites are being relocated.* Needs for project-affected persons catered for, based on socio-economic surveys and Land Acquisition and
Economic RAP, undertaken by consultants and WRO with project-affected person participation for each ofthe scheme completion sites where LAER is involved.
Key EMPs:Environment Action Plan Priontizes: (There is no detailed EMP):* Set up Environment cells for state water planning, allocation and EA* Unit to regulate ground water usage.* Consolidation of water data coilection.* Establish code of practice incorporating environmental safeguards.* Studies in ground water use, soil conservation, catchment interlinkages, pesticides impacts, sedimentation,
waste water reuse, pollution and health hazards.
Social covenants:* 'Carry out the land acquisition and economic rehabilitation of the project as given under Sch.2, Part E of
Development Credit Agreement (DCA) in accordance with a plan agreed with IDA'.
SEA: Final Report - Volume 2 April 30, 2000Page 14. 84

15.0 REFERENCES

15.0 REFERENCES
ENVIRONMENT ASSESSMENTWORLD BANK OPERATIONAL POLICIES, OPERATIONAL DIRECTIVES, UPDATESAND PROCEDURES
Operational Policies: Environmental Assessment, OP 4.01, January, 1999.Operational Policies: Natural Habitats, OP 4.04, September 1995Operational Policies: Forestry, OP 4.36, March 1993Operational Policies: Environmental Action Plans, OP 4.02, October 1994Operational Policies: Water Resource Management, OP 4.07, July 1993Operational Policies: Pest Management, OP 4.09, July 1996Operational Policies: Economic Evaluation of Investment Operations, OP 10.04, September,
1994Operational Directive: Environmental Assessment, OD 4.00, October, 1989Operational Directive: Environmental Assessment, OD 4.01, October, 1991Operational Directive: Involuntary Settlement, OD 4.30, June 1990Operational Directive: Indigenous People, OD 4.20, September, 1991Environmental Assessment, Source Book: Volumes 1, 2 and 3Update #1: An over view, April 1993Updates #2: Environmental Screening, April, 1993Update #3:GIS systems for Environmental Assessment and Review, April 1993Update #4: Sectoral Environmental Assessment, October 1993Update #5: Public Involvement in Environmental Assessment: Requirements, Opportunities
and Issues, October 1993Update #6: Privatization and Environmental Assessment: Issues and Opportunities, March
1994Update #7: Coastal Zone Management and Environmental Assessment, March 1994Update #8: Cultural Heritage in Environmental Assessment, September 1994Update #9: Implementing GIS in Environmental Assessment, January 1995Update #10: Intemational Agreements on Environment and Natural Resources: Relevance
and Application in Environmental AssessmentUpdate #11: Environmental Auditing, August 1995Update #12: Elimination of Ozone Depleting Substances, March 1996Update #13: Guidelines for Marine Outfalls and Alternative Disposal and Reuse Options,
March 1996Update #14: Environmental Performance Monitoring and Supervision, June 1996Update #15: Regional Environmental Analysis. June 1996Update #16: Challenges of Managing the EA Process, December 1996Update #17: Analysis of Altematives in Environmental Assessment, December 1996Update #18: Health Aspects of Environmental Assessment, July 1997Update #19: Asssessing Environmental Impact of Urban Development, October 1997Update #20: Biodiversity and Environmental Assessment, October 1997Update #21: Environmental Hazard and Risk Assessment, December 1997Update #22: Environmental Assessment of Mining Projects, March 1998Update #23: Economic Analysis and Environmental Assessment, April 1998Update #24: Environmental Assessment of Social Fund Projects, April 1998Update #25: Environmental Management Plans, January 1999.Bank Procedures: Natural Habitats, BP 4.04, September 1995Bank Procedures: Disclosure of Operational Information, BP 17.50, September 1993The World Bank Group. Country Brief- India. September 1998.
SEA: Final Report - Volume 2 April 30, 2000Page 15. 1

SEA STUDY REFERENCES
DHV Consultants BV. Tungabhadra Irrigation Pilot Project, Phase II, Environmental ImpactAssessment, October 1997
Haryana Water Resources Consolidation Project, Sectoral Environmental Assessment,August 1993
HR. Wallingford Ltd. Orissa Water Resources Consolidation: Environmental Assessment,1993
HR. Wallingford Ltd. Tamilnadu Water Resources Consolidation Project- ProjectPreparation Assistance- Environmental Assessment, July 1993
Leopold L.B et al, US Geological Survey Circular 645. A Procedure for EvaluatingEnvironmental Impact, 1971.
Louis Berger Intemational, Inc. et al Environmental Impact Assessment, Kota- ChittorgarhCorridor Improvements, August 1998
Louis Berger Intemational, Inc. et al Environmental Impact Assessment, Jaipur NagaurCorridor Improvements, August 1998
Louis Berger Intemational, Inc. et al, Sectoral Environmental Assessment, Rajasthan StateHighway Project Volume 1 & 2, August 1998
Mock JF and P. Bolton. Environmental Effects of Irrigation, Drainage and Flood ControlProjects, Checklist for environmental Impact Indication, Revised Draft forDiscussion, HR. Wallingford, February 1991
Montana Environmental Quality Council 1996: Our Montana Environment.. Where do westand ?
Mott McDonald Consultants. IGNP Studies for the State of Rajasthan - Draft Final Report -Annex H - Environmental Review, 1998
Water and Power Consultancy Services ( India) Limited. Central Water Commission NewDelhi. Draft Guidelines for Sustainable Water Resources Development andManagement. Volume-1. July 1992
Water and Power Consultancy Services ( India) Limited. Central Water Commission NewDelhi. Draft Guidelines for Sustainable Water Resources Development andManagement. Case Study: Kadana Reservoir Project. Volume-Il July 1992
World Bank: Report # 18321. India-Water Resources Management Sector Review. UrbanWater Supply and Sanitation Report. Volume 1- Main Report. June,1998
World Bank: Report # 18321. India-Water Resources Management Sector Review. UrbanWater Supply and Sanitation Report. Volume II- Annexes. June,1998
World Bank: Report #18322. India-Water Resources Management Sector Review. Reporton Inter-Sectoral water Allocation, Planning and Management. Volume 1: MainReport June,1998.
World Bank: Report #18322. India-Water Resources Management Sector Review. Reporton Inter-Sectoral water Allocation, Planning and Management. Volume II: Data andCase Study Analysis. June,1998
World Bank: Greening Industry, New Roles for Commidities, Markets, and Govemments. AWorld Bank Policy Research Paper, 2000
World Bank: Groundwater Legal and Policy Perspective, Proceedings of World BankSeminar, Salman. H.A. Salman edited, 1999, Technical Paper No. 456.
World Bank: India-Water Resources Management Sector Review. Groundwater Regulationand Management Report. April,1998
World Bank: India-Water Resources Management Sector Review. Rural Water Supply andSanitation Report. January,1998
World Bank: Pollution Prevention and Abatement Handbook, 1998.World Bank: Report #18416 IN. India-Water Resources Management Sector Review.
Report on Irrigation Sector. September 1998.
SEA. Final Report - Volume 2 April 30, 2000Page 15. 2

OTHER REFERENCES
Agarwal, R.R. Saline and Alkali Soils of India, Indian Council of Agricultural Research, NewDelhi, 1982.
Asian Development Bank. Industrial Pollution Prevention, 1994.Biswas Asit K. et.al. Envrionmental Modeling for Developing Countries, 1990.Bureau of Indian Standards. Code of Practice for Control of Sediment in Reservoirs (First
revision) Indian Standard IS 6518:1992Bureau of Indian Standards. Environmental Management System - Specification with
Guidance for use. Indian Standard IS/ISO 14001:1996Bureau of Indian Standards. Environmental Management Systems - General Guidelines on
Principle, System and Supporting Techniques. Indian Standard IS/SO 14004:1996Bureau of Indian Standards. Guidelines for overall planning of River Basin. Indian Standard
IS 13028:1991Canada - Alberta Environmentally Sustainable Agriculture Agreement. Agricultural Impacts
on Water quality in Alberta. Alberta Agriculture, Food and Rural development,Lethbridge. Alberta, 1998.
Center of Management Studies, HCM RSI of PA Jaipur. Environmental and socio-economicaction plan-Bisalpur Irrigation and Water Supply project-Volume 1, 1992
Center of Management Studies, HCM RSI of PA Jaipur. Environmental and socio-economicaction plan-Bisalpur Irrigation and Water Supply project-volume 11, 1992
Central Groundwater Board, Ministry of Water Resources, Govemment of India.Groundwater Year Book 1998-99, Westem Region, Jaipur. May, 1999.
Central Pollution Control Board, Ministry of Environment & Forest, Govemment of India,Parivesh Newsletter, Vol. 5 (iv), 1999.
Central Pollution Control Board., Ministry of Environment & Forests, Govemment of India,Water Quality Data in respect of Rivers in Rajasthan for 1996 and 1997.
Chauhan, T.S. Encyclopedia of Rajasthan, Volume I & II, Vigyan Prakashan, 1996.Chouhan, T.S. (Edior), Natural and Human resources of Rajasthan. Scientific Publishers,
Jodhpur, 1993College of Technology and Agricultural Engineering, A Report of research Studies on Survey
Identification and documentation of local grass and legume flora and indigenousTechnical knowledge of Integrated Watershed Development Project (Plains).
College of Technology and Agricultural Engineering, Rajasthan Agriculture UniversityUdaipur. Evaluation Agency. Baseline Survey Report, Integrated WatershedDevelopment Project, 1993.
College of Technology and Agricultural Engineering, Rajasthan Agriculture University,Uda,pur. Concurrent Evaluation Report, Integrated Watershed Development Project(Plains), 1994.
College of Technology and Agricultural Engineering. Adaptive Research Studies (1990-98),1 998.
Command Area Development, Bikaner. Information on Watertable in I.G.N.P, 2000.Command Area Development, Bikaner. Monitoring of Watertable in I.G.N.P, 1998.CRUX Consultants. Inception Report & Draft Final Report: Operation & Maintenance Study,
Rajasthan Water Resources Consolidation ProjectDalal consultants. I.G.N.P studies for the State of RajasthanDepartment of Agriculture, GOR, Jaipur. Saline- Alkaline Soils in Rajasthan -
Their Nature, Extent, & Management, 1969.Department of Industries, GOR. Rajasthan - The New Industrial Policy, 1998.Department of Relief, Govemment of Rajasthan. Perspective plan for mitigation and
strategic management of drought in Rajasthan - September 1992.Department of Science & Technology, Govemment of Rajasthan, Resource Atlas of
Rajasthan, 1994.Director Minor lmgation, Govemment of Rajasthan. Rehabilitation Project of Minor irrigation
to be posed for Extemal Assistance.Directorate of Agriculture ( Statistical Cell), Govemment of Rajasthan. Vital Agricultural
Statistics, 1997-98.
SEA: Final Report - Volume 2 April 30, 2000Page 15. 3

Directorate of Economics & Statistics, Govemment of Rajasthan. Basic Statistics, Rajasthan,1996.
Directorate of Economics & Statistics, Govemment of Rajasthan. District Statistical Outline,Kota, 1994.
Directorate of Economics & Statistics, Govemment of Rajasthan. Socio - EconomicStatistics, Rajasthan, 1996-97.
Directorate of Economics & Statistics, Govemment of Rajasthan. Some Facts aboutRajasthan, 1998.
Directorate of Economics & Statistics, Govemment of Rajasthan. Statistical Abstract,Rajasthan, 1995.
Directorate of Economics & Statistics, Govemment of Rajasthan. Twenty Five YearsAgricultural Statistics of Rajasthan, 1973-74 to 97-98.
Directorate, Watershed Development and Soil Conservation, Rajasthan, Jaipur. i) Progressunder NWDRPA during 1997-98 and Report on compiled Progress of All SpecialSchemes & IRD Schemes being operated by Watershed Development & SoilConservation Department, in IX Plan; ii) Annual Report, 1995-96.
Dixon A. John. et.al. Economic Analysis of Environmental Impacts, 1994.Durve, V.S.. Rajasthan WatersFAO. Irrigation and Drainage Paper 55: Control of Water Pollution from Agriculture, 1996.FAO/ECE. Legislation and Measures for the Solving of Environmental Problems Resulting
from Agricultural Practices (With Particular Reference to Soil, Air and Water), TheirEconomic Consequences and Impact on Agrarian Structures and FarmRationalization. United Nations Economic Commission for Europe (UNECE) andFAO, AgrilAgrarian Structures and Farm Rationalization Report No. 7. UnitedNations, Geneva, 1991.
Forest Department of Rajasthan, Rajasthan Forest Statistics- 1997.Forest Department, Govemment of Rajasthan. Wild life Census-1997.Goel, M.M. Industries and Pollution Control, Anupriya Publishing House, Jaipur, 1992.Govemment of Rajasthan, Draft of the Rehabilitation Policyfor the displaced and Project
affected persons of construction Projects in Rajasthan, Jaipur, 1997.Govemment of Rajasthan. Agreement Between Rajasthan and Gujarat for the Exploitation of
Mahi River, 1966.Govemment of Rajasthan. Rehabilitation & Resettlement Policy of Rajasthan - August, 1998Govemment of Rajasthan. State Water PolicyGovemment of Rajasthan. Strategy for Creation of WUAGroundwater Department GOR, Jodhpur. Groundwater Fluctuation maps for Kota, Baran,
Jhalawar, Alwar, Bharatpur, Dholpur, Jhunjhunu, Sikar, Jaipur, Dausa, Tonk, &Sawai Mahopur, 1984-98
Groundwater Department, Govemment of Rajasthan, Jodhpur. Groundwater Resources ofRajasthan (Irrigation Potential) as on January 1, 1998.
Groundwater Department. GOR. Jodhpur. Groundwater Fluctuation maps for Kota, Baran,Jhalawar, Alwar, Bharatpur, Dholpur, Jhunjhunu, Sikar, Jaipur, Dausa, Tonk, &Sawai Madhopur, 1984-98.
Groundwater Legislation-Model Bill- 1997-Hindi.Groundwater Wing, CAD, IGNP, Bikaner. Annual Report, 1957 1996-97.Gupta, L.C. (Ed.). IDS Research Abstracts, Institute of Development StudiesGupta, L.C. and Shrimali, M.R. N.G.Os in Rajasthan (in Hindi), Institute of Development
Studies, 1996Health Deptt., Govemment of Rajasthan. Year wise Incidence of Seasonal Diseasesl.C Gupta. Extent, Distribution and Utilization of saline waters in RajasthanIMTI, Kota. Explanations Showing Necessity of Amendments, Additions, Deletions in
Respect of Various Sections of the Rajasthan Irrigation and Drainage Act 1954.Institute of Development Studies. Annual Report 1997-98,Institute of Development Studies. Assessment of Policy Reforms under ADPInstitute of Development Studies. Baseline survey o0 Sindh Mukh Nahar, 1997Institute of Development Studies. Economic Viability of Lift Irrigation Schemes IGNP II,
1995
SEA: Final Report - Volume 2 April 30, 2000Page 15. 4

Institute of Development Studies. Priorities of Research in Water Management for WaterScare Regions-The case of Rajasthan
Institute of Development Studies. RWRCP Baseline Survey Inception Report, 1998.Institute of Development Studies. RWRCP Baseline Survey Mid Term Report, 1999.Institute of Development Studies. RWRCP Baseline Survey, Juggar Project, 1999.Irrigation Department, Govemment of Rajasthan 1996. The IX Five year Plan, Report of
Working Group on Irrigation, 1997-2002.Jashbhai Patel. Story of a Rivulet Arvari, From death to rebirthJohn A. Dixon, Richar A. Carpenter, L.A. Fallon and P.B. Sherman, Supachit Manopimoke.
Economic Analysis of the Environmental Impacts of Development Projects, 1988.Joshi, H.C et.al. Potential of alcohol industry effluent application for crop production, IARI,
New Delhi, 1998.Joshi, K.N. Development Dialogue on Agrochemicals, Agriculture Dev. & Environment,
Institute of Development Studies.Joshi, L.K. and Dinkar, V.S. Waterlogged, Saline and Alkali Lands - Prevention and
Reclamation, Ministry of Water Resources, 1996.Kapoor, A.S. A Comparative Study of Experiences on Bio-Drainage, 1997.Kapoor, A.S. Bio-Drainage - A Case Study, 1997Kapoor, A.S. Bio Drainage of Lands Under Irrigation in Dry Arid Regions With Particular
Reference to The IGNP, 1997Kapoor, A.S. Prevention of Soil Salinisation of Irrigated Lands in Dry Arid Regions with the
Help of Plantations, 1997.Lal, S.S. Studies on the Chemical and Biological Analysis of Drinking Water of Tribal villages
of Udaipur and its Impact on Human Health and Hygiene, MLS Udaipur.Law Department of Govemment of Rajasthan. Rajasthan Code-Volume 1l,Law Department,
Govemment Press Govemment of Rajasthan, 1996.Lodha, R.M. Environmental Impact of Mining Activity on Land Use -Annual Report, MLS
Udaipur, 95-96Lohani et.al. Asian Development Bank: Environmental Impact Assessment for Developing
Countries in Asia. Volume 1, 1997.Lohani et.al. Asian Development Bank: Environmental Impact Assessment for Developing
Countries in Asia. Volume 2, 1997.Louis Berger Intemational. Resettlement Action Plan, Public Works Department, September
1998Lutz Emst. Agriculture. and the Environment. Perspectives on Sustainable Rural
Development. A World Bank Symposium, 1998.Madhya Pradesh - Rajasthan Inter-State(lrrigation & Power) Control Board, Kota, 1973Marcus Moench. Groundwater Component: Draft Preparation Document.Mathur, P.C.. Working Paper-12, Social Aspects of Development & Management of Natural
resources, Institute of Development Studies, 1985Mc Gauhey. P.H. Engineering Management of Water Quality, 1968.Mckee Wolfe. Water Quality Criteria. Califomia State Water Resources Control Board, 1963.Medical and Health Department, Govemment of Rajasthan, 1999. Incidence of water related
diseases, 1994- 97 (Personal Communication).Memorandum of Understanding between UP, Haryana, Rajasthan, HP and National Capital
Territory of Delhi regarding Allocation of Surface Flow of Yamuna, 1994.Minhas, P.S. and Gupta, Raj K. Quality of Irrigation Water - Assessment and Management,
Central Soil Salinity Research Institute, Kamal, Indian Council of AgriculturalResearch, 1992
Minhas, P.S.; Sharma, O.P. and Patil, S.G. Twenty Five Years of Research on Managementof Salt-affected Soils and Use of Saline Water in Agriculture, Central Soil SalinityResearch Institute, Kamal, 1998
Ministry of Agriculture. The Drought of 1987 response and management- Vol- 1, 1989Ministry of Agriculture. The Drought of 1987 response and management- Vol- 2, 1990Ministry of Water Resources, GOI. National Water Policy, 1987Mott McDonald Consultants. Background Material for Presentation, Jaipur -15 Feb 1997
SEA: Final Report - Volume 2 April 30, 2000Page 15. 5

Mott McDonald Consultants. IGNP Studies for the State of Rajasthan - Draft Final Report -Annex C - Drainage Studies, 1998
Mott McDonald Consultants. IGNP Studies for the State of Rajasthan - Draft Final Report -Annex G - Review of North-West Drainage, 1998.
Mott McDonald Consultants., IGNP Studies - Interim Report - 4, Pilot Drainage andEvaporation Pond Studies, 1996.
National Bureau of Soil Survey. Soils of Rajasthan for Optimising Land Use 16-sheets]National Institute of Hydrology, Roorkee. Subsurface Drainage Investigations in Stage-Il of
IGNP at RD 838, 1997Price Water House Consultants. Study on Institutional Strengthening & Restructuring of
Water Resources Development Departments of Government of Rajasthan -Intermediate Report. Mid Term Report - Volume I & Volume II (Appendices), DraftFinal Report Volume I & II (Appendices).
Price Water House Coopers. Study for Development of Information TechnologyInfrastructure in Water Resources Development Departments of Govemment ofRajasthan (Management Information System Study) Intermediate Report.
Project Officer, Groundwater, IGNP. Evaluation of Vertical Drainage Project in the area ofBaropal, Stage I, Command IGNP, 1998.
Project Preparation Unit, RWRCP, Department of Irrigation, GOR, Jaipur. Project Report ofAlnia, Saran Kheri, Bhakra Canal System, Gang Canal System, Lodisar, Jetpura,Kaladeh, Jhadol, Santhal Sagar Bandh, Jawai, Angor and Ogna Imgation Projects,1999.
RAJAD ( Rajasthan Agricufltural Drainage Research Project), Chambal Command AreaDevelopment, Kota, DataBase- 1992-1999.
RAJAD Project. Analysis of Subsurface Drainage Design Criteria, 1995.RAJAD. Environmental Analysis of SSD systems RAJAD Experiences, 1999RAJAD. Environmental Baseline Report, 1995.RAJAD. Environmental Management Plan, RAJAD Project, 1995Rajasthan Agricultural University, Agricultural Research Station Durgapura (Jaipur), Studies
on Pesticide Residues in certain vegetables (1991-99), All India CoordinatedResearch Project on Pesticide Residues.
Rajasthan Groundwater act (Rajasthan Bhoomigat Jal Vidhayak), 1997Rajasthan Groundwater Department. Groundwater Fluctuation maps for Kota, Baran,
Jhalawar, Aiwar, Bharatpur, Dholpur, Jhunjhunu, Sikar, Jaipur, Dausa, Tonk, &Sawai Madhopur, 1984-98.
Rajasthan State Pollution Control Board. Comprehensive Guidelines for pollution Control.Rajasthan State Pollution Control Board. Environment Status of Lakes in Rajasthan, 1986.Rajasthan State Pollution Control Board. Selected Industrial Effluent Data, April, 2000.Rajasthan State Pollution Control Board. Zoning Atlas for Siting of Industries - Udaipur &
Rajsamand Districts, April, 2000.Rajvanshy, T.S. et.al. Study and Status of Environmental consciousness in the Planned city
Jaipur, Pollution Board, 1987.Randhawa, N.S. and Sharma, P.B.S. National Water Policy - Agricultural Scientists'
Perceptions, National Academy of Agricultural Sciences, 1998Ratna Reddy V. Urban Water Crises-Rationale for Pricing, Institute of Development Studies,
1996.RIICO, Industrial Land in Rajasthan as on 31 October, 1998.RIICO, Industnal Land in Rajasthan, Index of Prime Industrial Towns, 1999.RSPCB (Rajasthan State Pollution Control Board, Govemment of Rajasthan, Jaipur). Annual
Progress Report, 1996-97.RSPCB, Kota Region, Kota. Water Quality Data for Chambal River (From RAJAD Data
Base).RSPCB. Assessment of Water Quality in Rajasthan, 1997.RSPCB. Comprehensive Guidelines - Compliance of Environmental Acts/Rules, 1998.RSPCB. Environmental Evaluation of M.I.A. Alwar, 1998.RSPCB. Environmental Status of Lakes in Rajasthan, 1986.
SEA: Final Report - Volume 2 April 30, 2000Page 15. 6

RSPCB. Groundwater Quality Assessment in and around Sanganer Town, Jaipur, 1998.Sharma, Chitranjan. A Study on Farmers' Knowledge and Participation for Regeneration of
Command Area Environment of Jaisamand, District Udaipur, RajasthanSingh, Dalbir. Working Paper-16, Managing Groundwater Resources for Sustainable
Agricultural Dev. in Raj. Institute of Development Studies, 1998SPM Consultants. Integrated Water Resources Management -Program Phase, Inception
Report, April 1998Tahal Consulting Engineers Ltd.. State Water Resources Plans, Vol. 1, 2 & 3 (Annexure),
RWRCP, ID&R (Irrigation) Unit, 1998.Tahal Consulting Engineers Ltd.. Water Resources Planning Report of Gambhir River Basin,
RWRCP, ID&R (Irigation) Unit, 1998.Tahal Consulting Engineers Ltd.. Water Resources Planning Report of Banas River Basin,
RWRCP, ID&R (Irrigation) Unit, 1998.Tahal Consulting Engineers Ltd.. Water Resources Planning Report of Banganga River
Basin, RWRCP, ID&R (Irrigation) Unit, 1998.Tahal Consulting Engineers Ltd.. Water Resources Planning Report of Chambal River Basin,
RWRCP. ID&R (Irrigation) Unit, 1998Tahal Consulting Engineers Ltd.. Water Resources Planning Report of Luni River Basin,
RWRCP, ID&R (Irrigation) Unit, 1998Tahal Consulting Engineers Ltd.. Water Resources Planning Report of Other Nallas of Jalore
district, RWRCP, ID&R (Irrigation) Unit, 1998.Tahal Consulting Engineers Ltd.. Water Resources Planning Report of Parbati River Basin,
RWRCP, ID&R (Irrigation) Unit, 1998.Tahal Consulting Engineers Ltd.. Water Resources Planning Report of Ruparail River Basin,
RWRCP, ID&R (Irrigation) Unit, 1998.Tahal Consulting Engineers Ltd.. Water Resources Planning Report of Sabi River Basin,
RWRCP, ID&R (Irrigation) Unit, 1998.Tahal Consulting Engineers Ltd.. Water Resources Planning Report of Shekhawati River
Basin, RWRCP, ID&R (Irrigation) Unit, 1998.Tahal Consulting -Engineers Ltd.. Water Resources Planning Report of Sukli river Basin,
RWRCP, ID&R (Irrigation) Unit, 1998.Tahal Consulting Engineers Ltd.. Water Resources Planning Report of the Outside Basin,
RWRCP, ID&R (Irrigation) Unit, 1998.Tahal Consulting Engineers Ltd.. Water Resources Planning Report of West Banas River
Basin, RWRCP, ID&R (Irrigation) Unit, 1998.Tahal Consulting Engineers Ltd.. Water Resources Planning Report on Sabarmati River
Basin, RWRCP, ID&R (Irrigation) Unit, 1998.Tahal Consulting Engineers Ltd.. Water Resources Planning Report on Mahi River Basin,
RWRCP, ID&R (Irrigation) Unit, 1998.Thash N.C. and Asit K. Biswas. Envrionmentally Sound Water Management, 1993.Trivedi, R.K. Environmental Directory of India, Envim Media, Karad, 1990UMA Engineering Limited, Calgary, Canada. Rajasthan Water Resources Consolidation
Project (RWRCP) - Sectoral Environmental Assessment Study: Inception Report,1999 & Mid term Report, 1999.
UNESCO: Newsletter of Intemational Hydrological Program No.18, 1999.United Nations. Johad - Watershed in Alwar District Rajasthan.Vaish, A.K.; Gyani, K.C. & Vaish, Prerana. Fluoride, fluorosis and defluoridation Technique -
A Profile. Society affiliated to Research and Improvement of Tribal Areas, Udaipur,1999.
Varma, Balbir et.al. SWCT&RC, Kota. Twenty Five Years of Research on Soil and WaterConservation in Ravine Lands of Rajasthan
Varma, C.V.J. (Ed.). Workshop Waterlogging and Soil Salinity in Irrigated Agriculture,Central Board of Irrigation & Power & Central Soil Salinity Research Institute, 1996.
Vyas, L.N. A study of Hydrophytes and Marsh Plants of AlwarVyas, L.N. et.al. Contributions to the Environmental Sciences, Himanshu Publications, 1J96Vyas, L.N. Vegetation of Jaisamand Lake, Alwar, Rajasthan.
SEA: Final Report - Volume 2 April 30, 2000Page 15. 7

Vyas, V.S. and Bargava, Pradeep. Policies for Agricultural development, Institute ofDevelopment Studies, 1997
World Bank. File with letters from The World Bank to Chief Secretary dated Jul.3'97,Nov.4'97, Feb.10'98 & Mar.12'98 relating to identification and preparation of RWRCP
WWF - India. Keoladeo National Park, Rajasthan, 1994.
SEA: Final Report - Volume 2 April 30, 2000Page 15. 8