Modelling dry season deciduousness in Mexican Yucatán forest using MODIS EVI data (2000–2011)
Upload
khangminh22Category
view
1download
0
water
Article
Dynamics of Suspended Sediments during a DrySeason and Their Consequences on MetalTransportation in a Coral Reef Lagoon Impacted byMining Activities, New Caledonia
Jean-Michel Fernandez 1,*, Jean-Dominique Meunier 2, Sylvain Ouillon 3, Benjamin Moreton 1,Pascal Douillet 4 and Olivier Grauby 5
1 Analytical and Environmetal Laboratory (AEL),Institut de Recherche pour le Développement (IRD)-Nouméa, BP A5,98800 Nouméa, Nouvelle-Calédonie; [email protected]
2 Aix Marseille University, Centre National de la Recherche Scientifique (CNRS), IRD,Unité Mixte de Recherche CEREGE, 13545 Aix en Provence CEDEX 05, France; [email protected]
3 Unité Mixte de Recherche LEGOS, Université de Toulouse, IRD, Centre National d’Etudes Spatiales (CNES),CNRS, Université Paul Sabatier (UPS), 14 avenue Edouard Belin, 31400 Toulouse, France;[email protected]
4 Mediterranean Institute of Oceanography (MIO), Unité Mixte de Recherche 110, IRD, CNRS/InstitutNational des Sciences de l’Univers (INSU), Aix Marseille Université, Université de Toulon,13284 Marseille, France; [email protected]
5 CINaM-CNRS-Aix-Marseille Université, Campus de Luminy Case 913, 13288 Marseille CEDEX 9, France;[email protected]
* Correspondence: [email protected]; Tel.: +687-76-84-30
Academic Editor: Roger A. FalconerReceived: 30 March 2017; Accepted: 8 May 2017; Published: 10 May 2017
Abstract: Coral reef lagoons of New Caledonia form the second longest barrier reef in the world.The island of New Caledonia is also one of the main producers of nickel (Ni) worldwide. Therefore,understanding the fate of metals in its lagoon waters generated from mining production is essential toimproving the management of the mining activities and to preserve the ecosystems. In this paper, thevertical fluxes of suspended particulate matter (SPM) and metals were quantified in three bays duringa dry season. The vertical particulate flux (on average 37.70 ± 14.60 g·m2·d−1) showed fractionsrich in fine particles. In Boulari Bay (moderately impacted by the mining activities), fluxes weremostly influenced by winds and SPM loads. In the highly impacted bay of St Vincent and in theweakly impacted bay of Dumbéa, tide cycles clearly constrained the SPM and metal dynamics. Metalswere associated with clay and iron minerals transported by rivers and lagoonal minerals, such ascarbonates, and possibly neoformed clay as suggested by an unusually Ni-rich serpentine. Particleaggregation phenomena led to a reduction in the metal concentrations in the SPM, as identified bythe decline in the metal distribution constants (Kd).
Keywords: suspended sediment; sediment transport; lagoon; geochemistry; Ni mining; sedimenttrap; hydrodynamics; New Caledonia; dry season
1. Introduction
The mining industry in New Caledonia is one of the most important environmental concerns forthe tropical island lagoonal ecosystem [1–9].
With about 85% endemism among terrestrial plants, 24 different species of mangroves among the70 listed throughout the world, about 2800 species of molluscs and the second longest barrier reef in
Water 2017, 9, 338; doi:10.3390/w9050338 www.mdpi.com/journal/water
Water 2017, 9, 338 2 of 24
the world [10–15], New Caledonia’s ecosystems and biodiversity are highly sensitive to anthropogenicactivities (e.g., [16–23] for its lagoons). Since the beginning of mining in New Caledonia, morethan 160 × 106 tonnes of ore have been extracted. This has led to the mobilization and transport ofapproximately 300 million m3 of soil material (laterites). Opencast Ni mines have enhanced soil erosionand transportation of sediments and metals into the lagoon [19,24–27] with several consequences onthe lagoonal ecosystems, including increased sedimentation rates; decreased light penetration anddissolved oxygen levels; and an increased metal contamination in the food web which may affecthumans [23,28,29]. The Ni mining industry has flourished for over 25 years, and New Caledonia willremain one of the major worldwide Ni producers for the foreseeable future, with global Ni reservesestimated at around 20–25% [30]. As a consequence, environmental studies are required in orderto mitigate the effects of 400–500 km2 of deforestation specifically related to the mining industry inNew Caledonia.
Numerous studies of the south-western lagoon of New Caledonia have been conductedinvestigating hydrodynamics, sediment transport, sedimentation dynamics, metal fluxes, accumulationzones, and particle sources [23,27,31–37]. In complement to these works, this paper aims atcharacterizing the suspended sediment mineralogy and geochemistry (including metals) in threebays; analysing the relationships between their composition and the mining activities; determininghow hydrodynamics forced by wind regimes affect the transportation of particulate metals bounded tothe lateritic Suspended Particulate Matter (SPM) into the lagoon. Three contrasting bays in the southwest lagoon, where hydrodynamics modelling has been carried out [38–40] were selected: Boulari Bay,Dumbéa Bay and Saint Vincent Bay. Samples were collected during a dry season in order to limit theinfluence of riverine inputs which could affect the understanding of hydrodynamic regimes, duringdistinct wind regimes (trade wind and west-breezes) and two neap/spring tide cycles.
2. Study Area
New Caledonia is located at the southern end of the Melanesian Arc, near the Tropic ofCapricorn. In New Caledonia, mining activities are almost exclusively conducted on the main island(16,642 km2, [41]). In its south-western part, host rocks are composed of peridotites and harzburgitesincorporating metals like Ni, Co, Cr, Fe and Mn [42,43] in Mg and Fe-minerals. Elements like Pb and Znare only present in significant quantities in rocks from the northernmost part of the island [44–49]. Theweathering of peridotites results in the accumulation of transition metals in the saprolite (also called“garnierite”) and the yellow lateritic layers which are subjected to mining extraction. On the top of theseries, the red lateritic layer corresponds to a more advanced weathering state of the peridotites wherethe structure of the bedrock is no longer visible [50]. Mg and Si are very low and the main constituentsare ferric hydroxides more or less widely crystallized in goethite. In the upper part of the profile, theultimate term of the weathering process is represented by a ferricrete composed mostly of goethiteand, in lower proportions, hematite.
The climate of New-Caledonia is dry-tropical [51] with alternating dry and wet seasons.South-East trade winds blow from October to May with a mean speed of 8 m·s–1 and from April toSeptember a variable northern wind blows. The temperatures vary moderately between dry andwet seasons.
In the south-west lagoon of New Caledonia, the tide is mixed and mainly semi diurnal [38].Due to the interaction between the different components, spring tide and neap tide periods alternateduring a lunar month. The maximum tidal amplitude is 1.5 m during a spring tide.
Similar to most of the New Caledonian Rivers, the Coulée, Dumbéa and Tontouta Rivers havesteep upper courses and much flatter lower courses where deposits of weathered bedrock productsaccumulate (Figure 1). Due to the tropical climate conditions in New Caledonia, the hydrologicalregime is of torrential type. During the dry season, sediment loads carried by the rivers are low becauseof the low energy for erosion and the weak transport capacity [52,53]. Rain events reaching 700 mmand more over a 24-h period lead to intense weathering of the slopes and flushing of large quantities

Water 2017, 9, 338 3 of 24
of suspended matter to the lagoon. Baltzer and Trescases [52] reported that during cyclone Brendain 1968, over 20,000 t of particles were discharged in a single day through the Dumbéa River estuary.The present study focuses on the three above-mentioned estuaries located on the south-west coast ofNew Caledonia influenced by their respective watersheds (Figure 1).Water 2017, 9, 338 3 of 24
Figure 1. Map location of the study area in the west coast of New-Caledonia: Boulari Bay, influenced by a medium-scale mine activities until 1981; Dumbéa Bay, halted mining activity in order to maintain the water supply of Nouméa (the peninsula between Dumbéa Bay and Boulari Bay); St Vincent Bay, affected by intense opencast mining activities.
2.1. Boulari Bay
The Coulée River catchment (92 km2) is located almost entirely in the ultrabasic Grand Massif of the South New-Caledonia. An intermediate-scale mining operation was active in the area until 1981, but erosion from the initial prospecting and extraction sites has continued. The present terrigenous inputs delivered to Boulari Bay by the Coulée River result from combined natural and anthropogenic influences [19,25]. The river is extending its delta into the southern part of Boulari Bay where tidal mudflats are being formed.
2.2. Dumbéa Bay
The catchment area of Dumbéa River covers about 233 km2 and only a few small-scale localized garnierite extractions have occurred in the headwater regions. Similar to other drainage basins near the main city, Nouméa, any mining activities in the area have been forbidden since 1927 to maintain a quality water supply for the city. The sediment load yielded at the river mouth—where a mangrove extends—and delivered to Dumbéa Bay consists of clay, silts and sand, and the effects of mining activities have been limited [25,26].
2.3. St Vincent Bay
The Tontouta River and its tributaries form the largest of the three river catchments (476 km2) and drain a peridotic hinterland where opencast mining is still intense today. These activities extend to the mountain crests, and on hillslopes, only a few kilometres from the coast. The Tontouta River carries substantial amounts of fine terrigenous material that has resulted in a shallowing of the Saint Vincent Bay, particularly nearshore. The impact of mining activities appears to be stronger than in the Coulée catchment because of the lack of conservation work along the river and tributaries between 1960s and 1980s. This has led to a drastic increase in the sediment load at the river mouth.
Figure 1. Map location of the study area in the west coast of New-Caledonia: Boulari Bay, influencedby a medium-scale mine activities until 1981; Dumbéa Bay, halted mining activity in order to maintainthe water supply of Nouméa (the peninsula between Dumbéa Bay and Boulari Bay); St Vincent Bay,affected by intense opencast mining activities.
2.1. Boulari Bay
The Coulée River catchment (92 km2) is located almost entirely in the ultrabasic Grand Massif ofthe South New-Caledonia. An intermediate-scale mining operation was active in the area until 1981,but erosion from the initial prospecting and extraction sites has continued. The present terrigenousinputs delivered to Boulari Bay by the Coulée River result from combined natural and anthropogenicinfluences [19,25]. The river is extending its delta into the southern part of Boulari Bay where tidalmudflats are being formed.
2.2. Dumbéa Bay
The catchment area of Dumbéa River covers about 233 km2 and only a few small-scale localizedgarnierite extractions have occurred in the headwater regions. Similar to other drainage basins nearthe main city, Nouméa, any mining activities in the area have been forbidden since 1927 to maintain aquality water supply for the city. The sediment load yielded at the river mouth—where a mangroveextends—and delivered to Dumbéa Bay consists of clay, silts and sand, and the effects of miningactivities have been limited [25,26].

Water 2017, 9, 338 4 of 24
2.3. St Vincent Bay
The Tontouta River and its tributaries form the largest of the three river catchments (476 km2) anddrain a peridotic hinterland where opencast mining is still intense today. These activities extend to themountain crests, and on hillslopes, only a few kilometres from the coast. The Tontouta River carriessubstantial amounts of fine terrigenous material that has resulted in a shallowing of the Saint VincentBay, particularly nearshore. The impact of mining activities appears to be stronger than in the Couléecatchment because of the lack of conservation work along the river and tributaries between 1960s and1980s. This has led to a drastic increase in the sediment load at the river mouth.
3. Materials and Methods
During the dry season between 21 November and 14 December, 2005, SPM was sampled in thethree bays every two days, and currents were measured continuously (Figure 1, Table 1). Rainfallrates, and wind direction and velocity were obtained from Météo-France’s meteorological stationsat Magenta airport, Mont Coffin and Tontouta airport close to Boulari Bay, Dumbéa Bay and SaintVincent Bay, respectively.
Table 1. Sampling sites, depth and localisation.
Site Longitude Latitude Depth (m)
Boulari Bay E 166◦32.126 S 22◦15.355 13.2Dumbéa Bay E 166◦23.243 S 22◦12.291 13.0
St Vincent Bay E 166◦06.635 S 22◦00.561 12.8
3.1. SPM Sampling
Three sequential sediment traps (model PPS 4/3; section of 0.05 m2, Technicap, La Turbie, France)were used for suspended particulate matter (SPM) sampling. They were moored at sites of ~13 mdepth downstream of the mouth of the Coulée, Dumbéa and Tontouta Rivers (Figure 1, Table 1).Samples were collected at a frequency of 48 h, 3 m above the seabed. The sediment traps wereequipped with twelve 250 mL polypropylene vials filled with 5% formaldehyde-filtered seawatersolution before mooring in order to preserve the particles from microbiological activity [54]. Aftersampling, the samples were placed in a refrigerator at 2–4 ◦C before analysis. Particles fluxes werecalculated using the formula:
Flux (g·m–2·d–1) = sample load (g)/(Section area (m2) * Collecting time (d) per flask) (1)
3.2. Current Measurement
Currents were measured using an Acoustic Doppler Current Profilers (RDI Workhorse MonitorADCP, Teledyne RD Instruments, Poway, USA 300 kHz, 12 cells, 1-m resolution) placed on the seabedin Dumbéa and St Vincent Bays (Figure 1). In Boulari Bay, local currents were measured using anAcoustic Doppler Velocimeter (Sontek) located 3 m above the seabed. Moored in the vicinity ofthe 3 sediment traps, the three current meters simultaneously recorded measurements during theSPM sampling period (one month). Unfortunately, due to technical problems, measurements are notavailable for Dumbéa Bay during the last ten days of the field campaign.
3.3. In Situ Laser Grain Size and CTD Profiling
Turbidity was measured regularly at each station by the use of a Seapoint Optical BackscatteringSensor (Seapoint Sensors, Inc., Brentwood, NH, USA) (λ = 880 nm) connected to a Seabird SBE19 CTDprofiler. The Seapoint sensor was factory-adjusted for a consistent response to Formazin TurbidityStandard measured in Formazin Turbidity Units (FTU). A former calibration showed that, in the

Water 2017, 9, 338 5 of 24
south-west lagoon of New Caledonia, turbidity is related to the mass concentration (C) of SPMfollowing [55]:
Turbidity (FTU) = 1.85 C (mg·L–1) (2)
An in situ Laser Scattering and Transmissometry device (LISST-100X; Sequoia Scientific Inc.,Bellevue, WA, USA) was used in situ to quantify the SPM and the Particle Size Distribution(PSD). The LISST-100X provides the distribution of particle volume concentrations in 32 size classeslogarithmically spaced within the range 1.25–250 µm (e.g., [56]). Jouon et al. [55] gave an extendedpresentation of its first application in the lagoon of New Caledonia.
Synthetic parameters were defined to characterize the particle distribution: (1) the mediandiameter (D50) as the diameter of a particle for which the cumulative volumetric distribution reaches50% of the SPM volume concentration; (2) the Junge parameter (s) characterizing the slope of theparticle size distribution (PSD) (e.g., [57,58]): high values correspond to SPM dominated by fineparticles or aggregates, while low values correspond to macro-flocs; (3) the percentage of particleswith diameter > 60 µm that was shown to be an indicator of the state of aggregation [55].
3.4. Geochemistry
All apparatus was acid soaked (10% nitric acid) for a minimum of five days and rinsed withultrapure water (Milli-Q), and then stored in acid cleaned plastic bags until needed. While analyticalacid grades were used for all cleaning steps, high purity reagents were used for all parts of theanalytical procedure.
Seawater samples: Seawater was collected from the three bays using 5L teflon lined Go-Flo™ watersamplers (General Oceanics Inc., Miami, FL, USA). The Go-Flo™ water samplers were primed tobe open at the site and lowered into the water, rinsed thoroughly and closed using a teflon-coatedmessenger. Once at the surface, samples were transferred in situ into acid cleaned HDPE bottles andsealed in clean plastic bags. After an on-line filtration at 0.45 µm (Millipore acetate filters, MerckMillipore, Billerica, MA, USA), samples were then preconcentrated and analysed using ICP-OESfollowing the procedure described by Moreton et al. [35]. Only the results for Fe, Mn and Ni, whichrepresent the main elements used to trace watershed lixiviation, are presented in this article.
The accuracy and precision of the analytical results was controlled by assaying a SLEW-3 certifiedwater sample (National Research Council, Canada), to check the preconcentration method. The stabilityof the ICP-OES was controlled inserting independent standards in the sample series: in our case, one atthe beginning and one at the end. The quantification limits (LQ) of the method for the 3 metals,obtained after deduction of blanks, are given in Table 2.
Table 2. Results of the analysis of the reference material SLEW-3 and LQ of the method.
MetalReference Material SLEW-3 (µg·L–1)
LQ (µg·L–1)Analysed (n = 1) Certified
Fe 0.32 0.57 ± 0.06 0.068Mn 1.92 1.61 ± 0.22 0.028Ni 1.17 1.23 ± 0.07 0.022
Particulate samples: Swimmers were removed from SPM collected at each site with sediment trapsby sieving at 40 µm. The formaldehyde solution and salt were removed by rinsing several times andcentrifuging. Organic matter and faecal pellets were destroyed using a solution of 30% hydrogenperoxide. The purified sediments were then oven dried at 60 ◦C for a period of 72 h.
Particulate metals were then dissolved by an alkaline fusion digestion performed using 0.5 g oflithium tetraborate mixed with 100 mg of SPM and heated in a muffle furnace (1100 ◦C) for 15 min.The resulting amalgam was dissolved into 0.5M HCl, and the metals analysed.

Water 2017, 9, 338 6 of 24
Analysis of 9 elements (Al, Ca, Co, Cr, Fe, Mg, Mn, Ni and Si) in SPM was performed using aninductively coupled plasma optical emission spectrometer (Vista, Varian, Inc., Palo Alto, CA, USA).
The validity of the analysis was verified by assaying a MESS-3 certified sediment sample (NationalResearch Council, Canada). The quantification limits (LQ) of the method for the 9 metals, obtainedafter deduction of blanks, are given in Table 3.
Table 3. Results of the analysis of the reference material MESS-3. The Quantification Limits of themethod were not estimated because of the high levels of concentrations measured in SPM.
Reference Material MESS-3 (mg·kg−1·dw)
Metal Analyzed Certified
Al 90,053 85,900 ± 2300Ca 13,746 14,700 ± 600Co 15.2 14.4 ± 2.0Cr 97 105 ± 4Fe 37,815 32,400 ± 1200
Mg 16,905 16Mn 308 324 ± 12Ni 40.6 46.9 ± 2.2Si 232,765 270,000 *
Note: * Information value only.
3.5. Kd Calculation
Trace metal mobility in the lagoon water column was quantified through its distribution coefficient(Kd, in mL·g−1), given by the following general formula:
Kd =Cp
Cw(3)
with Cp = metal concentration in SPM, Cw = dissolved metal concentration in sea water.
3.6. Mineralogy
The mineralogical composition of the suspended sediments was determined using X-raydiffractometry (XRD), and Transmission Electron Microscopy (TEM). XRD analyses were done onslightly ground samples using Philips (PW1050/81) equipment (Philips, Eindhoven, The Netherlands)with a Cu anticathode. TEM observations were carried out on a JEOL-2000 FX microscope (JEOL USA,Inc., Peabody, MA, USA), operating with a beam intensity of 126 mA and an accelerating voltage of200 kV. Microanalyses were acquired with a Si(Li) detector filled with a UTW and a Brucker EspritEDS System. Quantitative data were obtained by the method developed by Cliff and Lorimer [59] aftercalibration of the kx,Si factors (x = Al, Mg . . . ) against natural and synthetic layer silicates of knownand homogeneous composition.
4. Results
4.1. Rainfall
During the study period (21 November to 14 December 2005), rainfall was low, scarce andirregular over all 3 sites. Only one day of significant rainfall (12 December) was recorded at themeteorological stations at Magenta airport (18 mm) and Mont Coffin (10 mm). At the Tontouta airportstation, the maximum rainfall was 6 mm on 9 December. Besides this, only 2 mm were recorded at the3 stations on the 20 and 21 November and on 26 November. Generally, rainfall at the Tontouta stationwas systematically lower than at the two other stations.

Water 2017, 9, 338 7 of 24
4.2. Wind
The meteorological stations at Magenta airport (near Boulari Bay) and Mont Coffin(between Dumbéa Bay and Boulari Bay, but representative of Dumbéa Bay conditions) recordedmainly two distinct regimes (Figure 2):
• A typical dominant trade wind regime during the study period, with the direction changing fromNE during the night to SE in the day, increasing in strength until the beginning of the afternoonand reaching a maximum of 10 m·s–1 (periods B, D);
• A regime characterized by variable and weaker winds (below 5 m·s–1) (periods A, C and E).
The meteorological station at Tontouta airport (St Vincent Bay) recorded winds that weresystematically weaker than those recorded at Magenta airport (Boulari Bay) and Mont Coffin(Dumbéa Bay). In the Saint Vincent Bay, wind speeds were lower than 6 m·s–1 and wind direction wasirregular. In this area, trade winds are weakened by relief and coastal thermal breezes.
Water 2017, 9, 338 7 of 24
• A regime characterized by variable and weaker winds (below 5 m·s–1) (periods A, C and E).
The meteorological station at Tontouta airport (St Vincent Bay) recorded winds that were systematically weaker than those recorded at Magenta airport (Boulari Bay) and Mont Coffin (Dumbéa Bay). In the Saint Vincent Bay, wind speeds were lower than 6 m·s–1 and wind direction was irregular. In this area, trade winds are weakened by relief and coastal thermal breezes.
Figure 2. Wind and current speeds and directions for Boulari, Dumbéa and St Vincent bays during the study period (21 November to 14 December 2005).
4.3. Hydrodynamics
During the study period, the amplitudes of the semi-diurnal tides changed from 0.6 to 1.2 m. Neap tide periods are identified in Figures 2 and 3.
Figure 2. Wind and current speeds and directions for Boulari, Dumbéa and St Vincent bays during thestudy period (21 November to 14 December 2005).
4.3. Hydrodynamics
During the study period, the amplitudes of the semi-diurnal tides changed from 0.6 to 1.2 m.Neap tide periods are identified in Figures 2 and 3.

Water 2017, 9, 338 8 of 24
Water 2017, 9, 338 8 of 24
Figure 3. Median diameter (D50), Junge parameter (s), flux and turbidity for Boulari, Dumbéa and St Vincent bays over the study period (21 November to 14 December 2005), 3 m above the seabed.
In Boulari Bay, the neap/spring tide cycles had a non-significant influence on the currents measured 3 m above the seabed (Figure 2). In the absence of trade winds (periods C and E), a strong westward flow was observed during several days and may indicate the development of a cyclonic gyre circulation along the isobaths from Mont-Dore (SW of Boulari Bay) towards Nouméa (as described by Fernandez et al. [27]). This gyre results from the conjunction of the propagation of the tide along the coastline of the bay. During trade winds (periods B and D), which blew from an E-NE direction in the Coulée River valley in the morning and from the SE in the afternoon, an anticyclonic gyre generated flows toward the East (as described by Douillet et al. [39]). However, during short periods (28 and 30 November and 2 December), flows in the opposite direction were observed. The present data suggest the strong impact of winds on currents in Boulari Bay, and the formation of a
Figure 3. Median diameter (D50), Junge parameter (s), flux and turbidity for Boulari, Dumbéa and StVincent bays over the study period (21 November to 14 December 2005), 3 m above the seabed.
In Boulari Bay, the neap/spring tide cycles had a non-significant influence on the currentsmeasured 3 m above the seabed (Figure 2). In the absence of trade winds (periods C and E), a strongwestward flow was observed during several days and may indicate the development of a cyclonic gyrecirculation along the isobaths from Mont-Dore (SW of Boulari Bay) towards Nouméa (as describedby Fernandez et al. [27]). This gyre results from the conjunction of the propagation of the tide alongthe coastline of the bay. During trade winds (periods B and D), which blew from an E-NE directionin the Coulée River valley in the morning and from the SE in the afternoon, an anticyclonic gyregenerated flows toward the East (as described by Douillet et al. [39]). However, during short periods(28 and 30 November and 2 December), flows in the opposite direction were observed. The presentdata suggest the strong impact of winds on currents in Boulari Bay, and the formation of a drive outphenomena of waters which were accumulated at the bottom of the bay only when trade winds blow.

Water 2017, 9, 338 9 of 24
In Dumbéa Bay, the strong tidal influence and the weak effects of the wind on the direction and thestrength of the currents 3 m above seabed were noticed: flows were the highest during spring tides andlowest during neap tides (Figure 2). Furthermore, currents were similar at the same periods of the tidebut with different wind forcings, for example, during a neap tide, with low wind (20 and 21 November)and with a trade wind (3 and 4 December). This suggests that the wind has little influence on the watercirculation in an area that is partly protected from the trade winds by the topography.
In St Vincent Bay, the strength of the currents 3 m above the seabed strongly depended on tidecycles (Figure 2); currents rotated 180 degrees during a neap-spring tide cycle, the currents beingstronger during spring tides and lower during neap tides. The weakest flows were measured between24 to 27 November and 24 to 27 December during neap tides. The strongest currents were recordedduring spring tides around 3 December. Tides are thus the major factor influencing hydrodynamics inSt Vincent Bay. A residual drift of the current to the S-W was observed; however, its value was low.
4.4. SPM Collection
In Boulari Bay, the SPM load collected over 48-h periods ranged between 1.72 and 3.16 g,corresponding to downward fluxes in the range 17.23 to 31.63 g·m–2·d–1 (Table 4), with an averagevalue of 24.14 g·m–2·d–1 (σ = 4.50 g·m–2·d–1). The maximum fluxes were recorded over the period of4 days from 25 to 28 November (F > 30 g·m–2·d–1) and the minimum on 23 to 24 November and 29 to30 November (F ≈ 17 g m–2·d–1).
Table 4. Mass (g) of suspended particulate matter collected over 48 h in sediment traps in the threesampling bays during the study period (21 November to 14 December 2005).
Date Boulari Bay Dumbéa Bay St Vincent Bay
21–22 November 2.21 1.29 4.8323–24 November 1.72 2.16 2.5325–26 November 3.16 2.84 3.0727–28 November 3.03 3.19 1.9629–30 November 1.74 2.26 1.51
1–2 December 2.12 2.78 2.523–4 December 2.79 1.95 5.155–6 December 2.27 2.09 3.327–8 December 2.64 2.20 5.179–10 December 2.35 1.90 5.50
11–12 December 2.51 2.30 5.5513–14 December 2.40 1.71 4.12
In Dumbéa Bay, the SPM load was similar to that of Boulari Bay with fluxes between 12.92 and31.93 g·m–2·d–1, and a mean value of 22.24 g·m–2·d–1 (σ = 5.20 g·m–2·d–1). The maximum fluxes wererecorded over the period of 4 days from 25 to 28 November (F ≈ 32 g·m–2·d–1) and the minimum on22 November (F ≈ 13 g·m–2·d–1).
The values in St Vincent Bay were clearly different with a higher average value of 37.70 g·m–2·d–1
(σ = 14.60 g·m–2·d–1). Variations around the average value were large with frequent loads higher than50 g·m–2·d–1. Except on 21 and 22 November, the first half of the sampling period was characterisedby low fluxes (15 < F < 31 g·m–2·d–1) and from 4 December onwards, the values were much higher(33 < F < 56 g·m–2·d–1).
For each bay, variations in the fluxes, turbidity, D50 (mean diameter of SPM from measurementsin the range 1.25–250 µm) and Junge parameter (s) during the study period are presented in Figure 3.
4.5. Turbidity, Water Column Structure, and Particle Dynamics
Turbidity was systematically higher in the bay of St Vincent with an average value of 2.8 FTU,compared with average values around 2.0 FTU in the other two bays (Table 5).
Water 2017, 9, 338 10 of 24
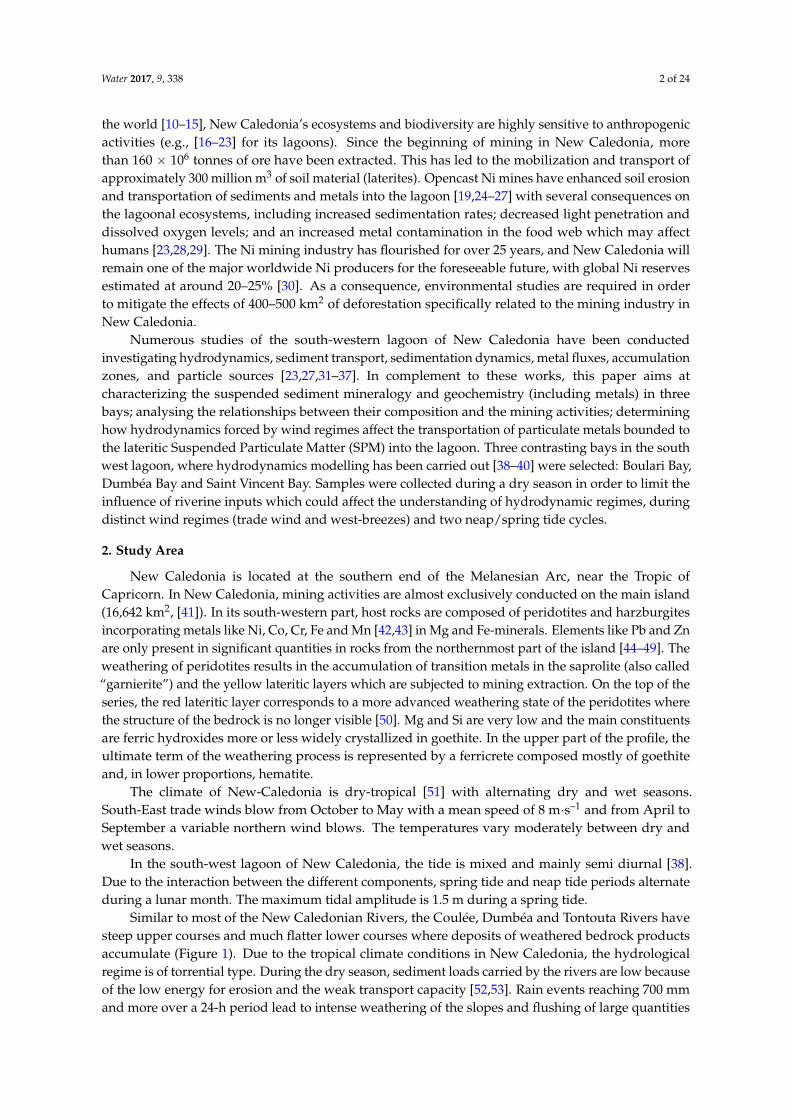
In Boulari Bay between 21 and 24 November, the median diameter (D50) increased from 45 to64 µm while the Junge parameter (s) decreased from 3.75 to 3.48 (Figure 3). While fine particlesdominated initially, coarser and medium sizes suddenly increased (24 and 25 November) two daysafter the beginning of the trade-winds. After 25 November, the decrease of D50 was fairly constantup to the end of the study period, when the value reached 42 µm. Conversely, the Junge parameterincreased until December 2 (s = 3.63), then decreased gradually up to 12 December and then increasedsharply until December 14. The downward flux of particles increased just after the peak of coarserparticles (26 November) and slightly decreased afterwards (Figure 3). Although generally rangingbetween 1 and 3 FTU, turbidity showed values around 7.5 FTU in the bottom first four metres aboveseabed, at the beginning of the study period. Another nepheloid layer, of weaker intensity (4.5 FTU),was also observed around 7 December. The particle grain size distribution was fairly homogeneousthroughout the water column during the study period except on the 12 and 14 December when theconcentration of fine particles (<7.75 µm) increasing towards the seabed was observed.
Table 5. Main characteristics (mean temperature, salinity and turbidity) recorded in the three sitesduring the study period (21 November to 14 December, 2005).
Site Statistics Temperature (◦C) Salinity (‰) Turbidity (FTU)
Boulari Bay Mean ± Std Dev.Min.–Max.
26.0 ± 0.625.3–27.5
35.9 ± 0.335.4–36.9
2.1 ± 1.10.5–7.6
Dumbéa Bay Mean ± Std Dev.Min.–Max.
26.5 ± 0.524.8–27.6
36.1 ± 0.135.3–36.6
2.0 ± 0.90.5–5.5
St Vincent Bay Mean ± Std Dev.Min.–Max.
26.9 ± 1.025.3–28.8
36.1 ± 0.135.2–36.5
2.8 ± 0.81.4–7.8
In Dumbéa Bay, the evolution of the median diameter and the Junge parameter were almostinversely related (Figure 3): for example, the two maximum values of D50 measured on 25 November(82 µm) and 6 December (79 µm) corresponded with the minimal values of s (3.32 and 3.28), respectively.Turbidity stayed fairly homogeneous throughout the water column, but decreased with time from3.2 FTU to 0.8 FTU. Only two profiles (11 November and 12 December) showed a clear increase inturbidity towards the bottom. A general decrease in the volumetric concentration, detected between24 November (10 µL·L–1) and 14 December (5 µL·L–1), combined with a decrease in turbidity, wascaused by a reduction in the largest particle-size ranges (∅ > 40.6 µm). After 9 December, the reductionin the volumetric concentration was due to a decrease in both the smallest (∅ < 7.75 µm) and largestparticle-size (∅ > 40.6 µm) populations. At the very end of the measurement period, an increase inthe amount of fine particles (∅ < 7.75 µm) was observed at depth, with large particles (∅ > 40.6 µm)towards the surface.
In St Vincent Bay, the minimum median diameter (42 µm) was measured at the beginning of thestudy period (24 November) (Figure 3). D50 increased gradually until 7 December (85 µm) with anintermediate maximum value observed on 30 November (76 µm). From the 9 to the 12 December,the median diameter increased from 62 to 70 µm. The Junge parameter followed an exact oppositeevolution. The maximum value was 3.70 on 24 November and the minimal value was 3.25 on7 December. From the 9 to the 12 December, the parameter s decreased from 3.46 to 3.38. Turbidityranged between 1.5 and 3.0 FTU in the first few metres below the surface. From 2 December until theend of the study period, turbidity systematically increased towards the seabed with a consistentlyhigher total volumetric concentration. A significant population of particles above 40 µm and highdownward fluxes of particles were observed throughout the study period (Figure 3). High downwardfluxes varied similar to turbidity after a short delay.
The values of the median diameter and the Junge parameter strongly differed from one bay toanother (Figure 3). D50 values ranged between 42 and 65 µm in Boulari Bay (median D50 = 48.9 µm),between 55 and 82 in Dumbéa Bay (median D50 = 66.8 µm) and between 42 and 84 µm in St Vincent
Water 2017, 9, 338 11 of 24
Bay (median D50 = 63.4 µm). The Junge parameter s values ranged between 3.45 and 3.73 in BoulariBay (median s = 3.58), 3.28 and 3.48 in Dumbéa Bay (median s = 3.38) and 3.25 and 3.70 in St VincentBay (median s = 3.45). The s parameter variation was minimal in Dumbéa Bay and maximal inSt Vincent Bay, the variation of D50 was minimal in Boulari Bay and maximal in St Vincent Bay.
4.6. Geochemistry
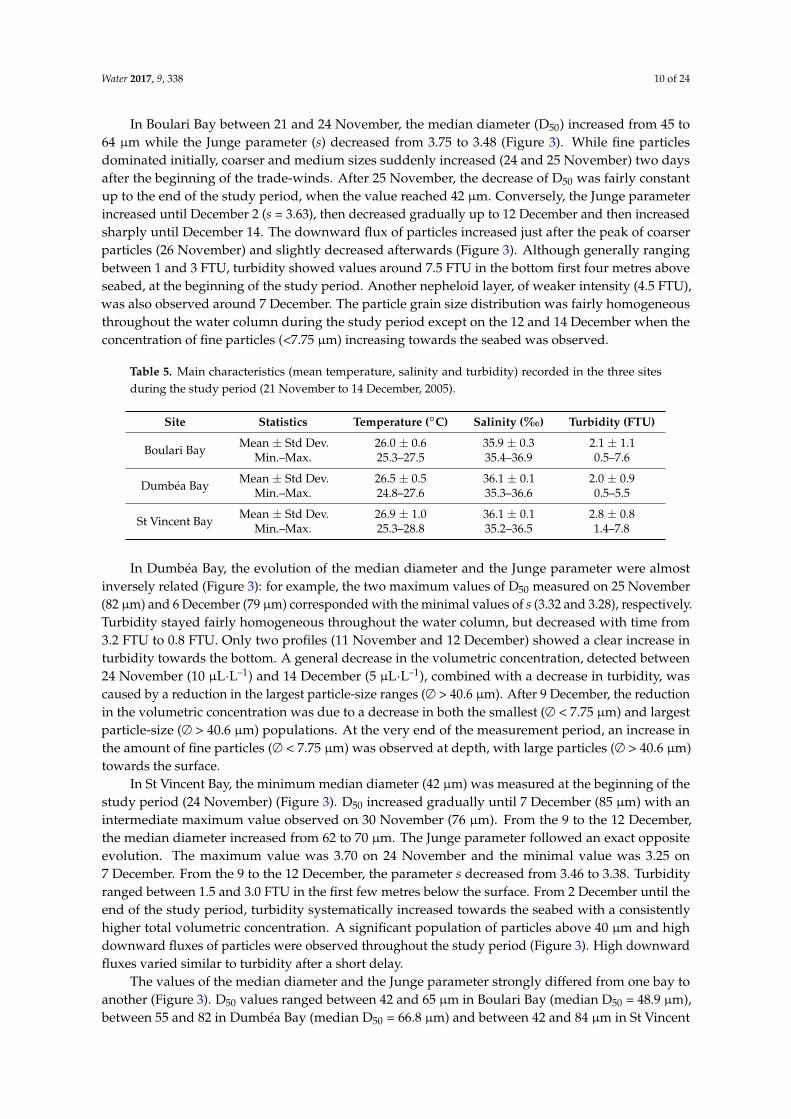
The chemical composition of the seawaters in the 3 bays (Table 6) differed in their dissolved Fe,Mn and Ni concentration. The respective highest and the lowest concentrations were measured inSt Vincent Bay and in Boulari Bay. Fe and especially Mn were found at much lower concentrationthan Ni.
These values are high but reflect the influence of the geology of New Caledonia on theconcentrations in dissolved metals. The values show a typical “coast-to-offshore” gradient, withmaximum concentrations in bays influenced by rivers and minimum near the coral reef-barrier(Table 7). This evolution is similar to that of the lateritic metals analysed in the sedimentary cover [27].
During the study, Mn concentrations were similar for the 3 bays, with limited variation between0.33 to 1.24 µg·L–1. The respective Fe and Ni ranges were larger, i.e., 0.23–2.65 µg·L–1 and 0.95 to7.10 µg·L–1 in the 3 bays. Indeed, in Boulari Bay, the maximum Fe values were measured on 24 and30 November, and were slightly higher on 8 December, and seemed to coincide with those of Ni. Forthe other two bays, the concentrations of theses metals changed differently over time. For example,for Ni, maximum concentrations were measured on 24 November, 2 December and 22 November, forBoulari, Dumbéa and St Vincent bays, respectively.
Table 6. Concentration of the dissolved Fe, Mn and Ni in seawater during the study period from22 November to 14 December 2005 in the 3 bays.
Sampling DateBoulari Bay Dumbea Bay StVincent Bay
Fe(µg·L−1)
Mn(µg·L−1)
Ni(µg·L−1)
Fe(µg·L−1)
Mn(µg·L−1)
Ni(µg·L−1)
Fe(µg·L−1)
Mn(µg·L−1)
Ni(µg·L−1)
22 November 2005 0.58 0.66 2.00 0.73 0.56 2.87 1.09 0.73 7.1024 November 2005 1.19 0.40 3.92 0.74 0.59 1.30 1.33 0.80 5.4926 November 2005 0.70 0.48 2.11 1.41 0.46 2.87 1.43 1.07 4.8628 November 2005 0.24 0.45 1.17 0.64 0.49 3.84 1.59 1.24 5.1130 November 2005 1.38 0.35 1.60 1.07 0.57 4.52 2.51 0.96 1.952 December 2005 0.69 0.33 1.06 1.07 0.55 4.04 1.87 0.96 2.456 December 2005 0.32 0.45 1.31 0.77 0.55 3.65 1.43 0.67 3.238 December 2005 0.55 0.60 1.70 1.30 0.58 3.35 2.65 1.06 4.9210 December 2005 0.40 0.53 1.18 0.91 0.57 2.77 1.99 0.88 4.7112 December 2005 0.30 0.46 0.95 0.23 0.73 1.99 0.71 0.40 6.5014 December 2005 0.28 0.69 1.24 0.30 0.57 1.78 0.95 0.61 4.87
Min 0.24 0.33 0.95 0.23 0.46 1.30 0.71 0.40 1.95Max 1.38 0.69 3.92 1.41 0.73 4.52 2.65 1.24 7.10
The analytical results showed that the SPM collected in St Vincent Bay had a distinctly differentchemical composition to that of the other two bays (Table 8 and Figure 4). Indeed, in St Vincent Bay’sSPM, 7 of the 9 analysed metals (Co, Cr, Fe, Mg, Mn, Ni, Si) were highly enriched, up to one order ofmagnitude (e.g., Co, Ni or Mn) compared with the two others sites. Only the behaviour of Ca differed,being slightly more concentrated in the SPM collected in Dumbéa Bay, particularly during the secondhalf of the sampling period (Figure 4).
In terms of intra–site variability, the metal and Ca concentrations remained relatively constant inSt Vincent Bay’s SPM, while they evolved in Dumbéa Bay and particularly in Boulari Bay (Figure 4).This time-variation started with high metal concentrations at the beginning of the study period(21 and 22 November) followed by a strong decrease over a 4-day period (23 to 27 November) beforeincreasing to the highest values at the end of the sampling period. This increasing trend was irregularin Dumbéa Bay, where the highest concentrations were observed from 4 December, while in Boulari

Water 2017, 9, 338 12 of 24
Bay, the increase was slight but continuous to reach the maximum values for all the metals and Ca on14 December. The mean concentrations increased about 2, 3 and 5 times, in St Vincent, Dumbéa andBoulari bays, respectively.
Table 7. Concentrations of dissolved Fe, Mn and Ni in bays and coral reef barrier (n = 965). Analysiscarried out between November 2013 and August 2016 in the frame of marine environmental monitoringalong the west coast of New Caledonia (unpublished environmental monitoring data of the surroundingarea of the KNS plant). Observed especially in the shallow bays, the extreme Std Deviations demonstratethe high variability of the metal concentration levels generated by the lixiviation of the exploited basins.
Location Fe (µg·L−1) Mn (µg·L−1) Ni (µg·L−1)
Bays (n = 288) 0.241 ± 0.444 4.565 ± 9.802 2.904 ± 4.700Intermediate (n = 315) 0.123 ± 0.095 0.422 ± 0.659 0.322 ± 0.423
Reef (n = 362) 0.058 ± 0.061 0.103 ± 0.095 0.115 ± 0.100
Water 2017, 9, 338 12 of 24
being slightly more concentrated in the SPM collected in Dumbéa Bay, particularly during the second half of the sampling period (Figure 4).
In terms of intra–site variability, the metal and Ca concentrations remained relatively constant in St Vincent Bay’s SPM, while they evolved in Dumbéa Bay and particularly in Boulari Bay (Figure 4). This time-variation started with high metal concentrations at the beginning of the study period (21 and 22 November) followed by a strong decrease over a 4-day period (23 to 27 November) before increasing to the highest values at the end of the sampling period. This increasing trend was irregular in Dumbéa Bay, where the highest concentrations were observed from 4 December, while in Boulari Bay, the increase was slight but continuous to reach the maximum values for all the metals and Ca on 14 December. The mean concentrations increased about 2, 3 and 5 times, in St Vincent, Dumbéa and Boulari bays, respectively.
(a)
(b)
Figure 4. Cont.

Water 2017, 9, 338 13 of 24Water 2017, 9, 338 13 of 24
(c)
Figure 4. Time variation of the Ca and the 8 metals analysed in SPM trapped during study period from 21 November to 14 December, 2005 in each sampling site: (a) Boulari Bay; (b) Dumbéa Bay and (c) St Vincent Bay.
Table 8. Minimum and maximum concentrations for the analysed elements in SPM trapped during study period from 21 November to 14 December 2005 in each sampling site.
Concentration (mg kg–1) Al Ca Co Cr Fe Mg Mn Ni Si
Boulari bay Min 1930 12,990 13 208 690 15,874 87 195 4750 Max 11,520 53,710 76 1209 51,820 29,169 568 1157 31,850
Dumbéa bay Min 6740 33,060 24 306 17,420 17,672 183 473 25,830 Max 22,740 119,600 78 1025 58,190 32,064 765 1332 86,590
StVincent bay Min 11,220 38,360 105 1204 64,670 43,684 844 2033 63,780 Max 18,440 73,950 164 1856 97,900 51,051 1459 3012 102,940
For each bay, variations in elements concentrations were remarkably correlated (R2 > 0.850) except for (Table 9): (i) Mg, where concentrations showed poor correlations with other SPM metals in Dumbéa Bay (mean R2 ≈ 0.480) and no correlation in Boulari Bay (mean R2 ≈ 0.223); (ii) Ca and all the other metals in St Vincent Bay (mean R2 ≈ 0.534), and, to a lesser extent, in Dumbéa Bay (mean R2 ≈ 0.710), and with Mg in Boulari Bay (R2 = 0.236).
Table 9. Correlation coefficients (R2) for Ca, Mg, Fe, Co, Cr, Mn, Ni, Al and Si concentrations in the suspended matter trapped from 21 November to 14 December in each sampling site: (a) Boulari Bay, (b) Dumbéa Bay and (c) St Vincent Bay.
Boulari BayCa Mg Fe Co Cr Mn Ni Al Si
Ca 1 0.236 0.994 0.989 0.987 0.988 0.988 0.995 0.993 Mg 1 0.221 0.223 0.217 0.248 0.209 0.233 0.212 Fe 1 0.998 0.994 0.995 0.993 0.999 0.993 Co 1 0.996 0.998 0.994 0.995 0.986 Cr 1 0.992 0.992 0.993 0.983 Mn 1 0.991 0.994 0.984 Ni 1 0.991 0.982 Al 1 0.996 Si 1
(a)
Figure 4. Time variation of the Ca and the 8 metals analysed in SPM trapped during study periodfrom 21 November to 14 December, 2005 in each sampling site: (a) Boulari Bay; (b) Dumbéa Bay and(c) St Vincent Bay.
Table 8. Minimum and maximum concentrations for the analysed elements in SPM trapped duringstudy period from 21 November to 14 December 2005 in each sampling site.
Concentration (mg kg–1) Al Ca Co Cr Fe Mg Mn Ni Si
Boulari bay Min 1930 12,990 13 208 690 15,874 87 195 4750Max 11,520 53,710 76 1209 51,820 29,169 568 1157 31,850
Dumbéa bay Min 6740 33,060 24 306 17,420 17,672 183 473 25,830Max 22,740 119,600 78 1025 58,190 32,064 765 1332 86,590
StVincent bay Min 11,220 38,360 105 1204 64,670 43,684 844 2033 63,780Max 18,440 73,950 164 1856 97,900 51,051 1459 3012 102,940
For each bay, variations in elements concentrations were remarkably correlated (R2 > 0.850) exceptfor (Table 9): (i) Mg, where concentrations showed poor correlations with other SPM metals in DumbéaBay (mean R2 ≈ 0.480) and no correlation in Boulari Bay (mean R2 ≈ 0.223); (ii) Ca and all the othermetals in St Vincent Bay (mean R2 ≈ 0.534), and, to a lesser extent, in Dumbéa Bay (mean R2 ≈ 0.710),and with Mg in Boulari Bay (R2 = 0.236).
Table 9. Correlation coefficients (R2) for Ca, Mg, Fe, Co, Cr, Mn, Ni, Al and Si concentrations in thesuspended matter trapped from 21 November to 14 December in each sampling site: (a) Boulari Bay,(b) Dumbéa Bay and (c) St Vincent Bay.
Boulari Bay
Ca Mg Fe Co Cr Mn Ni Al Si
Ca 1 0.236 0.994 0.989 0.987 0.988 0.988 0.995 0.993Mg 1 0.221 0.223 0.217 0.248 0.209 0.233 0.212Fe 1 0.998 0.994 0.995 0.993 0.999 0.993Co 1 0.996 0.998 0.994 0.995 0.986Cr 1 0.992 0.992 0.993 0.983
Mn 1 0.991 0.994 0.984Ni 1 0.991 0.982Al 1 0.996Si 1
(a)

Water 2017, 9, 338 14 of 24
Table 9. Cont.
Dumbéa Bay
Ca Mg Fe Co Cr Mn Ni Al Si
Ca 1 0.688 0.702 0.701 0.604 0.826 0.655 0.772 0.734Mg 1 0.484 0.468 0.419 0.497 0.461 0.514 0.516Fe 1 0.998 0.985 0.946 0.988 0.992 0.997Co 1 0.986 0.948 0.990 0.989 0.994Cr 1 0.888 0.986 0.962 0.977
Mn 1 0.912 0.962 0.945Ni 1 0.971 0.988Al 1 0.995Si 1
(b)
St Vincent Bay
Ca Mg Fe Co Cr Mn Ni Al Si
Ca 1 0.438 0.542 0.448 0.483 0.450 0.634 0.725 0.552Mg 1 0.953 0.958 0.961 0.808 0.813 0.878 0.920Fe 1 0.986 0.963 0.869 0.905 0.954 0.963Co 1 0.941 0.903 0.866 0.904 0.949Cr 1 0.754 0.853 0.922 0.932
Mn 1 0.833 0.796 0.806Ni 1 0.908 0.803Al 1 0.948Si 1
(c)
The geochemical compositions of SPM (Figure 4, Table 8, which differed substantially betweenthe 3 bays, contrast strongly with the average composition of red laterites (Table 10). Comparatively,red laterite showed much lower levels of Ca, Mg and Si (Table 10), being composed principally of Fewith a high proportion of Cr. The concentrations of the other elements in the red laterites were thesame order of magnitude as those observed in the SPMs collected in the bays.
Table 10. Mean concentrations (n = 22) of the main elements analysed in the red laterite of the southand west coastal ore sites of New Caledonia.
Concentration (mg·kg–1) Al Ca Co Cr Fe Mg Mn Ni Si
Mean 26,566 117 437 19,677 586,760 2560 3887 5760 6920StDev 3170 69 21 1309 46,928 381 221 939 1803
4.7. Mineralogy
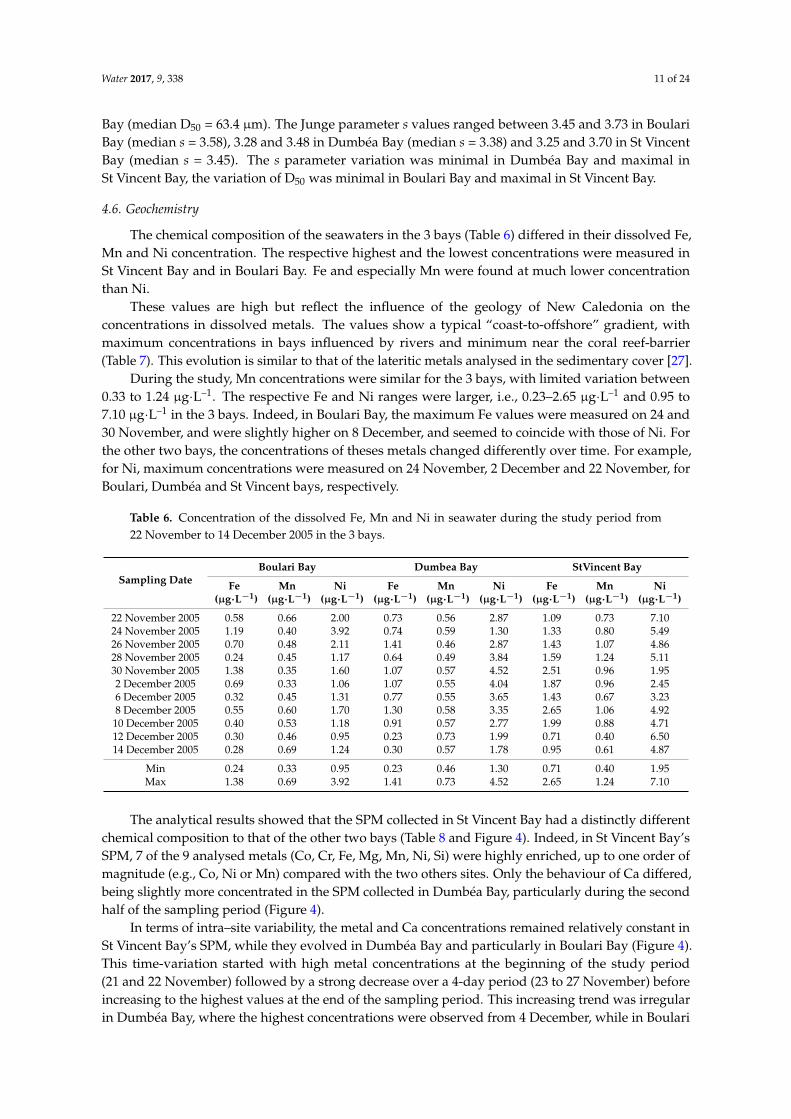
The minerals detected in both fractions ∅ < 40 µm and ∅ > 40 µm were not significantly differentbetween each sampled site; the main difference being that clay minerals were enhanced in the finerfraction. The main minerals detected in the suspended sediments of the 3 bays analysed were:carbonates (calcite, Mg-calcite and aragonite), goethite, talc, serpentine and quartz (Figure 5). Smectitewas detected in St Vincent and Boulari Bays, but was not significant in Dumbéa Bay. The peaks oftalc and serpentine were less intense in Dumbéa Bay than in the two other bays. In the 3 sites, otherdetected, but less abundant, minerals were: kaolinite, feldspar, pyroxene, and olivine.
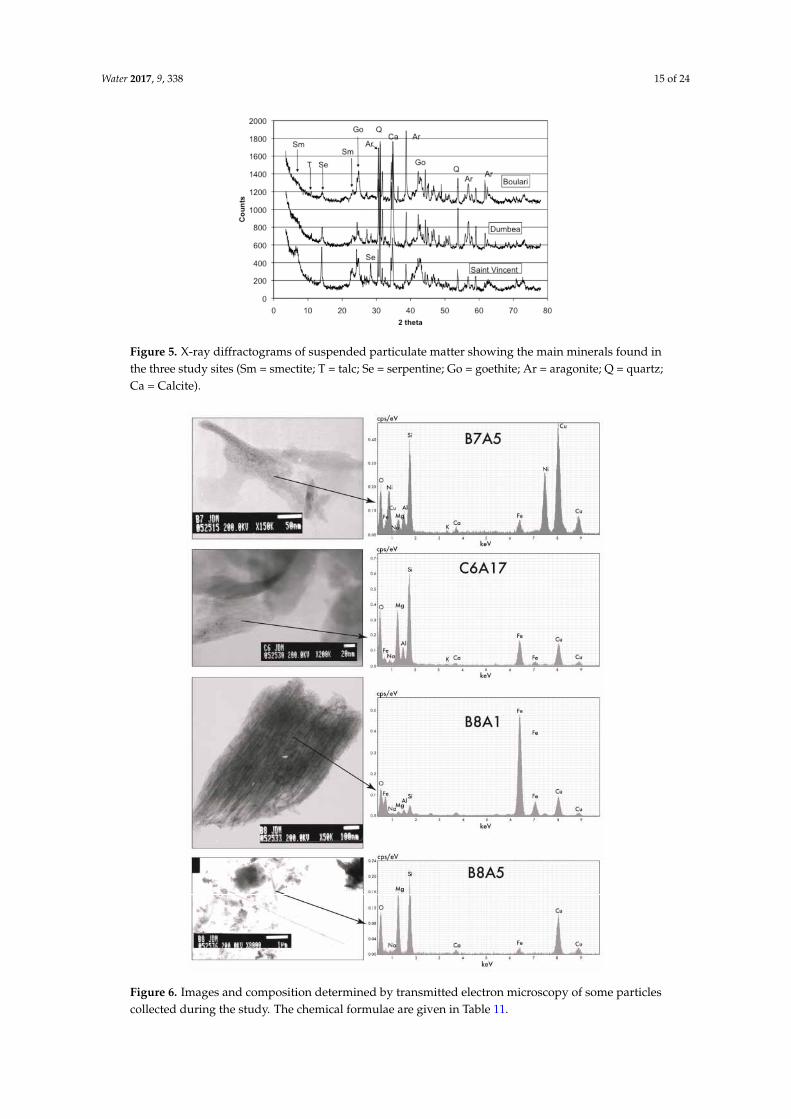
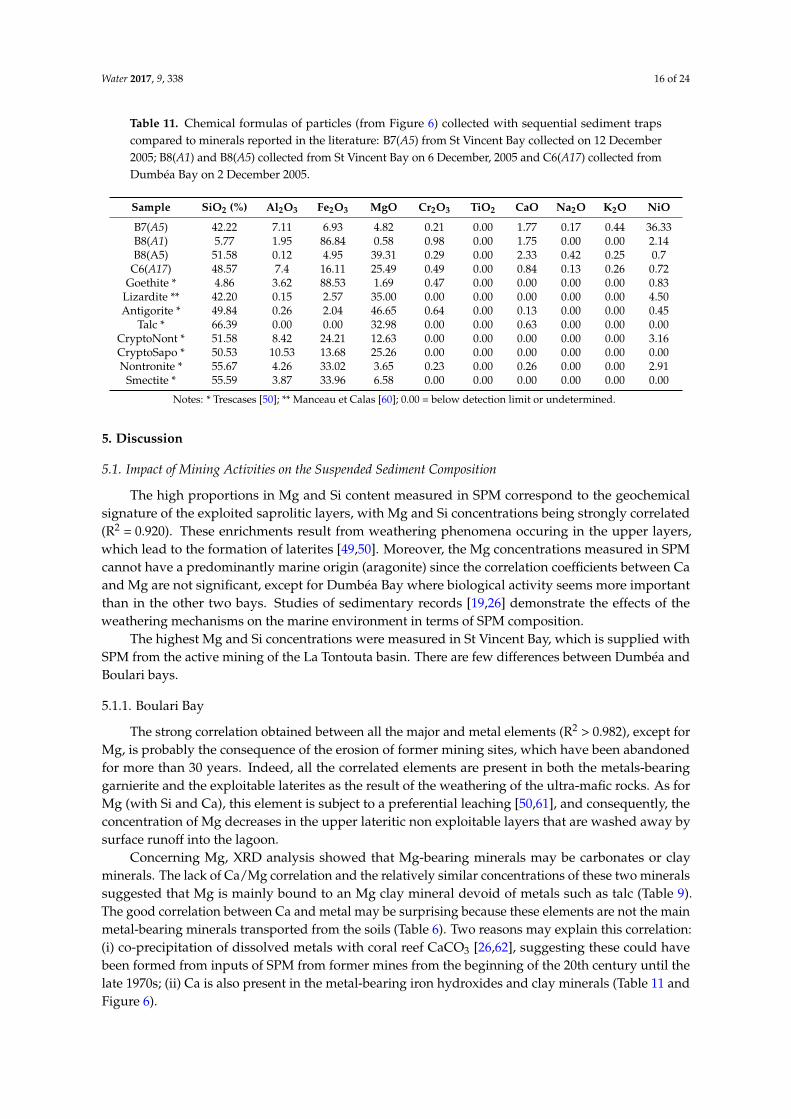
TEM observations were mainly focused on the Ni-bearing minerals found in the bays. Carbonates,quartz, feldspar, biogenic silica (diatom tests) detected by TEM did not contain Ni, according to EDSspectra. Ni was detected in goethite and clay minerals (Figure 6 and Table 11).
Water 2017, 9, 338 15 of 24Water 2017, 9, 338 15 of 24
Figure 5. X-ray diffractograms of suspended particulate matter showing the main minerals found in the three study sites (Sm = smectite; T = talc; Se = serpentine; Go = goethite; Ar = aragonite; Q = quartz; Ca = Calcite).
Figure 6. Images and composition determined by transmitted electron microscopy of some particles collected during the study. The chemical formulae are given in Table 11.
Figure 5. X-ray diffractograms of suspended particulate matter showing the main minerals found inthe three study sites (Sm = smectite; T = talc; Se = serpentine; Go = goethite; Ar = aragonite; Q = quartz;Ca = Calcite).
Water 2017, 9, 338 15 of 24
Figure 5. X-ray diffractograms of suspended particulate matter showing the main minerals found in the three study sites (Sm = smectite; T = talc; Se = serpentine; Go = goethite; Ar = aragonite; Q = quartz; Ca = Calcite).
Figure 6. Images and composition determined by transmitted electron microscopy of some particles collected during the study. The chemical formulae are given in Table 11. Figure 6. Images and composition determined by transmitted electron microscopy of some particlescollected during the study. The chemical formulae are given in Table 11.
Water 2017, 9, 338 16 of 24
Table 11. Chemical formulas of particles (from Figure 6) collected with sequential sediment trapscompared to minerals reported in the literature: B7(A5) from St Vincent Bay collected on 12 December2005; B8(A1) and B8(A5) collected from St Vincent Bay on 6 December, 2005 and C6(A17) collected fromDumbéa Bay on 2 December 2005.
Sample SiO2 (%) Al2O3 Fe2O3 MgO Cr2O3 TiO2 CaO Na2O K2O NiO
B7(A5) 42.22 7.11 6.93 4.82 0.21 0.00 1.77 0.17 0.44 36.33B8(A1) 5.77 1.95 86.84 0.58 0.98 0.00 1.75 0.00 0.00 2.14B8(A5) 51.58 0.12 4.95 39.31 0.29 0.00 2.33 0.42 0.25 0.7
C6(A17) 48.57 7.4 16.11 25.49 0.49 0.00 0.84 0.13 0.26 0.72Goethite * 4.86 3.62 88.53 1.69 0.47 0.00 0.00 0.00 0.00 0.83
Lizardite ** 42.20 0.15 2.57 35.00 0.00 0.00 0.00 0.00 0.00 4.50Antigorite * 49.84 0.26 2.04 46.65 0.64 0.00 0.13 0.00 0.00 0.45
Talc * 66.39 0.00 0.00 32.98 0.00 0.00 0.63 0.00 0.00 0.00CryptoNont * 51.58 8.42 24.21 12.63 0.00 0.00 0.00 0.00 0.00 3.16CryptoSapo * 50.53 10.53 13.68 25.26 0.00 0.00 0.00 0.00 0.00 0.00Nontronite * 55.67 4.26 33.02 3.65 0.23 0.00 0.26 0.00 0.00 2.91
Smectite * 55.59 3.87 33.96 6.58 0.00 0.00 0.00 0.00 0.00 0.00
Notes: * Trescases [50]; ** Manceau et Calas [60]; 0.00 = below detection limit or undetermined.
5. Discussion
5.1. Impact of Mining Activities on the Suspended Sediment Composition
The high proportions in Mg and Si content measured in SPM correspond to the geochemicalsignature of the exploited saprolitic layers, with Mg and Si concentrations being strongly correlated(R2 = 0.920). These enrichments result from weathering phenomena occuring in the upper layers,which lead to the formation of laterites [49,50]. Moreover, the Mg concentrations measured in SPMcannot have a predominantly marine origin (aragonite) since the correlation coefficients between Caand Mg are not significant, except for Dumbéa Bay where biological activity seems more importantthan in the other two bays. Studies of sedimentary records [19,26] demonstrate the effects of theweathering mechanisms on the marine environment in terms of SPM composition.
The highest Mg and Si concentrations were measured in St Vincent Bay, which is supplied withSPM from the active mining of the La Tontouta basin. There are few differences between Dumbéa andBoulari bays.
5.1.1. Boulari Bay
The strong correlation obtained between all the major and metal elements (R2 > 0.982), except forMg, is probably the consequence of the erosion of former mining sites, which have been abandonedfor more than 30 years. Indeed, all the correlated elements are present in both the metals-bearinggarnierite and the exploitable laterites as the result of the weathering of the ultra-mafic rocks. As forMg (with Si and Ca), this element is subject to a preferential leaching [50,61], and consequently, theconcentration of Mg decreases in the upper lateritic non exploitable layers that are washed away bysurface runoff into the lagoon.
Concerning Mg, XRD analysis showed that Mg-bearing minerals may be carbonates or clayminerals. The lack of Ca/Mg correlation and the relatively similar concentrations of these two mineralssuggested that Mg is mainly bound to an Mg clay mineral devoid of metals such as talc (Table 9).The good correlation between Ca and metal may be surprising because these elements are not the mainmetal-bearing minerals transported from the soils (Table 6). Two reasons may explain this correlation:(i) co-precipitation of dissolved metals with coral reef CaCO3 [26,62], suggesting these could havebeen formed from inputs of SPM from former mines from the beginning of the 20th century until thelate 1970s; (ii) Ca is also present in the metal-bearing iron hydroxides and clay minerals (Table 11 andFigure 6).

Water 2017, 9, 338 17 of 24
The high content of metals in SPM collected at the beginning of the sampling period (21 to22 November) can be correlated with the presence of a large amount of fine particles as suggested byboth the Junge parameter (s = 3.7) and the high turbidity (4.7 FTU) (Figure 3). In the days that followed,the increase in the mean diameter (D50) and the decrease in the Junge parameter s demonstratedthat a fast physical and chemical aggregation occurred from 24 to 26 November. This aggregation,probably with organic matter, was accompanied by a significant solid dilution in the terrigenousmetal concentrations in the SPM (Figure 4). This reduction in the metal concentration was highlightedby the sharp decrease in the distribution coefficients (Kd) of the lateritic metal nickel (Figure 7).Later, aggregates became finer (Figure 3) with a higher specific surface area, and relatively stableconcentrations in metals (28 November to 7 December, Figure 7). From 8 December onwards, the fluxof trapped SPM was fairly constant; however, a drastic increase in metal concentrations was observed.These results suggest that sedimentation resulted mostly from settling of small particles (∅ < 10 µm).
Water 2017, 9, 338 17 of 24
followed, the increase in the mean diameter (D50) and the decrease in the Junge parameter s demonstrated that a fast physical and chemical aggregation occurred from 24 to 26 November. This aggregation, probably with organic matter, was accompanied by a significant solid dilution in the terrigenous metal concentrations in the SPM (Figure 4). This reduction in the metal concentration was highlighted by the sharp decrease in the distribution coefficients (Kd) of the lateritic metal nickel (Figure 7). Later, aggregates became finer (Figure 3) with a higher specific surface area, and relatively stable concentrations in metals (28 November to 7 December, Figure 7). From 8 December onwards, the flux of trapped SPM was fairly constant; however, a drastic increase in metal concentrations was observed. These results suggest that sedimentation resulted mostly from settling of small particles (∅ < 10 µm).
Figure 7. Particulate Ni flux, distribution constant (Kd) of Ni and dissolved concentration of Ni for Boulari, Dumbéa and St Vincent bays over the study period (21 November to 14 December 2005), 3 m above the seabed.
5.1.2. Dumbéa Bay
A strong correlation was observed between the metals and the major elements Si and Fe. For Mg, no correlation was found with the other analysed elements (Table 9). Mg concentrations were similar to those measured in Boulari Bay’s SPM but two times lower than the ones observed in St Vincent Bay. This can be interpreted as a low contribution of smectite as shown by the XRD
Figure 7. Particulate Ni flux, distribution constant (Kd) of Ni and dissolved concentration of Ni forBoulari, Dumbéa and St Vincent bays over the study period (21 November to 14 December 2005), 3 mabove the seabed.

Water 2017, 9, 338 18 of 24
5.1.2. Dumbéa Bay
A strong correlation was observed between the metals and the major elements Si and Fe. For Mg,no correlation was found with the other analysed elements (Table 9). Mg concentrations were similarto those measured in Boulari Bay’s SPM but two times lower than the ones observed in St VincentBay. This can be interpreted as a low contribution of smectite as shown by the XRD determinations(Figure 5). Regarding Ca, its concentrations in Dumbéa Bay were much higher than in Boulari Bay andis likely to be generated by strong resuspension of carbonated debris from numerous coral reef colonies,by trade winds upstream of the sampling area (Table 8). Indeed, Dumbéa Bay shelters fringing reefsand corals both, alive and dead, on its sea bottom which constitute an important source of carbonatescompared to the Coulée River mouth [36]. The metals were only slightly correlated to Ca and thisprobably reflects the low residence time of seawaters in this bay [63].
The concentrations of metals determined in the SPM were averaged at the beginning of the studyperiod (22 November), and correlated well with the presence of fine particles (s = 3.45); in spite ofthis, the turbidity remained low (1.3 FTU) (Figures 3 and 4). From the 24 of November onwards, thestrong increase in median diameter (D50 > 75 µm) and reduction in the Junge parameter (s < 3.36)preceded a strong sedimentation (Figure 3); this increase in particle size led to a reduction in the metalconcentrations in the SPM, a phenomenon identified by the decline in the metal distribution constants(Kd), for example Nickel (Figure 7).
The concentrations of particulate metals progressively increased with the reduction in turbidityand median diameter of SPM until the end of the study period. This phenomenon was probablydue to the increase in the specific surface area of the particles. The turbidity and especially the SPMflux was correlated with the strength and direction of the wind while the bottom currents were quitelow. Hence, the increase in the mass of SPM probably corresponded to the resuspension of carbonateparticles originating from the fringing coral patches of shallow depth found south-east of the bay andsubjected to trade winds, as shown by the significant increase in Ca concentrations observed (Figure 4).Until 11 December, the trade winds may have been the cause of occasional deposition of aeolian nickeldust generating the high metal concentration increase observed in the SPM; this dust is generated bythe nickel processing SLN plant (Figure 1) located on the south-east coast of Dumbéa Bay. After thatdate, the westerly winds that blew until the end of the study period were probably responsible for thedecrease in the concentration of metals (Figures 2 and 4).
5.1.3. St Vincent Bay
Except for Ca, a strong correlation was also observed between the metals and the major elements(Si, Fe and Mg) but the values of R2 were slightly lower than in Boulari Bay (Table 9). The correlationis well explained by the present-day mining extraction of less weathered lateritic layers enrichedwith metals. The main difference with Boulari Bay is that a high correlation was observed betweenMg and the metals and a lower correlation between Ca and the metals. XRD from St Vincent Baysamples showed the presence of smectite (Figure 5) not observed in Boulari Bay’s SPM, which mightexplain the difference. SPM in St Vincent Bay was also enriched in Fe and Si (and Al, not presentedin this paper) compared to the other bays, which might be explained by the higher proportion ofclays. The high concentrations of Ca suggested a sizeable contribution of resuspended carbonates asa result of the regular effect of the winds in this shallow bay. Besides this, a significant proportionof former resuspended coral reef debris could explain the lower correlation of Ca with the metals inSt Vincent Bay.
Over the study period, some variations were observed in the metal concentrations present in theSPM with no major trends evident and of smaller amplitude than in the 2 other bays. However, a clearcorrelation between Kd values and the tide was detected, with smaller Kd at neap tides than at springtides (Figure 7). During spring tides, the resuspension of fine particles and subsequent adsorption ofmetals (Kd values) increased. Nevertheless, resuspension was not only caused by tides, but also bythe wind regimes. Indeed, on the 24 November, an increase in turbidity and in the Junge parameter

Water 2017, 9, 338 19 of 24
and a decrease in D50 highlighted a resuspension event at the end of a spring tide period, due tothe re-establishment of trade winds (Figures 2, 3 and 7). Aggregation of suspended particles andsubsequent deposition followed, but was interrupted by a short resuspension event on the 2 December,likely due to the combined effect of spring tides and waves generated by the wind. This resuspensionlikely induced the high amount of SPM collected on 4 December. Immediately after a short period oftrade winds, aggregation and deposition were observed from 8 December during weak westerly andvariable winds, hence promoting the deposition of aggregates.
5.2. Origin of the Minerals
All of the detrital minerals detected were previously described [50] from the weathering profiles ofthe plateaus. The predominance of clay minerals in St Vincent Bay and Boulari Bay may be attributedto the presence of, respectively, actual and former open cast mines in their watershed which erode thedeeper lateritic horizons where clay minerals are for the most part located.
In all the lagoon sediments, carbonates minerals (calcite, aragonite, Mg carbonate), absent in theriverine sediments, provide evidence of sediment resuspension [26]. Other authors [64] also showedthat in the different typical bottoms of the lagoon, more than 80% of total sedimentation was linked todeposition of resuspended benthic material. Suspended sediments present in St Vincent Bay containthe same main terrestrial minerals as those detected in the Tontouta River: quartz, goethite, talc,serpentine and smectite. However, smectite and serpentinite may also result from neoformation inthe delta area or in the bay itself [26,50,65]; the presence of smectite was higher in St Vincent Bay thanin the connected Tontouta River. In tBoulari Bay under trade wind conditions, SPM contained thesame minerals as those found in St Vincent Bay except that goethite was more present than clays.During a west wind regime, no clay minerals were detected, and goethite and quartz were the onlyterrestrial minerals found. During the same period, SPM collected in Dumbéa Bay were characterizedby the same minerals as in St Vincent Bay, but clays and goethite contents were lower and sampleswere dominated by lagoonal material (calcites and aragonite). These results therefore show thatthe mineralogical composition of suspended sediments in the 3 bays was not strictly related to thecomposition of sediments transported by their connected rivers. These findings may be due to thepresence of authigenic minerals in the bay [26,36] besides detrital particles.
A chemical analysis of a goethite particle referenced as B8A1 (Table 11 and Figure 6) yields similarresults to the one given by [50]. Chrysotile (a mineral from the serpentine family) particles forming longacicular tubes were also detected (referenced as C6A17 in Table 11 and Figure 6. This mineral is formedin fractures of the ultrabasites and results from an episode of serpentinisation which concentratesNi [50]. Compared to other serpentinites analysed previously [50,60], the analysed chrysotile particlehad a comparable chemical composition (Table 11). A particle with a different composition (less Aland Mg and more Fe) was also detected (referenced as B8A5 in Table 6 and Figure 6. The compositionof this particle is comparable to a poorly crystallized smectite named crypto nontronite [50], which isfound in sediments of the deltaic plain and probably originates from diagenesis.
The composition of the particle referenced B7A5 (Table 11 and Figure 6) is more intriguingbecause of its high Ni content. It could be comparable to a clay mineral like that of a serpentinephase with a high degree of Ni substitution, but such a composition has not yet been reported inNew Caledonia. Neoformed serpentine has been identified [26] in the lagoonal sediments of DumbéaBay but was not quantified. In addition, the serpentinite was of the Fe (III) type and comparable tothe authigenic green phyllosilicates described by Odin et al. [66] in the lagoonal sediments of NewCaledonia. Authigenic clay minerals in the Amazon delta have also been described by Michalopoulosand Aller [67], who demonstrated that clay minerals may form rapidly in the sediment pores afterliberation of Si from the diatoms and Al and Fe from the oxy-hydroxides derived from the drainagebasin. The amount of diatoms or other biogenic silica sources is not known in New Caledonia but theirpresence has been detected here by TEM. Besides this, goethite is abundant. We therefore supportthe idea that the high amount of Ni in the clay particle B7A5 resulted from Ni incorporation in the
Water 2017, 9, 338 20 of 24
structure of the clay during diagenesis. This statement implies that part of the dissolved Ni in thelagoon may be fixed by minerals, which limit its dissemination.
6. Conclusions
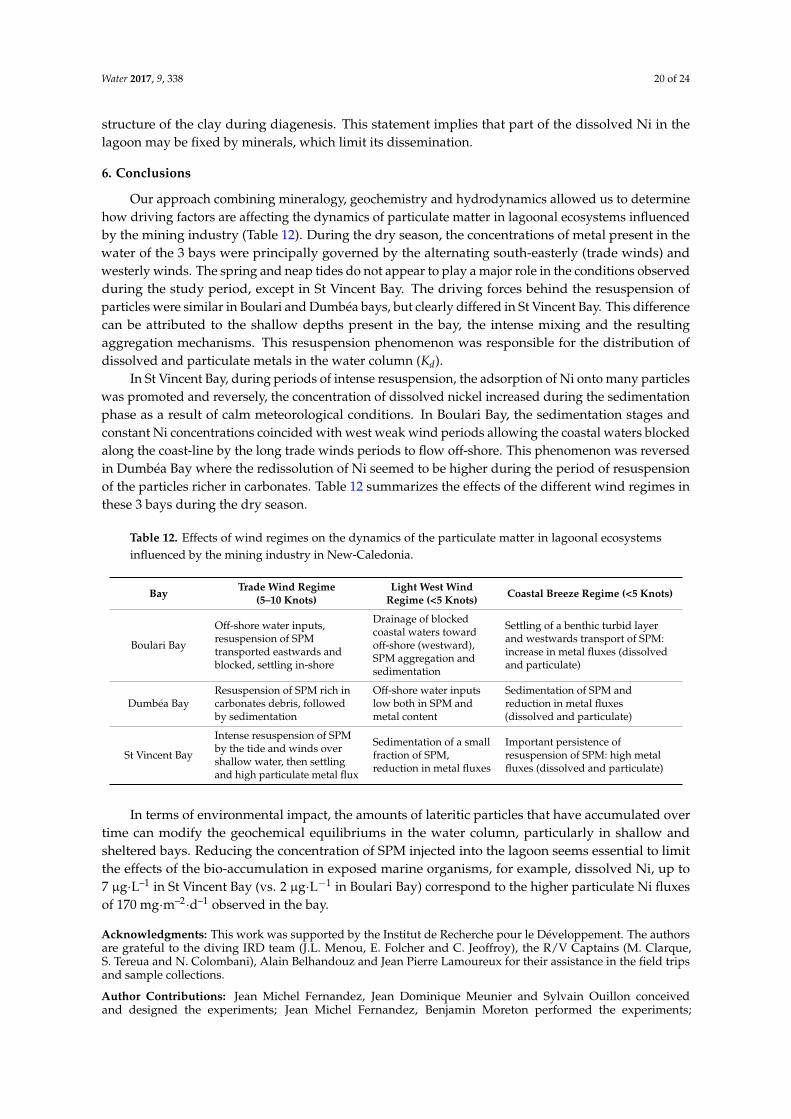
Our approach combining mineralogy, geochemistry and hydrodynamics allowed us to determinehow driving factors are affecting the dynamics of particulate matter in lagoonal ecosystems influencedby the mining industry (Table 12). During the dry season, the concentrations of metal present in thewater of the 3 bays were principally governed by the alternating south-easterly (trade winds) andwesterly winds. The spring and neap tides do not appear to play a major role in the conditions observedduring the study period, except in St Vincent Bay. The driving forces behind the resuspension ofparticles were similar in Boulari and Dumbéa bays, but clearly differed in St Vincent Bay. This differencecan be attributed to the shallow depths present in the bay, the intense mixing and the resultingaggregation mechanisms. This resuspension phenomenon was responsible for the distribution ofdissolved and particulate metals in the water column (Kd).
In St Vincent Bay, during periods of intense resuspension, the adsorption of Ni onto many particleswas promoted and reversely, the concentration of dissolved nickel increased during the sedimentationphase as a result of calm meteorological conditions. In Boulari Bay, the sedimentation stages andconstant Ni concentrations coincided with west weak wind periods allowing the coastal waters blockedalong the coast-line by the long trade winds periods to flow off-shore. This phenomenon was reversedin Dumbéa Bay where the redissolution of Ni seemed to be higher during the period of resuspensionof the particles richer in carbonates. Table 12 summarizes the effects of the different wind regimes inthese 3 bays during the dry season.
Table 12. Effects of wind regimes on the dynamics of the particulate matter in lagoonal ecosystemsinfluenced by the mining industry in New-Caledonia.
Bay Trade Wind Regime(5–10 Knots)
Light West WindRegime (<5 Knots) Coastal Breeze Regime (<5 Knots)
Boulari Bay
Off-shore water inputs,resuspension of SPMtransported eastwards andblocked, settling in-shore
Drainage of blockedcoastal waters towardoff-shore (westward),SPM aggregation andsedimentation
Settling of a benthic turbid layerand westwards transport of SPM:increase in metal fluxes (dissolvedand particulate)
Dumbéa BayResuspension of SPM rich incarbonates debris, followedby sedimentation
Off-shore water inputslow both in SPM andmetal content
Sedimentation of SPM andreduction in metal fluxes(dissolved and particulate)
St Vincent Bay
Intense resuspension of SPMby the tide and winds overshallow water, then settlingand high particulate metal flux
Sedimentation of a smallfraction of SPM,reduction in metal fluxes
Important persistence ofresuspension of SPM: high metalfluxes (dissolved and particulate)
In terms of environmental impact, the amounts of lateritic particles that have accumulated overtime can modify the geochemical equilibriums in the water column, particularly in shallow andsheltered bays. Reducing the concentration of SPM injected into the lagoon seems essential to limitthe effects of the bio-accumulation in exposed marine organisms, for example, dissolved Ni, up to7 µg·L–1 in St Vincent Bay (vs. 2 µg·L−1 in Boulari Bay) correspond to the higher particulate Ni fluxesof 170 mg·m–2·d–1 observed in the bay.
Acknowledgments: This work was supported by the Institut de Recherche pour le Développement. The authorsare grateful to the diving IRD team (J.L. Menou, E. Folcher and C. Jeoffroy), the R/V Captains (M. Clarque,S. Tereua and N. Colombani), Alain Belhandouz and Jean Pierre Lamoureux for their assistance in the field tripsand sample collections.
Author Contributions: Jean Michel Fernandez, Jean Dominique Meunier and Sylvain Ouillon conceivedand designed the experiments; Jean Michel Fernandez, Benjamin Moreton performed the experiments;

Water 2017, 9, 338 21 of 24
Jean Michel Fernandez, Benjamin Moreton, Pascal Douillet, Olivier Grauby, Jean Dominique Meunier andSylvain Ouillon analysed the data; Jean Michel Fernandez, Jean Dominique Meunier and Sylvain Ouillon wrotethe paper.
Conflicts of Interest: The authors declare no conflict of interest.
References
1. Labrosse, P.; Fichez, R.; Farman, R.; Adams, T. New Caledonia. In Seas at the Millenium, an EnvironmentalEvaluation; Sheppard, C., Ed.; Elsevier: Amsterdam, The Netherlands, 2000; Volume 2, pp. 723–736.
2. Pandolfi, J.M.; Bradbury, R.H.; Sala, E.; Hughes, T.P.; Bjorndal, K.A.; Cooke, R.G.; McArdle, D.;McClenachan, L.; Newman, M.J.H.; Paredes, G.; et al. Global trajectories of the long-term decline ofcoral reef ecosystems. Science 2003, 301, 955–958. [CrossRef] [PubMed]
3. Doney, S.C. The growing human footprint on coastal and open-ocean biogeochemistry. Science 2010, 328,1512–1516. [CrossRef] [PubMed]
4. Burke, L.; Reytar, K.; Spalding, M.; Perry, A. Reefs at Risk Revisited; World Resources Institute: Washington, DC,USA, 2011; Available online: http://pdf.wri.org/reefs_at_risk_revisited.pdf (accessed on 3 January 2017).
5. Maina, J.; McClanahan, T.R.; Venus, V.; Ateweberhan, M.; Madin, J. Global gradients of coral exposureto environmental stresses and implications for local management. PLoS ONE 2011, 6, e23064. [CrossRef][PubMed]
6. Brodie, J.E.; Kroon, F.J.; Schaffelke, B.; Wolanski, E.C.; Lewis, S.E.; Devlin, M.J.; Bohnet, I.C.; Bainbridge, Z.T.;Waterhouse, J.; Davis, A.M. Terrestrial pollutant runoff to the Great Barrier Reef: An update of issues,priorities and management responses. Mar. Poll. Bull. 2012, 65, 81–100. [CrossRef] [PubMed]
7. De’ath, G.; Fabricius, K.E.; Sweatman, H.; Puotinen, M. The 27-year decline of coral cover on the GreatBarrier Reef and its causes. PNAS 2012, 109, 17995–17999. [CrossRef] [PubMed]
8. Erftemeijer, P.L.A.; Riegl, B.; Hoeksema, B.W.; Todd, P.A. Environmental impacts of dredging and othersediment disturbances on corals: A review. Mar Poll. Bull. 2012, 64, 1737–1765. [CrossRef] [PubMed]
9. Morrison, R.J.; Denton, G.R.W.; Bale Tamata, U.; Grignon, J. Anthropogenic biogeochemical impacts on coralreefs in the Pacific Islands-An overview. Deep-Sea Res. II 2013, 96, 5–12. [CrossRef]
10. Myers, N.; Mittermeier, R.A.; Mittermeier, C.G.; da Fonseca, G.A.B.; Kent, J. Biodiversity hotspots forconservation priorities. Nature 2000, 403, 853–858. [CrossRef] [PubMed]
11. Alongi, D.M. Present state and future of the world’s mangrove forests. Environ. Conserv. 2002, 29, 331–349.[CrossRef]
12. Bouchet, P.; Lozouet, P.; Maestrati, P.; Heros, V. Assessing the magnitude of species richness in tropicalmarine environments: Exceptionally high numbers of molluscs at a New Caledonia site. Biol. J. Linn. Soc.2002, 75, 421–436. [CrossRef]
13. Nagelkerken, I.; Blaber, S.J.M.; Bouillon, S.; Green, P.; Haywood, M.; Kirton, L.G.; Meynecke, J.O.; Pawlik, J.;Penrose, H.M.; Sasekumar, A.; et al. The habitat function of mangroves for terrestrial and marine fauna:A review. Aquat. Bot. 2008, 89, 155–185. [CrossRef]
14. Adjeroud, M.; Fernandez, J.M.; Caroll, A.G.; Harrison, P.L.; Penin, L. Spatial patterns and recruitmentprocesses of coral assemblages among contrasting environmental conditions in the southwestern lagoon ofNew Caledonia. Mar. Poll. Bull. 2010, 61, 375–386. [CrossRef] [PubMed]
15. Losfeld, G.; L’Huillier, L.; Fogliani, B.; Jaffré, T.; Grison, C. Mining in New Caledonia: Environmental stakesand restoration opportunities. Environ. Sci. Pollut. Res. 2015, 22, 5592–5607. [CrossRef] [PubMed]
16. Hédouin, L.; Bustamante, P.; Fichez, R.; Warnau, M. The tropical brown alga Lobophora variegate asa bioindicator of mining contamination in the New Caledonia lagoon: A field transplantation study.Mar. Environ. Res. 2008, 66, 438–444. [CrossRef] [PubMed]
17. Metian, M.; Bustamante, P.; Hédouin, L.; Warnau, M. Accumulation of nine metals and one metalloid inthe tropical scallop Comptopallium radula from coral reefs in New Caledonia. Environ. Pollut. (Oxford, UK)2008, 152, 543–552. [CrossRef] [PubMed]
18. Hédouin, L.; Bustamante, P.; Churlaud, C.; Pringault, O.; Fichez, R.; Warnau, M. Trends in concentrations ofselected metalloid and metals in two bivalves from the SW lagoon of New Caledonia. Ecotoxicol. Environ. Saf.2009, 72, 372–381. [CrossRef] [PubMed]
Water 2017, 9, 338 22 of 24
19. Debenay, J.P.; Fernandez, J.M. Benthic foraminifera records of complex anthropogenic environmental changescombined with geochemical data in a tropical bay of New Caledonia. Mar. Poll. Bull. 2009, 59, 311–322.[CrossRef] [PubMed]
20. Bonnet, X.; Briand, M.; Brischoux, F.; Letourneur, Y.; Fauvel, T.; Bustamante, P. Anguilliform fish reveal largescale contamination by mine trace elements in the coral reefs of New Caledonia. Sci. Total Environ. 2014,470–471, 876–882. [CrossRef] [PubMed]
21. Cuif, M.; Kaplan, D.M.; Lefèvre, J.; Faure, V.M.; Caillaud, M.; Verley, P.; Vigliola, L.; Lett, C. Wind-inducedvariability in larval retention in a coral reef system: A biophysical modelling study in the South-West Lagoonof New Caledonia. Prog. Oceanogr. 2014, 122, 105–115. [CrossRef]
22. Gilbert, A.; Heintz, T.; Hoeksema, B.W.; Benzoni, F.; Fernandez, J.M.; Fauvelot, C.; Andrefouet, S. EndangeredNew Caledonian endemic mushroom coral Cantharellus noumeae in turbid, metal-rich, natural and artificialenvironments. Mar. Poll. Bull. 2015, 100, 359–369. [CrossRef] [PubMed]
23. Heintz, T.; Haapkylä, J.; Gilbert, A. Coral health on reefs near mining sites in New Caledonia. Dis. Aquat. Org.2015, 115, 165–173. [CrossRef] [PubMed]
24. Dugas, F. La sedimentation en baie de St Vincent (Côte ouest de la Nouvelle-Caledonie). In Cah. ORSTOM, ser.Géol.; Office de la recherche scientifique et technique outre-mer (ORSTOM): Paris, France, 1974; Volume VI,pp. 41–62.
25. Bird, E.C.F.; Dubois, J.P.; Iltis, J.A. The Impact of Opencast Mining on the Rivers and Coasts of New Caledonia;The United Nation University: Shibuya, Japan, 1984; Available online: http://archive.unu.edu/unupress/unupbooks/80505e/80505E00.htm (accessed on 9 May 2017).
26. Ambatsian, P.; Fernex, F.; Bernant, M.; Parron, C.; Lecolle, J. High metal inputs to close seas:The New-Caledonia Lagoon. J. Geochem. Explor. 1997, 59, 59–74. [CrossRef]
27. Fernandez, J.-M.; Ouillon, S.; Chevillon, C.; Douillet, P.; Fichez, R.; Le Gendre, R. A combined modelling andgeochemical study of the fate of terrigenous inputs from mixed natural and mining sources in a coral reeflagoon (New Caledonia). Mar. Poll. Bull. 2006, 52, 320–331. [CrossRef] [PubMed]
28. Fichez, R.; Adjeroud, M.; Bozec, Y.M.; Breau, L.; Chancerelle, Y.; Chevillon, C.; Douillet, P.; Fernandez, J.M.;Frouin, P.; Kulbicki, M.; et al. A review of selected indicators of particle, nutrient and metal input in coralreef lagoon systems. Aquat. Living Res. 2005, 18, 125–147. [CrossRef]
29. Grenz, C.; Le Borgne, R.; Fichez, R.; Torreton, J.P. Tropical lagoon multidisciplinary investigations: Anoverview of the PNEC New Caledonia pilot site. Mar. Poll. Bull. 2010, 61, 267–268. [CrossRef] [PubMed]
30. A collective of 75 authors. Atlas de la Nouvelle Calédonie, IRD ed.; Institut de Recherche pour le Développement(IRD): Marseille, France, 2013; ISBN: 978-2-7099-1740-7.
31. Breau, L. Extractions Séquentielles et Analyses de Métaux dans une Carotte de Sédiments Lagonaires Datée:Mise en Evidence de L’évolution des Apports Terrigènes Liée aux Activités Humaines au Cours des 150Dernières Années. Master’s Thesis, University Aix-Marseille II, Marseille, France, 1998.
32. Magand, O. Contribution à la Modélisation du Transport de la Matière Particulaire dans le Lagon Sud-Ouestde Nouvelle-Calédonie: Etude des flux, Détermination des Signatures Minéralogiques et Evolution Spatiale.Master’s Thesis, University Perpignan, Perpignan, France, 1998.
33. Magand, O. Recherche et Définition des Signatures Géochimiques (Métaux Lourds et Lanthanides) desSources Terrigènes du Lagon Sud-Ouest de Nouvelle-Calédonie. Master’s Thesis, University Aix-MarseilleII, Marseille, France, 1999.
34. Fernandez, J.-M.; Moreton, B.; Fichez, R.; Breau, L.; Magand, O.; Badie, C. Advantages of combining 210Pband geochemical signature determinations in sediment record studies, application to coral reef lagoonenvironments. In Environmental Changes and Radioactive Tracers, IRD ed.; Fernandez, J.-M., Fichez, R., Eds.;Institut de Recherche pour le Développement (IRD): Paris, France, 2002; pp. 187–200.
35. Moreton, B.M.; Fernandez, J.-M.; Dolbecq, M.B.D. Development of a field preconcentration/elution unitfor routine determination of dissolved metal concentrations by ICP-OES in marine waters: Application formonitoring of the New Caledonia lagoon. Geostand. Geoanal. Res. 2009, 33, 205–218. [CrossRef]
36. Ouillon, S.; Douillet, P.; Lefebvre, J.P.; Le Gendre, R.; Jouon, A.; Bonneton, P.; Fernandez, J.M.; Chevillon, C.;Magand, O.; Lefèvre, J.; et al. Circulation and suspended sediment transport in a coral reef lagoon:The southwest lagoon of New Caledonia. Mar. Poll. Bull. 2010, 61, 269–296. [CrossRef] [PubMed]

Water 2017, 9, 338 23 of 24
37. Fichez, R.; Chifflet, S.; Douillet, P.; Gérard, P.; Gutierrez, F.; Jouon, A.; Ouillon, S.; Grenz, C. Biogeochemicaltypology and temporal variability of lagoon waters in a coral reef ecosystem subject to terrigeneous andanthropogenic inputs (New Caledonia). Mar. Poll. Bull. 2010, 61, 309–322. [CrossRef] [PubMed]
38. Douillet, P. Tidal dynamics of the south-west lagoon of New Caledonia: Observations and 2D numericalmodelling. Oceanol. Acta 1998, 21, 69–79. [CrossRef]
39. Douillet, P.; Ouillon, S.; Cordier, E. A numerical model for fine suspended sediment transport in thesouth-west lagoon of New-Caledonia. Coral Reefs 2001, 20, 361–372. [CrossRef]
40. Jouon, A.; Lefebvre, J.P.; Douillet, P.; Ouillon, S.; Schmied, L. Wind wave measurements and modelling in afetch-limited semi-enclosed lagoon. Coast. Eng. 2009, 56, 599–608. [CrossRef]
41. Andréfouët, S.; Cabioch, G.; Flamand, B.; Pelletier, B. A reappraisal of the diversity of geomorphologicaland genetic processes of New Caledonian coral reefs: A synthesis from optical remote sensing, coring andacoustic multibeam observations. Coral Reefs 2009, 28, 691–707. [CrossRef]
42. Lillie, A.R.; Brothers, R.N. The geology of New-Caledonia. N. Zeal. J. Geol. Geophys. 1970, 13, 159–167.[CrossRef]
43. Paris, J.P. Les Ressources Minérales de Nouvelle-Calédonie; Mémoire 113, Bureau de Recherches Géologiques etMinières (BRGM): Orléans, France, 1981.
44. Antheaume, B. Chronique de l’Atlas de la Nouvelle-Calédonie, un bilan méthodologique et critique.Cahiers ORSTOM. Série Schum 1981, 18, 389–398.
45. Paris, J.P. Gîtes minéraux et substances utiles. In Atlas de Nouvelle-Calédonie; Sautter, G., Ed.; ORSTOM: Paris,France, 1981.
46. Perrier, N.; Ambrosi, J.P.; Colin, F.; Gilkes, R.J. Biogeochemistry of a regolith: The new Caledonian Koniamboultramafic massif. J. Geochem. Explor. 2006, 88, 54–58. [CrossRef]
47. Dublet, G.; Fandeur, D.; Juillot, F.; Morin, G.; Ambrosi, J.P.; Fritsch, E.; Brown, G.E., Jr. Ni speciation in aNew Caledonian lateritic regolith: A quantitative X-ray absorption spectroscopy investigation. Geochim.Cosmochim. Acta 2012, 95, 119–133. [CrossRef]
48. Dublet, G.; Juillot, F.; Morin, G.; Fritsch, E.; Noel, V.; Brest, J.; Brown, G.E., Jr. XAS evidence for Nisequestration by siderite in a latéritic Ni-deposit from New Caledonia. Am. Miner. 2014, 99, 225–234.[CrossRef]
49. Dublet, G.; Juillot, F.; Morin, G.; Fritsch, E.; Fandeur, D.; Brown, G.E., Jr. Goethite aging explains Ni depletionin upper units of ultramafic lateritic ores. Geoch. Cosmoch. Acta 2015, 160, 1–15. [CrossRef]
50. Trescases, J.J. L’évolution Geochimique Supergène des Roches Ultrabasiques en Zone Tropicale. Formationdes Gisements Nickélifères de Nouvelle-Calédonie. Ph.D. Thesis, University Louis Pasteur, Strasbourg,France, 1973.
51. Pesin, E.; Blaize, S.; Lacoste, D. Atlas Climatique de la Nouvelle Calédonie; Météo France: Nouméa,New Caledonia, 1995.
52. Baltzer, F.; Trescases, J.J. Erosion, transport et sédimentation liés aux cyclones tropicaux dans les massifsd’ultrabasites de Nouvelle-Calédonie. Cahiers ORSTOM Série Géologie III 1973, 2, 221–244.
53. Dugas, F.; Debenay, J.P. Carte Sédimentologique et carte Annexe du Lagon de Nouvelle Calédonie au 1/50000—MontDore, Tontouta, Prony, Nouméa; Notices explicatives n◦ 76, 86, 91 and 95; ORSTOM: Paris, France, 1982.
54. Heussner, S.; Ratti, C.; Carbonne, J. The PPS3 times series sediment trap and the trap sample processingtechniques used during the ECOMARGE experiment. Cont. Shelf Res. 1990, 10, 943–958. [CrossRef]
55. Jouon, A.; Ouillon, S.; Douillet, P.; Lefebvre, J.P.; Fernandez, J.-M.; Mari, X.; Froidefond, J.M. Spatio-temporalvariability in suspended particulate matter concentration and the role of aggregation on size distribution ina coral reef lagoon. Mar. Geol. 2008, 256, 36–48. [CrossRef]
56. Lefebvre, J.-P.; Ouillon, S.; Vinh, V.D.; Arfi, R.; Panche, J.-Y.; Mari, X.; Thuoc, C.V.; Torreton, J.P.Seasonal variability of cohesive sediment aggregation in the Bach Dang-Cam Estuary, Haiphong (Vietnam).Geo-Mar. Lett. 2012, 32, 103–121. [CrossRef]
57. Mobley, C.D. Light and Water Radiative Transfer in Natural Water; Academic Press: San Diego, CA, USA, 1994.58. Pinet, S.; Martinez, J.-M.; Ouillon, S.; Lartiges, B.; Villar, R.E. Variability of apparent and inherent optical
properties of sediment-laden waters in large river basins—Lessons from in situ measurements and bio-opticalmodeling. Opt. Express 2017, 25, A283–A310. [CrossRef] [PubMed]
59. Cliff, G.; Lorimer, G.W. The quantitative analysis of thin specimens. J. Microsc. 1975, 103, 203–207. [CrossRef]

Water 2017, 9, 338 24 of 24
60. Manceau, A.; Calas, G. heterogneous distribution of nickel in hydrous silicates from New Caledonia oredeposits. Am. Miner. 1985, 70, 549–558.
61. Pelletier, B. Serpentines in Nickel Silicate Ore from New-Caledonia. In Proceedings of the Publications-Australasian Institute of Mining and Metallurgy, Kalgoolie, Australia, 27–29 November 1996; Volume 27–29,pp. 197–206.
62. Wartel, M.; Skirer, M.; Auger, T.; Boughriet, A. Interaction of manganese II with carbonates in sea water:Assessment of the solubility product of MnCO3 and Mn distribution coefficient between the liquid phaseand CaCO3 particles. Mar. Chem. 1990, 29, 99–117. [CrossRef]
63. Jouon, A.; Douillet, P.; Ouillon, S.; Fraunié, P. Calculations of hydrodynamic time parameters in asemi-opened coastal zone using a 3D hydrodynamic model. Cont. Shelf Res. 2006, 26, 1395–1415. [CrossRef]
64. Clavier, J.; Chardy, P.; Chevillon, C. Sedimentation of particulate matter in the South-west lagoon ofNew Caledonia: Spatial and Temporal Patterns. Est. Coast. Shelf Sci. 1995, 40, 281–294. [CrossRef]
65. Baltzer, F. Géodynamique de la Sédimentation et Diagénèse Précoce en Domaine Ultrabasique, Nouvelle-Calédonie;ORSTOM: Paris, France, 1982.
66. Odin, G.S. Green Marine Clays; Elsevier: Amsterdam, The Netherlands, 1988.67. Michalopoulos, P.; Aller, R.C. Rapid clay mineral formation in Amazon delta sediments: Reverse weathering
and oceanic elemental cycles. Science 1995, 270, 614–617. [CrossRef]
© 2017 by the authors. Licensee MDPI, Basel, Switzerland. This article is an open accessarticle distributed under the terms and conditions of the Creative Commons Attribution(CC BY) license (http://creativecommons.org/licenses/by/4.0/).
Copyright © 2022 FDOKUMEN