Dynamics of suprabenthos-zooplankton communities around the Balearic Islands (western...
20
Dynamics of suprabenthos-zooplankton communities around the Balearic Islands (western Mediterranean): Influence of environmental variables and effects on the biological cycle of Aristeus antennatus J.E. Cartes a, ⁎ , T. Madurell a , E. Fanelli a , J.L. López-Jurado b a CSIC - Institut de Ciències del Mar de Barcelona. Passeig Marítim de La Barceloneta, 37-49, 08003 Barcelona, Spain b IEO - Centro Oceanográfico de Baleares, Moll de Ponent s/n, 07015 Palma de Mallorca, Spain Received 28 June 2006; accepted 7 November 2006 Available online 3 January 2008 Abstract Dynamics of suprabenthos and zooplankton were analyzed in two areas located in the NW (off Sóller harbour) and S (off Cabrera Archipelago) of Mallorca (Balearic Islands, western Mediterranean) at depths ranging between 135–780 m. Four stations situated respectively at 150 m (shelf-slope break), and at bathyal depths of 350, 650 and 750 m were sampled at bi-monthly intervals during six cruises performed between August 2003 and June 2004. Suprabenthos showed maximum biomass in both areas from late spring to summer (April to August), while minimum biomass was found in autumn (September–November). Though variable, temporal dynamics of zooplankton showed peaks of biomass in late winter and summer (February and June), while minimals occurred in autumn (August–September) and, at bathyal depths, in April. Suprabenthos (abundance; MDS analyses) showed a sample aggregation as a function of depth (3 groups corresponding to the shelf-slope break, upper slope — over 350 m; and the middle, deeper part of the slope — over 650–750 m), without any separation of hauls by season. By contrast, zooplankton samples were separated by season and not by depth. There was evidence of three seasonal groups corresponding to summer (June 2004–August 2003), autumn–winter (September and November 2003, February 2004), and spring (April 2004), being especially well established off Sóller. In general, suprabenthos was significantly correlated with the sediment variables (e.g. total organic matter content (% OM), potential REDOX), whereas zooplankton was almost exclusively dependent on Chl a at the surface, which suggests two different food sources for suprabenthos and zooplankton. The increase of suprabenthos abundance in April–June was paralleled by a sharp increase (ca. 2.8 times) in the %OM on sediment during the same period, coupled ca. 1–2 months of delay with the peak of surface Chl a recorded in February–March (from satellite imagery data). Suprabenthos biomass was also correlated with salinity close to the bottom, suggesting a link between suprabenthos abundance and changes in the oceanographic condition of water masses close to the bottom. It is suggested that a higher suprabenthos biomass recorded off Sóller in comparison to that off Cabrera in June could, in turn, be related to a seasonal inflow of Levantine Intermediate Water (LIW) in April–June in this area at mid bathyal depths (350–650 m). This trend would be based on: 1) it was evident only at mid-slope depths between 350–750 m, coinciding with the LIW distribution, and 2) it was not recorded among zooplankton (collected throughout the water column). The possible effect of the fluctuations of suprabenthos and zooplankton on higher trophic levels has been explored studying the diet and food consumption rates of the red shrimp Aristeus antennatus, as indicator species by its dominance in bathyal communities. A. antennatus increased its food consumption from February to April–June 2004 off Sóller, which in the case of large (CL N 40 mm) specimens was found in both areas. In addition, there was a shift of diet from winter to spring–early summer. Available online at www.sciencedirect.com Journal of Marine Systems 71 (2008) 316 – 335 www.elsevier.com/locate/jmarsys ⁎ Corresponding author. Tel.: +34 932309500; fax: +34 932309555. E-mail address: [email protected] (J.E. Cartes). 0924-7963/$ - see front matter © 2007 Elsevier B.V. All rights reserved. doi:10.1016/j.jmarsys.2006.11.013
Transcript of Dynamics of suprabenthos-zooplankton communities around the Balearic Islands (western...
Available online at www.sciencedirect.com
s 71 (2008) 316–335www.elsevier.com/locate/jmarsys
Journal of Marine System
Dynamics of suprabenthos-zooplankton communities around theBalearic Islands (western Mediterranean): Influence of
environmental variables and effects on thebiological cycle of Aristeus antennatus
J.E. Cartes a,⁎, T. Madurell a, E. Fanelli a, J.L. López-Jurado b
a CSIC - Institut de Ciències del Mar de Barcelona. Passeig Marítim de La Barceloneta, 37-49, 08003 Barcelona, Spainb IEO - Centro Oceanográfico de Baleares, Moll de Ponent s/n, 07015 Palma de Mallorca, Spain
Received 28 June 2006; accepted 7 November 2006Available online 3 January 2008
Abstract
Dynamics of suprabenthos and zooplankton were analyzed in two areas located in the NW (off Sóller harbour) and S (offCabrera Archipelago) of Mallorca (Balearic Islands, western Mediterranean) at depths ranging between 135–780 m. Four stationssituated respectively at 150 m (shelf-slope break), and at bathyal depths of 350, 650 and 750 m were sampled at bi-monthlyintervals during six cruises performed between August 2003 and June 2004. Suprabenthos showed maximum biomass in both areasfrom late spring to summer (April to August), while minimum biomass was found in autumn (September–November). Thoughvariable, temporal dynamics of zooplankton showed peaks of biomass in late winter and summer (February and June), whileminimals occurred in autumn (August–September) and, at bathyal depths, in April. Suprabenthos (abundance; MDS analyses)showed a sample aggregation as a function of depth (3 groups corresponding to the shelf-slope break, upper slope — over 350 m;and the middle, deeper part of the slope — over 650–750 m), without any separation of hauls by season. By contrast, zooplanktonsamples were separated by season and not by depth. There was evidence of three seasonal groups corresponding to summer (June2004–August 2003), autumn–winter (September and November 2003, February 2004), and spring (April 2004), being especiallywell established off Sóller. In general, suprabenthos was significantly correlated with the sediment variables (e.g. total organicmatter content (% OM), potential REDOX), whereas zooplankton was almost exclusively dependent on Chl a at the surface, whichsuggests two different food sources for suprabenthos and zooplankton. The increase of suprabenthos abundance in April–June wasparalleled by a sharp increase (ca. 2.8 times) in the %OM on sediment during the same period, coupled ca. 1–2 months of delaywith the peak of surface Chl a recorded in February–March (from satellite imagery data). Suprabenthos biomass was alsocorrelated with salinity close to the bottom, suggesting a link between suprabenthos abundance and changes in the oceanographiccondition of water masses close to the bottom. It is suggested that a higher suprabenthos biomass recorded off Sóller in comparisonto that off Cabrera in June could, in turn, be related to a seasonal inflow of Levantine Intermediate Water (LIW) in April–June inthis area at mid bathyal depths (350–650 m). This trend would be based on: 1) it was evident only at mid-slope depths between350–750 m, coinciding with the LIW distribution, and 2) it was not recorded among zooplankton (collected throughout the watercolumn). The possible effect of the fluctuations of suprabenthos and zooplankton on higher trophic levels has been exploredstudying the diet and food consumption rates of the red shrimp Aristeus antennatus, as indicator species by its dominance inbathyal communities. A. antennatus increased its food consumption from February to April–June 2004 off Sóller, which in the caseof large (CLN40 mm) specimens was found in both areas. In addition, there was a shift of diet from winter to spring–early summer.
⁎ Corresponding author. Tel.: +34 932309500; fax: +34 932309555.E-mail address: [email protected] (J.E. Cartes).
0924-7963/$ - see front matter © 2007 Elsevier B.V. All rights reserved.doi:10.1016/j.jmarsys.2006.11.013

317J.E. Cartes et al. / Journal of Marine Systems 71 (2008) 316–335
In this last period, A. antennatus preyed upon euphausiids and mesopelagic decapods and fish, while benthos (e.g. polychaetes andbivalves) decreased in the diet. This indicates an increase in the food consumption and probably in the caloric content of the diet inpre-spawning females in April–June 2004, which is synchronized with the period when gonad development begins in A.antennatus females (May–June). Anyway, macrozooplankton, and not suprabenthos, is crucial as a high energetic food source inthe coupling between food intake and reproduction in the red shrimp.© 2007 Elsevier B.V. All rights reserved.
Keywords: Suprabenthos; Zooplankton; Western Mediterranean; Bathyal communities; Trophic level; Aristeus antennatus
1. Introduction
There is an increasing interest towards the study ofthe fauna occupying the water layer immediatelyadjacent to the sea bottom (the so-called suprabenthos,hyperbenthos or Benthic Boundary Layer macrofauna,Mees and Jones, 1997). This type of fauna is still poorlyknown even at descriptive levels such as its taxonomyand assemblage composition, and this is particularly truefor deep-water suprabenthos.
Suprabenthos is a complex compartment mainly com-posed of peracarid crustaceans (e.g. mysids, amphipods)that constitutes the permanent suprabenthos, and othertaxa (e.g. euphausiids, natantian decapods), which bymeans of vertical or ontogenetic migrations have a moretemporary relationship with the water-sediment interface.Some authors distinguish between the permanent supra-benthos (=holohyperbenthos) and the temporary supra-benthos (=merohyperbenthos) (Mees and Jones, 1997). Infact, merohyperbenthos partially overlaps in terms oftaxon composition with macro-mesozooplankton. Themain adaptive biological feature of the permanent supra-benthos is the direct development of embryos in broodpouches (oostegites) developed by adult females of pera-carid crustaceans.
Studies on suprabenthos were first focused on thedistribution of dominant taxa and assemblages in thewater column (Bieri and Tokioka, 1968), as a function ofdepth (Sainte-Marie and Brunel, 1985; Buhl-Jensen,1986), and to a lesser extent to seasonal changes inassemblage composition (Boysen, 1976) and populationdynamics. Recently, studies on plankton-suprabenthoscoupling (Richoux et al., 2004a,b) found a synchronismbetween the release of juveniles and maximum foodavailability derived from spring phytoplankton blooms inthe mysid Mysis mixta and the amphipod Acanthoste-pheia malmgreni inhabiting the shallowest part of theslope (at 240 m depth). The influence of environmentalvariability on suprabenthos dynamics has been rarelyexamined, particularly at bathyal depths. Changes insediment type associated to hydrodynamism (Cartes et al.,2003), or the arrival of fresh organic matter to the bottom
have been suggested as possible causes of this variability(Cartes et al., 2002; Richoux et al., 2004a,b).
In addition, most suprabenthic groups (e.g. mysids,amphipods) constitute the basis of the diet of littoral andbathyal top predators (e.g. flatfish: Wildish et al., 1992;hake: Cartes et al., 2004; the deep sea red shrimp Aristeusantennatus: Cartes, 1994; Sardà and Cartes, 1997),particularly of their smallest size classes or recruits andhence its importance in foodwebs dynamics. In spite of itsobvious ecological interest (Mees and Jones, 1997; Carteset al., 2002), information on the dynamics of suprabenthiccommunities is still scarce (Cartes et al., 2002). In the dietof bathyal species, the smallest sizes of some ecologicallyimportant (and commercial) species (e.g. A. antennatus,CLb20 mm) and hake (TLb10 cm) consume supra-benthos (mysids, cumaceans, and amphipods; Cartes,1994; Sardà and Cartes, 1997; Bozzano et al., 1997), whilelargest juveniles increasingly consume mero-hyperbenthos-zooplankton (e.g. decapods, small mycto-phids; Cartes et al., 2004).
Temporal dynamics of open-water zooplankton com-munities has been the focus of a number of studies in thewesternMediterranean (Franqueville, 1971; Sabatés et al.,1989; Sardou et al., 1996). The variety of gears (e.g.Bongo nets, IKMT), difference in mesh-size used, andsampling design are important limitations for under-taking detailed comparisons. However, maximum zoo-plankton biomass has been regularly reported in spring(Sabatés et al., 1989; Sardou et al., 1996), sometimes alongthe continental shelf edge in associationwith hydrographicfronts (Sabatés et al., 1989), which act as nursery areas forsome zooplankton stages (Boucher et al., 1987). Anotherregular pattern arising in the western Mediterranean is thedominance of jellyfish (e.g. salps, cnidarians) among deepmacroplankton in winter (January to March, Franqueville,1971). Since studies on the dynamics of suprabenthos atbathyal depths are practically non-existent (Cartes et al.,2002; Richoux et al., 2004a,b), this is the first comparativestudy focused on the simultaneous dynamics of bothcompartments.
The objective of this paper is to describe the dynamics ofsuprabenthos and zooplankton in two neighbouring regions

318 J.E. Cartes et al. / Journal of Marine Systems 71 (2008) 316–335
(separated by 60 nm) situated around the island ofMallorca(Balearic Islands), a priori subjected to different oceano-graphic conditions, and to explore possible environmentalvariables that could explain these dynamics. Winter windsfrom the Gulf of Lyons act on the oceanographic dynamicsof western Mediterranean water masses, controlling thesouth–north flux of Atlantic waters at surface around theBalearic Islands. This is combined with other oceano-graphic processes (e.g. dynamics of Levantine IntermediateWaters — LIW, and Western Mediterranean IntermediateWaters — WIW) occurring in sub-surface layers (Font,1987; López-Jurado et al., 2008-this issue). As aconsequence, differences in annual ocean dynamics andin the biological response of trophic webs are expected inboth study sites. Furthermore, the possible effect of thesechanges in the diet of a dominant-target species for fisheriesin this area, the shrimp A. antennatus, is discussed as anexample of the coupling processes linking different trophiclevels in deep-bathyal communities.
2. Material and methods
2.1. Study area and sampling strategy
The study was performed in two areas situated in theNW and S of Mallorca (Balearic Islands, westernMediterranean) within the framework of the multi-disciplinary project IDEA (Fig. 1) Changes in density(individuals/100m2), and biomass (g wet weight/100m2)were explored at two sites (Sóller: 38°98′ N–2°57′ E;39°14′ N–2°76′ E; Cabrera: 39°68′ N–2°18′ E; 39°81′
Fig. 1. Map of the study area (Balearic Islands, western Mediterranean), indstations simultaneously covered.
N–2°37′E) separated by a distance of ca. 60 nm. TheNWsite was close to the harbour of Sóller, included in theBalearic subbasin (between the coasts of Catalonia–NEIberian Peninsula–and theBalearic Islands). The S sitewasclose to the Cabrera Archipelago, included in the Algeriansubbasin. The Balearic and the Algerian subbasins areseparated by depths of ca. 600 m in the Mallorca channel,placed between the islands of Eivissa and Mallorca.
Suprabenthos and meso-macrozooplankton weresampled. A total of 46 Macer-GIROQ sledges and 461 m2 WP2 plankton nets were performed correspondingto six cruises (IDEA0803: 3–7 August 2003; IDEA0903:25 September–1 October 2003; IDEA1103: 13–21November 2003; IDEA0204: 14–20 February 2004;IDEA0404: 7–13 April 2004; IDEA0604 23–28 June2004). During each cruise, four stations (at depths ca. the150 m, 350 m, 650 m and 750 m isobaths) both off Sóllerand Cabrera were sampled, except for 2 stations situatedoff Sóller (IDEA1103: 650 m; IDEA0204: 150 m), whichcould not be sampled due to bad weather conditions.Distance between stations ranged from ca. 3 to 10 nm.The sledge used had two superimposed nets with mouthssampling suprabenthos between 10–40 and 50–90 cmabove the bottom. Only the lower net, where the largestamount of fauna was found, was processed.
One haul was taken at each station because previousstudies carried out using suprabenthic samplers had shownthat one haul was enough to characterize the community ofsuprabenthos in a particular area/time (Brattegard andFossa, 1991). Meso-macrozooplankton in the watercolumn was sampled using a non-closing WP2 net with a
icating the suprabenthos–zooplankton sampling and the hydrographic
319J.E. Cartes et al. / Journal of Marine Systems 71 (2008) 316–335
mouth area of 1 m2, in horizontal-oblique hauls performedfrom a few metres above the sea bottom (closest estimateddistance to the bottom between 13–90 m by means of aninclinometer) to the sea surface.
Both WP2 and sledges were equipped with 500 μmmesh size nets and were trawled to a similar speed (ca.1.5 knots). The duration of sledge hauls over the bottomwere ca. 10 min; the duration of WP2 was 10 min closeto the bottom (horizontal haul) and varied between 3–15 min during the recovery of the net throughout theentire water column. Standard 2030 flowmeters wereattached to the mouth of nets to measure the amount offiltered water and/or the distance/area covered by eachhaul. All samples were collected during daytime.
Specimenswere immediately frozen onboard at−20 °C(for later stable isotope analyses) or fixed (some jellyfish) inbuffered formaldehyde (4%) for further detailed taxonomicidentification, sorted (by aliquots ranging from 1/2 to 1/8 ofsamples from the small fraction of organisms in somecases), and identified to a high taxa level under a stereo-microscope (at ×10–×40). Peracarids and eucarids(decapods) were identified to species level only forIDEA0803 (authors unpublished data). All taxa werecounted and weighed (wet weight (WW) after eliminatingwater with blottingwater; dryweight was not considered toavoid damaging the samples).
Data was standardized (abundance — individuals/100 m2; wet weight — g/100 m2) for each haul.
2.1.1. Environmental variablesCTD transects were completed using a SBE911 and
SBE25 profiler furnished with a fluorometer (only inIDEA0404 and IDEA0604) andwith a SB37-SMmountedon the mouth of the trawl used to catch megabenthic fauna(fish and large invertebrates) in simultaneous haulsperformed in the same stations (see López-Jurado et al.,2008-this issue and Moranta et al., 2008-this issue, fordetails). At each profile, a measure of temperature andsalinity at 5 m above the bottom (T5 mab; S5 mab) wasobtained, and during IDEA04 and IDEA06 fluorometryalong all the water column was also recorded. Maximumfluorometry, depth of maximum fluorometry, and the sumof fluorometer readings by 1 m intervals from surface to200 m depth have been calculated from raw data.
Sediment for granulometric and organic analyses werecollected using a Shipeck grab at each station and cruise.Sediment variables considered were D50 (mean grain size),percentage of gravels, sand and mud (silt+clay) usingSedigraph techniques (see Guijarro et al., 2008-this issue,for more details). Total organic matter (%OM) content ofcollected sediment, calculated as difference between dryweight (DW: 80 °C during 24 h until reaching constant
weight) and ash weight (500 °C in a furnace during 2 h)were obtained. REDOXwas also obtained from sedimentsin grabs (using a ThermoOrion 250 A sensor) readingvoltage at surface and at 5 cm deep in the mud.
Phytoplankton pigment concentration (ppc, mg Chl am-3), obtained from http://reason.gsfc.nasa.gov/Giovanni,was used as indicator of the availability of trophic resourcesat the lowest levels of the trophic chain (Cartes et al., 2004).Monthly average ppc values obtained at the positionswherethe sledges/plankton netswere used (Cartes et al., 2004) anddata from different periods, both simultaneously and before1, 2, 3 and 4 months of the sampling, were considered.
2.2. Data treatment
Data on abundance (individuals/100 m2) of faunacollected were analyzed by cluster analysis and MDStechniques. Based on the correlation matrix generatedby clustering, Multi-Dimensional Scaling (MDS) wasapplied. Analyses for suprabenthos and zooplanktonincluded the following taxa:
• Suprabenthos, 15 taxonomic groups (Siphonophora,Decapoda Natantia, Euphausiacea, Mysidacea, Amphi-poda Gammaridea and Hyperiidea, Isopoda, Cumacea,Ostracoda, Copepoda, Nebaliacea, Pycnogonida,Cephalopoda, Chaetognatha and Osteichthyes).
• Zooplankton, comprising 24 taxa (Scyphozoa,Siphonophora, Ctenophora, Polychaeta, DecapodaNatantia, Decapoda larvae, Euphausiacea, Euphau-siacea larvae, Mysidacea, Amphipoda Gammarideaand Hyperiidea, Isopoda, Cumacea, Ostracoda,Calanoida, Cyclopoida, Gastropoda Prosobranchia,Pteropoda, Cephalopoda, Chaetognatha, Thaliacea,Pyrosomida and Osteichthyes, both adult and larvae).
For certain analyses (e.g. Multiple Regression mod-els), only some of these taxa were considered (seebelow). The benthic boundary layer macrofauna com-prises, in fact, a mixture of taxa with different ecologicalhabits and distribution in the water column-sedimentinterface (see Mees and Jones, 1997) and it is oftenimpossible to separate suprabenthos and zooplanktonspecies unless working at the species level. Somegelatinous zooplankton (salps, cnidarians) were excludedfrom some analyses due to difficulties in their sortingand quantification. Species/taxa appearing less than twicein all samples were removed from data matrices. Sometaxa, poorly represented in sledge samples and belong-ing to the (non-swimming) epifauna–infauna fraction(Polychaeta, Amphipoda Caprellidea, Tanaidacea andOphiuroidea) were also removed from the data matrix.

Fig. 2. Seasonal changes in suprabenthos biomass with depth off Sóller(discontinuous line) and Cabrera (continuous line).
Fig. 3. Seasonal changes in zooplankton biomass with depth off Sóller(discontinuous line) and Cabrera (continuous line).
320 J.E. Cartes et al. / Journal of Marine Systems 71 (2008) 316–335
The similarity index used in both cluster and MDSordination was 1-r (correlation coefficient of Pearson),after log-transformation of data). The aggregation algo-rithmwas theUPGMA (Unweighted-paired groupmethodaverage). The software STATISTICA 5.0 was used.
In order to establish possible relationships betweenspecies assemblage dynamics/structure and existing envir-onmental gradients, we tested for possible relationships(correlations) between the abundance and MDS dimen-sions of suprabenthos-zooplankton and some environ-mental variables (e.g. temperature, %OM in sediments)that were simultaneously recorded. A search was made forpossible correlations at two levels: 1) simple non para-metric Spearman rank correlations; and 2) Multi-linear
regression models (MLR; after log transformation of data),to identify the main explanatory variables of the dynamicsof suprabenthos/zooplankton.
3. Results
3.1. Trends in biomass
3.1.1. SuprabenthosSuprabenthos biomass changed seasonally and as a
function of depth both off Sóller and Cabrera (Fig. 2).Mean annual biomass was on average an order of
magnitude higher on upper–middle slope (between350–750 m: between 0.493 gWW/100 m2 at 750 m and0.671 gWW/100 m2 at 350 m) than on shelf-slope break(150 m: between 0.003–0.388 gWW/100 m2).

321J.E. Cartes et al. / Journal of Marine Systems 71 (2008) 316–335
Themean annual biomass was clearly higher in Cabrera(0.388 gWW/100m2) than in Sóller (0.003 gWW/100m2)at 150m,while at 350m and 650–750mbiomasswas verysimilar.
Seasonal changes followed parallel trends at both sites.Off Sóller, maximum biomass was recorded in
August–September at 150 m, and in June–August bothat 350 m and deeper at 650–750 m (Fig. 2). Minimumvalues were recorded in June at 150 m and in Septemberat 350 m and 650–750 m, with a sharp decrease to only0.0004–0.0009 gWW/100 m2.
Off Cabrera, maximum biomass was recorded inApril–June at 150 m, in August–September and Aprilat 350 m, and in February and June–August at 650–
Fig. 4. MDSperformedon suprabenthos abundance off Sóller (top) andCabrera (
750 m (Fig. 2). Minimum values were recorded inNovember–February at 150 m and in November at350 m–750 m, with a decrease until 0.027 gWW/100 m2 at 650 m.
Some regularities in the temporal dynamics of su-prabenthos were found, indicating peaks of maximumbiomass occurring in both areas from late spring tosummer (April to August) and never or rarely in autumn–winter (September–November and February). By con-trast,minimumbiomasswas regularly recorded in autumn(in September–November).
In general, seasonal fluctuations of biomass at slopedepths (below 350 m) were broader and more recurrentat all depths off Sóller than off Cabrera.
bottom). The labels indicate area (S: Sóller, C:Cabrera), month anddepth.

Table 1Composition of suprabenthos (abundance: individuals/100 m2)collected around Mallorca by depth strata and area
Cabrera Soller
150 m 350 m 650–750 m
150 m 350 m 650–750 m
Medusae⁎ 0 0 0.2 0 3.8 0.1Siphonophora 0.6 2.5 1.0 0.7 1.3 1.7Natantia⁎ 0.9 3.1 1.2 0.2 2.6 0.5Euphausiacea 0.8 1.1 2.0 0.1 1.7 2.2Mysidacea⁎⁎ 21.4 85.2 56.7 4.4 138.4 36.3AmphipodaGammaridea⁎⁎ 8.1 94.1 72.3 1.4 155.0 44.2Hyperiidea 0.5 0.3 1.4 0.5 1.3 1.0Caprellidea 0 0.5 0 0.1 0 0
Isopoda⁎⁎ 4.2 39.1 67.6 1.3 80.5 21.5Tanaidacea 0 0.2 0.1 0.1 1.6 0.1Cumacea⁎ 3.4 57.2 19.9 0.6 148.5 3.4Ostracoda⁎ 7.1 6.2 8.9 1.9 5.5 4.2CopepodaCalanoidea⁎ 267.1 342.4 140.9 73.6 279.3 148.1Cyclopoidea 3.2 0.1 0.9 3.6 2.2 2.3
Nebaliacea⁎⁎ 0 0 0 0 0.04 0.02Pycnogonida⁎ 0 0.04 0 0 0.1 0.05CopepodaCymbulia peroni 0.1 0 0 0 0 0Pteropoda 0.4 0.3 0.1 0.1 0.4 0.4
Cephalopoda 0.2 0.1 0 0 0.1 0Chaetognatha 4.5 13.8 2.5 1.8 3.7 2.5Thaliacea 0 0.1 0.02 0 0.1 0.1Pyrosomidae 0 0.03 0.02 0.05 0.2 0.05Osteichthyes⁎ 0.6 0.6 2.6 0.1 0.8 2.3
(⁎⁎) taxa exclusively or mainly composed of permanent suprabenthicspecies; (⁎) taxa composed both of suprabenthic and meso-bath-ypelagic species, or infauna stages.
322 J.E. Cartes et al. / Journal of Marine Systems 71 (2008) 316–335
3.1.2. ZooplanktonThough zooplankton showed spatial and temporal
changes in our sampling, these fluctuations werenarrower than those of suprabenthos.
Mean annual biomass increased offshore, rangingbetween 0.183–0.330 gWW/100 m2 on the 150 misobath, increasing to 0.397–0.423 gWW/100 m2 at350 m and to 0.657–0.879 gWW/100 m2 offshore (on650–750 m) both off Sóller and Cabrera (Fig. 3).
Comparing both sites (Sóller andCabrera),mean annualbiomass was higher at Sóller (0.330 gWW/100 m2)on the shelf-slope break, at 150 m, than at Cabrera(0.183 gWW/100 m2). Offshore the trend was the op-posite with higher biomass off Cabrera. Seasonal dy-namics run more or less parallel in both sites.
Off Sóller, maximum biomass was recorded in April–June (0.444–0.532 gWs gWg W/100 m2) at 150 m, inFebruary (1.087 gWs gWgW/100m2) at 350 m, and againin June, with a secondary peak in February, offshore at650–750 m (1.125–1.045 gWs gWg W/100 m2; Fig. 3).Minimum values were recorded in September at 150 m(0.050 gWs gWg W/100 m2), in June–August at 350 m(0.136–0.191 gWs gWgW/100 m2) and in September andApril in 650–750 m (0.249–0.362 gWs gWg W/100 m2).
Off Cabrera, maximum biomass was recorded inFebruary (0.360 gWs gWg W/100 m2) at 150 m, in June(0.784 gWs gWgW/100m2) at 350m, and (in a compositeyear) later, in August, offshore at 650–750 m (1.211 gWsgWgW/100m2; Fig. 3).Minimumvalueswere recorded inJune–August at 150 m (0.085 gWs gWg W/100 m2), inApril at 350 m (0.148 gWs gWg W/100 m2) and in Apriland September in 650–750 m (0.275–0.345 gWs gWgW/100 m2).
It was difficult to identify clear regularities in thetemporal dynamics of zooplankton. However, peaks ofmaximum biomass regularly occurred in both areas in latewinter and summer (February and June) and never inautumn (September–November), while minimum valuesoccurred in autumn (August–September) and also in April.
3.2. Multivariate analysis
3.2.1. SuprabenthosSuprabenthos varied as a function of depth gradients
both off Sóller and Cabrera (Fig. 4).Off Sóller, MDS analyses showed sampling aggrega-
tion for those hauls taken around 150m, and 350m,whichappeared segregated from the deeper samples. Samplesfrom the deeper part of the slope (650–750 m) were notseparated. Two samples (S09–727 m; S09–687 m) weremore related to the shallowest hauls at 150 m in theMDS,probably because in September 2003 the density of
suprabenthic fauna was very low at 650–750 m, as oc-curred in general with suprabenthos on the shelf-slopebreak.
Off Cabrera, we found also a similar aggregation ofhauls in three groups (150 m, 350 m and 650–750 m).Again, the haul C11–753 m, characterized by a very lowabundance of fauna, was more related with hauls of theshelf-slope break.
Within each depth group there was no seasonal trend,as was found among zooplankton (see below).
The taxonomic composition of suprabenthos bydepth strata is shown in Table 1. Apart from copepods,which were always dominant in number, peracarids(belonging to permanent suprabenthos: mysids, gam-maridean amphipods, isopods, and cumaceans) were thedominant taxa. These taxa increased their densities atbathyal stations in comparison to the shelf-slope break.Most taxa showed peaks at intermediate depths (350 m),both at Sóller and Cabrera. Comparing densities ofpermanent suprabenthos in both areas, the highest

323J.E. Cartes et al. / Journal of Marine Systems 71 (2008) 316–335
densities (e.g. among amphipods, cumaceans, isopodsor mysids) were found off Sóller, at 350 m depth.However, densities at deeper stations (650–750 m) werehigher off Cabrera.
3.2.2. ZooplanktonIn contrast to suprabenthos dynamics, changes in the
abundance of zooplankton showed a clear seasonalpattern (Fig. 5).
This pattern was particularly obvious off Sóller,where in MDS analyses, samples from June 2003 and
Fig. 5. MDS performed on zooplankton abundance off Sóller (top) and CaAugust 2003, autumn–winter samples from September–November 2003 andarea (S: Sóller, C: Cabrera), month and depth.
August 2004 (summer) were separated from thoseperformed in September–November 2003 and February2004 (autumn–winter). April 2004 samples appearedwell grouped, thus suggesting that spring is a period ofchange between two extreme situations with regard thetaxonomic composition of zooplankton.
A seasonal pattern also occurred off Cabrera, thoughless evident than in the previous case. Most samples ofJune 2003 and August 2004 (summer) were groupedin the upper part of the plot (Fig. 5). By contrast,the September–November 2003 and February 2004
brera (bottom). Summer group includes samples from June 2004 andFebruary 2004 and spring samples from April 2004. The labels indicate
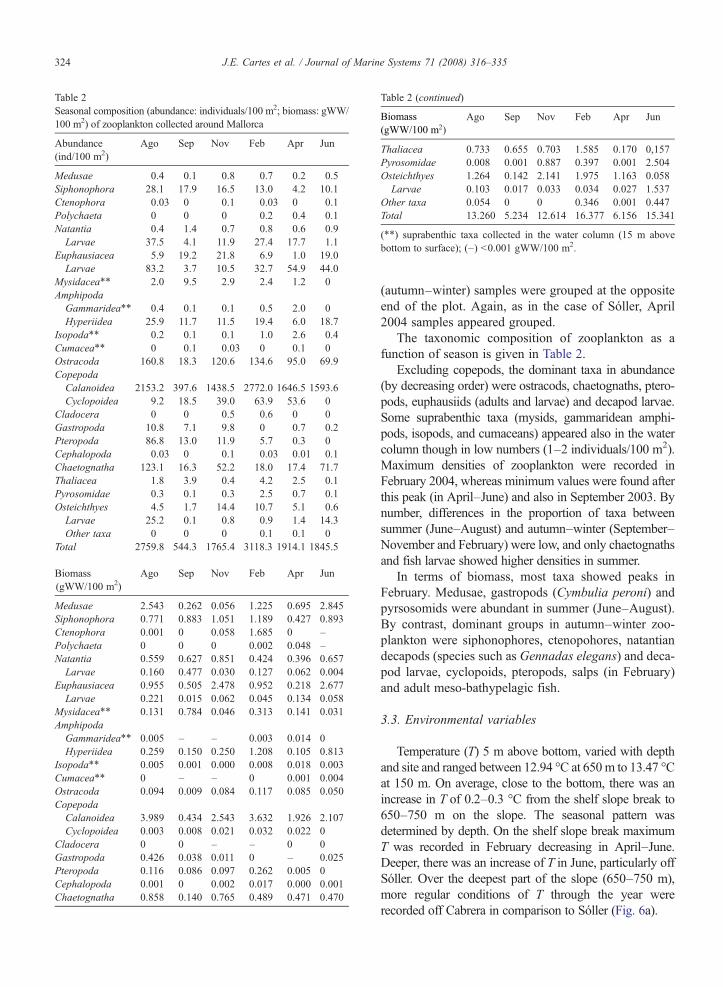
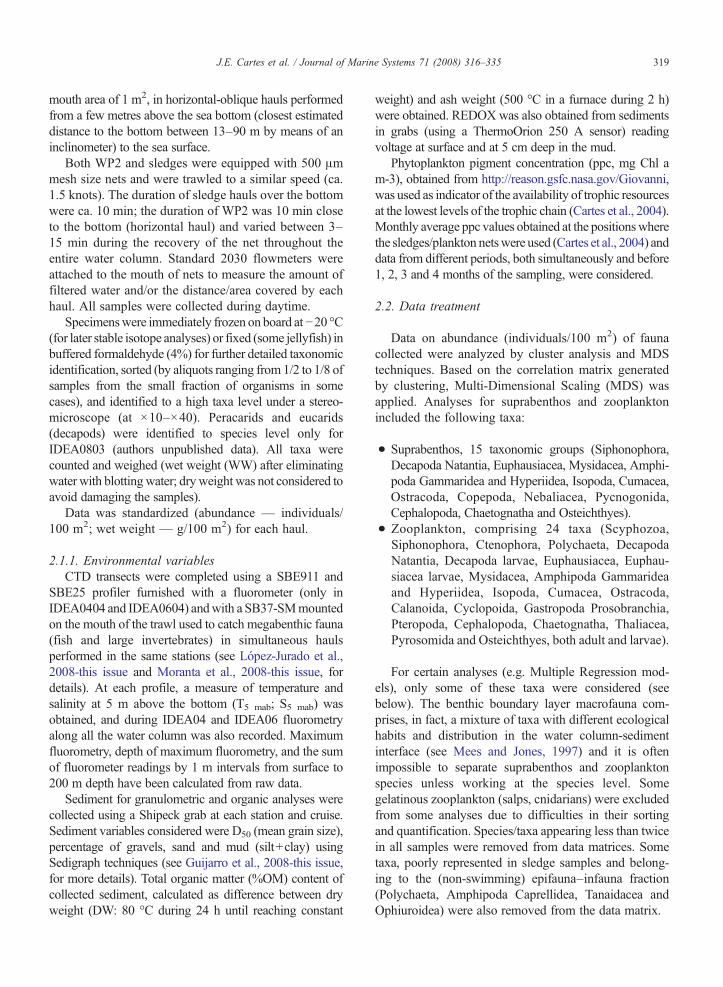
Table 2Seasonal composition (abundance: individuals/100 m2; biomass: gWW/100 m2) of zooplankton collected around Mallorca
Abundance(ind/100 m2)
Ago Sep Nov Feb Apr Jun
Medusae 0.4 0.1 0.8 0.7 0.2 0.5Siphonophora 28.1 17.9 16.5 13.0 4.2 10.1Ctenophora 0.03 0 0.1 0.03 0 0.1Polychaeta 0 0 0 0.2 0.4 0.1Natantia 0.4 1.4 0.7 0.8 0.6 0.9Larvae 37.5 4.1 11.9 27.4 17.7 1.1
Euphausiacea 5.9 19.2 21.8 6.9 1.0 19.0Larvae 83.2 3.7 10.5 32.7 54.9 44.0
Mysidacea⁎⁎ 2.0 9.5 2.9 2.4 1.2 0AmphipodaGammaridea⁎⁎ 0.4 0.1 0.1 0.5 2.0 0Hyperiidea 25.9 11.7 11.5 19.4 6.0 18.7
Isopoda⁎⁎ 0.2 0.1 0.1 1.0 2.6 0.4Cumacea⁎⁎ 0 0.1 0.03 0 0.1 0Ostracoda 160.8 18.3 120.6 134.6 95.0 69.9CopepodaCalanoidea 2153.2 397.6 1438.5 2772.0 1646.5 1593.6Cyclopoidea 9.2 18.5 39.0 63.9 53.6 0
Cladocera 0 0 0.5 0.6 0 0Gastropoda 10.8 7.1 9.8 0 0.7 0.2Pteropoda 86.8 13.0 11.9 5.7 0.3 0Cephalopoda 0.03 0 0.1 0.03 0.01 0.1Chaetognatha 123.1 16.3 52.2 18.0 17.4 71.7Thaliacea 1.8 3.9 0.4 4.2 2.5 0.1Pyrosomidae 0.3 0.1 0.3 2.5 0.7 0.1Osteichthyes 4.5 1.7 14.4 10.7 5.1 0.6Larvae 25.2 0.1 0.8 0.9 1.4 14.3Other taxa 0 0 0 0.1 0.1 0
Total 2759.8 544.3 1765.4 3118.3 1914.1 1845.5
Biomass(gWW/100 m2)
Ago Sep Nov Feb Apr Jun
Medusae 2.543 0.262 0.056 1.225 0.695 2.845Siphonophora 0.771 0.883 1.051 1.189 0.427 0.893Ctenophora 0.001 0 0.058 1.685 0 –Polychaeta 0 0 0 0.002 0.048 –Natantia 0.559 0.627 0.851 0.424 0.396 0.657Larvae 0.160 0.477 0.030 0.127 0.062 0.004
Euphausiacea 0.955 0.505 2.478 0.952 0.218 2.677Larvae 0.221 0.015 0.062 0.045 0.134 0.058
Mysidacea⁎⁎ 0.131 0.784 0.046 0.313 0.141 0.031AmphipodaGammaridea⁎⁎ 0.005 – – 0.003 0.014 0Hyperiidea 0.259 0.150 0.250 1.208 0.105 0.813
Isopoda⁎⁎ 0.005 0.001 0.000 0.008 0.018 0.003Cumacea⁎⁎ 0 – – 0 0.001 0.004Ostracoda 0.094 0.009 0.084 0.117 0.085 0.050CopepodaCalanoidea 3.989 0.434 2.543 3.632 1.926 2.107Cyclopoidea 0.003 0.008 0.021 0.032 0.022 0
Cladocera 0 0 – – 0 0Gastropoda 0.426 0.038 0.011 0 – 0.025Pteropoda 0.116 0.086 0.097 0.262 0.005 0Cephalopoda 0.001 0 0.002 0.017 0.000 0.001Chaetognatha 0.858 0.140 0.765 0.489 0.471 0.470
Table 2 (continued)
Abundance(ind/100 m2)
Ago Sep Nov Feb Apr Jun
Thaliacea 0.733 0.655 0.703 1.585 0.170 0,157Pyrosomidae 0.008 0.001 0.887 0.397 0.001 2.504Osteichthyes 1.264 0.142 2.141 1.975 1.163 0.058Larvae 0.103 0.017 0.033 0.034 0.027 1.537
Other taxa 0.054 0 0 0.346 0.001 0.447Total 13.260 5.234 12.614 16.377 6.156 15.341
(⁎⁎) suprabenthic taxa collected in the water column (15 m abovebottom to surface); (–) b0.001 gWW/100 m2.
Biomass(gWW/100 m2)
324 J.E. Cartes et al. / Journal of Marine Systems 71 (2008) 316–335
(autumn–winter) samples were grouped at the oppositeend of the plot. Again, as in the case of Sóller, April2004 samples appeared grouped.
The taxonomic composition of zooplankton as afunction of season is given in Table 2.
Excluding copepods, the dominant taxa in abundance(by decreasing order) were ostracods, chaetognaths, ptero-pods, euphausiids (adults and larvae) and decapod larvae.Some suprabenthic taxa (mysids, gammaridean amphi-pods, isopods, and cumaceans) appeared also in the watercolumn though in low numbers (1–2 individuals/100 m2).Maximum densities of zooplankton were recorded inFebruary 2004, whereas minimum values were found afterthis peak (in April–June) and also in September 2003. Bynumber, differences in the proportion of taxa betweensummer (June–August) and autumn–winter (September–November and February) were low, and only chaetognathsand fish larvae showed higher densities in summer.
In terms of biomass, most taxa showed peaks inFebruary. Medusae, gastropods (Cymbulia peroni) andpyrsosomids were abundant in summer (June–August).By contrast, dominant groups in autumn–winter zoo-plankton were siphonophores, ctenopohores, natantiandecapods (species such as Gennadas elegans) and deca-pod larvae, cyclopoids, pteropods, salps (in February)and adult meso-bathypelagic fish.
3.3. Environmental variables
Temperature (T) 5 m above bottom, varied with depthand site and ranged between 12.94 °C at 650m to 13.47 °Cat 150 m. On average, close to the bottom, there was anincrease in T of 0.2–0.3 °C from the shelf slope break to650–750 m on the slope. The seasonal pattern wasdetermined by depth. On the shelf slope break maximumT was recorded in February decreasing in April–June.Deeper, there was an increase of T in June, particularly offSóller. Over the deepest part of the slope (650–750 m),more regular conditions of T through the year wererecorded off Cabrera in comparison to Sóller (Fig. 6a).

Fig. 6. Trends in Temperature, T (a) and Salinity, S in psu (b) close to the bottom at 150, 350, and 650–750 m depth off Sóller (discontinuous line) andCabrera (continuous line).
325J.E. Cartes et al. / Journal of Marine Systems 71 (2008) 316–335
Salinity (S) 5 m above bottom ranged from 38.28 psu at150 m (November 2003) to 38.51 psu at 350 m (June2004). In general, S increased from the shelf-slope break tobathyal stations (Fig. 6b). The seasonal pattern wasdifferent depending on depth. Maximum S was regularlyrecorded in June 2004 both at 150 m and deeper on theslope. However, at 150 m maximum values were alsorecorded in September–November 2004. S was in generalhigher off Cabrera, except at 350 m depth where valueswere rather similar at both sites.
Trends in %OM with depth and area are shown inFig. 7a. The patterns were similar in both areas for %OM, with rather similar values. The %OM increased
with depth from the shelf-slope break (1.6–4.5%) tobathyal stations (2.5–9%), and this increment generallyparalleled the increase in the proportion of mud onsediments (data not shown).The most regular temporaltrend depicted was the increase of %OM from February2004 to April and June 2004 that was recorded in bothareas and at all depths. In February 2004, the mini-mum value of %OM was recorded in the sediments atbathyal stations below 350 m depth. Comparing bothareas, %OM was slightly higher in April and especiallyin June off Sóller.
Records of potential REDOX (Fig. 7b) followed asimilar trend to that of %OM off Sóller, with minimum

Fig. 7. Seasonal trends in %OM (a) and potential REDOX (mV) (b) in sediments at 150, 350, and 650–750 m depth off Sóller (discontinuous line)and Cabrera Archipelago (continuous line).
326 J.E. Cartes et al. / Journal of Marine Systems 71 (2008) 316–335
values recorded in February (range −49 to −47 mV) andincreasing in April–June (to −34.1, −11.8 mV at350 m). Off Cabrera, REDOX showed less variabilitythan off Sóller.
The values of Chl a derived from satellite imageryare shown in Fig. 8. Both off Sóller and Cabrera therewas a unique peak of Chl a on surface in February–March 2004 with a period of low production betweenMay and October. The general shape of Chl a curveswas similar in both areas as also occurred withmaximum values of Chl a. The peak off Sóller wasslightly more prolonged in time than that off Cabrera,
and Chl a had already begun to increase in September–October, reaching a peak with some delay (1 month) inMarch, in comparison to Cabrera.
3.4. Possible explanatory variables of suprabenthos-zooplankton dynamics
3.4.1. MDS dimensions
3.4.1.1. Suprabenthos. The ordination of hauls ofsuprabenthos on inertia axes were correlated off Sóller;Dimension 1 (D1) only with temperature close to the
327J.E. Cartes et al. / Journal of Marine Systems 71 (2008) 316–335
bottom (T), and with the % of gravels in sediments(Table 3a). Dimension 2 (D2) was correlated also with T.
Off Cabrera, D1 was correlated with S, REDOX at thesediment surface, and with Chl a recorded simultaneouslyand in each of the 2 preceding months (Chl asim, Chl a1mo,Chl a2mo). D2 was correlated with depth, with %OM, andwith textural parameters of sediments (% of gravels, sands,inversely with finer – mud – sediments, median size) andwith REDOX potential (difference from surface to 5 cminto the sediment).
3.4.1.2. Zooplankton. Off Sóller, D1 of MDS (i.e. theordination of hauls in inertia axes) performed onzooplankton was only significantly correlated with Chla4mo, D2 was correlated with S, %OM in sediments, andwith Chl a recorded simultaneously with hauls (Chlasim), and 1 month before (Chl a1mo) (Table 3b).
Off Cabrera, D1 was correlated with salinity (S),REDOX at the sediment surface, and with Chl arecorded simultaneously and the preceding 2 months(Chl asim, Chl a1mo, Chl a2mo). D2 was correlated withChl a recorded in each of the preceding 4 months beforehauls (Chl a1mo, Chl a2mo, Chl a3mo, Chl a4mo).
Fig. 8. Monthly Chl a derived from satellite imagery (http://reason.gsfc.nasa.gov/Giovanni) off Sóller (a) and Cabrera (b). Discontinuouslines represent stations at 150–350 m and continuous lines stations at650–750 m.
In general, changes in affinity between hauls seemmorerelated with Chl a at the surface off Cabrera than off Sóller.
A comparison between results from suprabenthosand zooplankton indicated that suprabenthos was relatedto a number of sediment features (grain size, nature ofsediments, %OM…) and to a lesser extend with Chl a onsurface, while zooplankton was mainly related withrecords of Chl a on surface, especially with simulta-neous or recent (b2 months) readings.
3.4.2. Abundance
3.4.2.1. Suprabenthos. Off Sóller, abundance ofsuprabenthos was significantly higher at higher S closeto the bottom (5 m above), at higher % of mud (andsmaller median grain sizes) and at more oxidized (lessnegative) sediments (at 5 cm depth). Peracarid abun-dance was only significantly higher at higher S.
Off Cabrera, both suprabenthos and peracaridabundances were significantly higher at higher S 5 mabove bottom, at higher % of mud (and smaller mediangrain size), higher %OM, and at more oxidized sedi-ments (5 cm). In addition to these variables, which werethe same as those that were correlated with abundanceoff Sóller, higher abundance (of peracarids only) wasalso correlated with Chl a taken simultaneously and ineach of the preceding 4 months.
The relationships between suprabenthos abundanceand environmental variables after combining Sóller andCabrera samplings were similar to those obtained whenboth sites were considered separately (Table 4).
3.4.2.2. Zooplankton. Off Sóller, abundance of zoo-plankton was significantly higher only in samples asso-ciated with higher Chl a1mo (after excluding gelatinousanimals) at surface 1 month before, while other measuresof Chl a were close to the significance level (Table 4).
Off Cabrera, similar trends were found, with abundancebeing higher in samples associated with higher Chl a onsurface 3 months before sampling, and higher T. Similarresults were also obtained combining data from both sites.
Comparing trends between suprabenthos and zoo-plankton, and as shown in the case of MDS dimensions,intra-annual fluctuations in suprabenthos abundance weremore dependent on variables related to the nature of thesediment nature and its condition (e.g. %OM, REDOX),and with salinity close to the bottom. By contrast,zooplankton was mostly dependent of Chl a on surface.
3.4.3. Multi-linear regression modelsA collection of multi-linear regression models (MLR)
are shown in Table 5. MLR models accumulating the

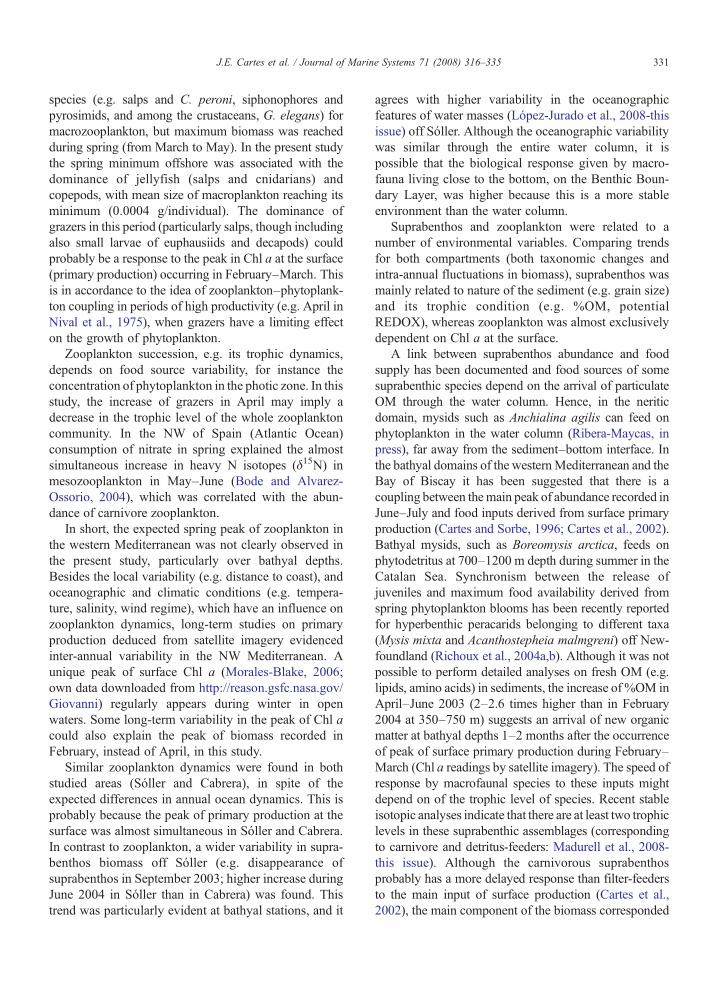
Table 3Correlations (Spearman r) between MDS dimensions (D1 and D2, obtained from abundance matrix abundance) and environmental (physical, andgeochemical) variables: (a) suprabenthos; (b) zooplankton
a)Suprabenthos Sóller Cabrera
D1 D2 D1 D2
n r p-level n r p-level n r p-level n r p-level
Depth (m) 22 −0.042 ns 22 −0.205 ns 24 −0.456 0.025 24 −0.046 nsT(5mab) 22 −0.273 ns 22 0.374 0.086 23 0.188 ns 23 −0.022 nsS(5mab) 22 −0.394 0.07 22 0.080 ns 23 −0.541 0.008 23 0.170 ns%OM (%) 19 −0.023 ns 19 0.098 ns 22 −0.467 0.028 22 −0.233 nsgravels (%) 19 0.513 0.025 19 −0.203 ns 21 0.643 0.002 21 0.011 nsSand (%) 19 0.251 ns 19 0.181 ns 21 0.742 b0.001 21 −0.081 nsMud (%) 19 −0.249 ns 19 −0.125 ns 21 −0.742 b0.001 21 0.081 nsD50 mm 19 0.228 ns 19 0.123 ns 21 0.713 b0.001 21 −0.270 nsRedox mV (5 cm) 19 −0.256 ns 19 0.163 ns 18 0.059 ns 18 −0.011 nsChl a satellite 4 month 22 −0.102 ns 22 −0.121 ns 24 −0.150 ns 24 0.022 ns
3 month 22 −0.011 ns 22 0.022 ns 24 −0.186 ns 24 0.160 ns2 month 22 −0.073 ns 22 −0.261 ns 24 −0.144 ns 24 0.287 0.1741 month 22 0.001 ns 22 −0.272 ns 24 0.107 ns 24 0.351 0.092simult. 22 0.078 ns 22 −0.152 ns 24 −0.037 ns 24 0.358 0.086
Fluorometry Max depth Chl 7 0.160 ns 7 0.312 ns 10 0.128 ns 10 0.067 nsFluorometry 7 0.101 ns 7 0.509 ns 10 −0.079 ns 10 −0.104 nsΣFlu200 m 7 0.059 ns 7 0 ns 10 −0.506 0.136 10 0.055 ns
b)Zooplankton Sóller Cabrera
D1 D2 D1 D2
n r p-level n r p-level n r p-level n r p-level
Depth (m) 22 0.243 ns 22 −0.357 0.103 24 −0.124 ns 24 −0.174 nsT(5mab) 22 −0.031 ns 22 0.169 ns 23 −0.198 ns 23 −0.042 nsS(5mab) 22 0.100 ns 22 −0.580 0.005 23 −0.304 0.158 23 0.075 ns%OM (%) 19 −0.007 ns 19 −0.498 0.030 22 −0.033 ns 22 0.124 nsgravels (%) 19 −0.344 0.149 19 0.353 0.138 21 0.091 ns 21 −0.013 nssand (%) 19 −0.207 ns 19 0.268 ns 21 0.118 ns 21 −0.074 nsmud (%) 19 0.211 ns 19 −0.240 ns 21 −0.118 ns 21 0.074 nsD50 mm 19 −0.184 ns 19 0.272 ns 21 0.235 ns 21 0.078 nsREDOX mV (5 cm) 19 −0.202 ns 19 −0.381 0.108 18 0.325 0.188 18 0.276 nsChla satellite 4 month 22 −0.626 0.002 22 −0.093 ns 24 0.035 ns 24 0.795 b0.001
3 month 22 −0.325 0.140 22 −0.012 ns 24 −0.321 0.127 24 0.638 b0.0012 month 22 −0.396 0.068 22 0.341 0.120 24 −0.537 0.007 24 0.586 0.0031 month 22 −0.228 ns 22 0.436 0.043 24 −0.800 b0.001 24 0.447 0.029Simult. 22 0.160 ns 22 0.470 0.027 24 −0.841 b0.001 24 −0.065 ns
Fluorometry Max depth Chl 7 −0.312 ns 7 0.165 ns 10 0.165 ns 10 0.098 nsFluorometry 7 −0.691 0.086 7 0.291 ns 10 0.75 0.012 10 −0.061 nsΣFlu200 m 7 0.655 0.111 7 −0.327 ns 10 0.421 ns 10 −0.402 ns
n: number of cases; ns: non-significant correlation.
328 J.E. Cartes et al. / Journal of Marine Systems 71 (2008) 316–335
highest amount of inertia (r2) and showing the lowestredundancy between explanatory variables were selected.
As in the case of Spearman correlations, both abun-dance and biomass of suprabenthos were mainlyexplained by S, and % of organic matter (%OM). Modelsaccumulated between 0.332 to 0.433 of inertia. Modelsconstructed on zooplankton (gelatinous taxa excluded)accumulated between 0.345 to 0.544 of total inertia. S, T
and Chl a at the surface, taken simultaneously to zoo-plankton sampling (Chl asim), were the most frequentexplanatory variables found in the 7 models selected.
4. Discussion
In open waters, temporal dynamics of meso- and ma-crozooplankton has been the topic ofmany studies both in
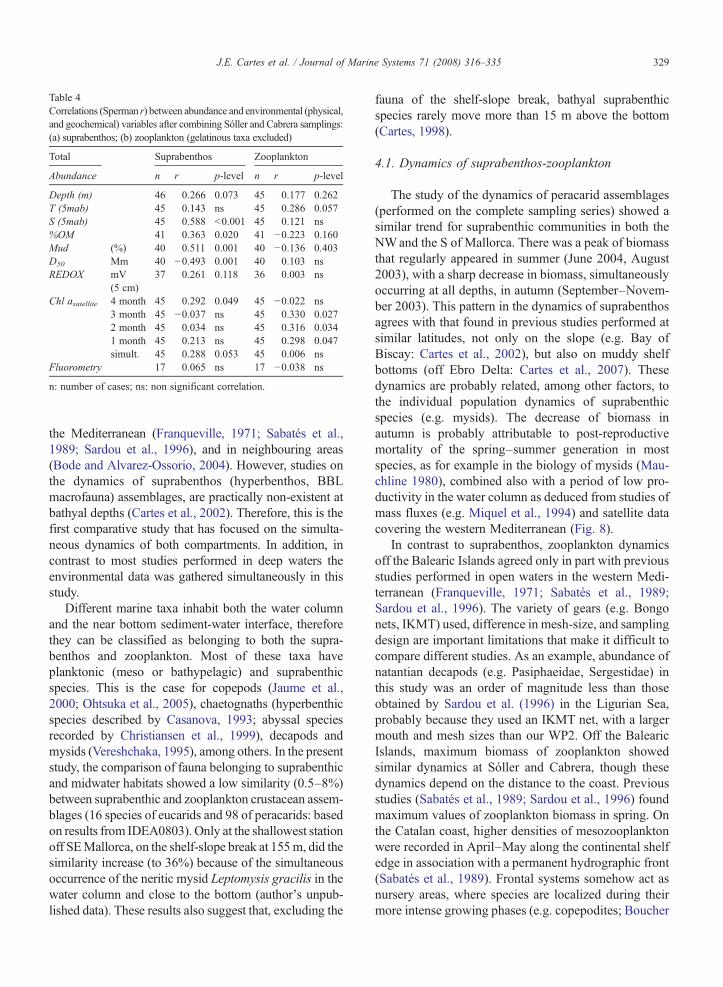
Table 4Correlations (Sperman r) between abundance and environmental (physical,and geochemical) variables after combining Sóller and Cabrera samplings:(a) suprabenthos; (b) zooplankton (gelatinous taxa excluded)
Total Suprabenthos Zooplankton
Abundance n r p-level n r p-level
Depth (m) 46 0.266 0.073 45 0.177 0.262T (5mab) 45 0.143 ns 45 0.286 0.057S (5mab) 45 0.588 b0.001 45 0.121 ns%OM 41 0.363 0.020 41 −0.223 0.160Mud (%) 40 0.511 0.001 40 −0.136 0.403D50 Mm 40 −0.493 0.001 40 0.103 nsREDOX mV
(5 cm)37 0.261 0.118 36 0.003 ns
Chl asatellite 4 month 45 0.292 0.049 45 −0.022 ns3 month 45 −0.037 ns 45 0.330 0.0272 month 45 0.034 ns 45 0.316 0.0341 month 45 0.213 ns 45 0.298 0.047simult. 45 0.288 0.053 45 0.006 ns
Fluorometry 17 0.065 ns 17 −0.038 ns
n: number of cases; ns: non significant correlation.
329J.E. Cartes et al. / Journal of Marine Systems 71 (2008) 316–335
the Mediterranean (Franqueville, 1971; Sabatés et al.,1989; Sardou et al., 1996), and in neighbouring areas(Bode and Alvarez-Ossorio, 2004). However, studies onthe dynamics of suprabenthos (hyperbenthos, BBLmacrofauna) assemblages, are practically non-existent atbathyal depths (Cartes et al., 2002). Therefore, this is thefirst comparative study that has focused on the simulta-neous dynamics of both compartments. In addition, incontrast to most studies performed in deep waters theenvironmental data was gathered simultaneously in thisstudy.
Different marine taxa inhabit both the water columnand the near bottom sediment-water interface, thereforethey can be classified as belonging to both the supra-benthos and zooplankton. Most of these taxa haveplanktonic (meso or bathypelagic) and suprabenthicspecies. This is the case for copepods (Jaume et al.,2000; Ohtsuka et al., 2005), chaetognaths (hyperbenthicspecies described by Casanova, 1993; abyssal speciesrecorded by Christiansen et al., 1999), decapods andmysids (Vereshchaka, 1995), among others. In the presentstudy, the comparison of fauna belonging to suprabenthicand midwater habitats showed a low similarity (0.5–8%)between suprabenthic and zooplankton crustacean assem-blages (16 species of eucarids and 98 of peracarids: basedon results from IDEA0803). Only at the shallowest stationoff SEMallorca, on the shelf-slope break at 155m, did thesimilarity increase (to 36%) because of the simultaneousoccurrence of the neritic mysid Leptomysis gracilis in thewater column and close to the bottom (author's unpub-lished data). These results also suggest that, excluding the
fauna of the shelf-slope break, bathyal suprabenthicspecies rarely move more than 15 m above the bottom(Cartes, 1998).
4.1. Dynamics of suprabenthos-zooplankton
The study of the dynamics of peracarid assemblages(performed on the complete sampling series) showed asimilar trend for suprabenthic communities in both theNWand the S of Mallorca. There was a peak of biomassthat regularly appeared in summer (June 2004, August2003), with a sharp decrease in biomass, simultaneouslyoccurring at all depths, in autumn (September–Novem-ber 2003). This pattern in the dynamics of suprabenthosagrees with that found in previous studies performed atsimilar latitudes, not only on the slope (e.g. Bay ofBiscay: Cartes et al., 2002), but also on muddy shelfbottoms (off Ebro Delta: Cartes et al., 2007). Thesedynamics are probably related, among other factors, tothe individual population dynamics of suprabenthicspecies (e.g. mysids). The decrease of biomass inautumn is probably attributable to post-reproductivemortality of the spring–summer generation in mostspecies, as for example in the biology of mysids (Mau-chline 1980), combined also with a period of low pro-ductivity in the water column as deduced from studies ofmass fluxes (e.g. Miquel et al., 1994) and satellite datacovering the western Mediterranean (Fig. 8).
In contrast to suprabenthos, zooplankton dynamicsoff the Balearic Islands agreed only in part with previousstudies performed in open waters in the western Medi-terranean (Franqueville, 1971; Sabatés et al., 1989;Sardou et al., 1996). The variety of gears (e.g. Bongonets, IKMT) used, difference in mesh-size, and samplingdesign are important limitations that make it difficult tocompare different studies. As an example, abundance ofnatantian decapods (e.g. Pasiphaeidae, Sergestidae) inthis study was an order of magnitude less than thoseobtained by Sardou et al. (1996) in the Ligurian Sea,probably because they used an IKMT net, with a largermouth and mesh sizes than our WP2. Off the BalearicIslands, maximum biomass of zooplankton showedsimilar dynamics at Sóller and Cabrera, though thesedynamics depend on the distance to the coast. Previousstudies (Sabatés et al., 1989; Sardou et al., 1996) foundmaximum values of zooplankton biomass in spring. Onthe Catalan coast, higher densities of mesozooplanktonwere recorded in April–May along the continental shelfedge in association with a permanent hydrographic front(Sabatés et al., 1989). Frontal systems somehow act asnursery areas, where species are localized during theirmore intense growing phases (e.g. copepodites; Boucher
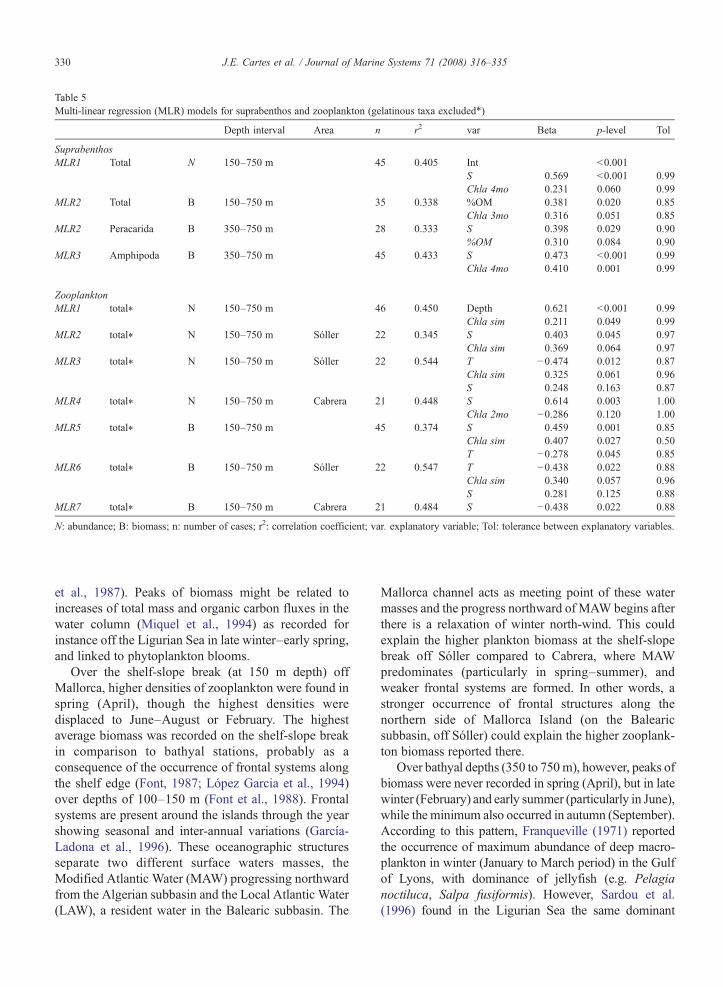
Table 5Multi-linear regression (MLR) models for suprabenthos and zooplankton (gelatinous taxa excluded⁎)
Depth interval Area n r2 var Beta p-level Tol
SuprabenthosMLR1 Total N 150–750 m 45 0.405 Int b0.001
S 0.569 b0.001 0.99Chla 4mo 0.231 0.060 0.99
MLR2 Total B 150–750 m 35 0.338 %OM 0.381 0.020 0.85Chla 3mo 0.316 0.051 0.85
MLR2 Peracarida B 350–750 m 28 0.333 S 0.398 0.029 0.90%OM 0.310 0.084 0.90
MLR3 Amphipoda B 350–750 m 45 0.433 S 0.473 b0.001 0.99Chla 4mo 0.410 0.001 0.99
ZooplanktonMLR1 total⁎ N 150–750 m 46 0.450 Depth 0.621 b0.001 0.99
Chla sim 0.211 0.049 0.99MLR2 total⁎ N 150–750 m Sóller 22 0.345 S 0.403 0.045 0.97
Chla sim 0.369 0.064 0.97MLR3 total⁎ N 150–750 m Sóller 22 0.544 T −0.474 0.012 0.87
Chla sim 0.325 0.061 0.96S 0.248 0.163 0.87
MLR4 total⁎ N 150–750 m Cabrera 21 0.448 S 0.614 0.003 1.00Chla 2mo −0.286 0.120 1.00
MLR5 total⁎ B 150–750 m 45 0.374 S 0.459 0.001 0.85Chla sim 0.407 0.027 0.50T −0.278 0.045 0.85
MLR6 total⁎ B 150–750 m Sóller 22 0.547 T −0.438 0.022 0.88Chla sim 0.340 0.057 0.96S 0.281 0.125 0.88
MLR7 total⁎ B 150–750 m Cabrera 21 0.484 S −0.438 0.022 0.88
N: abundance; B: biomass; n: number of cases; r2: correlation coefficient; var. explanatory variable; Tol: tolerance between explanatory variables.
330 J.E. Cartes et al. / Journal of Marine Systems 71 (2008) 316–335
et al., 1987). Peaks of biomass might be related toincreases of total mass and organic carbon fluxes in thewater column (Miquel et al., 1994) as recorded forinstance off the Ligurian Sea in late winter–early spring,and linked to phytoplankton blooms.
Over the shelf-slope break (at 150 m depth) offMallorca, higher densities of zooplankton were found inspring (April), though the highest densities weredisplaced to June–August or February. The highestaverage biomass was recorded on the shelf-slope breakin comparison to bathyal stations, probably as aconsequence of the occurrence of frontal systems alongthe shelf edge (Font, 1987; López Garcia et al., 1994)over depths of 100–150 m (Font et al., 1988). Frontalsystems are present around the islands through the yearshowing seasonal and inter-annual variations (García-Ladona et al., 1996). These oceanographic structuresseparate two different surface waters masses, theModified Atlantic Water (MAW) progressing northwardfrom the Algerian subbasin and the Local Atlantic Water(LAW), a resident water in the Balearic subbasin. The
Mallorca channel acts as meeting point of these watermasses and the progress northward of MAW begins afterthere is a relaxation of winter north-wind. This couldexplain the higher plankton biomass at the shelf-slopebreak off Sóller compared to Cabrera, where MAWpredominates (particularly in spring–summer), andweaker frontal systems are formed. In other words, astronger occurrence of frontal structures along thenorthern side of Mallorca Island (on the Balearicsubbasin, off Sóller) could explain the higher zooplank-ton biomass reported there.
Over bathyal depths (350 to 750m), however, peaks ofbiomass were never recorded in spring (April), but in latewinter (February) and early summer (particularly in June),while the minimum also occurred in autumn (September).According to this pattern, Franqueville (1971) reportedthe occurrence of maximum abundance of deep macro-plankton in winter (January to March period) in the Gulfof Lyons, with dominance of jellyfish (e.g. Pelagianoctiluca, Salpa fusiformis). However, Sardou et al.(1996) found in the Ligurian Sea the same dominant
331J.E. Cartes et al. / Journal of Marine Systems 71 (2008) 316–335
species (e.g. salps and C. peroni, siphonophores andpyrosimids, and among the crustaceans, G. elegans) formacrozooplankton, but maximum biomass was reachedduring spring (from March to May). In the present studythe spring minimum offshore was associated with thedominance of jellyfish (salps and cnidarians) andcopepods, with mean size of macroplankton reaching itsminimum (0.0004 g/individual). The dominance ofgrazers in this period (particularly salps, though includingalso small larvae of euphausiids and decapods) couldprobably be a response to the peak in Chl a at the surface(primary production) occurring in February–March. Thisis in accordance to the idea of zooplankton–phytoplank-ton coupling in periods of high productivity (e.g. April inNival et al., 1975), when grazers have a limiting effecton the growth of phytoplankton.
Zooplankton succession, e.g. its trophic dynamics,depends on food source variability, for instance theconcentration of phytoplankton in the photic zone. In thisstudy, the increase of grazers in April may imply adecrease in the trophic level of the whole zooplanktoncommunity. In the NW of Spain (Atlantic Ocean)consumption of nitrate in spring explained the almostsimultaneous increase in heavy N isotopes (δ15N) inmesozooplankton in May–June (Bode and Alvarez-Ossorio, 2004), which was correlated with the abun-dance of carnivore zooplankton.
In short, the expected spring peak of zooplankton inthe western Mediterranean was not clearly observed inthe present study, particularly over bathyal depths.Besides the local variability (e.g. distance to coast), andoceanographic and climatic conditions (e.g. tempera-ture, salinity, wind regime), which have an influence onzooplankton dynamics, long-term studies on primaryproduction deduced from satellite imagery evidencedinter-annual variability in the NW Mediterranean. Aunique peak of surface Chl a (Morales-Blake, 2006;own data downloaded from http://reason.gsfc.nasa.gov/Giovanni) regularly appears during winter in openwaters. Some long-term variability in the peak of Chl acould also explain the peak of biomass recorded inFebruary, instead of April, in this study.
Similar zooplankton dynamics were found in bothstudied areas (Sóller and Cabrera), in spite of theexpected differences in annual ocean dynamics. This isprobably because the peak of primary production at thesurface was almost simultaneous in Sóller and Cabrera.In contrast to zooplankton, a wider variability in supra-benthos biomass off Sóller (e.g. disappearance ofsuprabenthos in September 2003; higher increase duringJune 2004 in Sóller than in Cabrera) was found. Thistrend was particularly evident at bathyal stations, and it
agrees with higher variability in the oceanographicfeatures of water masses (López-Jurado et al., 2008-thisissue) off Sóller. Although the oceanographic variabilitywas similar through the entire water column, it ispossible that the biological response given by macro-fauna living close to the bottom, on the Benthic Boun-dary Layer, was higher because this is a more stableenvironment than the water column.
Suprabenthos and zooplankton were related to anumber of environmental variables. Comparing trendsfor both compartments (both taxonomic changes andintra-annual fluctuations in biomass), suprabenthos wasmainly related to nature of the sediment (e.g. grain size)and its trophic condition (e.g. %OM, potentialREDOX), whereas zooplankton was almost exclusivelydependent on Chl a at the surface.
A link between suprabenthos abundance and foodsupply has been documented and food sources of somesuprabenthic species depend on the arrival of particulateOM through the water column. Hence, in the neriticdomain, mysids such as Anchialina agilis can feed onphytoplankton in the water column (Ribera-Maycas, inpress), far away from the sediment–bottom interface. Inthe bathyal domains of the westernMediterranean and theBay of Biscay it has been suggested that there is acoupling between themain peak of abundance recorded inJune–July and food inputs derived from surface primaryproduction (Cartes and Sorbe, 1996; Cartes et al., 2002).Bathyal mysids, such as Boreomysis arctica, feeds onphytodetritus at 700–1200 m depth during summer in theCatalan Sea. Synchronism between the release ofjuveniles and maximum food availability derived fromspring phytoplankton blooms has been recently reportedfor hyperbenthic peracarids belonging to different taxa(Mysis mixta and Acanthostepheia malmgreni) off New-foundland (Richoux et al., 2004a,b). Although it was notpossible to perform detailed analyses on fresh OM (e.g.lipids, amino acids) in sediments, the increase of %OM inApril–June 2003 (2–2.6 times higher than in February2004 at 350–750 m) suggests an arrival of new organicmatter at bathyal depths 1–2 months after the occurrenceof peak of surface primary production during February–March (Chl a readings by satellite imagery). The speed ofresponse by macrofaunal species to these inputs mightdepend on of the trophic level of species. Recent stableisotopic analyses indicate that there are at least two trophiclevels in these suprabenthic assemblages (correspondingto carnivore and detritus-feeders: Madurell et al., 2008-this issue). Although the carnivorous suprabenthosprobably has a more delayed response than filter-feedersto the main input of surface production (Cartes et al.,2002), the main component of the biomass corresponded
332 J.E. Cartes et al. / Journal of Marine Systems 71 (2008) 316–335
to mysids, which are mainly filter-feeders. This wouldexplain the positive correlations found between the wholesuprabenthos biomass and %OM.
Both suprabenthos and zooplankton use marine snow,e.g., detritus derived from primary production reachingbathyal depths, as a main food source, as has beenreported by the use of isotope studies both in Sóller(Madurell et al., 2008-this issue) and previously in theAlgerian subbasin (Polunin et al., 2001). The presentresults suggest, in addition, that this food source isexploited in two different ways by both compartments,zooplankton feeding directly on phytoplankton byvertical daily movements to the photic zone, and supra-benthos linked to deposited and/or resuspended detritusin the BBL. The biomass of suprabenthos increased fromautumn–winter (September–November–February) tospring–early summer (April–June), particularly offSóller, with a parallel increase in the %OM in sediments(from a range of 2.69–7.62% in November–February toa range of 4.17–9.43% in April–June), which in somecases (e.g. at 650–750 m off Sóller) represented anincrease of ca 3% of %OM. Nevertheless peaks of Chl awere nearly simultaneous (in February–March, begin-ning in December) in both areas. Off Cabrera there was asharp peak of Chl a in February; while off Sóller, themaximum was delayed by one month and was of longerduration (Fig. 6). The main peak of suprabenthosbiomass at slope depths (350–750 m) was delayed offSóller (in June) in comparison to Cabrera (occurring inFebruary and April), and this delay agrees with thedynamics of Chl a at the surface. Probably in relation tothis, the %OM reached also maximum values in April offCabrera and later, in June, off Sóller.
Salinity in spite its narrower range of variation (from38.18–38.52 psu between 150–750 m, and 38.44–38.52 psu deeper at 350–750 m) in comparison to othervariables (e.g. %OM), was also correlated with supra-benthos–zooplankton biomass. At slope depths, Ghidaliaand Bourgois (1961) suggested that the distribution ofsome deepwater shrimps (Aristaeomorpha foliacea andA. antennatus), could be respectively linked to inter-mediate and deep-water masses in the Mediterranean, butdid not provide any data in support to this hypothesis.Correlations with salinity close to the bottom suggest alink between suprabenthos abundance (increment ofbiomass in June–August) and changes in the oceano-graphic conditions close to the bottom, and these changescould be related with the occurrence of LIW in April–June off Sóller (López-Jurado et al., 2008-this issue). Inspite of this possible couplingwith salinity,%OMshoweda stronger increase in April–June after the surface peak ofChl a and this increase is also coupled with increases in
food consumption and energy in the diet of key speciessuch as A. antennatus (see below). It is possible, inaddition, that S recorded byCTDs are in fact reflecting theincrease in OM in the environment, because salinitymeasures the increase of dissolved particles in the watermass, dissolved organic matter included. The input ofLIW can also contribute to a higher OM resuspension byimpinging on the slope by bottom currents. Probably acombination of all these factors may explain the positiverelation found between S and suprabenthos biomass.
4.2. Influence on the biology of higher trophic levels:the case of A. antennatus
Summarizing the available information on theimportance of suprabenthos in the diet of bathyal speciesin the Mediterranean, the smallest class-sizes of somekey species such as A. antennatus (CLb18 mm) andhake (TLb10 cm) consume suprabenthos (mysids,amphipods, cumaceans: Sardà and Cartes, 1997; theso-called permanent suprabenthos or holosuprabenthos),while largest juveniles increasingly consume zooplank-ton (decapods, small myctophids; Cartes, 1994; alsoknow as merosuprabenthos).
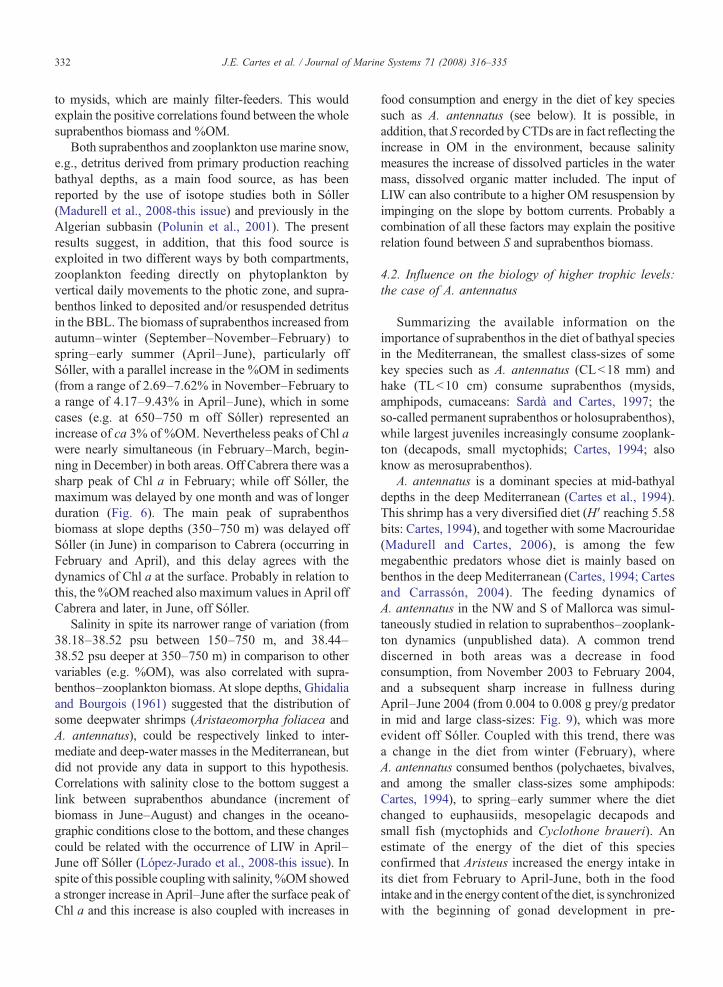
A. antennatus is a dominant species at mid-bathyaldepths in the deep Mediterranean (Cartes et al., 1994).This shrimp has a very diversified diet (H′ reaching 5.58bits: Cartes, 1994), and together with some Macrouridae(Madurell and Cartes, 2006), is among the fewmegabenthic predators whose diet is mainly based onbenthos in the deep Mediterranean (Cartes, 1994; Cartesand Carrassón, 2004). The feeding dynamics ofA. antennatus in the NW and S of Mallorca was simul-taneously studied in relation to suprabenthos–zooplank-ton dynamics (unpublished data). A common trenddiscerned in both areas was a decrease in foodconsumption, from November 2003 to February 2004,and a subsequent sharp increase in fullness duringApril–June 2004 (from 0.004 to 0.008 g prey/g predatorin mid and large class-sizes: Fig. 9), which was moreevident off Sóller. Coupled with this trend, there wasa change in the diet from winter (February), whereA. antennatus consumed benthos (polychaetes, bivalves,and among the smaller class-sizes some amphipods:Cartes, 1994), to spring–early summer where the dietchanged to euphausiids, mesopelagic decapods andsmall fish (myctophids and Cyclothone braueri). Anestimate of the energy of the diet of this speciesconfirmed that Aristeus increased the energy intake inits diet from February to April-June, both in the foodintake and in the energy content of the diet, is synchronizedwith the beginning of gonad development in pre-

Fig. 9. Stomach fullness (left; gWWfood/gWW predator) and energy intake (right; Kcal/gWW) of Aristeus antennatus at 550–750 m depth off Sóller(discontinuous line and black symbols) and Cabrera (continuous line and black symbols). In energy plots also represented an average line(discontinuous line and open circles). Data presented by size class (small, CL—carapace length b30 mm; medium, 30 mmbCLb40 mm; large,CLN40 mm) and based on specimens analyzed in a parallel study.
333J.E. Cartes et al. / Journal of Marine Systems 71 (2008) 316–335
reproductive females (Fig. 9), that occurs in May with apeak in summer (Demestre and Fortuño, 1992) in theBalearic subbasin (June in this study). Zooplankton(mesopelagic euphausiids, decapod shrimps and smallfishes) were responsible for the increase of energy inthe diet of A. antennatus during this period. As a con-sequence, inter-annual fluctuations in the biomass ofthese highly energetic resources might have an influ-ence on the reproductive success and post-recruitmentof A. antennatus.
Acknowledgments
We deeply appreciate the help of all participants inthe cruises “IDEA”, to the crew of the R/V Francisco dePaula Navarro and especially to our colleague M. Serrafor his assistance on board. We extend also our thanksespecially to Dr. J. Moranta and Dr. E. Massutí for theirhelp in planning cruises, and to V. Papiol for herassistance in the laboratory. Dr. J.J. Fornós (Universitatde les Illes Balears) performed the sediment and organic

334 J.E. Cartes et al. / Journal of Marine Systems 71 (2008) 316–335
matter analyses. We especially acknowledge his work.This research has been sponsored by the Spanish projectIDEA (REN2002-04535-C01/02).
References
Bieri, R., Tokioka, T., 1968. Dragonet II: an opening-closingquantitative trawl for the study of micro-vertical distribution ofzooplankton and the meio-epibenthos. Publications of the SetoMarine Biological Laboratory 15, 373–390.
Bode, A., Alvarez-Ossorio, M.T., 2004. Taxonomic versus trophicstructure of mesozooplankton: a seasonal study of species successionand stable carbon and nitrogen isotopes in a coastal upwellingecosystem. ICES Journal of Marine Science 61, 563–571.
Boucher, J., Ibanez, F., Prieur, L., 1987. Daily and seasonal variationsin the spatial distribution of zooplankton populations in relation tothe physical structure in the Ligurian Sea Front. Journal of MarineResearch 45, 133–173.
Boysen, H.O., 1976. Regional and seasonal differences in the abundanceof mysids and decapod larvae in the hyperbenthos of the Kiel Bay.Meeresforschung/Reports on Marine Research 25, 54–63.
Bozzano, A., Recasens, L., Sartor, P., 1997. Diet of the European hakeMerluccius merluccius (Pisces: Merlucciidae) in the WesternMediterranean (Gulf of Lions). Scientia Marina 61, 1–8.
Brattegard, T., Fossa, J.H., 1991. Replicability of an epibenthicsampler. Journal of the Marine Biological Association of theUnited Kingdom 71, 153–166.
Buhl-Jensen, L., 1986. The benthic amphipod fauna of the west-Norwegian continental shelf compared with the fauna of fiveadjacent fjords. Sarsia 71, 193–208.
Cartes, J.E., 1994. Influence of depth and season on the diet of thedeep-water aristeid Aristeus antennatus along the continental slope(400 to 2300 m) in the Catalan Sea. Marine Biology 120, 639–648.
Cartes, J.E., 1998. Dynamics of the bathyal Benthic Boundary Layer inthe north-western Mediterranean: depth and temporal variations inmacrofaunal–megafaunal communities and their possible connec-tions within deep-sea trophic webs. Progress in Oceanography 41,111–139.
Cartes, J.E., Sorbe, J.C., 1996. Aspects of population structure andfeeding ecology of the deep-water mysid Boreomysis arctica, adominant species in western Mediterranean slope assemblages.Journal of Plankton Research 20, 2401–2411.
Cartes, J.E., Carrassón, M., 2004. The influence of trophic variables inthe depth-range distribution and zonation rates of deep-seamegafauna: the case of the Western Mediterranean assemblages.Deep-Sea Research (Part I, Oceanographic Research Papers) 51,263–279.
Cartes, J.E., Grémare, A., Maynou, F., Villora-Moreno, S., Dinet, A.,2002. Bathymetric changes in the distributions of particulateorganic matter and associated fauna along a deep-sea transect downthe Catalan Sea slope (Northwestern Mediterranean). Progress inOceanography 53, 29–56.
Cartes, J.E., Jaume, D., Madurell, T., 2003. Local changes in thecomposition and community structure of suprabenthic peracaridcrustaceans on the bathyal Mediterranean: influence of environ-mental factors. Marine Biology 143, 745–758.
Cartes, J.E., Rey, J., Lloris, D., Gil de Sola, L., 2004. Influence ofenvironmental variables in the feeding and the diet of Europeanhake (Merluccius merluccius) on the Mediterranean Iberian coasts.Journal of the Marine Biological Association of the UnitedKingdom 84, 831–835.
Cartes, J.E., Company, J.B., Maynou, F., 1994. Deep-water decapodcrustacean communities in the Northwestern Mediterranean:influence of submarine canyons and season. Marine Biology120, 221–229.
Cartes, J.E., Papiol, V., Palanques, A., Guillén, J., Demestre, M., 2007.Dynamics of suprabenthos off the Ebro Delta (Catalan Sea:western Mediterranean): spatial and temporal patterns andrelationships with environmental factors. Estuarine, Coastal andShelf Science 75, 501–515.
Casanova, J.P., 1993. A new genus and species of deep-seachaetognath from the Bay of Biscay with a strange ventralsecretory gland. Journal of Natural History 27, 445–455.
Christiansen, B., Drueke, B., Koppelmann, R., Weikert, H., 1999. Thenear-bottom zooplankton at the abyssal BIOTRANS site, northeastAtlantic: composition, abundance and variability. Journal ofPlankton Research 21, 1847–1863.
Demestre, M., Fortuño, J.M., 1992. Reproduction of the deep-watershrimp Aristeus antennatus (Decapoda: Dendrobranchiata). Mar-ine Ecology Progress Series 84, 41–51.
Franqueville, C., 1971. Macroplankton profond (Invertébrés) de laMéditerranée Nord-occidentale. Tethys 3, 11–56.
Font, J., 1987. The path of the Levantine intermediate water to theAlboran Sea. Deep-Sea Research (Part I, Oceanographic ResearchPapers) 34, 1745–1755.
Font, J., Salat, J., Tintoré, J., 1988. Permanent features of the circulationin the Catalan Sea. Oceanological Acta, 9 51–57 (special issue).
García-Ladona, E., Castellón, A., Font, J., Tintoré, J., 1996. TheBalearic current and volume transports in the Balearic Basin.Oceanological Acta 19, 489–497.
Ghidalia, W., Bourgois, F., 1961. Influence de la témperature et del'éclairement sur la distribution des crevettes des moyennes etgrandes profondeurs. Studies and Reviews of the General FisheriesCouncil for the Mediterranean, FAO, 16. 53 pp.
Guijarro, B., Massutí, E., Moranta, J., Díaz, P., 2008. Populationdynamics of the red shrimp Aristeus antennatus in the BalearicIslands (western Mediterranean): Short spatio-temporal differencesand influence of environmental factors. J. Mar. Syst. 71, 385–402(this issue). doi:10.1016/j.jmarsys.2007.04.003.
Jaume, D., Cartes, J.E., Boxhall, G.A., 2000. Shallow-water and notdeep-sea as most plausible origin for cave-dwelling Paramiso-phria species (Copepoda: Calanoida: Arietellidae), with descrip-tion of three new species fromMediterraneas bathyal hyperbenthosand littoral caves. Contributions to Zoology 68, 205–244.
López Garcia, M.J., Millot, C., Font, J., García-Ledona, E., 1994.Surface circulation variability in the Balearic Basin. Journal ofGeophysical Research 99, 3285–3296.
López-Jurado, J.L., Marcos, M., Monserrat, S., 2008. Hydrographicconditions during the IDEA project (2003–2004). J. Mar. Syst. 71,303–315 (this issue). doi:10.1016/j.jmarsys.2007.03.007.
Madurell, T., Cartes, J.E., 2006. Trophic relationships and foodconsumption of slope dwelling macrourids from the bathyal IonianSea (eastern Mediterranean). Marine Biology 48, 1325–1338.
Madurrel, T., Fanelli, E., Cartes, J.E., 2008. Isotopic composition ofcarbon and nitrogen of suprabenthos fauna in the NW BalearicIslands (Western Mediterranean). J. Mar. Syst. 71, 336–345 (thisissue). doi:10.1016/j.jmarsys.2007.03.006.
Mauchline, J., 1980. The biology of mysids and euphausiids.Advances in Marine Biology 18, 1–681.
Mees, J., Jones, M.B., 1997. The hyperbenthos. Oceanography andMarine Biology:An Annual Review 35, 221–255.
Miquel, J.C., Fowler, S.W., La Rosa, J., Buat-Menard, P., 1994.Dynamics of the downward flux of particles and carbon in the open

335J.E. Cartes et al. / Journal of Marine Systems 71 (2008) 316–335
northwestern Mediterranean Sea. Deep-Sea Research (Part I,Oceanographic Research Papers) 41, 243–261.
Morales-Blake, A., 2006. Estudio multitemporal de la clorofilasuperficial en el Mar Mediterráneo Nor-occidental, evaluada a partirde datos Seawifs: Septiembre de 1997 aAgosto de 2004. Ph.D. Thesis,Universitat Politècnica de Catalunya, Barcelona, Spain, Unpublished.
Moranta, J., Quetglas, A., Massutí, E., Guijarro, B., Hidalgo, M., Diaz,P., 2008. Spatio-temporal variations in deep-sea demersalcommunities off the Balearic Islands (western Mediterranean).Journal of Marine Systems 71, 346–366 (this issue). doi:10.1016/j.jmarsys.2007.03.006.
Nival, P., Nival, S., Thiriot, A., 1975. Influence of winter conditions onphytozooplankton and zooplankton production in northwesternmediterranean. V. zooplankton biomass and production— phyto-zooplankton relationships. Marine Biology 31, 249–270.
Ohtsuka, S., Nishida, S., Machida, R.J., 2005. Systematics andzoogeography of the deep-sea hyperbenthic family Arietellidae(Copepoda: Calanoida) collected from the Sulu Sea. Journal ofNatural History 39, 2483–2514.
Polunin,N.V.C.,Morales-Nin, B., Herod,W., Cartes, J.E., Pinnegar, J.K.,Moranta, J., 2001. Feeding relationships in Mediterranean bathyalassemblages elucidated by carbon and nitrogen stable-isotope data.Marine Ecology Progress Series 220, 13–23.
Ribera-Maycas, E.. in press. Comportement migratoire et trophiquedes mysidacés benthopélagiques Anchialina agilis et Haplostyluslobatus sur la marge continentale en Méditerranée Nord-Occiden-tale: incidence sur les transferts de matiére. Ph.D. Thesis,Université de la Méditerranée, Centre d'Océanologie de Marseille,Marseille, France, unpublished.
Richoux, N.B., Deibel, D., Thompson, R.J., 2004a. Populationbiology of hyperbenthic crustaceans in a cold water environment
(Conception Bay, Newfoundland). 1. Mysis mixta (Mysidacea).Marine Biology 144, 881–894.
Richoux, N.B., Thompson, R.J., Deibel, D., 2004b. Populationbiology of hyperbenthic crustaceans in a cold water environment(Conception Bay, Newfoundland). 2. Acanthostepheia malmgreni(Amphipoda). Marine Biology 144, 895–904.
Sabatés, A., Gili, J.M., Pagés, F., 1989. Relationship between zooplanktondistribution, geographic characteristics and hydrographic patternsoff the Catalan coast (Western Mediterranean). Marine Biology 103,153–159.
Sainte-Marie, B., Brunel, P., 1985. Suprabenthic gradients ofswimming activity by cold-water gammaridean amphipod Crusta-cea over a muddy shelf in the Gulf of Saint Lawrence. MarineEcology Progress Series 23, 57–69.
Sardà, F., Cartes, J.E., 1997. Morphological features and ecologicalaspects of early juvenile specimens of the aristeid shrimp Aristeusantennatus in the Western Mediterranean. Marine and FreshwaterResearch 48, 73–77.
Sardou, J., Etienne, M., Andersen, V., 1996. Seasonal abundance andvertical distributions of macrozooplankton and micronekton in theNorthwestern Mediterranean Sea. Oceanological Acta 19, 645–656.
Vereshchaka, A.L., 1995. Macroplankton in the near-bottom layer ofcontinental slopes and seamounts. Deep-Sea Research (Part I,Oceanographic Research Papers) 42, 1639–1668.
Wildish, D.J., Wilson, A.J., Frost, B., 1992. Benthic boundary layermacrofauna of Browns Bank, Northwest Atlantic, as potential preyof juvenile benthic fish. Canadian Journal of Fisheries and AquaticSciences 49, 91–98.