Dynamics of slow wave activity in narcoleptic patients under bed rest conditions
12
ELSEVIER Electroencephalographyand clinical Neurophysiology 95 (1995) 414-425 Dynamics of slow wave activity in narcoleptic patients under bed rest conditions L. Nobili a,*, A. Besset b, F. Ferrillo a, G. Rosadini a, G. Schiavi a, M. Billiard b a Center for Sleep Medicine, Department of Motor Sciences, Center for Cerebral Neurophysiology, National Council of Research, University of Genoa, Genoa, Italy b Sleep and Wake Disorders Unit, Gui-de-Chauliac Hospital, Montpellier, France Accepted for publication: 6 June 1995 Abstract Following a baseline night recording, 9 narcoleptic subjects and 9 sex- and age-matched control subjects were maintained on 16 h of diurnal sleep deprivation. Thereafter subjects were submitted to a 32 h bed rest protocol in a sound- and light-attenuated room. The EEG was recorded and processed by a Fast Fourier Transform. Narcoleptics did not differ from controls in total sleep time over the whole 32 h, but spent more time sleeping during the daytime (DT). In both groups slow wave activity (SWA) showed an exponential decaying trend during the first night (NI); a similar exponential trend during the second night (N2) was evident only in controls. In controls SWA showed a circadian-circasemidian distribution that was hardly detectable in narcoleptics. Narcoleptics showed an ultradian distribution of SWA with periodic emergence every 4 h during DT and N2. Our data confirm that a homeostatic mechanism is evident in narcoleptics when stimulated by diurnal sleep deprivation, while circadian and circasemidian mechanisms are less evident during DT and N2. These findings suggest a different coupling between homeostatic sleep regulating processes and circadian drives to sleep in narcoleptics. Ultradian drives to sleep seem to be predominant in these patients, thus probably acting as a means for the avoidance of stressful attempts to counteract a weaker waking state maintenance mechanism. Keywords: Narcolepsy; Slow wave activity; Bed rest; Homeostasis; Circadian rhythm; Ultradian rhythm I. Introduction The pathophysiological mechanism responsible for ex- cessive daytime sleepiness and irresistible daytime sleep episodes in narcolepsy is still controversial. Nocturnal sleep of narcoleptic patients is often fragmented by an increased number of awakenings, as well as being charac- terized by low sleep efficiency and low levels of slow wave sleep (SWS) (Rechtschaffen et al., 1963; Mont- plaisir, 1976; Montplaisir et al., 1978). Laboratory (Rechtschaffen et al., 1963; Hishikawa et al., 1976; Mosko et al., 1983), ambulatory (Broughton et al., 1988) and free-run protocols (Pollak and Green, 1990) * Corresponding author. Cattedra di Neurofisiopatologia, DISM, Os- pedale S. Martino, Viale Benedetto XV, 16132, Genoa, Italy. Tel.: +39 10 3537465; Fax: + 39 10 3537699; E-mail: [email protected]. it. have shown a normal total sleep time in narcoleptics. The respective amounts of non-REM (NREM) and REM sleep and the circadian phase of REM sleep are preserved (Baldy-Moulinier et al., 1976). A key feature of th e narcoleptic syndrome is the abnor- mal distribution of sleep and wakefulness over the 24 h (Volk et al., 1990). In narcoleptic subjects the sleep-wake pattern is disrupted by intrusion of sleep during the day and of wakefulness during the night, thus suggesting that narcolepsy could be caused by a disorder of the rhythmic sleep organization resulting from the interaction of homeo- static, circadian and ultradian regulatory processes (Kripke, 1976; Pavel et al., 1980; Mosko et al., 1983). However, it has been shown that a defined circadian pattern persists, albeit attenuated, with most sleep re- stricted to the night period (Broughton et al., 1988; Dantz et al., 1994). In normal subjects circasemidian biorhythms of sleep and wake propensity, expressed by diumal pulses of SWS and forbidden zones for sleep, have been proposed by 0013-4694/95/$09.50 © 1995 Elsevier Science Ireland Ltd. All rights reserved SSDI 001 3-4694(95)0013 8-7 EEG 94763
-
Upload
independent -
Category
Documents
-
view
1 -
download
0
Transcript of Dynamics of slow wave activity in narcoleptic patients under bed rest conditions
ELSEVIER Electroencephalography and clinical Neurophysiology 95 (1995) 414-425
Dynamics of slow wave activity in narcoleptic patients under bed rest conditions
L. Nobili a,*, A. Besset b, F. Ferrillo a, G. Rosadini a, G. Schiavi a, M. Billiard b a Center for Sleep Medicine, Department of Motor Sciences, Center for Cerebral Neurophysiology, National Council of Research, University of Genoa,
Genoa, Italy b Sleep and Wake Disorders Unit, Gui-de-Chauliac Hospital, Montpellier, France
Accepted for publication: 6 June 1995
Abstract
Following a baseline night recording, 9 narcoleptic subjects and 9 sex- and age-matched control subjects were maintained on 16 h of diurnal sleep deprivation. Thereafter subjects were submitted to a 32 h bed rest protocol in a sound- and light-attenuated room. The EEG was recorded and processed by a Fast Fourier Transform. Narcoleptics did not differ from controls in total sleep time over the whole 32 h, but spent more time sleeping during the daytime (DT). In both groups slow wave activity (SWA) showed an exponential decaying trend during the first night (NI); a similar exponential trend during the second night (N2) was evident only in controls. In controls SWA showed a circadian-circasemidian distribution that was hardly detectable in narcoleptics. Narcoleptics showed an ultradian distribution of SWA with periodic emergence every 4 h during DT and N2. Our data confirm that a homeostatic mechanism is evident in narcoleptics when stimulated by diurnal sleep deprivation, while circadian and circasemidian mechanisms are less evident during DT and N2. These findings suggest a different coupling between homeostatic sleep regulating processes and circadian drives to sleep in narcoleptics. Ultradian drives to sleep seem to be predominant in these patients, thus probably acting as a means for the avoidance of stressful attempts to counteract a weaker waking state maintenance mechanism.
Keywords: Narcolepsy; Slow wave activity; Bed rest; Homeostasis; Circadian rhythm; Ultradian rhythm
I. Introduction
The pathophysiological mechanism responsible for ex- cessive daytime sleepiness and irresistible daytime sleep episodes in narcolepsy is still controversial. Nocturnal sleep of narcoleptic patients is often fragmented by an increased number of awakenings, as well as being charac- terized by low sleep efficiency and low levels of slow wave sleep (SWS) (Rechtschaffen et al., 1963; Mont- plaisir, 1976; Montplaisir et al., 1978).
Laboratory (Rechtschaffen et al., 1963; Hishikawa et al., 1976; Mosko et al., 1983), ambulatory (Broughton et al., 1988) and free-run protocols (Pollak and Green, 1990)
* Corresponding author. Cattedra di Neurofisiopatologia, DISM, Os- pedale S. Martino, Viale Benedetto XV, 16132, Genoa, Italy. Tel.: +39 10 3537465; Fax: + 39 10 3537699; E-mail: [email protected]. it.
have shown a normal total sleep time in narcoleptics. The respective amounts of non-REM (NREM) and REM sleep and the circadian phase of REM sleep are preserved (Baldy-Moulinier et al., 1976).
A key feature of th e narcoleptic syndrome is the abnor- mal distribution of sleep and wakefulness over the 24 h (Volk et al., 1990). In narcoleptic subjects the sleep-wake pattern is disrupted by intrusion of sleep during the day and of wakefulness during the night, thus suggesting that narcolepsy could be caused by a disorder of the rhythmic sleep organization resulting from the interaction of homeo- static, circadian and ultradian regulatory processes (Kripke, 1976; Pavel et al., 1980; Mosko et al., 1983).
However, it has been shown that a defined circadian pattern persists, albeit attenuated, with most sleep re- stricted to the night period (Broughton et al., 1988; Dantz et al., 1994).
In normal subjects circasemidian biorhythms of sleep and wake propensity, expressed by diumal pulses of SWS and forbidden zones for sleep, have been proposed by
0013-4694/95/$09.50 © 1995 Elsevier Science Ireland Ltd. All rights reserved SSDI 001 3-4694(95)0013 8-7 EEG 94763
L. Nobili et aL / Electroencephalography and clinical Neurophysiology 95 (1995) 414-425 415
Broughton (1975) and Lavie (1986) and confirmed in time-free disentrained studies by Zulley and Campbell (1985).
In narcoleptic patients the circasemidian rhythms of sleep appear to be maintained (Billiard et al., 1986; Broughton et al., 1988; Lavie, 1991).
Ultradian cyclicities have been studied in normal sub- jects, and 2 distinct periodicities in "sleepability" at 90 min and at about 3.5 h 'were found (Lavie and Zomer, 1984). A similar 3 -4 h rhythm in vigilance states was found by Nakagawa (19813,).
In narcoleptic patients :an ultradian periodicity at about 90-120 min in the distribution of sleep episodes was observed by Passouant et al. (1969) and confirmed more recently (Schulz, 1985; I~'. Koninck et al., 1986). Further- more, a 4 h periodicity of SWS has been reported by Billiard et al. (1990, 1992).
The dysregulation of the sleep-wake pattern led Volk et al. (1990) to investigate the regulation of SWS in narcolep- tics, but they did not find evidence of altered homeostatic processes.
It is well known that SWS is predominant in the early part of sleep and that sleep deprivation produces a selec- tive enhancement of SWS during recovery sleep (Williams et al., 1964; Agnew et al., 1967; Kales et al., 1970). In the 2-process model of sleep :regulation (Borbrly, 1982; Daan et al., 1984; Achermann et al., 1993) the power density of the delta (0.75-4.5 Hz) band, called slow wave activity (SWA) and obtained by ,;pectral analysis, is supposed to reflect the variations of a homeostatic recovery process (process S) that increases in a saturating exponential way during wakefulness. Its decrease is expressed by the expo- nential decline of SWA during sleep. Process S interacts with a circadian process (process C) (Dijk et al., 1991) that determines sleep timing. The 2-process model has been further modified (Borbrly et al., 1989) to account for the circasemidian sleep propensity, although no satisfactory fit has been obtained with laboratory data (Broughton and Mullington, 1992).
Tafti et al. (1992) recently studied the time course of SWA in successive NREM-REM cycles in narcoleptics after sleep deprivation, finding a monotonic exponential decreasing trend and thus concluding that there was no solid evidence for a disorder of NREM sleep homeostatic regulation in narcolepsy. The topic has recently been re- viewed by Besset et al. (1994).
Our study is an attempt to help clarify the issue of SWS regulation in narcoleptic patients, taking into account homeostatic as well as circadian, circasemidian and ultra- dian aspects. A relatively long time span was believed to be a prerequisite to allow for the expression of both circadian and homeostatic factors, whereas partial sleep deprivation was thought to be useful to stimulate the expression of homeostatic factors. For this purpose a study protocol of 32 h of consecutive bed rest preceded by 16 h of daytime sleep deprivatiion was designed.
2. Methods
2.1. Subjects
Nine narcoleptic subjects (7 males and 2 females, aged 20-55 years, mean 39.6, S.D. 4.3 years), all showing 2 or more sleep onset REM episodes on a previous MSLT, cataplectic episodes and excessive diurnal sleepiness (less than 5 min of mean sleep latency on MSLT), were in- cluded in the study. They were all DR2 positive.
All patients were either untreated or withdrawn from stimulant and anticataplecic drugs for at least 3 weeks.
Control subjects were 9 healthy paid volunteers who had given informed consent; each control subject was age and sex matched to a patient.
2.2. Experimental protocol
Both narcoleptics and controls were recorded for an adaptation night (23.00-07.00 h). Successively, subjects were prevented from sleeping for 16 consecutive h, under the continuous control of the laboratory staff. At 23.00 h they were recorded for 32 h in a bed rest protocol. The room was without windows and sound-attenuated. In order to allow subjects to have meals and to go to the bathroom a dim light (10 lux) was maintained constant throughout the protocol. Subjects were not allowed to get up, to read or to listen to the radio. They were not allowed to know the time of the day. They could ask for soft drinks and meals (breakfast, lunch or dinner). They were asked to stay in this condition until the end of the experiment, which was set at 07.00 h 2 days later. They were instructed to sleep as long as possible. Communication between subjects and a single investigator, by means of an interphone and a video monitor, were reduced only to meal delivery and bathroom pauses.
The experimental protocol was approved by the Ethic Committee of the Montpellier University School of Medicine, and subjects were free to leave it at whatever time they wished.
2.3. Recording procedure and data analysis
EEGs were derived from C3-A2 and C4-A1. EMG and eye movements were also recorded. EEGs were low-pass filtered at 40 Hz and on-line digitized at a sampling rate of 128 Hz by a STC-PC 12-16200 card (SMZI France) on a personal computer. The high-pass filters for the EEGs were at 0.5 Hz. Both EEG signals were processed on-line by an FFT routine that was implemented on a WE DSP32 digital processor card. The epoch length was 4 sec and a Hamming window was applied.
Power spectra were calculated by the method of Welch (i.e., 9 epochs overlapping every 2 sec) and the resulting spectra were averaged every 20 sec if more than 5 epochs were artifact-free. In order to synchronize power spectra and visual scores of paper recording, a time signal was
416 L. Nobili et al./ Electroencephalography and clinical Neurophysiology 95 (1995) 414-425
generated and recorded both on EEG paper and on the PC. This enabled us to eliminate epochs with artifacts by visual inspection of the records and to calculate power spectra per cycle. Records were scored according to the stan- dardized criteria of Rechtschaffen and Kales (1968) in 20 sec epochs. A first analysis was performed comparing sleep parameters of the 2 groups extracted from the whole recording time. For further analysis the 32 h time span was subdivided distinguishing: (1) a first sleep episode (night 1, N1) defined as starting at 23.00 h of the first night and ending at the beginning of a continuous waking state lasting longer than 20 min; (2) a daytime sleep episode (DT), defined as lasting from the end of N1 until 23.00 h; (3) a second nocturnal sleep episode (night 2, N2) from 23.00 to 07.00 h. The cut-off at 23.00 h between DT and N2 was decided on to avoid the difficulties in detecting the moment of the second nocturnal sleep onset, especially in narcoleptic patients. The hypothesis of statistically signifi- cant differences between the 3 sessions (N1, DT, N2) and between the 2 groups (narcoleptics, controls) was tested by a 2-factor ANOVA and post hoc t test. Data have been expressed as percentages of the duration of each session.
During N1 NREM-REM cycles were defined according to the criteria of Feinberg and Floyd (1979) by the succes- sion of an NREM sleep episode lasting at least 15 min and a REM sleep episode of at least 5 min. In narcoleptics REM sleep onset episodes were defined as the occurrence of REM sleep in the first 20 min of sleep and the cycles were defined as the succession of REM-NREM episodes.
During DT and N2, sleep cycles were accepted if they contained at least 15 min of continuous NREM sleep, irrespective of the order of NREM-REM, REM-NREM sequences or NREM alone. This modified definition of sleep cycles allowed us to analyze all sleep cycles, while disregarding possible changes in their structure during the experimental condition.
2.4. Time course o f SWA
SWA (0.75-4.5 Hz) power density in sleep cycles was averaged per cycle. For each subject the cycle values of SWA were expressed as percentages of the average SWA in total sleep during the whole bed rest condition and divided into N1, DT and N2. Values of SWA were then plotted versus time at cycle midpoints. An exponential decaying function with a horizontal asymptote was fitted to the data by a non-linear regression procedure. The fitted function was SWA t = SWA 0 X e -t/~ + SWA~ where SWA 0 represents the intercept with the ordinate; t is the time of the cycle midpoint; ~- is the time constant of the exponential function; SWA~ represents the horizontal asymptote if t approaches ~.
2.5. Periodicity o f SWA
In order to study any possible periodicity of SWA, the delta band (0.75-4.5 Hz) power values derived from EEG
spectral analysis were averaged into epochs of 10 min, thus obtaining a temporal series of SWA in the 32 h (192 epochs per subject).
A first analysis was performed in order to detect the existence and timing of delta pulses. For this purpose the time series of SWA underwent an amplitude normalization and a smoothing procedure (c(t) = [c(t - 1) + 2 X c(t) + c(t + 1)]/4 with 100 iterations). Peaks and troughs were detected in each subject and ranked according to their order of occurrence. We performed ANOVA on the values of peaks and troughs, with subjects and order of occur- rence as factors, as well as a post hoc t test comparison between each single value and the mean value of peaks and troughs, both in controls and in narcoleptics.
In order to detect the presence of periodicities and to evaluate their importance in the composition of the studied epoch a zero padding procedure was applied to the data, thus making the time series long enough for the FFT (256 data points corresponding to 42.6 h). The full spectrum was studied after having rejected the power of the first frequency band in order to eliminate the continuous com- ponent of the signal.
The importance of each periodicity in the composition of the time series was evaluated in terms of the percentage of spectral variance explained by each frequency. In order to assess the intra- and inter-group differences due to frequency-related signal variations a 2-factor ANOVA and a post hoc t test were performed on the values of spectral variance explained by each frequency, with group and frequency as factors.
The hypothesis of the prevalence of different cyclicities in successive temporal portions of the studied sessions was tested by performing a periodogram on N1, DT and N2.
A 2-factor ANOVA and a post hoc t test were sepa- rately performed on the values of the highest peaks of the periodograms, using the groups and the sessions as factors.
3. Results
3.1. Polygraphic data
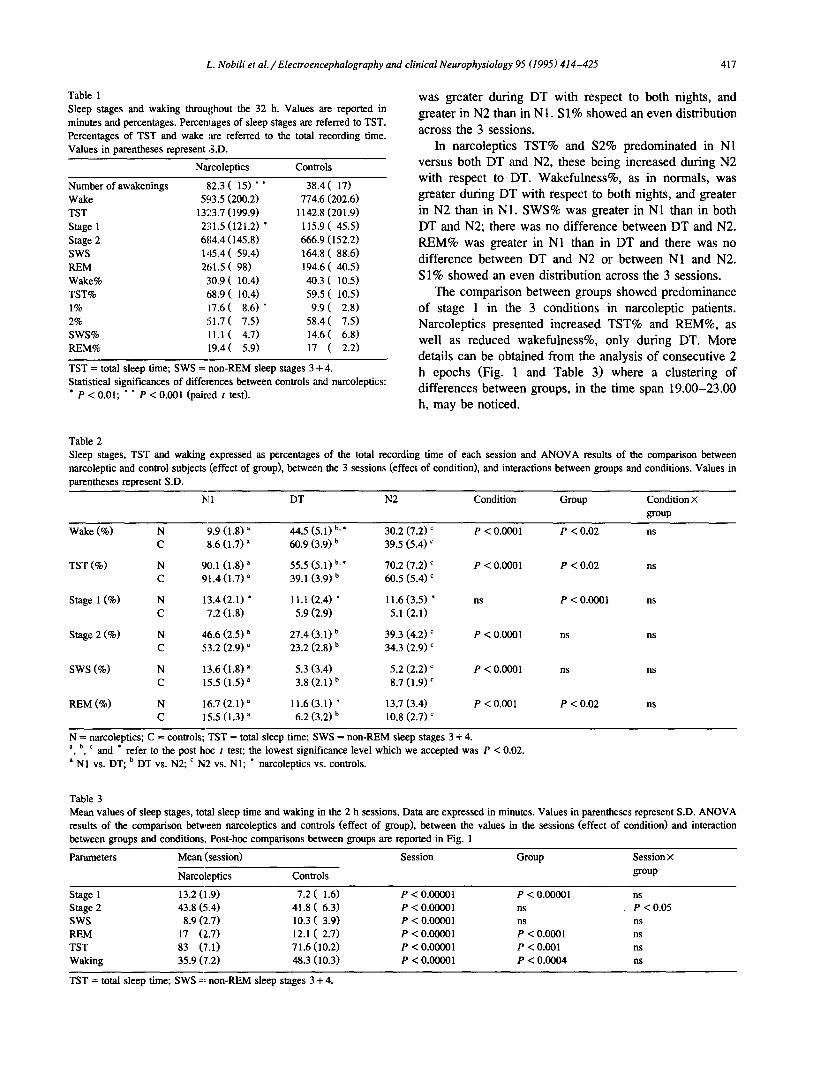
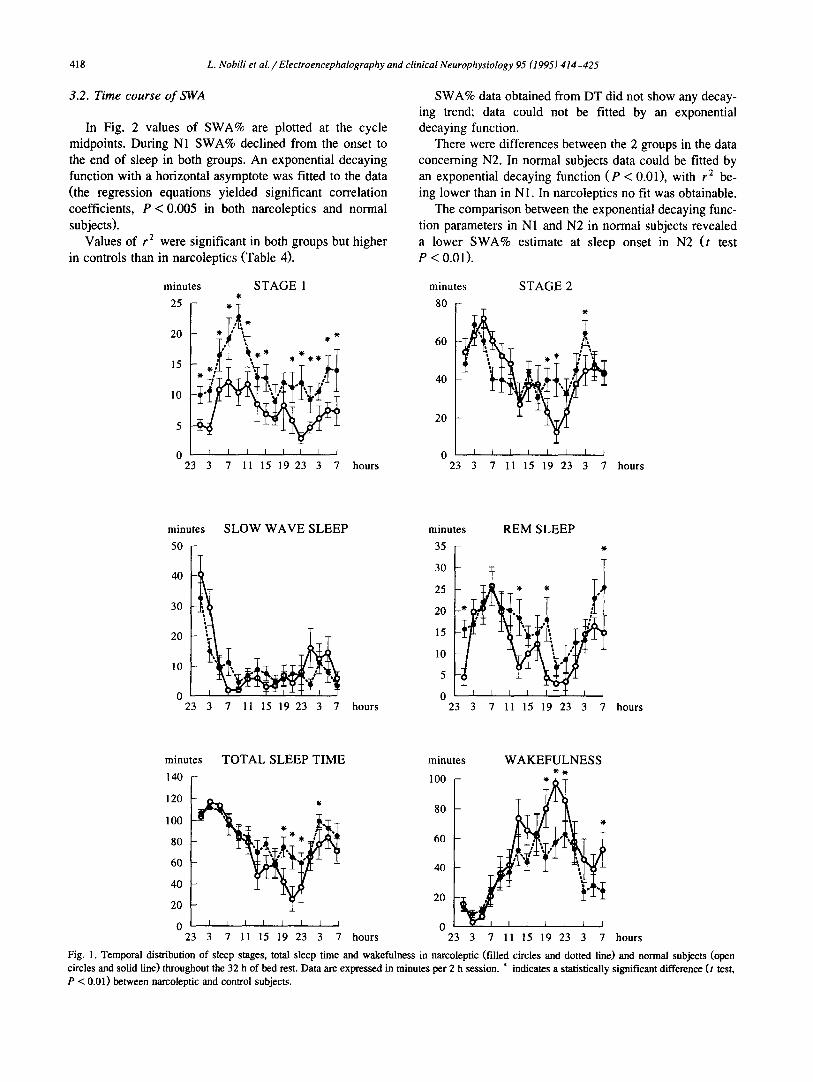
Data concerning sleep parameters assessed throughout the 32 h of BR are reported in Table 1. The only signifi- cant differences between narcoleptics and controls have been found in stage 1 and in the number of awakenings, which were increased in narcoleptics. Narcoleptic patients had an increased TST and REM duration, as well as decreased wakefulness, with respect to control subjects. However, these differences did not reach statistical signifi- cance.
Data from N1, DT and N2 (Table 2) demonstrate differences between the 3 sessions. In normals there was a greater amount of TST%, S2%, SWS% and REM% during each of the 2 nights with respect to DT, the greatest amount being in N1. Wakefulness% on the other hand,
L. Nobili et al. / Electroencephalography and clinical Neurophysiology 95 (1995) 414-425 417
Table 1 Sleep stages and waking throughout the 32 h. Values are reported in minutes and percentages. Percentages of sleep stages are referred to TST. Percentages of TST and wake are referred to the total recording time. Values in parentheses represent S.D.
Narcoleptics Controls
Number of awakenings ~;2.3 ( 1 5 ) * * 38.4 ( 1 7 ) Wake 5c~3.5 (200.2) 774.6 (202.6) TST 1323.7 (199.9) 1142.8 (201.9) Stage 1 231.5 (121.2) * 115.9 (45 .5 ) Stage 2 684.4 (145.8) 666.9 (152.2) SWS 145.4 (59 .4 ) 164.8 (88 .6 ) REM 261.5 ( 9 8 ) 194.6 ( 4 0 . 5 ) Wake% 30.9 (10 .4 ) 40.3 (10 .5 ) TST% 68.9 (10 .4 ) 59.5 (10 .5 ) 1% ii7.6 ( 8 . 6 ) * 9.9 ( 2 . 8 ) 2% 5 1 . 7 ( 7 . 5 ) 5 8 . 4 ( 7 . 5 ) SWS% 1 1 . 1 ( 4 . 7 ) 1 4 . 6 ( 6 . 8 ) REM% 119.4(5 .9) 17 ( 2 . 2 )
TST = total sleep time; SWS -- non-REM sleep stages 3 + 4. Statistical significances of differences between controls and narcoleptics: * P < 0.01; " * P < 0.001 (pair~.~d t tes0.
was greater during DT with respect to both nights, and greater in N2 than in N1. S1% showed an even distribution across the 3 sessions.
In narcoleptics TST% and S2% predominated in N1 versus both DT and N2, these being increased during N2 with respect to DT. Wakefulness%, as in normals, was greater during DT with respect to both nights, and greater in N2 than in N1. SWS% was greater in N1 than in both DT and N2; there was no difference between DT and N2. REM% was greater in N1 than in DT and there was no difference between DT and N2 or between N1 and N2. S 1% showed an even distribution across the 3 sessions.
The comparison between groups showed predominance of stage I in the 3 conditions in narcoleptic patients. Narcoleptics presented increased TST% and REM%, as well as reduced wakefulness%, only during DT. More details can be obtained from the analysis of consecutive 2 h epochs (Fig. 1 and Table 3) where a clustering of differences between groups, in the time span 19.00-23.00 h, may be noticed.
Table 2 Sleep stages, TST and waking narcoleptic and control subjects parentheses represent S.D.
expressed as percentages of the total recording time of each session and ANOVA results of the comparison between (effect of group), between the 3 sessions (effect of condition), and interactions between groups and conditions. Values in
Ix[ 1 DT N2 Condition Group Condition × group
Wake (%) N 9.9 (1.8) a 44.5 (5.1) b.* 30,2 (7.2) c P < 0.0001 P < 0.02 ns C 8.6 (1.7) a 60.9 (3.9) b 39.5 (5.4) c
TST (%) N 90.1 (1.8) a 55.5 (5.1) b. * 70.2 (7.2) c P < 0.0001 P < 0.02 ns C 91.4 (1.7) a 39.1 (3.9) b 60.5 (5.4) c
Stage 1 (%) N 13.4 (2.1) * 11.1 (2.4) * 11.6 (3.5) * ns P < 0.0001 ns C 7.2 (1.8) 5.9 (2.9) 5.1 (2.1)
Stage 2 (%) N 46.6 (2.5) a 27.4 (3.1) b 39.3 (4.2) c P < 0.0001 ns ns C 53.2 (2.9) ~ 23.2 (2.8) b 34.3 (2.9) c
SWS (%) N 13.6 (1.8) a 5.3 (3.4) 5.2 (2.2) c P < 0.0001 ns ns C 15.5 (1.5) a 3.8 (2.1) b 8.7 (1.9) c
REM (%) N 16.7 (2.1) ~ 11.6 (3.1) * 13.7 (3.4) P < 0.001 P < 0.02 ns C 15.5 (1.3) a 6.2 (3.2) b 10.8 (2.7) ~
N = narcoleptics; C = controls; TST = total sleep time; SWS = non-REM sleep stages 3 + 4. a, b, ¢ and * refer to the post h o c t test; the lowest significance level which we accepted was P < 0.02. a N1 vs. DT; b DT vs. N2; c N2 vs. N1; " narcoleptics vs. controls.
Table 3 Mean values of sleep stages, total sleep time and waking in the 2 h sessions. Data are expressed in minutes. Values in parentheses represent S.D. ANOVA results of the comparison between narcoleptics and controls (effect of group), between the values in the sessions (effect of condition) and interaction between groups and conditions. Post-hoc comparisons between groups are reported in Fig. 1
Parameters Mean (session) Session Group Session ×
Narcoleptics Controls group
Stage 1 13.2 (1.9) 7.2 ( 1 . 6 ) P < 0.00001 P < 0.00001 ns Stage 2 43.8 (5.4) 41.8 ( 6 . 3 ) P < 0.00001 ns P < 0.05 SWS 8.9 (2.7) 10.3 ( 3 . 9 ) P < 0.00001 ns ns REM 17 (2.7) 12.1 ( 2 . 7 ) P < 0.00001 P < 0.0001 ns TST 83 ('7.1) 71.6 (10.2) P < 0.00001 P < 0.001 ns Waking 35.9 (7.2) 48.3 (I0.3) P < 0.00001 P < 0.0004 ns
TST = total sleep time; SWS =~ non-REM sleep stages 3 + 4.
418 L. Nobili et al. / Electroencephalography and clinical Neurophysiology 95 (1995) 414-425
3.2. Time course of SWA
In Fig. 2 values of SWA% are plotted at the cycle midpoints. During N1 SWA% declined from the onset to the end of sleep in both groups. An exponential decaying function with a horizontal asymptote was fitted to the data (the regression equations yielded significant correlation coefficients, P < 0.005 in both narcoleptics and normal subjects).
Values of r 2 were significant in both groups but higher in controls than in narcoleptics (Table 4).
SWA% data obtained from DT did not show any decay- ing trend; data could not be fitted by an exponential decaying function.
There were differences between the 2 groups in the data concerning N2. In normal subjects data could be fitted by an exponential decaying function (P < 0.01), with r 2 be- ing lower than in N1. In narcoleptics no fit was obtainable.
The comparison between the exponential decaying func- tion parameters in N1 and N2 in normal subjects revealed a lower SWA% estimate at sleep onset in N2 (t test P < 0.01).
minutes S T A G E 1
25 f 20 * ° *
15 . , '~
105 * ~
0 23 3 7 11 15 19 23 3 7 hours
minutes S T A G E 2
80
60
40
20
I I I I I I I t
23 3 7 11 15 19 23 3 7 hours
minutes
50
40
30
20
10
0 23
SLOW WAVE SLEEP
7 11 15 19 23 3 7
minutes R E M S L E E P
35 ,
30
25 * * ,
20
15
10
5
0 hours 23 3 7 11 15 19 23 3 7 hours
minutes
140
120
100
80
60
TOTAL SLEEP TIME
40
20
0 23
I I I I I I I I
3 7 11 15 19 23 3 7
minutes W A K E F U L N E S S
100 *
80
60
40 )
20
0 hours 23 3 7 11 15 19 23 3 7 hours
Fig. 1. Temporal distribution of sleep stages, total sleep time and wakefulness in narcoleptic (filled circles and dotted line) and normal subjects (open circles and solid line) throughout the 32 h of bed rest. Data are expressed in minutes per 2 h session. * indicates a statistically significant difference (t test, P < 0.01) between narcoleptic and control subjects.
L. Nobili et al. / Electroencephalography and clinical Neurophysiology 95 (1995) 414-425 419
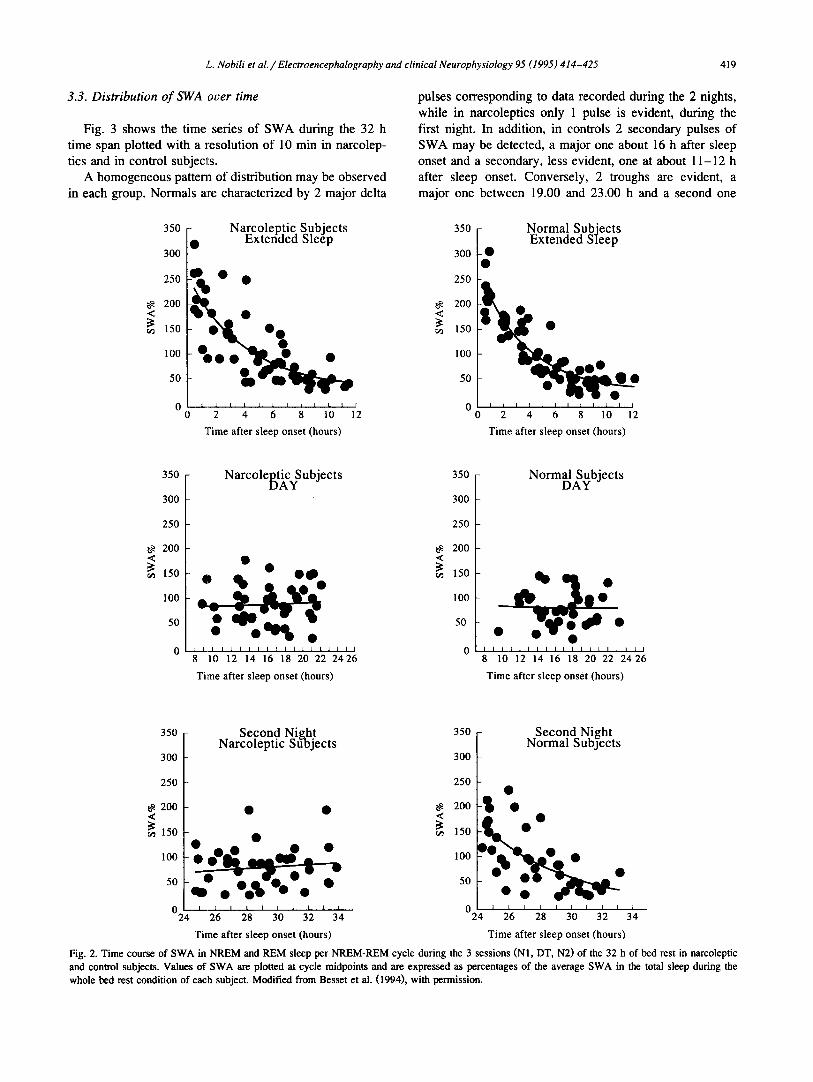
3.3. Distribution of SWA over time
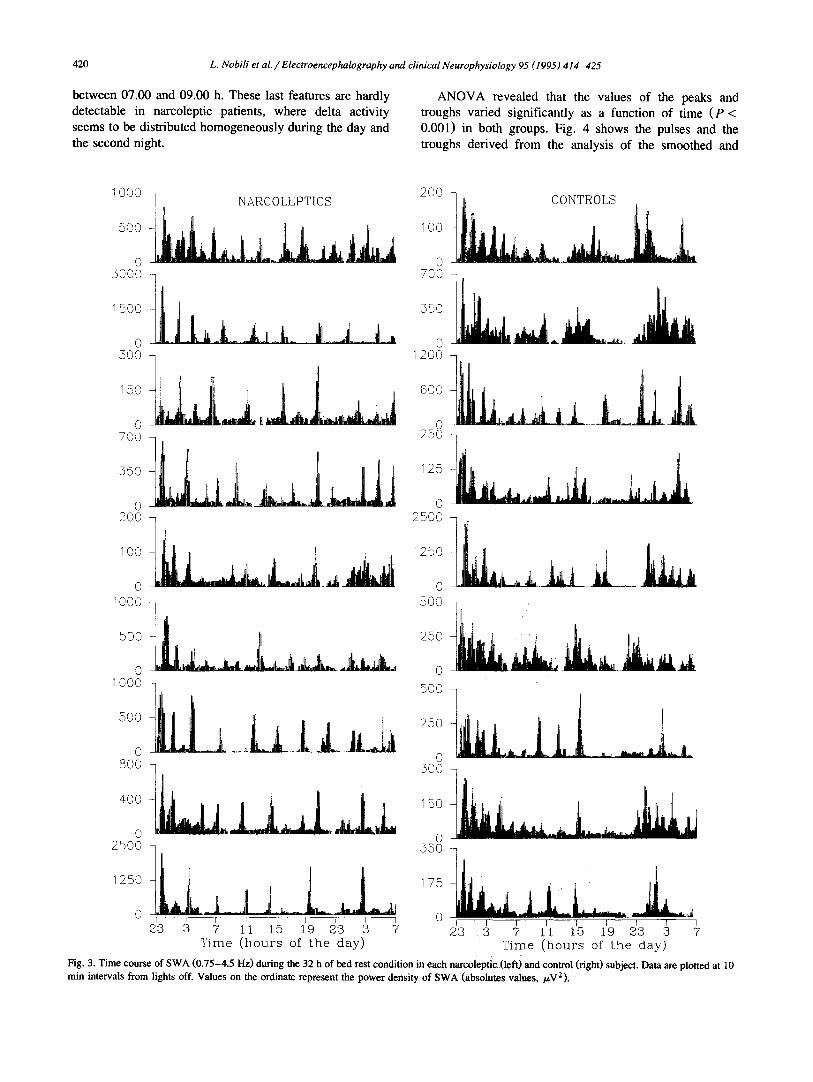
Fig. 3 shows the time series of SWA during the 32 h time span plotted with a resolution of 10 min in narcolep- tics and in control subjects.
A homogeneous pattern of distribution may be observed in each group. Normals ~tre characterized by 2 major delta
pulses corresponding to data recorded during the 2 nights, while in narcoleptics only 1 pulse is evident, during the first night. In addition, in controls 2 secondary pulses of SWA may be detected, a major one about 16 h after sleep onset and a secondary, less evident, one at about 11-12 h after sleep onset. Conversely, 2 troughs are evident, a major one between 19.00 and 23.00 h and a second one
<
350
300 I •
250
200
150
100
50
0 0
Narcoleptic Subjects Extended Sleep
2 4 6 8 10
q?ime after sleep onset (hours)
12
<
350 -
300 •
25O
200
150 -
100
50
0 __t_ 0
Normal Subjects Extended Sleep
2 4 6 8 10 12
Time after sleep onset (hours)
350
300
250
200
150
100
50
N arc o le~)tiAcyS u bj e c t s 350
300
250
200 • • <
o • 15o °
QO0 0 ~ 1 ~ 0 50
I [ I I I I I I I P I I I I t I I ~ I 0
8 10 12 14 16 18 20 22 2426
Time after sleep onset (hours)
Normal Subjects DAY
• •
I I I I I I I ~ I ~ I I I I I I I I I
8 10 12 14 16 18 20 22 24 26
Time after sleep onset (hours)
350 Second Nizht 350 f[_~ . Second Night Narcoleptic Subjects r~ormal Subjects
300 300
250 250
200
150 ~ O 0 / 0 - . • • •
I0o ~ O _ _ ~ 10o
0 0 24 26 28 30 32 34 24 26 28 30 32 34
Time after sleep onset (hours) Time after sleep onset (hours)
Fig. 2. Time course of SWA in NREM and REM sleep per NREM-REM cycle during the 3 sessions (N1, DT, N2) of the 32 h of bed rest in narcoleptic and control subjects. Values of SWA are plotted at cycle midpoints and are expressed as percentages of the average SWA in the total sleep during the whole bed rest condition of each subject. Modified from Besset et al. (1994), with permission.
420 L. Nobili et al. /Electroencephalography and clinical Neurophysiology 95 (1995) 414-425
between 07.00 and 09.00 h. These last features are hardly detectable in narcoleptic patients, where delta activity seems to be distributed homogeneously during the day and the second night.
A N O V A revealed that the values of the peaks and troughs varied significantly as a function of time ( P < 0.001) in both groups. Fig. 4 shows the pulses and the troughs derived from the analysis of the smoothed and
1000
5OO
0 5000
1500
0 50O
150
0 7OO
550
0 2OO
100
0 IOO0
5OO
0 1000
5OO
0 8OO
400
0 2500
1250
0
200 NARCOLEPTICS
700
_ _ L _ L _ I , _ o 1200
250
2500
-] 5oo
o
0
150
0 550
i i i I r 0 15 :19 23 9 7
I P I F 23 3 7 11
Time (hour s of t he day)
CONTROLS
]
_ i l l i tli,.,, jii,
i | " f l - - | q I I I I I I r I
23 3 7 11 15 19 23 3 7 Time (hours of the day)
Fig. 3. Time course of SWA (0.75-4.5 Hz) during the 32 h of bed rest condition in each narcoleptic (left) and control (right) subject. Data are plotted at 10 min intervals from lights off. Values on the ordinate represent the power density of SWA (absolutes values, /.~V2).
200 -
180 - •
120 '~\
1 O0 ~ / *"
80
60 ~ / 40 V ' ~ '
2 0 -
o I I I I I I I I I I I I I I I I 0 2 4 6 8 10 12 14 16 18 20 22 24 26 28 30 32
Time after sleep onset (hours)
Fig. 4. Distribution over time of peaks and troughs (mean and S.D.) of normalized and smoothed SWA throughout the 32 h of bed rest condition in narcoleptic (filled circles and dotted line) and control (open circles and solid line) subjects. * indicates a statistically significant difference (t test, P < 0.01) between each single value and the mean value of peaks and troughs, in each group.
Table 4 Summary of the non-linear regression analysis on the time course of mean SWA in non-REM and P4!M sleep over successive sleep cycles. No fit was obtainable for N2 of naraoleptics. Values in parentheses represent 1 S.E.M.
N1 N2
Narcoleptics Controls Narcoleptics Controls
SWA o (%) 226 (22.75) 243.2( 14.35)* - 175 (48.6) r (rain) 263 (101) 229.3 (150) - 343 (53.6) SWA~ (%) 30.5 (25 .7) 24.9 (14.02) - 15.3 (43.2) r 2 69.8 82.8 - 55.3
* Statistically significant difference (t test, P < 0.01) of SWAo% be- tween N1 and N2 in controls.
normalized SWA time series. Three delta pulses and 3 troughs were found to be significant (P < 0.001) in normal subjects. A first significa:at major peak was detected at the beginning of the first night (mean 132 + 22 min from sleep onset), a second one in the mid-afternoon (mean 1000 + 40 min) and a third one in the first part of the second night (mean 1600 + 45 min). Three significant troughs (P < 0.001) were observed: the first one in the early morning (mean 418 -1- 24 min), the second one in the late evening (mean 1338 _ 42 min) and a third one in the early morning of N2 (mean 1830 + 31 min). In narcoleptic patients only the first peak at the beginning of the first night (mean 162 + 35 min) was significant (P < 0.001). Only 1 signifi- cant trough was detected in the early morning of the first night (P < 0.001, mean ,$98 + 61 min).
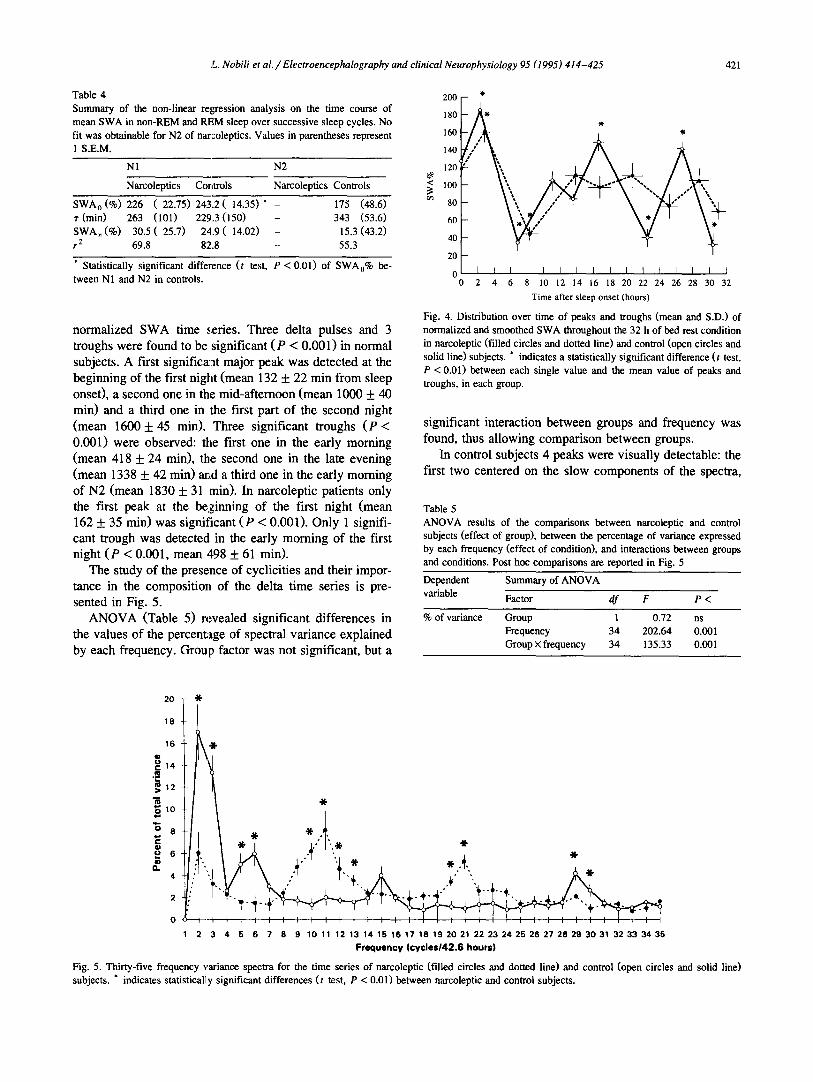
The study of the presence of cyclicities and their impor- tance in the composition of the delta time series is pre- sented in Fig. 5.
ANOVA (Table 5) revealed significant differences in the values of the percentage of spectral variance explained by each frequency. Group factor was not significant, but a
significant interaction between groups and frequency was found, thus allowing comparison between groups.
In control subjects 4 peaks were visually detectable: the first two centered on the slow components of the spectra,
Table 5 ANOVA results of the comparisons between narcoleptic and control subjects (effect of group), between the percentage of variance expressed by each frequency (effect of condition), and interactions between groups and conditions. Post hoc comparisons are reported in Fig. 5
Dependent Summary of ANOVA
variable Factor df F P <
% of variance
20 "!(.
18
16 "11"
o -
12
10
8
6
4
2
0
Group 1 0.72 ns Frequency 34 202.64 0.001 Group × frequency 34 135.33 0.001
L. Nobili et al. / Electroencephalography and clinical Neurophysiology 95 (1995) 414-425 421
I 2 3 4 5 6 7 8 9 10 11 12 13 14 15 16 17 18 19 2 0 2 1 2 2 2 3 2 4 2 5 26 2 7 2 8 2 9 3 0 3 1 3 2 3 3 3 4 3 5
Frequency (cyc les142.6 hours)
Fig. 5. Thirty-five frequency variance spectra for the time series of narcoleptic (filled circles and dotted line) and control (open circles and solid line) subjects. * indicates statistically significant differences (t test, P < 0.01) between narcoleptic and control subjects.
422 L. Nobili et al. / Electroencephalography and clinical Neurophysiology 95 (1995) 414-425
40 <
o~ 30
• = I 20
o 50
NI
i \
- - ' I i I I I l 80 I10 140 170 200 230 260
Period of SWA (min)
I f 290 320
40 <
30
"~ 20
0 5o
DT
, s S
80 110 140 170 200 230 260 290 320
Period of SWA (min)
third related to a periodicity of about 120 min. t test comparison between groups is also reported in Fig. 5. The percentage of variance explained by frequencies 2, 3, 5, 6 and 29, 30 was greater in controls, while variance ex- plained by frequencies 10, 11, 12, 13 and 20, 21 was
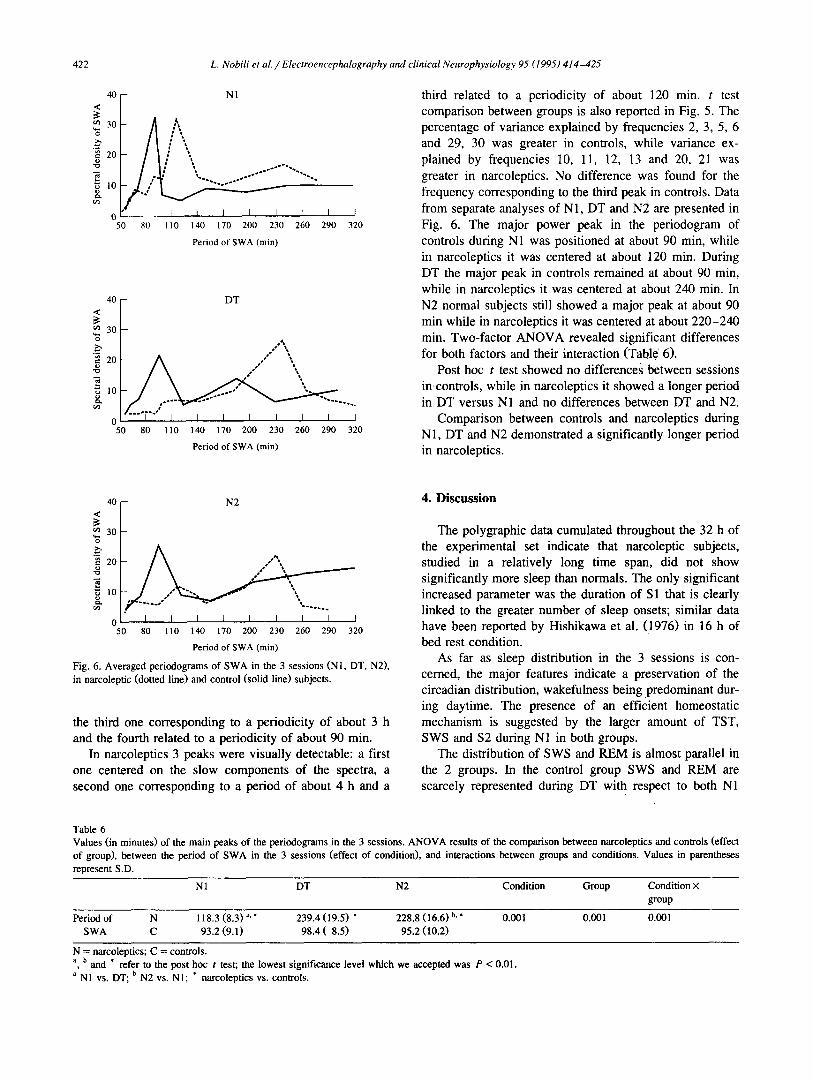
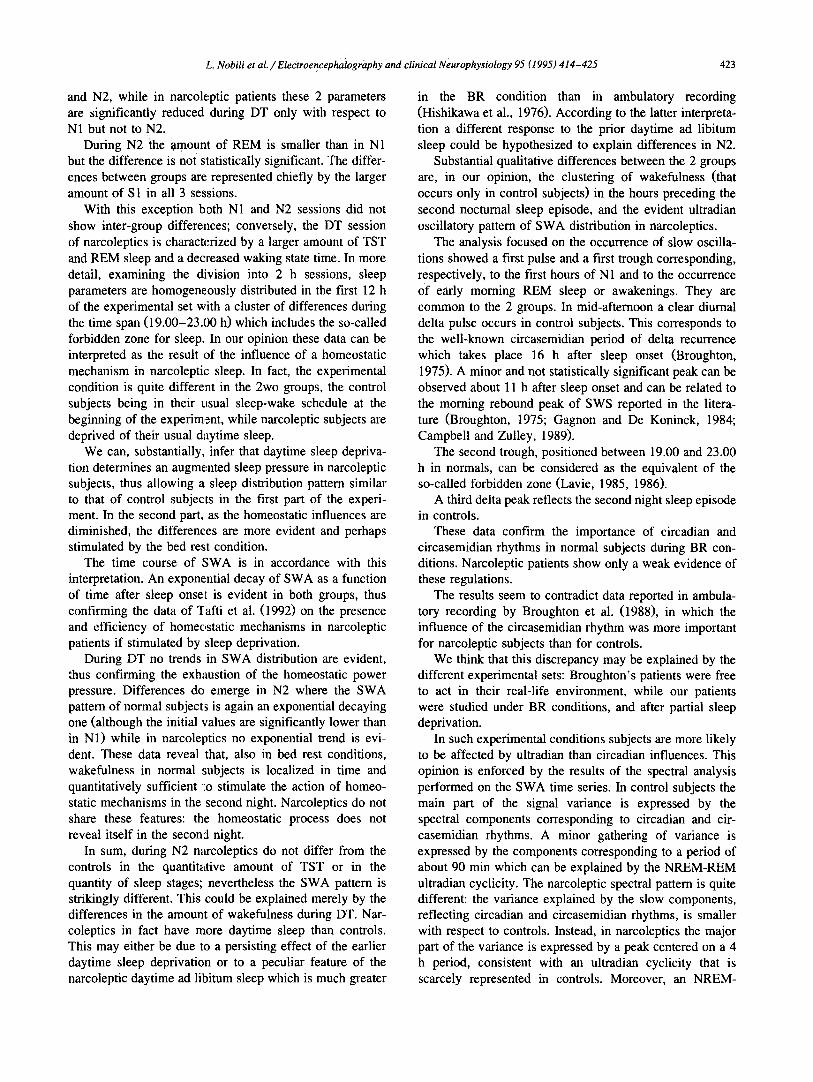
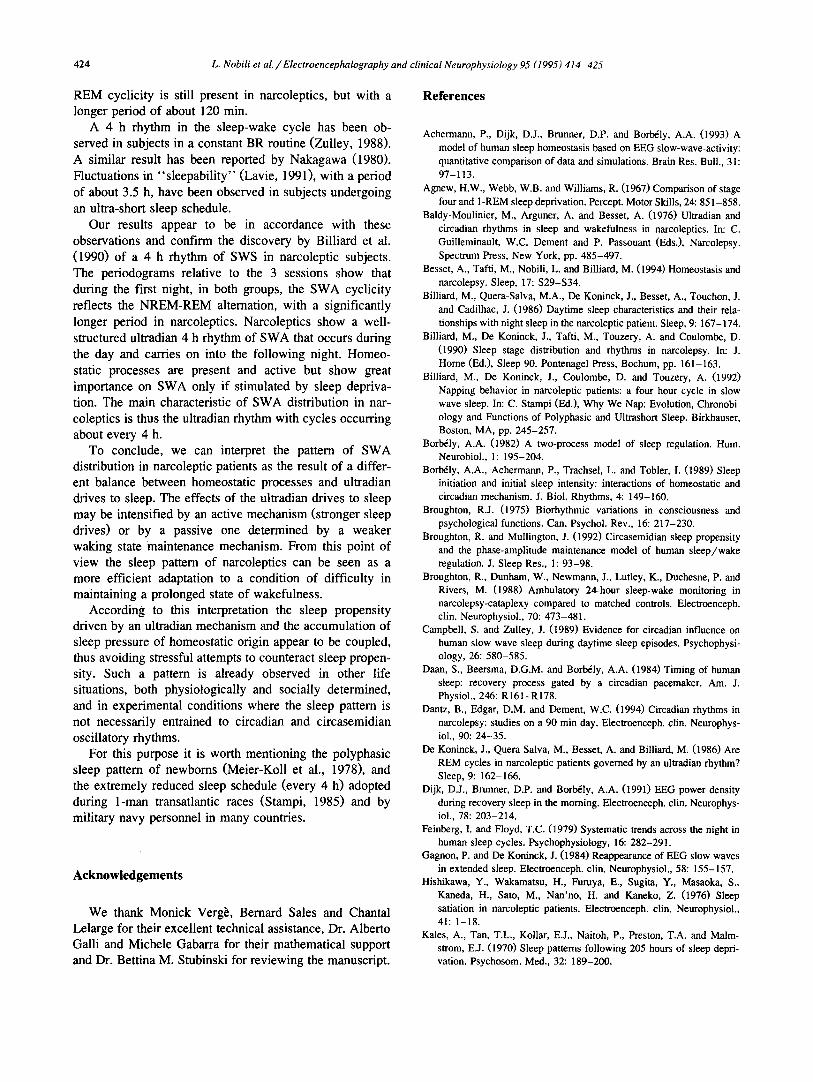
greater in narcoleptics. No difference was found for the frequency corresponding to the third peak in controls. Data from separate analyses of N1, DT and N2 are presented in F ig . 6. The major power peak in the periodogram of controls during N1 was posit ioned at about 90 min, while in narcoleptics it was centered at about 120 min. During DT the major peak in controls remained at about 90 min, while in narcoleptics it was centered at about 240 min. In N2 normal subjects still showed a major peak at about 90 min while in narcoleptics it was centered at about 220-240 min. Two-factor A N O V A revealed significant differences for both factors and their interaction (Table 6).
Post hoc t test showed no differences between sessions in controls, while in narcoleptics it showed a longer period in DT versus N1 and no differences between DT and N2.
Comparison between controls and narcoleptics during N1, DT and N2 demonstrated a significantly longer period in narcoleptics.
40 <
o~ 30
20
0 5O
N2
I I I I I I I I I 80 110 140 170 200 230 260 290 320
Period of SWA (min)
Fig. 6. Averaged periodograms of SWA in the 3 sessions (NI, DT, N2), in narcoleptic (dotted line) and control (solid line) subjects.
the third one corresponding to a periodicity of about 3 h and the fourth related to a periodicity of about 90 min.
In narcoleptics 3 peaks were visually detectable: a first one centered on the slow components of the spectra, a second one corresponding to a period of about 4 h and a
4 . D i s c u s s i o n
The polygraphic data cumulated throughout the 32 h of the experimental set indicate that narcoleptic subjects, studied in a relatively long time span, did not show significantly more sleep than normals. The only significant increased parameter was the duration of S 1 that is clearly linked to the greater number of sleep onsets; similar data have been reported by Hishikawa et al. (1976) in 16 h of bed rest condition.
As far as sleep distribution in the 3 sessions is con- cerned, the major features indicate a preservation of the circadian distribution, wakefulness being predominant dur- ing daytime. The presence of an efficient homeostatic mechanism is suggested by the larger amount of TST, SWS and $2 during N1 in both groups.
The distribution of SWS and REM is almost parallel in the 2 groups. In the control group SWS and REM are scarcely represented during DT with respect to both N1
Table 6 Values (in minutes) of the main peaks of the periodograms in the 3 sessions. ANOVA results of the comparison between narcoleptics and controls (effect of group), between the period of SWA in the 3 sessions (effect of condition), and interactions between groups and conditions. Values in parentheses represent S.D.
N 1 DT N2 Condition Group Condition × group
Period of N 118.3 (8.3) a. * 239.4 (19.5) * 228.8 (16.6) b.* 0.001 0.001 0.001 SWA C 93.2 (9.1) 98.4 (8.5) 95.2 (10.2)
N = narcoleptics; C = controls. a, b and * refer to the post hoc t test; the lowest significance level which we accepted was P < 0.01. a N1 vs. DT; b N2 vs. N1; * narcoleptics vs. controls.
L. Nobili et al. / Electroencephalography and clinical Neurophysiology 95 (1995) 414-425 423
and N2, while in narcole, ptic patients these 2 parameters are significantly reduced during DT only with respect to N1 but not to N2.
During N2 the amount of REM is smaller than in N1 but the difference is not statistically significant. The differ- ences between groups are represented chiefly by the larger amount of S 1 in all 3 sessions.
With this exception both NI and N2 sessions did not show inter-group differences; conversely, the DT session of narcoleptics is characterized by a larger amount of TST and REM sleep and a decreased waking state time. In more detail, examining the division into 2 h sessions, sleep parameters are homogeneously distributed in the first 12 h of the experimental set with a cluster of differences during the time span (19.00-23.00 h) which includes the so-called forbidden zone for sleep. In our opinion these data can be interpreted as the result of the influence of a homeostatic mechanism in narcoleptic sleep. In fact, the experimental condition is quite different in the 2wo groups, the control subjects being in their usual sleep-wake schedule at the beginning of the experiment, while narcoleptic subjects are deprived of their usual daytime sleep.
We can, substantially, infer that daytime sleep depriva- tion determines an augmented sleep pressure in narcoleptic subjects, thus allowing a sleep distribution pattern similar to that of control subjects in the first part of the experi- ment. In the second part, as the homeostatic influences are diminished, the differences are more evident and perhaps stimulated by the bed rest condition.
The time course of SWA is in accordance with this interpretation. An expone, ntial decay of SWA as a function of time after sleep onset is evident in both groups, thus confirming the data of Tafti et al. (1992) on the presence and efficiency of homeostatic mechanisms in narcoleptic patients if stimulated by sleep deprivation.
During DT no trends in SWA distribution are evident, thus confirming the exhaustion of the homeostatic power pressure. Differences do emerge in N2 where the SWA pattern of normal subjects is again an exponential decaying one (although the initial values are significantly lower than in N1) while in narcoleptics no exponential trend is evi- dent. These data reveal that, also in bed rest conditions, wakefulness in normal subjects is localized in time and quantitatively sufficient 1:o stimulate the action of homeo- static mechanisms in the second night. Narcoleptics do not share these features: the homeostatic process does not reveal itself in the seconcl night.
In sum, during N2 narcoleptics do not differ from the controls in the quantitmive amount of TST or in the quantity of sleep stages; nevertheless the SWA pattern is strikingly different. This could be explained merely by the differences in the amount of wakefulness during DT. Nar- coleptics in fact have more daytime sleep than controls. This may either be due to a persisting effect of the earlier daytime sleep deprivatic,n or to a peculiar feature of the narcoleptic daytime ad libitum sleep which is much greater
in the BR condition than in ambulatory recording (Hishikawa et al., 1976). According to the latter interpreta- tion a different response to the prior daytime ad libitum sleep could be hypothesized to explain differences in N2.
Substantial qualitative differences between the 2 groups are, in our opinion, the clustering of wakefulness (that occurs only in control subjects) in the hours preceding the second nocturnal sleep episode, and the evident ultradian oscillatory pattern of SWA distribution in narcoleptics.
The analysis focused on the occurrence of slow oscilla- tions showed a first pulse and a first trough corresponding, respectively, to the first hours of N1 and to the occurrence of early morning REM sleep or awakenings. They are common to the 2 groups. In mid-afternoon a clear diurnal delta pulse occurs in control subjects. This corresponds to the well-known circasemidian period of delta recurrence which takes place 16 h after sleep onset (Broughton, 1975). A minor and not statistically significant peak can be observed about 11 h after sleep onset and can be related to the morning rebound peak of SWS reported in the litera- ture (Broughton, 1975; Gagnon and De Koninck, 1984; Campbell and Zulley, 1989).
The second trough, positioned between 19.00 and 23.00 h in normals, can be considered as the equivalent of the so-called forbidden zone (Lavie, 1985, 1986).
A third delta peak reflects the second night sleep episode in controls.
These data confirm the importance of circadian and circasemidian rhythms in normal subjects during BR con- ditions. Narcoleptic patients show only a weak evidence of these regulations.
The results seem to contradict data reported in ambula- tory recording by Broughton et al. (1988), in which the influence of the circasemidian rhythm was more important for narcoleptic subjects than for controls.
We think that this discrepancy may be explained by the different experimental sets: Broughton's patients were free to act in their real-life environment, while our patients were studied under BR conditions, and after partial sleep deprivation.
In such experimental conditions subjects are more likely to be affected by ultradian than circadian influences. This opinion is enforced by the results of the spectral analysis performed on the SWA time series. In control subjects the main part of the signal variance is expressed by the spectral components corresponding to circadian and cir- casemidian rhythms. A minor gathering of variance is expressed by the components corresponding to a period of about 90 min which can be explained by the NREM-REM ultradian cyclicity. The narcoleptic spectral pattern is quite different: the variance explained by the slow components, reflecting circadian and circasemidian rhythms, is smaller with respect to controls. Instead, in narcoleptics the major part of the variance is expressed by a peak centered on a 4 h period, consistent with an ultradian cyclicity that is scarcely represented in controls. Moreover, an NREM-
424 L. Nobili et al. / Electroencephalography and clinical Neurophysiology 95 (1995) 414-425
REM cyclicity is still present in narcoleptics, but with a longer period of about 120 min.
A 4 h rhythm in the sleep-wake cycle has been ob- served in subjects in a constant BR routine (Zulley, 1988). A similar result has been reported by Nakagawa (1980). Fluctuations in "sleepability" (Lavie, 1991), with a period of about 3.5 h, have been observed in subjects undergoing an ultra-short sleep schedule.
Our results appear to be in accordance with these observations and confirm the discovery by Billiard et al. (1990) of a 4 h rhythm of SWS in narcoleptic subjects. The periodograms relative to the 3 sessions show that during the first night, in both groups, the SWA cyclicity reflects the NREM-REM alternation, with a significantly longer period in narcoleptics. Narcoleptics show a well- structured ultradian 4 h rhythm of SWA that occurs during the day and carries on into the following night. Homeo- static processes are present and active but show great importance on SWA only if stimulated by sleep depriva- tion. The main characteristic of SWA distribution in nar- coleptics is thus the ultradian rhythm with cycles occurring about every 4 h.
To conclude, we can interpret the pattern of SWA distribution in narcoleptic patients as the result of a differ- ent balance between homeostatic processes and ultradian drives to sleep. The effects of the ultradian drives to sleep may be intensified by an active mechanism (stronger sleep drives) or by a passive one determined by a weaker waking state maintenance mechanism. From this point of view the sleep pattern of narcoleptics can be seen as a more efficient adaptation to a condition of difficulty in maintaining a prolonged state of wakefulness.
According to this interpretation the sleep propensity driven by an ultradian mechanism and the accumulation of sleep pressure of homeostatic origin appear to be coupled, thus avoiding stressful attempts to counteract sleep propen- sity. Such a pattern is already observed in other life situations, both physiologically and socially determined, and in experimental conditions where the sleep pattern is not necessarily entrained to circadian and circasemidian oscillatory rhythms.
For this purpose it is worth mentioning the polyphasic sleep pattern of newborns (Meier-Koll et al., 1978), and the extremely reduced sleep schedule (every 4 h) adopted during 1-man transatlantic races (Stampi, 1985) and by military navy personnel in many countries.
Acknowledgements
We thank Monick Vergb, Bernard Sales and Chantal Lelarge for their excellent technical assistance, Dr. Alberto Galli and Michele Gabarra for their mathematical support and Dr. Bettina M. Stubinski for reviewing the manuscript.
References
Achermann, P., Dijk, D.J., Brunner, D.P. and Borb~ly, A.A. (1993) A model of human sleep homeostasis based on EEG slow-wave-activity: quantitative comparison of data and simulations. Brain Res. Bull., 31: 97-113.
Agnew, H.W., Webb, W.B. and Williams, R. (1967) Comparison of stage four and 1-REM sleep deprivation. Percept. Motor Skills, 24:851-858.
Baldy-Moulinier, M., Arguner, A. and Besset, A. (1976) Ultradian and circadian rhythms in sleep and wakefulness in narcoleptics. In: C. Guilleminault, W.C. Dement and P. Passouant (Eds.), Narcolepsy. Spectrum Press, New York, pp. 485-497.
Besset, A., Tafti, M., Nobili, L. and Billiard, M. (1994) Homeostasis and narcolepsy. Sleep, 17: $29-$34.
Billiard, M., Quera-Salva, M.A., De Koninck, J., Besset, A., Touchon, J. and Cadilhac, J. (1986) Daytime sleep characteristics and their rela- tionships with night sleep in the narcoleptic patient. Sleep, 9: 167-174.
Billiard, M., De Koninck, J., Tafti, M., Touzery, A. and Coulombe, D. (1990) Sleep stage distribution and rhythms in narcolepsy. In: J. Home (Ed.), Sleep 90. Pontenagel Press, Bochum, pp. 161-163.
Billiard, M., De Koninck, J., Coulombe, D. and Touzery, A. (1992) Napping behavior in narcoleptic patients: a four hour cycle in slow wave sleep. In: C. Stampi (Ed.), Why We Nap: Evolution, Chronobi- ology and Functions of Polyphasic and Ultrashort Sleep. Birkhauser, Boston, MA, pp. 245-257.
Borb~ly, A.A. (1982) A two-process model of sleep regulation. Hum. Neurobiol., 1: 195-204.
Borb61y, A.A., Achermann, P., Trachsel, L. and Tobler, I. (1989) Sleep initiation and initial sleep intensity: interactions of homeostatic and circadian mechanism. J. Biol. Rhythms, 4: 149-160.
Broughton, R.J. (1975) Biorhythmic variations in consciousness and psychological functions. Can. Psychol. Rev., 16: 217-230.
Broughton, R. and Mullington, J. (1992) Circasemidian sleep propensity and the phase-amplitude maintenance model of human steep/wake regulation. J. Sleep Res., 1: 93-98.
Broughton, R., Dunham, W., Newmann, J., Lutley, K., Duchesne, P. and Rivers, M. (1988) Ambulatory 24-hour sleep-wake monitoring in narcolepsy-cataplexy compared to matched controls. Electroenceph. clin. Neurophysiol., 70: 473-481.
Campbell, S. and Zulley, J. (1989) Evidence for circadian influence on human slow wave sleep during daytime sleep episodes. Psychophysi- ology, 26: 580-585.
Daan, S., Beersma, D.G.M. and Borb61y, A.A. (1984) Timing of human sleep: recovery process gated by a circadian pacemaker. Am. J. Physiol., 246: R161-R178.
Dantz, B., Edgar, D.M. and Dement, W.C. (1994) Circadian rhythms in narcolepsy: studies on a 90 min day. Electroenceph. clin. Neurophys- iol., 90: 24-35.
De Koninck, J., Quera Salva, M., Besset, A. and Billiard, M. (1986) Are REM cycles in narcoleptic patients governed by an ultradian rhythm? Sleep, 9: 162-166.
Dijk, D.J., Brunner, D.P. and Borb~ly, A.A. (1991) EEG power density during recovery sleep in the morning. Electroenceph. clin. Neurophys- iol., 78: 203-214.
Feinberg, I. and Floyd, T.C. (1979) Systematic trends across the night in human sleep cycles. Psychophysiology, 16: 282-291.
Gagnon, P. and De Koninck, J. (1984) Reappearance of EEG slow waves in extended sleep. Electroenceph. clin. Neurophysiol., 58: 155-157.
Hishikawa, Y., Wakamatsu, H., Furuya, E., Sugita, Y., Masaoka, S., Kaneda, H., Sato, M., Nan'no, H. and Kaneko, Z. (1976) Sleep satiation in narcoleptic patients. Electroenceph. clin. Neurophysiol., 41: 1-18.
Kales, A., Tan, T.L., Kollar, E.J., Naitoh, P., Preston, T.A. and Malm- strom, E.J. (1970) Sleep patterns following 205 hours of sleep depri- vation. Psychosom. Med., 32: 189-200.
L. Nobili et al. / Electroencephalography and clinical Neurophysiology 95 (1995) 414-425 425
Kripke, D. (1976) Biological rhythm disturbances can cause narcolepsy. In: C. Guilleminault, W.C. Dement and P. Passouant (Eds.), Nar- colepsy. Spectrum, New Yolk, pp. 475-483.
Lavie, P. (1985) Ultradian rhythms: gates of sleep and wakefulness. In: H. Schulz and P. Lavie (Eds.), Ultradian Rhythms in Physiology and Behavior. Springer, Heidelberg, pp. 110-124.
Lavie, P. (1986) Ultrashort sleep-waking schedule. III. Gates and "forbidden zones" for sleep. Electroenceph. clin. Neurophysiol., 63: 414-425.
Lavie, P. (1991) REM periodicity under ultradian sleep/wake cycle in narcoleptic patients. Can. J. Psychol., 45: 185-193.
Lavie, P. and Zomer, J. (1984) Ultrashort sleep-waking schedule. II. Relationship between ultradian rhythms in sleepability and the REM- NREM cycles and effects of the circadian phase. Electroenceph. clin. Neurophysiol., 57: 35-42.
Meier-Koll, A., Hall, U., Hellwig, U., Kott, G. and Meier-Koll, U. (1978) A biological oscillator system and the development of sleep-wake behavior during early infancy. Chronobiologia, 6: 301-308.
Montplaisir, J. (1976) Disturbed noctumal sleep. In: C. Guilleminault, W.C. Dement and P. Passouant (Eds.), Narcolepsy. Specu'um, New York, pp. 43-56.
Montplaisir, J., Billiard, M., Takahashi, S., Bell, I., Guilleminault, C. and Dement, W.C. (1978) Twenty-four-hour polygraphic recording in narcoleptics with special reference to nocturnal sleep disturbance. Biol. Psychiat., 13: 73-89.
Mosko, S.S., Holowach, J.B. and Sassin, J.F. (1983) The 24-hour rhythm of core temperature in narcolepsy. Sleep, 6: 137-143.
Nakagawa, Y. (1980) Continuous observations of EEG patterns at night and in daytime of normal subjects under restrained conditions. I. Quiescent state when lying down. Electroenceph. clin. Neurophysiol., 49: 524-537.
Passouant, P., Halberg, F., Genicot, R., Popoviciu, L. and Baldy- Moulinier, M. (1969) La pgriodicitg des acc~s narcoleptiques et le rhytme ultradien du sommeil rapide. Rev. Neurol., 121: 155-164.
Pavel, S., Goldstein, R. and Petrescu, M. (1980) Vasotocin, melatonin and narcolepsy: possible involvement of the pineal gland and its pathophysiological mechanism. Peptides, l: 281-284.
Pollak, C.P. and Green, J. (1990) Eating and its relationship with subjective alermess and sleep in narcoleptic subjects living without temporal cues. Sleep, 13: 467-478.
Rechtschaffen, A. and Kales, A. (1968) A Manual of Standardised Terminology, Techniques and Scoring System for Sleep Stages of Human Subjects. BIS/BRI UCLA, Los Angeles, CA.
Rechtschaffen, A., Wolpert, E.A., Dement, W.C., Mitchel, S.A. and Fisher, C. (1963) Nocturnal sleep of narcoleptics. Electroenceph. clin. Neurophysiol., 15: 599-609.
Schulz, H. (1985) Ultradian rhythms in the nycthemeron of narcoleptic patients and normal subjects. In: H. Schulz and P. Lavie (Eds.), Ultradian Rhythms in Physiology and Behavior. Springer, Berlin, pp. 165-185.
Stampi, C. (1985) Ultrashort sleep-wake cycles improve performance during one-man transatlantic races. In: W. Koella, E. Ruther and M. Schulz (Eds.), Sleep '84. Gustav Fischer Verlag, Stuttgart, pp. 271- 272.
Tafti, M., Rondouin, G., Besset, A. and Billiard, M. (1992) Sleep deprivation in narcoleptic subjects: effect on sleep stages and EEG power density. Electroenceph. clin. Neurophysiol., 83: 339-349.
Volk, S., Schultz, H., Yassouridis, A., Wilde-Frenz, J. and Simon, O. (1990) The influence of two behavioral regimens on the distribution of sleep and wakefulness in narcoleptic patients. Sleep, 13: 136-142.
Williams, H.L., Hammack, J.T., Daly, R.L., Dement, W.C. and Lubin, A. (1964) Responses to auditory stimulation, sleep loss and the EEG stages of sleep. Electroenceph. clin. Neurophysiol., 16: 269-279.
Zulley, J. (1988) The four-hour sleep wake cycle. Sleep Res., 17: 403. Zulley, J. and Campbell, S. (1985) Napping behavior during "sponta-
neous internal desynchronization." Hum. Neurobiol., 4: 123-126.