Dynamics of community structure and phosphate status of picocyanobacterial populations in the Gulf...
13
363 Limnol. Oceanogr., 50(1), 2005, 363–375 q 2005, by the American Society of Limnology and Oceanography, Inc. Dynamics of community structure and phosphate status of picocyanobacterial populations in the Gulf of Aqaba, Red Sea Nicholas J. Fuller and Nyree J. West 1 Department of Biological Sciences, University of Warwick, Coventry CV4 7AL, Great Britain Dominique Marie Station Biologique de Roscoff, UMR 7127 CNRS et Universite ´ Pierre et Marie Curie, BP74, 29682 Roscoff, Cedex, France Marian Yallop School of Biological Sciences, University of Bristol, Bristol BS8 1UG, Great Britain Tanya Rivlin and Anton F. Post The InterUniversity Institute for Marine Sciences, Coral Beach, POB 469, 88103, Eilat, Israel David J. Scanlan 2 Department of Biological Sciences, University of Warwick, Coventry CV4 7AL, Great Britain Abstract We monitored the genetic diversity and phosphate (P) status of Prochlorococcus and Synechococcus populations during an annual cycle (1999–2000) in the Gulf of Aqaba, Red Sea, using DNA probes and antibodies against the protein PstS, a molecular marker of P stress. The usual spring Synechococcus bloom was not observed in this year, and the picophytoplankton was dominated by Prochlorococcus from April to December. A single high light (HL)– adapted ecotype of Prochlorococcus, HLII, dominated, and this dominance extended even to the base of the euphotic zone for much of the year. Low light (LL)–adapted ecotypes only appeared between July and October and were confined to waters deeper than 50 m. The Synechococcus population was also dominated by a single clade (clade II), with the exception of a peak of clade III genotypes in June. Highest PstS expression from the collective Synechococcus and Prochlorococcus populations, indicative of P stress, was observed during the acutely oligotro- phic summer, whereas low expression occurred during the winter and spring. Prochlorococcus abundance appeared unaffected by P stress and only decreased with the beginning of winter mixing, whereas P stress might have caused the decline of the Synechococcus population in May 1999. Unicellular cyanobacteria of the genera Synechococcus and Prochlorococcus are known to be widespread and abun- dant throughout the world’s oceans (see Partensky et al. 1999a,b; Scanlan 2003 for reviews), contributing signifi- cantly to marine and global primary production. The wide oceanic distribution of these organisms is mirrored by high physiological and genetic diversity of cultured isolates and natural populations (Moore et al. 1995; Scanlan and West 1 Present address: Laboratoire Arago, UMR 7628 et Universite ´ Pierre et Marie Curie, 66651 Banyuls sur mer, France. 2 Corresponding author ([email protected]). Acknowledgments We thank Asaph Rivlin for supplying CTD data from the Red Sea depth profiles, Willie Wilson for generating contour plots of nutrients and chlorophyll, Efrat David for ammonium and chloro- phyll measurements from September 2000, and Captain David Hil- lel and the crew of the RV Sea Surveyor. This work was supported by NERC grant GR3/11606 and by the European Union program PICODIV (EVK3-CT-1999-00021). Field work was also partly sponsored by the EU program PROMOLEC (MAS3-CT97-0128) and by US-ISRAEL Bi-national Science Foun- dation grant 1999-194 to A.F.P. 2002; Scanlan 2003). Marine Synechococcus comprises at least 10 lineages within marine cluster A (MC-A; Fuller et al. 2003), and although these might correspond to different ecotypes, the relationship between diversity and physiology is not yet well defined. However for Prochlorococcus, spe- cific high light (HL)– and low light (LL)–adapted ecotypes defined by photosynthetic pigment characteristics and pho- tophysiology (Moore et al. 1998; Moore and Chisholm 1999; Garcarek et al. 2000) are indeed phylogenetically distinct (Moore et al. 1998; Urbach et al. 1998). Furthermore, this phylogenetic separation is of ecological relevance because in situ studies that used the gene markers 16S rRNA (West and Scanlan 1999; West et al. 2001), rpoC1 (Ferris and Pal- enik 1998), cpeB (Steglich et al. 2003), and rbcL (Wawrik et al. 2003) showed that the HL and LL ecotypes exhibited depth-dependent distributions. In addition, HL-adapted Prochlorococcus can be subdivided into two further clades, HLI and HLII (Moore et al. 1998; Urbach et al. 1998; West and Scanlan 1999), that show different oceanic distributions (West et al. 2001). Although the light gradient is clearly a major factor dic- tating the vertical distribution of Synechococcus and Pro-
-
Upload
independent -
Category
Documents
-
view
0 -
download
0
Transcript of Dynamics of community structure and phosphate status of picocyanobacterial populations in the Gulf...

363
Limnol. Oceanogr., 50(1), 2005, 363–375q 2005, by the American Society of Limnology and Oceanography, Inc.
Dynamics of community structure and phosphate status of picocyanobacterialpopulations in the Gulf of Aqaba, Red Sea
Nicholas J. Fuller and Nyree J. West1
Department of Biological Sciences, University of Warwick, Coventry CV4 7AL, Great Britain
Dominique MarieStation Biologique de Roscoff, UMR 7127 CNRS et Universite Pierre et Marie Curie, BP74, 29682 Roscoff,Cedex, France
Marian YallopSchool of Biological Sciences, University of Bristol, Bristol BS8 1UG, Great Britain
Tanya Rivlin and Anton F. PostThe InterUniversity Institute for Marine Sciences, Coral Beach, POB 469, 88103, Eilat, Israel
David J. Scanlan2
Department of Biological Sciences, University of Warwick, Coventry CV4 7AL, Great Britain
Abstract
We monitored the genetic diversity and phosphate (P) status of Prochlorococcus and Synechococcus populationsduring an annual cycle (1999–2000) in the Gulf of Aqaba, Red Sea, using DNA probes and antibodies against theprotein PstS, a molecular marker of P stress. The usual spring Synechococcus bloom was not observed in this year,and the picophytoplankton was dominated by Prochlorococcus from April to December. A single high light (HL)–adapted ecotype of Prochlorococcus, HLII, dominated, and this dominance extended even to the base of the euphoticzone for much of the year. Low light (LL)–adapted ecotypes only appeared between July and October and wereconfined to waters deeper than 50 m. The Synechococcus population was also dominated by a single clade (cladeII), with the exception of a peak of clade III genotypes in June. Highest PstS expression from the collectiveSynechococcus and Prochlorococcus populations, indicative of P stress, was observed during the acutely oligotro-phic summer, whereas low expression occurred during the winter and spring. Prochlorococcus abundance appearedunaffected by P stress and only decreased with the beginning of winter mixing, whereas P stress might have causedthe decline of the Synechococcus population in May 1999.
Unicellular cyanobacteria of the genera Synechococcusand Prochlorococcus are known to be widespread and abun-dant throughout the world’s oceans (see Partensky et al.1999a,b; Scanlan 2003 for reviews), contributing signifi-cantly to marine and global primary production. The wideoceanic distribution of these organisms is mirrored by highphysiological and genetic diversity of cultured isolates andnatural populations (Moore et al. 1995; Scanlan and West
1 Present address: Laboratoire Arago, UMR 7628 et UniversitePierre et Marie Curie, 66651 Banyuls sur mer, France.
2 Corresponding author ([email protected]).
AcknowledgmentsWe thank Asaph Rivlin for supplying CTD data from the Red
Sea depth profiles, Willie Wilson for generating contour plots ofnutrients and chlorophyll, Efrat David for ammonium and chloro-phyll measurements from September 2000, and Captain David Hil-lel and the crew of the RV Sea Surveyor.
This work was supported by NERC grant GR3/11606 and by theEuropean Union program PICODIV (EVK3-CT-1999-00021). Fieldwork was also partly sponsored by the EU program PROMOLEC(MAS3-CT97-0128) and by US-ISRAEL Bi-national Science Foun-dation grant 1999-194 to A.F.P.
2002; Scanlan 2003). Marine Synechococcus comprises atleast 10 lineages within marine cluster A (MC-A; Fuller etal. 2003), and although these might correspond to differentecotypes, the relationship between diversity and physiologyis not yet well defined. However for Prochlorococcus, spe-cific high light (HL)– and low light (LL)–adapted ecotypesdefined by photosynthetic pigment characteristics and pho-tophysiology (Moore et al. 1998; Moore and Chisholm 1999;Garcarek et al. 2000) are indeed phylogenetically distinct(Moore et al. 1998; Urbach et al. 1998). Furthermore, thisphylogenetic separation is of ecological relevance becausein situ studies that used the gene markers 16S rRNA (Westand Scanlan 1999; West et al. 2001), rpoC1 (Ferris and Pal-enik 1998), cpeB (Steglich et al. 2003), and rbcL (Wawriket al. 2003) showed that the HL and LL ecotypes exhibiteddepth-dependent distributions. In addition, HL-adaptedProchlorococcus can be subdivided into two further clades,HLI and HLII (Moore et al. 1998; Urbach et al. 1998; Westand Scanlan 1999), that show different oceanic distributions(West et al. 2001).
Although the light gradient is clearly a major factor dic-tating the vertical distribution of Synechococcus and Pro-

364 Fuller et al.
chlorococcus, little is known of how nutrient and tempera-ture gradients, or water column stability, influencecommunity dynamics. The few in situ studies that have beenperformed indicate that warmer temperatures and water col-umn stability are associated with higher Prochlorococcusabundance (Lindell and Post 1995; Cavender-Bares et al.2001), whereas Synechococcus are more tolerant of mixedwater conditions (Lindell and Post 1995) and lower temper-atures, and their concentration has been linked with highernitrate concentrations (Blanchot et al. 1992).
In terms of nutrient acquisition, Synechococcus are ver-satile, being able to use nitrate, nitrite, ammonium, urea, andsome amino acids (Moore et al. 2002). In contrast, Prochlo-rococcus cannot use nitrate but can grow on ammonium andurea, and some LL-adapted strains can metabolize nitrite(Moore et al. 2002). In addition, Prochlorococcus can sup-plement their nitrogen (N) requirement by the uptake of ami-no acids (Zubkov et al. 2003). Synechococcus and Prochlo-rococcus show similar phosphorus (P) acquisition capacitythough, utilizing phosphate and numerous organic P sources(Scanlan et al. 1997; Rippka et al. 2000). The complete ge-nome sequences for three Prochlorococcus strains (one HL-adapted and two LL-adapted) and one Synechococcus strainfully support these observations but also indicate that thesuccess of these marine cyanobacteria in nutrient-depletewaters might be partly a result of their utilization of novelorganic sources of N and P, such as cyanates and phospho-nates (Dufresne et al. 2003; Palenik et al. 2003; Rocap et al.2003).
The relationship between Prochlorococcus and Synecho-coccus community dynamics and nutrients is clearly com-plex and will necessitate further in situ studies that take intoaccount the multiple sources of N and P available to them.However, a more direct approach to studying the responseof organisms to their environment, or their activity, isthrough the use of molecular markers in which the expres-sion of a gene or protein is used to indicate a given stressor a metabolic activity. In Prochlorococcus and Synecho-coccus, a high-affinity P uptake protein, PstS, is expressedin response to P starvation (Scanlan et al. 1993). An anti-body raised against PstS allowed the detection of P stress innatural Synechococcus populations with the use of single-cell immunofluorescence (Scanlan et al. 1997). These au-thors also found that this antibody recognizes PstS in Pro-chlorococcus cells but not marine heterotrophic bacteria.Similarly, assays for alkaline phosphatase activity can beused to indicate P stress in the bulk planktonic community(Li et al. 1998) or in a given species with the use of a spe-cific antibody (Dyhrman and Palenik 2001). Nitrogen stresshas also been followed in natural Synechococcus populationsby quantifying expression of the ntcA gene, the global nitro-gen regulator (Lindell and Post 2001).
To understand marine cyanobacterial community dynam-ics better, there is a need for more studies combining geneticand physiological data with environmental parameters. Toaddress this, we have carried out a detailed genetic analysisof picocyanobacterial community structure in relation toflow cytometry and physical and chemical properties of thewater column, at Sta. A in the Gulf of Aqaba, at the northernend of the Red Sea, over an annual cycle during February
1999–January 2000. This site was chosen because, despiteits proximity to land, it is typical of an open ocean gyre inits biogeochemistry; in addition, it is subject to strong sea-sonal variation in water column structure (see Wolf-Vecht etal. 1992; Lindell and Post 1995). The oligotrophic nature ofthese Gulf waters results from the influx of relatively nutri-ent-deplete surface waters from the northern Red Sea, fromwhich it is separated by a shallow sill (240 m) at the Straitsof Tiran. Furthermore, because the Gulf is bounded by de-serts, fluvial nutrient input is negligible. To analyze pico-cyanobacterial community structure both spatially and tem-porally at this site, we used 16S rDNA oligonucleotidesspecific for individual Synechococcus clades and Prochlo-rococcus ecotypes, which we had developed in previousstudies (West and Scanlan 1999; Fuller et al. 2003). We alsoused antibodies raised against a component, PstS, of thehigh-affinity P uptake system of these organisms (Scanlanet al. 1997) to evaluate whether changes in nutrient statuswere coupled with any obvious changes in subsequent pop-ulation structure. We used PstS expression here, rather thanthe more widely used alkaline phosphatase activity mea-surements, because PstS antibodies specifically target thecollective Synechococcus and Prochlorococcus populationsfor P stress, separate from the rest of the picoplanktoniccommunity. Furthermore PstS probing and alkaline phos-phatase activities report on different aspects of the P stressresponse, PstS responding to ambient P levels (i.e., both or-ganic and inorganic phosphate) and alkaline phosphatase ac-tivities reporting on ambient inorganic phosphate levels (theenzyme being switched on when inorganic phosphate supplyis low).
Materials and methods
Sampling—Monthly water samples were collected fromthe northern tip of the Gulf of Aqaba at Sta. A (298289N,348559E) in the surface 200 m between February 1999 andJanuary 2000, and then again in September 2000, aboard theResearch Vessel (RV) Suellyn (Feb 99) and the RV Sea Sur-veyor (Mar 99–Jan 00, Sep 00). Samples were obtained fromdiscrete depths with 30-liter Niskin bottles on a hydrograph-ic cable (Feb 99–Sep 99) or with a Rosette sampler of 12-liter Go-Flo bottles (Oct 99–Jan 00, Sep 00). Conductivity,temperature, and barometric pressure were measured simul-taneously with a CTD (model STD-plus, Applied Microsys-tems). For ammonium measurements, 20 ml of water wastaken by syringe directly from the collection bottle beforeany water had been removed. This was then filtered throughtwo 25-mm-diameter GF/F filters, which had been combust-ed at 4508C, with the use of an in-line filtration system andstored in an air-tight polycarbonate Nalgene bottle at 68Cuntil analysis. For DNA extraction, seawater (5 or 10 liters)was filtered and stored, and the DNA was extracted as pre-viously described (Fuller et al. 2003). The 1% isolume (thedepth to which 1% of incident surface light penetrates andthus the base of the euphotic zone) was calculated as threetimes the Secchi depth (Brown et al. 1992).
Oxidized nitrogen measurement—Duplicate 10-ml sam-ples of seawater were filtered through acid-washed 25-mm-

365Picocyanobacterial population dynamics
diameter 0.2-mm-pore-size cellulose acetate filters into acid-washed 10-ml screw-capped tubes and stored at 2208C untilanalysis. Total oxidized nitrogen (TON) and nitrite weremeasured with a Quick Chem 8000 flow injection nutrientanalyzer (Lachat Instruments) with a detection limit of 20nmol L21 as described previously (Lindell and Post 2001).Nitrate measurements were calculated by the subtraction ofnitrite from TON.
Phosphate measurement—Soluble reactive phosphate(SRP) was concentrated from duplicate samples by theMAGIC method, described previously (Karl and Tien 1992),from 500 ml of seawater, with 250-ml polycarbonate centri-fuge pots, collecting the precipitate by centrifugation with aGS 3 rotor with a Sorvall RC-5B centrifuge. The two pelletswere resuspended in a total of ;10 ml of 1 mol L21 HCl inacid-washed 10-ml screw-capped tubes and stored at 2208Cuntil analysis. SRP was measured by the molybdenum bluemethod (Murphy and Riley 1962) modified for analysis witha Quick Chem 8000 flow injection nutrient analyzer (LachatInstruments) and with a detection limit of 10 nmol L21.
Ammonium measurement—The method is based largelyon protocol A described by Holmes et al. (1999), with adetection limit of 20 nmol L21, except that smaller volumeswere used. Triplicate 4-ml samples were placed in screw-cap tubes, and 1 ml of the working reagent (WR) was addedto two of them. Samples with WR were mixed and incubatedfor 3–8 h in the dark. Fluorescence readings were taken witha Hoefer DyNA Quant 200 fluorometer, with a 365 6 7 nmexcitation lamp and a 460 6 15 nm emission filter. Thesample’s fluorescence reading with no WR was subtractedfrom those with WR, with water as a blank. To avoid matrixeffects, a standard curve was made by adding NH4Cl to sea-water that had been collected from surface waters of Sta. Aduring the nutrient-deplete summer, filtered through two GF/F filters, and stored at 68C.
Flow cytometric analysis—Between February 1999 andJanuary 2000, duplicate 1-ml samples were preserved with1% (w/v) paraformaldehyde and 0.05% (v/v) glutaraldehydeand picophytoplankton enumerated as described previously(Marie et al. 1999; Fuller et al. 2003). During September2000, duplicate 2-ml subsamples from each depth were pre-served with 0.2% (w/v) paraformaldehyde, after which theywere quickly frozen and stored in liquid nitrogen. Picophy-toplankton abundance in these samples was determined ona modified FacScan flow cytometer (Becton Dickinson) suit-ed for analysis of the dimly fluorescent surface populationsof Prochlorococcus (Dusenberry and Frankel 1994). A 10-ml suspension of 0.474-mm fluoresbrite microspheres (Po-lysciences) was used as an internal standard for both cell-specific scatter and fluorescence.
Chlorophyll a measurement—Chlorophyll a (Chl a) wasextracted and measured as previously described (Fuller et al.2003).
PCR amplification—Initially 16S rDNA sequences bothfrom environmental DNA and from laboratory strains were
amplified with primers OXY107F and OXY1313R (West etal. 2001), which specifically amplify oxygenic phototrophsand are based on primers described previously (Urbach etal. 1992). Amplification conditions were the same as re-ported previously (Fuller et al. 2003). Later amplification ofSynechococcus 16S rDNA from environmental DNA wasperformed with the new primer SYN172F (59-AATA-CCCCATATGCCGMGAG-39) in conjunction withOXY1313R. This primer pair amplifies all known sequencesfrom Synechococcus MC-A (clades I–X; Fuller et al. 2003),some MC-B strains, no freshwater Synechococcus strains, allLL Prochlorococcus strains, some HLI Prochlorococcusstrains, but no HLII Prochlorococcus strains. SYN172F wasdesigned by the probe design function in the ARB program(Ludwig et al. 2004). Amplification conditions were thesame as for OXY107F and OXY1313R, except that the con-centration of SYN172F was 50 nmol L21. EnvironmentalDNA was amplified in duplicate, and the products werepooled for further use.
PstS measurement—Phytoplankton were concentratedfrom 100-liter seawater volumes, prefiltered through 20-mmmesh by tangential flow filtration, and centrifuged as pre-viously described (Scanlan et al. 1997). A subsample of theconcentrate was fixed and analyzed by flow cytometry asdescribed above to enumerate Prochlorococcus and Syne-chococcus. Relative expression of PstS in the picocyanobac-teria was assessed by western blot analysis as described pre-viously (Scanlan et al. 1993, 1997) with the use of apolyclonal PstS antiserum that cross-reacts with PstS fromboth Synechococcus and Prochlorococcus. Protein gels forthe annual cycle were loaded on an equal cell number basis(total 1.5 3 107 cells 5 [Synechococcus 1 Prochlorococ-cus]) with the use of flow cytometry data from the concen-trates. The protein gels for samples taken in September 2000were loaded on an equal protein concentration basis becausecell numbers were not available for these samples. All west-ern blots were repeated at least once. To allow semiquanti-fication of the PstS expression level and interblot compari-sons, a standard curve was prepared with a SynechococcusWH 7803 purified cell wall extract that was enriched in PstS(see fig. 2B in Scanlan et al. 1993). Cross-reacting bandswere revealed by the ECL Plus western blotting detectionsystem (Amersham Pharmacia Biotech UK) according to themanufacturer’s instructions and quantified against a standardcurve of PstS by densitometric analysis with Total Lab soft-ware (Phoretix).
Dot blot hybridization—Blots of 16S rDNA PCR productswere constructed, prehybridized, and hybridized as previ-ously reported (West and Scanlan 1999). Briefly, environ-mental products (30 ng) pooled from duplicate reactionswere blotted in triplicate, as were membrane blanks for sub-traction from final readings. Blots were also constructed forcalibration curves with control DNAs. 32P-labeled oligonu-cleotides were hybridized simultaneously to environmentaland control blots in the same hybridization vessel, and allblots from the same probe were subsequently exposed in thesame phosphorimager cassette. Oligonucleotide probes andtheir stringency wash temperatures were used as previously

366 Fuller et al.
Table 1. 16S rDNA oligonucleotide probes used in this study.
Probe Sequence (59–39) Target organism(s) Reference
SYN1006SYN1006RSSYN262SYN635SYN1280
CTC TCA AGT TTC CAA GAGCTC TCC TGT TTC CAA GAGGAT GCC TTG GTA GGC CTTAAG CCC CTC AGT TTC CACGAG CCA CGG TTT ATG AGA
Synechococcus clade ISynechococcus clade IISynechococcus clade IIISynechococcus clade IVSynechococcus clades V, VI and VII
Fuller et al. 2003Fuller et al. 2003Fuller et al. 2003Fuller et al. 2003Fuller et al. 2003
SYN620SYN1000SYN1007SYN1258
CAC TGC CAC GAT GGA GTTGGT TTC CCA GAA ATT CGCACC CTC CGG TTT CCC AGATTG TCC TCG CGA ACT TGC
Synechococcus clade VIIISynechococcus clade IXSynechococcus clade XSynechococcus clades I–VII and X, Prochlo-
rococcus sp. MIT9303
Fuller et al. 2003Fuller et al. 2003Fuller et al. 2003Fuller et al. 2003
S1PRO634RS2PRO640RDPRO634R
GCC GAT CAG TTT CCA CTGATA CTC AAG CCT TTC AGT TTGCC AAT CAG TTT CCA CTG
HLI ProchlorococcusHLII ProchlorococcusLL Prochlorococcus (except SS120)
West and Scanlan 1999This studyWest and Scanlan 1999
SARG634RMIT1023REUB338
GCC CTT CAG TTT CCA CTGTGC GTT CCC AAA GGC ACTGCT GCC TCC CGT AGG AGT
Prochlorococcus sp. SS120Prochlorococcus sp. MIT9303Eubacteria
West and Scanlan 1999West and Scanlan 1999Amann et al. 1995
reported, having been optimized against control DNAs froma range of cyanobacterial strains for Synechococcus probes(Fuller et al. 2003) and for Prochlorococcus and eubacterialprobes (West and Scanlan 1999; see Table 1). However, theProchlorococcus HLII-specific probe S2PRO640R is a mod-ification of the published probe S2PRO634R to improvespecificity (data not shown), for which the stringency washtemperature was determined as 418C. Hybridization of Sy-nechococcus probes to SYN172F-OXY1313R products wasquantified with a Fujifilm FLA-5000 phosphorimager andTotal Lab software (Phoretix). Hybridization of Synechococ-cus and Prochlorococcus probes to OXY107F-OXY1313Rproducts was quantified with a Molecular Dynamics phos-phorimager and Image Quant software (Molecular Dynam-ics). Minimum detection limits were ;0.1 ng of DNA. Lev-els of relative hybridization of the probes were calculated aspreviously reported, normalizing the individual cyanobacter-ial probe signals against the signal for total amplified DNAwith the EUB338 probe (West and Scanlan 1999). Hence,relative hybridization represents the probe signal as a pro-portion of total DNA amplified with the specific primer setused.
Statistical analyses—Following tests for normality, Pear-son’s correlation coefficients were determined for selectedgenotype and cell abundance data. Multivariate statisticalanalysis of the physical, chemical, and biotic data from theannual cycle was performed with the dot blot hybridizationdata set OXY107F-OXY1313R and the computer programCANOCO 3.1 (Ter Braak 1988, 1990). A preliminary de-trended correspondence analysis (DCA) was run and showedshort gradient lengths (,2.0 SD), which indicated that linearmethods were more appropriate. A partial redundancy anal-ysis (RDA; Ter Braak 1994) ordination was carried out withvariations in species abundance of Synechococcus andProchlorococcus ‘‘partialled out’’ by setting them as cov-ariables, allowing us to relate the residual variation to theimpact variables (John Birks pers. comm.). Nutrient datawere log transformed prior to analysis. Environmental vari-ables were selected by a Forward Selection option with
Monte Carlo restrictions. Only those variables with p , 0.05have been included.
Results
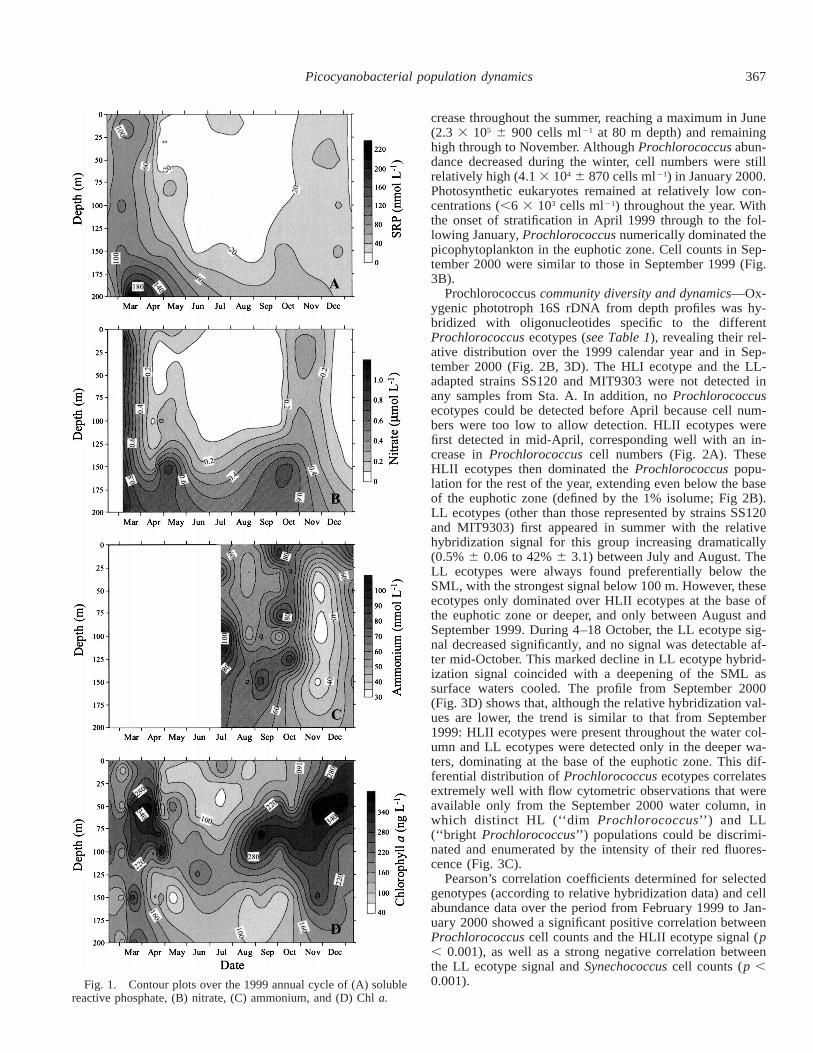
Seasonal cycle: Physical and chemical profiles—Depthprofiles of nutrients and temperature throughout the year inthe north of the Gulf of Aqaba (Figs. 1, 2A) reveal the strongseasonal changes in the water column and its oligotrophicnature throughout most of the year. The upper part of thewater column was nearly homogeneously mixed down todepths of .300 m during the winter months, with very littlevariation in temperature or nutrients. This winter mixing in-creased the concentration of phosphate and nitrate in surfacewaters, although these still barely exceeded 0.1 and 1 mmolL21, respectively (Fig. 1A,B). Winter mixing at the begin-ning of 1999 reached a depth of 500 m by early March (datanot shown). By the end of April, a slight thermocline pro-vided a stable surface mixed layer (SML), which coincidedwith a sharp decline in nitrate and phosphate concentrationsin surface waters. Surface waters remained stratifiedthroughout the summer until November, when the thermo-cline had descended to below the euphotic zone. Despitewinter mixing, nitrate and phosphate concentrations re-mained low through to January 2000. Ammonium concen-trations (Fig. 1C) were consistently low (;70 nmol L21)throughout the period measured (Jul 99–Jan 00). Thermo-cline and nutrient conditions in September 2000 were similarto those in September 1999 (Fig. 3A,B).
Picophytoplankton abundance—Picocyanobacterial num-bers were low during February–March 1999 (Fig. 2A) butincreased greatly with the onset of stratification in mid-April,a feature coinciding with falls in nitrate and phosphate con-centrations (Fig. 1). Maximum Synechococcus abundancewas observed at the end of April (3.9 3 104 6 430 cellsml21 at 60 m depth), followed by a decline through the sum-mer before another increase from November to January, witha maximum of 3.0 3 104 6 530 cells ml21 in January 2000.In contrast, Prochlorococcus abundance continued to in-
367Picocyanobacterial population dynamics
Fig. 1. Contour plots over the 1999 annual cycle of (A) solublereactive phosphate, (B) nitrate, (C) ammonium, and (D) Chl a.
crease throughout the summer, reaching a maximum in June(2.3 3 105 6 900 cells ml21 at 80 m depth) and remaininghigh through to November. Although Prochlorococcus abun-dance decreased during the winter, cell numbers were stillrelatively high (4.1 3 104 6 870 cells ml21) in January 2000.Photosynthetic eukaryotes remained at relatively low con-centrations (,6 3 103 cells ml21) throughout the year. Withthe onset of stratification in April 1999 through to the fol-lowing January, Prochlorococcus numerically dominated thepicophytoplankton in the euphotic zone. Cell counts in Sep-tember 2000 were similar to those in September 1999 (Fig.3B).
Prochlorococcus community diversity and dynamics—Ox-ygenic phototroph 16S rDNA from depth profiles was hy-bridized with oligonucleotides specific to the differentProchlorococcus ecotypes (see Table 1), revealing their rel-ative distribution over the 1999 calendar year and in Sep-tember 2000 (Fig. 2B, 3D). The HLI ecotype and the LL-adapted strains SS120 and MIT9303 were not detected inany samples from Sta. A. In addition, no Prochlorococcusecotypes could be detected before April because cell num-bers were too low to allow detection. HLII ecotypes werefirst detected in mid-April, corresponding well with an in-crease in Prochlorococcus cell numbers (Fig. 2A). TheseHLII ecotypes then dominated the Prochlorococcus popu-lation for the rest of the year, extending even below the baseof the euphotic zone (defined by the 1% isolume; Fig 2B).LL ecotypes (other than those represented by strains SS120and MIT9303) first appeared in summer with the relativehybridization signal for this group increasing dramatically(0.5% 6 0.06 to 42% 6 3.1) between July and August. TheLL ecotypes were always found preferentially below theSML, with the strongest signal below 100 m. However, theseecotypes only dominated over HLII ecotypes at the base ofthe euphotic zone or deeper, and only between August andSeptember 1999. During 4–18 October, the LL ecotype sig-nal decreased significantly, and no signal was detectable af-ter mid-October. This marked decline in LL ecotype hybrid-ization signal coincided with a deepening of the SML assurface waters cooled. The profile from September 2000(Fig. 3D) shows that, although the relative hybridization val-ues are lower, the trend is similar to that from September1999: HLII ecotypes were present throughout the water col-umn and LL ecotypes were detected only in the deeper wa-ters, dominating at the base of the euphotic zone. This dif-ferential distribution of Prochlorococcus ecotypes correlatesextremely well with flow cytometric observations that wereavailable only from the September 2000 water column, inwhich distinct HL (‘‘dim Prochlorococcus’’) and LL(‘‘bright Prochlorococcus’’) populations could be discrimi-nated and enumerated by the intensity of their red fluores-cence (Fig. 3C).
Pearson’s correlation coefficients determined for selectedgenotypes (according to relative hybridization data) and cellabundance data over the period from February 1999 to Jan-uary 2000 showed a significant positive correlation betweenProchlorococcus cell counts and the HLII ecotype signal (p, 0.001), as well as a strong negative correlation betweenthe LL ecotype signal and Synechococcus cell counts (p ,0.001).

368 Fuller et al.
Fig. 2. Vertical profiles over the 1999 annual cycle of (A) temperature and Synechococcus, Prochlorococcus, and picoeukaryote abun-dance (mean 6 SD) as determined by flow cytometry; (B) relative hybridization values (mean 6 SD) of HLII and LL Prochlorococcusecotypes (as a proportion of all amplified by primers OXY107F and OXY1313R); and (C) relative hybridization values (mean 6 SD) ofSynechococcus clade II and III genotypes and ‘‘general MC-A Synechococcus’’ (clades I–VII, X; as a proportion of all amplified by primersSYN172F and OXY1313R) derived from dot blot data. The horizontal dashed line in panel B represents the depth of the 1% isolume.
Synechococcus community diversity and dynamics—Aninitial assessment of Synechococcus community diversity atSta. A was made by hybridizing oxygenic phototroph 16SrDNA with Synechococcus clade–specific oligonucleotideprobes (see Table 1). This assessment (data not shown) re-vealed the predominance of a single Synechococcus clade,clade II, throughout the water column for the entire year.From April onward, however, relative hybridization signalswere low, even for the dominant clade II genotypes, presum-ably as the result of low total Synechococcus compared withProchlorococcus cell numbers in the water column. To im-prove the resolution of Synechococcus clade dynamics, anew forward primer, SYN172F, was designed that amplifiesall known MC-A Synechococcus and LL Prochlorococcusstrains but no HLII Prochlorococcus strains. This primerwas used to amplify environmental DNA in conjunction withOXY1313R prior to hybridization with the Synechococcusclade–specific oligonucleotides. These dot blot data showed
much more clearly the dominance of a single marine Syne-chococcus clade, clade II, throughout the sampling period,often accounting for .50% of the relative hybridization sig-nal (Fig. 2C). For certain samples, some discrepancy be-tween the clade II and ‘‘general Synechococcus’’ (SYN1258)hybridization signal could not be accounted for by the sum-mation of the hybridization values for the remaining clades.Of these minor clades, clade III was the most abundant, yetaccounted for ,10% of the signal for most of the year. Rel-ative hybridization values for clade III were proportionatelyhigher through the summer months, compared with winter,peaking in June when values exceeded clade II at 100 m.Relative hybridization values for each of the minor clades(including clades VIII and IX, which are not detected by thegeneral MC-A Synechococcus, SYN1258, probe) remained,1% throughout the euphotic zone during most of the sam-pling period and never exceeded 2% (data not shown). TheSynechococcus community structure profile from September

369Picocyanobacterial population dynamics
Fig. 2. Continued.
2000 (Fig. 3E) was very similar to that from September1999, but clade II accounted for an even greater proportion(85% 6 3.8) of the total MC-A Synechococcus signal.
Picocyanobacterial P status—Corporate expression of thePstS protein by Synechococcus and Prochlorococcus wasmeasured over the annual cycle at 10 and 100 m (Fig. 4).Two general trends were observed: (1) PstS expression waslow in the spring and then increased in the summer beforedecreasing in the winter, and (2) SRP concentration was highin the early spring and then decreased in the summer beforeincreasing in the winter. No absolute correlation betweendepth and level of PstS expression was observed over theannual cycle; however, PstS expression was usually greaterat the surface than at depth on any given date. In contrastto the data for September 1999, the depth profile of PstSexpression from September 2000 showed a marked declinebetween 5 and 25 m, with no detectable expression below50 m (Fig. 5). Expression correlated negatively with SRPconcentration, which was ,4 6 3 nmol L21 in the upper 50m and .25 6 3 nmol L21 below 50 m.
As expected, these trends (1 and 2 above) show an inverserelationship and indicate that PstS is useful for showing a P
stress response in Prochlorococcus and Synechococcus.However, low PstS expression was sometimes observedwhen SRP concentration was also low (e.g., 7 Sep), sug-gesting that other bioavailable P forms were present at thattime.
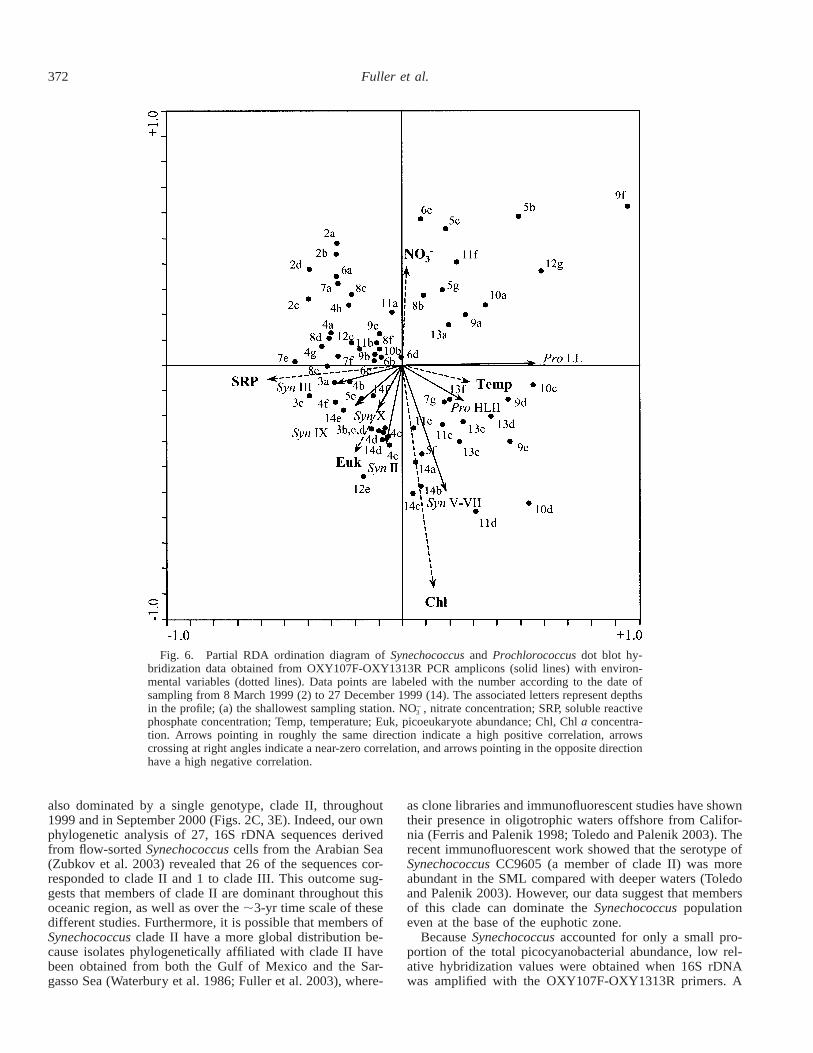
Multivariate analysis—To define the environmental pa-rameters that allow proliferation of a specific picocyanobac-terial population, a partial redundancy analysis (pRDA) wasperformed on a suite of environmental variables and theOXY107F-OXY1313R dot blot hybridization data (Fig. 6).The first two pRDA axes explained 19.6% of the variancein the species data and 76.9% of the variance in the corre-lations and the class means of species (genotypes) with re-spect to the environmental variables. An examination of thecanonical coefficients and the intraset correlations of envi-ronmental variables with the first two axes of the pRDAindicated that the first axis was mainly a phosphate gradient,whereas the second axis described nitrate concentration andbiomass (Chl a) as the important gradients.
The Synechococcus clades III and IX correlated positivelywith SRP concentration, whereas both HL and LL Prochlo-rococcus ecotypes correlated negatively with SRP. Addition-

370 Fuller et al.
Fig. 3. Vertical profiles from September 2000 of (A) Chl a, nitrate (mean 6 SD), soluble reactive phosphate (mean 6 SD), andammonium (mean 6 SD); (B) temperature and Synechococcus, Prochlorococcus, and picoeukaryote abundance (mean 6 SD) as enumeratedby flow cytometry; (C) abundance of HL and LL Prochlorococcus ecotypes (mean 6 SD) as enumerated by flow cytometry; (D) relativehybridization values (mean 6 SD) of HLII and LL Prochlorococcus ecotypes (as a proportion of all amplified by primers OXY107F andOXY1313R); and (E) relative hybridization values (mean 6 SD) of Synechococcus clade II and III genotypes and ‘‘general MC-A Syne-chococcus’’ (clades I–VII, X; as a proportion of all amplified by primers SYN172F and OXY1313R) as determined by dot blot analysis.The horizontal dashed line in panel D represents the depth of the 1% isolume.
ally, Synechococcus clades II and X showed a positive cor-relation with the abundance of photosyntheticpicoeukaryotes, whereas clades V, VI, and VII showed apositive correlation with algal biomass (Chl a). For nitrateconcentration, Synechococcus clades II and V–VII were neg-atively correlated, whereas Synechococcus clade III showedno correlation. HLII Prochlorococcus showed a weak neg-ative correlation and LL Prochlorococcus ecotypes were un-correlated with nitrate concentration.
Discussion
Temporal studies of Synechococcus and Prochlorococcuspopulations in the North Atlantic Ocean, the Pacific Ocean,and the Red Sea (Lindell and Post 1995; Campbell et al.1997; DuRand et al. 2001) have provided invaluable data onpicocyanobacterial community structure. However, we nowknow that these populations are composed of several eco-types or diverse clades; therefore, the dynamics of these pop-ulations are better resolved by molecular approaches. Herewe present for the first time an annual study of Synechococ-cus and Prochlorococcus community structure dynamicscombining genetic analyses with flow cytometric data, phys-ical and chemical data, and an assessment of the P status ofthese populations.
Prochlorococcus numerically dominated the picophyto-plankton from April 1999 to January 2000, whereas Syne-chococcus cell concentrations remained low throughout theyear. This contrasts markedly with a previous study carriedout between September 1992 and September 1993 (Lindell
and Post 1995) that showed the succession of blooms ofSynechococcus and Prochlorococcus in the spring and sum-mer, respectively. These striking differences in the picophy-toplankton dynamics between the two studies could be ex-plained by the different depths of winter mixing and theirsubsequent effects on nutrient concentrations. During the1992–1993 winter, the water column was mixed to a depthof 600 m at Sta. A and exceeded depths of 1,000 m at south-erly sites in the Gulf of Aqaba (Genin et al. 1995; Lindelland Post 1995), leading to nitrate concentrations as high as2.8 mmol L21 by mid-March (Lindell and Post 1995). Incontrast, water column mixing during the 1998–1999 winterdescended to 300–500 m (see also Sommer et al. 2002), andnitrate concentrations were only 0.7 mmol L21 in surfacewaters by mid-March (Fig. 1). Synechococcus have a highN requirement (Moore et al. 2002; Heldal et al. 2003) be-cause of their N-rich phycobilisomes; therefore, the lowernitrate concentrations might have been a factor in preventinga spring bloom. Because Prochlorococcus cannot utilize ni-trate, but rely instead on more reduced N forms for growth(Moore et al. 2002; Zubkov et al. 2003), they might be lesssensitive to lower concentrations of this nutrient.
Molecular diversity analyses showed that Prochlorococ-cus and Synechococcus populations were dominated by asingle ecotype or clade. The HL-adapted Prochlorococcusecotype, HLII, was the most abundant ecotype throughout1999 and in September of the following year. These resultsare supported by sequencing of ntcA and cpeB environmen-tal clones from the same site sampled in 1997 and September2000, respectively (Lindell 2000; Steglich et al. 2003), and

371Picocyanobacterial population dynamics
Fig. 4. Corporate expression of the phosphate-binding protein, PstS, by marine Synechococcusand Prochlorococcus during the 1999 annual cycle (mean 6 SD) at 10 and 100 m. Respective SRPconcentrations (mean 6 SD) are plotted with the data from Fig. 1.
Fig. 5. Corporate expression of the phosphate-binding protein,PstS, by marine Synechococcus and Prochlorococcus down a ver-tical profile in September 2000. SRP concentrations (mean 6 SD)are also plotted. N.B., the relative units of PstS expression betweenFigs. 4 and 5 are not directly comparable.
suggests a dominance of the HLII ecotype in this waterbodyover longer time scales. Furthermore, 16S rDNA sequencesfrom clone libraries from two sites in the Arabian Sea havealso shown the presence of HLII, rather than HLI, ecotypes
(Zubkov et al. 2003), suggesting that HLII is the dominantProchlorococcus HL ecotype throughout this oceanic region.In contrast to the HLI ecotype found in the eastern NorthAtlantic Ocean (West and Scanlan 1999) and the Mediter-ranean Sea (West et al. unpubl.), the HLII ecotype extendedto the base of the euphotic zone well below the 1% isolumethroughout most of the year (see Fig. 2B). This extension ofHLII ecotypes to the base of the euphotic zone agrees wellwith our previous fluorescent in situ hybridization data fromthe same site (West et al. 2001). This distribution might beexplained by a lack of competition from other Prochloro-coccus ecotypes because the LL form only appeared in latesummer. The late emergence of LL ecotypes from July toOctober 1999 and their reappearance in September 2000(Figs. 2B, 3C,D) suggests a seasonal occurrence. The delayin colonization of LL ecotypes at Sta. A could be explainedby differences in growth rates between ecotypes (from thesmall ‘‘seed’’ population remaining after winter mixing) orby invasion or repopulation of Prochlorococcus originatingfrom niches and refuges within the Gulf of Aqaba or fromthe main body of the Red Sea, south of the Straits of Tiran.Should seeding be required from the main body of the RedSea, a mechanism could then be envisaged whereby HLIIecotypes are transported via rapidly moving surface watersinto the northern tip of the Gulf. LL ecotypes, however,would probably be photoinhibited by the high light intensi-ties in such surface waters (Moore and Chisholm 1999);hence, their seeding populations would be confined to theslower moving, deeper waters. The sudden disappearance ofLL ecotypes after mid-October might have been a result ofthe cooling and deepening of the SML at this time; however,a specific loss of LL ecotypes through selective grazing orviral lysis cannot be discounted.
The Synechococcus population in the Gulf of Aqaba was
372 Fuller et al.
Fig. 6. Partial RDA ordination diagram of Synechococcus and Prochlorococcus dot blot hy-bridization data obtained from OXY107F-OXY1313R PCR amplicons (solid lines) with environ-mental variables (dotted lines). Data points are labeled with the number according to the date ofsampling from 8 March 1999 (2) to 27 December 1999 (14). The associated letters represent depthsin the profile; (a) the shallowest sampling station. NO , nitrate concentration; SRP, soluble reactive2
3
phosphate concentration; Temp, temperature; Euk, picoeukaryote abundance; Chl, Chl a concentra-tion. Arrows pointing in roughly the same direction indicate a high positive correlation, arrowscrossing at right angles indicate a near-zero correlation, and arrows pointing in the opposite directionhave a high negative correlation.
also dominated by a single genotype, clade II, throughout1999 and in September 2000 (Figs. 2C, 3E). Indeed, our ownphylogenetic analysis of 27, 16S rDNA sequences derivedfrom flow-sorted Synechococcus cells from the Arabian Sea(Zubkov et al. 2003) revealed that 26 of the sequences cor-responded to clade II and 1 to clade III. This outcome sug-gests that members of clade II are dominant throughout thisoceanic region, as well as over the ;3-yr time scale of thesedifferent studies. Furthermore, it is possible that members ofSynechococcus clade II have a more global distribution be-cause isolates phylogenetically affiliated with clade II havebeen obtained from both the Gulf of Mexico and the Sar-gasso Sea (Waterbury et al. 1986; Fuller et al. 2003), where-
as clone libraries and immunofluorescent studies have showntheir presence in oligotrophic waters offshore from Califor-nia (Ferris and Palenik 1998; Toledo and Palenik 2003). Therecent immunofluorescent work showed that the serotype ofSynechococcus CC9605 (a member of clade II) was moreabundant in the SML compared with deeper waters (Toledoand Palenik 2003). However, our data suggest that membersof this clade can dominate the Synechococcus populationeven at the base of the euphotic zone.
Because Synechococcus accounted for only a small pro-portion of the total picocyanobacterial abundance, low rel-ative hybridization values were obtained when 16S rDNAwas amplified with the OXY107F-OXY1313R primers. A
373Picocyanobacterial population dynamics
Synechococcus-biased forward primer (SYN172F) used withOXY1313R allowed a much clearer resolution of the Syne-chococcus clade dynamics over the course of the year, dem-onstrating the importance of primer pair choice. However,the general MC-A Synechococcus probe (SYN1258) gavehybridization values often ,100%, even for the more spe-cific SYN172F-OXY1313R primer pair (Fig. 2C). The ap-parent decrease in relative hybridization values of Synecho-coccus genotypes below the SML from July to October (Fig.2C) can be explained by the appearance of ProchlorococcusLL ecotypes in these samples, which numerically outnumberSynechococcus cells (Fig. 2A,B) and which are amplified bythe SYN172F-OXY1313R primer set. Where LL ecotypesare absent, the low SYN1258 values suggest the presence ofother noncharacterized MC-A Synechococcus 16S rDNAclades in this water column. Such a proposal is supportedby rpoC1 restriction fragment length polymorphism datafrom clone libraries obtained from these annual cycle sam-ples that indicate the presence of novel genotypes (Muhlinget al. unpubl.). These novel genotypes might correspond toSynechococcus strains CC9616 and CC9317, whose rpoC1sequences do not correlate with strains whose 16S rDNAsequence is known (Ferris and Palenik 1998).
To try to identify the response of Prochlorococcus andSynechococcus to their environment, we chose to use a spe-cific molecular marker of P stress (PstS) in Prochlorococcusand Synechococcus (Scanlan et al. 1997) because previousstudies had already shown evidence of P stress in cyano-bacteria in the Red Sea (Li et al. 1998; Stihl et al. 2001).The combined Prochlorococcus and Synechococcus com-munity showed marked seasonal changes of PstS expressionover an annual cycle, whereas the single depth profile forSeptember 2000 showed highest PstS expression, indicativeof P stress, in the upper 50 m where SRP concentrationswere extremely low. Similarly, high alkaline phosphatase(AP) activities, also indicative of P stress, which were cor-related with Synechococcus, were observed in surface watersat the same site in the Gulf of Aqaba in 1996 (Li et al. 1998).Indeed, AP added exogenously to seawater samples showedthat AP could release inorganic phosphate during Novem-ber–December and April–May, but not during June–August,suggesting low concentrations of organic P hydrolyzable bythis enzyme in the same region of the Gulf during the sum-mer of 1998 (Stihl et al. 2001).
Because Prochlorococcus cells greatly dominated the pi-cocyanobacterial population during the summer months (Fig.2A), we would suggest then that most of the PstS expressionobserved during this period can be attributed to this genus.Although the Prochlorococcus population might thereforehave exhibited P stress, it remained abundant throughout thesummer months and showed a negative correlation with SRP.Other studies have shown a lack of correlation of Prochlo-rococcus abundance with nutrients and instead indicated thattemperature was more important in Prochlorococcus dynam-ics (Cavender-Bares et al. 2001). Indeed, our study also sug-gests a positive correlation between Prochlorococcus eco-types and temperature (Fig. 6). In contrast, Synechococcusabundance was low in summer, which corresponded withgreater picocyanobacterial PstS expression and lower SRPconcentrations. Indeed, the decline in Synechococcus abun-
dance in May 1999, coinciding with the onset of PstS ex-pression, suggests that P stress might have been a causalfactor in this decline. Certainly, Synechococcus have highercell P quotas compared with Prochlorococcus (Bertilsson etal. 2003; Heldal et al. 2003); therefore, their proliferationmight be restricted under low P concentrations.
SRP measurements alone are, however, insufficient for as-sessing the P status of these picocyanobacteria. This is evi-denced by low PstS expression co-occurring with low SRPconcentration in some instances (Fig. 4). We would suggestthat the explanation for this low PstS expression, at a timewhen SRP measurements alone might indicate stress, is thebioavailability of other, likely organic, P sources at that time.This hypothesis would be consistent with earlier AP datafrom the Gulf of Aqaba (Stihl et al. 2001). It is alreadyknown that PstS expression in Synechococcus sp. strain WH7803 is repressed by the addition of organic P sources suchas dCTP, p-nitrophenyl phosphate, glucose-6-phosphate, orglycerol phosphate (Scanlan et al. 1997). Hence, it is quitepossible that utilization of organic P sources such as P estersand phosphonates, which are now known to be major com-ponents of marine dissolved organic phosphorus (Kolowithet al. 2001), would not be measured as SRP but would re-press PstS expression. Certainly, the complete genome se-quences of Synechococcus and Prochlorococcus indicate thepresence of genes encoding alkaline phosphatases as well asthose for phosphonate uptake, showing their potential to useorganic P substrates (Palenik et al. 2003; Rocap et al. 2003).
Multivariate statistical analysis of the molecular commu-nity structure (dot blot hybridization) and environmental pa-rameter datasets indicates that specific Synechococcus–Prochlorococcus clades respond somewhat differently to thedominant environmental gradients of phosphate and nitrate.For example, different Synechococcus clades showed vary-ing responses to nitrate concentrations at Sta. A, albeit the‘‘signal’’ is weak. Further use of large datasets, coupled withhigh-resolution sampling to fully capture the dynamics of Pand N cycling and their influence on community structure,is now required to demonstrate the generality of the corre-lations found here, particularly with respect to specific cladesand their potential adaptation to different niches. Even so,given the potential for specific picocyanobacterial clades torespond differently to environmental variables, this needs tobe borne in mind, particularly when considering correlationsthat have previously been drawn between picocyanobacterialflow cytometric (i.e., cell abundance) data and such param-eters.
This study shows the dominance of the ProchlorococcusHLII ecotype and Synechococcus clade II in the northern tipof the Red Sea with punctual appearances of the Prochlo-rococcus LL ecotype and the Synechococcus clade III ge-notype in the summer, demonstrating the utility of an annualstudy. Synechococcus and Prochlorococcus population dy-namics were different in this study compared with those in1992–1993, particularly with respect to the absence of a sig-nificant spring Synechococcus bloom, which emphasizes theneed for long-term molecular studies. Furthermore, the useof PstS antibodies, which allowed for the specific interro-gation of the Synechococcus and Prochlorococcus popula-tions for their P status and which showed these organisms
374 Fuller et al.
to be P stressed during the summer months, demonstratesthe utility of markers that can target particular componentsof the bacterioplankton, rather than bulk enzyme measure-ments. The availability of whole genome sequences willgreatly aid the development of new molecular markers ofphysiological state which, combined with DNA and antibodyprobes, will help unlock the complex processes influencingProchlorococcus and Synechococcus population dynamics.
References
AMANN, R. I., W. LUDWIG, AND K. H. SCHLEIFER. 1995. Phyloge-netic identification and in situ detection of individual microbialcells without cultivation. Microbiol. Rev. 59: 143–169.
BERTILSSON, S., O. BERGLUND, D. M. KARL, AND S. W. CHISHOLM.2003. Elemental composition of marine Prochlorococcus andSynechococcus: Implications for the ecological stoichiometryof the sea. Limnol. Oceanogr. 48: 1721–1731.
BLANCHOT, J., M. RODIER, AND A. LEBOUTEILLER. 1992. Effect ofEl Nino Southern Oscillation events on the distribution andabundance of phytoplankton in the western Pacific tropicalocean along 165 degrees-E. J. Plankton Res. 14: 137–156.
BROWN, J., A. COLLING, D. PARK, J. PHILLIPS, D. ROTHERY, AND
J. WRIGHT. 1992. Light and sound in seawater, p. 71–84. In G.Bearman [ed.], Seawater: Its composition, properties and be-haviour. Oceanography Series of The Open University. Per-gamon.
CAMPBELL, L., H. LIU, H. A. NOLLA, AND D. VAULOT. 1997. An-nual variability of phytoplankton and bacteria in the subtropicalNorth Pacific Ocean at Station ALOHA during the 1991–1994ENSO event. Deep-Sea Res. I 44: 167–192.
CAVENDER-BARES, K. K., D. M. KARL, AND S. W. CHISHOLM. 2001.Nutrient gradients in the western North Atlantic Ocean: Rela-tionship to microbial community structure and comparison topatterns in the Pacific Ocean. Deep-Sea Res. I 48: 2373–2395.
DUFRESNE, A., AND OTHERS. 2003. Genome sequence of the cya-nobacterium Prochlorococcus marinus SS120, a nearly mini-mal oxyphototrophic genome. Proc. Natl. Acad. Sci. USA 100:10,020–10,025.
DURAND, M. D., R. J. OLSON, AND S. W. CHISHOLM. 2001. Phy-toplankton population dynamics at the Bermuda Atlantic Time-series station in the Sargasso Sea. Deep-Sea Res. II Oceanogr.48: 1983–2003.
DUSENBERRY, J. A., AND S. L. FRANKEL. 1994. Increasing the sen-sitivity of a FACScan flow cytometer to study oceanic pico-plankton. Limnol. Oceanogr. 39: 206–209.
DYHRMAN, S. T., AND B. PALENIK. 2001. A single-cell immunoassayfor phosphate stress in the dinoflagellate Prorocentrum mini-mum (Dinophyceae). J. Phycol. 37: 400–410.
FERRIS, M. J., AND B. PALENIK. 1998. Niche adaptation in oceancyanobacteria. Nature 396: 226–228.
FULLER, N. J., D. MARIE, F. PARTENSKY, D. VAULOT, A. F. POST,AND D. J. SCANLAN. 2003. Clade-specific 16S rDNA oligo-nucleotides reveal the predominance of a single marine Syne-chococcus clade throughout a stratified water column in theRed Sea. Appl. Environ. Microbiol. 69: 2430–2443.
GARCZAREK, L., W. R. HESS, J. HOLTZENDORFF, G. W. M. VAN DER
STAAY, AND F. PARTENSKY. 2000. Multiplication of antennagenes as a major adaptation to low light in a marine prokary-ote. Proc. Natl. Acad. Sci. USA 97: 4098–4101.
GENIN, A., B. LAZAR, AND S. BRENNER. 1995. Vertical mixing andcoral death in the Red Sea following the eruption of MountPinatubo. Nature 377: 507–510.
HELDAL, M., D. J. SCANLAN, S. NORLAND, F. THINGSTAD, AND N.H. MANN. 2003. Elemental composition of single cells of var-
ious strains of marine Prochlorococcus and Synechococcus us-ing X-ray microanalysis. Limnol. Oceanogr. 48: 1732–1743.
HOLMES, R. M., A. AMINOT, R. KEROUEL, B. A. HOOKER, AND B.J. PETERSON. 1999. A simple and precise method for measuringammonium in marine and freshwater ecosystems. Can. J. Fish.Aquat. Sci. 56: 1801–1808.
KARL, D. M., AND G. TIEN. 1992. MAGIC: A sensitive and precisemethod for measuring dissolved phosphorus in aquatic envi-ronments. Limnol. Oceanogr. 37: 105–116.
KOLOWITH, L. C., E. D. INGALL, AND R. BENNER. 2001. Compo-sition and cycling of marine organic phosphorus. Limnol.Oceanogr. 46: 309–320.
LI, H., M. J. W. VELDHUIS, AND A. F. POST. 1998. Alkaline phos-phatase activities among planktonic communities in the north-ern Red Sea. Mar. Ecol. Prog. Ser. 173: 107–115.
LINDELL, D. 2000. Asssessing the nitrogen status of marine pro-karyotic phytoplankton using molecular methods. Ph.D. thesis,Hebrew Univ. of Jerusalem.
, AND A. F. POST. 1995. Ultraphytoplankton succession istriggered by deep winter mixing in the Gulf of Aqaba (Eilat),Red Sea. Limnol. Oceanogr. 40: 1130–1141.
, AND . 2001. Ecological aspects of ntcA gene ex-pression and its use as an indicator of the nitrogen status ofmarine Synechococcus. Appl. Environ. Microbiol. 67: 3340–3349.
LUDWIG, W., AND OTHERS. 2004. ARB: A software environment forsequence data. Nucl. Acids Res. 32: 1363–1371.
MARIE, D., C. BRUSSAARD, F. PARTENSKY, AND D. VAULOT. 1999.Flow cytometric analysis of phytoplankton, bacteria and virus-es, p. 11.11.1–11.11.15. In J. P. Robinson and others [eds.],Current protocols in cytometry. Wiley.
MOORE, L. R., AND S. W. CHISHOLM. 1999. Photophysiology of themarine cyanobacterium Prochlorococcus: Ecotypic differencesamong cultured isolates. Limnol. Oceanogr. 44: 628–638.
, R. GOERICKE, AND S. W. CHISHOLM. 1995. Comparativephysiology of Synechococcus and Prochlorococcus: Influenceof light and temperature on growth, pigments, fluorescence andabsorptive properties. Mar. Ecol. Prog. Ser. 116: 259–275.
, A. F. POST, G. ROCAP, AND S. W. CHISHOLM. 2002. Utili-zation of different nitrogen sources by the marine cyanobac-teria Prochlorococcus and Synechococcus. Limnol. Oceanogr.47: 989–996.
, G. ROCAP, AND S. W. CHISHOLM. 1998. Physiology andmolecular phylogeny of coexisting Prochlorococcus ecotypes.Nature 393: 464–467.
MURPHY, J., AND J. P. RILEY. 1962. A modified single solutionmethod for the determination of phosphate in natural waters.Anal. Chim. Acta 27: 31–36.
PALENIK, B., AND OTHERS. 2003. The genome of a motile marineSynechococcus. Nature 424: 1037–1042.
PARTENSKY, F., J. BLANCHOT, AND D. VAULOT. 1999a. Differentialdistribution and ecology of Prochlorococcus and Synechococ-cus in oceanic waters: A review, p. 457–475. In L. Charpy andA. W. D. Larkum [eds.], Marine cyanobacteria. Bull. Inst.Oceanogr. (Monaco) (special issue) 19.
, W. R. HESS, AND D. VAULOT. 1999b. Prochlorococcus, amarine photosynthetic prokaryote of global significance. Mi-crobiol. Mol. Biol. Rev. 63: 106–127.
RIPPKA, R., AND OTHERS. 2000. Prochlorococcus marinus Chisholmet al. 1992 subsp. pastoris subsp. nov. strain PCC 9511, thefirst axenic chlorophyll a2/b2–containing cyanobacterium (Ox-yphotobacteria). Int. J. Syst. Evol. Microbiol. 50: 1833–1847.
ROCAP, G., AND OTHERS. 2003. Genome divergence in two Prochlo-rococcus ecotypes reflects oceanic niche differentiation. Nature424: 1042–1047.

375Picocyanobacterial population dynamics
SCANLAN, D. J. 2003. Physiological diversity and niche adaptationin marine Synechococcus. Adv. Microb. Physiol. 47: 1–64.
, N. H. MANN, AND N. G. CARR. 1993. The response of thepicoplanktonic marine cyanobacterium Synechococcus speciesWH 7803 to phosphate starvation involves a protein homolo-gous to the periplasmic phosphate-binding protein of Esche-richia coli. Mol. Microbiol. 10: 181–191.
, N. J. SILMAN, K. M. DONALD, W. H. WILSON, N. G. CARR,I. R. JOINT, AND N. H. MANN. 1997. An immunological ap-proach to detect phosphate stress in populations and singlecells of photosynthetic picoplankton. Appl. Environ. Micro-biol. 63: 2411–2420.
, AND N. J. WEST. 2002. Molecular ecology of the marinecyanobacterial genera Prochlorococcus and Synechococcus.FEMS Microbiol. Ecol. 40: 1–12.
SOMMER, U., AND OTHERS. 2002. Grazing during early spring in theGulf of Aqaba and the northern Red Sea. Mar. Ecol. Prog. Ser.239: 251–261.
STEGLICH, C., A. F. POST, AND W. R. HESS. 2003. Analysis of nat-ural populations of Prochlorococcus spp. in the northern RedSea using phycoerythrin gene sequences. Environ. Microbiol.5: 681–690.
STIHL, A., U. SOMMER, AND A. F. POST. 2001. Alkaline phosphataseactivities among populations of the colony forming diazotroph-ic cyanobacterium Trichodesmium spp. (cyanobacteria) in theRed Sea. J. Phycol. 37: 310–317.
TER BRAAK, C. J. F. 1994. CANOCO—A FORTRAN program forcanonical community ordination by [partial][detrended][canonical] correspondence analysis, principal componentsanalysis and redundancy analysis (version 2.1). Report LWA-88-02. Agricultural Mathematics Group, Wageningen, TheNetherlands.
. 1990. Upgrade notes: CANOCO version 3.1. AgriculturalMathematics Group, Wageningen, The Netherlands.
. 1994. Canonical community ordination part 1: Basic theoryand linear methods. Ecoscience 1: 127–140.
TOLEDO, G., AND B. PALENIK. 2003. A Synechococcus serotype isfound preferentially in surface marine waters. Limnol. Ocean-ogr. 48: 1744–1755.
URBACH, E., D. L. ROBERTSON, AND S. W. CHISHOLM. 1992. Mul-tiple evolutionary origins of prochlorophytes within the cyano-bacterial radiation. Nature 355: 267–270.
, D. J. SCANLAN, D. L. DISTEL, J. B. WATERBURY, AND S.W. CHISHOLM. 1998. Rapid diversification of marine picophy-toplankton with dissimilar light-harvesting structures inferredfrom sequences of Prochlorococcus and Synechococcus (Cya-nobacteria). J. Mol. Evol. 46: 188–201.
WATERBURY, J. B., S. W. WATSON, F. W. VALOIS, AND D. G.FRANKS. 1986. Biological and ecological characterisation ofthe marine unicellular cyanobacterium Synechococcus, p. 71–120. In T. Platt and W. K. W. Li [eds.], Photosynthetic pico-plankton. Can. Bull. Fish. Aquat. Sci. 214.
WAWRIK, B., J. H. PAUL, L. CAMPBELL, D. GRIFFIN, L. HOUCHIN,A. FUENTES-ORTEGA, AND F. MULLER-KARGER. 2003. Verticalstructure of the phytoplankton community associated with acoastal plume in the Gulf of Mexico. Mar. Ecol. Prog. Ser. 251:87–101.
WEST, N. J., AND D. J. SCANLAN. 1999. Niche-partitioning ofProchlorococcus populations in a stratified water column in theeastern North Atlantic Ocean. Appl. Environ. Microbiol. 65:2585–2591.
, W. A. SCHONHUBER, N. J. FULLER, R. I. AMANN, R. RIPP-KA, A. F. POST, AND D. J. SCANLAN. 2001. Closely relatedProchlorococcus genotypes show remarkably different depthdistributions in two oceanic regions as revealed by in situ hy-bridisation using 16S rRNA-targeted oligonucleotides. Micro-biology 147: 1731–1744.
WOLF-VECHT, A., N. PALDOR, AND S. BRENNER. 1992. Hydrograph-ic indications of advection/convection in the Gulf of Eilat.Deep-Sea Res. 39: 1393–1401.
ZUBKOV, M. V., B. M. FUCHS, G. A. TARRAN, P. H. BURKILL, AND
R. AMANN. 2003. High rate of uptake of organic nitrogen com-pounds by Prochlorococcus cyanobacteria as a key to theirdominance in oligotrophic oceanic waters. Appl. Environ. Mi-crobiol. 69: 1299–1304.
Received: 10 March 2004Accepted: 29 July 2004
Amended: 16 August 2004


![Ugo ZANETTI, L'Église Copte, dans Seminarium, 38 [= N.S. 27, 3] (1987), p. 352-363.](https://static.fdokumen.com/doc/165x107/6317feafd93a162f9c0e5f64/ugo-zanetti-leglise-copte-dans-seminarium-38-ns-27-3-1987-p-352-363.jpg)