Dynamics of anterior–posterior axis formation in the developing mouse embryo
10
ARTICLE 1 NATURE COMMUNICATIONS | 3:673 | DOI: 10.1038/ncomms1671 | www.nature.com/naturecommunications © 2012 Macmillan Publishers Limited. All rights reserved. Received 20 Oct 2011 | Accepted 9 Jan 2012 | Published 14 Feb 2012 DOI: 10.1038/ncomms1671 The development of an anterior–posterior (AP) polarity is a crucial process that in the mouse has been very difficult to analyse, because it takes place as the embryo implants within the mother. To overcome this obstacle, we have established an in-vitro culture system that allows us to follow the step-wise development of anterior visceral endoderm (AVE), critical for establishing AP polarity. Here we use this system to show that the AVE originates in the implanting blastocyst, but that additional cells subsequently acquire AVE characteristics. These ‘older’ and ‘younger’ AVE domains coalesce as the egg cylinder emerges from the blastocyst structure. Importantly, we show that AVE migration is led by cells expressing the highest levels of AVE marker, highlighting that asymmetry within the AVE domain dictates the direction of its migration. Ablation of such leading cells prevents AVE migration, suggesting that these cells are important for correct establishment of the AP axis. 1 Wellcome Trust/Cancer Research UK Gurdon Institute, Cambridge CB2 1QN, UK. 2 Laboratory of Biophysics and Surface Analysis, School of Pharmacy, University of Nottingham, Nottingham NG7 2RD, UK. 3 Drug Delivery and Tissue Engineering, Centre for Biomolecular Sciences, School of Pharmacy, University of Nottingham, Nottingham NG7 2RD, UK. *These authors contributed equally to this work. † Present address: Department of Biological Chemistry and Molecular Pharmacology, Harvard Medical School; Department of Medicine, Division of Hematology/Oncology, Children’s Hospital Boston, Massachusetts, USA. Correspondence and requests for materials should be addressed to M.Z.G. (email: [email protected]). Dynamics of anterior–posterior axis formation in the developing mouse embryo Samantha A. Morris 1, * ,† , Seema Grewal 1, *, Florencia Barrios 1, *, Sameer N. Patankar 2 , Bernhard Strauss 1 , Lee Buttery 3 , Morgan Alexander 2 , Kevin M. Shakesheff 3 & Magdalena Zernicka-Goetz 1
Transcript of Dynamics of anterior–posterior axis formation in the developing mouse embryo

ARTICLE
1NATURE COMMUNICATIONS | 3:673 | DOI: 10.1038/ncomms1671 | www.nature.com/naturecommunications
© 2012 Macmillan Publishers Limited. All rights reserved.
Received 20 Oct 2011 | Accepted 9 Jan 2012 | Published 14 Feb 2012 DOI: 10.1038/ncomms1671
The development of an anterior – posterior (AP) polarity is a crucial process that in the mouse
has been very diffi cult to analyse, because it takes place as the embryo implants within the
mother. To overcome this obstacle, we have established an in-vitro culture system that
allows us to follow the step-wise development of anterior visceral endoderm (AVE), critical
for establishing AP polarity. Here we use this system to show that the AVE originates in the
implanting blastocyst, but that additional cells subsequently acquire AVE characteristics. These
‘ older ’ and ‘ younger ’ AVE domains coalesce as the egg cylinder emerges from the blastocyst
structure. Importantly, we show that AVE migration is led by cells expressing the highest levels
of AVE marker, highlighting that asymmetry within the AVE domain dictates the direction of its
migration. Ablation of such leading cells prevents AVE migration, suggesting that these cells are
important for correct establishment of the AP axis.
1 Wellcome Trust / Cancer Research UK Gurdon Institute , Cambridge CB2 1QN, UK . 2 Laboratory of Biophysics and Surface Analysis, School of Pharmacy,
University of Nottingham , Nottingham NG7 2RD, UK . 3 Drug Delivery and Tissue Engineering, Centre for Biomolecular Sciences, School of Pharmacy,
University of Nottingham , Nottingham NG7 2RD, UK . * These authors contributed equally to this work . † Present address: Department of Biological
Chemistry and Molecular Pharmacology, Harvard Medical School; Department of Medicine, Division of Hematology / Oncology, Children ’ s Hospital Boston,
Massachusetts, USA. Correspondence and requests for materials should be addressed to M.Z.G. (email: [email protected] ) .
Dynamics of anterior – posterior axis formation in the developing mouse embryo Samantha A. Morris 1 , * , † , Seema Grewal 1 , * , Florencia Barrios 1 , * , Sameer N. Patankar 2 , Bernhard Strauss 1 ,
Lee Buttery 3 , Morgan Alexander 2 , Kevin M. Shakesheff 3 & Magdalena Zernicka-Goetz 1

ARTICLE
2
NATURE COMMUNICATIONS | DOI: 10.1038/ncomms1671
NATURE COMMUNICATIONS | 3:673 | DOI: 10.1038/ncomms1671 | www.nature.com/naturecommunications
© 2012 Macmillan Publishers Limited. All rights reserved.
The fi rst days of mouse embryo development are devoted to setting aside a group of pluripotent cells, the epiblast, from two extra-embryonic lineages: the trophectoderm and primi-
tive endoderm. Epiblast cells will give rise to all cells of the future body while both of the extra-embryonic tissues are critical to provide support for embryo development in utero and for estab-lishing the anterior – posterior (AP) axis. It is relatively well known how these lineages become established, as embryos can be cultured, manipulated and imaged until the blastocyst stage. However, as the blastocyst implants into the uterus, it becomes inaccessible and, therefore, it has been diffi cult to follow the dynamics of the events leading to AP axis formation.
Following implantation, the epiblast and surrounding extra-embryonic tissues undergo a burst of proliferation and transform into the egg cylinder, an elongated cup-like structure that becomes the foundation of the future body. Th is transformation is a highly dynamic process associated with intensive growth and changes in the shape and topology of the tissues. As a result, the epiblast becomes positioned toward the distal part of the egg cylinder, the trophectoderm-derived extra-embryonic ectoderm (ExE) locates in the proximal part, and both of these tissues become enveloped by primitive endoderm-derived visceral endoderm (VE). Around this time, AP polarity becomes defi ned.
By embryonic day 5.5 (E5.5), a distinct group of VE cells, the anterior visceral endoderm (AVE), have assembled at the distal tip of the egg cylinder 1,2 . Th is unique group of cells will subsequently expand and undertake unilateral movement towards the proximal region of the egg cylinder to specify the site where the head will form 1,3,4 . Th is movement is critical for correct positioning of the AP axis. It is well-established that AVE formation is the result of a combination of inductive signalling by the transforming growth fac-tor- β family members, Nodal and Activin 5 – 7 , and inhibitory signals originating in ExE, particularly bone morphogenetic protein 4 8 – 11 . However, how the AVE becomes specifi ed and the dynamics of its formation currently remain unclear. Interestingly, several recent studies indicate that expression of AVE markers such as Left y1 12,13 and Cerl 14,15 is initiated at the blastocyst stage, and so, earlier than previously expected. But are these cells that show early expression of AVE markers truly AVE progenitors? If so, how do they develop to contribute to the AVE? To answer these questions directly would require the visualisation and continuous tracing of the behaviour of these early expressing cells from pre- to post-implantation stages as the AVE forms. Until now, this has not been possible, because although embryo culture throughout this stage had been reported in the past 16 – 19, the reported protocols have not been widely adopted, most likely because of the lack of quantitative comparison with in vivo development and poor effi ciencies of embryo survival. Most importantly, they have never been developed for high-resolution time-lapse imaging, and consequently, dynamic observations of this crucial stage of development have never been made.
To build a picture of this critical pre- to post-implantation transi-tion, we previously carried out a series of complex experiments in which individual blastocyst cells were marked, then blastocysts were transferred into foster mothers to permit further development and subsequently recovered at successive implantation stages to analyse the clonal distribution of cells 3,15,20 . Th is very laborious approach proved insightful and suggested a model for how the egg cylin-der might emerge from the blastocyst structure, but this complex process could only be extrapolated from a limited number of static pictures. Th erefore, aiming to gain better and direct insight into how the blastocyst transforms into the egg cylinder and how the AP axis forms, we designed conditions that would allow reproducible development, and importantly, four-dimensional imaging of single cell behaviour, beyond the blastocyst stage outside the mother.
Here we report the step-wise development of AVE sub-domains from individual cells of the implanting blastocyst and their subse-
quent coalescence to form an asymmetrical domain of AVE at the distal tip of the egg cylinder. Th ese key stages of AVE formation have been observed in real time, using our newly validated in-vitro embryo culture technique that can be used to follow the dynam-ics of cellular events within the embryo at post-implantation stages. We show that such in vitro -cultured and -imaged embryos develop the correct morphology and spatio-temporal expression of epi-blast, trophectoderm- and primitive endoderm-derived tissue marker genes as the blastocyst grows into the egg cylinder . We also confi rm that the AVE develops in accordance with ‘ snap-shot ’ observations of embryos sampled from mothers at successive implantation stages 12,13,15,20 , and the pattern of expression of ante-rior and posterior markers indicates proper establishment of the AP axis. Finally, we show that the asymmetry in the expression of AVE marker genes dictates the direction of its anterior migration.
Results Novel culture system to follow development beyond the blastocyst stage . To follow the dynamics of AVE development, we fi rst needed to establish a reproducible system for culturing mouse embryos in vitro , which would permit time-lapse observations of the transition from the pre-implantation blastocyst to the post-implantation egg cylinder. As a starting point, we evaluated culture methods that had been reported in the 1970s 16 – 18 but not widely adopted. We found that supplementing the media with human cord serum was the key to success and permitted the development of approximately 40 % of blastocysts to the egg cylinder stage on plastic culture dishes ( Supplementary Fig. S1 ; Supplementary Table S1 ). Under these conditions, the egg cylinders that developed from blastocysts in vitro were morphologically similar to egg cylinders collected from mothers, and showed the same spatial patterns of expression of the respective ExE, VE and epiblast marker genes, Cdx2, Gata4 and Oct4 ( Supplementary Fig. S1 ).
However, this culture system was not suitable for our purpose, as the plastic dishes used as a platform for the embryo development were not amenable to live-imaging at cellular resolution. Moreover, we found that none of the commercially available, optically friendly culture dishes permitted correct development ( Supplementary Table S1 ). Th erefore, we assessed the use of polyacrylamide hydrogels bonded to glass and overlaid with various protein coatings, as simi-lar approaches have been successful in other cell culture systems 21 ( Supplementary Tables S1 and S2 ). We found that two variables were of particular importance for successful culture of embryos. First, the surface stiff ness of the polyacrylamide hydrogel, which we optimised by varying N ′ N ′ -methylenebisacrylamide and acry-lamide ratios; second, its protein coating. A coating of type I rat-tail collagen allowed 87 % (13 / 15) of embryos to attach to the matrix and 38 % (5 / 13) to develop into egg cylinders ( Supplementary Table S2 ). In contrast, laminin or fi bronectin alone were unsuitable surface coatings, but would allow 80 % (12 / 15) of embryos to attach and 41 % (5 / 12) to form egg cylinders when used in combination with collagen.
We set out to use these collagen-coated polyacrylamide matri-ces to follow the cellular dynamics of an egg cylinder emergence by spinning-disc, confocal time-lapse microscopy. Typically, when zona-free E3.5 blastocysts were seeded onto the culture gels, embryos developed over 5 days following the indicated time course ( Fig. 1a – d ; Supplementary Movies 1 – 3 ). We confi rmed the normal morphology of the egg cylinders that had developed from the blastocysts in vitro by recovering them from the gel aft er time-lapse imaging and staining them with the vital lipophilic dye FM4-64 to reveal individual cells by optical sectioning ( Fig. 1e ).
Dynamics of the blastocyst to egg cylinder transformation in vitro . We fi rst wished to use this new in-vitro culture / imaging system to describe the developmental events occurring as the

ARTICLE
3
NATURE COMMUNICATIONS | DOI: 10.1038/ncomms1671
NATURE COMMUNICATIONS | 3:673 | DOI: 10.1038/ncomms1671 | www.nature.com/naturecommunications
© 2012 Macmillan Publishers Limited. All rights reserved.
blastocysts develop into egg cylinders ( Fig. 1f ). We observed that during the fi rst day of in vitro culture, the blastocysts underwent expansion and contraction before thickening of the mural troph-ectoderm became evident during the second day. Higher resolu-tion imaging allowed us to discern the basal lamina, separating the epiblast from the primitive endoderm at this stage (optical sec-tions in Fig. 2a ). By the third day of culture, trophoblast cells had migrated across the collagen surface, resulting in spreading and fl attening of the embryos, and typical blastocyst morphology was lost. Th e beginnings of the egg cylinder formation were marked on the fourth day by the appearance of VE and of ExE close to the site of attachment. Th e embryonic VE and the underlying epiblast then started to ‘ grow out ’ from the surface, whereas the extra-embryonic components remained fi rmly ‘ implanted ’ and spread out across the matrix (optical sections in Fig. 2b ). Mature egg cylinders were con-sistently found towards the end of day 4 or on day 5. At this stage, the epiblast developed the shape of a cup surrounding the pro-amniotic cavity and extending towards the extra-embryonic compartment. VE enveloped both the embryonic and extra-embryonic regions of such egg cylinders.
To confi rm whether the dimensions of embryos developing in vitro are similar to those developing in utero , we next used the system to culture and image the development of embryos expressing transgenes for Histone H2B-GFP 22 and Oct4 Δ PE-GFP 23 (Oct4 deleted for the proximal enhancer). Th e former provides a marker for all nuclei, thus facilitating all cells to be followed at successive stages; the latter provides a marker to follow the pluripo-tent cells before the egg cylinder stage and germ cells thereaft er ( Supplementary Fig. S2a,b ). We found that the embryonic and extra-embryonic compartments of the in-vitro developing egg cylinders,
and the dimensions and overall shapes of the cultured embryos were comparable to embryos that had developed in utero ( Supplementary Fig. S2c,d and legend).
To further assess the extent to which development in vitro resem-bles development in utero , we examined and compared the spatial expression of anterior and posterior markers in egg cylinders of the in vitro and in vivo cultured embryos. To this end, we cultured blasto-cysts derived from a transgenic reporter line in which green fl uores-cent protein expressed from the Cerl promoter marks the develop-ment of AVE 14 . At the fi ft h day of development in vitro , the expression of this AVE marker was similar to its pattern in the egg cylinders freshly collected from mothers ( Fig. 3a ). We also assessed the expres-sion of the posterior marker, Brachyury , through in situ hybridisation and found that as in embryos developing in vivo , its transcripts were present in the opposing (posterior) side and were characteristically restricted to the embryonic / extra-embryonic boundary ( Fig. 3a ). As a further test for correct development of the anterior, we car-ried out co-staining for Cerl and another AVE marker, Left y1. Th is revealed that these markers are co-expressed at successive stages of AVE development ( Fig. 3b,c ). Together, these results indicate that the development of AVE in vitro accords with the ‘ snap-shot ’ observations made by ourselves and by others, of embryos recov-ered from pregnant mothers during implantation stages 12,13,15,20 . Moreover, upon AVE migration, the in vitro -cultured embryos initi-ate the expression of Brachyury , indicating a proper establishment of AP polarity. As Brachyury expression marks the site of primitive streak formation, this suggests that embryos cultured in vitro are competent to gastrulate.
As a fi nal test, we determined whether the development of exogenous, transplanted embryonic stem (ES) cells would occur
a
b
41 h 48 h 56 h 58 h 90 h 106 h 116 h
Day 2 ivc Day 3 ivc Day 4 ivc Day 5 ivc
c
36 h 49 h 56 h 66 h 76 h 89 h 95 h 101 h
*
×20 ×40
Day 1
ivc
**
*
56 h15 min
×40
d
Day 1ivc
Day 2ivc
Day 3ivc
Day 4ivc
00:00 02:40 08:40 12:20 15:40
00:00 03:20 08:00 18:0014:00
00:00 06:20 13:40 19:40 21:00
02:10 06:20 15:00 17:30
2 h 17 h
22 h 40 h
51 h 72 h
73 h 89 h
18:30
DIC FM4-64
Projectedz70 z57 z80
e
f
Day 2
ivc
Day 3
ivc
Day 4
ivc
Day 5
ivc
Day 1
ivc
Day 2
ivc
Day 3
ivc
Day 4
ivc
Day 5
ivc
* *
Figure 1 | In vitro culture of blastocysts on collagen-coated polyacrylamide matrices allows successful development to the egg cylinder stage. ( a , b ) DIC time-lapse observations of in vitro development of two representative blastocysts on collagen-coated polyacrylamide gels covalently bound
to a glass-bottomed dish. Each panel shows a single embryo continuously observed from the second day of in vitro culture (ivc), until the fi fth day. Panels
( a ) and ( b ) show selected frames from Supplementary Movies 1 and 2 , respectively. Elapsed developmental time from the point at which the blastocyst
was placed on the gel is shown at the top of each frame. Scale bars represent 50 μ m. ( c , d ) Development of two further representative embryos in vitro
and observed using a × 40 objective. DIC images are shown alongside schematics showing different tissues: epiblast, blue; primitive / visceral endoderm,
yellow; trophectoderm / ExE, grey; the pro-amniotic cavity is highlighted by an asterisk. The overlying trophectoderm is omitted from the schematics of
the third and fourth day of in vitro culture, for clarity. Development of the embryo shown in ( c ) is presented in Supplementary Movie 3 . ( e ) On day 5 of
in vitro culture, the embryo shown in ( d ) was removed from the gel and stained with the lipophilic dye FM4-64. DIC, selected confocal stacks and
projected images are shown. ( f ) DIC time-lapse observations during 4 days of development in vitro. A representative embryo is shown for each day
of culture. Elapsed developmental time from the point at which the blastocyst was placed on the gel is shown at the top of the fi rst and the last frame
presented for each day. Time points at the bottom of each still represent individual time frames from time-lapse observations on the indicated day.
Embryonic and extra-embryonic structures are indicated as follows: primitive endoderm (blastocyst) and visceral endoderm (egg cylinder), yellow-dashed
line; trophectoderm (blastocyst) and ExE (egg cylinder), white-dashed line; epiblast, blue-dashed line. Scale bars represent 50 μ m.

ARTICLE
4
NATURE COMMUNICATIONS | DOI: 10.1038/ncomms1671
NATURE COMMUNICATIONS | 3:673 | DOI: 10.1038/ncomms1671 | www.nature.com/naturecommunications
© 2012 Macmillan Publishers Limited. All rights reserved.
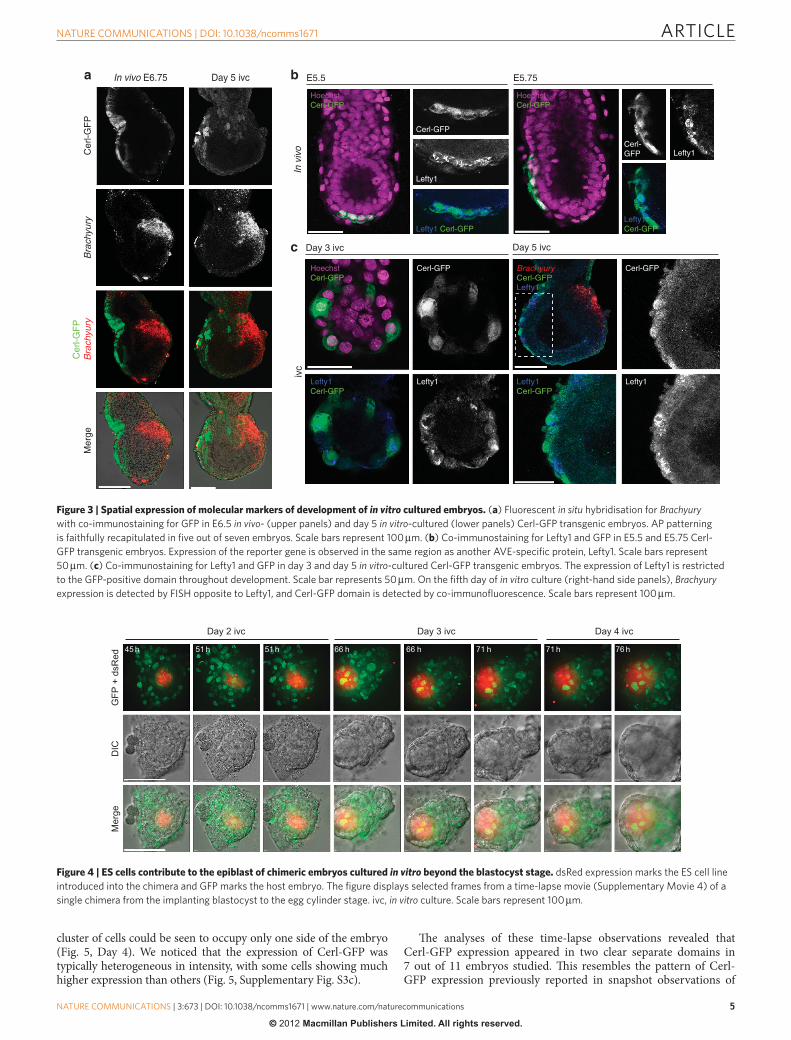
correctly in embryos cultured in vitro and therefore would allow us to follow the dynamics of their contribution as the egg cylinder emerges. To this end, we aggregated ES cells expressing the marker gene, dsRed , with eight-cell stage histone H2B-GFP 24 host embryos and cultured such chimeras in vitro until the egg cylinder emerged. Our time-lapse observations revealed that the ES cells proliferated and became incorporated mostly into the epiblast rather than the VE or the ExE of the egg cylinder ( Fig. 4 ; Supplementary Movie 4 ), in accordance with their contribution in embryos developing in utero 25 .
Taken together, these results indicate that the development of embryos on collagen-coated polyacrylamide matrices permits the emergence of egg cylinders that are similar to those collected from the uteri of pregnant mothers, both in morphology and in patterns of gene expression, as well as in establishment of an AP axis as judged by the expression of both anterior and posterior markers. Th e proper restriction of ES cells to the epiblast when aggregation chimeras are allowed to develop in vitro is a further indication that the development in vitro recapitulates the development in utero .
AVE-formation dynamics as blastocyst transforms into the egg cylinder . A number of studies have attempted to relate the spatial organisation of the pre-implantation blastocyst to that of the post-implantation egg cylinder, with particular reference to the emergence of the AVE and thus of the AP axis of the embryo 13 – 15 . However, due to the necessity of transferring pre-implantation embryos to foster mothers to allow their further development, the continuity of these processes was until now impossible to determine. Th us, we next
evaluated whether our new in vitro culture system in combination with time-lapse imaging could enable us to follow AVE development as the blastocysts grew into egg cylinders. We collected E3.5 blas-tocysts from female F1 mice mated with Cerl - GFP male mice and seeded them onto the collagen-coated polyacrylamide hydrogels. We recorded Cerl-GFP expression during continuous develop ment in vitro from its onset in the blastocyst until its consolidation in the AVE ( Supplementary Fig. S3a ; Supplementary Movie 5 ). Detailed analyses of these movies allowed us to register the positions of Cerl-GFP-expressing cells in multiple focal planes as development progressed ( Fig. 5 ; Supplementary Movie 6 ). Th is revealed the onset of Cerl-GFP expression in one or two cells of the inner cell mass in the free-fl oating blastocyst (not shown), in accordance with previous observations 13,15 . We found that at this stage, the Cerl-GFP expres-sion was transient, as when the blastocyst fi rst attached to the culture matrix, the Cerl-GFP expression was not evident. However, Cerl-GFP expression appeared in single primitive endoderm cells and progressively increased in intensity once the blastocysts had com-pletely fl attened onto the matrix surface ( Fig. 5 , Day 3). With time, other primitive endoderm cells surrounding the epiblast began to express Cerl-GFP. Th ese Cerl-GFP-expressing cells were found both in the vicinity of the fi rst expressing cell and in another region within the primitive endoderm ( Fig. 5 , Day 3). Interestingly, we observed that the emergence of the egg cylinder structure from the fl attened blastocyst coincided with the consolidation of the Cerl-GFP-express-ing cells into the early AVE domain ( Fig. 5 , Day 3 to start of Day 4). On the fourth day of culture, as the egg cylinder grew, this Cerl-GFP
a
b
Pha
lloid
in+
H2B
-GF
P
Pha
lloid
in+
H2B
-GF
PB
right
field
Brig
htfie
ld
z z+3.85 µm
z+11µm z+26µm z+41µm z+61µm z+91µm
z+7.15 µm z+21.45 µm z+25.5µm z+28.6µm
z
*
Day 2 ivc
Day 5 ivc
Epi
PE
TE
TE
VE
VE
VEExE
ExE
ExE
Epi
BL
Figure 2 | Optical sections of embryos after 2 or 5 days of in vitro culture. Mouse blastocysts from the H2B-GFP transgenic reporter line were
cultured on polyacrylamide hydrogels coated with collagen on a 24-well glass-bottomed plate and fi xed on either the second ( a ) or fi fth ( b ) day of
in vitro development. Selected laser-scanning confocal z-planes are shown for each developmental stage in which both nuclei (H2B-GFP) and cortical
cytoskeleton (Phalloidin) is shown merged on a grey scale. Bright-fi eld images corresponding to each focal plane are shown beneath the fl uorescent
images. Scale bars shown in ( a ) represent 50 μ m and in ( b ) 100 μ m. Arrowheads indicate the epiblast (Epi, blue); primitive endoderm (PE, yellow); visceral
endoderm (VE, yellow); trophectoderm (TE, white) and ExE (white); basal lamina (BL, red). We were unable to identify parietal endoderm or Reichert ’ s
membrane. The asterisk indicates the pro-amniotic cavity.
ARTICLE
5
NATURE COMMUNICATIONS | DOI: 10.1038/ncomms1671
NATURE COMMUNICATIONS | 3:673 | DOI: 10.1038/ncomms1671 | www.nature.com/naturecommunications
© 2012 Macmillan Publishers Limited. All rights reserved.
cluster of cells could be seen to occupy only one side of the embryo ( Fig. 5 , Day 4). We noticed that the expression of Cerl-GFP was typically heterogeneous in intensity, with some cells showing much higher expression than others ( Fig. 5 , Supplementary Fig. S3c ).
Th e analyses of these time-lapse observations revealed that Cerl-GFP expression appeared in two clear separate domains in 7 out of 11 embryos studied. Th is resembles the pattern of Cerl-GFP expression previously reported in snapshot observations of
Cer
l-GF
PB
rach
yury
In vivo E6.75 Day 5 ivcaC
erl-G
FP
Bra
chyu
ryM
erge
b
c
E5.5 E5.75
HoechstCerl-GFP
HoechstCerl-GFP
Cerl-GFP
Lefty1
Cerl-GFP Lefty1
In v
ivo
ivc
Day 3 ivc Day 5 ivc
HoechstCerl-GFP
Cerl-GFP
Lefty1Lefty1Cerl-GFP
Lefty1Cerl-GFPLefty1 Cerl-GFP
BrachyuryCerl-GFPLefty1
Cerl-GFP
Lefty1Cerl-GFP
Lefty1
Figure 3 | Spatial expression of molecular markers of development of in vitro cultured embryos. ( a ) Fluorescent in situ hybridisation for Brachyury
with co-immunostaining for GFP in E6.5 in vivo - (upper panels) and day 5 in vitro -cultured (lower panels) Cerl-GFP transgenic embryos. AP patterning
is faithfully recapitulated in fi ve out of seven embryos. Scale bars represent 100 μ m. ( b ) Co-immunostaining for Lefty1 and GFP in E5.5 and E5.75 Cerl-
GFP transgenic embryos. Expression of the reporter gene is observed in the same region as another AVE-specifi c protein, Lefty1. Scale bars represent
50 μ m. ( c ) Co-immunostaining for Lefty1 and GFP in day 3 and day 5 in vitro -cultured Cerl-GFP transgenic embryos. The expression of Lefty1 is restricted
to the GFP-positive domain throughout development. Scale bar represents 50 μ m. On the fi fth day of in vitro culture (right-hand side panels), Brachyury
expression is detected by FISH opposite to Lefty1, and Cerl-GFP domain is detected by co-immunofl uorescence. Scale bars represent 100 μ m.
GFP
+ d
sRed
DIC
Mer
ge
45 h 51 h 51 h 66 h 66 h 71 h 71 h 76 h
Day 2 ivc Day 3 ivc Day 4 ivc
Figure 4 | ES cells contribute to the epiblast of chimeric embryos cultured in vitro beyond the blastocyst stage. dsRed expression marks the ES cell line
introduced into the chimera and GFP marks the host embryo. The fi gure displays selected frames from a time-lapse movie ( Supplementary Movie 4 ) of a
single chimera from the implanting blastocyst to the egg cylinder stage. ivc, in vitro culture. Scale bars represent 100 μ m.

ARTICLE
6
NATURE COMMUNICATIONS | DOI: 10.1038/ncomms1671
NATURE COMMUNICATIONS | 3:673 | DOI: 10.1038/ncomms1671 | www.nature.com/naturecommunications
© 2012 Macmillan Publishers Limited. All rights reserved.
embryos developing in utero 15 (compare Cerl-GFP expression patterns in vitro and in vivo in Supplementary Fig. S3b ). We observed that, as development progressed, these two Cerl-GFP-expressing domains always coalesced at the distal part of the egg cylinder. Either the fi rst ( ‘ older ’ ) or the second ( ‘ younger ’ ) Cerl-GFP domain to arise could develop into the brightest part of the merged domains ( Sup-plementary Fig. S3c ). In all cases studied, the outcome was a cluster of cells at the distal part of the egg cylinder that showed a range of Cerl-GFP expression as judged by fl uorescence levels. Th ese results indicate that the AVE originates in the implanting blastocyst, but subsequently, an additional domain of cells acquires the AVE char-acteristics. Th ese ‘ older ’ and ‘ younger ’ domains coalesce as the egg cylinder emerges from the blastocyst structure.
Asymmetry of the AVE . Th e time-lapse observations indicated that on day 4 of in vitro culture, one cell within the AVE domain at the distal tip of the egg cylinder showed higher levels of Cerl-GFP expression than its neighbours and was set apart from them ( Fig. 5 ). Th is prompted us to examine if this heterogeneity of Cerl-GFP levels also exists in vivo and, if so, whether it is of physiological relevance to the subsequent migration of the AVE. We collected embryos that already had AVE positioned at the distal tip of the egg cylinder, and fi rst examined the Cerl-GFP expression levels. We observed a domain of three to nine cells clearly expressing Cerl-GFP at the dis-tal tip of the embryo and positioned slightly, but clearly, towards one side before AVE movement commenced ( Fig. 6a , n = 6), in agree-ment with previous observations 9,14 . We found that a cell express-ing higher levels of Cerl-GFP was positioned ahead of other Cerl-GFP-positive cells ( Fig. 6a,b ; fi ve out of six embryos), suggesting it could be leading migration of the AVE domain. We also observed that this most anteriorly located Cerl-GFP-expressing cell extended projections towards the anterior region and initiated migra-tion in that direction ( Fig. 6a , arrows, Supplementary Movie 7 ). To verify this observation, we analysed the dimensions of these cells by measuring their maximum length and width in relation to
their long axis in in-vitro -developed egg cylinders and freshly col-lected embryos. Th is revealed that the most anteriorly located Cerl-GFP-expressing cell became signifi cantly more elongated with time in comparison with the cuboidal cells following its migratory trajectory, and that this was the case for both embryos developing in vivo or in vitro ( Fig. 6c – e ). Quantifi cation of Cerl-GFP fl uores-cence indicated that the greater the intensity, the more elongated the cell ( Fig. 6e ). Th ese results indicate an asymmetry in the expression of the AVE marker gene and suggest that the cell expressing Cerl-GFP at the highest levels might be the cell that leads AVE migration.
AVE asymmetry dictates the direction of its migration . We wished to determine whether the asymmetric distribution of cells strongly expressing Cerl-GFP is important for the subsequent direc-tionality of AVE migration. To this end, we laser ablated individ-ual cells within the AVE domain showing diff erences in the levels of Cerl-GFP expression and followed the consequences for AVE behaviour. Having ensured that laser ablation of a target cell had no eff ects upon neighbouring cells ( Supplementary Fig. S4a,b ), we fi rst ablated the leading AVE cell, which showed the highest level of Cerl-GFP expression ( Fig. 7 ). Th is had a dramatic eff ect on AVE behaviour. In all 14 embryos examined, ablation of this leading cell abolished the migration of all AVE cells and prevented expansion of the AVE domain ( Fig. 7a ; Supplementary Movies 7 and 8 ; Sup-plementary Fig. S4c ). To determine to what extent the failure of AVE migration refl ected some unique quality of its leading cell or a general property of the entire AVE domain, we next ablated indi-vidual cells at diff erent positions in the AVE. We found that ablation of the cell immediately following the pioneer was also eff ective in preventing AVE migration; however, it still allowed an increase in the number of the Cerl-GFP cells ( Fig 7b ; n = 10; Supplementary Fig. S4d ). In contrast, ablation of a cell in the central domain of the trailing group of Cerl-GFP-expressing cells permitted anterior migration and AVE expansion, although to a slightly lesser extent than in control embryos ( Fig. 7b ; n = 5; Supplementary Fig. S4e ).
Cer
l-GF
Phe
at m
apD
ICC
erl-G
FP
proj
ectio
n
Day 3 ivc Day 4 ivc
66:00 67:15 69:45 72:45 76:30 81:05 84:50 88:3586:50 98:05 99:35
z1
z2
z3
z4
Figure 5 | Time-lapse-imaging of blastocysts cultured in vitro reveals the formation of the AVE. Day 3: within 6 h of the onset of expression of Cerl-GFP
in a single cell (red-dotted lines, top panel), two opposing domains of Cerl-GFP-expressing cells can be observed in the primitive endoderm (red- and
yellow-dotted lines; Supplementary Movie 6 ). Day 4: Cerl-GFP-expressing cells become progressively restricted to one side of the nascent egg cylinder.
Among these, the brightest cell (white arrow) becomes progressively distant from the central domain. Scale bars represent 100 μ m. The lower panels
represent heatmaps of the intensity levels of Cerl-GFP on four different topical sections. The colour bar on the left-hand side of the bottom panel is
the look-up table for GFP intensity in which white is the brightest. The GFP fl uorescence is a maximum intensity projection over the z-axis of confocal
sections. ivc, in vitro culture.

ARTICLE
7
NATURE COMMUNICATIONS | DOI: 10.1038/ncomms1671
NATURE COMMUNICATIONS | 3:673 | DOI: 10.1038/ncomms1671 | www.nature.com/naturecommunications
© 2012 Macmillan Publishers Limited. All rights reserved.
Ablation of Cerl-GFP-negative cells in the VE ahead of the leading cell had no eff ect on either AVE migration or its expansion, sug-gesting that cell ablation per se is not likely to provide a physical barrier to cell migration ( Fig. 7b , n = 5). Th ese results indicate that AVE migration is led by cells expressing the highest levels of AVE marker genes and therefore, suggest that the asymmetry within the AVE domain drives the direction of its migration. Th e fact that abla-tion of a single leading cell or its immediate follower could prevent AVE migration suggests that AVE migrates as a continuous sheet of cells, and that this is important for the correct establishment of the AP axis.
Discussion Studies of the genesis of AP polarity in the mouse embryo have been restricted by the inaccessibility of the embryo during the pre- to post-implantation transition when this primary body axis becomes established. To overcome this diffi culty, we have developed an in-vitro culture system that is compatible with time-lapse confocal microscopy to directly visualise how the AP axis emerges as the egg cylinder grows out of the blastocyst structure. Several lines of evidence indicate that this new approach for in vitro culture and imaging recapitulates development outside the body of the mother. First, embryos developing in vitro acquire the correct morphol-ogy and spatio-temporal expression patterns of key marker genes, indicating proper organisation of the epiblast, trophectoderm- and primitive endoderm-derived tissues in the egg cylinder . Sec-ond, they undergo rapid growth, concomitant with the formation of the proamniotic cavity, as is the case in embryos developing in the mother. Th ird, they develop the AVE in accordance with snap-shot observations of embryos sampled from mothers at successive implantation stages 13,15,20 . Fourth, upon AVE migration, they initi-ate expression of the posterior marker, Brachyury , indicating proper establishment of AP polarity and competence to initiate gastrulation.
Fift h, exogenous ES cells become incorporated into the appropriate tissues of the egg cylinder as it develops in vitro. Together, these results indicate that this new in-vitro culture / imaging system provides a reliable in vitro platform that recapitulates development in the uterus and enables us to follow the step-wise development of AP polarity in relation to egg cylinder morphogenesis. Th e future use of this platform should allow further characterisation of the cel-lular interactions between diff erent lineages as the blastocyst trans-forms into the egg cylinder.
Th e ability to culture mouse embryos on collagen-coated poly-acrylamide matrices enabled us to follow the dynamics of AVE formation by time-lapse confocal microscopy. We show that the fi rst cells to express Cerl-GFP develop in the inner cell mass of the pre-implantation blastocyst, but that this expression is only transient. Cerl expression becomes again evident in the primitive endoderm as the blastocyst ‘ implants ’ , that is, aft er the trophectoderm cells have spread out on the culture substrate and the blastocyst is fl attened. We show that this early expression continues, but also additional cells start to express the AVE markers. Typically, these two, ‘ older ’ and ‘ younger ’ AVE domains become consolidated by the time the egg cylinder emerges. Th ese fi ndings are in agreement with, and provide an explanation to, our previous snap-shot observations 15 and also support a recent report indicating that cells which start to express another AVE marker, Left y1, in the implanting blastocyst participate in establishing the AVE 13 . As confi rmation of this, our analyses of fi xed embryos that develop either in vivo or in vitro indi-cate that the expression domains of Cerl and Left y1 are coincident and lie opposite the posterior expression domain of Brachyury . It is important to note that, although we show that Cerl-GFP expres-sion is initiated in individual blastocyst cells, it remains unknown whether these cells arise stochastically or in relation to some feature of the blastocyst ’ s development, an interesting topic for future detailed investigation.
00:00 00:30 01:00 01:30
DIC
-GF
P M
erge
GF
P
b
0
10
20
30
40
50
0 1 2 3 4 5 6 7 8 9 10
Cer
l-GF
P in
tens
ity:a
rbitr
ary
units
Cell sequencePioneer Follower
In vivo
11.21.41.61.8
22.22.42.62.8
3
0 20 60 80 100 120
In vivo In vitrocultured
Elo
ngat
ion
cell
leng
th:w
idth
ivcc
Pio
neer
Pio
neer
Fol
low
er
Fol
low
er
00:00 00:30 01:3001:0000:00 00:30 01:3001:00d
e
0
0.5
1
1.5
2
2.5
3
00:00 00:30 01:00 01:30
PioneerFollower
Elo
ngat
ion
cell
leng
th:w
idth
rat
io
Hours:minutes
00:00 00:30 01:00 01:30
Hours:minutes
Elo
ngat
ion
cell
leng
th:w
idth
rat
io
0
0.5
1
1.5
2
2.5
3
aIn vivo
PioneerFollower
Expression intensity: % of maximumn=16 cells, 64 frames
40
Figure 6 | The most anterior cell expressing the highest levels of Cerl-GFP leads migration of the Cerl-GFP-expressing cells in a collective domain. ( a ) The putative leading AVE cell (red arrow) in an E5.5 embryo extends protrusions towards the prospective anterior region and migrates over the 2 h of
imaging shown ( Supplementary Movie 7 ). ( b ) Fluorescence intensity levels (arbitrary units) of Cerl-GFP-expressing cells in six E5.5 embryos. The leading
AVE cell (number 1) is always amongst the strongest Cerl-GFP-expressing cells. Cerl-GFP-expressing cell shape was monitored over the course of 2 h
of live imaging in freshly collected ‘ in vivo ’ embryos ( c ) and in vitro -cultured embryos. Scale bars represent 20 μ m. ( d ) In each case — examples of strong
Cerl-GFP-expressing leading AVE cells and weaker-expressing followers are shown. Following repeated tracings of cell shape, rectangles of best fi t were
constructed around the cell boundaries for all four time points over the 2-h period. ( e ) Each set of rectangles represents the changing cell shape over
time — the average length to width ratio was calculated and plotted against the average intensity of Cerl-GFP expression for each cell. A total of 16 cells
were analysed over 64 time points.

ARTICLE
8
NATURE COMMUNICATIONS | DOI: 10.1038/ncomms1671
NATURE COMMUNICATIONS | 3:673 | DOI: 10.1038/ncomms1671 | www.nature.com/naturecommunications
© 2012 Macmillan Publishers Limited. All rights reserved.
Once the AVE domains have consolidated at the distal tip of the egg cylinder, we fi nd that cells that express the AVE markers at higher levels than their neighbours lead the AVE migration process. Th is result is in agreement with recent fi ndings that AVE cells are migrating actively rather than being pushed by other VE cells 26,27 . Th is is also in accord with studies showing that embryos carrying mutations in genes essential for cell migration exhibit a defective AVE movement 28 . Our results indicate that the integrity of cells that lead AVE migration and their surrounding community is required for the migratory process. Th is is because ablation of both the leading and following cells prevents AVE migration and expan-sion. In other words, our results suggest that AVE migration is a collective process and requires the group of AVE cells to act as a migratory community. However, we show that ablation of a central
cell within the AVE domain and expressing its markers less inten-sively still permits considerable AVE migration and expansion. Taken together, these results point to two broad classes of cells within the AVE, one group that leads to the migration and another that might be carried along by this process. Th ese fi ndings echo a recent report, which showed that following genetic ablation of Left y1-expressing cells soon aft er embryo implantation, the AVE was formed but failed to migrate 13 . Th erefore, these two studies that analyse the expression of diff erent AVE markers in embryos cultured either in vitro or in utero each suggest that the anterior migration of the AVE is guided by an independent sub-set of AVE cells.
Although Cerl-GFP expression is an excellent marker of the AVE, Cerl expression on its own is not essential for the develop-ment of the AP axis 29 , which requires both Cerl and Left y1 acting together 30 . At present, we cannot determine unequivocally whether the diff ering cellular behaviour we assign to AVE cells is a specifi c consequence of diff erential levels of Cerl expression or rather a more general property of cells marked in this way. Several pos-sibilities could account for why the highest Cerl-expressing cells might act as pioneers in AVE migration. It might be that, within the AVE domain, these are the cells that are the most responsive to an attractant or cue. In such a case, the leading AVE cells would be passive responders to external signals rather than having their pioneer properties determined by the high level of Cerl expression. Moreover, it is possible that the asymmetry within the AVE would result in its unidirectional migration in response to a symmetric signal originating, for example, from the ExE 8 – 10,31,32 . Alternatively, by expressing the highest levels of Cerl and Left y1, which are Nodal antagonists, the leading AVE cells and their immediate neighbours would suppress Nodal activity in their vicinity, thus facilitating a stepwise migration. Any asymmetry in the levels of Cerl expression could be reinforced by such a process and migration would proceed unidirectionally. Understanding whether these or other mechanisms drive AVE migration will require gaining greater understanding of the cell biology of these processes. Th e accessibilty of embryos at this stage of development for experimentation opens up real possibilities for achieving such goals.
Methods Embryo collection, culture and staining . F1 (C57BL / 6XCBA) blastocysts from either wild-type or appropriate transgenic matings (as indicated in the text) were collected into M2 medium with 4 mg ml − 1 of bovine serum albumin as described previously 15,20 . Zona pellucidae were removed by treatment with acidic Tyrode ’ s solution as described previously 15 . Aft er recovery, embryos were were seeded in single wells of 24-well plates in 400 μ l of in-vitro culture medium 1 (IVC1: CMRL-1066 ( Invitrogen ) supplemented with 200 mM L-glutamine ( Invitrogen ), 100 mM sodium pyruvate ( Invitrogen ), penicillin and streptomycin ( Invitrogen ), and 20 % fetal calf serum ( FCS , Invitrogen ) either in plastic tissue culture dishes or on poly-acrylamide matrices (see below). For plastic tissue culture dishes, drops of 5 μ l were used. On the evening of day 2, the medium was replaced by mouth pipetting with in-vitro culture medium 2 (IVC2), which is identical to IVC1, except for the serum component for which we used 20 % human cord serum ( HCS, Addenbrokes Hospital , Cambridge, UK). IVC2 media was replaced on a daily basis for the remainder of the culture. For post-implantation studies, E5.5 embryos were collected from F1 females mated with Cer-l-GFP males and cultured in IVC2. All embryo cultures were performed at 37 ° C in a 5 % CO 2 atmosphere. Th e fl uorescent in-situ hybridisation was performed as described before 33 . Immunostaining was carried out as previously described 15 .
Polyacrylamide gels for embryo culture . Polyacrylamide gels of characterised surface stiff ness, covalently bonded to glass substrates, have been used to allow the mouse embryo culture in well plates and petridishes, and simultaneous time-lapse confocal imaging. Circular grade 1 borosilicate glass coverslips ( Menzel-Gl ä ser, Th ermo Scientifi c ) were cleaned in a 0.1-M sodium hydroxide solution ( > 98 % , Sigma-Aldrich ). Successive dip-coating in APTMS (97 % , Sigma-Aldrich ) and 0.5 % glutaraldehyde solutions ( ~ 50 % solution, Fluka / Biochemika, Sigma-Aldrich ) were then carried out, with wash-steps in distilled water aft er each APTMS and glutaraldehyde treatment. Polyacrylamide gel solutions were made containing varying concentrations of N , N ′ -methylenebisacrylamide solution (2 % in water, Fluka / Biochemika, Sigma-Aldrich ), from 0.02 to 0.5 % , and 10 % acrylamide solu-tion (40 % in water), Fluka / Biochemika, Sigma-Aldrich . Polyacrylamide gel was
a
30
25
20
15
10
5
0
Cer
l-GF
P c
ells
Control+16 h
Ablated+16 h
bBefore ablation
“Fol
low
er”
“Cen
tral
”“A
head
”C
ontr
ol
After ablation GFP projected GFP/DIC merge
+ 16 h
Control Ablated
Figure 7 | AVE migration requires leading AVE cells. ( a ) Projected
confocal images of control embryos (left panels) and an embryo in
which the leading AVE cell was ablated by laser-irradiation (right panels,
Supplementary Movie 8 ) 16 h after ablation. Migration of the Cerl-GFP
expressing cells is prevented when the leading AVE cell is ablated.
Numbers of Cerl-GFP expressing cells in control and leading cell-ablated
embryos were quantifi ed 16 h after ablation: Ablation of leading cells
prevents expansion of the Cerl-GFP-expressing domain. ( b ) Consequences
of cell ablation for AVE migration and expansion: cell ablation immediately
behind the leading cell, in the central section of the AVE, and in a region
of visceral endoderm anterior to the AVE. Images of Cerl-GFP expression
are taken immediately before and after ablation, and 16 h later. Scale bars
represent 100 μ m.

ARTICLE
9
NATURE COMMUNICATIONS | DOI: 10.1038/ncomms1671
NATURE COMMUNICATIONS | 3:673 | DOI: 10.1038/ncomms1671 | www.nature.com/naturecommunications
© 2012 Macmillan Publishers Limited. All rights reserved.
polymerised using 10 % ammonium persulphate solution (98 % , Sigma-Aldrich ) in distilled water (1:167 volume), and NNN ′ -M-Tetramethylethyldiamine ( TEMED ; Sigma-Aldrich; 1:250 volume). Initial screening of embryo attachment was carried out using gels varying in N ′ N ′ -methylenebisacrylamide concentration, but data reported is from embryos cultured on hydrogels of 0.3 % N ′ N ′ -methylenebisacry-lamide concentration. Polyacrylamide surfaces were coated with the extracellular matrix component, collagen. A 0.2 mg ml − 1 water solution of type I rat-tail collagen (9.92 mg ml − 1 , BD Bioscience ) was attached to the polyacrylamide gels using a 0.5 mg ml − 1 in water solution of ultraviolet light-activated heterobifunctional molecule, sulfo-SANPAH ( Pierce Biotechnology ).
Th e stainless steel mould for moulding gels into the correct shape was a proprietary design and manufactured by the Precision Manufacturing Centre (University of Nottingham). Th e mould was fabricated from 6-mm thick stainless steel. Embryos were cultured in one large cylindrical well in the centre of the gel (1130 μ m dia meter, 300 μ m height). All wells have a base thickness from 100 μ m up to 500 μ m.
To increase the imaging resolution at × 40 magnifi cation, 24-well glass bottom well plates were used ( PAA Laboratories GmbH , Austria). Th ese imaging plates were already pre-functionalised with amino groups. Functionalising the imaging surface of the wells with polyacrylamide gels was carried out by applying 100 μ l of 0.5 % glutaraldehyde solution, then washing with distilled water. A volume of 10 μ l of polyacrylamide gel solution was then applied to the imaging surface in the well. A grade 1 circular glass coverslip of 12-mm diameter ( Menzel-Gl ä ser, Th ermo Scientifi c ) was then placed on top of the gel solution. Once the gel had cured, the coverslip was removed. Th e method of functionalisation of the polyacrylamide gels in well plates with type I rat-tail collagen is the same as for individual gels.
Time-lapse confocal imaging . Time-lapse imaging during in vitro culture and following laser ablation of selected cells (see below) was performed using a confocal spinning-disc microscopy system ( Intelligent Imaging Solutions ). Confocal images were acquired with a QuantEM:512SC camera ( Photometrics ) and wide-fi eld images on the same microscope with a CoolSnapHQ camera ( Photometrics ). Objectives used were a × 20 Air EC Plan Neofl uar, NA 0.5 , and a × 40 Air EC Plan Neofl uar, NA 0.75 ( Zeiss ). Image stacks with 3.5 or 5 μ m z-planes were captured every 12 – 30 min, scanning up to 100 μ m up to the pre-egg cylinder stage, and up to 150 μ m in the egg cylinder stage. Imaging had to be interrupted for changing medium and adjusting to the best focal plane and therefore, the data provided from time-lapse observations are oft en a compilation of several captures. Image process-ing and analysis was performed with Slidebook 5.0.0.20 or superior Image J and Adobe Photoshop.
Laser ablation . Elimination of the selected cell by laser irradiation was performed with an Olympus inverted FV1000 microscope with the 405-nm laser irradiating for 500 ms in the selected area. Confocal images of embryos were captured before and aft er ablation, and following 16 h of culture using the same system. Where indicated, fl uorescence intensity was measured using ImageJ soft ware.
Animals . Animals were maintained in the Animal Facility of Gurdon Institute at 12:12 light cycle and provided with food and water ad libitum . All experiments were conducted in compliance with Home Offi ce regulations.
References 1 . Th omas , P . Q . , Brown , A . & Beddington , R . S . Hex: a homeobox gene revealing
peri-implantation asymmetry in the mouse embryo and an early transient marker of endothelial cell precursors . Development 125 , 85 – 94 ( 1998 ).
2 . Beddington , R . S . & Robertson , E . J . Axis development and early asymmetry in mammals . Cell 96 , 195 – 209 ( 1999 ).
3 . Weber , R . J . , Pedersen , R . A . , Wianny , F . , Evans , M . J . & Zernicka-Goetz , M . Polarity of the mouse embryo is anticipated before implantation . Development 126 , 5591 – 5598 ( 1999 ).
4 . Srinivas , S . , Rodriguez , T . , Clements , M . , Smith , J . C . & Beddington , R . S . Active cell migration drives the unilateral movements of the anterior visceral endoderm . Development 131 , 1157 – 1164 ( 2004 ).
5 . Brennan , J . et al. Nodal signalling in the epiblast patterns the early mouse embryo . Nature 411 , 965 – 969 ( 2001 ).
6 . Robertson , E . J . , Norris , D . P . , Brennan , J . & Bikoff , E . K . Control of early anterior-posterior patterning in the mouse embryo by TGF-beta signalling . Philos. Trans. R. Soc. Lond. B Biol. Sci. 358 , 1351 – 1357 ; discussion 1357 ( 2003 ).
7 . Yamamoto , M . et al. Antagonism between Smad1 and Smad2 signaling determines the site of distal visceral endoderm formation in the mouse embryo . J Cell Biol 184 , 323 – 334 ( 2009 ).
8 . Rodriguez , T . A . , Srinivas , S . , Clements , M . P . , Smith , J . C . & Beddington , R . S . Induction and migration of the anterior visceral endoderm is regulated by the extra-embryonic ectoderm . Development 132 , 2513 – 2520 ( 2005 ).
9 . Richardson , L . , Torres-Padilla , M . E . & Zernicka-Goetz , M . Regionalised signalling within the extraembryonic ectoderm regulates anterior visceral endoderm positioning in the mouse embryo . Mech. Dev. 123 , 288 – 296 ( 2006 ).
10 . Soares , M . L . et al. Functional studies of signaling pathways in peri-implantation development of the mouse embryo by RNAi . BMC Dev. Biol. 5 , 28 ( 2005 ).
11 . Soares , M . L . , Torres-Padilla , M . E . & Zernicka-Goetz , M . Bone morphogenetic protein 4 signaling regulates development of the anterior visceral endoderm in the mouse embryo . Dev. Growth Diff er. 50 , 615 – 621 ( 2008 ).
12 . Takaoka , K . et al. Th e mouse embryo autonomously acquires anterior-posterior polarity at implantation . Dev Cell 10 , 451 – 459 ( 2006 ).
13 . Takaoka , K . , Yamamoto , M . & Hamada , H . Origin and role of distal visceral endoderm, a group of cells that determines anterior-posterior polarity of the mouse embryo . Nat. Cell. Biol. 13 , 743 – 752 ( 2011 ).
14 . Mesnard , D . , Filipe , M . , Belo , J . A . & Zernicka-Goetz , M . Th e anterior-posterior axis emerges respecting the morphology of the mouse embryo that changes and aligns with the uterus before gastrulation . Curr. Biol. 14 , 184 – 196 ( 2004 ).
15 . Torres-Padilla , M . E . et al. Th e anterior visceral endoderm of the mouse embryo is established from both preimplantation precursor cells and by de novo gene expression aft er implantation . Dev. Biol. 309 , 97 – 112 ( 2007 ).
16 . Hsu , Y . C . Diff erentiation in vitro of mouse embryos beyond the implantation stage . Nature 239 , 200 – 202 ( 1972 ).
17 . Hsu , Y . C . Diff erentiation in vitro of mouse embryos to the stage of early somite . Dev. Biol. 33 , 403 – 411 ( 1973 ).
18 . Hsu , Y . C . In vitro development of individually cultured whole mouse embryos from blastocyst to early somite stage . Dev. Biol. 68 , 453 – 461 ( 1979 ).
19 . Tachi , C . Partial characterization of macromolecular components in fetal bovine serum required for development of mouse blastocysts cultured in vitro . Dev. Growth Diff er. 34 , 69 – 77 ( 1992 ).
20 . Perea-Gomez , A . et al. Regionalization of the mouse visceral endoderm as the blastocyst transforms into the egg cylinder . BMC Dev. Biol. 7 , 96 ( 2007 ).
21 . Engler , A . J . , Sen , S . , Sweeney , H . L . & Discher , D . E . Matrix elasticity directs stem cell lineage specifi cation . Cell 126 , 677 – 689 ( 2006 ).
22 . Hadjantonakis , A . K . & Papaioannou , V . E . Dynamic in vivo imaging and cell tracking using a histone fl uorescent protein fusion in mice . BMC Biotechnol. 4 , 33 ( 2004 ).
23 . Yeom , Y . I . et al. Germline regulatory element of Oct-4 specifi c for the totipotent cycle of embryonal cells . Development 122 , 881 – 894 ( 1996 ).
24 . Eakin , G . S . & Hadjantonakis , A . K . Production of chimeras by aggregation of embryonic stem cells with diploid or tetraploid mouse embryos . Nat. Protoc. 1 , 1145 – 1153 ( 2006 ).
25 . Beddington , R . S . & Robertson , E . J . An assessment of the developmental potential of embryonic stem cells in the midgestation mouse embryo . Development 105 , 733 – 737 ( 1989 ).
26 . Stuckey , D . W . et al. Coordination of cell proliferation and anterior-posterior axis establishment in the mouse embryo . Development 138 , 1521 – 1530 ( 2011 ).
27 . Trichas , G . et al. Nodal dependent diff erential localisation of dishevelled-2 demarcates regions of diff ering cell behaviour in the visceral endoderm . PLoS Biol. 9 , e1001019 ( 2011 ).
28 . Migeotte , I . , Omelchenko , T . , Hall , A . & Anderson , K . V . Rac1-dependent collective cell migration is required for specifi cation of the anterior-posterior body axis of the mouse . PLoS Biol. 8 , e1000442 ( 2010 ).
29 . Belo , J . A . et al. Cerberus-like is a secreted factor with neutralizing activity expressed in the anterior primitive endoderm of the mouse gastrula . Mech. Dev. 68 , 45 – 57 ( 1997 ).
30 . Perea-Gomez , A . et al. Nodal antagonists in the anterior visceral endoderm prevent the formation of multiple primitive streaks . Dev. Cell 3 , 745 – 756 ( 2002 ).
31 . Mesnard , D . , Guzman-Ayala , M . & Constam , D . B . Nodal specifi es embryonic visceral endoderm and sustains pluripotent cells in the epiblast before overt axial patterning . Development 133 , 2497 – 2505 ( 2006 ).
32 . Mesnard , D . & Constam , D . B . Imaging proprotein convertase activities and their regulation in the implanting mouse blastocyst . J. Cell. Biol. 191 , 129 – 139 ( 2010 ).
33 . Jedrusik , A . et al. Role of Cdx2 and cell polarity in cell allocation and specifi cation of trophectoderm and inner cell mass in the mouse embryo . Genes Dev. 22 , 2692 – 2706 ( 2008 ).
Acknowledgements We are grateful to Professor David Glover for his comments on the manuscript, Professor
Azim Surani and Caroline Lee for kindly providing Oct4 Δ PE-GFP mice, and Harry
Leitch for providing the dsRed ES cells. F. B. holds a Newton International Fellowship
from the Royal Society, which supported this work. Th is work was supported by a
Wellcome Trust Senior Fellowship to M. Z. G.
Author contributions S. A. M. performed experiments on AVE migration, analysed data and assisted in the
interpretation of these results. S. G. developed the embryo culture method, and together
with F. B., cultured and experimented on the embryos from pre- to post-implantation
stages and assisted in the interpretation of the results. L. B., M. A. and K. M. S. designed

ARTICLE
10
NATURE COMMUNICATIONS | DOI: 10.1038/ncomms1671
NATURE COMMUNICATIONS | 3:673 | DOI: 10.1038/ncomms1671 | www.nature.com/naturecommunications
© 2012 Macmillan Publishers Limited. All rights reserved.
substrates for the embryo culture, and S. N. P. built the gels and demonstrated their
applicability. K. M. S. assisted in preparing the manuscript. M. Z. G. designed the
experiments, interpreted the results and wrote the manuscript.
Additional information Supplementary Information accompanies this paper at http://www.nature.com/
naturecommunications
Competing fi nancial interests: Th e authors declare no competing fi nancial interests.
Reprints and permission information is available online at http://npg.nature.com/
reprintsandpermissions/
How to cite this article: Morris, S. A. et al. Dynamics of anterior – posterior
axis formation in the developing mouse embryo. Nat. Commun. 3:673 doi:
10.1038 / ncomms1671 (2012).
License: Th is work is licensed under a Creative Commons Attribution-NonCommercial-
Share Alike 3.0 Unported License. To view a copy of this license, visit http://
creativecommons.org/licenses/by-nc-sa/3.0/


![[Posterior cortical atrophy]](https://static.fdokumen.com/doc/165x107/6331b9d14e01430403005392/posterior-cortical-atrophy.jpg)