
Correlation between the dioptric power, astigmatism and surface shape of the anterior and posterior...
10
Correlation between the dioptric power, astigmatism and surface shape of the anterior and posterior corneal surfaces David Mas 1 , Julian Espinosa 1 , Begon ˜ a Domenech 1 , Jorge Perez 1 , Henryk Kasprzak 2 and Carlos Illueca 1 1 Department of Optica, Universidad de Alicante, c/ Alicante, s.n. 03690, San Vicente del Raspeig, Alicante, Spain, and 2 Institute of Physics, Wroclaw University of Technology, Wybrzeze Wyspianskiego 27, Wroclaw, Poland Abstract A knowledge of the shape of the cornea is of major importance for the planning and monitoring of surgery, and for the correct diagnosis of corneal diseases. Many authors have studied the geometry of the second corneal surface in the central region and it has been stated that there is a high correlation between the central radii of curvature and asphericities of the two corneal surfaces. In this work we extend this study to a larger, central, 6-mm diameter of the cornea. Surface height data, obtained with an Oculus Pentacam from 42 eyes from 21 subjects, were analysed to yield surface power vectors. Corneal heights of both surfaces were also decomposed into low-order Zernike polynomials and the correlations between each of the power vectors and low-order Zernike coefficients for the two surfaces were studied. There was not only a strong correlation between spherical powers and Zernike defocus coefficients, but also between the astigmatic components. The correspondence between the astigmatisms in both surfaces found here can be of the utmost importance in planning optical surgery, since perfect spherical ablation of the first surface does not assure total correction of corneal astigmatism. Keywords: cornea, pachymetry, Scheimpflug camera, Zernike polynomials Introduction The principal refracting element and contributor to the aberrations of the human eye is the cornea. Modelling of the refraction in the eye therefore requires an accurate description of the anterior and the posterior corneal surfaces. Some eye models treat the cornea as a single refracting surface which separates air (n= 1) from the aqueous humour with an equivalent keratometric index n k = 1.3375 (Guirao and Artal, 2000). Such a simple approach has several problems. In particular, the typical keratometric index is too high and results in an overestimation of the corneal optical power (Dubbelman et al., 2006; Espin- osa et al., 2007). Moreover, although the second corneal surface only contributes to a 10% of the total refractive power of the eye, a precise knowledge of its morphology is needed for the correct diagnosis and monitoring of corneal diseases or surgical inter- ventions. Several groups have studied the relationship between the anterior and posterior corneal surfaces. Edmund (1994), Garner et al. (1997) and Lam and Douthwaite (2000) found a high correlation between the two surface curvatures. Dubbelman et al. (2002), using Scheimpflug photography, found a clear correlation between anterior and posterior corneal asphericities. Dubbelman et al. (2007) went on to explore the contribution of the posterior surface to the corneal coma aberration. Age- related changes in corneal biometry were studied by Dubbelman et al. (2007) and Atchison et al. (2008), who also compared the curvature radius and astigmatism of the two corneal surfaces. O P O 6 3 2 B Dispatch: 31.12.08 Journal: OPO CE: Krishna Sarma Journal Name Manuscript No. Author Received: No. of pages: 8 PE: Mahendrakumar Received: 8 September 2008 Revised form: 12 November 2008 Accepted: 12 December 2008 Correspondence and reprint requests to: David Mas. Tel.: +34 96 59 03400; Fax: +34 96 59 03464. E-mail address: [email protected] Ophthal. Physiol. Opt. 2008 29: 1–8 ª 2008 The Authors. Journal compilation ª 2008 The College of Optometrists doi: 10.1111/j.1475-1313.2008.00632.x 1 2 3 4 5 6 7 8 9 10 11 12 13 14 15 16 17 18 19 20 21 22 23 24 25 26 27 28 29 30 31 32 33 34 35 36 37 38 39 40 41 42 43 44 45 46 47 48 49 50 51 52 53 54 55
-
Upload
independent -
Category
Documents
-
view
5 -
download
0
Transcript of Correlation between the dioptric power, astigmatism and surface shape of the anterior and posterior...

Correlation between the dioptric power,astigmatism and surface shape of the anteriorand posterior corneal surfaces
David Mas1, Julian Espinosa1, Begona Domenech1, Jorge Perez1,Henryk Kasprzak2 and Carlos Illueca1
1Department of Optica, Universidad de Alicante, c/ Alicante, s.n. 03690, San Vicente del Raspeig,
Alicante, Spain, and 2Institute of Physics, Wroclaw University of Technology, Wybrzeze
Wyspianskiego 27, Wroclaw, Poland
Abstract
A knowledge of the shape of the cornea is of major importance for the planning and monitoring of
surgery, and for the correct diagnosis of corneal diseases. Many authors have studied the geometry
of the second corneal surface in the central region and it has been stated that there is a high
correlation between the central radii of curvature and asphericities of the two corneal surfaces. In this
work we extend this study to a larger, central, 6-mm diameter of the cornea. Surface height data,
obtained with an Oculus Pentacam from 42 eyes from 21 subjects, were analysed to yield surface
power vectors. Corneal heights of both surfaces were also decomposed into low-order Zernike
polynomials and the correlations between each of the power vectors and low-order Zernike
coefficients for the two surfaces were studied. There was not only a strong correlation between
spherical powers and Zernike defocus coefficients, but also between the astigmatic components. The
correspondence between the astigmatisms in both surfaces found here can be of the utmost
importance in planning optical surgery, since perfect spherical ablation of the first surface does not
assure total correction of corneal astigmatism.
Keywords: cornea, pachymetry, Scheimpflug camera, Zernike polynomials
Introduction
The principal refracting element and contributor to
the aberrations of the human eye is the cornea.
Modelling of the refraction in the eye therefore
requires an accurate description of the anterior and
the posterior corneal surfaces. Some eye models treat
the cornea as a single refracting surface which
separates air (n = 1) from the aqueous humour with
an equivalent keratometric index nk = 1.3375 (Guirao
and Artal, 2000). Such a simple approach has several
problems. In particular, the typical keratometric index
is too high and results in an overestimation of the
corneal optical power (Dubbelman et al., 2006; Espin-
osa et al., 2007). Moreover, although the second
corneal surface only contributes to a 10% of the
total refractive power of the eye, a precise knowledge
of its morphology is needed for the correct diagnosis
and monitoring of corneal diseases or surgical inter-
ventions.
Several groups have studied the relationship between
the anterior and posterior corneal surfaces. Edmund
(1994), Garner et al. (1997) and Lam and Douthwaite
(2000) found a high correlation between the two surface
curvatures. Dubbelman et al. (2002), using Scheimpflug
photography, found a clear correlation between anterior
and posterior corneal asphericities. Dubbelman et al.
(2007) went on to explore the contribution of the
posterior surface to the corneal coma aberration. Age-
related changes in corneal biometry were studied by
Dubbelman et al. (2007) and Atchison et al. (2008), who
also compared the curvature radius and astigmatism of
the two corneal surfaces.
O P O 6 3 2 B Dispatch: 31.12.08 Journal: OPO CE: Krishna Sarma
Journal Name Manuscript No. Author Received: No. of pages: 8 PE: Mahendrakumar
Received: 8 September 2008
Revised form: 12 November 2008
Accepted: 12 December 2008
Correspondence and reprint requests to: David Mas.
Tel.: +34 96 59 03400; Fax: +34 96 59 03464.
E-mail address: [email protected]
Ophthal. Physiol. Opt. 2008 29: 1–8
ª 2008 The Authors. Journal compilation ª 2008 The College of Optometrists doi: 10.1111/j.1475-1313.2008.00632.x
1
2
3
4
5
6
7
8
9
10
11
12
13
14
15
16
17
18
19
20
21
22
23
24
25
26
27
28
29
30
31
32
33
34
35
36
37
38
39
40
41
42
43
44
45
46
47
48
49
50
51
52
53
54
55

The existence of a strong correlation between the
shapes of the two corneal surfaces in healthy eyes is not
surprising. In absence of pathologies or external forces,
the growth of the corneal tissue should be approxi-
mately uniform. Our hypothesis is that, in normal
circumstances, the shape of one corneal surface is
transferred to the other one and major geometrical
features describing the first surface will also be found on
the second surface. As a consequence of this, in the
presence of astigmatism, both surfaces must be astig-
matic and their asymmetry must also be highly corre-
lated. Following this idea, Oshika et al. (1998) evaluated
the regular and irregular astigmatism of the posterior
surface and correlated these data with those for the
anterior surface. They found that there exists a strong
correlation between both surfaces and that the non-
spherical components of the second surface are not
negligible. Lam and Douthwaite (2000) compared the
curvature radii of the vertical and horizontal meridians
of both corneal surfaces and found a strong correlation
between them. Unfortunately, these authors did not
explicitly describe the refractive state of their subjects:
according to their results we guess that they limited their
analysis to normal emmetropic eyes.
It can be seen that several past studies have analyzed
the relationship between the corneal surfaces. However,
there are two main drawbacks to existing work. First,
the majority of studies have been limited to curvature
values in the central cornea or to a small number of
meridians, so that a significant area of the corneal
surface was omitted from the analysis. The second
drawback deals with the statistical analysis of the data.
Many of the cited works obtained averaged values over
all the population under study, thus giving reference
values for curvature and astigmatism of the corneal
surfaces. We know that the influence of the second
surface on the total optical power is low, and its effect
on total astigmatism is almost negligible. Moreover,
corneal variability regarding astigmatism is large
enough to mask the effects of the second surface. These
combined circumstances – low average values and large
intersubject variability – may mask individual variations
and hence fail to yield evidence of shape correspondence
between the corneal surface geometries of individual
eyes.
In this work we analyze correlations between shape
descriptors of the first and second corneal surfaces
within a natural pupil size for individual subjects.
Measurements were taken with a commercial Sche-
impflug camera (Oculus Pentacam1 ) Both anterior and
posterior surfaces are reconstructed from corrected
data. We have based our analysis on the comparison of
spherical and astigmatic descriptors of the surfaces,
such as power vector and Zernike coefficients. We
show that first- and second-surface coefficients are
linearly correlated. This permits modelling of the
second surface by direct measurement of the first
surface.
Subjects and methods
Subjects
Twenty-one adult emmetropic and ametropic subjects
without ocular pathology were selected. Contact lens
users and patients having undergone ocular surgery
were excluded, as well as any irregular corneal
astigmatism. Subjects taking part in this study were
selected from staff and students of the School of
Optics and Optometry of the University of Alicante
who met the above selection criteria. We adhered to
the tenets of the Declaration of Helsinki during this
study. All participants were informed about the nature
and purpose of the study and all of them provided
informed consent.
Methods
Corneal measurements were taken with an Oculus
Pentacam. The Oculus Pentacam is a Scheimpflug
imaging system that allows measurement of 25 merid-
ians in 1 s and provides a three-dimensional model of
the eye�s anterior segment. The posterior corneal surface
and the anterior crystalline lens surface are calculated by
ray tracing, compensating the optical and geometrical
distortion of the system itself. Based on this model, the
system provides corneal pachymetry and the topogra-
phy of both corneal surfaces. Shankar et al. (2008) have
explored the reliability of this device in measuring the
anterior segment. The system allows ASCII files with
data from corneal elevation and point-to-point pachy-
metry to be exported. These were used for the recon-
struction of the first and second corneal surfaces.
Zernike polynomials for both surfaces were obtained
in polar coordinates (q, h) by using our own software
implemented on MATLABMATLAB. Sign and normalization follow
the convention suggested by the Optical Society of
America Standardization Committee (Thibos et al.,
2000):
Zmn ðq; hÞ ¼ Nm
n Rjmjn ðqÞ cosðmhÞ; if m � 0
Zmn ðq; hÞ ¼ �Nm
n Rjmjn ðqÞsinðmhÞ; if m<0
ð1Þ
being Nmn a normalization factor and, Rjmj
n ðqÞ the Zernikeradial polynomial, both given by:
Rjmjn ðqÞ¼
X
ðn�jmjÞ=2
s¼0
ð�1Þsðn�sÞ!s!½0:5ðnþjmjÞ�s�!½0:5ðn�jmjÞ�s�!q
n�2s
ð2Þ
2 Ophthal. Physiol. Opt. 2008 29: No. 1
ª 2008 The Authors. Journal compilation ª 2008 The College of Optometrists
1
2
3
4
5
6
7
8
9
10
11
12
13
14
15
16
17
18
19
20
21
22
23
24
25
26
27
28
29
30
31
32
33
34
35
36
37
38
39
40
41
42
43
44
45
46
47
48
49
50
51
52
53
54
55

Nmn ¼
ffiffiffiffiffiffiffiffiffiffiffiffiffiffiffiffiffiffiffi
2ðnþ 1Þð1þ dm0Þ
s
ð3Þ
We also obtained and compared the power vectors for
the wavefronts emerging from the first and second
surfaces (Thibos et al., 2002; Iskander et al., 2007), in
particular the spherical and astigmatic components M,
J0 and J45:
PV k mð Þ¼ 1
r2p
X
k
n¼2
ffiffiffiffiffiffiffiffiffiffiffiffiffiffi
nþ1
1þdm0
s
�1ð Þn�22 nþ2
2
� �
!
2mj j�3
2n�22
� �
!cmn
" #
Mk¼PV k 0ð Þ¼ 1
r2p2
ffiffiffi
3p
c02�6ffiffiffi
5p
c04þ12ffiffiffi
7p
c06þ���� �
J k0 ¼PV k 2ð Þ¼ 1
r2p
ffiffiffi
6p
c22�3ffiffiffiffiffi
10p
c24þ6ffiffiffiffiffi
14p
c26þ���� �
J k45¼PV k �2ð Þ¼ 1
r2p
ffiffiffi
6p
c�22 �3
ffiffiffiffiffi
10p
c�24 þ6
ffiffiffiffiffi
14p
c�26 þ���
� �
ð4Þ
where cnm denotes the Zernike coefficient of radial order
n and azimuthal frequency m and rp is the pupil radius
dm0 is the Kronecker delta function and k is the
maximum order of the polynomical decomposition. In
our case we extended the analysis up to k = 7. Notice
that spherical and astigmatic components do not corre-
spond with the typical optometric sphere and cylinder,
since they sum all spherical-like and astigmatic-like
components.M, J0 and J45 take into account all the
Zernike coefficients of polynomials depending on q2, q2
cos (2h) and q2 sin (2h) respectively. Thus, the power
vectors take into account all the lower- and higher order
influences over spherical and astigmatism shapes.
We have taken the two corneal surfaces as indepen-
dent optical elements. We considered a planar wavefront
entering each surface and calculated the optical path up
to an exit plane, the distance between the input and
output planes being the same on both cases. Thus, for
the first surface we considered the refraction of a beam
passing from air (n = 1) to the inner cornea
(n = 1.376) and, for the second surface, the refraction
between cornea and aqueous humour (n = 1.336)
(Atchison and Smith, 2005). Thus we could determine
the correlation between the powers of the two sides of
the cornea and check the compensation effect that the
second surface had over the first.
A description based on power vectors allows the
correlation in optical power between the surfaces to be
explored. Nevertheless, as is evident from Equation (4),
the values obtained for both surfaces are affected by
higher-order aberrations. This can mask correspon-
dences between the basic surface shapes. Thus, it is also
useful to directly compare surface geometries instead of
optical powers. To do so we have compared the low-
order Zernike coefficients for both surfaces. Since high-
order (third-order and above) coefficients only describe
small imperfections in the surfaces, it is not reasonable
to expect as high a degree of correspondence between
the higher-order Zernike coefficients of first and second
corneal surface as for the lower-order coefficients. Thus,
in addition to power vectors we have extended our
analysis to include the defocus (c02) and astigmatism
coefficients (c�22 andc22). Since they are not proper shape
descriptors, we have also compared tilt coefficients
(c�11 andc11) due to the fact that they are very sensitive to
misalignments and can provide very useful information
about the corneal geometry.
We have used data from the 42 real corneas, 21 from
right eyes and 21 from left eyes. We took six different
measures from each cornea and used mean data in our
calculations. Data were obtained over the central 6-mm
diameter of the cornea. Statistics for individual eyes and
the whole set were calculated. In all mathematical
analyses for both eyes we set the positive direction of
our horizontal axis (0� semi-meridian) as the one
pointing nasally.
Results
The following figures show the correlations between the
values of the geometrical parameters describing the first
and second corneal surfaces. Each point in the graphs
corresponds the average values for each eye, as mea-
sured six times. We would like to remark that we are
only comparing parameters related to the principal
ammetropias, and the reliability of the Pentacam in
measuring such parameters has been shown to be good
(Shankar et al., 2008). Atchison et al. (2008) have some
criticisms of the reliability of Pentacam for determining
corneal surface shape. Our own experience suggests that
some parameters given by the Pentacam are not
accurate, but we did not find any problem with exported
data. Thus, we conclude that there are some bugs in the
calculation software, but have no reason to doubt the
measurements themselves.
In all the figures we distinguish between left and right
eyes. In many cases the statistics are very similar in both
eyes because of bilateral symmetry. We have summa-
rized results in the figures and captions by giving the
regression lines for the whole set (i.e. including both the
right and left eyes). In Table 1 we summarize the least-
squares regression line results for the separate right and
left eye data and for all eyes .
Figure 1 shows the M vector (see Equation 4) for the
eyes under study. First we can see that the back surface
compensates about 10% of the refractive power of the
front surface. Correspondence between both surfaces is
good, with a correlation coefficient r2 = 0.74.
Correlation between anterior and posterior corneal surfaces: D. Mas et al. 3
ª 2008 The Authors. Journal compilation ª 2008 The College of Optometrists
1
2
3
4
5
6
7
8
9
10
11
12
13
14
15
16
17
18
19
20
21
22
23
24
25
26
27
28
29
30
31
32
33
34
35
36
37
38
39
40
41
42
43
44
45
46
47
48
49
50
51
52
53
54
55

Figures 2 and 3 show the correlations between front
and back corneal surfaces for the J0 and J45 vectors.
These vectors represent the crossed-cylinder surface
astigmatisms in the 90/180 and 45/135 axes respectively.
Notice that J0 component has a good correspondence
between the first and the second surface although not as
good as that of the sphere component (Figure 1). The
J45 components, which generally have much smaller
magnitudes than their J0 counterparts, show poor
correlation, the r2 coefficient being very low. The p
value obtained for left and right eyes (p > 0.05) means
that correlation is not statistically significant (see
Table 1). Although correlation for the whole set is
significant (p < 0.01), we found that little information
can be obtained from this parameter.
As noted earlier, although power vectors in Equation
(4) adequately describe the optical performance of the
cornea, they do not describe the basic shape of the
Table 1. Linear fit values (y = ax + b) for all coefficients studied.
Left eye Right eye Both eyes
a b r2
a b r2
a b r2
M )0.12 0.01 0.70 )0.13 0.10 0.79 )0.13 0.06 0.74
J0 )0.13 0.18 0.50 )0.12 0.17 0.41 )0.13 0.17 0.49
J45 )0.08 0.01 0.23 )0.10 )0.01 0.20 )0.10 )0.00 0.23
c02 1.26 )2.85 0.90 1.23 0.77 0.87 1.25 )1.02 0.89
c�22 1.11 0.21 0.43 1.39 0.98 0.66 1.27 0.58 0.52
c22 1.37 )3.48 0.69 1.31 )3.62 0.76 1.34 )3.55 0.72
c�11 1.73 )7.69 0.36 2.04 )7.25 0.42 1.90 )7.26 0.52
c11 1.07 7.65 0.37 0.82 8.77 0.18 1.03 8.23 0.31
*c11 )0.82 4.54 0.06 )0.68 8.88 0.03 0.32 7.71 0.01
Values for the independent parameter b are given in dioptres (D) for the power vectors and microns (lm) for the Zernike coefficients. The
underlined results are not statistically significant (p-value > 0.01) while for all the others we have p < 0.01. The last row with (*) refers to the x-tilt
coefficients without the outlier points
Figure 1. Correspondence between the spherical powers of the first
and second corneal surfaces. The regression line is: y = )0.13x +
0.06; r2 = 0.74; p < 0.01.
Figure 2. Correspondence between the power vectors J0 of the first
and second corneal surfaces. The regression line is: y = )0.13x +
0.17; r2 = 0.49; p < 0.01.
Figure 3. Correspondence between power vectors J45 of the first
and second corneal surfaces. The regression line is: y = )0.10x )
0.00; r2 = 0.23; p < 0.01.
4 Ophthal. Physiol. Opt. 2008 29: No. 1
ª 2008 The Authors. Journal compilation ª 2008 The College of Optometrists
1
2
3
4
5
6
7
8
9
10
11
12
13
14
15
16
17
18
19
20
21
22
23
24
25
26
27
28
29
30
31
32
33
34
35
36
37
38
39
40
41
42
43
44
45
46
47
48
49
50
51
52
53
54
55
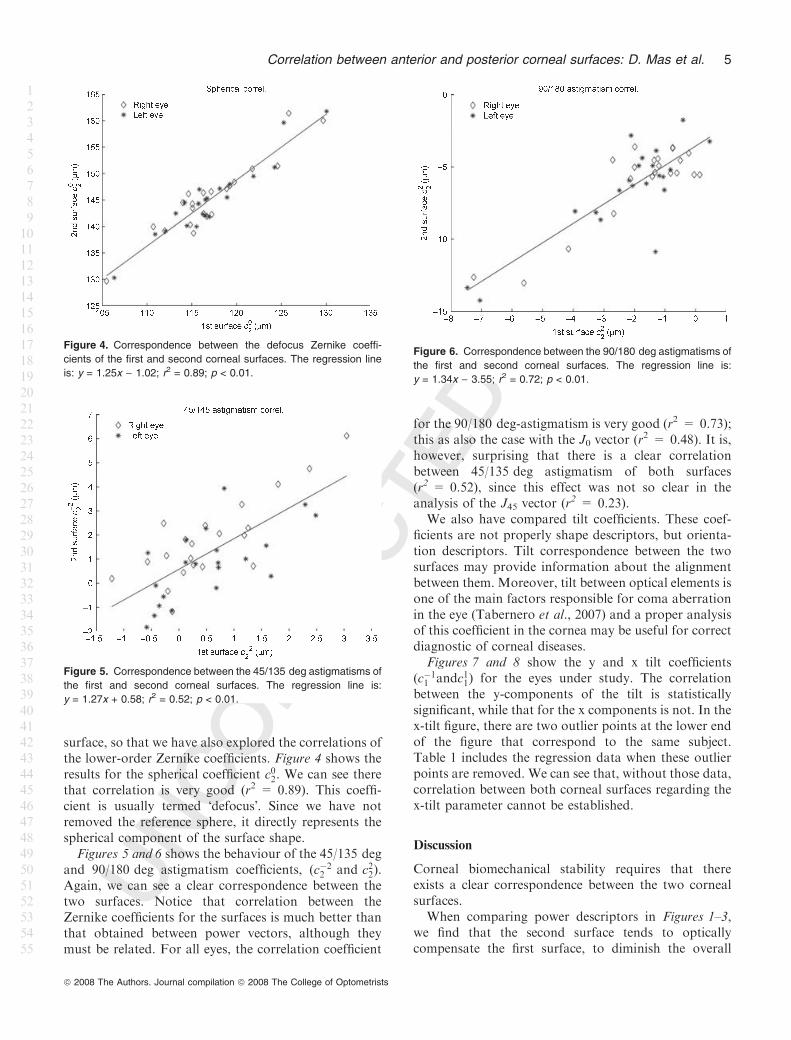
surface, so that we have also explored the correlations of
the lower-order Zernike coefficients. Figure 4 shows the
results for the spherical coefficient c02. We can see there
that correlation is very good (r2 = 0.89). This coeffi-
cient is usually termed �defocus�. Since we have not
removed the reference sphere, it directly represents the
spherical component of the surface shape.
Figures 5 and 6 shows the behaviour of the 45/135 deg
and 90/180 deg astigmatism coefficients, (c�22 and c22).
Again, we can see a clear correspondence between the
two surfaces. Notice that correlation between the
Zernike coefficients for the surfaces is much better than
that obtained between power vectors, although they
must be related. For all eyes, the correlation coefficient
for the 90/180 deg-astigmatism is very good (r2 = 0.73);
this as also the case with the J0 vector (r2 = 0.48). It is,
however, surprising that there is a clear correlation
between 45/135 deg astigmatism of both surfaces
(r2 = 0.52), since this effect was not so clear in the
analysis of the J45 vector (r2 = 0.23).
We also have compared tilt coefficients. These coef-
ficients are not properly shape descriptors, but orienta-
tion descriptors. Tilt correspondence between the two
surfaces may provide information about the alignment
between them. Moreover, tilt between optical elements is
one of the main factors responsible for coma aberration
in the eye (Tabernero et al., 2007) and a proper analysis
of this coefficient in the cornea may be useful for correct
diagnostic of corneal diseases.
Figures 7 and 8 show the y and x tilt coefficients
(c�11 andc11) for the eyes under study. The correlation
between the y-components of the tilt is statistically
significant, while that for the x components is not. In the
x-tilt figure, there are two outlier points at the lower end
of the figure that correspond to the same subject.
Table 1 includes the regression data when these outlier
points are removed. We can see that, without those data,
correlation between both corneal surfaces regarding the
x-tilt parameter cannot be established.
Discussion
Corneal biomechanical stability requires that there
exists a clear correspondence between the two corneal
surfaces.
When comparing power descriptors in Figures 1–3,
we find that the second surface tends to optically
compensate the first surface, to diminish the overall
Figure 4. Correspondence between the defocus Zernike coeffi-
cients of the first and second corneal surfaces. The regression line
is: y = 1.25x ) 1.02; r2 = 0.89; p < 0.01.
Figure 5. Correspondence between the 45/135 deg astigmatisms of
the first and second corneal surfaces. The regression line is:
y = 1.27x + 0.58; r2 = 0.52; p < 0.01.
Figure 6. Correspondence between the 90/180 deg astigmatisms of
the first and second corneal surfaces. The regression line is:
y = 1.34x ) 3.55; r2 = 0.72; p < 0.01.
Correlation between anterior and posterior corneal surfaces: D. Mas et al. 5
ª 2008 The Authors. Journal compilation ª 2008 The College of Optometrists
1
2
3
4
5
6
7
8
9
10
11
12
13
14
15
16
17
18
19
20
21
22
23
24
25
26
27
28
29
30
31
32
33
34
35
36
37
38
39
40
41
42
43
44
45
46
47
48
49
50
51
52
53
54
55

spherical power and astigmatism. Our results for the
correspondence between the spherical component agree
with those presented by Oshika et al. (1998), who give a
ratio of the magnitudes of posterior to anterior spherical
power equal to 0.136 ± 0.006, compared to our overall
value of 0.13. Our correlation coefficient is higher than
theirs, due perhaps to improvement in measuring
devices. In order to compare our regular astigmatism
with theirs, we have computed the mean values of the
first and second surface cylinders. In our case, the ratio
of posterior to anterior astigmatism is 0.33, while
Oshika et al. (1998) give an average result of 0.35.
Atchison et al. (2008) give compensation values between
the two corneal surfaces for the J0 and J45 vectors. They
state that in emmetropic eyes the second surface
compensates 53% and 23% of the anterior surface�s J0and J45 vectors respectively. In our case, we obtain
average compensation values of 43% and 9%. Since our
population was not restricted to emmetropic eyes we
suggest that our averaged compensation values in the
90/180 deg direction adequately reproduce Atchison
et al.�s results. In the oblique case we find that our data
dispersion is very large, making our results are unreli-
able.
In Figures 4–8 we have directly compared the low-
order Zernike coefficients for the two corneal surfaces.
As we already said, correlations between surface coef-
ficients are better than those obtained for power vectors.
We failed to find a good correspondence between the J45components, but a clear correlation appeared in the
Zernike c�22 (45/135) astigmatism coefficient. This
difference might be due to influence of higher-order
terms of wavefront decomposition on J45 or to the
unreliability of the generally small values of J45. We
would like to remark that we are checking correspon-
dence between coefficients with no distinction over the
relative weight of each coefficient in the total amount of
aberrations in the eye. High correlation between c�22
astigmatism coefficients but low correlation between J45vectors means that there is no correspondence between
higher-order astigmatism in the 45/135 direction. The
contrary happens for horizontal/vertical components of
the astigmatism and power vectors. Since we are only
interested in comparing the basic shape descriptors of
the corneal surfaces we will not further analyze the effect
of high-aberration coefficients. Having this in mind,
from spherical and astigmatism coefficients we can
conclude that shapes of front and rear surfaces of the
cornea are clearly correlated. Note that slope of the
regression line is positive in the three cases (Figures 4–6),
confirming that the first surface is always less curved
than the second one.
We emphasize that the correlation between the
Zernike coefficients, c�22 , for oblique astigmatism is, in
all cases, worse than that for 90/180 astigmatism, c22, and
that the same happens for the corresponding astigmatic
power vectors. This is not surprising, since most of
astigmatisms are oriented in the vertical and horizontal
directions. Notice also that most 90/180 astigmatism
coefficients in Figure 6 are negative for both surfaces,
which means that the horizontal meridian is flatter than
the vertical one. Although the number of subjects is
relatively low, this supports the finding that most of the
young and middle aged population has with-the-rule
corneal astigmatism (Read et al., 2007).
When comparing the tilt coefficients of both corneal
surfaces, we found that there is a good correlation for
the y-tilt but not for the x-tilt. This effect could be due to
Figure 7. Correspondence between the y-tilts of the first and
second corneal surfaces. The regression line is: y = 1.90x ) 7.26;
r2 = 0.52; p < 0.01.
Figure 8. Correspondence between the x-tilts of the first and
second corneal surfaces. The regression line is: y = )1.03x + 8.23;
r2 = 0.31; p < 0.01.
6 Ophthal. Physiol. Opt. 2008 29: No. 1
ª 2008 The Authors. Journal compilation ª 2008 The College of Optometrists
1
2
3
4
5
6
7
8
9
10
11
12
13
14
15
16
17
18
19
20
21
22
23
24
25
26
27
28
29
30
31
32
33
34
35
36
37
38
39
40
41
42
43
44
45
46
47
48
49
50
51
52
53
54
55

a vertical misalignment between the Pentacam�s optical
axis and the eye axis. However, the y-tilt of the first
surface is distributed around the zero-value, which
implies that, as a general rule, the eyes are correctly
aligned with the measuring device. It is remarkable that
the second surface tilt is negative for all cases except
one. This means that the second corneal surface is tilted
downwards. This effect may be related to the gravita-
tional forces affecting the IOP. Kasprzak and Piersci-
onek (2002) propose a model for the gravitational sag of
the cornea, and describe a situation like this one
affecting both corneal surfaces. We suggest that the
first surface tilt is due to small vertical misalignments
between the Pentacam and the eye, and that this effect
will be highly correlated in the two surfaces. Another
effect that only affects the second surface is a permanent
tilt due to gravity. The viscoelastic properties of the
corneal tissue will explain why this deformation is not
transmitted from the second to the first surface.
There is a noticeable difference between the tilt
characteristics of the left and right eyes (Figures 7 and
8). While first surface y-tilt coefficients for right eyes are
distributed between negative and positive values, left
eyes tend to have negative coefficients. This effect is
more noticeable in the x-tilt values: right eyes values are
randomly distributed around zero, but left eyes are
biased to the temporal direction. In addition, all second
surface x-tilt values are positive, which means that, in
both eyes, this surface is tilted nasally. Although tilt
values are not very high, the bilateral symmetry is
broken in almost all the eyes. From Table 1, the reader
should note that this effect appears in both astigmatic
and tilt Zernike coefficients, although, in some cases, the
effect is more noticeable than in others. We do not
found any special reason on why the left eye correlations
are worse than those for the right eye. One hypothesis is
that there could be some postural habit in the subjects
that led to these results. It could also be related to the
eye dominance. Since target fixation is easier in the
dominant than in the non-dominant eye, small fixational
inaccuracies in the non-dominant eye may lead to the
results here presented. In our most recent measuring
campaigns we determined the dominant eye as a part of
our measuring protocol. Our preliminary results show
that there may be some dominancy effect. More work
should be done to clarify all these asymmetry effects.
The results here presented can be of the utmost
importance for clinicians who are planning optical
surgery. Most corneal ablations assume the one-surface
corneal model with an equivalent keratometric index.
Thus, apart from central pachymetry measurements,
little attention is paid to the second corneal surface.
Existence of a strong correlation between the astigma-
tism of both surfaces means that ablating the anterior
cornea will break the equilibrium of the corneal
structure. IOP (intraocular pressure) will naturally tend
to restablish the optimal mechanical configuration.
Thus, astigmatism in the second surface can transfer a
residual astigmatism to the first corneal surface just to
equilibrate the internal forces. Although the optical
power of the second surface is small, its influence over a
residual astigmatism must not be neglected.
Acknowledgements
This work has been partially supported by the Spanish
Ministry of Education and Science through the project
nr. FIS2005-05053. Julian Espinosa and Jorge Perez
acknowledge finnantial support from the University of
Alicante through the project GRE07-7P. Henryk
Kasprzak acknowledges the University of Alicante
its economical support through the project Senior 08/
07.
References
Atchison, D. A. and Smith, G. (2005) Chromatic dispersion
of the ocular media of human eyes. J. Opt. Soc. Am. A 22,
29–37.
Atchison, D. A., Markwell, E. L., Kasthurirangan, S., Pope, J.
M., Smith, G. and Swann, P. G. (2008) Age-related changes
in optical and biometric characteristics of emmetropic eyes.
J. Vis. 8, 1–20.
Dubbelman, M., Weeber, H. A. and van der Heijde, R. G. L.
(2002) Radius and asphericity of the posterior corneal
surface determined by corrected Scheimpflug photography.
Acta Opththalmol. Scand. 80, 379–383.
Dubbelman, M., Sicam, V. A. D. P. and van der Heijde, R. G.
L. (2006) The shape of the anterior and posterior surface of
the aging human cornea. Vision Res. 46, 993–1001.
Dubbelman, M., Sicam, V. A. D. P. and van der Heijde, R. G.
L. (2007) The contribution of the posterior surface to the
coma aberration of the human cornea. J. Vis. 7, 1–8.
Edmund, C. (1994) Posterior corneal curvature and its
influence on corneal dioptric power. Acta Ophthalmol.
Scand. 72, 715–720.
Espinosa, J., Rouarch, J., Perez, J., Illueca, C. and Mas, D.
(2007) Geometrical approximations for accurate evalua-
tion of refraction in the human cornea. Optik. 118, 209–
215.
Garner, L. F., Owens, H., Yap, M. K. H., Frith, M. J. and
Kinnear, R. F. (1997) Radius of curvature of the posterior
surface of the lens. Optom. Vis. Sci. 74, 496–498.
Guirao, A. and Artal, P. (2000) Corneal wave aberration from
videokeratography: accuracy and limitations of the proce-
dure. J. Opt. Soc. Am. A 17, 955–965.
Iskander, R., Davis, R. A., Collins, M. J. and Franklin, R.
(2007) Objective refraction from monochromatic wavefront
aberrations via Zernike power polynomials. Ophthal. Phys-
iol. Opt. 27, 245–255.
Kasprzak, H. and Pierscionek, B. K. (2002) Modelling the
gravitational sag of the cornea and the subsequent quality of
the refracted image. J. Mod. Opt. 49, 2153–2166.
Correlation between anterior and posterior corneal surfaces: D. Mas et al. 7
ª 2008 The Authors. Journal compilation ª 2008 The College of Optometrists
1
2
3
4
5
6
7
8
9
10
11
12
13
14
15
16
17
18
19
20
21
22
23
24
25
26
27
28
29
30
31
32
33
34
35
36
37
38
39
40
41
42
43
44
45
46
47
48
49
50
51
52
53
54
55

Lam, A. K. C. and Douthwaite, W. A. (2000) The ageing effect
on the central posterior corneal radius. Ophthal. Physiol.
Opt. 20, 63–69.
Oshika, T., Tomidokoro, A. and Tsuji, H. (1998) Regular and
irregular refractive powers in the front and back surfaces of
the cornea. Exp. Eye Res. 67, 443–447.
Read, S. A., Collins, M. J. and Carney, L. G. (2007) A review
of astigmatism and its possible genesis. Clin. Exp. Optom.
90, 5–19.
Shankar, H., Taranah, D., Chandramalar, F., Santhirathela-
gan, T. and Pseudovs, K. (2008) Anterior segment biometry
with the Pentacam: comprehensive assesment of repeatabil-
ity of automated measurements. J. Cataract Refract. Surg.
34, 103–113.
Tabernero, J., Benito, A., Alcon, E. and Artal, P. (2007)
Mechanism of compensation of aberrations in the human
eye. J. Opt. Soc. Am. A 24, 3274–3283.
Thibos, L. N., Applegate, R. A., Schwiegerling, J. T. and
Webb, R. H. (2000) Standards for reporting the optical
aberrations of eyes. Trends Opt. Photon 35, 110–130.
Thibos, L. N., Hong, X., Bradley, A. and Cheng, X. (2002)
Statistical variation of aberration structure and image
quality in a normal population of healthy eyes. J. Opt.
Soc. Am. A 19, 2329–2348.
8 Ophthal. Physiol. Opt. 2008 29: No. 1
ª 2008 The Authors. Journal compilation ª 2008 The College of Optometrists
1
2
3
4
5
6
7
8
9
10
11
12
13
14
15
16
17
18
19
20
21
22
23
24
25
26
27
28
29
30
31
32
33
34
35
36
37
38
39
40
41
42
43
44
45
46
47
48
49
50
51
52
53
54
55

Author Query Form
Journal: OPO
Article: 632
Dear Author,
During the copy-editing of your paper, the following queries arose. Please respond to these by marking up your proofs
with the necessary changes/additions. Please write your answers on the query sheet if there is insufficient space on the
page proofs. Please write clearly and follow the conventions shown on the attached corrections sheet. If returning the
proof by fax do not write too close to the paper’s edge. Please remember that illegible mark-ups may delay
publication.
Many thanks for your assistance.
Query reference Query Remarks
1 AUTHOR: Please give manufacturer information for Scheimpflug camera:
town, state (if USA), and country.

MARKED PROOF
Please correct and return this set
Instruction to printer
Leave unchanged under matter to remain
through single character, rule or underline
New matter followed by
or
or
or
or
or
or
or
or
or
and/or
and/or
e.g.
e.g.
under character
over character
new character
new characters
through all characters to be deleted
through letter or
through characters
under matter to be changed
under matter to be changed
under matter to be changed
under matter to be changed
under matter to be changed
Encircle matter to be changed
(As above)
(As above)
(As above)
(As above)
(As above)
(As above)
(As above)
(As above)
linking characters
through character or
where required
between characters or
words affected
through character or
where required
or
indicated in the margin
Delete
Substitute character or
substitute part of one or
more word(s)Change to italics
Change to capitals
Change to small capitals
Change to bold type
Change to bold italic
Change to lower case
Change italic to upright type
Change bold to non-bold type
Insert ‘superior’ character
Insert ‘inferior’ character
Insert full stop
Insert comma
Insert single quotation marks
Insert double quotation marks
Insert hyphen
Start new paragraph
No new paragraph
Transpose
Close up
Insert or substitute space
between characters or words
Reduce space betweencharacters or words
Insert in text the matter
Textual mark Marginal mark
Please use the proof correction marks shown below for all alterations and corrections. If you
in dark ink and are made well within the page margins.
wish to return your proof by fax you should ensure that all amendments are written clearly


![[Posterior cortical atrophy]](https://static.fdokumen.com/doc/165x107/6331b9d14e01430403005392/posterior-cortical-atrophy.jpg)


