Dynamics of Anion-Molecule Reactions at low collision energy
223
Dynamics of anion-molecule reactions at low energy Jochen Mikosch PhD thesis November 2007 University of Freiburg, Physics Department Atomic and Molecular Quantum Dynamics
-
Upload
khangminh22 -
Category
Documents
-
view
0 -
download
0
Transcript of Dynamics of Anion-Molecule Reactions at low collision energy

Dynamics of anion-molecule
reactions at low energy
Jochen Mikosch
PhD thesisNovember 2007
University of Freiburg, Physics Department
Atomic and Molecular Quantum Dynamics


The figure on the title page depicts the I− product velocity distribution from the nucle-
ophilic substitution reaction Cl− + CH3I→ CH3Cl + I− unraveling direct backscattering
of iodine and a novel “roundabound” mechanism involving CH3 rotation (see Chapter 7).


Dynamics of anion-molecule
reactions at low energy
Inaugural-Dissertation
zur
Erlangung des Doktorgrades
der Fakultat fur Mathematik und Physik
der Albert-Ludwigs-Universitat
Freiburg im Breisgau, Germany
vorgelegt von
Jochen Mikosch
aus Freiburg i. Br.
im November 2007

Dekan: Professor Dr. Jorg Flum
Leiter der Arbeit: Privat-Dozent Dr. Roland Wester
Referent: Privat-Dozent Dr. Roland Wester
Koreferent: Professor Dr. Hanspeter Helm
Prufer: Professor Dr. John Briggs
Professor Dr. Frank Stienkemeier
Tag der Verkundigung
des Prufungsergebnisses: 17.12.2007

List of publications covered in this thesis
Chapter 4
• J. Mikosch, U. Fruhling, S. Trippel, D. Schwalm, M. Weidemuller, and R. WesterEvaporation of buffer gas-thermalized anions out of a multipole rf ion trapPhys. Rev. Lett. 98, 223001 (2007)
• S. Trippel, J. Mikosch, R. Berhane, R. Otto, M. Weidemuller, and R. WesterPhotodetachment of cold OH- in a multipole ion trapPhys. Rev. Lett. 97, 193003 (2006)
• H. Kreckel, J. Mikosch, R. Wester, J. Glosık, R. Plasil, M. Motsch, D. Gerlich, D. Schwalm, andA. WolfTowards state selective measurements of the H+
3 dissociative recombination rate co-efficientJournal of Physics: Conference Series 4, 126 (2005)
• J. Mikosch, H. Kreckel, R. Wester, R. Plasil, J. Glosık, D. Gerlich, D. Schwalm, and A. WolfAction spectroscopy and temperature diagnostics of H+
3 by chemical probingJ. Chem. Phys. 121, 11030 (2004)
• J. Mikosch, U. Fruhling, S. Trippel, R. Otto, D. Schwalm, M. Weidemuller, and R. WesterStability of ion motion in a multipole rf ion trap and its operation in tandem time-of-flight configurationin preparation
Chapter 5
• R. Otto, J. Mikosch, S. Trippel, M. Weidemuller, and R. WesterProton transfer to a negative ion at extremely low temperaturesin preparation
• J. Mikosch, R. Otto, S. Trippel, C. Eichhorn, M. Weidemuller, and R. WesterInverse temperature dependent lifetimes of transient SN2 ion-dipole complexessubmitted to J. Am. Chem. Soc.
Chapter 6
• J. Mikosch, S. Trippel, R. Otto, C. Eichhorn, M. Weidemuller, and R. WesterAnion Molecule Reaction Dynamicsinvited to be published in Phys. Chem. Chem. Phys.
Chapter 7
• J. Mikosch, S. Trippel, C. Eichhorn, R. Otto, U. Lourderaj, J. X. Zhang, W. L. Hase, M. Wei-demuller, and R. WesterImaging nucleophilic substitution dynamicsScience (in press)
• J. Mikosch, U. Fruhling, S. Trippel, D. Schwalm, M. Weidemuller, and R. WesterVelocity map imaging of ion-molecule reactive scattering: The Ar+ + N2 chargetransfer reactionPhys. Chem. Chem. Phys. 8, 2990 (2006)
VII

• J. Mikosch, S. Trippel, R. Otto, C. Eichhorn, P. Hlavenka, M. Weidemuller, and R. WesterKinematically complete reaction dynamics of slow ionsJournal of Physics: Conference Series 88, 012025 (2007)
• J. Mikosch, S. Trippel, C. Eichhorn, R. Otto, M. Weidemuller, and R. WesterReaction dynamics of competing channels in F− + CH3I collisionsin preparation
In addition the author has contributed to the following publications
• H. Kreckel, M. Motsch, J. Mikosch, J. Glosık, R. Plasil, S. Altevogt, V. Andrianarijaona, H. Buhr,J. Hoffmann, L. Lammich, M. Lestinsky, I. Nevo, S. Novotny, D. A. Orlov, H. B. Pedersen, F.Sprenger, A. S. Terekhov, J. Toker, R. Wester, D. Gerlich, D. Schwalm, A. Wolf, and D. Zajfman,High-resolution dissociative recombination of cold H+
3 and first evidence for nuclearspin effectsPhys. Rev. Lett. 95, 263201 (2005)
• A. Wolf, H. Kreckel, L. Lammich, D. Strasser, J. Mikosch, J. Glosık, R. Plasil, S. Altevogt, V.Andrianarijaona, H. Buhr, J. Hoffmann, M. Lestinsky, I. Nevo, S. Novotny, D. A. Orlov, H. B.Pedersen, A. S. Terekhov, J. Toker, R. Wester, D. Gerlich, D. Schwalm, and D. Zajfman,Effects of molecular rotation in low-energy electron collisions of H+
3
Phil. Trans. R. Soc. A 364, 2981 (2006)
• H. Kreckel, A. Petrignani, M. Berg, D. Bing, S. Reinhardt, S. Altevogt, H. Buhr, M. Froese, J.Hoffmann, B. Jordon-Thaden, C. Krantz, M. Lestinsky, M. Mendes, O. Novotny, S. Novotny, H.B. Pedersen, D. A. Orlov, J. Mikosch, R. Wester, R. Plasil, J. Glosık, D. Schwalm, D. Zajfmanand A. Wolf,Electron collisions and rovibrational action spectroscopy of cold H+
3 moleculesJournal of Physics: Conference Series 88, 012064 (2007)
• S. D. Kraft, J. Mikosch, P. Staanum, J. Deiglmayr, J. Lange, A. Fioretti, R. Wester, and M.WeidemullerA high resolution time-of-flight mass spectrometer for the detection of ultracoldmoleculesAppl. Phys. B 89, 453 (2007)
• M. Kroner, M. Debatin, J. Mikosch, S. Trippel, E. Just, M. Reetz-Lamour, R. Wester, M. Wei-demuller, and P. WoiasSimulation, design, and test of a novel planar rf micro ion trapProceedings of the Transducers and Eurosensors ’07
• M. Debatin, M. Kroner, J. Mikosch, S. Trippel, N. Morrison, M. Reetz-Lamour, P. Woias, R.Wester, and M. WeidemullerA novel multi pole ion trap for the investigation of ion-atom interactionssubmitted to Phys. Rev. A
VIII

Abstract:Anion-molecule reactions must find their way through deeply bound entrance and exitchannel complexes separated by a central barrier. This results in low reaction ratesand rich dynamics since direct pathways compete with the formation of transientintermediates. In this thesis we examine the probability of proton transfer to a smallanion and transient lifetimes of a thermoneutral bimolecular nucleophilic substitution(SN2) reaction at well defined variable temperature down to 8 Kelvin in a multipoletrap. The observed strong inverse temperature dependence is attributed to the deficitof available quantum states in the entrance channel at decreasing temperature. Fur-thermore we investigate scattering dynamics of SN2 reactions at defined relative en-ergy between 0.4 and 10 eV by crossed beam slice imaging. A weakly exothermicreaction with high central barrier proceeds via an indirect, complex-mediated mech-anism at low relative energies featuring high internal product excitation in excellentquantitative agreement with a statistical model. In contrast, direct backward scat-tering prevails for higher energies with product velocities close to the kinematicalcutoff. For a strongly exothermic reaction, competing SN2-, dihalide- and protontransfer-channels are explored which proceed by complex mediation for low energyand various rebound-, grazing- and collision induced bond rupture-mechanisms athigher energy. From our data and a collaboration with theory we identify a newindirect “roundabout” SN2 mechanism involving CH3-rotation.
Zusammenfassung:Anionen-Molekul Reaktionen mussen ihren Weg durch tiefgebundene Komplexe imEingangs- und Ausgangskanal finden, die durch eine hohe Zentralbarriere getrenntsind. Dies hat niedrige Reaktionsraten und reichhaltige Dynamik zur Folge, da di-rekte Pfade mit der Bildung von transienten Zwischenzustanden konkurrieren. Indieser Arbeit untersuchen wir die Effizenz einer anionischen Protontransferreaktionund Transientenlebensdauern einer thermoneutralen bimolekularen nukleophilen Sub-stitutionsreaktion (SN2 Reaktion) bei wohlbekannter variabler Temperatur in einerMultipolfalle bis hinunter zu 8 Kelvin. Die beobachtete stark inverse Temperatur-abhangigkeit wird der geringen Quantenzustandsdichte im Eingangskanal bei ab-nehmender Temperatur zugerechnet. Des Weiteren untersuchen wir Streudynamikvon SN2 Reaktionen bei wohlbekannter Relativenergie zwischen 0.4 und 10 eV mittelseiner Geschwindigkeitsabbildung der Reaktionsprodukte. Eine schwach exothermeReaktion mit hoher Zentralbarriere lauft uber einen indirekten, komplexvermitteltenMechanismus bei niedrigen Reaktionsenergien ab, der hohe interne Produktanregungin sehr guter quantitativer Ubereinstimmung mit einem statistischen Modell aufweist.Im Gegensatz dazu setzt sich direkte Ruckstreuung fur hohere Energien durch mitProduktgeschwindigkeiten nah an der kinematischen Grenze. Wir erforschen bei einerstark exothermen Reaktion konkurrierende SN2-, Halogendimer- und Protontransfer-kanale, die bei niedrigen Energien uber Komplexbildung und bei hohen Energienuber diverse Abprall-, kollisionsinduzierte Bindungsbruch-, und streifende Mechanis-men ablaufen. Mittels unserer Daten und einer Zusammenarbeit mit Theoretikernidentifizieren wir einen neuen indirekten Kreiselmechanismus fur SN2 Reaktionen, derdie Rotation einer CH3-Gruppe beinhaltet.

X

Contents
1 Introduction 1
2 Anion-Molecule Reactions 7
3 Hot Fields for Cold Ions 15
3.1 Capturing ions in inhomogeneous radiofrequency fields . . . . . . . . . . . 15
3.1.1 Effective potential approximation . . . . . . . . . . . . . . . . . . . 16
3.1.2 Quadrupole and multipole ion traps . . . . . . . . . . . . . . . . . . 18
3.1.3 Disturbed multipole fields . . . . . . . . . . . . . . . . . . . . . . . 26
3.2 A versatile multipole trap setup for the study of cold anions . . . . . . . . 31
3.2.1 Ion production and time-of-flight selection . . . . . . . . . . . . . . 31
3.2.2 The cryogenic multipole trap . . . . . . . . . . . . . . . . . . . . . 36
3.2.3 Time-of-flight mass spectroscopy of stored ion ensembles . . . . . . 40
4 Scrutinizing Trapping and Cooling 45
4.1 Stability of ion motion probed by evaporation . . . . . . . . . . . . . . . . 45
4.1.1 Evaporation limited ion storage . . . . . . . . . . . . . . . . . . . . 46
4.1.2 Effective trap depth derived from activated ion loss . . . . . . . . . 48
4.1.3 Framing stability requirements for adiabatic ion motion . . . . . . . 51
4.1.4 Predicting trapping conditions for other rf devices . . . . . . . . . . 56
4.2 Sampling the effective potential by photodetachment tomography . . . . . 58
4.2.1 An eye to image ion column densities . . . . . . . . . . . . . . . . . 58
4.2.2 From density distributions to confining potentials . . . . . . . . . . 61
4.3 Preparation and diagnostics of internally cold molecular ions . . . . . . . . 67
4.3.1 Action spectroscopy by chemical probing . . . . . . . . . . . . . . . 68
4.3.2 Temperature diagnostics of H+3 . . . . . . . . . . . . . . . . . . . . 76
5 Inferring Reaction Dynamics from Kinetics 79
5.1 Proton transfer to NH−2 at extremely low temperatures . . . . . . . . . . . 79
5.1.1 Proton transfer from H2 to NH−2 . . . . . . . . . . . . . . . . . . . . 80
5.1.2 Absolute rate coefficients and reaction probabilities . . . . . . . . . 82
XI

CONTENTS
5.1.3 Statistical modeling of reaction rates . . . . . . . . . . . . . . . . . 88
5.1.4 Beyond statistical redistribution of energy . . . . . . . . . . . . . . 95
5.2 Nucleophilic substitution metastables probed by ternary collisions . . . . . 96
5.2.1 Anion dipole complexes as reaction intermediates . . . . . . . . . . 96
5.2.2 Association of [Cl− · · · CH3Cl] by collisional stabilisation . . . . . . 99
5.2.3 Lifetimes of SN2 entrance channel complexes . . . . . . . . . . . . . 101
6 Velocity Mapping of Ion-Molecule Scattering 105
6.1 Compact sources for cold ion and neutral beams . . . . . . . . . . . . . . . 108
6.2 Pulsed field, time-sliced velocity mapping and spatial focusing . . . . . . . 116
6.3 Imaging angle-differential cross sections of reactive scattering . . . . . . . . 123
7 Imaging Reaction Dynamics 129
7.1 Investigating the Ar+ + N2 charge transfer reaction . . . . . . . . . . . . . 129
7.1.1 Non-adiabatic coupling in Ar+ + N2 . . . . . . . . . . . . . . . . . 129
7.1.2 Imaging of reaction dynamics . . . . . . . . . . . . . . . . . . . . . 130
7.1.3 Evidence for a scattering resonance . . . . . . . . . . . . . . . . . . 136
7.2 Imaging SN2 reaction mechanisms in Cl− + CH3I . . . . . . . . . . . . . . 140
7.2.1 The Cl− + CH3I SN2 reaction . . . . . . . . . . . . . . . . . . . . . 140
7.2.2 Imaging nucleophilic substitution dynamics . . . . . . . . . . . . . . 142
7.2.3 Modeling of reaction dynamics and the “roundabout” mechanism . . 151
7.2.4 Dihalide production via chlorine rebound . . . . . . . . . . . . . . . 156
7.3 Competing chemical dynamics in F− + CH3I . . . . . . . . . . . . . . . . . 159
8 Summary 169
9 Outlook 171
A Details of the Monte Carlo Reconstruction 179
B Time-of-flight trace correction 183
Bibliography 185
Acknowledgements 209
XII

Chapter 1
Introduction
Reactions of ions with neutral molecules at thermal energies are omnipresent in our close
and distant environment as well as in technological applications. Usually by far less
abundant than neutrals, the importance of ions in the following examples relies on their
high reactivity based on the long-range charge-dipole interaction. In living systems ions
are the carriers of signal processing via action potentials through synapses [Kandel et al.,
2006]. Ionizing radiation causes single- and double-strand breaks in DNA [Boudaiffa
et al., 2000], which are a cause of cancer. On the other hand the same can be used to
treat tumors by controlled local impact of ionizing radiation and heavy ions [Amaldi and
Kraft, 2005]. Gas phase ion reactions are utilized in plasma etching processes applied
in the semiconductor industry for building high-current transistors [Zhang et al., 2006].
Another fundamental example is the monitoring and dilution of global climate change by
human impact on the Earth’s atmosphere. Here ion molecule reactions are not only used
in the analysis of the changing composition of our biosphere by highly sensitive chemical
ionization mass spectrometry [Marcy et al., 2004], they also constitute important seeds
for nucleation and subsequent cloud formation [Kulmala, 2003; Lee et al., 2003; Kulmala
et al., 2007]. In interstellar clouds, the birthplaces for young stars, ions play a central role
in chemical networks as catalysts in the genesis of heavier molecules, which might be the
building blocks of life [Petrie and Bohme, 2007].
For most of these ion-molecule reactions the embedding environment has to be taken
into account since it influences the dynamics on a molecular level. In the low density
regime of interstellar media molecules will cool to temperatures of a few ten Kelvin by
emitting radiation and weakly exothermic isotope exchange becomes significant. In the
atmosphere, vibrational excitation of molecular ions will be quenched in collisions with
neutrals and three-body processes have to be considered. In contrast high internal excita-
tions might prevail in plasmas and secondary electrons can be dissociatively attached to
form radicals and negatively charged ions. In biological systems, ions are usually clustered
by water molecules and solvation partially shields long-range forces.
1

Chapter 1. Introduction
More and more complex aggregates are identified where quantum dynamics drives
macroscopic phenomena. Strand breaks in DNA can arise from rapid decays of transient
molecular resonances which cause genotoxic damage by secondary electrons at energies
below the onset of ionization [Boudaiffa et al., 2000]. The extreme efficiency of some
light harvesting complexes can be explained by remarkably long-lived electronic quantum
coherence, which allows the system to sample vast areas of phase space to find the most
efficient path [Engel et al., 2007]. Enzyme-catalyzed reactions have been revealed, which
are dominated by proton tunneling [Masgrau et al., 2006].
In depth microscopic understanding of ion-molecule reaction dynamics is still mostly
restricted to smaller systems containing only a few atoms. Studies with isolated reactants
in the gas-phase allows to highlight the intrinsic properties of these reactions. Effects
introduced by a solvent might then be revealed in a bottom-up approach by successive
clustering of individual solvent molecules to the reactants.
Teloy and Gerlich introduced guided-ion beams into gas-phase chemistry in pioneer-
ing experiments carried out here in Freiburg in the 1970s [Teloy and Gerlich, 1974]. By
guiding ions with radio frequency electric fields through a scattering cell filled with the
neutral reaction partner they obtained high resolution integral cross sections over an ex-
tended range of energies between 0.1 and 20 eV. Still nowadays guided ion beam studies
are the method of choice for an accurate energy resolved determination of the opening
and competition of different reactive channels in ion-molecule reactions [Angel and Ervin,
2003]. Along these lines it became clear that for the efficient cooling and complete ther-
malization of molecular ions with a buffer gas trapping in a quasi field-free environment is
indispensable. In this way micro motion driven by the oscillating confining field and ac-
companying energetic collisions with the buffer gas can be minimized - effects referred to as
radio frequency heating. Gerlich pioneered the development of cryogenic storage devices
based on electric multipole fields [Gerlich, 1992], which are capable of cooling molecu-
lar ions to below 10 Kelvin in all degrees of molecular freedom [Schlemmer et al., 1999;
Schlemmer et al., 2002; Glosık et al., 2006; Boyarkin et al., 2006]. The most renown design
is the 22pole ion trap [Gerlich, 1995]. It is nowadays widely applied to prepare and study
cold and temperature-variable ensembles of molecular ions for such different endeavors
as laboratory astrophysics [Gerlich and Smith, 2006; Dzhonson et al., 2007], threebody
[Paul et al., 1995; Paul et al., 1996; Schlemmer et al., 2002] and radiative association
[Gerlich and Horning, 1992], collision and photodissociation experiments in storage rings
[Andersen et al., 2004; Kreckel et al., 2005], photofragmentation of biomolecules [Boyarkin
et al., 2006; Mercier et al., 2006] and precision infrared spectroscopy with lasers and Free
Electron Lasers [Asvany et al., 2005a; Asvany et al., 2005b]. Similar designs are used to
reduce the Doppler shift in microwave ion clocks [Prestage et al., 2001], for photoelectron
[Kostko et al., 2007] and gas phase cluster spectroscopy [Asmis et al., 2003].
2
An alternative approach to measure ion-molecule reaction rate coefficients and cross
sections is followed in flow and drift tubes and stationary afterglows [Ferguson, 1975;
Depuy and Bierbaum, 1981; Viggiano et al., 1992; Plasil et al., 2002]. These instruments
do not reach the low temperatures of compact multipole ion traps, but provide other ad-
vantages. Collisions can be studied at elevated temperatures up to a few hundred Kelvin.
Most important internal and translational degrees of freedom of the reaction partners
are decoupled and can be separately controlled, allowing to study how the reaction rate
changes if the same amount of energy is provided in different forms.
Uniquely low temperature environments for ion-molecule collisions down to 0.1 Kelvin
are reached in free jet supersonic flows employing adiabatic expansion [Smith, 1998]. Pos-
itive ions are created by laser ionization of admixtures in the supersonic flow allowing
investigation of ions prepared in a single quantum state. Particularly nice examples are
studies of vibrational quenching of NO+(ν=1) via Helium by complex formation below
3 Kelvin [Hawley and Smith, 1991] and the reopening of the bimolecular C2H+3 channel
in the hydrogen transfer of H2 to C2H+2 for low temperatures, which is attributed to
tunneling of a collision complex through the reaction barrier [Hawley and Smith, 1992].
Unfortunately, the nature of the spherical expansion forces strong temperature disequi-
libria in the complicated cooling process regarding different degrees of molecular freedom.
Even more, the rotational distribution has been demonstrated to have non-thermal nature
[Zacharias et al., 1984; Belikov et al., 1998]. Uniform expansions from precisely designed
Laval nozzles can overcome some of the difficulties of free flows by maintaining parallel
stream lines at constant Mach number [Smith, 1998]. Constant high densities are reached
at a fixed temperature in the traveling frame over the entire flow, which makes equili-
bration of the molecules degrees of freedom more likely. By terminating the supersonic
expansion through parallelization of the stream lines in the nozzle, the exceedingly low
temperatures of free expansions are unfortunately lost. This CRESU technique is also
applicable to negatively charged ions setting up to now the low temperature “record” of
an anion molecule reaction to 23 Kelvin [LeGarrec et al., 1997].
Direct insight into reaction dynamics is provided by kinematically complete experi-
ments using the powerful technique of crossed molecular beams. This method has a long
and very successful history especially in neutral-neutral and neutral-radical reactive scat-
tering [Lee, 1987; Casavecchia, 2000; Liu, 2001]; its pioneers Dudley R. Herschbach and
Yuan T. Lee were awarded the Nobel Price in Chemistry in 1986. A classical crossed
molecular beam machine for neutrals consists of two quasi-continuous directed fluxes of
reactants with well-defined velocity [Scoles, 1988; Campargue, 2001], which are intersect-
ing in a small spatial volume, and a rotatable detector in the plane spanned by the two
beams, which records the flux of products created in the reactants interaction by electron
impact ionization. The measurement of product velocities delivers both the kinematics
3

Chapter 1. Introduction
and the amount of energy stored in internal degrees of freedom. With this technique
many elementary chemical processes have been studied in depth. Certainly one of the
most prominent examples is the reaction F + H2 −→ HF + H [Neumark et al., 1985].
Extensively studied over the past 40 years it seems to be the ultimate mainspring and
benchmark for advances in the technique of crossed molecular beams. Despite the sim-
plicity of its reactants this reaction is governed by state-selective scattering resonances
[Qiu et al., 2006], which has also attracted considerable theoretical interest [Che et al.,
2007]. The holy grail of rotationally resolved reaction dynamics has been reached for this
reaction with the technique of Rydberg tagging [Schnieder et al., 1991; Yang, 2005].
One of the main drawbacks of classical crossed molecular beam machines is the small
solid angle inherently covered by the rotating detector. This makes the measurement of
differential cross sections a very time-consuming task and requires high stability of the
employed apparatus. It also makes the study of ion-molecule reactions difficult, since the
high densities of neutral supersonic expansions are not available to ions, which reduces
the event rate by several orders of magnitude. The technique of velocity mapping by
ion imaging [Chandler and Houston, 1987; Whitacker, 2003] developed ten years ago by
Arthur Eppink and Dave Parker [Eppink and Parker, 1997] for photodissociation provides
a loophole to this problem.Velocity map imaging projects the velocity of ions created in
a two-stage electric field acting as lens on a position sensitive detector, thereby compen-
sating for an initial spatial separation of the ions at their origin. This powerful technique
was rapidly adopted by many fields and is successfully employed in all laser driven pro-
cesses, which create electrons and ions to measure the recoil of the departing charged
fragments [Ashfold et al., 2006]. It represents a complementary approach to multi-hit
coincidence detection techniques such as reaction microscopes [Ullrich et al., 2003] re-
quired in many-particle fragmentation studies [Ullrich and Shevelko, 2003]. Velocity map
imaging has been successfully applied in crossed molecular beams to study bimolecular
reaction dynamics of neutrals [Lin et al., 2003a]. In combination with resonance en-
hance multi-photon ionization it allows to determine the state-resolved, pair-correlated
differential cross section of two molecular reaction products [Lin et al., 2003b].
At our experiment in Freiburg we are focusing on reaction dynamics of small nega-
tively charged ions with small neutral molecules. Anion molecule reactions exhibit low
cross sections as compared to most cation reactions, which is attributed to barriers along
the reaction pathway suggesting induction of rich dynamics. We are especially interested
in bimolecular nucleophilic substitution, a fundamental reaction mechanism that does not
involve too many atoms but still is considered an important model system for bond break-
ing and bond making in chemistry (see for example [Vollhardt and Schore, 2007]). The
reaction’s equation X + R-Y −→ X-R + Y summarizes bond formation by the attacking
nucleophile X with the moiety R and concerted bond-cleavage of the substituted leaving
4

group Y. SN2 reactions are omnipresent in preparative organic synthesis [Merceron-Saffon
et al., 2003]. Low energy negative ion reactions, most likely nucleophilic substitution,
are made responsible for the large amount of DNA double strand breaks in the wake of
radioactive particles [Boudaiffa et al., 2000]. Anion-molecule SN2 reactions may be the
most prominent type of ion-molecule reactions, studied extensively both experimentally
[Chabinyc et al., 1998; Laerdahl and Uggerud, 2002] and computationally [Hase, 1994;
Schmatz, 2004]. Rate coefficients for these reactions depend strongly upon the surround-
ing solvent [Chabinyc et al., 1998], making experiments on isolated gas-phase systems
indispensable. Their low, non-Langevin rate coefficients are qualitatively well understood
to stem from two wells (see next section) on the potential energy hypersurface [Olmstead
and Brauman, 1977]. This characteristic potential energy landscape is attributed to the
formation of ion-dipole collision complexes on both sides of the reaction barrier. The bar-
rier itself, which represents a transition state that corresponds to inversion at the reaction
center, has a significant influence on the reaction kinetics even though it most often lies
submerged with respect the energy of the reactants.
Within this thesis we have developed two complementary approaches to study the dy-
namics of anion-molecule reactions. At well defined, variable temperature we investigate
anion interactions with neutrals and photons in a 22 pole ion trap, access transient reac-
tion intermediates and study reaction probability down to unusually low temperatures of
8 Kelvin. This environment opens up the perspective to model solvent influence by the
preparation of micro-solvated ions. At well defined, variable energy we perform kinemat-
ically complete experiments by extending imaging of crossed beam reactive scattering to
low-energy ion-molecule reactions. This gives direct insight into the reaction dynamics
and the alteration of reaction mechanisms.
The thesis is organized as follows. Some important features of anion-molecule reac-
tions will be briefly discussed in the next section. After an exploration of trapping in
inhomogeneous radio frequency fields the 22 pole setup is described (Chapter 3). The first
application of anions in high order multipole fields allows novel diagnostics as evaporation
(Section 4.1) and tomography (Section 4.2) which give a new view on trapping conditions
and stability requirements. In Section 5.1 we investigate the temperature dependent rate
coefficient of an SN2 model system and the lifetime of an SN2 entrance channel complex.
In the second part imaging of crossed-beam ion-molecule scattering by combination of ve-
locity mapping and spatial focusing is described in Chapter 6. A charge transfer reaction
used as benchmark shows indications for a scattering resonance (Section 7.1). Finally
kinematically complete investigations of nucleophilic substitution dynamics and compet-
ing reaction channels will be presented in Sections 7.2 and 7.3. In a collaboration with
the theoretical chemistry group of W. L. Hase we uncover a new indirect “roundabout”-
mechanism involving rotation of a CH3 group.
5


Chapter 2
Anion-Molecule Reactions
Considering the approach of two initially far apart structureless particles, the conserved
total energy can be written as sum of kinetic, centrifugal, and potential energy1:
E =1
2µ
(dR
dt
)2
+L2
2µR2+ V (R). (2.1)
Here µ denotes the reduced mass of the collision pair, R(t) the interparticle distance, L =
µ(
dRdt
)b is the angular momentum (with b the impact parameter), and V (R) = −
∞∑n=0
Cn
Rn a
conservative potential due to the interparticle interaction. This equation implies, that the
initial kinetic energy of the separated collision partners is transformed not only in potential
but also in centrifugal energy due to rotation of the interparticle distance. Considering
collisions of charged particles with nonpolar neutrals, the only contribution for a pure
interaction of the ion with the induced dipole stems from n = 4. Together with the
centrifugal energy this gives rise to an effective potential
Veff(R) = −αq2
2R4+ Erel
b2
R2, (2.2)
where α denotes the neutrals polarizability and q the charge of the ion. As schematically
depicted in Fig. 2.1 the centrifugal force hence creates a barrier of height
Veff =1
2
E2relb
4
αq2, (2.3)
which corresponds to a maximal impact parameter b. Capture theory assumes, that the
particles undergo reaction with unit probability once Veff is reached, which in this case
results in the Langevin cross section
σL = πb2 = π ·√
2αq2
Erel. (2.4)
1 See for example [Levine, 2005].
7

Chapter 2. Anion-Molecule Reactions
R [a.u.]0 0.1 0.2 0.3 0.4 0.5 0.6 0.7 0.8
(R
) [a
.u.]
eff
V
-3
-2
-1
0
1
2
3
Figure 2.1: Effective potential (solid line) due to the interaction of an ion with the induced dipole of the
neutral (dotted-dashed) and the centrifugal potential (dashed).
Thermal averaging over a Boltzmann distribution yields the reaction rate coefficient
kL =< vσL >= 2πq
√α
4πε0µ, (2.5)
which turns out to be temperature independent. Typical Langevin rate coefficients are
around 10−9 cm3/s.
The Langevin rate constant has proven to be extremely valuable as a guideline and
often describes fairly accurately measured reaction rates for cations with nonpolar neutral
molecules [Ferguson, 1975]. A prominent correction has to be introduced if the neutral
exhibits a permanent dipole moment µD. The effective potential (2.2) is extended by
the interaction of the ion with the permanent dipole Vid = − qµD
R2 cos(θ(R)), where θ(R)
denotes the orientation angle which the dipole vector makes with respect to the line of
centers of the collision. Average-Dipole-Orientation (ADO) theory [Su and Bowers, 1973]
introduces an effective “dipole locking constant” C = 〈 cos[θ(R)] 〉 depending on µD
α, such
that a collision rate coefficient kADO can be derived. Alternatively, the rate coefficient
for ion-polar molecule reactions may be predicted using a prefactor K(T ) > 1 to the
Langevin rate constant (2.5), which is derived from a similar parametrization depending
on µD
αbased on classical trajectories [Su and Chesnavich, 1982; Su, 1988] and considered
to be more accurate [Viggiano, 2007]. In any case this results in a capture rate coefficient
slightly larger than predicted by Langevin.
While realistic for most cation molecule reactions, for anions capture limited rate
coefficients mostly completely fail to reflect the experimental observation. A prominent
example is depicted in Fig. 2.2, which shows a collection of measurements of the rate
8

Figure 2.2: Measured rate coefficient for the SN2 reaction Cl− + CH3Br→ ClCH3 + Br− adapted from
[LeGarrec et al., 1997]. The inserted line represents the capture rate coefficient [Su, 1988], open diamonds correspond
to a quantum dynamics calculation [LeGarrec et al., 1997].
coefficient for the SN2 reaction
Cl− + CH3Br→ ClCH3 + Br− (2.6)
in the temperature range from 23 to 500 Kelvin [LeGarrec et al., 1997]. As can be seen
the rate coefficient is found to be about three orders of magnitude below the capture limit
(solid line) for high temperatures and features a strong inverse temperature dependence.
While for low temperatures the rate coefficient is rapidly approaching the capture limit,
no temperatures below 23 Kelvin were reached up to now for an anion molecule reaction.
The reason for the low and strongly temperature dependent rate coefficient of many
anion-molecule reactions is uncovered by inspection of the potential energy hypersurface.
The potential energy along the minimum energy pathway between reactants and products
often features a double-minimum structure. This is schematically depicted in Fig. 2.3 for
the SN2 reaction (2.6), where the potential energy V(g) is plotted as a function of the
reaction coordinate g = RC−Br − RC−Cl. While the long range part of the potential stems
from the ion-dipole interaction, the wells are due to entrance and exit channel ion-dipole
complexes. The ion-dipole complexes are often bound by hundreds of meV if they are
brought to their groundstate but are metastable when formed from free reactants. The
central barrier separating entrance and exit channel complex is caused by overlapping
electron orbitals during molecular rearrangement, which requires that much of the total
available energy is shuffled into the covalent bond to be broken. At the same time it is
often accompanied by the inversion of functional groups, in this case the CH3 umbrella.
9

Chapter 2. Anion-Molecule Reactions
Figure 2.3: Sketch of the potential energy along the reaction coordinate for the SN2 reaction
Cl− + CH3Br→ ClCH3 + Br− [Schmatz, 2004]. The double minimum shape is characteristic for all SN2 reac-
tions [Olmstead and Brauman, 1977] and typical for anion molecule reactions in general. The wells correspond to
formation of ion-dipole complexes, whereas the central barrier stems from inversion at the reaction center as seen
from the indicated molecular structure.
Although submerged with respect to the asymptotes, this makes surmounting the central
barrier a bottleneck of the reaction, since it competes with dissociation of the entrance
channel complex back to reactants. The reaction probability will hence sensitively depend
on the interplay between complex lifetime and redistribution of energy between inter- and
intramolecular degrees of molecular freedom.
The issue of intermediates and the flow of energy on the microscopic scale is closely
related to reaction mechanisms and the detailed reaction dynamics. One way to describe
the redistribution of initial translational and internal energy is the assumption of an
ergodic collision complex. Especially for bimolecular nucleophilic substitution (SN2) reac-
tions the applicability of the so-called statistical theories [Forst, 2003], such as transition
state theory (TST), Rice-Ramsperger-Kassel-Marcus theory (RRKM), and phase space
theory (PST) has prompted a large number of studies on the theoretical side [Hase, 1994;
Chabinyc et al., 1998; Laerdahl and Uggerud, 2002]. In particular classical trajectory
calculations by the group of W. L. Hase have elucidated this topic and put the suitability
of statistical models into question. The simulations show that formation of an ion-dipole
complex by collision of free reactants does not involve energy transfer to the vibrations
of the molecular moiety. This is traced back to the mismatch of the low energy modes
associated with relative product rotation and translation and the high energy modes of
intra-molecular vibration [Wang and Hase, 1996]. Instead coupling between the orbital
angular momentum of the reactants and the rotational angular momentum of the neutral
10

Figure 2.4: Multiple crossings of the central barrier in an SN2 reaction as uncovered in a molecular dynamics
calculation [Cheon et al., 2006]. Such a behaviour is characteristic for many nucleophilic substitution reactions due
to the weak coupling between intra- and intermolecular complexes.
(T → R transfer) is most important for stabilizing the collision complex. The collision
complex will initially exhibit a high excitation of the floppy intermolecular modes and is
hence named an intermolecular complex. To access the central reaction barrier, it has to
undergo the transition to an intramolecular complex, which involves rotational to vibra-
tional (R → V) energy transfer on a much longer timescale. This unimolecular process
does not yet involve surmounting a potential barrier, its hindrance results from a dynam-
ical barrier for energy transfer [Hase, 1994]. After the isomerization of the intramolecular
complex, i.e. the crossing of the central barrier, the same holds true for the exit-channel
ion-dipole complex. For its dissociation V → R transfer is required, such that the strong
R→ T coupling can lead to formation of products. This model implies a low reaction rate
even if the complex is formed, since the slow R → V transfer competes with dissociation
back to reactants. Similarly slow V → R transfer in the exit channel complex results in
central barrier recrossings seen in the trajectory calculations (see Fig. 2.4), which invalid
the assumption of a transition state in statistical theories [Wang et al., 1994; Sun et al.,
2001; Cheon et al., 2006]
For the formation of an entrance channel ion-dipole complex in SN2 reactions impact
of the ion on the backside of the methylhalide molecule, i.e. the side of the CH3 umbrella,
is required (see Fig. 2.3). Nevertheless trajectory calculations uncover that oriented colli-
sions, where the dipole points exactly along the line of centers, do not lead to the formation
of a collision complexes. This is a direct consequence of the poor T → V energy trans-
fer. The oriented trajectories, which are the ones that follow the minimum energy path
depicted in Fig. 2.3, can however undergo a direct substitution mechanism without trap-
ping in either of the potential energy wells [Hase, 1994]. Direct nucleophilic substitution
11

Chapter 2. Anion-Molecule Reactions
Figure 2.5: Result of a molecular dynamics calculation of an SN2 reaction at 0.7 eV showing the impact angle
at the hard-sphere radius for trajectories starting at uniform angular distribution (open squares) and the reaction
probability for direct substitution (solid circles) [Su et al., 1998]. The narrow distributions stem from self-alignment
of ion and dipole and a steric cone of acceptance for reactive collisions.
becomes important for higher collision energies [Wang et al., 2003] and initial vibrational
excitation of the neutral reactant, while high rotational excitation is counterproductive
since it impedes oriented collisions. Fig. 2.5 shows the distribution of impact angles (open
squares) at the hard-sphere radius relative to the oriented trajectory for the system F− +
CH3Cl at a collision energy of Erel = 0.7 eV [Su et al., 1998]. Most of the collisions occur
at an angle of incidence of less than 60, which indicates the ability of the ion-molecule
partners to orient themselves to a rear attack position upon collision. The solid circles
represent the fraction of trajectories, which form products, and hence correspond to the
reaction probability at the particular collision angle. As can be seen direct reaction is
probable only in a narrow“cone of acceptance” around direct backside attack. Such steric
limitations are an additional cause of low rate coefficients as compared to the capture
limit for both cationic and anionic ion-molecule reactions. Direct and indirect reaction
mechanisms found in classical molecular dynamics simulations are visualized in animated
trajectories 2, which give an intuitive insight into the microscopic reaction dynamics.
Quantum dynamical calculations are suited to overcome some of the intrinsic limita-
tions of classical molecular dynamics simulations [Clary, 1998; Schmatz, 2004]. Among
them are conservation of zero-point energy, quantized energy levels, and tunneling ef-
fects. Quantum calculations have been very successful in providing state-to-state reac-
tion dynamics of small systems with three or four predominantly light atoms [Alexander
et al., 2002; Che et al., 2007]. Since computationally expensive, solving the Schrodinger
2see Hase’s group homepage http://monte.chem.ttu.edu/group/
12

Figure 2.6: Feshbach and Shape resonances for a nucleophilic substitution reaction as derived from a reduced-
dimensionality quantum calculation [Schmatz, 2004]. This behaviour stems from coupling of the reaction coordinate
to transversal degrees of freedom affiliated with internal modes.
Equation for SN2 reactions, where at least six atoms are involved, yet requires reduced
dimensionality models. At the moment up to four dimensions of molecular freedom can
be explicitly taken into account [Hennig and Schmatz, 2005]. As depicted in Fig. 2.6 a this
allows to include two totally symmetric modes of the methyl group (symmetric stretch
and umbrella bend) beside the mandatory stretching vibrations, which form the reaction
coordinate. It came as a surprise that the umbrella mode and even the high energy C-
H stretching mode (ν1 in Fig. 2.6 a) can not be regarded as spectators [Schmatz, 2004].
Instead the collective excitation of specific modes is particular efficient in driving the re-
action. Since relative translational energy can be temporarily stored in internal degrees
of freedom not coupled to the reaction coordinate, the reaction probability is character-
ized by narrow Feshbach resonances (see Fig. 2.6 b). The quasi-bound states persist until
energy is redistributed from the transversal degrees of freedom [Zare, 2006]. Since these
couplings rely on anharmonicities in the potential, scattering resonances can have very
long lifetimes. Outside the scattering resonances, the reaction probability is practically
negligible. In addition, avoided crossings between adiabats corresponding to different vi-
brational excitation mediate vibrationally nonadiabatic transitions and enhance the reac-
tivity [Schmatz, 2004]. Also tunneling entails strong mixing between different vibrational
states, especially in the region of the central reaction barrier. While experiments which
map out the resonance structure of nucleophilic substitution reaction rates seem far ahead,
spectroscopy on intermediate model systems reveals lines showing up as doublets, which
is a fingerprint for tunneling through the central reaction barrier [Dopfer, 2003].
Direct experimental insight into reaction dynamics is obtained from crossed molecular
beam experiments. Measurements of angle-differential cross sections for ion-molecule re-
actions have been performed with this technique and a rotatable detector [Herman, 2001].
For anion-molecule reactions these scattering experiments focus especially on reactive and
13

Chapter 2. Anion-Molecule Reactions
nonreactive collisions of O− and OH− ions with H2 and D2 [Carpenter and Farrar, 1997a;
Carpenter and Farrar, 1997b; Lee and Farrar, 2000; Li et al., 2005]. For these reactions,
which proceed on double-minimum potential surfaces, population of vibrational states in
OH− and OD− products could be measured. Both forward and backward scattering is
observed and contributions from direct and collision complex mechanisms suggested. For
nucleophilic substitution reactions, crossed beam scattering experiments were not avail-
able to date. A number of other techniques have accessed effects of reaction dynamics
[Laerdahl and Uggerud, 2002]. The Cl− + CH3Br reaction rate shows a strong dependence
on the relative translational energy, while being at the same time insensitive to the inter-
nal temperature of the reactants [Viggiano et al., 1992; Craig and Brauman, 1997]. Such
behaviour is in clear contradiction to the statistical assumption of rapid randomization
of all the available energy in the Cl− · CH3Br pre-reaction complex. Translational energy
spectra from unimolecular decomposition of metastable ion-dipole complexes show en-
ergy partitioning in disagreement with statistical phase space theory [Graul and Bowers,
1994; Graul et al., 1998]. These results indicate that the fragments are internally excited
and that this holds true also for larger systems, which should feature longer complex
lifetimes. Guided ion beam studies provide high-resolution cross sections of competing
reaction channels [Angel and Ervin, 2001] showing that the highest probability for nucle-
ophilic substitution is obtained for low collision energies. The axial velocity distribution
of Br− products from Cl− + CH3Br is found to be symmetric for 0.1 eV relative collision
energy and in agreement with a statistical model, while backward scattering of Br− is
dominating for 0.2 - 0.6 eV and forward scattering above 0.6 eV [Angel and Ervin, 2003].
Time-resolved photoelectron spectroscopy has been employed to trace the symmetric SN2
half-reaction in I− + CH3I [Wester et al., 2003]. A femtosecond laser pump pulse is used
to initiate interaction by photodissociation of I−2 in the precursor cluster I−2 · CH3I and a
delayed second pulse probes the photoelectron spectrum of the I− anion. While a low fre-
quency pump pulse yields stable [I− · · · CH3I]∗ complexes, higher photon energies evoke
a biexponential decay to reactants on timescales of 0.8 and 10 ps.
14

Chapter 3
Hot Fields for Cold Ions
3.1 Capturing ions in inhomogeneous radiofrequency
fields
Central to the understanding of particle confinement in oscillating fields is the concept of
dynamical stabilization. Dynamical stabilization opens up a way around the impossibility
of creating a static potential minimum in three dimensions, manifested in Earnshaws
theorem [Earnshaw, 1842]. The motion of a dynamically stabilized particle may yet be
described in good approximation as adiabatic motion governed by an effective potential,
which provides the desired minimum. The inverted pendulum [Landau and Lifschitz,
2004], the marble on a rotating saddle [Kaiser, 2006], the electrodynamic Paul trap [Paul,
1990] for charged particles, the electrodynamic trap for polar molecules [van Veldhoven
et al., 2005] or for polarizable atoms [Schlunk et al., 2007], the optical dipole trap [Chu
et al., 1986; Grimm et al., 2000] and the a.c. magnetic trap for ultracold atoms [Cornell
et al., 1991] all use this principle of converting an intrinsically unstable arrangement of
trapping fields into a stably confining situation by applying rapidly oscillating potentials.
To recover the adiabatic approximation leading to the effective potential, the classical
derivation from the textbook of Landau and Lifshitz [Landau and Lifschitz, 2004] on
Mechanics, which follows an idea by Kapitza [Kapitza, 1951], is quoted in a nutshell
and applied to the trapping of a charged particle in an oscillating electric field. We
then employ one dimensional numerical simulations of ion trajectories in quadrupole and
multipole traps and unravel the need for quasi-field free trapping conditions. Finally we
introduce the 22pole trap, which we apply for the study of anion-molecule interactions.
15

Chapter 3. Hot Fields for Cold Ions
Figure 3.1: Trajectory of a charged particle in a time-oscillating electric field E(r)cos(ωt). The particle
follows the field and exerts a quiver motion. In case of a homogeneous field E(r) = E(0) as shown in (a), the
average position of the particle remains unchanged and the amplitude of the quiver motion is constant. For an
inhomogeneous field (b) an additional slow drift R(t) towards the weaker field region is induced.
3.1.1 Effective potential approximation
The classical equation of motion of a particle of charge q and mass m moving in an
electromagnetic field E(r, t) and B(r, t) is given by
mr = qE(r, t) + qr×B(r, t). (3.1)
For inhomogeneous and time-dependent electromagnetic fields, this equation can be solved
analytically only for very special cases. However, many of the general properties of ion
confinement in these fields can be understood in terms of the adiabatic approximation. In
the absence of quasistationary magnetic fields, the Lorenz force can be neglected for heavy
particles in weak electric fields, which move at velocities r small compared to the speed of
light [Friedman et al., 1982]. These conditions are safely fulfilled for radiofrequency ion
traps and mass filters.
We consider an electric field oscillating with angular frequency ω = 2πf and amplitude
E0(r)
E(r, t) = E0(r)cos(ωt). (3.2)
Since the instantaneous acceleration of the charged particle is proportional to the instan-
taneous force exerted the particle will undergo an oscillating motion, the so called quiver-
or micromotion. This is demonstrated in Fig. 3.1, which shows the trajectory of a charged
particle obtained by solving the equation of motion numerically. For the case of a field
homogeneous in space as shown in (a), the average position of the particle is unchanged.
In case of an inhomogeneous field (b), however, an additional time-averaged drift motion
is induced, which forces the ion into regions of weaker fieldstrength. This drift motion is
referred to as the secular motion.
We therefore seek for a solution of the equation of motion (3.1) by separating the ion
motion r(t) into a smooth drift and a rapidly oscillating term. For simplicity we restrict
16

3.1. Capturing ions in inhomogeneous radiofrequency fields
ourselves in this section to one dimension writing
r(t) = R(t) + ξ(t). (3.3)
Inserting this ansatz into the equation of motion (3.1) and expanding E(r, t) into a Taylor
series around R up to first order, we find
mR + mξ = qE(R, t) + qξ∂E(R, t)
∂R(3.4)
The adiabatic approximation relies on a small amplitude of the micromotion ξ(t). The
equation of motion (3.4) can then be separated into equations describing the micromotion
ξ(t) and the smooth or secular motion R(t) by considering different timescales. During
one oscillation period 2π/ω of the field the function R(t) is almost unchanged and the
factor ξ is small, such that we get on a short timescale
mξ = qE(R, t). (3.5)
Inserting (3.2) into the equation of micromotion (3.5) and integrating we get
ξ(t) = −qE(R, t)
mω2= −qE0(R)
mω2cos(ωt). (3.6)
Hence the micromotion follows the oscillation of the field with amplitude ξ0 =
−qE0(R)/(mω2). As expected, heavy particles damp the oscillation, whereas highly
charged ions and electrons exhibit trajectories with large amplitude. A Fourier analy-
sis of numerically determined trajectories is done in the next section. It shows that the
higher-order-contributions neglected in the adiabatic approximation result in weak fre-
quency components appearing at multiples n×ω/(2π) (n ∈ N) of the frequency of the
field.
To treat the secular motion R(t), we average the equation of motion (3.4) over one
period 2π/ω of the oscillating field. Within the adiabatic approximation the amplitude of
the oscillating field E0(R(t)) can be regarded constant during the oscillation, such that the
zeroth order in the Taylor expansion vanishes because of∫ t+2π/ω
tcos(ωt)dt = 0. Similarly
the amplitude of the micromotion is constant such that ξ vanishes and we are left with
mR = q ξ∂E(R, t)
∂R= − q2
mω2E(R, t)
∂E(R, t)
∂R, (3.7)
where the bar labels the described averaging. We can now write the secular equation of
motion for the drift R(t) as
mR = −∂Veff
∂R, (3.8)
introducing
Veff =q2
2mω2E(R, t)2 =
q2
2mω2E0(R)2 cos2(ωt) =
q2
4mω2E0(R)2. (3.9)
17

Chapter 3. Hot Fields for Cold Ions
An additional electrostatic field Es(r) = −∇V (r) will result in an additional contribu-
tion + qV0(R) to the effective potential (3.9) in a straightforward manner. Hence the
oscillating field gives rise to a time-independent potential, which scales quadratically with
the amplitude E0(R) of the oscillating field. This potential is usually referred to as the
effective potential and completely determines the secular motion via eqn. (3.8). As such,
it appoints the time-averaged spatial distribution of the ion in the rf field and opens up an
easy way to sufficiently characterize the trapping capabilities of arbitrary field geometries
without solving the full time-dependent equation of motion (3.1) explicitly.
By integrating the secular equation of motion (3.8), one obtains conservation of energy
Etot =1
2mR2 + Veff . (3.10)
Within the adiabatic approximation the total energy is hence dynamically shared between
kinetic energy of the smooth secular motion and potential energy within the effective
potential. By comparing eqn. (3.9) and (3.6), we find that the effective potential is equal
to the time-averaged kinetic energy of the micromotion
Veff =1
2mξ2. (3.11)
This uncovers the complementary understanding of the total energy as being frequently
reallocated among the drift and the oscillating motion.
It should be noted, however, that the adiabatic approximation breaks down, once the
assumption of a small-amplitude micromotion becomes invalid. The introduction of non-
adiabatic ion motion will result in a rapid transfer of energy from the field to the ion
motion. Due to the coupling of micromotion and secular motion this leads to rapid ion
loss, even if the ion oscillation stays smaller than the size of the trap (see Section 4.1).
3.1.2 Quadrupole and multipole ion traps
Radiofrequency quadrupole traps are unique because the ions’ equation of motion can
be reduced to a set of decoupled, one-dimensional differential equations of the Mathieu
type, which can be solved analytically. The stability of ion trajectories depends only on
two dimensionless parameters a2 and q2 incorporating the ions charge to mass ratio, the
trap’s radius and operating frequency and the static and oscillating voltages applied to
the trap’s electrodes. They are independent of the starting condition of the ion. Since
the stability parameters are global throughout the trap, quadrupoles can be used as mass
filters. Quadrupole mass filters are extensively used as workhorses both in scientific and
commercial mass spectrometric applications [Gosh, 1995].
For the efficient preparation of cold ensembles of molecular ions by sympathetic cooling
with a buffer gas quadrupoles are not so favourable and high order multipole traps are to
18
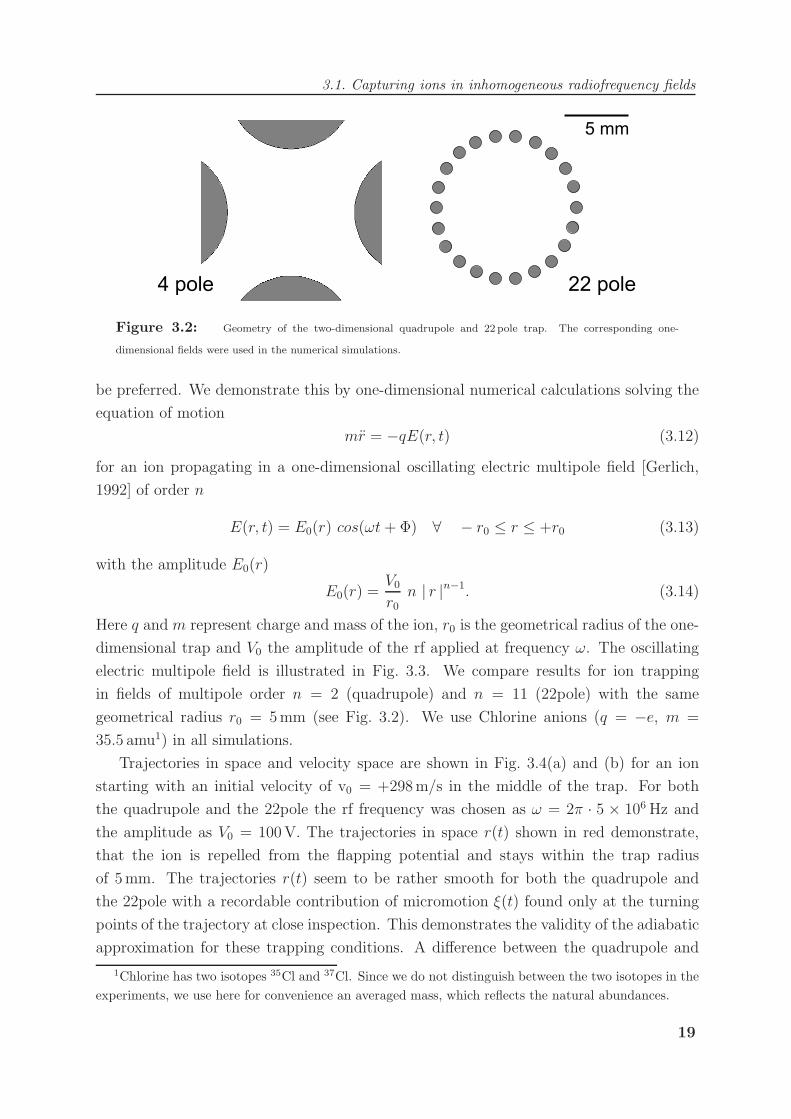
3.1. Capturing ions in inhomogeneous radiofrequency fields
Figure 3.2: Geometry of the two-dimensional quadrupole and 22 pole trap. The corresponding one-
dimensional fields were used in the numerical simulations.
be preferred. We demonstrate this by one-dimensional numerical calculations solving the
equation of motion
mr = −qE(r, t) (3.12)
for an ion propagating in a one-dimensional oscillating electric multipole field [Gerlich,
1992] of order n
E(r, t) = E0(r) cos(ωt + Φ) ∀ − r0 ≤ r ≤ +r0 (3.13)
with the amplitude E0(r)
E0(r) =V0
r0
n | r |n−1. (3.14)
Here q and m represent charge and mass of the ion, r0 is the geometrical radius of the one-
dimensional trap and V0 the amplitude of the rf applied at frequency ω. The oscillating
electric multipole field is illustrated in Fig. 3.3. We compare results for ion trapping
in fields of multipole order n = 2 (quadrupole) and n = 11 (22pole) with the same
geometrical radius r0 = 5 mm (see Fig. 3.2). We use Chlorine anions (q = −e, m =
35.5 amu1) in all simulations.
Trajectories in space and velocity space are shown in Fig. 3.4(a) and (b) for an ion
starting with an initial velocity of v0 = +298 m/s in the middle of the trap. For both
the quadrupole and the 22pole the rf frequency was chosen as ω = 2π · 5 × 106 Hz and
the amplitude as V0 = 100 V. The trajectories in space r(t) shown in red demonstrate,
that the ion is repelled from the flapping potential and stays within the trap radius
of 5 mm. The trajectories r(t) seem to be rather smooth for both the quadrupole and
the 22pole with a recordable contribution of micromotion ξ(t) found only at the turning
points of the trajectory at close inspection. This demonstrates the validity of the adiabatic
approximation for these trapping conditions. A difference between the quadrupole and
1Chlorine has two isotopes 35Cl and 37Cl. Since we do not distinguish between the two isotopes in theexperiments, we use here for convenience an averaged mass, which reflects the natural abundances.
19

Chapter 3. Hot Fields for Cold Ions
r [m]0 0.001 0.002 0.003 0.004 0.005 0.006
E(r
,t)
[a.u
.]
-1
-0.5
0
0.5
1
)φt + ωcos(
startv
Figure 3.3: One dimensional oscillating electric multipole field of order n =11 according to eqn. (3.13) as used
in the numerical simulations. If not noted otherwise, the ions start at r = 0 at random phase Φ with a velocity
v0, that is either fixed or drawn from a 2D Maxwellian distribution at temperature T. They are propagated ion by
ion by solving the equation of motion (3.12) numerically. For the finite velocities discussed in this section, the ions
are rejected by an effective potential created by the oscillating field. Loss processes for higher ion velocities studied
with the same model are discussed in section 4.1.
the 22pole is observed in the amplitude r0 of the trajectories r(t) and the time between
two reflections from the oscillating wall. Within the first 60µs, the ion undergoes 9
reflections for the quadrupole with an amplitude of r0 ≈ 1 mm and only 2 reflections for
the 22pole at r0 ≈ 3.5 mm. The trajectories in velocity space are shown as black line in the
same panels (a) and (b). Despite the delusive impression of space trajectories dominated
by smooth secular motion, the ions velocity v(t) is found to be rapidly oscillating with
considerable amplitude. A Fourier analysis of v(t) shown as blue line in panels (e) and
(f) of Fig. 3.5 unravels, that these oscillations follow the rapid frequency frf = ω/(2π)
imposed by the rf field. Therefore the spatial displacements are small on the scale of
the amplitude of the secular motion and were hard to identify in the trajectory in space
r(t). The inset into Figure (b) showing a zoom into the trajectory in velocity space
v(t) clarifies, that the initial velocity is in fact not reached after one period ω. This is
because the ion is stronger repelled during the repulsive halfcycle than it was accelerated
during the attractive halfcycle of the flapping field when the velocity is directed outwards
and the absolute value of the field is monotonically increasing with the radius. On the
other hand the ion is accelerated by the inverted mechanism when its velocity is directed
inwards. These observations form the basis of what might be interpreted as an effective
potential. The effective potential is equal to the time-averaged kinetic energy of the
micromotion (eqn. (3.11)). Distinct differences can be seen comparing the trajectories v(t)
20

3.1. Capturing ions in inhomogeneous radiofrequency fields
for quadrupole and 22pole. In the case of the quadrupole, the oscillation has considerable
amplitude throughout the trap and the starting velocity of v0 = 298 m/s is reinstalled
only during a short time in the vicinity of the turning points. This is verified by looking
at the velocity distribution given in panel (c) (obtained by tracking the ion for 100 us
after propagation times of 0.1 ms and 1 ms respectively). The initial velocity can hardly
be guessed by looking at the distribution. In contrast for the 22pole the velocity oscillates
only at the turning points of the trajectories in space. After the ion is reflected and
propagates back to the center of the trap, the oscillation decays rapidly off and the ion
propagates at the initial velocity v0. This fact shows up as pronounced peak at v0 in
the velocity histogram (d). Note however, that for an amplitude of 100 V the maximal
velocity of the ion reached at the turning point is very similar for the quadrupole and the
22pole.
The observed behaviour is straightforward to understand considering our results from
the last section. Following eqn. (3.3), which states that the ion motion in space r(t) is
composed of a smooth secular motion R(t) and an oscillating micromotion ξ(t), we get
v(t) = V (t) + ξ(t). (3.15)
Hence also the trajectories in velocity space can be decomposed in a smooth and an
oscillating contribution. In analogy we call ξ(t) the velocity micromotion although it is
not necessarily small also within the adiabatic approximation. The amplitude ξ0 of the
velocity micromotion as obtained from eqn. (3.6) is
ξ0 = −qE0(r)
mω∝ | r |n−1 (3.16)
and hence follows the field amplitude E0(r). Recalling that the field amplitude for an ideal
multipole field of order n scales as | r |n−1 (3.14) explains the observed distinct differences
in the oscillation of the velocities of ions stored in quadrupole (n=2) and 22pole (n=11)
fields. The amplitude of the spatial micromotion ξ0(t) will follow the same behaviour
according to eqn. (3.6) but is small due to the additional 1ω
factor. Using (3.9) one
may write ξ20 = 4/mVeff and for the point of return, where for the conservative case,
i.e. within the adiabatic approximation, the initial kinetic energy equals the effective
potential, therefore1
2mv2
0 = Veff = ξ2max
m
4. (3.17)
This means that within the adiabatic approximation the maximal amplitude of the velocity
micromotion is ξ0 =√
2 v0 independent of the multipole order. To compare this to the
simulations, we have split up the velocity trajectories v(t) depicted in panel (a) and (b)
into the secular contribution V(t) and the oscillating velocity micromotion ξ(t), drawn
in panel (a1) and (b1) in black and green respectively. V(t) was derived by averaging
21

Chapter 3. Hot Fields for Cold Ions
Figure 3.4: Results for the 1D rf simulations for n=2 and 11. Panels (a) & (b) show typical trajectories in
space and velocity representation. The velocity v(t) has been split up into secular and ... (see RHS)
22

3.1. Capturing ions in inhomogeneous radiofrequency fields
Figure 3.5: ... oscillating contributions as depicted in (a1) & (b1). In contrast to the quadrupole, velocity
micromotion is found only at the geometrical turning points for the high order multipole. Velocity histograms for
an ion starting with v0 = + 298 m/s at r0 = 0 are shown in (c) & (d). The initial velocity is much better conserved
for the 22pole. The Fourier analysis of v(t) and the rf in (e) & (f) shows oscillation of the ion at the rf frequency frf
and weak contributions from higher orders. The trap frequency shows up as leftmost peak. The structure marked
with a star stems from the FT of the boxlike smoothed velocity V (t). The double peak structure for the quadrupole
and broadened peak for the 22pole is due to beating of the different frequency components. Panel (i) & (j) show
the spatial distribution obtained by tracking 1000 ions chosen from a thermal distribution at T=300K for 1ms.
The distributions overall follow the effective potential given in (g) & (h). In (k) & (l) the velocity distribution after
two propagation times is shown. All results were obtained for two different rf amplitudes as indicated by the color
code.
23

Chapter 3. Hot Fields for Cold Ions
the velocity v(t) over one period of the rf field, ξ(t) is then obtained as v(t) - V(t). The
maximal amplitude of the velocity micromotion ξ(t) is reached near the turning point
of the ions in space. It is found to be very similar for the case of the quadrupole and
the 22pole and in good agreement with the predicted value of√
2 v0. At close inspection
the maximal amplitude for the quadrupole is found to be slightly higher than for the
22pole, which might be taken as first indication, that the zeroth order approximation is
insufficient at the large oscillations near the turning points.
Most instructive in understanding the trapping conditions is to compute the effective
potential for an ideal multipole field of order n from the electric field (3.14). We find
Veff(r) =1
8
(qV0)2
εr2n−2, (3.18)
where ε is the characteristic energy
ε =1
2n2mω2r2
0. (3.19)
The effective potential Veff(r) is plotted for quadrupole and 22pole in Fig. 3.5 (g) and (h)
for two different rf amplitudes of V0 = 100 V and 1000 V, cut at 10× kBT for T = 300 K.
Whereas Veff is harmonic for the case of the quadrupole, it follows an r20 behaviour
for the 22pole creating a quasi field-free environment confined by steep walls. Recalling
that the effective potential Veff determines the spatial secular motion R(t) via eqn. (3.8)
demonstrates, why R(t) is a sinusoidal function for the quadrupole and a zigzag for the
higher order multipole. Since the velocity secular motion V (t) obeys V (t) = R(t) it has to
follow a cosine for the quadrupole and a rectangular function for the 22pole. These shapes
of V (t) are also recovered in the Fourier transformations of the ion velocity trajectories
v(t), which are shown in panel (e) and (f). For the case of the quadrupole, we find a
single peak at the repetition rate of the spatial oscillation of the ion. For the 22pole, this
trap frequency ftrap is much lower, reflecting the shallower ion confinement. In addition
a series of peaks (*) at a distance of 2 ftrap is observed, since the Fourier transform of a
rectangular function is a sinc function.
To calculate the spatial distribution of a thermal cloud of stored ions, we draw starting
velocities from a 2D Maxwellian distribution at temperature T
vs =√
v21 + v2
2 with vi ∈ f(vi) =1
σ√
2πe−v2
i /(2σ2) (3.20)
and σ =√
kBTm
. Ion propagation is processed ion by ion neglecting their interactions.
They start at r = 0 with random phase Φ of the rf field. For 1000 ions we fill their
position into a histogram at each timestep during a propagation time of t = 1 ms. During
this time averages of 44 and 163 reflections from the potential wall were recorded for the
22pole and the 4pole respectively. The resulting spatial distributions are shown in Fig. 3.5
24

3.1. Capturing ions in inhomogeneous radiofrequency fields
(i) and (j). The profile in the 22pole is almost boxlike and extends over most of the traps
diameter of 2 r0 = 10 mm, whereas for the quadrupole ions are squeezed in the center.
The overall shape resembles the effective potentials shown in (g) and (h). This is not
unexpected since in the absence of ion-ion interactions the effective potential governs the
secular motion, which appoints the spatial ion distribution. As might be seen from the
figure application of higher rf amplitudes V0 results in a strong compression of the ion
cloud in a quadrupole field. In contrast, the trapping volume in a higher order multipole
field is not so sensitive to the amplitude. This is also reflected in weak and strong shifts of
the frequency of spatial oscillation of the ion in the trap as can be seen from the Fourier
transformations of the velocity trajectories v(t) shown in panel (e) and (f). Interestingly
small caps are found in the calculated spatial distributions at large radii, which deviate
from the effective potential. This further substantiates, that the adiabatic approximation
is in question at the turning points, where the micromotion is largest. The ions spend
here more time since they have to reverse their velocity. The contribution of higher order
terms in the Taylor expansion (3.4) can be directly seen in the Fourier transformations
of v(t) as peaks appearing at multiples of the radiofrequency frf = ω/(2π). For the
case of the quadrupole, where the ion spends a lot of time in the region of strong field,
these contributions strongly grow when increasing the rf amplitude. The simulated ion
profiles are compared with measured distributions in our linear two dimensional 22pole
trap in Section 4.2, which also show a larger ion density near the turning points of the
ion trajectories.
High order multipole fields with their quasi field-free environment minimize distur-
bance of the ion motion and preserve an initial velocity of the ion much better. This
is an absolute requirement for guiding ion beam techniques working with nonthermal
velocity distributions. For the preparation of cold ensembles of molecular ions by sympa-
thetic cooling with a buffer gas other aspects come into play which need to be mentioned.
First due to the pertinent strong oscillations of the ion velocity velocity distributions in
a harmonic trap are never thermal. This can be seen from the disturbance of the ini-
tial Maxwell-Boltzmann distribution in Figure 3.5 (k) after ion propagation, whereas the
original distribution is preserved also in its small details for the case of the high order
multipole trap in panel (l). Second, collisions with the buffer gas introduce a mechanism
of energy redistribution. When these statistically distributed collisions take place during
heavy oscillations of the ions velocity driven by the rf field, energy can be carried into the
system rather than being removed. In high order multipole traps, most of the collision
take place at very low fields, such that the thermalization of the ions with the buffer gas is
not disturbed by rf driven collisions. Third, when preparing larger ensembles of cold ions
that are necessary for doing experiments, ion-ion interactions need to be considered. We
have investigated this using a Debye-Huckel type model [Eisenbarth, 2001], which treats
25

Chapter 3. Hot Fields for Cold Ions
Figure 3.6: Ion distributions in the presence of space charge obtained from a mean field approach [Otto,
2006b]. The ions are pushed towards larger radii. For the case of the quadrupole the cloud covers a much larger
region of the trap for strong space charge than compared to weak space charge and will hence be strongly heated
by the rf field. This effect is minimized for the 22pole, where the overall size of the ion cloud stays the same due to
the steep confining walls of the trap.
the interaction of the ions as an additional mean field, that needs to be considered in
addition to the confining potential of the trap [Otto, 2006b]. Fig. 3.6 shows the result-
ing ion distribution according to our model for 103 ions, where space charge effects are
supposed to be small and for 3 × 10⁶ ions, which represents the space charge limit for
a 22pole of the usual dimensions. The mean field pushes the ions outward in the trap.
For the high order multipole trap, the diameter of the ion cloud in the trap is however
not changed due to the steep confining walls. In contrast the tightly confined ion cloud
in the quadrupole is strongly broadened. A large fraction of the ions hence climbs much
higher up in the effective potential than intended by the temperature of the buffer gas.
Due to the permanent redistribution of potential and kinetic energy it will therefore not
be possible to create a thermalized ion ensemble.
3.1.3 Disturbed multipole fields
In this section we consider the effect of an additional static patchfield that stems from
a pointlike charge located at the geometrical radius r0 = 5 mm of the 22pole trapping
device. This analysis is very relevant since multipole ion traps are usually operated at
cryogenic temperatures, where residual gas especially from the ion source or impurities
26

3.1. Capturing ions in inhomogeneous radiofrequency fields
in the buffer gas will freeze out and hence also be deposited on the rods and endcaps
of the trapping device. Due to the injection of ions, which are too fast to be stored the
frozen bulk might be charged up. The same holds true for ceramic insulators holding the
static endcaps. One finds that continuous operation for many days at low temperature
significantly reduces the storage time if a strong ion source is employed and that the
original conditions can be recovered by heating up the trap and cooling down again.
We use the one-dimensional numerical model described in the last section and add
as additional term to the equation of motion (3.12) the Coulomb force acting on the
propagated ion of charge q in the static field of a pointlike charge Q
Fstatic(r) = −q∂
∂rVstatic =
4πε0
1
(r0 − r)2. (3.21)
The effective potential is hence modified as Veff = Veff + qVstatic and show in Fig. 3.7(a)
and (b) (keep in mind that ions are negative ions in our case with q = −e). At a
patchcharge of Q = 5 ×10⁴e the effective potential is significantly, at Q = 5 ×10⁵e
strongly distorted.
Panels (c) - (h) and (o) show the velocity distribution of an ion starting with a velocity
of v = +298 m/s in the middle of the trap recorded by tracking the ions velocity for 100µs
after 0.1 ms and 10 ms propagation, respectively. The distribution does not change for the
two timings and shows, that the ion is still trapped and not lost. The effect of a positive
patchcharge +Q is shown on the right, whereas negative patchcharges −Q are displayed
on the left. For Q = ±5 × 10⁴e the obtained velocity distributions look very similar
to the unperturbed case in Fig. 3.4(d). For increasing Q however, the distributions are
heavily disturbed and the ion is strongly heated. The effect is more dramatic for positive
patchcharges +Q. Extensively high velocities of several thousand meters per second are
reached with significant probability for charges of Q = ±5 × 10⁵e and Q = ±5 × 10⁶e.
Beyond this point trapping is impossible. These effects are not unexpected in view of the
adiabatic approximation since the ions start in the center of the trap and roll down the
modified effective potential Veff . The trajectories in phase space shown in panel (i) and
(j) reveal this acceleration in the static field towards the potential wall. The ions reach
it with high velocity and undergo heavy oscillations. Once the acceleration is too strong,
the ion cannot be repelled from the rf field any more. The spatial distributions obtained
for Q = ±5× 10⁵e is strongly perturbed as compared to the boxlike shape in Fig. 3.5 (j)
for Q=0. The velocity distributions for an ensemble of ions drawn at the start from a
Maxwellian distribution at T=300 K is found to be non-thermal after propagation and
shifted towards higher temperatures. In general the higher rf amplitude attenuates the
effects slightly since it keeps the ions away from the disturbing charge located at the edge
of the trap.
It should however be mentioned that buffer gas helps to cool the ions into the minima
27

Chapter 3. Hot Fields for Cold Ions
Figure 3.7: Velocity distributions of an ion starting with v0 = 298 m/s in the center of a one dimensional
22pole trap with a pointlike patchcharge of size ±Q located at the geometrical radius of r0=5mm. The distributions
are heavily disturbed for increasing values of Q. Panels (a) and (b) show the modified effective potentials Veff =
Veff + qVstatic.
28
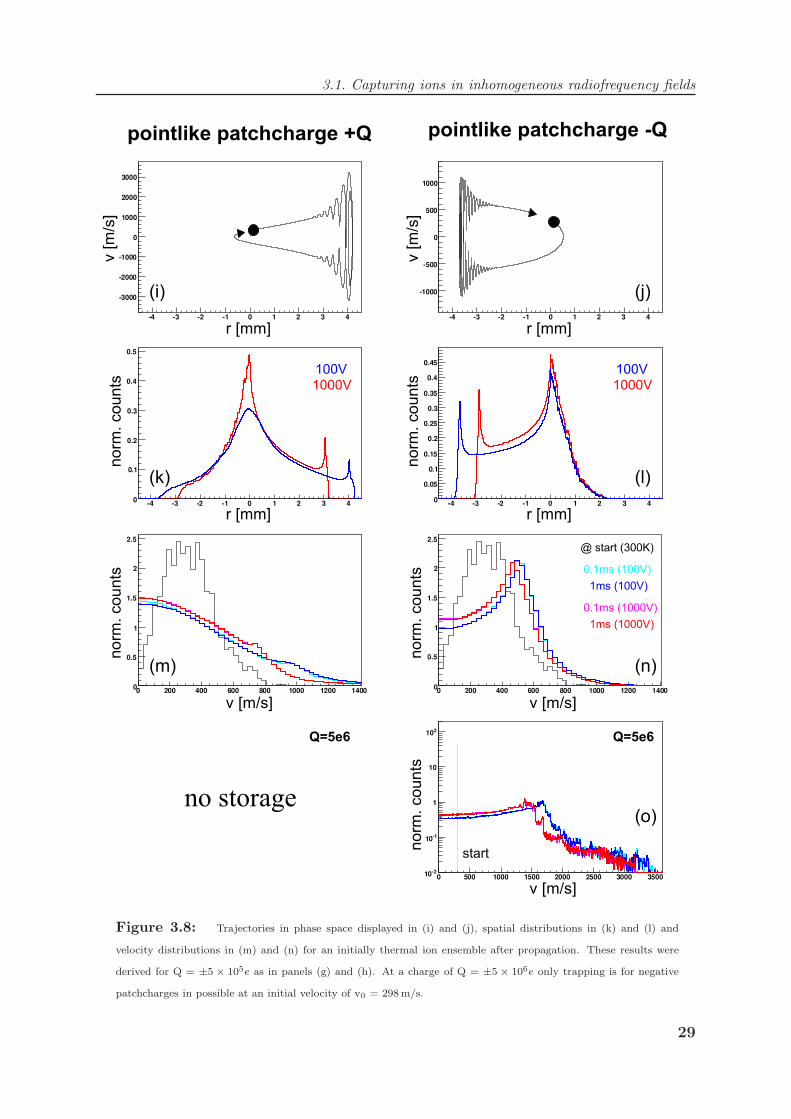
3.1. Capturing ions in inhomogeneous radiofrequency fields
Figure 3.8: Trajectories in phase space displayed in (i) and (j), spatial distributions in (k) and (l) and
velocity distributions in (m) and (n) for an initially thermal ion ensemble after propagation. These results were
derived for Q = ±5 × 10⁵e as in panels (g) and (h). At a charge of Q = ±5 × 10⁶e only trapping is for negative
patchcharges in possible at an initial velocity of v0 = 298 m/s.
29

Chapter 3. Hot Fields for Cold Ions
created by the patch field. Nevertheless these will be located near the patchcharge on the
electrodes or at maximal distance from it, in any case near the steep walls of the confining
potential where the micromotion is largest and capable of heating the ions. Also one
will loose the favourable quasi field-free environment of the high order multipole and
introduce all the effects discussed above for quadrupole trapping fields. The problem of
additional heating through patch fields demonstrates the experimental need to measure
the ion temperature in situ, a task, that we follow in Section 4.3. It also shows, that
patchcharges that hurt can be seen in the spatial distribution of the ions, which we are
measuring by photodetachment tomography as introduced in Section 4.2.
30
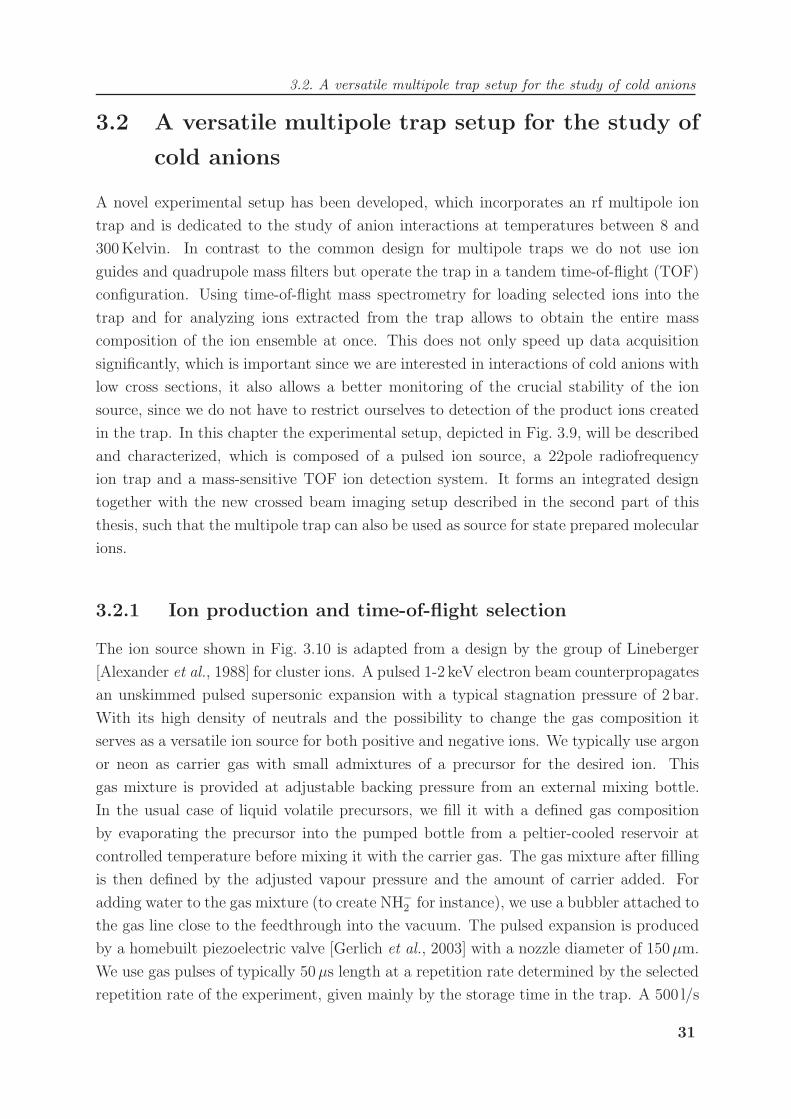
3.2. A versatile multipole trap setup for the study of cold anions
3.2 A versatile multipole trap setup for the study of
cold anions
A novel experimental setup has been developed, which incorporates an rf multipole ion
trap and is dedicated to the study of anion interactions at temperatures between 8 and
300 Kelvin. In contrast to the common design for multipole traps we do not use ion
guides and quadrupole mass filters but operate the trap in a tandem time-of-flight (TOF)
configuration. Using time-of-flight mass spectrometry for loading selected ions into the
trap and for analyzing ions extracted from the trap allows to obtain the entire mass
composition of the ion ensemble at once. This does not only speed up data acquisition
significantly, which is important since we are interested in interactions of cold anions with
low cross sections, it also allows a better monitoring of the crucial stability of the ion
source, since we do not have to restrict ourselves to detection of the product ions created
in the trap. In this chapter the experimental setup, depicted in Fig. 3.9, will be described
and characterized, which is composed of a pulsed ion source, a 22pole radiofrequency
ion trap and a mass-sensitive TOF ion detection system. It forms an integrated design
together with the new crossed beam imaging setup described in the second part of this
thesis, such that the multipole trap can also be used as source for state prepared molecular
ions.
3.2.1 Ion production and time-of-flight selection
The ion source shown in Fig. 3.10 is adapted from a design by the group of Lineberger
[Alexander et al., 1988] for cluster ions. A pulsed 1-2 keV electron beam counterpropagates
an unskimmed pulsed supersonic expansion with a typical stagnation pressure of 2 bar.
With its high density of neutrals and the possibility to change the gas composition it
serves as a versatile ion source for both positive and negative ions. We typically use argon
or neon as carrier gas with small admixtures of a precursor for the desired ion. This
gas mixture is provided at adjustable backing pressure from an external mixing bottle.
In the usual case of liquid volatile precursors, we fill it with a defined gas composition
by evaporating the precursor into the pumped bottle from a peltier-cooled reservoir at
controlled temperature before mixing it with the carrier gas. The gas mixture after filling
is then defined by the adjusted vapour pressure and the amount of carrier added. For
adding water to the gas mixture (to create NH−2 for instance), we use a bubbler attached to
the gas line close to the feedthrough into the vacuum. The pulsed expansion is produced
by a homebuilt piezoelectric valve [Gerlich et al., 2003] with a nozzle diameter of 150µm.
We use gas pulses of typically 50µs length at a repetition rate determined by the selected
repetition rate of the experiment, given mainly by the storage time in the trap. A 500 l/s
31

Chapter 3. Hot Fields for Cold Ions
Figure 3.9:
32

3.2. A versatile multipole trap setup for the study of cold anions
Figure 3.10: Electron impact ion source composed of a pulsed piezoelectric gas valve, an electron gun
and a Wiley-McLaren type time-of-flight mass spectrometer. All components are home-made. The electron beam
of typically 1 keV kinetic energy counterpropagates the supersonic expansion creating a local plasma close to the
nozzle, in which negative ions are formed via dissociative attachment of secondary electrons to a suitable precursor.
Anions are separated from cations and the free jet by pulsing the electrodes of the spectrometer when the bunch
has propagated into it and an ion beam is formed. The anions are then separated in space and time according
to their mass and might be selected by a mass gate. Electrostatic einzel lenses and deflectors take care of beam
focusing and steering.
33

Chapter 3. Hot Fields for Cold Ions
turbomolecular pump - backed by a 10 m3/h dry scroll pump (BOC Edwards XDS10)
- maintains a pressure of 1− 10× 10−5 mbar (Pfeiffer PKR 251 gauge) at a repetition
rate of 10 Hz. In case of failure the gas flow to the piezo valve is interrupted automatically
by an interlock controlled electropneumatic valve (Swagelok SS-42S6MM-A15C4AN01)
in the supply line. The electron beam bombarding the expansion head-on is made by
a homebuilt electron gun. It consists of a tungsten filament (Plano A054), which is
embedded in a repeller plate and mounted opposite to an acceleration anode followed
by an optimized einzel lens of either three or four cylinders [Erdman and Zipf, 1982]
and horizontal and vertical deflectors. Typical output currents are in the range of a few
hundred µA with a beam diameter of a few mm. The electron beam can be pulsed by
switching the voltage applied to the acceleration plates from repulsive to attractive and
vice versa. This pulsing is crucial to avoid dragging of the ions and to suppress noise on
the detector since the electron beam intersects the mass spectrometer. Also surfaces stay
much longer clean when not irradiated by a continuous electron beam. At impact position
a local plasma is created in the gas jet and negative ions form via capture of low energy
secondary electrons, often followed by subsequent dissociation or reaction.
Figure 3.11: Comb mass gate [Stormer et al., 1998] used to remove unwanted ions from the beam coming
from the source. The ions, separated in space and time according to their mass, pass alternatingly connected parallel
gold wires of 50 µm diameter spaced at 0.5mm distance. Positive and negative voltages of same size are applied to
the sets of interleaving wires in blocking mode, such that unwanted ions are deflected out of the beam. Nevertheless
the potentials compensate in the far field, such that ions of different mass are not touched. When the desired ion
mass is about to reach the gate, the voltages are quickly pulsed to zero (switching time about 50 ns), thus enabling
passage of the selected ion mass.
Ions drifting downstream the expansion enter the three grounded acceleration elec-
trodes (spaced at 20 mm) of a Wiley-McLaren mass spectrometer [Wiley and McLaren,
1955] aligned perpendicular to the ion drift direction (see Fig. 3.10). The two plates in the
direction towards the trap have holes with a diameter of 25 mm. When the ion package
34
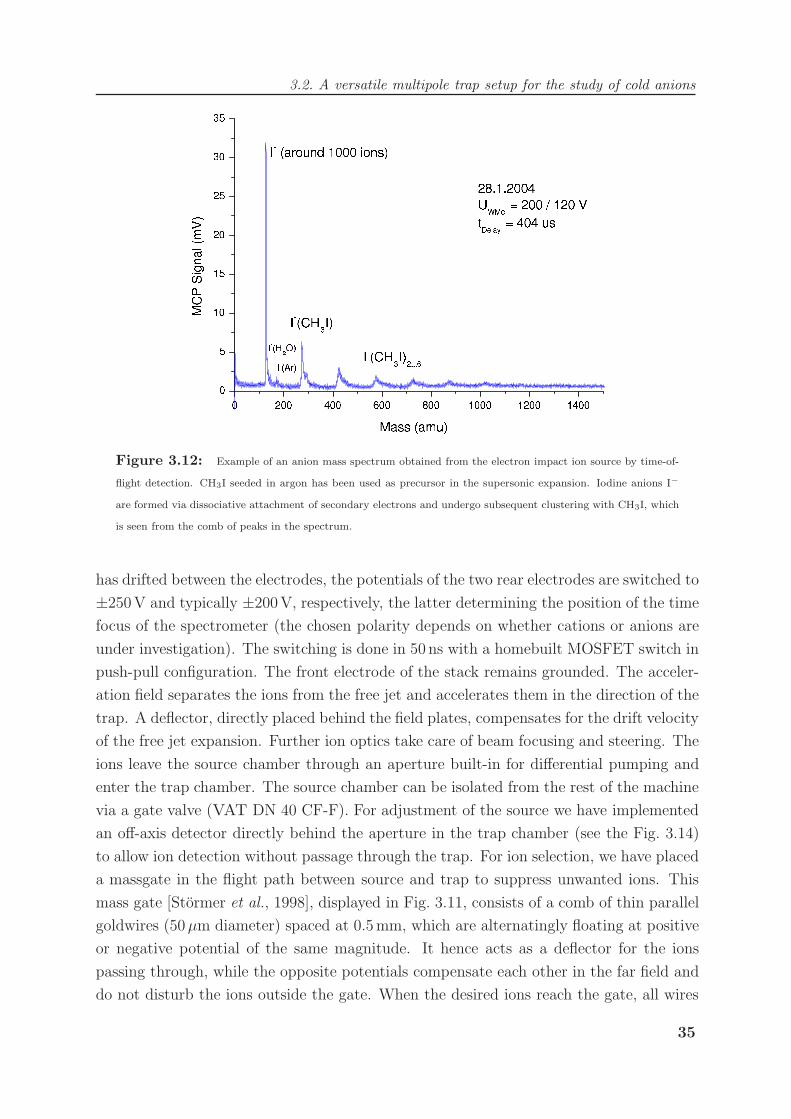
3.2. A versatile multipole trap setup for the study of cold anions
Figure 3.12: Example of an anion mass spectrum obtained from the electron impact ion source by time-of-
flight detection. CH3I seeded in argon has been used as precursor in the supersonic expansion. Iodine anions I−
are formed via dissociative attachment of secondary electrons and undergo subsequent clustering with CH3I, which
is seen from the comb of peaks in the spectrum.
has drifted between the electrodes, the potentials of the two rear electrodes are switched to
±250 V and typically ±200 V, respectively, the latter determining the position of the time
focus of the spectrometer (the chosen polarity depends on whether cations or anions are
under investigation). The switching is done in 50 ns with a homebuilt MOSFET switch in
push-pull configuration. The front electrode of the stack remains grounded. The acceler-
ation field separates the ions from the free jet and accelerates them in the direction of the
trap. A deflector, directly placed behind the field plates, compensates for the drift velocity
of the free jet expansion. Further ion optics take care of beam focusing and steering. The
ions leave the source chamber through an aperture built-in for differential pumping and
enter the trap chamber. The source chamber can be isolated from the rest of the machine
via a gate valve (VAT DN 40 CF-F). For adjustment of the source we have implemented
an off-axis detector directly behind the aperture in the trap chamber (see the Fig. 3.14)
to allow ion detection without passage through the trap. For ion selection, we have placed
a massgate in the flight path between source and trap to suppress unwanted ions. This
mass gate [Stormer et al., 1998], displayed in Fig. 3.11, consists of a comb of thin parallel
goldwires (50µm diameter) spaced at 0.5 mm, which are alternatingly floating at positive
or negative potential of the same magnitude. It hence acts as a deflector for the ions
passing through, while the opposite potentials compensate each other in the far field and
do not disturb the ions outside the gate. When the desired ions reach the gate, all wires
35
Chapter 3. Hot Fields for Cold Ions
are switched to ground, allowing the ions under investigation to pass without deflection.
With this source up to a few thousand ions can be obtained per pulse. So far we have
produced a number of positive and negative ions including H+2 , H+
3 , Ar+, Ar++, I+, N+2
and H−, H−(NH3), Cl−, Cl−(H2O)n, I−, I−(CH3I)n, NH−2 and OH−. A demonstration of
the capabilities of the ion source is given by the time-of-flight mass spectrum depicted
in Fig. 3.12, which was obtained from electron impact on CH3I seeded in argon. Iodine
anions are formed by dissociative attachment of slow secondary electrons [Alajajian et al.,
1988] and subsequently cluster with CH3I to form a comb of larger aggregates.
3.2.2 The cryogenic multipole trap
The 22pole1 rf ion trap [Gerlich, 1995], placed 80 cm downstream the acceleration elec-
trodes, is the central part of the apparatus. As depicted in Fig. 3.13 is assembled from 22
stainless steel rods with 1 mm diameter planted alternatingly into two copper sideplates,
thereby forming a cylindrical cage of 10 mm inscribed diameter. To these sideplates,
spaced at 40 mm, the two opposite phase ports of a homebuilt self-exciting rf oscillator
[Jones and Anderson, 2000] are connected. In this way in radial direction an effective
potential of multipole order n = 11 is created. The rf amplitude can be changed, also
during storage of an ion package, making it possible to catch the ions in a deep trapping
potential before ramping it down. Ion confinement along the axis is achieved by two pairs
cylindrical endcap electrodes to which small static potentials are applied. As described
below, ions are injected and extracted through these endcaps. Five shaping electrodes
are placed around the trap to shift the ions inside if needed. The sideplates holding the
rf electrodes are mounted on a copper baseplate; a copper cover put over the trap closes
backside, frontside and top. In this way the trap is completely encapsulated except of the
orifices along its axis (see Fig. 3.15). This is to allow thermalization of a buffer gas inside
the trap, which is applied through one of three ports in the baseplate. Much precaution
has been spend on the electrical insulation of the sideplates, since the used materials have
to combine electrical insulation with reasonable thermal conductivity at cryogenic tem-
peratures at at the same time maintain an excellent vacuum to avoid ion interaction with
residual gas. Sapphire sheets are used between sideplates and baseplate, to which usually
the cooling is applied. High precision ceramic rods are tightly fitting between sideplates
and cover.
The trap is loaded with a pulse of typically 103 ions from the ion source. Since the
1Much has been speculated about the conjecturally special meaning of the cipher 22. However, it isjust a geometrical constraint. To best approximate an ideal multipole field, the rod diameter d and theinscribed diameter 2r0 of the trapping device have to fulfill the relation r0 = (n− 1)d/2 [Gerlich, 1992].Hence 22 rods with d = 1 mm diameter on an inscribed diameter of 2r0 = 10mm represent the mostconvenient implementation of a high order multipole field.
36

3.2. A versatile multipole trap setup for the study of cold anions
Figure 3.13: 22pole ion trap. The radially confining field is created by 22 stainless steel rods planted
alternatingly into two copper sideplates, to which the rf is applied. These sideplates are galvanically isolated from
the trap’s baseplate and housing by sapphire and ceramic insulators, which maintain good thermal conductivity at
cryogenic temperatures. Ion confinement along the axis is achieved by small static potentials applied to two pairs
of cylindrical endcap electrodes fitted into the sideplates and isolated by ceramics. Additional shaping electrodes
around the trap are employed to eventually shift the ions inside the trap. The ion trap is 40mm long and has an
inscribed diameter of 10mm. For exact dimensions see the plot in the appendix.
37

Chapter 3. Hot Fields for Cold Ions
Figure 3.14: Interior of the trap chamber. The 22pole ion trap is mounted along the long axis of the machine.
Ions coming from the source are mass selected and decelerated since the trap is floating on a potential close to the
ions kinetic energy. A stack of ring electrodes placed before the trap allows focusing and smooth deceleration to
avoid burst of the ion beam in lateral direction. The ions are stored in the trap in radial direction by an almost
boxlike effective potential created by connecting the two opposite phase ports of a home-made oscillator to the two
alternating sets of stainless steel rods. Along the axis ions are trapped by small DC voltages applied to cylindrical
endelectrodes. Ions are extracted after the desired storage time by switching the exit-endelectrode to an attractive
potential. Vertical and horizontal deflectors and einzel lenses behind the trap help to steer and focus the beam,
which is injected into a drift section for mass analysis.
trap depth is much smaller than the kinetic energy of the ion beam, the ions need to be
decelerated. We therefore keep the trap on a potential just below the kinetic energy of
the ions coming from the source. To minimize divergence of the ion package a set of seven
ring electrodes is placed in front of the trap as seen in Fig. 3.14; their potentials can be
adjusted individually. The construction of the trap’s static entrance endcap as pair allows
to strongly focus the ion beam into the trap, which is crucial for enhancing the trapping
efficiency. The endcaps on the exit side of the trap are hold on a repulsive potential of
2-20 V with respect to the trap. Ions are then reflected from the exit cap reversing their
direction. Before they leave the trap again, the inner entrance electrode is switched to
repulsive and the ions are trapped in the cage. Since the ions come from the source with
a finite energy spread it is vital to introduce some mechanism, which makes the ions loose
energy when entering the trap. We therefore usually apply an intense pulse of helium
buffer gas in the trap with a piezoelectric valve of the type employed in the ion source.
38

3.2. A versatile multipole trap setup for the study of cold anions
Figure 3.15: The 22pole trap embedded in a copper housing, which allows application and thermalization
of buffergas at well defined density and temperature. Overhead one of the sideplates of the trap is visible, in which
one half of the trap’s linear electrodes is integrated. The device is mounted on a commercial coldhead based on a
Helium compressor. Capton heating foils wrapped around the base of the trap allow temperature variability in the
range 7.5 - 300 Kelvin. Temperature is measured with two silicon diodes (Lakeshore DT-471-CU) screwed to the
trap’s cover utilizing a sheet of Indium in between to improve the thermal contact. The gas lines are precooled by
attaching them to the aluminum shield, which is partly open on this figure. They are made from stainless steel to
reduce the amount of heat transported from the shield to the colder ion trap. We do not use capacitive coupling of
the rf to further reduce the heat entry but thin electric connections.
Ions are hence slowed down by undergoing collisions. Possible collisional excitation is
cooled once the ions are trapped in the cold bath of buffer gas. The large difference in
the masses of ions and the helium atoms is well suited for using the entire length of the
trap for ion stopping, since the initial direction of the ion is not changed too much in a
collision. With this procedure a trapping efficiency of 30-80% is achieved with respect to
the flux of ions coming from the source. To further increase the number of trapped ions,
we have successfully employed loading by multiple injections.
The entire trap with its copper envelope, which spares only the cylindrical entrance
and exit electrodes for ion injection and extraction (see Fig. 3.15), is temperature vari-
able. Ions in the trap are sympathetically cooled to the trap’s temperature by means of
collisions with a thermalized buffer gas injected into the trap’s housing through precooled
tubes. For the first experiments the trap housing was coupled to a coldfinger through
thick copper belts. Outside the vacuum, the finger extended into a liquid-nitrogen filled
dewar. For temperature variability, the copper belts were wrapped with a heating coil.
Moreover, additional heating could be applied to the copper finger outside the vacuum
39

Chapter 3. Hot Fields for Cold Ions
when no liquid nitrogen was used. With this configuration, heating of the trap to more
than 380 K and cooling to about 170 K was possible. This enabled us to do experiments
also at temperatures above room temperature, which would damage a Helium refrigera-
tor. To study ion-molecule reactions down to 7.5 K, we have replaced this arrangement
and mounted the trap directly on a commercial coldhead (Leybold Coolpower 7/25)
connected to a Helium compressor (Leybold Coolpack 4000) [Otto, 2006a]. To reach
this temperature, it is essential to shield the trap by a cooled envelope. The heat en-
try from 300 Kelvin background radiation, calculated from Stefan-Boltzmann’s law to be
about 6 Watt, would otherwise outnumber the rapidly decreasing cooling power at low
temperatures (specified cooling power at 20 Kelvin: 7 Watt). This shield, depicted in
Fig. 3.16, is manufactured from polished aluminum and held at around 50 K by the first
stage of the coldhead. The tubings for the gas inlet system are also attached to this shield
for precooling but made from stainless steel with bad heat conductivity to minimize heat
entry to the colder 22pole trap. The temperature of the trap can be varied by two capton
heating foils (Telemeter HK5275R4.3L12A) integrated in a cylindrical base of copper
placed between coldhead and ion trap. The crucial connections between coldhead, base
and trap were enhanced by placing sheets of Indium between the copper surfaces to iron
out residual coarseness of the surfaces. The temperature is measured with two silicon
diodes in 4-point-configuration (Lakeshore DT-471-CU) attached at two opposite sides
of the trap’s inner copper housing (see Fig. 3.15). While the trap chamber, pumped with
a 500 l/s turbomolecular pump, maintains a vacuum of 5×10⁻¹⁰ mbar without gas inlet
(Pfeiffer IKR 270 gauge), buffer gas and reaction gas is applied to the trap via preci-
sion sapphire valves (Leybold UD 040 HR). The buffer gas density can be determined
with the help of a gas-type-independent capacitance pressure gauge (Pfeiffer CMR 275)
connected directly to the trapping volume as might be seen from Fig. 3.16 or via the gas
load in the vacuum chamber and a calibration reaction (see also [Berhane, 2006]). The
trap/coldhead unit is attached to the trapping chamber by means of a bellow to alow
precise adjustment and at the same time mounted on rails, such that it can be moved out
in a straightforward manner (see Fig. 3.16). The trap chamber can be isolated from the
vacuum in the source and detection chamber by two gate valves (VAT DN 40 CF-F).
3.2.3 Time-of-flight mass spectroscopy of stored ion ensembles
After variable storage times ions are extracted from the 22pole into the second time-of-
flight stage by applying an attractive potential to the endcap which drags the ions out
of the trap. Acceleration is done in multiple steps with the help of a segmented endcap
electrode and three field plates placed directly after the trap. The ions pass further ion
optics before leaving the trap chamber through a small aperture and enter the differentially
pumped drift section. As can be seen from Fig. 3.9 about 100 cm downstream a deflector
40

3.2. A versatile multipole trap setup for the study of cold anions
Figure 3.16: Trap/coldhead unit readily assembled for operation (except that the trap’s endelectrode is
missing). The trap and its housing are insulated against 300K radiation by a shield, which spares out only the
endcap electrodes to allow ion injection and extraction along the trap’s axis. This shield is cooled to about 50Kelvin
by the first stage of the coldhead. Underneath the trap a pulsed piezoelectric valve, which is itself shielded against
the aluminum shield, is mounted, as can be seen from the upper image. It is dedicated to apply pulsed buffergas
into the trap for ion stopping. A versatile CF150 flange with 10 integrated CF16 flanges provides electric and gas
feedthroughs. The white Teflon tube depicted connects the trap’s chimney to a pressure independent capacitance
gauge for determination of the buffer gas density in combination with a temperature measurement of the trap and
lab. Sapphire valves seen on the mechanical drawing allow precise adjustment of the density. The trap can be
routinely moved out of the vacuum since the whole unit is mounted on rails.
41
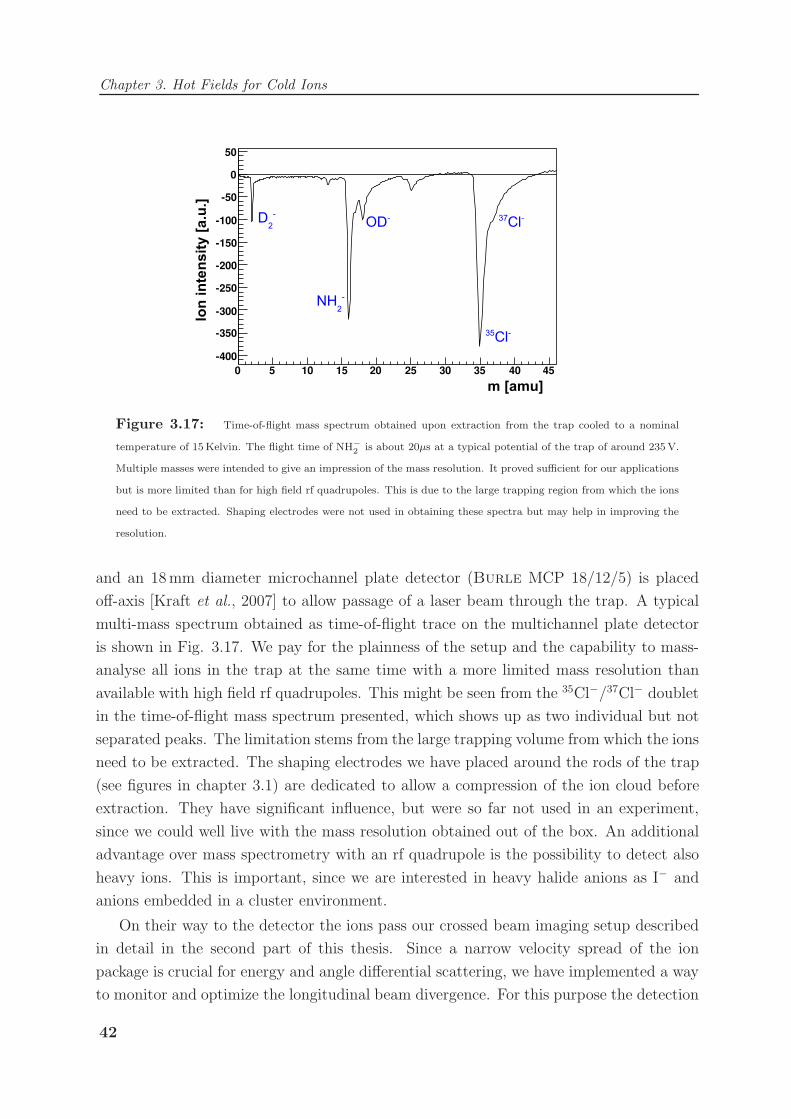
Chapter 3. Hot Fields for Cold Ions
Figure 3.17: Time-of-flight mass spectrum obtained upon extraction from the trap cooled to a nominal
temperature of 15 Kelvin. The flight time of NH−2 is about 20µs at a typical potential of the trap of around 235 V.
Multiple masses were intended to give an impression of the mass resolution. It proved sufficient for our applications
but is more limited than for high field rf quadrupoles. This is due to the large trapping region from which the ions
need to be extracted. Shaping electrodes were not used in obtaining these spectra but may help in improving the
resolution.
and an 18 mm diameter microchannel plate detector (Burle MCP 18/12/5) is placed
off-axis [Kraft et al., 2007] to allow passage of a laser beam through the trap. A typical
multi-mass spectrum obtained as time-of-flight trace on the multichannel plate detector
is shown in Fig. 3.17. We pay for the plainness of the setup and the capability to mass-
analyse all ions in the trap at the same time with a more limited mass resolution than
available with high field rf quadrupoles. This might be seen from the 35Cl−/37Cl− doublet
in the time-of-flight mass spectrum presented, which shows up as two individual but not
separated peaks. The limitation stems from the large trapping volume from which the ions
need to be extracted. The shaping electrodes we have placed around the rods of the trap
(see figures in chapter 3.1) are dedicated to allow a compression of the ion cloud before
extraction. They have significant influence, but were so far not used in an experiment,
since we could well live with the mass resolution obtained out of the box. An additional
advantage over mass spectrometry with an rf quadrupole is the possibility to detect also
heavy ions. This is important, since we are interested in heavy halide anions as I− and
anions embedded in a cluster environment.
On their way to the detector the ions pass our crossed beam imaging setup described
in detail in the second part of this thesis. Since a narrow velocity spread of the ion
package is crucial for energy and angle differential scattering, we have implemented a way
to monitor and optimize the longitudinal beam divergence. For this purpose the detection
42

3.2. A versatile multipole trap setup for the study of cold anions
Figure 3.18: Potential energy analyzer and a measurement of the longitudinal beam divergence of Cl−
anions extracted from the trap. The design, following an approach by Enloe [Enloe, 1994], is supposed to have
superiour resolution as compared to an arrangement of parallel grids. The measurement shows the derivative of
the ion flux when changing the voltage applied to the repeller. The inner endcap was switched to an attractive
potential of 85 V with respect to the trap upon extraction and the rf field was switched off. The Gaussian fit yields
a sigma of ∆ E = (0.99 ± 0.08)V.
unit comprises a potential energy analyzer, which is mounted on a translation stage and
can by this means be moved onto the ion beam axis. It was adapted from a design by
Enloe [Enloe, 1994] and is constructed to provide equipotentials that are normal to the
trajectory of the impacting ions irrespective of their angle of incidence. As seen from
Fig. 3.18, a grounded conus is sticking into a biased cylinder, which is closed on the other
side by a grid. The particles impacting from the left experience a retarding field within
the cylinder. The voltage applied to the cylinder is increased and the depletion of the
beam flux recorded. Unfortunately the ions have to be reaccelerated to be detected on
the multichannel plate placed behind the repeller. To minimize field penetration into the
retarding volume an additional grid was placed between MCP and repeller. The device
always suffered from focusing effects, which should be minimizeable by replacing the grids
by narrow meshes. So far we have measured at various acceleration voltages to clarify that
the obtained beam divergence is not depending on the latter. A preliminary measurement
of the energy spread of a bunch of Cl− anions extracted from the trap after a storage
time of 30 ms in Helium at 300 K is presented on the right hand side of the figure. For
this measurement the rf field was switched off immediately before extraction to avoid an
increase of the beam spread by phase-sensitive extraction. To pull the ions out of the
trap, the inner exit endcap was switched to an attractive potential of 85 V with respect to
the trap. A Gaussian fit yields a sigma of ∆ E = (0.99 ± 0.08)V. By using the shaping
electrodes the distribution could be narrowed by about 30%. From the striking effect on
the mass resolution it is to be expected that cooling the trap will help to further reduce
this beam divergence.
43
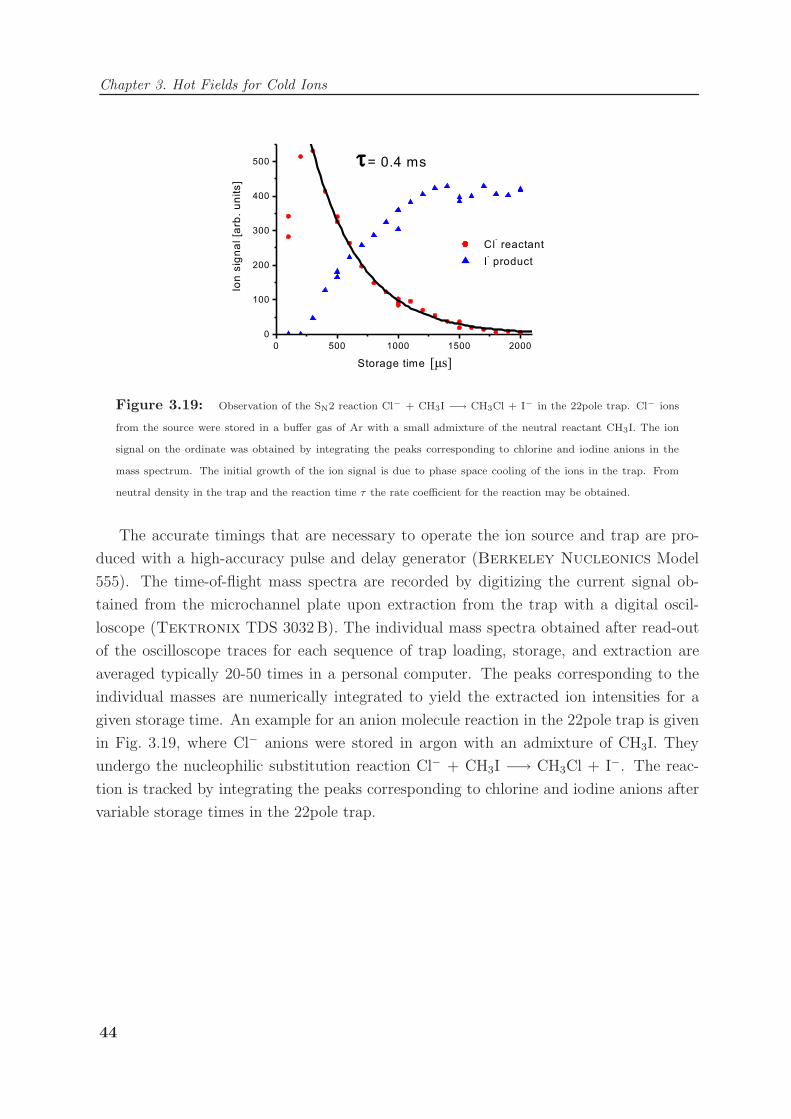
Chapter 3. Hot Fields for Cold Ions
Figure 3.19: Observation of the SN2 reaction Cl− + CH3I −→ CH3Cl + I− in the 22pole trap. Cl− ions
from the source were stored in a buffer gas of Ar with a small admixture of the neutral reactant CH3I. The ion
signal on the ordinate was obtained by integrating the peaks corresponding to chlorine and iodine anions in the
mass spectrum. The initial growth of the ion signal is due to phase space cooling of the ions in the trap. From
neutral density in the trap and the reaction time τ the rate coefficient for the reaction may be obtained.
The accurate timings that are necessary to operate the ion source and trap are pro-
duced with a high-accuracy pulse and delay generator (Berkeley Nucleonics Model
555). The time-of-flight mass spectra are recorded by digitizing the current signal ob-
tained from the microchannel plate upon extraction from the trap with a digital oscil-
loscope (Tektronix TDS 3032 B). The individual mass spectra obtained after read-out
of the oscilloscope traces for each sequence of trap loading, storage, and extraction are
averaged typically 20-50 times in a personal computer. The peaks corresponding to the
individual masses are numerically integrated to yield the extracted ion intensities for a
given storage time. An example for an anion molecule reaction in the 22pole trap is given
in Fig. 3.19, where Cl− anions were stored in argon with an admixture of CH3I. They
undergo the nucleophilic substitution reaction Cl− + CH3I −→ CH3Cl + I−. The reac-
tion is tracked by integrating the peaks corresponding to chlorine and iodine anions after
variable storage times in the 22pole trap.
44

Chapter 4
Scrutinizing Trapping and Cooling
In the next two sections we make use of the storage of anions to accomplish diagnostics
of the trapping conditions that are not so easily available to cations. The high electron
binding energy of halide anions prevents them from chemical conversion by collisions with
residual gas or impurities in the buffer gas. This enables to investigate experimentally
the stability of ion motion in a radiofrequency field as the intrinsic loss process from the
trap and to reveal the depth of the confining potential (see Section 4.1). In Section 4.2 we
employ photodetachment with a narrowly focused laser to image the ion distribution inside
the trap. This probes the bottom of the effective potential on the meV level and shows the
distracting influence of small static fields. In the last section of this chapter we perform
highly sensitive action spectroscopy by chemical probing to measure the translational and
internal temperature of a stored ion ensemble (see Section 4.3).
4.1 Stability of ion motion probed by evaporation
Evaporation of atoms and molecules out of a confined thermalized ensemble is a well
understood process [Davis et al., 1995b; Luiten et al., 1996] and represents the decisive
cooling step towards Bose-Einstein condensation [Petrich et al., 1995; Davis et al., 1995a].
In radiofrequency ion traps, early studies of the dynamics have shown that, in the absence
of a buffer gas, thermalization is achieved by ion-ion collisions and evaporative losses
[Dehmelt, 1967; Church, 1988]. If the ion temperature is fixed by collisions with a buffer
gas and the ion density is to low for self-interaction, evaporative loss measurements provide
access to the stability of ion motion in traps. In a quadrupole or Paul trap, stable
ion motion is described analytically by the Mathieu equations, which puts well-defined
constraints on the trapping fields. In contrast, for ions moving in a high order multipole
field the equations of motion have no analytical solution. There have been attempts
to numerically establish a stability diagram for two-dimensional hexapoles [Haegg and
Szabo, 1986a] and octupoles [Haegg and Szabo, 1986b]. For different starting conditions
45

Chapter 4. Scrutinizing Trapping and Cooling
the obtained stability diagrams look very different and the regions of stability do not show
well defined boundaries opposite to the case of the quadrupole trap.
We identify plain evaporation of ions as the fundamental loss mechanism out of a
multipole ion trap. Using thermalized negative Cl− ions the evaporative loss rate is found
to be proportional to a Boltzmann factor. We show that one can attribute an effective trap
depth to an ion cloud in a multipole ion trap and extract it as the activation energy for
evaporation. As a function of the rf amplitude we find two distinct regimes related to the
stability of motion of the trapped ions. For low amplitudes the entire trap allows for stable
motion and the trap depth increases with the rf field. For larger rf amplitudes, however,
rapid energy transfer from the field to the ion motion can occur at large trap radii, which
leads to a reduction of the effective trapping volume as we show by comparison with
the above introduced numerical model of ion motion in a one-dimensional rf field. In this
regime the trap depth decreases again slowly with increasing rf amplitude. This behaviour
is in distinct difference to a classical quadrupole or Paul trap, where stable ion motion
breaks down in the entire trap once a certain rf amplitude is reached. We give an analytical
parameterization of the trap depth for various multipole traps that allows predictions of
the most favorable trapping conditions. The experimentally obtained stability parameter
suggests, that ion motion in multipole fields is stable up to conditions significantly relaxed
as compared to the numerically obtained “safe operating conditions” defined by Gerlich
[Gerlich, 1992].
4.1.1 Evaporation limited ion storage
The Cl− ions used in this experiment are produced in the electron impact ion source from
CCl4 via dissociative attachment of slow electrons [Matejcık et al., 2002]:
CCl4 + e− (CCl)∗−4 → Cl− + CH3. (4.1)
A peltier-cooled reservoir of CCl4 is attached to the Ar carrier gas line, such that the
mixture is determined by the vapour pressure of CCl4 and the stagnation pressure of
Ar. Cl− is practically the only negative ion produced under these conditions. Ions are
transferred to the 22pole trap into which we apply helium at a well defined density of
typically 2 × 1014 cm−3. Thermalization of the ions hence occurs on the timescale of
100µs, assuming a Langevin-limited collision rate. Around 2×10³ Cl− anions are trapped
per filling, which results in a Spitzer self collision time [Church, 1988] of about 40 s at
300 K, ensuring that ion-ion interactions do not play a role.
Fig. 4.1 shows a typical graph of the Cl− ion intensity as a function of the storage time
in the 22pole rf trap (rf amplitude: V0 =33 V; frequency: ω/(2π)= 4.7 MHz). Data are
shown for three different temperatures, 370 K, 300 K and 225 K. Each point is obtained by
integrating the chlorine anion peak averaged over about 20 individual time-of-flight traces,
46

4.1. Stability of ion motion probed by evaporation
Storage time [s]0 2 4 6 8 10 12 14 16 18
No
rmal
ized
ion
inte
nsi
ty
-110
1
T = 370 K 0.02 s± = 0.46 τ
T = 300 K 0.4 s± = 9.0 τ
Storage time [s]0 50 100 150 200 250 300
No
rmal
ized
ion
inte
nsi
ty
-110
1
T = 225 K 50 s± = 600 τ
Figure 4.1: Measured Cl− ion signal as a function of storage time in the trap for three different temperatures.
No other ions have been observed in the time-of-flight spectra for any of the storage times. A dramatic increase
in the lifetime from 9 s to 10minutes is observed for cooling the trap from 300 K to 225 K, whereas the lifetime is
reduced to only 0.46 s when heating the trap to 370 K. Lifetimes are obtained from exponential fits (solid lines).
i.e. 20 trap fillings. The error bars indicate the variance of the chlorine ion intensities of
the single time-of-flight traces. As can be seen a mono-exponential decay of the ion signal
with storage time is observed, which is fitted to yield the loss rate and the corresponding
1/e lifetime of the Cl− anions in the trap. We find this lifetime to decrease dramatically
when the trap and its copper housing are heated and to increase strongly, when it is
cooled. According to Fig. 4.1, we observe a lifetime of (9.0± 0.4) s at a temperature of
the trap of (300± 3)K. In contrast if the trap is heated to (370± 3)K the lifetime is
reduced to (0.46± 0.02) s and enhanced to (600± 50) s if the trap is cooled to (225± 3)K.
The uncertainties of the lifetimes indicate fit errors of exponential decays. The absolute
value of the lifetime at a given temperature is afflicted with an additional systematic
error, because the lifetime of ions in the trap differs by up to a factor of two depending
on the “history” of the trap. Our experience is that an ion trap provides longer lifetimes
immediately after cooling it down as compared to many days of continuous operation at
cryogenic temperatures. Similarly the lifetime at 300 K is enhanced by baking the trap
prior to the measurement. We attribute these effects to stray fields originating from charge
up of insulators holding the endcaps and shaping electrodes but also by the deposition
of rest gas onto the electrodes at cryogenic temperatures (see also Section 3.1.3). It
demonstrates the need to work in a clean environment. This is especially true for the
present study, since we are investigating the intrinsic loss mechanisms of ions stored in
multipole fields. Therefore, we clean the trap by baking it at 370 K for 12 hours prior to
any of the presented measurements. This is found to effectively remove impurities from
the trap surfaces. The temperature dependent measurements in this article were done by
47

Chapter 4. Scrutinizing Trapping and Cooling
gradually reducing the heating power and hence slowly cooling the trap to 300 K while
performing trap loss measurements as shown in Fig. 4.1. Measurements as a function of
the rf amplitude are recorded within the same cooldown cycle, such that the systematic
error due to the effects described should be small.
Ion loss due to chemical reactions in the trap can be excluded since the mass spectra
upon extraction exhibit Cl− as the only ion for any of the storage times. This is expected
since the high electron affinity of chlorine of 3.61 eV [Berzinsh et al., 1995] prevents chem-
ical substitution with any of the possible molecular impurities in the background gas.
Detachment of the excess electron by photons from blackbody radiation can be directly
excluded regarding the high photon energies needed. In fact in a 350 K environment the
energy content of the radiation field for photon energies exceeding the electron affinity
of chlorine is calculated from Wien’s law to be less than 10−30 eV/m3. Similarly detach-
ment by collisions can be excluded in the temperature regime under study. This implies,
that the ions are physically removed from the trap. Hence the only possible loss pro-
cess from the trap is evaporation of hot anions in the Boltzmann tail of the distribution
over the effective energy barrier formed by the rf field. This is strongly supported by
the dependence of the lifetime on the temperature of the trap, which is promoted to the
translational temperature of the trapped ion ensemble via the buffer gas. Fig. 4.1 reflects
that by increasing the ensembles temperature we force more ions over the barrier. The
next section treats these qualitative observations in a quantitative manner.
4.1.2 Effective trap depth derived from activated ion loss
The ion loss rate k(T ) yields the activation energy for evaporative loss Ea by an Arrhenius
or Boltzmann law
k(T ) = A× e− Ea
kB T . (4.2)
This can be seen in Fig. 4.2, which shows the measured Cl− loss rate k(T ) on a logarithmic
scale as a function of the inverse of the traps temperature 1/T . The activation energy
Ea is obtained in units of the Boltzmann constant kB as the slope of the fit following
eqn. (4.2), which is shown as solid line in the figure. Ea represents the kinetic energy
ions need to exceed the effective barrier formed by the rf field and therefore provides an
elegant way to determine the effective trap depth. The fit in Fig. 4.2 yields an activation
energy and hence a trap depth of Ea = (420 ± 10)meV, obtained at an rf amplitude of
V0 = 33 V . Loss along the symmetry axis of the trap is much less probable, since the
static potential applied to the endcaps is chosen such, that the ions are much more tightly
confined along the z-axis as compared to the radial direction. This shows that Boltzmann
statistics are not only applicable to the translational and rotational degrees of freedom of
the bulk of trapped ions [Schlemmer et al., 1999], but also to the high-energy tail of the
48

4.1. Stability of ion motion probed by evaporation
1/Temperature [1/K]0.0027 0.0028 0.0029 0.003 0.0031 0.0032 0.0033
Lo
ss r
ate
[1/s
]
-110
1
pulsed and continuous He buffer gas
solely continuous He buffer gas
Figure 4.2: Measurement of the loss rate of Cl− anions out of the trap as a function of the traps temperature
at an rf amplitude of V0 = 33V. An exponential decay of the loss rate with decreasing temperature is observed. The
dashed line shows a fit following a Boltzmann or Arrhenius law k(T ) = A× e− Ea
kB T , we obtain an activation energy
of Ea = (420 ± 10) meV . In the absence of a chemical reaction this energy is attributed to the barrier formed by
the confining rf field. Points plotted in grey are obtained without usage of an intense pulse of helium during ion
injection and demonstrate, that this does not influence the ion loss rate measurements.
Boltzmann distribution.
We have measured the effective trap depth of the 22pole ion trap for Cl− anions as a
function of the rf amplitude V0 applied to the rods. Since the catching efficiency is fairly
low for small rf amplitudes, the trap is always loaded at the same rf amplitude of 110 V.
After a storage time of 200 ms to await phase-space cooling, the rf amplitude is ramped
linearly in 90 ms to the desired rf amplitude V0 under study. Then the loss rate of the Cl−
anions from the trap is measured. It is checked carefully, that the rf amplitude has reached
V0 before the start of the trap loss measurement. The utilization of helium pulses for ion
stopping does not affect the loss rate from the trap as demonstrated in Fig. 4.2. For each
amplitude V0 the Cl− anion loss rate is measured for four trap temperatures T between
370 K and 300 K. Measurements at different rf amplitudes have been acquired within a
single heating and cooldown cycle of the trap. Boltzmann fits of k(T ) following eqn. (4.2)
yield the activation energy Ea(V0) which is interpreted as the effective trap depth U(V0).
Fig. 4.3 shows that we find two distinct regimes of ion storage in the trap. For low
rf amplitudes V0 the effective trap depth U(V0) rises steeply and reaches a maximum of
0.65 eV at around 12 V. For higher amplitudes U(V0) decreases slightly before it eventually
levels off at 0.5 eV for amplitudes V0 > 40V. At rf amplitudes V0 around 30 V, a small
dip in the measured effective trap depth is observed. Experimental accuracies are derived
from the Boltzmann fits. The inserted lines arise from a model for the effective trap depth
49

Chapter 4. Scrutinizing Trapping and Cooling
RF amplitude [V]0 20 40 60 80 100 120 140
Eff
ecti
ve t
rap
dep
th [
eV]
0
0.1
0.2
0.3
0.4
0.5
0.6
0.7
0.8
0.9
1
0.02± = 0.38 max
η
RF amplitude [V]0 20 40 60 80 100 120 140 160
pre
fact
or
A [
1/s]
410
510
610
710
810
910
1010
Figure 4.3: Measurement of the effective trap depth as a function of the rf amplitude at a fixed frequency of
ω/(2π) = 4.7MHz. Each point originates from a Boltzmann fit (eqn. (4.2)) to a loss rate measurement as shown
in Fig. 4.2. We attribute the break-off of the effective trap depths quadratic increase to the appearance of non-
adiabatic ion motion. The solid line stems from a fit following the analytical model described in Section 4.1.3. We
obtain a maximal value of the multipole stability parameter of ηmax = 0.38 ± 0.02 for adiabatic ion motion. The
inset shows the prefactor A in the Boltzmann fit as a function of the rf amplitude. For higher amplitudes, where
the trapping volume is bound by the adiabaticity requirement, the prefactor is found to agree with the frequency
of the rf field.
described in the next section.
The pre-exponential factor A(V0) in eqn. (4.2) is left as free parameter in the Boltz-
mann fits and should reflect the event rate of the process leading to evaporation of the
ions. Fit results for A(V0) are shown as inset into Fig. 4.3. Due to the limited tem-
perature range in the experiment A(V0) is subject to a very large fit error, which makes
the interpretation difficult. For large rf amplitudes A is found to be of the order of 107
s−1, independent of the helium buffer gas density up to 2 × 1015 cm−3 and hence the
average collision rate. Higher densities result in a slight decrease of trap loss rate and
prefactor. For interpretation it is instructive to compare the different time scales in the
rf trap. The loss rate of Cl− anions in the 22pole trap is on the order of 10−3 − 10 s−1
for the temperature range 370-200 K. Collision rates with the helium buffer gas are about
1 × 10⁵ s−1, rates of reflection at the trap walls 2− 5× 10⁵ s−1 and the rf field oscillates
at a frequency of 5× 10⁶ s−1. Hence ions survive between 5 × 10⁴ and 5 × 10⁸ collisions
and reflections, before they are lost from the trap. The experimentally determined rate of
about 5× 10⁶ s−1 fits best to the frequency of the field rather than the collision frequency
with the helium or the reflections at the trap walls. This points to a loss mechanism,
where the ions acquire translational energy from the rf field within a few cycles. Numer-
50

4.1. Stability of ion motion probed by evaporation
ical simulations presented in the next section show, that this happens once the ions are
located in a trap region where the rf amplitude is strong enough to prevent adiabatic
motion. The probability to find an ion at such a position corresponds to the exponential
factor in the Boltzmann equation (4.2) with the activation energy given by the effective
trap potential where the motion becomes non-adiabatic. For rf amplitudes around 15 V
the fitted prefactors seem to be two to three orders of magnitude larger. Though the
fit errors exceed the values itself the spread of neighbouring points suggests, that an en-
hanced prefactor is real under these trapping conditions. It coincides with the transition
from steeply increasing to constant trap depth described above. Our interpretation of the
different evaporation regimes detailed below indicates a special sensitivity to systematic
errors under these circumstances. This suggests to carry out further investigations to
make reliable statements for these rf amplitudes. For very small rf amplitudes A is found
to be two to three orders of magnitude smaller than for large rf amplitudes. This is in
agreement with the collision frequency of the anions with the helium buffer gas rather than
with the frequency of the field. These findings give additional evidence that evaporation
for low and for high rf amplitudes is of different nature. The next section will discuss the
underlying mechanisms.
4.1.3 Framing stability requirements for adiabatic ion motion
To get a microscopic insight into the involved loss processes, we have set up a simple
numerical model. As in Section 3.1.2 Cl− ions are propagated in a one-dimensional os-
cillating electric multipole field of order n (eqn. (3.13)) E(r, t) = V0
r0n | r |n−1 cos(ωt + Φ)
with −r0 ≤ r ≤ +r0 by solving the equation of motion numerically. Here we record the
loss of ions with an initial velocity drawn from a two-dimensional Maxwellian distribution
at temperature T (see eqn. 3.20). Propagation is processed ion by ion, starting at r = 0
with random phase Φ. If the ions reach the trap radius at r = r0, they are counted as lost.
Collisions with a buffer gas are only considered indirectly via the propagation time. In the
calculation we assume that the ions thermalize translationally with the buffer gas within
three collisions. If the ions survive this timescale in the trap, we expect, that oscillations
introduced by the rf field will be damped again by the cooling force introduced by the
buffer gas collisions, such that oscillations cannot built up. We use the same parameters
as in the experiment shown in Fig. 4.3 (n=11, ω / (2 π) = 4.7 MHz, q= -e, m=35.5 amu,
nHe =3.4× 1014 cm−3) and a Langevin limited rate coefficient for elastic collisions of Cl−
anions with He atoms of k = 5.4×10⁻¹⁰ cm3/s.
In agreement with the experiment an exponential decay of the ion loss rate with the
inverse temperature is observed, where the ion loss rate represents the lost ion fraction
divided by propagation time. It is fitted to a Boltzmann factor according to eqn. (4.2)
to determine the effective barrier height. In analogy to the experiment we determine
51

Chapter 4. Scrutinizing Trapping and Cooling
RF amplitude [V]0 20 40 60 80 100 120 140
Eff
ecti
ve b
arri
er h
eig
ht
[eV
]
0
0.2
0.4
0.6
0.8
1
1.2
1.4
1.6
1.8
0.03± = 0.54 max
η
Figure 4.4: Effective barrier height as a function of the rf amplitude obtained with the one-dimensional
numerical model. As in the corresponding experiment, each point originates from a Boltzmann fit (eqn. (4.2)). The
numerical model is well suited to interpret the general shape of the effective trap depth measurement shown in
Fig. 4.3 by the introduction of non-adiabatic ion motion. The solid line stems from a fit following the analytical
model. We obtain a maximal value of the multipole stability parameter of ηmax = 0.54 ± 0.03 for adiabatic ion
motion. Hence for the ideal one-dimensional multipole field of the simulation adiabatic ion motion is possible up
to a significantly higher value of the stability parameter as compared to the experiment.
the height of the effective barrier as a function of the rf amplitude V0 in a series of
Arrhenius-type measurements. Since calculation time turned out to be critical, we had to
use elevated ensemble temperatures as compared to the experiment to speed up ion loss.
The temperature is altered in the interval 1200 K to 1700 K, which is a similar relative
variation as in the measurement displayed in Fig. 4.3. For this temperature range the lost
ion fraction within the propagation time is always below 1% for all rf amplitudes V0 under
study. Fig. 4.4 shows that the numerically determined effective barrier height rises steeply
for low rf amplitudes, reaches a maximum and then eventually slightly decreases again for
high amplitudes. This behaviour is consistent with the corresponding experimental data
in Fig. 4.3. In detail, however, there are distinct differences. The maximum barrier in
the simulation is obtained at V0 =40 V, whereas the maximal effective trap depth in the
measurement is found at V0 = 12 V. This coincides with the achievement of a substantially
higher maximal value for the barrier height in the simulation of 1.3 eV as compared to
the maximal effective trap depth in the experiment of 0.65 eV.
Nevertheless, the simple numerical model provides valuable insight into the underly-
ing mechanisms of ion loss. Exclusively ions with a high starting velocity drawn from the
Boltzmann tail of the distribution are lost during propagation, as expected for an evapo-
ration driven ion loss. As can be seen from Fig. 4.5 the calculated ion trajectories in phase
52

4.1. Stability of ion motion probed by evaporation
radius [mm]0 1 2 3 4 5
s]µve
loci
ty [
mm
/
-2
-1.5
-1
-0.5
0
0.5
1
1.5
2 (a)
(a) - (c): RF amplitude 10V
radius [mm]0 1 2 3 4 5
s]µve
loci
ty [
mm
/
-2
-1.5
-1
-0.5
0
0.5
1
1.5
2 (b)
radius [mm]0 1 2 3 4 5
s]µve
loci
ty [
mm
/
-2
-1.5
-1
-0.5
0
0.5
1
1.5
2 (c)
radius [mm]0 1 2 3 4 5
s]µve
loci
ty [
mm
/
-15
-10
-5
0
5
10
15
(d)
(d) - (f): RF amplitude 100V
radius [mm]0 1 2 3 4 5
s]µve
loci
ty [
mm
/
-15
-10
-5
0
5
10
15
(e)
radius [mm]0 1 2 3 4 5
s]µve
loci
ty [
mm
/
-15
-10
-5
0
5
10
15
(f)
Figure 4.5: Velocity of ions starting at zero radius with increasing velocity as they propagate in a one
dimensional multipole rf field of order n =11. For a low rf amplitude (upper panel) ions either return to the origin
with the same velocity they started with or get lost in that they reach the rim of the rf field at 5mm radius depending
on their starting velocity. However, for high rf amplitudes (lower panel) ions can gain translational energy in the
regions of high field, leading to subsequent loss at the next approach to the barrier. The figure demonstrates the
introduction of regions of non-adiabatic ion motion into the trap for high rf amplitudes.
space are characterized by a uniform velocity in the region of low field at smaller radii
evolving into a fast oscillation of the velocity in the region of high field near the turning
point. The three trajectories shown in the top row are recorded at a small rf amplitude
of V0 = 10 V, where the effective barrier height in Fig. 4.4 is found to be steeply rising. In
contrast, the lower panel shows trajectories obtained at V0 = 100 V, where the effective
barrier height is roughly constant. The three trajectories within one panel differ in the
velocity with which the ions start at zero radius; the starting velocity increases from left
to right. For a starting velocity of 0.5 mm/µ s, as shown in the two leftmost trajectories
(a) and (d), the ion returns with the same absolute value of the velocity as it started with.
As expected the ion returns at a much smaller radius in case of the high rf amplitude.
The starting velocity in the two rightmost trajectories (c) and (f) is chosen such, that
the ions kinetic energy just exceeds the height of the barrier formed by the rf field. Hence
the ion is lost in that it reaches a radius of r0 = 5 mm, which is the geometrical radius
of the trap. For the high rf amplitude of V0 = 100 V a starting velocity of 6 mm/µ s is
needed, whereas for the low rf amplitude of V0 = 10 V an initial velocity of 1.3 mm/µ s
is sufficient to overcome the barrier. These trajectories reflect the loss of hot ions via
evaporation over the barrier. The two trajectories (b) and (e) are calculated at a slightly
reduced starting velocity as compared to the latter values, i.e. a velocity just below the
limit for direct escape. The ions return to the origin, probing regions of high field very
53

Chapter 4. Scrutinizing Trapping and Cooling
close to the edge of the trap. In case of the low rf amplitude (upper panel) the velocity
on return is unchanged as compared to the starting velocity. However, for the high rf
amplitude (lower panel), the ion has gained energy from the field expressed as a dramatic
shift in the velocity on return. An ion with such a trajectory will not be reflected at the
flapping potential on the next approach. These contrary observations correspond to the
two distinct regimes of ion evaporation identified above. It turns out that the critical
radius, from where on field energy can be transferred to translational energy of the ions,
is decreasing for increasing rf amplitude.
This demonstrates that an ion has to fulfill two criteria to stay trapped in a rf storage
device: Apparently it has to be geometrically inside the cage formed by the electrodes of
the device. Moreover, the ion needs to stay within the region of adiabatic ion motion,
in which trajectories are conservative and oscillations induced by the rf field do not built
up. These two requirements define what we call the trapping volume. Below we use an
analytical parametrization of the trapping volume based on the adiabaticity parameter η
defined in [Gerlich, 1992] to describe the trap depth.
By comparison with the numerical simulation we are able to interpret the abrupt
break-off in the experimentally observed effective trap depth shown in Fig. 4.3 and the
accompanied change in the pre-factor A to a value of the order of the rf frequency. We
identify it with the advent of non-adiabatic ion motion. Ions are lost from the trap by
rapidly acquiring translational energy from the rf field within a few rf cycles, once they
happen to be located in a trap region where the rf amplitude is strong enough to disturb
adiabatic motion.
For an analytic description of the trap depth we introduce the trapping volume as the
volume in which stable trajectories without transfer of energy from the field are possible.
The numerical simulation shows in agreement with our measurement that the trapping
volume is reduced for increasing rf amplitude and that the reduction prevails over the
increase in the repelling force by the rf field. We consider the effective potential - the
concept was introduced in Section 3.1.1 - at the edge of the trapping volume as the
effective trap depth.
We parameterize the trapping volume based on the adiabaticity parameter
η =n− 1
n
qV0
ε
(r
r0
)n−2
(4.3)
introduced by Gerlich [Gerlich, 1992] for an ideal multipole field of order n. Ion motion
is considered adiabatic for η < ηmax, which gives rise to a critical radius
rcrit = r0
(ηmax
n
n− 1
ε
qV0
)1/(n−2)
(4.4)
(ε = 1 / (2n2) mω2r20 the characteristic energy defined in Section 3.1.2). The trapping
volume is bound by rcrit if this radius is smaller than the geometrical radius r0 of the
54
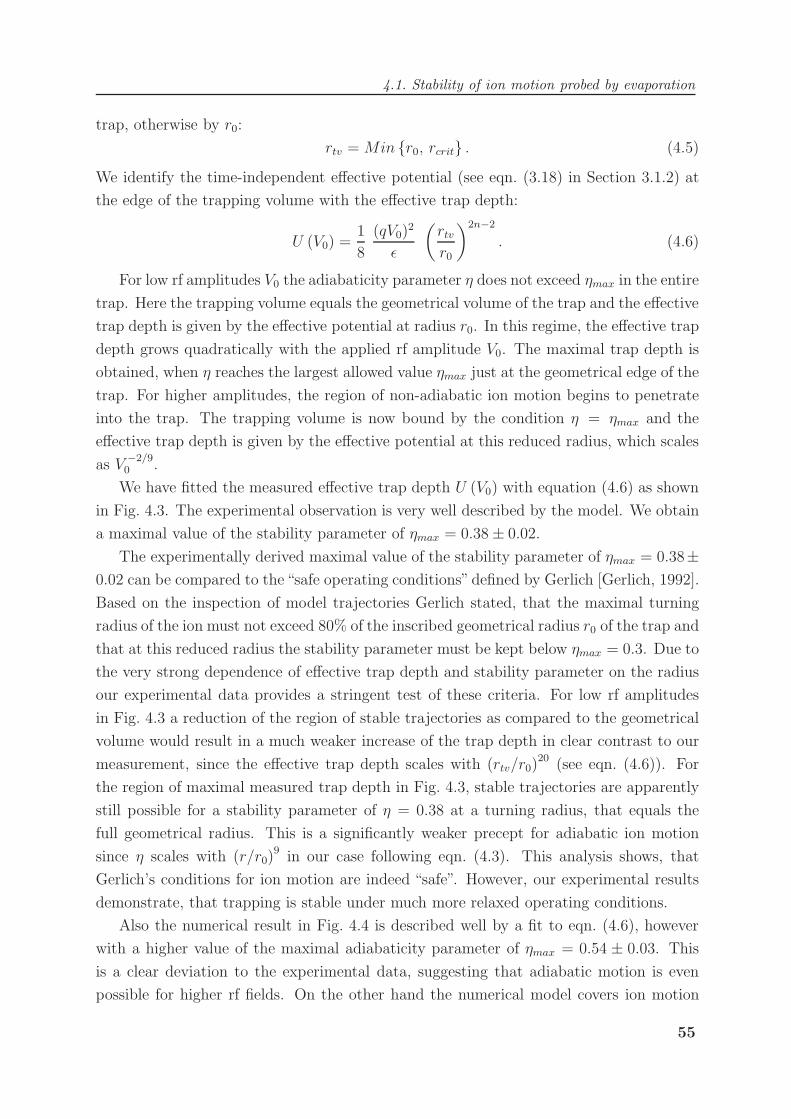
4.1. Stability of ion motion probed by evaporation
trap, otherwise by r0:
rtv = Min r0, rcrit . (4.5)
We identify the time-independent effective potential (see eqn. (3.18) in Section 3.1.2) at
the edge of the trapping volume with the effective trap depth:
U (V0) =1
8
(qV0)2
ε
(rtv
r0
)2n−2
. (4.6)
For low rf amplitudes V0 the adiabaticity parameter η does not exceed ηmax in the entire
trap. Here the trapping volume equals the geometrical volume of the trap and the effective
trap depth is given by the effective potential at radius r0. In this regime, the effective trap
depth grows quadratically with the applied rf amplitude V0. The maximal trap depth is
obtained, when η reaches the largest allowed value ηmax just at the geometrical edge of the
trap. For higher amplitudes, the region of non-adiabatic ion motion begins to penetrate
into the trap. The trapping volume is now bound by the condition η = ηmax and the
effective trap depth is given by the effective potential at this reduced radius, which scales
as V−2/90 .
We have fitted the measured effective trap depth U (V0) with equation (4.6) as shown
in Fig. 4.3. The experimental observation is very well described by the model. We obtain
a maximal value of the stability parameter of ηmax = 0.38± 0.02.
The experimentally derived maximal value of the stability parameter of ηmax = 0.38±0.02 can be compared to the“safe operating conditions”defined by Gerlich [Gerlich, 1992].
Based on the inspection of model trajectories Gerlich stated, that the maximal turning
radius of the ion must not exceed 80% of the inscribed geometrical radius r0 of the trap and
that at this reduced radius the stability parameter must be kept below ηmax = 0.3. Due to
the very strong dependence of effective trap depth and stability parameter on the radius
our experimental data provides a stringent test of these criteria. For low rf amplitudes
in Fig. 4.3 a reduction of the region of stable trajectories as compared to the geometrical
volume would result in a much weaker increase of the trap depth in clear contrast to our
measurement, since the effective trap depth scales with (rtv/r0)20 (see eqn. (4.6)). For
the region of maximal measured trap depth in Fig. 4.3, stable trajectories are apparently
still possible for a stability parameter of η = 0.38 at a turning radius, that equals the
full geometrical radius. This is a significantly weaker precept for adiabatic ion motion
since η scales with (r/r0)9 in our case following eqn. (4.3). This analysis shows, that
Gerlich’s conditions for ion motion are indeed “safe”. However, our experimental results
demonstrate, that trapping is stable under much more relaxed operating conditions.
Also the numerical result in Fig. 4.4 is described well by a fit to eqn. (4.6), however
with a higher value of the maximal adiabaticity parameter of ηmax = 0.54 ± 0.03. This
is a clear deviation to the experimental data, suggesting that adiabatic motion is even
possible for higher rf fields. On the other hand the numerical model covers ion motion
55

Chapter 4. Scrutinizing Trapping and Cooling
Figure 4.6: Effective trap depths for multipoles of different order n as derived from the analytical model
assuming a maximum adiabaticity parameter ηmax = 0.4 (calculation for Cl− ions, r0 = 5mm, ω = 2π × 5MHz).
restricted to one dimension such that detailed quantitative interpretation should not be
exaggerated. The maximum allowed value of the stability parameter η describes the point
where the region of unstable ion motion begins to penetrate into the geometrical radius
of the trapping device. In this regime ion motion is expected to be very sensitive to
weak fringe fields from charge up of insulators or frozen rest gas, disturbing the perfect
multipole configuration (see also Section 3.1.3). The failure of the models to describe the
dip in the effective trap depth observed at amplitudes around 25 V might be attributed
to such effects.
4.1.4 Predicting trapping conditions for other rf devices
The analytical and numerical models can be readily applied to multipoles of different
order n. In Fig.7.16 the effective trap depth for Cl− ions is plotted as a function of the
rf amplitude for various multipoles of the same inscribed radius r0 = 5 mm operated at a
fixed frequency ω = 2π×5 MHz assuming a maximum adiabaticity parameter ηmax = 0.4.
The maximal effective trap depth is given by
Umax =1
16η2
maxmω2 r20
(n− 1)2, (4.7)
The larger field-free region for increasing multipole order n is hence payed by a smaller
maximal effective trap depth. Also, lower order multipole traps can be operated in an all-
adiabatic mode up to higher rf amplitudes. For a quadrupole trap (n = 2) the adiabaticity
parameter η becomes independent of the radius, but is still a function of the rf amplitude
V0. Note that this results in a distinct difference to higher order multipoles: The trap
56
4.1. Stability of ion motion probed by evaporation
depth scales quadratically with the rf amplitude V0 until the maximal stability parameter
is reached; at this point there is a transition from adiabatic to nonadiabatic ion motion
in the entire trap and the trap depth vanishes completely.
The present results suggest possible applications of trap losses as a probing scheme
for inelastic collision processes of trapped ions, similar to schemes used for neutral atoms
[Staanum et al., 2006; Zahzam et al., 2006]. Maximizing the trapping volume of multipole
traps based on our findings should allow one to trap an optimum number of ions at a given
space charge interaction, which is particularly interesting for the loading of shallow surface
traps [Cetina et al., 2007]. Furthermore, ion-ion induced evaporation in a collision free
environment may be investigated, for which we have first experimental evidence at larger
ion ensembles.
57
Chapter 4. Scrutinizing Trapping and Cooling
4.2 Sampling the effective potential by photodetach-
ment tomography
In this section photodetachment of a negative ion’s excess electron by a narrowly focussed
laser is used to introduce a loss mechanism at well defined trap radius. In this way the
radial ion column density is probed by moving the laser beam through the trap. For
a thermalized ion ensemble this allows to extract the effective potential averaged along
the ion column. As shown elsewhere [Trippel et al., 2006]1 a tomography of the trapped
ion cloud enables us to obtain the absolute cross section for photodetachment of state
prepared molecular ions. Despite the fundamental importance photodetachment cross
sections might also represent an important input parameter to astrophysical models in
view of the first very recent observations of anions in the interstellar medium [McCarthy
et al., 2006].
4.2.1 An eye to image ion column densities
Photodetachment is possible, once the photon energy exceeds the binding energy of the
electron to the neutral, which is equivalent to the neutrals electron affinity. Above this
threshold, the photon flux from a laser beam introduces a loss channel to an ensemble of
trapped anions in the 22pole trap. Photodetachment will hence be visible in a measure-
ment of the lifetime of the ions. The rate of photodetachment kpd(r, φ) is given by the
absolute cross section σpd for photodetachment of the employed ion at the employed laser
wavelength times the photon flux Φ(r, φ) weighted with the ions column density ρ(r, φ)
along the z direction. If the laser beam is narrowly focussed along the entire length of
the trap, such that the ion density can be regarded constant over the waist of the laser,
integration over the laser spot yields in cylindrical coordinates
kpd(r, φ) = σpd × FL × ρ(r, φ), (4.8)
where FL =∫
Φ(r, φ)rdrdφ is the total photon flux coming from the laser. This derivation
is time-independent and hence assumes that the ion distribution is not changed by impact
of the laser. Two implications have to hold for this: Photodetachment has to be slow on
the timescale of ion redistribution in the trap. This is safely fulfilled in our case due to the
low absolute cross section of photodetachment and the low laser intensity. On the other
hand ion-ion interactions have to be negligible from the start on since a destruction of ions
would reduce them and hence affect the distribution. The latter requirement is also easily
fulfilled by using a dilute ion cloud of only about 1000 ions in the trap. Equation (4.8)
expresses that under these conditions the rate of photodetachment kpd(r, φ) is a map of
1See also: S. Trippel, PhD thesis (in preperation)
58

4.2. Sampling the effective potential by photodetachment tomography
Figure 4.7: Schematic view of a tomography scan. The narrowly focused laser beam with long Rayleigh range
serves as a probe for the ion distribution inside the trap.
the ion distribution ρ(r, φ) in the trap. We can hence use a narrowly focused laser beam
as an eye to image spatial profiles of anions stored in a confining potential, a probing
scheme illustrated in Fig. 4.7.
In practice, there will be an additional loss rate Γ of the ions in the trap due to
evaporation or reactive collisions with the residual gas. This loss rate is however not
dependent on the spatial position (r, φ) of the laser and may hence be simply added to
equation (4.8), resulting in the experimentally accessible total loss rate of the ions from
the trap.
The trap is loaded with a packet of about 103 NH−2 anions which are chemically
converted into OH− ions in the trap within a few seconds of storage time. NH−2 ions are
produced in the source by dissociative attachment of slow secondary electrons to NH3 in
a pulsed supersonic expansion of 90% Ne and 10% NH3 that is ionized by the counter-
propagating electron beam adjusted to 2 keV kinetic energy. After transfer to the trap a
continuous flow of helium buffer gas thermalizes the translational and internal degrees of
freedom of the trapped ions within a fraction of a second with the trap walls, which are
cooled to 170 K to strongly increase the ions lifetime. The endcap electrodes are adjusted
to 6 V repulsive with respect to the trap to confine the ions along the traps axis. OH−
ions are produced in the trap via the reaction NH−2 + H2O → OH− + NH3 by mixing
traces of water to the helium buffer gas [Smith et al., 1997]. Careful analysis of the time-
of-flight spectra showed that after a storage time of 10 s all NH−2 ions are converted into
OH−. The photodetachment HeNe laser (Carl Zeiss Jena), which travels parallel to the
symmetry axis of the trap, has a wavelength of 632.8 nm and a power of (3.0± 0.1)mW,
which corresponds to a photon flux of FL = (9.5± 0.3)× 1015 /s. It photodetaches OH−
(electron affinity 1.83 eV [Goldfarb et al., 2004]) in a one-photon transition. With a
telescope and a convex lens the beam is focused to a waist of 210 µm. The laser light is
switched on and off via an electro-mechanic shutter to perform consecutive measurements
59

Chapter 4. Scrutinizing Trapping and Cooling
Figure 4.8: Measured OH− ion signal as a function of storage time in the trap. The upper set of points shows
the signal in absence of the photodetachment laser. The lower points show that, when the laser is switched on at
10 s, a fast additional loss channel due to photodetachment appears. The decay rates are obtained from exponential
fits (solid lines).
with and without laser interaction.
Figure 4.8 shows the measured ion intensity as a function of storage time. The points
depicted in blue correspond to a background measurement without laser interaction. An
exponential fit yields a loss rate of Γ = (7.5± 0.3)× 10−3 s−1 corresponding to a lifetime
of the trapped ions of τbg = (133± 6) s. The points depicted in red show the ion intensity
as a function of storage time when the laser, positioned along the symmetry axis of the
trap, is switched on 10 s after loading the trap. An exponential fit to this curve yields an
ion lifetime of only τpd = 6.23 s. The striking difference in the loss rate from the trap is
caused by photodetachment of the negative ions by the laser photons, the only possible
laser-driven process.
For doing photodetachment tomography we move the probing laser beam vertically
through the trap by moving the convex lens of the telescope with a translation stage.
For various radial positions (r, φ = 0) of the laser, we perform a measurement of the
laser-induced detachment rate kpd(r, φ = 0) analogous to Fig. 4.8. The result is shown in
Fig. 4.9 by the black triangles (left vertical axis), errors stem from fit errors of the ions
lifetime in the trap with and without laser. The photodetachment rate is found to be
rather constant in the middle of the trap confined by two peaks symmetric around the
trap center but asymmetric in height, before the rate is steeply dropping off near ±3 mm.
To exclude clipping of the laser beam at the end-cap electrodes we expand the trapped
ion cloud in a weaker trapping potential. A nonvanishing photodetachment rate for radii
more than one laser waist away from the steep descent experimentally verifies that the
60

4.2. Sampling the effective potential by photodetachment tomography
Figure 4.9: Measured photodetachment rate (left axis) and derived ion column density (right axis) as a
function of the laser beam position. The accuracy stems from fit errors for exponential decays. It was carefully
checked that the sharp drop of the photodetachment rate for radii above 2.5mm is not induced by clipping of the
laser beam at the cylindrical endcaps. Their nominal open diameter is indicated by the dashed vertical lines.
drop is in deed a property of the ion distribution and not an artefact.
This distribution reflects already a relative measurement of the ions column density
in radial direction. To calculate the absolute ion column density ρ(r, φ = 0) from the
photodetachment rate kpd(r, φ = 0) we do in fact not need to resort to the absolute cross
section σpd as might be expected from eqn. (4.8). If the total number of ions in the trap
N is known, the absolute ion column density might be derived from the normalization
N =
∫ρ(r, φ)rdrdφ. (4.9)
We assume radial symmetry, which is suggested by the geometry of the trap (although
in question by the observation). The single-particle column density ρ(r)/N resulting
from this normalization is shown as the right vertical axis in Fig. 4.9. We are currently
employing a two dimensional scanner incorporating actuator driven translation stages,
which enables an automatized tomography of the spatial ion distribution in the trap.
Nevertheless a lot can be learned already from the simplified procedure of one dimensional
projections, as the next paragraph will show.
4.2.2 From density distributions to confining potentials
The introduced technique is used to directly visualize for the first time the effective po-
tential ions feel in a multipole radiofrequency trap. For thermalized non-interacting ions
61

Chapter 4. Scrutinizing Trapping and Cooling
mm radial distance -4 -3 -2 -1 0 1 2 3 4
m
eV
Eff
ecti
ve P
ote
nti
al
-5
0
5
10
15
20
25
30
35
40
K
T
emp
erat
ure
0
100
200
300
400
500
Figure 4.10: Experimentally determined radial dependence of the effective potential projected along the z-
axis of the trap. It is obtained from the photodetachment tomography depicted in Fig. 4.9 by assuming an ion
cloud thermalized with the buffer gas to the temperature to the trap. The inserted blue lines stem from an ideal
two-dimensional effective multipole potential. For further discussion see the text.
at temperature T the density distribution ρ(r) confined in an effective potential Veff(r)
obeys a Boltzmann law
ρ(r) = ρ0e−Veff (r)
kBT . (4.10)
Here ρ0 denotes the density for the minimum of the potential landscape, i.e. the position
r′, where we set Veff(r′) = 0. Hence we write
ρ(r)
ρ(r′)=
k(r)
k(r′)= e
−Veff (r)
kBT (4.11)
and obtain for the effective potential
Veff (r) = kBT ln
(k(r′)k(r)
). (4.12)
For the data k(r) shown in Fig. 4.9, obtained at a trap temperature of T = 170 K, this
analysis is demonstrated in Fig. 4.10. Errorbars are included but are slightly smaller than
the black triangles. As can be seen we are sensitive to the (along the z-axis) projected
effective potential on the meV scale. The absolute minimum of this potential is found at
a radius of about +2.4 mm. The symmetric peaks in the column density ρ(r) described
above arise from minima in the projected effective potential of 7 and 12 meV depth re-
spectively. The steep drops in the column density for higher radii are attributed to the
effective potential created by the radiofrequency field. We compare the experimentally
62

4.2. Sampling the effective potential by photodetachment tomography
Figure 4.11: Superposition of an ideal effective multipole field of order n = 11 (left image) and the static
field from the inner endcaps hold at 6V with respect to the trap (middle image). As seen from the right image
showing the sum, the trapping volume is strongly perturbed by influence from the endcaps. This reflects itself in
the maxima observed in the radial colum density distribution ρ(r) depicted in Fig. 4.9.
obtained effective potential with the effective potential of an ideal two-dimensional multi-
pole of order n = 11, as represented by the inserted blue lines. The solid line corresponds
to a geometrical trap radius of r0 = 5 mm, the nominal radius of our 22pole trap, whereas
the dashed line results from r0 = 4.5 mm. As seen from the image, our data is in good
agreement with the reduced radius rather than the nominal geometry. A possible expla-
nation is a slight misalignment of the entire trap with respect to the axis of the setup,
which appears likely since for this experiment the trap was not mounted on the coldhead
yet and had some play on its platform. Then the projected radius will be reduced as
compared to the actual trap radius, especially since the ions are squeezed towards the
center of the trap by influence of the static endcap electrodes.
The two minima in the measured effective potential are in clear disagreement with an
ideal high-order multipole rf field. Space charge would lead to an additional mean field,
which in superposition with an ideal effective potential would result in a total effective
potential similar to the one we observe. This might be seen by comparison with the figures
from the Debye-Huckel model in Section 3.1.2. However we do not expect that ion-ion
interactions play a role for this experiment due to the low ion load of only about 1000 OH−
ions, which results in an estimated plasma parameter of about 10−4. The peaks in the
ρ(r) distribution remind us that also in the numerical simulations of ion distributions in
an ideal multipole field peaks are observed as found in Section 3.1. These were attributed
63

Chapter 4. Scrutinizing Trapping and Cooling
to the contribution of higher order terms at the turning point of the trajectories, which
invalid the effective potential approximation. Such effects might contribute. However, the
dominant contribution stems from the influence of the cylindrical endcaps, which strongly
modify the trapping potential created by the 22 radiofrequency rods. This can be seen
from Fig. 4.11, which shows on the left hand side an ideal effective multipole potential of
order n = 11 with no dependence along the z direction. Referring to our results from the
last section, we cut the potential at a critical radius, where η = ηmax = 0.4 is reached,
obeying the concept of a trapping volume. We superimpose this effective potential with
the static potential of the endcaps derived with Simion [SIMION, 2007], which solves
the Laplace equation for the geometry of our trapping device. The plot in the middle
depicts equipotential lines of this static field together with the geometry obtained by a
horizontal slice through the trap. The inner endcaps have been adjusted to 6 V with
respect to the trap in accordance with the experiment. The geometrical scale agrees with
the neighboured images of the field. The superposition of the ideal effective potential from
the rf field with the static potential of the endcaps is shown in the left image. As can
be seen, the endcaps strongly perturb the trapping volume. The minimum of the total
effective potential is squeezed in the center of the trap at equal distance from both endcaps.
By influence of the endcaps it is split to create a cylindrically symmetric minimum placed
off the axis as seen from the color code. The energy scale unravels that the ions in the
experiment, which have a translational temperature of T=170 K corresponding to 15 meV,
will be preferably trapped in these pockets of the resulting effective potential. In this sense
the observed maxima in the photodetachment rate can be traced back to the influence
of the static cylindrical endcaps, which confine the ions along the axis of the trap. It
also becomes immediately clear that high potentials at the endcaps need to be absolutely
avoided if the favourable quasi field-free conditions created by the rf electrodes want to
be preserved.
For quantitative comparison with the measured ion column density ρ(r) we calculate
the density of a thermalized ion ensemble in the resulting superimposed effective potential
Vtotal(r) using the Boltzmann distribution (4.10). After integration over the axial coordi-
nate, this calculation yields the column density, which is depicted as red line in the upper
panel of Fig. 4.12 for a temperature of T=170 K as in the experiment. For this calculation
the geometrical radius r0 of the ideal multipole has been decreased by 10 % to match the
experimental width of the ion density, as already discussed above. The blue rectangu-
lar distribution corresponds to the calculated density in the ideal multipole neglecting
z-dependence. As can be seen the observed maxima are reproduced by the calculation,
although it cannot account for the entire effect. To experimentally test the influence of
the static field created by the endcaps we increase it by a factor of ten, as demonstrated
in the lower panel of the figure. As expected the ions are cleared from the middle of the
64

4.2. Sampling the effective potential by photodetachment tomography
Figure 4.12: Calculated column density distribution (red line) in the total effective potential of Fig. 4.11
derived from the Boltzmann ansatz (4.10). It is compared to the measured distribution (black triangles) and a
calculation in an ideal multipole field (blue line). The upper panel is obtained for applying a static potential of 6V
to the endcaps, whereas the lower panel is for 60V. The maxima in the measured column density are explained to
stem from the pockets in the total effective potential induced by the endcap electrodes.
65

Chapter 4. Scrutinizing Trapping and Cooling
mm radial distance -4 -3 -2 -1 0 1 2 3 4
1
/s
p
dk
0
0.2
0.4
0.6
0.8
1
mm radial distance -4 -3 -2 -1 0 1 2 3 4
m
eV
Eff
ecti
ve P
ote
nti
al
-5
0
5
10
15
20
25
30
35
40
K
T
emp
erat
ure
0
100
200
300
400
500
Figure 4.13: Photodetachment tomography at a temperature of 90Kelvin showing a strongly asymmetric ion
cloud. This is attributed to patch fields arising from charge-up of gas frozen to the trap.
trap and pushed further outward. The calculated column density for the scaled static
field is found to be in good agreement with the experimental observation. The measured
left/right asymmetry shows a deviation from cylindrical symmetry, which is most likely
due to field inhomogeneities introduced by an asymmetric placement of ground electrodes
outside of the trap.
Since photodetachment tomography is sensitive to disturbances of the effective poten-
tial on the meV level, it offers a way to in situ interrogate the status of possible patchfields
arising from freeze-out to an ion trap continously operated at cryogenic temperatures and
subsequent charge-up. An example is given in Fig. 4.13, which shows an ion distribution
obtained from the trap hold at a temperature of 90 K. The distribution is not at all sym-
metric, the ions are strongly dragged to positive radial distance. These images as similar
to the numerically derived one-dimensional ion distributions in the presence of a pointlike
patchcharge as discussed in Section 3.1.3.
Once an effective potential has been thoroughly characterized with photodetachment
tomography, this technique can in turn be used as a straightforward diagnostics of the
temperature of the ion ensemble. This is interesting, since it does not require the intro-
duction of an additional reactant as for chemical probing spectroscopy.
66

4.3. Preparation and diagnostics of internally cold molecular ions
4.3 Preparation and diagnostics of internally cold
molecular ions
Using laser spectroscopy we show in this section that rotational and translational degrees
of freedom of molecular ions stored in a 22pole trap thermalize. In addition, we show which
conditions have to be obeyed such that they reach temperatures where only the lowest
quantum states contribute to the population. For this purpose we performed infrared
action spectroscopy on the second vibrational overtone of H+3 using a chemical reaction
of vibrationally excited H+3 as the probing technique. The absence of a permanent dipole
moment as well as stable electronically excited states render infrared spectroscopy of H+3
the only feasible approach. Since the discovery of the first infrared lines in the laboratory in
1980 [Oka, 1980], a number of spectroscopic studies of H+3 have been performed and more
than 900 experimentally observed transitions are meanwhile documented (a comprehensive
review can be found in [Lindsay and McCall, 2001]).
This work has been carried out at the Max-Planck-Institut fur Kernphysik in Heidel-
berg within a collaboration. The MPI-K’s research program on H+3 aims at unraveling the
influence of internal excitation on the dissociative recombination rate of H+3 with electrons
[Kreckel, 2003; Kreckel et al., 2005; McCall, 2006]. The triatomic hydrogen molecular ion
H+3 is one of the key molecules of interstellar chemistry and as the most simple polyatomic
molecule a much studied system both theoretically and experimentally [Tennyson, 1995].
Being of D3h point group symmetry the vibrational modes of H+3 are characterized
by the quantum numbers v1 for the symmetric stretch and vl2 for the doubly degenerate
antisymmetric stretch vibration,the vibrational angular momentum l runs from v2, v2 −2, · · ·− v2 + 2,−v2; only vibrational transitions that change the v2 quantum number have
non-negligible dipole matrix elements [Lindsay and McCall, 2001]. Following Ref. [Lindsay
and McCall, 2001] the rotational states of H+3 are labeled by their quantum numbers (J, G)
(see Fig. 4.14). J is the total angular momentum associated with the motion of the nuclei.
Instead of using the projection k of J onto the molecular symmetry axis, which is a good
quantum number for most symmetric top molecules, one uses in H+3 the quantum number
G = |k − l|, because of a near degeneracy for levels with the same G due to the Coriolis
coupling to the vibrational angular momentum. For l = 0 and (J −|l|) ≥ G ≥ 1 there are
two different ways to form the same G; these two non-degenerate levels are labeled “u” for
“upper” and “l” for “lower”. The Pauli principle, which requires a totally antisymmetric
wavefunction under nuclear permutations, links the total nuclear spin I, which is either
1/2 for para-H+3 or 3/2 for ortho-H+
3 , to the G quantum number. I = 3/2 requires G = 3n
(n = 0, 1, 2, . . . ) and I = 1/2 requires G = 3n ± 1. In addition certain G = 0 levels do
not satisfy the symmetry requirements at all, most notably the J = even levels in the
ground vibrational state. For the R-branch (∆J = +1) transitions studied in this work the
67
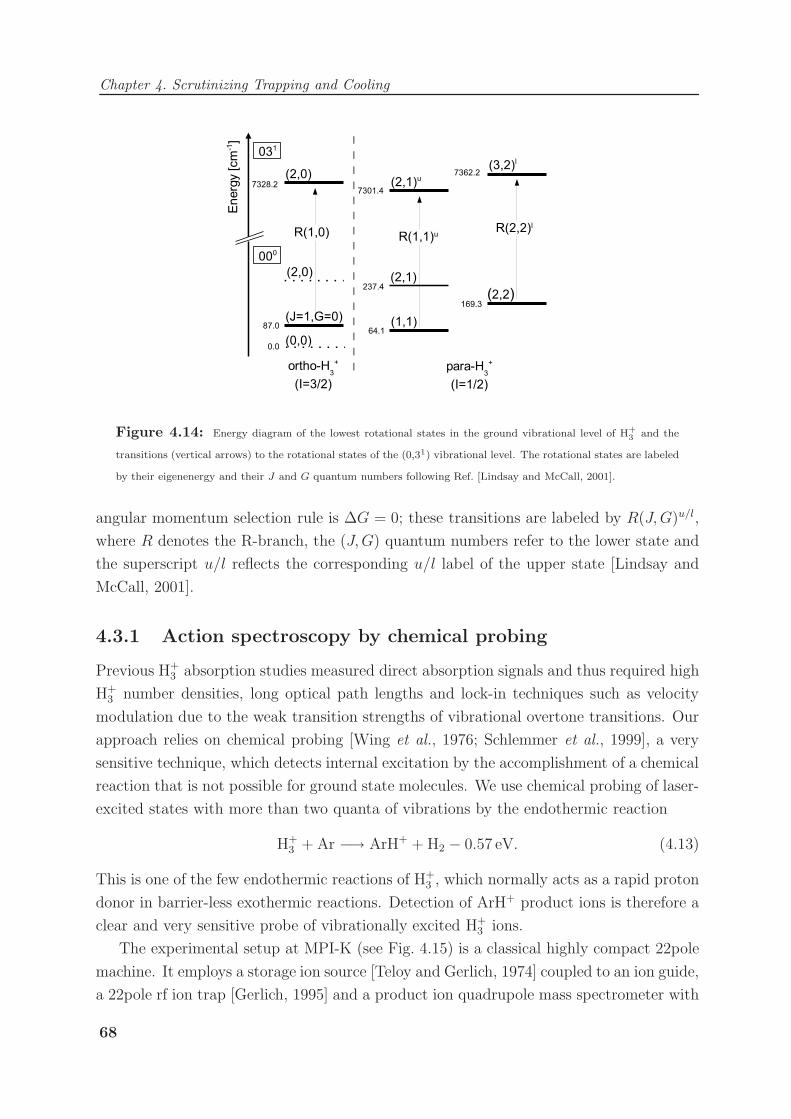
Chapter 4. Scrutinizing Trapping and Cooling
Figure 4.14: Energy diagram of the lowest rotational states in the ground vibrational level of H+3 and the
transitions (vertical arrows) to the rotational states of the (0,31) vibrational level. The rotational states are labeled
by their eigenenergy and their J and G quantum numbers following Ref. [Lindsay and McCall, 2001].
angular momentum selection rule is ∆G = 0; these transitions are labeled by R(J, G)u/l,
where R denotes the R-branch, the (J, G) quantum numbers refer to the lower state and
the superscript u/l reflects the corresponding u/l label of the upper state [Lindsay and
McCall, 2001].
4.3.1 Action spectroscopy by chemical probing
Previous H+3 absorption studies measured direct absorption signals and thus required high
H+3 number densities, long optical path lengths and lock-in techniques such as velocity
modulation due to the weak transition strengths of vibrational overtone transitions. Our
approach relies on chemical probing [Wing et al., 1976; Schlemmer et al., 1999], a very
sensitive technique, which detects internal excitation by the accomplishment of a chemical
reaction that is not possible for ground state molecules. We use chemical probing of laser-
excited states with more than two quanta of vibrations by the endothermic reaction
H+3 + Ar −→ ArH+ + H2 − 0.57 eV. (4.13)
This is one of the few endothermic reactions of H+3 , which normally acts as a rapid proton
donor in barrier-less exothermic reactions. Detection of ArH+ product ions is therefore a
clear and very sensitive probe of vibrationally excited H+3 ions.
The experimental setup at MPI-K (see Fig. 4.15) is a classical highly compact 22pole
machine. It employs a storage ion source [Teloy and Gerlich, 1974] coupled to an ion guide,
a 22pole rf ion trap [Gerlich, 1995] and a product ion quadrupole mass spectrometer with
68

4.3. Preparation and diagnostics of internally cold molecular ions
Figure 4.15: Experimental setup including the storage ion source, the guiding quadrupole, the 22-pole ion
trap and the product ion quadrupole mass spectrometer with the Daly detector [Kreckel, 2003]. The laser light is
passed axially through the trap and is retroreflected to increase the laser power. A commercial wavemeter yields
an online measurement of the absolute laser frequency.
a Daly-type scintillation detector [Daly, 1960] capable of single ion detection with nearly
unity detection efficiency. The machine is in detail described in Ref. [Kreckel, 2003].
H+2 ions are created in the ion source in collisions of H2 with electrons and undergo a
chemical reaction with neutral H2 molecules in which case H+3 is produced via the effective
formation reaction [Glenewinkel-Meyer and Gerlich, 1997]
H2 + H+2 −→ H+
3 + H, (4.14)
which is exothermic by 1.7 eV. In the present experiment it was vital to keep the hydrogen
pressure in the apparatus at a minimum in order to suppress the influence of H2 on the
buffer gas cooling as well as the destruction of ArH+ formed in reaction (4.13) through the
inverse reaction with H2 molecules. A differential pumping section between the ion source
and the main chamber was not implemented, because the setup needs to be compact to
be compatible with the ion accelerator of the storage ring TSR. The source was therefore
operated at an unusually low hydrogen pressure at the expense of a very low H+3 ion yield.
The trap could be filled reproducibly over several days of operation with 300±20 H+3
ions. It was heated to (55±5)K to keep argon from freezing on the trap electrodes and to
maintain an argon vapor pressure that is well above the argon partial pressure employed in
the experiment. Fig. 4.16 shows a representative measurement of the number of trapped
69

Chapter 4. Scrutinizing Trapping and Cooling
Figure 4.16: Representative measurement of the number of stored ions as a function of the storage time in
the 22-pole trap. H+3 , the dominant contribution, is found to decay slowly with a time constant longer than 2 s into
N2H+. About 25% of the H+3 ions carry initially enough vibrational energy to react immediately to ArH+, which
then decays with a time constant of (25±5) ms back to H+3 . During the laser interaction time (230-250 ms after
injection) the number of H+3 ions in the trap amounts to 300±20 while the initial ArH+ fraction has decayed to a
level below 1, small enough to allow the detection of laser-induced ArH+.
H+3 ions as a function of storage time. The lifetime of these ions in the trap is larger
than 2 s and is limited by the proton transfer reactions with traces of N2 molecules in the
residual gas of the vacuum chamber, leading to the formation of N2H+ ions which are
also trapped but which have no further influence on the experiment. The base pressure
of the residual gas in the vacuum chamber amounts to about 8 · 10−9 mbar, corresponding
to a particle density of 3 · 108 cm−3. With a large N2 component in the residual gas this
density explains well the measured H+3 decay constant, given that the proton transfer rate
coefficient to N2 amounts to about 2 · 10−9 cm3/s.
In this experiment the employed helium density inside the trap was adjusted to about
4 · 1011 cm−3 (see Table 4.1). Higher gas densities were not useful because the impurity
concentration in the gas inlet system of 10−4 lead to a significantly faster H+3 decay in
the trap. Through a second gas inlet argon is passed into the trap (particle density about
2 · 1011 cm−3) to provide the neutral reactant for the chemical probing spectroscopy based
on reaction (4.13). The typical collision time of trapped ions with the helium and argon
buffer gas amounts to about 1-2 ms. The trapped H+3 ions were stored for 230 ms prior to
the laser interaction (see Fig. 4.16). This allowed for about 100-200 buffer gas collisions,
which is expected to be sufficient to achieve translational and rotational cooling. The time
scale for vibrational cooling by buffer gas collisions is not known; however all vibrational
levels decay by spontaneous radiative transitions [Kreckel et al., 2002], so that after 230 ms
70

4.3. Preparation and diagnostics of internally cold molecular ions
gas constituent density in the trap [cm−3]
He 4 · 1011
Ar 2 · 1011
H2 2 · 1010
N2 < 3 · 108
Table 4.1: Densities of the different gas constituents that are present inside the 22pole ion trap during the
experiment. Values are estimated to be accurate within a factor of 2.
at most a small metastable fraction of the H+3 ions still populates the lowest symmetric
stretch vibrations and are thus invisible to the absorption laser.
Both helium and argon are passed into the trap through Teflon tubes wrapped around
the cold head where they undergo a number of collisions with the tube walls which leads
to an efficient thermalization of the gas prior to entering the trap volume. The buffer
gas atoms then stay inside the trap for about 100 collisions with the trap walls. Their
translational temperature is therefore expected to be well characterized by the (55±5)K
trap wall temperature. However an additional constituent of the buffer gas in the trap
arises from an influx of H2 molecules from the H+3 ion source, even at the low H2 operating
pressure in the ion source, due to the lack of a differential pumping stage in this setup.
This influx leads to an H2 density in the ion trap of about 2 · 1010 cm−3, obtained from
the decay time of ArH+ ions in the trap.
An infrared diode laser was used to deliver 1.38 to 1.39µm radiation suitable for
exciting H+3 into the (031) vibrational level. The employed laser was a commercial
grating-incidence-stabilized diode laser system in Littman-Metcalf [Littman, 1978; Liu
and Littman, 1981; McNicholl and Metcalf, 1985] configuration (Sacher). The linewidth
of such lasers is typically below 10 MHz. Frequency scans over a range of 2 GHz were per-
formed mode-hop free across the resonances using the piezo actuator on the end mirror of
the external laser cavity. The absolute laser frequency was measured with an accuracy of
±500 MHz using a commercial wavemeter (Burleigh). No active frequency locking was
employed. The optical setup is shown in Fig. 4.15. After having passed the apparatus
the laser beam is retro-reflected to increase the intensity in the interaction region. Con-
tinuous wavelength measurements with the wavemeter are achieved using a glass plate
beamsplitter. A mechanical shutter [Singer et al., 2002] allowed to pass the laser through
the ion trap only during the desired storage times. This is monitored with the help of
an InGaAs photodiode, onto which the back-traveling laser beam is focused. The laser
power traversing the interaction region was estimated to be roughly 1.8 mW.
In the present experiment infrared absorption starting from several low lying rota-
tional states of H+3 was measured indirectly using chemical probing based on reaction
(4.13). This reaction is endothermic by 0.57 eV for H+3 in the vibrational ground state,
71

Chapter 4. Scrutinizing Trapping and Cooling
i.e. it becomes only exothermic for molecules that have absorbed at least two quanta of
vibrational energy: In particular for excitations into the second overtone of the asym-
metric stretch (031) it becomes exothermic by 0.23 eV. We expect that reactions of the
vibrationally excited H+3 ions proceed with a large, Langevin limited rate coefficient of
about 2 · 10−9 cm3/s, similar to most proton transfer reactions of ground state H+3 ions.
At an argon buffer gas density in the trap of 2 · 1011 cm−3 this reaction should therefore
proceed with a time constant of about 2 ms. This is faster than the dominant competing
decay process of H+3 in the (0,31) level, namely radiative decay to lower vibrational levels,
which is characterized by a 3 ms time constant [Neale et al., 1996]. Mass spectrometric
detection of the number of formed ArH+ ions as a function of the laser frequency will
therefore yield a direct action spectrum of the infrared absorption.
The fact that about 25 % of the trapped H+3 ions are initially in high lying vibra-
tional levels (due to inefficient cooling in the ion source given the low pressure conditions
necessary for the absorption experiment) allowed us to observe the formation of ArH+
ions according to reaction (4.13) without laser interaction during the first milliseconds of
storage time. As viewed in Fig. 4.16 the ArH+ ions undergo the inverse reaction with
H2 molecules back to H+3 and Ar with a lifetime of τ = (25± 5)ms. This lifetime yields
the estimated H2 density in the trap of 2 · 1010 cm−3, based on the rate coefficient for the
inverse of reaction (4.13) of 2 · 10−9 cm3/s [Bedford and Smith, 1990]. The ArH+ decay
has two important consequences for the experiment: On the one hand, the laser interac-
tion time with the trapped H+3 ions was limited to 20 ms, because no further “breeding”
occurs for longer storage times. On the other hand, the laser interaction has to occur
at a storage time where the initial ArH+ population has decayed to a level that is low
enough to observe the laser-induced formation of ArH+ ions. This was achieved for a
laser interaction time of 230 to 250 ms of storage (see Fig. 4.16) where the ArH+ level
has decayed to an average level of well below 1 trapped ion. As described in the previous
section, this time window also leads to a good buffer gas cooling of the trapped H+3 ions
while keeping the decay of H+3 to a minimum. Thus, in the experiment the trapped H+
3
ions are buffer gas cooled for 230 ms and then irradiated by the infrared laser at given
frequency for 20 ms. After that the ion trap is emptied and the ArH+ product ions are
counted after the quadrupole mass spectrometer. This cycle is repeated for each point of
the laser frequency scan.
The formation rate k(J,G)(νL) of ArH+ per H+3 ion via an infrared transition R(J, G)u/l
with transition frequency ν0 is determined by the fraction f(J,G)(ν − ν0) of the H+3 ions
in the sub-ensemble that can interact resonantly with the laser, the coupling strength of
these ions to the laser field, given by the Einstein coefficient BR(J,G)u/l and the spectral
energy density of the laser ρ(ν − νL) around its center frequency νL,
k(J,G)(νL) =
∫f(J,G)(ν − ν0)BR(J,G)u/lρ(ν − νL)dν. (4.15)
72

4.3. Preparation and diagnostics of internally cold molecular ions
The fraction f(J,G)(ν−ν0) depends on the relative population of the initial rotational state
p(J,G), the geometrical overlap of the ion cloud with the laser beam, which is estimated
from the ratio of the laser cross section to the trap cross section (AL/Atrap) (about 10 %),
and due to the Doppler effect on the laser frequency ν. It is therefore given by
f(J,G)(ν − ν0) = p(J,G) Ce− (ν−ν0)2
2σ2D
AL
Atrap, (4.16)
where the normalization constant C =√
mc2/2πkBTν20 and the Doppler width is de-
scribed by the standard deviation
σD =
√kBT
mc2ν0. (4.17)
T denotes the translational temperature of the ions. For our narrow bandwidth diode
laser the spectral energy density ρ(ν − νL) is approximated by a delta function times the
energy density PL/ALc, where PL is the laser power and c is the speed of light. Eqn.
(4.15) then simplifies to
k(J,G)(νL) =p(J,G)BR(J,G)u/lPL
AtrapcCe− (νL−ν0)2
2σ2D . (4.18)
Note, that this rate is independent of the laser bandwidth, since at lower bandwidth less
ions are addressed within the Doppler profile but with higher spectral intensity.
The total number of ArH+ ions that are formed within the laser interaction time tL is
given by solving the rate equation
dNArH+
dtL= k(J,G)(νL)NH+
3− 1
τNArH+ . (4.19)
The first term accounts for the formation of ArH+ from H+3 while the second term describes
the back-reaction of the ArH+ ions with H2 into H+3 with a time constant τ . As the result
one obtains
NArH+ = NH+3k(J,G)(νL)τ(1− e−tL/τ ) (4.20)
which is based on the safe assumption that depletion of the H+3 ions can be neglected
during the laser interaction time.
Fig. 4.17 shows a calculation of the number of expected ArH+ ions, NArH+ , formed in
the trap by resonant laser interaction as a function of the temperature T . The three curves
display the result for the three lowest rotational states of H+3 . The calculation assumes
a Boltzmann level population, calculated Einstein coefficients [Neale et al., 1996] and a
geometrical overlap of 10 %. Furthermore, the number of trapped H+3 ions was assumed
to be 250, corresponding to the situation in the experiment. Under these conditions we
expect that the strongest signal is observed for the R(1,0) (0, 31)← (0, 00) transition over
73

Chapter 4. Scrutinizing Trapping and Cooling
Figure 4.17: Model calculation of the expected number of laser-excited H+3 ions as a function of temperature,
assuming the rotational and translational temperature to be equal. Shown are results for the three infrared tran-
sitions studied in the experiment with the laser assumed to be on resonance. The expected average signal of less
than one excited H+3 ion per trap filling required a low background and stable operating conditions.
the whole temperature range from 40 K to 300 K. At 55 K we expect a signal strength of
about 1.2 ArH+ ions per trap filling when the laser is tuned into resonance. The R(1,1)u
(0, 31)← (0, 00) transition yields half of this signal estimate, about 0.6 ions per trap filling.
The expected signal for the third transition R(2,2)l (0, 31) ← (0, 00) is lower by another
factor of 5. Thus, the calculation shows that in order to observe absorption signals from
the lowest rotational levels data has to be accumulated over many trap fillings. Stable
conditions throughout continuous hours of measurement were therefore essential for this
experiment.
We have measured the absorption profiles of three infrared overtone transitions of H+3
via chemical probing spectroscopy which are displayed in Fig. 4.18. The spectra show the
background-corrected number of detected ArH+ ions per trap filling, plotted as a function
of the laser detuning. Approximately 500 trap fillings and background measurements,
respectively, were averaged for each spectrum. Note the extremely weak spectral lines
displayed in Fig. 4.18. The high sensitivity of this approach is evident, given that each
detected ArH+ product ion reflects the absorption of a single infrared photon by a trapped
H+3 ion. In the current experiment the excitation probability of an H+
3 ion in the trap
during the 20 ms of laser irradiation amounts to about 0.1 %, leading to the observed 0.1
to 0.3 ArH+ ions for 300 trapped H+3 ions (see Fig. 4.18). This excitation probability is in
reasonable agreement with our model calculation (see Fig. 4.17); the factor of 2 difference
is most likely due to the uncertainty in the overlap of the laser beam with the trapped
ions.
74

4.3. Preparation and diagnostics of internally cold molecular ions
Figure 4.18: Measured absorption profiles for the three observed transitions in the (0, 31)← (0, 00) vibrational
overtone band. The employed chemical probing technique yields an ArH+ ion per absorbed infrared photon. The
signal is derived by averaging over 500 trap fillings, interleaved by 500 background measurements. The absolute
accuracy of the frequency scale is ±0.017 cm−1.
Based on Ref. [Lindsay and McCall, 2001] the three observed transitions are assigned to
the R(1,0) (0,31)← (0,00), R(1,1)u (0,31)← (0,00) and R(2,2)l (0,31)← (0,00) transitions.
Thus, the three observed transitions are R-branch transitions starting from the three
energetically lowest rotational states of H+3 , which are located 64.1 cm−1, 87.0 cm−1, and
169.3 cm−1 above the symmetry forbidden virtual |0, 0〉 ground state of H+3 (see the level
scheme in Fig. 4.14). The most prominent signal is found for the transition starting in
the (1,0) state of the vibrational ground state.
Table 4.2 compares the center frequencies of the three observed peaks with the mea-
surements and theoretical values presented in Ref. [Ventrudo et al., 1994] and Ref. [Lindsay
and McCall, 2001]. The good agreement with the previous measurement within the ex-
perimental accuracy proves our assignment of the three transitions, while a small, but
significant discrepancy remains with respect to the calculated frequencies. As seen in
table 4.2 the accuracy of the present measurement is better by a factor of 4 as compared
to the previous one. Note that the accuracy in our measurement is only limited by the
absolute frequency uncertainty of the employed wavemeter.
75

Chapter 4. Scrutinizing Trapping and Cooling
transition νcalc [cm−1] a νexp [cm−1] b νexp [cm−1] c
R(1,0) 7241.025 7241.244(70) 7241.235(17)
R(1,1)u 7237.058 7237.285(70) 7237.277(17)
R(2,2)l 7193.311 7192.908(70) 7192.875(17)
Table 4.2: Observed transitions in the (0, 31) ← (0, 00) vibrational overtone band. a calculated frequencies
from Ref. [Lindsay and McCall, 2001]; b measured frequencies from Ref. [Ventrudo et al., 1994], accuracies are
re-assessed in Ref. [Lindsay and McCall, 2001]; c this work. Experimental accuracies are denoted in brackets.
4.3.2 Temperature diagnostics of H+3
The linewidths of the absorption profiles in Fig. 4.18 are dominated by Doppler broad-
ening. Therefore the profiles unveil the translational velocities of the stored ions in the
initial states of the transitions. Hence we can assign a translational temperature to the
ions in these states. A Gaussian fit yielded a standard deviation of σD = (470 ± 30)MHz
for the strongest line and compatible values for the two weaker lines. According to eqn.
(4.17) this corresponds to a translational temperature of (170±20)K.
The relative population of each of the rotational states is obtained by dividing the
amplitude of each resonance peak by the Einstein coefficient for the corresponding tran-
sition. We found that the populations of the three lowest rotational states correspond in
energetically ascending order to 1 : 1.6(2) : 0.54(8). In thermal equilibrium the populations
p(J,G) are linked to the temperature according to
p(J ′,G′)
p(J,G)
=g(J ′,G′)
g(J,G)
e−(E(J′,G′)−E(J,G))/(kBT ), (4.21)
where the statistical weight g(J,G) = (2J + 1)(2I + 1) depends on the total rotational
quantum number J as well as the total nuclear spin I. Using this equation the ratio
of the measured populations of the two para states (1,1) and (2,2) is converted into an
effective temperature which amounts to (140±20)K. In the same way the population of
the lowest para and the lowest ortho state can be used to derive an effective ”para-to-
ortho” rotational temperature of (150±35)K, which has to be clearly distinguished from
the translational and the “para”rotational temperatures because ortho-to-para conversion
of H+3 can only occur in collisions with H2 in this experiment.
All three effective H+3 temperatures are consistent with each other within the exper-
imental accuracy. This may not necessarily be the case, because the translational and
the rotational temperature of the separate ortho and para systems thermalize in collisions
with the dominant buffer gases helium and argon, whereas ortho-to-para conversion may
only occur in collisions with normal H2 by nuclear spin re-arrangement in the H+5 colli-
sion complex. Thus the ortho-to-para temperature is not a priori expected to reflect the
translational or rotational temperature.
76

4.3. Preparation and diagnostics of internally cold molecular ions
The translational and internal temperature of the trapped H+3 ions of about 150 K
is significantly larger than the 55 K temperature of the RF trap and the helium buffer
gas. Three different mechanisms may explain this deviation. On the one hand, electric
field inhomogeneities near the trap electrodes may lead to large amplitudes of the RF
micro-motion in the trap which may assist conversion of RF energy into translational
and subsequently internal energy. Impurities on the RF electrodes of the trap, e. g. due
to the freeze-out of argon, may introduce such patch fields. While high-order multipole
RF traps have in general the property to minimize this effect, its contribution to the H+3
temperature can not be ruled out in the present experiment. On the other hand, the
background gas in the vacuum chamber that penetrates into the ion trap, predominantly
H2 from the ion source (see Table 4.1), may not thermalize quickly enough with the trap
walls and thus lead to collisional heating of the trapped ions. However, this effect may not
explain a temperature increase by more than about 10 K, because the helium and argon
densities together are larger than the H2 density by a factor of 30 and both the helium
and argon buffer gas are carefully thermalized to the 55 K of the cold head, before the
gas enters the ion trap. Nevertheless, the approximately 10 H2 collisions that an H+3 ion
undergoes inside the trap may be enough to equilibrate the ortho-to-para temperature
through an intermediate H+5 collision complex. The third heating mechanism originates
from the normal mixture of the ortho and para states of the H2 gas component in the
ion trap. Thus, 75 % of the H2 molecules are expected to occupy the lowest ortho state
with J = 1, which carries a rotational energy of about 120 cm−1 = kB · 180 K. Quenching
of the excited ortho-H2 states in collisions with the trap walls only occurs with lifetimes
of days. It is therefore possible that this energy is converted in collisions with the stored
ions into H+3 internal or translational excitation. All of the discussed heating mechanisms
are expected to play a much smaller role if the unavoidable low helium buffer gas density
in the described experiment could be significantly enhanced.
In the meantime, the H+3 spectroscopy experiment at the MPI-K has been revisited
and brought to a new level of sensitivity. Various improvements of the experimental setup
allow longer laser interaction with more stored ions at a higher buffer gas density [Kreckel
and Petrigiani, 2007]. The group at MPI-K finds much lower rotational and translational
molecular temperatures in the range of the temperature of the ion trap. It turns out,
however, that helium buffer gas densities in the low 1014 cm−3 range are required, at least
for cooling H+3 in the Heidelberg setup. Indeed for lower densities, as we had them in
the described experiment, an increased molecular temperature is measured [Kreckel and
Petrigiani, 2007]. At buffer gas number densities of 2× 1014 cm−3, the collision rate is
about 200/ms, assuming a Langevin limited rate coefficient of 1× 10⁻⁹ cm3 s−1 for He +
H+3 collisions. This results in a mean free path length of ∼ 0.5 mm at 10 K, which is small
versus the 10 mm trap diameter. For heavier ions than mass three, such as the anions we
77

Chapter 4. Scrutinizing Trapping and Cooling
are using in Freiburg, the mean free path is decreased suggesting that smaller buffer gas
densities are sufficient.
Action spectroscopy has been also carried out on H+3 and its deuterated isotopomers
at the 22pole setup in Chemnitz, where chemical probing with Ar is possible at tempera-
tures below freeze-out by the use of a pulsed supersonic beam passing through the trap.
Using this trick, it was possible for the first time to measure the ion temperature at the
lowest available buffer gas temperature of 10 Kelvin. A translational temperature of T
= (9±4.5)Kelvin was obtained for the transition starting from the ground rovibrational
state. Despite several attempts no absorption by the lowest para state was observed,
indicating also a very low rotational temperature [Glosık et al., 2006].
Photofragmentation spectroscopy on biomolecules in the 22 pole trap in Lausanne
indicate vibrational temperatures ≤ 10 K by the lack of hot-band features to the red of
the lowest energy band origin [Boyarkin et al., 2006].
On the other hand the Cologne group very recently reports action spectroscopy on
H2D+ and D2H
+ by laser induced reactions in a 22 pole trap [Asvany et al., 2007]. At
a nominal trap temperature of 17 K they find a translational temperature of (27±2)K.
Based on numerical simulations including the buffer gas the authors assign half of the
temperature increase of 10 K to rf-driven collisions and the influence of the static end-
caps. They conclude that the remaining temperature increase is probably caused by trap
imperfections or potential distortions.
This shows that while 22 pole traps have proven to create cold ensembles of molecular
ions with temperatures close to the nominal temperature of the trap, perfect thermaliza-
tion with the buffer gas still poses open questions.
78

Chapter 5
Inferring Reaction Dynamics from
Kinetics
In this chapter anion-molecule reaction kinetics is measured as a function of temperature
in the 22pole trap with the aim to infer reaction dynamics. We probe the amount of energy
redistribution in the entrance channel ion-dipole complex using two completely different
approaches. In each case we find strong indications for non-statistical behaviour. In the
first section the rate coefficient of proton transfer from H2 and D2 to the amino radical
anion NH−2 is determined between 300 and 8 Kelvin. We infer the reaction probability
and show that it is much smaller and than predicted by a assuming statistical energy
redistribution. At low temperature, we observe an unexpected rapid decrease in the rate
coefficient. In the second section, we collisionally stabilize the entrance channel complex
from a nucleophilic substitution reaction and deduce the transient lifetime. We find an
inverse temperature behaviour much stronger than predicted by energy randomization.
5.1 Proton transfer to NH−2 at extremely low tem-
peratures
Proton transfer between cations and small molecules is fast and proceeds at or near the
collision rate when exoergic. The essentially unit probability made cationic proton transfer
the ideal benchmark system for the systematic testing of classical ion-molecule collision
rate theories as they were being developed in the seventies. As described in a review
by Bohme, survey measurements of rate coefficients have been performed for the same
neutral, varying the mass of the ionic reaction agent, and for the same ion, varying the
dipole moment of the neutral reaction agent (see Fig. 16 - 18 in [Bohme, 2000]). These
were then compared to predictions from Langevin, Average and Locked Dipole Orientation
theories. Few systems with unusually low rate coefficients, however, attracted attention.
79

Chapter 5. Inferring Reaction Dynamics from Kinetics
For cations, such effects were observed for large reactants as pyridines and amines and
attributed to steric hindrance [Meotner and Smith, 1991]. In these systems, steric effects
prevent close approach of the reactive centers in most of the collisions, resulting in slow
kinetics. For proton transfer to anions, in contrast, slow kinetics is much more common.
As first suggested by Farneth and Brauman [Farneth and Brauman, 1976], their potential
energy surface may exhibit a double minimum structure as for gas phase nucleophilic
substitution reactions. The reaction efficiency is then reduced because of the low density
of states at the transition state, which represents a dynamical hindrance. By this means,
strongly reduced rates of proton transfer as compared to the collision limit are also feasible
for anion molecule systems incorporating small reactants.
5.1.1 Proton transfer from H2 to NH−2In this section we investigate the temperature dependence of the proton transfer from H2
and D2 to the amino radical anion NH−2
NH−2 + H2 → NH3 + H−, (5.1)
which according to ab-initio calculations [Cremer and Kraka, 1986] proceeds on a double
well potential as depicted in Fig. 5.1. This system might hence be regarded as model
system for SN2 reaction dynamics with the advantage of hydrogen dominated reaction
agents, which might facilitate a theoretical approach.
The chemical equilibrium of reaction (5.1) has been investigated almost 35 years ago
at a fixed temperature of T = 297 Kelvin in a flowing afterglow [Bohme et al., 1973]. From
the equilibrium concentrations, an equilibrium constant of K=27± 9 has been obtained
in agreement with the ratio of the independently determined rate coefficients for forward
and backward reaction. From the equilibrium constant K, a standard free energy change
of ∆G = -(85±9)meV is calculated for reaction (5.1) via K = e− ∆G
kBT . A standard entropy
change ∆S = -0.184 meV/K for this reaction may be calculated from tabulated values of
S(H−), S(H2), S(NH3) [NIST, 2007] and assuming that S(NH−2 ) may be approximated by
S(H2O) since the amino radical anion NH−2 is isoelectronic to water. This leads us to a
standard enthalpy change of ∆H = ∆G + T∆S = -(140± 9)meV, making reaction (5.1)
slightly exothermic.
Ab initio calculations have explored the potential energy landscape of the proton trans-
fer reaction (5.1). Different geometries have been considered as reaction intermediates
[Cremer and Kraka, 1986]. For NH−4 there are various energetically stable configura-
tions including a tetrahedral structure with two delocalized electrons, the prototype of
a Double Rydberg Anion [Melin and Ortiz, 2007]. The suggested minimum energy path
and the structure of the reaction intermediates is depicted in Fig. 5.1. NH−2 and H2
form an entrance channel complex [NH−2 · · · H2], in which the axis of the H2 molecule is
80

5.1. Proton transfer to NH−2 at extremely low temperatures
Figure 5.1: Sketch of the potential energy along the reaction coordinate for the proton transfer
NH−2 + H2 → NH3 + H− proceeding on a double-minimum potential surface. The exothermicity of 140 meV, la-
beled by 1, has been obtained from a chemical equilibrium study at 297 K in a flowing afterglow [Bohme et al., 1973].
Energies of reaction intermediates, labeled by 2, are adapted from an ab-initio calculation [Cremer and Kraka, 1986].
The two numbers correspond to two different basis sets, HF/6-31G* and MP2/6-31++G** respectively. According
to the probably more accurate second basis set, the transition state is energetically 120 meV above the entrance
channel complex. Structures of entrance and exit channel complexes are depicted as insets.
pointing towards the nitrogen atom of NH−2 . This complex might be stabilized via a low
energy bending mode. The central barrier corresponds to transfer of a proton from the
H2 molecule to the amino radical anion NH−2 and is comparatively loose. On the exit side,
the energetically most stable conformation of NH−4 is reached, which correspond to the
Hydride-molecule [NH3 · · · H−]. Although it seems to be clear, that the potential energy
along the reaction coordinate is characterized by a double-minimum structure, the exact
depth of the potential wells is strongly dependent on the basis sets used. For the probably
more accurate MP2/6-31++G** level of theory, the intermediate barrier is found to be
120 meV above the entrance channel ion-dipole complex, as might be seen from Fig. 5.1.
A rate coefficient of reaction (5.1) has been measured at T = 297 K and found to
be about two orders of magnitude below the capture limit [Bohme et al., 1973]. The
low rate might be attributed to the cone of steric acceptance in the entrance channel
complex formation and to dynamic hindrance by the intermediate barrier. If this is true,
a reduction of the temperature should make a better exploration of phase space possible
and hence lead to an increase in the reaction rate. By measuring the rate coefficient of
reaction (5.1) between 300 K and 7.5 K, we couple to the previous work of [Bohme et al.,
1973] and push the coldest ever achieved environment for an anion molecule reaction from
81

Chapter 5. Inferring Reaction Dynamics from Kinetics
23 K [LeGarrec et al., 1997] substantially further down.
5.1.2 Absolute rate coefficients and reaction probabilities
NH−2 anions are produced in the ion source by dissociative attachment of secondary elec-
trons to NH3 [Sharp and Dowell, 1969; Yalcin and Suzer, 1992] in a supersonic expansion
of 10% ammonia and 90% Argon counterpropagated by a 1 keV electron beam:
NH3 + e− → (NH−3 )∗ → NH−2 + H. (5.2)
Apart from the amino radical anion NH−2 we observe also formation of substantial amounts
of H− and reasonable amounts of H−(NH3), which we block together with a Chlorine
impurity using our time-of-flight mass gate.
A few hundred NH−2 ions are transferred to the trap and stored in helium buffer gas
at a density of around 1014 cm−3. The proton transfer reaction (5.1) is induced by adding
molecular hydrogen gas to the helium buffer gas in the ion trap with the precision sapphire
valve. The hydrogen number density nH2 is obtained by measuring the hydrogen pressure
with the capacity pressure gauge connected directly to the trap volume using the ideal
gas law and the temperature of trap and pressure gauge. Due to the large excess of the
neutral reactant, its density nH2 can be regarded as constant and the rate equation for
the loss of NH−2 due to proton transfer from H2 is of pseudo first order:
R = −d[NH−2 ]
dt= k× nH2 (5.3)
Here k is the rate coefficient of the reaction in units of cm3
s. Note that no NH3 is provided
in the trap, such that the backreaction H− + NH3 → NH−2 + H2 is not to be taken into ac-
count. After variable interaction times of the trapped ions with the reactant gas, the trap
is emptied and the ion intensity is measured mass-resolved using time-of-flight measure-
ments. These data show an exponential decay of the NH−2 signal. H− product ions cannot
be trapped in the multipole trap at the employed rf frequency and are thus un-detected.
However, for supplying molecular deuterium gas D2 as neutral reactant, the heavier D−
product is formed and observed in the mass spectrum. This shows that the amino radical
anions in fact undergo reaction (5.1). At temperatures above 150 K a parasitic proton
transfer reaction with H2O impurities is observed through the appearance of OH− ions
in the trap. This reaction proceeds at a high rate coefficient of k = 2.6 · 10−9 cm3 s−1 at
297 K [Betowski et al., 1975] and hence accounts for up to 10% of the NH−2 loss. To correct
for this, in the temperature range from 300 to 150 K the decay of the NH−2 ions is fitted
with a rate equation model that includes the reaction with water [Otto, 2006a]. This
yields the partial decay rate with respect to reactions with hydrogen molecules. Losses by
evaporation of the anions from the trap as studied in Section 4.1 can be safely neglected
on the timescale of this experiment.
82

5.1. Proton transfer to NH−2 at extremely low temperatures
Figure 5.2: Measurement of the loss rate R of NH−2 ions due to proton transfer from H2 as a function of the
H2 number density nH2 in the 22pole trap. Errors stem from fit errors of exponential decays. Since R = k × nH2 ,
this yields a precise determination of the reaction rate coefficient k. Shown are measurements at 300 and 8Kelvin.
The rate coefficient is found to be significantly increased with decreasing temperature from k300k = (2.5 ± 0.1)
× 10−11 cm3
sto k8k = (12.9 ± 0.3) × 10−11 cm3
s.
According to eqn. (5.3), a precise value of the reaction rate coefficient k is directly
obtained as linear slope in a measurement of the loss rate R versus the hydrogen density
nH2 in the 22pole trap. We have performed such a measurement for temperatures of
300 and 8 Kelvin respectively, as shown in Fig. 5.2. The linear dependence and the
interception of the origin present further evidence that the anions react with hydrogen
and not with any impurities in the buffer gas. It has been verified that the decay rate
does not depend on the density of the helium buffer gas. The values of the reaction rate
coefficients are obtained by fitting the slopes in Fig. 5.2. Their accuracy is estimated from
the statistical accuracy of the χ2-fit based on the accuracies of the individual decay rate
measurements. The obtained data are summarized in table 5.1, together with the only
previous measurement of a thermal rate coefficient [Bohme et al., 1973] and the calculated
Langevin rates. We find excellent agreement of our 300 K measurement with the previous
value at a 5-fold improved accuracy. The data show that the reaction proceeds at a fraction
of the maximum possible Langevin capture rate, which indicates that upon formation of
a short-range NH−4 reaction complex, dynamical constraints hinder the system to form
products and the complex instead decays back to reactants. As seen from the slope in
Fig. 5.2 and the fit values in table 5.1, we obtain a rate coefficient at 8 Kelvin that is more
than a factor of five higher as compared to the rate coefficient at 300 Kelvin. This shows
that the removal of translational and rotational energy increases the chances for forming
products.
83

Chapter 5. Inferring Reaction Dynamics from Kinetics
temperature [K] this work Ref. [Bohme et al., 1973] Langevin
NH−2 + H2 300 0.025(1) 0.023(5) 1.57
8 0.129(3)
NH−2 + D2 300 0.0098(6) 1.16
8 0.075(3)
Table 5.1: Reaction rate coefficients in 10−9 cm3/s for proton/deuteron transfer from molecular hydro-
gen/deuterium to the amino radical anion NH−2 . Our results are derived from measurements as depicted in Fig.
5.2 and found to be in excellent agreement at an improved accuracy with the only previous measurement carried
out at 300K in a flowing afterglow [Bohme et al., 1973]. The measured rate coefficients show inverse temperature
dependence and are far below the calculated temperature-independent Langevin rate coefficients (polarizabilities
for H2 and D2 used to obtain kLangevin were taken from [Lide, 2003]).
To study isotope effects, we exchange the neutral reactant H2 by molecular deuterium
D2. We see D− ions appearing in the mass spectra, for which the trap is very shallow.
This demonstrates, that we observe the deuteron transfer reaction
NH−2 + D2 → NH2D + D−. (5.4)
Unfortunately the lifetime of D− in the trap is very low, such that we cannot compare
the production of D− with the loss of NH−2 . This would be appreciated to exclude the
channel
NH−2 + D2 → NHD2 + H−, (5.5)
which seems however very unlikely keeping the structure of the reaction intermediates
shown in Fig. 5.1 in mind. From inspection of the time-of-flight mass spectra we can
exclude deuteration of NH−2 to NHD− or ND−2 , such that we regard the deuteron trans-
fer (5.4) as the only possible mechanism when introducing D2 buffer gas. We perform
a measurement of the absolute rate coefficient of reaction (5.4) at the same tempera-
tures of 300 and 8 Kelvin in the same way as described above. As denoted in table 5.1,
the rate coefficient for the deuterated reaction is found to be significantly lower. We
find ratios of the rate coefficients for deuteron and proton transfer of f300KD2/H2= 39% and
f8KD2/H2= 58%, which we compare to an expectation from the Langevin rate coefficient
kL ∝√
αµ
of fD2/H2= 74%. The increase in the relative efficiency of deuteron donation for
decreasing temperature is interesting since in the absence of a permanent dipole moment
of the neutral it is unexpected. Since the electronic potential surface should be untouched,
an isotope effect in the reaction efficiency might point to a suppression by dynamic hin-
drance. A reduced effect for decreasing temperature might in turn point to an increased
lifetime of the intermediate reaction complex at low temperatures.
In order to clarify influence of the temperature on the dynamics of reaction (5.1), we
obtain the reaction rate coefficient for the entire temperature range from 8 to 300 K, as
84

5.1. Proton transfer to NH−2 at extremely low temperatures
shown in Fig. 5.3. For this purpose we employ a more efficient scheme by measuring
the NH−2 decay rate at a fixed hydrogen pressure for different temperatures. In this way,
the density inside the trap is varied by the square root of the traps temperature [Wutz
et al., 2000] and obeying this correction a measurement of the relative rate coefficient
is performed. We then normalize the data sets either to the 8 K or the 300 K absolute
rate coefficient. As seen from the colour code in Fig. 5.3 the different data sets overlap at
intermediate temperatures within their errorbars as expected. The same scheme is applied
for the deuteron transfer using D2 as reaction agent. It is shown in the lower panel of Fig.
5.3.
As can be seen from Fig. 5.3, the rate coefficient is found to be continously rising with
decreasing temperature in the range from 300 to about 20 Kelvin. At around 20 Kelvin
the maximum value is reached. At lower temperatures the rate coefficient is rapidly
falling with decreasing temperature. This effect is observed both for proton and deuteron
transfer. We fit the measured rate coefficient with the following parametrization [Le Teuff
et al., 2000]
k(T ) = α · (T/300)β · exp(−γ/T ), (5.6)
which represents an Arrhenius law combined with a temperature power law as prefactor.
The measurement is well described as might be seen from the solid lines in Fig. 5.3, fit
results are given in Table 5.2.
reaction α [10−11 cm3s−1] β γ [K]
NH−2 + H2 2.56 ± 0.03 -0.96 ± 0.01 14.6 ± 0.3
NH−2 + D2 0.94 ± 0.01 -1.247 ± 0.01 20.7 ± 0.4
Table 5.2: Parameters and their errors obtained from fitting eqn. (5.6) to the measurement shown in Fig. 5.3.
In Fig. 5.4 the reaction probabilities for proton and deuteron transfer from H2 and
D2 to the amino radical anion NH−2 , i. e. the measured rate coefficient divided by the
respective Langevin rate coefficient, are plotted. The reaction probabilities follow Fig.
5.3 since Langevin rate coefficients are not temperature dependent. It can be seen, that
the probability reaches roughly 10% at most. Deuteron transfer features not only a smaller
absolute rate coefficient, also the reaction probability is reduced with respect to proton
transfer over the entire temperature range. The inset shows the ratio of deuteron and
proton transfer reaction probabilities as obtained from the parametrization fits. This ratio
is itself temperature dependent. At a temperature of 20 Kelvin, a minimal difference in
85
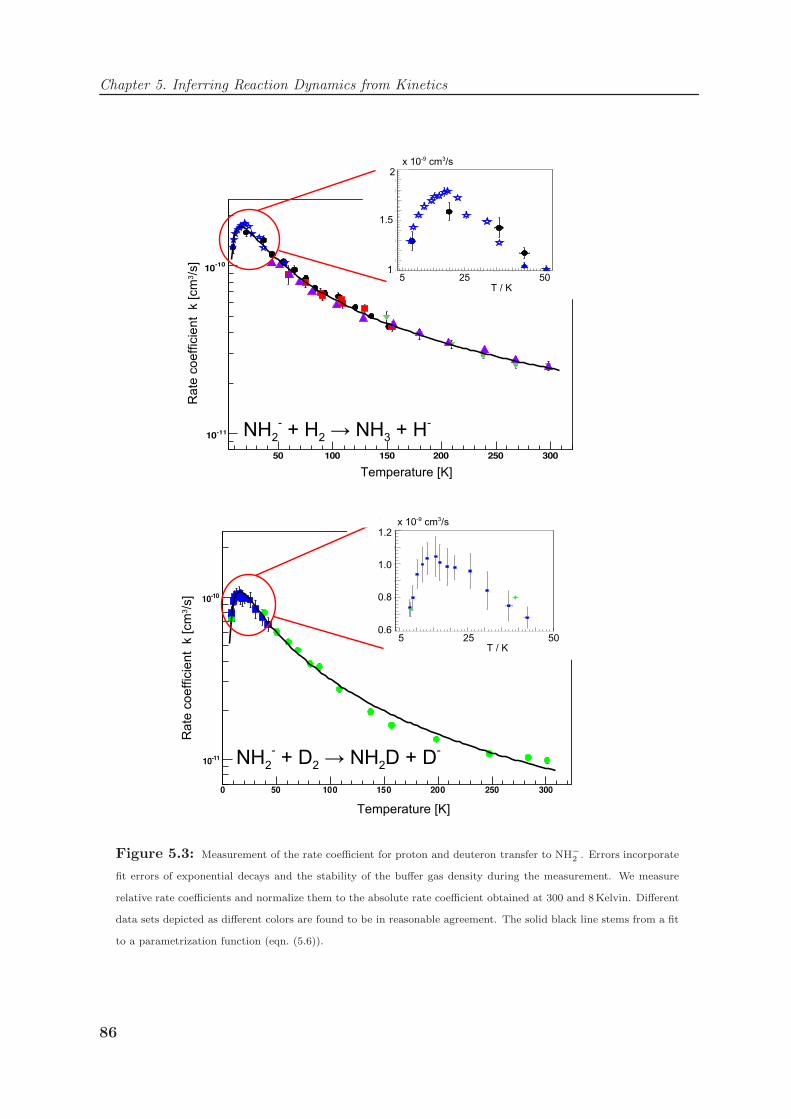
Chapter 5. Inferring Reaction Dynamics from Kinetics
Figure 5.3: Measurement of the rate coefficient for proton and deuteron transfer to NH−2 . Errors incorporate
fit errors of exponential decays and the stability of the buffer gas density during the measurement. We measure
relative rate coefficients and normalize them to the absolute rate coefficient obtained at 300 and 8Kelvin. Different
data sets depicted as different colors are found to be in reasonable agreement. The solid black line stems from a fit
to a parametrization function (eqn. (5.6)).
86

5.1. Proton transfer to NH−2 at extremely low temperatures
Figure 5.4: Reaction probability for proton/deuteron transfer from H2/D2 to the amino radical anion NH−2
depicted in red/blue respectively. It is obtained by scaling the measured rate coefficient of Fig. 5.3 with the
respective Langevin rate coefficient listed in Table 5.1. Inserted solid lines stem from fits following eqn. (5.6). The
inset compares the reaction probability of proton and deuteron transfer by using the fit results.
the efficiencies is found, whereas for higher and lower temperatures the relative probability
of deuteron transfer drops.
The observed strong increase in the reaction rate coefficient with decreasing tempera-
ture is a feature that has been observed for a few other ion-molecule reactions as well. It
might be understood in terms of a three-step model. As a first step, a metastable entrance
channel ion-dipole complex is formed by association of the reaction educts
NH−2 + H2 → [NH−2 · · ·H2]∗. (5.7)
Considering the potential surface depicted in Fig. 5.1, this association reaction should
be free of electronic barriers and hence proceed at a capture rate. In the absence of a
permanent dipole moment of the neutral it should be hindered solely by the centrifugal
barrier, making a Langevin description of the association rate coefficient realistic. In
a second step the intermediate reaction barrier has to be crossed, requiring that the
hydrogen molecule is broken up and the proton is donated to the amino radical anion
[NH−2 · · ·H2]∗ → [NH3 · · ·H−]∗. (5.8)
Crossing the central barrier to the hydride molecule competes with unimolecular decay of
the activated entrance channel ion-dipole complex [NH−2 · · ·H2]∗. Hence only a fraction of
the association events will lead to formation of the exit channel complex. In a third step,
the exit channel complex has to dissociate to form the reaction products
[NH3 · · ·H−]∗ → NH3 + H−. (5.9)
87

Chapter 5. Inferring Reaction Dynamics from Kinetics
This dissociation in turn will compete with a recrossing of the central barrier towards the
entrance channel complex. In this vein the total reaction rate coefficient will be given by
kreact = kassoc ×(
Kcross
Kdiss + Kcross
)×
(K′diss
K′recross + K′diss
), (5.10)
where K denotes rates of unimolecular dissociation and barrier crossing on the entrance
channel side of the central barrier and K′ on the exit channel side respectively. The
competition between complex dissociation and molecular rearrangement on the double
well potential surface provides an explanation for a reaction rate coefficient, that might
be strongly suppressed with respect to the capture rate. An increase of the reaction
rate with decreasing temperature can qualitatively be understood via a prolongation of
the short complex lifetime K−1diss of the entrance channel ion dipole complex. This will
give the system more time to exploit the available phase space and cross the barrier
towards reactants. In the next section (see 5.2), we measure for the first time the lifetime
of the entrance channel complex of a nucleophilic substitution reaction as a function of
temperature and find a steep increase with decreasing collision energy.
5.1.3 Statistical modeling of reaction rates
Statistical theories provide a way to quantify the rate coefficient described by eqn. (5.10).
They generally assume, that all available energy is equally distributed among all degrees of
freedom of the complex. In this way a probability for crossing the central barrier is derived
in a static picture by comparing densities of state. Central assumption of statistical
theories is the concept of a transition state, meaning that there is a point of no return.
Once the transition state is reached, products will be formed with unit probability. In our
case, a transition state is associated with the central barrier and denoted with ”TS” in Fig.
5.1. Due to this assumption of the central barrier as a bottle neck, the third factor in eqn.
(5.10) involving the exit channel complex is unity. To account for the second factor, we
have performed a statistical calculation based on RRKM and phase space theory modeling
the branching of the entrance channel complex [NH−2 · · ·H2]∗ into dissociation and barrier
crossing1.
RRKM theory is a microcanonical transition state theory, which treats the unimolec-
ular decomposition of a polyatomic molecule [Forst, 2003]. The molecule resides over a
well in the potential surface at energy E and is detained from decomposition by a barrier
of height E0, which acts as a transition state ‡. Then, according to RRKM theory, the
rate constant for unimolecular decomposition is given by
kdecomp(E) =N ‡(E− E0)
hρ(E), (5.11)
1Details will be given in: Rico Otto, PhD thesis (in preparation).
88

5.1. Proton transfer to NH−2 at extremely low temperatures
Figure 5.5: Probability for the proton transfer reaction (5.1) following RRKM theory. Decomposition of the
entrance channel complex [NH−2 · · · H2] is considered towards the reactants * and towards the central barrier ‡.
The probability for crossing the barrier is given by comparing the sum of states. To obtain the sum of states N∗ for
the loose transition state phase space theory is employed to treat external rotations and the conservation of angular
momentum.
where N ‡(E− E0) is the total number of states at the transition state up to energy
(E− E0), ρ(E) is the density of states of the polyatomic molecule at energy E and h
is Planck’s constant. Applied to our situation, depicted in Fig. 5.5, we could sepa-
rately calculate the rate of unimolecular decomposition of the entrance channel complex
[NH−2 · · ·H2]∗ into products and into reactants. The transition state in the first case, as-
signed as ‡, is the central barrier of the double minimum potential. The transition state
in the second case, assigned as *, is the centrifugal barrier along the reactant asymptote,
a so called “loose” transition state. Here we are just interested in the relative abundance
of one of the two channels, namely the crossing of the central barrier towards reactants.
According to the RRKM equation (5.11) and demonstrated in Fig. 5.5 this abundance
can be written as
p(Ekin) =
(Kcross
Kdiss + Kcross
)=
N ‡(Ekin + ∆ E)
N∗(Ekin) + N ‡(Ekin + ∆ E)(5.12)
where N ‡(Ekin + ∆ E) and N∗(Ekin) denote the sum of states for transition state ‡ and *
respectively. The energies Ekin and ∆E are defined according to Fig. 5.5 as translational
energy of the reactants and as energy difference between the two transition states ‡ and *.
Hence for determination of the reaction rate coefficient (5.10) we are left with a problem
of state compilation and state counting for the reactants and the molecular configuration
89

Chapter 5. Inferring Reaction Dynamics from Kinetics
at the central barrier.
Relevant are vibrational and rotational levels of NH−2 , H2 and [NH−2 · · ·H · · ·H]∗ and
for the separated reactants also a way to include orbital angular momentum. To obtain
vibrational levels at neglected anharmonicity, we have performed an ab initio molecular
orbital calculation with Gaussian [Gaussian03, 2007] using an MP4 6311++G basis set.
Since this calculation yields molecular structures, depicted in Fig. 5.1, also rotational
constants are derived from moments of inertia. Relative energies of transition states are
computed from differences of total molecular energies. All results are collected in table
5.3 and compared to measured values, where available. Our relative energies are similar
to the previous MP2 6-31++G** calculation of Ref. [Cremer and Kraka, 1986]. They
are supposed to be more accurate due to the extended basis sets we have used. The val-
ues confirm a double well potential energy hypersurface with a significant central barrier
more than 130 meV above the entrance channel complex and about 70 meV submerged
with respect to the asymptote corresponding to the reaction partners. Due to the mea-
sured exothermicity of 140 meV [Bohme et al., 1973], the transition state is in terms of
energy symmetrically placed with respect to the entrance and exit channel asymptotes,
making this system very similar to the more famous Cl− + CH3Br → CH3Cl + Br− SN2
potential surface. As can be further seen from table 5.3, low lying vibrational modes are
introduced once the products have associated to a collision complex. These are floppy
intermolecular modes between the constituents NH−2 and H2 of the ion-dipole complex. At
the same time the intramolecular modes are more and more modified due to the ion-dipole
interaction as might be seen from the NH2 bending and stretching modes in [NH−2 · · ·H2]
and [NH−2 · · ·H · · ·H]. The H2 stretch vibrational mode becomes the reaction coordinate
in the transition state ‡, which is hence lacking one vibrational degree of freedom. Small
rotational constants testify the enlarged size of the ion dipole complex and the more tight
structure at the central reaction barrier.
From the data of table 5.3, we calculate vibrational and rovibrational sums of state
N ‡(Ekin + ∆ E) and N∗(Ekin) at the tight transition state ‡ and the loose transition state *
respectively. The results are shown in Fig. 5.6 as a function of the kinetic energy Ekin up to
2500 cm−1 (0.31 eV). Remember that within statistical theories energy is considered only
as total energy regardless of its origin. The vibrational and rovibrational sum of states as
determined by a direct state counting algorithm (Beyer-Swinehart) are depicted as black
and blue line respectively. Its stepwise nature springs from the excitation of subsequent
vibrational states. For the loose transition state * corresponding to the reaction educts,
vibrational excitation does not play any role at the energies under investigation in this
experiment due to the high lying harmonic levels listed in table 5.3. On the other hand due
to the free and molecular nature of the fragments, there are plenty of rotational degrees of
freedom, which cause a steep rise in the rotational sum of states. For transition state ‡, a
90
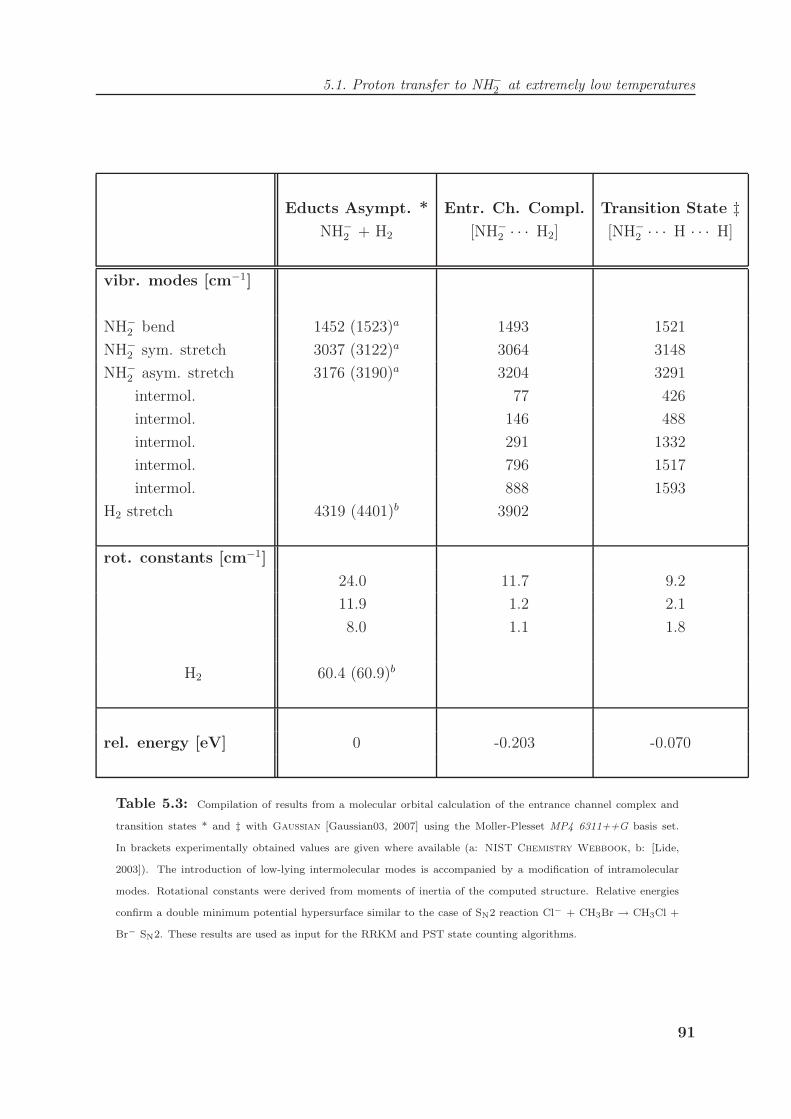
5.1. Proton transfer to NH−2 at extremely low temperatures
Educts Asympt. * Entr. Ch. Compl. Transition State ‡NH−2 + H2 [NH−2 · · · H2] [NH−2 · · · H · · · H]
vibr. modes [cm−1]
NH−2 bend 1452 (1523)a 1493 1521
NH−2 sym. stretch 3037 (3122)a 3064 3148
NH−2 asym. stretch 3176 (3190)a 3204 3291
intermol. 77 426
intermol. 146 488
intermol. 291 1332
intermol. 796 1517
intermol. 888 1593
H2 stretch 4319 (4401)b 3902
rot. constants [cm−1]
24.0 11.7 9.2
11.9 1.2 2.1
8.0 1.1 1.8
H2 60.4 (60.9)b
rel. energy [eV] 0 -0.203 -0.070
Table 5.3: Compilation of results from a molecular orbital calculation of the entrance channel complex and
transition states * and ‡ with Gaussian [Gaussian03, 2007] using the Moller-Plesset MP4 6311++G basis set.
In brackets experimentally obtained values are given where available (a: NIST Chemistry Webbook, b: [Lide,
2003]). The introduction of low-lying intermolecular modes is accompanied by a modification of intramolecular
modes. Rotational constants were derived from moments of inertia of the computed structure. Relative energies
confirm a double minimum potential hypersurface similar to the case of SN2 reaction Cl− + CH3Br → CH3Cl +
Br− SN2. These results are used as input for the RRKM and PST state counting algorithms.
91

Chapter 5. Inferring Reaction Dynamics from Kinetics
Figure 5.6: Sum of states N∗(Ekin) and N‡(Ekin + ∆E) at the loose transition state * and the transition state
‡ associated to the central barrier of reaction (5.1) as a function of the kinetic energy Ekin of the reactants. We
use harmonic rotational and vibrational states derived from the molecular orbital calculation compiled in Table 5.3
as input. The blue and black lines were derived from direct state counting via the Beyer-Swinehart algorithm and
represent vibrational and rovibrational sums of state respectively. The green line corresponds to an approximate
way of state ascertainment via the method of steepest descent and delivers the required smooth function. For
transition state ‡ the sum of states approaches a finite value for Ekin → 0 due to the additional energy ∆ E available
as potential energy. For the loose transition state * dissociating to free fragments, orbital angular momentum needs
to be taken into account. We hence use Phase Space Theory to compute the density of states; the result is shown
as red line. Its steep ascent stems from the multiple rotational degrees of freedom of the free partners H2 and NH−2 .
92

5.1. Proton transfer to NH−2 at extremely low temperatures
different behaviour is obtained. Low lying vibrations in combination with the additional
energy ∆T make the function of vibrational sum of states already very similar in shape
to the rovibrational sum of states. The additional energy ∆T is also responsible for the
nonvanishing sum of states N ‡(∆ E) at zero kinetic energy. The green line corresponds to
the rovibrational sum of states as obtained from an approximate state counting algorithm
(the method of steepest descent) [Forst, 2003]. It produces a smooth function, which is
required and better adapted to the inherent semi-classical nature of the microcanonical
theory. As can be seen from Fig. 5.6 the result is very similar to the one derived by
direct state counting. For decomposition into free fragments, as in the case of the loose
transition state *, an additional point has to be taken into account. Here in addition
to internal angular momentum Jr we have to deal also with orbital angular momentum
L and the conservation of total angular momentum Jr + L. To account for this, we use
Phase Space Theory to consider external degrees of freedom. The result is shown as red
line in the plot of N∗(Ekin) in Fig. 5.6. The availability of additional degrees of freedom
results in an enhanced sum of states.
The reaction probability p(Ekin) is obtained according to eqn. (5.12) by normalizing
the sum of states for the transition state ‡, N ‡(Ekin + ∆ E), to the sum of states for both
transition states, N∗(Ekin) + N ‡(Ekin + ∆ E). Since the kinetic energy corresponds to the
total energy for the loose transition state *, p(Ekin) will approach unity for Ekin → 0,
where the sum of states vanishes for * but goes to N ‡(∆ E) for transition state ‡. Hence
a statistical model will not be able to explain the surprising observation of a suddenly
decreasing rate coefficient for low temperatures.
To compare the modeled rate coefficient with the measurement a thermal averaging of
k(Ekin) = kLangevin × p(Ekin) has to be done. The thermal rate coefficient k(T) is obtained
from
k(T) = Q−1
∫ ∞
0
k(E)ρ∗(E) exp(−β E) dE, (5.13)
following [Levine, 2005], where β = 1/(kBT) is the Boltzmann factor, ρ∗(E) =dN∗dE
is the
density of states of the reactants and Q is their partition function
Q =
∫ ∞
0
ρ∗(E) exp(−β E) dE. (5.14)
The result normalized to the Langevin rate coefficient is shown in Fig. 5.7 and compared
to the experimentally obtained reaction probability. As already noted, the modeled rate
coefficient starts from unity for T=0 K, it drops to about 25% for T=300 K. As seen from
the scaled model, where k(0) was set to 0.065, the statistical model might be suited to
describe the shape of k(T) for temperatures above 150 K. It is however inappropriate to
explain the low overall rate coefficient, the increasing slope for decreasing temperatures
down to 20 Kelvin, and the rapid decrease for temperatures below 20 Kelvin.
93

Chapter 5. Inferring Reaction Dynamics from Kinetics
Figure 5.7: Comparison of the thermal reaction probability as derived from the statistical model and the
experiment. According to RRKM theory, the statistical reaction probability p(Ekin) is derived from normalizing
the sum of states N‡(Ekin + ∆ E) for the transition state corresponding to the central barrier to the total sum of
states N∗(Ekin) + N‡(Ekin + ∆ E) for both transition states. The two functions are depicted in Fig. 5.6. p(T) is
then derived from a convolution of p(Ekin) with the reactant density of states and a Boltzmann factor as described
by eqn. (5.13). While the statistical model might be suited to reproduce the relative change in the measured reaction
probability at high temperatures it fails to explain the overall low values and the rapid decrease at low temperature.
Figure 5.8: Probability for occupation of rotational levels J>0 as a function of rotational temperature for
NH−2 obeying a Boltzmann distribution. Rotational levels up to Jτ = 2 are considered (τ : projection quantum
number). The inserted black line stems from a fit following A × exp(-γ∗/T) and yields an activation energy of
γ∗ = 26 ± 4 K for rotational excitation. This value is similar to the barrier found in the proton transfer reaction
NH−2 + H2 → NH3 + H−.
94
5.1. Proton transfer to NH−2 at extremely low temperatures
5.1.4 Beyond statistical redistribution of energy
The low overall reaction rates might show a bad coupling between inter- and intramolecu-
lar modes provoked by the mismatch in frequencies documented in Table 5.3. The coupling
is necessary to carry energy into the H2 bond to be broken. A suppressed randomization
of energy and mode-specific effects are also in contradiction to statistical theories, which
partition the total energy regardless of its origin. A reduced reaction efficiency might
also point to the importance of recrossings of the central barrier, which are inherently not
taken into account in the concept of a transition state. Both features have been observed
in molecular dynamics simulations of nucleophilic substitution reactions [Hase, 1994] on
similar potential surfaces.
The observed rapid decrease in the rate coefficient for these low temperatures repre-
sents a feature, which has never been reported for other ion-molecule reactions. Following
the parametrization (5.6) it may be described as a low energy effective barrier of only
15 Kelvin height (see the fit results in table 5.2). We have currently no explanation for
this feature. No evidence points to a barrier in the electronic potential energy surface.
Further insight is clearly required from a dynamical model. We have carefully checked,
that the rate coefficient is not dependent on the Helium density in the trap thus excluding
three body processes and the formation of Helium clusters around the ions. The latter
would represent a straightforward explanation since clusters would introduce steric hin-
drance and kinetic energy would be required to break them up [Arnold and Viggiano,
1997].
To act from necessity we allow ourselves a speculation affiliated with the scales of
energy involved in the system under study. Inspection of table 5.3 shows, that for the
reactants the only energy on the required scale is rotational excitation of NH−2 . Even
the lowest ortho state of H2 is 150 K above the para groundstate. Fig. 5.8 shows the
probability for rotational excitation J > 0 in NH−2 as a function of temperature. The
solid line stems from a fit following A × exp(-γ∗/T) and yields an activation energy of γ∗
= 26 ± 4 K. Assuming one could identify a strong reaction suppression for NH−2 in the
rotational groundstate J=0, the rapid decrease in the rate coefficient for low temperatures
would be explained.
From the experimental side, we plan to gain further insight into the nature of this
barrier by isotope exchange. If the effect is related to NH−2 rotations it should be sensitive
to employment of ND−2 . Furthermore we plan to use para H2 as reaction agent to remove
the additional 150 K internal energy provided in 75% of the collisions.
95

Chapter 5. Inferring Reaction Dynamics from Kinetics
5.2 Nucleophilic substitution metastables probed by
ternary collisions
5.2.1 Anion dipole complexes as reaction intermediates
In this chapter we tackle experimentally the lifetime of metastable anion-dipole complexes
formed as first step in a bimolecular nucleophilic substitution (SN2) reaction proceeding
on a double well potential. This work scrutinizes the perception of an enhanced com-
plex lifetime with decreasing temperature conceived to explain the inverse temperature
dependence of the rate coefficient [LeGarrec et al., 1997].
Despite the importance of the complex lifetime on the reactivity and reaction dy-
namics, only two direct measurements of SN2 complex lifetimes have been carried out
to date [Li et al., 1996; Wester et al., 2003]. A high pressure mass spectrometry study
using collisional stabilisation resulted in a lifetime of 12 to 16 ps for [Cl− · · · CH3Cl]∗ at
a fixed temperature of 296 K [Li et al., 1996] 2. Time-resolved tracking of the dissocia-
tion of [I− · · · CH3I]∗ revealed a dissociation lifetime of about 10 ps for SN2 complexes
with roughly 20 meV relative energy above the asymptote [Wester et al., 2003]. Classical
trajectory calculations predict collision complex lifetimes in the picosecond regime with a
pronounced translational energy dependence [van de Linde and Hase, 1990c; van de Linde
and Hase, 1990b]. Reduced-dimensional quantum calculations [Clary and Palma, 1997;
Hernandez et al., 1999; Schmatz and Clary, 1998; Schmatz, 2000; Schmatz et al., 2001;
Hennig and Schmatz, 2005; Hennig et al., 2006] show many narrow Feshbach and Shape
resonances with a broad range of lifetimes and a strong increase of these lifetimes with de-
creasing temperature. Up to now no experimental data was available on the temperature
dependence of SN2 metastables.
We extract lifetimes of SN2 anion-dipole complexes, similar to the work of Ref. [Li
et al., 1996], from ternary rate coefficients for the formation and collisional stabilisation
of the complexes. We measure ternary rate coefficients in our 22pole radiofrequency ion
trap, which enables easy variation of the collisional and internal temperature of the asso-
ciating reactants. For cationic reactions, the extraction of complex lifetimes from ternary
association has a long history using flow and drift tubes at high pressure [Adams and
Smith, 1981; Adams and Smith, 1987; Glosık et al., 1995; Smith, 1998] and has also been
performed in a radiofrequency ion trap [Schlemmer et al., 2002]. These experiments were
interpreted in the framework of statistical phase space theories based on the assumption
of an ergodic complex [Herbst, 1979; Herbst, 1982; Bates, 1979; Bass and Jennings, 1984].
2Note the corrected value of 16 ps as compared to 27 ps in the publication; the authors may havemisinterpreted table VI in Ref. [van de Linde and Hase, 1990c], which they used in their data analysis.
96

5.2. Nucleophilic substitution metastables probed by ternary collisions
Figure 5.9: Potential energy hypersurface of the symmetric SN2 reaction Cl− + CH3Cl −→ ClCH3 + Cl−. The
dashed line stems from the interaction of the anion with the permanent and induced dipole moment of the neutral.
The reactants shuttle between the free and the associated metastable form [Cl− · · · CH3Cl]∗ until eventually
stabilized by impact of a third particle to form the stable complex [Cl− · · · CH3Cl]. The rate of stable complex
formation is given by the association rate of the metastable times its stabilization rate via third particle impact
divided by the metastables unimolecular dissociation rate kΓ. A measurement of the three body rate coefficient by
variation of the neutral density nCH3Cl hence yields the complex lifetime τ = k−1Γ , once the rate coefficients for
formation kf and stabilization ks are known. These correspond to barrier-free ion-molecule reactions and are in
accordance with the literature assumed to be determined by the capture rate.
97

Chapter 5. Inferring Reaction Dynamics from Kinetics
Here we investigate the symmetric anion-molecule SN2 reaction
Cl− + CH3Cl −→ ClCH3 + Cl−, (5.15)
specifically the formation and the unimolecular decay time of the [Cl− · · · CH3Cl]∗ en-
trance channel complex. This thermoneutral system is the favourite SN2 reaction for
theoretical investigations, because of the intrinsic barrier dynamics in the absence of a
thermodynamic driving force. We have drafted this system, because it exhibits a high cen-
tral barrier, such that the reactants shuttle between the free and the metastably associated
form. This might be seen from Fig. 5.9, which shows the potential energy as a function of
the difference of the two C-Cl interatomic distances ∆r(C− Cl) - the reaction coordinate
[van de Linde and Hase, 1990a]. It shows the double-minimum structure characteristic to
SN2 reactions, where the minima correspond to ground-state entrance and exit channel
ion-dipole complexes. The computed binding energy with respect to the asymptotes is
about 450 meV, in reasonable agreement with experimental data from collision induced
dissociation and high-pressure mass spectrometry [DeTuri et al., 1997; Li et al., 1996;
Dougherty et al., 1974; Larson and McMahon, 1984; Larson and McMahon, 1985]. For
comparison, the dashed line shows the long-range electrostatic potential calculated for the
interaction of the Cl− ion with the permanent and induced dipole moment of CH3Cl.
The formation and the unimolecular decay of the entrance channel complex [Cl− · · ·CH3Cl]∗ represent the first steps that determine how reaction (5.15) proceeds from reac-
tants to products. The next step, the transition of the central barrier in the potential
energy surface is strongly suppressed at thermal energies due to the height of the inter-
mediate barrier calculated to lie more than 100 meV above the asymptotes (see Fig. 5.9).
This results in a very low rate coefficient of reaction (5.15), which was measured in a drift
tube by Bierbaum and coworkers [Barlow et al., 1988] to be k = (3.5± 1.8) × 10−14 cm3
s−1 at 300 K, five orders of magnitude below the capture rate coefficient. Currently, this
thermal rate provides the only experimental test of the barrier height via quantitative
models of reaction based on different statistical theories [Barlow et al., 1988; Tucker and
Truhlar, 1989; Tucker and Truhlar, 1990; Wladkowski and Brauman, 1993; Graul and
Bowers, 1994]. However, classical trajectory and quantum-dynamical calculations suggest
strong nonstatistical behaviour like barrier recrossings [Cho et al., 1992; van de Linde and
Hase, 1990b; Sun et al., 2001] and mode selectivity [Hennig and Schmatz, 2005; Hennig
et al., 2006], which disputes the applicability of statistical models. Furthermore, the ex-
perimental value for the rate coefficient itself [Barlow et al., 1988] is placed in doubt by
guided ion beam measurements [DeTuri et al., 1997] and further theoretical calculations
[Okuno, 1996; Clary and Palma, 1997]. The latter works argue that the experiment of Ref.
[Barlow et al., 1988] might have been influenced by redistribution of energy in collisions
with the helium buffer gas during the lifetime of the SN2 collision complex.
98

5.2. Nucleophilic substitution metastables probed by ternary collisions
At higher collision energies experiments show the translational activation of reaction
(5.15) with an apparent threshold of (0.47 ± 0.16) eV [Barlow et al., 1988; DeTuri et al.,
1997]. Considerable analytical and numerical effort has been conducted to elucidate why
this threshold is more than a factor of three higher than the computed central barrier
heights [DeTuri et al., 1997; Ervin, 1999; Mann and Hase, 1998; Yu and Nyman, 1999;
Li and Hase, 1999]. While the initially proposed front side attack [Barlow et al., 1988;
Glukhovtsev et al., 1996; Deng et al., 1994] was excluded [DeTuri et al., 1997], ab-initio
direct dynamics studies [Mann and Hase, 1998; Li and Hase, 1999] unraveled a direct
reaction mechanism which avoids trapping in the ion-dipole complexes and displays very
inefficient translational to vibrational coupling with the possibility of very short complex
lifetimes. This is another indication of the “non-statistical” dynamics in nucleophilic
substitution reactions. With the lifetime measurements in this work we intend to provide
experimental data on the entrance channel complex to aid theoretical calculations in
solving this debate.
5.2.2 Association of [Cl− · · · CH3Cl] by collisional stabilisation
Three-body association in the thermal environment of the ion trap can be understood as
a two-step process (see also Fig. 5.9):
kfn ksn
Cl− + CH3Cl [Cl− · · ·CH3Cl]∗ → [Cl− · · ·CH3Cl]
kΓ
(5.16)
In the first step collisions of Cl− anions with neutral CH3Cl form the highly excited ion-
dipole complex [Cl−· · · CH3Cl]∗ with the rate kf · n, where kf denotes the capture rate
coefficient and n the methyl chloride density. This complex disscociates back to reactants
with the unimolecular rate kΓ. Stabilization of the complex only occurs if a third particle
impact removes more internal excitation from the complex than its initial relative energy.
Given the deep well in the potential only a fraction of the internal excitation of the
complex [Cl−· · · CH3Cl]∗ needs to be removed to prevent dissociation. In further collisions
thermalization of the internal energy with the buffer gas temperature occurs. Reexitation
of the complex above the dissociation asymptote is suppressed by a Boltzmann factor. The
rate of stabilisation is given by ksn, where ks is the rate coefficient for inelastic collisions
and n is the density of the neutral stabilizing agent. Under the low pressure conditions of
the experiment stabilisation of the complex is a rare event; the timescale for collisions is
about 10µs as compared to expected dipole-complex lifetimes in the range of picoseconds.
The overall rate of product formation in reaction (5.16) is therefore written as
R =kfks
kΓn2 = k3 n2. (5.17)
99

Chapter 5. Inferring Reaction Dynamics from Kinetics
The quadratic dependence of the formation rate on the density accounts for the fact that
CH3Cl is responsible for both forming and stabilizing the cluster. The three-body rate
coefficient k3 =kf ks
kΓis determined from a measurement of the cluster growth rate R as
a function of the CH3Cl density n. Both kf and ks describe barrier-free ion-molecule
reactions and are very close to the capture limited rate coefficient, as discussed below.
With this the unimolecular dissociation rate kΓ becomes experimentally accessible, the
inverse of which is the lifetime of the excited collision complex [Cl− · · · CH3Cl]∗.
For anion production in the source we use a pulsed supersonic expansion of argon with
a small admixture of CCl4 bombarded by a pulsed 1 keV electron beam. Cl− anions are
generated via dissociative attachment of slow secondary electrons [Matejcık et al., 2002]
and transferred to the temperature-variable 22pole trap, which we use as reaction cham-
ber for the threebody association experiment. Typically 2×10³ Cl− anions are trapped
per filling. Neutral reactant CH3Cl gas (purity 99.8%) is applied at a well defined and
well controllable density determined with the gas-type-independent capacitance pressure
gauge directly connected to the trapping volume. Depending on the experiment CH3Cl
is the only buffer gas or accompanied by He or N2. The time-of-flight mass spectra ob-
tained after variable storage times show an exponential decay of the Cl− ion signal with
storage time and the corresponding formation of cluster ions with higher masses. Due to
HCl impurities in the CH3Cl buffer gas, the formed [Cl− · · · CH3Cl] complex is a tran-
sient species that converts to the much deeper bound hydrogen bonded dihalide ClHCl−
cluster [Caldwell and Kebarle, 1985] by subsequent ligand switching with HCl. Further
coagulation followed by collisional dissociation make the mass spectra difficult to interpret
in detail. Nevertheless the three-body association Cl− + CH3Cl −→ [Cl− · · · CH3Cl] is
identified as the rate determining step, the rate of which is given by the measured Cl−
decay rate according to Eq. (5.17).
The measured Cl− decay rate in methyl chloride buffer gas is shown in Fig. 7.15
as function of the methyl chloride density at a temperature of 150 K. It is found to be
well fitted by the quadratic dependence k3n2, which demonstrates the expected three-
body association of [Cl− · · · CH3Cl]. A three-body rate coefficient of k3(150 K) = (2.76 ±0.05)× 10−28 cm−6/s is obtained from the fit. At lower temperatures the partial pressure of
CH3Cl reaches its vapour pressure and the buffer gas freezes to the trap walls. We observe
the quadratic dependence up to trap temperatures of 220 K. At higher temperatures than
220 K an additional linear contribution to the Cl− decay rate starts to mask the three-
body association. At 280 K this linear contribution, which we attribute to a combination
of bimolecular reaction and collision induced dissociation, becomes dominant. In this
study we therefore provide data on the temperature range between 150 and 220 K.
In Fig. 5.11a the measured three-body rate coefficient k3(T ) is shown as a function
of temperature. It is found to show a strong inverse temperature dependence within the
100

5.2. Nucleophilic substitution metastables probed by ternary collisions
]3 [1/cmCl3
CHn20 40 60 80 100 120 140 160
1210×
loss
rat
e [1
/s]
-C
l
0
1
2
3
4
5
6
7
Figure 5.10: Cl− loss rate from the trap due to production of [Cl− · · · CH3Cl] as a function of the density of
CH3Cl buffer gas. Each point is obtained from a measurement of the ion intensity versus storage time. The solid
line stems from a pure quadratic fit demonstrating that CH3Cl acts both as associating and stabilizing agent. The
fit parameter is the threebody rate coefficient.
studied temperature range of 150 to 220 K. The graph is well parametrized by the scaling
law k3 = αT−n, where the best fit of n yields 3.5± 0.2 (see Fig. 5.11a). We compare this
exponent to the prediction of statistical theory based on the principle of detailed balance
[Herbst, 1979]. This model suggest that n = (r + 1)/2, where r is the total number
of rotational degrees of freedom of the separated association partners; excitation of the
vibrational degrees of freedom of CH3Cl does not play a role at the given temperatures.
In our case of [Cl− · · · CH3Cl] association, the statistical model predicts n = 1.5, a
temperature dependence much weaker than our experimental finding. Such a strong
deviation from the statistical model is unusual for ternary association reactions [Viggiano,
2007]. This might either indicate that the low-energy cluster vibrations, which are not
included in the statistical model, need to be taken into account. Or this finding may
represent another indication for intrinsic non-statistical dynamics in this SN2 complex.
5.2.3 Lifetimes of SN2 entrance channel complexes
According to Eq. (5.17), the lifetime of the excited ion-dipole collision complex [Cl− · · ·CH3Cl]∗ can be derived from the ternary rate coefficient k3 once the bimolecular rate
coefficients for formation kf and stabilisation ks for collisions with CH3Cl are known. In
previous studies of three-body association both these rate coefficients are usually assumed
to be capture limited. Instead, we base our analysis on the association rate coefficients
kf derived from dedicated molecular dynamics simulations for reaction (5.15) at different
relative translational energies (table VI of Ref. [van de Linde and Hase, 1990c]). These
deviate slightly from capture theory calculations and are expected to map out the temper-
ature dependence more accurately, which is important in this analysis. The stabilisation
101
Chapter 5. Inferring Reaction Dynamics from Kinetics
T [Kelvin]140 160 180 200 220
/s]
6 c
m28
[10
3k
0
0.5
1
1.5
2
2.5
3
3.5
T [Kelvin]140 160 180 200 220 240 260 280 300
[p
s]τ β
0
5
10
15
20
25
30
35
40
45
50
Figure 5.11: Threebody rate coefficient (upper panel) and the derived complex lifetime (lower panel) as a
function of temperature. Rate coefficients k3 have been determined by measurements of the Cl− destruction as
demonstrated in Fig. 7.15. They exhibit a strong inverse temperature dependence, described by the fit k3 = αT−n
with n = 3.5 ± 0.2. Lifetimes k−1Γ of the entrance channel complex [Cl− · · · CH3Cl]∗ are extracted from the
threebody rate coefficients k3 =kf ks
kΓusing rate coefficients for association and stabilisation provided by molecular
dynamics simulations. Our values, depicted as black squares, are increasing from 16 to 42 ps when the temperature
is decreased from 220 to 150 Kelvin. We compare them to a high-pressure mass spectrometry study at 296Kelvin
yielding 16 ps [Li et al., 1996] (black triangle pointing upwards) and a fs pump probe experiment tracking [I− · · ·CH3I]∗ to obtain 10 ps [Wester et al., 2003] (black triangle pointing downwards). The open cross represents the
result from a molecular dynamics calculation [van de Linde and Hase, 1990c].
102

5.2. Nucleophilic substitution metastables probed by ternary collisions
rate ks may be smaller than the capture limited rate due to inefficient energy transfer from
the cluster vibrations to the collision partner. This is accounted for by parameterizing
the stabilisation rate as ks = β × kcollision, where kcollision represents the capture rate and
β denotes the probability for carrying away enough internal energy from the complex in a
collision to prevent its dissociation. The capture rate is obtained for the polar stabilizing
agent CH3Cl from the parametrization of classical trajectory results by Su and Chesnavich
[Su and Chesnavich, 1982; Su, 1988]. For stabilizing agents without a permanent dipole
moment the temperature-independent Langevin collision rate is used.
In order to obtain information on the stabilisation efficiency β we experimentally
compare the stabilisation rates of different neutral collision partners. Fig. 5.12 shows the
conversion rate of Cl− in the trap as a function of the applied helium density at 150 K
while a constant density of CH3Cl is maintained. For vanishing helium density the decay
rate represents the three-body association with CH3Cl as described above. Adding he-
lium to the buffer gas results in an additional linear contribution to the Cl− conversion
rate proportional to kf nCH3Cl kHes /kΓ × nHe (see Eq. (5.16)). This is reproduced in the
data presented in Fig. 5.12. By comparing this measurement, a similar measurement for
nitrogen buffer gas, and the results for CH3Cl, we derive ratios βCH3Cl/βHe = (6.4± 0.3)
and βCH3Cl/βN2 = (1.14± 0.04) at a temperature of 150 K. These two ratios reflect that
with an increasing density of internal states of the stabilizing agent, the transfer of in-
ternal excitation from the ion-dipole collision complex becomes more and more efficient.
Interestingly, the ratio of β for N2 and CH3Cl is surprisingly close to unity. This implies
that the stabilisation efficiency saturates with respect to increasing the density of internal
states. We therefore conclude that the rate coefficient for stabilisation of the excited ion
dipole complex with CH3Cl is very close to the collision limit and thus β ≈ 1. Support
for this conclusion stems from the fact that the formation of [Cl− · · · CH3Cl]∗ complexes
proceeds via translational to rotational (T→R) energy transfer [Hase, 1994] so that sta-
bilisation with a second CH3Cl molecule can occur via R→R and R→T transfer, both of
which are likely to be very efficient. Based on this description we assume β lies near unity
for CH3Cl also for temperatures higher than 150 K.
Using Eq. (5.17) and the association and stabilisation rate coefficients as described
above, lifetimes τ = k−1Γ of the ion-dipole complexes [Cl− · · · CH3Cl]∗ are derived from
the temperature-dependent three-body rate coefficient k3(T ). The results are shown in
Fig. 5.11b as a function of the association temperature. At the lowest studied temperature
of 150 K we determine a lifetime of (42 ± 1) ps. The lifetime then decreases with increasing
temperature reaching a value of (16 ± 1) ps at 220 K. This decrease in lifetime for higher
temperature is likely to be qualitatively explained by the increased phase space density
of the Cl− and CH3Cl fragments.
Our results are compared in Fig. 5.11b with the two previous measurements of the
103

Chapter 5. Inferring Reaction Dynamics from Kinetics
]3 [1/cmHen0 200 400 600 800 1000 1200 1400 1600 1800 2000
1210×
loss
rat
e [1
/s]
-C
l
0
0.5
1
1.5
2
2.5
3
Figure 5.12: Cl− loss rate from the trap due to production of [Cl− · · · CH3Cl] as a function of the density of
He buffer gas when CH3Cl is provided at constant density. In this case an additional linear contribution to collisional
stabilisation of the metastables is observed. A linear fit yields kfnCH3ClβkHes /kΓ, which enables comparison of
the stabilization efficiency β of different collision partners. We compare He, N2 and CH3Cl and derive ratios
βCH3Cl/βHe = (6.4 ± 0.3) and βCH3Cl/βN2 = (1.14± 0.04) at a temperature of 150 K.
lifetime of SN2 entrance channel complexes: high-pressure mass spectrometry yielded a
value for the [Cl− · · · CH3Cl]∗ complex at 296 K of about 16 ps [Li et al., 1996] and direct
time-resolved photoelectron spectroscopy was employed to measure a value of about 10 ps
for [I− · · · CH3I]∗ at roughly 20 meV excess energy [Wester et al., 2003]. The lifetimes
obtained in this work for the highest studied temperature of 220 K agree well with the
two previous measurements at or near 300 K. Also the averaged theoretical value of about
12 ps, calculated for the translational energy of 0.5 kcal/mol using classical trajectories
agrees with the measurements [van de Linde and Hase, 1990c]. This means that the strong
lifetime decrease from 150 to 220 K by about a factor of three does not seem to continue
in the temperature interval from 220 K to room temperature. More measurements and
high-level theoretical calculations for this temperature interval are highly desirable to
investigate the cause of this change in temperature dependence, which could be related
to a possible change in decay mechanism near 200 K.
The longer lifetime of the entrance channel complex at lower temperatures gives the
reaction system more time to explore the available phase space, randomize energy, and
finally cross the barrier towards reactants. An increase of the lifetime of the SN2 entrance
channel complex is suggested to be at work also in non-symmetric SN2 reactions and
cause the strong inverse temperature dependence observed in the rate to form reaction
products [LeGarrec et al., 1997]. In addition, at low temperature SN2 reaction dynamics
may even change from “non-statistical” to statistical due to the longer available time for
intramolecular energy redistribution.
104
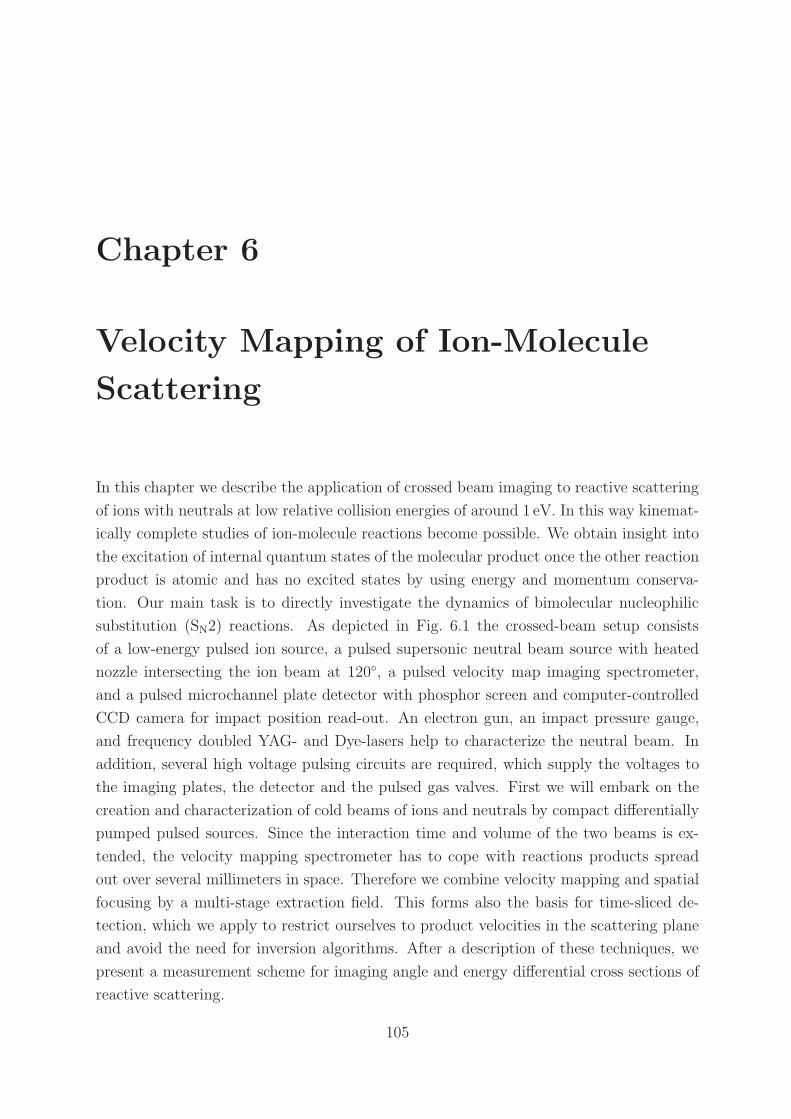
Chapter 6
Velocity Mapping of Ion-Molecule
Scattering
In this chapter we describe the application of crossed beam imaging to reactive scattering
of ions with neutrals at low relative collision energies of around 1 eV. In this way kinemat-
ically complete studies of ion-molecule reactions become possible. We obtain insight into
the excitation of internal quantum states of the molecular product once the other reaction
product is atomic and has no excited states by using energy and momentum conserva-
tion. Our main task is to directly investigate the dynamics of bimolecular nucleophilic
substitution (SN2) reactions. As depicted in Fig. 6.1 the crossed-beam setup consists
of a low-energy pulsed ion source, a pulsed supersonic neutral beam source with heated
nozzle intersecting the ion beam at 120, a pulsed velocity map imaging spectrometer,
and a pulsed microchannel plate detector with phosphor screen and computer-controlled
CCD camera for impact position read-out. An electron gun, an impact pressure gauge,
and frequency doubled YAG- and Dye-lasers help to characterize the neutral beam. In
addition, several high voltage pulsing circuits are required, which supply the voltages to
the imaging plates, the detector and the pulsed gas valves. First we will embark on the
creation and characterization of cold beams of ions and neutrals by compact differentially
pumped pulsed sources. Since the interaction time and volume of the two beams is ex-
tended, the velocity mapping spectrometer has to cope with reactions products spread
out over several millimeters in space. Therefore we combine velocity mapping and spatial
focusing by a multi-stage extraction field. This forms also the basis for time-sliced de-
tection, which we apply to restrict ourselves to product velocities in the scattering plane
and avoid the need for inversion algorithms. After a description of these techniques, we
present a measurement scheme for imaging angle and energy differential cross sections of
reactive scattering.
105

Chapter 6. Velocity Mapping of Ion-Molecule Scattering
Figure 6.1: Crossed-beam imaging setup for ion-molecule scattering experiments shown in the upper panel
with the low energy ion source in the bottom left, the neutral supersonic target beam in the bottom right, the
electron gun for reactant beam measurements in the top right and a pressure impact gauge in the top left for
neutral beam density measurements. The velocity map imaging spectrometer built around the interaction region of
the two beams intersecting at 120 consists of four pulsed-field electrodes and a grounded end-electrode as shown
in the center. The 70mm diameter microchannel plate detector with phosphor screen is located parallel to the
imaging plates 64 cm above the center of the interaction region. The lower panel displays a photograph of the open
scattering chamber from the opposite side with the imaging electrodes and the two differentially pumped integrated
source chambers.
106

Figure 6.2: Photograph of scattering chamber, drift section and imaging detector from the outside. The
scattering chamber is evacuated by a 2000 l/s turbomolecular pump attached from the bottom. The source chambers
are pumped from the backside by medium-size turbo pumps. The imaging detector is placed at the end of the drift
section 64 cm above the center of the interaction region. Together with the camera it is integrated into a light-proof
black aluminum cylinder to avoid illumination of the camera by background light. The beam from the 22 pole trap
intersects the setup at half angle between the ion and the neutral beam.
107

Chapter 6. Velocity Mapping of Ion-Molecule Scattering
6.1 Compact sources for cold ion and neutral beams
We infer reaction dynamics and the population of internal quantum states of the molecular
product from velocity and kinetic energy spectroscopy of the ion created in the reactive
collision. For this to become meaningful ion and neutral reactant beams with narrow and
well characterized velocity distribution are an indispensable prerequisite.
Low energy ions are produced by electron impact on a pulsed supersonic beam exiting
from a home-built piezo-electric valve [Gerlich et al., 2003] with a nozzle diameter of 0.2
mm. As seen from Fig. 6.3 a small custom made hot cathode electron source is mounted
next to the supersonic beam for this purpose. Due to the excessive heat generated by the
filament (Plano A054/A054C) it turned out to be necessary to contain it in a block of
copper to avoid damage of the piezo valve. The electron source is cooled by connecting
the copper block to a coldfinger reaching into the vacuum. Depending on the thickness of
the filament in use (0.125 mm or 0.2 mm) the coldfinger is either cooled by peltier elements
attached to a water cooled copper block or it extends into a liquid nitrogen filled dewar,
which is refilled by a automatic supply from a 100 l reservoir. This enables continuous
operation of the filament mounted only millimeters away from the nozzle at more than
15 Watt power consumption and a moderate increase of the valves temperature. The
front side of the piezo-electric valve1, including the nozzle, a cylindrical electrode facing
the valve 15 mm downstream and the electron gun’s anode (1.0 mm aperture) form the
“ion source terminal”. This terminal is held at a potential between ∓ 1 and ± 4 V relative
to the potential of the interaction region of typically ± 4 V utilizing two highly stable
power supplies2 (Keithley). Biasing the interaction region, which is done by applying
the same voltage to all the field electrodes of the imaging spectrometer and the endcaps of
the beam chambers, was found to significantly enhance ion flux and beam quality coming
from the source. The whole ion source is housed in a cylindrical vacuum chamber of 65 mm
outer diameter reaching into the scattering chamber where the imaging stack is placed (see
Fig. 6.1). The ion source is pumped from the backside by a 70 l/s turbomolecular pump
maintaining a mean pressure of around 1 ×10⁻⁴ mbar (Pfeiffer PKR 251 gauge) at a
pulse length of around 70µs and a repetition rate of 10 Hz. To ionize the expansion, the
filament is floating on a potential of typically -100 V with respect to the“terminal voltage”,
so that 100 eV electrons impinge on the jet in quasi field-free space. At these kinetic
energies argon, which is typically used as main constituent of the supersonic expansion,
exhibits the maximum cross section for electron impact ionization [Straub et al., 1995].
1Special care was required to mount the frontside of the valve in an electrically isolated way to thebody. This was difficult, since M2 screws reach through the body, which do not only fix the frontside, butalso serve for adjusting the valves leakrate. The screws were isolated from the body by ceramic washersand bushes made from heat shrink tube.
2The sign depends on whether cations or anions are under investigation.
108

6.1. Compact sources for cold ion and neutral beams
The electron acceleration voltage is pulsed for 5 - 20µs during the duration of the neutral
bunch, to avoid excess ionization of the beam and charge-up effects of any insulating
material. A multichannel plate detector mounted opposite the ion beam chamber makes
adjustment of the ion source more convenient. The described ion source represents a very
compact version of the ion source employed in the multipole setup described in Section
3.2.
The ion source is capable of delivering positively and negatively charged ions depending
on the extraction voltages applied. Negative ions are formed by dissociative attachment
of slow secondary electrons to a suitable precursor seeded into the supersonic expansion.
Ions float with the neutral beam downstream and may be cooled to some degree by
collisions with the neutrals from the jet. Once the ions of selected charge exit the ion
source terminal through a 2 mm diameter opening in the electrode facing the front side of
the valve, they are accelerated to ground potential in a homogeneous field (see Fig. 6.3).
They pass an electrostatic lens, which focuses them onto the interaction region with the
neutral beam. The ions leave the source chamber through a pinhole and are decelerated
in another homogeneous field between pinhole and the source endcap, which is floating
on the potential of the interaction region, before they drift towards the scattering region,
centered 93 mm from the nozzle. Depending on the relative terminal potential, this source
produces bunches of approximately 104 ions with kinetic energies between 0.2 and 5 eV.
The ions velocity distribution is measured by pulsing the high voltage of the imaging
electrodes once an ion packet is located in the center of the spectrometer. Since velocity
dispersion may lengthen the ion packet beyond the 15 mm diameter of the opening in the
extractor electrode, ions that arrive in the interaction volume of the spectrometer either
too early or too late are not projected onto the detector but instead hit the extractor
electrode (see Fig. 6.1). To account for this filtering effect, the full velocity distribution is
determined from a sequence of images that are measured by stepping the delay time of the
high voltage pulsing with respect to the timing of the ion source. For short (long) delay
times only the fast (slow) ions are detected. The full velocity distribution is obtained from
the envelope of the individual velocity distributions obtained for the sequence of images.
In addition, each individual velocity distribution stems from images integrated over 1000
experimental cycles (i.e. 100 s at our usual repetition rate of 10 Hz).
In the upper panel of Fig. 6.4 we show distributions of absolute velocities obtained in
this way for Ar+ cations and Cl− anions. Argon cations are created by electron impact
ionization of a supersonic expansion of argon gas. Chlorine anions are obtained from
a mixture of 2.5% CCl4 in argon provided from a mixing bottle installed in the supply
line. In both cases we use a backing pressure for the expansion of 2 bar (with respect to
vacuum). We find that the width of the velocity distributions is not dependent on the
acceleration potential, which determines the mean kinetic energy of the ions [Eichhorn,
109

Chapter 6. Velocity Mapping of Ion-Molecule Scattering
Figure 6.3: Cut-away view of the compact ion-source. Ions are produced by electron impact on a pulsed
supersonic expansion created by a home-built piezoelectric valve. The valves frontside, the electron source anode,
and a cylindrical plate mounted 15mm away from the nozzle form the ion source “terminal”, which defines the
kinetic energy of the beam. The ion beam is focused with the lens and leaves the source chamber through an
aperture. Since the electron source is mounted very close to the piezo valve it needs to be shielded by a cooled block
of copper to avoid damage by excessive heating. Cooling is provided by connection to a cold finger reaching into
the vacuum, which - depending on the thickness of the filament in use - is supplied by peltier elements attached to a
water cooled copper block or extends into a liquid nitrogen filled dewar. Electric potentials and gas is delivered from
feedthroughs at the radial CF 16 flanges incorporated in the CF 63 base. The source is backed by a turbomolecular
pump. About 104 ions are created per bunch, specifications of the cation and anion beams are described in Figure
6.4.
110

6.1. Compact sources for cold ion and neutral beams
Ar velocity [m/s]0 200 400 600 800 1000
inte
nsi
ty [
arb
. un
its]
0
10000
20000
30000
40000
50000
60000
70000
80000
CH3I velocity [m/s]0 200 400 600 800 1000
inte
nsi
ty [
arb
. un
its]
0
20
40
60
80
100
120
310×envelope 1D
Figure 6.4: Velocity distribution of Ar+ (left upper panel) and Cl− (right upper panel) reactant beams
produced in the ion source from electron impact ionization of an Ar expansion and dissociative attachment to CCl4
respectively. Velocities are derived from projection onto the imaging detector. A full width at half maximum of
about 120 m/s is obtained for argon cations compared to 160 m/s for chorine anions; both widths are independent of
the mean kinetic energy of the beam adjusted by the source terminal potential. The lower panel shows the velocity
distributions for beams from the neutral source chamber as detected by ionization in the interaction region of the
spectrometer with a 1 µs long pulse of electrons. For the Ar beam (left lower panel), produced from 2bar stagnation
pressure at 300 Kelvin, a translational temperature in the co-moving frame of the beam of about 10K is obtained.
For CH3I seeded at 10% in He a translational temperature of around 60 K is found for a stagnation pressure of
0.8 bar at 363 K nozzle temperature (right lower panel).
111

Chapter 6. Velocity Mapping of Ion-Molecule Scattering
2007]. For the measured Ar+ velocity distribution depicted in Fig. 6.4 a Gaussian fit yields
a full width at half maximum (FWHM) of 120 m/s, which corresponds to a FWHM in
kinetic energy of 120 meV. The velocity distribution obtained for Cl− anions has a wider
spread of 160 m/s (FWHM) corresponding to 180 meV in energy, which is expected since
they are created with additional kinetic energy that stems from the dissociation of the
precursor CCl4. In fact the moderate difference as compared to the case of Ar+ cations
points to a significant cooling of the anions by the supersonic expansion.
One should point out, that the described ion source is designed for the production
of atomic ions with no internal degrees of freedom. Since no mass selection is applied it
is also only suited if essentially one sort of positive and negative ions is created in the
electron beam excitation. Since the detection of product ions is mass selective, minor
contributions of other ions or different charge states are however not relevant if their
interaction with the neutral reactant does not lead to the same product ions. We used
the source so far for scattering experiments with Ar+ cations, Cl− anions and F− anions,
the latter being obtained from a mixture of 10% NF3 in Ar. In the future we want to
employ also internally cold molecular and cluster ions for reactive scattering, which are
provided from the 22 pole ion trap.
The target neutral molecules are provided by a pulsed supersonic beam, which origi-
nates from a second differentially pumped source chamber. As can be seen from Fig. 6.1
it is similar to the ion source and contains a home-made piezo-electric valve of the type
we use in all molecular beam applications. We were fighting with blocking of the valve
by condensation of admixtures, especially of CH3I. This problem was solved by heating
the nozzle to 363 K with a power resistance3. The beam is skimmed with a 0.30 mm
skimmer (Beam Dynamics) 13 mm downstream of the valve orifice and propagates into
the scattering chamber4. Alternatively the skimmer is replaced by an aperture to increase
the flux to the interaction region located 83 mm away from the nozzle. During operation
at a repetition rate of 10 Hz and a pulse length of around 70µs the attached 200 l/s tur-
bomolecular pump maintains a mean pressure of around 1 ×10⁻⁴ mbar (Pfeiffer PKR
251 gauge) in the neutral source chamber.
A home-built electron gun of the type also employed in the ion source of the 22 pole
3For our valves this requires adjustment under these temperatures prior to implementation, sincethermal expansion of the rubber seals changes the leakrate of the valve significantly. The temperatureis limited by depolarization of the piezo actuator introduced at higher temperatures. Already at theemployed temperature of 363K it is vital to reduce the bias voltage closing the valve from -200V toabout -130V.
4Good alignment of the skimmer to the axis of the molecular beam is essential, since we have nopossibility to adjust the position of the skimmer from outside the vacuum. We use a stereomicroscopeequipped with a camera for this purpose, and move the skimmer orifice to the same point on the screenwhere the nozzle is placed when in focus.
112

6.1. Compact sources for cold ion and neutral beams
Figure 6.5: Density of the pulsed neutral beam in the interaction region as a function of the delay between the
probing frequency doubled YAG-laser pulse and the application of a 100 µs long voltage pulse to the piezo actuator
(left panel). The main pulse is followed by a series of damped post-pulses at around 2.9 kHz repetition rate. The
right panel shows the profile of a skimmed beam of CH3I seeded in Ar as probed by translating the lens focusing
the laser beam. A 0.3mm skimmer results in a FWHM beam diameter of 2.2mm in the interaction region. The
tiny distortions in the slope of the distribution are real and might be induced by the truncation of the molecular
beam at the skimmer.
setup (see Section 3.2) is attached to the scattering chamber for characterization of the
pulsed neutral jets velocity, length and arrival time by electron impact ionization. Its
beam can be sweeped in horizontal and vertical direction to unravel the quality of velocity
mapping as described in the next section. We also employ diagnostics by photodissocia-
tion (see Section 7.2) and photofragmentation of CH3I seeded in a rare-gas beam using
frequency doubled Dye and YAG lasers (Radiant Dyes Narrowscan, Innolas Spitlight
600). The left panel of Fig. 6.5 shows the ion yield obtained from photofragmentation of
methyliodine when the timing of a 5 ns long YAG laser pulse at 532 nm is varied with re-
spect to the voltage pulse applied to the piezo valve. As seen from the image the first pulse
reaching the interaction region with a delay of about 200µs is followed by a sequence of de-
creasing post-pulses spaced at about 350µs. Obviously the piezo is undergoing a damped
oscillation of about 2.9 kHz after excitation with the high voltage pulse. These post-pulses
have to be taken into account when determining the density of the neutral beam. For a
boxlike electric pulse of 100µs applied to the piezo element as used for this measurement,
we find that the gas pulse in the interaction region is about 110µs long. Since the beam is
broadened by velocity spreading when traveling from the nozzle to the interaction region
this finding is in good agreement with an initial gas pulse duration equal to the electric
pulse. Usually we apply shorter electric pulses of 60 - 70µs, where we find an initial burst
of the neutral flux of about 30µs length followed by a tail of lower density. This shows,
that accurate characterization of the neutral beam by ionization is important to get the
113

Chapter 6. Velocity Mapping of Ion-Molecule Scattering
Figure 6.6: Cut-away view of the impact pressure gauge for determination of the neutral beam density. The
directed flow of particles from the neutral beam enters a small chamber with attached pressure gauge through
a 30mm long bore. The particles are dispersed and diffuse out of the bore of well-defined conductance. From
the average pressure increase upon impact of the beam, its time-structure and the geometries the density in the
interaction region can be calculated.
maximum possible event rate of reactive scattering. By focusing the YAG laser into the
interaction with a lens mounted on a translation stage the spatial profile of the beam can
be obtained. The right panel of Fig. 6.5 shows a measurement of the beam diameter in
vertical direction performed when the 0.3 mm skimmer was used. We obtain a full width
at half maximum of 2.2 mm in reasonable agreement with the geometrical expectation of
1.9 mm. When replacing the skimmer with an aperture of 4 mm, we obtain a large beam
diameter of (8 ± 1)mm.
The density in the interaction region is measured to about ntarget = 1012 cm−3 for a
pure expansion of N2 at 2 bar stagnation pressure using a custom built impact pressure
gauge opposite to the pulsed valve [Feuerstein, 2004]. As seen from figure 6.6 the neutral
beam is skimmed and enters a small chamber through a bore with expanding diameter,
which avoids scattering of the beam at the walls. The neutrals are dispersed and diffuse
out of the chamber through the 30 mm long bore of well defined conductance [Wutz et al.,
2000]. The chamber is equipped with an ion gauge, which records the pressure increase
upon impact of the neutral beam. Hence the particle flux out of the chamber can be
determined from the pressure gradient and the conductance of the bore. For a stationary
state as reached in pulsed operation at fixed repetition rate the outgoing flux equals the
incoming flux. From a measurement of the pulse length of the neutral beam, the diameter
of the sampling orifice of the impact pressure gauge and the geometrical distance to the
114

6.1. Compact sources for cold ion and neutral beams
interaction region and nozzle the flux per area in the interaction region can be derived5. A
measurement of the speed of the neutral beam yields the beam’s density in the interaction
region (see also [Fruhling, 2005]).
An important advantage of the neutral beam source is that the supersonic expansion
introduces significant translational and rovibrational cooling. The left histogram in the
lower panel of Fig. 6.4 shows the distribution of absolute velocities obtained for a super-
sonic Ar expansion at 2 bar stagnation pressure. Using electron impact ionization with
a 1µs long pulse of 1 keV electrons Ar+ ions are created in the center of the interaction
region of the velocity map imaging spectrometer. These ions are then projected onto the
position sensitive detector by switching the imaging voltages directly after the electron
bunch. Their impact position is transformed into the ion velocity magnitude via the time-
of-flight and the velocity origin. The result is a narrow velocity distribution of Ar that
peaks near 570 m/s with an width of about 45 m/s. The histogram on the right hand side
of the lower panel of Fig. 6.4 shows velocity distribution for CH3I seeded at 10% in He at a
stagnation pressure of 0.8 bar. As explained in Section 7.2 these low backing pressures are
required to avoid clustering of the CH3I in the expansion. For the measurement we tune
the time-of-flight gate to CHnI+ since almost all constituents of CH3I are observed upon
electron impact. We find a mean absolute velocity of 880 m/s and a root mean square
(RMS) width of about 60 m/s. The theoretical terminal velocity of a supersonic beam of
constituents with f degrees of freedom is given by [Scoles, 1988]
√(f + 2)
kBT
m, (6.1)
which yields 560 m/s for argon (f = 3), in good agreement with the measurement. For
the seeded beam of CH3I in He, starting from a temperature of T0 = 363 K, we expect
1025 m/s using a particle number averaged value of f and m. The slightly lower mean
velocity of CH3I found experimentally might indicate that the CH3I is not completely
thermalized with the He due to the high seeding fraction and the large mass difference.
Also the low stagnation pressure of 0.8 bar is certainly not an ideal prerequisite for a high
cooling efficiency. The RMS width σv of the velocity distribution represents a measure
of the translational temperature in the co-moving frame of the beam, σv =√
kBT/m.
Here a value of about 10 K is obtained for the measured velocity distribution of argon,
which shows efficient cooling of the atoms due to the expansion. For CH3I a translational
temperature of about 60 K is found in accordance with a less efficient cooling in the
expansion. Note that these values represents an upper limit, because the measured velocity
distribution could include an additional broadening due to a finite imaging resolution.
5We have simplified our life by placing the sampling orifice of the pressure impact gauge at twice thedistance from the nozzle as the interaction region.
115

Chapter 6. Velocity Mapping of Ion-Molecule Scattering
The concentration of CH3I seeded in Ar is determined by the mixing ratio in the gas
reservoir. It can however also be checked in the beam in situ by comparing the ion yield of
Ar+ and CHnI+ ions obtained from electron impact ionization at a fixed electron energy.
The ion yields, weighted with the measured cross sections for electron impact ionization
at this energy [Straub et al., 1995; Rejoub et al., 2002], display the relative abundance of
CH3I and Ar in the interaction region.
The arrangement with the two differentially pumped chambers for creation of the
neutral and ion beam in combination with a 2000 l/s turbomolecular pump attached to
scattering chamber enables a vacuum during operation of both beams at 10 Hz repetition
rate in the 10−7 mbar range (Pfeiffer IKR 270 gauge) ensuring that background gas
collisions are negligible.
6.2 Pulsed field, time-sliced velocity mapping and
spatial focusing
For the measurement of velocities of reactants and reaction products we are using the
technique of velocity map imaging [Eppink and Parker, 1997]. Velocity mapping projects
spatially separated ions with the same initial velocity vector in the xy-plane parallel to
a position sensitive detector on the same point of the detectors surface. This analogon
to an optical lens is usually achieved by employing a two-stage electric acceleration field.
Figure 6.7 shows the trajectories of two pairs of ions starting at 10 mm spatial separation
with velocities of 1000 m/s directed in opposite directions. As can be seen the impact
positions on the detector are very close to each other for the initially separated ions with
same starting velocity. This is crucial for our application since the interaction volume is
extended over several millimeters due to the large diameter of the neutral beam and the
length of the ion package. It also accounts for the fact that the product ions travel between
the time of their origin and the pulsing of the extraction field. In the classical version of
velocity map imaging no information on the initial ion velocity in z-direction is obtained
from the measurement. It is thus only applicable to processes, which feature a spherical
or cylindrical symmetry around an axis in the xy-plane. A cylindrical symmetry exists for
reactive scattering of non-aligned reactants. The symmetry axis is given by the relative
velocity vector of the two reaction partners. From the measured distribution of projected
product ion velocities P (vx, vy) the differential cross section d2σ/dθ/dv as a function of
the scattering angle θ and the product ion velocity v can then be extracted by an inverse
Abel transformation [Whitacker, 2003]. In our first studies of reactive scattering we used
two dimensional imaging and an inversion algorithm to study a cationic charge transfer
reaction (see Section 7.1).
The ions initial velocity in z-direction is however mapped on the ions time-of-flight
116

6.2. Pulsed field, time-sliced velocity mapping and spatial focusing
Figure 6.7: Velocity mapping of ions starting with 10mm spatial separation and a velocity of 1000 m/s in the
plane parallel to the detector surface. The electrostatic imaging lens projects them onto the detector such that the
position of ion impact reflects their velocity independent of the starting position.
to the detector. This can be used to obtain the full velocity vector in three-dimensional
imaging, where also the impact time of the ion on the detector is recorded with high
accuracy. For investigations of processes incorporating cylindrical symmetry, another
(cheaper) scheme has been introduced in recent years [Gebhardt et al., 2001; Townsend
et al., 2003; Lin et al., 2003a]. In slice imaging the detector is activated only during a
short time window, placed such that only ions with no velocity component in z-direction
are recorded. The velocity vectors of all imaged ions then lies within a plane parallel
to the detector surface. Due to the cylindrical symmetry of the cross section this allows
one to directly obtain the velocity magnitude- and angle-differential cross section without
resorting to Abel-inversion-type algorithms. Slicing is straightforward if the ions have no
initial spatial spread in z-direction. In all the previous demonstrations of slice imaging
this is ensured by creating the ions in the narrow focus of a laser beam.
To apply time-slicing in ion-molecule reactive scattering, we combine velocity mapping
and spatial focusing to account for an extended volume in all three dimensions. Spatial
focusing was developed to improve the resolution of time-of-flight mass spectrometers
[Wiley and McLaren, 1955]. An initially extended cloud of ions with no kinetic energy is
compressed by stronger acceleration of the ions, which have a longer flight distance to the
detector. For this purpose we provide a multi-stage extraction field created by a stack
of five field electrodes (the geometry is sketched in Fig. 6.8). The interaction region of
117

Chapter 6. Velocity Mapping of Ion-Molecule Scattering
the crossed ion and neutral beam is placed between the two lowermost plates (see Fig.
6.1). The imaging potentials applied to the electrodes are derived from a SIMION 7.0
simulation [SIMION, 2007]. The optimization algorithm is indicated in Fig. 6.8. A fixed
voltage of 3500 V is chosen for the lowermost (closed) electrode of the stack. This voltage
mainly determines the flight time to the detector by setting the kinetic energy the ions
reach in the drift section. It hence accounts for the magnification M and the maximal
velocity that can be imaged. The uppermost electrode of the stack remains grounded to
guarantee a defined terminal kinetic energy. In the first step the voltage applied to the
extractor plate VMI 2 is optimized such that a one-dimensional 10 mm long chain of ions
placed at rest between the two lowermost electrodes is arriving at minimal time spread at
the detector, positioned in our case 64 cm away from the interaction region (see the left
panel of Fig. 6.8). In the second step we use electrodes VMI 3 and VMI 4 to implement
velocity mapping. For this purpose we place four points of ion departure forming a cross
of 10 × 10 mm in the center between VMI 1 and VMI 2. The voltages of VMI 3 and
VMI 4 are adjusted such, that ions with a fixed starting velocity in ± x and ± y direction
departing from different spots arrive at minimal spatial separation on the detector. This
is illustrated in the right panel of Fig. 6.8, which gives a view on the detector and the
trajectories from the top. Here it is necessary to optimize also the voltages applied to the
source chambers endcap to minimize blurring. Now we return to the first optimization
step and iterate the procedure until convergence is reached. The voltages obtained and
used in the experiment are denoted in Table 6.9. All simulations are carried out with
fixed voltages applied to the electrodes neglecting possible influence of the switching.
The optimization is tested numerically with SIMION 7.0 by implementing a homoge-
neous ion cloud of (3 mm)3 with isotropic velocity distribution. For fixed total velocity of
1000 m/s, i.e. a sphere in velocity space, the result is demonstrated in Fig. 6.10. The left
panels show the velocity components vz and ±√v2
x + v2y (+ for vx > 0 and − for vx < 0)
at zero flight time, the right panel shows the same components at arrival on the detector.
As can be seen vz is mapped on the time-of-flight. When restricting ion detection to a
window of 15 ns around the time corresponding to vz = 0, a slice through the sphere is
obtained. The detector image will thus display a circle of√
v2x + v2
y = 1000 m/s. From
this simulation we expect a reduction of the initial spatial spread of an ion cloud due to
velocity mapping of about a factor of 15 as might be inferred from the right panel of Fig.
6.8.
To avoid any electric field to perturb the interaction of the ion and neutral beam it is
crucial to carefully pulse the high voltages to the imaging electrodes. This requires not
only fast rise-times of the voltage pulses of up to 3.5 kV, but also a perfect synchronization
of the four switched field electrodes and the two endcaps shielding the ground potential
of the source chambers. We do this with the help of optimized fast commercial switches
118
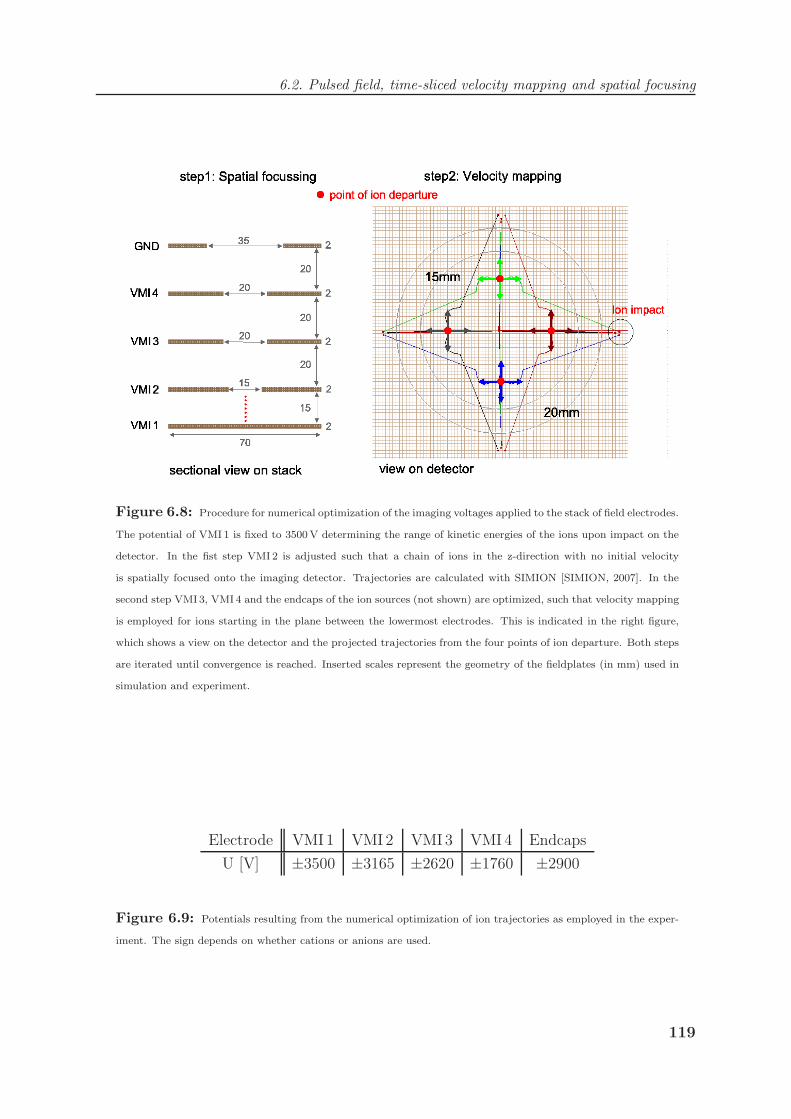
6.2. Pulsed field, time-sliced velocity mapping and spatial focusing
Figure 6.8: Procedure for numerical optimization of the imaging voltages applied to the stack of field electrodes.
The potential of VMI 1 is fixed to 3500 V determining the range of kinetic energies of the ions upon impact on the
detector. In the fist step VMI 2 is adjusted such that a chain of ions in the z-direction with no initial velocity
is spatially focused onto the imaging detector. Trajectories are calculated with SIMION [SIMION, 2007]. In the
second step VMI3, VMI 4 and the endcaps of the ion sources (not shown) are optimized, such that velocity mapping
is employed for ions starting in the plane between the lowermost electrodes. This is indicated in the right figure,
which shows a view on the detector and the projected trajectories from the four points of ion departure. Both steps
are iterated until convergence is reached. Inserted scales represent the geometry of the fieldplates (in mm) used in
simulation and experiment.
Electrode VMI 1 VMI 2 VMI 3 VMI 4 Endcaps
U [V] ±3500 ±3165 ±2620 ±1760 ±2900
Figure 6.9: Potentials resulting from the numerical optimization of ion trajectories as employed in the exper-
iment. The sign depends on whether cations or anions are used.
119

Chapter 6. Velocity Mapping of Ion-Molecule Scattering
Figure 6.10: Starting velocity components in z-direction and in the xy-plane for a homogeneous ion cloud
of (3mm)3 with isotropic velocity distribution and a fixed total velocity of 1000 m/s. The two left panels show
the distribution at the start of the trajectory. The right graphs, obtained after ion propagation to the detector,
demonstrate that the ions are separated in the flight-time according to their initial vz velocity. Hence within a
narrow time slice only ions with no velocity component out of the xy-, i.e.scattering-plane, are detected. Application
of such a gate avoids the necessity for an inverse Abel-type transformation.
(Behlke HTS 31(61)-03-GSM), which we synchronize with cable delays. Figure 6.11
shows the voltage traces applied to the different electrodes (in this case all set to the same
terminal voltages). Since we find the jitter to be small on the scale of the rise time this
demonstrates that switching times below 50ns and a synchronization on the level of 1 ns
is reached.
Ions accelerated in the stack of pulsed field electrodes impinge on the the 70 mm
diameter microchannel plate with P-20 phosphor screen (Burle APD 3075FM 32/25/8 I
P20) with a kinetic energy of about 3300 eV. There they induce an avalanche of about 106
electrons which subsequently produce a light spot on the phosphor screen. Light spots are
detected by a 1280x960 pixels CCD camera (Basler A 102f) equipped with a 17.52 mm
focal length objective (Schneider Kreuznach Xenoplan 1.4/17-0513) that runs with
a frame rate of 10 Hz, synchronized with the pulse cycle of the experiment. Each frame
is read-out through the cameras firewire interface and analyzed on the fly by a personal
computer. For each light spot that is found in a camera frame the intensity-weighted x
and y position, RMS widths, intensity and number of illuminated pixels are calculated
using a 1st and 2nd moment analysis and are stored in memory (see also [Fruhling, 2005]).
This is a variant of centroiding that has proven to yield a high resolution at a low data
rate [Kella et al., 1993; Wester et al., 1998]. To select the mass of the detected ions,
120
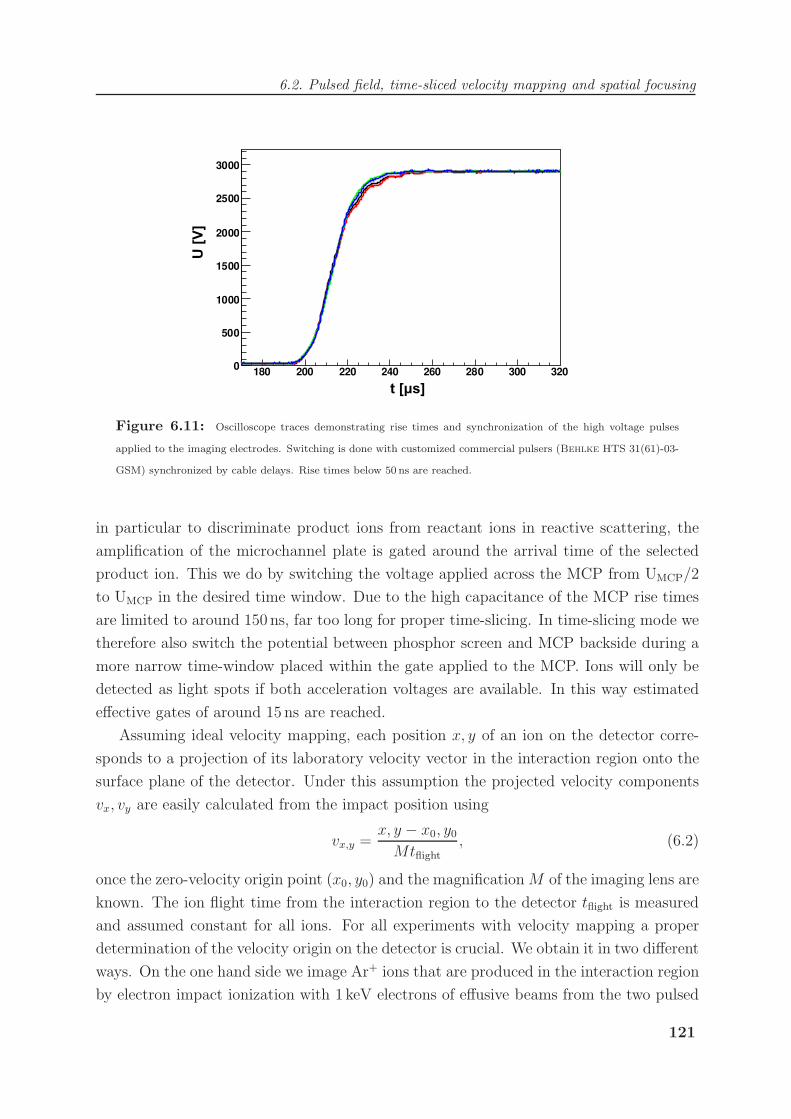
6.2. Pulsed field, time-sliced velocity mapping and spatial focusing
Figure 6.11: Oscilloscope traces demonstrating rise times and synchronization of the high voltage pulses
applied to the imaging electrodes. Switching is done with customized commercial pulsers (Behlke HTS 31(61)-03-
GSM) synchronized by cable delays. Rise times below 50 ns are reached.
in particular to discriminate product ions from reactant ions in reactive scattering, the
amplification of the microchannel plate is gated around the arrival time of the selected
product ion. This we do by switching the voltage applied across the MCP from UMCP/2
to UMCP in the desired time window. Due to the high capacitance of the MCP rise times
are limited to around 150 ns, far too long for proper time-slicing. In time-slicing mode we
therefore also switch the potential between phosphor screen and MCP backside during a
more narrow time-window placed within the gate applied to the MCP. Ions will only be
detected as light spots if both acceleration voltages are available. In this way estimated
effective gates of around 15 ns are reached.
Assuming ideal velocity mapping, each position x, y of an ion on the detector corre-
sponds to a projection of its laboratory velocity vector in the interaction region onto the
surface plane of the detector. Under this assumption the projected velocity components
vx, vy are easily calculated from the impact position using
vx,y =x, y − x0, y0
Mtflight, (6.2)
once the zero-velocity origin point (x0, y0) and the magnification M of the imaging lens are
known. The ion flight time from the interaction region to the detector tflight is measured
and assumed constant for all ions. For all experiments with velocity mapping a proper
determination of the velocity origin on the detector is crucial. We obtain it in two different
ways. On the one hand side we image Ar+ ions that are produced in the interaction region
by electron impact ionization with 1 keV electrons of effusive beams from the two pulsed
121

Chapter 6. Velocity Mapping of Ion-Molecule Scattering
valves and measure the intersection of the two beam directions [Elioff et al., 2004]. More
convenient is to perform a measurement of the origin by ionizing a thermalized rare gas,
which is introduced into the chamber by a leak valve. A fit of the Gaussian distribution
on the detector yields the velocity zero. The magnification M is obtained from SIMION
7.0 [SIMION, 2007] simulations of ion trajectories through the imaging spectrometer to
amount to M = 1.03 independent of the ion mass.
We test the quality of velocity mapping experimentally by producing ions in different
spatial volumes. For this purpose we sweep the focused electron beam horizontally or
vertically over a bunch of argon atoms from the supersonic expansion, which is longer
than the 15 mm diameter of the extractor fieldplate. The electron beam is sweeped by
applying a ramp to the guns horizontal or vertical deflector at a repetition rate of 0.1 Hz.
At the same time we integrate the images over 100 s at a repetition rate of the pulsed
experiment of 10 Hz. In this way we obtain a spot on the detector, which stems from
velocity mapping of ions with a horizontal spread of 15 mm or with a vertical spread
given by the beam diameter. The distribution of ion impact positions on the detector is
compared in Fig. 6.12 to the situation of a fixed electron beam focused into the center
of the interaction region. These histograms show the spatial separation between ion
impact on the detector and the velocity origin. As can be seen the distribution is only
about 10% broader for the wide spread in horizontal direction as compared to the tight
initial cloud. Assuming that the velocity distribution is the same along the neutral bunch
results in a FWHM spread due to imperfect velocity mapping of the 15 mm ion cloud of
s =√
1.42 − 1.32 mm = 0.5 mm. This indicates a compression of about a factor of 15 in
agreement with the simulations. For the wide spatial spread in vertical direction we do
not find a significant broadening of the distribution on the detector. This indicates proper
spatial focusing. In all cases the field electrodes were switched 0.3µs after the end of the
pulsed electron beam of 1µs length. Our findings hence also demonstrate that there is
no severe additional blurring due to the pulsed mode of velocity map imaging. It should
be noted that two effects play also a role in this kind of analysis. On the one hand the
ion cloud will show a spread along the axis of the electron beam. At a density of argon
of 1012 cm−3 and a cross section for electron impact ionization at 1 keV of σ = 0.8 ×10⁻¹⁶ cm2 [Straub et al., 1995] the mean free path is λ = 1/(σ n) ≈ 104 cm. Hence ions
are scattered along the electron beam over the full diameter of the neutral beam. This
suggests to carry out the same measurement for a narrowly skimmed neutral beam. On
the other side this test relies on the assumption, that the velocity distribution is the same
over the full imaged length of the neutral bunch. A dispersion will result in a blurring
of the image in the horizontal electron sweep which is not due to imperfections in the
velocity mapping.
Slicing is demonstrated experimentally by photodissociation of methyliodine with a
122

6.3. Imaging angle-differential cross sections of reactive scattering
Figure 6.12: Experimental test of the quality of velocity mapping obtained by sweeping the electron gun
through a neutral argon beam. The velocity distributions are derived from integrated detector images of the
created Ar+ ions. For horizontal sweeping over the full 15 mm source volume of the spectrometer a broadening of
about 10% as compared to distribution obtained for a fixed electron beam focused into the interaction region is
observed. This indicates a spatial compression in velocity mapping of about a factor of 15 in agreement with the
simulations. Proper spatial focusing is demonstrated by sweeping the electron beam vertically, where no significant
change in the width is observed.
focused, frequency doubled Dye laser at 304 nm. Absorption of a photon separates CH3I
in CH3 and I in a parallel transition accompanied by prompt dissociation (prompt on
the timescale of molecule rotation) [Eppink and Parker, 1998; Eppink and Parker, 1999].
Hence the distribution of fragments is described according to I(θ) ∝ cos2(θ). With the
same laser photons 2 +1 REMPI of I is driven to produce iodine cations I+. These are
imaged in the velocity map imaging spectrometer operated at constant field. Fig. 6.13
shows the symmetrized detector images obtained for moving the time-slice through the
ion cloud [Eichhorn, 2007]. The delay between the upper left and the lower right image is
220 ns. The unusually broad distribution of the I+ ions is most probably due to the finite
internal temperature of CH3I and not determined by the quality of velocity mapping or
the length of the time slices.
6.3 Imaging angle-differential cross sections of reac-
tive scattering
To observe reactive scattering the pulsed ion and neutral beam bunches have to be syn-
chronized such that they cross in the interaction region. Synchronization is straightfor-
ward since we can image both the ion and the neutral beam as described above. All
the individual components of the experiment are adjusted by deriving all pulsing signals
from two eight-channel high-precision pulse generators (Berkeley Nucleonics Model
555). Reaction products are then observed by tuning the gates of the imaging detector
to the mass of the product ion. Given a typical ion-molecule collision rate coefficient of
123
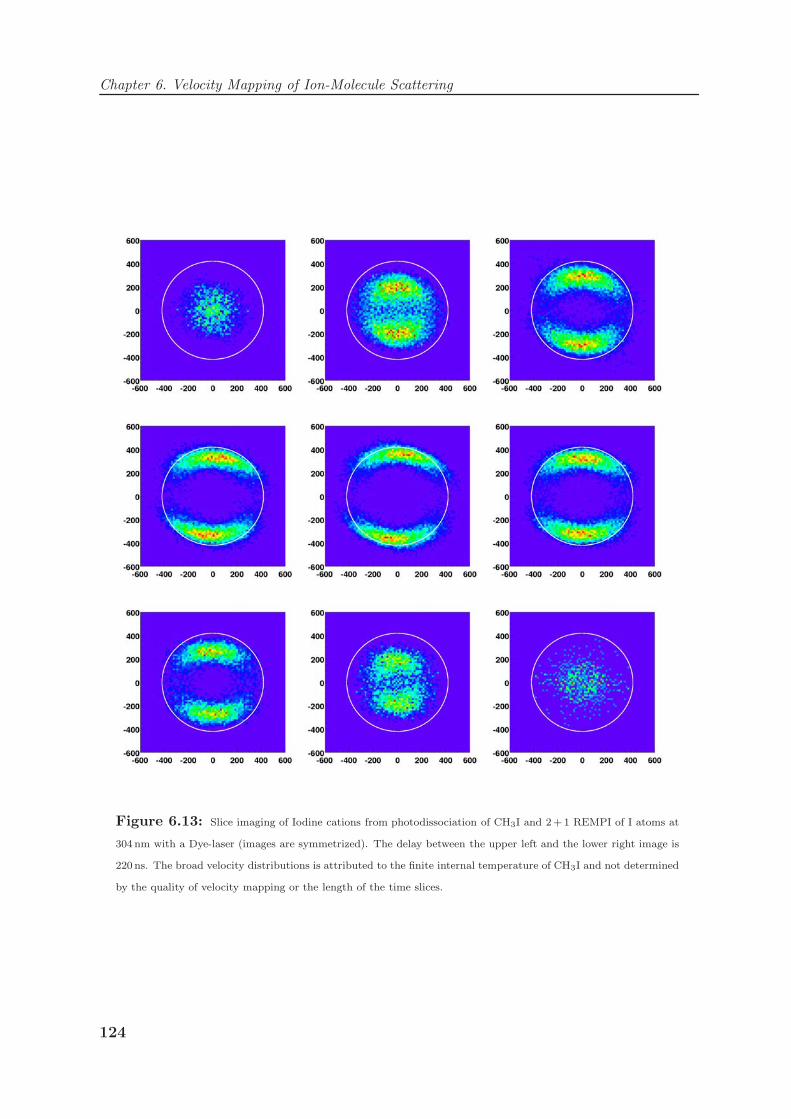
Chapter 6. Velocity Mapping of Ion-Molecule Scattering
Figure 6.13: Slice imaging of Iodine cations from photodissociation of CH3I and 2+1 REMPI of I atoms at
304 nm with a Dye-laser (images are symmetrized). The delay between the upper left and the lower right image is
220 ns. The broad velocity distributions is attributed to the finite internal temperature of CH3I and not determined
by the quality of velocity mapping or the length of the time slices.
124

6.3. Imaging angle-differential cross sections of reactive scattering
k = 10−9cm3/s, a typical relative velocity of vion=3000 m/s, a density of the reactant in
the molecular beam of 1012 cm−3 and a beam diameter of dtarget = 1.9 mm a scattering
probability per ion of pscatt = kntargetdtarget/vion = 7 · 10−4 is obtained. Even for small
ion yields this will result in an event rate of the order of Hz, given that the imaging
spectrometer has a 4π solid angle of acceptance.
To guarantee good data quality we have established a fixed measurement procedure,
which we follow for each collision energy. We set a kinetic energy of the ion beam by
adjusting the potentials applied to the ion source terminal and the interaction region. We
image the ion bunch on the phosphor screen at continuous amplification of the detector
and optimize the lens in the source chamber for minimal divergence. Then we measure
the envelope of the velocity distribution in forward and transversal direction by varying
the switching time of the imaging field plates relative to the ion source. For each delay we
aquire data over 1000 cycles of the experiment. We select an optimal timing based on the
counter-acting requirements that the pulsed reactant beams have had considerable time
to cross each other and that any product ions have not yet left the source volume of the
spectrometer. The neutral jet, which velocity and arrival timing distribution is determined
after each refill of the mixing bottle, is synchronized to the ion bunch. Then we tune the
detector gates to the product ion and increase the amplification of the MCP to single ion
detection. Product ions should now be visible. Finally we adjust the narrow slicing gate to
the window of maximum product ion countrate, which corresponds to vanishing velocity
out of the scattering plane. For smooth product ion distributions we usually aquire a
few hundred thousand events. This takes typically between 4 and 12 hours in which the
experiment is fully automatic and running at a repetition rate of 10 Hz. We then stop
the data acquisition and measure the velocity distribution of the ion beam as before the
scattering measurement without touching any settings of the ion source. This is very
important for judging the quality of the acquired scattering data. When the cryogenically
cooled ion source is fully thermalized we have very stable operating conditions over weeks
observing shifts of the mean ion velocity before and after the scattering measurement
which are small on the scale of the width of the distribution. Having attained a good
dataset we move on to the next scattering energy.
A typical data set obtained for crossed beam ion slice imaging of the SN2 reaction
Cl− + CH3I → CH3Cl + I− is shown in Fig. 6.14. The upper left panel shows the
velocity image for electron impact ionization of the neutral CH3I bunch when tuning the
imaging detector to record CHnI+6. The upper right panel shows the envelope distribution
of Cl− anions from the ion source (in this case a significant spread in the transversal
velocity distribution is observed). The lower left panel shows the raw I− product ion
image acquired when synchronizing both bunches and tuning the detector to slice imaging.
6The mass resolution of the detection system does not allow to distinguish between n=1,2,3.
125

Chapter 6. Velocity Mapping of Ion-Molecule Scattering
Figure 6.14: Velocity images of the reactants and products of reactive scattering Cl− + CH3I→ CH3Cl + I−
at 1.95 eV relative collision energy. The Cl− ion beam is characterized before and after each scattering measurement.
At synchronization of the two reactant beams I− product ions are obtained in the corresponding time-window at a
rate of up to several hundred Hz, such that slice imaging becomes feasible. As shown in the lower panels the images
can then be directly compared to the corresponding Newton diagram.
Figure 6.15: Loss correction applied to account for the filtering of fast product ions, which leave the source
volume of the velocity mapping spectrometer with higher probability. The weighting is a function of the lab velocity
and shown in Fig. 6.16.
126

6.3. Imaging angle-differential cross sections of reactive scattering
[m/s]labv0 500 1000 1500 2000 2500
Lo
ss F
ract
ion
0
0.2
0.4
0.6
0.8
1
Figure 6.16: Loss fraction derived from the requirement of symmetry around the relative velocity axis for two
high scattering energies in Cl− + CH3I. The black fit function is P(vlab) = 1 + a2v2lab + a3v3
lab with the parameters
a2 = -3.4 10−7 s2/m2 and a3 = 7.9 10−11 s3/m3 and has been used for correcting all product images for I− ions
(Chapter 7.2).
Since we slice out events with product ion velocities in the scattering plane, a Newton
diagram can directly be drawn into the velocity image, which we show in the lower right
panel. The experiment is kinematically complete since the velocity of the neutral reaction
product can be obtained from momentum conservation. The velocity of the ion and
neutral reactants define the relative velocity Vrel in the center-of-mass frame and thus the
available relative kinetic energy T = 12µV 2
rel for each collision event prior to the reaction;
µ is the reduced mass in the colliding reactant system. Energy conservation takes the
form Etot = T + U = T ′ + U ′, where T and U (T ′ and U ′) denote the total kinetic
and internal energy before (after) the reaction. Hence ∆U = U ′ − U > 0 is equal to the
difference of kinetic energies ∆T = T−T ′ > 0. Measuring the translational energies of the
reactants and products is therefore a way to measure internal excitation energies. Since
the rovibrational excitation of the molecular reactant is expected to be small due to the
supersonic expansion the translational energy difference ∆T reveals the internal excitation
of the molecular product. This will be further elucidated in the following chapters. The
sharp edge observed in the product ion distribution for forward scattering corresponds to
the kinematical cutoff, i.e. scattering events where all available energy is distributed to
product translation.
Cylindrical symmetry around the relative velocity axis requires that the images show
an up-down symmetry with respect to Vrel. We observe this for product velocity distri-
butions with small lab velocity. For higher velocities such as the distribution shown in
127
Chapter 6. Velocity Mapping of Ion-Molecule Scattering
Fig. 6.14 a slight asymmetry is introduced. The degree of asymmetry increases with the
product velocity, indicating that we loose a fraction of the fast product ions from the
source volume of the imaging spectrometer before the extraction field is pulsed. We need
to correct for this velocity filtering effect when using the extended neutral beam created
by replacing the skimmer with the aperture. To first approximation the loss fraction is a
function of the velocity in the laboratory frame only. We obtain a one dimensional correc-
tion function P(vlab) for a specific mass from two product ion images at higher scattering
energy. Ratios of losses at different velocities are obtained by comparing the content of
bins in the two dimensional histogram, which are symmetrically positioned with respect
to the relative velocity. An absolute scaling is achieved by the requirement of vanishing
loss fraction for low velocities. Fig. 6.16 shows the result of this analysis, which so far
is done by hand, for the reaction Cl− + CH3I. We fit the data points obtained from the
requirement of symmetry with a polynomial function of third order, given by the solid
line. We apply the same function to all scattering images regardless of the scattering
energy. For the data shown in Fig. 6.14 the correction is demonstrated in Figure 6.15. As
expected, a symmetric distribution is obtained.
We usually show product ion distributions rotated into the center of mass frame such
that the relative velocity vector is aligned along the x-axis of the two-dimensional velocity
histogram. The rotated and loss corrected slice-images show the differential cross sectiond3σ
dvxdvydvz. This representation is most instructive since an isotropic and homogeneous
distribution of scattering products shows up as uniform disposal in these histograms. To
obtain the angle- and velocity differential cross section weighting with the velocity v2 in
the center of mass is required
dσ
dvdΩ= v2 d3σ
dvxdvydvz, (6.3)
as derived from a transformation of coordinates.
128

Chapter 7
Imaging Reaction Dynamics
7.1 Investigating the Ar+ + N2 charge transfer reac-
tion
Using crossed-beam ion imaging we have studied charge transfer, one of the most funda-
mental ion-molecule collision processes. The collision system
Ar+(2P3/2) + N2(v = 0) −→ Ar + N+2 (v′) (7.1)
was chosen, because it represents a very well studied ion-molecule reaction (see Ref.
[Futrell, 1992] and references therein) and therefore allows for detailed comparison of
our results with previous data. This measurement was intended as benchmark and done
when both the multi-stage extraction field and slice imaging were not yet implemented.
The scattering images contain therefore all product ions regardless of their velocity and
are subject to significant blurring due to deficient velocity mapping. This makes data
analysis more elaborate. Despite these difficulties some interesting insights into the reac-
tion were obtained. Especially the observation of N+2 product ions with unexpectedly high
vibrational excitation may be caused by a Feshbach scattering resonance and proposes
further theoretical and experimental work on this reaction.
7.1.1 Non-adiabatic coupling in Ar+ + N2
One of the most notable effects in this reaction is the predominant formation of N+2
products in the v′ = 1 level at collision energies of few to few tens of electron volts
[Huewel et al., 1984; Liao et al., 1986; Birkinshaw et al., 1987]. This is in violation
of the Franck-Condon principle, which would suggest no change in the vibrational level
upon the transfer of the electron from the nitrogen molecule to the argon cation. As
seen from the relevant energy levels of the reactants and products shown in Fig. 7.1,
129

Chapter 7. Imaging Reaction Dynamics
Figure 7.1: Energy level diagram of the Ar+ + N2 ion-molecule reaction. Reactant energy levels of Ar+ and
N2(v = 0) are shown on the left and product energy levels for N+2 (v′) are shown on the right. Rotational energy
levels are omitted.
this even changes reaction (7.1) from an exothermic to an endothermic reaction. The
occurrence of product ions in v′ = 1 is explained by a Landau-Zener curve crossing due
to non-adiabatic couplings between the different potential energy surfaces [Candori et al.,
2001], as shown schematically in Fig. 7.2. However, the experimental observation of higher
product vibrational states [Birkinshaw et al., 1987] near 0.8 eV relative energy has not
been explained theoretically up to now. Besides the fundamental interest, this charge
transfer reaction also has technological relevance as a temperature diagnostics in argon
plasmas [Linss et al., 2004]. Recently the reaction complex [ArN2]+ has been studied using
rotationally resolved infrared spectroscopy and detailed information on the structure of
this reactive intermediate were obtained [Linnartz et al., 2002].
7.1.2 Imaging of reaction dynamics
Low energy Ar+ ions are produced by electron impact on a pulsed supersonic Ar beam
as in detail described in the previous chapter. Once created by electron impact, the Ar+
ions, which are expected to populate the P3/2 ground state and the P1/2 excited state in
a statistical mixture of 2:1, float with the neutral beam downstream. De-excitation of the
excited P1/2 state is known to be very slow [Liu and Conway, 1975] and is not expected
to occur considerably in the molecular beam. The roughly 30% excited state fraction,
however, is only playing a minor role in this experiment, because the charge transfer
cross section for the P1/2 state is lower by a factor of two than for the P3/2 ground state
[Schweizer and Gerlich, 1994].
130

7.1. Investigating the Ar+ + N2 charge transfer reaction
Ar-N2 distance
po
ten
tial
en
erg
y
A, v’=0)2(2
S) + N1Ar(
X, v’=2)2(2
S) + N1Ar(
X, v’=1)2(2
S) + N1Ar(
X, v’=0)2(2
S) + N1Ar(
2) + N3/2P2(+Ar
relE
Figure 7.2: Qualitative view of a cut through the relevant potential surfaces as a function of the Ar-N2
distance.
The target N2 molecules are provided by the pulsed neutral beam source operated at
a stagnation pressure of 2 bar with pure N2. The supersonic beam is skimmed with a
0.30 mm skimmer and has in the interaction region a measured diameter of 2.2 mm at a
density of about ntarget = 1012 cm−3 (see Section 6). Due to cooling in the supersonic
expansion, the rovibrational excitation of the N2 reactant is expected to be much smaller
than 25 meV (corresponding to the 300 K of the valves nozzle).
Reactive scattering of Ar+ with N2, producing N+2 ions, is observed by synchronizing
both beam bunches such that they cross in the interaction region. Based on the measured
velocity distributions for Ar+ and N2 the two reactant beams cross each other with an
uncertainty in the relative kinetic energy of about 140 meV FWHM, which is smaller than
the vibrational spacing in N+2 of 270 meV.
Product ions emerging from a collision are detected with the velocity map imaging
detector. For this study only the two lowermost electrodes in the stack were used and
supplied in pulsed mode with 1300 V and 950 V respectively. The magnification M is
obtained from SIMION 7.0 [SIMION, 2007] simulations to amount to M = 1.24 for the
two-electrode arrangement. A grounded grid of high transmission was placed a few mm in
front of the 70 mm diameter microchannel plate to accelerate the projected ions by another
2000V before they impinge on the detector. In this experiment the gain of the MCP was
not switched. To select the mass of the detected ions, in particular to discriminate N+2
131

Chapter 7. Imaging Reaction Dynamics
product ions from Ar+ reactant ions, only the high voltage to the phosphor screen is
pulsed on. N+2 product ions arrive on the detector 1.5µs before the Ar+ reactant ions.
No slicing is applied in this experiment. A product ion rate of about 5-20 per second
is observed at a bunch crossing rate of 10 Hz. Typical images consisting of 50.000 ion
impacts are acquired within 1-3 hours.
Fig. 7.3 shows in three panels the accumulated product ion images for three different
relative collision energies Erel = 0.6 eV, 0.8 eV, and 2.5 eV. To obtain these images the
impact positions of the product ions, as measured with the CCD camera, are converted
into transverse velocity vectors. These velocities are then transformed into the center of
mass (c.m.) frame of reference using a simple Galileo transformation. The c.m. velocity
in the laboratory frame is known from the measured reactant velocities. The coordinate
system of the c.m. velocities is rotated such that the initial relative velocity vector is
aligned along the horizontal vx-axis. As indicated with arrows in Fig. 7.3, the Ar+ reactant
velocity points to the right and the N2 velocity points to the left. In each panel, Newton
spheres that represent the expected N+2 product velocities in the rovibrational states
v′ = 0 − 3 are drawn as concentric rings. The spacing between two Newton spheres
corresponds to the average vibrational energy spacing in N+2 of 270 meV (see Fig. 7.1);
rotational product states are not resolved given that the rotational constant of N+2 amounts
to 0.24 meV.
Several conclusions can already be drawn from these raw product ion images: Forward
scattering with little momentum transfer from Ar+ to N2 is dominant for all collision
energies. However, at 0.8 eV collision energy (middle panel) the angular spread is increased
significantly compared to 2.5 eV collision energy (lower panel), and exhibits a large amount
of sideways and even backward scattering. At 0.6 eV (upper panel) the sideways scattering
is reduced, but a backward scattered peak remains.
In none of the individual product ion images separated ridges are resolved, which
one would expect for the population of distinct vibrational levels in the N+2 product
ion and moderate rotational excitation corresponding to 700 K or 60 meV, as observed
previously by fluorescence spectroscopy [Huewel et al., 1984]. However, when comparing
the product ion images for 0.6 eV and 0.8 eV with the different Newton spheres, the
vibrational excitation of the N+2 product ion is clearly peaking at v′ = 1 for Erel = 0.6 eV
whereas v′ = 1 and 2 are both found for Erel = 0.8 eV with more intensity in the v′ = 2
channel.
At the high collision energy of 2.5 eV the spacing of the Newton spheres reduces to only
one histogram bin. This makes it difficult to resolve the individual contributions of the
v′ = 1 and v′ = 2 product states. We assume for the subsequent analysis that the width
of the forward scattered peak at 2.5 eV in Fig. 7.3 is dominated by the transfer function
of our imaging spectrometer. This is consistent with previous experiments [Birkinshaw
132

7.1. Investigating the Ar+ + N2 charge transfer reaction
m/s xv-4000 -3000 -2000 -1000 0 1000 2000 3000 4000
m/s
yv
-3000
-2000
-1000
0
1000
2000
3000
50
100
150
200
250
= 0.6 eVrelE
01
2
m/s xv-4000 -3000 -2000 -1000 0 1000 2000 3000 4000
m/s
yv
-3000
-2000
-1000
0
1000
2000
3000
100
200
300
400
500
600
700
800 = 0.8 eVrelE
32
10
m/s xv-4000 -3000 -2000 -1000 0 1000 2000 3000 4000
m/s
yv
-3000
-2000
-1000
0
1000
2000
3000
2000
4000
6000
8000
10000 = 2.5 eVrelE
3210
Figure 7.3: Images of the projected velocities of the N+2 product ions from the reactive scattering of Ar+ with
N2 for three different relative energies, shown in the center of mass frame. The N2 reactant velocity is shown by
the arrow pointing along the negative vx-axis and the Ar+ reactant velocity is shown by the arrow pointing along
the positive vx-axis. The Newton rings mark the product velocities for N+2 in the vibrational level v′ = 0, 1, 2, 3,
respectively.
133

Chapter 7. Imaging Reaction Dynamics
et al., 1987; Liao et al., 1986], which find that at this collision energy forward scattered
N+2 in v′ = 1 is the only significant product channel.
The discussed reactive scattering images represent projections of the three-dimensional
product ion velocity distribution onto the two-dimensional detector surface, broadened
by the experimental resolution function. The quantity of interest, however, is the double
differential scattering cross section d2σ/(dθd∆T ), where θ denotes the scattering angle
and ∆T the difference between the initial and final kinetic energies of all particles, i. e.
the net change of the internal energy of the collision partners. In the present experiment,
∆T corresponds to the internal energy of the N+2 product ion (under the assumption of
internally cold N2 reactants).
To extract differential cross sections from the measured projection images, an inver-
sion could be done by one of the standard inverse Abel transformations, since the axis of
symmetry – the relative velocity vector – lies parallel to the detector surface [Heck and
Chandler, 1995]. A more careful treatment of the data needs to take corrections of this
simplified analysis into account. Since no multi-stage extraction field was used in this
experiment, focusing aberrations of the velocity map imaging spectrometer are an impor-
tant source of broadening due to the large size of the product ion cloud of up to 15 mm
prior to the pulsing of the velocity map imaging fields. Presumably most important are
chromatic aberrations for ions located at different heights above the repeller plate at the
time of the switch-on of the imaging fields. Different ion flight times, the measured width
of the reactant velocity distributions and the finite detection efficiency for faster product
ions that may leave the interaction volume contribute additional experimental deficien-
cies. Except for the latter, however, all these effects only lead to a local broadening of the
measured distribution P (x, y) on the detector and do not change their overall shape. To
account for this transfer function of our spectrometer a forward Monte Carlo algorithm
has been developed that simulates the expected P (x, y) distribution on the detector from
an assumed differential cross section. Using this transfer function a Monte Carlo recon-
struction technique can be applied to retrieve the differential cross section from measured
data [Frieden, 1975; Strasser et al., 2002]. As explained in the appendix (see Section A)
this iterative algorithm reconstructs the two-dimensional histograms that represents the
measured projected velocity distributions (shown in Fig. 7.3) by the best fitting list of
simulated Monte Carlo events, each characterized by its scattering angle θ and its energy
difference ∆T . From this event list θ, ∆Ti the unfolded product velocity distributions
can be derived.
Fig. 7.4 shows for each of the three investigated collision energies of Fig. 7.3 the Abel-
inverted and unfolded two-dimensional histogram of the product ion velocities in the
scattering plane. Since θ ranges from 0 to 180 the images are symmetric with respect to
the relative velocity axis. These unfolded distributions show that the projection images
134

7.1. Investigating the Ar+ + N2 charge transfer reaction
m/s xv-4000 -3000 -2000 -1000 0 1000 2000 3000 4000
m/s
yv
-3000
-2000
-1000
0
1000
2000
3000
500
1000
1500
2000
2500
3000
3500
4000
4500 = 0.6 eVrelE
01
2
m/s xv-4000 -3000 -2000 -1000 0 1000 2000 3000 4000
m/s
yv
-3000
-2000
-1000
0
1000
2000
3000
1000
2000
3000
4000
5000
32
10
= 0.8 eVrelE
m/s xv-4000 -3000 -2000 -1000 0 1000 2000 3000 4000
m/s
yv
-3000
-2000
-1000
0
1000
2000
3000
2000
4000
6000
8000
10000
12000
14000
16000
18000
20000 = 2.5 eVrelE
3210
Figure 7.4: Reconstructed distributions of the N+2 product velocity in the scattering plane, derived with the
Monte Carlo reconstruction technique from the three corresponding images of Fig. 7.3. Reactant velocity vectors
and product state Newton rings are indicated in the same way as in Fig. 7.3.
135

Chapter 7. Imaging Reaction Dynamics
of Fig. 7.3 actually represent few well-resolved features in the differential cross section.
For 2.5 eV collision energy (bottom panel) a sharp peak in the forward direction is
obtained, which reflects our assumption that the measured broadening at this energy
is given by the transfer function. In addition to the sharp forward scattering a small
contribution of larger scattering angles into the forward hemisphere is observed. At 0.8 eV
collision energy (middle panel) the reconstructed image shows a peak at forward scattering
together with pronounced ring of sideways scattering. The forward scattering peak shows
product velocities mainly corresponding to v′ = 2. In the sideways scattering both v′ = 1
and v′ = 2 are observed. At 0.6 eV collision energy (upper panel) the reconstructed image
shows again a strong forward scattering peak, but now clearly into v′ = 1. Also a weaker
scattering in the backward direction is observed. In addition a small amount of sideways
scattering is found which goes along with the excitation of two vibrational quanta in the
N+2 product ion. An excitation into v′ = 3 is not observed for any of the collision energies
under study. In general, the differential cross section images obtained from the Monte
Carlo reconstruction reflect the qualitative observations made in the raw projected images.
In addition, the reconstructed images show that the observed intensity near zero velocity
in the raw images of Fig. 7.3 is completely accounted for by the Abel transformation.
The strength of the Monte Carlo reconstruction is that it directly delivers the unfolded
one-dimensional distributions of the energy difference ∆T for a more quantitative analysis.
The obtained histograms for the three collision energies integrated over all scattering an-
gles are shown in Fig. 7.5; indicated in the graph are the energy differences corresponding
to product channels v′ = 0− 3. A clear difference is observed when comparing the 0.6 eV
and 0.8 eV collision energies. For 0.6eV collision energy the dominant peak at v′ = 1 is
due to the forward and backward scattered ions while the smaller amount of products in
v′ = 2 stems from the sideway scattering. For 0.8 eV, where sideway scattering is found
to be more prominent, a general shift towards v’=2 is observed. Since the Monte Carlo
reconstruction cannot result in widths smaller than the corresponding binning of the raw
images, a finite width of the peaks in the ∆T -distribution remains. This is particularly
visible in the distribution for 2.5 eV collision energy, where the ∆T resolution is lower,
because energy differences are mapped onto smaller changes in the absolute velocities.
Here we can not disentangle the v′ = 1 and v′ = 2 product states from our data.
7.1.3 Evidence for a scattering resonance
The Ar+ + N2 system has been studied in great detail by the group of J. H. Futrell using a
crossed-beam setup with a rotatable ion detector [Futrell, 1992]. In particular the results
of [Birkinshaw et al., 1987] are ideally suited as a concise benchmark for our crossed-beam
imaging data. Fig. 9 and 10 of this reference show N+2 velocity distributions for charge
transfer at collision energies of 0.78 and 1.54 eV, respectively. These distributions are
136

7.1. Investigating the Ar+ + N2 charge transfer reaction
eV T ∆-0.4 -0.2 0 0.2 0.4 0.6 0.8
arb
.un
its
Inte
nsi
ty
0
0.05
0.1
0.15
0.2
0.25
0.3
0.35
0.4 (v = 0)+2 N 1 2 3
= 0.6 eVrelE
eV T ∆-0.4 -0.2 0 0.2 0.4 0.6 0.8
arb
.un
its
Inte
nsi
ty
0
0.05
0.1
0.15
0.2
0.25
0.3
0.35
0.4 (v = 0)+2 N 1 2 3
= 0.8 eVrelE
eV T ∆-0.4 -0.2 0 0.2 0.4 0.6 0.8
arb
.un
its
Inte
nsi
ty
0
0.05
0.1
0.15
0.2
0.25
0.3
0.35
0.4 (v = 0)+2 N 1 2 3
= 2.5 eVrelE
Figure 7.5: Distributions of the kinetic energy difference ∆T between the kinetic energy of the reactants and
the kinetic energy of the products, derived with the Monte Carlo reconstruction technique for the three scattering
energies Erel = 0.6 eV, 0.8 eV and 2.5 eV. The internal energies ∆U corresponding to different N+2 product vibra-
tional states v′ = 0 − 3 are indicated at the top of each panel. The broader binning in the bottom panel reflects
the lower resolution for energy differences at this higher collision energy.
137

Chapter 7. Imaging Reaction Dynamics
derived through a deconvolution procedure from the product laboratory angle and energy
dependent count rates. The distribution for 1.54 eV from Birkinshaw et al. agrees very
well with our data for 2.5 eV collision energy in that sharp forward scattering dominates.
Our observation of a small fraction of events with larger scattering angles is not shown in
the data of Birkinshaw et al., because of their lower dynamic range.
The distribution for 0.8 eV of Birkinshaw et al. shows much larger scattering angles
and more internal excitation of the N+2 product than the one for larger collision energy.
This agrees qualitatively with our results for 0.8 eV. However, the distribution shown in
Ref. [Birkinshaw et al., 1987] features several local maxima for the product states v′ = 1,
2 and even 3, whereas our measurement shows only one additional local maximum near
90 scattering angle besides the main forward scattering peak, which is also smaller by
about a factor of three to five compared to Birkinshaw et al.. No v′ = 3 is observed in
our data. Unfortunately, Birkinshaw et al. do not indicate the statistical significance of
the structures they observed in their de-convoluted and fitted differential cross section,
which would be helpful to judge these deviations. We attribute them primarily to the
finite resolution in our experiment, which even after de-convolution cannot resolve peaks
in the cross section in too close proximity. However the main forward scattered peak
seems to be mainly N+2 in the v′ = 2 level in our data, as can be seen in Fig. 7.4, whereas
Birkinshaw et al. find predominantly v′ = 1 in the forward direction. For 0.6 eV collision
energy we find sideways scattering with product excitation of v′ = 2, benefitting from our
higher dynamic range as compared to Birkinshaw et al..
While Birkinshaw et al. observed product states v′ ≥ 2 of N+2 at 0.8 eV collision
energy, they found the v′ = 1 product state to dominate at 1.5 eV. Liao et al. observed
also only v′ = 1 for several energies above 1.5 eV as well as for 0.25 eV collision energy
[Liao et al., 1986] using guided ion beams techniques with chemical probing of the N+2
product excitation. Additional low energy results were obtained by Huewel et al. for
0.21 eV collision energy, where they also found v′ = 1 to be the main product state using
fluorescence spectroscopy [Huewel et al., 1984].
Energy conservation during the reaction links the translational energy as depicted in
Fig. 7.5 to the internal excitation of the molecular product N+2 , so that the branching
ratio for the different product vibrational levels as a function of the collision energy can
be extracted for reaction (7.1); rotational excitation is assumed to be small compared
to vibrational excitation [Huewel et al., 1984]. The result is shown in Fig. 7.6, which
combines the data of this study with data points from Liao et al. [Liao et al., 1986]
obtained using guided ion beam techniques together with chemical probing. A recent
semi-classical calculation, based on Landau-Zener type transitions, of the state-to-state
charge transfer cross section [Candori et al., 2001] predicts an almost constant fraction
of 70% in v′ = 1 and 20% in v′ = 2 over the collision energy range of Fig. 7.6. This is
138

7.1. Investigating the Ar+ + N2 charge transfer reaction
eV relE0 0.5 1 1.5 2 2.5 3 3.5 4
rel.
abu
nd
ance
-0.2
0
0.2
0.4
0.6
0.8
1
1.2
v’=1
v’=2
v’=0
Figure 7.6: Branching ratio for vibrational levels v′ of the N+2 charge transfer product ion as a function of
the relative collision energy, derived in this work (circles) and obtained from Ref. [Liao et al., 1986] (triangles).
in disagreement with the experimental data, which show that v′ = 1 is dominant only at
large relative energies and that the v′ = 2 channel shows a distinct peak near 0.8 eV.
With a full quantum scattering calculation for reaction (7.1) still at large, we allow
ourselves a speculation of the reason for the higher product vibrational excitation near
0.8 eV. In the Landau-Zener calculation of Ref. [Candori et al., 2001] only the ground
electronic states for Ar and N2 are taken into account. However, N+2 possesses a low-lying
electronically excited A-state of 2Πu symmetry. This state lies 1.1 eV above the X2Σg
ground state and thus represents an energetically closed channel for collision energies
below 0.9 eV. The N+2 ground state interacts strongly with Ar leading to a total binding
energy of the (ArN2)+ complex of more than 1 eV [Weitzel and Mahnert, 2002]. If the
A-state of N+2 features a similarly strong interaction with argon then this closed channel
can in fact couple to the open Ar+ + N2 scattering channel for collision energies below
1 eV. This Feshbach-type coupling can lead to scattering resonances when a bound state in
the closed channel is tuned into resonance with the continuum scattering state, as shown
qualitatively in Fig. 7.2. Our suggestions is that the higher vibrational excitation of the N+2
product at 0.6 and 0.8 eV collision energy may be a manifestation of such a resonance. The
observed large angle scattering would be in support of this as well. Clearly, a theoretical
treatment that includes the A-state would be highly desirable. Further experiments on
this system are planned in particular to shed more light on the width of this resonance
feature and to investigate if further resonances occur at different scattering energies.
139

Chapter 7. Imaging Reaction Dynamics
7.2 Imaging SN2 reaction mechanisms in Cl− + CH3I
In this section the dynamics of the SN2 reaction
Cl− + CH3I −→ CH3Cl + I− (7.2)
is shown in detail using crossed molecular beam imaging. As a function of the collision
energy, varied between 0.4 and 5.3 eV, the transition from an indirect, complex-mediated
reaction mechanism to direct backward scattering to sideways scattering with high internal
excitation and possibly fragmentation is observed experimentally. Statistical and direct
chemical dynamics calculations by the collaborating theory group of W. L. Hase from
Texas Tech University explain the observed energy transfer and reveal together with the
experiment a new indirect “roundabout” reaction mechanism involving CH3-rotation.
7.2.1 The Cl− + CH3I SN2 reaction
A one-dimensional cut along the reaction coordinate of the potential energy hypersurface
of reaction (7.2) is shown in Fig. 7.7. The potential energy landscape of this SN2 reaction
features the characteristic double-minimum structure, which is attributed to the formation
of ion-dipole collision complexes on both sides of the reaction barrier. The reaction is
exoergic by (0.55± 0.05) eV [Glukhovtsev et al., 1996] with an intermediate barrier 0.21 eV
submerged with respect to the educt asymptote. The reaction rate coefficient has been
measured at 300 K to amount to (1.6 ± 0.3) × 10−10 cm3/s [Kato et al., 2001; Gronert
et al., 1991] in reasonable agreement with statistical modeling [Hu and Truhlar, 1995],
which results in a reaction efficiency of about 8% at this temperature. At collision energies
between 0.9 and 1.6 eV the rate coefficient was determined to be about 0.6 × 10⁻¹⁰ cm3/s
insensitive of the collision energy [Cyr et al., 1995]. Kinetic energy release distributions
have been measured for the unimolecular decomposition of [Cl− · · · CH3I]∗→ I− + CH3Cl
at about 300 K internal temperature and were found to be in disagreement with statistical
energy partitioning [Graul and Bowers, 1994]. Formation of the dihalide ICl− due to
abstraction rather than substitution has been observed and was measured to proceed at
about 4% of the substitution rate at 1.6 eV collision energy [Cyr et al., 1995].
We produce packages of Cl− anions from dissociative electron attachment to CCl4 in
the pulsed supersonic expansion ion source. The precursor is seeded at 2.5% in argon at
a stagnation pressure of 2 bar. We tune the kinetic energy of the anion beam between
0.2 eV and 5.9 eV. For typical velocity distributions see Chapter 6. We do not select the
isotope, such that a chlorine anion mixture close to the natural abundance of 35Cl/37Cl
= 3.1 is likely. Chlorine anions are in rare-gas configuration and hence have no stable
internally excited states.
140
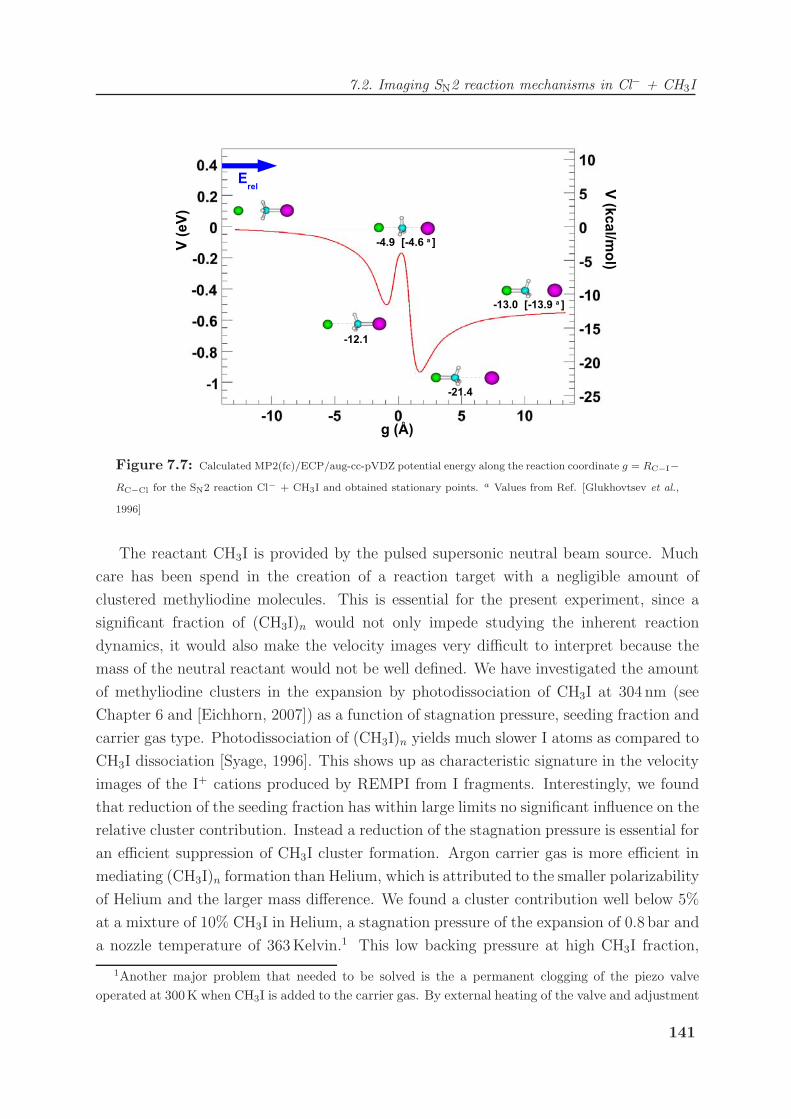
7.2. Imaging SN2 reaction mechanisms in Cl− + CH3I
Figure 7.7: Calculated MP2(fc)/ECP/aug-cc-pVDZ potential energy along the reaction coordinate g = RC−I−RC−Cl for the SN2 reaction Cl− + CH3I and obtained stationary points. a Values from Ref. [Glukhovtsev et al.,
1996]
The reactant CH3I is provided by the pulsed supersonic neutral beam source. Much
care has been spend in the creation of a reaction target with a negligible amount of
clustered methyliodine molecules. This is essential for the present experiment, since a
significant fraction of (CH3I)n would not only impede studying the inherent reaction
dynamics, it would also make the velocity images very difficult to interpret because the
mass of the neutral reactant would not be well defined. We have investigated the amount
of methyliodine clusters in the expansion by photodissociation of CH3I at 304 nm (see
Chapter 6 and [Eichhorn, 2007]) as a function of stagnation pressure, seeding fraction and
carrier gas type. Photodissociation of (CH3I)n yields much slower I atoms as compared to
CH3I dissociation [Syage, 1996]. This shows up as characteristic signature in the velocity
images of the I+ cations produced by REMPI from I fragments. Interestingly, we found
that reduction of the seeding fraction has within large limits no significant influence on the
relative cluster contribution. Instead a reduction of the stagnation pressure is essential for
an efficient suppression of CH3I cluster formation. Argon carrier gas is more efficient in
mediating (CH3I)n formation than Helium, which is attributed to the smaller polarizability
of Helium and the larger mass difference. We found a cluster contribution well below 5%
at a mixture of 10% CH3I in Helium, a stagnation pressure of the expansion of 0.8 bar and
a nozzle temperature of 363 Kelvin.1 This low backing pressure at high CH3I fraction,
1Another major problem that needed to be solved is the a permanent clogging of the piezo valveoperated at 300K when CH3I is added to the carrier gas. By external heating of the valve and adjustment
141

Chapter 7. Imaging Reaction Dynamics
required to nevertheless guarantee a significant density of the neutral reactant, makes
cooling in the expansion less efficient. The neutral beam is characterized with electron
impact ionization. As described in Chapter 6 we reach translational temperatures of about
60 Kelvin. Due to the large mass difference between admixture and seed gas internal
cooling will be inefficient. Upper and lower limits for the vibrational temperature of
CH3I are given by the temperature of the nozzle of 360 K and the measured translational
temperature of CH3I of 60 Kelvin.
By synchronizing both beam bunches Cl− anions undergo nucleophilic substitution and
form I− reaction products. Especially at high translational energies, where extraction from
the ion source is very efficient, we reach rates of reactive scattering of several hundred Hz
at 10 Hz bunch crossing rate. Based on the velocity distributions of the neutral beam and
the anion beam, which we measure before and after each scattering data acquisition, the
uncertainty in the relative kinetic energy amounts to about 300 meV FWHM. Product ions
are detected with the velocity map imaging spectrometer. All four electrodes were used in
this study to combine velocity mapping and spatial focusing. Voltages are pulsed typically
3 - 5µs after the first reactant ions have arrived in the interaction region. We switch the
MCP gain such that only I− products are amplified. We apply slicing by pulsing the
phosphor screen to restrict ion detection to events where the products remain within the
scattering plane spanned by the reactants. Typical images contain (2 - 10)× 105 product
ions and are acquired within 3 - 10 hours. We have mapped the dynamics of reaction (7.2)
between 0.4 and 5.3 eV in intervals close to the resolution imposed by the spread of the
beams, hereby acquiring more than 50 images of reactive scattering.
Table 7.1 summarizes all the product channels of reaction (7.2) in the relevant en-
ergy range, which produce I− anions. As can be seen below 3.06 eV collision energy no
fragmentation of the neutral product CH3Cl is possible. Hence all energy not distributed
to product translation is stored as internal excitation of the CH3Cl molecule. Since the
reaction reactants are initially cold this internal energy can be directly read of in the
measured kinetic energy transfer.
7.2.2 Imaging nucleophilic substitution dynamics
Figures 7.8 to 7.11 give a selection of our data, chosen to reflect the observed reaction
dynamics of the SN2 reaction Cl− + CH3I −→ CH3Cl + I− in the investigated energy
range. Each row represents a different relative scattering energy denoted as Erel in the
leftmost panel together with the statistics N. The rows are arranged as increasing in
energy. The leftmost column shows maps of the I− product ion velocities derived from
of the hot valve we were able to avoid these problems. Valve blocking with CH3I is not observed forsolenoid valves presumably since unlike piezo vales they inherently heat up during operation [Parker andStapelfeldt, 2007].
142

7.2. Imaging SN2 reaction mechanisms in Cl− + CH3I
products ∆ H0 [eV]
Cl− + CH3I 0
I− + CH3Cl -0.55 ± 0.05
I− + CH3 + Cl +3.06 ± 0.06
I− + CH2 + HCl +3.38 ± 0.06
I− + CH2Cl + H +3.69 ± 0.11a
ICl− + CH3 +0.98 ± 0.12
Table 7.1: Enthalpies of Reaction ∆H0 calculated from enthalpies of formation ∆fH0 at 0K [Lide, 2003] for
product channels of Cl− + CH3I in which I− is formed. The lowest energy channels are shown, which are at reach
with the available kinetic energy in this study. a adapted from [Angel and Ervin, 2003].
histogramming loss-weighted ion impact positions on the detector, which are linearly
converted from position to ion speed and transformed into the center of mass frame.
Consequently, the velocity vectors of the two reactants, the Cl− anion and the CH3I
neutral, line up horizontally and point in opposite directions as indicated by the arrows
in the top line of Figs. 7.8 - 7.11. The total energy available to the reaction products
is given by the relative translational energy Erel of the reactants plus the exoergicity
∆ H = - 0.55 eV of the reaction (see Fig. 7.7). I− products reach the highest velocity
when all the available energy is converted to translational energy. The outermost circle
in Figs. 7.8 - 7.11 represents this kinematic cutoff for the velocity distribution. The other
concentric rings display spheres of the same translational energy and hence also the same
internal product excitation, spaced at 0.5 eV intervals for relative scattering energies up
to Erel = 1.9 eV and at 1.0 eV intervals for higher scattering energies. If dissociation of
CH3Cl is energetically accessible, the respective kinematical cutoff for the lowest energy
channel is displayed as solid white circle. The images of product ion velocity show the
differential cross section d3σdvxdvydvz
= d3σv2dv dcos(θ) dφ
. Isotropic scattering with all velocities
equally probable results in a homogeneous distribution. In the second column weighting
with v2 has been applied to unravel the doubly differential cross section d2σdv dcos(θ)
. The
radius of the histograms has been adjusted to the kinematical cutoff plus the half width
at half maximum (HWHM) of the distribution of relative kinetic energies, which stems
from the velocity spread of the beams. The size of the disc hence represents the maximum
allowed kinetic energy of the product ions.
The images in Figs. 7.8 - 7.11 reveal many details of the reaction dynamics. For the
lowest relative collision energy of 0.39 eV there is an isotropic distribution of product
velocities centered around zero with all scattering angles equally probable. This points to
143

Chapter 7. Imaging Reaction Dynamics
the traditional reaction mechanism [Olmstead and Brauman, 1977] mediated by a collision
complex that lives long as compared to the timescale of its rotation. The rotational period
can be estimated to be τrot ≈ 0.9 ps according to [Busch and Wilson, 1972; Okino et al.,
2006]
τrot =2 π
ωrot
≈ 2 π√πErel
B2
, (7.3)
using an effective rotational constant for [Cl− · · · CH3I] of B = 0.131 cm−1 [Graul and
Bowers, 1994]. Hence we expect collision complex lifetimes on the order of picoseconds
at this collision energy of 0.39 eV, which corresponds to a translational temperature of T
= Erel/kB = 4500 K. This is interesting recalling the steep descent for the lifetime of the
collision complex [Cl− · · · CH3Cl] from 42 to 16 ps in the range from 150 to 220 Kelvin de-
termined in the 22pole trap (see Section 5.2). It might indicate a different way of complex
formation at thermal and superthermal energies. The complex-mediated mechanism is ac-
companied by a velocity distribution that drops to zero far before the kinematic cutoff is
reached, as can be inferred from the position of the outermost ring in the image. It implies,
that the largest fraction of the available energy is partitioned to internal rovibrational en-
ergy of the CH3Cl product. A distinctly different reaction mechanism is introduced at the
higher relative collision energy of 0.69 eV, which becomes dominant at 0.76 eV as seen in
the lowest row of Fig. 7.8: The I− product is back-scattered into a small cone of scattering
angles. This indicates that direct nucleophilic displacement dominates. The Cl− reactant
attacks the methyliodine molecule on the side of the CH3 umbrella and thereby drives the
I− product away on the opposite side. Asymmetric patterns in the velocity image imply
that the reaction is not statistical since complete randomization of energy requires an
isotropic dissociation of the collision complex. The direct mechanism leads to product ion
velocities close to the kinematic cutoff. In addition, part of the product flux is still found
at small product velocities with an almost isotropic angular distribution, indicating that
for some of the collisions a long-living complex is formed with a significant probability.
While still being visible at Erel = 1.00 eV the complex-mediated reaction channel has died
off at a collision energy of 1.07 eV (see Fig. 7.9). The reaction proceeds almost exclusively
by the direct mechanism with a similar velocity and a slightly narrower angular distri-
bution as for 0.76 eV. Now the interaction of the reactants is short on the timescale of
rotation calculated from eqn. (7.3) to be 0.6 ps. At 1.49 eV the cone of product emission
in the backward direction spreads over an increased range of scattering angles while the
inserted rings demonstrate that the velocity distribution is further reduced as compared
to 1.07 eV. Here almost all available energy is partitioned to translation, such that the
neutral molecular product has to be internally cold. Interestingly, a new feature appears
at the same time that consists of two distinct low-velocity peaks that are symmetric in
the forward and backward direction with respect to the center of mass. This phenomenon
144

7.2. Imaging SN2 reaction mechanisms in Cl− + CH3I
becomes more pronounced at collision energies of 1.90 eV and 2.52 eV. It corresponds to a
reaction mechanism that renders highly internally excited CH3Cl molecules. For increas-
ing collision energy the distribution for the dominating backward scattering spreads over
increasing ranges of scattering angles, which might indicate a larger “cone of acceptance”
for reactive trajectories. Thus at Erel = 3.03 eV a significant fraction of the I− products
are released in sideways direction. At the same time the velocity distribution becomes
very broad. A strong peak is established in the forward direction at high internal exci-
tation, which might point to a direct replacement upon frontside attack of CH3I at the
location of the halide. At a relative energy of 3.73 eV dissociation of CH3Cl becomes
energetically accessible but does not contribute significantly as seen from the intensity
inside the white circle. Still backward scattering prevails with exceedingly high internal
excitation. At even higher collision energies the dynamics is more and more dominated
by sideways scattering. For a collision energy of 4.62 eV product velocities in the range
of the kinematical cutoff for breakup of CH3Cl into CH3 and Cl are observed. While
additional kinetic energy results in a product velocity in sideways direction that resides
at the kinematical cutoff, in backward direction considerably smaller velocities are seen.
We propose a mechanism, which might explain these observations below.
We extract the scattering angle θ for the reaction events defined as the angle between
incoming and outgoing velocity of iodine as indicated in the sketched Newton diagram.
The one-dimensional histograms in the third column of Figs. 7.8 - 7.11 show the distri-
bution of cos(θ) normalized to an area of unity. The graphs confirm our analysis, that
an almost isotropic distribution is observed for the lowest collision energy of 0.39 eV. The
increasing importance of backward scattering for ascending collision energy is mapped
very clearly in the distributions as seen from the constriction of the histogram entries
near cos(θ) = -1. Maximum backward scattering is reached for a relative collision energy
of 1.07 eV as also seen from Fig. 7.12 showing the mean value <cos(θ)> for the histograms
in Figs. 7.8 - 7.11 as a function of the relative collision energy Erel. At energies exceeding
1.07 eV backward scattering is gradually reduced and accompanied by sideways and for-
ward scattering. For the highest collision energy of 5.33 eV, where fragmentation might
play a role, sideways scattering is dominating as seen from the distribution peaking at
cos(θ) = 0 in the lowest panel of Fig. 7.11.
For a quantitative comparison we calculate the energy transfer
Q = Erel,final −Erel,initial (7.4)
for all reaction events and accumulate the Q-values in histograms shown in black in the
last column of Figs. 7.8 - 7.11 after normalization. The other colors represent Q-value
histograms restricted to backward scattering cos(θ) < -1/3 (green), sideways scattering
-1/3 < cos(θ) < 1/3 (blue) and forward scattering cos(θ) > 1/3 (red) only, all normalized
145

Chapter 7. Imaging Reaction Dynamics
-1000-500
0500
1000-1000
-500 0
500
1000
[m/s]
v
[m/s]yv
= 0.39 eVrel
EN
= 48 k
π
)θd
v dco
s(σ 2
d
-1-0.5
00.5
10
0.5 1
1.5 2
2.5 3
)θco
s(-2
-1.5-1
-0.50
0.51
0
0.5 1
1.5 2
2.5 3
Q [eV
]
total
forw
.b
ackw.
sidew
.
-1000-500
0500
1000-1000
-500 0
500
1000
[m/s]
v
[m/s]yv
= 0.69 eVrel
EN
= 213 k
π
)θd
v dco
s(σ 2
d
-1-0.5
00.5
10
0.5 1
1.5 2
2.5 3
)θco
s(-2
-1.5-1
-0.50
0.51
0
0.5 1
1.5 2
2.5 3
Q [eV
]
total
forw
.b
ackw.
sidew
.
-1000-500
0500
1000-1000
-500 0
500
1000
[m/s]
v
[m/s]yv
= 0.76 eVrel
EN
= 273 k
π
)θd
v dco
s(σ 2
d
-1-0.5
00.5
10
0.5 1
1.5 2
2.5 3
)θco
s(-2
-1.5-1
-0.50
0.51
0
0.5 1
1.5 2
2.5 3
Q [eV
]
total
forw
.b
ackw.
sidew
.
Figu
re7.8:
Cen
ter-of-m
ass
images
ofth
eI −
reactio
npro
duct
velo
city,th
edoubly
diff
erentia
lcro
sssectio
nd2σ
dv
dcos(θ
),th
eangula
rdistrib
utio
nand
the
energ
ytra
nsfer
for
the
reactio
nofC
l −w
ithC
H3I
as
afu
nctio
nofth
erela
tive
collisio
nen
ergy.
146

7.2. Imaging SN2 reaction mechanisms in Cl− + CH3I
-100
0-5
000
500
1000
-100
0
-5000
500
1000
[m
/s]
v
[m/s] y v
= 1
.00
eVre
lE
N =
320
k
π
)θd
v d
cos(σ
2d
-1-0
.50
0.5
10
0.51
1.52
2.53
)θco
s(-2
-1.5
-1-0
.50
0.5
10
0.51
1.52
2.53
Q [
eV]
tota
lfo
rw.
bac
kw.
sid
ew.
-100
0-5
000
500
1000
-100
0
-5000
500
1000
[m
/s]
v
[m/s] y v
= 1
.07
eVre
lE
N =
167
k
π
)θd
v d
cos(σ
2d
-1-0
.50
0.5
10
0.51
1.52
2.53
)θco
s(-2
-1.5
-1-0
.50
0.5
10
0.51
1.52
2.53
Q [
eV]
tota
lfo
rw.
bac
kw.
sid
ew.
-100
0-5
000
500
1000
-100
0
-5000
500
1000
[m
/s]
v
[m/s] y v
= 1
.49
eVre
lE
N =
402
k
π
)θd
v d
cos(σ
2d
-1-0
.50
0.5
10
0.51
1.52
2.53
)θco
s(-2
-1.5
-1-0
.50
0.5
10
0.51
1.52
2.53
Q [
eV]
tota
lfo
rw.
bac
kw.
sid
ew.
Fig
ure
7.9:
Cen
ter-
of-m
ass
images
ofth
eI−
react
ion
pro
duct
vel
oci
ty,th
edoubly
diff
eren
tialcr
oss
sect
ion
d2σ
dv
dcos(
θ),th
eangula
rdis
trib
uti
on
and
the
ener
gy
transf
er
for
the
react
ion
ofC
l−w
ith
CH
3I
as
afu
nct
ion
ofth
ere
lative
collis
ion
ener
gy.
147

Chapter 7. Imaging Reaction Dynamics
-1500-1000-500
0500
10001500
-1500
-1000
-500 0
500
1000
1500
[m/s]
xv
[m/s]yv
= 1.90 eVrel
EN
= 565 k
π
)θd
v dco
s(σ 2
d
-1-0.5
00.5
10
0.2
0.4
0.6
0.8 1
1.2
1.4
1.6
1.8
)θco
s(-5
-4-3
-2-1
01
0
0.1
0.2
0.3
0.4
0.5
0.6
Q [eV
]
total
forw
.b
ackw.
sidew
.
-1500-1000-500
0500
10001500
-1500
-1000
-500 0
500
1000
1500
[m/s]
xv
[m/s]yv
= 2.52 eVrel
EN
= 707 k
π
)θd
v dco
s(σ 2
d
-1-0.5
00.5
10
0.2
0.4
0.6
0.8 1
1.2
1.4
1.6
1.8
)θco
s(-5
-4-3
-2-1
01
0
0.1
0.2
0.3
0.4
0.5
0.6
Q [eV
]
total
forw
.b
ackw.
sidew
.
-1500-1000-500
0500
10001500
-1500
-1000
-500 0
500
1000
1500
[m/s]
xv
[m/s]yv
= 3.03 eVrel
EN
= 959 k
π
)θd
v dco
s(σ 2
d
-1-0.5
00.5
10
0.2
0.4
0.6
0.8 1
1.2
1.4
1.6
1.8
)θco
s(-5
-4-3
-2-1
01
0
0.1
0.2
0.3
0.4
0.5
0.6
Q [eV
]
total
forw
.b
ackw.
sidew
.
Figu
re7.10:
Cen
ter-of-m
ass
images
ofth
eI −
reactio
npro
duct
velo
city,th
edoubly
diff
erentia
lcro
sssectio
nd2σ
dv
dcos(θ
),th
eangula
rdistrib
utio
nand
the
energ
ytra
nsfer
for
the
reactio
nofC
l −w
ithC
H3I
as
afu
nctio
nofth
erela
tive
collisio
nen
ergy.
148

7.2. Imaging SN2 reaction mechanisms in Cl− + CH3I
-150
0-10
00-5
000
500
1000
1500
-150
0
-100
0
-5000
500
1000
1500
[m
/s]
xv
[m/s] y v
= 3
.73
eVre
lE
N =
511
k
π
)θd
v d
cos(σ
2d
-1-0
.50
0.5
10
0.2
0.4
0.6
0.81
1.2
1.4
1.6
1.8
)θco
s(-5
-4-3
-2-1
01
0
0.1
0.2
0.3
0.4
0.5
0.6
Q [
eV]
tota
lfo
rw.
bac
kw.
sid
ew.
-150
0-10
00-5
000
500
1000
1500
-150
0
-100
0
-5000
500
1000
1500
[m
/s]
xv
[m/s] y v
= 4
.62
eVre
lE
N =
890
k
π
)θd
v d
cos(σ
2d
-1-0
.50
0.5
10
0.2
0.4
0.6
0.81
1.2
1.4
1.6
1.8
)θco
s(-5
-4-3
-2-1
01
0
0.1
0.2
0.3
0.4
0.5
0.6
Q [
eV]
tota
lfo
rw.
bac
kw.
sid
ew.
-150
0-10
00-5
000
500
1000
1500
-150
0
-100
0
-5000
500
1000
1500
[m
/s]
xv
[m/s] y v
= 5
.33
eVre
lE
N =
133
4 k
π
)θd
v d
cos(σ
2d
-1-0
.50
0.5
10
0.2
0.4
0.6
0.81
1.2
1.4
1.6
1.8
)θco
s(-5
-4-3
-2-1
01
0
0.1
0.2
0.3
0.4
0.5
0.6
Q [
eV]
tota
lfo
rw.
bac
kw.
sid
ew.
Fig
ure
7.11
:C
ente
r-of-m
ass
images
ofth
eI−
react
ion
pro
duct
vel
oci
ty,th
edoubly
diff
eren
tialcr
oss
sect
ion
d2σ
dv
dcos(
θ),th
eangula
rdis
trib
uti
on
and
the
ener
gy
transf
er
for
the
react
ion
ofC
l−w
ith
CH
3I
as
afu
nct
ion
ofth
ere
lative
collis
ion
ener
gy.
149

Chapter 7. Imaging Reaction Dynamics
[eV]relE0 1 2 3 4 5
)>θ<c
os(
-1
-0.5
0
0.5
1
Figure 7.12: Mean value <cos(θ)> of the angular distribution of I− product ions shown the third column of
Figs. 7.8 - 7.11 as a function of the collision energy Erel. It reflects the transition from isotropic to backward to
sideways scattering for increasing collision energy.
to the total number of reaction events. Due to energy conservation
Erel,initial + Eint,initial −∆ H = Erel,final + Eint,final (7.5)
and initially cold reactants (Eint,initial = 0), the internal excitation of the molecular product
in the absence of dissociation is given by
Eint,final = −Q−∆ H with ∆ H = −0.55 eV. (7.6)
The dashed vertical lines indicate the extreme cases Q = −Erel,initial, where the products
are at a standstill in the cm frame after the reaction and all energy is converted to internal
energy Eint,final = ∆ H + Erel,initial and Q = ∆ H , where the kinematical cutoff is reached
and the internal energy vanishes. As seen from the events outside the kinematical cutoff
our measurements are subject to significant broadening due to the velocity spread of
the reactant beams. The experimental resolution depends also on scattering angle and
energy transfer, a Gaussian error treatment by a computer algebra software yields for σQ
a lengthy formula depending on all measured parameters. We calculate σQ separately
for each reaction event. The mean of all these values < σQ > yields the FWHM of the
experimental resolution of the Q-value distribution (2.35 × < σQ >), which is indicated
by the horizontal dimension of the black bar in the histogram. Since the beams are well
characterized for each scattering energy, a more advanced data evaluation similar to the
Monte Carlo reconstruction used for the cationic charge transfer in the last section is
desirable. For the one dimensional Q-value distributions we go the opposite way and fold
theoretical predictions with the experimental resolution.
150

7.2. Imaging SN2 reaction mechanisms in Cl− + CH3I
For the lowest collision energy of 0.39 eV, the Q-value distributions for forward, back-
ward and sideways scattering are all very similar in size and shape as expected for isotropic
scattering (see Fig. 7.8). At the same time the observed distribution vanishes for Q-values
far below the kinematical cutoff. For increasing collision energy (Figs. 7.9 - 7.10) the dis-
tributions for backward and forward scattering become very different. While backward
scattering peaks close to the kinematical cutoff and is hence accompanied by low internal
excitation forward scattering in turn has its maximum at large negative Q-values cor-
responding to high internal excitation. For energies above 1.49 eV the relative fraction
of backward scattering is continously diminished. The distribution shifts away from the
kinematical cutoff and becomes very broad. At the highest collision energy of 5.33 eV in
Fig. 7.11 backward scattering is characterized by a higher internal excitation than forward
and sideways scattering. The mean value of the internal excitation of CH3Cl, derived by
eqn. (7.6) from the mean Q-value of the distribution for all scattering angles, is plotted in
Fig. 7.13 for the entire energy range of the scattering experiment both on an absolute and
on a relative scale. After the minimum for collision energies around 1.1 eV correspond-
ing to the disappearance of the complex-mediated mechanism the internal excitation of
the CH3Cl reaction product is steeply increasing with Erel and reaches very high values of
around 2.1 eV corresponding to 25.000 K at a collision energy of Erel = 4 eV, where still no
dissociation is observed. Nevertheless the by far highest relative disposition of energy to
internal degrees of freedom is reached in the complex-mediated mechanism at the lowest
collision energy.
7.2.3 Modeling of reaction dynamics and the“roundabout”mech-
anism
For a more detailed analysis we focus on the energy range up to Erel = 1.9 eV and pick the
four representative datasets at 0.39 eV, 0.76 eV, 1.07 eV and 1.90 eV. We have performed
a phase-space theory (PST) calculation [Pechukas and Light, 1965; Pechukas et al., 1966]
of the kinetic energy release (KER) upon unimolecular decomposition of [I− · · · CH3Cl]∗
similar to the ones described in Ref. [Graul and Bowers, 1994; Angel and Ervin, 2003]. It
assumes that the available energy Etotal = Erel − ∆ H is distributed statistically among
all degrees of freedom of the reaction products thereby explicitly conserving angular mo-
mentum. Then the probability P (Etrans, Etotal) of finding a specific relative translational
energy Etrans is obtained by its rotationally integrated relative contribution to the convo-
151

Chapter 7. Imaging Reaction Dynamics
[eV]relE0 1 2 3 4 5
> [e
V]
int
<E
0
0.5
1
1.5
2
2.5
3
[eV]relE0 1 2 3 4 5
int
f
0
0.2
0.4
0.6
0.8
1
Figure 7.13: Mean value of the internal excitation of CH3Cl (left) and the fraction of the total energy disposed
to it (right) as a function of the relative collision energy. At Erel > 4 eV dissociation will probably take place. This
data is derived from the mean of the Q-value distributions for all scattering angles as shown in the last column of
Figs. 7.8 - 7.11 and the transformation Eint,final = − < Q > −∆ H with ∆ H = −0.55 eV. While large internal
excitation is reached on an absolute scale for high collision energies the efficiency is highest for the complex-mediated
mechanism at the lowest collision energy.
luted sum of vibrational and roexternal states [Forst, 2003]:
P (Etrans, Etotal) =
dEtrans
Etotal−Etrans∫0
ρv(Etotal −Etrans − Er) ρrx(Er, Etrans) dEr
Etotal∫0
ρv(Etotal −Ert) Γrx(Ert) dErt
. (7.7)
Here ρv(E) denotes the internal vibrational and ρrx(Er, Et) the roexternal (phase-space)
density of states at the “loose” transition state corresponding to reaction products. The
phase-space density of states ρrx combines rotations Jr of the CH3Cl product molecule
itself and “external” rotations L due to angular momentum. The sum of roexternal states
is obtained by integration:
Γrx(Ert) =
Ert∫0
Et∫0
ρrx(Er, Et)dErdEt. (7.8)
The only input parameters are the vibrational states of the molecular product CH3Cl and
its rotations in the form of a geometrically averaged effective rotational constant. These
values are given in Table 7.2 as adapted from the NIST database [NIST, 2007]. The
vibrational density of states ρv(E) is then derived by a direct state counting algorithm
(Beyer-Swinehard). The roexternal density of states ρrx(Er, Et) is obtained from a suit-
able parametrization (sphere + atom) depending on Er + Et and the effective rotational
152
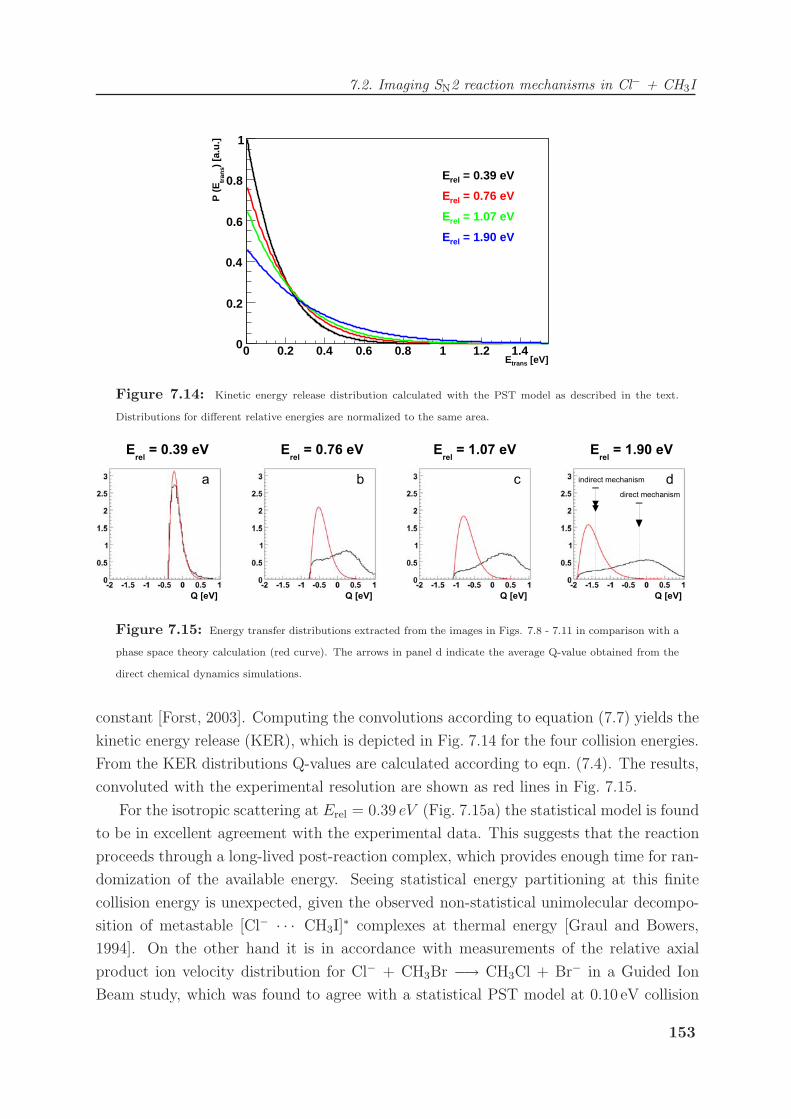
7.2. Imaging SN2 reaction mechanisms in Cl− + CH3I
[eV]transE0 0.2 0.4 0.6 0.8 1 1.2 1.4
) [a
.u.]
tran
sP
(E
0
0.2
0.4
0.6
0.8
1
= 0.39 eVrelE
= 0.76 eVrelE
= 1.07 eVrelE
= 1.90 eVrelE
Figure 7.14: Kinetic energy release distribution calculated with the PST model as described in the text.
Distributions for different relative energies are normalized to the same area.
Figure 7.15: Energy transfer distributions extracted from the images in Figs. 7.8 - 7.11 in comparison with a
phase space theory calculation (red curve). The arrows in panel d indicate the average Q-value obtained from the
direct chemical dynamics simulations.
constant [Forst, 2003]. Computing the convolutions according to equation (7.7) yields the
kinetic energy release (KER), which is depicted in Fig. 7.14 for the four collision energies.
From the KER distributions Q-values are calculated according to eqn. (7.4). The results,
convoluted with the experimental resolution are shown as red lines in Fig. 7.15.
For the isotropic scattering at Erel = 0.39 eV (Fig. 7.15a) the statistical model is found
to be in excellent agreement with the experimental data. This suggests that the reaction
proceeds through a long-lived post-reaction complex, which provides enough time for ran-
domization of the available energy. Seeing statistical energy partitioning at this finite
collision energy is unexpected, given the observed non-statistical unimolecular decompo-
sition of metastable [Cl− · · · CH3I]∗ complexes at thermal energy [Graul and Bowers,
1994]. On the other hand it is in accordance with measurements of the relative axial
product ion velocity distribution for Cl− + CH3Br −→ CH3Cl + Br− in a Guided Ion
Beam study, which was found to agree with a statistical PST model at 0.10 eV collision
153

Chapter 7. Imaging Reaction Dynamics
CH3Cl - Symmetry: C3v - Symmetry Number: σ = 3
vibrational modes
number sym. species assignment frequency [cm−1]
ν1 a1 CH3 sym. stretch 2937
ν2 a1 CH3 sym. deform 1355
ν3 a1 C-Cl stretch 732
ν4 e CH3 antisym. stretch 30391
ν5 e CH3 antisym. deform 14521
ν6 e CH3 rock 10171
rotational constants
B [cm−1] 5.097 0.443 0.443
Beff 0.994 cm−1
Table 7.2: Input Parameters for the CH3Cl molecular product as used in the PST model. Vibrational modes
are quoted from [NIST, 2007], rotational constants from [Herzberg, 1945]. 1 Modes of symmetry species e are
doubly degenerate.
energy [Angel and Ervin, 2003]. We find that at Erel = 0.39 eV 84% of the total available
energy is trapped in internal excitation of the CH3Cl reaction product, which amounts to
Eint = 0.79 eV. At all the higher relative collision energies (see Fig. 7.15 b-d) the phase
space model can not reproduce the observed dynamics. Here, the Q-value distribution
peaks near its maximum value of 0.55 eV. The mean internal excitation in absolute and in
relative numbers is given by 0.5 eV (40%), 0.45 eV (25%) and 0.95 eV (40%). At 1.07 eV
relative collision energy a minimum in the internal excitation is found both on absolute
and on relative grounds, which is a sign of subtle changes in the translation-vibration
coupling during the reaction.
To complement the above experimental study of the Cl− + CH3I reaction dynamics, a
direct dynamics trajectory simulation [Lourderaj et al., 2007] is performed by the group of
W. L. Hase at the MP2(fc)/ECP/aug-cc-pVDZ [Hase, 2007] level of theory. As shown in
Fig. 7.7, this theory gives energies for the reaction’s stationary points in good agreement
with previous values based on rate coefficient measurements [Glukhovtsev et al., 1996].
These direct dynamics simulations are “computationally expensive” and only practical at
the highest collision energies where both the reaction encounter time is short and the
reaction probability appreciable. So far first results are available for the 1.9 eV collision
energy.
Even though the reaction has no overall barrier, the simulations show a quite low
reaction probability at 1.9 eV, decreasing from 0.09, 0.03, and 0.01 as the collision impact
154
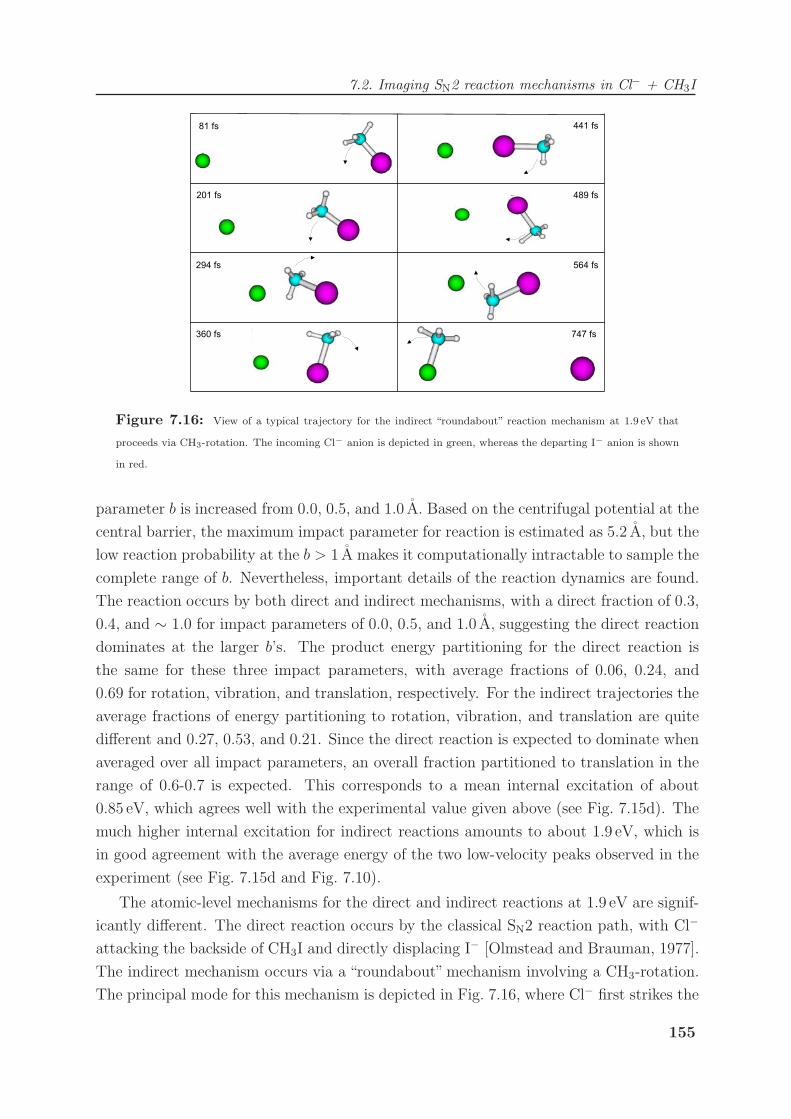
7.2. Imaging SN2 reaction mechanisms in Cl− + CH3I
Figure 7.16: View of a typical trajectory for the indirect “roundabout” reaction mechanism at 1.9 eV that
proceeds via CH3-rotation. The incoming Cl− anion is depicted in green, whereas the departing I− anion is shown
in red.
parameter b is increased from 0.0, 0.5, and 1.0 A. Based on the centrifugal potential at the
central barrier, the maximum impact parameter for reaction is estimated as 5.2 A, but the
low reaction probability at the b > 1 A makes it computationally intractable to sample the
complete range of b. Nevertheless, important details of the reaction dynamics are found.
The reaction occurs by both direct and indirect mechanisms, with a direct fraction of 0.3,
0.4, and ∼ 1.0 for impact parameters of 0.0, 0.5, and 1.0 A, suggesting the direct reaction
dominates at the larger b’s. The product energy partitioning for the direct reaction is
the same for these three impact parameters, with average fractions of 0.06, 0.24, and
0.69 for rotation, vibration, and translation, respectively. For the indirect trajectories the
average fractions of energy partitioning to rotation, vibration, and translation are quite
different and 0.27, 0.53, and 0.21. Since the direct reaction is expected to dominate when
averaged over all impact parameters, an overall fraction partitioned to translation in the
range of 0.6-0.7 is expected. This corresponds to a mean internal excitation of about
0.85 eV, which agrees well with the experimental value given above (see Fig. 7.15d). The
much higher internal excitation for indirect reactions amounts to about 1.9 eV, which is
in good agreement with the average energy of the two low-velocity peaks observed in the
experiment (see Fig. 7.15d and Fig. 7.10).
The atomic-level mechanisms for the direct and indirect reactions at 1.9 eV are signif-
icantly different. The direct reaction occurs by the classical SN2 reaction path, with Cl−
attacking the backside of CH3I and directly displacing I− [Olmstead and Brauman, 1977].
The indirect mechanism occurs via a “roundabout” mechanism involving a CH3-rotation.
The principal mode for this mechanism is depicted in Fig. 7.16, where Cl− first strikes the
155

Chapter 7. Imaging Reaction Dynamics
side of the CH3-group, causing it to rotate around the more massive I-atom. Then, after
one CH3 revolution, Cl− attacks the C-atom backside and directly displaces I−. The time
between the initial Cl−-CH3 collision and the departure of I− ranges around 400 fs. Two
additional modes, of lesser importance and with intermediate lifetimes of 1-2 ps, were also
found for the indirect mechanism. One of them is similar to above, except CH3 rotates
multiple times about the I-atom. For the other, the CH3-group first rotates about the
I-atom, followed by recrossings of the central barrier by the Cl- and I-atoms [Hase, 1994].
Some of these trajectories go back to reactants and some form products.
7.2.4 Dihalide production via chlorine rebound
By changing the delay between the pulsing of the imaging fieldplates and the time-slice
of ion detection we are sensitive to alternative reaction channels, which produce ions of
different mass. Here we study the formation of dihalides via the reaction pathway Cl−
+ CH3I −→ ICl− + CH3, which is endothermic by about 1 eV as seen from Table 7.1.
The velocity map of ICl− at a relative collision energy of 5.74 eV is depicted in Fig. 7.17
and shows pronounced backscattering of chlorine into a small spatial angle (one might
equally say that iodine is forward scattered). This points to a rebound mechanism, where
reactive trajectories require a central approach of the Cl− anion on the iodine side of
the tetrahedral CH3I molecule (halophilic attack rather than nucleophilic attack) [Angel
and Ervin, 2001; Angel and Ervin, 2004]. Bond rupture demands transfer of energy
from relative translation to the C-I bond to be broken. This is supposed to be rather
efficient due to the small vibrational spacing of the C-I stretch mode in CH3I (neglecting
anharmonicity ∆ν = 533 cm−1 (66 meV) [NIST, 2007]). The abstracted I atom is picked
up by the chlorine anion to form the product dihalide ICl− and the planar CH3. In contrast
to nucleophilic substitution via backside attack the bottleneck of CH3 group inversion is
avoided. The inserted rings display the kinematical cutoff and spheres of same product
excitation spaced at 1.0 eV intervals. Hence a total internal excitation of both molecular
products of about 3 eV is found. Dissociation of ICl− to form Cl− and I requires (1.53
± 0.13) eV as seen from Table 7.1 and the difference in the electron affinities of I and Cl
(∆EA = -0.55 eV). Since ICl− is detected this means that at least half of the total internal
energy of 3 eV has to be located in internal excitation of the CH3 product molecule.
Reaction mechanisms involving production and dissociation of ICl− as a reaction in-
termediate might also contribute to the I− velocity distributions at high relative energies.
Dissociation of ICl− to form I− and Cl requires (2.08 ± 0.13) eV (see Table 7.1). The
observation of sideways scattering residing at the kinematical cutoff for the two high-
est collision energies of 4.62 and 5.33 eV (see Fig. 7.11) means that not much energy
is available for internal excitation of the molecular product CH3. Sideways scattering
might indicate that Cl− attacks methyliodine from the side, i.e. perpendicular to the C - I
156

7.2. Imaging SN2 reaction mechanisms in Cl− + CH3I
Figure 7.17: Center-of-mass images of the ICl− reaction product velocity from the reaction of Cl− with CH3I
at a fixed relative collision energy of 5.74 eV. Entries with vx > 200 m/s have been scaled by a factor of five. The
outermost inserted ring represents the kinematical cutoff, while the other concentric rings display spheres of the
same internal product excitation, spaced at 1.0 eV intervals. The dominant channel corresponds to backscattering
of chlorine, which points to a rebound mechanism involving pickup of the I atom from CH3I. In addition a smaller
contribution from forward scattering of chlorine is observed, which might stem from abstraction of I in a more
sideways attack of the CH3I involving little momentum transfer.
157
Chapter 7. Imaging Reaction Dynamics
interatomic axis. This would break up the CH3I molecule along the C3 symmetry axis
and a highly excited [ICl∗]− collision complex could be formed, which would dissociate
rapidly on the timescale of its rotation. Regarding the small difference in electron affinity
of chlorine (3.61 eV) and iodine (3.06 eV) in some of the dissociation events the charge
might stay located at the I atom, such that iodine anions I− are produced. Such a mech-
anism for sideways scattering would explain the experimental observation of Fig. 7.11
that additional kinetic energy of the reactants does not lead to more internal excitation.
Fast abstraction by anion impact perpendicular to the C - I axis in CH3I might not couple
translational energy into vibrational excitation of the only molecular product CH3. In
contrast backscattering of the I− product by breaking the C - I bond via backside attack
of CH3I requires transfer of energy and charge through the molecule. This is likely to be
accompanied by a higher internal and translational excitation of the CH3 fragment and
by dissociation along the more endothermic reaction pathways given in Table 7.1. It coin-
cides with the experimental observation of Fig. 7.11 that for backscattered I− additional
kinetic energy of the reactants is not transferred to more translational excitation of the
produced iodine anion. Molecular dynamics calculations are required to unravel whether
the proposed mechanism exists. The noticeable peak corresponding to forward scattered
I− in Figures 7.10 and 7.11 can not be explained by dissociation of an ICl− intermedi-
ate except for the highest collision energy since it is located outside the corresponding
kinematical cutoff (white circle).
In addition to the backscattering of the chlorine anion there is also a forward scattered
contribution visible in the velocity image of ICl− depicted in Fig. 7.17. It accounts for
about 5% of the total product flux. The little momentum transfer to Cl− points to
abstraction of I in a more grazing or a sideways collision, indicating that ICl− can also be
formed in a non-rebound mechanism.
158

7.3. Competing chemical dynamics in F− + CH3I
7.3 Competing chemical dynamics in F− + CH3I
This section gives a brief overview on crossed beam imaging of three competing reaction
channels in collisions of fluorine anions with methyliodine. The system was chosen as
comparison to the reaction with chlorine anions described above since the bimolecular
nucleophilic substitution (SN2) pathway
F− + CH3I −→ CH3F + I− (∆ H = −1.84 eV) (7.9)
has almost no central barrier in the potential energy surface due to the strong nucle-
ophilicity of fluorine. This might be seen from the stationary points depicted in Fig. 7.18
as obtained from a molecular orbital calculation [Glukhovtsev et al., 1996]. The tight
binding of fluorine in the reaction product CH3F makes the reaction also very exother-
mic. A measurement of the reaction rate constant at 300 K yields a value of (1.9 ± 0.5)
× 10−9 cm−3/s [Ohair et al., 1994]. This implies a reaction efficiency of about 90% in
accordance with a low central barrier. Measurements at collision energies between 0.02
and 1 eV reveal that up to about 0.3 eV the rate coefficient is only weakly decreasing with
energy as expected from the capture rate. At higher collision energies in contrast, the
rate coefficient is found to decrease more rapidly with increasing energy [Su et al., 1990].
At the same time the internal temperature of CH3I has no influence on the reaction rate.
For the related system F− + CH3Cl, which shows a similar behaviour, detailed tra-
jectory simulations reproduce the rate coefficients and draw a picture of the reaction
mechanism [Su et al., 1998]. In the low energy regime (0.05 eV) an entrance channel com-
plex is formed, which is much longer living than the exit channel complex. This results in
isotropic scattering and a high vibrational excitation of the molecular product. For higher
collision energies (1.0 eV) the calculation shows shorter complex lifetimes and backward
scattering of the anionic product. Trajectories show reactivity only at backside attack
of the methylhalide molecule with the largest reaction probability at approach of the ion
along the C3 symmetry axis. The decreasing rate coefficient for increasing collision energy
is explained by the observation of a significant reduction of the cone of acceptance with
the collision energy while at the same time the self-orientation of the ion and the dipole
becomes less efficient. While the reaction exothermicity is preferentially partitioned to
product vibration additional relative kinetic energy of the reactants results in a larger
product translation.
Velocity maps of the I− product ion from reactive scattering of F− and CH3I are ob-
tained by slice imaging and depicted in Fig. 7.19 2. Concentric rings mark the kinematical
cutoff and spheres of same product excitation spaced at 1.0 eV intervals. For the lowest
2 The measurement was performed under identical conditions as described in the last section exceptthat the precursor CCl4 has been replaced by NF3 in the ion source.
159

Chapter 7. Imaging Reaction Dynamics
Figure 7.18: Potential energy of stationary points along the SN2 reaction F− + CH3I→ CH3F + I− as
obtained from a molecular orbital calculation [Glukhovtsev et al., 1996].
products ∆ H0 [eV]
F− + CH3I 0
I− + CH3F -1.84
I− + CH2 + HF +1.9 ± 0.1
I− + CH2F + H +2.8 ± 0.3a
I− + CH3 + F +3.0 ± 0.1
CH2I− + HF +0.6 ± 0.2b
IF− + CH3 +0.7 ± 0.3c
Table 7.3: Enthalpies of Reaction ∆H0 calculated from enthalpies of formation ∆f H0 at 0K [Lide, 2003;
NIST, 2007] for Product Channels of F− + CH3I. a calculated using the reaction enthalpy for CH3F → CH2F− +
H+ [NIST, 2007] and an estimated electron affinity of CH2F of 0.5 eV; b calculated using the reaction enthalpies
for CH3I → CH2I− + H+ and H+ + F− → HF [NIST, 2007]; c calculated using the electron affinity of iodine and
an electron affinity of IF of 2.5 eV estimated from comparison with other dihalides.
160

7.3. Competing chemical dynamics in F− + CH3I
relative collision energy of 0.32 eV small product velocities as compared to the kinemati-
cal cutoff are observed. The scattering pattern is close to isotropic pointing towards the
formation of a collision complex, which lives long on the timescale of its rotation. Since
no dissociation of the molecular product CH3F is possible for collision energies below (1.9
± 0.1) eV as seen from Table 7.3 this observation confirms the prediction of the trajectory
calculation that most of the energy is distributed to vibrational excitation. However for
increasing collision energy the maximum of the velocity distribution resides on the center
of mass demonstrating that the additional energy is not preferentially distributed to prod-
uct translation as suggested by theory for F− + CH3Cl. Backscattering of I− products is
observed but accounts only for a fraction of the flux and has no sharp velocity structure
as seen from the image at 1.53 eV collision energy in Fig. 7.19. The increasing vibrational
excitation of CH3F is remarkable considering that this should require an indirect process
which appears unlikely regarding the low intermediate barrier and the small valleys in the
potential energy surface. When the dissociative channels become energetically accessible
as indicated by the solid white circles the backscattered halo disappears. The distribution
of I− velocities stays narrow with increasing collision energies but gradually moves to for-
ward scattering. This might stem from the dissociation of intermediate IF− as described
below.
In an attempt to describe the kinetic energy release (KER) for low collision energies by
a statistical model we use the phase-space theory (PST) calculation described in the last
section. The required vibrational modes and rotational constants of CH3F are obtained
from the NIST database and compiled in Table 7.4. The calculated KER distributions
are shifted by the relative collision energy to reflect the reaction Q-value and convoluted
with the experimental resolution due to the velocity distribution of the reactant beams.
A comparison with the experimental distributions extracted from the velocity images is
shown in Fig. 7.20 for relative collision energies of 0.32 eV (left panel) and 1.53 eV (right
panel). As can be seen the experimental distribution is only qualitatively described by
the model. For both energies the products are measured to be translationally hotter than
predicted by PST.
We have also studied two alternative endothermic reaction channels at relative collision
energies between 1.2 and 12.5 eV, which compete with formation of I− products. These
are iodine abstraction
F− + CH3I −→ CH3 + IF− (∆ H = +0.7± 0.3 eV) (7.10)
and proton transfer
F− + CH3I −→ HF + ICH−2 (∆ H = +0.6± 0.2 eV). (7.11)
Velocity maps of IF− and ICH−2 product ions are shown in Figs. 7.21 and 7.22 respectively.
161

Chapter 7. Imaging Reaction Dynamics
-1500 -1000 -500 0 500 1000 1500-1500
-1000
-500
0
500
1000
1500
[m/s]xv
[m
/s]
yvE_rel = 0.32 eV N = 184 k
-1500 -1000 -500 0 500 1000 1500-1500
-1000
-500
0
500
1000
1500
[m/s]xv
[m
/s]
yv
E_rel = 0.68 eV N = 651 k
-1500 -1000 -500 0 500 1000 1500-1500
-1000
-500
0
500
1000
1500
[m/s]xv
[m
/s]
yv
E_rel = 1.53 eV N = 666 k
-1500 -1000 -500 0 500 1000 1500-1500
-1000
-500
0
500
1000
1500
[m/s]xv
[m
/s]
yv
E_rel = 2.34 eV N = 1796 k
-1500 -1000 -500 0 500 1000 1500-1500
-1000
-500
0
500
1000
1500
[m/s]xv
[m
/s]
yv
E_rel = 3.42 eV N = 708 k
-1500 -1000 -500 0 500 1000 1500-1500
-1000
-500
0
500
1000
1500
[m/s]xv
[m
/s]
yv
E_rel = 4.32 eV N = 904 k
-1500 -1000 -500 0 500 1000 1500-1500
-1000
-500
0
500
1000
1500
[m/s]xv
[m
/s]
yv
E_rel = 5.06 eV N = 1092 k
-1500 -1000 -500 0 500 1000 1500-1500
-1000
-500
0
500
1000
1500
[m/s]xv
[m
/s]
yv
E_rel = 5.62 eV N = 1043 k
Figure 7.19: Velocity maps of the I− product ion from reactive scattering of F− and CH3I as a function of
the collision energy. Dashed black rings represent the kinematical cutoff for the SN2 reaction and spheres of same
product excitation spaced at 1 eV intervals. While circles indicate the kinematical cutoff for the three dissociative
channels producing I− given in Table 7.3. The number N above each two-dimensional histogram denotes the total
number of entries, i.e. the number of detected product ions.
162

7.3. Competing chemical dynamics in F− + CH3I
CH3F - Symmetry: C3v - Symmetry Number: σ = 3
vibrational modes
number sym. species assignment frequency [cm−1]
ν1 a1 CH3 sym. stretch 2930
ν2 a1 CH3 sym. deform 1464
ν3 a1 C-F stretch 1049
ν4 e CH3 antisym. stretch 30061
ν5 e CH3 antisym. deform 14671
ν6 e CH3 rock 11821
rotational constants
B [cm−1] 5.182 0.852 0.852
Beff 1.55 cm−1
Table 7.4: Input Parameters for the CH3F molecular product as used in the PST model. Vibrational modes
and rotational constants are quoted from [NIST, 2007]. 1 Modes of symmetry species e are doubly degenerate.
Q [eV]-2 -1.5 -1 -0.5 0 0.5 1 1.5 20
0.2
0.4
0.6
0.8
1
1.2
1.4
1.6
1.8
2
Q [eV]-2 -1.5 -1 -0.5 0 0.5 1 1.5 20
0.2
0.4
0.6
0.8
1
1.2
1.4
1.6
1.8
2
Figure 7.20: Measured Q-value distributions for relative collision energies of 0.32 eV (left panel) and 1.53 eV
(right panel) and the comparison to the prediction from phase-space theory (red line).
163

Chapter 7. Imaging Reaction Dynamics
-1500 -1000 -500 0 500 1000 1500-1500
-1000
-500
0
500
1000
1500
[m/s]xv
[m
/s]
yv
E_rel = 1.19 eV N = 0 k
-1500 -1000 -500 0 500 1000 1500-1500
-1000
-500
0
500
1000
1500
[m/s]xv
[m
/s]
yv
E_rel = 1.59 eV N = 8 k
-1500 -1000 -500 0 500 1000 1500-1500
-1000
-500
0
500
1000
1500
[m/s]xv
[m
/s]
yv
E_rel = 2.09 eV N = 25 k
-1500 -1000 -500 0 500 1000 1500-1500
-1000
-500
0
500
1000
1500
[m/s]xv
[m
/s]
yv
E_rel = 2.76 eV N = 147 k
-1500 -1000 -500 0 500 1000 1500-1500
-1000
-500
0
500
1000
1500
[m/s]xv
[m
/s]
yv
E_rel = 3.44 eV N = 200 k
-1500 -1000 -500 0 500 1000 1500-1500
-1000
-500
0
500
1000
1500
[m/s]xv
[m
/s]
yv
E_rel = 4.18 eV N = 1149 k
-1500 -1000 -500 0 500 1000 1500-1500
-1000
-500
0
500
1000
1500
[m/s]xv
[m
/s]
yv
E_rel = 5.47 eV N = 713 k
-1500 -1000 -500 0 500 1000 1500-1500
-1000
-500
0
500
1000
1500
[m/s]xv
[m
/s]
yv
E_rel = 6.25 eV N = 570 k
-1500 -1000 -500 0 500 1000 1500-1500
-1000
-500
0
500
1000
1500
[m/s]xv
[m
/s]
yv
E_rel = 7.80 eV N = 341 k
-1500 -1000 -500 0 500 1000 1500-1500
-1000
-500
0
500
1000
1500
[m/s]xv
[m
/s]
yv
E_rel = 9.21 eV N = 143 k
-1500 -1000 -500 0 500 1000 1500-1500
-1000
-500
0
500
1000
1500
[m/s]xv
[m
/s]
yv
E_rel = 10.93 eV N = 103 k
-1500 -1000 -500 0 500 1000 1500-1500
-1000
-500
0
500
1000
1500
[m/s]xv
[m
/s]
yv
E_rel = 12.48 eV N = 21 k
Figure 7.21: Velocity maps of the IF− product ion from reactive scattering of F− and CH3I as a function of
the collision energy. Dashed black rings represent the kinematical cutoff for this dihalide formation and spheres of
same product excitation spaced at 1 eV intervals.
164

7.3. Competing chemical dynamics in F− + CH3I
For the lowest collision energy of 1.19 eV dihalide production (7.10) is not yet observed
while it should be energetically feasible. This does not imply that the effective barrier
is higher than the calculated reaction enthalpy of (+0.7 ± 0.3) eV (see Table 7.3) but it
means that the cross section for iodine abstraction rises slowly in this energy range, such
that we are not sensitive to this channel. In contrast proton transfer, which has a similar
calculated reaction enthalpy of (+0.6 ± 0.2) eV, is observed implicating a steeper rising
cross section. A similar observation was made in precision measurements of the absolute
reaction cross sections of competing channels in F− + CH3Cl [Angel and Ervin, 2001].
While proton transfer shows a strong initial rise of the cross section, halide abstraction
increases slowly and reaches a plateau before a second threshold is reached at a collision
energy that coincides with the CH3-Cl bond strength of 3.6 eV (see Fig. 3 in Ref. [Angel
and Ervin, 2001]). The authors postulated an impulsive rupture of this bond by collision-
induced dissociation accompanied by dihalide bond formation.
The bond strength of CH3-I is estimated from differences in formation enthalpies to be
2.6 eV [NIST, 2007]. In deed we see a striking difference in the IF− velocity maps below
and above this energy (see Fig. 7.21). For lower collision energy the fluorine is scattered
into all angles with a preference of forward scattering. This could indicate formation of
a collision complex via halophilic attack at the iodine or via nucleophilic attack at the
front side of the carbon atom (producing the complex of C3v or C1 symmetry suggested in
Ref. [Angel and Ervin, 2001]). At higher collision energies distinct backscattering of the
fluorine is observed, which points to rebound upon collinear impact along the C3 symmetry
axis of CH3I on the side of the I-atom. Collision-induced impulsive bond rupture frees the
iodine and makes it available for bond formation with fluorine to produce the detected
dihalide. As seen from Fig. 7.21 at a collision energy of 2.76 eV still both mechanisms are
possible while at higher collision energies the complex-mediated channel has died off.
While the crossed beam imaging experiment is not well suited to measure cross sections
an estimate on trends can be obtained from the event rate of product formation. The
average number of IF− ions obtained per bunch crossing increases from 0.6 at Erel =
1.59 eV to 1.3 at Erel = 2.09 eV to 6.1 at Erel = 2.76 eV to 14.3 at Erel = 3.44 eV. This
backs that a change in mechanism is introduced which accounts for the jump in reactivity.
Inspecting the position of the backward scattered peak with respect to the concentric rings
shows that the products’ internal degrees of freedom are highly excited in the reaction and
that even additional kinetic energy is preferentially transferred to more product excitation.
Excessive vibrational excitation will hence lead to dissociation of the dihalide IF−. This
causes the IF− product channel to decay off for high collision energies. This might be
seen from the event rate per bunch crossing, which is found to decrease from 9.2 at Erel =
7.8 eV to 3.4 at Erel = 9.2 eV to 1.7 at Erel = 10.9 eV to 0.8 at Erel = 12.5 eV. Dissociation
of IF− will by part render I− products, which contributes to the iodine channel (7.9) and
165

Chapter 7. Imaging Reaction Dynamics
-1500 -1000 -500 0 500 1000 1500-1500
-1000
-500
0
500
1000
1500
[m/s]xv
[m
/s]
yv
E_rel = 1.19 eV N = 47 k
-1500 -1000 -500 0 500 1000 1500-1500
-1000
-500
0
500
1000
1500
[m/s]xv
[m
/s]
yv
E_rel = 1.59 eV N = 145 k
-1500 -1000 -500 0 500 1000 1500-1500
-1000
-500
0
500
1000
1500
[m/s]xv
[m
/s]
yv
E_rel = 2.09 eV N = 168 k
-1500 -1000 -500 0 500 1000 1500-1500
-1000
-500
0
500
1000
1500
[m/s]xv
[m
/s]
yv
E_rel = 2.76 eV N = 113 k
-1500 -1000 -500 0 500 1000 1500-1500
-1000
-500
0
500
1000
1500
[m/s]xv
[m
/s]
yv
E_rel = 3.44 eV N = 169 k
-1500 -1000 -500 0 500 1000 1500-1500
-1000
-500
0
500
1000
1500
[m/s]xv
[m
/s]
yv
E_rel = 4.18 eV N = 196 k
-1500 -1000 -500 0 500 1000 1500-1500
-1000
-500
0
500
1000
1500
[m/s]xv
[m
/s]
yv
E_rel = 5.47 eV N = 226 k
-1500 -1000 -500 0 500 1000 1500-1500
-1000
-500
0
500
1000
1500
[m/s]xv
[m
/s]
yv
E_rel = 6.25 eV N = 216 k
-1500 -1000 -500 0 500 1000 1500-1500
-1000
-500
0
500
1000
1500
[m/s]xv
[m
/s]
yv
E_rel = 7.80 eV N = 147 k
-1500 -1000 -500 0 500 1000 1500-1500
-1000
-500
0
500
1000
1500
[m/s]xv
[m
/s]
yv
E_rel = 9.21 eV N = 80 k
-1500 -1000 -500 0 500 1000 1500-1500
-1000
-500
0
500
1000
1500
[m/s]xv
[m
/s]
yv
E_rel = 10.93 eV N = 106 k
-1500 -1000 -500 0 500 1000 1500-1500
-1000
-500
0
500
1000
1500
[m/s]xv
[m
/s]
yv
E_rel = 12.48 eV N = 47 k
Figure 7.22: Velocity maps of the CH2I− product ion from reactive scattering of F− and CH3I as a function
of the collision energy. Dashed black rings represent the kinematical cutoff for this proton transfer and spheres of
same product excitation spaced at 1 eV intervals.
166

7.3. Competing chemical dynamics in F− + CH3I
probably accounts for the backscattering observed for high collision energies in Fig. 7.19.
As for the reaction with chlorine anions described in the previous section also a minor
contribution of forward scattered IF− is observed in an energy window between 5.5 and
9.2 eV (see Fig. 7.21) which might be due to a more grazing collision.
Proton transfer from CH3I to F− (7.11) shows a different behaviour as seen from Fig.
7.22. The velocity maps of the CH2I− product reveal that at the lowest relative collision
energies of 1.19, 1.59 and 2.09 eV isotropic scattering dominates with most energy disposed
to product excitation. This points again to a complex-mediated reaction mechanism.
For higher collision energies the dynamics shows distinct forward scattering with low
momentum transfer. This indicates a fast and direct mechanism similar to the charge
transfer of Ar+ + N2 investigated in Section 7.1. In contrast to dihalide production
the total amount of internal excitation exhibits almost no dependence on the relative
collision energy for Erel > 4 eV and is fixed to about 2 eV. The moderate internal excitation
suggests that an additional fragmentation of reaction products is not introduced. This is
in accordance with the observation of an event rate per bunch crossing, which is kept at
a high level for increasing collision energy: 8.6 at Erel = 7.8 eV, 8.0 at Erel = 9.2 eV, 8.2
at Erel = 10.9 eV and 3.9 at Erel = 12.5 eV.
167


Chapter 8
Summary
Anion molecule reactions show a rich dynamics due to different reaction pathways on
the characteristic double well potential surface and competing reaction channels. In this
thesis we have applied a temperature variable high-order multipole radio frequency trap
and a crossed-beam imaging spectrometer to the investigation of anion interactions in the
gas phase at low energy.
The cryogenic multipole trap enables to cool molecular ions to their lowest rovibra-
tional states, as we were able to show by highly sensitive infrared action spectroscopy of
H+3 . Operating the multipole trap in a tandem time-of-flight configuration permits detec-
tion of the entire mass composition of a stored ion ensemble. Halide anions allow us to
investigate the depth of the effective trapping potential and the stability requirements for
adiabatic ion motion in oscillating fields by realizing that the storage time is ultimately
limited by ion evaporation over the effective barrier formed by the rf field. Our analyt-
ical and numerical model can readily be applied to predict the most favorable trapping
conditions of other storage devices. The effective trapping potential bottom is probed
by photodetachment tomography with a narrowly focused laser. In this way weak patch
fields can be detected, which need to be avoided since they severely disturb the favorable
trapping conditions in multipole traps. Since the lifetime of negative ions inside the trap
is very long it is an ideal tool to study anion-molecule reactions with low cross section by
adding a neutral reaction agent at a well defined density. We measure the integral cross
section of proton transfer from H2 to NH−2 between 300 and 8 Kelvin and find an inverse
temperature behaviour. This reflects the deficit of available states in the entrance channel
at low temperature, which forces the system to cross the intermediate reaction barrier. At
temperatures below 20 Kelvin a currently unexplained drop in the reaction rate coefficient
is observed, which cannot be explained by a statistical model. To further elucidate why
anion molecule reaction rates are often found to increase for decreasing temperature we
measure the lifetime of the ion-dipole complex [Cl− · · · CH3Cl] via collisional stabilisation
by a third particle. For decreasing temperature, a strong increase in the lifetime of this
169

Chapter 8. Summary
nucleophilic substitution intermediate is observed. It is likely that the longer lifetime gives
SN2 complexes more time to explore the available phase space and cross the barrier to the
reaction products.
In the second line of experiments we study anion molecule reactions at a well defined
relative energy rather than temperature in a kinematically complete way. In a novel
combination of crossed beam scattering of ions at low kinetic energy with velocity map
imaging, we are able to follow ion-molecule reaction dynamics in the scattering plane. For
the charge transfer of Ar+ to N2 we resolve the population of distinct vibrational states
in the molecular reaction product N+2 . We find indications for a scattering resonance at a
relative collision energy of 0.8 eV. The SN2 reaction Cl− + CH3I → CH3Cl + I− shows a
transition from an isotropic scattering at a relative collision energy of 0.4 eV to a direct
backward scattering of chlorine at energies between 1 and 3 eV. This is accompanied by
a change in the disposal of of energy to internal and translational degrees of freedom.
For the isotropic scattering, most of the energy is distributed to rovibrational excitation
of the CH3Cl product in excellent quantitative agreement with a statistical model. This
is a clear signature for a complex mediated reaction mechanism with complex lifetimes
longer than the rotational period. In contrast, the backward scattering comes along with
a preferred energy partitioning in product translation, pointing towards a direct mecha-
nism. An addition weak contribution from two distinct low translational energy features
symmetric around the center of mass is observed. Molecular dynamics calculations by
the group of W. L. Hase at a relative collision energy of 1.9 eV find reaction Q-values in
good agreement with the respective measurement and reveal that the low translational
energy feature is due to a new “roundabout” mechanism involving CH3 rotation. For
the strongly exoergic SN2 reaction F− + CH3I → CH3F + I− we investigate the dynam-
ics of competing reaction channels. Surprisingly, despite the low intermediate reaction
barrier high internal excitation is observed in the SN2 channel. The endoergic dihalide
channel producing IF− shows isotropic scattering for low relative collision energies and a
transition to backward scattering of fluorine at relative collision energies above the CH3-I
bond strength. This indicates that the reaction proceeds via collision induced dissociation
and subsequent bond formation on rebound. We find high internal excitation of the IF−
products and their dissociation probably accounts for the observation of backscattered I−
at higher collision energy. The endoergic proton transfer channel producing ICH−2 and
HF shows also isotropic scattering at low relative collision energy but a transition to for-
ward scattering for higher energies. The low momentum transfer and the fixed amount of
internal product excitation suggests direct proton hopping.
While we overall observe a transition from complex mediated to direct reaction mech-
anisms for increasing collision energy, high internal excitation of the products is still
possible via distinctly different pathways as the discovered “roundabout” mechanism.
170

Chapter 9
Outlook
Crossed beam imaging is a new eye to ion molecule reactions. Accompanied by precision
measurements of the reaction cross section with the complementary technique of guided
ion beams and by molecular dynamics simulations it provides detailed insight into the
reaction dynamics and its dependence on the relative collision energy. So far we are spec-
tators in the interparticle relationships. In the next step, we would like to participate in
the molecular dance and use what we have learned to manipulate the outcome of the par-
ticles interaction. Devising control schemes for quantum reaction dynamics will in turn
lead to a deeper understanding of the involved mechanisms. We follow two directions
towards a designed ion molecule scattering experiment in our lab. The first route aims
at an advanced preparation of the collision partners before the reactive encounter. This
applies to the population of specific internal states to investigate mode-selective chemistry
[Hennig and Schmatz, 2004] but also to the scattering with engineered quantum aggre-
gates. The second line of sight is an active intervention during the course of the reaction.
This means stereodynamic control by fixing the relative orientation of the reactants with
respect to each other and also the assistance of collision by distorting potential energy
surfaces inside a strong laser field [Kirchner, 2007].
Ion molecule reactions going complex
Due to their high reactivity ions are extensively used in organic chemistry synthe-
sis as reactants, intermediates, and catalysts. The original interest in gas-phase studies
of nucleophilic substitution reactions emerged from the difficulty to relate the kinetics
of the reactions in aqueous solution to intrinsic properties of the reactants. For the
halide anions, even a reversal of the reaction rate in protic solvents such as methanol
(I− >Br− >Cl− >F−) occurs for solvation in acetone [Winstein et al., 1960]. Rate coeffi-
cients of SN2 reactions in solution phase are much lower than in gas phase - in some cases
171

Chapter 9. Outlook
Figure 9.1: Sketch of the potential energy surface for a symmetric SN2 reaction in gas and solution phase.
Stronger solvation of configurations with localized charge change the characteristic double well structure into a
single barrier. Figure adapted from [Chabinyc et al., 1998].
by 20 orders of magnitude [Tanaka et al., 1976; Olmstead and Brauman, 1977]. This is
due to steric hindrance and the difference in solvation energies of ions and reaction inter-
mediates. By solvation all intermediate stages of the reaction are stabilized, but solvation
effects are stronger where the charge is localized. Therefore, the lowering of the potential
energy is largest for the reactants, less for the anion-dipole complexes and least for the
transition state. This results often in a high central barrier for solvated SN2 reactions as
schematically indicated in Fig. 9.1 [Chabinyc et al., 1998; Laerdahl and Uggerud, 2002].
Gas phase studies do not only highlight the effects introduced by the solvent, but also set
the stage to stick solvent molecules one at a time to the reaction agents, following the
path from gas to solution phase step by step [Hierl et al., 1988]. Experimental studies of
microsolvated nucleophilic substitution have focused on the effects of solvent molecules
on the reaction rate [Bohme and Raksit, 1984; Regan et al., 2002]. It was found that an
increasing number of solvent molecules progressively reduces the rate coefficient, often by
many orders of magnitude per solvation step [Viggiano et al., 1996; Ohair et al., 1994].
Solvent molecules can be “boiled off” during the reaction and competing channels such as
association, proton transfer, thermal decomposition and ligand switching can take over
[Seeley et al., 1997].
Our multipole trap provides an excellent environment to prepare and accumulate wa-
ter cluster anions. Operating the trap as ion source1 opens the perspective of reactive
1We have successfully demonstrated the feasibility of using the trap as a source for molecular ionsby an experiment at the Heavy Ion Storage Ring TSR in Heidelberg, where we studied the dissociativerecombination of state prepared H+
3 with electrons [Kreckel et al., 2005]
172

Figure 9.2: Multipole trap used as source for reactive scattering of internally cold molecular and water cluster
ions.
scattering experiments with mass-selected, internally cold molecular and microsolvated
ions as schematically indicated in Fig. 9.2. This will access the experimentally completely
unexplored effects of microsolvation on the reaction dynamics. Since small molecular ions
are cooled into their rovibrational ground state, narrow-banded laser excitation of reac-
tants becomes efficient. This enables to probe the coupling of specific internal modes
to the reaction coordinate and to reveal the microscopic dynamics of energy redistribu-
tion. The path of ions extracted from the trap intersects the neutral supersonic reactant
beam inside the imaging spectrometer at an angle of 60. Compared to the 120 of the
currently employed source for atomic ions this will further reduce the lowest attainable
relative collision energy at a given laboratory kinetic energy down to about 100 meV.
Stereodynamic control of ion molecule reaction dynamics
In the last sections stereodynamic effects were often proposed to explain the measured
angle differential cross section in collisions of atomic anions with neutral polar molecules.
While they were rationalized by the dependence of the dynamics on the relative colli-
sion energy and backed by molecular dynamics simulations the ultimate test calls for a
scattering experiment where the relative orientation of ion and dipole is locked in space
(see Fig. 9.3). Since we are observing in the lab frame and work with oriented reac-
tant beams, it is most straightforward to fix the molecular frame with respect to the lab
frame. For collisions of neutral atoms with neutral molecules stereochemistry is investi-
173

Chapter 9. Outlook
Figure 9.3: Sketch of a stereospecific scattering experiment involving Cl− and CH3I with locked relative
orientation of ion and dipole.
gated for a long time by aligning and orienting2 molecules with two different techniques.
Hexapole electrostatic fields are employed to produce a state selected beam of oriented
polar molecules which is intersected by an atomic beam at fixed angle [Brooks, 1976].
The product flux is measured as a function of the degree of orientation, which yields the
reactivity for different approach geometries. The toy system is methyl iodine-alkali scat-
tering such as Rb + CH3I → RbI + CH3 [Brooks and Jones, 1966; Beuhler et al., 1966],
where reactivity is found in a cone of acceptance around direct frontside attack of Rb at
the I end of methyl iodine and nonreactivity is observed for backside approach [Parker
et al., 1981; Parker and Bernstein, 1989]. An alternative approach is to scatter with
laser-excited molecules, where the rotational angular momentum direction is controlled
by absorption of linearly polarized light [Simpson et al., 1995; Zare, 1998]. This is effi-
cient for endothermic chemical reactions, where the formation of products is only possible
for the small fraction of vibrationally excited molecules having absorbed a photon. An
external guiding field preserves the reactant alignment up to the interaction region and
serves as local quantization axis. For the benchmark system Sr + HF(v=1, j=1,m=0)
→ SrF + H [Karny et al., 1978] it was found that for low collision energies reactivity is
enhanced by adjusting the HF bond perpendicular to the Sr approach direction while for
high collision energies impact of Sr along the HF intramolecular axis is favoured [Loesch
and Stienkemeier, 1994]. So far no experiment has been reported on scattering of ions
with aligned or oriented neutral molecules. The reported techniques are not applicable in
this respect since they employ strong electrostatic fields, which impede the transportation
of ions to the scattering volume.
In recent years a different approach has been established to fix the molecular frame to
the lab frame. Unlike the “brute force techniques” [Loesch and Remscheid, 1990] acting
on the molecules permanent dipole moment, alignment in a strong laser field relies solely
on interaction with the induced dipole moment since the molecule cannot follow the field
2For alignment a vector fixed with respect to the molecule needs to lie parallel to a particular line inthe external frame while orientation in addition requires that all vectors point in the same direction.
174

Figure 9.4: Realization of a stereospecific scattering experiment with locked relative alignment of ion and
dipole.
oscillations [Stapelfeldt and Seideman, 2003]. The oscillating electric field of the laser
creates a time-independent effective potential which aligns molecules with an asymmetric
polarizability tensor. The molecules rotations are transferred to pendular states which
make the molecule vibrate around the direction of the field. Since the effective potential
is shallow low rotational temperatures are required. Laser alignment of molecules does
not require electrostatic fields, which should make reactive scattering with ions feasible.
In addition the laser field acts on all neutrals in the molecular beam such that a high
degree of alignment is reached [Kumarappan et al., 2006]. The direction of alignment can
be changed by rotating the polarization of the laser.
We are preparing a crossed beam reactive scattering experiment involving atomic
anions and CH3I aligned in the field of an infrared YAG laser 3, schematically depicted in
Figure 9.4. By imaging the reaction products with velocity mapping not only the reactivity
as a function of the relative alignment of the reactants is probed but also changes in the
reaction dynamics become visible. Varying the depth of the effective aligning potential
it might be possible to investigate the ability of self-orientation of the ion and neutral
during the collision. In addition, reactions might be assisted by the absorption of laser
photons during their course. Since the required high field strengths are only reached in
the focus of an intense laser pulse and the alignment is lost as soon as the field is gone
the overlap of ions, neutrals and laser field in time and space represents a considerable
experimental challenge.
3S. Trippel, PhD thesis (in preparation)
175

Chapter 9. Outlook
Anion physics in multipole traps
Very briefly some possible future directions of our activities on anion interactions at
low temperature are indicated:
• For the proton transfer from H2 to NH−2 , discussed in Section 5.1, we want to eluci-
date the origin of the strongly decreasing rate coefficient at low temperatures. Most
desired is support from theory via a quantum dynamical calculation. In the experi-
ment the influence of the ion’s internal states might be probed in a measurement of
proton transfer from H2 to ND−2 and NHD−; in addition para H2 and HD might be
employed to access the nuclear spin.
• Cold multipole ion traps with their long storage times provide an ideal environ-
ment to study slow processes. Such are ion-molecule reactions with exceedingly low
rate coefficients and tunneling effects. Very interesting are rate coefficients for the
strongly suppressed symmetric SN2 reactions [Barlow et al., 1988; DeTuri et al.,
1997]. A Boltzmann-type experiment should directly yield the height of the central
reaction barrier.
• Within the last months the first three negatively charged molecules have been identi-
fied in the interstellar medium and in circumstellar shells by combining observations
with laboratory studies (see Fig. 9.5) [McCarthy et al., 2006; Cernicharo et al., 2007].
The observations show a surprisingly high anion abundance [Brunken et al., 2007;
Remijan et al., 2007] and allow to retrieve the rotational temperatures, found to
be between 10 and 40 Kelvin. Photodetachment will contribute an important loss
channel in these low-density environments. We can access absolute photodetach-
ment cross sections of molecular anions at these temperatures by tomography in the
trap.
• Conventional multipole traps have a strongly limited optical access to the trapping
volume. In a collaboration with the group of P. Woias from the Department of
Microsystems Engineering at our University in Freiburg novel multipole traps are
developed with transmissive electrodes. These chip-borne microtraps are planar
and coated on a Pyrex glass substrate. Indium tin oxide (ITO) electrodes provide
high transmission in the optical at good electrical conductivity. We have success-
fully tested a prototype planar 32pole trap achieving ion storage times of more than
10 seconds at 300 Kelvin [Debatin, 2007]. The microtrap project opens up the per-
spective to cool the ions with an ultracold buffer gas decoupled from the walls of
the trap.
176

Figure 9.5: Press Release from Harward-Smithsonian Center for Astrophysics
CfA Press ReleaseRelease No.: 2007-18 For Release: Monday, July 23, 2007
Interstellar Chemistry Gets More Complex With New Negatively-ChargedMolecule Discovery
Cambridge, MA - Astronomers using data from the National Science Foundation’s RobertC. Byrd Green Bank Telescope (GBT) have found the largest negatively-charged moleculeyet seen in space. The discovery of the third negatively-charged molecule, called an anion,in less than a year and the size of the latest anion will force a drastic revision of theoreticalmodels of interstellar chemistry, the astronomers say.
177

Appendix A
Details of the Monte Carlo
Reconstruction
Several factors broaden the detector images: on the one hand the finite velocity and an-
gular distributions of the reactant beams, which lead to an uncertainty in the relative
velocity vector, and on the other hand chromatic aberrations of the imaging system, es-
pecially due to an extended interaction volume. Information about these mechanisms is
available from complementary measurements, hence a Monte-Carlo reconstruction tech-
nique (MCR) should be able to extract more information from the detector images about
the angle-differential scattering than a “conventional” Abel inversion. More specifically,
the aim is to derive the two-dimensional distribution of the scattering angle θ and the
difference of kinetic energies ∆T from the images on the detector.
As a first step, it is necessary to calculate the transfer function of the imaging system.
The transfer function associates pairs (θ, ∆T ) with points on the detector (x, y) by a for-
ward Monte-Carlo simulation modeling the conditions we had in the experiment, especially
the measured velocity distributions of the reactant beams and the resolution of the imag-
ing system. The transfer function contains all possible scattering angles 0 ≤ θ ≤ 180
and kinetic energy differences ∆T (maximum negative value given by a standstill of the
products after the reaction, maximum positive value by a suitable cutoff) with an appro-
priate sampling. Note that the transfer function has to be calculated separately for each
collision energy. Note also that the assignment (θ, ∆T ) −→ (x, y) is not unique; therefore
the transfer function contains 50 events calculated separately for the same pair (θ, ∆T ).
With the response function, the detector image HDetector (a histogram) is reconstructed
entry by entry. In this process, another image HMCR, which is empty at first, becomes a
copy of the histogram HDetector. To do so, a large number of combinations (θ, ∆T ) (500
in our case) is chosen randomly. Of these “test events” the single event is selected, which
best completes the image HMCR in order to match it to the measured image HDetector.
The point on the detector (x, y), which is to be filled into HMCR is assigned to the chosen
179

Chapter A. Details of the Monte Carlo Reconstruction
(θ, ∆T ) using the transfer function (since this is not unique, one of the 50 events calculated
under the same conditions is picked at random). Only the (x, y) combination with the
minimum ratio q = entry in HMCR
entry in HDetectoris filled into the histogram HMCR and the corresponding
(θ, ∆T ) combination is stored in a histogram that represents the probability distribution
P (θ, ∆T ), i. e. the relative differential cross section. This procedure is repeated until all
entries in the histogram HDetector are reconstructed or until no ratio q < 1 is found among
all 500 test ions. The whole reconstruction procedure is iterated several times, where the
test events are not chosen completely randomly for the subsequent loops, but selected
according to the obtained distribution P (θ, ∆T ) of the previous iteration.
As described above, aberrations of the imaging system due to the extended interaction
volume have to be taken into account. In the forward simulation this was done by means
of Gaussian smearing of the product ion impact position on the detector. To unfold
this smearing with good convergence we improved the algorithm used in Ref. [Strasser
et al., 2002] in that not only one, but ten of the entries in the transfer function belonging
to the same combination (θ, ∆T ) are drawn randomly and an average ratio q = Σ qi
10
is calculated. This procedure is especially well suited for finding sharp structures in
the P (θ, ∆T ) distribution, which one would expect when single vibrational states are
populated in the molecular product.
An example of a reconstruction of simulated data is shown in Fig. A.1. In the upper
panel the detector image resulting from a forward simulation of delta-peaked scattering
angles θ = 0, 45, 90, 135, 180 for a Gaussian ∆T -distribution centered around zero
with a sigma of 100 meV is shown. In the case of forward and backward scattering all
azimuthal angles 0 ≤ φ ≤ 360 result in the same point on the detector, whereas for
sideways scattering the arbitrary φ angle results in ions with a wide spread of transversal
velocities in the projection plane. The lower panel shows the unfolded product ion veloci-
ties in the scattering plane derived by the MCR. The indicated ring represents zero kinetic
energy difference, as has been chosen as input for the forward simulation. The clearance
of small c.m. velocities as compared to the raw distribution in the upper panel shows
the proper Abel inversion. Sharp structures are better reproduced in the forward and
backward directions since these scattering angles require no Abel inversion. The peaks
are shifted slightly inwards, which is presently not understood, but this shift is small
compared to the relevant energy scale of the vibrational spacing in N+2 of 270 meV.
180

m/s xv-2000 -1000 0 1000 2000
m/s
yv
-2000
-1000
0
1000
2000
0
20
40
60
80
100
120
140
160
180
m/s xv-2000 -1000 0 1000 2000
m/s
yv
-2000
-1000
0
1000
2000
500
1000
1500
2000
2500
3000
3500
4000
Figure A.1: Upper panel: Monte Carlo simulation of a detector image for eight delta-peaked angle and
Gaussian energy distributions (rms width of 100 meV) of the charge transfer reaction of Ar+ + N2 at a collision
energy of 0.8 eV, reflecting the transfer function of the imaging spectrometer. Lower panel: Result of the Monte
Carlo reconstruction for the simulated detector image in the upper panel.
181


Appendix B
Time-of-flight trace correction
For efficient time-of-flight resolved ion detection we use multichannel plates (MCPs) in
Chevron configuration to convert ions into bunches of electrons. As usual the electrons are
collected on an anode, which is biased on a small attractive potential with respect to the
backside of the Chevron stack. As depicted in Fig.B.1, a capacitance is used to decouple
the AC current signals I(t) arising from impact of ion packages from the DC potential of
the anode, such that ions of different mass can be finally detected with an oscilloscope
as voltage peaks U(t) across a 50 Ω resistor. Since this arrangement represent a high-
pass filter, long ion bunches result in oscilloscope traces U(t) comprising overshoots. An
analytic correction to the measured traces U(t) may be applied to uncover the original
signal I(t). This correction is especially helpful, if an additional commercial amplifier
with fixed RC filter at the input stage is used.
Figure B.1: Configuration of the MCP.
According to Kirchhoff’s rule at each knot of the circuit the sum of all currents has
to vanish. Hence the following equations hold for point 1 and 2 of the circuit depicted in
Fig.B.1:
+VCC − U1
R1+ I(t)− C
d
dt(U1 − U) = 0 (B.1)
183

Chapter B. Time-of-flight trace correction
− U
R2+ C
d
dt(U1 − U) = 0. (B.2)
U1(t) is eliminated by adding up equation (B.1) and (B.2) to yield:
I(t) = U(t)
(1
R2+
1
R1
)− 1
R1R2C
∫ t
0
U(t′)dt′. (B.3)
Additional knots i in the circuit due to additional RC elements are treated in a straight-
forward manner by setting up the corresponding differential equations and gradually elim-
inating all Ui.
184

Bibliography
[Adams and Smith, 1981] N. G. Adams and D. Smith. The Rate Coefficients for Several
Ternary Association Reactions at Thermal Energies. Chemical Physics Letters 79,
563 (1981)
[Adams and Smith, 1987] N. G. Adams and D. Smith. SIFDT Studies of some CH+3 Ternary
Association Reactions. International Journal Of Mass Spectrometry And Ion Pro-
cesses 81, 273 (1987)
[Alajajian et al., 1988] S. H. Alajajian, M. T. Bernius, and A. Chutjian. Electron-
attachment lineshapes, cross-sections and rate constants at ultra-low energies in sev-
eral halomethyl and haloethyl molecules. Journal of Physics B 21, 4021 (1988)
[Alexander et al., 2002] M. H. Alexander, G. Capecchi, and H. J. Werner. Theoretical study
of the validity of the Born-Oppenheimer approximation in the Cl + H2 → HCl + H
reaction. Science 296, 715 (2002)
[Alexander et al., 1988] M. L. Alexander, N. E. Levinger, M. A. Johnson, D. Ray, and
W. C. Lineberger. Recombination of Br−2 photodissociated within mass selected ionic
clusters. J. Chem. Phys. 88, 6200 (1988)
[Amaldi and Kraft, 2005] U. Amaldi and G. Kraft. Radiotherapy with beams of carbon ions.
Reports On Progress In Physics 68, 1861 (2005)
[Andersen et al., 2004] J. U. Andersen, H. Cederquist, J. S. Forster, B. A. Huber,
P. Hvelplund, J. Jensen, B. Liu, B. Manil, L. Maunoury, S. Brøndsted Nielsen, U. V.
Pedersen, J. Rangama, H. T. Schmidt, S. Tomita, and H. Zettergren. Photodissoci-
ation of protonated amino acids and peptides in an ion storage ring. Determination
of Arrhenius parameters in the high-temperature limit. Physical Chemistry Chemical
Physics 6, 2676 (2004)
[Angel and Ervin, 2001] L. A. Angel and K. M. Ervin. Dynamics of the gas-phase reactions
of fluoride ions with chloromethane. Journal of Physical Chemistry A 105, 4042
(2001)
185
BIBLIOGRAPHY
[Angel and Ervin, 2003] L. A. Angel and K. M. Ervin. Gas-Phase SN2 and Bromine Ab-
straction Reactions of Chloride Ion with Bromomethane: Reaction Cross Sections
and Energy Disposal into Products. Journal of the American Chemical Society 125,
1014 (2003)
[Angel and Ervin, 2004] L. A. Angel and K. M. Ervin. Gas-phase reactions of the iodide ion
with chloromethane and bromomethane: Competition between nucleophilic displace-
ment and halogen abstraction. Journal of Physical Chemistry A 108, 9827 (2004)
[Arnold and Viggiano, 1997] S. T. Arnold and A. A. Viggiano. Effect of ion hydration in the
gas-phase proton-transfer reaction of OH− with HBr. Journal of Physical Chemistry
A 101, 2859 (1997)
[Ashfold et al., 2006] M. N. R. Ashfold, N. H. Nahler, A. J. Orr-Ewing, O. P. J. Vieuxmaire,
R. L. Toomes, T. N. Kitsopoulos, I. A. Garcia, D. A. Chestakov, S. M. Wu, and D. H.
Parker. Imaging the dynamics of gas phase reactions. Physical Chemistry Chemical
Physics 8, 26 (2006)
[Asmis et al., 2003] K. R. Asmis, N. L. Pivonka, G. Santambrogio, M. Brummer, C. Ka-
posta, D. M. Neumark, and L. Woste. Gas-Phase Infrared Spectrum of the Protonated
Water Dimer. Science 299, 1375 (2003)
[Asvany et al., 2005a] O. Asvany, T. Giesen, B. Redlich, and S. Schlemmer. Experimental
Determination of the ν5 Cis-Bending Vibrational Frequency and Renner-Teller Struc-
ture in Ground State (X2 Πu) C2H+2 Using Laser Induced Reactions. Phys. Rev. Lett.
94, 073001 (2005a)
[Asvany et al., 2007] O. Asvany, E. Hugo, F. Muller, F. Kuhnemann, S. S. an J. Tennyson,
and S. Schlemmer. Overtone spectroscopy of H2D+ and D2H
+ using laser induced
reactions. J. Chem. Phys. 127, 154317 (2007)
[Asvany et al., 2005b] O. Asvany, P. Kumar, B. Redlich, I. Hegemann, S. Schlemmer, and
D. Marx. Understanding the Infrared Spectrum of Bare CH+5 . Science 309, 1219
(2005b)
[Barlow et al., 1988] S. E. Barlow, J. M. Vandoren, and V. M. Bierbaum. The Gas-
Phase Displacement Reaction of Chloride-Ion with Methyl-Chloride as a Function
of Kinetic-Energy. Journal of the American Chemical Society 110, 7240 (1988)
[Bass and Jennings, 1984] L. M. Bass and K. R. Jennings. Application of Statistical Phase-
Space Theory to some Termolecular Association Reactions of CH+3 and CD+
3 Ions.
International Journal Of Mass Spectrometry And Ion Processes 58, 307 (1984)
186
BIBLIOGRAPHY
[Bates, 1979] D. R. Bates. Ion-Molecule Association. Journal Of Physics B 12, 4135 (1979)
[Bedford and Smith, 1990] D. K. Bedford and D. Smith. Variable-temperature selected ion
flow tube studies of the reactions of Ar+, Ar+2 and ArH+
n (n = 1-3) ions with H2,
HD and D2 at 300K and 80K. International Journal of Mass Spectrometry and Ion
Processes 98, 179 (1990)
[Belikov et al., 1998] A. E. Belikov, M. M. Ahern, and M. A. Smith. REMPI spectroscopy
of internal state populations in HBr + Ar free jets: Rotational relaxation of HBr.
Chemical Physics 234, 195 (1998)
[Berhane, 2006] R. Berhane. Anion-Molekul-Reaktionen und Photodetachment in einer 22-
Pol-Ionenfalle. Diplomarbeit, Universitat Freiburg (2006)
[Berzinsh et al., 1995] U. Berzinsh, M. Gustafsson, D. Hanstorp, A. Klinkmuller, U. Ljung-
blad, and A.-M. Martensson-Pendrill. Isotope shift in the electron affinity of chlorine.
Phys. Rev. A 231, 51 (1995)
[Betowski et al., 1975] D. Betowski, J. Payzant, G. Mackay, and D. Bohme. Rate Coeffi-
cients at 297K for Proton Transfer Reacions with H2O. Comparison with Classical
Theories and Exothermicity. Chem. Phys. Lett. 31, 321 (1975)
[Beuhler et al., 1966] R. J. Beuhler, R. B. Bernstein, and K. H. Kramer. Observation of
reactive asymmetry of methyl iodide. Crossed beam study of reaction of rubidium with
oriented methyl iodide molecules. Journal of The American Chemical Society 88, 5331
(1966)
[Birkinshaw et al., 1987] K. Birkinshaw, A. Shukla, S. L. Howard, and J. H. Futrell. A
crossed-beam study of the reactive and unreactive scattering of Ar+ (2P3/2) and
Ar+ (2P1/2) by N2 at low energies. Chem. Phys. 113, 149 (1987)
[Bohme et al., 1973] D. Bohme, R. Hemsworth, and H. Rundle. Chemical Equilibrium of
NH−2 + H2 H− + NH3 and the Determination of D00(NH2 − H)∗. J. Chem. Phys.
59, 77 (1973)
[Bohme, 2000] D. K. Bohme. Experimental studies of positive ion chemistry with flow-tube
mass spectrometry: birth, evolution, and achievements in the 20th century. Interna-
tional Journal of Mass Spectrometry 200, 97 (2000)
[Bohme and Raksit, 1984] D. K. Bohme and A. B. Raksit. Gas-Phase Measurements of
the Influence of Stepwise Solvation on the Kinetics of Nucleophilic Displacement Re-
actions with CH3Cl and CH3Br at Room-Temperature. Journal of the American
Chemical Society 106, 3447 (1984)
187

BIBLIOGRAPHY
[Boudaiffa et al., 2000] B. Boudaiffa, P. Cloutier, D. Hunting, M. A. Huels, and L. Sanche.
Resonant formation of DNA strand breaks by low-energy (3 to 20 eV) electrons.
Science 287, 1658 (2000)
[Boyarkin et al., 2006] O. V. Boyarkin, S. R. Mercier, A. Kamariotis, and T. R. Rizzo.
Electronic Spectroscopy of Cold, Protonated Tryptophan and Tyrosine. J. Am. Chem.
Soc. 128, 2816 (2006)
[Brooks, 1976] P. R. Brooks. Reactions of oriented molecules. Science 193, 11 (1976)
[Brooks and Jones, 1966] P. R. Brooks and E. M. Jones. Reactive scattering of K atoms
from oriented CH3I molecules. Journal of Chemical Physics 45, 3449 (1966)
[Brunken et al., 2007] S. Brunken, H. Gupta, C. A. Gottlieb, M. C. McCarthy, and P. Thad-
deus. Detection of the Carbon Chain Negative Ion C8H− in TMC-1. Astrophys. J.
664, L43 (2007)
[Busch and Wilson, 1972] G. E. Busch and K. R. Wilson. Triatomic photofragment spectra.
2. Angular-distributions from no2 photodissociation. Journal of Chemical Physics 56,
3638 (1972)
[Caldwell and Kebarle, 1985] G. Caldwell and P. Kebarle. The Hydrogen-Bond Energies
of the Bihalide ions XHX− and YHX−. Canadian Journal Of Chemistry 63, 1399
(1985)
[Campargue, 2001] R. Campargue. Atomic and Molecular Beams. Springer Verlag,
Berlin/Heidelberg (2001)
[Candori et al., 2001] R. Candori, S. Cavalli, F. Pirani, A. Volpi, D. Cappelletti, P. Tosi,
and D. Bassi. Structure and charge transfer dynamics of the (Ar-N2)+ molecular
cluster. J. Chem. Phys. 115, 8888 (2001)
[Carpenter and Farrar, 1997a] M. A. Carpenter and J. M. Farrar. Vibrational state-resolved
study of the O− + D2 reaction: Direct dynamics from 0.47 to 1.20 eV. Journal of
Physical Chemistry A 101, 6870 (1997a)
[Carpenter and Farrar, 1997b] M. A. Carpenter and J. M. Farrar. Vibrational state-resolved
study of the O− + D2 reaction: Low-energy dynamics from 0.25 to 0.37 eV. Journal
of Physical Chemistry A 101, 6475 (1997b)
[Casavecchia, 2000] P. Casavecchia. Chemical reaction dynamics with molecular beams.
Reports on Progress In Physics 63, 355 (2000)
188

BIBLIOGRAPHY
[Cernicharo et al., 2007] J. Cernicharo, M. Guelin, M. Agundez, K. Kawaguchi, M. C. Mc-
Carthy, and P. Thaddeus. Astronomical detection of C4H−, the second interstellar
anion. Astron. Astrophys. 476, L37 (2007)
[Cetina et al., 2007] M. Cetina, A. Grier, J. Campbell, I. Chuang, and V. Vuletic.
arXiv:physic/0702025 (2007)
[Chabinyc et al., 1998] M. L. Chabinyc, S. L. Craig, C. K. Regan, and J. I. Brauman. Gas-
Phase Ionic Reactions: Dynamics and Mechanism of Nucleophilic Displacements.
Science 279, 1882 (1998)
[Chandler and Houston, 1987] D. W. Chandler and P. L. Houston. Two-dimensional imag-
ing of state-selected photodissociation products detected by multiphoton ionization.
Journal of Chemical Physics 87, 1445 (1987)
[Che et al., 2007] L. Che, Z. F. Ren, X. G. Wang, W. R. Dong, D. X. Dai, X. Y. Wang,
D. H. Zhang, X. M. Yang, L. S. Sheng, G. L. Li, H. J. Werner, F. Lique, and M. H.
Alexander. Breakdown of the Born-Oppenheimer approximation in the F + o-D2 →DF + D reaction. Science 317, 1061 (2007)
[Cheon et al., 2006] S. Cheon, K. Song, and W. L. Hase. Central barrier recrossing dynamics
of the Cl− + CD3Cl SN2 reaction. Journal of Molecular Structure - Theochem 771,
27 (2006)
[Cho et al., 1992] Y. J. Cho, S. R. Vandelinde, L. Zhu, and W. L. Hase. Trajectory studies
of SN2 nucleophilic-substitution. 2. Nonstatistical central barrier recrossing in the Cl−
+ CH3Cl system. Journal of Chemical Physics 96, 8275 (1992)
[Chu et al., 1986] S. Chu, J. E. Bjorkholm, A. Ashkin, and A. Cable. Experimental-
observation of optically trapped atoms. Physical Review Letters 57, 314 (1986)
[Church, 1988] D. A. Church. Stored-ion collisional relaxation to equilibrium. Phys. Rev. A
37, 277 (1988)
[Clary, 1998] D. C. Clary. Quantum theory of chemical reaction dynamics. Science 279,
1879 (1998)
[Clary and Palma, 1997] D. C. Clary and J. Palma. Quantum Dynamics of the Walden
Inversion Reaction Cl− + CH3Cl → ClCH3 + Cl−. Journal of Chemical Physics
106, 575 (1997)
[Cornell et al., 1991] E. A. Cornell, C. Monroe, and C. E. Wieman. Multiply loaded, ac
magnetic trap for neutral atoms. Physical Review Letters 67, 2439 (1991)
189

BIBLIOGRAPHY
[Craig and Brauman, 1997] S. L. Craig and J. I. Brauman. Phase-shifting acceleration of
ions in an ion cyclotron resonance spectrometer: Kinetic energy distribution and
reaction dynamics. Journal of Physical Chemistry A 101, 4745 (1997)
[Cremer and Kraka, 1986] D. Cremer and E. Kraka. Theoretical Detrmination of Molecular
Structure and Conformation. 17. On the Existence of FH−2 , OH−3 , NH−4 and CH−5 in
the Gas Phase. J. Phys. Chem. 90, 33 (1986)
[Cyr et al., 1995] D. M. Cyr, M. G. Scarton, K. B. Wiberg, M. A. Johnson, S. Nonose,
J. Hirokawa, H. Tanaka, T. Kondow, R. A. Morris, and A. A. Viggiano. Observation
the XY− abstraction products in the reactions X− + RY→ XY− + R - an alternative
to the SN2 mechanism at suprathermal collision energies. Journal of The American
Chemical Society 117, 1828 (1995)
[Daly, 1960] N. R. Daly. Scintillation type mass spectrometer ion detector. Review of
Scientific Instruments 31, 264 (1960)
[Davis et al., 1995a] K. B. Davis, M. O. Mewes, M. R. Andrews, N. J. Vandruten, D. S.
Durfee, D. M. Kurn, and W. Ketterle. Bose-Einstein Condensation in a Gas of
Sodium Atoms. Physical Review Letters 75, 3969 (1995a)
[Davis et al., 1995b] K. B. Davis, M. O. Mewes, and W. Ketterle. An analytical model for
evaporative cooling of atoms. Applied Physics B - Lasers and Optics 60, 155 (1995b)
[Debatin, 2007] M. Debatin. Diplomarbeit, Universitat Freiburg (in preparation) (2007)
[Dehmelt, 1967] H. G. Dehmelt. Radiofrequency spectroscopy of stored ions I: Storage. Adv.
At. Mol. Phys. 3, 53 (1967)
[Deng et al., 1994] L. Q. Deng, V. Branchadell, and T. Ziegler. Potential-Energy Surfaces
of the Gas-Phase SN2 Reactions X− + CH3X → XCH3 + X− (X=F, Cl, Br, I) - a
Comparative Study by Density-Functional Theory and Ab-Initio Methods. Journal of
the American Chemical Society 116, 10645 (1994)
[Depuy and Bierbaum, 1981] C. H. Depuy and V. M. Bierbaum. Gas-phase reactions of
organic-anions as studied by the flowing afterglow technique. Accounts of Chemical
Research 14, 146 (1981)
[DeTuri et al., 1997] V. F. DeTuri, P. A. Hintz, and K. M. Ervin. Translational Acti-
vation of the SN2 Nucleophilic Displacement Reactions Cl− + CH3Cl(CD3Cl) →ClCH3(ClCD3) + Cl−: A Guided Ion Beam Study. Journal of Physical Chemistry A
101, 5969 (1997)
190

BIBLIOGRAPHY
[Dopfer, 2003] O. Dopfer. Spectroscopic and Theoretical Studies of CH+3 -Rgn clusters (Rg
= He, Ne, Ar): from weak intermolecular forces to chemical reaction mechanisms.
International Reviews In Physical Chemistry 22, 437 (2003)
[Dougherty et al., 1974] R. C. Dougherty, J. Dalton, and J. D. Roberts. SN2 Reactions in
the Gas Phase. Structure of the Transition State”. Org. Mass Spectrom. 8, 77 (1974)
[Dzhonson et al., 2007] A. Dzhonson, E. B. Jochnowitz, and J. P. Maier. Electronic gas-
phase spectra of larger polyacetylene cations. Journal Of Physical Chemistry A 111,
1887 (2007)
[Earnshaw, 1842] S. Earnshaw. On the nature of the molecular forces which regulate the
constitution of the luminiferous ether. Trans. Cambridge Philos. Soc. 7, 97 (1842)
[Eichhorn, 2007] C. Eichhorn. Abbildung von Anionen-Molekul-SN2-Reaktionen und von
Photodissoziation in starken Laserfeldern. Diplomarbeit, Universitat Freiburg (2007)
[Eisenbarth, 2001] U. Eisenbarth. Laser cooling of fast stored ion beams to extreme phase-
space densities. PhD thesis, University of Heidelberg (2001)
[Elioff et al., 2004] M. S. Elioff, J. J. Valentini, and D. W. Chandler. Formation of
NO(j′=7.5) molecules with sub-kelvin translational energy via molecular beam col-
lisions with argon using the technique of molecular cooling by inelastic collisional
energy-transfer. European Physical Journal D 31, 385 (2004)
[Engel et al., 2007] G. S. Engel, T. R. Calhoun, E. L. Read, T. K. Ahn, T. Mancal, Y. C.
Cheng, R. E. Blankenship, and G. R. Fleming. Evidence for wavelike energy transfer
through quantum coherence in photosynthetic systems. Nature 446, 782 (2007)
[Enloe, 1994] C. L. Enloe. High-resolution retarding potential analyzer. Rev. Sci. Instrum.
65, 507 (1994)
[Eppink and Parker, 1997] A. T. J. B. Eppink and D. H. Parker. Velocity map imaging
of ions and electrons using electrostatic lenses: Application in photoelectron and
photofragment ion imaging of molecular oxygen. Review Of Scientific Instruments
68, 3477 (1997)
[Eppink and Parker, 1998] A. T. J. B. Eppink and D. H. Parker. Methyl iodide A-band
decomposition study by photofragment velocity imaging. Journal of Chemical Physics
109, 4758 (1998)
[Eppink and Parker, 1999] A. T. J. B. Eppink and D. H. Parker. Energy partitioning fol-
lowing photodissociation of methyl iodide in the A band: A velocity mapping study.
Journal of Chemical Physics 110, 832 (1999)
191

BIBLIOGRAPHY
[Erdman and Zipf, 1982] P. W. Erdman and E. C. Zipf. Low-voltage, high-current electron
gun. Rev. Sci. Instrum. 53, 225 (1982)
[Ervin, 1999] K. M. Ervin. Orientational Effects in the Direct Cl− + CH3Cl SN2 Reaction
at Elevated Collision Energies: Hard-Ovoid Line-of-Centers Collision Model. Inter-
national Journal of Mass Spectrometry 187, 343 (1999)
[Farneth and Brauman, 1976] W. E. Farneth and J. I. Brauman. Dynamics of proton-
transfer involving delocalized negative-ions in gas-phase. Journal of the American
Chemical Society 98, 7891 (1976)
[Ferguson, 1975] E. E. Ferguson. Ion-molecule reactions. Annual Review of Physical Chem-
istry 26, 17 (1975)
[Feuerstein, 2004]B. Feuerstein. priv. communication (2004)
[Forst, 2003] W. Forst. Unimolecular Reactions. Cambridge University Press, Cambridge
(UK) (2003)
[Frieden, 1975]B. R. Frieden. vol. 6 p. 177. Springer-Verlag, Berlin (1975)
[Friedman et al., 1982] M. H. Friedman, A. L. Yergey, and J. E. Campana. Fundamentals
of ion motion in electric radio-frequency multipole fields. J. Phys. E.: Sci. Instrum.
15, 53 (1982)
[Fruhling, 2005] U. Fruhling. Ein neues Spektrometer zur winkelaufgelA¶sten Abbildung
reaktiver Streuung von Anionen mit kalten Molekulen. Diplomarbeit, Universitat
Freiburg (2005)
[Futrell, 1992] J. H. Futrell. Crossed-molecular beam studies of state-to-state reaction dy-
namics. Adv. Chem. Phys. LXXXII, 501 (1992)
[Gaussian03, 2007] Gaussian03. Molecular Structure Software. Wallingford, CT (USA)
(2007)
[Gebhardt et al., 2001] C. R. Gebhardt, T. P. Rakitzis, P. C. Samartzis, V. Ladopoulos,
and T. N. Kitsopoulos. Slice imaging: A new approach to ion imaging and velocity
mapping. Review of Scientific Instruments 72, 3848 (2001)
[Gerlich, 1992] D. Gerlich. Inhomogeneous RF Fields: A versatile tool for the study of
Processes with slow ions. Adv. Chem. Phys. LXXXII, 1 (1992)
[Gerlich, 1995] D. Gerlich. Experimental Investigations of Ion-Molecule Reactions Relevant
to Interstellar Chemistry. Phys. Scr. T59, 256 (1995)
192

BIBLIOGRAPHY
[Gerlich and Horning, 1992] D. Gerlich and S. Horning. Experimental investigations of ra-
diative association processes as related to interstellar chemistry. Chemical Reviews
92, 1509 (1992)
[Gerlich et al., 2003]D. Gerlich, G. Jerke, U. Muck, and U. Person. Schnelles Ventil zur Erzeu-
gung sehr kurzer Gasimpulse (2003). Priv. communication
[Gerlich and Smith, 2006] D. Gerlich and M. Smith. Laboratory astrochemistry: studying
molecules under inter- and circumstellar conditions. Phys. Scr. 73, C25 (2006)
[Glenewinkel-Meyer and Gerlich, 1997] T. Glenewinkel-Meyer and D. Gerlich. Single and
merged beam studies of the reaction H+2 (v=0,1;j=0,4) + H2 → H+
3 + H. Israel Journal
of Chemistry 37, 343 (1997)
[Glosık et al., 2006] J. Glosık, P. Hlavenka, R. Plasil, F. Windisch, D. Gerlich, A. Wolf, and
H. Kreckel. Action spectroscopy of H+3 and D2H
+ using overtone excitation. Phil.
Trans. R. Soc. A 364, 2931 (2006)
[Glosık et al., 1995] J. Glosık, P. Zakouril, and W. Lindinger. Selected-Ion Flow Drift-Tube
Studies of the Reaction of Si+(p-2) with C2H4 - Observation of the Ternary Reaction
with 2 Channels - Collisional Stabilization and Collisional Dissociation. International
Journal of Mass Spectrometry and Ion Processes 145, 155 (1995)
[Glukhovtsev et al., 1996] M. N. Glukhovtsev, A. Pross, H. B. Schlegel, R. D. Bach, and
L. Radom. Gas-Phase Identity SN2 Reactions of Halide Anions and Methyl Halides
with Retention of Configuration. Journal of the American Chemical Society 118,
11258 (1996)
[Goldfarb et al., 2004] F. Goldfarb, C. Drag, W. Chaibi, S. Kroger, C. Blondel, and C. Del-
sart. Photodetachment microscopy of the P, Q, and R branches of the OH−(v = 0) to
OH(v = 0) detachment threshold. Journal of Chemical Physics 122, 014308 (2004)
[Gosh, 1995] P. K. Gosh. Ion traps. Clarendon Press, Oxford (1995)
[Graul and Bowers, 1994] S. T. Graul and M. T. Bowers. Vibrational-Excitation in Products
of Nucleophilic Substitution - the Dissociation of Metastable X− CH3Y in the Gas-
Phase. Journal of the American Chemical Society 116, 3875 (1994)
[Graul et al., 1998] S. T. Graul, C. J. Carpenter, J. E. Bushnell, P. A. M. van Koppen, and
M. T. Bowers. Internal Excitation in the Products of Nucleophilic Substitution from
the Dissociation of Metastable Ion Complexes. Journal of the American Chemical
Society 120, 6785 (1998)
193

BIBLIOGRAPHY
[Grimm et al., 2000] R. Grimm, M. Weidemuller, and Y. B. Ovchinnikov. Optical dipole
traps for neutral atoms. Advances In Atomic Molecular, And Optical Physics, Vol.
42 42, 95 (2000)
[Gronert et al., 1991] S. Gronert, C. H. DePuy, and V. M. Bierbaum. Deuterium-isotope
effects in gas-phase reactions of alkyl-halides - distinguishing E2 and SN2 pathways.
Journal of The American Chemical Society 113, 4009 (1991)
[Haegg and Szabo, 1986a] C. Haegg and I. Szabo. New Ion-Optical Devices utilizing oscil-
latory electric fields. II. Stability of ion motion in a two-dimensional hexapole field.
Int. J. Mass Spectr. 73, 237 (1986a)
[Haegg and Szabo, 1986b] C. Haegg and I. Szabo. New Ion-Optical Devices utilizing oscil-
latory electric fields. III. Stability of ion motion in a two-dimensional octupole field.
Int. J. Mass Spectr. 73, 277 (1986b)
[Hase, 1994] W. L. Hase. Simulations of Gas-Phase Chemical Reactions - Applications to
SN2 Nucleophilic-Substitution. Science 266, 998 (1994)
[Hase, 2007]W. L. Hase (2007). The aug-cc-pVDZ basis set was used for the C, H, and Cl
atoms. For iodine, the Wadt and Hay effective core potential was used for the core
electrons and an uncontracted 3s,3p basis set for the valence electrons [W. R. Wadt
and P.J. Hay, J. Chem. Phys. 82, 284 (1985)]. This iodine basis was augmented by a
d-polarization function with a 0.262 exponent, and s, p, and d diffuse functions with
exponents of 0.034, 0.039, and 0.0873, respectively [W.-P. Hu and D. G. Truhlar, J.
Phys. Chem. 98, 1049 (1994)]. This basis is denoted as ECP/aug-cc-pVDZ in the
text.
[Hawley and Smith, 1991] M. Hawley and M. A. Smith. Gas-phase collisional quenching of
NO+(v=1) ions below 5K. Journal of Chemical Physics 95, 8662 (1991)
[Hawley and Smith, 1992] M. Hawley and M. A. Smith. The gas-phase reaction of C2H+2
with H+2 below 3K - the reopening of the bimolecular C2H
+3 channel at low-energy.
Journal of Chemical Physics 96, 1121 (1992)
[Heck and Chandler, 1995] A. J. R. Heck and D. W. Chandler. Imaging techniques for the
study of chemical reaction dynamics. Annu. Rev. Phys. Chem. 46, 335 (1995)
[Hennig et al., 2006] C. Hennig, R. B. Oswald, and S. Schmatz. Secondary Kinetic Isotope
Effect in Nucleophilic Substitution: A Quantum-Mechanical Approach. Journal of
Physical Chemistry A 110, 3071 (2006)
194

BIBLIOGRAPHY
[Hennig and Schmatz, 2004] C. Hennig and S. Schmatz. State-selected dynamics of the
complex-forming bimolecular reaction Cl− + CH3Cl → ClCH3 + Cl−: A four-
dimensional quantum scattering study. Journal of Chemical Physics 121, 220 (2004)
[Hennig and Schmatz, 2005] C. Hennig and S. Schmatz. Four-Dimensional Quantum Study
on Exothermic Complex-Forming Reactions: Cl− + CH3Br→ ClCH3 + Br−. Journal
of Chemical Physics 122, 234307 (2005)
[Herbst, 1979] E. Herbst. Statistical-Theory of 3-Body Ion-Molecule Reactions. Journal of
Chemical Physics 70, 2201 (1979)
[Herbst, 1982] E. Herbst. Intermediate Coupling Approach to the Collisional Stabiliza-
tion Step in Ternary Ion-Molecule Association Reactions. Chemical Physics 68, 323
(1982)
[Herman, 2001] Z. Herman. The crossed-beam scattering method in studies of ion-molecule
reaction dynamics. International Journal of Mass Spectrometry 212, 413 (2001)
[Hernandez et al., 1999] M. I. Hernandez, J. Campos-Martinez, P. Villarreal, S. Schmatz,
and D. C. Clary. Quantum-mechanical study of the resonances of the SN2 reaction
Cl− + CH3Cl→ CH3Cl + Cl−. Physical Chemistry Chemical Physics 1, 1197 (1999)
[Herzberg, 1945] G. Herzberg. Molecular Spectra and Molecular Structure. van Nostrand
Reinhold Company, New York (1945)
[Hierl et al., 1988] P. M. Hierl, A. F. Ahrens, M. J. Henchman, A. A. Viggiano, J. F.
Paulson, and D. C. Clary. Chemistry as a Function of Solvation Number - Solvated-
Ion Reactions in the Gas-Phase and Comparison with Solution. Faraday Discussions
85, 37 (1988)
[Hu and Truhlar, 1995] W. P. Hu and D. G. Truhlar. Deuterium kinetic isotope effects and
their temperature-dependence in the gas-phase SN2 reactions X− + CH3Y → CH3X
+ Y− (X,Y = Cl, Br, I). Journal of The American Chemical Society 117, 10726
(1995)
[Huewel et al., 1984] L. Huewel, D. R. Guyer, G. H. Lin, and S. R. Leone. Laser induced
fluorescence measurement of nascent vibrational and rotational product state distri-
butions in the charge transfer of Ar+ + N2 → Ar + N+2 (v=0,1) at 0.2 eV. J. Chem.
Phys. 82, 3520 (1984)
[Jones and Anderson, 2000] R. M. Jones and S. L. Anderson. Simplified radio-frequency
generator for driving ion guides, traps, and other capacitive loads. Rev. Sci. Instr.
71, 4335 (2000)
195

BIBLIOGRAPHY
[Kaiser, 2006] S. Kaiser. Aufbau des Demonstrationsexperiments eines rotierenden Sattels
als mechanisches Modell einer Paulfalle. Staatsexamensarbeit, Universitat Freiburg
(2006)
[Kandel et al., 2006] E. R. Kandel, J. H. Schwartz, and T. M. Jessell. Principles of Neural
Science. McGraw-Hill, New York (2006)
[Kapitza, 1951] P. L. Kapitza. Zn. Eksperim. i. Teor. Fiz. 21, 588 (1951)
[Karny et al., 1978] Z. Karny, R. C. Estler, and R. N. Zare. Effect of reagent orientation
and rotation upon product state distribution in reaction Sr + HF(v=1,4)→ SrF(v′,j′)
+ H. Journal of Chemical Physics 69, 5199 (1978)
[Kato et al., 2001] S. Kato, G. E. Davico, H. S. Lee, C. H. DePuy, and V. M. Bierbaum.
Deuterium kinetic isotope effects in gas phase SN2 reactions. International Journal
of Mass Spectrometry 210, 223 (2001)
[Kella et al., 1993] D. Kella, M. Algranati, H. Feldman, O. Heber, H. Kovner, E. Malkin,
E. Miklazky, R. Naaman, D. Zajfman, J. Zajfman, and Z. Vager. A system for
coulomb explosion imaging of small molecules at the Weizmann-Institute. Nuclear
Instruments & Methods In Physics Research Section A 329, 440 (1993)
[Kirchner, 2007] T. Kirchner. Laser-field enhanced electron transfer in p-Ne and p-Ar col-
lisions. Physical Review A 75, 025401 (2007)
[Kostko et al., 2007] O. Kostko, B. Huber, M. Moseler, and B. von Issendorff. Structure
Determination of Medium-Sized Sodium Clusters. Phys. Rev. Lett. 98, 043401 (2007)
[Kraft et al., 2007] S. D. Kraft, J. Mikosch, P. Staanum, J. Deiglmayr, J. Lange, A. Fioretti,
R. Wester, and M. Weidemuller. Detection of ultracold heteronuclear molecules with a
high-resolution time-of-flight mass spectrometer. submitted to Appl. Phys. B (2007)
[Kreckel, 2003] H. Kreckel. Internal Excitations of Stored Triatomic Hydrogen Molecular
Ions. PhD thesis, University of Heidelberg (2003)
[Kreckel et al., 2002] H. Kreckel, S. Krohn, L. Lammich, M. Lange, J. Levin, M. Scheffel,
D. Schwalm, J. Tennyson, Z. Vager, R. Wester, A. Wolf, and D. Zajfman. Vibrational
and rotational cooling of H+3 . Physical Review A 66, 052509 (2002)
[Kreckel et al., 2005] H. Kreckel, M. Motsch, J. Mikosch, J. Glosık, R. Plasil, S. Altevogt,
V. Andrianarijaona, H. Buhr, J. Hoffmann, L. Lammich, M. Lestinsky, I. Nevo,
S. Novotny, D. Orlov, H. Pedersen, F. Sprenger, A. Terekhov, J. Toker, R. Wester,
D. Gerlich, D. Schwalm, A. Wolf, and D. Zajfman. High-Resolution Dissociative
196

BIBLIOGRAPHY
Recombination of Cold H+3 and First Evidence for Nuclear Spin Effects. Phys. Rev.
Lett. 95, 263201 (2005)
[Kreckel and Petrigiani, 2007] H. Kreckel and A. Petrigiani. private communication (2007)
[Kulmala, 2003] M. Kulmala. How particles nucleate and grow. Science 302, 1000 (2003)
[Kulmala et al., 2007] M. Kulmala, I. Riipinen, M. Sipila, H. E. Manninen, T. Petaja,
H. Junninen, M. Dal Maso, G. Mordas, A. Mirme, M. Vana, A. Hirsikko, L. Laakso,
R. M. Harrison, I. Hanson, C. Leung, K. E. J. Lehtinen, and V. M. Kerminen. Toward
direct measurement of atmospheric nucleation. Science 318, 89 (2007)
[Kumarappan et al., 2006] V. Kumarappan, C. Z. Bisgaard, S. S. Viftrup, L. Holmegaard,
and H. Stapelfeldt. Role of rotational temperature in adiabatic molecular alignment.
Journal of Chemical Physics 125, 194309 (2006)
[Laerdahl and Uggerud, 2002] J. K. Laerdahl and E. Uggerud. Gas Phase Nucleophilic
Substitution. International Journal Of Mass Spectrometry 214, 277 (2002)
[Landau and Lifschitz, 2004] L. D. Landau and E. M. Lifschitz. Mechanik, 14. Auflage.
Verlag Harri Deutsch (2004)
[Larson and McMahon, 1984] J. W. Larson and T. B. McMahon. Hydrogen-Bonding in Gas-
Phase Anions - an Experimental Investigation of the Interaction between Chloride-
Ion and Bronsted Acids from Ion-Cyclotron Resonance Chloride Exchange Equilibria.
Journal of the American Chemical Society 106, 517 (1984)
[Larson and McMahon, 1985] J. W. Larson and T. B. McMahon. Fluoride and Chloride
Affinities of Main Group Oxides, Fluorides, Oxofluorides, and Alkyls - Quantitative
Scales of Lewis Acidities from Ion-Cyclotron Resonance Halide-Exchange Equilibria.
Journal of the American Chemical Society 107, 766 (1985)
[Le Teuff et al., 2000] Y. H. Le Teuff, T. J. Millar, and A. J. Markwick. The UMIST
database for astrochemistry 1999. Astron. Astrophys. Suppl. Ser. 146, 157 (2000)
[Lee et al., 2003] S. H. Lee, J. M. Reeves, J. C. Wilson, D. E. Hunton, A. A. Viggiano,
T. M. Miller, J. O. Ballenthin, and L. R. Lait. Particle formation by ion nucleation
in the upper troposphere and lower stratosphere. Science 301, 1886 (2003)
[Lee and Farrar, 2000] S. T. Lee and J. M. Farrar. Dynamics of the OH− + D2 isotope
exchange reaction: Reactive and nonreactive decay of the collision complex. Journal
of Chemical Physics 113, 581 (2000)
197

BIBLIOGRAPHY
[Lee, 1987] Y. T. Lee. Molecular-beam studies of elementary chemical processes. Science
236, 793 (1987)
[LeGarrec et al., 1997] J. L. LeGarrec, B. R. Rowe, J. L. Queffelec, J. B. A. Mitchell, and
D. C. Clary. Temperature dependence of the rate constant for the Cl− + CH3Br
reaction down to 23 K. Journal of Chemical Physics 107, 1021 (1997)
[Levine, 2005] R. D. Levine. Molecular Reaction Dynamics. Cambridge University Press,
Cambridge (UK) (2005)
[Li et al., 1996] C. Li, P. Ross, J. E. Szulejko, and T. B. McMahon. High-Pressure Mass
Spectrometric Investigations of the Potential Energy Surfaces of Gas-Phase SN2 Re-
actions. Journal of the American Chemical Society 118, 9360 (1996)
[Li and Hase, 1999] G. S. Li and W. L. Hase. Ab Initio Direct Dynamics Trajectory Study
of the Cl− + CH3Cl SN2 Reaction at High Reagent Translational Energy. Journal of
the American Chemical Society 121, 7124 (1999)
[Li et al., 2005] Y. Li, L. Liu, and J. M. Farrar. Quantum state-resolved study of the four-
atom reaction OH− (X1Σ+) + D2(X1Σ+
g ,ν=0)→ HOD (X1 A′,ν ′) + D−(1S). Journal
of Physical Chemistry A 109, 6392 (2005)
[Liao et al., 1986] C.-L. Liao, J.-D. Shao, R. Xu, G. D. Flesch, Y.-G. Li, and C. Y. Ng.
A state-to-state study of the electron transfer reactions Ar+ + N2 → Ar + N+2 . J.
Chem. Phys. 85, 3874 (1986)
[Lide, 2003] D. R. Lide. CRC Handbook of Chemistry and Physics, 84 th Edition. CRC
Press (2003)
[Lin et al., 2003a] J. J. Lin, J. G. Zhou, W. C. Shiu, and K. P. Liu. Application of time-
sliced ion velocity imaging to crossed molecular beam experiments. Review of Scientific
Instruments 74, 2495 (2003a)
[Lin et al., 2003b] J. J. Lin, J. G. Zhou, W. C. Shiu, and K. P. Liu. State-specific correlation
of coincident product pairs in the F + CD4 reaction. Science 300, 966 (2003b)
[Lindsay and McCall, 2001] C. M. Lindsay and B. J. McCall. Comprehensive evaluation and
compilation of H+3 spectroscopy. Journal of Molecular Spectroscopy 210, 60 (2001)
[Linnartz et al., 2002] H. Linnartz, D. Verdes, and J. P. Maier. Rotationally resolved infrared
spectrum of the charge transfer complex [Ar-N2]+. Science 297, 1166 (2002)
[Linss et al., 2004] V. Linss, H. Kupfer, S. Peter, and F. Richter. J. Phys. D. 37, 1935
(2004)
198

BIBLIOGRAPHY
[Littman, 1978] M. G. Littman. Single-mode operation of grazing-incidence pulsed dye-laser.
Opt. Lett. 3, 138 (1978)
[Liu and Littman, 1981] K. Liu and M. G. Littman. Novel geometry for single-mode scan-
ning of tunable lasers. Optics Letters 6, 117 (1981)
[Liu, 2001] K. P. Liu. Crossed-beam studies of neutral reactions: State-specific differential
cross sections. Annual Review of Physical Chemistry 52, 139 (2001)
[Liu and Conway, 1975] W. F. Liu and D. C. Conway. Ion-molecule reaction rates in Ar at
296, 195, and 77 K. J. Chem. Phys. 62, 3070 (1975)
[Loesch and Remscheid, 1990] H. J. Loesch and A. Remscheid. Brute force in molecular re-
action dynamics - a novel technique for measuring steric effects. Journal of Chemical
Physics 93, 4779 (1990)
[Loesch and Stienkemeier, 1994] H. J. Loesch and F. Stienkemeier. Steric effects in total
integral reaction cross-sections for Sr + HF(v=1,j=1,m=0) → SrF + H. Journal of
Chemical Physics 100, 4308 (1994)
[Lourderaj et al., 2007] U. Lourderaj, K. Song, T. L. Windus, Y. Zhuang, and W. L. Hase.
Direct dynamics simulations using Hessian-based predictor-corrector integration al-
gorithms. Journal of Chemical Physics 126, 044105 (2007)
[Luiten et al., 1996] O. J. Luiten, M. W. Reynolds, and J. T. M. Walraven. Kinetic theory
of the evaporative cooling of a trapped gas. Physical Review A 53, 381 (1996)
[Mann and Hase, 1998] D. J. Mann and W. L. Hase. Trajectory Studies of SN2 Nucleophilic
Substitution. 6. Translational Activation of the Cl− + CH3Cl Reaction. Journal of
Physical Chemistry A 102, 6208 (1998)
[Marcy et al., 2004] T. P. Marcy, D. W. Fahey, R. S. Gao, P. J. Popp, E. C. Richard,
T. L. Thompson, K. H. Rosenlof, E. A. Ray, R. J. Salawitch, C. S. Atherton, D. J.
Bergmann, B. A. Ridley, A. J. Weinheimer, M. Loewenstein, E. M. Weinstock, and
M. J. Mahoney. Quantifying stratospheric ozone in the upper troposphere with in situ
measurements of HCl. Science 304, 261 (2004)
[Masgrau et al., 2006] L. Masgrau, A. Roujeinikova, L. O. Johannissen, P. Hothi, J. Basran,
K. E. Ranaghan, A. J. Mulholland, M. J. Sutcliffe, N. S. Scrutton, and D. Leys.
Atomic description of an enzyme reaction dominated by proton tunneling. Science
312, 237 (2006)
199

BIBLIOGRAPHY
[Matejcık et al., 2002] S. Matejcık, V. Foltin, M. Stano, and J. D. Skalny. Temperature
dependencies in dissociative electron attachment to CCl4, CCl2F2, CHCl3 and CHBr3.
Int. J. Mass Spectr. 223, 9 (2002). And references therein
[McCall, 2006] B. J. McCall. Molecular physics - Recombination cool and fast. Nature 440,
157 (2006)
[McCarthy et al., 2006] M. C. McCarthy, C. A. Gottlieb, H. Gupta, and P. Thaddeus.
Laboratory and Astronomical Identification of the negative molecular ion C6H−. As-
trophys. J. 652, L141 (2006)
[McNicholl and Metcalf, 1985] P. McNicholl and H. J. Metcalf. Synchronous cavity mode
and feedback wavelength scanning in dye-laser oscillators with gratings. Applied Op-
tics 24, 2757 (1985)
[Melin and Ortiz, 2007] J. Melin and J. V. Ortiz. OH−3 and O2H−5 double rydberg anions:
Predictions and comparisons with NH−4 and N2H−7 . J. Chem. Phys. 127, 014307
(2007)
[Meotner and Smith, 1991] M. Meotner and S. C. Smith. Entropy barriers to proton-
transfer. Journal of the American Chemical Society 113, 862 (1991)
[Merceron-Saffon et al., 2003] N. Merceron-Saffon, A. Baceiredo, H. Gornitzka, and
G. Bertrand. Synthesis of carbenes through substitution reactions at a carbene center.
Science 301, 1223 (2003)
[Mercier et al., 2006] S. R. Mercier, O. V. Boyarkin, A. Kamariotis, M. Guglielmi, I. Taver-
nelli, M. Cascella, U. Rothlisberger, and T. R. Rizzo. Microsolvation Effects on the
Excited-State Dynamics of Protonated Tryptophan. J. Am. Chem. Soc. 128, 16938
(2006)
[Neale et al., 1996] L. Neale, S. Miller, and J. Tennyson. Spectroscopic properties of the H+3
molecule: A new calculated line list. Astrophysical Journal 464, 516 (1996)
[Neumark et al., 1985] D. M. Neumark, A. M. Wodtke, G. N. Robinson, C. C. Hayden,
and Y. T. Lee. Molecular-beam studies of the F + H2 reaction. Journal of Chemical
Physics 82, 3045 (1985)
[NIST, 2007] NIST. NIST Chemistry Webbook, Chemical database. National Institute of
Standards and Technology, Boulder (USA) (2007)
[Ohair et al., 1994] R. A. J. Ohair, G. E. Davico, J. Hacaloglu, T. T. Dang, C. H. Depuy,
and V. M. Bierbaum. Measurements of Solvent and Secondary Kinetic Isotope Effects
200

BIBLIOGRAPHY
for the Gas-Phase SN2 Reactions of Fluoride with Methyl Halides. Journal of the
American Chemical Society 116, 3609 (1994)
[Oka, 1980] T. Oka. Observation of the infrared-spectrum of H+3 . Physical Review Letters
45, 531 (1980)
[Okino et al., 2006] T. Okino, Y. Furukawa, P. Liu, T. Ichikawa, R. Itakura, K. Hoshina,
K. Yamanouchi, and H. Nakano. Coincidence momentum imaging of ejection of
hydrogen molecular ions from methanol in intense laser fields. Chemical Physics
Letters 419, 223 (2006)
[Okuno, 1996] Y. Okuno. Microscopic Description of Nonadiabatic, Nonequilibrium, and
Equilibrium Solvations for Solvated Cluster Reactions: (H2O)(n)Cl− + CH3Cl →ClCH3 + Cl−(H2O)(n). Journal of Chemical Physics 105, 5817 (1996)
[Olmstead and Brauman, 1977] W. N. Olmstead and J. I. Brauman. Gas-phase nucleophilic
displacement-reactions. Journal of the American Chemical Society 99, 4219 (1977)
[Otto, 2006a] R. Otto. Kinetik einer anionischen Proton-Transfer-Reaktion bei extrem
niedrigen Temperaturen. Diplomarbeit, Universitat Freiburg (2006a)
[Otto, 2006b] R. Otto. Raumliche Verteilung kalter Ionen in einer 22-Pol-Falle. Haupt-
praktikumsbericht, Universitat Freiburg (2006b)
[Parker and Bernstein, 1989] D. H. Parker and R. B. Bernstein. Oriented molecule beams
via the electrostatic hexapole - preparation, characterization, and reactive scattering.
Annual Review of Physical Chemistry 40, 561 (1989)
[Parker et al., 1981] D. H. Parker, K. K. Chakravorty, and R. B. Bernstein. Reactive asym-
metry of methyl-iodide - the crossed-beam reaction of oriented CH3I with Rb. Journal
of Physical Chemistry 85, 466 (1981)
[Parker and Stapelfeldt, 2007] D. H. Parker and H. Stapelfeldt. private communication
(2007)
[Paul, 1990] W. Paul. Electromagnetic traps for charged and neutral particles. Rev. Mod.
Phys. 62, 531 (1990)
[Paul et al., 1995] W. Paul, B. Lucke, S. Schlemmer, and D. Gerlich. On the dynamics of the
reaction of positive hydrogen cluster ions H+5 to H+
23 with para and normal hydrogen
at 10 k. International Journal Of Mass Spectrometry 150, 373 (1995)
[Paul et al., 1996] W. Paul, S. Schlemmer, B. Lucke, and D. Gerlich. Deuteration of positive
hydrogen cluster ions H+5 to H+
17 at 10 K. Chemical Physics 209, 265 (1996)
201
BIBLIOGRAPHY
[Pechukas and Light, 1965] P. Pechukas and J. C. Light. On detailed balancing and statistical
theories of chemical kinetics. Journal of Chemical Physics 42, 3281 (1965)
[Pechukas et al., 1966] P. Pechukas, J. C. Light, and C. Rankin. Statistical theory of chemical
kinetics - application to neutral-atom-molecule reactions. Journal of Chemical Physics
44, 794 (1966)
[Petrich et al., 1995] W. Petrich, M. Anderson, J. Ensher, and E. Cornell. Stable, Tightly
Confining Magnetic Trap for Evaporative Cooling of Neutral Atoms. Physical Review
Letters 74, 3352 (1995)
[Petrie and Bohme, 2007] S. Petrie and D. K. Bohme. Ions in space. Mass Spectrometry
Reviews 26, 258 (2007)
[Plasil et al., 2002] R. Plasil, J. Glosik, V. Poterya, P. Kudrna, J. Rusz, M. Tichy, and
A. Pysanenko. Advanced integrated stationary afterglow method for experimental
study of recombination of processes of H+3 and D+
3 ions with electrons. International
Journal of Mass Spectrometry 218, 105 (2002)
[Prestage et al., 2001] J. D. Prestage, R. L. Tjoelker, and L. Maleki. Recent Developments
in Microwave Ion Clocks. Topics Appl. Phys. 79, 195 (2001)
[Qiu et al., 2006] M. H. Qiu, Z. F. Ren, L. Che, D. X. Dai, S. A. Harich, X. Y. Wang, X. M.
Yang, C. X. Xu, D. Q. Xie, M. Gustafsson, R. T. Skodje, Z. G. Sun, and D. H. Zhang.
Observation of Feshbach resonances in the F + H2 → HF + H reaction. Science 311,
1440 (2006)
[Regan et al., 2002] C. K. Regan, S. L. Craig, and J. I. Brauman. Steric Effects and Solvent
Effects in Ionic Reactions. Science 295, 2245 (2002)
[Rejoub et al., 2002] R. Rejoub, B. G. Lindsay, and R. F. Stebbings. Electron-impact ion-
ization of the methyl halides. Journal of Chemical Physics 117, 6450 (2002)
[Remijan et al., 2007] A. J. Remijan, J. M. Hollis, F. J. Lovas, M. A. Cordiner, T. J. Millar,
A. J. Markwick-Kemper, and P. R. Jewell. Detection of C8H− and Comparison with
C8H toward IRC+10216. Astrophysical Journal 664, L47 (2007)
[Schlemmer et al., 1999] S. Schlemmer, T. Kuhn, E. Lescop, and D. Gerlich. Laser excited
N+2 in a 22-pole ion trap: experimental studies of rotational relaxation processes. Int.
J. Mass Spectr. 185/186/197, 589 (1999)
[Schlemmer et al., 2002] S. Schlemmer, E. Lescop, J. von Richthofen, D. Gerlich, and M. A.
Smith. Laser induced reactions in a 22-pole ion trap: C2H+2 + h ν3 + H2 → C2H
+3
+ H. J. Chem. Phys. 117, 2068 (2002)
202

BIBLIOGRAPHY
[Schlunk et al., 2007] S. Schlunk, A. Marian, P. Geng, A. P. Mosk, G. Meijer, and W. Schoel-
lkopf. Trapping of Rb atoms by ac electric fields. Physical Review Letters 98, 223002
(2007)
[Schmatz, 2000] S. Schmatz. Quantum Dynamics of SN2 Reactions on CCSD(T) Potential
Energy Surfaces: Cl− + CH3Cl and Cl− + CH3Br. Chemical Physics Letters 330,
188 (2000)
[Schmatz, 2004] S. Schmatz. Quantum Dynamics of Gas-Phase SN2 Reactions. Chem. Phys.
Chem. 5, 600 (2004)
[Schmatz et al., 2001] S. Schmatz, P. Botschwina, J. Hauschildt, and R. Schinke. Symmetry
Specificity in the Unimolecular Decay of the Cl− · · · CH3Cl Complex: Two-Mode
Quantum Calculations on a Coupled-Cluster [CCSD(T)] Potential Energy Surface.
Journal of Chemical Physics 114, 5233 (2001)
[Schmatz and Clary, 1998] S. Schmatz and D. C. Clary. Quantum Scattering on SN2 Re-
actions: Influence of Azimuthal Rotations. Journal of Chemical Physics 109, 8200
(1998)
[Schnieder et al., 1991] L. Schnieder, K. Seekamprahn, F. Liedeker, H. Steuwe, and K. H.
Welge. Hydrogen-exchange reaction H + D2 in crossed beams. Faraday Discussions
91, 259 (1991)
[Schweizer and Gerlich, 1994] Schweizer and D. Gerlich. Resonance-enhanced multiphoton
ionization of argon: reactivity as a probe for the 2P1/2 / 2P3/2 population. Int. J.
Mass. Spectrom. and Ion Proc. 135, 1 (1994)
[Scoles, 1988] G. Scoles. Atomic and Molecular Beam Methods. Oxford University Press,
Oxford (1988)
[Seeley et al., 1997] J. V. Seeley, R. A. Morris, and A. A. Viggiano. Temperature depen-
dences of the rate constants and branching ratios for the reactions of F−(H2O)(0-5)
with CH3Br. Journal of Physical Chemistry A 101, 4598 (1997)
[Sharp and Dowell, 1969] T. E. Sharp and J. T. Dowell. Dissociative Attachment of Elec-
trons in Ammonia and Ammonia-d∗3. J. Chem. Phys. 50, 3024 (1969)
[SIMION, 2007] SIMION. Ion optics simulation software, Version 7.0. Scientific Instrument
Services, Idaho National Labs (USA) (2007)
[Simpson et al., 1995] W. R. Simpson, T. P. Rakitzis, S. A. Kandel, A. J. Orr-Ewing, and
R. N. Zare. Reaction of Cl with vibrationally excited CH4 and CHD3 - state-to-state
203
BIBLIOGRAPHY
differential cross-sections and steric effects for the HCl product. Journal of Chemical
Physics 103, 7313 (1995)
[Singer et al., 2002] K. Singer, S. Jochim, M. Mudrich, A. Mosk, and M. Weidemuller. Low-
cost mechanical shutter for light beams. Review of Scientific Instruments 73, 4402
(2002)
[Smith et al., 1997] J. R. Smith, J. B. Kim, and W. C. Lineberger. High-resolution threshold
photodetachment spectroscopy of OH−. Phys. Rev. A 55, 2036 (1997)
[Smith, 1998] M. A. Smith. Low-temperature rate studies of ions and radicals in supersonic
flows. International Reviews In Physical Chemistry 17, 35 (1998)
[Staanum et al., 2006] P. Staanum, S. D. Kraft, J. Lange, R. Wester, and M. Weidemuller.
Experimental investigation of ultracold atom-molecule collisions. Physical Review
Letters 96, 023201 (2006)
[Stapelfeldt and Seideman, 2003] H. Stapelfeldt and T. Seideman. Colloquium: Aligning
molecules with strong laser pulses. Reviews of Modern Physics 75, 543 (2003)
[Stormer et al., 1998] C. W. Stormer, S. Gilb, J. Friedrich, D. Schooss, and M. M. Kappes.
A high resolution dual mass gate for ion separation in laser desorption/ionization
time of flight mass spectrometry. Rev. Sci. Instr. 69, 1661 (1998)
[Strasser et al., 2002] D. Strasser, L. Lammich, H. Kreckel, S. Krohn, M. L. A. Naaman,
D. Schwalm, A. Wolf, and D. Zajfman. Breakup dynamics and the isotope effect in
H+3 and D+
3 dissociative recombination. Phys. Rev. A 66, 032719 (2002)
[Straub et al., 1995] H. C. Straub, P. Renault, B. G. Lindsay, K. A. Smith, and R. F.
Stebbings. Absolute partial and total cross-sections for electron-impact ionization of
argon from threshold to 1000 eV. Physical Review A 52, 1115 (1995)
[Su, 1988] T. Su. Trajectory Calculations of Ion-Polar Molecule Capture Rate Constants at
Low-Temperatures. Journal of Chemical Physics 89, 5355 (1988)
[Su and Bowers, 1973] T. Su and M. T. Bowers. Theory of Ion-Polar Molecule collisions -
Comparison with Experimental Charge-Transfer Reactions of Rare-Gas Ions to Geo-
metric Isomers of Difluorobenzene and Dichloroethylene. Journal of Chemical Physics
58, 3027 (1973)
[Su and Chesnavich, 1982] T. Su and W. J. Chesnavich. Parametrization of the ion-
polar molecule collision rate-constant by trajectory calculations. Journal of Chemical
Physics 76, 5183 (1982)
204

BIBLIOGRAPHY
[Su et al., 1990] T. Su, R. A. Morris, A. A. Viggiano, and J. F. Paulson. Kinetic-energy
and temperature dependences for the reactions of F− with halogenated methanes -
experiment and theory. Journal of Physical Chemistry 94, 8426 (1990)
[Su et al., 1998] T. Su, H. B. Wang, and W. L. Hase. Trajectory studies of SN2 nucleophilic
substitution. 7. F− + CH3Cl → FCH3 + Cl−. Journal of Physical Chemistry A 102,
9819 (1998)
[Sun et al., 2001] L. Sun, W. L. Hase, and K. Song. Trajectory studies of SN2 nucleophilic
substitution. 8. Central barrier dynamics for gas phase Cl− + CH3Cl. Journal of The
American Chemical Society 123, 5753 (2001)
[Syage, 1996] J. A. Syage. State specific, angle velocity resolved measurements of photodis-
sociation in clusters: I atom escape from (CH3I)n (n=1,2,3). Chemical Physics 207,
411 (1996)
[Tanaka et al., 1976] K. Tanaka, G. I. MacKay, J. D. Payzant, and D. K. Bohme. Gas-phase
reactions of anions with halogenated methanes at 297 ± 2 K. Canadian Journal of
Chemistry - Revue Canadienne De Chimie 54, 1643 (1976)
[Teloy and Gerlich, 1974] E. Teloy and D. Gerlich. Integral cross-sections for ion-molecule
reactions. 1.Guided beam technique. Chemical Physics 4, 417 (1974)
[Tennyson, 1995] J. Tennyson. Spectroscopy of H+3 - planets, chaos and the universe. Rep.
Prog. Phys. 58, 421 (1995)
[Townsend et al., 2003] D. Townsend, M. P. Minitti, and A. G. Suits. Direct current slice
imaging. Review of Scientific Instruments 74, 2530 (2003)
[Trippel et al., 2006] S. Trippel, J. Mikosch, R. Berhahne, R. Otto, M. Weidemuller, and
R. Wester. Photodetachment of Cold OH− in a Multipole Ion Trap. Phys. Rev. Lett.
97, 193003 (2006)
[Tucker and Truhlar, 1989] S. C. Tucker and D. G. Truhlar. Ab-Initio Calculations of the
Transition-State Geometry and Vibrational Frequencies of the SN2 Reaction of Cl−
with CH3Cl. Journal of Physical Chemistry 93, 8138 (1989)
[Tucker and Truhlar, 1990] S. C. Tucker and D. G. Truhlar. A 6-Body Potential-Energy
Surface for the SN2 Reaction Cl−(g) + CH3Cl(g) and a Variational Transition-State-
Theory Calculation of the Rate-Constant. Journal of the American Chemical Society
112, 3338 (1990)
205

BIBLIOGRAPHY
[Ullrich et al., 2003] J. Ullrich, R. Moshammer, A. Dorn, R. Dorner, L. P. H. Schmidt,
and H. Schmidt-Bocking. Recoil-ion and electron momentum spectroscopy: reaction-
microscopes. Rep. Prog. Phys. 66, 1463 (2003)
[Ullrich and Shevelko, 2003]J. Ullrich and V. P. Shevelko, editors. Many-Particle Quantum
Dynamics in Atomic and Molecular Fragmentation. Springer (2003)
[van de Linde and Hase, 1990a] S. R. van de Linde and W. L. Hase. Complete Multidimen-
sional Analytic Potential-Energy Surface for Cl− + CH3Cl SN2 Nucleophilic Sub-
stitution. Journal of Physical Chemistry 94, 2778 (1990a)
[van de Linde and Hase, 1990b] S. R. van de Linde and W. L. Hase. Non-RRKM Kinetics
in Gas-Phase SN2 Nucleophilic Substitution. Journal of Physical Chemistry 94, 6148
(1990b)
[van de Linde and Hase, 1990c] S. R. van de Linde and W. L. Hase. Trajectory Studies
of SN2 Nucleophilic Substitution. 1. Dynamics of Cl− + CH3Cl Reactive Collisions.
Journal of Chemical Physics 93, 7962 (1990c)
[van Veldhoven et al., 2005] J. van Veldhoven, H. L. Bethlem, and G. Meijer. ac Electric
Trap for Ground-State Molecules. Physical Review Letters 94, 083001 (2005)
[Ventrudo et al., 1994] B. F. Ventrudo, D. T. Cassidy, Z. Y. Guo, S. W. Joo, S. S. Lee, and
T. Oka. Near-infrared 3ν2 overtone band of H+3 . Journal of Chemical Physics 100,
6263 (1994)
[Viggiano, 2007] A. A. Viggiano. private communication (2007)
[Viggiano et al., 1996] A. A. Viggiano, S. T. Arnold, R. A. Morris, A. F. Ahrens, and P. M.
Hierl. Temperature dependences of the rate constants and branching ratios for the
reactions of OH−(H2O)(0-4) + CH3Br. Journal of Physical Chemistry 100, 14397
(1996)
[Viggiano et al., 1992] A. A. Viggiano, R. A. Morris, J. S. Paschkewitz, and J. F. Paulson.
Kinetics of the Gas-Phase Reactions of Cl− with CH3Br and CD3Br - Experimental-
Evidence for Nonstatistical Behavior. Journal of the American Chemical Society 114,
10477 (1992)
[Vollhardt and Schore, 2007] K. P. C. Vollhardt and N. E. Schore. Organic Chemistry,
Structure and Function (2007)
[Wang and Hase, 1996] H. B. Wang and W. L. Hase. Reaction path Hamiltonian analysis
of the dynamics for Cl− + CH3Br → ClCH3 + Br− SN2 nucleophilic substitution.
Chemical Physics 212, 247 (1996)
206

BIBLIOGRAPHY
[Wang et al., 1994] H. B. Wang, G. H. Peslherbe, and W. L. Hase. Trajectory studies of SN2
nucleophilic-substitution. 4. Intramolecular and unimolecular dynamics of the Cl− · · ·CH3Br and ClCH3 · · · Br− complexes. Journal of The American Chemical Society
116, 9644 (1994)
[Wang et al., 2003] Y. F. Wang, W. L. Hase, and H. B. Wang. Trajectory studies of SN2
nucleophilic substitution. IX. Microscopic reaction pathways and kinetics for Cl− +
CH3Br. Journal of Chemical Physics 118, 2688 (2003)
[Weitzel and Mahnert, 2002] K. M. Weitzel and J. Mahnert. The binding energies of small
Ar, CO and N2 cluster ions. International Journal of Mass Spectrometry 214, 175
(2002)
[Wester et al., 1998] R. Wester, F. Albrecht, M. Grieser, L. Knoll, R. Repnow, D. Schwalm,
A. Wolf, A. Baer, J. Levin, Z. Vager, and D. Zajfman. Coulomb explosion imaging at
the heavy ion storage ring TSR. Nuclear Instruments & Methods In Physics Research,
Section A 413, 379 (1998)
[Wester et al., 2003] R. Wester, A. E. Bragg, A. V. Davis, and D. M. Neumark. Time-
Resolved Study of the Symmetric SN2-Reaction I− + CH3I. Journal of Chemical
Physics 119, 10032 (2003)
[Whitacker, 2003]B. Whitacker, editor. Imaging in Molecular Dynamics: Technology and Ap-
plications. Cambridge University Press (2003)
[Wiley and McLaren, 1955] W. C. Wiley and I. H. McLaren. Time-of-flight mass spectrom-
eter with improved resolution. Rev. Sci. Instr. 26, 1150 (1955)
[Wing et al., 1976] W. H. Wing, G. A. Ruff, W. E. Lamb, and J. J. Spezeski. Observation
of infrared-spectrum of hydrogen molecular ion HD+. Physical Review Letters 36,
1488 (1976)
[Winstein et al., 1960] S. Winstein, L. G. Savedoff, S. Smith, I. D. R. Stevens, and J. S. Gall.
Ion Pairs, Nucleophilicity and Salt Effects in Bimolecular Nucleophilic Substitution.
Tetrahedron Letters 9, 24 (1960)
[Wladkowski and Brauman, 1993] B. D. Wladkowski and J. I. Brauman. Application of
Marcus theory to Gas-Phase SN2 Reactions - Experimental Support of the Marcus
theory Additivity Postulate. Journal of Physical Chemistry 97, 13158 (1993)
[Wutz et al., 2000] M. Wutz, H. Adam, W. Walcher, and K. Jousten. Handbuch Vaku-
umtechnik, 7. Auflage. Vieweg Verlag, Braunschweig/Wiesbaden (2000)
207

[Yalcin and Suzer, 1992] T. Yalcin and S. Suzer. Dissociative electron-attachment to NH3,
NH2OH, NH2NH2 and NH2CH3. J. Mol. Struct. 266, 353 (1992)
[Yang, 2005] X. M. Yang. State-to-state dynamics of elementary chemical reactions using
Rydberg H-atom translational spectroscopy. International Reviews in Physical Chem-
istry 24, 37 (2005)
[Yu and Nyman, 1999] H. G. Yu and G. Nyman. An Application of the Rotating Line
Umbrella Model to Quantum Dynamics of SN2 Reactions. Chemical Physics Letters
312, 585 (1999)
[Zacharias et al., 1984] H. Zacharias, M. M. T. Loy, P. A. Roland, and A. S. Sudbo. Ro-
tational and electronic relaxation in pulsed supersonic beams of no seeded in He and
Ar. Journal of Chemical Physics 81, 3148 (1984)
[Zahzam et al., 2006] N. Zahzam, T. Vogt, M. Mudrich, D. Comparat, and P. Pillet. Atom-
molecule collisions in an optically trapped gas. Physical Review Letters 96, 023202
(2006)
[Zare, 2006] R. Zare. Resonances in Reaction Dynamics. Science 311, 1383 (2006)
[Zare, 1998] R. N. Zare. Laser control of chemical reactions. Science 279, 1875 (1998)
[Zhang et al., 2006] G. Y. Zhang, P. F. Qi, X. R. Wang, Y. R. Lu, X. L. Li, R. Tu,
S. Bangsaruntip, D. Mann, L. Zhang, and H. J. Dai. Selective etching of metal-
lic carbon nanotubes by gas-phase reaction. Science 314, 974 (2006)
208

Acknowledgements
Zuallererst mochte ich mich von Herzen bei Roland Wester bedanken. Dafur, dass ich
von Dir so viel lernen und an Deinem Forschungsprojekt teilhaben durfte. Du hast mit
Weitsicht eine Marschrichtung vorgegeben, die sehr schlau gewahlt ist, und ein wirklich
lohnendes Ziel angepeilt. Vielen Dank fur die Moglichkeit und den Spaß daran trotzdem
zwischendrin immer wieder Blumchen am Wegesrand pflucken zu gehen. Danke fur Dein
immer offenes Ohr und die Bereitschaft, auch zu vorgeruckter Stunde uber die neuesten
Ideen und Beobachtungen zu diskutieren.
Vielen Dank an Matthias Weidemuller fur die Freude an der Physik, die Du ver-
mittelst, und fur einen erfrischenden Blick auf unser Experiment und die Welt daruber
hinaus (!). Dank auch fur die Freiheit, die Du zusammen mit Roland mir gelassen hast,
selbststandig zu sein und zu entscheiden, wie weit man geht. Ich habe dies als große
Herausforderung wahrgenommmen, aber auch immer wieder sehr genossen. Ich wunsche
Dir eine weise Entscheidung fur die mittelfristige Zukunft!
Dir, Dirk Schwalm, herzlichen Dank fur die Unterstutzung in der Anfangsphase
meiner Doktorarbeit. Besonders danke ich Dir aber fur Deine ruhige Art, ein Problem
wirklich zu Ende zu denken. In diesem Sinne wurde ich gerne noch viele Paper mit Dir
schreiben.
Trotz allem Eifer zeigt sich doch immer wieder, wie unverzichtbar das Team ist. Von
Herzen danke ich allen, mit denen ich in den vergangenen Jahren arbeiten und von denen
ich lernen durfte.
Ich danke Dir, Sebastian Trippel, fur Deinen scharfen Blick und Deine unverkrampfte
Art. Ich finde es faszinierend, wie Du an vielen Stellen Optimierungspotential ausmachst
und es konsequent nutzt. Auf diese Weise wird auch das nachste “unmogliche” Experi-
ment funktionieren! Dir zuzusehen und mit Dir zu arbeiten, lieber Rico Otto, hat mir
in den letzten Jahren besonders viel Spaß gemacht. Du hast den ganzen Weg vom Labor-
praktikum bei NIMOS bis zur Doktorarbeit absolviert. Die Geschichte mit der Falle und
dem Balg werde ich nie vergessen! Vielleicht ist die Tatsache, dass ich Dir mittlerweile
nichts mehr beibringen kann, das untruglichste Zeichen, dass ich mal wieder etwas Neues
anfangen muss.
Besonders danke ich allen Diplomanden, die - zunachst ins kalte Wasser geworfen -
209
schnell voll motiviert bei der Sache waren. Ulrike Fruhling, Dir danke ich fur Deinen
Mut, als Erste in einer unbekannten Gruppe anzufangen, und fur Deine unkomplizierte
und positive Art. Vielen Dank Raphael Berhane fur Deinen unverdrossenen Versuch,
mit der verkehrten Diode doch Feedback hinzubekommen und fur die endlosen Scans.
Dich, Rico Otto, habe ich schon erwahnt. Christoph Eichhorn, Dir danke ich fur
die Ruhe, die Du ausstrahlst, und Deine Sorgfalt, die uns an wichtigen Stellen weiter-
brachte. Unsere gemeinsame Detektorreparatur im Auge der Orkans wird mir noch lange
im Gedachtnis sein. Alles Gute fur den nachsten Start! Vielen Dank Markus Debatin
fur die sehr selbstandige Arbeit an der Mikrofalle und die gelegentlichen Ausfluge in den
Schwarzwald. Der nachste Winter macht ja schon Hoffnung! Ich danke Nathan Mor-
rison, der zu uns als RISE-Student kam und sogar wiederkehrte! Ich danke Sebastian
Kaiser und Ruth Billen fur ein spannendes Nanoteilchen-Projekt und Ruth fur zwei
verruckte Hosen. Christian Greve, Dir wunsche ich einen guten Start. Ich werde ver-
suchen, dazu beizutragen, dass die Sache ins Rollen kommt.
Alles Gute Dir und Deiner jungen Familie, Petr Hlavenka, und eine erlebnis- und
eine erfolgreiche Zeit in Freiburg!
Ich danke Michael Kroner und Peter Woias fur die unermutliche Zusammenarbeit
bei der Mikrofalle! Holger Kreckel mochte ich besonders dafur danken, dass er mich in
die 22pol-Geheimnisse eingefuhrt hat. Ohne das Experiment mit Dir waren wir in Freiburg
sicher viel langsamer vorangekommen. Es macht immer wieder Spaß, Dich zu treffen!
Vielen Dank Michael Motsch, mit Dir habe ich eine sehr erlebnisreiche Strahlzeitwoche
am TSR verbracht. I would like to thank Juraj Glosık and Radek Plasil from Prague
for sharing your experience and a painful but wonderful H+3 spectroscopy experiment
as well as for the preparation of various “excellent” bottles (of hydrogen). Vielen Dank
Andreas Wolf fur die Einladung zur DR-Strahlzeit; vielleicht ergibt sich ja mal wieder
eine ahnliche Gelegenheit! Danke Annemieke Petrignani fur die Gastfreundschaft und
den lieben personlichen Umgang. I thank Bill Hase for the collaboration on nucleophilic
substitution reactions, which contributed significantly to this thesis.
Vielen Dank der ganzen Arbeitsgruppe fur die gute und stimulierende Atmosphare!
Markus Reetz-Lamour danke ich fur die richtigen Fragen und clevere Ideen in der Grup-
pensitzung und beim Seminar, die mich weitergebracht haben. Danke Thomas Amthor
fur die kompetente Hilfe bei allen Elektronikfragen und die sporadischen Kochaktionen!
Ein Dank geht an Christian Giese, Janne Denskat, Christoph Hofmann, Wendelin
Sprenger, Karin Mortlbauer, Ina Blank, Anna Grochola und Christian Gluck
(fur die gemeinsamen Abendessen und das Bestaunen Deiner Aquarien; ich wunsche Dir
alles Gute fur Deine Zukunft in der Reaktionsdynamik!). Simone Gotz, Magnus Al-
bert, Jorg Lange und Terry Mullins danke ich fur gelegentliche ablenkende Gesprache
zu ungewohnlicher Tages- oder Wochenzeit, außerdem danke ich den Ehemaligen Kilian
210

Singer, Marcel Mudrich und Peter Staanum. Wenzel Salzmann sei gedankt fur
die lustige Zeit, als wir noch ein Buro zusammen hatten. Stefan Kraft danke ich fur
gemeinsame Abendessen und den Besuch bei seinen Eltern und der GSI. Johannes Dei-
glmayr danke ich fur Fragen und spannende Diskussionen. Vielen Dank Dir, Helga
Muller, dass ich immer wieder alles vergessen durfte, was mit Papierkrieg zu tun hat,
und dafur, dass Du es mir nicht allzu krumm genommen hast, wenn mal wieder etwas
sofort bestellt werden “musste”.
Weiterhin danke ich Uli Person und Marc Eichhorn fur technische Unterstutzung,
unter anderem zum Thema Piezoventile und Radiofrequenzgeneratoren.
Ich danke der mechanischen Werkstatt am Physikalischen Institut in Freiburg fur
ihre exzellente Arbeit, ohne die der Aufbau eines neuen Experiments nicht moglich gewe-
sen ware. Besonders danke ich dem Leitungsburo um Herrn Stoll und Herrn Groß-
mann fur ihre Flexibilitat und den netten und unkomplizierten Umgang. Ebenso danke
ich der Elektronikwerkstatt um Herrn Bergmann und Herrn Keilhauer fur die
Entwicklung, den Bau und die Reparatur vieler Spannungs- und Stromquellen. Dieses
Projekt wurde in Heidelberg begonnen, weshalb ich der dortigen Werkstatt, stellvertre-
tend Herrn Mallinger, danken will. Vielen Dank an Wolfgang Kratschmer, der
uns sein Labor zur Verfugung gestellt hat. Ein ganz großes Dankeschon geht an Herrn
Schlicksupp, der die 22pol Falle gebaut hat.
Ich danke Hanns-Christoph Nagerl und Rudi Grimm fur eine tolle Zeit ins Inns-
bruck, die zum Beginn dieser Arbeit gefuhrt hat.
I have benefited a lot from discussions and suggestions by other scientists on confer-
ences or during their visit in Freiburg. Among the people I want to thank are Dieter
Gerlich, Stefan Schmatz, Bernold Feuerstein, Tom Kirchner, Al Viggiano, Dave
Parker, Arthur Suits, Albert Stolow, Dave Chandler, Marc Vrakking, Steven
Stolte and Kopin Liu.
Abschließend mochte ich meinen Eltern und Geschwistern fur ihre immerwahrende
Unterstutzung danken.
211