
Effect of Dosage of Non-Chloride Accelerator versus Chloride ...
Upload
kharkov-uaCategory
view
1download
0
IOP PUBLISHING JOURNAL OF PHYSICS: CONDENSED MATTER
J. Phys.: Condens. Matter 19 (2007) 415120 (22pp) doi:10.1088/0953-8984/19/41/415120
Dynamics and structure of nickel chloride–methanolsolutions: quasi-elastic neutron scattering andmolecular dynamics simulations
Ashok K Adya1,4, Oleg N Kalugin2 and W Spencer Howells3
1 Condensed Matter Group and BIONTHE5 Centre, School of Contemporary Sciences, Universityof Abertay Dundee, Bell Street, Dundee DD1 1HG, UK2 Department of Inorganic Chemistry, Kharkiv National University, Svobody square 4,Kharkiv 61077, Ukraine3 ISIS, Rutherford Appleton Laboratory, Chilton, Didcot, Oxon OX11 0QX, UK
E-mail: [email protected], [email protected] and [email protected]
Received 30 April 2007, in final form 2 July 2007Published 27 September 2007Online at stacks.iop.org/JPhysCM/19/415120
AbstractThe high-resolution quasi-elastic neutron scattering (QENS) technique has beenapplied to study the translational diffusion of methanol protons in pure methanol(MeOH) at 223 and 297 K, and in 0.3 and 1.3 molal non-aqueous electrolytesolutions (NAESs) of NiCl2 in methanol at 297 K. Molecular dynamics (MD)simulations, in conjunction with the present QENS results and our previouslypublished structural results obtained by neutron diffraction isotopic substitution(NDIS) experiments, have been carried out in the NV T ensemble to explore theparticle dynamics and microscopic structures of the experimentally investigatedsystems. The simulated structure of the ∼1.35 molal NiCl2–MeOH NAEShas been compared with the structures of Ni2+ and Cl− coordination shells in∼1.4 molal NAES obtained earlier by the NDIS technique.
1. Introduction
Our ability to understand and predict the properties of disordered materials continues to be achallenge for condensed matter theory. Within this area the non-aqueous electrolyte solutions(NAESs) perhaps remain the severest test. Ion solvation and ion association are the twophenomena which mainly govern the macroscopic properties of NAESs and, hence, theirtechnological applications. A deeper understanding of these phenomena requires detailedinformation of ion–solvent and ion–ion interactions at a molecular level.
4 Author to whom any correspondence should be addressed.5 BIO- and Nano-Technologies for Health and Environment.
0953-8984/07/415120+22$30.00 © 2007 IOP Publishing Ltd Printed in the UK 1

J. Phys.: Condens. Matter 19 (2007) 415120 A K Adya et al
Figure 1. Model of ion solvation in solution with the three regions of a solvent defined according toFrank and Wen [1] as the first solvation shell (FSS), second solvation shell (SSS), and bulk solvent(Bulk).
The solvation of ions in a liquid solvent embodies primarily the interactions between theions and solvent molecules that alter the solvent structure and its microdynamics in solution.According to the Frank and Wen model of ion solvation [1] the space around an ion can bedivided into three regions, namely the first solvation shell (FSS), second solvation shell (SSS),and bulk solvent (see figure 1). In the bulk solvent its properties correspond to those in neatsolvent. In the FSS the solvent properties are modified significantly by an ion, while the SSSis the intermediate region between the bulk solvent and the FSS. It is now entirely clear thatthe problems associated with the interactions of various types in solution, the structure of thesolution, and the thermal movement of its particles are intimately related to each other.
Among the various direct experimental methods (i.e., those methods for which thespace and time dimensions are comparable to the molecular dimensions and characteristictimes of molecular processes, respectively), neutron diffraction with isotopic substitution(NDIS) [2–6] and quasi-elastic neutron scattering (QENS) [7–11] offer the most powerfultechniques for analysing the microscopic structure and ion/molecule dynamics in ion–molecular systems. These methods allow us to derive structural information of the nearest-neighbour ion environment in terms of pair radial distribution functions, interatomic distancesand co-ordination numbers, and molecular dynamics in terms of the dynamic structure factorsand diffusion coefficients.
When these neutron scattering techniques are complementarily coupled with modernmolecular modelling techniques, such as molecular dynamics (MD) computer simulations, theoutput can provide structural and dynamical details of unparalleled accuracy not obtainable bythe application of any single technique [12, 13].
Recently, we demonstrated [14, 15] the use of the NDIS technique to isolate the ion–ion, ion–H and ion–O partial radial distribution functions (RDFs), and to resolve the co-ordination/solvation structures of the isotopically substituted ions (cation and anion) in NiCl2–MeOH solutions. First- , second- and higher-order difference methods of neutron diffractionwith isotopic substitutions on nickel, chlorine and hydroxyl hydrogen (HO) were appliedin conjunction with ab initio calculations of the Ni2+–methanol complex to derive Ni–O,Ni–HO, Ni–Cl, Ni–C, Ni–H (methyl), and Cl−-dependent pair RDFs. Analyses of these RDFs
2

J. Phys.: Condens. Matter 19 (2007) 415120 A K Adya et al
demonstrated, in most clear terms, that Ni2+ is co-ordinated octahedrally by five methanolmolecules and one chloride anion. The solvation number of Cl− was determined to be ∼=2.The joint analysis of the pair RDFs, gNiCl(r) and gClCl(r), revealed that the electrolyte in its1.4 molal methanolic solution mainly exists in the form of solvated contact ion pairs, [NiCl]+s ,with a very small content of solvated [NiCl2]0
s ion triples.From this point of view there is special interest in the study of dynamic aspects of ion
solvation phenomena in NiCl2–methanol solutions by using the quasi-elastic neutron scatteringtechnique and molecular dynamics simulations.
In their seminal paper, Hewish et al [7] showed how the technique of QENS at high (μeV)resolution could be used to probe, via the dynamic structure factor, S(k, ω), the dynamicsof protons in hydrogenous liquids. Using the model of Frank and Wen, they were able toanalyse the spectroscopic information derived from QENS in terms of the lifetimes of watermolecules in the cationic hydration structures and water diffusion coefficients, and therebyobtain complementary information to that obtained from the nuclear magnetic relaxationmethod and other spectroscopic techniques. Analyses of QENS results, although slightlymodel dependent, require surprisingly few assumptions and can give a definitive picture of thedynamics of protons of the solvent molecules, especially with regard to how the first solvationshell of the ion develops as the ionic concentration and temperature are varied.
The work presented in this paper aims to use a state-of-the-art approach of jointly applyingthe three techniques, namely NDIS, QENS and MD simulations, for detailed investigation ofthe structural and dynamic properties of neat methanol (MeOH) and NiCl2–MeOH solutions atdifferent temperatures and salt concentrations.
The paper has the following structure. The experimental method is given in section 2.Section 3 describes the essential theory behind the QENS method, data analyses, and discussionof the results. The details of MD simulations are described in section 4 with special attentionpaid to the validation of the force field model employed and comparison with the NDIS results.In section 5, the results of MD simulations are presented and discussed.
2. Experimental details
The aqueous solutions of NiCl2 were obtained by dissolving crystalline NiCl2·xH2O (Alfa,Puratronic®, 99.995%) in very dilute HCl (BDH, Aristar®) solution to remove any residualproducts of hydrolysis. The solutions of NiCl2 were then evaporated to a solid form ofNiCl2·6H2O and further dried in a vacuum line under 1–100 Pa at gradually increasingtemperatures from 25 to 70 ◦C during a period of one month. Such a procedure reducedthe water content to less than 0.01%, which was controlled/monitored by weighing withcorresponding accuracy. The anhydrous salt, as expected [16], was a yellow-brownish powder.
The solutions of NiCl2 in methanol (Analar, 99.8%, <0.001% H2O) of requiredconcentrations were made by weighing in a dried nitrogen-filled glove box. Prior to this,however, the solvent was distilled and dried under 4 A molecular sieves for one week.
The sample densities were measured by using an Anton Paar DMA 58 densimeter.The quasi-elastic neutron scattering experiments were performed on the backscattering
spectrometer IN10 at the ILL, Grenoble, France. Spectra were measured at five equallyspaced k-values in the range 0.09 A
−1 � k � 0.38 A−1
with an energy window of about±15 μeV. Incident wavelength of 6.271 A with the resolution in momentum transfer of0.04 A
−1was used. The monochromator was standard Si(111) and the experimental energy
resolution function of ≈1.5 μeV (HWHM) was obtained from incoherent scattering from asample of vanadium.
3

J. Phys.: Condens. Matter 19 (2007) 415120 A K Adya et al
Figure 2. The experimental quasi-elastic neutron spectra (points) and fitted Lorentzians (solid lines)for neat methanol (MeOH) at 223 K at five different k-values (0.091, 0.17, 0.25, 0.31, and 0.38)in A
−1indicated in the figure, with arbitrary scale on the ordinate.
The complete experiment required measurements to be taken of the liquid sample(methanol or NiCl2 solutions in methanol) in its container, the empty container, the background,and a vanadium slab of 1 mm thickness to give the energy resolution function.
The samples were held in a 40 mm × 40 mm flat container specially made from PTFEmaterial with a sample thickness of 1 mm, providing a sample volume of 1.6 cm3. All themeasurements were performed at two temperatures, 223±1 K and ambient (nominal 297±1 K).
The raw data were converted to the dynamic structure factors, S(k, ω), and corrected forbackground and container scattering using the INX program at the ILL. No multiple scatteringcorrections were applied to the data. The experimental QENS spectra on neat methanol and 0.3and 1.3 molal NiCl2–MeOH solutions are shown in figures 2–5.
3. QENS data analyses and discussion of the results
The scattering of neutrons from a solution comprising n atomic species is dependent on thedouble differential cross section d2σ
d� dωdefined by [7, 9]
d2σ
d� dω=
n∑
i
n∑
j
bi b j(xi x j)1/2Si j(k, ω) +
n∑
i
b2inc,i xi S
si (k, ω), (1)
where xi , bi and binc,i are the atomic fraction, coherent scattering length and incoherentscattering length of species i , Ss
i (k, ω) is the self-part of the scattering law, and hk = �p
4

J. Phys.: Condens. Matter 19 (2007) 415120 A K Adya et al
Figure 3. The experimental QENS spectra (points) and fitted Lorentzians (solid lines) for neat
methanol at 297 K at five different k-values in A−1
indicated in the figure, with arbitrary scale onthe ordinate.
and hω = �E are the momentum and energy transfers, respectively. The incoherent scatteringcross section of the hydrogen (H) nucleus present in all the non-aqueous solvents, includingmethanol, is so large that S(k, ω) is dominated by the self-term, Ss
H(k, ω); the other terms aresufficiently small that they may be neglected in the data analysis. The knowledge of d2σ
d� dω
should, thus, lead directly to the proton dynamics, which can be identified with that of thesolvent molecule itself.
For a proton obeying the diffusion equation, SsH(k, ω) is a Lorentzian of the form
SsH(k, ω) = (1/h)Dk2
/ [(Dk2)2 + ω2
], (2)
with translational diffusion coefficient, D. This is the form to be expected when the longestionic binding time, τb, present is short relative to the observation time, τob, so that during thisobservation time any proton can sample the entire range of environments present in the solution.Usually this situation is described as the ‘fast-exchange limit’ [7].
For the case when the solvent molecule’s binding time (usually to a cation) is longer thanthe observation time, i.e., when τb > τob, the so-called ‘slow-exchange regime’, Ss
H(k, ω) takesthe form
SsH(k, ω) = (1/h)
{x1 D1k2
/[(D1k2)2 + ω2
] + x2 D2k2/[
(D2k2)2 + ω2]}
, (3)
which is a sum of two weighted Lorentzians with two different diffusion coefficients, D1 andD2 in the FSS and SSS (or bulk solvent), respectively. Here xi (i = 1, 2) denote the atomicfractions of the two proton populations.
5

J. Phys.: Condens. Matter 19 (2007) 415120 A K Adya et al
Figure 4. The experimental QENS spectra (points) and fitted Lorentzians (solid lines) for 0.3 molal
solution of NiCl2 in methanol at 297 K at five different k-values in A−1
indicated in the figure, witharbitrary scale on the ordinate.
Bearing in mind the results of aqueous NiCl2 solutions [7], one can expect the methanolicsolutions of this salt also to obey the ‘slow-exchange regime’. Accordingly, the two separatetranslational diffusion coefficients of MeOH molecules, one originating from the Ni2+ FSSand the other from the rest of the solution, can, in principle, be evaluated. But, due to therelatively high statistical noise observed, especially at ambient temperature (figures 3–5), andthe narrow energy window available, the fitting procedure did not allow us to resolve more thana single Lorentzian (see the solid lines in figures 2–5). The experimental neutron spectra ofNiCl2 solutions could thus be described by a scattering law in the form
S(k, ω) = (1/h)Dk2/[
(Dk2)2 + ω2], (4)
where
D = x1 D1 + x2 D2, (5)
is the average translational diffusion coefficient of MeOH molecules throughout the wholesolution. Clearly, the experimental spectra for neat methanol at both the temperatures werefitted by a single Lorentzian each in the form of equation (2). Then, the slopes of theplots of the half-width at half-maximum (HWHM) of the fitted Lorentzians versus the squareof wavenumber (k2 in A
−2) were used to calculate the corresponding diffusion coefficients
(figure 6). It should be noted, however, that for the 0.3 molal NiCl2–MeOH solutions, only thefirst four points, respectively, could be used because of large statistical errors in HWHM valuesat high k-values. The experimental diffusion coefficients, D (for neat methanol) and D (forNiCl2–MeOH solutions) are listed in table 1 along with the available literature [11, 17, 18] data
6

J. Phys.: Condens. Matter 19 (2007) 415120 A K Adya et al
Figure 5. The experimental QENS spectra (points) and fitted Lorentzians (solid lines) for 1.3 molal
solution of NiCl2 in methanol at 297 K at five different k-values in A−1
indicated in the figure, witharbitrary scale on the ordinate.
Figure 6. The half-widths at half-maxima (HWHM) of the fitted Lorentzians plotted as a function
of the square of wavenumber (k2 in A−2
) for neat methanol at 223 and 297 K, and for 0.3 and1.3 molal NiCl2 solutions in methanol at 297 K.
on neat methanol. The analysis of table 1 firstly shows that the D values for neat methanol agreewell with the literature data. Secondly, as the temperature decreases and concentration of NiCl2
7

J. Phys.: Condens. Matter 19 (2007) 415120 A K Adya et al
Table 1. The diffusion coefficients of methanol (MeOH) in neat solvent and NiCl2–MeOH systems.
SystemTemperature,T (K)
�E/k2 a
(μeV A2)
Diffusion coefficient ofMeOHf,D (109 m2 s−1)
CH3OH (MeOH) 223 20.8 ± 2.2 0.39 ± 0.03b, 0.498c
CH3OH (MeOH) 297 142 ± 4 2.16 ± 0.07b, 2.567c, 2.50d, 3.25e
0.3 molal NiCl2 in MeOH 297 92.0 ± 3.0 1.40 ± 0.05b
1.3 molal NiCl2 in MeOH 297 45.3 ± 4.6 0.69 ± 0.07b
a Gradient of a plot of HWHM �E(μeV) versus k2 (A−2
), see figure 6.b Present work.c Reference [11] (data refer to CD3OH at 300 and 230 K).d Reference [17].e Reference [18].f For the NiCl2–MeOH solutions, this value corresponds to the average diffusion coefficient, D, defined in equation (5).
Table 2. Some parameters of the modelled systems and MD simulation details. (Note: the sign ⇒means approaching.)
Designationofthe system Solutea
Number ofMeOHmolecules
Molality,m (mol kg−1)
Temperature,T (K)
Density,ρ (g cm−3) Dielectric constantb
I — 216 0 223 0.857 11 52.32II — 216 0 298.15 0.786 37 32.66III 1 Ni2+ 215 ⇒0 298.15 0.786 37 32.66IV 1 Cl− 215 ⇒0 298.15 0.786 37 32.66V 2 NiCl2 210 ≈0.3 298.15 0. 8229 32.66VI 9 NiCl2 189 ≈1.35 298.15 0. 9592 32.66
a The number before each solute refers to the number of ions or number of molecules of the electrolyte.b The values used for calculation of Coulombic interactions by reaction field method.
increases, the diffusion of MeOH molecules slows down drastically. Unfortunately, as ourresults show, the QENS technique does not on its own allow one to elucidate any microscopicdetails of solvent dynamics in the cation’s solvation shell. The MD simulations were, therefore,used complementarily in this work to elucidate all the details of ion solvation dynamics.
4. MD simulation details
The MD simulations of pure MeOH at 223 and 298.15 K (systems I and II), infinitely dilutesolutions of Ni2+ and Cl− (systems III and IV), and solutions of NiCl2 in MeOH of differentconcentrations (systems V and VI) were performed in a cubic box with periodic boundaryconditions. The box lengths for the systems I–IV and V–VI were chosen to match theexperimental densities of pure MeOH [19] and its electrolyte solutions, respectively. A cut-off radius equal to half the box length was applied to all the interactions. Table 2 summarizesthe designation, parameters, and some simulation details of the modelled systems.
The equations of motion were integrated with a time step of 1 fs by using an algorithmproposed and developed recently [20]. The MD simulations on all the systems were performedin the NV T ensemble by using the MDNAES simulation package [21]. The temperaturewas kept constant using the weak coupling method [22] with a relaxation time of 0.1 psduring collection runs of the already equilibrated systems. Equilibration periods of 100 psand collection runs of 500 ps were used.
8

J. Phys.: Condens. Matter 19 (2007) 415120 A K Adya et al
Table 3. The potential parameters for the interacting sites of the methanol molecule and ions.
Particle Sitea σii (A) εi j (kJ mol−1) zi (e) Mi (amu)
MeOH HO 0.0 0.0 +0.431 1.007 947O 3.083 0.731 17 −0.728 15.999 43C (Me) 3.861 0.757 86 +0.297 15.034 941
Ni2+ Ni2+ 0.85 615 +2 58.693 4Cl− Cl− 4.767 0.078 17 −1 35.452 7
a HO refers to the hydroxyl hydrogen, and C (Me) refers to the methyl group treated as a unitedatom.
The site–site interactions between pairs of MeOH molecules and ions, as well as between amolecule and an ion are given by the sum of Lennard-Jones (LJ) 12-6 and Coulomb potentials,
U(ri j ) = 4εi j
[(σi j
ri j
)12
−(
σi j
ri j
)6]
+ zi z j e2
4πε0ri j, (6)
where εi j and σi j are the LJ parameters between sites i and j of distinct molecules, zi is thepartial charge on site i , and r is the site–site separation. Cross interactions were obtained fromLorentz–Berthelot combining rules, εi j = √
εiiε j j and σi j = (σii + σ j j)/2 [23]. A shiftedforce potential [21] was employed for the LJ part of the potential, whereas the reaction fieldmethod [24] was used to calculate the long-range Coulombic part.
The force field model of MeOH parameterized by Haughney et al [25], denoted as H1, andsuccessfully used in our previous simulations [26], was used in the present MD simulations.Within the H1 model, each methanol molecule was treated as a rigid, non-polarizable objectconsisting of three sites corresponding to the oxygen (O), the methyl group (C) treated asa united atom, and the hydrogen of the hydroxyl group (HO). The molecular geometry of themethanol molecule was described by two bond lengths, dOHO = 0.9451 A and dCO = 1.4246 A,and one angle � COHO = 108.53◦.
The LJ parameters for Cl− were derived by fitting the LJ 12-6 potential function (first termon the right-hand side of equation (6)) to the van der Waals curve calculated by the equation
U vdW(rii ) = εvdWii
[2
(R∗
ii
rii
)9
− 3
(R∗
ii
rii
)6]
, (7)
in the range 3.5–7.0 A by using εvdWii and R∗
ii parameters proposed by Peng et al [27].The LJ parameters, εNiNi and σNiNi, for the nickel cation were obtained in the following
way. First, the LJ parameters εNiO and σNiO were derived by fitting the LJ 12-6 potentialfunction (first term in the right-hand part of equation (6)) to the potential curve describing aninteraction of Ni2+ with a six-site water molecule [28]. Then, the LJ parameters εNiNi and σNiNi
were calculated by using the SPC/E model for water [29] and Lorentz–Berthelot combiningrules. We consider such a procedure as quite reasonable because, both within the SPC/Emodel for water and H1 model for methanol, the hydroxyl hydrogen is considered similarlyas a charged site with zero LJ parameters. All the potential parameters used in the present MDsimulations are listed in table 3.
5. MD simulations results and their discussion
5.1. Structure and force field model validation
The structural properties of the solutions have been characterized by a set of radial distributionfunctions (RDFs), gαβ(r), together with the running co-ordination numbers (r.c.ns), nαβ(r),
9

J. Phys.: Condens. Matter 19 (2007) 415120 A K Adya et al
Figure 7. The RDFs, gNiX(r) (full curves), describing the nearest-neighbour environment of Ni2+in ∼1.4 molal NiCl2–methanol solutions as obtained by using NDIS technique. The dashed curvesare the same RDFs derived from MD simulation on system VI (see table 2).
Figure 8. The RDF, gClHO (r) (full curve), as obtained by using the NDIS technique on ∼1.4 molalNiCl2–methanol solution. All other curves are the RDFs, gClX(r), describing the nearest-neighbourenvironment of Cl− derived from MD simulations on system VI (see table 2).
defined as
nαβ(r) = 4πρβ
∫ r
0gαβ(r ′)r ′2 dr ′, (8)
where ρβ is the number density of species β . The ion–solvent RDFs, giX(r), between the ion i(Ni2+ and Cl−) and X (X = HO/O/C) site of the MeOH molecule, as well as Ni–Cl and Cl–ClRDFs derived from MD simulation on systems V and VI are displayed in figures 7–9. Theexperimental RDFs obtained by using the neutron diffraction with isotopic substitution (NDIS)technique on ∼1.4 molal NiCl2–MeOH solutions [14, 15] are also plotted in these figures.The positions of the first maxima in the RDFs for systems III–VI along with the experimental
10

J. Phys.: Condens. Matter 19 (2007) 415120 A K Adya et al
Figure 9. The RDFs, gNiCl(r) and gClCl(r), derived from MD simulations on systems V (dashedand double dot–dashed curves, respectively) and VI (solid and dot–dashed curves, respectively)corresponding to ∼0.3 and ∼1.35 molal solutions of NiCl2 in MeOH (see table 2). The dottedcurve corresponds to the experimental RDF, gNiCl(r), obtained by using the NDIS technique on∼1.4 molal solution of NiCl2 in MeOH.
Figure 10. The running co-ordination numbers of Ni2+ and Cl− ions in ∼0.3 molal (left) and∼1.35 molal (right) solutions of NiCl2 in MeOH at 298 K derived from MD simulations on systemsV and VI (see table 2), respectively.
values are listed in table 4. The corresponding running co-ordination numbers for the ∼0.3 and∼1.35 molal solutions are shown in figure 10.
11

J. Phys.: Condens. Matter 19 (2007) 415120 A K Adya et al
Table 4. The positions of the first maxima in the RDFs for ion–X (X = the closest atom of theMeOH molecule) and ion–ion pairs from MD simulations on systems III–VI (also see figures 7–9 for systems V and VI) and NDIS experiments on ∼1.35 molal solutions of NiCl2 in methanol.(Note: the positions of the second maxima are given in parentheses. The positions of the firstminima are indicated only for the pairs used for defining the boundaries of the first solvation shellsof the ions.)
rmax 1 (A) rmin 1 (A) rmax 1 (A)
System Pairs MD simulations NDIS experimentsa,b
III Ni2+–O 2.03 3.0 —III Ni2+–HO 2.64 — —III Ni2+–C 3.14 — —IV Cl−–HO 2.28 3.27 —IV Cl−–O 3.19 — —IV Cl−–C 3.89 — —V Ni2+–O 2.03 2.8 —V Ni2+–HO 2.64 — —V Ni2+–C 3.13 — —V Ni2+–Cl− 2.72 (4.21) — —V Cl−–HO 2.25 3.25 —V Cl−–O 3.19 — —V Cl−–C 3.88 — —V Cl−–Cl− 3.92 — —VI Ni2+–O 2.03 2.5 2.057VI Ni2+–HO 2.64 — 2.619VI Ni2+–C 3.13 — 3.163VI Ni2+–Cl− 2.72 (4.21) — 2.348VI Cl−–HO 2.21 3.0 2.18VI Cl−–O 3.15 — 3.077–3.215VI Cl−–C 3.88 — 3.632–3.810VI Cl−–Cl− 3.78 — 4.57c
a Reference [14].b Reference [15].c This value can be considered merely indicative because it was obtained from a rather noisy high-order difference function (see figure 6 in [15]).
The Ni2+–O/HO/C (MeOH) and Ni–Cl RDFs show (figures 7, 9) intense first peaks,especially for the cation–O and cation–Cl pairs in the solutions of both concentrations. Theseclearly indicate the formation of well-defined first co-ordination shells around Ni2+. The RDFsof the pairs with the Cl− ion also show (figures 8, 9) well-defined first peaks, but these are ofreduced intensities, broader, and their first minima are much shallower as compared to thosefor the nickel. These observations are clear testimony to a more crumbly packing of the MeOHmolecules around the anion as compared with the cation.
The change in the concentration of NiCl2–MeOH solution appears to hardly influencethe ion–O/HO/C (MeOH) RDFs, and this is also reflected in the corresponding runningcoordination numbers (figure 10). Only small shifts in the positions of the first peaks towardsshorter distances with increase in electrolyte concentration can be observed (see table 4) for theCl− ion.
Comparison of the MD simulated RDFs with the corresponding ones obtained from NDISexperiments [14, 15] shows (figures 7, 8 and table 4) a good agreement in the first peakpositions for Ni–O, Ni–HO, Ni–C, Cl–HO, Cl–O, and Cl–C pairs. Although the first peaks in thesimulated RDFs gNiX(r), describing the nearest-neighbour environment of Ni2+ in ∼1.35 molal
12

J. Phys.: Condens. Matter 19 (2007) 415120 A K Adya et al
NiCl2–methanol solutions, are narrower than the experimental ones (figure 7), figure 10unambiguously indicates the stability of the cation’s first co-ordination shell as composed offive MeOH molecules and one Cl− ion. This is especially encouraging because these resultsare exactly the same as those obtained previously by us from the NDIS experiments [14]. Thewell-defined plateaus in the functions nNiX(r) in the range ∼2–4 A (figure 10) confirm, onceagain, the stability of the first solvation shell of Ni2+.
In contrast to the Ni2+ cation, evaluation of the anion (Cl−) co-ordination (solvation)number through the integration procedure described by equation (8) is hampered because ofa lack of a zero minimum after the first maximum in all the RDFs pertaining to Cl–X pairs(figure 8). As a result, the nClX(r) functions for chloride show a monotonic increase withr (figure 10). Thus, the solvation number of the Cl− ion depends on the definition of theFSS boundary and can be estimated from the nClHO (r) to be in the range 3.5–4.5. This valueis slightly more than 1.6–2.9, the value derived by using second- and higher-order isotopicdifference techniques of neutron diffraction (tables 5 and 6 in [15]).
The first peak at 2.72 A in the computed Ni–Cl RDF for ∼1.35 molal solution occursat slightly larger inter-ion distance as compared with the one obtained at 2.35 A from NDISexperiments (figure 9, table 4). Probably, this difference arises from the fact that Ni–Cl pairpotential expressed by equation (7) was not specially adjusted for this interaction to incorporatea possible covalent contribution typical for a d-block element like Ni. Nevertheless, the forcefield models (table 3) employed in this work allowed us not only to reproduce correctlythe experimental co-ordination number of Ni2+ with respect to Cl− equal to unity [15] (seefigure 10), but also to confirm the Cl–Cl short-range correlation [2] occurring around 4 A(figure 9). The latter observation corroborates our earlier findings [15] about the existence ofsolvated ion triples [NiCl2]+s in concentrated solutions of NiCl2 in methanol.
Overall, the comparison of structural properties of ∼1.35 molal solution of NiCl2 inMeOH obtained from MD simulations and NDIS experiments indicates the reliability of forcefield models employed in our MD modelling. A deeper molecular insight of the microscopicstructure of NiCl2–MeOH solutions, inaccessible from real experiments, can thus be gainedfrom the current MD simulations.
The results reported in figure 9 and table 4 allow us to identify the presence of not only thecontact ion pair (CIP) [NiCl]+ at an inter-ionic distance of 2.72 A, but also the solvent separatedion pair (SSIP) at 4.21 A. It is interesting to note that a change in electrolyte concentration from∼0.3 to ∼1.35 molal does not influence the inter-ionic distances in these ionic aggregates. It isalso noteworthy that the existence of SSIPs could not be revealed from the NDIS experiments,probably due to a relatively small contribution from Ni–Cl correlation to the experimentalsignal (see table 3 and figure 16 in [14]).
For further microscopic considerations of ion solvation phenomenon, the distributionsof co-ordination numbers (c.ns) within the first solvation shells of the ions, n1, constructedby direct counting [12], were analysed (figure 11). The averaged co-ordination (solvation)numbers over the first solvation shells, n1,av, of Cl− derived from the correspondingdistributions are also listed in figure 11. The definition of the FSS boundary in each of themodelled systems III–VI was based on the position of the first minimum (see table 4) in theNi2+–O and/or Cl−–HO RDFs.
In the infinitely dilute solution of Ni2+ in MeOH (system III), the probability distributionfunction is uni-modal, with the most probable value being exactly equal to 6. In the solutionsof finite concentrations, however, the average c.n. of the cation decreases to 5 due to ionassociation. It is interesting to note that in ∼1.35 molal solution, the values of 4 and 6 fornickel co-ordination (solvation) by MeOH molecules are also possible with a high probability(figure 11, left). For a visual interpretation of the corresponding distributions, the snapshots
13

J. Phys.: Condens. Matter 19 (2007) 415120 A K Adya et al
Figure 11. The distribution of co-ordination numbers (c.ns) of Ni2+ (left) and Cl− (right) in theirfirst solvation shells from MD simulations at 298 K of systems III (bottom left), IV (bottom right),V (middle), and VI (top) (for the system definitions see table 2).
Figure 12. Instantaneous configurations of co-ordination shells of Ni2+ in 1.35 molal solution ofNiCl2 in MeOH at 298 K (from MD simulations) with c.n. = 4 + 2 (a), c.n. = 6 + 0 (b), andc.n. = 5 + 1 (c). In figure (c) the configuration of the solvation environment of [NiCl]+ contact ionpair can also be seen.
of the instantaneous configurations of co-ordination shells of Ni2+ in ∼1.35 molal solution ofNiCl2 in MeOH at 298 K are shown in figure 12. Figure 12(a) suggests that for a possibleco-ordination shell of Ni2+, comprising four MeOH molecules and two chloride ions, the latter(Cl−) lie on an edge of the octahedron and not in the radial positions, as one would expect.Surprisingly, the mean co-ordination number of Ni2+ in the ∼0.3 molal solution is still 5, butit results from equal contributions from the 4 and 6 c.n. values. Thus, the solvation number5 is not stable in dilute solutions of NiCl2 in methanol. Clearly, the results described abovecannot be deduced from any diffraction experiment due, in principle, to the time (for datacollection) and space (throughout the macroscopic volume of the solution) averaging nature ofthe structural data so derived.
14

J. Phys.: Condens. Matter 19 (2007) 415120 A K Adya et al
Figure 13. Simulated and/or experimental translational diffusion coefficients, D, of Ni2+, Cl−, andMeOH molecules belonging to the bulk solvent, the first solvation shells (FSSs), and the regionof overlap of the ions’ FSSs (ORFSS) in NiCl2–MeOH solutions at 298 K as a function of thesolution’s molality. The simulated diffusion coefficients of methanol molecules related to the wholeelectrolyte solutions (MD, mean) are also presented.
As opposed to the cation, rather wide distributions of n1 are observed (figure 11, right)for Cl−, with the mean, n1,av, value decreasing from 5.37 for infinitely dilute solution (m ⇒0 mol kg−1) to 3.72 for a concentrated solution (m = ∼1.35 mol kg−1). This is quite reasonablebecause the behaviour of the corresponding RDFs (figures 7, 8) is different in regions of thefirst minima. The function gNiO(r) shows a very sharp first peak followed by a zero-valueminimum, whereas the Cl–HO RDF does not have a zero value around the first minimum.
5.2. Translational diffusion of methanol molecules
Self-diffusion coefficients, D, of the centre of mass of MeOH molecules and ions werecalculated from the mean-absolute displacements (MADs),
limt→∞ R1(t) = lim
t→∞〈|r(t) − r(0)|〉 = 4(Dt/π)1/2, (9)
the mean-square displacements (MSDs),
limt→∞ R2(t) = lim
t→∞〈|r(t) − r(0)|2〉 = 6Dt, (10)
and the velocity autocorrelation functions (VACFs) via the Green–Kubo relation,
D = limt→∞
13
∫ ∞
0〈v(0)v(t)〉 dt . (11)
In order to investigate how the presence of Ni2+ and Cl− ions influence the dynamicalbehaviour of the solvent molecules throughout the electrolyte solution, the diffusioncoefficients of MeOH molecules have been calculated separately in different regions (methanolsubsystems)—the bulk solvent (Bulk), the first (FSS) and second (SSS) solvation shells of ions,and the overlapping region of the first solvation shells (ORFSS) of Ni2+ and Cl−. The resultingDMeOH and Di values for all the simulated systems are summarized in table 5 and shown infigure 13. Figure 13 also depicts the experimental and simulated ‘overall’ diffusion coefficients,
15

J. Phys.: Condens. Matter 19 (2007) 415120 A K Adya et al
Table 5. Self-diffusion coefficients of the methanol molecules and ions in the modelled systems(see table 2), derived from the centre of mass of the velocity autocorrelation functions (VACFs),mean absolute displacements (MADs), and mean-square displacements (MSDs). Bulk, FSS, SSS,and ORFSS stand for the bulk solvent, the first and second solvation shells of an ion, and theoverlapping region of the fist solvation shells of Ni2+ and Cl−, respectively.
D (105 cm2 s−1)
System Particle/Region VACF MAD MSD MeanResidencetime (ps)
I MeOH/Bulk 0.27 0.26 0.28 0.27 —II MeOH/Bulk 2.03 1.99 2.03 2.0 —III MeOH/Bulk 2.08 2.06 2.10 2.1 —III MeOH/SSS Ni2+ 1.17 0.87 0.93 1.0 94III MeOH/FSS Ni2+ 0.57 0.57 0.59 0.58 >500a
III Ni2+ 0.41 0.42 0.43 0.42 —IV MeOH/Bulk 2.01 1.99 2.03 2.0 —IV MeOH/SSS Cl− 1.77 2.45 2.50 2.2 17IV MeOH/FSS Cl− 1.53 1.31 1.36 1.4 50IV Cl− 0.92 0.86 0.87 0.89 —V MeOH/Bulk 1.72 1.66 1.72 1.7 —V MeOH/FSS Cl− 1.01 0.81 0.84 0.88 61V MeOH/FSS Ni2+ 0.47 0.41 0.43 0.44 227V MeOH/ORFSS 0.42 0.40 0.41 0.41 147V Ni2+ 0.30 0.29 0.29 0.29 —V Cl− 0.45 0.43 0.43 0.44 —VI MeOH/Bulk 0.70 0.61 0.69 0.67 —VI MeOH/FSS Cl− 0.60 0.31 0.34 0.42 52VI MeOH/FSS Ni2+ 0.13 0.14 0.15 0.14 143VI MeOH/ORFSS 0.14 0.13 0.14 0.14 86VI Ni2+ 0.096 0.091 0.096 0.094 —VI Cl− 0.16 0.16 0.17 0.16 —
a During the collection run of 500 ps, no decay in residence time correlation function (RTCF) ofMeOH molecules for this subsystem was observed (see figure 14(a)).
denoted as ‘exp’ and ‘MD, mean’, respectively, of methanol molecules related to the wholeelectrolyte solutions at three different concentrations (m ⇒ 0, 0.3, and 1.35 mol kg−1). Thefollowing conclusions can be drawn from analysis of the data listed in table 5 and shown infigure 13.
(1) The diffusion coefficients estimated by different means, e.g., from the VACF, MAD, andMSD, are in reasonable agreement (see table 5) with each other.
(2) The experimental DMeOH values derived from the QENS experiments are in satisfactoryagreement (see figure 13) with the ‘overall’ simulated diffusion coefficients averagedthroughout each solution by taking into account the molar fractions of the solventmolecules in different subsystems (regions).
(3) Due to the relatively small fraction of MeOH molecules in the first solvation shells of theions as compared to the total number of solvent molecules, the ‘overall’ simulated averagevalues of DMeOH differ only slightly (see figure 13) from those in the bulk solvent. Becauseof this, it is difficult to extract the diffusion coefficients of the MeOH molecules within anion’s FSS from the real physical experiment.
(4) In the electrolyte solution of a finite concentration (0.3 m—system V), the values for thediffusion coefficients of Cl− and MeOH molecules from Ni2+ FSS and ORFSS are closeamong themselves, and these values are approximately four times smaller than the DMeOH
16
J. Phys.: Condens. Matter 19 (2007) 415120 A K Adya et al
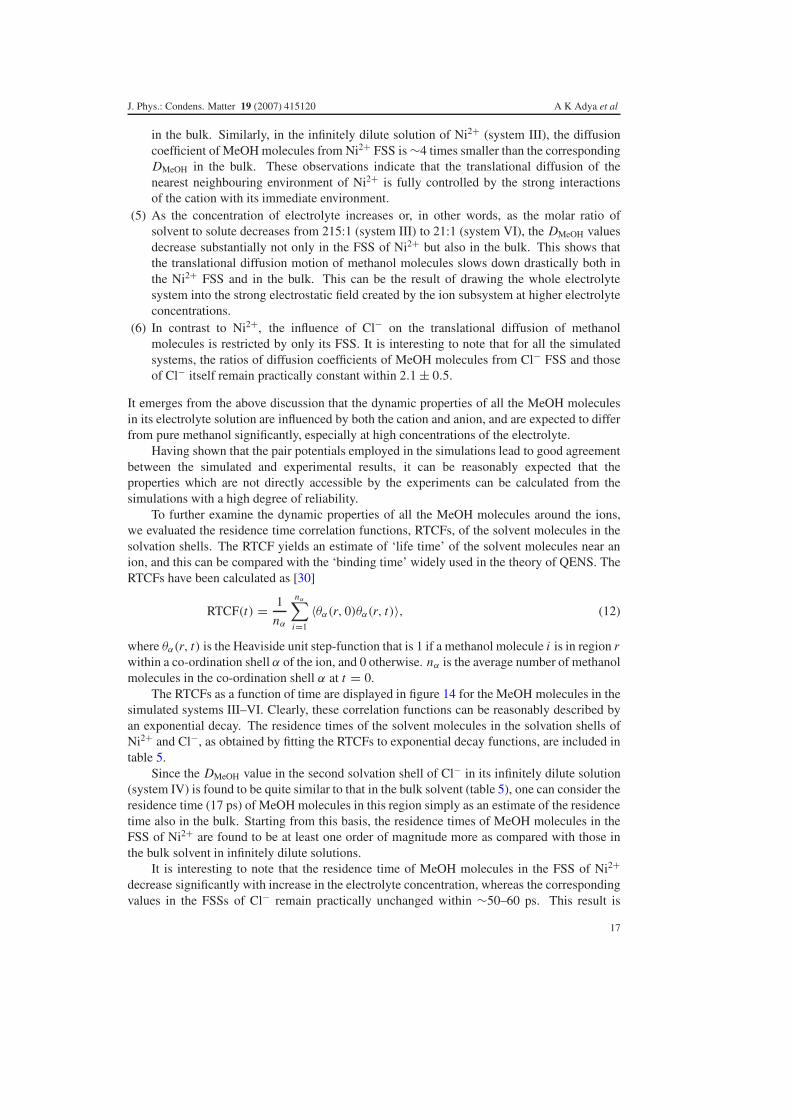
in the bulk. Similarly, in the infinitely dilute solution of Ni2+ (system III), the diffusioncoefficient of MeOH molecules from Ni2+ FSS is ∼4 times smaller than the correspondingDMeOH in the bulk. These observations indicate that the translational diffusion of thenearest neighbouring environment of Ni2+ is fully controlled by the strong interactionsof the cation with its immediate environment.
(5) As the concentration of electrolyte increases or, in other words, as the molar ratio ofsolvent to solute decreases from 215:1 (system III) to 21:1 (system VI), the DMeOH valuesdecrease substantially not only in the FSS of Ni2+ but also in the bulk. This shows thatthe translational diffusion motion of methanol molecules slows down drastically both inthe Ni2+ FSS and in the bulk. This can be the result of drawing the whole electrolytesystem into the strong electrostatic field created by the ion subsystem at higher electrolyteconcentrations.
(6) In contrast to Ni2+, the influence of Cl− on the translational diffusion of methanolmolecules is restricted by only its FSS. It is interesting to note that for all the simulatedsystems, the ratios of diffusion coefficients of MeOH molecules from Cl− FSS and thoseof Cl− itself remain practically constant within 2.1 ± 0.5.
It emerges from the above discussion that the dynamic properties of all the MeOH moleculesin its electrolyte solution are influenced by both the cation and anion, and are expected to differfrom pure methanol significantly, especially at high concentrations of the electrolyte.
Having shown that the pair potentials employed in the simulations lead to good agreementbetween the simulated and experimental results, it can be reasonably expected that theproperties which are not directly accessible by the experiments can be calculated from thesimulations with a high degree of reliability.
To further examine the dynamic properties of all the MeOH molecules around the ions,we evaluated the residence time correlation functions, RTCFs, of the solvent molecules in thesolvation shells. The RTCF yields an estimate of ‘life time’ of the solvent molecules near anion, and this can be compared with the ‘binding time’ widely used in the theory of QENS. TheRTCFs have been calculated as [30]
RTCF(t) = 1
nα
nα∑
i=1
〈θα(r, 0)θα(r, t)〉, (12)
where θα(r, t) is the Heaviside unit step-function that is 1 if a methanol molecule i is in region rwithin a co-ordination shell α of the ion, and 0 otherwise. nα is the average number of methanolmolecules in the co-ordination shell α at t = 0.
The RTCFs as a function of time are displayed in figure 14 for the MeOH molecules in thesimulated systems III–VI. Clearly, these correlation functions can be reasonably described byan exponential decay. The residence times of the solvent molecules in the solvation shells ofNi2+ and Cl−, as obtained by fitting the RTCFs to exponential decay functions, are included intable 5.
Since the DMeOH value in the second solvation shell of Cl− in its infinitely dilute solution(system IV) is found to be quite similar to that in the bulk solvent (table 5), one can consider theresidence time (17 ps) of MeOH molecules in this region simply as an estimate of the residencetime also in the bulk. Starting from this basis, the residence times of MeOH molecules in theFSS of Ni2+ are found to be at least one order of magnitude more as compared with those inthe bulk solvent in infinitely dilute solutions.
It is interesting to note that the residence time of MeOH molecules in the FSS of Ni2+decrease significantly with increase in the electrolyte concentration, whereas the correspondingvalues in the FSSs of Cl− remain practically unchanged within ∼50–60 ps. This result is
17

J. Phys.: Condens. Matter 19 (2007) 415120 A K Adya et al
Figure 14. Residence time correlation functions (RTCFs) for the methanol molecules in the first(FSS) and second (SSS) solvation shells of ions, and in the overlapping region of the cation’s andanion’s first solvation shells (ORFSS) as derived from the MD simulations on systems III (a), IV (b),V (c), and VI (d) (for system’s definition see table 2).
consistent with the observed tendency (see figure 11) in the change of c.n. distributions withinthe FSSs of Ni2+ and Cl−. This may be explained partly in terms of higher sensitivity of thecation’s FSS to mutual inter-ion interactions, resulting from the anion’s penetration into thecation’s FSS, especially in electrolyte solutions of finite concentrations.
5.3. Hindered translations and librations of methanol molecules
The spectral densities of the hindered translational, Svv(ω), and librational, Sww(ω), motions ofMeOH molecules have been calculated by the cosine Fourier transformation,
SAA(ω) =∫ ∞
0CAA(t) cos(ωt) dt, (13)
of the corresponding normalized velocity autocorrelation functions (VACFs) of translational,Cvv(t), and rotational, Cww(t), motion of the methanol molecules,
CAA(t) = 〈A(0)A(t)〉/〈A(0)A(0)〉, (14)
where A ≡ v or w. The results are presented in figures 15–17.The distinct feature of the rotational VACFs, Cww(t), is their oscillatory behaviour, which
is present not only in the ions’ FSSs, but also in the bulk solvent. This implies that the rotationalmotion of methanol molecules in electrolyte solutions is restricted by their strong interactionseither with ions or due to H-bonding with the nearest solvent molecules.
18

J. Phys.: Condens. Matter 19 (2007) 415120 A K Adya et al
Figure 15. Normalized autocorrelation functions (ACFs) of the translational [Cvv(t)] and rotational[Cww(t)] motions of the methanol molecules in the bulk solvent (Bulk), the first (FSS) and thesecond (SSS) solvation shells of Ni2+ in the system III (see table 2). Svv(ω) and Sww(ω) (onthe right) are cosine Fourier transforms of the corresponding ACFs (on the left), and represent thespectral densities of the hindered translation and libration motions of the MeOH molecules.
The influence of Ni2+ on the MeOH molecules in its (Ni2+) FSS is observed in the blueshifts. The frequency of hindering translation and libration of methanol molecules in the FSSof Ni2+ are shifted by ∼150–210 cm−1 with respect to the bulk solvent for both the hinderedtranslation and libration. The influence of Cl− on the spectral density functions, Svv(ω) andSww(ω), of MeOH molecules in its FSS is small relative to that of Ni2+, and the frequencyvalues are comparable to that in the SSS of Ni2+ in the infinitely dilute solution. Interestingly,however, the dynamic behaviour of MeOH molecules in the ORFSS in solutions of finiteconcentrations is quite similar to that in the FSS of the cation.
6. Conclusions
The high-resolution quasi-elastic neutron scattering (QENS) technique has been applied tostudy the translational diffusion of methanol protons in pure methanol (MeOH) at 223 and297 K, and in 0.3 and 1.3 molal solutions of NiCl2 in methanol at 297 K. Molecular dynamics(MD) simulations have also been carried out in the NV T ensemble to explore the static anddynamic behaviour of the experimentally investigated systems. The MD simulated resultsvalidate our structural results at the pair distribution function level obtained previously byneutron diffraction isotopic substitution (NDIS) technique.
19
J. Phys.: Condens. Matter 19 (2007) 415120 A K Adya et al
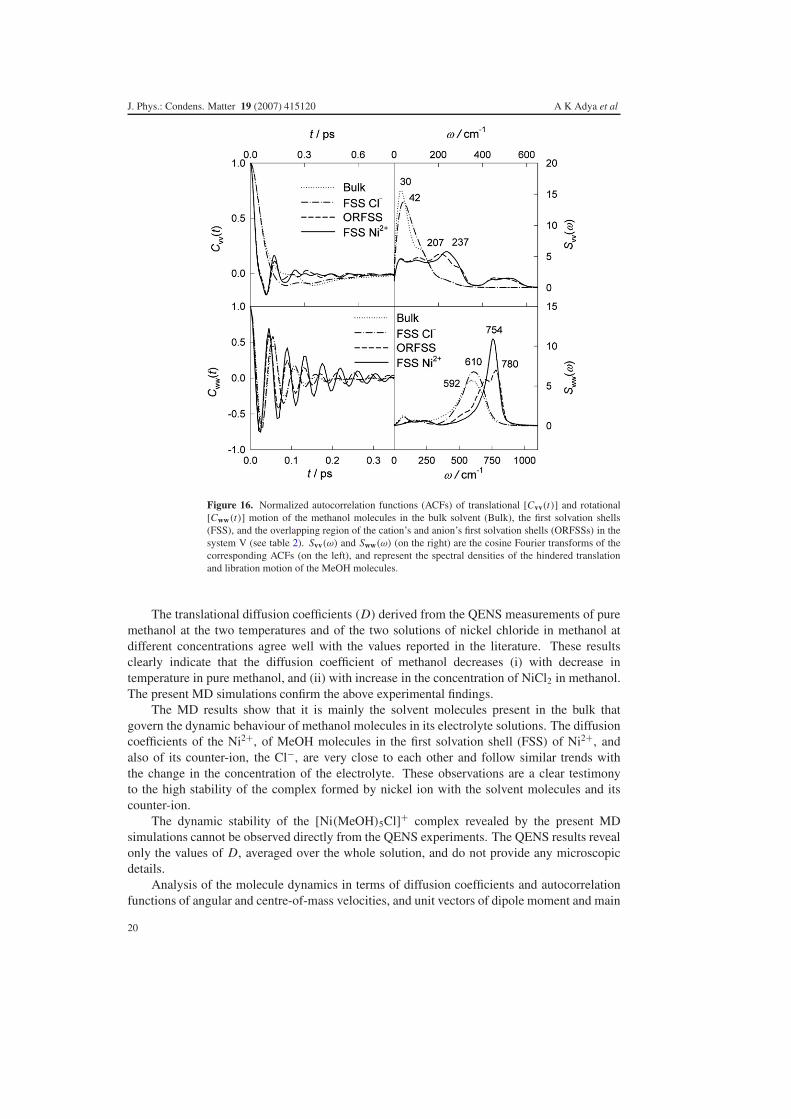
Figure 16. Normalized autocorrelation functions (ACFs) of translational [Cvv(t)] and rotational[Cww(t)] motion of the methanol molecules in the bulk solvent (Bulk), the first solvation shells(FSS), and the overlapping region of the cation’s and anion’s first solvation shells (ORFSSs) in thesystem V (see table 2). Svv(ω) and Sww(ω) (on the right) are the cosine Fourier transforms of thecorresponding ACFs (on the left), and represent the spectral densities of the hindered translationand libration motion of the MeOH molecules.
The translational diffusion coefficients (D) derived from the QENS measurements of puremethanol at the two temperatures and of the two solutions of nickel chloride in methanol atdifferent concentrations agree well with the values reported in the literature. These resultsclearly indicate that the diffusion coefficient of methanol decreases (i) with decrease intemperature in pure methanol, and (ii) with increase in the concentration of NiCl2 in methanol.The present MD simulations confirm the above experimental findings.
The MD results show that it is mainly the solvent molecules present in the bulk thatgovern the dynamic behaviour of methanol molecules in its electrolyte solutions. The diffusioncoefficients of the Ni2+, of MeOH molecules in the first solvation shell (FSS) of Ni2+, andalso of its counter-ion, the Cl−, are very close to each other and follow similar trends withthe change in the concentration of the electrolyte. These observations are a clear testimonyto the high stability of the complex formed by nickel ion with the solvent molecules and itscounter-ion.
The dynamic stability of the [Ni(MeOH)5Cl]+ complex revealed by the present MDsimulations cannot be observed directly from the QENS experiments. The QENS results revealonly the values of D, averaged over the whole solution, and do not provide any microscopicdetails.
Analysis of the molecule dynamics in terms of diffusion coefficients and autocorrelationfunctions of angular and centre-of-mass velocities, and unit vectors of dipole moment and main
20

J. Phys.: Condens. Matter 19 (2007) 415120 A K Adya et al
Figure 17. Normalized autocorrelation functions (ACFs) of translational [Cvv(t)] and rotational[Cww(t)] motion of the methanol molecules in the bulk solvent (Bulk), the first solvation shells(FSS), and the overlapping region of the cation’s and anion’s first solvation shells (ORFSSs) in thesystem VI (see table 2). Svv(ω) and Sww(ω) (on the right) are cosine Fourier transforms of thecorresponding ACFs (on the left), and represent the spectral densities of the hindered translationand libration motion of the MeOH molecules.
inertia axes show that a cation of small size and high charge, such as Ni2+, forms a dynamicallywell-defined solvation shell. Also, with decrease in the ion–molecule distance, the mobility ofsolvent molecules decreases significantly for such ions of high charge density.
Acknowledgments
AKA, is grateful to the Institute Laue Langevin (ILL, Grenoble) for allocation of neutron beamtime, Dr M R Johnson (ILL) for help with the QENS experiments, and the University of AbertayDundee (UAD), UK, for support of his research activities. ONK thanks the Kharkiv NationalUniversity, Ukraine, for providing him the necessary resources, and the UAD for hosting hisvisits. AKA gratefully acknowledges the financial support received from the Carnegie Trust(UK), and the Royal Society of Edinburgh (UK) to enable mutual exchange of visits betweenthe collaborating partners from Ukraine (ONK) and the UK (AKA).
References
[1] Frank H S and Wen W-Y 1957 Discuss. Faraday Soc. 24 133[2] Neilson G W and Enderby J E 1996 J. Phys. Chem. 100 1317[3] Neilson G W and Adya A K 1997 Annu. Rep. C: Royal Soc. Chem. 93 101
21

J. Phys.: Condens. Matter 19 (2007) 415120 A K Adya et al
[4] Adya A K 2002 Molten Salts from Fundamentals to Applications ed M Gaune-Escard (Dordrecht: Kluwer) p 107[5] Neilson G W, Adya A K and Ansell S 2002 Annu. Rep. C: Royal Soc. Chem. 98 273[6] Adya A K 2005 J. Ind. Chem. Soc. 82 1197[7] Hewish N A, Enderby J E and Howells W S 1983 J. Phys. C: Solid State Phys. 16 1777[8] Kunz W, Calmettes P and Bellissent-Funel M-C 1993 J. Chem. Phys. 99 2079[9] Salmon P S 1987 J. Phys. C: Solid State Phys. 20 1573
[10] Novikov A G, Rodnikova M N, Savostin V V and Sobolev O V 1997 Physica B 234–236 340[11] Bermejo F J, Batallan F, Enciso E, White R, Dianoux A J and Howells W S 1990 J. Phys.: Condens. Matter
2 1301[12] Adya A K, Kalugin O N, Volobuev M N and Kolesnik Ya V 2001 Mol. Phys. 99 835[13] Kalugin O N, Adya A K, Volobuev M N and Kolesnik Ya V 2003 Phys. Chem. Chem. Phys. 5 1536[14] Kalugin O N and Adya A K 2000 Phys. Chem. Chem. Phys. 2 11[15] Adya A K and Kalugin O N 2000 J. Chem. Phys. 113 4740[16] Karyakin Yu V and Angelov I U 1974 Pure Chemical Substances (Moscow: Khimiya Publishers)[17] Pratt K C and Wakeham W A 1977 J. Chem. Soc. Faraday Trans. II 73 997[18] Sampson T E and Carpenter J M 1969 J. Chem. Phys. 51 5543[19] Barthel J, Wachter R and Gores H-J 1979 Modern Aspects of Electrochemistry vol 13, ed B E Conway and
J O’M Bockis (New York: Plenum) p 1[20] Kolesnik Ya V, Kalugin O N and Volobuev M N 2001 Khim. Fiz. (Russ.) 20 16[21] Kalugin O N, Volobuev M N and Kolesnik Ya V 1999 Kharkov Univ. Bull., Chem. Ser. 454 58[22] Berendsen H J C, Postma J P M, van Gunsteren W, DiNola A and Haak J R 1984 J. Chem. Phys. 81 3684[23] Allen M P and Tildesley D J 1987 Computer Simulation of Liquids (Oxford: Clarendon)[24] Neumann M 1985 J. Chem. Phys. 82 5663[25] Haughney M, Ferrario M and McDonald I R 1987 J. Phys. Chem. 91 4934[26] Bianchi L, Kalugin O N, Adya A K and Wormald C J 2000 Mol. Simul. 25 321[27] Peng Z, Ewig C S, Hwang M-J, Waldman M and Hagler A T 1997 J. Phys. Chem. A 101 7243[28] Odelius M, Ribbing K and Kowalewski J 1995 J. Chem. Phys. 103 1800[29] Berendsen M J C, Grigera J R and Straatsma T P 1987 J. Phys. Chem. 91 6271[30] Impey R W, Madden P A and McDonald I R 1985 J. Chem. Phys. 87 5071
22
Copyright © 2022 FDOKUMEN