Dynamic and Transparent Analysis of Commodity Production Systems
19
Dynamic and Transparent Analysis of Commodity Production Systems Aristide Fattori † Roberto Paleari † Lorenzo Martignoni ‡ Mattia Monga † {aristide,roberto}@security.dico.unimi.it [email protected] [email protected] Dip. di Informatica e Comunicazione † Dip. di Fisica ‡ Università degli Studi di Milano Università degli Studi di Udine I-20135 Milan, Italy I-33100 Udine, Italy ABSTRACT We propose a framework that provides a programming in- terface to perform complex dynamic system-level analyses of deployed production systems. By leveraging hardware support for virtualization available nowadays on all com- modity machines, our framework is completely transparent to the system under analysis and it guarantees isolation of the analysis tools running on its top. Thus, the internals of the kernel of the running system needs not to be modi- fied and the whole platform runs unaware of the framework. Moreover, errors in the analysis tools do not affect the run- ning system and the framework. This is accomplished by installing a minimalistic virtual machine monitor and mi- grating the system, as it runs, into a virtual machine. In order to demonstrate the potentials of our framework we developed an interactive kernel debugger, nicknamed Hy- perDbg. HyperDbg can be used to debug any critical kernel component, and even to single step the execution of exception and interrupt handlers. Categories and Subject Descriptors D.2.5 [Software Engineering]: Testing and Debugging— Debugging aids, Monitors, Tracing ; D.4.9 [Operating Sys- tems]: Systems Programs and Utilities General Terms Verification Keywords hardware virtualization, debugging, system analysis 1. INTRODUCTION Operating systems are peculiar and very complex pieces of software whose internals are critically vital for a system: a failure, or a bottleneck, in any of their parts can lead to To appear in the 25 th IEEE/ACM International Conference on Automated Software Engineering, Antwerp, Belgium, 20-24 September 2010 catastrophic consequences. Therefore, special care is needed to develop, analyze, test, and profile them. To simplify their task, developers and analysts rely on a large variety of tools and analysis techniques. Some of them are specific for study- ing static properties of the operating system, while others are more specific for studying dynamic properties. In par- ticular, the latter class of tools and techniques is nowadays very popular among kernel developers and analysts because it allows them to collect the information very quickly, while hiding many of the intricacies of the kernel, and can even be used on running production systems. Existing approaches for dynamic analysis of operating sys- tems (e.g., debugging, profiling, and tracing) can be roughly classified in two groups: kernel-based and VMM-based. The approach taken by the first group is to include some com- ponent into the kernel in order to intercept all the events of interest (e.g., the creation of a new process, the execution of a system call, and the execution of a kernel function) and to execute a specific action when such events occur [2, 11, 14, 18, 20]. This solution requires the installation of specific hooks in the kernel to monitor run-time events and it might be very difficult to apply to operating systems that do not natively offer facilities for dynamic analysis, especially when the source code is not available. The approach taken by the second group is to run the kernel and user-space applica- tions in a virtual machine and to intercept, and respond to, the events of interest from the virtual machine moni- tor (VMM) [9]. Although this approach guarantees trans- parency and has a loose dependency on the operating sys- tem internals, it cannot be used in all the settings, since it implies that the system must be run as a guest of a vir- tual machine and production systems not running in virtual machines cannot be analyzed. Moreover, VMM-based solu- tions typically virtualize hardware devices, to allow multiple guests to share the same physical peripherals. This makes software virtualization approaches unsuitable to assist the analysis of components that need to interact directly with the underlying hardware. In this paper we propose a framework that brings to- gether the advantages of both approaches: it can be used on commodity production systems (i.e., off-the-shelf products, whose source code or debugging symbols are not necessarily available), since it does not require to instrument the sys- tem under test, and it is able to inspect systems running on real hardware, since it does not require an emulation con- tainer. Similarly to existing frameworks, the analyses that can be built on top of our framework include profiling and 1 arXiv:1006.5845v1 [cs.OS] 30 Jun 2010
Transcript of Dynamic and Transparent Analysis of Commodity Production Systems

Dynamic and Transparent Analysis of CommodityProduction Systems
Aristide Fattori† Roberto Paleari† Lorenzo Martignoni‡ Mattia Monga†
{aristide,roberto}@security.dico.unimi.it [email protected] [email protected]
Dip. di Informatica e Comunicazione† Dip. di Fisica‡
Università degli Studi di Milano Università degli Studi di UdineI-20135 Milan, Italy I-33100 Udine, Italy
ABSTRACTWe propose a framework that provides a programming in-terface to perform complex dynamic system-level analysesof deployed production systems. By leveraging hardwaresupport for virtualization available nowadays on all com-modity machines, our framework is completely transparentto the system under analysis and it guarantees isolation ofthe analysis tools running on its top. Thus, the internalsof the kernel of the running system needs not to be modi-fied and the whole platform runs unaware of the framework.Moreover, errors in the analysis tools do not affect the run-ning system and the framework. This is accomplished byinstalling a minimalistic virtual machine monitor and mi-grating the system, as it runs, into a virtual machine. Inorder to demonstrate the potentials of our framework wedeveloped an interactive kernel debugger, nicknamed Hy-perDbg. HyperDbg can be used to debug any criticalkernel component, and even to single step the execution ofexception and interrupt handlers.
Categories and Subject DescriptorsD.2.5 [Software Engineering]: Testing and Debugging—Debugging aids, Monitors, Tracing ; D.4.9 [Operating Sys-tems]: Systems Programs and Utilities
General TermsVerification
Keywordshardware virtualization, debugging, system analysis
1. INTRODUCTIONOperating systems are peculiar and very complex pieces
of software whose internals are critically vital for a system:a failure, or a bottleneck, in any of their parts can lead to
To appear in the 25th IEEE/ACM International Conference on AutomatedSoftware Engineering, Antwerp, Belgium, 20-24 September 2010
catastrophic consequences. Therefore, special care is neededto develop, analyze, test, and profile them. To simplify theirtask, developers and analysts rely on a large variety of toolsand analysis techniques. Some of them are specific for study-ing static properties of the operating system, while othersare more specific for studying dynamic properties. In par-ticular, the latter class of tools and techniques is nowadaysvery popular among kernel developers and analysts becauseit allows them to collect the information very quickly, whilehiding many of the intricacies of the kernel, and can even beused on running production systems.
Existing approaches for dynamic analysis of operating sys-tems (e.g., debugging, profiling, and tracing) can be roughlyclassified in two groups: kernel-based and VMM-based. Theapproach taken by the first group is to include some com-ponent into the kernel in order to intercept all the events ofinterest (e.g., the creation of a new process, the executionof a system call, and the execution of a kernel function) andto execute a specific action when such events occur [2, 11,14, 18, 20]. This solution requires the installation of specifichooks in the kernel to monitor run-time events and it mightbe very difficult to apply to operating systems that do notnatively offer facilities for dynamic analysis, especially whenthe source code is not available. The approach taken by thesecond group is to run the kernel and user-space applica-tions in a virtual machine and to intercept, and respondto, the events of interest from the virtual machine moni-tor (VMM) [9]. Although this approach guarantees trans-parency and has a loose dependency on the operating sys-tem internals, it cannot be used in all the settings, since itimplies that the system must be run as a guest of a vir-tual machine and production systems not running in virtualmachines cannot be analyzed. Moreover, VMM-based solu-tions typically virtualize hardware devices, to allow multipleguests to share the same physical peripherals. This makessoftware virtualization approaches unsuitable to assist theanalysis of components that need to interact directly withthe underlying hardware.
In this paper we propose a framework that brings to-gether the advantages of both approaches: it can be used oncommodity production systems (i.e., off-the-shelf products,whose source code or debugging symbols are not necessarilyavailable), since it does not require to instrument the sys-tem under test, and it is able to inspect systems running onreal hardware, since it does not require an emulation con-tainer. Similarly to existing frameworks, the analyses thatcan be built on top of our framework include profiling and
1
arX
iv:1
006.
5845
v1 [
cs.O
S] 3
0 Ju
n 20
10

tracing of the kernel and user-space applications, interactivedebugging, or even extension of system features. However,differently from existing frameworks, ours is fully dynamic,transparent, loosely dependent on the operating system, andfault-tolerant with respect to possible defects in the anal-ysis code. First, our framework does not require recompi-lation or rebooting of the target system. Thus, it can beused to analyze any running production system, includingcommodity operating systems lacking native support for in-strumentation and systems not running in virtual machines.Second, the framework is not invasive, since analyses can beperformed on a virtually unmodified system: as explained inthe paper, only a minimal driver needs to be installed and noparts of the kernel are patched in any way. Moreover, sincethe framework itself is not accessible from the target system,its code cannot be detected by malicious code or unwittinglyinfluence buggy operating system components. Thus, theinfrastructure can be applied to any operating system, asthe majority of the facilities it supports are completely OS-independent, and the only OS-dependent functionalities arejust provided to ease the development of analysis tools. Fi-nally, the framework is fault-tolerant, as it guarantees thata defect in an analysis tool built on top of it do not damagethe framework itself nor the analyzed system.
Our framework leverages hardware extensions for virtual-ization available on commodity x86 CPUs [1, 15]. Hardware-support for virtualization allows the development of virtualmachine monitors that are very efficient, completely trans-parent, and non invasive to the systems running in the vir-tual machine. To overcome the major limitation of tradi-tional VMM-based approaches (i.e., the impossibility to an-alyze productions systems not running in a virtual machine),our framework exploits a feature of the hardware that allowsto install a virtual machine monitor and to migrate a run-ning system into a virtual machine. When the analysis iscompleted, the original mode of operation of the system canbe restored. Practically speaking, our framework is a mini-malistic virtual machine monitor acting as a broker betweenthe analyzed system and the analysis tool. The frameworkabstracts low-level events occurring in the analyzed systeminto high-level events and guarantees fault-tolerance by re-lying on the hardware to run the analysis tool in a isolatedexecution environment.
To demonstrate the potentials of our framework we havedeveloped an interactive kernel debugger, nicknamed Hy-perDbg, constructed entirely using the programming in-terface exposed by our infrastructure. HyperDbg addslive and interactive debugging support to Microsoft Win-dows XP, so far only possible using very invasive tools, likeSyser [19], or traditional VMM-based debuggers. Hyper-Dbg can be used to debug any component of the Win-dows kernel, including interrupt/exception handlers, devicedrivers, and even supports single instruction stepping. Be-ing completely separated from the debuggee, HyperDbg istransparent to the analyzed system and can be even used toanalyze protected and malicious code.
In summary, the paper makes the following contributions.
1. We propose a framework to perform complex dynamicsystem-level analyses of commodity production sys-tems. Compared to existing frameworks, the one wepropose guarantees transparency, efficiency, and doesnot require the target system to be already installedon a virtual machine.
2. We implemented our framework in an experimentalprototype for Microsoft Windows XP.
3. We describe the design and the implementation of Hy-perDbg, a kernel-level interactive debugger built ontop our framework.
Both the analysis framework and HyperDbg are avail-able at http://security.dico.unimi.it/hyperdbg/ and isreleased under the terms and conditions of the GPL (v3.0)license.
2. RELATED WORKThe framework proposed in this paper shares many simi-
larities with frameworks and techniques extensively exploredin the past. However, by exploiting recent facilities availableof modern Intel x86 CPUs, our framework is able to combineand to offer simultaneously the main benefits introduced byprevious research work.
Dynamic Kernel Instrumentation.DTrace is a facility included into the Solaris kernel that al-
lows the dynamic instrumentation of production systems [2].The key points of DTrace are efficiency and flexibility. First,the instrumentation framework itself introduces no over-head. Second, the framework provides tens of thousandsof instrumentation points, and the actions to be taken canbe expressed in terms of a high-level control language, thatalso includes a number of mechanisms to guarantee run-time safety. Similarly, KernInst is a dynamic instrumen-tation framework for commodity kernels [20]. KernInst hasbeen developed mainly to gather information about the per-formances of a running kernel, but it has also been em-ployed for run-time kernel optimization. Differently fromDTrace, KernInst does not provide any mechanism for run-time safety of the instrumentation routines. Unfortunately,the aforementioned approaches are not transparent, as theyrequire direct modifications of the operating system kernel,achieved by loading a kernel-mode module. Moreover, noneof them is OS-independent, and they and cannot be appliedto closed-source operating systems. Our framework doesnot suffer these limitations since it can instrument the ker-nel without modifying it and does not rely on any facilityoffered by the kernel.
Kernel-level Debugging.Several efforts have been made to develop efficient and
reliable kernel-level debuggers. Indeed, these applicationsare essential for many activities, such as the developmentof device drivers. One of the first and most widely usedkernel-level debuggers that targeted the Microsoft Windowsoperating system was SoftICE [18], but today the projecthas been discontinued. However, both commercial [19] andopen-source [17] alternatives to SoftICE appeared. Mod-ern versions of Windows already include a kernel debuggingsubsystem [14]. Unfortunately, to exploit the full capabili-ties of Microsoft’s debugging infrastructure, the host beingdebugged must be physically linked (e.g., by means of a se-rial cable) with another machine. All these approaches sharea common factor: to debug kernel-level code, they leverageanother kernel-level module. Obviously, that is like a dogchasing its tail. The framework proposed in this paper doesnot require any kernel support nor to modify the kernel toadd the missing support at run-time.
2

Operating system kernel
User modeKernel mode
Userprocess
Userprocess
Operating system kernel
User modeKernel mode
Userprocess
Userprocess
Non-root modeRoot mode
Framework
Analysistool
Install
Remove Exit
Insp
ect
Figure 1: Overview of the framework
Frameworks Based on Virtual Machines.Instead of relying on a kernel-level module to monitor
other kernel code, an alternative approach consists of run-ning the target code inside a virtual machine, and to per-form the required analyses from the outside [9]. In [10, 22, 7]the authors propose virtual machines with execution replay-ing capabilities: a user can move forward and backwardsthrough the execution history of the whole system, bothfor debugging and for understanding how a hacker intrusiontook place. Finally, in [3] Chow et al. propose Aftersight,a system that decouples execution recording from executiontrace analysis, thus reducing the overhead suffered by thesystem where the guest operating system is run. Nowa-days, Aftersight is part of the VMware platform, and othermainstream commercial products provide similar capabili-ties. The framework proposed in this paper can providethese functionalities even on systems not running in any vir-tual machine.
Aspect-oriented Programming.Aspect-oriented programming is a paradigm that promises
to increase modularity by encapsulating cross-cutting con-cerns into separated code units, called “aspects”, whose “ad-vice” code is woven into the system automatically, by speci-fying the properties of the join-points. AspectC is an aspect-oriented framework that is used to customize (at compile-time) operating system kernels [4, 12, 13]. More dynamicapproaches have been proposed: for example TOSKANAprovides before, after and around advices for in-kernel func-tions and supports the implementation of aspects themselvesas dynamically exchangeable kernel modules [8]. The frame-work proposed in this paper allows to achieve the same goalwhile being transparent and fault-tolerant.
3. OVERVIEW OF THE FRAMEWORKFigure 1 depicts the architecture of our framework, the
installation and removal processes, and the migration of theoperating system and its applications into a virtual machine.Our framework consists of a virtual machine monitor (VMMfor short) that provides a programming interface for the de-velopment of system-level analysis tools. As in traditionalVMM-based analysis approaches, the analysis tool is runwithin the VMM and thus completely transparent to guestsof the virtual machine. However, compared to traditional
VMM-based ones, ours does not require the system to bealready running inside any virtual machine. To achieve thisgoal, our framework leverages hardware extensions for virtu-alization available on all modern x86 CPUs [15, 1] (which areunused in the majority of the deployments). In short, theseextensions augment the instruction set architecture with twonew modes of operation: VMX root mode and VMX non-root mode1. These new modes of operation separate logicallythe virtual machine monitor from a guest without having tomodify the latter. More precisely, we exploit a particularfeature of these extensions that allows for late launching ofVMX modes. Late launching of VMX modes permits toinstall a virtual machine monitor even if the system has al-ready been bootstrapped. In other words, late launchingallows to migrate (temporarily) a running operating systemin a virtual machine, and to analyze and control the execu-tion of the system from the monitor. Through the rest of thepaper, we use the term “guest” to refer to the system underanalysis that has been migrated into a virtual machine.
Practically speaking, the running operating system is notmigrated anywhere and not touched at all. Rather, bylaunching VMX modes, the execution environment is ex-tended with the two aforementioned operating modes; therunning operating system is then associated with non-rootmode, while the VMM is associated with root mode. Thus,in all respects, the operating system and its applications be-come a guest of our special virtual machine. Following thesame principle, the VMM can be unloaded, and the originalmode of execution of the operating system restored, by sim-ply disabling VMX modes. After the launch of the VMXmodes, the execution of the guest can continue exactly asbefore, even in terms of interactions with the underlyinghardware devices. However, during its execution, the guestmight be interrupted by an exit to root mode. Like hardwareexceptions, exits are events that block the execution of theguest, switch from non-root mode to root mode, and transferthe control to the VMM. Differently from exceptions, the setof events triggering exits to root mode can be configured dy-namically by the VMM. A routine of the VMM handles theexit and eventually enters non-root mode to resume the ex-ecution of the guest. Being executed at the highest privilegelevel, the routine handling the exit has complete read/writecontrol of the state of the guest system (of both memoryand CPU registers).
The framework itself does not perform any analysis. It isonly responsible for handling a small set of exits to controlall accesses to the memory management unit of the CPU, toprevent the guest from accessing the physical memory loca-tions holding the code and the data of the framework. Onthe other hand, the framework provides a flexible API to de-velop tools to perform sophisticated analyses of both kerneland user code running in the guest. Using the function-alities provided through the API, the tool can request theframework to monitor certain events that might occur dur-ing the execution of the guest; when such events occur, it caninspect, and even manipulate, the state of the guest. Theevents that can be monitored include, but are not limited to,system call invocations, function calls, context switches andI/O operations. Practically speaking, events are monitoredthrough exits to root mode. Thus, a request of the analysistool to monitor a certain high-level event (e.g., the execu-
1VMX (non-) root mode is the terminology used by Intel;AMD adopts a different terminology.
3

7. Interrupt
Event gate Trap gate API
Analysis tool1.
Exit
2.
Noti
fica
tion
3. API call6. Exception
4. API request
4a.
Insp
ect/
man
ipu
late
4b. Request event notification
5. Recover information about events
Non-root mode
Root mode
User mode
Kernel mode
Hardware
Framework
Timer Disk NetworkVideo
Figure 2: A close-up of the framework
tion of a system call) is translated by the API of the frame-work into a sequence of low-level operations that guaranteethat all the occurrences of such event in the guest trigger anexit to root mode. Similarly, the framework translates theexit into a higher-level event and notifies the occurrence ofthe event to the analysis tool. Once notified, the tool canrecover information about the event (e.g., arguments andreturn value of a system call), using the inspection function-alities offered by the API.
An important requirement for the analysis of productionsystems is that analysis tools must not interfere with thecorrect execution of the guest. This is particularly impor-tant for faults and deadlocks that might occur in the analysistool. The approach we adopt is to run the tool in a less privi-leged execution environment, isolated from the analyzed sys-tem and from the framework. The tool can interact with theguest only through the API exposed by the framework. Thisapproach guarantees the framework the ability to interceptany fault occurring in the tool, to mediate all accesses tothe analyzed system (and to prevent write accesses), and toterminate the tool in case of deadlocks or other anomaloussituations.
4. DESIGN AND IMPLEMENTATIONFigure 2 shows a more detailed view of the architecture
of our framework. Intuitively, this architecture is very simi-lar to that of traditional operating systems: the frameworkplays the role of the kernel and the analysis tool plays therole of a user-space application. As will become clear later,this architecture prevents buggy analysis tools from compro-mising the guest system and the framework. The separationbetween these two parts is made possible by the fact that,when VMX is enabled, root and non-root modes offer twofully-featured execution environments. Thus, like the guestrunning in non-root mode, the framework running in rootmode can rely on privilege separation to isolate the analysistool and can handle independently interrupts and exceptionsthat might occur while executing in root mode.
When an exit to root mode interrupts the execution ofthe guest, the event is delivered to the event gate (step 1
in Figure 2). The event gate is responsible for abstract-ing low-level events into higher-level ones, and to notify theanalysis tool if the latter has requested to do so (step 2).On startup the analysis tool requests the framework to benotified of certain events (not shown in the figure). Thetool can use the API provided by framework to query extrainformation about the event (e.g., the content of the stacklocation storing one of the arguments of a function). Sincethe tool is isolated from the framework, API functions areinvoked through software interrupts. Thus, requests comingfrom the analysis tool are received by the trap gate (step3), then forwarded to the component implementing the API(step 4). The tool can perform two types of API calls: (step4a) to inspect or manipulate the state of the guest, and (step4b) to control event notifications (e.g., enable or disable thenotification of certain events). Note that the componentimplementing the API is also used by the framework itself(step 5) to recover extra information about events (e.g., thereturn address of a function stored in the stack). The trapgate also serves the purpose of detecting exceptions (e.g.,page faults) that might occur during the execution of theanalysis tool. If the trap gate intercepts an exception (step6), it terminates the faulty tool and unloads the framework,to resume the normal operation mode of the system. Finally,the trap gate is also used to handle timer interrupts (step7), that, as will be discussed in Section 4.4, are employed toenforce a time-bound on the execution of the tool.
The functionalities provided by the API of the frameworkcan be classified into two classes: execution and I/O tracingand state inspection and manipulation. The following para-graphs describe briefly the API. More details are given inSections 4.2 and 4.3.
Execution and I/O tracing facilities allow a tool to inter-cept the occurrence in the analyzed system of certain eventsand certain I/O operations respectively. Table 1 reports themain types of events that can be traced. For each event, thetable also reports the arguments associated to the event; ar-guments are information about the events most commonlyused in tools. For example, the events FunctionEntry andSyscallEntry are used to trace functions and system callsrespectively. The arguments associated to the FunctionEn-
try event are the address (or the name) of the functioncalled, the caller and the return address. Another exam-ple is the ProcessSwitch event that can be used to tracecontext switches between processes (not threads). From thepoint of view of the analysis tool all the events are handledin the same way: the tool can subscribe to any event and,when the event occurs, can inspect its arguments and takethe proper actions. However, at the framework-level, certainevents are different from other ones. Indeed, some of them(e.g., context switches between processes) can be traced di-rectly by the hardware. That is, the event triggering the exitcorresponds exactly to the event being traced. Other eventsinstead (e.g., function calls and returns) cannot be traceddirectly by the hardware. In all these cases the frameworkrelies on other low-level events to trace the execution andthen abstract exiting low-level events into higher-level ones,meaningful for the analysis tool.
Arguments can optionally be used as conditions, to limitthe tracing to a subset of all the events. Conditions on eventsserve two purposes. First, conditions allow to simplify theanalysis tools, since events that do not match the requestedconditions are discarded by the framework and thus do not
4

Event Description Arguments
ProcessSwitch Context (process) switch —Exception Execution Exception vector, faulty instruction, error codeInterrupt Hardware or software interrupt Interrupt vector, requesting instructionBreakpointHit Execution breakpoint Breakpoint addressWatchpointHit Watchpoint on data read/write Watchpoint address, access type, hitting instructionFunctionEntry Function call Function name/address, caller/return addressFunctionExit Return from function Function name/address, return addressSyscallEntry System call invocation System call number, caller/return addressSyscallExit Return from system call System call number, return addressIOOperationPort I/O operation throught hardware port Port number, access typeIOOperationMmap Memory-mapped I/O operation Memory address, access type
Table 1: Events traceable using our framework and corresponding arguments (the argument that representsthe current process is omitted, as it is common to all the events)
need to be handled by the tool. Second, some conditionsallow preemptive filtering of the events. In other words,the framework configures a priori which events trigger anexit, instead of filtering out exits caused by uninterestingevents. For example, in the case of the IOOperationPort
event, preemptive filtering means to configure the CPU suchthat only I/O operations involving a specific I/O port triggeran exit. This feature is very important to minimize thenumber of exits and thus the overall overhead.
State inspection and manipulation primitives can be usedby the tool to access the state of the guest, in order to extractmore detailed information about events or other data use-ful for the analysis. For example, these primitives allow toextract the arguments of an invoked function, or to inspectthe internal structures of the guest operating system. Notethat, by default, write access to guest state is not grantedto a tool. If necessary, such permission can be enabled atcompile-time. Obviously, in this case the framework cannotprotect the state of the guest from dangerous modifications.
4.1 Framework and Analysis Tool LoadingThe framework and the analysis tool are loaded by a min-
imal kernel driver. This is unavoidable since the operationswe need to perform to load the framework require maxi-mum privileges and can be performed only by the kernel ofthe operating system. The driver, however, is indeed verysimple and we put extreme care in avoiding any interferencewith the kernel. Moreover, since once loaded the frameworkis completely invisible to the system, we unload the driverimmediately as soon as the framework has been installed.
When VMX modes are enabled, a special VMX data struc-ture (VMCS in Intel terminology) is made accessible initiallyto the loader, and subsequently, when the loading is com-pleted, only to the framework. This data structure stores thehost state, guest state, and the execution control fields. Thehost state stores the state of the processor that is loadedon exits to root mode, and consists of the state of all theregisters of the CPU (except for general purpose registers).Similarly, the guest state stores the state of the processorthat is loaded on entries to non-root mode. The guest stateis updated automatically at every exit, such that the sub-sequent entry to non-root mode will resume the executionfrom the same point. The execution control fields allow afine-grained specification of which events should trigger anexit to root mode.
The task of the loader is to enable VMX modes and toconfigure the VMX data structure such that the execution ofthe operating system and user-space applications continue to
run in non-root mode, while the framework and the analysistool are executed in root mode. Moreover, the loader hasto configure the CPU such that all the events necessary forthe tool to trace the execution of the system trigger exits toroot mode. When the initialization is completed, the driverunloads itself and resumes the execution of the system.
Guest State Configuration.The guest state is initialized to the current state of the
system. In this way, when the virtual machine is launchedand execution enters non-root mode, the guest operatingsystem will resume its execution as if nothing happened.A tricky problem when initializing non-root mode concernsthe management of the memory. More precisely, we mustprevent the newly created guest to use and access the phys-ical memory frames allocated to the framework and to thetool. Otherwise, the guest could detect and even corruptthe framework. Most recent CPUs provide hardware facil-ities for memory virtualization (e.g., Intel Extended PageTable extension). If these facilities are not available, mem-ory virtualization must be implemented entirely via soft-ware. Briefly, software memory virtualization consists ofintercepting all guest operations to manipulate the page ta-ble (the data structure the CPU uses for virtual-to-physicaladdress translation) and in ensuring that none of the phys-ical frames allocated to the framework and to the analysistool are mapped into the guest. In case the guest tries tomap a reserved physical frame, the framework assigns theguest a different one and masquerades the difference.
Host State Configuration.The host state is initialized as follows. The CPU is config-
ured to use, when in root mode, a dedicated address spaceand a dedicated interrupt descriptor table (IDT). This con-figuration simplifies the separation of the analyzed systemfrom the framework and allows to detect and handle inter-rupts and exceptions that occur in root mode. Differentlyfrom the address of the entry point of non-root mode, whichis updated at every exit to allow to resume execution ofthe guest from where it was interrupted, the address of theentry point of root mode is fixed. The entry point is setto the address of the routine that takes care of dispatchingan exit event to the appropriate handler and that in turnmight notify the analysis tool (i.e., the entry point of theevent gate).
Execution Control Fields Configuration.To reduce the run-time overhead suffered by the guest
5

Event Exit causeNativeexit
ProcessSwitch Change of page table address√
Exception Exception√
Interrupt Interrupt√
BreakpointHit Debug except. / Page fault except.WatchpointHit Page fault except.FunctionEntry Breakpoint on function entry pointFunctionExit Breakpoint on return addressSyscallEntry Breakpoint on syscall entry pointSyscallExit Breakpoint on return addressIOOperationPort Port read/write
√IOOperationMmap Watchpoint on device memory
Table 2: Techniques for tracing events
system, the execution control fields are configured to mini-mize the number of events that trigger an exit to root mode.When the tool is initialized, it specifies which events mustbe intercepted. Subsequently, in response to the invocationof API functions, the configuration of the execution controlfields can be altered to intercept additional events or to ig-nore other ones.
4.2 Execution TracingTable 2 describes the technique used to trace all the events
currently supported by the framework. Low-level events(those with a mark in the last column) correspond directlyto exits to root mode (e.g., Exception). Other events aretraced through the aforementioned ones (e.g., Breakpoint-Hit), and others again are traced through the latter (e.g.,FunctionEntry).
Events that can be traced directly through the hardwareare process switches, exceptions, interrupts, and port-basedI/O operations. All these events exit conditionally: theyexit to root mode only when requested and can have op-tional exit conditions to limit exits to particular situations.The remaining of this section presents how we developed theprimitives for tracing higher-level events starting from theaforementioned low-level ones.
Breakpoints and watchpoints are two of the most compli-cated events to implement. Modern CPUs provide hardwarefacilities to realize efficient and transparent breakpoints andwatchpoints. Unfortunately, hardware-assisted breakpointsand watchpoints are limited in number (only 4) and sharedbetween non-root and root mode. Therefore, they cannotbe used simultaneously by the analyzed system and by theframework. The solution we adopt to allow an arbitrarynumber of breakpoints is to use software breakpoints. Asoftware breakpoint is a one-byte instruction that triggers abreakpoint exception when executed. Software breakpointsare enabled by replacing the byte at the address on whichwe want the breakpoint with the aforementioned instruction.When the breakpoint is hit, the original byte is restored andthe event is notified to the tool. If the breakpoint is not per-sistent the execution of the system is resumed. Otherwisethe instruction is emulated and then the breakpoint is setagain. Clearly, this approach to breakpoints is not trans-parent for the analyzed system. However, it is very efficient.An alternative and transparent approach is to use the sametechnique we use for watchpoints, as described in the nextparagraph. Our framework supports both approaches.
The approach used in our framework to implement soft-ware watchpoints is based on protecting the memory loca-tions from any access via hardware (or just from write ac-
cesses, depending on the type of watchpoint), such that anyaccess results in an exception [21]. More precisely, sincethe finest level of protection offered by the hardware is atthe page level, we mark the page containing the address onwhich we want to set the watchpoint as “non-present”. Anyfuture access to this page will result in a page fault exceptionthat will be intercepted by our framework. The frameworkanalyzes the exception and checks whether the accessed ad-dress corresponds to the address with the watchpoint. Ifthe watchpoint is hit, the framework delivers the event tothe analysis tool, otherwise it emulates the instruction, andthen resumes the normal execution of the guest. Emula-tion is necessary to execute the faulty instruction manually.Indeed, to prevent a second fault, the original permissionof the memory page accessed by the instruction must berestored before executing the faulty instruction. After theexecution of the instruction, the page must be marked againas “non-present” to catch future accesses.
Other higher-level events, such as function and system callentries and exits, are traced through breakpoints. When theanalysis tool requests the framework to monitor a certainfunction, the framework sets a breakpoint on the address ofthe entry point of the function. Later, when a breakpoint ishit, the framework checks whether the hit breakpoint cor-responds to a function entry point and, if so, it delivers theappropriate event (i.e., FunctionEntry) to the analysis tool.Function exits, instead, are traced by setting a breakpointon the return address. The framework discovers the returnaddress by setting a breakpoint on the function entry and byinspecting the stack frame of the function when the break-point on the entry point is hit. A similar approach is usedfor tracing system calls entries and exits.
The approach for tracing function calls and returns justdescribed allows to trace specific functions, whose names oraddresses are supplied by the tool. The tracing of all func-tion calls and returns is instead more complicated becauseit is not possible to know a priori the addresses of all func-tions’ entry points. The solution in this case is to performa static analysis to identify the addresses of all functions’entry points (e.g., by recognizing function prologues). Thisfeature is still not available in our current implementation ofthe framework. Nevertheless, if needed, the static analysiscould be performed directly in the tool. The tracing of allsystem calls is instead much easier, since they are all invokedthrough a common gate. The solution we adopt is to put abreakpoint on the entry point of the system call gate [6].
Beside execution tracing facilities, the framework also ex-poses to analysis tools the possibility of intercepting I/Ooperations with hardware peripherals. Software can interactwith hardware devices through hardware I/O ports, or it canleverage memory-mapped I/O. In the first case, VMX allowsto intercept the operation without any effort: the frameworksimply configures the execution control fields such that allthe interactions with the specific hardware ports trigger anexit to root mode; when such an exit occurs, the frame-work notifies the tool by means of a IOOperationPort event.However, for performance reasons, modern peripherals typ-ically resort to memory-mapped I/O. In this case, read andwrite operations do not involve any hardware port, as theyare performed directly on memory. To intercept such opera-tions we set a watchpoint on the appropriate memory region.Thus, when an access to it is detected, the framework deliv-ers a IOOperationMmap event to the tool.
6

4.3 State Inspection and ManipulationSeveral situations require to access the state of the guest
system in order to inspect, and optionally manipulate, boththe registers of the CPU and the memory. As an example,the framework could need to read the return address of afunction from the stack, to access the parameters of a systemcall from the processor registers, or to insert a breakpointinto the address space of a particular process. Similarly, theanalysis tool might need to extract data from the memoryof the guest.
The inspection and manipulation of CPU registers is astraightforward activity. These information are saved duringan exit and restored before an entry. Thus, the inspectionand manipulation of registers merely consists of reading orwriting the VMX guest state (or the memory of the frame-work, depending on the type of register).
Inspection and manipulation of memory locations is muchmore complex. When paging is enabled, virtual addressesare translated by the hardware into physical addresses ac-cording to the content of the page table and direct physicaladdressing is not possible. Each process has its own pagetable; therefore, different processes have different virtual-to-physical mappings and a process cannot access the memoryof the others. The framework is isolated from the guest us-ing the same approach and thus it has its own page tableand its own mapping. Consequently, the framework cannotdirectly access memory locations of guest processes. More-over, inspection is complicated by the fact that page tablescannot be traversed via software (but only via hardware):the page table is a multilevel table and pointers to lowerlevels are physical. To overcome this problem we have de-veloped a specific, OS-independent, algorithm that allows toaccess an arbitrary virtual memory location of an arbitraryprocess. The core of the algorithm is a primitive that al-lows to access arbitrary physical memory locations. This isaccomplished by mapping a given physical address p to anunused virtual address v in the page table of the framework,and subsequently by accessing v. Then, using this primi-tive, the algorithm can traverse the page table of a processof the guest via software by iteratively mapping the physicaladdresses stored in the table.
The framework exposes memory inspection and manipula-tion facilities, based on the aforementioned algorithm, to theanalysis tools through two API functions: GuestRead(p,a,-n ) and GuestWrite(p,a,data ). The former reads n bytesstarting from virtual address a of process p ; the latter writesthe content of buffer data into the address space of processp , starting from virtual address a . By default, to preservethe integrity of the guest, all GuestWrite operations are for-bidden. On top of this functions we have built higher-levelones that facilitates the extraction of functions’ arguments,null terminated strings, and to disassemble code.
4.4 Tool IsolationTo be able to use our infrastructure on a production sys-
tem, it is essential to guarantee that any defect in the anal-ysis tool will not affect the stability of the analyzed systemand of the framework. At this aim, the framework controlsthe execution of the analysis tool and, if any anomalous be-havior is observed, the whole infrastructure is automaticallyunloaded.
As we outlined at the beginning of this section, even ifthe analysis tool is executed in VMX root mode, it is still
constrained into a less privileged execution mode than theframework. Thus, any operation the tool performs on theguest must be mediated by the framework. This is exactlywhat happens in traditional operating systems: a user-modeprocess cannot access directly the resources of the operatingsystem, nor those of other user-mode processes, and any ac-tion it performs outside its address space must be mediatedby the kernel. Similarly in our context, to perform an opera-tion on the guest system, the tool must use the programminginterface offered by the framework.
In the default configuration, the framework does not al-low a tool to access in write-mode to the state of the guest.However, there is still the possibility that the execution ofan instruction of the tool raises an unexpected exception(e.g., a page fault on memory access, or a general protec-tion fault). When such an event occurs, the framework hasno way to handle the anomalous situation and to allow thetool to continue its execution. The only viable approach thatalso preserves the integrity of the guest system is to termi-nate the analysis tool and to remove the framework. At thisaim, the solution we adopt is to intercept unexpected excep-tions through the custom interrupt descriptor table (IDT)installed when launching VMX modes. The IDT receivesthe trap, and delivers it to the trap gate that eventuallyunloads the framework. Another problem that might arisewith a buggy analysis tool is non-termination: if the anal-ysis tool entered an infinite loop, the guest system wouldnever be resumed. To prevent this problem we added to theframework a minimalistic watchdog and set a time limit onthe execution of the tool. The limit is not on the whole exe-cution time of the tool, but rather on the execution time tohandle an event. Thus, the analysis tool could potentiallybe run forever, but with the guarantee that the executionof the analyzed system will be resumed within the specifiedtime limit. At this aim, before delivering an event to theanalysis tool, the framework resets a timer. Then, whilethe tool handles the event, the framework periodically re-gains the control of the execution and checks whether thetime limit has been exceeded. To do that the frameworkregisters, in the IDT, a custom interrupt handler to handletimer interrupts and programs the interrupt controller to de-liver only timer interrupts (that is necessary to prevent theframework to consume interrupts for all the other devices).Before returning to non-root mode, the framework repro-grams the interrupt controller to deliver all the interruptsto the analyzed system.
4.5 OS-dependent InterfaceOur framework provides a general programming interface
completely independent from the operating system runninginside the guest. However, in many cases some OS-specificfacilities can ease the analysis of the guest. As an example,the only OS-independent manner to identify a process is bymeans of the base address of its page table (typically storedinside the cr3 CPU register). However, it is quite awkwardto refer to processes using page table base addresses, and itis more natural to identify a process through its process id(PID) or through the name of the application it executes.
The OS-dependent interface we provide leverages virtualmachine introspection techniques [9] to analyze the inter-nal structures of the guest operating system to translateOS-independent information (e.g., process with page tablebase address 0x13cdc000) into something more user-friendly
7

Name Description
GetFuncAddr(n ) Return the address of the function nGetFuncName(a ) Return the name of the function at address aGetProcName(p ) Get the name of process with page directory
base address pGetProcPID(p ) Get the PID of process with page directory
base address pGetProcLibs(p ) Enumerate the dynamically linked libraries
loaded into process pGetProcStack(p ) Get the stack base for process pGetProcHeap(p ) Get the heap base for process pGetProcList() Enumerate processesGetDriverList() Enumerate device drivers
Table 3: OS-dependent API
(e.g., process notepad.exe). Moreover, using debuggingsymbols, the framework allows to resolve symbols’ namesand addresses (e.g., functions and global variables). In thisway, a tool can ask to interrupt the execution of the guestwhen function NtCreateFile is invoked, instead of referenc-ing the function through its address. Similarly, when a func-tion is invoked, it is possible to inspect its call-stack and toresolve the name of the caller functions and even recover thelibraries to which the various functions belong to. Some ofthe OS-dependent functionalities provided are summarizedin Table 3.
In case the guest operating system is not supported, theOS-dependent module is disabled, and only OS-independentfunctionalities are available. Our current implementationoffers an OS-dependent interface only for the Windows XPoperating system.
5. APPLICATIONSIn this section we present HyperDbg, an interactive ker-
nel debugger for Microsoft Windows XP we built on top ofour framework. In our strive to contribute to the open sourcecommunity, we released the code of HyperDbg, along withthe code of the framework, under the GPL (v3.0) license.The code is available at the following address:
http://security.dico.unimi.it/hyperdbg/
The section also discusses other possible applications thatcould be constructed using our framework.
5.1 HyperDbgHyperDbg is an interactive kernel debugger we developed
on top of our analysis framework. It offers all the featurescommonly found in kernel-level debuggers but, being com-pletely run in VMX root mode, it is OS-independent andgrants complete transparency to the guest operating systemand its applications. The debugger provides a simple graph-ical user interface to ease the interaction with the user. Thisinterface is activated in two circumstances: (i) when the userpresses a special hot-key or (ii) when the debugger receivesthe notification for an event that requires the attention ofthe user (e.g., when a breakpoint is hit). From this interfacethe user interacts with the debugger and can perform severaloperations, including setting breakpoints and watchpoints,tracing functions and system calls, and inspecting and ma-nipulating the state of the guest (since all interactive debug-gers allow to modify the state of the debuggee, we decidedto enable write access to the guest as well).
Figure 3: HyperDbg in action
Figure 3 shows HyperDbg in action2. In particular, thefigure shows the debugger notifying the event that inter-rupted the execution of the analyzed system, displaying afragment of the code of the process currently running in theanalyzed system and displaying a“backtrace”of the functioncalls that are currently active. Additionally, the debuggerdisplays information about the status of the registers at thetime the event occurred (in the case of the figure the event isthe pressure of the hot-key). To facilitate the analysis, thedebugger leverages OS-dependent information. For exam-ple, the screenshot in Figure 3 shows that the debugger re-solved the ID and the name of the process in a MS WindowsXP guest, by knowing how the process table is managed bythe operating system.
It is worth pointing out that HyperDbg can be used todebug any piece of code of the guest system, including crit-ical components such as the process scheduler, or interruptand exception handlers. Indeed, Figure 3 shows that theguest operating system has been stopped while executingthe PS/2 keyboard/mouse driver (i8042prt.sys). Thanksto the fact that the framework on which the debugger isbuilt on is completely transparent to the analyzed system,the user can use the keyboard to interact with the debug-ger even though the keyboard driver of the guest is beingdebugged.HyperDbg consists of less than 1600 lines of code: ∼25%
of the code implements the graphical interface, ∼23% ofthe code provides the facilities required for keyboard-baseduser interaction, and the remaining ∼52% is responsible forhandling events and for all the other interactions with theframework. Note that certain functionalities (e.g., disassem-bling a code region) are implemented directly in the frame-work since, most likely, they will be used for other types ofanalysis as well. The framework is about four times big-ger than the debugger (without considering the disassemblymodule embedded in the framework, as it is based on anoff-the-shelf disassembler). We believe these numbers arevery significant. The number of lines of code we had towrite to implement HyperDbg clearly witnesses that com-
2The screenshot was taken using our development environ-ment based on an Intel x86 emulator supporting extensionsfor virtualization (i.e., BOCHS).
8

plex analysis tools like an interactive kernel debugger arestraightforward to implement using our framework.
The remaining of this section describes how we used thefacilities of the framework to implement the user interfaceand the component to receive commands from the user.
User Interface.Although the graphical user interface of the debugger is
rough, its implementation is very challenging. The reasonof the complexity is the fact that we cannot rely on anyhigh-level graphical facility available in the analyzed systemto render the interface. Such approach would be too OS-depended and not transparent at all. The lack of graphicalprimitives obliged us to interact directly with the video card.The video memory is mapped at a fixed address in the guestand thus unmodified inspection and manipulation API (i.e.,GuestRead and GuestWrite) can be used by the debuggerto render the interface. Note that this approach is not de-pendent on the OS nor on the hardware. We developed asmall video library that provides basic graphical functional-ities and translates our requests into data that are writtendirectly in the memory of the video card. Before renderingthe graphical interface to the screen, the debugger backupsthe content of the video memory and restores the contentright before resuming the execution of the analyzed system.
User Interaction.User interaction is keyboard-based. When in non-root
mode, the user can switch into HyperDbg by pressing ahot-key. Then, in root mode the user can control the de-bugger. For these reasons, HyperDbg must be able to in-tercept keystrokes both in root and non-root mode. To in-tercept keystrokes in non-root mode we monitor all the readoperations from the hardware I/O port devoted to the key-board. In other words, HyperDbg registers to the core forall the IOOperationPort events that satisfy the event con-dition port =KEYBOARD_PORT && access =read. When suchoperation is detected, HyperDbg checks whether the keypressed corresponds to the hot-key that enables the debug-ger. If the key pressed matches the hot-key the debuggerpops up the graphical interface and waits for commands.Otherwise, the debugger passes the keystroke to the ana-lyzed system such that the latter will continue its executionas if the keystroke were read directly from the keyboard.Keyboard handling in root mode is done by polling the key-board hardware I/O port. Since direct access to I/O portsis not permitted to any analysis tool, the debugger relies ona API function exported by the framework which mediatesall accesses to I/O ports and allows (if the permission isgranted at compile time) certain analysis tools to read datafrom certain I/O ports.
5.2 Other Possible Uses of the FrameworkHyperDbg demonstrates that our framework is very ver-
satile and that enables new opportunities for dynamic anal-ysis and we will explore in our future research.
An interesting extension of HyperDbg will be the sup-port for kernel-level omniscent debugging. Omniscent de-bugging allows developers to inspect the status of their pro-grams in past execution instants, in order to detect the causeof a failure without the need to run the target program mul-tiple times [16]. HyperDbg could be extended to allow auser to record and inspect the values a memory location
stored during the time, and the exceptions and interruptsoccurred. Such a feature would ease a user to discover whena memory location of the kernel gets corrupted and whichinstruction is responsible for the corruption. Moreover, theability to log asynchronous events, such as interrupts, wouldallow to spot defects connected to non-deterministic behav-iors of the analyzed system. Our framework already offersall the necessary facilities for this kind of debugging: excep-tion and interrupts can be traced natively by the frameworkand memory accesses can be traced using watchpoints.
Another interesting application of our framework will bedynamic aspect-oriented programming of operating systemkernels. As discussed in Section 2, several approaches havebeen proposed to apply AOP to kernels. The main advan-tage offered by our framework over the approaches proposedso far is that it does not require any modification of thesource code of the kernel, nor any modification of the imagein memory of the kernel. Moreover, our framework pro-tects the running kernel from defects in the woven code.One approach to facilitate the use of such technology wouldbe to provide programmers a source-to-source translator, totranslate aspect oriented code written in languages like As-pectC [5] into C code that uses the API offered by our frame-work. In particular, the translator would be responsible fortranslating pointcuts into API calls to trace the correspond-ing events, using advices as events handlers, and for trans-lating all pointer dereferences into calls to inspection APIto read the memory of the guest.
6. CONCLUSIONSWe proposed a framework to perform complex run-time
analyses of both system- and user-level code on commodityproduction systems. The framework exposes an API thateases the development of analysis tools on its top. The ap-proach we described leverages hardware extensions for vir-tualization available on modern processors to overcome thelimitations that affect existing approaches for the analysis ofsystem-level code. In particular, the solution we proposeddoes not require to recompile or reboot the target system,it is not invasive, it is almost completely OS-independent,and it guarantees that a defect in an analysis tool cannotdamage the framework itself nor the analyzed system. Todemonstrate its potentials, we developed HyperDbg, an in-teractive kernel-level debugger for Microsoft Windows XP.HyperDbg and the framework have been released as anopen source package.
AcknowledgmentsThis research has been partially funded by the EuropeanCommission, Program IDEAS–ERC, Project 227977 SM-SCom and by the Italian Ministry of Education, Universitiesand Research, Program PRIN–2008.
7. REFERENCES[1] AMD, Inc. AMD virtualization.
http://www.amd.com/us/products/technologies/
virtualization/Pages/virtualization.aspx.
[2] B. Cantrill, M. W. Shapiro, and A. H. Leventhal.Dynamic Instrumentation of Production Systems. InProceedings of USENIX Annual Technical Conference,pages 15–28, June 2004.
9

[3] J. Chow, T. Garfinkel, and P. Chen. DecouplingDynamic Program Analysis from Execution in VirtualEnvironments. In Proceedings of USENIX AnnualTechnical Conference, pages 1–14, June 2008.
[4] Y. Coady, G. Kiczales, M. Feeley, and G. Smolyn.Using AspectC to improve the modularity ofpath-specific customization in operating system code.In Proceedings of the 8th European SoftwareEngineering Conference, pages 88–98, 2001.
[5] Y. Coady, G. Kiczales, M. J. Feeley, N. C. Hutchinson,and J. S. Ong. Structuring Operating System Aspects.Communications of the ACM, 44(10):79–82, 2001.
[6] A. Dinaburg, P. Royal, M. Sharif, and W. Lee. Ether:Malware Analysis via Hardware VirtualizationExtensions. In Proceedings of the 15th ACMConference on Computer and CommunicationsSecurity, pages 51–62. ACM, 2008.
[7] G. W. Dunlap, S. T. King, S. Cinar, M. A. Basrai,and P. M. Chen. ReVirt: Enabling Intrusion AnalysisThrough Virtual-Machine Logging and Replay. InOSDI ’02: 5th Symposium on Operating SystemsDesign and Implementations, December 2002.
[8] M. Engel and B. Freisleben. TOSKANA: A toolkit foroperating system kernel aspects. Transactions onAspect-Oriented Software Development II,4242:182–226, 2006.
[9] T. Garfinkel and M. Rosenblum. A Virtual MachineIntrospection Based Architecture for IntrusionDetection. In Proceedings of the Symposium onNetwork and Distributed Systems Security, San Diego,CA, Feb. 2003.
[10] S. T. King, G. W. Dunlap, and P. M. Chen.Debugging operating systems with time-travelingvirtual machines. In Proceedings of USENIX AnnualTechnical Conference, pages 71–84, April 2005.
[11] Linux Trace Toolkit. http://lttng.org/.
[12] D. Mahrenholz, O. Spinczyk, A. Gal, andW. Schroder-Preikschat. An Aspect-OrientedImplementation of Interrupt Synchronization in thePURE Operating System Family. In Proceedings ofthe 5th ECOOP Workshop on Object Orientation andOperating Systems, pages 49–54, June 2002.
[13] D. Mahrenholz, O. Spinczyk, andW. Schroder-Preikschat. Program Instrumentation forDebugging and Monitoring with AspectC++. InSymposium on Object-Oriented Real-Time DistributedComputing, pages 249–256, April 2002.
[14] Microsoft Corporation. Debugging Tools for Windows.http://www.microsoft.com/whdc/devtools/
debugging/default.mspx.
[15] G. Neiger, A. Santoni, F. Leung, D. Rodgers, andR. Uhlig. Intel Virtualization Technology: HardwareSupport for Efficient Processor Virtualization. IntelTechnology Journal, 10(3):167–177, August 2006.
[16] G. Pothier and E. Tanter. Back to the future:Omniscient debugging. IEEE Software, 26:78–85, 2009.
[17] Rasta ring 0 debugger.http://rr0d.droids-corp.org/.
[18] SoftICE. http://en.wikipedia.org/wiki/SoftICE.
[19] Syser Kernel Debugger. http://www.sysersoft.com/.
[20] A. Tamches. Fine-Grained Dynamic Instrumentation
of Commodity Operating System Kernels. PhD thesis,University of Wisconsin-Madison, 2001.
[21] A. Vasudevan and R. Yerraballi. Stealth Breakpoints.In 21st Annual Computer Security ApplicationsConference, pages 381–392, 2005.
[22] M. Xu, V. Malyugin, J. Sheldon, G. Venkitachalam,and B. Weissman. ReTrace: Collecting execution tracewith virtual machine deterministic replay. InProceedings of the 3rd Annual Workshop on Modeling,Benchmarking and Simulation, 2007.
10

Dynamic and Transparent Analysis of CommodityProduction Systems
Aristide Fattori† Roberto Paleari† Lorenzo Martignoni‡ Mattia Monga†
{aristide,roberto}@security.dico.unimi.it [email protected] [email protected]
Dip. di Informatica e Comunicazione† Dip. di Fisica‡
Università degli Studi di Milano Università degli Studi di UdineI-20135 Milan, Italy I-33100 Udine, Italy
ABSTRACTWe propose a framework that provides a programming in-terface to perform complex dynamic system-level analysesof deployed production systems. By leveraging hardwaresupport for virtualization available nowadays on all com-modity machines, our framework is completely transparentto the system under analysis and it guarantees isolation ofthe analysis tools running on its top. Thus, the internalsof the kernel of the running system needs not to be modi-fied and the whole platform runs unaware of the framework.Moreover, errors in the analysis tools do not affect the run-ning system and the framework. This is accomplished byinstalling a minimalistic virtual machine monitor and mi-grating the system, as it runs, into a virtual machine. Inorder to demonstrate the potentials of our framework wedeveloped an interactive kernel debugger, nicknamed Hy-perDbg. HyperDbg can be used to debug any criticalkernel component, and even to single step the execution ofexception and interrupt handlers.
Categories and Subject DescriptorsD.2.5 [Software Engineering]: Testing and Debugging—Debugging aids, Monitors, Tracing ; D.4.9 [Operating Sys-tems]: Systems Programs and Utilities
General TermsVerification
Keywordshardware virtualization, debugging, system analysis
1. INTRODUCTIONOperating systems are peculiar and very complex pieces
of software whose internals are critically vital for a system:a failure, or a bottleneck, in any of their parts can lead to
Permission to make digital or hard copies of all or part of this work forpersonal or classroom use is granted without fee provided that copies arenot made or distributed for profit or commercial advantage and that copiesbear this notice and the full citation on the first page. To copy otherwise, torepublish, to post on servers or to redistribute to lists, requires prior specificpermission and/or a fee.ASE’10, September 20–24, 2010, Antwerp, Belgium.Copyright 2010 ACM 978-1-4503-0116-9/10/09 ...$10.00.
catastrophic consequences. Therefore, special care is neededto develop, analyze, test, and profile them. To simplify theirtask, developers and analysts rely on a large variety of toolsand analysis techniques. Some of them are specific for study-ing static properties of the operating system, while othersare more specific for studying dynamic properties. In par-ticular, the latter class of tools and techniques is nowadaysvery popular among kernel developers and analysts becauseit allows them to collect the information very quickly, whilehiding many of the intricacies of the kernel, and can even beused on running production systems.
Existing approaches for dynamic analysis of operating sys-tems (e.g., debugging, profiling, and tracing) can be roughlyclassified in two groups: kernel-based and VMM-based. Theapproach taken by the first group is to include some com-ponent into the kernel in order to intercept all the events ofinterest (e.g., the creation of a new process, the execution ofa system call, and the execution of a kernel function) and toexecute a specific action when such events occur [?, ?, ?, ?,?]. This solution requires the installation of specific hooksin the kernel to monitor run-time events and it might bevery difficult to apply to operating systems that do not na-tively offer facilities for dynamic analysis, especially whenthe source code is not available. The approach taken bythe second group is to run the kernel and user-space appli-cations in a virtual machine and to intercept, and respondto, the events of interest from the virtual machine moni-tor (VMM) [?]. Although this approach guarantees trans-parency and has a loose dependency on the operating sys-tem internals, it cannot be used in all the settings, since itimplies that the system must be run as a guest of a vir-tual machine and production systems not running in virtualmachines cannot be analyzed. Moreover, VMM-based solu-tions typically virtualize hardware devices, to allow multipleguests to share the same physical peripherals. This makessoftware virtualization approaches unsuitable to assist theanalysis of components that need to interact directly withthe underlying hardware.
In this paper we propose a framework that brings to-gether the advantages of both approaches: it can be used oncommodity production systems (i.e., off-the-shelf products,whose source code or debugging symbols are not necessarilyavailable), since it does not require to instrument the sys-tem under test, and it is able to inspect systems running onreal hardware, since it does not require an emulation con-tainer. Similarly to existing frameworks, the analyses thatcan be built on top of our framework include profiling and
1
arX
iv:1
006.
5845
v1 [
cs.O
S] 3
0 Ju
n 20
10

tracing of the kernel and user-space applications, interactivedebugging, or even extension of system features. However,differently from existing frameworks, ours is fully dynamic,transparent, loosely dependent on the operating system, andfault-tolerant with respect to possible defects in the anal-ysis code. First, our framework does not require recompi-lation or rebooting of the target system. Thus, it can beused to analyze any running production system, includingcommodity operating systems lacking native support for in-strumentation and systems not running in virtual machines.Second, the framework is not invasive, since analyses can beperformed on a virtually unmodified system: as explained inthe paper, only a minimal driver needs to be installed and noparts of the kernel are patched in any way. Moreover, sincethe framework itself is not accessible from the target system,its code cannot be detected by malicious code or unwittinglyinfluence buggy operating system components. Thus, theinfrastructure can be applied to any operating system, asthe majority of the facilities it supports are completely OS-independent, and the only OS-dependent functionalities arejust provided to ease the development of analysis tools. Fi-nally, the framework is fault-tolerant, as it guarantees thata defect in an analysis tool built on top of it do not damagethe framework itself nor the analyzed system.
Our framework leverages hardware extensions for virtual-ization available on commodity x86 CPUs [?, ?]. Hardware-support for virtualization allows the development of virtualmachine monitors that are very efficient, completely trans-parent, and non invasive to the systems running in the vir-tual machine. To overcome the major limitation of tradi-tional VMM-based approaches (i.e., the impossibility to an-alyze productions systems not running in a virtual machine),our framework exploits a feature of the hardware that allowsto install a virtual machine monitor and to migrate a run-ning system into a virtual machine. When the analysis iscompleted, the original mode of operation of the system canbe restored. Practically speaking, our framework is a mini-malistic virtual machine monitor acting as a broker betweenthe analyzed system and the analysis tool. The frameworkabstracts low-level events occurring in the analyzed systeminto high-level events and guarantees fault-tolerance by re-lying on the hardware to run the analysis tool in a isolatedexecution environment.
To demonstrate the potentials of our framework we havedeveloped an interactive kernel debugger, nicknamed Hy-perDbg, constructed entirely using the programming in-terface exposed by our infrastructure. HyperDbg addslive and interactive debugging support to Microsoft Win-dows XP, so far only possible using very invasive tools, likeSyser [?], or traditional VMM-based debuggers. HyperDbgcan be used to debug any component of the Windows kernel,including interrupt/exception handlers, device drivers, andeven supports single instruction stepping. Being completelyseparated from the debuggee, HyperDbg is transparent tothe analyzed system and can be even used to analyze pro-tected and malicious code.
In summary, the paper makes the following contributions.
1. We propose a framework to perform complex dynamicsystem-level analyses of commodity production sys-tems. Compared to existing frameworks, the one wepropose guarantees transparency, efficiency, and doesnot require the target system to be already installedon a virtual machine.
2. We implemented our framework in an experimentalprototype for Microsoft Windows XP.
3. We describe the design and the implementation of Hy-perDbg, a kernel-level interactive debugger built ontop our framework.
Both the analysis framework and HyperDbg are avail-able at http://security.dico.unimi.it/hyperdbg/ and isreleased under the terms and conditions of the GPL (v3.0)license.
2. RELATED WORKThe framework proposed in this paper shares many simi-
larities with frameworks and techniques extensively exploredin the past. However, by exploiting recent facilities availableof modern Intel x86 CPUs, our framework is able to combineand to offer simultaneously the main benefits introduced byprevious research work.
Dynamic Kernel Instrumentation.DTrace is a facility included into the Solaris kernel that al-
lows the dynamic instrumentation of production systems [?].The key points of DTrace are efficiency and flexibility. First,the instrumentation framework itself introduces no over-head. Second, the framework provides tens of thousandsof instrumentation points, and the actions to be taken canbe expressed in terms of a high-level control language, thatalso includes a number of mechanisms to guarantee run-time safety. Similarly, KernInst is a dynamic instrumen-tation framework for commodity kernels [?]. KernInst hasbeen developed mainly to gather information about the per-formances of a running kernel, but it has also been em-ployed for run-time kernel optimization. Differently fromDTrace, KernInst does not provide any mechanism for run-time safety of the instrumentation routines. Unfortunately,the aforementioned approaches are not transparent, as theyrequire direct modifications of the operating system kernel,achieved by loading a kernel-mode module. Moreover, noneof them is OS-independent, and they and cannot be appliedto closed-source operating systems. Our framework doesnot suffer these limitations since it can instrument the ker-nel without modifying it and does not rely on any facilityoffered by the kernel.
Kernel-level Debugging.Several efforts have been made to develop efficient and
reliable kernel-level debuggers. Indeed, these applicationsare essential for many activities, such as the developmentof device drivers. One of the first and most widely usedkernel-level debuggers that targeted the Microsoft Windowsoperating system was SoftICE [?], but today the projecthas been discontinued. However, both commercial [?] andopen-source [?] alternatives to SoftICE appeared. Mod-ern versions of Windows already include a kernel debuggingsubsystem [?]. Unfortunately, to exploit the full capabilitiesof Microsoft’s debugging infrastructure, the host being de-bugged must be physically linked (e.g., by means of a serialcable) with another machine. All these approaches share acommon factor: to debug kernel-level code, they leverageanother kernel-level module. Obviously, that is like a dogchasing its tail. The framework proposed in this paper doesnot require any kernel support nor to modify the kernel toadd the missing support at run-time.
2

Operating system kernel
User modeKernel mode
Userprocess
Userprocess
Operating system kernel
User modeKernel mode
Userprocess
Userprocess
Non-root modeRoot mode
Framework
Analysistool
Install
Remove Exit
Insp
ect
Figure 1: Overview of the framework
Frameworks Based on Virtual Machines.Instead of relying on a kernel-level module to monitor
other kernel code, an alternative approach consists of run-ning the target code inside a virtual machine, and to per-form the required analyses from the outside [?]. In [?, ?, ?]the authors propose virtual machines with execution replay-ing capabilities: a user can move forward and backwardsthrough the execution history of the whole system, bothfor debugging and for understanding how a hacker intrusiontook place. Finally, in [?] Chow et al. propose Aftersight,a system that decouples execution recording from executiontrace analysis, thus reducing the overhead suffered by thesystem where the guest operating system is run. Nowa-days, Aftersight is part of the VMware platform, and othermainstream commercial products provide similar capabili-ties. The framework proposed in this paper can providethese functionalities even on systems not running in any vir-tual machine.
Aspect-oriented Programming.Aspect-oriented programming is a paradigm that promises
to increase modularity by encapsulating cross-cutting con-cerns into separated code units, called “aspects”, whose “ad-vice” code is woven into the system automatically, by speci-fying the properties of the join-points. AspectC is an aspect-oriented framework that is used to customize (at compile-time) operating system kernels [?, ?, ?]. More dynamic ap-proaches have been proposed: for example TOSKANA pro-vides before, after and around advices for in-kernel functionsand supports the implementation of aspects themselves asdynamically exchangeable kernel modules [?]. The frame-work proposed in this paper allows to achieve the same goalwhile being transparent and fault-tolerant.
3. OVERVIEW OF THE FRAMEWORKFigure 1 depicts the architecture of our framework, the
installation and removal processes, and the migration of theoperating system and its applications into a virtual machine.Our framework consists of a virtual machine monitor (VMMfor short) that provides a programming interface for the de-velopment of system-level analysis tools. As in traditionalVMM-based analysis approaches, the analysis tool is runwithin the VMM and thus completely transparent to guestsof the virtual machine. However, compared to traditional
VMM-based ones, ours does not require the system to bealready running inside any virtual machine. To achieve thisgoal, our framework leverages hardware extensions for virtu-alization available on all modern x86 CPUs [?, ?] (which areunused in the majority of the deployments). In short, theseextensions augment the instruction set architecture with twonew modes of operation: VMX root mode and VMX non-root mode1. These new modes of operation separate logicallythe virtual machine monitor from a guest without having tomodify the latter. More precisely, we exploit a particularfeature of these extensions that allows for late launching ofVMX modes. Late launching of VMX modes permits toinstall a virtual machine monitor even if the system has al-ready been bootstrapped. In other words, late launchingallows to migrate (temporarily) a running operating systemin a virtual machine, and to analyze and control the execu-tion of the system from the monitor. Through the rest of thepaper, we use the term “guest” to refer to the system underanalysis that has been migrated into a virtual machine.
Practically speaking, the running operating system is notmigrated anywhere and not touched at all. Rather, bylaunching VMX modes, the execution environment is ex-tended with the two aforementioned operating modes; therunning operating system is then associated with non-rootmode, while the VMM is associated with root mode. Thus,in all respects, the operating system and its applications be-come a guest of our special virtual machine. Following thesame principle, the VMM can be unloaded, and the originalmode of execution of the operating system restored, by sim-ply disabling VMX modes. After the launch of the VMXmodes, the execution of the guest can continue exactly asbefore, even in terms of interactions with the underlyinghardware devices. However, during its execution, the guestmight be interrupted by an exit to root mode. Like hardwareexceptions, exits are events that block the execution of theguest, switch from non-root mode to root mode, and transferthe control to the VMM. Differently from exceptions, the setof events triggering exits to root mode can be configured dy-namically by the VMM. A routine of the VMM handles theexit and eventually enters non-root mode to resume the ex-ecution of the guest. Being executed at the highest privilegelevel, the routine handling the exit has complete read/writecontrol of the state of the guest system (of both memoryand CPU registers).
The framework itself does not perform any analysis. It isonly responsible for handling a small set of exits to controlall accesses to the memory management unit of the CPU, toprevent the guest from accessing the physical memory loca-tions holding the code and the data of the framework. Onthe other hand, the framework provides a flexible API to de-velop tools to perform sophisticated analyses of both kerneland user code running in the guest. Using the function-alities provided through the API, the tool can request theframework to monitor certain events that might occur dur-ing the execution of the guest; when such events occur, it caninspect, and even manipulate, the state of the guest. Theevents that can be monitored include, but are not limited to,system call invocations, function calls, context switches andI/O operations. Practically speaking, events are monitoredthrough exits to root mode. Thus, a request of the analysistool to monitor a certain high-level event (e.g., the execu-
1VMX (non-) root mode is the terminology used by Intel;AMD adopts a different terminology.
3

7. Interrupt
Event gate Trap gate API
Analysis tool1.
Exit
2.
Noti
fica
tion
3. API call6. Exception
4. API request
4a.
Insp
ect/
man
ipu
late
4b. Request event notification
5. Recover information about events
Non-root mode
Root mode
User mode
Kernel mode
Hardware
Framework
Timer Disk NetworkVideo
Figure 2: A close-up of the framework
tion of a system call) is translated by the API of the frame-work into a sequence of low-level operations that guaranteethat all the occurrences of such event in the guest trigger anexit to root mode. Similarly, the framework translates theexit into a higher-level event and notifies the occurrence ofthe event to the analysis tool. Once notified, the tool canrecover information about the event (e.g., arguments andreturn value of a system call), using the inspection function-alities offered by the API.
An important requirement for the analysis of productionsystems is that analysis tools must not interfere with thecorrect execution of the guest. This is particularly impor-tant for faults and deadlocks that might occur in the analysistool. The approach we adopt is to run the tool in a less privi-leged execution environment, isolated from the analyzed sys-tem and from the framework. The tool can interact with theguest only through the API exposed by the framework. Thisapproach guarantees the framework the ability to interceptany fault occurring in the tool, to mediate all accesses tothe analyzed system (and to prevent write accesses), and toterminate the tool in case of deadlocks or other anomaloussituations.
4. DESIGN AND IMPLEMENTATIONFigure 2 shows a more detailed view of the architecture
of our framework. Intuitively, this architecture is very simi-lar to that of traditional operating systems: the frameworkplays the role of the kernel and the analysis tool plays therole of a user-space application. As will become clear later,this architecture prevents buggy analysis tools from compro-mising the guest system and the framework. The separationbetween these two parts is made possible by the fact that,when VMX is enabled, root and non-root modes offer twofully-featured execution environments. Thus, like the guestrunning in non-root mode, the framework running in rootmode can rely on privilege separation to isolate the analysistool and can handle independently interrupts and exceptionsthat might occur while executing in root mode.
When an exit to root mode interrupts the execution ofthe guest, the event is delivered to the event gate (step 1
in Figure 2). The event gate is responsible for abstract-ing low-level events into higher-level ones, and to notify theanalysis tool if the latter has requested to do so (step 2).On startup the analysis tool requests the framework to benotified of certain events (not shown in the figure). Thetool can use the API provided by framework to query extrainformation about the event (e.g., the content of the stacklocation storing one of the arguments of a function). Sincethe tool is isolated from the framework, API functions areinvoked through software interrupts. Thus, requests comingfrom the analysis tool are received by the trap gate (step3), then forwarded to the component implementing the API(step 4). The tool can perform two types of API calls: (step4a) to inspect or manipulate the state of the guest, and (step4b) to control event notifications (e.g., enable or disable thenotification of certain events). Note that the componentimplementing the API is also used by the framework itself(step 5) to recover extra information about events (e.g., thereturn address of a function stored in the stack). The trapgate also serves the purpose of detecting exceptions (e.g.,page faults) that might occur during the execution of theanalysis tool. If the trap gate intercepts an exception (step6), it terminates the faulty tool and unloads the framework,to resume the normal operation mode of the system. Finally,the trap gate is also used to handle timer interrupts (step7), that, as will be discussed in Section 4.4, are employed toenforce a time-bound on the execution of the tool.
The functionalities provided by the API of the frameworkcan be classified into two classes: execution and I/O tracingand state inspection and manipulation. The following para-graphs describe briefly the API. More details are given inSections 4.2 and 4.3.
Execution and I/O tracing facilities allow a tool to inter-cept the occurrence in the analyzed system of certain eventsand certain I/O operations respectively. Table 1 reports themain types of events that can be traced. For each event, thetable also reports the arguments associated to the event; ar-guments are information about the events most commonlyused in tools. For example, the events FunctionEntry andSyscallEntry are used to trace functions and system callsrespectively. The arguments associated to the FunctionEn-
try event are the address (or the name) of the functioncalled, the caller and the return address. Another exam-ple is the ProcessSwitch event that can be used to tracecontext switches between processes (not threads). From thepoint of view of the analysis tool all the events are handledin the same way: the tool can subscribe to any event and,when the event occurs, can inspect its arguments and takethe proper actions. However, at the framework-level, certainevents are different from other ones. Indeed, some of them(e.g., context switches between processes) can be traced di-rectly by the hardware. That is, the event triggering the exitcorresponds exactly to the event being traced. Other eventsinstead (e.g., function calls and returns) cannot be traceddirectly by the hardware. In all these cases the frameworkrelies on other low-level events to trace the execution andthen abstract exiting low-level events into higher-level ones,meaningful for the analysis tool.
Arguments can optionally be used as conditions, to limitthe tracing to a subset of all the events. Conditions on eventsserve two purposes. First, conditions allow to simplify theanalysis tools, since events that do not match the requestedconditions are discarded by the framework and thus do not
4

Event Description Arguments
ProcessSwitch Context (process) switch —Exception Execution Exception vector, faulty instruction, error codeInterrupt Hardware or software interrupt Interrupt vector, requesting instructionBreakpointHit Execution breakpoint Breakpoint addressWatchpointHit Watchpoint on data read/write Watchpoint address, access type, hitting instructionFunctionEntry Function call Function name/address, caller/return addressFunctionExit Return from function Function name/address, return addressSyscallEntry System call invocation System call number, caller/return addressSyscallExit Return from system call System call number, return addressIOOperationPort I/O operation throught hardware port Port number, access typeIOOperationMmap Memory-mapped I/O operation Memory address, access type
Table 1: Events traceable using our framework and corresponding arguments (the argument that representsthe current process is omitted, as it is common to all the events)
need to be handled by the tool. Second, some conditionsallow preemptive filtering of the events. In other words,the framework configures a priori which events trigger anexit, instead of filtering out exits caused by uninterestingevents. For example, in the case of the IOOperationPort
event, preemptive filtering means to configure the CPU suchthat only I/O operations involving a specific I/O port triggeran exit. This feature is very important to minimize thenumber of exits and thus the overall overhead.
State inspection and manipulation primitives can be usedby the tool to access the state of the guest, in order to extractmore detailed information about events or other data use-ful for the analysis. For example, these primitives allow toextract the arguments of an invoked function, or to inspectthe internal structures of the guest operating system. Notethat, by default, write access to guest state is not grantedto a tool. If necessary, such permission can be enabled atcompile-time. Obviously, in this case the framework cannotprotect the state of the guest from dangerous modifications.
4.1 Framework and Analysis Tool LoadingThe framework and the analysis tool are loaded by a min-
imal kernel driver. This is unavoidable since the operationswe need to perform to load the framework require maxi-mum privileges and can be performed only by the kernel ofthe operating system. The driver, however, is indeed verysimple and we put extreme care in avoiding any interferencewith the kernel. Moreover, since once loaded the frameworkis completely invisible to the system, we unload the driverimmediately as soon as the framework has been installed.
When VMX modes are enabled, a special VMX data struc-ture (VMCS in Intel terminology) is made accessible initiallyto the loader, and subsequently, when the loading is com-pleted, only to the framework. This data structure stores thehost state, guest state, and the execution control fields. Thehost state stores the state of the processor that is loadedon exits to root mode, and consists of the state of all theregisters of the CPU (except for general purpose registers).Similarly, the guest state stores the state of the processorthat is loaded on entries to non-root mode. The guest stateis updated automatically at every exit, such that the sub-sequent entry to non-root mode will resume the executionfrom the same point. The execution control fields allow afine-grained specification of which events should trigger anexit to root mode.
The task of the loader is to enable VMX modes and toconfigure the VMX data structure such that the execution ofthe operating system and user-space applications continue to
run in non-root mode, while the framework and the analysistool are executed in root mode. Moreover, the loader hasto configure the CPU such that all the events necessary forthe tool to trace the execution of the system trigger exits toroot mode. When the initialization is completed, the driverunloads itself and resumes the execution of the system.
Guest State Configuration.The guest state is initialized to the current state of the
system. In this way, when the virtual machine is launchedand execution enters non-root mode, the guest operatingsystem will resume its execution as if nothing happened.A tricky problem when initializing non-root mode concernsthe management of the memory. More precisely, we mustprevent the newly created guest to use and access the phys-ical memory frames allocated to the framework and to thetool. Otherwise, the guest could detect and even corruptthe framework. Most recent CPUs provide hardware facil-ities for memory virtualization (e.g., Intel Extended PageTable extension). If these facilities are not available, mem-ory virtualization must be implemented entirely via soft-ware. Briefly, software memory virtualization consists ofintercepting all guest operations to manipulate the page ta-ble (the data structure the CPU uses for virtual-to-physicaladdress translation) and in ensuring that none of the phys-ical frames allocated to the framework and to the analysistool are mapped into the guest. In case the guest tries tomap a reserved physical frame, the framework assigns theguest a different one and masquerades the difference.
Host State Configuration.The host state is initialized as follows. The CPU is config-
ured to use, when in root mode, a dedicated address spaceand a dedicated interrupt descriptor table (IDT). This con-figuration simplifies the separation of the analyzed systemfrom the framework and allows to detect and handle inter-rupts and exceptions that occur in root mode. Differentlyfrom the address of the entry point of non-root mode, whichis updated at every exit to allow to resume execution ofthe guest from where it was interrupted, the address of theentry point of root mode is fixed. The entry point is setto the address of the routine that takes care of dispatchingan exit event to the appropriate handler and that in turnmight notify the analysis tool (i.e., the entry point of theevent gate).
Execution Control Fields Configuration.To reduce the run-time overhead suffered by the guest
5

Event Exit causeNativeexit
ProcessSwitch Change of page table address√
Exception Exception√
Interrupt Interrupt√
BreakpointHit Debug except. / Page fault except.WatchpointHit Page fault except.FunctionEntry Breakpoint on function entry pointFunctionExit Breakpoint on return addressSyscallEntry Breakpoint on syscall entry pointSyscallExit Breakpoint on return addressIOOperationPort Port read/write
√IOOperationMmap Watchpoint on device memory
Table 2: Techniques for tracing events
system, the execution control fields are configured to mini-mize the number of events that trigger an exit to root mode.When the tool is initialized, it specifies which events mustbe intercepted. Subsequently, in response to the invocationof API functions, the configuration of the execution controlfields can be altered to intercept additional events or to ig-nore other ones.
4.2 Execution TracingTable 2 describes the technique used to trace all the events
currently supported by the framework. Low-level events(those with a mark in the last column) correspond directlyto exits to root mode (e.g., Exception). Other events aretraced through the aforementioned ones (e.g., Breakpoint-Hit), and others again are traced through the latter (e.g.,FunctionEntry).
Events that can be traced directly through the hardwareare process switches, exceptions, interrupts, and port-basedI/O operations. All these events exit conditionally: theyexit to root mode only when requested and can have op-tional exit conditions to limit exits to particular situations.The remaining of this section presents how we developed theprimitives for tracing higher-level events starting from theaforementioned low-level ones.
Breakpoints and watchpoints are two of the most compli-cated events to implement. Modern CPUs provide hardwarefacilities to realize efficient and transparent breakpoints andwatchpoints. Unfortunately, hardware-assisted breakpointsand watchpoints are limited in number (only 4) and sharedbetween non-root and root mode. Therefore, they cannotbe used simultaneously by the analyzed system and by theframework. The solution we adopt to allow an arbitrarynumber of breakpoints is to use software breakpoints. Asoftware breakpoint is a one-byte instruction that triggers abreakpoint exception when executed. Software breakpointsare enabled by replacing the byte at the address on whichwe want the breakpoint with the aforementioned instruction.When the breakpoint is hit, the original byte is restored andthe event is notified to the tool. If the breakpoint is not per-sistent the execution of the system is resumed. Otherwisethe instruction is emulated and then the breakpoint is setagain. Clearly, this approach to breakpoints is not trans-parent for the analyzed system. However, it is very efficient.An alternative and transparent approach is to use the sametechnique we use for watchpoints, as described in the nextparagraph. Our framework supports both approaches.
The approach used in our framework to implement soft-ware watchpoints is based on protecting the memory lo-cations from any access via hardware (or just from write
accesses, depending on the type of watchpoint), such thatany access results in an exception [?]. More precisely, sincethe finest level of protection offered by the hardware is atthe page level, we mark the page containing the address onwhich we want to set the watchpoint as “non-present”. Anyfuture access to this page will result in a page fault exceptionthat will be intercepted by our framework. The frameworkanalyzes the exception and checks whether the accessed ad-dress corresponds to the address with the watchpoint. Ifthe watchpoint is hit, the framework delivers the event tothe analysis tool, otherwise it emulates the instruction, andthen resumes the normal execution of the guest. Emula-tion is necessary to execute the faulty instruction manually.Indeed, to prevent a second fault, the original permissionof the memory page accessed by the instruction must berestored before executing the faulty instruction. After theexecution of the instruction, the page must be marked againas “non-present” to catch future accesses.
Other higher-level events, such as function and system callentries and exits, are traced through breakpoints. When theanalysis tool requests the framework to monitor a certainfunction, the framework sets a breakpoint on the address ofthe entry point of the function. Later, when a breakpoint ishit, the framework checks whether the hit breakpoint cor-responds to a function entry point and, if so, it delivers theappropriate event (i.e., FunctionEntry) to the analysis tool.Function exits, instead, are traced by setting a breakpointon the return address. The framework discovers the returnaddress by setting a breakpoint on the function entry and byinspecting the stack frame of the function when the break-point on the entry point is hit. A similar approach is usedfor tracing system calls entries and exits.
The approach for tracing function calls and returns justdescribed allows to trace specific functions, whose names oraddresses are supplied by the tool. The tracing of all func-tion calls and returns is instead more complicated becauseit is not possible to know a priori the addresses of all func-tions’ entry points. The solution in this case is to performa static analysis to identify the addresses of all functions’entry points (e.g., by recognizing function prologues). Thisfeature is still not available in our current implementation ofthe framework. Nevertheless, if needed, the static analysiscould be performed directly in the tool. The tracing of allsystem calls is instead much easier, since they are all invokedthrough a common gate. The solution we adopt is to put abreakpoint on the entry point of the system call gate [?].
Beside execution tracing facilities, the framework also ex-poses to analysis tools the possibility of intercepting I/Ooperations with hardware peripherals. Software can interactwith hardware devices through hardware I/O ports, or it canleverage memory-mapped I/O. In the first case, VMX allowsto intercept the operation without any effort: the frameworksimply configures the execution control fields such that allthe interactions with the specific hardware ports trigger anexit to root mode; when such an exit occurs, the frame-work notifies the tool by means of a IOOperationPort event.However, for performance reasons, modern peripherals typ-ically resort to memory-mapped I/O. In this case, read andwrite operations do not involve any hardware port, as theyare performed directly on memory. To intercept such opera-tions we set a watchpoint on the appropriate memory region.Thus, when an access to it is detected, the framework deliv-ers a IOOperationMmap event to the tool.
6

4.3 State Inspection and ManipulationSeveral situations require to access the state of the guest
system in order to inspect, and optionally manipulate, boththe registers of the CPU and the memory. As an example,the framework could need to read the return address of afunction from the stack, to access the parameters of a systemcall from the processor registers, or to insert a breakpointinto the address space of a particular process. Similarly, theanalysis tool might need to extract data from the memoryof the guest.
The inspection and manipulation of CPU registers is astraightforward activity. These information are saved duringan exit and restored before an entry. Thus, the inspectionand manipulation of registers merely consists of reading orwriting the VMX guest state (or the memory of the frame-work, depending on the type of register).
Inspection and manipulation of memory locations is muchmore complex. When paging is enabled, virtual addressesare translated by the hardware into physical addresses ac-cording to the content of the page table and direct physicaladdressing is not possible. Each process has its own pagetable; therefore, different processes have different virtual-to-physical mappings and a process cannot access the memoryof the others. The framework is isolated from the guest us-ing the same approach and thus it has its own page tableand its own mapping. Consequently, the framework cannotdirectly access memory locations of guest processes. More-over, inspection is complicated by the fact that page tablescannot be traversed via software (but only via hardware):the page table is a multilevel table and pointers to lowerlevels are physical. To overcome this problem we have de-veloped a specific, OS-independent, algorithm that allows toaccess an arbitrary virtual memory location of an arbitraryprocess. The core of the algorithm is a primitive that al-lows to access arbitrary physical memory locations. This isaccomplished by mapping a given physical address p to anunused virtual address v in the page table of the framework,and subsequently by accessing v. Then, using this primi-tive, the algorithm can traverse the page table of a processof the guest via software by iteratively mapping the physicaladdresses stored in the table.
The framework exposes memory inspection and manipula-tion facilities, based on the aforementioned algorithm, to theanalysis tools through two API functions: GuestRead(p,a,-n ) and GuestWrite(p,a,data ). The former reads n bytesstarting from virtual address a of process p ; the latter writesthe content of buffer data into the address space of processp , starting from virtual address a . By default, to preservethe integrity of the guest, all GuestWrite operations are for-bidden. On top of this functions we have built higher-levelones that facilitates the extraction of functions’ arguments,null terminated strings, and to disassemble code.
4.4 Tool IsolationTo be able to use our infrastructure on a production sys-
tem, it is essential to guarantee that any defect in the anal-ysis tool will not affect the stability of the analyzed systemand of the framework. At this aim, the framework controlsthe execution of the analysis tool and, if any anomalous be-havior is observed, the whole infrastructure is automaticallyunloaded.
As we outlined at the beginning of this section, even ifthe analysis tool is executed in VMX root mode, it is still
constrained into a less privileged execution mode than theframework. Thus, any operation the tool performs on theguest must be mediated by the framework. This is exactlywhat happens in traditional operating systems: a user-modeprocess cannot access directly the resources of the operatingsystem, nor those of other user-mode processes, and any ac-tion it performs outside its address space must be mediatedby the kernel. Similarly in our context, to perform an opera-tion on the guest system, the tool must use the programminginterface offered by the framework.
In the default configuration, the framework does not al-low a tool to access in write-mode to the state of the guest.However, there is still the possibility that the execution ofan instruction of the tool raises an unexpected exception(e.g., a page fault on memory access, or a general protec-tion fault). When such an event occurs, the framework hasno way to handle the anomalous situation and to allow thetool to continue its execution. The only viable approach thatalso preserves the integrity of the guest system is to termi-nate the analysis tool and to remove the framework. At thisaim, the solution we adopt is to intercept unexpected excep-tions through the custom interrupt descriptor table (IDT)installed when launching VMX modes. The IDT receivesthe trap, and delivers it to the trap gate that eventuallyunloads the framework. Another problem that might arisewith a buggy analysis tool is non-termination: if the anal-ysis tool entered an infinite loop, the guest system wouldnever be resumed. To prevent this problem we added to theframework a minimalistic watchdog and set a time limit onthe execution of the tool. The limit is not on the whole exe-cution time of the tool, but rather on the execution time tohandle an event. Thus, the analysis tool could potentiallybe run forever, but with the guarantee that the executionof the analyzed system will be resumed within the specifiedtime limit. At this aim, before delivering an event to theanalysis tool, the framework resets a timer. Then, whilethe tool handles the event, the framework periodically re-gains the control of the execution and checks whether thetime limit has been exceeded. To do that the frameworkregisters, in the IDT, a custom interrupt handler to handletimer interrupts and programs the interrupt controller to de-liver only timer interrupts (that is necessary to prevent theframework to consume interrupts for all the other devices).Before returning to non-root mode, the framework repro-grams the interrupt controller to deliver all the interruptsto the analyzed system.
4.5 OS-dependent InterfaceOur framework provides a general programming interface
completely independent from the operating system runninginside the guest. However, in many cases some OS-specificfacilities can ease the analysis of the guest. As an example,the only OS-independent manner to identify a process is bymeans of the base address of its page table (typically storedinside the cr3 CPU register). However, it is quite awkwardto refer to processes using page table base addresses, and itis more natural to identify a process through its process id(PID) or through the name of the application it executes.
The OS-dependent interface we provide leverages virtualmachine introspection techniques [?] to analyze the inter-nal structures of the guest operating system to translateOS-independent information (e.g., process with page tablebase address 0x13cdc000) into something more user-friendly
7

Name Description
GetFuncAddr(n ) Return the address of the function nGetFuncName(a ) Return the name of the function at address aGetProcName(p ) Get the name of process with page directory
base address pGetProcPID(p ) Get the PID of process with page directory
base address pGetProcLibs(p ) Enumerate the dynamically linked libraries
loaded into process pGetProcStack(p ) Get the stack base for process pGetProcHeap(p ) Get the heap base for process pGetProcList() Enumerate processesGetDriverList() Enumerate device drivers
Table 3: OS-dependent API
(e.g., process notepad.exe). Moreover, using debuggingsymbols, the framework allows to resolve symbols’ namesand addresses (e.g., functions and global variables). In thisway, a tool can ask to interrupt the execution of the guestwhen function NtCreateFile is invoked, instead of referenc-ing the function through its address. Similarly, when a func-tion is invoked, it is possible to inspect its call-stack and toresolve the name of the caller functions and even recover thelibraries to which the various functions belong to. Some ofthe OS-dependent functionalities provided are summarizedin Table 3.
In case the guest operating system is not supported, theOS-dependent module is disabled, and only OS-independentfunctionalities are available. Our current implementationoffers an OS-dependent interface only for the Windows XPoperating system.
5. APPLICATIONSIn this section we present HyperDbg, an interactive ker-
nel debugger for Microsoft Windows XP we built on top ofour framework. In our strive to contribute to the open sourcecommunity, we released the code of HyperDbg, along withthe code of the framework, under the GPL (v3.0) license.The code is available at the following address:
http://security.dico.unimi.it/hyperdbg/
The section also discusses other possible applications thatcould be constructed using our framework.
5.1 HyperDbgHyperDbg is an interactive kernel debugger we developed
on top of our analysis framework. It offers all the featurescommonly found in kernel-level debuggers but, being com-pletely run in VMX root mode, it is OS-independent andgrants complete transparency to the guest operating systemand its applications. The debugger provides a simple graph-ical user interface to ease the interaction with the user. Thisinterface is activated in two circumstances: (i) when the userpresses a special hot-key or (ii) when the debugger receivesthe notification for an event that requires the attention ofthe user (e.g., when a breakpoint is hit). From this interfacethe user interacts with the debugger and can perform severaloperations, including setting breakpoints and watchpoints,tracing functions and system calls, and inspecting and ma-nipulating the state of the guest (since all interactive debug-gers allow to modify the state of the debuggee, we decidedto enable write access to the guest as well).
Figure 3: HyperDbg in action
Figure 3 shows HyperDbg in action2. In particular, thefigure shows the debugger notifying the event that inter-rupted the execution of the analyzed system, displaying afragment of the code of the process currently running in theanalyzed system and displaying a“backtrace”of the functioncalls that are currently active. Additionally, the debuggerdisplays information about the status of the registers at thetime the event occurred (in the case of the figure the event isthe pressure of the hot-key). To facilitate the analysis, thedebugger leverages OS-dependent information. For exam-ple, the screenshot in Figure 3 shows that the debugger re-solved the ID and the name of the process in a MS WindowsXP guest, by knowing how the process table is managed bythe operating system.
It is worth pointing out that HyperDbg can be used todebug any piece of code of the guest system, including crit-ical components such as the process scheduler, or interruptand exception handlers. Indeed, Figure 3 shows that theguest operating system has been stopped while executingthe PS/2 keyboard/mouse driver (i8042prt.sys). Thanksto the fact that the framework on which the debugger isbuilt on is completely transparent to the analyzed system,the user can use the keyboard to interact with the debug-ger even though the keyboard driver of the guest is beingdebugged.HyperDbg consists of less than 1600 lines of code: ∼25%
of the code implements the graphical interface, ∼23% ofthe code provides the facilities required for keyboard-baseduser interaction, and the remaining ∼52% is responsible forhandling events and for all the other interactions with theframework. Note that certain functionalities (e.g., disassem-bling a code region) are implemented directly in the frame-work since, most likely, they will be used for other types ofanalysis as well. The framework is about four times big-ger than the debugger (without considering the disassemblymodule embedded in the framework, as it is based on anoff-the-shelf disassembler). We believe these numbers arevery significant. The number of lines of code we had towrite to implement HyperDbg clearly witnesses that com-
2The screenshot was taken using our development environ-ment based on an Intel x86 emulator supporting extensionsfor virtualization (i.e., BOCHS).
8
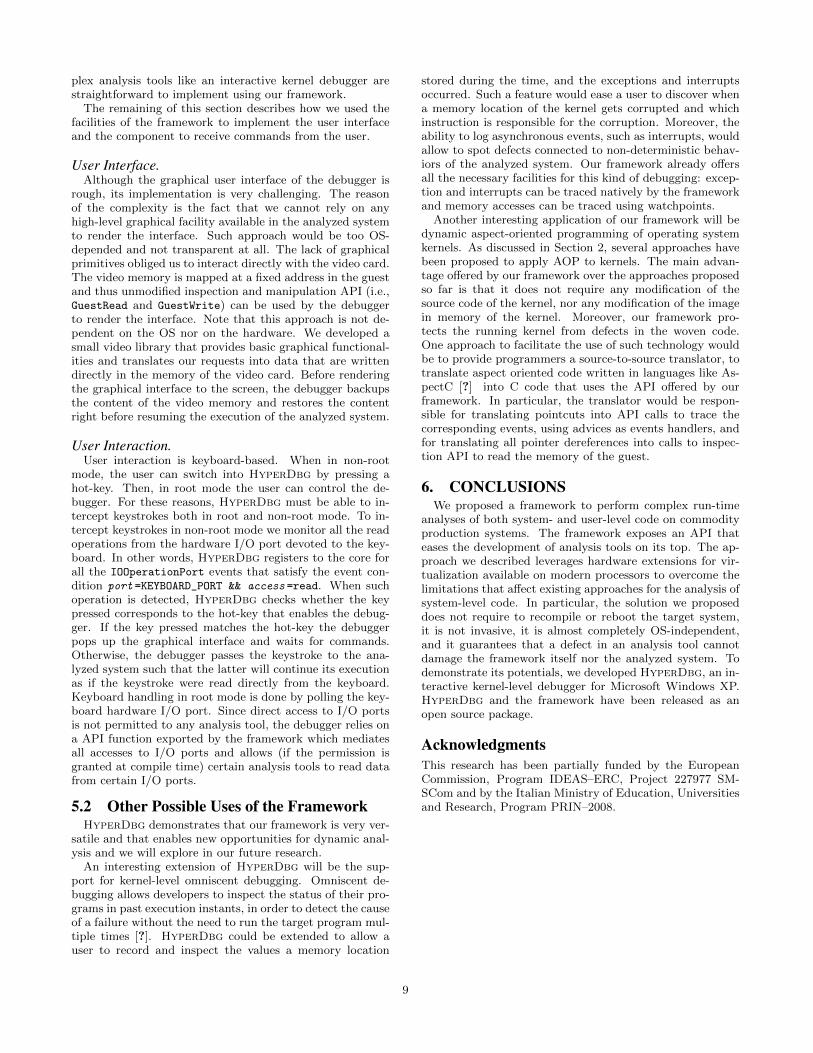
plex analysis tools like an interactive kernel debugger arestraightforward to implement using our framework.
The remaining of this section describes how we used thefacilities of the framework to implement the user interfaceand the component to receive commands from the user.
User Interface.Although the graphical user interface of the debugger is
rough, its implementation is very challenging. The reasonof the complexity is the fact that we cannot rely on anyhigh-level graphical facility available in the analyzed systemto render the interface. Such approach would be too OS-depended and not transparent at all. The lack of graphicalprimitives obliged us to interact directly with the video card.The video memory is mapped at a fixed address in the guestand thus unmodified inspection and manipulation API (i.e.,GuestRead and GuestWrite) can be used by the debuggerto render the interface. Note that this approach is not de-pendent on the OS nor on the hardware. We developed asmall video library that provides basic graphical functional-ities and translates our requests into data that are writtendirectly in the memory of the video card. Before renderingthe graphical interface to the screen, the debugger backupsthe content of the video memory and restores the contentright before resuming the execution of the analyzed system.
User Interaction.User interaction is keyboard-based. When in non-root
mode, the user can switch into HyperDbg by pressing ahot-key. Then, in root mode the user can control the de-bugger. For these reasons, HyperDbg must be able to in-tercept keystrokes both in root and non-root mode. To in-tercept keystrokes in non-root mode we monitor all the readoperations from the hardware I/O port devoted to the key-board. In other words, HyperDbg registers to the core forall the IOOperationPort events that satisfy the event con-dition port =KEYBOARD_PORT && access =read. When suchoperation is detected, HyperDbg checks whether the keypressed corresponds to the hot-key that enables the debug-ger. If the key pressed matches the hot-key the debuggerpops up the graphical interface and waits for commands.Otherwise, the debugger passes the keystroke to the ana-lyzed system such that the latter will continue its executionas if the keystroke were read directly from the keyboard.Keyboard handling in root mode is done by polling the key-board hardware I/O port. Since direct access to I/O portsis not permitted to any analysis tool, the debugger relies ona API function exported by the framework which mediatesall accesses to I/O ports and allows (if the permission isgranted at compile time) certain analysis tools to read datafrom certain I/O ports.
5.2 Other Possible Uses of the FrameworkHyperDbg demonstrates that our framework is very ver-
satile and that enables new opportunities for dynamic anal-ysis and we will explore in our future research.
An interesting extension of HyperDbg will be the sup-port for kernel-level omniscent debugging. Omniscent de-bugging allows developers to inspect the status of their pro-grams in past execution instants, in order to detect the causeof a failure without the need to run the target program mul-tiple times [?]. HyperDbg could be extended to allow auser to record and inspect the values a memory location
stored during the time, and the exceptions and interruptsoccurred. Such a feature would ease a user to discover whena memory location of the kernel gets corrupted and whichinstruction is responsible for the corruption. Moreover, theability to log asynchronous events, such as interrupts, wouldallow to spot defects connected to non-deterministic behav-iors of the analyzed system. Our framework already offersall the necessary facilities for this kind of debugging: excep-tion and interrupts can be traced natively by the frameworkand memory accesses can be traced using watchpoints.
Another interesting application of our framework will bedynamic aspect-oriented programming of operating systemkernels. As discussed in Section 2, several approaches havebeen proposed to apply AOP to kernels. The main advan-tage offered by our framework over the approaches proposedso far is that it does not require any modification of thesource code of the kernel, nor any modification of the imagein memory of the kernel. Moreover, our framework pro-tects the running kernel from defects in the woven code.One approach to facilitate the use of such technology wouldbe to provide programmers a source-to-source translator, totranslate aspect oriented code written in languages like As-pectC [?] into C code that uses the API offered by ourframework. In particular, the translator would be respon-sible for translating pointcuts into API calls to trace thecorresponding events, using advices as events handlers, andfor translating all pointer dereferences into calls to inspec-tion API to read the memory of the guest.
6. CONCLUSIONSWe proposed a framework to perform complex run-time
analyses of both system- and user-level code on commodityproduction systems. The framework exposes an API thateases the development of analysis tools on its top. The ap-proach we described leverages hardware extensions for vir-tualization available on modern processors to overcome thelimitations that affect existing approaches for the analysis ofsystem-level code. In particular, the solution we proposeddoes not require to recompile or reboot the target system,it is not invasive, it is almost completely OS-independent,and it guarantees that a defect in an analysis tool cannotdamage the framework itself nor the analyzed system. Todemonstrate its potentials, we developed HyperDbg, an in-teractive kernel-level debugger for Microsoft Windows XP.HyperDbg and the framework have been released as anopen source package.
AcknowledgmentsThis research has been partially funded by the EuropeanCommission, Program IDEAS–ERC, Project 227977 SM-SCom and by the Italian Ministry of Education, Universitiesand Research, Program PRIN–2008.
9