Dynamic Analysis of the Gait Cycle for Normal and Abnormal ...
8
Al-Nahrain University, College of Engineering Journal (NUCEJ) Vol.18 No.2, 2015 pp.343 - 350 343 Dynamic Analysis of the Gait Cycle for Normal and Abnormal Subjects Sadiq J. Abass Basma A. Faihan Medical Eng. Dep., Al-Nahrain University [email protected] Abstract Identification of pathological gait is the most direct application of gait analysis. The purpose of the study is to investigate the dynamics of human walking over a complete gait cycle. Level- walking experiments were performed by two- dimensional (2D) motion analysis using a digital video camera (Sony, 25 Hz) and two force plates. Kinematic data were obtained from the trajectories of 7 reflective markers using SkillSpector software (ver. 1.2.4). MATLAB software (ver. 8.1) has been adopted in this work to obtain Pedotti diagram and for inverse dynamics computations. Digital low pass Butterworth filter with zero phase-shift and cut- off frequency of 4.5 Hz was used. Joints' angular displacement, forces, and moments were obtained during gait cycle. The study was made on fourteen healthy volunteers (10 males and 4 females); a male with cerebral palsy, and an old female underwent unilateral knee arthroplasty. These data can be used as standard measures in pathology studies, as input to theoretical joint models, and as input to mechanical joint simulators. Keywords: gait analysis, Pedotti diagram, inverse dynamics, and kinematics. Nomenclature a fx , a fy Cartesian accelerations at the foot in x, y direction (m/s 2 ) a sx , a sy Cartesian accelerations at the shank in x, y direction (m/s 2 ) a tx , a ty Cartesian accelerations at the thigh in x, y direction (m/s 2 ) COP x Force plate center of pressure in x direction (m) F Ankle , F Knee , F Hip Forces at the ankle, knee, and hip joints respectively (N) F ground , GRF Ground reaction force (N) g Gravitational acceleration (m/s 2 ) I t , I s , I f Moments of inertia of the thigh, shank, foot respectively (kg.m 2 ) M H , M K , M A Moments at the hip, knee, ankle respectively (N.m) m t , m s , m f Masses of the thigh, shank, foot, HAT respectively (kg) α t , α s , α f Angular acceleration of the thigh, shank, foot respectively (rad/s 2 ) UKA Unilateral knee arthroplasty patient CP Cerebral palsy patient BW Body weight (N) Meta2 Second Metatarsal Introduction Human gait is a complex spatiotemporal process involving structures and functions of the neuro˗musculoskeletal system of human body. In normal gait, not only the energy consumption is optimized, but also, the resulting loads are regulated so that they can be well tolerated by the joints without initiating destructive changes in the articulating cartilage [1]. The subsequent effect on the load of the lower extremities is a matter of concern, since it might contribute to the disorders in bones (e.g., osteoporosis) or articulating joints (e.g., osteoarthritis) of both the intact and prosthetic limbs. In biomechanical applications, motion tracking systems are traditionally used together with force plate measurements and information on the body segment inertial parameters to estimate values of net joint torques (i.e., ankle, knee, and hip torques) and net inter-segmental forces using inverse dynamics [1]. Gait analysis has radically changed the treatment of cerebral palsy. Preoperatively, it allows critical assessment of the specific pathologies of the patient. Postoperatively, it provides an accurate assessment of outcome. This assessment of outcome has in turn allowed the accurate critique of surgeries and has made it possible to discard treatments that are not useful or are perhaps even injurious [2]. Favoring one leg results in increased loading in the unaffected leg and could eventually lead to osteoarthritis in that leg [3]. Ground reaction force (GRF) measurements allow gait asymmetries to be analyzed quantitatively and could be used to develop training programs to help patients avoid complications such as arthritis. The main goal of this work is to study the dynamics of human walking in order to get measurement values that can be depended on in the hospitals of rehabilitation, the clinical of medical sports, design and evaluation of orthotics and prosthetics devices and in developing rehabilitation programs for patients with joint problems. This study provides such normative data for joint dynamics parameters.
-
Upload
khangminh22 -
Category
Documents
-
view
0 -
download
0
Transcript of Dynamic Analysis of the Gait Cycle for Normal and Abnormal ...

Al-Nahrain University, College of Engineering Journal (NUCEJ) Vol.18 No.2, 2015 pp.343 - 350
343
Dynamic Analysis of the Gait Cycle for Normal and Abnormal
Subjects
Sadiq J. Abass Basma A. Faihan
Medical Eng. Dep., Al-Nahrain University
Abstract
Identification of pathological gait is the most
direct application of gait analysis. The purpose of
the study is to investigate the dynamics of human
walking over a complete gait cycle. Level-
walking experiments were performed by two-
dimensional (2D) motion analysis using a digital
video camera (Sony, 25 Hz) and two force plates.
Kinematic data were obtained from the
trajectories of 7 reflective markers using
SkillSpector software (ver. 1.2.4). MATLAB
software (ver. 8.1) has been adopted in this work
to obtain Pedotti diagram and for inverse
dynamics computations. Digital low pass
Butterworth filter with zero phase-shift and cut-
off frequency of 4.5 Hz was used. Joints' angular
displacement, forces, and moments were
obtained during gait cycle. The study was made
on fourteen healthy volunteers (10 males and 4
females); a male with cerebral palsy, and an old
female underwent unilateral knee arthroplasty.
These data can be used as standard measures in
pathology studies, as input to theoretical joint
models, and as input to mechanical joint
simulators.
Keywords: gait analysis, Pedotti diagram,
inverse dynamics, and kinematics.
Nomenclature
afx, afy Cartesian accelerations at the foot
in x, y direction (m/s2)
asx, asy Cartesian accelerations at the
shank in x, y direction (m/s2)
atx, aty Cartesian accelerations at the
thigh in x, y direction (m/s2)
COPx Force plate center of pressure in x
direction (m)
FAnkle,
FKnee, FHip
Forces at the ankle, knee, and hip
joints respectively (N)
Fground,
GRF Ground reaction force (N)
g Gravitational acceleration (m/s2)
It, Is, If Moments of inertia of the thigh,
shank, foot respectively (kg.m2)
MH, MK,
MA
Moments at the hip, knee, ankle
respectively (N.m)
mt, ms, mf Masses of the thigh, shank, foot,
HAT respectively (kg)
αt, αs, αf Angular acceleration of the thigh,
shank, foot respectively (rad/s2)
UKA Unilateral knee arthroplasty patient
CP Cerebral palsy patient
BW Body weight (N)
Meta2 Second Metatarsal
Introduction
Human gait is a complex spatiotemporal
process involving structures and functions of the
neuro˗musculoskeletal system of human body. In
normal gait, not only the energy consumption is
optimized, but also, the resulting loads are
regulated so that they can be well tolerated by
the joints without initiating destructive changes
in the articulating cartilage [1]. The subsequent
effect on the load of the lower extremities is a
matter of concern, since it might contribute to the
disorders in bones (e.g., osteoporosis) or
articulating joints (e.g., osteoarthritis) of both the
intact and prosthetic limbs.
In biomechanical applications, motion
tracking systems are traditionally used together
with force plate measurements and information
on the body segment inertial parameters to
estimate values of net joint torques (i.e., ankle,
knee, and hip torques) and net inter-segmental
forces using inverse dynamics [1]. Gait analysis
has radically changed the treatment of cerebral
palsy. Preoperatively, it allows critical
assessment of the specific pathologies of the
patient. Postoperatively, it provides an accurate
assessment of outcome. This assessment of
outcome has in turn allowed the accurate critique
of surgeries and has made it possible to discard
treatments that are not useful or are perhaps even
injurious [2]. Favoring one leg results in
increased loading in the unaffected leg and could
eventually lead to osteoarthritis in that leg [3].
Ground reaction force (GRF) measurements
allow gait asymmetries to be analyzed
quantitatively and could be used to develop
training programs to help patients avoid
complications such as arthritis.
The main goal of this work is to study the
dynamics of human walking in order to get
measurement values that can be depended on in
the hospitals of rehabilitation, the clinical of
medical sports, design and evaluation of
orthotics and prosthetics devices and in
developing rehabilitation programs for patients
with joint problems. This study provides such
normative data for joint dynamics parameters.
NUCEJ Vol.18 No.2, 2015 Abass, Faihan, pp.343 - 350
344
2. Methods
The dynamic analysis is done using a program
written in the MATLAB software where gait
data to be analyzed and the filtering method
applied on dynamic marker trajectories. The
output of this program includes: Pedotti diagram,
joints' angles, moments and powers during the
complete gait cycle. The x-y coordinated of
centers of hip, knee and ankle joints were
digitized with the help of markers using
SkillSpector software.
2.1 Pedotti diagram
A graphic representation of complete
spatiotemporal sequence of the ground reaction
evolution can be obtained by combining vertical
and fore-after component of the ground reaction
force with center of pressure in the fore-after
direction during stance phase of gait cycle. It has
been used to identify abnormal forces acting on
the foot in pathological gaits [4]. The density of
the vectors indicates the velocity with which the
center of pressure moves on the ground [5]. This
plot is obtained using the MATLAB command
"feather" after simple modifications.
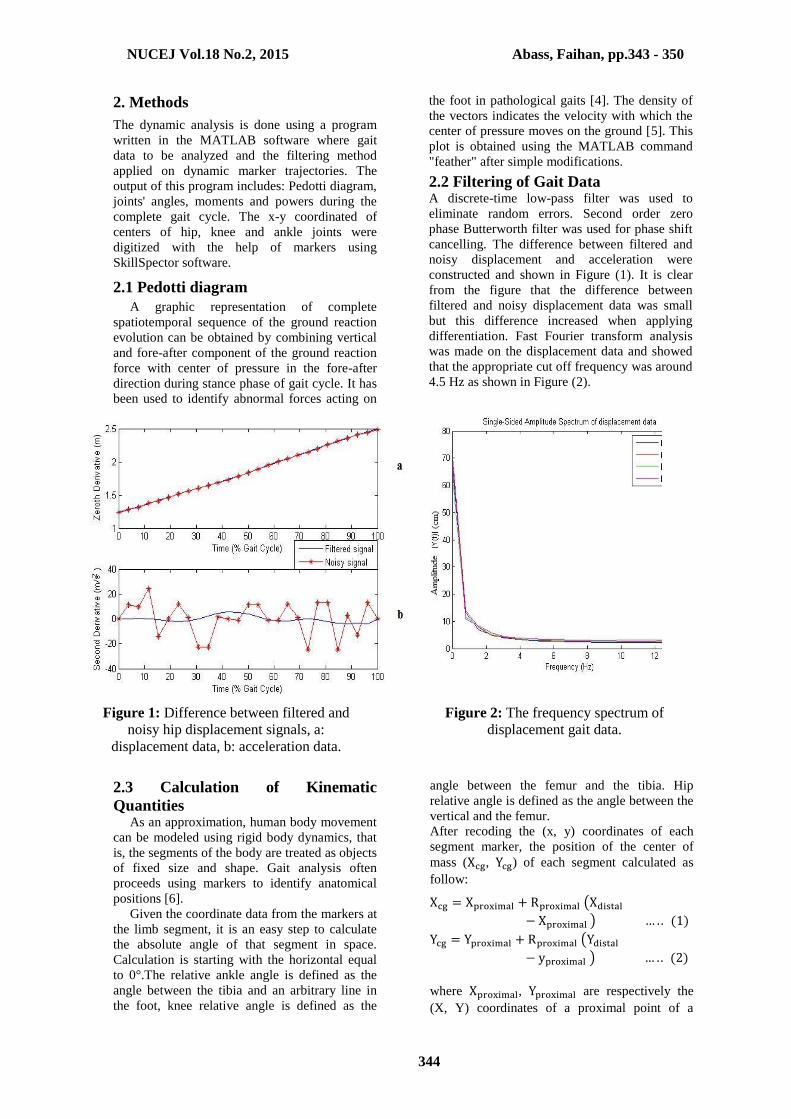
2.2 Filtering of Gait Data A discrete-time low-pass filter was used to
eliminate random errors. Second order zero
phase Butterworth filter was used for phase shift
cancelling. The difference between filtered and
noisy displacement and acceleration were
constructed and shown in Figure (1). It is clear
from the figure that the difference between
filtered and noisy displacement data was small
but this difference increased when applying
differentiation. Fast Fourier transform analysis
was made on the displacement data and showed
that the appropriate cut off frequency was around
4.5 Hz as shown in Figure (2).
Figure 1: Difference between filtered and
noisy hip displacement signals, a:
displacement data, b: acceleration data.
Figure 2: The frequency spectrum of
displacement gait data.
2.3 Calculation of Kinematic
Quantities As an approximation, human body movement
can be modeled using rigid body dynamics, that
is, the segments of the body are treated as objects
of fixed size and shape. Gait analysis often
proceeds using markers to identify anatomical
positions [6].
Given the coordinate data from the markers at
the limb segment, it is an easy step to calculate
the absolute angle of that segment in space.
Calculation is starting with the horizontal equal
to 0°.The relative ankle angle is defined as the
angle between the tibia and an arbitrary line in
the foot, knee relative angle is defined as the
angle between the femur and the tibia. Hip
relative angle is defined as the angle between the
vertical and the femur.
After recoding the (x, y) coordinates of each
segment marker, the position of the center of
mass (Xcg, Ycg) of each segment calculated as
follow:
Xcg = Xproximal + Rproximal (Xdistal
− Xproximal ) … . . (1)
Ycg = Yproximal + Rproximal (Ydistal
− yproximal ) … . . (2)
where Xproximal, Yproximal are respectively the
(X, Y) coordinates of a proximal point of a

NUCEJ Vol.18 No.2, 2015 Abass, Faihan, pp.343 - 350
345
segment and Xdistal, Ydistal are respectively the
(X, Y) coordinates of a distal point of a
segment. Rproximal is the standard center of mass
location from the proximal end of a segment [7].
The angular velocity and acceleration vectors (�⃑⃑� and 𝛼 , respectively) of the body segment along
with the linear acceleration vector (𝑎 𝑥 ,𝑎 𝑦) is
obtained simply by numerical differentiation
using five point central difference formulae[8].
2.4 Calculation of Kinetic Quantities
Kinetic quantities were calculated using
Newton’s second law of motion which
Incorporates inertia vectors [9]. All moments
were taken about the center of mass of each
segment. Positive forces were assumed to be in
the upward direction and positive moments in the
counterclockwise direction. Because the
frequency of force plate data differs from the
frequency of camera(default sampling rates of
camera and force plates are 25 and 50 Hz,
respectively), down sampling is performed using
the MATLAB command "resample".
Figure 3: the free body diagrams of the lower extremity segments (foot, shank, and thigh) that
demonstrate each segment forces isolated from the other segment forces.
With known ground reactions, the solution of
equations of motion is initiated from the most
distal segment, recursively progressing up to
adjacent segments until finally, the forces and
moments acting on the desired joint are obtained.
The moment of a force (M) is defined as the
cross-product (×) of a position vector (r) and its
force (F),i.e.,
𝑀 = [𝑟 × 𝐹] = 𝑟𝑥 . 𝐹𝑦 − 𝑟𝑦 . 𝐹𝑥 … . . (3)
[[[[
The position vector r is r =[Xcg, Ycg] of the
segment.
Forces and moments for the ankle:
FAx= mf .afx –Fx(ground) ….. (4)
FAy = mf .afy–Fy(ground) + mf . g ….. (5)
Fankle = [FAx, FAy]
MA = If .αf– [rankle × Fankle] – [rground× Fground]
….. (6)
Where rground =[COPx, 0].
Forces and moments at the knee:
FKx= ms .asx+ FAx ….. (7)
FKy = ms .asy+ FAy+ ms . g ….. (8)
Fknee= [FKx, FKy]
MK = Is .αs+ MA – [rknee× Fknee] – [rankle× - Fankle]
….. (9)
Forces and moments at the hip:
FHx= mt .atx+ FKx ….. (10)
FHy = mt .aty+ FKy+ mt . g ….. (11)
FHip= [FHx, FHy]
MH = It .αt+ MK – [rHip× FHip] – [rknee× - Fknee]
….. (12)
3. Experimental work The Gait analysis laboratory, located at the
Medical Engineering Department/Al Nahrain
university/Iraq, equipped with a digital camera
(Sony) and two force plates. The system has the
necessary software programs related to the force
plates that operate during and after the data
acquisition process. The final outputs of the
system are kinematic and kinetic data which
enable assessment and interpretation of gait
patterns on quantitative bases.
The study was made on fourteen healthy
normal volunteers (10 males and 4 females; age:
24.36∓4.53year, weight: 68.96∓12.71kg, height:

NUCEJ Vol.18 No.2, 2015 Abass, Faihan, pp.343 - 350
346
1.7∓0.091m), male with cerebral palsy (CP)
(age: 34year, weight: 70.8kg, height: 1.655m),
and an old female underwent unilateral (left)
knee arthroplasty (UKA) (age: 63year, weight:
88.50kg, height: 1.625m). Passive seven markers
(red round stickers) were used to identify the
location of joints' center of rotation. Markers
attached to the subject at the hip (right greater
trochanter), right knee (lateral femoral condyle),
left knee (medial femoral condyle), right ankle
(lateral malleolus), left ankle (medial malleolus),
right foot (fifth metatarsal head), left foot (left
first metatarsal head).
The standard collection protocol is composed
of static and dynamic trials. During both of the
trials, videos of a number of passive markers
attached to various landmarks on lower
extremities are captured with a digital video
camera (25 frames/second) placed 2.8m on the
side of the force plates, fitted on a tripod with a
height of 1.09m from the ground. Considering
the low-pass nature of human gait, this value
may safely be accepted to be more than twice of
the highest frequency value possible for human
gait. So, the sampling theorem is not violated.
The static trial requires the subject to stand still
for a specified duration. The static capture
provides information on the participant's
standing posture and the angle between the foot
and horizontal. Following the static trials,
participants were asked to perform walking trials
on a 6 m walkway, barefoot and at a self-selected
speed. During the dynamic trial, the force plate
data and camera videos were collected.
4. Results
The Pedotti diagram of normal subject is
shown in Figure (4). For the subject with
cerebral palsy patient, the Pedotti diagrams
(shown in Figure (5)) indicate that the difference
between the loading on the right and left foot
because of neural commands disorders. There
was no full weight bearing take place during
early stance for the right foot while full weight
bearing occurred in the left foot. Also there was
rapid decrease in center of mass acceleration
during mid-stance for the left foot. The Pedotti
diagram of the UKA patient is shown in Figure
(6). The right foot showed nearly vertical bend of
ground reaction force vectors for all stance phase
except during toe-off phase. The patient used a
forward trunk lean to move the body vector
anterior to the knee joint axis to decrease the
load on the joint. This imposes a greater flexor
torque at the hip.
Figure 4: Pedotti diagram for normal subjects.
Figure 5: Pedotti diagram for cerebral palsy subject, (a) right foot and (b) left foot.

NUCEJ Vol.18 No.2, 2015 Abass, Faihan, pp.343 - 350
347
Figure 6: Pedotti diagram for UKA patient, (a) right foot and (b) left foot.
Cerebral palsy and UKA patients exhibit less
range of motion at the knee joint and increase
range of motion at the hip joint as shown in
Figure (7). There is no planterflexion at heel
strike in cerebral palsy patient. The tight knee
extensors in cerebral palsy patient limit knee
extension.
Initial contact is made with the forefoot in
cerebral palsy patient. There were differences
between right and left side for all abnormal cases
(compensate for pain or discomfort in one limb
by altering range of motion in both limbs so the
time spent on the limb with no pain increased).
Mean joint forces during walking are
summarized in table (1). The GRFs during gait
are transmitted proximally to the rest of the body
through the foot and ankle, compressing each
joint along the way. Higher forces were observed
on the left limb joints of the UKA patient.
Table 1: Mean (∓SD) of hip, knee and ankle joint forces (N/BW) during gait cycle.
Subjects Normal CP
(right)
CP
(left) UKA (right) UKA (left)
Hip Force 3.159∓0.147 2.937 2.934 3.253 3.415
Knee Force 3.538∓0.125 3.335 3.340 3.648 3.833
Ankle Force 3.738∓0.178 3.539 3.546 3.855 4.049
The joints' moments for normal and abnormal
subjects are shown in Figure (8). For cerebral
palsy and UKA patients, the loading response of
stance phase (0˗7% of gait cycle) shows little
dorsiflexion moment. Cerebral palsy patient knee
shows a high extensor moment during late
stance, while the knee flexor moment for both
cerebral palsy and UKA was small. Also,
cerebral palsy shows hip extensor moment
during mid-stance, while small extensor moment
was appeared during swing phase for cerebral
palsy and UKA patents.
5. Discussion In general, the measured lower body kinetics
for normal subjects matched with finding
reported in the literature [2, 3, 10, and 11]. The
difference were found at the final points (95% ˗
100% of gait cycle) this is largely due to parallax
and perspective errors (occurred when the object
moved out of the calibration plane).
Considerable differences were found in the
magnitudes of joint angles and forces with the
previous literature [2 and 3]. Since the joints'
angles and forces are largely sensitive to the
velocity of walking [12], also the differences
stem partly from the different methods used to
determine the force and partly by differences in
the physiology of the individuals.
Accuracy of two dimensions (2D) gait analysis is
crucially dependent on correct marker placement,
anthropometric errors, digitizing process,
parallax and perspective errors and further errors
were introduced because movement may take
place between the marker and the underlying
clothing and skin. Since the cloth and soft tissues
moved relative to the bone, acceleration of the
segment mass center will be a function of both
acceleration of the bone and that of the soft
tissues. The skin motion artifacts may add high
frequency noise in displacement data.
As seen from the results (Figure (8) and table
(1)) of the UKA patient, the left side forces and
moments were greater than in the right side. This
is primarily due to loss of rehabilitation
procedures after knee arthroplasty, and because
the contribution of the articular cartilage lesion.
From the angles curves and time duration of the
cerebral palsy patient, the right side was more
affected than the left side and this leads to a
compensatory mechanism resulted the abnormal
movement of both right and left side and that
matched with the literature [13].

NUCEJ Vol.18 No.2, 2015 Abass, Faihan, pp.343 - 350
348
Normal Cerebral Palsy patient UKA patient
Ankle
joint
Knee
joint
Hip
joint
Figure 7: Ankle, knee and hip joints absolute angles during gait cycle.

NUCEJ Vol.18 No.2, 2015 Abass, Faihan, pp.343 - 350
349
Normal Cerebral Palsy UKA
Ankle joint
Knee
joint
Hip
joint
Figure 8: Ankle, knee and hip joints moments during gait cycle.
6. Conclusions: Using mathematical models of the lower limb
to examine the forces at the joints provided a
valuable insight into internal loading conditions.
The advantages of the method are that: no
encumbering apparatus is attached to the patient,
the method is painless and does not involve any
discomfort for the patient, multiple measurements
may be made in a single recording session, and
recordings of both extremities can be made at the
same time. Implanted joints bare more forces and
moments than normal joints.
7. Recommendations for future work: 1. This approach provides the net muscle activity
at the joints, and therefore, cocontractions
were not identified. Information on
cocontraction could be obtained using
electromyography (EMG).
2. Studying the dynamics of movement in 3D for
better understanding of dynamic stability
during walking and for positioning of joints'
centers accurately especially for hip and the
Meta2.
3. Combining Pedotti diagram with video for
determining the direction of ground reaction
force vectors with respect to joints. This
procedure would be useful for determining the
alignment and stability for joint prosthesis.
4. Studying kinetics of other human daily
activities such as stair climbing, running, and
lifting objects for different speeds. Further
researches are needed on a wider range of
populations that include pediatric, patients
with joint arthroplasty, amputees and other
pathological groups.
5. Using artificial neural network to perform
automated diagnosis of gait pattern and to find
new clinical indicators for interpreting quick
and objectively the large amount of
information obtained in a gait lab.

NUCEJ Vol.18 No.2, 2015 Abass, Faihan, pp.343 - 350
350
8. References
1. Winter, D.A., Sandra J. Olney, Jill Conrad,
"Adaptability of Motor Patterns in
Pathological Gait", Springer New York,
ISBN: 978-1-4613-9030-5, 1990.
2. Paul J. P., "Force actions transmitted by joints
in the human body ", Proc. R. Soc. Lond. B.,
Vol. 192, pp. 163-172, 1976.
3. Sylvia Ounpuu, "The biomechanics of
walking and running", Clinics in sport
medicine, Vol. 3, pp. 843-863, 1994.
4. Michael W. Whittle, “Gait Analysis: An
Introduction”, 4th edition, Heidi Harrison,
ISBN : 9-780-7506-8883-3, 2007.
5. Brian R. Umberger, "Effects of suppressing
arm swing on kinematics, kinetics, and
energetic of human walking", Journal of
Biomechanics, Vol. 41, pp. 2575-2580, 2008.
6. Iwan W. Griffiths , " Principles of
Biomechanics & Motion Analysis " , LWW,
ISBN: 0-7817-5231-0, 2006.
7. Winter, D.A., "The Biomechanics and Motor
Control of Human Movement", 2nd edition,
Springer New York, ISBN: 0-88898-105-8, 1990.
8. Richard L. Burden, J. Douglas Faires, "Numerical
Analysis" , 9th edition, Richard Stratton, ISBN: 978-
0-538-73351-9, 2010.
9. Hall S. J., "Basic Biomechanics", 3rd edition,
McGraw, ISBN: 0-07-116373-5, 1999.
10. Winter, D.A., "Human balance and posture
control during standing and walking", Gait &
Posture, Vol. 3, pp. 193-214, 1995.
11. F. Farahmand , T. Rezaeian , R. Narimani& P.
HejaziDinan , "Kinematic and Dynamic
Analysis of the Gait Cycle of Above-Knee
Amputees ", ScientiaIranica, Vol. 13, pp. 261-
271, 2006.
12. Joseph Hamill, Kathleen M. Knutzen, "
Biomechanical basis of human movement",
2nd edition, LWW, ISBN: 978-0-7817-6306-
6, 2005.
13. MónikaHorváth, TeklaTihanyi, JózsefTihanyi
,"Kinematic and Kinetic Analyses of Gait
Patterns in Hemiplegic Patients ", Physical
Education and Sport, Vol. 1, pp. 25- 35, 2001.
التحليل الحركي خالل دورة المشي لالشخاص السليمين والمرضى
صادق جعفرعباس جامعة النهرين/ كلية الهندسة
قسم الهندسة الطبية
بسمة عبد الصاحب قيحان الهندسة كلية/ النهرين جامعة
الطبية الهندسة قسم
الخالصة: المحركة القوى تحّريتحديد المشية المرضية هو من أكثر تطبيقات تحليل المشي. الغرض من هذه الدراسة هو
رقمية فيدويةأجريت تجارب التحليل الحركي الثنائي األبعاد باستخدام كاميرا الكاملة. المشي دورة خالل لإلنسان ((Sony ومنصتين لقياس القوة نوعAMTI. ْن بيانات مسارات الكينماتيكيةتم الحصول على البيانات الحركّية م
)اإلصدار MATLAB(.اعتمد برنامج 1.2.4)اإلصدار SkillSpectorعالمات الصقة بأستخدام برنامج سبعة( لغرض الحصول على مخطط بيدوتي ولغرض حسابات معادالت الدايناميك المعكوس. أجريت تصفية رقميه 8.1تم الحصول على اإلزاحة Hz 4.5). بتردد ) zero phase Butterworth filter)بأستخدام ) الكينماتيكية تللبيانا
الزاوية وقوى رد الفعل والعزم لمفاصل الورك والركبة والكاحل خالل المشي. أجريت دراسة المشي على أربعة عشر لسن أجري لها تبديل مفصل الركبة األيسر.هذه البيانات متطوعاً ومريضاً واحداً مصاباً بالشلل الدماغي وامرأًة كبيرة ا
للمفاصل ومحاكيات المفاصل يمكن االعتماد عليها في دراسات علم األمراض, كمدخالت إلى نماذج التصميم الميكانيكية.